A Regional-Scale Landslide Warning System Based ... - MDPI
17
water Technical Note A Regional-Scale Landslide Warning System Based on 20 Years of Operational Experience Samuele Segoni 1 , Ascanio Rosi 1, * , Riccardo Fanti 1 , Angela Gallucci 2 , Antonio Monni 2 and Nicola Casagli 1 1 Department of Earth Sciences, University of Florence, 50121 Florence, Italy; samuele.segoni@unifi.it (S.S.); riccardo.fanti@unifi.it (R.F.); nicola.casagli@unifi.it (N.C.) 2 Emilia Romagna Agency for Territorial Safety and Civil Protection, 40122 Bologna, Italy; [email protected] (A.G.); [email protected] (A.M.) * Correspondence: ascanio.rosi@unifi.it; Tel.: +39-055-2757551 Received: 31 July 2018; Accepted: 18 September 2018; Published: 21 September 2018 Abstract: SIGMA is a regional landslide warning system based on statistical rainfall thresholds that operates in Emilia Romagna (Italy). In this work, we depict its birth and the continuous development process, still ongoing, after two decades of operational employ. Indeed, a constant work was carried out to gather and incorporate in the modeling new data (extended rainfall recordings, updated landslides inventories, temperature and soil moisture data). The use of these data allowed for regular updates of the model and some conceptual improvements, which consistently increased the forecasting effectiveness of the warning system through time. Landslide forecasting at regional scale is a very complex task, but this paper shows that, as time passes by, the systematic gathering and analysis of new data and the continuous progresses of research activity, uncertainties can be progressively reduced. Thus, by the setting up of forward-looking research programs, the performances and the reliability of regional scale warning systems can be increased with time. Keywords: rainfall threshold; landslide; hazard; warning system; Emilia Romagna; Civil Protection 1. Introduction Regional scale landslide early warning systems (RSLEWS) are becoming widely used tools to forecast landslide occurrence and manage the related hazards over wide areas [1–8]. They are mainly based on rainfall thresholds, which are established by empirical or statistical correlations between a landslide catalogue and a rainfall database [9]. The need of only these two kinds of input data to establish the most basic implementation is one of the keys of the success and wide use of this approach. Moreover, some studies explored the possibility of establishing threshold-based early warning systems also in case studies characterized by scarcity of data [10,11]. However, it is important to stress that input data are not superfluous: on the contrary, several studies demonstrated that the quantity and quality of data are very important and greatly influences the quality of the rainfall thresholds and thus the capabilities of the related RSLEWS. For instance, Segoni et al. [12] analytically demonstrated that, in an Italian case study characterized by the presence of thousands of dated landslides, a single regional threshold can be outperformed by a mosaic of basin-scale thresholds. After a few years, the same group of authors updated the thresholds using an extended calibration dataset and a quantitative comparison demonstrated that the calibration against a dataset that was larger (both in terms of number of events and in terms of temporal extension) led to a consistent change of some of the thresholds and to a general improvement of their forecasting effectiveness [13]. Similarly, Gariano et al. [14] demonstrated that a landslide sample decreased by just 1% can cause a significant loss in the forecasting effectiveness of a rainfall threshold. Another series of works [15,16] clearly points out that the uncertainty associated Water 2018, 10, 1297; doi:10.3390/w10101297 www.mdpi.com/journal/water
-
Upload
khangminh22 -
Category
Documents
-
view
0 -
download
0
Transcript of A Regional-Scale Landslide Warning System Based ... - MDPI

water
Technical Note
A Regional-Scale Landslide Warning System Basedon 20 Years of Operational Experience
Samuele Segoni 1 , Ascanio Rosi 1,* , Riccardo Fanti 1, Angela Gallucci 2, Antonio Monni 2
and Nicola Casagli 1
1 Department of Earth Sciences, University of Florence, 50121 Florence, Italy; [email protected] (S.S.);[email protected] (R.F.); [email protected] (N.C.)
2 Emilia Romagna Agency for Territorial Safety and Civil Protection, 40122 Bologna, Italy;[email protected] (A.G.); [email protected] (A.M.)
* Correspondence: [email protected]; Tel.: +39-055-2757551
Received: 31 July 2018; Accepted: 18 September 2018; Published: 21 September 2018�����������������
Abstract: SIGMA is a regional landslide warning system based on statistical rainfall thresholdsthat operates in Emilia Romagna (Italy). In this work, we depict its birth and the continuousdevelopment process, still ongoing, after two decades of operational employ. Indeed, a constant workwas carried out to gather and incorporate in the modeling new data (extended rainfall recordings,updated landslides inventories, temperature and soil moisture data). The use of these data allowed forregular updates of the model and some conceptual improvements, which consistently increased theforecasting effectiveness of the warning system through time. Landslide forecasting at regional scale isa very complex task, but this paper shows that, as time passes by, the systematic gathering and analysisof new data and the continuous progresses of research activity, uncertainties can be progressivelyreduced. Thus, by the setting up of forward-looking research programs, the performances and thereliability of regional scale warning systems can be increased with time.
Keywords: rainfall threshold; landslide; hazard; warning system; Emilia Romagna; Civil Protection
1. Introduction
Regional scale landslide early warning systems (RSLEWS) are becoming widely used tools toforecast landslide occurrence and manage the related hazards over wide areas [1–8]. They are mainlybased on rainfall thresholds, which are established by empirical or statistical correlations betweena landslide catalogue and a rainfall database [9]. The need of only these two kinds of input data toestablish the most basic implementation is one of the keys of the success and wide use of this approach.Moreover, some studies explored the possibility of establishing threshold-based early warning systemsalso in case studies characterized by scarcity of data [10,11]. However, it is important to stress thatinput data are not superfluous: on the contrary, several studies demonstrated that the quantity andquality of data are very important and greatly influences the quality of the rainfall thresholds and thusthe capabilities of the related RSLEWS. For instance, Segoni et al. [12] analytically demonstrated that, inan Italian case study characterized by the presence of thousands of dated landslides, a single regionalthreshold can be outperformed by a mosaic of basin-scale thresholds. After a few years, the same groupof authors updated the thresholds using an extended calibration dataset and a quantitative comparisondemonstrated that the calibration against a dataset that was larger (both in terms of number of eventsand in terms of temporal extension) led to a consistent change of some of the thresholds and to ageneral improvement of their forecasting effectiveness [13]. Similarly, Gariano et al. [14] demonstratedthat a landslide sample decreased by just 1% can cause a significant loss in the forecasting effectivenessof a rainfall threshold. Another series of works [15,16] clearly points out that the uncertainty associated
Water 2018, 10, 1297; doi:10.3390/w10101297 www.mdpi.com/journal/water

Water 2018, 10, 1297 2 of 17
to the threshold parameters definition depends not only from the abundance of the data used inthe calibration, but also from their distribution in the graphic (e.g., representativeness of a widerange of rainfall durations or rainfall intensities). In other words, an effective threshold should becalibrated against an abundant dataset in which the experimental data are not clustered and are evenlydistributed in the graphic. Besides landslides, rainfall data quality and quantity are very important aswell to obtain reliable thresholds [17]. Since rain gauges are the most widely used method of rainfallmeasurement for threshold definition, the quality of the analysis is guaranteed by a high rain gaugedensity or by a high temporal resolution (especially for intensity-duration thresholds [9]). In othercases, radar rainfall measurements are used instead of (or in conjunction with) rain gauges to obtainrainfall measurement with higher spatial and temporal resolution and reduced uncertainties [18,19].
These examples show that RSLEWS can be constantly updated and improved as long as newcalibration data (namely, rainfall measurements and new activations of landslides) are gathered andmade available to researchers. The process of amelioration of RSLEWS requires a joint effort betweenresearchers and local administrations, the latter only rarely understanding that the setting up of areliable RSLEWS could be a long-term objective. Indeed, the literature describes cases of RSLEWS thatnowadays exhibit good results that have been obtained after continuous ameliorations fostered by along-term collaboration between local authorities (in charge of managing landslide hazard and risk)and scientists (committed to provide reliable forecasting and managing tools) [1,20–22].
This manuscript describes the Emilia Romagna (Italy) case study, where the long lasting(about 20 years) collaboration between the Emilia Romagna Agency for Territorial Safety and CivilProtection and the Earth Science Department of Florence University led to a constant developmentand progressive improvement of a RSLEWS to be used as an operational tool to forecast and managelandslide hazard at regional scale.
This work provides a framework that could be used as a reference for both researchers andend-users that are starting from the scratch the design of a RSLEWS; moreover, it quantitatively assessesthe improvements led by the progressive major and minor updates to the RSLEWS, demonstratingthat RSLEWSs need to be constantly evaluated, updated and upgraded to maintain and to increasetheir forecasting effectiveness.
2. Materials and Methods
2.1. Test Site Description
Emilia Romagna region is located in Northern Italy. The northern and eastern parts of the regionare flat as they are occupied by the alluvial Po Plain, while southern and western parts are mainly hillyand mountainous as they are occupied by the Apennines mountain chain. Apennines is a fold andthrust mountain chain and in the study area is mainly composed of turbidites deposits (sandstone andcalacarenites) and politic layers [23]. Several argillaceous formations are present in the region and theyhave been extensity affected by large intermittent landslide during the Holocene [24].
This work focuses on the hilly and mountainous part of the region, as it is the only one proneto land sliding (Figure 1), with a landslide density of about 0.12 landslide/km2. Emilia Romagna isaffected by landslides of different typologies: rotational–translational slides (affecting mainly flysch),slow earth flows (occurring in clayey lithologies), and complex movements (typically rotationalfailures at the head progressively changing into translational movements throughout the body andtoe). Rapid shallow landslides were less frequent in the past, but their triggering became a recurringphenomenon during recent years [25]. According to the Italian Landslide Database [26], the mostcommon type of landslides in Emilia Romagna are rotational–translational slides (45.9%), followed byslow flows (24.9%), complex landslides (22.9%), falls (0.5%) and rapid flows (mainly debris flows,0.4%), while other types of landslides represent about 0.1% of the overall number.

Water 2018, 10, 1297 3 of 17
Water 2018, 10, x FOR PEER REVIEW 3 of 17
Rainfall is the main landslide triggering factor in the study area: short and intense rainfalls are usually associated with the initiation of shallow landslides, while moderate and very long rainy periods (up to six months) are responsible for the triggering of deep-seated landslides and earthflows [27,28].
The study area is characterized by a Mediterranean climate, with dry and warm summers (approximately from May to October) and cold and wet winters (approximately from November to April); this climate affects seasonal landslide distribution, since they mainly occur during the wet season, even if landslides sometimes occur during summer rainstorms.
Figure 1. Map of the Emilia Romagna Region showing both landslide and rain gauges distribution.
2.2. Administrative Framework
Italian civil protection is a complex system entrusted to all administrative levels of the State: in short, a “central” national department coordinates a network of regional centers, each one in charge of forecasting and managing hazards inside its administrative territory, while at the local level the most important authority of civil protection is the mayor of each municipality. Other bodies (e.g., provinces) constitute an intermediate level between the municipality and the regions, ensuring an effective management of complex hazard scenarios.
According to this complex organization, each Italian region has a Functional Center in charge of meteorological monitoring and forecasting. This activity includes a warning system for the landslide hazard which covers the whole region and issues, at least daily, a criticality state among four possible levels (absent, ordinary, medium, and high). The criticality alerts are usually differentiated for subdivisions of the regional territory (called “alert zones”) and are addressed to the Mayors, which are in charge of activating all due countermeasures, including information to the citizens.
Concerning Emilia Romagna, one of the main tools used by the regional civil protection to manage landslide hazard is a RSLEWS named SIGMA, which is based on statistical rainfall thresholds and was developed starting from the late 1990s.
2.3. Basic Assumptions of the RSLEWS
The above described physical settings and administrative framework deeply influenced the way the warning system and the core threshold model were conceived and developed.
Rainfall parameters: Since the test site is affected by both rapid shallow landslides and deep-seated landslides, antecedent rainfall was selected as the rainfall parameter to define the rainfall thresholds. The basic assumption of the model is that short-term cumulates (e.g., a few days) should
Figure 1. Map of the Emilia Romagna Region showing both landslide and rain gauges distribution.
Rainfall is the main landslide triggering factor in the study area: short and intense rainfalls areusually associated with the initiation of shallow landslides, while moderate and very long rainy periods(up to six months) are responsible for the triggering of deep-seated landslides and earthflows [27,28].
The study area is characterized by a Mediterranean climate, with dry and warm summers(approximately from May to October) and cold and wet winters (approximately from November toApril); this climate affects seasonal landslide distribution, since they mainly occur during the wetseason, even if landslides sometimes occur during summer rainstorms.
2.2. Administrative Framework
Italian civil protection is a complex system entrusted to all administrative levels of the State: inshort, a “central” national department coordinates a network of regional centers, each one in charge offorecasting and managing hazards inside its administrative territory, while at the local level the mostimportant authority of civil protection is the mayor of each municipality. Other bodies (e.g., provinces)constitute an intermediate level between the municipality and the regions, ensuring an effectivemanagement of complex hazard scenarios.
According to this complex organization, each Italian region has a Functional Center in charge ofmeteorological monitoring and forecasting. This activity includes a warning system for the landslidehazard which covers the whole region and issues, at least daily, a criticality state among four possiblelevels (absent, ordinary, medium, and high). The criticality alerts are usually differentiated forsubdivisions of the regional territory (called “alert zones”) and are addressed to the Mayors, which arein charge of activating all due countermeasures, including information to the citizens.
Concerning Emilia Romagna, one of the main tools used by the regional civil protection to managelandslide hazard is a RSLEWS named SIGMA, which is based on statistical rainfall thresholds and wasdeveloped starting from the late 1990s.
2.3. Basic Assumptions of the RSLEWS
The above described physical settings and administrative framework deeply influenced the waythe warning system and the core threshold model were conceived and developed.
Rainfall parameters: Since the test site is affected by both rapid shallow landslides and deep-seatedlandslides, antecedent rainfall was selected as the rainfall parameter to define the rainfall thresholds.The basic assumption of the model is that short-term cumulates (e.g., a few days) should identify short

Water 2018, 10, 1297 4 of 17
but exceptionally intense rainfalls that are responsible for shallow landslide triggering, while longerperiods of accumulation should capture mild but exceptionally long rainfalls, which are traditionallyassociated to deep seated landslide triggering of reactivations.
Territorial units: Since municipalities are the basic administrative subject to face hazards,they were considered the basic spatial unit also for the rainfall threshold model. Municipalities wereaggregated into wide territorial units (TU) with homogeneous geomorphological and meteorologicalcharacteristics. Then, TUs were grouped into larger spatial units called Alert Zones, which are theadministrative levels for which warnings need to be issued.
Reference rain gauges: Among all the possible approaches to relate rain gauges and landslides inrainfall threshold analysis [9], it was decided to use a single reference rain gauge for each TU, to havea more straightforward comprehension of the model outputs also for personnel and end-users withoutadvanced skills in scientific fields related to landslides.
Alert levels: The warning system, the decisional algorithm and the thresholds were aimed atdefining four possible states of criticality (absent, ordinary, medium, and high), according to theregional and national laws.
2.4. Workflow
To define a RSLEWS to be used in landslide hazard management at regional scale, the departmentof Civil Protection of Emilia Romagna Region and the Earth Science Department of the University ofFlorence have been collaborating since the late 1990s. In a forward-looking perspective, the researchwas not conceived as a stand-alone program, but it was set up as a long-term collaboration in whicha general research framework (RF) defines general objectives to be pursued. The general researchframework is valid for five years (after this period, another RF agreement needs to be defined andsigned) and encompasses five broadly defined tasks:
1. Research and development to define and progressively improve the RSLEWS (including themonitoring algorithm, the triggering thresholds model and the data analysis);
2. Improvement of the correlation between model outputs and criticality levels for civilprotection purposes;
3. Assistance in implementing research outcomes into the informative systems of the regionalCivil Protection;
4. Assistance in defining procedures for the daily employ of SIGMA and for the management of theforecasted hazard levels;
5. Training the end-users to a correct interpretation of the model outputs for a sound hazardassessment and management.
Within this framework, every year a yearly research activity plan defines a series of activitiespertaining to one or more of the abovementioned tasks. During the year, the research is accomplished,a report is produced, the outcomes are quantitatively evaluated and the activities for the next year aredefined on the basis of the obtained results and of the end-user needs.
In this paper, only the activities strictly connected with scientific research (Task 1 and, partially,Task 2 of the research framework) are accounted for. We do not describe the activities dealing withthe implementation of the new features into the waning system, the training of the personnel and thedefinition of civil protection procedures.
Basically, a workflow was established that moves from a continuous collection of new data(rainfall and landslide data) (Figure 2), encompasses a periodic quantitative validation of the rainfallthreshold model operated at that time in the RSLEWS and an analysis of the errors. The error analysisfosters a search for possible solutions and a series of tests to quantitatively assess the impact of theproposed solutions on the forecasting effectiveness of the warning system.

Water 2018, 10, 1297 5 of 17
Water 2018, 10, x FOR PEER REVIEW 5 of 17
Figure 2. Collection of landslides data over the years, showing the total number of landslides collected each year and the number of landslides with good spatial and temporal accuracy that could be used for SIGMA.
3. Results
3.1. Base Version of the Model
The first steps of the research were influenced by the lack of data. Usually, empirical rainfall thresholds are established combining a dataset of rainfall data and a dataset of landslides for which the time of occurrence is known [9,29]. For the Emilia Romagna Region, the historical recordings of a wide network of rain gauges was available, providing hourly or daily rainfall measurements since the mid-1950s. Unfortunately, when the research began, the landslide dataset available did not contain the time of triggering. Therefore, the first prototypal version of the model had to rely only on rainfall data.
The prototypal version of SIGMA was based on rainfall thresholds defined by means of a statistical analysis performed over the rainfall time series of the reference rain gauges, on the hypothesis that anomalous or extreme values of accumulated rainfall are responsible for landslide triggering. The statistical distribution of the rainfall series was analyzed, and multiples of the standard deviation (σ) were used as thresholds to discriminate between ordinary and extraordinary rainfall events. The prototypal RSLEWS was based on a decision algorithm that compares measured and forecasted rainfalls:
Shallow landslides, triggered by short but exceptionally intense rainfalls: rainfall threshold is defined by 2σ of the rainfall cumulated in a short period (1–10 days).
Deep-seated landslides, triggered by mild but exceptionally prolonged rainfalls: 1.5σ of the rainfall cumulated in long periods (10–365 days).
Further details on this prototypal version of the rainfall threshold model can be found in [28], and the detailed explanation about how σ curves are built can be found also in [24]
It is important to remark that the objective of this research stage was just to establish the broad structure of the RSLEWS, postponing a more thorough model tuning in the following years, when more data of better quality would likely be available. As an example, the exact definition of “high” and ”low” σ values and of “short” and “long” duration has varied through time, as it has been adjusted during the evolution of the model according to the bigger quantity of data collected in the meanwhile.
Figure 2. Collection of landslides data over the years, showing the total number of landslides collectedeach year and the number of landslides with good spatial and temporal accuracy that could be usedfor SIGMA.
3. Results
3.1. Base Version of the Model
The first steps of the research were influenced by the lack of data. Usually, empirical rainfallthresholds are established combining a dataset of rainfall data and a dataset of landslides for whichthe time of occurrence is known [9,29]. For the Emilia Romagna Region, the historical recordings of awide network of rain gauges was available, providing hourly or daily rainfall measurements since themid-1950s. Unfortunately, when the research began, the landslide dataset available did not contain thetime of triggering. Therefore, the first prototypal version of the model had to rely only on rainfall data.
The prototypal version of SIGMA was based on rainfall thresholds defined by means of astatistical analysis performed over the rainfall time series of the reference rain gauges, on thehypothesis that anomalous or extreme values of accumulated rainfall are responsible for landslidetriggering. The statistical distribution of the rainfall series was analyzed, and multiples of the standarddeviation (σ) were used as thresholds to discriminate between ordinary and extraordinary rainfallevents. The prototypal RSLEWS was based on a decision algorithm that compares measured andforecasted rainfalls:
• Shallow landslides, triggered by short but exceptionally intense rainfalls: rainfall threshold isdefined by 2σ of the rainfall cumulated in a short period (1–10 days).
• Deep-seated landslides, triggered by mild but exceptionally prolonged rainfalls: 1.5σ of therainfall cumulated in long periods (10–365 days).
Further details on this prototypal version of the rainfall threshold model can be found in [28], andthe detailed explanation about how σ curves are built can be found also in [24].
It is important to remark that the objective of this research stage was just to establish the broadstructure of the RSLEWS, postponing a more thorough model tuning in the following years, whenmore data of better quality would likely be available. As an example, the exact definition of “high” and”low” σ values and of “short” and “long” duration has varied through time, as it has been adjustedduring the evolution of the model according to the bigger quantity of data collected in the meanwhile.

Water 2018, 10, 1297 6 of 17
3.2. Model Updates
3.2.1. Optimization of the Decisional Algorithm
Indeed, during the years, as landslides occurred, they were recorded and organized into ageodatabase and the performance of the prototypal version for SIGMA could be validated. This processallowed collecting evidence that the prototypal version of the model was producing many errors (bothfalse alarms and missed alarms). Fortunately, as year by year the amount of calibration and validationdata were increasing, it was possible to define a new decisional algorithm, more complex but withincreased forecasting effectiveness.
During the years, various versions of the decisional algorithm were tested (Table 1),mainly varying the number of the SIGMA curves and the length of the rainfall accumulation periodsto be used in the decisional algorithm. From time to time, a quantitative validation procedure allowedidentifying the best performing version of the algorithm and evaluating if the amelioration was worthimplementing the changes in the RSLEWS. From Table 1 stands out that the rainfall accumulationperiods were progressively reduced. In particular, the definition of the long-duration period wasinitially set to a whole year, with the aim of accounting for the possible influence of the rain fallen,which could potentially influence the hydrologic response of deep-seated landslides in terrain with verylow hydraulic conductivity. With time, the collection of new data and single case studies [27] suggestedto narrow the time span and to better address an inherent seasonal variability encountered in thehillslope response to rainfall. Temporal and seasonal variability have been considered using differenttime intervals to calculate the cumulative rainfalls. A variable time-window was then successfullytested and introduced, which considers the rain fallen from the beginning of the rainy season to the dayof interest. Since the dry season is conventionally defined from June to September [24], the maximumpossible length of the long-duration period is 245 days (influence of autumnal rainfall on early spring),while some tests suggested that the minimum possible length of 60 days (used during the dry season)was better than 30, 45 or 90 days.
Table 1. Main updates to the decisional algorithm.
Model Version Prototypal SIGMA SIGMA 2006 SIGMA 2010 SIGMA 2012
Reference [28] [30] [24] [31]
Number of differentSIGMA curves used as
thresholds
3 fixed(1σ, 1.5σ, 2σ)
3 fixed(1.5σ, 2σ, 3σ)
4 customized for eachTU
4 customized(according to a largercalibration dataset)
Definition ofshort-duration period 1–10 days 1–5 days 1–3 days 1–3 days
Definition oflong-duration period 5–365 days 6–365 days
4–60 days in the dryseason (or up to 245
days in the wet season)
4–60 days in the dryseason (or up to 245
days in the wet season)
Alert stages 3 3 4 4
3.2.2. Customization and Optimization of the Rainfall Thresholds
After almost a decade, enough data were collected in each TU to allow a most robust calibrationof the rainfall thresholds against a landslide catalogue. Consequently, the decisional algorithm wascustomized for each TU comparing rainfall data and landslides: the scheme of the decisional algorithmremains the same in each TU, but each TU uses different σ values to define the thresholds. The optimalset of σ values for each TU was empirically defined using a recursive algorithm that selected for eachTU the σ values that minimized the errors committed in a calibration dataset (further details can befound in [24]).
This process was repeated periodically: at regular intervals, new landslides and rainfall datawere stored into the calibration dataset and used to re-calibrate the SIGMA curves and run a newoptimization procedure. Table 2 shows that this procedure allowed consistently increasing the
Water 2018, 10, 1297 7 of 17
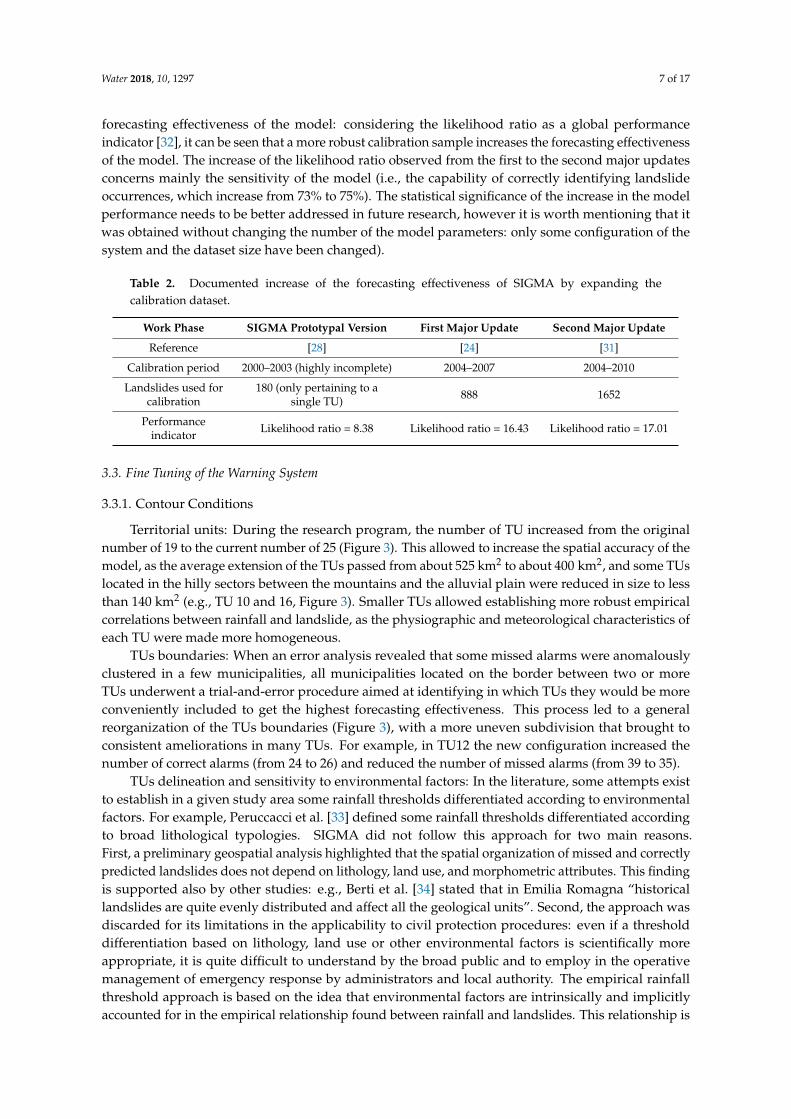
forecasting effectiveness of the model: considering the likelihood ratio as a global performanceindicator [32], it can be seen that a more robust calibration sample increases the forecasting effectivenessof the model. The increase of the likelihood ratio observed from the first to the second major updatesconcerns mainly the sensitivity of the model (i.e., the capability of correctly identifying landslideoccurrences, which increase from 73% to 75%). The statistical significance of the increase in the modelperformance needs to be better addressed in future research, however it is worth mentioning that itwas obtained without changing the number of the model parameters: only some configuration of thesystem and the dataset size have been changed).
Table 2. Documented increase of the forecasting effectiveness of SIGMA by expanding thecalibration dataset.
Work Phase SIGMA Prototypal Version First Major Update Second Major Update
Reference [28] [24] [31]
Calibration period 2000–2003 (highly incomplete) 2004–2007 2004–2010
Landslides used forcalibration
180 (only pertaining to asingle TU) 888 1652
Performanceindicator Likelihood ratio = 8.38 Likelihood ratio = 16.43 Likelihood ratio = 17.01
3.3. Fine Tuning of the Warning System
3.3.1. Contour Conditions
Territorial units: During the research program, the number of TU increased from the originalnumber of 19 to the current number of 25 (Figure 3). This allowed to increase the spatial accuracy of themodel, as the average extension of the TUs passed from about 525 km2 to about 400 km2, and some TUslocated in the hilly sectors between the mountains and the alluvial plain were reduced in size to lessthan 140 km2 (e.g., TU 10 and 16, Figure 3). Smaller TUs allowed establishing more robust empiricalcorrelations between rainfall and landslide, as the physiographic and meteorological characteristics ofeach TU were made more homogeneous.
TUs boundaries: When an error analysis revealed that some missed alarms were anomalouslyclustered in a few municipalities, all municipalities located on the border between two or moreTUs underwent a trial-and-error procedure aimed at identifying in which TUs they would be moreconveniently included to get the highest forecasting effectiveness. This process led to a generalreorganization of the TUs boundaries (Figure 3), with a more uneven subdivision that brought toconsistent ameliorations in many TUs. For example, in TU12 the new configuration increased thenumber of correct alarms (from 24 to 26) and reduced the number of missed alarms (from 39 to 35).
TUs delineation and sensitivity to environmental factors: In the literature, some attempts existto establish in a given study area some rainfall thresholds differentiated according to environmentalfactors. For example, Peruccacci et al. [33] defined some rainfall thresholds differentiated accordingto broad lithological typologies. SIGMA did not follow this approach for two main reasons.First, a preliminary geospatial analysis highlighted that the spatial organization of missed and correctlypredicted landslides does not depend on lithology, land use, and morphometric attributes. This findingis supported also by other studies: e.g., Berti et al. [34] stated that in Emilia Romagna “historicallandslides are quite evenly distributed and affect all the geological units”. Second, the approach wasdiscarded for its limitations in the applicability to civil protection procedures: even if a thresholddifferentiation based on lithology, land use or other environmental factors is scientifically moreappropriate, it is quite difficult to understand by the broad public and to employ in the operativemanagement of emergency response by administrators and local authority. The empirical rainfallthreshold approach is based on the idea that environmental factors are intrinsically and implicitlyaccounted for in the empirical relationship found between rainfall and landslides. This relationship is

Water 2018, 10, 1297 8 of 17
strengthened when the available dataset is larger and allows optimizing territorial units of smaller arealextent. Moreover, a more robust approach to account for environmental variables was performed bycoupling rainfall thresholds with susceptibility assessments aimed at spatial forecasting of landslides(Section 3.4.2).Water 2018, 10, x FOR PEER REVIEW 8 of 17
Figure 3. Change in the TU number, boundaries and reference rain gauges.
TUs delineation and sensitivity to environmental factors: In the literature, some attempts exist to establish in a given study area some rainfall thresholds differentiated according to environmental factors. For example, Peruccacci et al. [33] defined some rainfall thresholds differentiated according to broad lithological typologies. SIGMA did not follow this approach for two main reasons. First, a preliminary geospatial analysis highlighted that the spatial organization of missed and correctly predicted landslides does not depend on lithology, land use, and morphometric attributes. This finding is supported also by other studies: e.g., Berti et al. [34] stated that in Emilia Romagna “historical landslides are quite evenly distributed and affect all the geological units”. Second, the approach was discarded for its limitations in the applicability to civil protection procedures: even if a threshold differentiation based on lithology, land use or other environmental factors is scientifically more appropriate, it is quite difficult to understand by the broad public and to employ in the operative management of emergency response by administrators and local authority. The empirical rainfall threshold approach is based on the idea that environmental factors are intrinsically and implicitly accounted for in the empirical relationship found between rainfall and landslides. This relationship is strengthened when the available dataset is larger and allows optimizing territorial units of smaller areal extent. Moreover, a more robust approach to account for environmental
Figure 3. Change in the TU number, boundaries and reference rain gauges.
Reference rain gauges: A key point in rainfall threshold definition is the selection of the raingauge that measures the triggering rainfall for each landslide. According to the review in [9],several approaches are used in the literature and the threshold analysis result is very sensitive tothe rain gauge selection method. SIGMA always relied on the “reference rain gauge” approach,but it was refined during the research program. In the first stages of the research, a reference raingauge was chosen considering several factors: presence of a long historical dataset; reliable automaticrecording and transmission of the data; central position in the TU; and elevation representative ofthe mean elevation of the TU. In the early 2010s, this configuration was discussed again. For eachTU, all available rain gauges were tested and a performance analysis was used to select the referencerain gauge providing the best landslide forecasts. This procedure brought also important scientific

Water 2018, 10, 1297 9 of 17
results as it demonstrated that the approach of using the nearest rain gauge (the most used accordingto Segoni et al. [9]) did not always produce the best results.
3.3.2. Model Outputs and Event Magnitude
SIGMA forecasted landslides at the TU level, but the civil protection procedures dictate thatwarnings should be released at the alert zone level, according to the magnitude of the impact expected.The passage from TU criticality levels to a single AZ (Alert Zone) criticality level is not a trivialmatter, since during complex rainfall events adjacent TUs may have very different warning levels.Instead of relying on subjective decisions of the operators in monitoring duties, the high amountof data collected during the research was used to establish a correlation scheme that automaticallyweights and aggregates the TU outputs at the AZ levels providing four alert states defined in termsof number of expected landslide: absent (0 or 1 landslide), low (2–19 landslides), moderate (20–59landslides), and high (more than 60 landslides). Of course, the finer-resolution forecasts at the TU levelcan be used to better address the countermeasures to be implemented in the territory. Further detailson this procedure can be found in [35].
3.3.3. Rainfall Dataset Length
Every year, the SIGMA curves are updated, adding to the statistical sample the data collectedduring the previous year. During the first stages of the research, this procedure brought relevantmodifications of the σ curves. The changes progressively became smaller as time went by. This couldbe partially due to the reduction of sample variability with increasing sample size, but it could alsobe related to climate change, which in the 1990s led to a marked change in precipitation trends inthe Mediterranean area and in Italy [36,37]: the first updates brought some outliers in the datasets(in most cases, the rainfall series start from the 1950s) and consistently perturbed the statistical sample.During the years, the statistical perturbation stabilized.
These outcomes suggested to investigate the impact on SIGMA forecasting effectiveness of theuse of time series of different lengths to derive the σ curves. The details of the test are explained indetail in [38], here we summarize the main findings: the best model performances are obtained withthe longest possible time series, to the point that when selecting reference rain gauges, the length of thetime series may be more important than the position inside the TU. Actually, this test left the SIGMAmodel unchanged but corroborated the robustness of the workflow and the good practice of periodicalupdates to the system.
3.4. Conceptual Updates
3.4.1. Snow Melt/Accumulation Processes
Although the fine-tuning and update processes improved the performance of the model,many errors were still present. However, since the number of errors was reduced, it stood outthat some of the remaining ones were clustered in space and time. More specifically, many missedalarms were related to some events that took place in high-mountain areas, in a period of null or verylow precipitations. In addition, we recognized some false alarms in mountainous TU, when highvalues of rainfall surprisingly did not trigger landslides. Both kinds of errors could not be managedadjusting the threshold values with the calibration procedure; therefore, we hypothesized the presenceof external factors driving these anomalously clustered errors. After checking the seasonality of theevents and considering a more complete set of weather data, we concluded that these errors wererelated to snow-melting and snow accumulation events. In the first case, the terrain received waterfrom snowmelt, therefore landslides were triggered even with null precipitation. In the second case,heated rain gauges measured the water equivalent of the fallen snow, but actually a snowpack wasbuilding without any water infiltration into the soil, thus no landslides were triggered despite the highvalues recorded by the rain gauges.

Water 2018, 10, 1297 10 of 17
Therefore, a challenging objective of two annual activity plans was the definition of a simple snowaccumulation/melting model (SAMM) to be applied at regional scale in conjunction with SIGMA.Despite the physics governing snow melt-accumulation processes is very complex, we relied on asimple correlation scheme derived from the philosophy of statistical rainfall threshold for the initiationof landslides: as rainfall is used as the only external variable to forecast the occurrence of landslideswith a specific threshold for each TU; similarly we used temperature data to assess the presence ofsnow-related phenomena in each TU.
In brief, SAMM is based on two modules modeling snow accumulation and melting. Each moduleis composed by two equations: a conservation of mass equation for snowpack thickness and anempirical equation for snow density. The model depends on 13 empirical parameters, whose optimalvalues were defined with an optimization algorithm (simplex flexible) using calibration measures ofrecorded snowpack thickness. SAMM uses as input data only temperature and rainfall measurements,thus being easy to implement and understand. Various tests (cross validation, comparison withtwo simpler temperature index models, and simulation of the operational employment) proved thatSIGMA forecasting effectiveness can be improved if SAMM is used to filter the input rainfall data.Further details can be found in [39].
3.4.2. Coupling with a Susceptibility Map
One of the main and most known drawbacks of RSLEWS based on rainfall thresholds is the poorspatial resolution. Generally, they can be used only to issue generic warnings for the whole area ofapplication or for a large subdivision of it. The use of territorial units and the progressive increaseof their number (up to the actual configuration encompassing 25 TUs) can be considered a slightspatial refinement, but still the system cannot be used for a full spatial forecasting, e.g., to pinpoint ona map the spatial location of the landslides expected during the next warning. This drawback waspartially overcome by coupling SIGMA with a purposely-developed susceptibility map (Figure 4).Susceptibility maps are static products describing the spatial probability of landslide occurrence [40],i.e., they could be used to assess where landslides could occur in an unspecified future. A procedurebased on a hazard matrix was defined to correlate the criticality levels forecasted by SIGMA and thesusceptibility classes provided by the map (further details in [41]). A multi-tier procedure was proposedthat could be used to assist civil protection agencies during alert phase to better define the areas thatcould be affected by landslides. The coarser level of alert is the Alert Zone (typically thousands ofsquare kilometers) and it is connected to the expected magnitude of the event (i.e., number of triggeredlandslides). The mid-resolution tier has territorial units as spatial units (typically hundreds of squarekilometers) and it is based on the exceedance of the rainfall thresholds. The fine-resolution tier isaddressed specifically to the municipalities (Figure 4) that are more exposed to landslide hazard(typically tens of square kilometers) and the finest-resolution tier consists in a dynamic raster mapwith 100 m × 100 m pixels highlighting where landslides are more likely to occur during each alert.A back analysis showed that the proposed approach would have led to define a more accurate locationfor 83% of the landslides examined, while 17% occurred in locations that would have been deemed asstable by our approach.
3.4.3. Soil Moisture
The constant struggle to improve SIGMA effectiveness brought our error analyses to reveal thatmost of the false alarms were issued when long-period rainfall accumulation was taken into account.After years of calibrations and fine-tunings, it stood clear that SIGMA approach allows identifyinglandslides with complex hydrologic response at the cost of issuing a not negligible number of falsealarms. A series of tests was therefore performed to check the feasibility of incorporating soil moisturein the warning system. This represented a major change in the philosophy of the rainfall thresholdmodel but it was supported by a new perspective brought into landslide studies by novel approachesfocused on hydrologic issues [42,43]. Indeed, in rainfall threshold studies, long-period antecedent

Water 2018, 10, 1297 11 of 17
rainfall has always been used as a proxy of the antecedent soil moisture conditions; therefore, the idea ofincorporating directly soil moisture data into the warning system has a robust background, although itis quite unexplored in RSLEWS and is limited to few case studies mainly related to remotely sensedmeasures (e.g., [7]). In our case study, the major challenge was the application of this theory to awarning system where a reference rain gauge actually monitors a large territorial unit. Following thesame approach used for temperature data in the snow melting/accumulation module, we consideredsoil moisture conditions averaged over each territorial unit and we found an empirical correlationbetween soil moisture values and landslide triggering at the TU scale. Segoni et al. [44] described indetail this approach and demonstrated that it could be easily used to reduce both false alarms andmissed alarms. Unfortunately, this feature has not been implemented yet in SIGMA, because thereal-time use of soil moisture data is not available for the whole study area.Water 2018, 10, x FOR PEER REVIEW 11 of 17
.
Figure 4. Landslide susceptibility map: the output is aggregated at the municipality level.
3.4.3. Soil Moisture
The constant struggle to improve SIGMA effectiveness brought our error analyses to reveal that most of the false alarms were issued when long-period rainfall accumulation was taken into account. After years of calibrations and fine-tunings, it stood clear that SIGMA approach allows identifying landslides with complex hydrologic response at the cost of issuing a not negligible number of false alarms. A series of tests was therefore performed to check the feasibility of incorporating soil moisture in the warning system. This represented a major change in the philosophy of the rainfall threshold model but it was supported by a new perspective brought into landslide studies by novel approaches focused on hydrologic issues [42,43]. Indeed, in rainfall threshold studies, long-period antecedent rainfall has always been used as a proxy of the antecedent soil moisture conditions; therefore, the idea of incorporating directly soil moisture data into the warning system has a robust background, although it is quite unexplored in RSLEWS and is limited to few case studies mainly related to remotely sensed measures (e.g., [7]). In our case study, the major challenge was the application of this theory to a warning system where a reference rain gauge actually monitors a large territorial unit. Following the same approach used for temperature data in the snow melting/accumulation module, we considered soil moisture conditions averaged over each territorial unit and we found an empirical correlation between soil moisture values and landslide triggering at the TU scale. Segoni et al. [44] described in detail this approach and demonstrated that it could be easily used to reduce both false alarms and missed alarms. Unfortunately, this feature has not been implemented yet in SIGMA, because the real-time use of soil moisture data is not available for the whole study area.
3.4.4. Comparison with other Rainfall Threshold Models
The search for conceptual improvements of the rainfall threshold model brought us to question if SIGMA model would be outperformed by rainfall threshold model of different typology. Since intensity and duration are since long ago the most used rainfall parameters do define rainfall thresholds [9,29,45,46], an alert zone was selected to compare SIGMA with a state-of-the-art intensity-duration model. This test is described in detail in [35]. The main outcomes of the quantitative comparison of the forecasting effectiveness of two models demonstrate that in the selected alert zone SIGMA performs better than an intensity-duration (I-D) approach (the likelihood ratio was 89.8 with SIGMA and 51.3 with the I-D threshold). This result is connected with the quantity and typology of data and the physical features of the study area and from our perspective were encouraging: the
Figure 4. Landslide susceptibility map: the output is aggregated at the municipality level.
3.4.4. Comparison with other Rainfall Threshold Models
The search for conceptual improvements of the rainfall threshold model brought us toquestion if SIGMA model would be outperformed by rainfall threshold model of different typology.Since intensity and duration are since long ago the most used rainfall parameters do definerainfall thresholds [9,29,45,46], an alert zone was selected to compare SIGMA with a state-of-the-artintensity-duration model. This test is described in detail in [35]. The main outcomes of the quantitativecomparison of the forecasting effectiveness of two models demonstrate that in the selected alert zoneSIGMA performs better than an intensity-duration (I-D) approach (the likelihood ratio was 89.8 withSIGMA and 51.3 with the I-D threshold). This result is connected with the quantity and typologyof data and the physical features of the study area and from our perspective were encouraging: theinfluence of antecedent rainfall in low permeability terrain and deep-seated landslides led the I-Dthreshold to a poor performance and demonstrated the robustness of the SIGMA approach.
3.5. Summary of Main Results
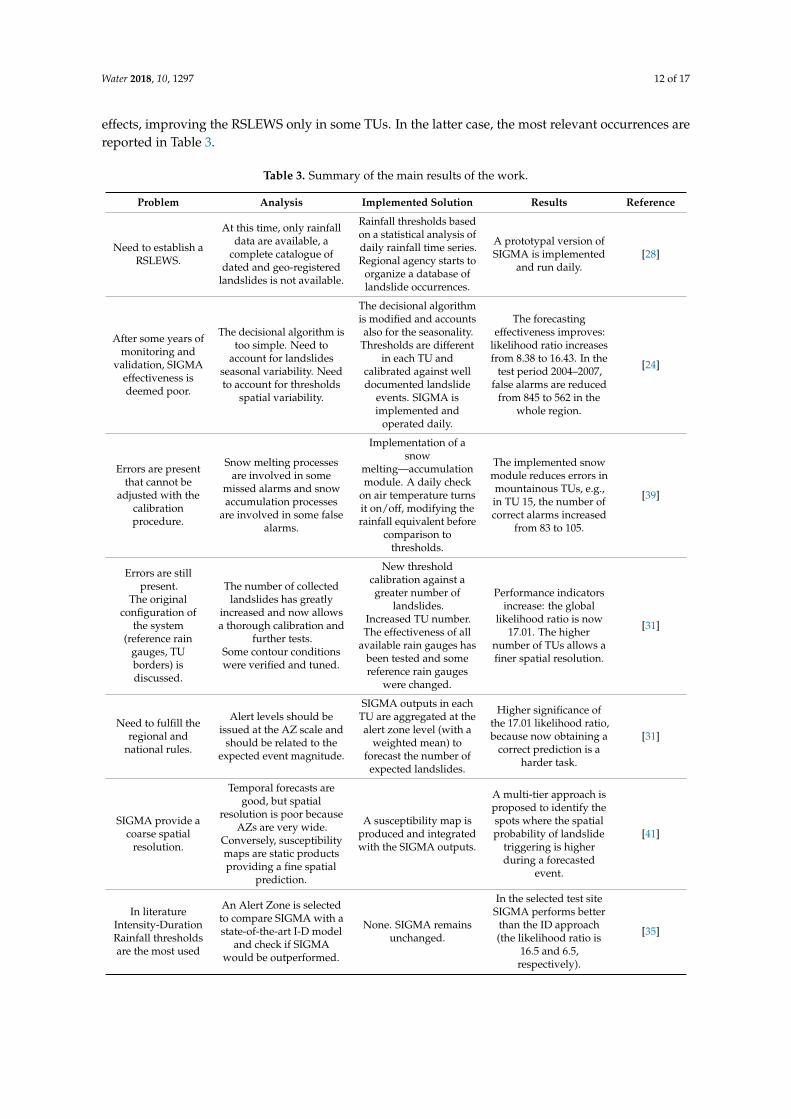
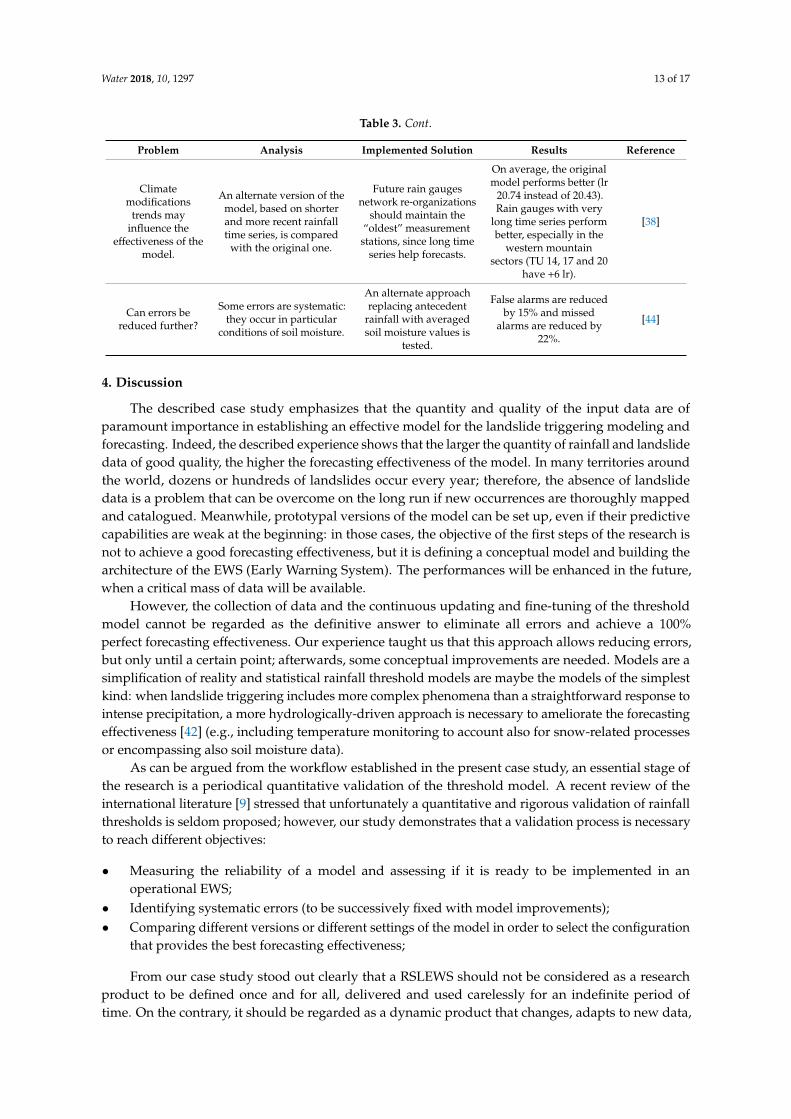
Table 3 summarizes the main results obtained with the workflow explained in the previoussections. It is worth to notice that while some of the improvements led to effects generalized in thewhole study area, some others address very specific scientific issues and therefore they led to localized
Water 2018, 10, 1297 12 of 17
effects, improving the RSLEWS only in some TUs. In the latter case, the most relevant occurrences arereported in Table 3.
Table 3. Summary of the main results of the work.
Problem Analysis Implemented Solution Results Reference
Need to establish aRSLEWS.
At this time, only rainfalldata are available, a
complete catalogue ofdated and geo-registered
landslides is not available.
Rainfall thresholds basedon a statistical analysis ofdaily rainfall time series.Regional agency starts to
organize a database oflandslide occurrences.
A prototypal version ofSIGMA is implemented
and run daily.[28]
After some years ofmonitoring and
validation, SIGMAeffectiveness isdeemed poor.
The decisional algorithm istoo simple. Need to
account for landslidesseasonal variability. Needto account for thresholds
spatial variability.
The decisional algorithmis modified and accountsalso for the seasonality.
Thresholds are differentin each TU and
calibrated against welldocumented landslide
events. SIGMA isimplemented and
operated daily.
The forecastingeffectiveness improves:
likelihood ratio increasesfrom 8.38 to 16.43. In the
test period 2004–2007,false alarms are reduced
from 845 to 562 in thewhole region.
[24]
Errors are presentthat cannot be
adjusted with thecalibrationprocedure.
Snow melting processesare involved in some
missed alarms and snowaccumulation processes
are involved in some falsealarms.
Implementation of asnow
melting—accumulationmodule. A daily check
on air temperature turnsit on/off, modifying therainfall equivalent before
comparison tothresholds.
The implemented snowmodule reduces errors inmountainous TUs, e.g.,in TU 15, the number ofcorrect alarms increased
from 83 to 105.
[39]
Errors are stillpresent.
The originalconfiguration of
the system(reference rain
gauges, TUborders) isdiscussed.
The number of collectedlandslides has greatly
increased and now allowsa thorough calibration and
further tests.Some contour conditionswere verified and tuned.
New thresholdcalibration against agreater number of
landslides.Increased TU number.The effectiveness of all
available rain gauges hasbeen tested and somereference rain gauges
were changed.
Performance indicatorsincrease: the global
likelihood ratio is now17.01. The higher
number of TUs allows afiner spatial resolution.
[31]
Need to fulfill theregional and
national rules.
Alert levels should beissued at the AZ scale and
should be related to theexpected event magnitude.
SIGMA outputs in eachTU are aggregated at thealert zone level (with a
weighted mean) toforecast the number of
expected landslides.
Higher significance ofthe 17.01 likelihood ratio,because now obtaining a
correct prediction is aharder task.
[31]
SIGMA provide acoarse spatial
resolution.
Temporal forecasts aregood, but spatial
resolution is poor becauseAZs are very wide.
Conversely, susceptibilitymaps are static productsproviding a fine spatial
prediction.
A susceptibility map isproduced and integratedwith the SIGMA outputs.
A multi-tier approach isproposed to identify thespots where the spatialprobability of landslide
triggering is higherduring a forecasted
event.
[41]
In literatureIntensity-DurationRainfall thresholdsare the most used
An Alert Zone is selectedto compare SIGMA with astate-of-the-art I-D model
and check if SIGMAwould be outperformed.
None. SIGMA remainsunchanged.
In the selected test siteSIGMA performs better
than the ID approach(the likelihood ratio is
16.5 and 6.5,respectively).
[35]
Water 2018, 10, 1297 13 of 17
Table 3. Cont.
Problem Analysis Implemented Solution Results Reference
Climatemodifications
trends mayinfluence the
effectiveness of themodel.
An alternate version of themodel, based on shorterand more recent rainfalltime series, is compared
with the original one.
Future rain gaugesnetwork re-organizations
should maintain the“oldest” measurement
stations, since long timeseries help forecasts.
On average, the originalmodel performs better (lr
20.74 instead of 20.43).Rain gauges with very
long time series performbetter, especially in the
western mountainsectors (TU 14, 17 and 20
have +6 lr).
[38]
Can errors bereduced further?
Some errors are systematic:they occur in particular
conditions of soil moisture.
An alternate approachreplacing antecedent
rainfall with averagedsoil moisture values is
tested.
False alarms are reducedby 15% and missed
alarms are reduced by22%.
[44]
4. Discussion
The described case study emphasizes that the quantity and quality of the input data are ofparamount importance in establishing an effective model for the landslide triggering modeling andforecasting. Indeed, the described experience shows that the larger the quantity of rainfall and landslidedata of good quality, the higher the forecasting effectiveness of the model. In many territories aroundthe world, dozens or hundreds of landslides occur every year; therefore, the absence of landslidedata is a problem that can be overcome on the long run if new occurrences are thoroughly mappedand catalogued. Meanwhile, prototypal versions of the model can be set up, even if their predictivecapabilities are weak at the beginning: in those cases, the objective of the first steps of the research isnot to achieve a good forecasting effectiveness, but it is defining a conceptual model and building thearchitecture of the EWS (Early Warning System). The performances will be enhanced in the future,when a critical mass of data will be available.
However, the collection of data and the continuous updating and fine-tuning of the thresholdmodel cannot be regarded as the definitive answer to eliminate all errors and achieve a 100%perfect forecasting effectiveness. Our experience taught us that this approach allows reducing errors,but only until a certain point; afterwards, some conceptual improvements are needed. Models are asimplification of reality and statistical rainfall threshold models are maybe the models of the simplestkind: when landslide triggering includes more complex phenomena than a straightforward response tointense precipitation, a more hydrologically-driven approach is necessary to ameliorate the forecastingeffectiveness [42] (e.g., including temperature monitoring to account also for snow-related processesor encompassing also soil moisture data).
As can be argued from the workflow established in the present case study, an essential stage ofthe research is a periodical quantitative validation of the threshold model. A recent review of theinternational literature [9] stressed that unfortunately a quantitative and rigorous validation of rainfallthresholds is seldom proposed; however, our study demonstrates that a validation process is necessaryto reach different objectives:
• Measuring the reliability of a model and assessing if it is ready to be implemented in anoperational EWS;
• Identifying systematic errors (to be successively fixed with model improvements);• Comparing different versions or different settings of the model in order to select the configuration
that provides the best forecasting effectiveness;
From our case study stood out clearly that a RSLEWS should not be considered as a researchproduct to be defined once and for all, delivered and used carelessly for an indefinite period oftime. On the contrary, it should be regarded as a dynamic product that changes, adapts to new data,

Water 2018, 10, 1297 14 of 17
new needs and new circumstances and improves through time. The changes progressively occurred tothe decisional algorithm of SIGMA well illustrate the concept of “dynamic” RSLEWS. The time spanconsidered to cumulate rainfall depths has been gradually adjusted and reduced: the short period ofcumulates were initially conceived as 10-day cumulate. To reduce false alarms, it was subsequentlyreduced to five days and, finally, to three days (currently employed configuration). The long periodstarted with 365 days, then it was reduced to 245 days, subsequently it was split into 60 days for thedry period and a variable length for the rainy season, while the latest experiments suggested that itcould be completely discarded in favor of soil moisture measures.
Therefore, when stakeholders and researchers plan the definition of a RSLEWS, an extendedlong-term research program would be needed to encompass at least also a quantitative validation, anerror analysis and periodic updates and improvements.
5. Conclusions
We described the development process of a regional scale landslide early warning systemoperating in Emilia Romagna (Italy), from its birth to the present setting, through over a decadeof operational employment. This case study taught us several lessons that could be convenientlyexploited in other cases of study:
• A prototypal RSLEWS can be implemented even if a complete archive of landslides is not available.• The setting up of a RSLEWS should be conceived as a long-term objective, to be reached by a joint
effort between researchers and local administrators involved in hazard management.• The collaboration between these two different sectors should be formalized with long-term
framework programs of applied research, where year by year the research activities are addressedby operational needs and defined on the basis of short-term objectives.
• The RSLEWS should be constantly validated and an error analysis should be periodically carriedout to find systematic errors and to study possible solutions.
• A quantitative evaluation procedure should be used not only to validate the various versionsof the RSLEWS, but also to: (i) compare the effectiveness of different versions of the model;and (ii) objectively test and identify the best scientific and operational solutions that deserve to beimplemented in the operational version of the RSLEWS.
• A constant effort to establish a workflow of constantly updated data (rainfall measures, landslideoccurrences, and other potentially useful environmental data) is of paramount importance toachieve good results.
In our case study, this process has led to an evolution of the warning system and to a tangibleimprovement of its forecasting effectiveness. The main upgrades reviewed in this paper concern:periodic re-calibrations of the thresholds against increased and updated datasets, development of acomputation module accounting for snow melt/accumulation processes, fine tuning of the algorithm,fine-tuning of the contour conditions of the system (e.g., boundaries of the territorial units and raingauges selection), establishment of a correspondence between alert levels and magnitude of the event(i.e., number of landslides expected), use of soil moisture data, and integration with a landslidesusceptibility map to improve the spatial accuracy of the model.
Landslide forecasting at regional scale is a very complex task, over time, and with the systematicgathering and analysis of new substantial data and continuous research, uncertainties can beprogressively reduced. Thus, forward-looking research programs can be set up that increase with timethe performance and reliability of regional scale warning systems.
Author Contributions: Conceptualization, N.C., R.F. and A.M.; Methodology, S.S., R.F. and A.R.; Validation,S.S. and A.R.; Formal Analysis, S.S.; Investigation, S.S.; Data Curation, A.G.; Writing—Original Draft Preparation,S.S.; Writing—Review and Editing, A.R.; Visualization, A.R.; Supervision, N.C. and A.M.; Project Administration,R.F. and A.G.; and Funding Acquisition, N.C. and A.M.
Funding: This research was funded by the Emilia Romagna Agency for Territorial Safety and Civil Protection.

Water 2018, 10, 1297 15 of 17
Acknowledgments: We would like to thank and to explicitly mention all the researchers from the EarthScience Department of University of Firenze that in the past have been involved in the development ofSIGMA: Paolo Canuti, Leonardo Ermini, Angelo Iacopo Benedetti, Matteo Palmieri, Gianluca Martelloni,Daniela Lagomarsino, and Filippo Catani. We also would like to express our gratitude to Sabrina Primeranofrom Emilia Romagna Agency for Territorial Safety and Civil Protection, who contributed to address theresearch activities.
Conflicts of Interest: The authors declare no conflict of interest. The funders had a key role in guiding theresearch towards the fulfillment of the operational needs faced daily by Civil Protection in its landslide hazardmanagement duty. They helped collecting raw data but had no role in the analyses or interpretation of data.
References
1. Baum, R.L.; Godt, J.W. Early warning of rainfall-induced shallow landslides and debris flows in the USA.Landslides 2010, 7, 259–272. [CrossRef]
2. Piciullo, L.; Calvello, M.; Cepeda, J.M. Territorial early warning systems for rainfall-induced landslides.Earth Sci. Rev. 2018, 179, 228–247. [CrossRef]
3. Capparelli, G.; Tiranti, D. Application of the MoniFLaIR early warning system for rainfall-induced landslidesin Piedmont region (Italy). Landslides 2010, 7, 401–410. [CrossRef]
4. Papa, M.N.; Medina, V.; Ciervo, F.; Bateman, A. Derivation of critical rainfall thresholds for shallow landslidesas a tool for debris flow early warning systems. Hydrol. Earth Syst. Sci. 2013, 17, 4095–4107. [CrossRef]
5. Aleotti, P. A warning system for rainfall-induced shallow failures. Eng. Geol. 2004, 73, 247–265. [CrossRef]6. Zêzere, J.L.; Vaz, T.; Pereira, S.; Oliveira, S.C.; Marques, R.; Garcia, R.A.C. Rainfall thresholds for landslide
activity in Portugal: A state of the art. Environ. Earth Sci. 2015, 73, 2917–2936. [CrossRef]7. Ponziani, F.; Pandolfo, C.; Stelluti, M.; Berni, N.; Brocca, L.; Moramarco, T. Assessment of rainfall
thresholds and soil moisture modeling for operational hydrogeological risk prevention in the UmbriaRegion (central Italy). Landslides 2012, 9, 229–237. [CrossRef]
8. Calvello, M.; d’Orsi, R.N.; Piciullo, L.; Paes, N.; Magalhaes, M.; Lacerda, W.A. The Rio de Janeiro earlywarning system for rainfall-induced landslides: Analysis of performance for the years 2010–2013. Int. J.Disaster Risk Reduction 2015, 12, 3–15. [CrossRef]
9. Segoni, S.; Piciullo, L.; Gariano, S.L. A review of the recent literature on rainfall thresholds for landslideoccurrence. Landslides 2018, 15, 1483–1501. [CrossRef]
10. Chen, H.X.; Wang, J.D. Regression analyses for the minimum intensity-duration conditions of continuousrainfall for mudflows triggering in Yan’an, Northern Shaanxi (China). Bull. Eng. Geol. Environ. 2014, 73,917–928. [CrossRef]
11. Pan, H.L.; Jiang, Y.J.; Wang, J.; Ou, G.Q. Rainfall threshold calculation for debris flow early warning in areaswith scarcity of data. Nat. Hazards Earth Syst. Sci. 2018, 18, 1395–1409. [CrossRef]
12. Segoni, S.; Rosi, A.; Rossi, G.; Catani, F.; Casagli, N. Analysing the relationship between rainfalls andlandslides to define a mosaic of triggering thresholds for regional scale warning systems. Nat. Hazards EarthSyst. Sci. 2014, 14, 2637–2648. [CrossRef]
13. Rosi, A.; Lagomarsino, D.; Rossi, G.; Segoni, S.; Battistini, A.; Casagli, N. Updating EWS rainfall thresholdsfor the triggering of landslides. Nat. Hazards 2015, 78, 297–308. [CrossRef]
14. Gariano, S.L.; Brunetti, M.T.; Iovine, G.; Melillo, M.; Peruccacci, S.; Terranova, O.; Vennari, C.; Guzzetti, F.Calibration and validation of rainfall thresholds for shallow landslide forecasting in Sicily, Southern Italy.Geomorphology 2015, 228, 653–665. [CrossRef]
15. Brunetti, M.T.; Peruccacci, S.; Rossi, M.; Luciani, S.; Valigi, D.; Guzzetti, F. Rainfall thresholds for the possibleoccurrence of landslides in Italy. Nat. Hazards Earth Syst. Sci. 2010, 10, 447–458. [CrossRef]
16. Peruccacci, S.; Brunetti, M.T.; Gariano, S.L.; Melillo, M.; Rossi, M.; Guzzetti, F. Rainfall thresholds for possiblelandslide occurrence in Italy. Geomorphology 2017, 290, 39–57. [CrossRef]
17. Peres, D.J.; Cancelliere, A.; Greco, R.; Bogaard, T.A. Influence of uncertain identification of triggering rainfallon the assessment of landslide early warning thresholds. Nat. Hazards Earth Syst. Sci. 2018, 18, 633–646.[CrossRef]
18. Saito, H.; Nakayama, D.; Matsuyama, H. Relationship between the initiation of a shallow landslide andrainfall intensity-duration thresholds in Japan. Geomorphology 2010, 118, 167–175. [CrossRef]

Water 2018, 10, 1297 16 of 17
19. Marra, F.; Nikolopoulos, E.I.; Creutin, J.D.; Borga, M. Space–time organization of debris flows-triggeringrainfall and its effect on the identification of the rainfall threshold relationship. J. Hydrol. 2016, 541, 246–255.[CrossRef]
20. Jakob, M.; Owen, T.; Simpson, T. A regional real-time debris-flow warning system for the District of NorthVancouver, Canada. Landslides 2012, 9, 165–178. [CrossRef]
21. Devoli, G.; Tiranti, D.; Cremonini, R.; Sund, M.; Boje, S. Comparison of landslide forecasting services inPiedmont (Italy) and Norway, illustrated by events in late spring 2013. Nat. Hazards Earth Syst. Sci. 2018, 18,1351–1372. [CrossRef]
22. Krøgli, I.K.; Devoli, G.; Colleuille, H.; Boje, S.; Sund, M.; Engen, I.K. The Norwegian forecasting and warningservice for rainfall- and snowmelt-induced landslides. Nat. Hazards Earth Syst. Sci. 2018, 18, 1427–1450.[CrossRef]
23. Vai, G.B.; Martini, I.P. Anatomy of an Orogen: The Apennines and Adjacent Mediterranean Basins; KluwerAcademic Publishers: London, UK, 2001.
24. Martelloni, G.; Segoni, S.; Fanti, R.; Catani, F. Rainfall thresholds for the forecasting of landslide occurrenceat regional scale. Landslides 2012, 9, 485–495. [CrossRef]
25. Montrasio, L.; Valentino, R.; Losi, G.L. Shallow landslides triggered by rainfalls: Modeling of some casehistories in the Reggiano Apennine (Emilia Romagna Region, Northern Italy). Nat. Hazards 2012, 60,1231–1254. [CrossRef]
26. Trigila, A.; Iadanza, C.; Spizzichino, D. Quality assessment of the Italian Landslide Inventory using GISprocessing. Landslides 2010, 4, 455–470. [CrossRef]
27. Ibsen, M.-L.; Casagli, N. Rainfall patterns and related landslide incidence in the Porretta-Vergato Region,Italy. Landslides 2004, 1, 143–150. [CrossRef]
28. Benedetti, A.I.; Casagli, N.; Dapporto, S.; Palmieri, M.; Zinoni, F. Modello statistico per la previsioneoperativa dei fenomeni franosi nella regione Emilia Romagna. Boll. Soc. Geol. Ital. 2005, 124, 333–344.
29. Guzzetti, F.; Peruccacci, S.; Rossi, M.; Stark, C.P. The rainfall intensity-duration control of shallow landslidesand debris flows: An update. Landslides 2008, 5, 3–17. [CrossRef]
30. Casagli, N.; Benedetti, A.I.; Palmieri, M.; Fanti, R. Unpublished work. 2006. (In Italian)31. Lagomarsino, D.; Segoni, S.; Fanti, R.; Catani, F. Updating and tuning a regional-scale landslide early warning
system. Landslides 2013, 10, 91–97. [CrossRef]32. Begueria, S. Validation and evaluation of predictive models in hazard assessment and risk management.
Nat. Hazards 2005, 37, 315–329. [CrossRef]33. Peruccacci, S.; Brunetti, M.T.; Luciani, S.; Vennari, C.; Guzzetti, F. Lithological and seasonal control on
rainfall thresholds for the possible initiation of landslides in central Italy. Geomorphology 2012, 139–140, 79–90.[CrossRef]
34. Berti, M.; Martina, M.L.V.; Franceschini, S.; Pignone, S.; Simoni, A.; Pizziolo, M. Probabilistic rainfallthresholds for landslide occurrence using a Bayesian approach. J. Geophys. Res. Earth Surf. 2012, 117.[CrossRef]
35. Lagomarsino, D.; Segoni, S.; Rosi, A.; Rossi, G.; Battistini, A.; Catani, F.; Casagli, N. Quantitative comparisonbetween two different methodologies to define rainfall thresholds for landslide forecasting. Nat. HazardsEarth Syst. Sci. 2015, 15, 2413–2423. [CrossRef]
36. Alpert, P.; Ben-Gai, T.; Baharad, A.; Benjamini, Y.; Yekutieli, D.; Colacino, M.; Diodato, L.; Ramis, C.;Homar, V.; Romero, R.; et al. The paradoxical increase of Mediterranean extreme daily rainfall in spite ofdecrease in total values. Geophys. Res. Lett. 2002, 29. [CrossRef]
37. Libertino, A.; Ganora, D.; Claps, P. Technical note: Space–time analysis of rainfall extremes in Italy:Clues from a reconciled dataset. Hydrol. Earth Syst. Sci. 2018, 22, 2705–2715. [CrossRef]
38. Segoni, S.; Rosi, A.; Lagomarsino, D.; Fanti, R.; Casagli, N. The impact of rainfall time series withdifferent length in a landslide warning system, in the framework of changing precipitation trends.Geoenviron. Disasters 2016. [CrossRef]
39. Martelloni, G.; Segoni, S.; Lagomarsino, D.; Fanti, R.; Catani, F. Snow accumulation-melting model (SAMM)for integrated use in regional scale landslide early warning systems. Hydrol. Earth Syst. Sci. 2013, 17,1229–1240. [CrossRef]
Water 2018, 10, 1297 17 of 17
40. Brabb, E.E. Innovative approaches to landslide hazard and risk mapping. In Proceedings of the 4th InternationalConference and Field Workshop in Landslides, Tokyo, Japan, 23–31 August 1985; Japan Landslide Society:Tokyo, Japan, 1985; pp. 17–22.
41. Segoni, S.; Lagomarsino, D.; Fanti, R.; Moretti, S.; Casagli, N. Integration of rainfall thresholds andsusceptibility maps in the Emilia Romagna (Italy) regional-scale landslide warning system. Landslides2015, 12, 773–785. [CrossRef]
42. Bogaard, T.; Greco, R. Invited perspectives: Hydrological perspectives on precipitation intensity-durationthresholds for landslide initiation: Proposing hydro-meteorological thresholds. Nat. Hazards Earth Syst. Sci.2018, 18, 31–39. [CrossRef]
43. Canli, E.; Mergili, M.; Thiebes, B.; Glade, T. Probabilistic landslide ensemble prediction systems: Lessons tobe learned from hydrology. Nat. Hazards Earth Syst. Sci. 2018, 18, 2183–2202. [CrossRef]
44. Segoni, S.; Rosi, A.; Lagomarsino, D.; Fanti, R.; Casagli, N. Brief communication: Using averaged soilmoisture estimates to improve the performances of a regional-scale landslide early warning system.Nat. Hazards Earth Syst. Sci. 2018, 18, 807–812. [CrossRef]
45. Fiorillo, F.; Wilson, R.C. Rainfall induced debris flows in pyroclastic deposits, Campania (Southern Italy).Eng. Geol. 2004, 75, 263–289. [CrossRef]
46. Caine, N. The rainfall intensity-duration control of shallow landslides and debris flows. Geogr. Ann. Ser. A.Phys. Geogr. 1980, 62, 23–27.
© 2018 by the authors. Licensee MDPI, Basel, Switzerland. This article is an open accessarticle distributed under the terms and conditions of the Creative Commons Attribution(CC BY) license (http://creativecommons.org/licenses/by/4.0/).