Landslide susceptibility zonation study using remote sensing and GIS technology in the Ken-Betwa...
12
ORIGINAL PAPER Landslide susceptibility zonation study using remote sensing and GIS technology in the Ken-Betwa River Link area, India Ram Avtar • C. K. Singh • Gulab Singh • R. L. Verma • S. Mukherjee • H. Sawada Received: 20 June 2010 / Accepted: 2 February 2011 / Published online: 15 March 2011 Ó Springer-Verlag 2011 Abstract The 231 km long Ken-Betwa River Linking canal will transfer 1,020 hm 3 of surplus water from the Ken River to the deficit Betwa River basin. The landslide susceptibility zonation map of the river link has been assessed using remote sensing data in GIS. Various the- matic maps such as geology, land use/land cover, linea- ment, drainage, slope, aspect, normalized difference vegetation index and soil type were generated from the Landsat Thematic Mapper 5 satellite data of 2005, the Survey of India topographic sheets, Shuttle Radar Topo- graphic Mission Digital Elevation (SRTM-DEM) data and other existing maps. Numerical rating schemes were used for ranking the thematic layers. The results were supported with the rainfall data, groundwater level data and a petro- logical study of rock thin sections. In addition to providing valuable information for project decision-makers, the results will assist in slope management and land use planning in the area. Keywords Landslide susceptibility zonation (LSZ) NDVI Ken-Betwa River Link GIS Re ´sume ´ Le canal de liaison Ken-Betwa, de 231 km de longueur, transfe ´rera 1020 hm 3 par an d’eau exce ´dentaire du bassin de la rivie `re Ken vers le bassin de la rivie `re Betwa. La carte de zonage de la sensibilite ´ aux glissements (LSZ) de la re ´gion du canal de liaison a e ´te ´e ´tablie en utilisant des donne ´es de te ´le ´de ´tection traite ´es dans un syste `me SIG. De nombreuses cartes the ´matiques relatives a ` la ge ´ologie, l’occupation des sols, les line ´aments, le drainage, les pentes, un indice de ve ´ge ´tation normalise ´ (NDVI) et les types de sols ont e ´te ´ ge ´ne ´re ´es a ` partir d’images Landsat (TM5) de 2005, de cartes de l’Institut ge ´ographique national indien, de fichiers nume ´riques de terrain (SRTM-DEM) et d’autres cartes pre ´existantes. Des proce ´de ´s de classement nume ´rique ont e ´te ´ mis en œuvre pour organiser les couches the ´matiques. Les re ´sultats ont e ´te ´ comple ´te ´s avec les donne ´es de pluviome ´trie, les nive- aux d’eau souterraine et des e ´tudes pe ´trographiques de lames minces. De plus, afin de produire une information valable pour les de ´cideurs, les re ´sultats apporteront une aide pour l’ame ´nagement des pentes et la planification territoriale de la re ´gion. Motscle ´s Zonage de la sensibilite ´ aux glissements (LSZ) NDVI Canal de liaison Ken-Betwa SIG Introduction Numerous natural factors such as earthquake, heavy rain- fall and river bank erosion by flood water, as well as anthropogenic factors, including deforestation and slope excavation, cause slope failure by decreasing the shear R. Avtar (&) H. Sawada Institute of Industrial Sciences, The University of Tokyo, Ce509, 4-6-1 Komaba, Maguro-Ku, Tokyo 153-8505, Japan e-mail: [email protected] R. Avtar C. K. Singh S. Mukherjee School of Environmental Sciences, Jawaharlal Nehru University, New Delhi 110067, India G. Singh Graduate School of Science and Technology, Niigata University, Niigata 9502181, Japan R. L. Verma Research Center for Advanced Science and Technology, The University of Tokyo, Tokyo, Japan 123 Bull Eng Geol Environ (2011) 70:595–606 DOI 10.1007/s10064-011-0368-5
-
Upload
independent -
Category
Documents
-
view
0 -
download
0
Transcript of Landslide susceptibility zonation study using remote sensing and GIS technology in the Ken-Betwa...

ORIGINAL PAPER
Landslide susceptibility zonation study using remote sensingand GIS technology in the Ken-Betwa River Link area, India
Ram Avtar • C. K. Singh • Gulab Singh •
R. L. Verma • S. Mukherjee • H. Sawada
Received: 20 June 2010 / Accepted: 2 February 2011 / Published online: 15 March 2011
� Springer-Verlag 2011
Abstract The 231 km long Ken-Betwa River Linking
canal will transfer 1,020 hm3 of surplus water from the
Ken River to the deficit Betwa River basin. The landslide
susceptibility zonation map of the river link has been
assessed using remote sensing data in GIS. Various the-
matic maps such as geology, land use/land cover, linea-
ment, drainage, slope, aspect, normalized difference
vegetation index and soil type were generated from the
Landsat Thematic Mapper 5 satellite data of 2005, the
Survey of India topographic sheets, Shuttle Radar Topo-
graphic Mission Digital Elevation (SRTM-DEM) data and
other existing maps. Numerical rating schemes were used
for ranking the thematic layers. The results were supported
with the rainfall data, groundwater level data and a petro-
logical study of rock thin sections. In addition to providing
valuable information for project decision-makers, the
results will assist in slope management and land use
planning in the area.
Keywords Landslide susceptibility zonation (LSZ) �NDVI � Ken-Betwa River Link � GIS
Resume Le canal de liaison Ken-Betwa, de 231 km de
longueur, transferera 1020 hm3 par an d’eau excedentaire
du bassin de la riviere Ken vers le bassin de la riviere
Betwa. La carte de zonage de la sensibilite aux glissements
(LSZ) de la region du canal de liaison a ete etablie en
utilisant des donnees de teledetection traitees dans un
systeme SIG. De nombreuses cartes thematiques relatives a
la geologie, l’occupation des sols, les lineaments, le
drainage, les pentes, un indice de vegetation normalise
(NDVI) et les types de sols ont ete generees a partir
d’images Landsat (TM5) de 2005, de cartes de l’Institut
geographique national indien, de fichiers numeriques de
terrain (SRTM-DEM) et d’autres cartes preexistantes. Des
procedes de classement numerique ont ete mis en œuvre
pour organiser les couches thematiques. Les resultats ont
ete completes avec les donnees de pluviometrie, les nive-
aux d’eau souterraine et des etudes petrographiques de
lames minces. De plus, afin de produire une information
valable pour les decideurs, les resultats apporteront une
aide pour l’amenagement des pentes et la planification
territoriale de la region.
Motscles Zonage de la sensibilite aux glissements
(LSZ) � NDVI � Canal de liaison Ken-Betwa � SIG
Introduction
Numerous natural factors such as earthquake, heavy rain-
fall and river bank erosion by flood water, as well as
anthropogenic factors, including deforestation and slope
excavation, cause slope failure by decreasing the shear
R. Avtar (&) � H. Sawada
Institute of Industrial Sciences, The University of Tokyo, Ce509,
4-6-1 Komaba, Maguro-Ku, Tokyo 153-8505, Japan
e-mail: [email protected]
R. Avtar � C. K. Singh � S. Mukherjee
School of Environmental Sciences, Jawaharlal Nehru University,
New Delhi 110067, India
G. Singh
Graduate School of Science and Technology, Niigata University,
Niigata 9502181, Japan
R. L. Verma
Research Center for Advanced Science and Technology,
The University of Tokyo, Tokyo, Japan
123
Bull Eng Geol Environ (2011) 70:595–606
DOI 10.1007/s10064-011-0368-5

strength or increasing the shear stress of the soil mass
(Abramson et al. 1996). Landslides are a type of ‘‘mass
wasting’’, which denotes any down-slope movement of soil
and rocks under the direct influence of gravity. Landslide
susceptibility zonation (LSZ) is the study of the spatial
distribution of factors related to slope instability, in order
to determine landslide prone areas without considering
temporal implications. This approach is useful for the
regions where there is no historical record of landslide
events (Chacon et al. 2006). Landslide susceptibility
zonation mapping is important for land use planning, civil
engineering design, civil protection and risk reduction
programmes.
The objective of the Inter Linking of River (ILR) project
in India is to transfer water from ‘excess’ to ‘deficit’ basins.
The ILR is primarily intended to mitigate problems of
floods and droughts in different regions of the country. It is
also connected with the development of the energy,
transport industry, agriculture and human health sectors
(National Water Development Agency 2006).
The Ken-Betwa Link Project (KBLP) involves con-
necting the Ken and Betwa Rivers through the creation of
a dam, reservoir and canal to provide storage for excess
rainfall during the monsoon season in the upper Ken
basin and transfer the water for consumption and irriga-
tion purposes to the upper Betwa basin. KBLP is the first
river link project of the 30 projects proposed by the
Government of India National Water Development
Agency (NWDA), involving the states of Madhya
Pradesh (MP) and Uttar Pradesh (UP) in the Bundelkhand
region (NWDA 2007). The Ken-Betwa link project is a
diversion and storage scheme which will transfer about
1,020 hm3 of surplus water from the Ken River basin. It
involves a 73.80 m high, 1,468 m long earth dam across
the Ken River with a gross storage capacity of
2,775 hm3, a 231.45 km long linking canal and two
power houses with 3 9 20 MW and 2 9 6 MW capacity
(NWDA 2007). The works, including the construction of
roads, etc., will affect the stability of slope and cause
deforestation as well as creating other ecological imbal-
ances between the different ecosystems in the Panna tiger
reserve forest.
Remote sensing and GIS is useful for landslide sus-
ceptibility zonation mapping and can help identify the area
best suited for developmental activities (Pachauri and Pant
1992; Mukherjee 1999; Guzetti et al. 1999; Van Westen
2000; Dai et al. 2001; Kosaka 2000; Van Westen et al.
2003; Sarkar and Kanungo 2004; Saha 2005; Van Westen
et al. 2008; Gupta et al. 2008). The objective of this study
was to generate a landslide susceptibility map of the Ken-
Betwa River linking area to assist the project planners in
their decision-making regarding site suitability and hazard
mitigation.
Study area
Most of the 61,750-km2 study area is in Bundelkhand and
divided between the states of UP and MP; see (Fig. 1). The
area has a semi-arid type of climate, although this is highly
variable depending on the region and the time of year,
being prone to droughts in summer and disastrous floods
during monsoons (June–September) when over 90% of the
750–1,250 mm annual rainfall occurs, mainly in the
southeastern part of the study area.
The area has annual maximum and minimum tempera-
tures of 44.2�C and 6.7�C. May and June are generally the
hottest months and December and January are the coldest
months.
Fig. 1 Location map of the study area
596 R. Avtar et al.
123

Materials and methods
In the first step, the Survey of India (SOI) topographic sheets
and existing maps were converted into digital format and geo-
referenced into universal transverse mercator (UTM),
spheroid and datum WGS-1984. Landsat (TM5) data
acquired in 2005 was processed to generate a standard false
colour composite (FCC) from bands 4, 3, 2 coded in a red,
green and blue colour scheme. This FCC was used to generate
land use/land cover, lineament and NDVI maps. SRTM DEM
data with a resolution 90 m were used to generate elevation,
slope and aspect maps. Drainage, geology and soil maps were
generated from the SOI topographic sheets, Geological Sur-
vey of India maps and the National Bureau of Soil Survey and
Land Use Planning (NBSS & LUP, Nagpur) maps.
There are two basic approaches for landslide zonation
studies. The first is the qualitative map combination where
relative weighting values are assigned to the factors and
their classes on the basis of field knowledge and experi-
ence; the second uses statistics to compute the weighting
values based on the relationship of the factors with existing
landslides (Sarkar and Kanungo 2004). In this study, the
qualitative map combination method was used by devel-
oping a rating system, based on the relative importance of
the thematic maps.
Each thematic map was assigned a weight depending on
its influence on landslide hazard based on multiple criteria
decision-making techniques. GIS is an ideal tool to analyse
and solve multiple criteria problems (Belton and Stewart
2002). The relative score of each thematic unit in a theme
was calculated by multiplying the weight of the theme with
the rank of the thematic unit. The weight and rank of each
layer is given in Table 1.
The scored maps were overlaid using the spatial analyst
tool of ArcGIS 9.1 to generate a LSZ map. The resultant
map was classified into high, moderate, low and very low
susceptibility zones. The results were supported using
groundwater level maps, rainfall maps and petrological
study of rock thin sections from the area. The methodology
adopted in this study is shown as a flow chart in Fig. 2. The
following equation was used for the LSZ mapping using a
multi-criteria decision-making technique.
LSZ ¼ R Wt1ð Þ � Rt1ð Þþ Wt2ð Þ � Rt2ð Þþ W t3ð Þ½� Rt3ð Þþ � � � � � � � � � Wt8ð Þ � Rt8ð Þ�
where, W is the weight of the theme, R is the rank of the
theme and t1, t2, t3…….t8, etc. are the theme numbers.
Petrological analysis
Rock samples were collected from different sites in the
study area (Fig. 15). The composition of the rocks was
Table 1 Thematic maps, weight and ranking for landslide suscepti-
bility zonation study
Theme Weight Features Rank
Drainage density 8 Very high 9
High 7
Medium 5
Low 3
Very low 1
Lineament density 7 High 8
Medium 6
Low 4
Very low 2
Slope 6 [72� 9
57–72 7
39–57 5
14–39 3
\14� 1
Geology 5 Alluvial plain 5
Archaean granite 2
Bhander group 6
Bijawar group 4
Bundelkhand granite 1
Deccan traps 2
Kaimur group 6
Vindhyan super group 8
Land use/land cover 4 Dense forest 1
Land with scrub 7
Agricultural land 4
Degraded forest 3
Land without scrub 6
Fallow land 7
Waterlogged 1
Water body 1
Built up 1
Bare exposed rock 8
NDVI (Vegetation) 3 Dense 1
Moderate 3
Low 6
Barren 9
Soil cover 2 Clayed loam 7
Loamy 5
Loamy sand 3
Sandy loam 1
Aspect 1 Flat 1
North 2
Northeast 5
East 7
Southeast 8
South 9
Southwest 6
West 4
Northwest 3
Landslide susceptibility in the Ken-Betwa linkage area, India 597
123

examined using thin sections under the ML 9000 series
petrological microscope (Meiji, Japan). Thin section
petrography is particularly useful as in addition to the
characteristics of the rocks, their weathering potential and
hence landslide susceptibility can be determined.
Interpolation of groundwater level and rainfall data
Ground water level data from 124 observation sites
were obtained from the Central Ground Water Board
(CGWB) for the years 1999–2004 and annual rainfall
data at 19 rain gauge stations from the Indian Meteo-
rology Department (IMD). These data were converted
into shape files according to their latitude and longitude.
The observation points, originally expressed as geo-
graphic coordinates, were converted to UTM WGS-1984
for interpolation (Fig. 15). Finally, interpolations of the
groundwater level and rainfall data were undertaken
using spline interpolation.
Results and discussion
Geological study of the area
Geology plays an important role in landslide susceptibility
because different geological units have different suscepti-
bilities to active geomorphological processes (Anabalagan
1992; Pachauri et al. 1998; Dai et al. 2001; Lee and Talib
2005). The area contains three major groups of rocks: the
Bundelkhand complex ([2.6 billion years) the Bijawar
group (2.6–2.4 billion years), and the Vindhayan super
group (1.4–0.9 billion years); see Fig. 3 and Auden (1933).
a) The Bundelkhand Granite complex is dominant in the
study area. These granites are frequently associated
with pegmatites and quartz reefs (Ahmad, 1984).
Above the Bundelkhand gneissic complex, newer
alluvium, older alluvium, gravel, sand and clay of
recent origin are present; in some places they are also
termed as buried pediment plains depending upon their
mode of formation (Mukherjee, 1991).
Fig. 2 Flow chart depicting the methodology adopted for landslide susceptibility zonation map generation
Fig. 3 Geology of the study area
598 R. Avtar et al.
123

b) The Bijawar group in the area consists of a terruginous
sequence of basal carbonates and shales with green
schists or pillow basalts, chloritic shales, ferruginous
quartzites and banded iron formations.
c) The Vindhayan super group has been broadly divided
into four major groups based on lithological similar-
ities–the Semri (lower), Kaimur, Rewa and Bhander
(upper)–and into the Lower and Upper Vindhyans
based on the major unconformity. The upper Kaimur
group rocks of the Vindhayan super group are
represented by sandstones all over the Vindhayan
basin.
Rock weathering and mineral composition are important
for landslide hazard assessment (Van Westen et al. 2008).
Quartzite, protoquartzite, sandstone, granite, orthoquartzite
and greywacke rocks were identified using the petrological
microscope (Fig. 4a–f).
Quartzite is highly resistant to weathering, while granite
(feldspar 65–90%, quartz 10–60% and biotite 10–15%),
because of its coarse-grained texture and the differing
hardness of the minerals present, is less resistant. The
sandstone of the study area (quartz, silica or calcite) is
coarse-grained with a weak (calcareous/argillaceous)
bonding and hence again is less resistant to weathering.
Fig. 5 a Lineament interpretation b Rose diagram c Lineament length
density map (Avtar et al., 2010)
4 (A) Quartzite 4 (B) Protoquartzite
4 (C) Sandstone 4 (D) Granite
4 (E) Greywacke 4 (F) Orthoquartzite
Fig. 4 Petrological microscopic view of rocks thin section
Landslide susceptibility in the Ken-Betwa linkage area, India 599
123

The greywacke (quartz, feldspar and clay) is dark in colour
and rich in clay with fewer quartz sand grains and less
resistant to weathering (Wilson 2004). These analyses are
consistent with the LSZ map. It is found that rocks with a
high weathering rate represent moderate to highly suscep-
tible zones and low susceptibility zones take place in less
weathered rocks (Tobe and Chigira 2006).
The alluvial plain was ranked higher (5) compared with
the granite, Deccan (basalt) and Bijawar group as it has a
high clay fraction and hence is more susceptible to mud and
debris flows. The Kaimur, Bhander and Vindhyan groups
were also ranked higher, despite consisting of sandstone as
although the area has not experienced any major landslides,
mud and debris flows occur during the rainy season.
Lineament map of the study area
Lineaments are the manifestation of subsurface linear
features (Mukherjee 2008). As seen in Fig. 5a–c, they were
analysed using lineament density and rose diagrams (Zakir
et al. 1999). The rose diagram indicated that the most
dominant lineament direction was generally NNE-SSW
and NNW-SSE. The lineament density was high in the
southern and central parts of the study area, indicating that
these areas are more susceptible to landslide. Lineament-
length density (Ld) is the total length of all delineated
lineaments divided by the total area under consideration
(Greenbaun 1985):
Ld ¼Xi¼n
i¼1
Li=A � m�1� �
wherePi¼n
i¼1 Li= total length of all lineaments (m) and
A = area (m2).
Slope map of the study area
The general topography of the catchment area was studied
through a digital elevation model generated from the
SRTM data (Fig. 6). Most parts of the study area have
slope angles between 39� and 57� (Fig. 7). The alluvial
region in the north has lower slopes and is less prone to
landslides compared with the hilly area in the south
Fig. 6 Elevation map of the study area based on SRTM DEM data
Fig. 7 Slope map of the study area (Avtar et al., 2010)
Fig. 8 Aspect map of the study area
600 R. Avtar et al.
123

(Ohlmacher and Davis 2003). The slope angle correlates
well with rainfall and groundwater level (Jiao et al. 2005,
Iverson 2000, Budhu and Gobin 1996, Giannecchini et al.
2007). Heavy rainfall is a critical factor in triggering
landslides in Hong Kong, as it results in a rapid increase in
pore pressure in the vadose zone and groundwater flow in
the saturated area (Jiao et al. 2005). Richard and Mark
(1992) studied the effects of slope morphology, hydraulic
heterogeneity and material properties and found that where
a low-hydraulic conductivity layer parallel to the slope acts
as a cap on the flow system, outward-directed seepage
forces occur at the slope toe, leading to conditions con-
ducive to landsliding. Hodge and Freeze (1977) also
pointed out that gravity-induced groundwater flow in
slopes depends on both the topography and the distribution
of materials of different hydraulic conductivity within the
subsurface. Areas with high slope angles were therefore
ranked higher in the landslide susceptibility zonation in
Table 1.
Aspect map of the study area
Aspect identifies the steepest down-slope direction from
each cell to its neighbours and defines the direction of flow
(Fig. 8). The value of each cell in an aspect dataset indi-
cates the direction of the cell’s slope faces. The aspect map
was divided into nine classes: N, NE, E, SE, S, SW, W,
NW and flat. The areas where vegetation has degraded will
receive direct sunlight, creating drier soil conditions and
thus increasing the probability of landslide occurrences.
Aspect influences the amount of rainfall and moisture
content in soil and thereby influences the stability of the
slope (Rajkumar 2007).
Soil map of the study area
The climate, physiography and geological characteristics of
the soil play an important role in groundwater recharge
and run-off. The permeability of the soil is an important
Fig. 9 Soil map of the study area (Avtar et al., 2010)
Fig. 10 Drainage network map of the study area (Avtar et al., 2010)
Fig. 11 Drainage density map of the study area (Avtar et al., 2010)
Landslide susceptibility in the Ken-Betwa linkage area, India 601
123
parameter for landslide occurrence. As soil moisture
increases, pore water pressure rises, increasing the shear
stress and decreasing shear strength (Ray Ram and Jacobs
2007). The soil in the study area is divided into clayey
loam, sandy loam, loamy and loamy sand on the basis of
soil texture. Most of the Betwa basin is covered by loamy
sand while in the Ken basin, loamy sand predominates in
the upper part and sandy clay in the lower part (Fig. 9). The
higher the percentage of clay fraction in the soil, the lower
the permeability and the higher the probability of land-
slides (Table 1).
Drainage map of the area
The drainage map shows the major rivers (Yamuna, Ken,
Betwa, Dhasan, Jamni) and a large number of other streams
draining this region (Fig. 10). The drainage pattern in
the area is dendritic (pinnate type). Drainage density is the
ratio of the total length of the stream to the area of the
drainage basin (Lin and Oguchi 2004). The southern part of
the basin is associated with very high drainage density,
while about 40% of the area upstream of the Ganagu weir
has a medium drainage density and some parts of the
western and south-eastern catchment a low drainage den-
sity, due to the extent of vegetation and the permeable
nature of the soil (Fig. 11). Areas with a higher drainage
density have lower infiltration rates because of the fast
movement of the surface flow (Pachauri et al. 1998; Cevik
and Topal 2003). Landslide susceptibility is greater in areas
of high drainage density (Rajkumar 2007) and hence low
drainage density areas have been given a lower rank in
Table 1.
Land use/land cover map
The land use/land cover map was generated using the
unsupervised image classification procedure (Lillesand and
Keifer 2006) based on Landsat TM5 satellite data for 2005,
and the topographic maps. The study area was classified
into ten categories: water, dense forest, built-up, current
fallow/agricultural land, water logged, degraded forest,
land with scrub, bare exposed rock, fallow land, and land
without scrub (Fig. 12). The percentage of the different
types of land use/land cover is shown in Table 2. About
Fig. 12 Land use/land cover map of study area (Avtar et al., 2010)
Table 2 Percentage of various classes in the study area from Landsat
2005
Class Area (km2) % Different classes
Water body 1,333.38 2.58
Dense forest 18,634.05 36.11
Built-up 606.72 1.18
Current fallow/agriculture land 12,657.22 24.53
Waterlogged 219.91 0.43
Degraded forest 4,035.82 7.82
Land with scrub 3,929.60 7.62
Bare exposed rock 1,471.42 2.85
Fallow land 2,704.16 5.24
Land without scrub 6,011.10 11.65
Total 51,603.39 100
Fig. 13 NDVI map of the study area
602 R. Avtar et al.
123

35% of the area is covered by forest with high to moderate
vegetation density. Vegetative areas have a tendency to
reduce the impact of climatic factors such as rain. In
addition, deep-rooted vegetation anchors the soil, which is
an important factor in lowering landslide hazard (Styczen
and Morgan 1995; Greenway 1987). The area with dense
forest was therefore given a lower rank compared with
barren areas, which are more prone to landslides (Table 1).
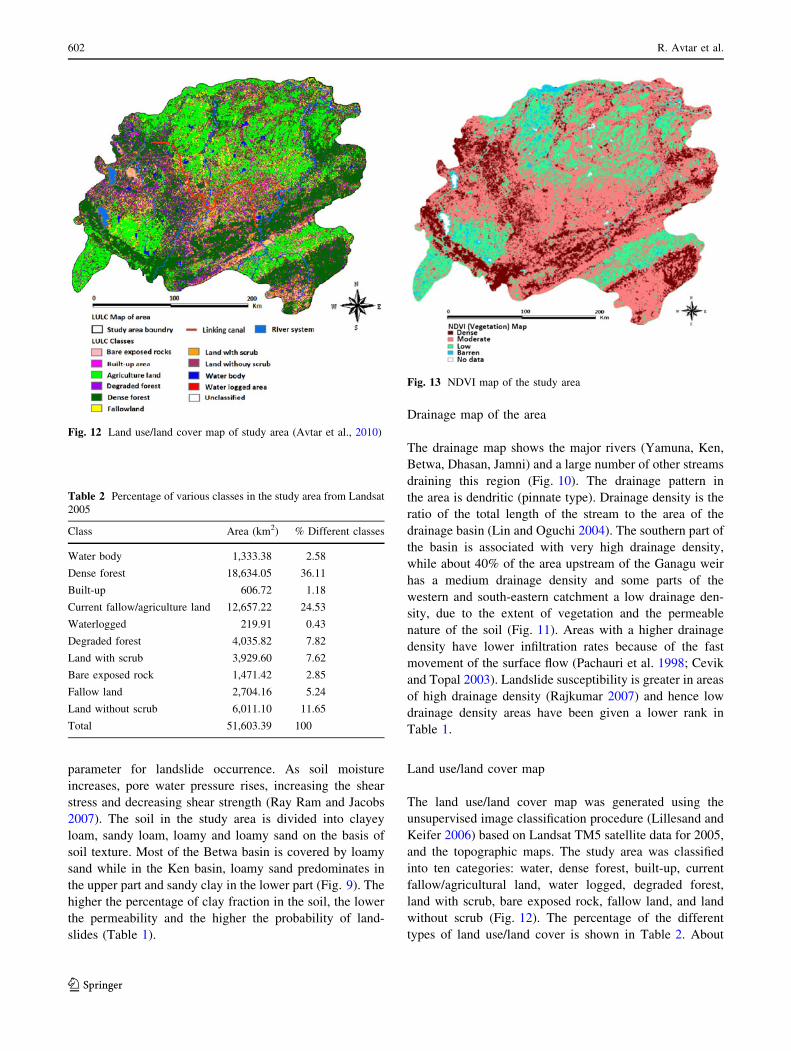
Normalized difference vegetation index (NDVI) map
The normalized difference of the vegetation index (NDVI)
is a non-linear transformation of the visible (red) and near-
infrared bands of satellite information. NDVI is defined as
the difference between the visible (RED) and near-infrared
(NIR) bands over their sum, and is a measure of the amount
and condition of the vegetation (Bannari et al. 1995). It is
associated with vegetation canopy characteristics such as
biomass, leaf area index and percentage of vegetation
cover (Lillesand and Keifer 2006).
NDVI = NIR-REDð Þ= NIR + REDð Þ
For vegetation monitoring, the NDVI is obtained by
the combination of bands 3 (visible) and 4 (NIR) of the
Landsat TM5 data. The higher value of NDVI in the
southern region indicates the dense forest of the Panna tiger
reserve (Fig. 13).
Vegetation plays an important role in controlling soil
erosion and can help stabilize the slope by providing
mechanical strength to the subsoil (Singhal and Srivastava
2004). It provides a protective layer on the earth and
regulates the transfer of water from the atmosphere to the
surface, soil and underlying rocks (Greenway 1987). Areas
with high values of NDVI are therefore less prone to
landslide susceptibility and are given a lower ranking in
Table 1.
GIS integration of thematic layers
The various thematic layers for geology, land use, NDVI,
lineament, drainage density, soil, slope and aspect were
arranged in order of importance and assigned a weighting
number (from 1 to 8) on the basis of previous studies
on landslide hazard zonation (Pachauri and Pant 1992;
Mukherjee 1999; Saha 2005; Saha et al., 2002; Sarkar and
Kanungo, 2004). Similarly, each class within a layer was
given an ordinal ranking from 0 to 9 by using multi criteria
decision techniques in GIS, the highest rank being given to
the factors which are more important for landsliding.
Table 1 describes the weights and rank given to each data
layer and their classes, respectively.
The landslide susceptibility zonation map (Fig. 14) was
generated on the basis of the cumulative values assigned to
the different features of the thematic layers in GIS and was
classified into high (4.07% of the area), moderate (40.75%),
low (53.13%) and very low (2.05%) susceptibility.
Depth to water level
The LSZ map was checked by rainfall and groundwater
level data of the study area to support the study. In the
study area, as the precipitation is concentrated mainly
during the monsoon season, depth to groundwater isFig. 14 Landslide susceptibility zonation map of the study area
Fig. 15 Map showing location of monitoring wells
Landslide susceptibility in the Ken-Betwa linkage area, India 603
123

(a) May 1999 (b) August 1999 (c) November 1999 (d) Jan 2000
(e) May 2000 (f) August 2000 (g) November 2000 (h) Jan 2001
(i) May 2001 (j) August 2001 (k) November 2001 (l) Jan 2002
(m) May 2002 (n) August 2002 (o) November 2002 (p) Jan 2003
(q) May 2003 (r) August 2003 (s) November 2003 (t) Jan 2004
m
Fig. 16 Interpolation maps of water level from May 1999 to January 2004 (Avtar et al., 2010)
604 R. Avtar et al.
123

generally reduced during and immediately after the mon-
soons. As can be seen from Figs 15 and 16, it is generally
deeper in the north. The magnitude of seasonal fluctuation
in response to monsoon recharge is related to aquifer
porosity and storage. After recharge, the rise in ground-
water levels may be greater and sustained longer in aqui-
fers with low permeability than in aquifers with high
permeability (Sara 2003). Groundwater plays an important
role in slides, flows (debris flows, debris avalanches, earth
flows, mudflows and creep) and lateral spreads. Water is
often a primary controlling factor in landslide occurrence
and most landslides are preceded by saturation of the slope
due to heavy rainfall or periods of extended precipitation,
although the increase in groundwater level may be related
to earth dams, banks of lakes, reservoirs, canals and rivers
(United States Geological Survey 2004). Overlaying the
groundwater level maps on the LSZ map, the areas with
low groundwater level are generally in the low to moderate
hazard zones while high groundwater level areas largely
coincide with high hazard zones.
Rainfall maps
The rainfall maps (Fig. 17) showed that the rainfall in this
region varies both with the topography and temporally.
A high intensity of rainfall is always associated with an
increase in landslides (Au 1998). The annual rainfall in
1999 varied between 700 mm and 1,850 mm while in 2004
it was between 250 mm and 1,375 mm. There is generally
more rain in the SW, i.e. it increases from the Jhansi region
towards the Panna region, where the links start at the
Gangau weir. Changes in monsoon rainfall affect land-
sliding while a long, dry spell followed by a short and
heavy rain event can significantly affect the vegetation and
ground water level, making the area more vulnerable to
landslides (Ratnayake and Herath 2005).
Conclusions
Remote sensing and GIS technology is very useful for
resource management and project development as it facil-
itates the integration of numerous data to generate landslide
susceptibility zonation maps. The LSZ map produced in
this study divides the area into high, moderate, low and
very low susceptibility zones, which have been shown to
correlate well with rainfall and groundwater level. The
information generated from this study can be applied by
decision makers to mitigate slope instability during the
major construction works involved in the Ken-Betwa River
Link Project. In addition, the basic data will assist in slope
management and land-use planning as deforestation,
exposure of rocks, blasting for tunnels, construction of the
canal, etc. will affect the hydrological conditions of the
slopes and unless managed carefully, it may promote rapid
run off and erosion and hence increase the possibility of
landslides and debris flows.
Acknowledgments The Authors are very grateful to Council for
Scientific and Industrial Research (CSIR), New Delhi, for the Fel-
lowship. They are also indebted to the Indian Meteorological
Department (IMD), the National Water Development Authority
(NWDA) and the Central Ground Water Board (CGWB) for the
provision of invaluable information for the study. Last but not least,
the authors also would like to put on record the contribution of the
School of Environmental Science, JNU, New Delhi, in facilitating
data analysis in its laboratories and of the MEXT Japanese Govern-
ment Fellowship to pursue research in The University of Tokyo,
Japan.
References
Abramson LW, Lee TS, Sharma S, Boyce GM (1996) Slope stability
and stabilization methods. A Wiley-Interscience Publication,
Wiley NY.
Ahmad SM (1984) Hydrogeological investigations for augmenting
water supply in drought affected areas of Banda District. Uttar
Pradesh, Central Ground Water Board. Unpublished report,
Lucknow, India
Anabalagan R (1992) Landslide hazard evaluation and zonation
mapping in mountainous terrain. Eng Geol 32:269–277
Fig. 17 Maps of annual rainfall (millimeter) on temporal scale from
1999 to 2004
Landslide susceptibility in the Ken-Betwa linkage area, India 605
123
Au SWC (1998) Rain-induced slope instability in Hong Kong. Eng
Geol 51:1–36
Auden JB (1933) Vindhayan sedimentation in Son valley. Mem Geol
Surv India 62:141–250
Avtar R et al (2010) Identification and analysis of groundwater
potential zones in Ken-Betwa River linking area using remote
sensing and geographic information system. Geocarto Int
25(5):379–396
Bannari A, Morin D, Bonn F, Huete AR (1995) A review of
vegetation indices. Remote Sens Rev 13:95–120
Belton V, Stewart TJ (2002) Multiple criteria decision analysis: an
integrated approach. Kluwer, Dordrecht
Budhu M, Gobin R (1996) Slope stability from ground-water seepage.
J Hydraul Eng 122(7):415–417
Cevik E, Topal T (2003) GIS-based landslide susceptibility mapping
for a problematic segment of the natural pipeline, Hendek
(Turkey). Env Geol 44(8):949–962
Chacon J, Irigaray C, Fernandez T, Hamdouni El R (2006)
Engineering geology maps: landslides and geographical infor-
mation systems. Bull Eng Geol Environ 65:341–411
Dai FC, Lee CF, Li J, Xu ZW (2001) Assessment of landslide
susceptibility on the natural terrain of Lantau Island, Hong
Kong. Env Geol 40:381–391
Giannecchini R, Naldini D, Avanzi AD, Puccinelli A (2007)
Modelling of the initiation of rainfall-indeced debris flows in
the Cardoso basin (Apuan Alps, Italy). Quat Int 171–172:
108–117
Greenbaun D (1985) Review of remote sensing applications to
groundwater exploration in basement and regolith. British
Geological Survey Report OD 85/8, 36
Greenway DR (1987) Vegetation and slope stability. In: Anderson
MG, Richards KS (eds) Slope stability. Wiley, New York,
pp 187–230
Gupta RP, Kanungo DP, Arora MK, Sarkar S (2008) Approaches for
comparative evaluation of raster GIS-based landslide suscepti-
bility zonation maps. Int J Appl Earth Obs Geoinformation
10(3):330–341
Guzetti F, Carrara A, Cardinali M, Reichenbach P (1999) Landslide
hazard evaluation: a review of current techniques and their
application in a multi-scale study, Central Italy. Geomorphology
31:181–216
Hodge RA, Freeze RA (1977) Groundwater flow systems and slope
stability. Can Geotech J 14:466–476
Iverson RM (2000) Landslide triggering by rain infiltration. Water
Resour Res 36(7):1897–1910
Jiao JJ, Wang X, Nandy S (2005) Confined groundwater zone and
slope instability in weathered igneous rocks in Hong Kong. Eng
Geol 80:71–92
Kosaka K (2000) Evaluating landslide deposits along the Tsurukawa
fault zone, Japan, using magnetic susceptibility, Bull. Eng Geol
Environ 58(3):179–182
Lee S, Talib JA (2005) Probabilistic landslide susceptibility and
factor effect analysis. Env Geol 47:982–990
Lillesand TM, Keifer RW (2006) Remote sensing and image
interpretation. Wiley, New York
Lin Z, Oguchi T (2004) Drainage density, slope angle, and relative
basin position in Japanese bare land from high-resolution DEMs.
Geomorphology 63:159–173
Martin M. Sara (2003) Site assessment and remediation handbook,
Lewis publishers, London
Mukherjee S (1991) Ground water appraisal report Hamirpur district
Uttar Pradesh, Remote Sensing Applications Centre, unpub-
lished technical report no. RSAC; GED91: 02, UPRSAC:
Lucknow, Uttar Pradesh, India, 4–9
Mukherjee S (1999) Microzonation of seismic and landslide prone
areas for alternate highway alignment in a part of Western Coast
of India using remote sensing techniques. J Indian Soc Remote
sens 27(2):81–90
Mukherjee S (2008) Role of satellite sensors in groundwater
exploration. Sensors 8:2006–2016
(National Water Development Agency 2006) Benefits of National
Perspective Plan, [online]. Available:http://nwda.gov.in/index2.
asp?sublinkid=49&langid=1
(National Water Development Agency 2007) Ken-Betwa Link
Project feasibility report, [online]. Available: http://nwda.gov.
in/index3.asp?sublink2id=23
Ohlmacher CG, Davis CJ (2003) Using multiple logistic regression
and GIS technology to predict landslide hazard in northeast
Kansas, USA. Eng Geol 69(3–4):331–343
Pachauri AK, Pant M (1992) Landslide hazard mapping based on
geological attributes. Eng Geol 32:81–100
Pachauri AK, Gupta PV, Chander R (1998) Landslide zoning in a part
of the Garhwal Himalayas. Env Geol 36:325–334
Rajkumar P (2007) Landslide susceptibility mapping in a hilly terrain
using remote sensing and GIS. J Indian Soc Remote Sens
35(1):31–42
Ratnayake U, Herath S (2005) Changing rainfall and its impact on
landslides in Sri Lanka. J Mt Sci 2(3):218–224
Ray Ram L, Jacobs ML (2007) Relationships among remotely sensed
soil moisture, precipitation and landslide events. Nat Hazards
43:211–222
Richard MI, Mark ER (1992) Gravity-driven groundwater flow and
slope failure potential: 1. Elastic effective-stress model. Water
Resour Res 28(3):925–938
Saha AK (2005) An approach for GIS-based statistical landslide
susceptibility zonation with a case study in the Himalayas.
Landslides 2:61–69
Saha AK, Gupta RP, Arora MK (2002) GIS-based landslide hazard
zonation in the Bhagirathi (Ganga) valley, Himalayas. Int J
Remote Sens 23:357–369
Sarkar S, Kanungo DP (2004) An integrated approach for landslide
susceptibility mapping using remote sensing and GIS70. Photo-
gramm Eng Remote Sens 70(5):617–625
Singhal PK, Srivastava P (2004) Challenges in sustainable develop-
ment. Anmol publication, India
Styczen ME, Morgan RPC (1995) Engineering properties of vegeta-
tion. In: Morgan RPC, Rickson RJ (eds) Slope stabilization and
erosion control: a bioengineering approach. E&FN Spon,
London, pp 5–58
Tobe H, Chigira M (2006) Causes of shallow landslides of weathered
granitic rocks—from the view point of weathering styles and
petrologic textures, disaster mitigation of debris flows, slope
failures and landslides, Universal Academy Press, Inc. Tokyo,
Japan, 493–501
USGS (United States Geological Survey) (2004) Landslide types andprocesses, USGS. Fact Sheet 2004-3072, July 2004 [accessed at
http://pubs.usgs.gov/fs/2004/3072/]
Van Westen CJ (2000) The modelling of landslide hazards using GIS.
Surv Geophys 21:241–255
Van Westen CJ, Rengers N, Soeters R (2003) Use of geomorpho-
logical information in indirect landslide susceptibility assess-
ment. Nat Hazard 30:399–419
Van Westen CJ, Castellanos E, Kuriakose SL (2008) Spatial data for
landslide susceptibility, hazard, and vulnerability assessment: an
overview. Eng Geol 102:112–131
Wilson MJ (2004) Weathering of the primary rock-forming minerals:
processes, products and rates. Clay Minerals 39:233–266
Zakir FA, Quari MHT, Mostafa ME (1999) A new optimizing
technique for preparing lineament density maps. Int J Remote
Sens 20(6):1073–1085
606 R. Avtar et al.
123