Impacts of transient salinity shock loads on Anammox process performance
7
Impacts of transient salinity shock loads on Anammox process performance Chun Ma, Ren-Cun Jin ⇑ , Guang-Feng Yang, Jin-Jin Yu, Bao-Shan Xing, Qian-Qian Zhang Department of Environmental Sciences, Hangzhou Normal University, Hangzhou 310036, PR China article info Article history: Received 13 December 2011 Received in revised form 21 February 2012 Accepted 24 February 2012 Available online 4 March 2012 Keywords: Anammox Salinity shock Nitrogen removal Extracellular polymeric substances abstract The effect of salinity shock (5–60 g l 1 NaCl) on anaerobic ammonium oxidation (Anammox) process per- formance was investigated. The response to the shock loads can be divided into three stages: a sensitive period, an interim stable period and a recovery period which lasted 6–26 d. When exposed to NaCl shocks for 12 h, the sludge retention time (SRT) of the reactor decreased with increasing NaCl shock loads, rang- ing between 2.9 and 22.5 d, meanwhile the biomass decreased by 0.8–37.4%. When shock loads were higher than 10 g l 1 NaCl, the reactor was at risk of losing too much biomass. The granular surface was rough due to rapid growth of filamentous bacteria and extracellular polymeric substances (EPS), also the EPS amount changed during all NaCl shock loads. In the latter of shocks, the microorganisms in the reactor showed a little adaption to the NaCl shock. Ó 2012 Elsevier Ltd. All rights reserved. 1. Introduction Nitrogen removal has attracted increasing attention due to the potential role of nitrogen in eutrophication. Biological nitrogen re- moval has many advantages over physical or chemical methods. Conventionally, sequential nitrification and heterotrophic denitrifi- cation are typically used for nitrogen removal and the removal of organic matter from wastewater (Sharma and Ahlert, 1977). These procedures require organic, chemical reagents and aeration. Anammox (anaerobic ammonium oxidation) is a novel, environ- mentally friendly, cost-effective technology with a high nitrogen removal potential (Jin et al., 2008a; Kartal et al., 2010; Tang et al., 2011a). During the Anammox reaction, ammonium (NH þ 4 ) is oxidized to gaseous N 2 using nitrite (NO 2 ) as an electron accep- tor, producing small amounts of nitrate (NO 3 ) (Eq. (1))(Strous et al., 1998): NH þ 4 þ 1:32NO 2 þ 0:066CO 2 þ 0:13H þ ! 1:02N 2 þ 0:26NO 3 þ 2:03H 2 O þ 0:066CH 2 O 0:5 N 0:15 ð1Þ One of the major challenges in developing the Anammox pro- cess is the complicated wastewater composition. Anammox bacte- ria are very sensitive to several environmental parameters such as temperature, pH and salinity (Jaroszynski et al., 2011). Industrial wastewater from seafood processing, textile dyeing, chemical, pharmaceutical and petroleum industries, oil and gas production, tanneries, livestock, and landfill leachate contains large amounts of ammonium and salts (Dapena-Mora et al., 2006; Kartal et al., 2006; Bassin et al., 2012; Jin et al., 2011). Salinity is known to have toxic effects on bacteria and is also capable of altering the micro- bial community. Moreover, salinity also significantly affects the physical and biochemical properties of activated sludge (Moussa et al., 2006; Vyrides et al., 2010). Several researchers have studied the effect of salinity on the Anammox process (Windey et al., 2005; Kartal et al., 2006; Jin et al., 2011). A previous study has shown that Anammox bacteria acclimated to salinity can tolerate levels up to 75 g l 1 NaCl (Kartal et al., 2006). Liu et al. (2008), however, have reported that, even with extended acclimatization, freshwater Anammox sludge can- not be applied in Anammox treatment at salt concentrations high- er than 30 g l 1 . Currently, the adaption of Anammox to salt is considered as one of the best ways to overcome saline inhibitions, and thus, some researchers have focused on acclimation strategies (Kartal et al., 2006; Bassin et al., 2012). Salinity is often highly variable in industrial wastewaters, espe- cially with regard to concentration and discharging time. These variable conditions can lead to fluctuant salt concentrations that create a transient shock (Vyrides and Stuckey, 2009). However, lit- tle is known about the impact of transient salinity shock loads on Anammox process performance. In this study, trials were carried out to investigate the effects of transient salinity shock loads on Anammox process performance and sludge characteristics. 2. Methods 2.1. Synthetic wastewater The synthetic wastewater was composed of four parts: sub- strates (ammonium and nitrite), mineral medium, salt and trace 0960-8524/$ - see front matter Ó 2012 Elsevier Ltd. All rights reserved. doi:10.1016/j.biortech.2012.02.122 ⇑ Corresponding author. Tel.: +86 571 88062061; fax: +86 571 28865333. E-mail address: [email protected] (R.-C. Jin). Bioresource Technology 112 (2012) 124–130 Contents lists available at SciVerse ScienceDirect Bioresource Technology journal homepage: www.elsevier.com/locate/biortech
-
Upload
independent -
Category
Documents
-
view
4 -
download
0
Transcript of Impacts of transient salinity shock loads on Anammox process performance
Bioresource Technology 112 (2012) 124–130
Contents lists available at SciVerse ScienceDirect
Bioresource Technology
journal homepage: www.elsevier .com/locate /bior tech
Impacts of transient salinity shock loads on Anammox process performance
Chun Ma, Ren-Cun Jin ⇑, Guang-Feng Yang, Jin-Jin Yu, Bao-Shan Xing, Qian-Qian ZhangDepartment of Environmental Sciences, Hangzhou Normal University, Hangzhou 310036, PR China
a r t i c l e i n f o a b s t r a c t
Article history:Received 13 December 2011Received in revised form 21 February 2012Accepted 24 February 2012Available online 4 March 2012
Keywords:AnammoxSalinity shockNitrogen removalExtracellular polymeric substances
0960-8524/$ - see front matter � 2012 Elsevier Ltd. Adoi:10.1016/j.biortech.2012.02.122
⇑ Corresponding author. Tel.: +86 571 88062061; faE-mail address: [email protected] (R.-C. Jin).
The effect of salinity shock (5–60 g l�1 NaCl) on anaerobic ammonium oxidation (Anammox) process per-formance was investigated. The response to the shock loads can be divided into three stages: a sensitiveperiod, an interim stable period and a recovery period which lasted 6–26 d. When exposed to NaCl shocksfor 12 h, the sludge retention time (SRT) of the reactor decreased with increasing NaCl shock loads, rang-ing between 2.9 and 22.5 d, meanwhile the biomass decreased by 0.8–37.4%. When shock loads werehigher than 10 g l�1 NaCl, the reactor was at risk of losing too much biomass. The granular surface wasrough due to rapid growth of filamentous bacteria and extracellular polymeric substances (EPS), alsothe EPS amount changed during all NaCl shock loads. In the latter of shocks, the microorganisms inthe reactor showed a little adaption to the NaCl shock.
� 2012 Elsevier Ltd. All rights reserved.
1. Introduction
Nitrogen removal has attracted increasing attention due to thepotential role of nitrogen in eutrophication. Biological nitrogen re-moval has many advantages over physical or chemical methods.Conventionally, sequential nitrification and heterotrophic denitrifi-cation are typically used for nitrogen removal and the removal oforganic matter from wastewater (Sharma and Ahlert, 1977). Theseprocedures require organic, chemical reagents and aeration.
Anammox (anaerobic ammonium oxidation) is a novel, environ-mentally friendly, cost-effective technology with a high nitrogenremoval potential (Jin et al., 2008a; Kartal et al., 2010; Tanget al., 2011a). During the Anammox reaction, ammonium (NHþ4 )is oxidized to gaseous N2 using nitrite (NO�2 ) as an electron accep-tor, producing small amounts of nitrate (NO�3 ) (Eq. (1)) (Strouset al., 1998):
NHþ4 þ 1:32NO�2 þ 0:066CO2 þ 0:13Hþ
! 1:02N2 þ 0:26NO�3 þ 2:03H2Oþ 0:066CH2O0:5N0:15 ð1Þ
One of the major challenges in developing the Anammox pro-cess is the complicated wastewater composition. Anammox bacte-ria are very sensitive to several environmental parameters such astemperature, pH and salinity (Jaroszynski et al., 2011). Industrialwastewater from seafood processing, textile dyeing, chemical,pharmaceutical and petroleum industries, oil and gas production,tanneries, livestock, and landfill leachate contains large amountsof ammonium and salts (Dapena-Mora et al., 2006; Kartal et al.,2006; Bassin et al., 2012; Jin et al., 2011). Salinity is known to have
ll rights reserved.
x: +86 571 28865333.
toxic effects on bacteria and is also capable of altering the micro-bial community. Moreover, salinity also significantly affects thephysical and biochemical properties of activated sludge (Moussaet al., 2006; Vyrides et al., 2010).
Several researchers have studied the effect of salinity on theAnammox process (Windey et al., 2005; Kartal et al., 2006; Jinet al., 2011). A previous study has shown that Anammox bacteriaacclimated to salinity can tolerate levels up to 75 g l�1 NaCl (Kartalet al., 2006). Liu et al. (2008), however, have reported that, evenwith extended acclimatization, freshwater Anammox sludge can-not be applied in Anammox treatment at salt concentrations high-er than 30 g l�1. Currently, the adaption of Anammox to salt isconsidered as one of the best ways to overcome saline inhibitions,and thus, some researchers have focused on acclimation strategies(Kartal et al., 2006; Bassin et al., 2012).
Salinity is often highly variable in industrial wastewaters, espe-cially with regard to concentration and discharging time. Thesevariable conditions can lead to fluctuant salt concentrations thatcreate a transient shock (Vyrides and Stuckey, 2009). However, lit-tle is known about the impact of transient salinity shock loads onAnammox process performance.
In this study, trials were carried out to investigate the effects oftransient salinity shock loads on Anammox process performanceand sludge characteristics.
2. Methods
2.1. Synthetic wastewater
The synthetic wastewater was composed of four parts: sub-strates (ammonium and nitrite), mineral medium, salt and trace
C. Ma et al. / Bioresource Technology 112 (2012) 124–130 125
elements. Ammonium, nitrite and salt were introduced as(NH4)2SO4, NaNO2 and NaCl respectively and trace elements weresupplied at 1.25 ml l�1 wastewater. The trace element solution con-tained 15 g l�1 EDTA, 0.43 g l�1 ZnSO4�7H2O, 0.24 g l�1 CoCl2�6H2O,0.99 g l�1 MnCl2�4H2O, 0.25 g l�1 CuSO4�5H2O, 0.22 g l�1 Na-MoO4�2H2O, 0.19 g l�1 NiCl2�2H2O, 0.21 g l�1 NaSeO4�10H2O,0.014 g l�1 H3BO4 and 0.050 g l�1 NaWO4�2H2O. The compositionof the mineral medium as presented in Jin et al. (2008a).
2.2. Reactor set up
An upflow anaerobic sludge bed (UASB) reactor was fabricatedusing plexiglass and had an effective volume of 2.5 l. The reactorwas covered with black cloth to avoid light inhibition and wasoperated at 30 ± 1 �C; the influent pH was maintained in the rangeof 7.5–8.0. The reactor was inoculated with Anammox sludge col-lected from another lab-scale UASB; the reactor had been operat-ing for approximately one and a half years and treated low-salinity wastewater. A steady performance was achieved with anitrogen removal rate (NRR) of up to 14 kg�(m3 d)�1 before theNaCl shock experiment took place. Then the reactor was fed witha nitrogen concentration of 210 mg l�1 for both NO�2 -N andNHþ4 -N (NO�2 -N: NHþ4 -N ratio of 1). The working hydraulic retentiontime (HRT) was set at 2 h before the shock load study.
2.3. Shock load studies
The UASB was subjected to NaCl shock loads of 5, 10, 20, 30, 50and 60 g l�1. Each shock load was administered for 12 h. Before eachshock experiment, the reactor was maintained at the steady state for3–5 days. The effect of the shock was assessed by measuring thenitrogen removal efficiency, the NRR, sludge characteristics suchas the levels of extracellular polymeric substance (EPS) and volatilesuspended solid (VSS), the sludge retention time (SRT), and the timeneeded to revert back the steady state after each shock.
2.4. Analytical methods
The measurement of NHþ4 -N, NO�2 -N, NO�3 -N, SS and VSS levelsand the pH were performed according to standard methods (APHA,1998). For EPS extraction, the ‘‘heating’’ method was employed(Sheng et al., 2006). First, 25 ml of sludge was centrifuged at3200 rpm for 30 min to remove it from the bulk solution. Thesupernatant was separated and kept as soluble EPS. The sludge pel-let was resuspended with 25 ml of a 0.9% NaCl solution. The solu-tion was heat-treated at 100 �C for 1 h and then centrifuged at3200 rpm for 30 min. The resulting supernatant was taken asbound EPS. The carbohydrate and protein in soluble and boundEPS were also estimated. Carbohydrate measurements were ac-quired using the anthrone method with a glucose standard proteinlevels were measured with the modified Lowry method using bo-vine serum albumin as a standard (Wu et al., 2009).
The sludge retention time (SRT) was calculated from the bio-mass concentration (VSS) in the reactor and in the effluent. Scan-ning electron microscopy (SEM) and transmission electronmicroscopy (TEM) were performed according to Tang et al.(2010). Specific Anammox activity assays (SAA) were performedaccording to the method presented by Dapena-Mora et al. (2004a).
3. Results and discussion
3.1. Performance of reactor in response to NaCl shock
Based on the response to the shock loads, the reactor shockoperational period can be divided into three periods: a sensitiveperiod, an interim stable period and a recovery period.
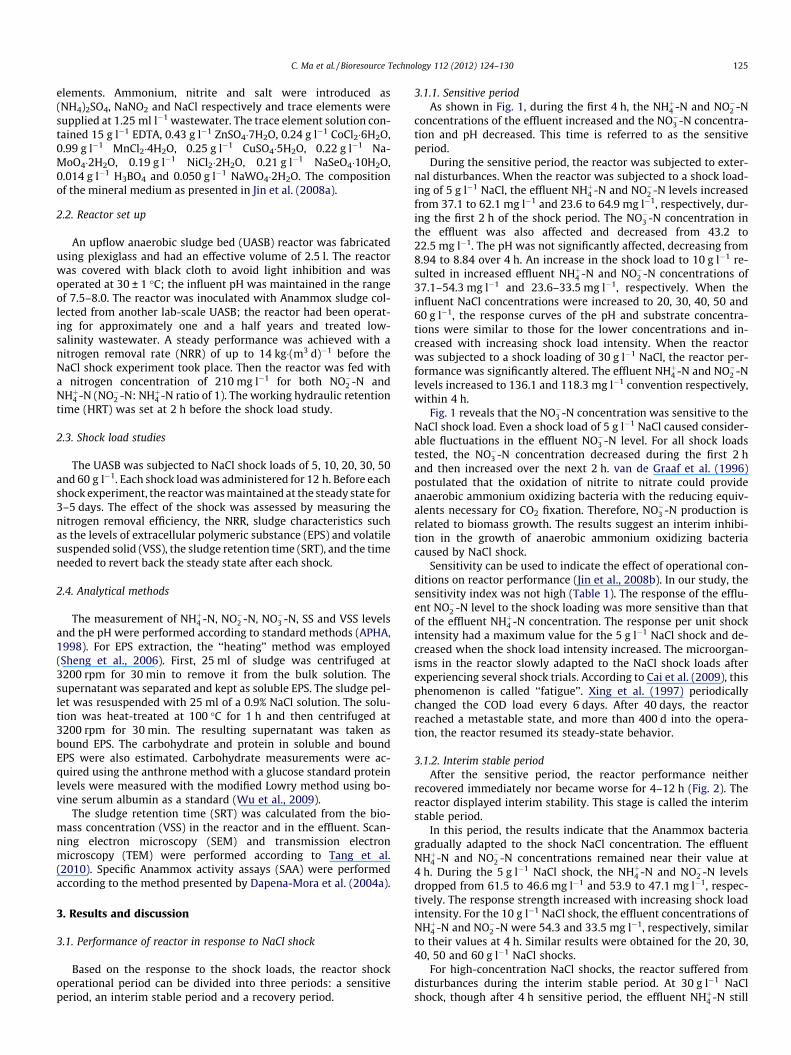
3.1.1. Sensitive periodAs shown in Fig. 1, during the first 4 h, the NHþ4 -N and NO�2 -N
concentrations of the effluent increased and the NO�3 -N concentra-tion and pH decreased. This time is referred to as the sensitiveperiod.
During the sensitive period, the reactor was subjected to exter-nal disturbances. When the reactor was subjected to a shock load-ing of 5 g l�1 NaCl, the effluent NHþ4 -N and NO�2 -N levels increasedfrom 37.1 to 62.1 mg l�1 and 23.6 to 64.9 mg l�1, respectively, dur-ing the first 2 h of the shock period. The NO�3 -N concentration inthe effluent was also affected and decreased from 43.2 to22.5 mg l�1. The pH was not significantly affected, decreasing from8.94 to 8.84 over 4 h. An increase in the shock load to 10 g l�1 re-sulted in increased effluent NHþ4 -N and NO�2 -N concentrations of37.1–54.3 mg l�1 and 23.6–33.5 mg l�1, respectively. When theinfluent NaCl concentrations were increased to 20, 30, 40, 50 and60 g l�1, the response curves of the pH and substrate concentra-tions were similar to those for the lower concentrations and in-creased with increasing shock load intensity. When the reactorwas subjected to a shock loading of 30 g l�1 NaCl, the reactor per-formance was significantly altered. The effluent NHþ4 -N and NO�2 -Nlevels increased to 136.1 and 118.3 mg l�1 convention respectively,within 4 h.
Fig. 1 reveals that the NO�3 -N concentration was sensitive to theNaCl shock load. Even a shock load of 5 g l�1 NaCl caused consider-able fluctuations in the effluent NO�3 -N level. For all shock loadstested, the NO�3 -N concentration decreased during the first 2 hand then increased over the next 2 h. van de Graaf et al. (1996)postulated that the oxidation of nitrite to nitrate could provideanaerobic ammonium oxidizing bacteria with the reducing equiv-alents necessary for CO2 fixation. Therefore, NO�3 -N production isrelated to biomass growth. The results suggest an interim inhibi-tion in the growth of anaerobic ammonium oxidizing bacteriacaused by NaCl shock.
Sensitivity can be used to indicate the effect of operational con-ditions on reactor performance (Jin et al., 2008b). In our study, thesensitivity index was not high (Table 1). The response of the efflu-ent NO�2 -N level to the shock loading was more sensitive than thatof the effluent NHþ4 -N concentration. The response per unit shockintensity had a maximum value for the 5 g l�1 NaCl shock and de-creased when the shock load intensity increased. The microorgan-isms in the reactor slowly adapted to the NaCl shock loads afterexperiencing several shock trials. According to Cai et al. (2009), thisphenomenon is called ‘‘fatigue’’. Xing et al. (1997) periodicallychanged the COD load every 6 days. After 40 days, the reactorreached a metastable state, and more than 400 d into the opera-tion, the reactor resumed its steady-state behavior.
3.1.2. Interim stable periodAfter the sensitive period, the reactor performance neither
recovered immediately nor became worse for 4–12 h (Fig. 2). Thereactor displayed interim stability. This stage is called the interimstable period.
In this period, the results indicate that the Anammox bacteriagradually adapted to the shock NaCl concentration. The effluentNHþ4 -N and NO�2 -N concentrations remained near their value at4 h. During the 5 g l�1 NaCl shock, the NHþ4 -N and NO�2 -N levelsdropped from 61.5 to 46.6 mg l�1 and 53.9 to 47.1 mg l�1, respec-tively. The response strength increased with increasing shock loadintensity. For the 10 g l�1 NaCl shock, the effluent concentrations ofNHþ4 -N and NO�2 -N were 54.3 and 33.5 mg l�1, respectively, similarto their values at 4 h. Similar results were obtained for the 20, 30,40, 50 and 60 g l�1 NaCl shocks.
For high-concentration NaCl shocks, the reactor suffered fromdisturbances during the interim stable period. At 30 g l�1 NaClshock, though after 4 h sensitive period, the effluent NHþ4 -N still
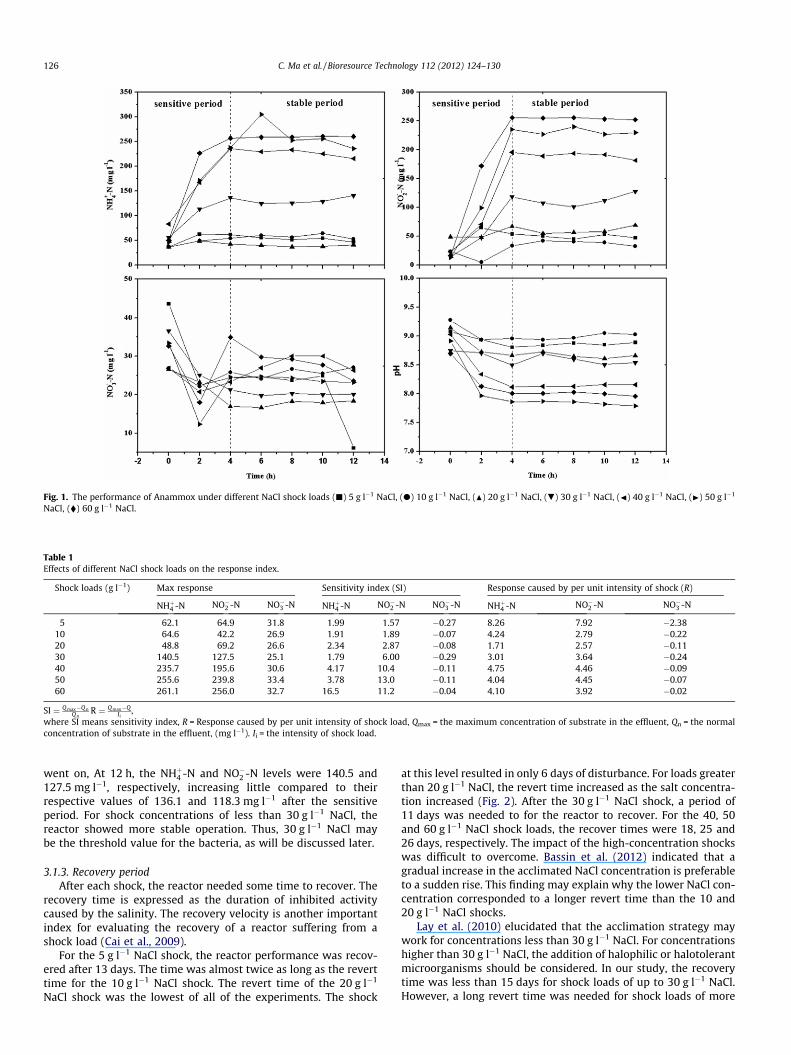
Fig. 1. The performance of Anammox under different NaCl shock loads (j) 5 g l�1 NaCl, (d) 10 g l�1 NaCl, (N) 20 g l�1 NaCl, (.) 30 g l�1 NaCl, (J) 40 g l�1 NaCl, (I) 50 g l�1
NaCl, (�) 60 g l�1 NaCl.
Table 1Effects of different NaCl shock loads on the response index.
Shock loads (g l�1) Max response Sensitivity index (SI) Response caused by per unit intensity of shock (R)
NHþ4 -N NO�2 -N NO�3 -N NHþ4 -N NO�2 -N NO�3 -N NHþ4 -N NO�2 -N NO�3 -N
5 62.1 64.9 31.8 1.99 1.57 �0.27 8.26 7.92 �2.3810 64.6 42.2 26.9 1.91 1.89 �0.07 4.24 2.79 �0.2220 48.8 69.2 26.6 2.34 2.87 �0.08 1.71 2.57 �0.1130 140.5 127.5 25.1 1.79 6.00 �0.29 3.01 3.64 �0.2440 235.7 195.6 30.6 4.17 10.4 �0.11 4.75 4.46 �0.0950 255.6 239.8 33.4 3.78 13.0 �0.11 4.04 4.45 �0.0760 261.1 256.0 32.7 16.5 11.2 �0.04 4.10 3.92 �0.02
SI ¼ Qmax�QnQn
R ¼ Qmax�QIi
,where SI means sensitivity index, R = Response caused by per unit intensity of shock load, Qmax = the maximum concentration of substrate in the effluent, Qn = the normalconcentration of substrate in the effluent, (mg l�1). Ii = the intensity of shock load.
126 C. Ma et al. / Bioresource Technology 112 (2012) 124–130
went on, At 12 h, the NHþ4 -N and NO�2 -N levels were 140.5 and127.5 mg l�1, respectively, increasing little compared to theirrespective values of 136.1 and 118.3 mg l�1 after the sensitiveperiod. For shock concentrations of less than 30 g l�1 NaCl, thereactor showed more stable operation. Thus, 30 g l�1 NaCl maybe the threshold value for the bacteria, as will be discussed later.
3.1.3. Recovery periodAfter each shock, the reactor needed some time to recover. The
recovery time is expressed as the duration of inhibited activitycaused by the salinity. The recovery velocity is another importantindex for evaluating the recovery of a reactor suffering from ashock load (Cai et al., 2009).
For the 5 g l�1 NaCl shock, the reactor performance was recov-ered after 13 days. The time was almost twice as long as the reverttime for the 10 g l�1 NaCl shock. The revert time of the 20 g l�1
NaCl shock was the lowest of all of the experiments. The shock
at this level resulted in only 6 days of disturbance. For loads greaterthan 20 g l�1 NaCl, the revert time increased as the salt concentra-tion increased (Fig. 2). After the 30 g l�1 NaCl shock, a period of11 days was needed to for the reactor to recover. For the 40, 50and 60 g l�1 NaCl shock loads, the recover times were 18, 25 and26 days, respectively. The impact of the high-concentration shockswas difficult to overcome. Bassin et al. (2012) indicated that agradual increase in the acclimated NaCl concentration is preferableto a sudden rise. This finding may explain why the lower NaCl con-centration corresponded to a longer revert time than the 10 and20 g l�1 NaCl shocks.
Lay et al. (2010) elucidated that the acclimation strategy maywork for concentrations less than 30 g l�1 NaCl. For concentrationshigher than 30 g l�1 NaCl, the addition of halophilic or halotolerantmicroorganisms should be considered. In our study, the recoverytime was less than 15 days for shock loads of up to 30 g l�1 NaCl.However, a long revert time was needed for shock loads of more
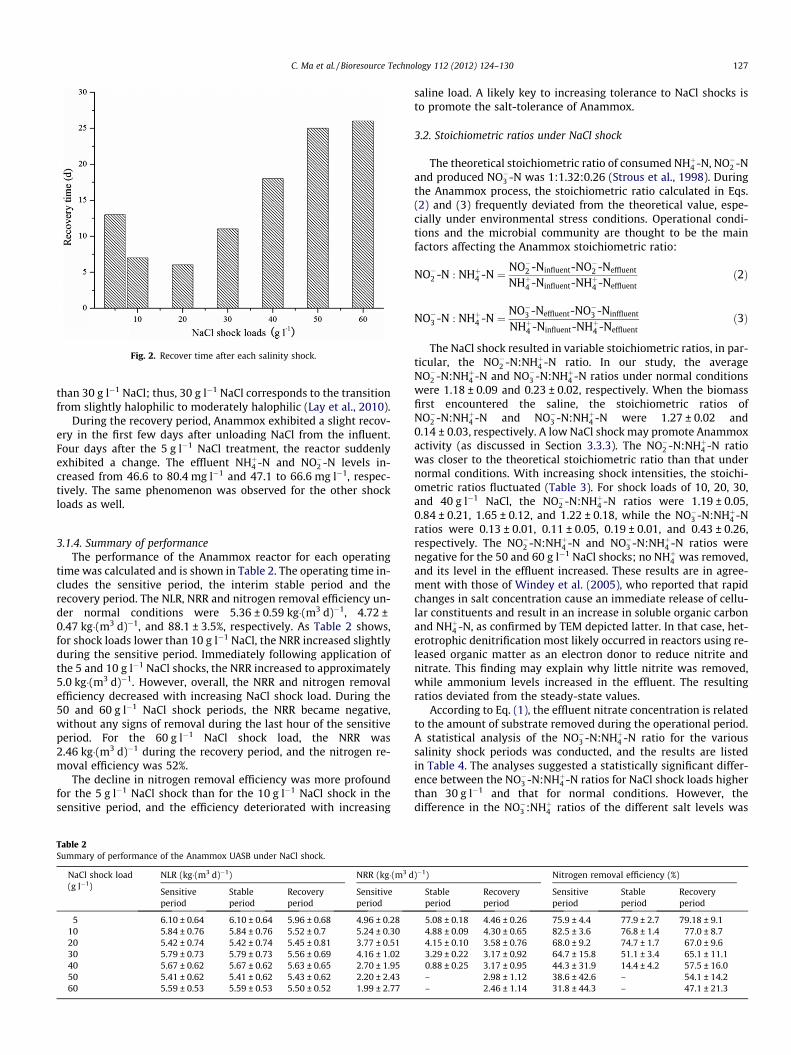
Fig. 2. Recover time after each salinity shock.
C. Ma et al. / Bioresource Technology 112 (2012) 124–130 127
than 30 g l�1 NaCl; thus, 30 g l�1 NaCl corresponds to the transitionfrom slightly halophilic to moderately halophilic (Lay et al., 2010).
During the recovery period, Anammox exhibited a slight recov-ery in the first few days after unloading NaCl from the influent.Four days after the 5 g l�1 NaCl treatment, the reactor suddenlyexhibited a change. The effluent NHþ4 -N and NO�2 -N levels in-creased from 46.6 to 80.4 mg l�1 and 47.1 to 66.6 mg l�1, respec-tively. The same phenomenon was observed for the other shockloads as well.
3.1.4. Summary of performanceThe performance of the Anammox reactor for each operating
time was calculated and is shown in Table 2. The operating time in-cludes the sensitive period, the interim stable period and therecovery period. The NLR, NRR and nitrogen removal efficiency un-der normal conditions were 5.36 ± 0.59 kg�(m3 d)�1, 4.72 ±0.47 kg�(m3 d)�1, and 88.1 ± 3.5%, respectively. As Table 2 shows,for shock loads lower than 10 g l�1 NaCl, the NRR increased slightlyduring the sensitive period. Immediately following application ofthe 5 and 10 g l�1 NaCl shocks, the NRR increased to approximately5.0 kg�(m3 d)�1. However, overall, the NRR and nitrogen removalefficiency decreased with increasing NaCl shock load. During the50 and 60 g l�1 NaCl shock periods, the NRR became negative,without any signs of removal during the last hour of the sensitiveperiod. For the 60 g l�1 NaCl shock load, the NRR was2.46 kg�(m3 d)�1 during the recovery period, and the nitrogen re-moval efficiency was 52%.
The decline in nitrogen removal efficiency was more profoundfor the 5 g l�1 NaCl shock than for the 10 g l�1 NaCl shock in thesensitive period, and the efficiency deteriorated with increasing
Table 2Summary of performance of the Anammox UASB under NaCl shock.
NaCl shock load(g l�1)
NLR (kg�(m3 d)�1) NRR (kg�(m3 d
Sensitiveperiod
Stableperiod
Recoveryperiod
Sensitiveperiod
5 6.10 ± 0.64 6.10 ± 0.64 5.96 ± 0.68 4.96 ± 0.2810 5.84 ± 0.76 5.84 ± 0.76 5.52 ± 0.7 5.24 ± 0.3020 5.42 ± 0.74 5.42 ± 0.74 5.45 ± 0.81 3.77 ± 0.5130 5.79 ± 0.73 5.79 ± 0.73 5.56 ± 0.69 4.16 ± 1.0240 5.67 ± 0.62 5.67 ± 0.62 5.63 ± 0.65 2.70 ± 1.9550 5.41 ± 0.62 5.41 ± 0.62 5.43 ± 0.62 2.20 ± 2.4360 5.59 ± 0.53 5.59 ± 0.53 5.50 ± 0.52 1.99 ± 2.77
saline load. A likely key to increasing tolerance to NaCl shocks isto promote the salt-tolerance of Anammox.
3.2. Stoichiometric ratios under NaCl shock
The theoretical stoichiometric ratio of consumed NHþ4 -N, NO�2 -Nand produced NO�3 -N was 1:1.32:0.26 (Strous et al., 1998). Duringthe Anammox process, the stoichiometric ratio calculated in Eqs.(2) and (3) frequently deviated from the theoretical value, espe-cially under environmental stress conditions. Operational condi-tions and the microbial community are thought to be the mainfactors affecting the Anammox stoichiometric ratio:
NO�2 -N : NHþ4 -N ¼ NO�2 -Ninfluent-NO�2 -Neffluent
NHþ4 -Ninfluent-NHþ4 -Neffluentð2Þ
NO�3 -N : NHþ4 -N ¼ NO�3 -Neffluent-NO�3 -Ninffluent
NHþ4 -Ninfluent-NHþ4 -Neffluentð3Þ
The NaCl shock resulted in variable stoichiometric ratios, in par-ticular, the NO�2 -N:NHþ4 -N ratio. In our study, the averageNO�2 -N:NHþ4 -N and NO�3 -N:NHþ4 -N ratios under normal conditionswere 1.18 ± 0.09 and 0.23 ± 0.02, respectively. When the biomassfirst encountered the saline, the stoichiometric ratios ofNO�2 -N:NHþ4 -N and NO�3 -N:NHþ4 -N were 1.27 ± 0.02 and0.14 ± 0.03, respectively. A low NaCl shock may promote Anammoxactivity (as discussed in Section 3.3.3). The NO�2 -N:NHþ4 -N ratiowas closer to the theoretical stoichiometric ratio than that undernormal conditions. With increasing shock intensities, the stoichi-ometric ratios fluctuated (Table 3). For shock loads of 10, 20, 30,and 40 g l�1 NaCl, the NO�2 -N:NHþ4 -N ratios were 1.19 ± 0.05,0.84 ± 0.21, 1.65 ± 0.12, and 1.22 ± 0.18, while the NO�3 -N:NHþ4 -Nratios were 0.13 ± 0.01, 0.11 ± 0.05, 0.19 ± 0.01, and 0.43 ± 0.26,respectively. The NO�2 -N:NHþ4 -N and NO�3 -N:NHþ4 -N ratios werenegative for the 50 and 60 g l�1 NaCl shocks; no NHþ4 was removed,and its level in the effluent increased. These results are in agree-ment with those of Windey et al. (2005), who reported that rapidchanges in salt concentration cause an immediate release of cellu-lar constituents and result in an increase in soluble organic carbonand NHþ4 -N, as confirmed by TEM depicted latter. In that case, het-erotrophic denitrification most likely occurred in reactors using re-leased organic matter as an electron donor to reduce nitrite andnitrate. This finding may explain why little nitrite was removed,while ammonium levels increased in the effluent. The resultingratios deviated from the steady-state values.
According to Eq. (1), the effluent nitrate concentration is relatedto the amount of substrate removed during the operational period.A statistical analysis of the NO�3 -N:NHþ4 -N ratio for the varioussalinity shock periods was conducted, and the results are listedin Table 4. The analyses suggested a statistically significant differ-ence between the NO�3 -N:NHþ4 -N ratios for NaCl shock loads higherthan 30 g l�1 and that for normal conditions. However, thedifference in the NO�3 :NHþ4 ratios of the different salt levels was
)�1) Nitrogen removal efficiency (%)
Stableperiod
Recoveryperiod
Sensitiveperiod
Stableperiod
Recoveryperiod
5.08 ± 0.18 4.46 ± 0.26 75.9 ± 4.4 77.9 ± 2.7 79.18 ± 9.14.88 ± 0.09 4.30 ± 0.65 82.5 ± 3.6 76.8 ± 1.4 77.0 ± 8.74.15 ± 0.10 3.58 ± 0.76 68.0 ± 9.2 74.7 ± 1.7 67.0 ± 9.63.29 ± 0.22 3.17 ± 0.92 64.7 ± 15.8 51.1 ± 3.4 65.1 ± 11.10.88 ± 0.25 3.17 ± 0.95 44.3 ± 31.9 14.4 ± 4.2 57.5 ± 16.0– 2.98 ± 1.12 38.6 ± 42.6 – 54.1 ± 14.2– 2.46 ± 1.14 31.8 ± 44.3 – 47.1 ± 21.3
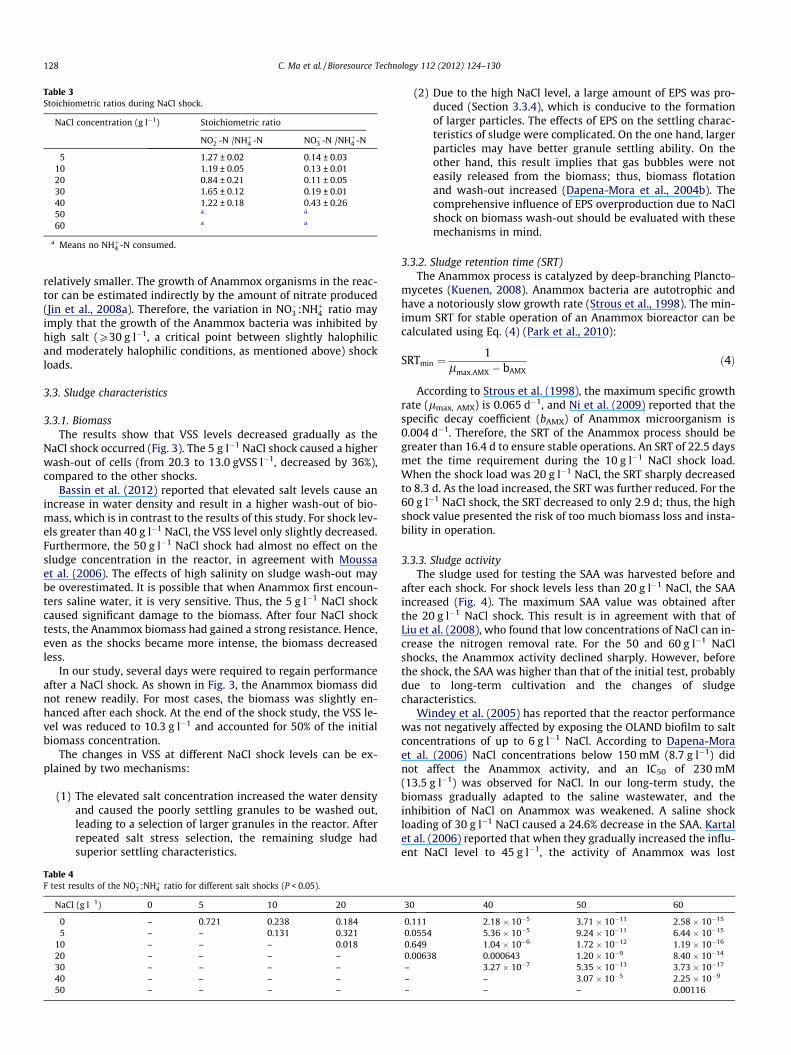
Table 3Stoichiometric ratios during NaCl shock.
NaCl concentration (g l�1) Stoichiometric ratio
NO�2 -N /NHþ4 -N NO�3 -N /NHþ4 -N
5 1.27 ± 0.02 0.14 ± 0.0310 1.19 ± 0.05 0.13 ± 0.0120 0.84 ± 0.21 0.11 ± 0.0530 1.65 ± 0.12 0.19 ± 0.0140 1.22 ± 0.18 0.43 ± 0.2650 a a
60 a a
a Means no NHþ4 -N consumed.
128 C. Ma et al. / Bioresource Technology 112 (2012) 124–130
relatively smaller. The growth of Anammox organisms in the reac-tor can be estimated indirectly by the amount of nitrate produced(Jin et al., 2008a). Therefore, the variation in NO�3 :NHþ4 ratio mayimply that the growth of the Anammox bacteria was inhibited byhigh salt (P30 g l�1, a critical point between slightly halophilicand moderately halophilic conditions, as mentioned above) shockloads.
3.3. Sludge characteristics
3.3.1. BiomassThe results show that VSS levels decreased gradually as the
NaCl shock occurred (Fig. 3). The 5 g l�1 NaCl shock caused a higherwash-out of cells (from 20.3 to 13.0 gVSS l�1, decreased by 36%),compared to the other shocks.
Bassin et al. (2012) reported that elevated salt levels cause anincrease in water density and result in a higher wash-out of bio-mass, which is in contrast to the results of this study. For shock lev-els greater than 40 g l�1 NaCl, the VSS level only slightly decreased.Furthermore, the 50 g l�1 NaCl shock had almost no effect on thesludge concentration in the reactor, in agreement with Moussaet al. (2006). The effects of high salinity on sludge wash-out maybe overestimated. It is possible that when Anammox first encoun-ters saline water, it is very sensitive. Thus, the 5 g l�1 NaCl shockcaused significant damage to the biomass. After four NaCl shocktests, the Anammox biomass had gained a strong resistance. Hence,even as the shocks became more intense, the biomass decreasedless.
In our study, several days were required to regain performanceafter a NaCl shock. As shown in Fig. 3, the Anammox biomass didnot renew readily. For most cases, the biomass was slightly en-hanced after each shock. At the end of the shock study, the VSS le-vel was reduced to 10.3 g l�1 and accounted for 50% of the initialbiomass concentration.
The changes in VSS at different NaCl shock levels can be ex-plained by two mechanisms:
(1) The elevated salt concentration increased the water densityand caused the poorly settling granules to be washed out,leading to a selection of larger granules in the reactor. Afterrepeated salt stress selection, the remaining sludge hadsuperior settling characteristics.
Table 4F test results of the NO�3 :NHþ4 ratio for different salt shocks (P < 0.05).
NaCl (g l�1) 0 5 10 20
0 – 0.721 0.238 0.1845 – – 0.131 0.321
10 – – – 0.01820 – – – –30 – – – –40 – – – –50 – – – –
(2) Due to the high NaCl level, a large amount of EPS was pro-duced (Section 3.3.4), which is conducive to the formationof larger particles. The effects of EPS on the settling charac-teristics of sludge were complicated. On the one hand, largerparticles may have better granule settling ability. On theother hand, this result implies that gas bubbles were noteasily released from the biomass; thus, biomass flotationand wash-out increased (Dapena-Mora et al., 2004b). Thecomprehensive influence of EPS overproduction due to NaClshock on biomass wash-out should be evaluated with thesemechanisms in mind.
3.3.2. Sludge retention time (SRT)The Anammox process is catalyzed by deep-branching Plancto-
mycetes (Kuenen, 2008). Anammox bacteria are autotrophic andhave a notoriously slow growth rate (Strous et al., 1998). The min-imum SRT for stable operation of an Anammox bioreactor can becalculated using Eq. (4) (Park et al., 2010):
SRTmin ¼1
lmax;AMX � bAMXð4Þ
According to Strous et al. (1998), the maximum specific growthrate (lmax, AMX) is 0.065 d�1, and Ni et al. (2009) reported that thespecific decay coefficient (bAMX) of Anammox microorganism is0.004 d�1. Therefore, the SRT of the Anammox process should begreater than 16.4 d to ensure stable operations. An SRT of 22.5 daysmet the time requirement during the 10 g l�1 NaCl shock load.When the shock load was 20 g l�1 NaCl, the SRT sharply decreasedto 8.3 d. As the load increased, the SRT was further reduced. For the60 g l�1 NaCl shock, the SRT decreased to only 2.9 d; thus, the highshock value presented the risk of too much biomass loss and insta-bility in operation.
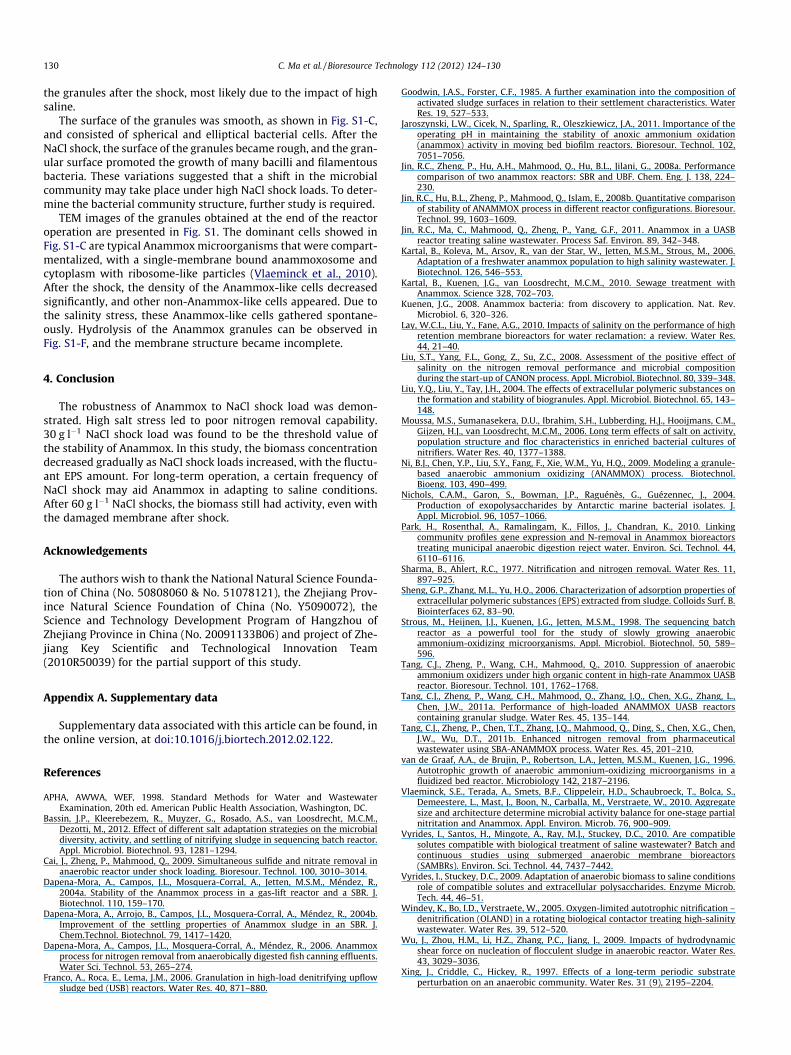
3.3.3. Sludge activityThe sludge used for testing the SAA was harvested before and
after each shock. For shock levels less than 20 g l�1 NaCl, the SAAincreased (Fig. 4). The maximum SAA value was obtained afterthe 20 g l�1 NaCl shock. This result is in agreement with that ofLiu et al. (2008), who found that low concentrations of NaCl can in-crease the nitrogen removal rate. For the 50 and 60 g l�1 NaClshocks, the Anammox activity declined sharply. However, beforethe shock, the SAA was higher than that of the initial test, probablydue to long-term cultivation and the changes of sludgecharacteristics.
Windey et al. (2005) has reported that the reactor performancewas not negatively affected by exposing the OLAND biofilm to saltconcentrations of up to 6 g l�1 NaCl. According to Dapena-Moraet al. (2006) NaCl concentrations below 150 mM (8.7 g l�1) didnot affect the Anammox activity, and an IC50 of 230 mM(13.5 g l�1) was observed for NaCl. In our long-term study, thebiomass gradually adapted to the saline wastewater, and theinhibition of NaCl on Anammox was weakened. A saline shockloading of 30 g l�1 NaCl caused a 24.6% decrease in the SAA. Kartalet al. (2006) reported that when they gradually increased the influ-ent NaCl level to 45 g l�1, the activity of Anammox was lost
30 40 50 60
0.111 2.18 � 10�5 3.71 � 10�11 2.58 � 10�15
0.0554 5.36 � 10�5 9.24 � 10�11 6.44 � 10�15
0.649 1.04 � 10�6 1.72 � 10�12 1.19 � 10�16
0.00638 0.000643 1.20 � 10�9 8.40 � 10�14
– 3.27 � 10�7 5.35 � 10�13 3.73 � 10�17
– – 3.07 � 10�5 2.25 � 10�9
– – – 0.00116
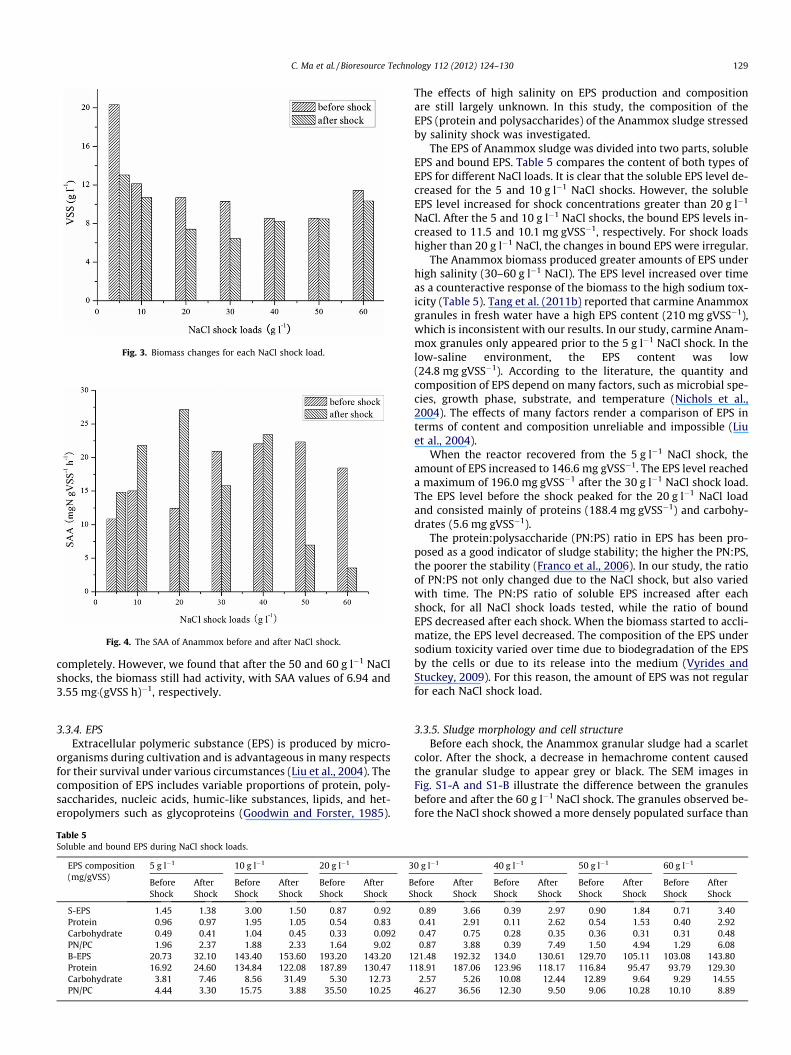
Fig. 3. Biomass changes for each NaCl shock load.
Fig. 4. The SAA of Anammox before and after NaCl shock.
C. Ma et al. / Bioresource Technology 112 (2012) 124–130 129
completely. However, we found that after the 50 and 60 g l�1 NaClshocks, the biomass still had activity, with SAA values of 6.94 and3.55 mg�(gVSS h)�1, respectively.
3.3.4. EPSExtracellular polymeric substance (EPS) is produced by micro-
organisms during cultivation and is advantageous in many respectsfor their survival under various circumstances (Liu et al., 2004). Thecomposition of EPS includes variable proportions of protein, poly-saccharides, nucleic acids, humic-like substances, lipids, and het-eropolymers such as glycoproteins (Goodwin and Forster, 1985).
Table 5Soluble and bound EPS during NaCl shock loads.
EPS composition(mg/gVSS)
5 g l�1 10 g l�1 20 g l�1 3
BeforeShock
AfterShock
BeforeShock
AfterShock
BeforeShock
AfterShock
BS
S-EPS 1.45 1.38 3.00 1.50 0.87 0.92Protein 0.96 0.97 1.95 1.05 0.54 0.83Carbohydrate 0.49 0.41 1.04 0.45 0.33 0.092PN/PC 1.96 2.37 1.88 2.33 1.64 9.02B-EPS 20.73 32.10 143.40 153.60 193.20 143.20 1Protein 16.92 24.60 134.84 122.08 187.89 130.47 1Carbohydrate 3.81 7.46 8.56 31.49 5.30 12.73PN/PC 4.44 3.30 15.75 3.88 35.50 10.25
The effects of high salinity on EPS production and compositionare still largely unknown. In this study, the composition of theEPS (protein and polysaccharides) of the Anammox sludge stressedby salinity shock was investigated.
The EPS of Anammox sludge was divided into two parts, solubleEPS and bound EPS. Table 5 compares the content of both types ofEPS for different NaCl loads. It is clear that the soluble EPS level de-creased for the 5 and 10 g l�1 NaCl shocks. However, the solubleEPS level increased for shock concentrations greater than 20 g l�1
NaCl. After the 5 and 10 g l�1 NaCl shocks, the bound EPS levels in-creased to 11.5 and 10.1 mg gVSS�1, respectively. For shock loadshigher than 20 g l�1 NaCl, the changes in bound EPS were irregular.
The Anammox biomass produced greater amounts of EPS underhigh salinity (30–60 g l�1 NaCl). The EPS level increased over timeas a counteractive response of the biomass to the high sodium tox-icity (Table 5). Tang et al. (2011b) reported that carmine Anammoxgranules in fresh water have a high EPS content (210 mg gVSS�1),which is inconsistent with our results. In our study, carmine Anam-mox granules only appeared prior to the 5 g l�1 NaCl shock. In thelow-saline environment, the EPS content was low(24.8 mg gVSS�1). According to the literature, the quantity andcomposition of EPS depend on many factors, such as microbial spe-cies, growth phase, substrate, and temperature (Nichols et al.,2004). The effects of many factors render a comparison of EPS interms of content and composition unreliable and impossible (Liuet al., 2004).
When the reactor recovered from the 5 g l�1 NaCl shock, theamount of EPS increased to 146.6 mg gVSS�1. The EPS level reacheda maximum of 196.0 mg gVSS�1 after the 30 g l�1 NaCl shock load.The EPS level before the shock peaked for the 20 g l�1 NaCl loadand consisted mainly of proteins (188.4 mg gVSS�1) and carbohy-drates (5.6 mg gVSS�1).
The protein:polysaccharide (PN:PS) ratio in EPS has been pro-posed as a good indicator of sludge stability; the higher the PN:PS,the poorer the stability (Franco et al., 2006). In our study, the ratioof PN:PS not only changed due to the NaCl shock, but also variedwith time. The PN:PS ratio of soluble EPS increased after eachshock, for all NaCl shock loads tested, while the ratio of boundEPS decreased after each shock. When the biomass started to accli-matize, the EPS level decreased. The composition of the EPS undersodium toxicity varied over time due to biodegradation of the EPSby the cells or due to its release into the medium (Vyrides andStuckey, 2009). For this reason, the amount of EPS was not regularfor each NaCl shock load.
3.3.5. Sludge morphology and cell structureBefore each shock, the Anammox granular sludge had a scarlet
color. After the shock, a decrease in hemachrome content causedthe granular sludge to appear grey or black. The SEM images inFig. S1-A and S1-B illustrate the difference between the granulesbefore and after the 60 g l�1 NaCl shock. The granules observed be-fore the NaCl shock showed a more densely populated surface than
0 g l�1 40 g l�1 50 g l�1 60 g l�1
eforehock
AfterShock
BeforeShock
AfterShock
BeforeShock
AfterShock
BeforeShock
AfterShock
0.89 3.66 0.39 2.97 0.90 1.84 0.71 3.400.41 2.91 0.11 2.62 0.54 1.53 0.40 2.920.47 0.75 0.28 0.35 0.36 0.31 0.31 0.480.87 3.88 0.39 7.49 1.50 4.94 1.29 6.08
21.48 192.32 134.0 130.61 129.70 105.11 103.08 143.8018.91 187.06 123.96 118.17 116.84 95.47 93.79 129.30
2.57 5.26 10.08 12.44 12.89 9.64 9.29 14.5546.27 36.56 12.30 9.50 9.06 10.28 10.10 8.89
130 C. Ma et al. / Bioresource Technology 112 (2012) 124–130
the granules after the shock, most likely due to the impact of highsaline.
The surface of the granules was smooth, as shown in Fig. S1-C,and consisted of spherical and elliptical bacterial cells. After theNaCl shock, the surface of the granules became rough, and the gran-ular surface promoted the growth of many bacilli and filamentousbacteria. These variations suggested that a shift in the microbialcommunity may take place under high NaCl shock loads. To deter-mine the bacterial community structure, further study is required.
TEM images of the granules obtained at the end of the reactoroperation are presented in Fig. S1. The dominant cells showed inFig. S1-C are typical Anammox microorganisms that were compart-mentalized, with a single-membrane bound anammoxosome andcytoplasm with ribosome-like particles (Vlaeminck et al., 2010).After the shock, the density of the Anammox-like cells decreasedsignificantly, and other non-Anammox-like cells appeared. Due tothe salinity stress, these Anammox-like cells gathered spontane-ously. Hydrolysis of the Anammox granules can be observed inFig. S1-F, and the membrane structure became incomplete.
4. Conclusion
The robustness of Anammox to NaCl shock load was demon-strated. High salt stress led to poor nitrogen removal capability.30 g l�1 NaCl shock load was found to be the threshold value ofthe stability of Anammox. In this study, the biomass concentrationdecreased gradually as NaCl shock loads increased, with the fluctu-ant EPS amount. For long-term operation, a certain frequency ofNaCl shock may aid Anammox in adapting to saline conditions.After 60 g l�1 NaCl shocks, the biomass still had activity, even withthe damaged membrane after shock.
Acknowledgements
The authors wish to thank the National Natural Science Founda-tion of China (No. 50808060 & No. 51078121), the Zhejiang Prov-ince Natural Science Foundation of China (No. Y5090072), theScience and Technology Development Program of Hangzhou ofZhejiang Province in China (No. 20091133B06) and project of Zhe-jiang Key Scientific and Technological Innovation Team(2010R50039) for the partial support of this study.
Appendix A. Supplementary data
Supplementary data associated with this article can be found, inthe online version, at doi:10.1016/j.biortech.2012.02.122.
References
APHA, AWWA, WEF, 1998. Standard Methods for Water and WastewaterExamination, 20th ed. American Public Health Association, Washington, DC.
Bassin, J.P., Kleerebezem, R., Muyzer, G., Rosado, A.S., van Loosdrecht, M.C.M.,Dezotti, M., 2012. Effect of different salt adaptation strategies on the microbialdiversity, activity, and settling of nitrifying sludge in sequencing batch reactor.Appl. Microbiol. Biotechnol. 93, 1281–1294.
Cai, J., Zheng, P., Mahmood, Q., 2009. Simultaneous sulfide and nitrate removal inanaerobic reactor under shock loading. Bioresour. Technol. 100, 3010–3014.
Dapena-Mora, A., Campos, J.L., Mosquera-Corral, A., Jetten, M.S.M., Méndez, R.,2004a. Stability of the Anammox process in a gas-lift reactor and a SBR. J.Biotechnol. 110, 159–170.
Dapena-Mora, A., Arrojo, B., Campos, J.L., Mosquera-Corral, A., Méndez, R., 2004b.Improvement of the settling properties of Anammox sludge in an SBR. J.Chem.Technol. Biotechnol. 79, 1417–1420.
Dapena-Mora, A., Campos, J.L., Mosquera-Corral, A., Méndez, R., 2006. Anammoxprocess for nitrogen removal from anaerobically digested fish canning effluents.Water Sci. Technol. 53, 265–274.
Franco, A., Roca, E., Lema, J.M., 2006. Granulation in high-load denitrifying upflowsludge bed (USB) reactors. Water Res. 40, 871–880.
Goodwin, J.A.S., Forster, C.F., 1985. A further examination into the composition ofactivated sludge surfaces in relation to their settlement characteristics. WaterRes. 19, 527–533.
Jaroszynski, L.W., Cicek, N., Sparling, R., Oleszkiewicz, J.A., 2011. Importance of theoperating pH in maintaining the stability of anoxic ammonium oxidation(anammox) activity in moving bed biofilm reactors. Bioresour. Technol. 102,7051–7056.
Jin, R.C., Zheng, P., Hu, A.H., Mahmood, Q., Hu, B.L., Jilani, G., 2008a. Performancecomparison of two anammox reactors: SBR and UBF. Chem. Eng. J. 138, 224–230.
Jin, R.C., Hu, B.L., Zheng, P., Mahmood, Q., Islam, E., 2008b. Quantitative comparisonof stability of ANAMMOX process in different reactor configurations. Bioresour.Technol. 99, 1603–1609.
Jin, R.C., Ma, C., Mahmood, Q., Zheng, P., Yang, G.F., 2011. Anammox in a UASBreactor treating saline wastewater. Process Saf. Environ. 89, 342–348.
Kartal, B., Koleva, M., Arsov, R., van der Star, W., Jetten, M.S.M., Strous, M., 2006.Adaptation of a freshwater anammox population to high salinity wastewater. J.Biotechnol. 126, 546–553.
Kartal, B., Kuenen, J.G., van Loosdrecht, M.C.M., 2010. Sewage treatment withAnammox. Science 328, 702–703.
Kuenen, J.G., 2008. Anammox bacteria: from discovery to application. Nat. Rev.Microbiol. 6, 320–326.
Lay, W.C.L., Liu, Y., Fane, A.G., 2010. Impacts of salinity on the performance of highretention membrane bioreactors for water reclamation: a review. Water Res.44, 21–40.
Liu, S.T., Yang, F.L., Gong, Z., Su, Z.C., 2008. Assessment of the positive effect ofsalinity on the nitrogen removal performance and microbial compositionduring the start-up of CANON process. Appl. Microbiol. Biotechnol. 80, 339–348.
Liu, Y.Q., Liu, Y., Tay, J.H., 2004. The effects of extracellular polymeric substances onthe formation and stability of biogranules. Appl. Microbiol. Biotechnol. 65, 143–148.
Moussa, M.S., Sumanasekera, D.U., Ibrahim, S.H., Lubberding, H.J., Hooijmans, C.M.,Gijzen, H.J., van Loosdrecht, M.C.M., 2006. Long term effects of salt on activity,population structure and floc characteristics in enriched bacterial cultures ofnitrifiers. Water Res. 40, 1377–1388.
Ni, B.J., Chen, Y.P., Liu, S.Y., Fang, F., Xie, W.M., Yu, H.Q., 2009. Modeling a granule-based anaerobic ammonium oxidizing (ANAMMOX) process. Biotechnol.Bioeng. 103, 490–499.
Nichols, C.A.M., Garon, S., Bowman, J.P., Raguénès, G., Guézennec, J., 2004.Production of exopolysaccharides by Antarctic marine bacterial isolates. J.Appl. Microbiol. 96, 1057–1066.
Park, H., Rosenthal, A., Ramalingam, K., Fillos, J., Chandran, K., 2010. Linkingcommunity profiles gene expression and N-removal in Anammox bioreactorstreating municipal anaerobic digestion reject water. Environ. Sci. Technol. 44,6110–6116.
Sharma, B., Ahlert, R.C., 1977. Nitrification and nitrogen removal. Water Res. 11,897–925.
Sheng, G.P., Zhang, M.L., Yu, H.Q., 2006. Characterization of adsorption properties ofextracellular polymeric substances (EPS) extracted from sludge. Colloids Surf. B.Biointerfaces 62, 83–90.
Strous, M., Heijnen, J.J., Kuenen, J.G., Jetten, M.S.M., 1998. The sequencing batchreactor as a powerful tool for the study of slowly growing anaerobicammonium-oxidizing microorganisms. Appl. Microbiol. Biotechnol. 50, 589–596.
Tang, C.J., Zheng, P., Wang, C.H., Mahmood, Q., 2010. Suppression of anaerobicammonium oxidizers under high organic content in high-rate Anammox UASBreactor. Bioresour. Technol. 101, 1762–1768.
Tang, C.J., Zheng, P., Wang, C.H., Mahmood, Q., Zhang, J.Q., Chen, X.G., Zhang, L.,Chen, J.W., 2011a. Performance of high-loaded ANAMMOX UASB reactorscontaining granular sludge. Water Res. 45, 135–144.
Tang, C.J., Zheng, P., Chen, T.T., Zhang, J.Q., Mahmood, Q., Ding, S., Chen, X.G., Chen,J.W., Wu, D.T., 2011b. Enhanced nitrogen removal from pharmaceuticalwastewater using SBA-ANAMMOX process. Water Res. 45, 201–210.
van de Graaf, A.A., de Brujin, P., Robertson, L.A., Jetten, M.S.M., Kuenen, J.G., 1996.Autotrophic growth of anaerobic ammonium-oxidizing microorganisms in afluidized bed reactor. Microbiology 142, 2187–2196.
Vlaeminck, S.E., Terada, A., Smets, B.F., Clippeleir, H.D., Schaubroeck, T., Bolca, S.,Demeestere, L., Mast, J., Boon, N., Carballa, M., Verstraete, W., 2010. Aggregatesize and architecture determine microbial activity balance for one-stage partialnitritation and Anammox. Appl. Environ. Microb. 76, 900–909.
Vyrides, I., Santos, H., Mingote, A., Ray, M.J., Stuckey, D.C., 2010. Are compatiblesolutes compatible with biological treatment of saline wastewater? Batch andcontinuous studies using submerged anaerobic membrane bioreactors(SAMBRs). Environ. Sci. Technol. 44, 7437–7442.
Vyrides, I., Stuckey, D.C., 2009. Adaptation of anaerobic biomass to saline conditionsrole of compatible solutes and extracellular polysaccharides. Enzyme Microb.Tech. 44, 46–51.
Windey, K., Bo, I.D., Verstraete, W., 2005. Oxygen-limited autotrophic nitrification –denitrification (OLAND) in a rotating biological contactor treating high-salinitywastewater. Water Res. 39, 512–520.
Wu, J., Zhou, H.M., Li, H.Z., Zhang, P.C., Jiang, J., 2009. Impacts of hydrodynamicshear force on nucleation of flocculent sludge in anaerobic reactor. Water Res.43, 3029–3036.
Xing, J., Criddle, C., Hickey, R., 1997. Effects of a long-term periodic substrateperturbation on an anaerobic community. Water Res. 31 (9), 2195–2204.