Effects of mechanical loads on the deformation and health ...
169
Wijbrand Ouweltjes Effects of mechanical loads on the deformation and health status of claws in dairy cows
-
Upload
khangminh22 -
Category
Documents
-
view
1 -
download
0
Transcript of Effects of mechanical loads on the deformation and health ...

Wijbrand Ouweltjes
Effects of mechanical loads on the deformation and health status of
claws in dairy cows

PROPOSITIONS
1. Sustained moderate load caused by prolonged standing bouts mayhave more detrimental effects on claw tissues of dairy cows thanhigh peak load that occurs during locomotion. (this thesis)
2. Lying duration and frequency of lying and standing of cattle areunreliable indicators for lying comfort, particularly in barns withhard flooring. (this thesis)
3. The fact that the journal Science reports on fake news proofs thatsuch news is a concern to the scientific community.
4. Automation in healthcare improves physical health of elderlypeople, but may reduce their well-being by reduced humaninteraction.
5. Globalisation impairs biodiversity in the Netherlands.
6. Implementation of legislation to protect laboratory animalshampers improvement of welfare of production animals.
Propositions belonging to the thesis:
Effects of mechanical loads on the deformation and health status of claws in dairy cows.
Wijbrand Ouweltjes
Wageningen, 13 juni 2018

ii
Thesis Committee
PromotorProf. Dr J.L. van LeeuwenProfessor of Experimental ZoologyWageningen University & Research
Co-PromotorsDr S.W.S. GusseklooAssistant professor, Experimental ZoologyWageningen University & Research
Dr C.W. SpoorSenior researcher, Experimental ZoologyWageningen University & Research
Other membersProf. Dr P.W.G. Groot Koerkamp, Wageningen University & ResearchProf. Dr P.R. van Weeren, Utrecht UniversityDr S. Nauwelaerts, University of Antwerp, BelgiumDr J.H. de Groot, Leiden University Medical Center
This research was conducted under the auspices of the Graduate School of the Wageningen Institute of Animal Sciences (WIAS)
iii
Wijbrand Ouweltjes
Thesissubmitted in fulfilment of the requirements for the degree of doctor at
Wageningen Universityby the authority of the Rector Magnificus,
Prof. Dr A.P.J. Mol,in the presence of the
Thesis Committee appointed by the Academic Boardto be defended in public
on Wednesday 13 June 2018at 4 p.m. in the Aula.
Effects of mechanical loads on the deformation and health status of
claws in dairy cows

iv
Wijbrand OuweltjesEffects of mechanical loads on the deformation and health status of claws in dairy cows, 158 pages.
PhD thesis, Wageningen University, Wageningen, the Netherlands (2018)With references, with summaries in English and Dutch
ISBN: 978-94-6343-871-1DOI: https://doi.org/10.18174/448262
v
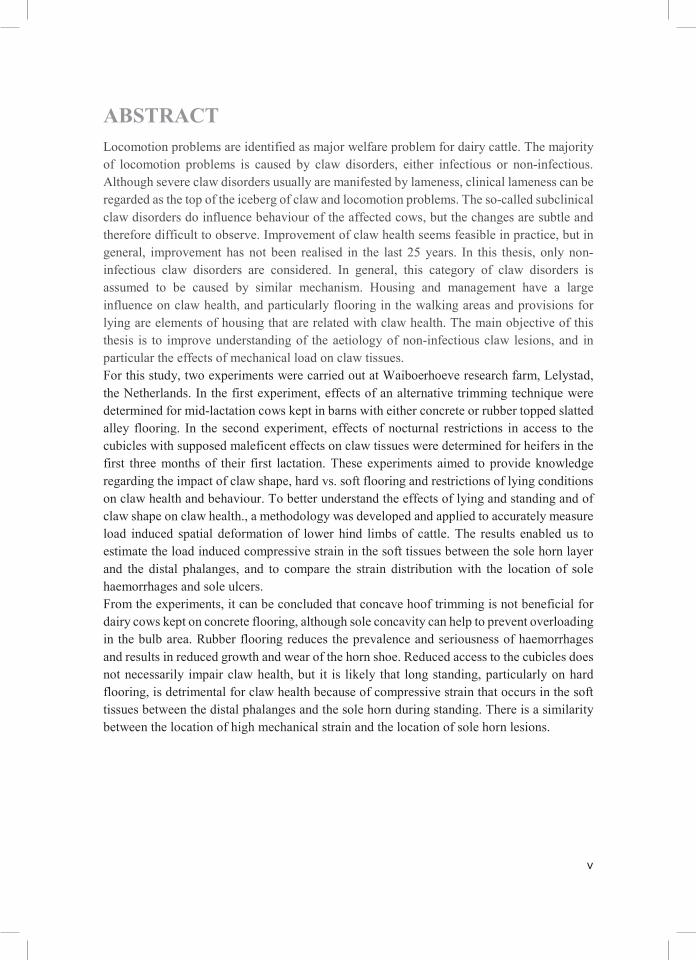
ABSTRACTLocomotion problems are identified as major welfare problem for dairy cattle. The majority of locomotion problems is caused by claw disorders, either infectious or non-infectious. Although severe claw disorders usually are manifested by lameness, clinical lameness can be regarded as the top of the iceberg of claw and locomotion problems. The so-called subclinical claw disorders do influence behaviour of the affected cows, but the changes are subtle and therefore difficult to observe. Improvement of claw health seems feasible in practice, but in general, improvement has not been realised in the last 25 years. In this thesis, only non-infectious claw disorders are considered. In general, this category of claw disorders is assumed to be caused by similar mechanism. Housing and management have a large influence on claw health, and particularly flooring in the walking areas and provisions for lying are elements of housing that are related with claw health. The main objective of this thesis is to improve understanding of the aetiology of non-infectious claw lesions, and in particular the effects of mechanical load on claw tissues.For this study, two experiments were carried out at Waiboerhoeve research farm, Lelystad, the Netherlands. In the first experiment, effects of an alternative trimming technique were determined for mid-lactation cows kept in barns with either concrete or rubber topped slatted alley flooring. In the second experiment, effects of nocturnal restrictions in access to the cubicles with supposed maleficent effects on claw tissues were determined for heifers in the first three months of their first lactation. These experiments aimed to provide knowledge regarding the impact of claw shape, hard vs. soft flooring and restrictions of lying conditions on claw health and behaviour. To better understand the effects of lying and standing and of claw shape on claw health., a methodology was developed and applied to accurately measure load induced spatial deformation of lower hind limbs of cattle. The results enabled us to estimate the load induced compressive strain in the soft tissues between the sole horn layer and the distal phalanges, and to compare the strain distribution with the location of solehaemorrhages and sole ulcers.From the experiments, it can be concluded that concave hoof trimming is not beneficial for dairy cows kept on concrete flooring, although sole concavity can help to prevent overloading in the bulb area. Rubber flooring reduces the prevalence and seriousness of haemorrhagesand results in reduced growth and wear of the horn shoe. Reduced access to the cubicles does not necessarily impair claw health, but it is likely that long standing, particularly on hard flooring, is detrimental for claw health because of compressive strain that occurs in the soft tissues between the distal phalanges and the sole horn during standing. There is a similarity between the location of high mechanical strain and the location of sole horn lesions.
iv
Wijbrand OuweltjesEffects of mechanical loads on the deformation and health status of claws in dairy cows, 158 pages.
PhD thesis, Wageningen University, Wageningen, the Netherlands (2018)With references, with summaries in English and Dutch
ISBN: 978-94-6343-871-1DOI: https://doi.org/10.18174/448262
v
ABSTRACTLocomotion problems are identified as major welfare problem for dairy cattle. The majority of locomotion problems is caused by claw disorders, either infectious or non-infectious. Although severe claw disorders usually are manifested by lameness, clinical lameness can be regarded as the top of the iceberg of claw and locomotion problems. The so-called subclinical claw disorders do influence behaviour of the affected cows, but the changes are subtle and therefore difficult to observe. Improvement of claw health seems feasible in practice, but in general, improvement has not been realised in the last 25 years. In this thesis, only non-infectious claw disorders are considered. In general, this category of claw disorders is assumed to be caused by similar mechanism. Housing and management have a large influence on claw health, and particularly flooring in the walking areas and provisions for lying are elements of housing that are related with claw health. The main objective of this thesis is to improve understanding of the aetiology of non-infectious claw lesions, and in particular the effects of mechanical load on claw tissues.For this study, two experiments were carried out at Waiboerhoeve research farm, Lelystad, the Netherlands. In the first experiment, effects of an alternative trimming technique were determined for mid-lactation cows kept in barns with either concrete or rubber topped slatted alley flooring. In the second experiment, effects of nocturnal restrictions in access to the cubicles with supposed maleficent effects on claw tissues were determined for heifers in the first three months of their first lactation. These experiments aimed to provide knowledge regarding the impact of claw shape, hard vs. soft flooring and restrictions of lying conditions on claw health and behaviour. To better understand the effects of lying and standing and of claw shape on claw health., a methodology was developed and applied to accurately measure load induced spatial deformation of lower hind limbs of cattle. The results enabled us to estimate the load induced compressive strain in the soft tissues between the sole horn layer and the distal phalanges, and to compare the strain distribution with the location of solehaemorrhages and sole ulcers.From the experiments, it can be concluded that concave hoof trimming is not beneficial for dairy cows kept on concrete flooring, although sole concavity can help to prevent overloading in the bulb area. Rubber flooring reduces the prevalence and seriousness of haemorrhagesand results in reduced growth and wear of the horn shoe. Reduced access to the cubicles does not necessarily impair claw health, but it is likely that long standing, particularly on hard flooring, is detrimental for claw health because of compressive strain that occurs in the soft tissues between the distal phalanges and the sole horn during standing. There is a similarity between the location of high mechanical strain and the location of sole horn lesions.

vi vii
VOORWOORDIn de loop van 2007 vroeg mijn toenmalige afdelingshoofd Hans Spoolder me of ik niet zou willen promoveren, maar hij gaf al wel aan daar vooraf goed over na te denken. Hij was namelijk in samenspraak met Hans Hopster bezig om het onderwerp klauwgezondheid in te bedden in het zogenaamde kennisbasis onderzoek. In die tijd was ik bezig met de verwerking van het onderzoek naar een alternatieve bekapmethode. Daarin werd een aanbeveling uit het proefschrift van Rik van der Tol onderzocht om koeien hol te bekappen. Rik was echter inmiddels zelf mede als gevolg van een reorganisatie binnen het toenmalige ASG Veehouderij vertrokken naar Lely, maar is op de achtergrond wel betrokken gebleven bij dit onderzoek. Menno Holzhauer was nauw betrokken bij de beoordeling van de klauwen, en heb ik in die tijd leren kennen als een expert op het gebied van klauwgezondheid van koeien.Ik besloot om de uitdaging aan te gaan, in de veronderstelling dat ik binnen 4 tot 5 jaar mijn proefschrift zou kunnen afronden. De vraag van Hans is het begin geweest van een lange zoektocht naar een goede onderzoekslijn, waarbij ik behalve met Hans Hopster ook overleg heb gehad met Dörte Döpfer en Norbert Stockhofe. Uiteindelijk is besloten om het onderzoekte richten op effecten van mechanische belasting op klauwen. Omdat Dörte inmiddels was vertrokken naar Madison had Ron Bergevoet de taak op zich genomen om als begeleider te fungeren. Hij heeft er mede aan bijgedragen dat het projectplan voor het onderzoek naar effecten van ligbeperkingen uiteindelijk een DEC-goedkeuring heeft gekregen. Bij de uitvoering van dit onderzoek, waarbij we behoorlijk hebben geworsteld met nog niet goed functionerende IceTags, heeft net als bij het onderzoek naar bekapmethodes Joop van der Werf een belangrijke rol gespeeld. Klaas Frankena heeft bijgedragen aan de analyse van de klauwgezondheidsgegevens.We hadden inmiddels ook Johan van Leeuwen bereid gevonden om als promotor op te treden. Johan heeft er samen met Mees Muller op aangestuurd om een meer biomechanische benadering te kiezen. In dat kader heb ik ook in 2010 het vak biomechanica gevolgd met Mees als bezielende docent, en heb ik me weer even student kunnen wanen. Aanvankelijk was de ambitie om het eindige elementen model van Hinterhofer te verbeteren, maar dat is achteraf te ambitieus gebleken. In die tijd is het plan ontstaan om belastings-experimenten uit te gaan voeren met koeienpoten. Om die te kunnen uitvoeren is veel voorwerk nodig geweest. Daarbij is de inbreng van Sander Gussekloo en Kees Spoor naast die van Johan van Leeuwen van grote waarde geweest. Mede met dank aan Sanders goede contacten bij de Faculteit Diergeneeskunde in Utrecht gingen voor mij de deuren open bij zowel pathologie, fysiologie als diagnostische beeldvorming. Eric Karruppannan en Evert Janssen van de werkplaats hebben mede op basis van adviezen van Kees een prima werkende belastingsopstelling gemaakt. Sander heeft me op weg geholpen met het prepareren van koeienpoten voor de belastings-testen. Louis van den Boom heeft er samen met Henk van Dijk voor gezorgd dat de benodigde achterpoten werden losgemaakt van een aantal bij de sectiezaal aangeboden koeien en voor mij werden bewaard. Bovendien heb ik van Louis de ruimte gekregen om een aantal poten in de sectiezaal te prepareren toen ik bij fysiologie niet terecht kon wegens een verbouwing. Henk van Dijk heeft me voor het prepareren van de

viii
overige poten gastvrijheid en koffie geboden en zorgde er voor dat de poten tijdig uit de vriezer werden gehaald. Joost Holthof heeft mij bij radiologie op menige zaterdag op een fantastische manier geholpen met de belastings-testen en zorgde altijd dat de koffie ’s ochtends vroeg klaarstond. Verder ben ik George Voorhout zeer erkentelijk dat hij er voor gezorgd heeft dat wij gebruik konden maken van de faciliteiten van diagnostische beeldvorming. Dankzij de contacten van Kees Spoor met onderzoekers in Leiden heb ik bij het verwerken van de stereo röntgenfoto’s gebruik kunnen maken van de Model Based RSA software van Medis Specials. Op basis van door Kees gemaakte programma’s ben ik ook thuisgeraakt in het gebruik van Matlab bij verwerking van o.a. beeldmateriaal. Met het daadwerkelijk uitvoeren van de belastings-testen ben ik in juni 2012 gestart, de laatste testen zijn uitgevoerd in april 2013. Daarna heeft het verwerken en interpreteren van de verzamelde gegevens veel tijd in beslag genomen, en mede doordat ik inmiddels geen projecturen meer had om er aan te werken heeft de afronding lang geduurd. Ik heb mezelf echter altijd voorgehouden dat wie A heeft gezegd ook B moet zeggen, ofwel dat opgeven geen optie was. Dankzij Henk Schipper heb ik voor de verwerking ook vanuit huis gebruik kunnen maken van de EZO-PC waarop de MBRSA-software was geïnstalleerd, en werd de licentie verlengd toen deze dreigde te verlopen. Annemarie Hofs heeft al die jaren vele afspraken van mij met Johan, Sander en Kees gepland. Met de totstandkoming van dit proefschrift komt bijna een eind aan al het gepuzzel met gegevens van röntgenfoto’s, al moeten we er nog wel voor zorgen dat ook het laatste onderzoeks-hoofdstuk in dit proefschrift als paper wordt gepubliceerd.Zoals als uit bovenstaande blijkt hebben velen een bijdrage geleverd aan het tot stand komen van dit proefschrift en was het me alleen niet gelukt. Bij het schrijven van de inleiding heb ik dankbaar gebruik gemaakt van informatie van Gidi Smolders en Menno Holzhauer. Menno bedank ik bij deze ook voor het beschikbaar stellen van de foto’s van klauwaandoeningen. Mijn afdelingshoofden Hans Spoolder en Annemarie Rebel en mijn begeleiders Johan van Leeuwen, Sander Gussekloo en Kees Spoor bedank ik voor het vertrouwen wat ze ondanks de soms trage voortgang hebben gehad in een goede afloop. Zelf had ik daar af en toe wel mijn twijfels over! Mijn familie en vrienden bedank ik voor begrip dat ik krap in mijn tijd zat, ik hoop van harte dat dit de komende tijd anders wordt. Carien en Henk, ik vind het super dat jullie mijn paranimfen willen zijn.Ten slotte wil ik bij deze nogmaals Anjo van harte bedanken voor het geduld wat zij de afgelopen jaren heeft opgebracht, de hulp bij het opmaken van het proefschrift en het mij achter de broek zitten om dingen te regelen. Ik hoop de komende tijd mijn aandeel in de verzorging van ons huis en tuin weer recht te trekken, en meer tijd te hebben om samen van het leven te genieten.
ix
Table of ContentsPage
Chapter 1 General Introduction 1
Chapter 2 Effects of two trimming methods of dairy cattle on concrete or rubber-covered slatted floors 23
Chapter 3 Effects of flooring and restricted freestall access on behavior and claw health of dairy heifers 47
Chapter 4 A new technique using roentgen stereo photogrammetry to measure changes in the spatial conformation of bovine hind claws in response to external loads 73
Chapter 5 Spatial distribution of load induced soft tissue strain in cattle claws 91
Chapter 6 General Discussion 123
Summary 141
Samenvatting 147
Curriculum Vitae 153

x
CHAPTER 1
General Introduction

x
CHAPTER 1
General Introduction

1-2
General Introduction
3
1 GENERAL INTRODUCTION
1.1 Locomotion problems in farm animalsFor good welfare, animals should not experience pain or injuries and have ease of movement (Blokhuis et al., 2013). However, together with mastitis, foot and leg disorders are identified as a major welfare problem for dairy cattle (EFSA, 2009a). The aetiology of locomotion problems is species specific. In cattle, the majority of locomotion problems are caused by claw disorders (Logue et al., 1993; Murray et al., 1996; EFSA, 2009a; Frankena et al., 2009).For Dutch dairy farms, economic losses due to foot disorders range from €35 to €76 per cow per year on average (Bruijnis et al., 2010). In their calculations, Bruijnis et al. (2010) included the following elements: milk production losses, prolonged calving interval, labour of the farmer, trimming costs, veterinary costs, treatment costs, discarded milk and culling. In summary, reduction of locomotion problems in dairy cattle can result in both improved animal welfare and decreased economic losses.Numerous scientific studies have revealed figures for the occurrence of lameness in dairy cattle populations (Table 1).Table 1 shows that average prevalence of lameness is quite high in nearly all cattle populations investigated, and that the variation between farms is huge. EFSA (2009b) state that a lameness prevalence of up to 2% is achievable on well managed commercial farms, so for the majority of farms considerable improvements should be possible. To achieve this, the awareness amongst farmers should probably be increased and targeted prevention and intervention strategies for claw disorders should be available.

1
1-2
General Introduction
3
1 GENERAL INTRODUCTION
1.1 Locomotion problems in farm animalsFor good welfare, animals should not experience pain or injuries and have ease of movement (Blokhuis et al., 2013). However, together with mastitis, foot and leg disorders are identified as a major welfare problem for dairy cattle (EFSA, 2009a). The aetiology of locomotion problems is species specific. In cattle, the majority of locomotion problems are caused by claw disorders (Logue et al., 1993; Murray et al., 1996; EFSA, 2009a; Frankena et al., 2009).For Dutch dairy farms, economic losses due to foot disorders range from €35 to €76 per cow per year on average (Bruijnis et al., 2010). In their calculations, Bruijnis et al. (2010) included the following elements: milk production losses, prolonged calving interval, labour of the farmer, trimming costs, veterinary costs, treatment costs, discarded milk and culling. In summary, reduction of locomotion problems in dairy cattle can result in both improved animal welfare and decreased economic losses.Numerous scientific studies have revealed figures for the occurrence of lameness in dairy cattle populations (Table 1).Table 1 shows that average prevalence of lameness is quite high in nearly all cattle populations investigated, and that the variation between farms is huge. EFSA (2009b) state that a lameness prevalence of up to 2% is achievable on well managed commercial farms, so for the majority of farms considerable improvements should be possible. To achieve this, the awareness amongst farmers should probably be increased and targeted prevention and intervention strategies for claw disorders should be available.

Chapter 1
4
Table 1. Prevalences reported for lameness in dairy cattle.
Country Prevalence (%)1 Remarks5 Reference
USA (MN) 24.6 (3.3 – 57.3) (Espejo et al., 2006)
New Zealand 8.1 (1.2 – 36) Cows on pasture (Fabian et al., 2014)
Chile 28.7 / 33.22 small herds: cows on pasture (Tadich et al., 2010)
Canada 21 (0 – 69) (Solano et al., 2015)
Finland 23 (2 – 62) (Sarjokari et al., 2013)
UK 20.6 (2 – 53.9) (Clarkson et al., 1996)
D, AU 34 (0 – 81) (Dippel et al., 2009)
USA (WI) 21.1 ± 10.523.9 ± 10.73
15 cubicle barns, 15 tie stalls (Cook, 2003)
AUS (NSW) 18.9 (5 – 44.5) Cows on pasture (Ranjbar et al., 2016)
UK 36.8 (0 – 79.2) (Barker et al., 2010)
UK 16.2 (1.4 – 41)16.3 (4 – 30.5)19.3 (2.3 – 48.6)4
2*9 straw yards and2*31 cubicle barns
(Rutherford et al., 2009)
Sweden 5.1 (0 – 33) 86 tie stalls, 15 cubicle barns (Manske et al., 2002b)
Norway 7.6 (Fjeldaas et al., 2011)1 average with minimum and maximum herd level prevalence between brackets2 For small and large herds respectively (all animals with locomotion score >1 were classified as lame); small herds had cows on pasture3 mean ± sd for summer and winter respectively4 figures for autumn, winter and spring respectively5 if majority of cows are not housed in cubicle barns during the housing season
1.2 Locomotion system of cattleThe general anatomy of the locomotor apparatus of different species of mammals is similar (Dyce et al., 2009). The entire locomotor apparatus includes the trunk, the neck, the head and the limbs. The proximal parts of fore- and hind limbs differ markedly, and these limbs have different roles during locomotion. Injuries of the proximal parts are rare in cattle, but trauma and infection of their feet occur frequently (Dyce et al., 2009). Therefore, the following description will be limited to the distal part of the limbs. The anatomy of the distal ends of fore limbs is similar to that of the hind limbs (below the carpal and tarsal joint respectively), except that the metatarsal bones on average are 20% longer than the metacarpal bones (Dyce et al., 2009). The first metatarsal bone is regressed, the second and fifth are rudimentary and the third and fourth are fused. Only the third and fourth metatarsal bones have phalanges,
General Introduction
5
therefore cattle have two complete digits on each foot. This study concentrates on the hind limbs because these experience the majority of problems in cattle. Cattle have developed hoofs around the distal phalanges. These hoofs are composed of horn tissue (keratin), and are a specialised part of the integument. Under natural conditions growth and wear are in equilibrium in adult cows. A medio-lateral and sagittal section of the distal end of the bovine hind limb are given in Figure 1.
Figure 1. CT scan of medio-lateral and sagittal section of lateral digit of cattle hind limb.
1.3 Claw problems in cattleA number of distinct disorders is observed in cattle claws. In the past, lesion definitions lacked international standardisation, but since the recent publication of the ICAR claw health atlas (Egger-Danner et al., 2015) there is an international standard. No less than 24 different disorders are distinguished, but most of them are rare in the Netherlands. Therefore, the Dutch claw health recording scheme (“Digiklauw”) distinguishes only a limited number specifically (Table 2). Photos for further clarification are given in appendix 1. DD, IDHE, IP and to a lesser extent IH are considered to be infectious disorders, SH WLD and SU are considered as non-infectious disorders. More detailed descriptions of these disorders can be found in e.g. Holzhauer (2006).The reference method for assessment of claw health is to record abnormalities during trimming (Egger-Danner et al., 2015). However, claw trimming is laborious and not suited for day-to-day health management. Around 60% of Dutch dairy farms have their herds trimmed twice a year by professional claw trimmers (Holzhauer et al., 2008), and part of these farms participate in the Dutch national recording scheme for claw disorders. Prevalences of claw disorders calculated from these data and prevalence figures reported in a sample of scientific studies (Table 3) indicate that claw disorders are widespread.

1
Chapter 1
4
Table 1. Prevalences reported for lameness in dairy cattle.
Country Prevalence (%)1 Remarks5 Reference
USA (MN) 24.6 (3.3 – 57.3) (Espejo et al., 2006)
New Zealand 8.1 (1.2 – 36) Cows on pasture (Fabian et al., 2014)
Chile 28.7 / 33.22 small herds: cows on pasture (Tadich et al., 2010)
Canada 21 (0 – 69) (Solano et al., 2015)
Finland 23 (2 – 62) (Sarjokari et al., 2013)
UK 20.6 (2 – 53.9) (Clarkson et al., 1996)
D, AU 34 (0 – 81) (Dippel et al., 2009)
USA (WI) 21.1 ± 10.523.9 ± 10.73
15 cubicle barns, 15 tie stalls (Cook, 2003)
AUS (NSW) 18.9 (5 – 44.5) Cows on pasture (Ranjbar et al., 2016)
UK 36.8 (0 – 79.2) (Barker et al., 2010)
UK 16.2 (1.4 – 41)16.3 (4 – 30.5)19.3 (2.3 – 48.6)4
2*9 straw yards and2*31 cubicle barns
(Rutherford et al., 2009)
Sweden 5.1 (0 – 33) 86 tie stalls, 15 cubicle barns (Manske et al., 2002b)
Norway 7.6 (Fjeldaas et al., 2011)1 average with minimum and maximum herd level prevalence between brackets2 For small and large herds respectively (all animals with locomotion score >1 were classified as lame); small herds had cows on pasture3 mean ± sd for summer and winter respectively4 figures for autumn, winter and spring respectively5 if majority of cows are not housed in cubicle barns during the housing season
1.2 Locomotion system of cattleThe general anatomy of the locomotor apparatus of different species of mammals is similar (Dyce et al., 2009). The entire locomotor apparatus includes the trunk, the neck, the head and the limbs. The proximal parts of fore- and hind limbs differ markedly, and these limbs have different roles during locomotion. Injuries of the proximal parts are rare in cattle, but trauma and infection of their feet occur frequently (Dyce et al., 2009). Therefore, the following description will be limited to the distal part of the limbs. The anatomy of the distal ends of fore limbs is similar to that of the hind limbs (below the carpal and tarsal joint respectively), except that the metatarsal bones on average are 20% longer than the metacarpal bones (Dyce et al., 2009). The first metatarsal bone is regressed, the second and fifth are rudimentary and the third and fourth are fused. Only the third and fourth metatarsal bones have phalanges,
General Introduction
5
therefore cattle have two complete digits on each foot. This study concentrates on the hind limbs because these experience the majority of problems in cattle. Cattle have developed hoofs around the distal phalanges. These hoofs are composed of horn tissue (keratin), and are a specialised part of the integument. Under natural conditions growth and wear are in equilibrium in adult cows. A medio-lateral and sagittal section of the distal end of the bovine hind limb are given in Figure 1.
Figure 1. CT scan of medio-lateral and sagittal section of lateral digit of cattle hind limb.
1.3 Claw problems in cattleA number of distinct disorders is observed in cattle claws. In the past, lesion definitions lacked international standardisation, but since the recent publication of the ICAR claw health atlas (Egger-Danner et al., 2015) there is an international standard. No less than 24 different disorders are distinguished, but most of them are rare in the Netherlands. Therefore, the Dutch claw health recording scheme (“Digiklauw”) distinguishes only a limited number specifically (Table 2). Photos for further clarification are given in appendix 1. DD, IDHE, IP and to a lesser extent IH are considered to be infectious disorders, SH WLD and SU are considered as non-infectious disorders. More detailed descriptions of these disorders can be found in e.g. Holzhauer (2006).The reference method for assessment of claw health is to record abnormalities during trimming (Egger-Danner et al., 2015). However, claw trimming is laborious and not suited for day-to-day health management. Around 60% of Dutch dairy farms have their herds trimmed twice a year by professional claw trimmers (Holzhauer et al., 2008), and part of these farms participate in the Dutch national recording scheme for claw disorders. Prevalences of claw disorders calculated from these data and prevalence figures reported in a sample of scientific studies (Table 3) indicate that claw disorders are widespread.

Chapter 1
6
Table 2. Claw disorders most prevalent in the Netherlands. IDHE is a combination of two disorders, these two conditions are pooled together as one condition (Holzhauer, 2006).
Disorder Abbreviation Short description1
Digital dermatitis
DD Infection of the digital and/or interdigital skin with erosion, mostly painful ulcerations and/or chronic hyperkeratosis/proliferation.
Interdigital dermatitis
IDHE
All kind of mild dermatitis around the claws, that is not classified as digital dermatitis.
Heel horn erosion
Erosion of the bulbs, in severe cases typically V-shaped, possibly extending to the corium.
Interdigital phlegmon
IP Symmetric painful swelling of the foot commonly accompanied with odorous smell with sudden onset of lameness.
Interdigital hyperplasia
IH Interdigital growth of fibrous tissue.
Sole haemorrhage
SH Diffused and/or circumscribed red or yellow discoloration of the sole and/or white line.
White line disorder
WLD Separation of the white line with or without purulentExudation.
Sole ulcer SU Penetration through the sole horn exposing fresh or necrotic corium.
1 Literally copied from the ICAR claw health atlas (Egger-Danner et al., 2015)
General Introduction
7
Tabl
e 3.
Pre
vale
nce’
s re
port
ed f
or m
ajor
cla
w d
isor
ders
in
dair
y ca
ttle
(min
imum
and
max
imum
pr
eval
ence
at h
erd
leve
l bet
wee
n br
acke
ts).
Claw
diso
rder
Refe
renc
e
DD
IDH
EIH
SHW
LDSU
21.6
(1–
83)
39.5
(0 –
100)
6.1
(0 –
38)
38.7
(2–
95)
9.6
(1–
45)
4.9
(1–
30)
(Hol
zhau
er e
t al.,
200
6a)
2218
2618
9(D
e Ro
os a
nd H
olzh
auer
, 201
6)1
27.6
(2 –
73)
24.2
(3 –
92)
54.1
(10
–83
)(S
omer
s et a
l., 2
003)
2
24.4
(1 –
65)
48.8
(2 –
93)
41.2
(9 –
80)
(Som
ers e
t al.,
200
3)3
0 (0
–29
)5.
7 (0
–49
)28
.8 (3
–55
)(S
omer
s et a
l., 2
003)
4
29.3
(0 -
69)
30.0
(3 -
56)
22.8
(0 -
47)
8.6
(0 -
33)
(Man
ske
et a
l., 2
002b
)5
41.0
(0 -
91)
9.3
(0 –
60)
8.3
(0 -
65)
1 (0
-14
)7.
1 (0
-46
)1.
6 (0
-25
)4.
7 (0
-37
)(C
ram
er e
t al.,
200
8)6
22.9
(0 –
67)
8.4
(0 -
86)
11.1
(0 -
41)
7.0
(0 -
28)
9.3
(0 -
73)
(Cra
mer
et a
l., 2
008)
7
7.8
11.0
9.2
2.9
(Fje
ldaa
s et a
l., 2
011)
8
18.1
4.2
11.7
7.3
2.8
(0 -
>10)
(Sog
stad
et a
l., 2
005)
9
5.7
(0 -
40)
5.7
20.4
13.6
3.2
(0 -
>10)
7.9
(0 -
90)
1fig
ures
from
nat
iona
l rec
ordi
ng sc
hem
e, n
o ra
nge
pres
ente
d2
cow
s exp
osed
to c
oncr
ete
floor
ing,
pas
ture
per
iod
3co
ws e
xpos
ed to
con
cret
e flo
orin
g, h
ousi
ng p
erio
d 4
cow
s on
straw
yar
d fa
rms
5ID
HE:
cow
-leve
l pre
vale
nce
for
eros
ive
+ ve
rruc
ose
derm
atiti
s an
d he
el h
orn
eros
ion
resp
ectiv
ely ,
WLD
: com
bina
tion
of
fissu
res a
nd h
aem
orrh
ages
6tie
stal
ls7
cubi
cle
barn
s8
did
not
repo
rt ra
nge
but
conf
iden
ce i
nter
vals
of
estim
ates
; ID
HE:
der
mat
itis
and
heel
hor
n er
osio
n re
spec
tivel
y, W
LD:
com
bina
tion
of fi
ssur
es a
nd h
aem
orrh
ages
9fig
ures
for t
ie s
talls
resp
. fre
e sta
lls, I
DH
E: d
erm
atiti
san
d he
el h
orn
eros
ion
resp
ectiv
ely,
WLD
: com
bina
tion
of fi
ssur
es a
nd
haem
orrh
ages

1
Chapter 1
6
Table 2. Claw disorders most prevalent in the Netherlands. IDHE is a combination of two disorders, these two conditions are pooled together as one condition (Holzhauer, 2006).
Disorder Abbreviation Short description1
Digital dermatitis
DD Infection of the digital and/or interdigital skin with erosion, mostly painful ulcerations and/or chronic hyperkeratosis/proliferation.
Interdigital dermatitis
IDHE
All kind of mild dermatitis around the claws, that is not classified as digital dermatitis.
Heel horn erosion
Erosion of the bulbs, in severe cases typically V-shaped, possibly extending to the corium.
Interdigital phlegmon
IP Symmetric painful swelling of the foot commonly accompanied with odorous smell with sudden onset of lameness.
Interdigital hyperplasia
IH Interdigital growth of fibrous tissue.
Sole haemorrhage
SH Diffused and/or circumscribed red or yellow discoloration of the sole and/or white line.
White line disorder
WLD Separation of the white line with or without purulentExudation.
Sole ulcer SU Penetration through the sole horn exposing fresh or necrotic corium.
1 Literally copied from the ICAR claw health atlas (Egger-Danner et al., 2015)
General Introduction
7
Tabl
e 3.
Pre
vale
nce’
s re
port
ed f
or m
ajor
cla
w d
isor
ders
in
dair
y ca
ttle
(min
imum
and
max
imum
pr
eval
ence
at h
erd
leve
l bet
wee
n br
acke
ts).
Claw
diso
rder
Refe
renc
e
DD
IDH
EIH
SHW
LDSU
21.6
(1–
83)
39.5
(0 –
100)
6.1
(0 –
38)
38.7
(2–
95)
9.6
(1–
45)
4.9
(1–
30)
(Hol
zhau
er e
t al.,
200
6a)
2218
2618
9(D
e Ro
os a
nd H
olzh
auer
, 201
6)1
27.6
(2 –
73)
24.2
(3 –
92)
54.1
(10
–83
)(S
omer
s et a
l., 2
003)
2
24.4
(1 –
65)
48.8
(2 –
93)
41.2
(9 –
80)
(Som
ers e
t al.,
200
3)3
0 (0
–29
)5.
7 (0
–49
)28
.8 (3
–55
)(S
omer
s et a
l., 2
003)
4
29.3
(0 -
69)
30.0
(3 -
56)
22.8
(0 -
47)
8.6
(0 -
33)
(Man
ske
et a
l., 2
002b
)5
41.0
(0 -
91)
9.3
(0 –
60)
8.3
(0 -
65)
1 (0
-14
)7.
1 (0
-46
)1.
6 (0
-25
)4.
7 (0
-37
)(C
ram
er e
t al.,
200
8)6
22.9
(0 –
67)
8.4
(0 -
86)
11.1
(0 -
41)
7.0
(0 -
28)
9.3
(0 -
73)
(Cra
mer
et a
l., 2
008)
7
7.8
11.0
9.2
2.9
(Fje
ldaa
s et a
l., 2
011)
8
18.1
4.2
11.7
7.3
2.8
(0 -
>10)
(Sog
stad
et a
l., 2
005)
9
5.7
(0 -
40)
5.7
20.4
13.6
3.2
(0 -
>10)
7.9
(0 -
90)
1fig
ures
from
nat
iona
l rec
ordi
ng sc
hem
e, n
o ra
nge
pres
ente
d2
cow
s exp
osed
to c
oncr
ete
floor
ing,
pas
ture
per
iod
3co
ws e
xpos
ed to
con
cret
e flo
orin
g, h
ousi
ng p
erio
d 4
cow
s on
straw
yar
d fa
rms
5ID
HE:
cow
-leve
l pre
vale
nce
for
eros
ive
+ ve
rruc
ose
derm
atiti
s an
d he
el h
orn
eros
ion
resp
ectiv
ely ,
WLD
: com
bina
tion
of
fissu
res a
nd h
aem
orrh
ages
6tie
stal
ls7
cubi
cle
barn
s8
did
not
repo
rt ra
nge
but
conf
iden
ce i
nter
vals
of
estim
ates
; ID
HE:
der
mat
itis
and
heel
hor
n er
osio
n re
spec
tivel
y, W
LD:
com
bina
tion
of fi
ssur
es a
nd h
aem
orrh
ages
9fig
ures
for t
ie s
talls
resp
. fre
e sta
lls, I
DH
E: d
erm
atiti
san
d he
el h
orn
eros
ion
resp
ectiv
ely,
WLD
: com
bina
tion
of fi
ssur
es a
nd
haem
orrh
ages

Chapter 1
8
In the Netherlands, prevalence of IP at preventive trimming is very low (<1%), although it occurs regularly on Dutch dairy farms. Affected cows usually become clinically lame and are treated immediately (Holzhauer, 2018). Some general inferences can be drawn from Table 3. High prevalences of the claw disorders represented in Table 3 are reported for dairy farms in the Netherlands (Somers et al., 2003; Holzhauer et al., 2006a) and Sweden (Manske et al., 2002b). In both countries, there is a large variation between herds. Prevalences reported for Norway were consistently lower (Sogstad et al., 2005; Fjeldaas et al., 2011), but they also reported a high prevalence of corkscrewed claws. This indicates that the type of lesions differs between countries, which can have a variety of reasons (e.g. climate, housing, breed). Cows often had more than one disorder at the same time (Somers et al., 2003; Tadich et al., 2010). Several authors mentioned that more than 70% of all cows trimmed had at least one claw disorder, particularly for herds housed in cubicle barns with concrete alley flooring (Manske et al., 2002b; Somers, 2004; Sogstad et al., 2005; Holzhauer, 2006). The majority of claw disorders occurred in lateral digits of the hind claws (Smits et al., 1992; Barkema et al., 1994; Bergsten and Herlin, 1996; Sogstad et al., 2005; Cramer et al., 2008).In general, recognition of pain in cattle is difficult (O'Callaghan et al., 2003; Gleerup et al., 2018). Dyer et al. (2007) tested a method for objective measurement of pain in the bovine foot, and detected a substantial prevalence of subclinical pain in lateral claws of dairy cows. Although often cows diagnosed with claw disorders at trimming are not considered clinically lame (Smits et al., 1992; Manske et al., 2002b; Somers et al., 2003), it is assumed that claw disorders cause pain. For their impact on welfare, it is also relevant that they usually take a long time to heal (Frankena et al., 2009). Farmers tend to underestimate the occurrence of lameness in their herds considerably (Espejo et al., 2006; Rutherford et al., 2009; Leach et al., 2010; Fabian et al., 2014; Cutler et al., 2017).
1.4 Risk factors for claw and locomotion disordersAetiology of claw and locomotion disorders is complex and presumably multifactorial (EFSA, 2009a), and currently incompletely understood. Knowledge of important risk factors is required to be able to prevent claw lesions. Well-designed intervention studies are required to evaluate the effects of treatment and prevention strategies that are currently propagated (Potterton et al., 2012). In this section, current knowledge regarding risk factors for claw and locomotion disorders is reviewed. Parturition is a risk for non-infectious claw disorders, particularly for heifers (Alban et al., 1996; Leach et al., 1997; Whay et al., 1997; Webster, 2001). Knott et al. (2007) suggest this is linked with impaired biomechanical properties of horn tissue due to endocrine changes around parturition. Cows become more susceptible to lameness at increasing age (Espejo et al., 2006; Dippel et al., 2009; Rutherford et al., 2009; Sarjokari et al., 2013; Solano et al., 2015) and have higher prevalence of IDHE (Smits et al., 1992; Somers et al., 2005b), SU (Holzhauer et al., 2008) and WLD (Barker et al., 2009; Solano et al., 2015) but lower prevalence of DD (Somers et al., 2005a; Holzhauer et al., 2006b; Barker et al., 2009; Solano
General Introduction
9
et al., 2016). These effects of aging are not fully understood, but could be linked to behavioural changes.Several epidemiological studies have shown that animals with low body condition score (BCS) are at risk to become lame (Espejo et al., 2006; Dippel et al., 2009; Randall et al., 2015; Solano et al., 2015; Wilhelm et al., 2017). Bicalho and Oikonomou (2013) hypothesize that low BCS is linked with thin digital cushions, and thus impaired shock absorption. Newsome et al. (2017) indeed found a relationship between thin soft tissue layers (including the digital cushions) and the likelihood of sole lesions, but argue that the relationship is not caused by fat mobilization as is suggested in literature. Low BCS could also be caused by other health problems and/or difficulties in competing with herdmates.Certain individual and social behaviours may predispose cattle to become lame (Galindo et al., 2000). Cows that spent more time standing with their front feet in cubicles had significantly higher haemorrhage scores in all feet (Dippel et al., 2011). They argue that the behaviour caused the lesions, and not vice versa. On the other hand, changes in behaviour could also indicate the development or existence of lesions (EFSA, 2009a; Proudfoot et al., 2010; Westin et al., 2016; Weigele et al., 2018). The difference has practical relevance, because preventive measures should aim to minimize behaviour that predisposes cattle to become lame, but not behaviour that is a response to locomotion problems. In line with the study of EFSA (2009b), a distinction is made between the impact of nutrition, genetic selection, housing and management. Because management affects the extent of the other risk factors, it is presented as a surrounding green circle in Figure 2.
Figure 2. Schematic overview of risk factors that affect claw health. The green circle represents management effects.

1
Chapter 1
8
In the Netherlands, prevalence of IP at preventive trimming is very low (<1%), although it occurs regularly on Dutch dairy farms. Affected cows usually become clinically lame and are treated immediately (Holzhauer, 2018). Some general inferences can be drawn from Table 3. High prevalences of the claw disorders represented in Table 3 are reported for dairy farms in the Netherlands (Somers et al., 2003; Holzhauer et al., 2006a) and Sweden (Manske et al., 2002b). In both countries, there is a large variation between herds. Prevalences reported for Norway were consistently lower (Sogstad et al., 2005; Fjeldaas et al., 2011), but they also reported a high prevalence of corkscrewed claws. This indicates that the type of lesions differs between countries, which can have a variety of reasons (e.g. climate, housing, breed). Cows often had more than one disorder at the same time (Somers et al., 2003; Tadich et al., 2010). Several authors mentioned that more than 70% of all cows trimmed had at least one claw disorder, particularly for herds housed in cubicle barns with concrete alley flooring (Manske et al., 2002b; Somers, 2004; Sogstad et al., 2005; Holzhauer, 2006). The majority of claw disorders occurred in lateral digits of the hind claws (Smits et al., 1992; Barkema et al., 1994; Bergsten and Herlin, 1996; Sogstad et al., 2005; Cramer et al., 2008).In general, recognition of pain in cattle is difficult (O'Callaghan et al., 2003; Gleerup et al., 2018). Dyer et al. (2007) tested a method for objective measurement of pain in the bovine foot, and detected a substantial prevalence of subclinical pain in lateral claws of dairy cows. Although often cows diagnosed with claw disorders at trimming are not considered clinically lame (Smits et al., 1992; Manske et al., 2002b; Somers et al., 2003), it is assumed that claw disorders cause pain. For their impact on welfare, it is also relevant that they usually take a long time to heal (Frankena et al., 2009). Farmers tend to underestimate the occurrence of lameness in their herds considerably (Espejo et al., 2006; Rutherford et al., 2009; Leach et al., 2010; Fabian et al., 2014; Cutler et al., 2017).
1.4 Risk factors for claw and locomotion disordersAetiology of claw and locomotion disorders is complex and presumably multifactorial (EFSA, 2009a), and currently incompletely understood. Knowledge of important risk factors is required to be able to prevent claw lesions. Well-designed intervention studies are required to evaluate the effects of treatment and prevention strategies that are currently propagated (Potterton et al., 2012). In this section, current knowledge regarding risk factors for claw and locomotion disorders is reviewed. Parturition is a risk for non-infectious claw disorders, particularly for heifers (Alban et al., 1996; Leach et al., 1997; Whay et al., 1997; Webster, 2001). Knott et al. (2007) suggest this is linked with impaired biomechanical properties of horn tissue due to endocrine changes around parturition. Cows become more susceptible to lameness at increasing age (Espejo et al., 2006; Dippel et al., 2009; Rutherford et al., 2009; Sarjokari et al., 2013; Solano et al., 2015) and have higher prevalence of IDHE (Smits et al., 1992; Somers et al., 2005b), SU (Holzhauer et al., 2008) and WLD (Barker et al., 2009; Solano et al., 2015) but lower prevalence of DD (Somers et al., 2005a; Holzhauer et al., 2006b; Barker et al., 2009; Solano
General Introduction
9
et al., 2016). These effects of aging are not fully understood, but could be linked to behavioural changes.Several epidemiological studies have shown that animals with low body condition score (BCS) are at risk to become lame (Espejo et al., 2006; Dippel et al., 2009; Randall et al., 2015; Solano et al., 2015; Wilhelm et al., 2017). Bicalho and Oikonomou (2013) hypothesize that low BCS is linked with thin digital cushions, and thus impaired shock absorption. Newsome et al. (2017) indeed found a relationship between thin soft tissue layers (including the digital cushions) and the likelihood of sole lesions, but argue that the relationship is not caused by fat mobilization as is suggested in literature. Low BCS could also be caused by other health problems and/or difficulties in competing with herdmates.Certain individual and social behaviours may predispose cattle to become lame (Galindo et al., 2000). Cows that spent more time standing with their front feet in cubicles had significantly higher haemorrhage scores in all feet (Dippel et al., 2011). They argue that the behaviour caused the lesions, and not vice versa. On the other hand, changes in behaviour could also indicate the development or existence of lesions (EFSA, 2009a; Proudfoot et al., 2010; Westin et al., 2016; Weigele et al., 2018). The difference has practical relevance, because preventive measures should aim to minimize behaviour that predisposes cattle to become lame, but not behaviour that is a response to locomotion problems. In line with the study of EFSA (2009b), a distinction is made between the impact of nutrition, genetic selection, housing and management. Because management affects the extent of the other risk factors, it is presented as a surrounding green circle in Figure 2.
Figure 2. Schematic overview of risk factors that affect claw health. The green circle represents management effects.

Chapter 1
10
1.4.1 NUTRITION AND GENETICSNutrition has a major impact on the development of laminitis in horses (Geor, 2010). It has long been assumed that SH and SU in cattle are provoked by a similar inflammatory process (Nocek, 1997), but for dairy cattle this was questioned by Singh et al. (1992), Lischer et al. (2002) and Knott et al. (2007) because they did not observe inflammatory changes coinciding with sole haemorrhages. Nutrition can provoke laminitis in dairy cattle (Danscher et al., 2009), and severely imbalanced feeding with increased non-fibre carbohydrates is associated with increased lameness (Lean et al., 2013). However, such impact of nutrition requires extreme diets. Offer et al. (2004) attempted to formulate concentrate supplements that promote claw health, but did not find effects of concentrate composition. Although in general positive effects of biotin supplementation on claw health are reported, they are not well quantified (Lean and Rabiee, 2011). In line with this, EFSA (2009b) concluded that in cattle nutrition risks are mainly related to transition feeding, but are low compared to housing and management risks.Selection has changed the form and size of cows and therefore has increased their spatial requirements, and may have increased vulnerability for mechanical impacts (EFSA, 2009a).Holstein cows usually show higher prevalence of claw and locomotion problems compared with other dairy cattle breeds (Alban et al., 1996; Vaarst et al., 1998; Holzhauer et al., 2006b; Barker et al., 2010; Sarjokari et al., 2013). The breed is specialised in high milk yield, but currently the breeding goal of most breeding organisations also include traits such as health, longevity and fertility. Quantitative genetics has revealed that claw health has a heritable component and prevalence of claw disorders can be reduced by selection (Van der Linde et al., 2010), which is possible nowadays because breeding values are available.
1.4.2 HOUSING AND PASTURENumerous studies have shown beneficial effects of grazing on claw health and locomotion (Somers et al., 2005a, b; Haskell et al., 2006; Hernandez-Mendo et al., 2007; Olmos et al., 2009; Rutherford et al., 2009; Barker et al., 2010; De Vries, 2013; Armbrecht et al., 2018).Several studies have reported considerably better claw health for cows housed in straw yards (Webster, 2001; Somers et al., 2003; Haskell et al., 2006; Rutherford et al., 2009; Smolders, 2018) or bedded pack barns (Solano et al., 2016; Smolders, 2018) compared with cows housed in cubicle barns. Bedded pack barns are a loose housing system characterised by a relatively large open area where cows can stand and rest and where the bedding is aerated daily (Galama, 2011). The majority of Dutch dairy cows is, at least for a part of the year, housed in cubicle barns because straw yards have other disadvantages (udder health, cost of straw and labour) and bedded pack barns are still in development (Galama, 2011). Impact of inadequate care and monitoring of foot health and hygiene is twice as big for cubicle and tie stalls compared with straw yards and pasture (EFSA, 2009b). The quality of handling of the animals by the herdsman can affect claw health both for grazing herds (Ranjbar et al., 2016)and for housed cattle (Solano et al., 2015). Inadequate flooring in walking areas, poor cubicle
General Introduction
11
design and inadequate bedding are identified as main risk factors for cubicle housing (EFSA, 2009a). These risks are discussed in the next subsections.
Flooring in walking areas
Flooring of alleys in dairy cattle barns is usually made of concrete, which compared to pasture and straw yards provides a hard walking surface. Dairy cows generally prefer soft rubber for walking and standing instead of concrete flooring (Telezhenko et al., 2007). Cows stood for longer on a rubber floor than on hard flooring, and had improved locomotion (Haufe et al., 2009). Rubber matting on alley flooring could reduce lameness prevalence (Chapinal et al., 2013) and prevent loss of sole concavity (Telezhenko et al., 2009), which is assumed to have beneficial effects on load distribution in the claw-floor interface (Van der Tol, 2004; Telezhenko et al., 2008). Thin soles resulting from abrasive flooring are a risk factor for SU and heel and toe ulcers (Sanders et al., 2009). Indications have been found that cows housed on concrete flooring are more affected by chronic inflammation compared to those housedon rubber flooring (Eicher et al., 2013). Numerous studies (Vokey et al., 2001; Vanegas et al., 2006; Kremer et al., 2007; Fjeldaas et al., 2011) have indicated concrete flooring as a risk factor for claw disorders, particularly those that are non-infectious. However, higher prevalences of infectious disorders on rubber flooring have also been reported (Kremer et al., 2007), which is probably related to poorer hygiene of rubber topped flooring. Soft alley flooring combined with uncomfortable stalls may result in animals lying on alley floors (Vokey et al., 2001).Several studies investigated differences between slatted and solid floors (floors with and without notches for removal of manure and urine), but impact on claw health and locomotion was ambiguous (Somers et al., 2003; Fjeldaas et al., 2011), despite the increase in mechanical peak load calculated for slatted flooring (Hinterhofer et al., 2006). This is probably linked with manure removal and floor cleaning, which are influenced by management. The use of automatic scrapers was identified as risk factor for lameness (Barker et al., 2010), and higher frequency of alley scraping coincided with higher prevalence of SU (Cramer et al., 2009).These effects of scraping are not fully understood, but frequent scraping can make floor surfaces slippery. Dirty alley flooring is a risk factor for infectious claw disorders, but also causes slipperiness (Phillips and Morris, 2000; Telezhenko et al., 2017). This is a risk factor for lameness (Sarjokari et al., 2013; Solano et al., 2015), but also will affect locomotion of cows with sound claws. Moreover, wet slurry on the alleys softens horn, which predisposes them for claw horn lesions (Borderas et al., 2004). Narrow alleys (<320 cm) next to the feeding table (Sarjokari et al., 2013) and cows pushing each other or turning sharply near the parlour entrance or exit (Barker et al., 2010) were identified as risk factors for lameness.
Bedding and cubicle design
The following lying circumstances at pasture are generally considered as the gold standard:sufficient space, clean and comfortable surface that provides grip and no construction that is hampering lying down and getting up movements. Numerous studies have shown relationships between bedding of cubicles and claw health and locomotion of housed cattle. Lameness prevalence was lower for farms with soft mats, mattresses or deep bedding in the

1
Chapter 1
10
1.4.1 NUTRITION AND GENETICSNutrition has a major impact on the development of laminitis in horses (Geor, 2010). It has long been assumed that SH and SU in cattle are provoked by a similar inflammatory process (Nocek, 1997), but for dairy cattle this was questioned by Singh et al. (1992), Lischer et al. (2002) and Knott et al. (2007) because they did not observe inflammatory changes coinciding with sole haemorrhages. Nutrition can provoke laminitis in dairy cattle (Danscher et al., 2009), and severely imbalanced feeding with increased non-fibre carbohydrates is associated with increased lameness (Lean et al., 2013). However, such impact of nutrition requires extreme diets. Offer et al. (2004) attempted to formulate concentrate supplements that promote claw health, but did not find effects of concentrate composition. Although in general positive effects of biotin supplementation on claw health are reported, they are not well quantified (Lean and Rabiee, 2011). In line with this, EFSA (2009b) concluded that in cattle nutrition risks are mainly related to transition feeding, but are low compared to housing and management risks.Selection has changed the form and size of cows and therefore has increased their spatial requirements, and may have increased vulnerability for mechanical impacts (EFSA, 2009a).Holstein cows usually show higher prevalence of claw and locomotion problems compared with other dairy cattle breeds (Alban et al., 1996; Vaarst et al., 1998; Holzhauer et al., 2006b; Barker et al., 2010; Sarjokari et al., 2013). The breed is specialised in high milk yield, but currently the breeding goal of most breeding organisations also include traits such as health, longevity and fertility. Quantitative genetics has revealed that claw health has a heritable component and prevalence of claw disorders can be reduced by selection (Van der Linde et al., 2010), which is possible nowadays because breeding values are available.
1.4.2 HOUSING AND PASTURENumerous studies have shown beneficial effects of grazing on claw health and locomotion (Somers et al., 2005a, b; Haskell et al., 2006; Hernandez-Mendo et al., 2007; Olmos et al., 2009; Rutherford et al., 2009; Barker et al., 2010; De Vries, 2013; Armbrecht et al., 2018).Several studies have reported considerably better claw health for cows housed in straw yards (Webster, 2001; Somers et al., 2003; Haskell et al., 2006; Rutherford et al., 2009; Smolders, 2018) or bedded pack barns (Solano et al., 2016; Smolders, 2018) compared with cows housed in cubicle barns. Bedded pack barns are a loose housing system characterised by a relatively large open area where cows can stand and rest and where the bedding is aerated daily (Galama, 2011). The majority of Dutch dairy cows is, at least for a part of the year, housed in cubicle barns because straw yards have other disadvantages (udder health, cost of straw and labour) and bedded pack barns are still in development (Galama, 2011). Impact of inadequate care and monitoring of foot health and hygiene is twice as big for cubicle and tie stalls compared with straw yards and pasture (EFSA, 2009b). The quality of handling of the animals by the herdsman can affect claw health both for grazing herds (Ranjbar et al., 2016)and for housed cattle (Solano et al., 2015). Inadequate flooring in walking areas, poor cubicle
General Introduction
11
design and inadequate bedding are identified as main risk factors for cubicle housing (EFSA, 2009a). These risks are discussed in the next subsections.
Flooring in walking areas
Flooring of alleys in dairy cattle barns is usually made of concrete, which compared to pasture and straw yards provides a hard walking surface. Dairy cows generally prefer soft rubber for walking and standing instead of concrete flooring (Telezhenko et al., 2007). Cows stood for longer on a rubber floor than on hard flooring, and had improved locomotion (Haufe et al., 2009). Rubber matting on alley flooring could reduce lameness prevalence (Chapinal et al., 2013) and prevent loss of sole concavity (Telezhenko et al., 2009), which is assumed to have beneficial effects on load distribution in the claw-floor interface (Van der Tol, 2004; Telezhenko et al., 2008). Thin soles resulting from abrasive flooring are a risk factor for SU and heel and toe ulcers (Sanders et al., 2009). Indications have been found that cows housed on concrete flooring are more affected by chronic inflammation compared to those housedon rubber flooring (Eicher et al., 2013). Numerous studies (Vokey et al., 2001; Vanegas et al., 2006; Kremer et al., 2007; Fjeldaas et al., 2011) have indicated concrete flooring as a risk factor for claw disorders, particularly those that are non-infectious. However, higher prevalences of infectious disorders on rubber flooring have also been reported (Kremer et al., 2007), which is probably related to poorer hygiene of rubber topped flooring. Soft alley flooring combined with uncomfortable stalls may result in animals lying on alley floors (Vokey et al., 2001).Several studies investigated differences between slatted and solid floors (floors with and without notches for removal of manure and urine), but impact on claw health and locomotion was ambiguous (Somers et al., 2003; Fjeldaas et al., 2011), despite the increase in mechanical peak load calculated for slatted flooring (Hinterhofer et al., 2006). This is probably linked with manure removal and floor cleaning, which are influenced by management. The use of automatic scrapers was identified as risk factor for lameness (Barker et al., 2010), and higher frequency of alley scraping coincided with higher prevalence of SU (Cramer et al., 2009).These effects of scraping are not fully understood, but frequent scraping can make floor surfaces slippery. Dirty alley flooring is a risk factor for infectious claw disorders, but also causes slipperiness (Phillips and Morris, 2000; Telezhenko et al., 2017). This is a risk factor for lameness (Sarjokari et al., 2013; Solano et al., 2015), but also will affect locomotion of cows with sound claws. Moreover, wet slurry on the alleys softens horn, which predisposes them for claw horn lesions (Borderas et al., 2004). Narrow alleys (<320 cm) next to the feeding table (Sarjokari et al., 2013) and cows pushing each other or turning sharply near the parlour entrance or exit (Barker et al., 2010) were identified as risk factors for lameness.
Bedding and cubicle design
The following lying circumstances at pasture are generally considered as the gold standard:sufficient space, clean and comfortable surface that provides grip and no construction that is hampering lying down and getting up movements. Numerous studies have shown relationships between bedding of cubicles and claw health and locomotion of housed cattle. Lameness prevalence was lower for farms with soft mats, mattresses or deep bedding in the

Chapter 1
12
cubicles instead of concrete (De Vries, 2013), for deep bedded stalls vs. mattress stalls (Dippel et al., 2009; Ito et al., 2010), for stalls with sand or dirt stall base vs. concrete or rubber stall base (Solano et al., 2015), and for cubicle barns with sand surfaces vs. non-sand surfaces (Vokey et al., 2001; Cook, 2003; Espejo et al., 2006). Sparse bedding was a risk factor for SU (Barker et al., 2009) and ≤2 cm bedding was related with a higher prevalence of lameness (Solano et al., 2015).Another factor related to lying is dimensioning of the cubicles. In practice cubicles are often too short and not properly adjusted to accommodate cows (Faull et al., 1996; Sarjokari et al., 2013). Presence of head lunge impediments or too short neck rail-curb diagonals coincided with more lameness (Dippel et al., 2009). Long and wide cubicles reduced the risk of DD (Somers et al., 2005a). Longer lying times and better claw health were reported for heifers kept in housing with more spacious cubicles with rubber mats vs smaller cubicles without bedding (Leonard et al., 1994). It is not clear to what extent these two factors contributed to the differences that were observed. Overstocking, with more cows than cubicles, increased competition for stalls and reduced lying time (Fregonesi et al., 2007; Winckler et al., 2015).Although these studies did not report effects on claw health, reduced lying time resulting from overstocking could exacerbate the development of claw lesions (Leonard et al., 1996).However, the relationship between lying time and claw health could be more complicated. Hernandez-Mendo et al. (2007) reported that a 4-wk period on pasture resulted in improved locomotion, despite that grazing cows had reduced lying times (10.9 vs. 12.3 h/d) and a larger number of lying bouts (15.3 vs. 12.2) than cows kept indoors.
1.5 General objectivesClaw disorders are widespread amongst dairy cattle, despite a large amount of research, application of measures such as preventive trimming and use of footbaths and governmental policies to stimulate investment in animal welfare friendly housing. They not only seriously impair animal welfare and cause lameness, but also cause considerable economic losses for the farmer. Improvement of claw health seems feasible in practice, because there is a huge variation between farms in prevalence of lameness and claw disorders. One of the practical difficulties is that claw health monitoring is laborious and only carried out infrequently (at herd trimming) or not at all. Locomotion scoring as a more practical tool is usually not done systematically, and the majority of claw lesions does not cause clear gait change (Manske et al., 2002b; Fjeldaas et al., 2006).Results from epidemiological studies and experiments comparing treatments have provided knowledge about relationships, but have also raised questions about causality. Particularly housing related parameters are identified as important herd level risk factors. Soft alley flooring in cubicle barns has beneficial effects on non-infectious claw disorders, and indications are found that they provide more comfort. Overall effects of flooring on claw health may be mitigated by impaired hygiene. Unlimited availability of spacious cubicles with soft bedding in general coincides with better claw health and less lameness. Both hardness of alley flooring and cubicle bedding and dimensioning of cubicles affect lying and
General Introduction
13
standing behaviour. More standing in itself will not cause increased peak loads (Van der Tol, 2004) but can prolong episodes of uninterrupted moderate loading, particularly when more standing coincides with increased bout lengths. Events such as displacements could go together with short episodes of high peak loads. Cow level risk factors, such as parturition and BCS could also be linked with mechanical load through behavioural or physiological effects (Knott et al., 2007; Bicalho and Oikonomou, 2013).Because claw disorders have a multifactorial aetiology that currently is far from understood, there is a huge variety of interventions that are applied and propagated, often with limited success. Most of the measures lack proper scientific evaluation. Although there might be measures that reduce prevalence of both infectious and non-infectious disorders, it is likely that these two main categories of claw disorders require specific approaches. Moreover, costly interventions such as improvements of housing circumstances are often not applied because their effects are insufficiently clear beforehand. This lack of understanding also hampers the development of improved housing systems that really combine favourable environmental qualities with improved animal welfare provisions.The main objective of this thesis is to improve understanding of the aetiology of non-infectious claw lesions, and in particular the effects of mechanical load on claw tissues. This can contribute to better understanding of links between behaviour and claw health and enable more tailored preventive measures particularly in relation to housing.
1.6 Outline of the thesis.Beneficial effects of pasture for claw health and locomotion are generally acknowledged, and straw yards have consistently shown significantly better claw health than cubicle barns. Both pasture and straw yards have considerably softer surfaces than conventional cubicle barns with either solid or slatted concrete flooring. Improved pressure distribution on soft flooring is suggested to be an important cause for their favourable effects (Van der Tol, 2004). There is some evidence of beneficial effects of softer flooring in the alleys for claw health, and these are to some extent propagated by scientists and farm advisors. However, also concerns are raised regarding the implementation of soft flooring. A reduction in wear resulting from soft flooring could increase the need for trimming and could result in more animals lying in the alleys.On the majority of farms claw trimming is regularly applied to correct claw shape and prevent overloading (Manske et al., 2002a). From studies on claw-floor interactions that showed thatvulnerable areas of the sole were heavily loaded, it was hypothesized that the current routine trimming technique is not optimal (Van der Tol, 2004). Because soft flooring is expected to interact with the development of claw shape, an experiment was performed to compare the effects of an alternative concave trimming method on claw health and locomotion with the standard Dutch method (Chapter 2).Although flooring provides the contact surface for the claws, it is becoming clear that non-infectious claw disorders also are influenced by lying conditions, and that flooring and lying conditions are interacting dynamically. In practice, lying comfort can be compromised by a

1
Chapter 1
12
cubicles instead of concrete (De Vries, 2013), for deep bedded stalls vs. mattress stalls (Dippel et al., 2009; Ito et al., 2010), for stalls with sand or dirt stall base vs. concrete or rubber stall base (Solano et al., 2015), and for cubicle barns with sand surfaces vs. non-sand surfaces (Vokey et al., 2001; Cook, 2003; Espejo et al., 2006). Sparse bedding was a risk factor for SU (Barker et al., 2009) and ≤2 cm bedding was related with a higher prevalence of lameness (Solano et al., 2015).Another factor related to lying is dimensioning of the cubicles. In practice cubicles are often too short and not properly adjusted to accommodate cows (Faull et al., 1996; Sarjokari et al., 2013). Presence of head lunge impediments or too short neck rail-curb diagonals coincided with more lameness (Dippel et al., 2009). Long and wide cubicles reduced the risk of DD (Somers et al., 2005a). Longer lying times and better claw health were reported for heifers kept in housing with more spacious cubicles with rubber mats vs smaller cubicles without bedding (Leonard et al., 1994). It is not clear to what extent these two factors contributed to the differences that were observed. Overstocking, with more cows than cubicles, increased competition for stalls and reduced lying time (Fregonesi et al., 2007; Winckler et al., 2015).Although these studies did not report effects on claw health, reduced lying time resulting from overstocking could exacerbate the development of claw lesions (Leonard et al., 1996).However, the relationship between lying time and claw health could be more complicated. Hernandez-Mendo et al. (2007) reported that a 4-wk period on pasture resulted in improved locomotion, despite that grazing cows had reduced lying times (10.9 vs. 12.3 h/d) and a larger number of lying bouts (15.3 vs. 12.2) than cows kept indoors.
1.5 General objectivesClaw disorders are widespread amongst dairy cattle, despite a large amount of research, application of measures such as preventive trimming and use of footbaths and governmental policies to stimulate investment in animal welfare friendly housing. They not only seriously impair animal welfare and cause lameness, but also cause considerable economic losses for the farmer. Improvement of claw health seems feasible in practice, because there is a huge variation between farms in prevalence of lameness and claw disorders. One of the practical difficulties is that claw health monitoring is laborious and only carried out infrequently (at herd trimming) or not at all. Locomotion scoring as a more practical tool is usually not done systematically, and the majority of claw lesions does not cause clear gait change (Manske et al., 2002b; Fjeldaas et al., 2006).Results from epidemiological studies and experiments comparing treatments have provided knowledge about relationships, but have also raised questions about causality. Particularly housing related parameters are identified as important herd level risk factors. Soft alley flooring in cubicle barns has beneficial effects on non-infectious claw disorders, and indications are found that they provide more comfort. Overall effects of flooring on claw health may be mitigated by impaired hygiene. Unlimited availability of spacious cubicles with soft bedding in general coincides with better claw health and less lameness. Both hardness of alley flooring and cubicle bedding and dimensioning of cubicles affect lying and
General Introduction
13
standing behaviour. More standing in itself will not cause increased peak loads (Van der Tol, 2004) but can prolong episodes of uninterrupted moderate loading, particularly when more standing coincides with increased bout lengths. Events such as displacements could go together with short episodes of high peak loads. Cow level risk factors, such as parturition and BCS could also be linked with mechanical load through behavioural or physiological effects (Knott et al., 2007; Bicalho and Oikonomou, 2013).Because claw disorders have a multifactorial aetiology that currently is far from understood, there is a huge variety of interventions that are applied and propagated, often with limited success. Most of the measures lack proper scientific evaluation. Although there might be measures that reduce prevalence of both infectious and non-infectious disorders, it is likely that these two main categories of claw disorders require specific approaches. Moreover, costly interventions such as improvements of housing circumstances are often not applied because their effects are insufficiently clear beforehand. This lack of understanding also hampers the development of improved housing systems that really combine favourable environmental qualities with improved animal welfare provisions.The main objective of this thesis is to improve understanding of the aetiology of non-infectious claw lesions, and in particular the effects of mechanical load on claw tissues. This can contribute to better understanding of links between behaviour and claw health and enable more tailored preventive measures particularly in relation to housing.
1.6 Outline of the thesis.Beneficial effects of pasture for claw health and locomotion are generally acknowledged, and straw yards have consistently shown significantly better claw health than cubicle barns. Both pasture and straw yards have considerably softer surfaces than conventional cubicle barns with either solid or slatted concrete flooring. Improved pressure distribution on soft flooring is suggested to be an important cause for their favourable effects (Van der Tol, 2004). There is some evidence of beneficial effects of softer flooring in the alleys for claw health, and these are to some extent propagated by scientists and farm advisors. However, also concerns are raised regarding the implementation of soft flooring. A reduction in wear resulting from soft flooring could increase the need for trimming and could result in more animals lying in the alleys.On the majority of farms claw trimming is regularly applied to correct claw shape and prevent overloading (Manske et al., 2002a). From studies on claw-floor interactions that showed thatvulnerable areas of the sole were heavily loaded, it was hypothesized that the current routine trimming technique is not optimal (Van der Tol, 2004). Because soft flooring is expected to interact with the development of claw shape, an experiment was performed to compare the effects of an alternative concave trimming method on claw health and locomotion with the standard Dutch method (Chapter 2).Although flooring provides the contact surface for the claws, it is becoming clear that non-infectious claw disorders also are influenced by lying conditions, and that flooring and lying conditions are interacting dynamically. In practice, lying comfort can be compromised by a

Chapter 1
14
range of factors, such as inappropriate cubicle dimensions, hard bedding but also because of limited availability. Particularly herds that are being expanded can be housed in barns where cubicle availability is limited by overstocking. This presumably invokes long standing times and long standing bouts in particular. Because suboptimal lying conditions are expected to be more detrimental on hard flooring than on soft flooring, an experiment aimed to quantify effects of combinations of hard and soft flooring and restricted vs. unrestricted free stall access on behaviour and claw health was performed (Chapter 3).Studies on claw-floor interactions have provided information on load distribution under the soles. Although it was hypothesised that claw disorders result from mechanical damage to the horn itself (Van der Tol, 2004), it seems more likely that mechanical load affects the inner tissues and particularly the soft tissues under the distal phalanx. This could better explain the complex interaction between the level of load and the duration of load. We developed a methodology to accurately measure load-induced deformations in the lower hind limbs of cattle (Chapter 4). We applied a range of loadings to dissected hind limbs to determine the effects on spatial deformation inside the hooves and the displacements of the middle and proximal phalanges. The results of the application of this method enabled us to estimate the compressive strain in the soft tissues between the sole horn layer and the distal phalanges. Moreover, we could compare the strain distribution with the location of sole heamorrhages and sole ulcers (Chapter 5). Finally the results of the studies are discussed, put in perspective, and linked with the literature reviewed in the introduction of the thesis (Chapter 6).
General Introduction
15
REFERENCESAlban, L., Agger, J.F., Lawson, L.G., 1996. Lameness in tied Danish dairy cattle: the possible
influence of housing systems, management, milk yield, and prior incidents of lameness. Preventive Veterinary Medicine 29, 135-149.
Armbrecht, L., Lambertz, C., Albers, D., Gauly, M., 2018. Does access to pasture affect claw condition and health in dairy cows? Veterinary Record 182, 79-79.
Barkema, H.W., Westrik, J.D., van Keulen, K.A.S., Schukken, Y.H., Brand, A., 1994. The effects of lameness on reproductive performance, milk production and culling in Dutch dairy farms. Preventive Veterinary Medicine 20, 249-259.
Barker, Z.E., Amory, J.R., Wright, J.L., Mason, S.A., Blowey, R.W., Green, L.E., 2009. Risk factors for increased rates of sole ulcers, white line disease, and digital dermatitis in dairy cattle from twenty-seven farms in England and Wales. Journal of Dairy Science 92, 1971-1978.
Barker, Z.E., Leach, K.A., Whay, H.R., Bell, N.J., Main, D.C.J., 2010. Assessment of lameness prevalence and associated risk factors in dairy herds in England and Wales. Journal of Dairy Science 93, 932-941.
Bergsten, C., Herlin, A.H., 1996. Sole haemorrhages and heel horn erosion in dairy cows: The influence of housing system on their prevalence and severity. Acta Veterinaria Scandinavica 37, 395-408.
Bicalho, R.C., Oikonomou, G., 2013. Control and prevention of lameness associated with claw lesions in dairy cows. Livestock Science 156, 96-105.
Blokhuis, H., Miele, M., Veissier, I., Jones, B., 2013. Improving farm animal welfare. Science and society working together: the Welfare Quality approach. Wageningen Academic Publishers, Wageningen.
Borderas, T.F., Pawluczuk, B., de Passille, A.M., Rushen, J., 2004. Claw hardness of dairy cows: Relationship to water content and claw lesions. Journal of Dairy Science 87, 2085-2093.
Bruijnis, M.R.N., Hogeveen, H., Stassen, E.N., 2010. Assessing economic consequences of foot disorders in dairy cattle using a dynamic stochastic simulation model. Journal of Dairy Science 93, 2419-2432.
Chapinal, N., Barrientos, A.K., von Keyserlingk, M.A.G., Galo, E., Weary, D.M., 2013. Herd-level risk factors for lameness in freestall farms in the northeastern United States and California. Journal of Dairy Science 96, 318-328.
Clarkson, M.J., Downham, D.Y., Faull, W.B., Hughes, J.W., Manson, F.J., Merritt, J.B., Murray, R.D., Russel, W.B., Sutherst, J.E., Ward, W.R., 1996. Incidence and prevalence of lameness in dairy cattle. Veterinary Record 138, 563-567.
Cook, N.B., 2003. Prevalence of lameness among dairy cattle in Wisconsin as a function of housing type and stall surface. Journal of the American Veterinary Medical Association 223, 1324-1328.

1
Chapter 1
14
range of factors, such as inappropriate cubicle dimensions, hard bedding but also because of limited availability. Particularly herds that are being expanded can be housed in barns where cubicle availability is limited by overstocking. This presumably invokes long standing times and long standing bouts in particular. Because suboptimal lying conditions are expected to be more detrimental on hard flooring than on soft flooring, an experiment aimed to quantify effects of combinations of hard and soft flooring and restricted vs. unrestricted free stall access on behaviour and claw health was performed (Chapter 3).Studies on claw-floor interactions have provided information on load distribution under the soles. Although it was hypothesised that claw disorders result from mechanical damage to the horn itself (Van der Tol, 2004), it seems more likely that mechanical load affects the inner tissues and particularly the soft tissues under the distal phalanx. This could better explain the complex interaction between the level of load and the duration of load. We developed a methodology to accurately measure load-induced deformations in the lower hind limbs of cattle (Chapter 4). We applied a range of loadings to dissected hind limbs to determine the effects on spatial deformation inside the hooves and the displacements of the middle and proximal phalanges. The results of the application of this method enabled us to estimate the compressive strain in the soft tissues between the sole horn layer and the distal phalanges. Moreover, we could compare the strain distribution with the location of sole heamorrhages and sole ulcers (Chapter 5). Finally the results of the studies are discussed, put in perspective, and linked with the literature reviewed in the introduction of the thesis (Chapter 6).
General Introduction
15
REFERENCESAlban, L., Agger, J.F., Lawson, L.G., 1996. Lameness in tied Danish dairy cattle: the possible
influence of housing systems, management, milk yield, and prior incidents of lameness. Preventive Veterinary Medicine 29, 135-149.
Armbrecht, L., Lambertz, C., Albers, D., Gauly, M., 2018. Does access to pasture affect claw condition and health in dairy cows? Veterinary Record 182, 79-79.
Barkema, H.W., Westrik, J.D., van Keulen, K.A.S., Schukken, Y.H., Brand, A., 1994. The effects of lameness on reproductive performance, milk production and culling in Dutch dairy farms. Preventive Veterinary Medicine 20, 249-259.
Barker, Z.E., Amory, J.R., Wright, J.L., Mason, S.A., Blowey, R.W., Green, L.E., 2009. Risk factors for increased rates of sole ulcers, white line disease, and digital dermatitis in dairy cattle from twenty-seven farms in England and Wales. Journal of Dairy Science 92, 1971-1978.
Barker, Z.E., Leach, K.A., Whay, H.R., Bell, N.J., Main, D.C.J., 2010. Assessment of lameness prevalence and associated risk factors in dairy herds in England and Wales. Journal of Dairy Science 93, 932-941.
Bergsten, C., Herlin, A.H., 1996. Sole haemorrhages and heel horn erosion in dairy cows: The influence of housing system on their prevalence and severity. Acta Veterinaria Scandinavica 37, 395-408.
Bicalho, R.C., Oikonomou, G., 2013. Control and prevention of lameness associated with claw lesions in dairy cows. Livestock Science 156, 96-105.
Blokhuis, H., Miele, M., Veissier, I., Jones, B., 2013. Improving farm animal welfare. Science and society working together: the Welfare Quality approach. Wageningen Academic Publishers, Wageningen.
Borderas, T.F., Pawluczuk, B., de Passille, A.M., Rushen, J., 2004. Claw hardness of dairy cows: Relationship to water content and claw lesions. Journal of Dairy Science 87, 2085-2093.
Bruijnis, M.R.N., Hogeveen, H., Stassen, E.N., 2010. Assessing economic consequences of foot disorders in dairy cattle using a dynamic stochastic simulation model. Journal of Dairy Science 93, 2419-2432.
Chapinal, N., Barrientos, A.K., von Keyserlingk, M.A.G., Galo, E., Weary, D.M., 2013. Herd-level risk factors for lameness in freestall farms in the northeastern United States and California. Journal of Dairy Science 96, 318-328.
Clarkson, M.J., Downham, D.Y., Faull, W.B., Hughes, J.W., Manson, F.J., Merritt, J.B., Murray, R.D., Russel, W.B., Sutherst, J.E., Ward, W.R., 1996. Incidence and prevalence of lameness in dairy cattle. Veterinary Record 138, 563-567.
Cook, N.B., 2003. Prevalence of lameness among dairy cattle in Wisconsin as a function of housing type and stall surface. Journal of the American Veterinary Medical Association 223, 1324-1328.

Chapter 1
16
Cramer, G., Lissemore, K.D., Guard, C.L., Leslie, K.E., Kelton, D.F., 2008. Herd- and Cow-Level Prevalence of Foot Lesions in Ontario Dairy Cattle. Journal of Dairy Science 91, 3888-3895.
Cramer, G., Lissemore, K.D., Guard, C.L., Leslie, K.E., Kelton, D.F., 2009. Herd-level risk factors for seven different foot lesions in Ontario Holstein cattle housed in tie stalls or free stalls. Journal of Dairy Science 92, 1404-1411.
Cutler, J.H.H., Rushen, J., de Passillé, A.M., Gibbons, J., Orsel, K., Pajor, E., Barkema, H.W., Solano, L., Pellerin, D., Haley, D., Vasseur, E., 2017. Producer estimates of prevalence and perceived importance of lameness in dairy herds with tiestalls, freestalls, and automated milking systems. Journal of Dairy Science 100, 9871-9880.
Danscher, A.M., Enemark, J.M.D., Telezhenko, E., Capion, N., Ekstrøm, C.T., Thoefner, M.B., 2009. Oligofructose overload induces lameness in cattle. Journal of Dairy Science 92, 607-616.
De Roos, S., Holzhauer, M., 2016. Claw health recording in NL. Eurotier, November 2016, Hannover, Germany.
De Vries, M., 2013. Assuring dairy cattle welfare : towards efficient assessment and improvement. PhD thesis, Wageningen University, Wageningen, the Netherlands.
Dippel, S., Dolezal, M., Brenninkmeyer, C., Brinkmann, J., March, S., Knierim, U., Winckler, C., 2009. Risk factors for lameness in freestall-housed dairy cows across two breeds, farming systems, and countries. Journal of Dairy Science 92, 5476-5486.
Dippel, S., Tucker, C.B., Winckler, C., Weary, D.M., 2011. Effects of behaviour on the development of claw lesions in early lactation dairy cows. Applied Animal Behaviour Science 134, 16-22.
Dyce, K., Sack, W., Wensing, C.J.G., 2009. Textbook of Veterinary Anatomy. Sauders, St. Louis, Missouri, USA.
Dyer, R.M., Neerchal, N.K., Tasch, U., Wu, Y., Dyer, P., Rajkondawar, P.G., 2007. Objective Determination of Claw Pain and Its Relationship to Limb Locomotion Score in Dairy Cattle. Journal of Dairy Science 90, 4592-4602.
EFSA, 2009a. Scientific opinion on the overall effects of farming systems on dairy cowwelfare and disease. EFSA Journal 7 (1143), 1-38.
EFSA, 2009b. Scientific opinion on welfare of dairy cows in relation to leg and locomotion problems based on a risk assessment with special reference to the impact of housing, feeding, management and genetic selection. EFSA Journal 7 (1142), 1-57.
Egger-Danner, C., Nielsen, P., Fiedler, A., Müller, K., Fjeldaas, T., Döpfer, D., Daniel, V., Bergsten, C., Cramer, G., Christen, A.M., Stock, K.F., Thomas, G., Holzhauer, M., Steiner, A., Clarke, J., Capion, N., Charfeddine, N., Pryce, E., Oakes, E., Burgstaller, J., Heringstad, B., Ødegǻrd, C., Kofler, J., 2015. ICAR Claw Health Atlas. International Committee for Animal Recording (ICAR), Rome, 45 pp.
Eicher, S.D., Lay, D.C., Arthington, J.D., Schutz, M.M., 2013. Effects of rubber flooring during the first 2 lactations on production, locomotion, hoof health, immune functions, and stress. Journal of Dairy Science 96, 3639-3651.
General Introduction
17
Espejo, L.A., Endres, M.I., Salfer, J.A., 2006. Prevalence of lameness in high-producingHolstein cows housed in freestall barns in Minnesota. Journal of Dairy Science 89, 3052-3058.
Fabian, J., Laven, R.A., Whay, H.R., 2014. The prevalence of lameness on New Zealand dairy farms: A comparison of farmer estimate and locomotion scoring. The Veterinary Journal 201, 31-38.
Faull, W.B., Hughes, J.W., Clarkson, M.J., Downham, D.Y., Manson, F.J., Merritt, J.B., Murray, R.D., Russell, W.B., Sutherst, J.E., Ward, W.R., 1996. Epidemiology of lameness in dairy cattle: the influence of cubicles and indoor and outdoor walking surfaces. Veterinary Record 139, 130-136.
Fjeldaas, T., Sogstad, Å., Østerås, O., 2011. Locomotion and claw disorders in Norwegian dairy cows housed in freestalls with slatted concrete, solid concrete, or solid rubber flooring in the alleys. Journal of Dairy Science 94, 1243-1255.
Fjeldaas, T., Sogstad, Å.M., Østerås, O., 2006. Claw trimming routines in relation to claw lesions, claw shape and lameness in Norwegian dairy herds housed in tie stalls and free stalls. Preventive Veterinary Medicine 73, 255-271.
Frankena, K., Somers, J.G.C.J., Schouten, W.G.P., van Stek, J.V., Metz, J.H.M., Stassen, E.N., Graat, E.A.M., 2009. The effect of digital lesions and floor type on locomotion score in Dutch dairy cows. Preventive Veterinary Medicine 88, 150-157.
Fregonesi, J.A., Tucker, C.B., Weary, D.M., 2007. Overstocking reduces lying time in dairy cows. Journal of Dairy Science 90, 3349-3354.
Galama, P.J., 2011. Prospects for bedded pack barns for dairy cattle. Wageningen UR Livestock Research, Wageningen, the Netherlands. (ISBN 978-90-8585-947-1).
Galindo, F., Broom, D.M., Jackson, P.G.G., 2000. A note on possible link between behaviour and the occurrence of lameness in dairy cows. Applied Animal Behaviour Science 67, 335-341.
Geor, R.J., 2010. Current concepts on the pathophysiology of pasture-A=associated laminitis. Veterinary Clinics: Equine Practice 26, 265-276.
Gleerup, K.B., Andersen, P.H., Munksgaard, L., Forkman, B., 2018. Pain evaluation in dairy cattle. Applied Animal Behaviour Science 171, 25-32.
Haskell, M.J., Rennie, L.J., Bowell, V.A., Bell, M.J., Lawrence, A.B., 2006. Housing system, milk production, and zero-grazing effects on lameness and leg injury in dairy cows. Journal of Dairy Science 89, 4259-4266.
Haufe, H.C., Gygax, L., Steiner, B., Friedli, K., Stauffacher, M., Wechsler, B., 2009. Influence of floor type in the walking area of cubicle housing systems on the behaviour of dairy cows. Applied Animal Behaviour Science 116, 21-27.
Hernandez-Mendo, O., Von Keyserlingk, M., Veira, D., Weary, D., 2007. Effects of pasture on lameness in dairy cows. Journal of Dairy Science 90, 1209-1214.
Hinterhofer, C., Ferguson, J.C., Apprich, V., Haider, H., Stanek, C., 2006. Slatted floors and solid floors: stress and strain on the bovine hoof capsule analyzed in finite element analysis. Journal of Dairy Science 89, 155-162.

1
Chapter 1
16
Cramer, G., Lissemore, K.D., Guard, C.L., Leslie, K.E., Kelton, D.F., 2008. Herd- and Cow-Level Prevalence of Foot Lesions in Ontario Dairy Cattle. Journal of Dairy Science 91, 3888-3895.
Cramer, G., Lissemore, K.D., Guard, C.L., Leslie, K.E., Kelton, D.F., 2009. Herd-level risk factors for seven different foot lesions in Ontario Holstein cattle housed in tie stalls or free stalls. Journal of Dairy Science 92, 1404-1411.
Cutler, J.H.H., Rushen, J., de Passillé, A.M., Gibbons, J., Orsel, K., Pajor, E., Barkema, H.W., Solano, L., Pellerin, D., Haley, D., Vasseur, E., 2017. Producer estimates of prevalence and perceived importance of lameness in dairy herds with tiestalls, freestalls, and automated milking systems. Journal of Dairy Science 100, 9871-9880.
Danscher, A.M., Enemark, J.M.D., Telezhenko, E., Capion, N., Ekstrøm, C.T., Thoefner, M.B., 2009. Oligofructose overload induces lameness in cattle. Journal of Dairy Science 92, 607-616.
De Roos, S., Holzhauer, M., 2016. Claw health recording in NL. Eurotier, November 2016, Hannover, Germany.
De Vries, M., 2013. Assuring dairy cattle welfare : towards efficient assessment and improvement. PhD thesis, Wageningen University, Wageningen, the Netherlands.
Dippel, S., Dolezal, M., Brenninkmeyer, C., Brinkmann, J., March, S., Knierim, U., Winckler, C., 2009. Risk factors for lameness in freestall-housed dairy cows across two breeds, farming systems, and countries. Journal of Dairy Science 92, 5476-5486.
Dippel, S., Tucker, C.B., Winckler, C., Weary, D.M., 2011. Effects of behaviour on the development of claw lesions in early lactation dairy cows. Applied Animal Behaviour Science 134, 16-22.
Dyce, K., Sack, W., Wensing, C.J.G., 2009. Textbook of Veterinary Anatomy. Sauders, St. Louis, Missouri, USA.
Dyer, R.M., Neerchal, N.K., Tasch, U., Wu, Y., Dyer, P., Rajkondawar, P.G., 2007. Objective Determination of Claw Pain and Its Relationship to Limb Locomotion Score in Dairy Cattle. Journal of Dairy Science 90, 4592-4602.
EFSA, 2009a. Scientific opinion on the overall effects of farming systems on dairy cowwelfare and disease. EFSA Journal 7 (1143), 1-38.
EFSA, 2009b. Scientific opinion on welfare of dairy cows in relation to leg and locomotion problems based on a risk assessment with special reference to the impact of housing, feeding, management and genetic selection. EFSA Journal 7 (1142), 1-57.
Egger-Danner, C., Nielsen, P., Fiedler, A., Müller, K., Fjeldaas, T., Döpfer, D., Daniel, V., Bergsten, C., Cramer, G., Christen, A.M., Stock, K.F., Thomas, G., Holzhauer, M., Steiner, A., Clarke, J., Capion, N., Charfeddine, N., Pryce, E., Oakes, E., Burgstaller, J., Heringstad, B., Ødegǻrd, C., Kofler, J., 2015. ICAR Claw Health Atlas. International Committee for Animal Recording (ICAR), Rome, 45 pp.
Eicher, S.D., Lay, D.C., Arthington, J.D., Schutz, M.M., 2013. Effects of rubber flooring during the first 2 lactations on production, locomotion, hoof health, immune functions, and stress. Journal of Dairy Science 96, 3639-3651.
General Introduction
17
Espejo, L.A., Endres, M.I., Salfer, J.A., 2006. Prevalence of lameness in high-producingHolstein cows housed in freestall barns in Minnesota. Journal of Dairy Science 89, 3052-3058.
Fabian, J., Laven, R.A., Whay, H.R., 2014. The prevalence of lameness on New Zealand dairy farms: A comparison of farmer estimate and locomotion scoring. The Veterinary Journal 201, 31-38.
Faull, W.B., Hughes, J.W., Clarkson, M.J., Downham, D.Y., Manson, F.J., Merritt, J.B., Murray, R.D., Russell, W.B., Sutherst, J.E., Ward, W.R., 1996. Epidemiology of lameness in dairy cattle: the influence of cubicles and indoor and outdoor walking surfaces. Veterinary Record 139, 130-136.
Fjeldaas, T., Sogstad, Å., Østerås, O., 2011. Locomotion and claw disorders in Norwegian dairy cows housed in freestalls with slatted concrete, solid concrete, or solid rubber flooring in the alleys. Journal of Dairy Science 94, 1243-1255.
Fjeldaas, T., Sogstad, Å.M., Østerås, O., 2006. Claw trimming routines in relation to claw lesions, claw shape and lameness in Norwegian dairy herds housed in tie stalls and free stalls. Preventive Veterinary Medicine 73, 255-271.
Frankena, K., Somers, J.G.C.J., Schouten, W.G.P., van Stek, J.V., Metz, J.H.M., Stassen, E.N., Graat, E.A.M., 2009. The effect of digital lesions and floor type on locomotion score in Dutch dairy cows. Preventive Veterinary Medicine 88, 150-157.
Fregonesi, J.A., Tucker, C.B., Weary, D.M., 2007. Overstocking reduces lying time in dairy cows. Journal of Dairy Science 90, 3349-3354.
Galama, P.J., 2011. Prospects for bedded pack barns for dairy cattle. Wageningen UR Livestock Research, Wageningen, the Netherlands. (ISBN 978-90-8585-947-1).
Galindo, F., Broom, D.M., Jackson, P.G.G., 2000. A note on possible link between behaviour and the occurrence of lameness in dairy cows. Applied Animal Behaviour Science 67, 335-341.
Geor, R.J., 2010. Current concepts on the pathophysiology of pasture-A=associated laminitis. Veterinary Clinics: Equine Practice 26, 265-276.
Gleerup, K.B., Andersen, P.H., Munksgaard, L., Forkman, B., 2018. Pain evaluation in dairy cattle. Applied Animal Behaviour Science 171, 25-32.
Haskell, M.J., Rennie, L.J., Bowell, V.A., Bell, M.J., Lawrence, A.B., 2006. Housing system, milk production, and zero-grazing effects on lameness and leg injury in dairy cows. Journal of Dairy Science 89, 4259-4266.
Haufe, H.C., Gygax, L., Steiner, B., Friedli, K., Stauffacher, M., Wechsler, B., 2009. Influence of floor type in the walking area of cubicle housing systems on the behaviour of dairy cows. Applied Animal Behaviour Science 116, 21-27.
Hernandez-Mendo, O., Von Keyserlingk, M., Veira, D., Weary, D., 2007. Effects of pasture on lameness in dairy cows. Journal of Dairy Science 90, 1209-1214.
Hinterhofer, C., Ferguson, J.C., Apprich, V., Haider, H., Stanek, C., 2006. Slatted floors and solid floors: stress and strain on the bovine hoof capsule analyzed in finite element analysis. Journal of Dairy Science 89, 155-162.

Chapter 1
18
Holzhauer, M., 2006. Claw health in dairy cows in the Netherlands. Epidemiological aspects of different claw disorders in dairy cattle in the Netherlands. PhD thesis, Veterinary Faculty Utrecht University, Utrecht, the Netherlands.
Holzhauer, M., 2018. Personal comments.Holzhauer, M., Bartels, C.J.M., van den Borne, B.H.P., van Schaik, G., 2006a. Intra-class
correlation attributable to claw trimmers scoring common hind-claw disorders in Dutch dairy herds. Preventive Veterinary Medicine 75, 47-55.
Holzhauer, M., Hardenberg, C., Bartels, C.J.M., 2008. Herd and cow-level prevalence of sole ulcers in the Netherlands and associated-risk factors. Preventive Veterinary Medicine 85, 125-135.
Holzhauer, M., Hardenberg, C., Bartels, C.J.M., Frankena, K., 2006b. Herd- and cow-level prevalence of digital dermatitis in the Netherlands and associated risk factors. Journal of Dairy Science 89, 580-588.
Ito, K., von Keyserlingk, M.A.G., LeBlanc, S.J., Weary, D.M., 2010. Lying behavior as an indicator of lameness in dairy cows. Journal of Dairy Science 93, 3553-3560.
Knott, L., Tarlton, J.F., Craft, H., Webster, A.J.F., 2007. Effects of housing, parturition and diet change on the biochemistry and biomechanics of the support structures of the hoof of dairy heifers. The Veterinary Journal 174, 277-287.
Kremer, P., Nueske, S., Scholz, A., Foerster, M., 2007. Comparison of claw health and milk yield in dairy cows on elastic or concrete flooring. Journal of Dairy Science 90, 4603-4611.
Leach, K.A., Logue, D.N., Kempson, S.A., Offer, J.E., Ternent, H.E., Randalls, J.M., 1997. Claw lesions in dairy cattle: Development of Sole andwhite line haemorrhages during the first lactation. The Veterinary Journal 154, 215-225.
Leach, K.A., Whay, H.R., Maggs, C.M., Barker, Z.E., Paul, E.S., Bell, A.K., Main, D.C.J., 2010. Working towards a reduction in cattle lameness: 1. Understanding barriers to lameness control on dairy farms. Research in Veterinary Science 89, 311-317.
Lean, I.J., Rabiee, A.R., 2011. Effect of feeding biotin on milk production and hoof health in lactating dairy cows: A quantitative assessment. Journal of Dairy Science 94, 1465-1476.
Lean, I.J., Westwood, C.T., Golder, H.M., Vermunt, J.J., 2013. Impact of nutrition on lameness and claw health in cattle. Livestock Science 156, 71-87.
Leonard, F.C., O'connell, J., O'farrell, K., 1994. Effect of different housing conditions on behavior and foot lesions in Frisian Heifers. Veterinary Record 134, 490-494.
Leonard, F.C., Oconnell, J.M., Ofarrell, K.J., 1996. Effect of overcrowding on claw health in first-calved Friesian heifers. Brithsh Veterinary Journal 152, 459-472.
Lischer, C., Ossent, P., Räber, M., Geyer, H., 2002. Suspensory structures and supporting tissues of the third phalanx of cows and their relevance to the development of typical sole ulcers (Rusterholz ulcers). Veterinary Record 151, 694-698.
Logue, D.N., Offer, J.E., Kempson, S.A., 1993. Lameness in dairy cattle. Irish Veterinary Journal 46, 47-58.
Manske, T., Hultgren, J., Bergsten, C., 2002a. The effect of claw trimming on the hoof health of Swedish dairy cattle. Preventive Veterinary Medicine 54, 113-129.
General Introduction
19
Manske, T., Hultgren, J., Bergsten, C., 2002b. Prevalence and interrelationships of hoof lesions and lameness in Swedish dairy cows. Preventive Veterinary Medicine 54, 247-263.
Murray, R.D., Downham, D.Y., Clarkson, M.J., Faull, W.B., Hughes, J.W., Manson, F.J., Merritt, J.B., Russell, W.B., Sutherst, J.E., Ward, W.R., 1996. Epidemiology of lameness in dairy cattle: description and analysis of foot lesions. Veterinary Record 138, 586-591.
Newsome, R.F., Green, M.J., Bell, N.J., Bollard, N.J., Mason, C.S., Whay, H.R., Huxley, J.N., 2017. A prospective cohort study of digital cushion and corium thickness. Part 2: Does thinning of the digital cushion and corium lead to lameness and claw horn disruption lesions? Journal of Dairy Science 100, 4759-4771.
Nocek, J.E., 1997. Bovine acidosis: implications on laminitis. Journal of Dairy Science 80, 1005-1028.
O'Callaghan, K.A., Cripps, P.J., Downham, D.Y., Murray, R.D., 2003. Subjective and objective assessment of pain and discomfort due to lameness in dairy cattle. Animal Welfare 12, 605-610.
Offer, J.E., Logue, D.N., Offer, N.W., Marsden, M., 2004. The effect of concentrate composition on lameness and hoof health in dairy cows. The Veterinary Journal 167, 111-113.
Olmos, G., Boyle, L., Hanlon, A., Patton, J., Murphy, J.J., Mee, J.F., 2009. Hoof disorders, locomotion ability and lying times of cubicle-housed compared to pasture-based dairy cows. Livestock Science 125, 199-207.
Phillips, C.J.C., Morris, I.D., 2000. The locomotion of dairy cows on concrete floors that are dry, wet, or covered with a slurry of excreta. Journal of Dairy Science 83, 1767-1772.
Potterton, S.L., Bell, N.J., Whay, H.R., Berry, E.A., Atkinson, O.C.D., Dean, R.S., Main, D.C.J., Huxley, J.N., 2012. A descriptive review of the peer and non-peer reviewed literature on the treatment and prevention of foot lameness in cattle published between 2000 and 2011. The Veterinary Journal 193, 612-616.
Proudfoot, K.L., Weary, D.M., von Keyserlingk, M.A.G., 2010. Behavior during transition differs for cows diagnosed with claw horn lesions in mid lactation. Journal of Dairy Science 93, 3970-3978.
Randall, L.V., Green, M.J., Chagunda, M.G.G., Mason, C., Archer, S.C., Green, L.E., Huxley, J.N., 2015. Low body condition predisposes cattle to lameness: An 8-year study of one dairy herd. Journal of Dairy Science 98, 3766-3777.
Ranjbar, S., Rabiee, A.R., Gunn, A., House, J.K., 2016. Identifying risk factors associated with lameness in pasture-based dairy herds. Journal of Dairy Science 99, 7495-7505.
Rutherford, K.M.D., Langford, F.M., Jack, M.C., Sherwood, L., Lawrence, A.B., Haskell, M.J., 2009. Lameness prevalence and risk factors in organic and non-organic dairy herds in the United Kingdom. The Veterinary Journal 180, 95-105.
Sanders, A.H., Shearer, J.K., De Vries, A., 2009. Seasonal incidence of lameness and risk factors associated with thin soles, white line disease, ulcers, and sole punctures in dairy cattle. Journal of Dairy Science 92, 3165-3174.

1
Chapter 1
18
Holzhauer, M., 2006. Claw health in dairy cows in the Netherlands. Epidemiological aspects of different claw disorders in dairy cattle in the Netherlands. PhD thesis, Veterinary Faculty Utrecht University, Utrecht, the Netherlands.
Holzhauer, M., 2018. Personal comments.Holzhauer, M., Bartels, C.J.M., van den Borne, B.H.P., van Schaik, G., 2006a. Intra-class
correlation attributable to claw trimmers scoring common hind-claw disorders in Dutch dairy herds. Preventive Veterinary Medicine 75, 47-55.
Holzhauer, M., Hardenberg, C., Bartels, C.J.M., 2008. Herd and cow-level prevalence of sole ulcers in the Netherlands and associated-risk factors. Preventive Veterinary Medicine 85, 125-135.
Holzhauer, M., Hardenberg, C., Bartels, C.J.M., Frankena, K., 2006b. Herd- and cow-level prevalence of digital dermatitis in the Netherlands and associated risk factors. Journal of Dairy Science 89, 580-588.
Ito, K., von Keyserlingk, M.A.G., LeBlanc, S.J., Weary, D.M., 2010. Lying behavior as an indicator of lameness in dairy cows. Journal of Dairy Science 93, 3553-3560.
Knott, L., Tarlton, J.F., Craft, H., Webster, A.J.F., 2007. Effects of housing, parturition and diet change on the biochemistry and biomechanics of the support structures of the hoof of dairy heifers. The Veterinary Journal 174, 277-287.
Kremer, P., Nueske, S., Scholz, A., Foerster, M., 2007. Comparison of claw health and milk yield in dairy cows on elastic or concrete flooring. Journal of Dairy Science 90, 4603-4611.
Leach, K.A., Logue, D.N., Kempson, S.A., Offer, J.E., Ternent, H.E., Randalls, J.M., 1997. Claw lesions in dairy cattle: Development of Sole andwhite line haemorrhages during the first lactation. The Veterinary Journal 154, 215-225.
Leach, K.A., Whay, H.R., Maggs, C.M., Barker, Z.E., Paul, E.S., Bell, A.K., Main, D.C.J., 2010. Working towards a reduction in cattle lameness: 1. Understanding barriers to lameness control on dairy farms. Research in Veterinary Science 89, 311-317.
Lean, I.J., Rabiee, A.R., 2011. Effect of feeding biotin on milk production and hoof health in lactating dairy cows: A quantitative assessment. Journal of Dairy Science 94, 1465-1476.
Lean, I.J., Westwood, C.T., Golder, H.M., Vermunt, J.J., 2013. Impact of nutrition on lameness and claw health in cattle. Livestock Science 156, 71-87.
Leonard, F.C., O'connell, J., O'farrell, K., 1994. Effect of different housing conditions on behavior and foot lesions in Frisian Heifers. Veterinary Record 134, 490-494.
Leonard, F.C., Oconnell, J.M., Ofarrell, K.J., 1996. Effect of overcrowding on claw health in first-calved Friesian heifers. Brithsh Veterinary Journal 152, 459-472.
Lischer, C., Ossent, P., Räber, M., Geyer, H., 2002. Suspensory structures and supporting tissues of the third phalanx of cows and their relevance to the development of typical sole ulcers (Rusterholz ulcers). Veterinary Record 151, 694-698.
Logue, D.N., Offer, J.E., Kempson, S.A., 1993. Lameness in dairy cattle. Irish Veterinary Journal 46, 47-58.
Manske, T., Hultgren, J., Bergsten, C., 2002a. The effect of claw trimming on the hoof health of Swedish dairy cattle. Preventive Veterinary Medicine 54, 113-129.
General Introduction
19
Manske, T., Hultgren, J., Bergsten, C., 2002b. Prevalence and interrelationships of hoof lesions and lameness in Swedish dairy cows. Preventive Veterinary Medicine 54, 247-263.
Murray, R.D., Downham, D.Y., Clarkson, M.J., Faull, W.B., Hughes, J.W., Manson, F.J., Merritt, J.B., Russell, W.B., Sutherst, J.E., Ward, W.R., 1996. Epidemiology of lameness in dairy cattle: description and analysis of foot lesions. Veterinary Record 138, 586-591.
Newsome, R.F., Green, M.J., Bell, N.J., Bollard, N.J., Mason, C.S., Whay, H.R., Huxley, J.N., 2017. A prospective cohort study of digital cushion and corium thickness. Part 2: Does thinning of the digital cushion and corium lead to lameness and claw horn disruption lesions? Journal of Dairy Science 100, 4759-4771.
Nocek, J.E., 1997. Bovine acidosis: implications on laminitis. Journal of Dairy Science 80, 1005-1028.
O'Callaghan, K.A., Cripps, P.J., Downham, D.Y., Murray, R.D., 2003. Subjective and objective assessment of pain and discomfort due to lameness in dairy cattle. Animal Welfare 12, 605-610.
Offer, J.E., Logue, D.N., Offer, N.W., Marsden, M., 2004. The effect of concentrate composition on lameness and hoof health in dairy cows. The Veterinary Journal 167, 111-113.
Olmos, G., Boyle, L., Hanlon, A., Patton, J., Murphy, J.J., Mee, J.F., 2009. Hoof disorders, locomotion ability and lying times of cubicle-housed compared to pasture-based dairy cows. Livestock Science 125, 199-207.
Phillips, C.J.C., Morris, I.D., 2000. The locomotion of dairy cows on concrete floors that are dry, wet, or covered with a slurry of excreta. Journal of Dairy Science 83, 1767-1772.
Potterton, S.L., Bell, N.J., Whay, H.R., Berry, E.A., Atkinson, O.C.D., Dean, R.S., Main, D.C.J., Huxley, J.N., 2012. A descriptive review of the peer and non-peer reviewed literature on the treatment and prevention of foot lameness in cattle published between 2000 and 2011. The Veterinary Journal 193, 612-616.
Proudfoot, K.L., Weary, D.M., von Keyserlingk, M.A.G., 2010. Behavior during transition differs for cows diagnosed with claw horn lesions in mid lactation. Journal of Dairy Science 93, 3970-3978.
Randall, L.V., Green, M.J., Chagunda, M.G.G., Mason, C., Archer, S.C., Green, L.E., Huxley, J.N., 2015. Low body condition predisposes cattle to lameness: An 8-year study of one dairy herd. Journal of Dairy Science 98, 3766-3777.
Ranjbar, S., Rabiee, A.R., Gunn, A., House, J.K., 2016. Identifying risk factors associated with lameness in pasture-based dairy herds. Journal of Dairy Science 99, 7495-7505.
Rutherford, K.M.D., Langford, F.M., Jack, M.C., Sherwood, L., Lawrence, A.B., Haskell, M.J., 2009. Lameness prevalence and risk factors in organic and non-organic dairy herds in the United Kingdom. The Veterinary Journal 180, 95-105.
Sanders, A.H., Shearer, J.K., De Vries, A., 2009. Seasonal incidence of lameness and risk factors associated with thin soles, white line disease, ulcers, and sole punctures in dairy cattle. Journal of Dairy Science 92, 3165-3174.

Chapter 1
20
Sarjokari, K., Kaustell, K.O., Hurme, T., Kivinen, T., Peltoniemi, O.A.T., Saloniemi, H., Rajala-Schultz, P.J., 2013. Prevalence and risk factors for lameness in insulated free stall barns in Finland. Livestock Science 156, 44-52.
Singh, S.S., Murray, R.D., Ward, W.R., 1992. Histopathological and morphometric studies on the hooves of dairy and beef cattle in relation to overgrown sole and laminitis. Journal of Comparative Pathology 107, 319-328.
Smits, M.C.J., Frankena, K., Metz, J.H.M., Noordhuizen, J.P.T.M., 1992. Prevalence of digital disorders in zero-grazing dairy cows. Livestock Production Science 32, 231-244.
Smolders, E.A.A., 2018. Personal comments.Sogstad, Å.M., Fjeldaas, T., Østerås, O., Forshell, K.P., 2005. Prevalence of claw lesions in
Norwegian dairy cattle housed in tie stalls and free stalls. Preventive Veterinary Medicine 70, 191-209.
Solano, L., Barkema, H., Mason, S., Pajor, E., LeBlanc, S., Orsel, K., 2016. Prevalence and distribution of foot lesions in dairy cattle in Alberta, Canada. Journal of Dairy Science 99, 6828-6841.
Solano, L., Barkema, H.W., Pajor, E.A., Mason, S., LeBlanc, S.J., Zaffino Heyerhoff, J.C., Nash, C.G.R., Haley, D.B., Vasseur, E., Pellerin, D., Rushen, J., de Passillé, A.M., Orsel, K., 2015. Prevalence of lameness and associated risk factors in Canadian Holstein-Friesian cows housed in freestall barns. Journal of Dairy Science 98, 6978-6991.
Somers, J.G.C.J., 2004. Claw disorders and disturbed locomotion in dairy cows : the effect of floor systems and implications for animal welfare. PhD thesis, Veterinary Faculty Utrecht University, Utrecht, the Netherlands.
Somers, J.G.C.J., Frankena, K., Noordhuizen-Stassen, E.N., Metz, J.H.M., 2003. Prevalence of claw disorders in Dutch dairy cows exposed to several floor systems. Journal of Dairy Science 86, 2082-2093.
Somers, J.G.C.J., Frankena, K., Noordhuizen-Stassen, E.N., Metz, J.H.M., 2005a. Risk factors for digital dermatitis in dairy cows kept in cubicle houses in the Netherlands. Preventive Veterinary Medicine 71, 11-21.
Somers, J.G.C.J., Frankena, K., Noordhuizen-Stassen, E.N., Metz, J.H.M., 2005b. Risk factors for interdigital dermatitis and heel erosion in dairy cows kept in cubicle houses in the Netherlands. Preventive Veterinary Medicine 71, 23-34.
Tadich, N., Flor, E., Green, L., 2010. Associations between hoof lesions and locomotion score in 1098 unsound dairy cows. The Veterinary Journal 184, 60-65.
Telezhenko, E., Bergsten, C., Magnusson, M., Nilsson, C., 2009. Effect of different flooring systems on claw conformation of dairy cows. Journal of Dairy Science 92, 2625-2633.
Telezhenko, E., Bergsten, C., Magnusson, M., Ventorp, M., Nilsson, C., 2008. Effect of different flooring systems on weight and pressure distribution on claws of dairy cows. Journal of Dairy Science 91, 1874-1884.
Telezhenko, E., Lidfors, L., Bergsten, C., 2007. Dairy cow preferences for soft or hard flooring when standing or walking. Journal of Dairy Science 90, 3716-3724.
Telezhenko, E., Magnusson, M., Bergsten, C., 2017. Gait of dairy cows on floors with different slipperiness. Journal of Dairy Science 100, 6494-6503.
General Introduction
21
Vaarst, M., Hindhede, J., Enevoldsen, C., 1998. Sole disorders in conventionally managed and organic dairy herds using different housing systems. Journal of Dairy Research 65, 175-186.
Van der Linde, C., de Jong, G., Koenen, E.P., Eding, H., 2010. Claw health index for Dutch dairy cattle based on claw trimming and conformation data. Journal of Dairy Science 93, 4883-4891.
Van der Tol, P.P.J., 2004. Biomechanical aspects of the claw-floor interaction in dairy cattle. Implications for locomotion and claw disorders. PhD thesis, Veterinary Faculty Utrecht University, Utrecht, the Netherlands.
Vanegas, J., Overton, M., Berry, S.L., Sischo, W.M., 2006. Effect of rubber flooring on claw health in lactating dairy cows housed in free-stall barns. Journal of Dairy Science 89, 4251-4258.
Vokey, F.J., Guard, C.L., Erb, H.N., Galton, D.M., 2001. Effects of alley and stall surfaces on indices of claw and leg health in dairy cattle housed in a free-stall barn. Journal of Dairy Science 84, 2686-2699.
Webster, A.J.F., 2001. Effects of housing and two forage diets on the development of claw horn lesions in dairy cows at first calving and in first lactation. The Veterinary Journal 162, 56-65.
Weigele, H.C., Gygax, L., Steiner, A., Wechsler, B., Burla, J.B., 2018. Moderate lameness leads to marked behavioral changes in dairy cows. Journal of Dairy Science 101, 2370-2382.
Westin, R., Vaughan, A., de Passille, A.M., DeVries, T.J., Pajor, E.A., Pellerin, D., Siegford, J.M., Vasseur, E., Rushen, J., 2016. Lying times of lactating cows on dairy farms with automatic milking systems and the relation to lameness, leg lesions, and body condition score. Journal of Dairy Science 99, 551-561.
Whay, H.R., Waterman, A.E., Webster, A.J.F., 1997. Associations between locomotion, claw lesions and nociceptive threshold in dairy heifers during the peri-partum period. The Veterinary Journal 154, 155-161.
Wilhelm, K., Wilhelm, J., Fürll, M., 2017. Claw disorders in dairy cattle – an unexpected association between energy metabolism and sole haemorrhages. Journal of Dairy Research 84, 54-60.
Winckler, C., Tucker, C.B., Weary, D.M., 2015. Effects of under- and overstocking freestalls on dairy cattle behaviour. Applied Animal Behaviour Science 170, 14-19.

1
Chapter 1
20
Sarjokari, K., Kaustell, K.O., Hurme, T., Kivinen, T., Peltoniemi, O.A.T., Saloniemi, H., Rajala-Schultz, P.J., 2013. Prevalence and risk factors for lameness in insulated free stall barns in Finland. Livestock Science 156, 44-52.
Singh, S.S., Murray, R.D., Ward, W.R., 1992. Histopathological and morphometric studies on the hooves of dairy and beef cattle in relation to overgrown sole and laminitis. Journal of Comparative Pathology 107, 319-328.
Smits, M.C.J., Frankena, K., Metz, J.H.M., Noordhuizen, J.P.T.M., 1992. Prevalence of digital disorders in zero-grazing dairy cows. Livestock Production Science 32, 231-244.
Smolders, E.A.A., 2018. Personal comments.Sogstad, Å.M., Fjeldaas, T., Østerås, O., Forshell, K.P., 2005. Prevalence of claw lesions in
Norwegian dairy cattle housed in tie stalls and free stalls. Preventive Veterinary Medicine 70, 191-209.
Solano, L., Barkema, H., Mason, S., Pajor, E., LeBlanc, S., Orsel, K., 2016. Prevalence and distribution of foot lesions in dairy cattle in Alberta, Canada. Journal of Dairy Science 99, 6828-6841.
Solano, L., Barkema, H.W., Pajor, E.A., Mason, S., LeBlanc, S.J., Zaffino Heyerhoff, J.C., Nash, C.G.R., Haley, D.B., Vasseur, E., Pellerin, D., Rushen, J., de Passillé, A.M., Orsel, K., 2015. Prevalence of lameness and associated risk factors in Canadian Holstein-Friesian cows housed in freestall barns. Journal of Dairy Science 98, 6978-6991.
Somers, J.G.C.J., 2004. Claw disorders and disturbed locomotion in dairy cows : the effect of floor systems and implications for animal welfare. PhD thesis, Veterinary Faculty Utrecht University, Utrecht, the Netherlands.
Somers, J.G.C.J., Frankena, K., Noordhuizen-Stassen, E.N., Metz, J.H.M., 2003. Prevalence of claw disorders in Dutch dairy cows exposed to several floor systems. Journal of Dairy Science 86, 2082-2093.
Somers, J.G.C.J., Frankena, K., Noordhuizen-Stassen, E.N., Metz, J.H.M., 2005a. Risk factors for digital dermatitis in dairy cows kept in cubicle houses in the Netherlands. Preventive Veterinary Medicine 71, 11-21.
Somers, J.G.C.J., Frankena, K., Noordhuizen-Stassen, E.N., Metz, J.H.M., 2005b. Risk factors for interdigital dermatitis and heel erosion in dairy cows kept in cubicle houses in the Netherlands. Preventive Veterinary Medicine 71, 23-34.
Tadich, N., Flor, E., Green, L., 2010. Associations between hoof lesions and locomotion score in 1098 unsound dairy cows. The Veterinary Journal 184, 60-65.
Telezhenko, E., Bergsten, C., Magnusson, M., Nilsson, C., 2009. Effect of different flooring systems on claw conformation of dairy cows. Journal of Dairy Science 92, 2625-2633.
Telezhenko, E., Bergsten, C., Magnusson, M., Ventorp, M., Nilsson, C., 2008. Effect of different flooring systems on weight and pressure distribution on claws of dairy cows. Journal of Dairy Science 91, 1874-1884.
Telezhenko, E., Lidfors, L., Bergsten, C., 2007. Dairy cow preferences for soft or hard flooring when standing or walking. Journal of Dairy Science 90, 3716-3724.
Telezhenko, E., Magnusson, M., Bergsten, C., 2017. Gait of dairy cows on floors with different slipperiness. Journal of Dairy Science 100, 6494-6503.
General Introduction
21
Vaarst, M., Hindhede, J., Enevoldsen, C., 1998. Sole disorders in conventionally managed and organic dairy herds using different housing systems. Journal of Dairy Research 65, 175-186.
Van der Linde, C., de Jong, G., Koenen, E.P., Eding, H., 2010. Claw health index for Dutch dairy cattle based on claw trimming and conformation data. Journal of Dairy Science 93, 4883-4891.
Van der Tol, P.P.J., 2004. Biomechanical aspects of the claw-floor interaction in dairy cattle. Implications for locomotion and claw disorders. PhD thesis, Veterinary Faculty Utrecht University, Utrecht, the Netherlands.
Vanegas, J., Overton, M., Berry, S.L., Sischo, W.M., 2006. Effect of rubber flooring on claw health in lactating dairy cows housed in free-stall barns. Journal of Dairy Science 89, 4251-4258.
Vokey, F.J., Guard, C.L., Erb, H.N., Galton, D.M., 2001. Effects of alley and stall surfaces on indices of claw and leg health in dairy cattle housed in a free-stall barn. Journal of Dairy Science 84, 2686-2699.
Webster, A.J.F., 2001. Effects of housing and two forage diets on the development of claw horn lesions in dairy cows at first calving and in first lactation. The Veterinary Journal 162, 56-65.
Weigele, H.C., Gygax, L., Steiner, A., Wechsler, B., Burla, J.B., 2018. Moderate lameness leads to marked behavioral changes in dairy cows. Journal of Dairy Science 101, 2370-2382.
Westin, R., Vaughan, A., de Passille, A.M., DeVries, T.J., Pajor, E.A., Pellerin, D., Siegford, J.M., Vasseur, E., Rushen, J., 2016. Lying times of lactating cows on dairy farms with automatic milking systems and the relation to lameness, leg lesions, and body condition score. Journal of Dairy Science 99, 551-561.
Whay, H.R., Waterman, A.E., Webster, A.J.F., 1997. Associations between locomotion, claw lesions and nociceptive threshold in dairy heifers during the peri-partum period. The Veterinary Journal 154, 155-161.
Wilhelm, K., Wilhelm, J., Fürll, M., 2017. Claw disorders in dairy cattle – an unexpected association between energy metabolism and sole haemorrhages. Journal of Dairy Research 84, 54-60.
Winckler, C., Tucker, C.B., Weary, D.M., 2015. Effects of under- and overstocking freestalls on dairy cattle behaviour. Applied Animal Behaviour Science 170, 14-19.

Chapter 1
22
APPENDIXPhotos illustrating clinical appearance of the most prevalent claw disorders in the Netherlands. Photos copied with permission.
Digital dermatits (photo M. Holzhauer) Interdigital phlegmon (photo M. Holzhauer)
Interdigital dermatitis (photo M. Holzhauer) Interdigital hyperplasia (photo M. Holzhauer)
Sole haemorrhage (photo WLR) White line disease (photo M. Holzhauer)
Sole ulcer (photo M. Holzhauer)
CHAPTER 2
Effects of two trimming methods of dairy cattle on concrete or rubber-
covered slatted floorsW.Ouweltjes a,b, M. Holzhauer b, P. P. J. van der Tol a and J. van der Werf a
a Animal Sciences Group, PO Box 65, NL-8200 AB Lelystad, the Netherlandsb GD Animal Health Service Ltd., PO Box 9, NL-7400 AA Deventer, the
Netherlands
Published in Journal of Dairy Science (2009) 92:960-971

24
Flooring and trimming
25
ABSTRACTThis study monitored claw health, claw conformation, locomotion, activity, and step traits of cows from a single dairy herd that were trimmed according to the standard Dutch method orwith an alternative “concave” trimming method. Half of the cows were kept in a stall section with concrete slatted floors in the alleys. The other cows were kept in a pen within the same housing with an identical concrete slatted floor in the alleys, but with a rubber top layer. All experimental cows were kept in the same environment for at least 3 mo before and after trimming. It was hypothesized that trimming for more-concave soles (i.e., with 3 to 5 mm of sole dug out under the claw bone) was preferred to the standard Dutch trimming with flat sole surfaces for cows kept in stalls with soft alley floors. None of the claw health or locomotion traits differed for the trimming methods. No interactions were found between flooring and trimming method. Floor effects were significant for several traits. Cows on the rubber-topped floors had significantly fewer sole hemorrhages (prevalence of 22 vs. 48% inmo 3) and larger claws (claw length 76.1 ± 5.0 vs. 72.5 ± 4.9 mm; heel height 49.3 ± 6.3 vs. 46.0 ± 6.4 mm; claw diagonal 129 ± 6.4 vs. 125 ± 6.9 mm), spent more time standing in the alleys (55.4 ± 2.8 vs. 49.6 ± 2.8%), and had higher activity (61.0 ± 3.7 vs. 53.0 ± 3.7 steps/h). This suggests greater claw comfort on rubber flooring compared with concrete flooring. Kinetic patterns during claw-floor contact while walking were similar for all treatments. During the double-support (stance) phase, claw-floor contact area increased to a maximum in the first 30% of double-support phase time, remained more or less stable until 80% of double-support phase time, and sharply decreased as the animal pushed off as shown by the change in center of pressure. A gradual change of center of pressure in the medial direction during double-support phase time was shown. The research hypothesis was rejected, but soft alley floors had subtle beneficial effects.
Key words: alley floor, trimming method, claw health and conformation, locomotion.

2
24
Flooring and trimming
25
ABSTRACTThis study monitored claw health, claw conformation, locomotion, activity, and step traits of cows from a single dairy herd that were trimmed according to the standard Dutch method orwith an alternative “concave” trimming method. Half of the cows were kept in a stall section with concrete slatted floors in the alleys. The other cows were kept in a pen within the same housing with an identical concrete slatted floor in the alleys, but with a rubber top layer. All experimental cows were kept in the same environment for at least 3 mo before and after trimming. It was hypothesized that trimming for more-concave soles (i.e., with 3 to 5 mm of sole dug out under the claw bone) was preferred to the standard Dutch trimming with flat sole surfaces for cows kept in stalls with soft alley floors. None of the claw health or locomotion traits differed for the trimming methods. No interactions were found between flooring and trimming method. Floor effects were significant for several traits. Cows on the rubber-topped floors had significantly fewer sole hemorrhages (prevalence of 22 vs. 48% inmo 3) and larger claws (claw length 76.1 ± 5.0 vs. 72.5 ± 4.9 mm; heel height 49.3 ± 6.3 vs. 46.0 ± 6.4 mm; claw diagonal 129 ± 6.4 vs. 125 ± 6.9 mm), spent more time standing in the alleys (55.4 ± 2.8 vs. 49.6 ± 2.8%), and had higher activity (61.0 ± 3.7 vs. 53.0 ± 3.7 steps/h). This suggests greater claw comfort on rubber flooring compared with concrete flooring. Kinetic patterns during claw-floor contact while walking were similar for all treatments. During the double-support (stance) phase, claw-floor contact area increased to a maximum in the first 30% of double-support phase time, remained more or less stable until 80% of double-support phase time, and sharply decreased as the animal pushed off as shown by the change in center of pressure. A gradual change of center of pressure in the medial direction during double-support phase time was shown. The research hypothesis was rejected, but soft alley floors had subtle beneficial effects.
Key words: alley floor, trimming method, claw health and conformation, locomotion.

Chapter 2
26
1 INTRODUCTIONSeveral studies have reported that claw lesions and locomotor problems are widespread among dairy cattle (Somers, 2004; Holzhauer et al., 2006), especially in free stall herds (Sogstad et al., 2005). Claw disorders in dairy cows cause pain and are the main cause of impaired mobility in an environment that requires that cows move around for resources. Therefore, claw disorders are a serious animal welfare issue (Galindo and Broom, 2002).Prevalence of claw disorders is linked to the surfaces on which cows walk (Somers et al., 2003). Around 80% of Dutch dairy cows are housed in freestall barns, of which more than 90% are equipped with slatted concrete floors (Somers, 2004), and such floors were associated with suboptimal locomotion. Several investigations reported beneficial effects on locomotion when concrete floors were equipped with rubber walking surfaces (Rushen and De Passillé, 2006; Flower et al., 2007). Tucker et al. (2006) showed that cows prefer soft walking surfaces over hard concrete, and there is growing interest among farmers to apply rubber top layers in their barns. Although soft flooring decreases the environmental challenge for mechanical overload, it is unlikely that it will prevent all claw lesions. Boyle et al. (2007)argue that housing comfort regarding claws was determined both by flooring and free stalls.Correspondingly, Kremer et al. (2007) and Vanegas et al. (2006) reported no significant improvement of claw health through soft flooring.Preventive hoof trimming is a common practice on dairy farms Manske et al. (2002). In the Netherlands, regardless of their housing conditions, cows are trimmed according to guidelines developed by Toussaint-Raven (1989). This so-called Dutch method was developed at a time when soft flooring was uncommon and cows walked on pasture more often than they do today. With this trimming method the weight-bearing surface of the sole is balanced over the lateral and medial claws. Pressure distribution measurements showed that soft and sensitive areas of the sole are loaded relatively heavily after trimming (Van der Tol et al., 2004). From a functional morphological perspective, soles with a weight-bearing wall combined with a bulb that bears only a minor part of the weight seem a better option (Van der Tol et al., 2004; Nuss and Paulus, 2006). Studies (Kremer et al., 2007; Telezhenko, 2007) showed that soft top layers on walking floors resulted in lower horn growth and wear and increased claw size. Telezhenko (2007) reported that rubber walking surfaces preserved sole concavity.Given the unfavorable mechanical loading pattern of standard trimming, the changed claw conformation, and a lack of clear improvement of claw health for cows kept on soft floors, the question is whether the trimming method should be modified for these flooring conditions. The hypothesis was that on softer floors, soles trimmed to be more concave are preferred over standard trimmed soles, and that effects will be visible within 3 mo. The aim was to evaluate the effects of the standard Dutch trimming method versus an alternative trimming method in combination with a concrete or rubber-covered slatted floor on claw health, claw conformation, locomotion, and pressure distribution.
Flooring and trimming
27
2 MATERIALS AND METHODS
2.1 Animals and Housing ConditionsThe study was carried out at research farm “De Waiboerhoeve” of the Animal Sciences Group in Lelystad, the Netherlands. The farm had a 400-cow Holstein herd with year-around calving. All dry cows at the farm were kept in a pen with concrete slatted alleys, and claws were trimmed at dry off according to the Dutch method following standard management procedures. After calving, cows entered 1 of 5 milking groups randomly [4 automatic milking system (AMS)-milked groups and a parlor-milked group]. The experimental cows (n = 72) were selected from 2 groups of about 60 animals kept in 2 adjacent sections of free stalls with mirror-image layouts under the same roof. The 2 different sections of free stalls had different types of floor (see treatments), but all other housing and management conditions were similar. Treatments consisted of a combination of floor and trimming method (see treatments). All experimental cows were kept in their environment from calving onward. Water and a partially mixed ration were available ad libitum; ration formulation was according to Dutch nutritional guidelines. The cows were milked by AMS (Astronaut A2, Lely Industries, Maassluis, the Netherlands) and received 1 to 6 kg of concentrates daily during milking, depending on their production level. Production data of the AMS (date and time of visit, milk yield) were recorded in the herd management system and used for descriptive analysis.The cows entered the experiment 3 to 4 mo after calving, when they were about to be trimmed according to standard management procedures. Criteria for inclusion were that the animals were clinically healthy and had a locomotion score of 2 or less on the 5-point scale described by Manson and Leaver (1988); that is, they should not be lame and the claws had enough horn for trimming by either of the 2 methods. During the experiment, cows were not treated for any disease that affects locomotor behavior. However, when cows were diagnosed with severe lameness (i.e., gait score >3.5) or another serious illness they were removed from the study. Seven cows were removed before the end of the observation period. Three of those had udder health problems, 2 had undefined disease problems, 1 cow died, and 1 had claw problems. Data from these animals were not used for statistical analysis. The study was approved by the institute’s (ASG-WUR, Lelystad) Animal Care and Ethics Committee. The animals entered the study between May 23 and June 21, 2006, on 5 different days and were followed for a period of 3 mo each. Parities of the animals ranged from 1 to 4. Every 2 wk a footbath containing, alternately, a solution of formalin or formalin-copper sulfate, was placed in their path for 2 d.
2.2 TreatmentsThe 2 free-stall sections used for the experiment had either a slatted concrete floor (SC; n = 14 heifers and n = 21 cows) or an identical slatted floor with rubber walking surfaces (SR; n = 12 heifers and 18 cows). Both prefabricated floors were provided by Concrelit
2
Chapter 2
26
1 INTRODUCTIONSeveral studies have reported that claw lesions and locomotor problems are widespread among dairy cattle (Somers, 2004; Holzhauer et al., 2006), especially in free stall herds (Sogstad et al., 2005). Claw disorders in dairy cows cause pain and are the main cause of impaired mobility in an environment that requires that cows move around for resources. Therefore, claw disorders are a serious animal welfare issue (Galindo and Broom, 2002).Prevalence of claw disorders is linked to the surfaces on which cows walk (Somers et al., 2003). Around 80% of Dutch dairy cows are housed in freestall barns, of which more than 90% are equipped with slatted concrete floors (Somers, 2004), and such floors were associated with suboptimal locomotion. Several investigations reported beneficial effects on locomotion when concrete floors were equipped with rubber walking surfaces (Rushen and De Passillé, 2006; Flower et al., 2007). Tucker et al. (2006) showed that cows prefer soft walking surfaces over hard concrete, and there is growing interest among farmers to apply rubber top layers in their barns. Although soft flooring decreases the environmental challenge for mechanical overload, it is unlikely that it will prevent all claw lesions. Boyle et al. (2007)argue that housing comfort regarding claws was determined both by flooring and free stalls.Correspondingly, Kremer et al. (2007) and Vanegas et al. (2006) reported no significant improvement of claw health through soft flooring.Preventive hoof trimming is a common practice on dairy farms Manske et al. (2002). In the Netherlands, regardless of their housing conditions, cows are trimmed according to guidelines developed by Toussaint-Raven (1989). This so-called Dutch method was developed at a time when soft flooring was uncommon and cows walked on pasture more often than they do today. With this trimming method the weight-bearing surface of the sole is balanced over the lateral and medial claws. Pressure distribution measurements showed that soft and sensitive areas of the sole are loaded relatively heavily after trimming (Van der Tol et al., 2004). From a functional morphological perspective, soles with a weight-bearing wall combined with a bulb that bears only a minor part of the weight seem a better option (Van der Tol et al., 2004; Nuss and Paulus, 2006). Studies (Kremer et al., 2007; Telezhenko, 2007) showed that soft top layers on walking floors resulted in lower horn growth and wear and increased claw size. Telezhenko (2007) reported that rubber walking surfaces preserved sole concavity.Given the unfavorable mechanical loading pattern of standard trimming, the changed claw conformation, and a lack of clear improvement of claw health for cows kept on soft floors, the question is whether the trimming method should be modified for these flooring conditions. The hypothesis was that on softer floors, soles trimmed to be more concave are preferred over standard trimmed soles, and that effects will be visible within 3 mo. The aim was to evaluate the effects of the standard Dutch trimming method versus an alternative trimming method in combination with a concrete or rubber-covered slatted floor on claw health, claw conformation, locomotion, and pressure distribution.
Flooring and trimming
27
2 MATERIALS AND METHODS
2.1 Animals and Housing ConditionsThe study was carried out at research farm “De Waiboerhoeve” of the Animal Sciences Group in Lelystad, the Netherlands. The farm had a 400-cow Holstein herd with year-around calving. All dry cows at the farm were kept in a pen with concrete slatted alleys, and claws were trimmed at dry off according to the Dutch method following standard management procedures. After calving, cows entered 1 of 5 milking groups randomly [4 automatic milking system (AMS)-milked groups and a parlor-milked group]. The experimental cows (n = 72) were selected from 2 groups of about 60 animals kept in 2 adjacent sections of free stalls with mirror-image layouts under the same roof. The 2 different sections of free stalls had different types of floor (see treatments), but all other housing and management conditions were similar. Treatments consisted of a combination of floor and trimming method (see treatments). All experimental cows were kept in their environment from calving onward. Water and a partially mixed ration were available ad libitum; ration formulation was according to Dutch nutritional guidelines. The cows were milked by AMS (Astronaut A2, Lely Industries, Maassluis, the Netherlands) and received 1 to 6 kg of concentrates daily during milking, depending on their production level. Production data of the AMS (date and time of visit, milk yield) were recorded in the herd management system and used for descriptive analysis.The cows entered the experiment 3 to 4 mo after calving, when they were about to be trimmed according to standard management procedures. Criteria for inclusion were that the animals were clinically healthy and had a locomotion score of 2 or less on the 5-point scale described by Manson and Leaver (1988); that is, they should not be lame and the claws had enough horn for trimming by either of the 2 methods. During the experiment, cows were not treated for any disease that affects locomotor behavior. However, when cows were diagnosed with severe lameness (i.e., gait score >3.5) or another serious illness they were removed from the study. Seven cows were removed before the end of the observation period. Three of those had udder health problems, 2 had undefined disease problems, 1 cow died, and 1 had claw problems. Data from these animals were not used for statistical analysis. The study was approved by the institute’s (ASG-WUR, Lelystad) Animal Care and Ethics Committee. The animals entered the study between May 23 and June 21, 2006, on 5 different days and were followed for a period of 3 mo each. Parities of the animals ranged from 1 to 4. Every 2 wk a footbath containing, alternately, a solution of formalin or formalin-copper sulfate, was placed in their path for 2 d.
2.2 TreatmentsThe 2 free-stall sections used for the experiment had either a slatted concrete floor (SC; n = 14 heifers and n = 21 cows) or an identical slatted floor with rubber walking surfaces (SR; n = 12 heifers and 18 cows). Both prefabricated floors were provided by Concrelit

Chapter 2
28
Betonindustrie (Steenwijk, the Netherlands), and the rubber coating was manufactured by Animat (Saint Élie d’Orford, Canada). Both floors were cleaned automatically every 45 min by a manure scraper (De Boer, Leeuwarden, the Netherlands). One of 2 trimming methods was randomly assigned to the animals, but a distinction was made between heifers and cows to prevent an unbalanced distribution of cows and heifers over treatments. The 2 trimming methods standard (ST, n = 14 heifers and 19 cows) or hollow (HO; n = 12 heifers and 20 cows) are illustrated in Figure 1. Before the experiment started the claw trimmer (who trimmed all claws throughout the study) was trained in both methods. Experimental groups (same floor and trimming method) were matched for parity and date of entering the experiment.
Figure 1. Outline of preventive trimming methods.
2.3 MeasurementsThe cows were monitored for claw health, claw dimensions, locomotion, and claw pressure distributions at trimming and 1 and 3 mo later. Claw health was recorded for each hind leg by scoring the presence of digital dermatitis, interdigital dermatitis, sole hemorrhages, white line defects, sole ulcer, tyloma (also known as interdigital hyperplasia), and interdigital phlegmon according to Holzhauer (2006). Because white line defects, sole ulcer, and tyloma were rarely recorded, these disorders were grouped together for analysis in the category “other claw disease”. Interdigital phlegmon was not observed. If present, digital dermatitis, interdigital dermatitis, and sole hemorrhages were scored on a scale from 1 (mild) to 3 (severe); the other disorders were scored as either present (1) or absent (0). For the measurements after 1 and 3 mo, claws were cleaned and a minimum of sole horn, just enough to visually score horn lesions, was removed. Lesions were scored by experienced personnel.
Flooring and trimming
29
Claw dimensions were assessed by measuring claw angle, claw length, heel height, claw diagonal, and claw width for both medial and lateral hind claws as described by Somers et al. (2005), and outlined in Figure 2 (adapted from their paper with permission). Horn growth and wear of medial and lateral hind claws were measured as described. After claw disorders and claw dimensions were recorded, and before cows were returned to their free-stall sections, the cows were filmed while walking on the same strip of slatted concrete floor next to their free-stall sections. Scoring of all films was performed by the first author (WO). Gait scores were recorded according to Manson and Leaver (1988) with 9 half-point classes in the range from 1 (healthy) to 5 (extremely lame). Midway through the experiment, from July 18 until August 14, 2006, activity data were obtained with IceTag activity sensors (version 2.003, IceRobotics Ltd., Roslin, Midlothian, UK). The sensors recorded the percentage of time a cow was lying, standing or active and the number of steps per minute. Because 16 sensors were available, 4 different animals in each treatment group were equipped twice weekly with a sensor for 3 to 4 d. Thus, after 2 wk data were obtained from 64 of the experimental animals, and in the next 2 wk the same animals were measured again in the same order.
Figure 2. Illustration of the claw traits measured on the hind claws to describe shape (adapted from Somers et al., 2005): A = claw angle; B = claw length; C = heel height; D = claw height (not measured in this study); E = claw diagonal; F = claw width.
Claw-floor interactions during locomotion were captured by means of a pressure distribution (PD) plate (footscan 2D-box, RsScan International, Olen, Belgium). The PD plate had a 976-× 325-mm measuring surface containing 8,192 conductive pressure-sensitive polymer sensors that were each 5 × 7.6 mm in size. The PD plate was embedded such that the top surface of the PD plate was at the same height as the surrounding walkway. To protect the PD plate the walkway was covered with a 2-mm-thick rubber mat. This minimized any visual disturbance that might be created by the equipment (Van der Tol, 2004). The cows were driven down the walkway and if cows ran, stood still, or slipped, those data were discarded. The PD plate was connected to a computer that recorded the pressure measurements for later analysis. All pressures above zero were measured and stored. Body weights were measured by weighing platforms in the AMS, and mean individual BW were calculated for each animal for experimental mo 0, 1, and 3.

2
Chapter 2
28
Betonindustrie (Steenwijk, the Netherlands), and the rubber coating was manufactured by Animat (Saint Élie d’Orford, Canada). Both floors were cleaned automatically every 45 min by a manure scraper (De Boer, Leeuwarden, the Netherlands). One of 2 trimming methods was randomly assigned to the animals, but a distinction was made between heifers and cows to prevent an unbalanced distribution of cows and heifers over treatments. The 2 trimming methods standard (ST, n = 14 heifers and 19 cows) or hollow (HO; n = 12 heifers and 20 cows) are illustrated in Figure 1. Before the experiment started the claw trimmer (who trimmed all claws throughout the study) was trained in both methods. Experimental groups (same floor and trimming method) were matched for parity and date of entering the experiment.
Figure 1. Outline of preventive trimming methods.
2.3 MeasurementsThe cows were monitored for claw health, claw dimensions, locomotion, and claw pressure distributions at trimming and 1 and 3 mo later. Claw health was recorded for each hind leg by scoring the presence of digital dermatitis, interdigital dermatitis, sole hemorrhages, white line defects, sole ulcer, tyloma (also known as interdigital hyperplasia), and interdigital phlegmon according to Holzhauer (2006). Because white line defects, sole ulcer, and tyloma were rarely recorded, these disorders were grouped together for analysis in the category “other claw disease”. Interdigital phlegmon was not observed. If present, digital dermatitis, interdigital dermatitis, and sole hemorrhages were scored on a scale from 1 (mild) to 3 (severe); the other disorders were scored as either present (1) or absent (0). For the measurements after 1 and 3 mo, claws were cleaned and a minimum of sole horn, just enough to visually score horn lesions, was removed. Lesions were scored by experienced personnel.
Flooring and trimming
29
Claw dimensions were assessed by measuring claw angle, claw length, heel height, claw diagonal, and claw width for both medial and lateral hind claws as described by Somers et al. (2005), and outlined in Figure 2 (adapted from their paper with permission). Horn growth and wear of medial and lateral hind claws were measured as described. After claw disorders and claw dimensions were recorded, and before cows were returned to their free-stall sections, the cows were filmed while walking on the same strip of slatted concrete floor next to their free-stall sections. Scoring of all films was performed by the first author (WO). Gait scores were recorded according to Manson and Leaver (1988) with 9 half-point classes in the range from 1 (healthy) to 5 (extremely lame). Midway through the experiment, from July 18 until August 14, 2006, activity data were obtained with IceTag activity sensors (version 2.003, IceRobotics Ltd., Roslin, Midlothian, UK). The sensors recorded the percentage of time a cow was lying, standing or active and the number of steps per minute. Because 16 sensors were available, 4 different animals in each treatment group were equipped twice weekly with a sensor for 3 to 4 d. Thus, after 2 wk data were obtained from 64 of the experimental animals, and in the next 2 wk the same animals were measured again in the same order.
Figure 2. Illustration of the claw traits measured on the hind claws to describe shape (adapted from Somers et al., 2005): A = claw angle; B = claw length; C = heel height; D = claw height (not measured in this study); E = claw diagonal; F = claw width.
Claw-floor interactions during locomotion were captured by means of a pressure distribution (PD) plate (footscan 2D-box, RsScan International, Olen, Belgium). The PD plate had a 976-× 325-mm measuring surface containing 8,192 conductive pressure-sensitive polymer sensors that were each 5 × 7.6 mm in size. The PD plate was embedded such that the top surface of the PD plate was at the same height as the surrounding walkway. To protect the PD plate the walkway was covered with a 2-mm-thick rubber mat. This minimized any visual disturbance that might be created by the equipment (Van der Tol, 2004). The cows were driven down the walkway and if cows ran, stood still, or slipped, those data were discarded. The PD plate was connected to a computer that recorded the pressure measurements for later analysis. All pressures above zero were measured and stored. Body weights were measured by weighing platforms in the AMS, and mean individual BW were calculated for each animal for experimental mo 0, 1, and 3.

Chapter 2
30
2.4 Data ProcessingPressure distribution data were processed to perform statistical analysis. First, for each cow and hind leg, 1 recording per measurement session was selected for which the footscan software indicated no irregularities; the other hoof strike data obtained were not used for analysis. The selected hoof strike data were exported in ASCII-format and saved in Excel format (Microsoft Corp., Redmond, WA) for processing purposes. For each scan the number of touched sensors, total vertical force, maximum force for an individual sensor, and coordinates of center of pressure (COP) were calculated. Also, minimum and maximum x-and y-coordinates per hoof strike were calculated to express COP in terms of percentages of the range of possible x and y values. From these data for each hoof strike relative values (as a percentage of hoof strike average) for claw-floor contact area (CA), total vertical force(Fsum), maximum vertical force per sensor (Fmax), and center of pressure in a lateromedial direction (COPx) and in a craniocaudal direction (COPy) (as a percentage of maximum value per hoof strike) per percentage of total double-support phase time were calculated. In a complete 2-step cycle, all feet are in contact with the ground at the same time for about 25% of the time. This part of the cycle is called the double-support phase. Because COPx for the left and right foot develop in opposite directions, the values for COPx of the right hind legs were reversed. Furthermore, per footprint double-support phase time average claw-floor contact area (CAmean, cm2), corrected mean vertical force (Fmean), and double-support phase time (StT, ms) were calculated. Registered vertical forces were precorrected because preliminary analysis revealed large and unexplainable level differences between measurement sessions for this variable. These differences did not affect relative patterns during double-support phase time. Correction factors were ratios of the average BW of the animals measured and the average maximum forces for each measurement session. Double-support phase time was determined from first recorded claw-floor contact to final contact.
2.5 Statistical ProcedureClaw disorders were analyzed with Genstat statistical package (GenStat 9.2, 2007, VSN International, Hemel Hempstead, UK) with the following GLM model:
𝑌𝑌𝑌𝑌𝑖𝑖𝑖𝑖𝑖𝑖𝑖𝑖𝑖𝑖𝑖𝑖𝑖𝑖𝑖𝑖𝑖𝑖𝑖𝑖𝑖𝑖𝑖𝑖 = 𝜇𝜇𝜇𝜇 + 𝐹𝐹𝐹𝐹𝑖𝑖𝑖𝑖 + 𝑇𝑇𝑇𝑇𝑖𝑖𝑖𝑖 + 𝐹𝐹𝐹𝐹𝑖𝑖𝑖𝑖 ∗ 𝑇𝑇𝑇𝑇𝑖𝑖𝑖𝑖 + 𝐵𝐵𝐵𝐵𝐵𝐵𝐵𝐵𝑖𝑖𝑖𝑖 + 𝐶𝐶𝐶𝐶𝑖𝑖𝑖𝑖𝑖𝑖𝑖𝑖 + 𝑂𝑂𝑂𝑂𝑖𝑖𝑖𝑖 + 𝑒𝑒𝑒𝑒𝑖𝑖𝑖𝑖𝑖𝑖𝑖𝑖𝑖𝑖𝑖𝑖𝑖𝑖𝑖𝑖𝑖𝑖𝑖𝑖𝑖𝑖𝑖𝑖
where 𝑌𝑌𝑌𝑌𝑖𝑖𝑖𝑖𝑖𝑖𝑖𝑖𝑖𝑖𝑖𝑖𝑖𝑖𝑖𝑖𝑖𝑖𝑖𝑖𝑖𝑖𝑖𝑖 is the variable recorded for floor i, trimming method j, block of entry k, cow l within block k, observer m, and repeated observation n; 𝜇𝜇𝜇𝜇 is the overall mean; 𝐹𝐹𝐹𝐹𝑖𝑖𝑖𝑖 is the type of floor on which a cow was kept (SC, SR); 𝑇𝑇𝑇𝑇𝑖𝑖𝑖𝑖 represents trimming method (ST, HO); 𝐵𝐵𝐵𝐵𝐵𝐵𝐵𝐵𝑖𝑖𝑖𝑖represents the date of entry (k = 1, 5); 𝐶𝐶𝐶𝐶𝑖𝑖𝑖𝑖𝑖𝑖𝑖𝑖 is the individual animal effect (l = 1, 65); and 𝑂𝑂𝑂𝑂𝑖𝑖𝑖𝑖indicates the observer (m = 1, 3) performing the measurements; 𝐵𝐵𝐵𝐵𝐵𝐵𝐵𝐵𝑖𝑖𝑖𝑖, 𝐶𝐶𝐶𝐶𝑖𝑖𝑖𝑖𝑖𝑖𝑖𝑖, 𝑂𝑂𝑂𝑂𝑖𝑖𝑖𝑖, and the error term are the random components of the model. Data were analyzed separately for measurements at d 0 and after 1 and 3 mo with the above model, but data for mo 1 and 3 were analyzed with previous lesion scores as covariate added to the model. Measurements on left
Flooring and trimming
31
and right hind legs were treated as repeated observations on the same animal, and all lesion scores were analyzed as digital variables. Claw dimensions (claw angle, claw length, heel height, diagonal, and width) and claw growth and wear were analyzed with REML type analysis with Genstat with the following model:
𝑌𝑌𝑌𝑌𝑖𝑖𝑖𝑖𝑖𝑖𝑖𝑖𝑖𝑖𝑖𝑖𝑖𝑖𝑖𝑖𝑖𝑖𝑖𝑖𝑖𝑖𝑖𝑖 = 𝜇𝜇𝜇𝜇 + 𝐹𝐹𝐹𝐹𝑖𝑖𝑖𝑖 + 𝑇𝑇𝑇𝑇𝑖𝑖𝑖𝑖 + 𝐶𝐶𝐶𝐶𝐵𝐵𝐵𝐵𝑖𝑖𝑖𝑖 + 𝑏𝑏𝑏𝑏1 ∗ 𝑀𝑀𝑀𝑀𝑖𝑖𝑖𝑖 + 𝑏𝑏𝑏𝑏2 ∗ 𝑀𝑀𝑀𝑀𝑖𝑖𝑖𝑖2 + 𝑅𝑅𝑅𝑅𝑖𝑖𝑖𝑖 + 𝑒𝑒𝑒𝑒𝑖𝑖𝑖𝑖𝑖𝑖𝑖𝑖𝑖𝑖𝑖𝑖𝑖𝑖𝑖𝑖𝑖𝑖𝑖𝑖𝑖𝑖𝑖𝑖
where 𝑌𝑌𝑌𝑌𝑖𝑖𝑖𝑖𝑖𝑖𝑖𝑖𝑖𝑖𝑖𝑖𝑖𝑖𝑖𝑖𝑖𝑖𝑖𝑖𝑖𝑖𝑖𝑖 is the variable recorded for floor i, trimming method j, claw k, measurement l, random effects m, and repeated observation n; 𝜇𝜇𝜇𝜇 is the overall mean; 𝐹𝐹𝐹𝐹𝑖𝑖𝑖𝑖 is the type of floor on which a cow was kept (SC, SR); 𝑇𝑇𝑇𝑇𝑖𝑖𝑖𝑖 represents trimming method (ST, HO); 𝐶𝐶𝐶𝐶𝐵𝐵𝐵𝐵𝑖𝑖𝑖𝑖 is medial or lateral claw; and 𝑀𝑀𝑀𝑀𝑖𝑖𝑖𝑖 is the measurement (0, 1, or 3 mo). All interactions between fixed effects were tested and remained in the model when significant; 𝑅𝑅𝑅𝑅𝑖𝑖𝑖𝑖 indicates random effects for animal (1 to 65), leg within animal (left or right) and observer (m = 1, 3) performing the measurements. Values for claw angle, length, and width were log-transformed for analysis because the error terms otherwise were not normally distributed.Gait scores were analyzed with Genstat REML. The data were analyzed for eachmeasurement separately and for all measurements simultaneously with correction for time of measurement. Furthermore, for measurements at mo 1 and 3, analyses were done with a correction for gait score at d 0 and for measurements at mo 3 with correction for gait score at mo 1. The model was similar to that used for claw dimensions, except that claw was excluded and animal was the only random effect.The data from the IceTag sensors (percentages of time standing, lying, active, and number of steps) were analyzed with GLMM in Genstat. Although data could be retrieved per second, data were grouped per hour for final analysis. Fixed effects in the model were floor, trimming method, and interaction of floor and trimming method. Random effects corrected for block,hour, animal, day, and sensor.Development of PD parameters during stance time was analyzed with ASREML (Gilmour et al., 2006) with the following model:
𝑌𝑌𝑌𝑌𝑖𝑖𝑖𝑖𝑖𝑖𝑖𝑖𝑖𝑖𝑖𝑖𝑖𝑖𝑖𝑖𝑖𝑖𝑖𝑖𝑖𝑖𝑖𝑖𝑖𝑖𝑖𝑖 = 𝜇𝜇𝜇𝜇 + 𝑀𝑀𝑀𝑀𝑖𝑖𝑖𝑖 ∗ 𝐹𝐹𝐹𝐹𝑖𝑖𝑖𝑖 ∗ 𝑇𝑇𝑇𝑇𝑖𝑖𝑖𝑖 + 𝑃𝑃𝑃𝑃𝑃𝑃𝑃𝑃𝑖𝑖𝑖𝑖 + 𝑓𝑓𝑓𝑓�𝑃𝑃𝑃𝑃𝑃𝑃𝑃𝑃𝑖𝑖𝑖𝑖𝑖𝑖𝑖𝑖𝑖𝑖𝑖𝑖𝑖𝑖𝑖𝑖� + 𝐷𝐷𝐷𝐷𝑖𝑖𝑖𝑖 + 𝑅𝑅𝑅𝑅𝑖𝑖𝑖𝑖 + 𝑒𝑒𝑒𝑒𝑖𝑖𝑖𝑖𝑖𝑖𝑖𝑖𝑖𝑖𝑖𝑖𝑖𝑖𝑖𝑖𝑖𝑖𝑖𝑖𝑖𝑖𝑖𝑖𝑖𝑖𝑖𝑖
where 𝑌𝑌𝑌𝑌𝑖𝑖𝑖𝑖𝑖𝑖𝑖𝑖𝑖𝑖𝑖𝑖𝑖𝑖𝑖𝑖𝑖𝑖𝑖𝑖𝑖𝑖𝑖𝑖𝑖𝑖𝑖𝑖 is the variable recorded for measurement number i, floor j, trimming method k, percentage of time l, measurement date m, cow n, and repeated observation o; 𝜇𝜇𝜇𝜇 is the overall mean; 𝑀𝑀𝑀𝑀𝑖𝑖𝑖𝑖 represents measurement number (0, 1 or 3 mo); 𝐹𝐹𝐹𝐹𝑖𝑖𝑖𝑖 is the type of floor on which a cow was kept (SC, SR); 𝑇𝑇𝑇𝑇𝑖𝑖𝑖𝑖 represents trimming method (ST, HO); 𝑃𝑃𝑃𝑃𝑃𝑃𝑃𝑃𝑖𝑖𝑖𝑖 represents percentage of time during the hoof strike; 𝑓𝑓𝑓𝑓�𝑃𝑃𝑃𝑃𝑃𝑃𝑃𝑃𝑖𝑖𝑖𝑖𝑖𝑖𝑖𝑖𝑖𝑖𝑖𝑖𝑖𝑖𝑖𝑖� is a spline describing the effects percentage of time per measurement and treatment; 𝐷𝐷𝐷𝐷𝑖𝑖𝑖𝑖 represents the date of measurement (m = 1, 14); and 𝑅𝑅𝑅𝑅𝑖𝑖𝑖𝑖 is the individual animal effect (n = 1, 65); 𝐷𝐷𝐷𝐷𝑖𝑖𝑖𝑖, 𝑅𝑅𝑅𝑅𝑖𝑖𝑖𝑖, and the error term were the random components of the model. Step parameters per hoof strike derived from PD data were analyzed with a similar model (without terms for percentage of time).

2
Chapter 2
30
2.4 Data ProcessingPressure distribution data were processed to perform statistical analysis. First, for each cow and hind leg, 1 recording per measurement session was selected for which the footscan software indicated no irregularities; the other hoof strike data obtained were not used for analysis. The selected hoof strike data were exported in ASCII-format and saved in Excel format (Microsoft Corp., Redmond, WA) for processing purposes. For each scan the number of touched sensors, total vertical force, maximum force for an individual sensor, and coordinates of center of pressure (COP) were calculated. Also, minimum and maximum x-and y-coordinates per hoof strike were calculated to express COP in terms of percentages of the range of possible x and y values. From these data for each hoof strike relative values (as a percentage of hoof strike average) for claw-floor contact area (CA), total vertical force(Fsum), maximum vertical force per sensor (Fmax), and center of pressure in a lateromedial direction (COPx) and in a craniocaudal direction (COPy) (as a percentage of maximum value per hoof strike) per percentage of total double-support phase time were calculated. In a complete 2-step cycle, all feet are in contact with the ground at the same time for about 25% of the time. This part of the cycle is called the double-support phase. Because COPx for the left and right foot develop in opposite directions, the values for COPx of the right hind legs were reversed. Furthermore, per footprint double-support phase time average claw-floor contact area (CAmean, cm2), corrected mean vertical force (Fmean), and double-support phase time (StT, ms) were calculated. Registered vertical forces were precorrected because preliminary analysis revealed large and unexplainable level differences between measurement sessions for this variable. These differences did not affect relative patterns during double-support phase time. Correction factors were ratios of the average BW of the animals measured and the average maximum forces for each measurement session. Double-support phase time was determined from first recorded claw-floor contact to final contact.
2.5 Statistical ProcedureClaw disorders were analyzed with Genstat statistical package (GenStat 9.2, 2007, VSN International, Hemel Hempstead, UK) with the following GLM model:
𝑌𝑌𝑌𝑌𝑖𝑖𝑖𝑖𝑖𝑖𝑖𝑖𝑖𝑖𝑖𝑖𝑖𝑖𝑖𝑖𝑖𝑖𝑖𝑖𝑖𝑖𝑖𝑖 = 𝜇𝜇𝜇𝜇 + 𝐹𝐹𝐹𝐹𝑖𝑖𝑖𝑖 + 𝑇𝑇𝑇𝑇𝑖𝑖𝑖𝑖 + 𝐹𝐹𝐹𝐹𝑖𝑖𝑖𝑖 ∗ 𝑇𝑇𝑇𝑇𝑖𝑖𝑖𝑖 + 𝐵𝐵𝐵𝐵𝐵𝐵𝐵𝐵𝑖𝑖𝑖𝑖 + 𝐶𝐶𝐶𝐶𝑖𝑖𝑖𝑖𝑖𝑖𝑖𝑖 + 𝑂𝑂𝑂𝑂𝑖𝑖𝑖𝑖 + 𝑒𝑒𝑒𝑒𝑖𝑖𝑖𝑖𝑖𝑖𝑖𝑖𝑖𝑖𝑖𝑖𝑖𝑖𝑖𝑖𝑖𝑖𝑖𝑖𝑖𝑖𝑖𝑖
where 𝑌𝑌𝑌𝑌𝑖𝑖𝑖𝑖𝑖𝑖𝑖𝑖𝑖𝑖𝑖𝑖𝑖𝑖𝑖𝑖𝑖𝑖𝑖𝑖𝑖𝑖𝑖𝑖 is the variable recorded for floor i, trimming method j, block of entry k, cow l within block k, observer m, and repeated observation n; 𝜇𝜇𝜇𝜇 is the overall mean; 𝐹𝐹𝐹𝐹𝑖𝑖𝑖𝑖 is the type of floor on which a cow was kept (SC, SR); 𝑇𝑇𝑇𝑇𝑖𝑖𝑖𝑖 represents trimming method (ST, HO); 𝐵𝐵𝐵𝐵𝐵𝐵𝐵𝐵𝑖𝑖𝑖𝑖represents the date of entry (k = 1, 5); 𝐶𝐶𝐶𝐶𝑖𝑖𝑖𝑖𝑖𝑖𝑖𝑖 is the individual animal effect (l = 1, 65); and 𝑂𝑂𝑂𝑂𝑖𝑖𝑖𝑖indicates the observer (m = 1, 3) performing the measurements; 𝐵𝐵𝐵𝐵𝐵𝐵𝐵𝐵𝑖𝑖𝑖𝑖, 𝐶𝐶𝐶𝐶𝑖𝑖𝑖𝑖𝑖𝑖𝑖𝑖, 𝑂𝑂𝑂𝑂𝑖𝑖𝑖𝑖, and the error term are the random components of the model. Data were analyzed separately for measurements at d 0 and after 1 and 3 mo with the above model, but data for mo 1 and 3 were analyzed with previous lesion scores as covariate added to the model. Measurements on left
Flooring and trimming
31
and right hind legs were treated as repeated observations on the same animal, and all lesion scores were analyzed as digital variables. Claw dimensions (claw angle, claw length, heel height, diagonal, and width) and claw growth and wear were analyzed with REML type analysis with Genstat with the following model:
𝑌𝑌𝑌𝑌𝑖𝑖𝑖𝑖𝑖𝑖𝑖𝑖𝑖𝑖𝑖𝑖𝑖𝑖𝑖𝑖𝑖𝑖𝑖𝑖𝑖𝑖𝑖𝑖 = 𝜇𝜇𝜇𝜇 + 𝐹𝐹𝐹𝐹𝑖𝑖𝑖𝑖 + 𝑇𝑇𝑇𝑇𝑖𝑖𝑖𝑖 + 𝐶𝐶𝐶𝐶𝐵𝐵𝐵𝐵𝑖𝑖𝑖𝑖 + 𝑏𝑏𝑏𝑏1 ∗ 𝑀𝑀𝑀𝑀𝑖𝑖𝑖𝑖 + 𝑏𝑏𝑏𝑏2 ∗ 𝑀𝑀𝑀𝑀𝑖𝑖𝑖𝑖2 + 𝑅𝑅𝑅𝑅𝑖𝑖𝑖𝑖 + 𝑒𝑒𝑒𝑒𝑖𝑖𝑖𝑖𝑖𝑖𝑖𝑖𝑖𝑖𝑖𝑖𝑖𝑖𝑖𝑖𝑖𝑖𝑖𝑖𝑖𝑖𝑖𝑖
where 𝑌𝑌𝑌𝑌𝑖𝑖𝑖𝑖𝑖𝑖𝑖𝑖𝑖𝑖𝑖𝑖𝑖𝑖𝑖𝑖𝑖𝑖𝑖𝑖𝑖𝑖𝑖𝑖 is the variable recorded for floor i, trimming method j, claw k, measurement l, random effects m, and repeated observation n; 𝜇𝜇𝜇𝜇 is the overall mean; 𝐹𝐹𝐹𝐹𝑖𝑖𝑖𝑖 is the type of floor on which a cow was kept (SC, SR); 𝑇𝑇𝑇𝑇𝑖𝑖𝑖𝑖 represents trimming method (ST, HO); 𝐶𝐶𝐶𝐶𝐵𝐵𝐵𝐵𝑖𝑖𝑖𝑖 is medial or lateral claw; and 𝑀𝑀𝑀𝑀𝑖𝑖𝑖𝑖 is the measurement (0, 1, or 3 mo). All interactions between fixed effects were tested and remained in the model when significant; 𝑅𝑅𝑅𝑅𝑖𝑖𝑖𝑖 indicates random effects for animal (1 to 65), leg within animal (left or right) and observer (m = 1, 3) performing the measurements. Values for claw angle, length, and width were log-transformed for analysis because the error terms otherwise were not normally distributed.Gait scores were analyzed with Genstat REML. The data were analyzed for eachmeasurement separately and for all measurements simultaneously with correction for time of measurement. Furthermore, for measurements at mo 1 and 3, analyses were done with a correction for gait score at d 0 and for measurements at mo 3 with correction for gait score at mo 1. The model was similar to that used for claw dimensions, except that claw was excluded and animal was the only random effect.The data from the IceTag sensors (percentages of time standing, lying, active, and number of steps) were analyzed with GLMM in Genstat. Although data could be retrieved per second, data were grouped per hour for final analysis. Fixed effects in the model were floor, trimming method, and interaction of floor and trimming method. Random effects corrected for block,hour, animal, day, and sensor.Development of PD parameters during stance time was analyzed with ASREML (Gilmour et al., 2006) with the following model:
𝑌𝑌𝑌𝑌𝑖𝑖𝑖𝑖𝑖𝑖𝑖𝑖𝑖𝑖𝑖𝑖𝑖𝑖𝑖𝑖𝑖𝑖𝑖𝑖𝑖𝑖𝑖𝑖𝑖𝑖𝑖𝑖 = 𝜇𝜇𝜇𝜇 + 𝑀𝑀𝑀𝑀𝑖𝑖𝑖𝑖 ∗ 𝐹𝐹𝐹𝐹𝑖𝑖𝑖𝑖 ∗ 𝑇𝑇𝑇𝑇𝑖𝑖𝑖𝑖 + 𝑃𝑃𝑃𝑃𝑃𝑃𝑃𝑃𝑖𝑖𝑖𝑖 + 𝑓𝑓𝑓𝑓�𝑃𝑃𝑃𝑃𝑃𝑃𝑃𝑃𝑖𝑖𝑖𝑖𝑖𝑖𝑖𝑖𝑖𝑖𝑖𝑖𝑖𝑖𝑖𝑖� + 𝐷𝐷𝐷𝐷𝑖𝑖𝑖𝑖 + 𝑅𝑅𝑅𝑅𝑖𝑖𝑖𝑖 + 𝑒𝑒𝑒𝑒𝑖𝑖𝑖𝑖𝑖𝑖𝑖𝑖𝑖𝑖𝑖𝑖𝑖𝑖𝑖𝑖𝑖𝑖𝑖𝑖𝑖𝑖𝑖𝑖𝑖𝑖𝑖𝑖
where 𝑌𝑌𝑌𝑌𝑖𝑖𝑖𝑖𝑖𝑖𝑖𝑖𝑖𝑖𝑖𝑖𝑖𝑖𝑖𝑖𝑖𝑖𝑖𝑖𝑖𝑖𝑖𝑖𝑖𝑖𝑖𝑖 is the variable recorded for measurement number i, floor j, trimming method k, percentage of time l, measurement date m, cow n, and repeated observation o; 𝜇𝜇𝜇𝜇 is the overall mean; 𝑀𝑀𝑀𝑀𝑖𝑖𝑖𝑖 represents measurement number (0, 1 or 3 mo); 𝐹𝐹𝐹𝐹𝑖𝑖𝑖𝑖 is the type of floor on which a cow was kept (SC, SR); 𝑇𝑇𝑇𝑇𝑖𝑖𝑖𝑖 represents trimming method (ST, HO); 𝑃𝑃𝑃𝑃𝑃𝑃𝑃𝑃𝑖𝑖𝑖𝑖 represents percentage of time during the hoof strike; 𝑓𝑓𝑓𝑓�𝑃𝑃𝑃𝑃𝑃𝑃𝑃𝑃𝑖𝑖𝑖𝑖𝑖𝑖𝑖𝑖𝑖𝑖𝑖𝑖𝑖𝑖𝑖𝑖� is a spline describing the effects percentage of time per measurement and treatment; 𝐷𝐷𝐷𝐷𝑖𝑖𝑖𝑖 represents the date of measurement (m = 1, 14); and 𝑅𝑅𝑅𝑅𝑖𝑖𝑖𝑖 is the individual animal effect (n = 1, 65); 𝐷𝐷𝐷𝐷𝑖𝑖𝑖𝑖, 𝑅𝑅𝑅𝑅𝑖𝑖𝑖𝑖, and the error term were the random components of the model. Step parameters per hoof strike derived from PD data were analyzed with a similar model (without terms for percentage of time).

Chapter 2
32
3 RESULTS
3.1 Claw DisordersSignificance levels of the fixed effects in the model are in Table 1. Correction of observations at mo 1 for observations at d 0 and correction of observations at mo 3 for observations at mo 1 yielded similar results and are not presented. Adding parity (heifer vs. cow) to the model for claw disorders yielded very similar results. Differences between heifers and cows were only significant for sole hemorrhages at d 0, with a greater predicted mean prevalence for heifers than for cows (87 vs. 57%). Presence of digital dermatitis or interdigital dermatitis at d 0 significantly increased the likelihood of presence of these disorders later on, whereas this was not found for the other claw disorders. Floor by trimming interaction was significant for digital dermatitis at mo 3: predicted means for treatments were 0.11 for SC floor and ST trimming, 0.02 for SC floor and HO trimming, 0.03 for SR floor and ST trimming, and 0.13 for SR floor and HO trimming. These treatment differences were similar to those present at d 0, and probably do not indicate true interaction. Predicted mean prevalence of sole hemorrhages at mo 1 and 3 was significantly higher on SC (48% on both occasions) than on SR (16 and 22%, respectively), and on both floors, the prevalence of sole hemorrhages decreased after d 0. Apart from the results for digital dermatitis at mo 3, there was no evidence for an effect of trimming methods or interaction of trimming method and flooring on the prevalence of claw disorders.
3.2 Claw DimensionsSignificance levels of the fixed effects that remained in the model for claw dimensions are presented in Table 2. None of the claw dimensions was influenced by trimming method, although some interactions with trimming method were significant. The significance of time of measurement indicated that most of the claw dimensions changed during the experiment. The significance of claw (except for claw length) indicated that there were differences between medial and lateral claws in claw dimensions. The predicted means for claw dimensions for each measurement for medial and lateral claws on both floors are in Figure 3. Lateral claws had smaller claw angles than medial claws (P = 0.007), and the claw angles became smaller on the SR floor than on the SC floor because of a larger decrease after trimming on the SR floor (P < 0.001). Claw length was longer for the SR floor than for the SC floor (P < 0.001). Heel height and claw diagonal were larger for lateral claws (P < 0.001) on both floors, and increased more during the experiment on the SR floor (P = 0.0321 and P < 0.001 respectively). Claw width was similar for both floors, but lateral claws had larger values (P < 0.001) and a larger increase (P < 0.001) than medial claws. An increase in the distance from the coronary band to the growth marker was larger for lateral than for medial claws (P = 0.006) and was larger for the SC than the SR floor (P < 0.001). Decrease of distance from the growth marker to the sole was similar for medial and lateral claws, but was larger for the SC than SR floor (P < 0.001).
Flooring and trimming
33
Table 1. Incidence of claw disorders and P-values of flooring and trimming method1
Disorder Date2 Mean incidence (%)
Floor (F)Trimming method (T)
F × T Score at d 0
Digital dermatitis
d 0 15 0.481 0.766 0.116
mo 1 14 0.791 0.712 0.315
mo 3 13 0.851 0.905 0.049
mo 33 0.140 0.677 0.263 <0.001
Sole hemorrhages
d 0 68 0.173 0.286 0.523
mo 1 38 0.006 0.362 0.494
mo 3 42 0.021 0.645 0.211
mo 33 0.033 0.412 0.218 0.096
Interdigital dermatitis
d 0 12 0.395 0.580 0.619
mo 1 19 0.675 0.277 0.883
mo 3 29 0.393 0.948 0.681
mo 33 0.546 0.960 0.761 0.014
Other claw disease
d 0 6 0.898 0.187 0.987
mo 1 3 0.369 0.474 0.999
mo 3 11 0.293 0.300 0.205
mo 33 0.505 0.189 0.172 0.9401 P < 0.05 are significant.2 Date of measurement3 Model with correction for score at d 0.

2
Chapter 2
32
3 RESULTS
3.1 Claw DisordersSignificance levels of the fixed effects in the model are in Table 1. Correction of observations at mo 1 for observations at d 0 and correction of observations at mo 3 for observations at mo 1 yielded similar results and are not presented. Adding parity (heifer vs. cow) to the model for claw disorders yielded very similar results. Differences between heifers and cows were only significant for sole hemorrhages at d 0, with a greater predicted mean prevalence for heifers than for cows (87 vs. 57%). Presence of digital dermatitis or interdigital dermatitis at d 0 significantly increased the likelihood of presence of these disorders later on, whereas this was not found for the other claw disorders. Floor by trimming interaction was significant for digital dermatitis at mo 3: predicted means for treatments were 0.11 for SC floor and ST trimming, 0.02 for SC floor and HO trimming, 0.03 for SR floor and ST trimming, and 0.13 for SR floor and HO trimming. These treatment differences were similar to those present at d 0, and probably do not indicate true interaction. Predicted mean prevalence of sole hemorrhages at mo 1 and 3 was significantly higher on SC (48% on both occasions) than on SR (16 and 22%, respectively), and on both floors, the prevalence of sole hemorrhages decreased after d 0. Apart from the results for digital dermatitis at mo 3, there was no evidence for an effect of trimming methods or interaction of trimming method and flooring on the prevalence of claw disorders.
3.2 Claw DimensionsSignificance levels of the fixed effects that remained in the model for claw dimensions are presented in Table 2. None of the claw dimensions was influenced by trimming method, although some interactions with trimming method were significant. The significance of time of measurement indicated that most of the claw dimensions changed during the experiment. The significance of claw (except for claw length) indicated that there were differences between medial and lateral claws in claw dimensions. The predicted means for claw dimensions for each measurement for medial and lateral claws on both floors are in Figure 3. Lateral claws had smaller claw angles than medial claws (P = 0.007), and the claw angles became smaller on the SR floor than on the SC floor because of a larger decrease after trimming on the SR floor (P < 0.001). Claw length was longer for the SR floor than for the SC floor (P < 0.001). Heel height and claw diagonal were larger for lateral claws (P < 0.001) on both floors, and increased more during the experiment on the SR floor (P = 0.0321 and P < 0.001 respectively). Claw width was similar for both floors, but lateral claws had larger values (P < 0.001) and a larger increase (P < 0.001) than medial claws. An increase in the distance from the coronary band to the growth marker was larger for lateral than for medial claws (P = 0.006) and was larger for the SC than the SR floor (P < 0.001). Decrease of distance from the growth marker to the sole was similar for medial and lateral claws, but was larger for the SC than SR floor (P < 0.001).
Flooring and trimming
33
Table 1. Incidence of claw disorders and P-values of flooring and trimming method1
Disorder Date2 Mean incidence (%)
Floor (F)Trimming method (T)
F × T Score at d 0
Digital dermatitis
d 0 15 0.481 0.766 0.116
mo 1 14 0.791 0.712 0.315
mo 3 13 0.851 0.905 0.049
mo 33 0.140 0.677 0.263 <0.001
Sole hemorrhages
d 0 68 0.173 0.286 0.523
mo 1 38 0.006 0.362 0.494
mo 3 42 0.021 0.645 0.211
mo 33 0.033 0.412 0.218 0.096
Interdigital dermatitis
d 0 12 0.395 0.580 0.619
mo 1 19 0.675 0.277 0.883
mo 3 29 0.393 0.948 0.681
mo 33 0.546 0.960 0.761 0.014
Other claw disease
d 0 6 0.898 0.187 0.987
mo 1 3 0.369 0.474 0.999
mo 3 11 0.293 0.300 0.205
mo 33 0.505 0.189 0.172 0.9401 P < 0.05 are significant.2 Date of measurement3 Model with correction for score at d 0.

Chapter 2
34
Tabl
e 2.
Pro
babi
lity
(P-v
alue
s) o
f fix
ed e
ffect
s for
cla
w di
men
sions
1
Claw
trai
t
Mod
el te
rmA
ngle
Leng
thH
eigh
tD
iago
nal
Wid
thG
row
th2
Wea
r2
Claw
(Cl)
0.00
70.
151
<0.0
01<0
.001
<0.0
010.
006
<0.0
01
Floo
r(F)
0.02
8<0
.001
<0.0
01<0
.001
0.36
60.
497
<0.0
01
Mea
sure
men
t(M
) (lin
ear)
0.00
30.
365
0.30
8<0
.001
<0.0
01<0
.001
<0.0
01
Trim
min
g(T
)0.
391
0.27
50.
138
0.76
0.70
70.
997
0.36
3
F ×
M<0
.001
0.01
40.
032
<0.0
01<0
.001
<0.0
01
F ×
T0.
381
0.32
0.92
8
M ×
T0.
044
0.50
50.
007
F×M
×T0.
041
0.00
80.
428
Mea
sure
men
t (qu
adra
tic)
0.05
80.
352
Cl ×
M0.
275
<0.0
01<0
.001
<0.0
010.
026
Cl ×
T0.
065
0.63
0.15
5
Cl ×
F0.
355
0.07
8
Cl×T
×F0.
045
Cl×M
×F0.
027
1P
< 0.
05 a
re c
onsid
ered
sign
ifica
nt.
2Fo
r gr o
wth
and
wea
r dist
ance
s fro
m c
law
edg
e to
the
mar
ker w
ere
anal
yzed
.
Flooring and trimming
35
Figure 3. Development of claw shape per floor and claw.

2
Chapter 2
34
Tabl
e 2.
Pro
babi
lity
(P-v
alue
s) o
f fix
ed e
ffect
s for
cla
w di
men
sions
1
Claw
trai
t
Mod
el te
rmA
ngle
Leng
thH
eigh
tD
iago
nal
Wid
thG
row
th2
Wea
r2
Claw
(Cl)
0.00
70.
151
<0.0
01<0
.001
<0.0
010.
006
<0.0
01
Floo
r(F)
0.02
8<0
.001
<0.0
01<0
.001
0.36
60.
497
<0.0
01
Mea
sure
men
t(M
) (lin
ear)
0.00
30.
365
0.30
8<0
.001
<0.0
01<0
.001
<0.0
01
Trim
min
g(T
)0.
391
0.27
50.
138
0.76
0.70
70.
997
0.36
3
F ×
M<0
.001
0.01
40.
032
<0.0
01<0
.001
<0.0
01
F ×
T0.
381
0.32
0.92
8
M ×
T0.
044
0.50
50.
007
F×M
×T0.
041
0.00
80.
428
Mea
sure
men
t (qu
adra
tic)
0.05
80.
352
Cl ×
M0.
275
<0.0
01<0
.001
<0.0
010.
026
Cl ×
T0.
065
0.63
0.15
5
Cl ×
F0.
355
0.07
8
Cl×T
×F0.
045
Cl×M
×F0.
027
1P
< 0.
05 a
re c
onsid
ered
sign
ifica
nt.
2Fo
r gr o
wth
and
wea
r dist
ance
s fro
m c
law
edg
e to
the
mar
ker w
ere
anal
yzed
.
Flooring and trimming
35
Figure 3. Development of claw shape per floor and claw.

Chapter 2
36
Figure 4. Development of step characteristics during the double-support phase (stance) time.
Table 3. Probability (P-values) for development of claw-floor contact area, total vertical force, maximum vertical force per sensor, and center of pressure during claw-floor contact time.1
Trait2
Model term CA Fsum Fmax COPx COPy
Measurement number (M) 0.193 0.189 0.322 0.849 0.111
Floor (F) 0.606 0.814 0.937 0.935 0.173
Trimming method (T) 0.966 0.956 0.951 0.491 0.963
M × F 0.994 0.996 0.991 <0.001 <0.001
M × T 0.982 0.99 0.973 <0.001 <0.001
F × T 0.993 0.989 0.896 0.756 0.558
M×F×T 0.988 0.992 0.986 0.003 <0.001
Time (%) <0.001 <0.001 <0.001 <0.001 <0.0011 P < 0.05 are significant.2 CA = claw-floor contact area; Fsum = total vertical force; Fmax = maximum vertical force per sensor; COPx = center of pressure in lateromedial direction; COPy = center of pressure in craniocaudal direction.
Flooring and trimming
37
Table 4. Predicted mean values for step characteristics and P-values for model factors1
Trait2
CAmean (cm2) Fmean3 StT (ms)
Mean ± SE 33.1 ± 1.7 413.5 ± 6.5 869.8 ± 14.8
Model factor
Measurement number (M) 0.178 0.002 0.266
Floor (F) <0.001 <0.001 0.517
Trimming method (T) 0.017 0.782 0.898
M×F <0.001 <0.001 0.687
M×T <0.001 0.016 0.154
F×T 0.565 0.5 0.777
M×F×T 0.791 0.944 0.7631 P < 0.05 are significant.2 CAmean = average claw-floor contact area; Fmean = corrected mean vertical force; StT = double-support phase (stance) time.3 Due to correction, Fmean is a unitless variable.
3.3 Gait ScoresGait scores at d 0 (1.7 ± 0.6), 1 mo (1.6 ± 0.6), 3 mo (1.7 ± 0.6), and overall gait scores corrected for measurement (1.7 ± 0.4) were not significantly influenced by floor or trimming method, indicating that gait scores remained stable throughout the experiment. Analysis of 1-mo gait scores corrected for gait score at d 0 and of 3-mo gait scores corrected for gait score at d 0 or at 1 mo revealed similar results. The maximum gait score was 4.
3.4 Activity MeasuresActivity traits were not significantly different between trimming methods, and no interactions of flooring and trimming method were found. Floor effects indicated there was more standing (55.4 ± 2.8 vs. 49.6 ± 2.8%; P < 0.001), more activity (4.9 ± 0.7 vs. 4.4 ± 0.7%; P < 0.001), and more steps (61 ± 3.7 vs. 53 ± 3.7; P < 0.001) for the cows on the SR floor compared with cows on the SC floor. Yet, the percentage of lying time was greater for cows on SC than SR(44.8 ± 3.9 vs. 38.2 ± 3.0; P < 0.014). The IceTag data were linked to the scores for sole hemorrhages. Although these data were not statistically analyzed, cows without sole hemorrhages at mo 1 and 3 spent more time standing in the alleys (54 vs. 50%) and made more steps (60 vs. 54) than the animals with sole hemorrhages. Most animals with sole hemorrhages were from the SC floor, and cows on this floor generally stood and stepped less. The greater activity of cows on the SR floor was reflected in shorter milking intervals for SR

2
Chapter 2
36
Figure 4. Development of step characteristics during the double-support phase (stance) time.
Table 3. Probability (P-values) for development of claw-floor contact area, total vertical force, maximum vertical force per sensor, and center of pressure during claw-floor contact time.1
Trait2
Model term CA Fsum Fmax COPx COPy
Measurement number (M) 0.193 0.189 0.322 0.849 0.111
Floor (F) 0.606 0.814 0.937 0.935 0.173
Trimming method (T) 0.966 0.956 0.951 0.491 0.963
M × F 0.994 0.996 0.991 <0.001 <0.001
M × T 0.982 0.99 0.973 <0.001 <0.001
F × T 0.993 0.989 0.896 0.756 0.558
M×F×T 0.988 0.992 0.986 0.003 <0.001
Time (%) <0.001 <0.001 <0.001 <0.001 <0.0011 P < 0.05 are significant.2 CA = claw-floor contact area; Fsum = total vertical force; Fmax = maximum vertical force per sensor; COPx = center of pressure in lateromedial direction; COPy = center of pressure in craniocaudal direction.
Flooring and trimming
37
Table 4. Predicted mean values for step characteristics and P-values for model factors1
Trait2
CAmean (cm2) Fmean3 StT (ms)
Mean ± SE 33.1 ± 1.7 413.5 ± 6.5 869.8 ± 14.8
Model factor
Measurement number (M) 0.178 0.002 0.266
Floor (F) <0.001 <0.001 0.517
Trimming method (T) 0.017 0.782 0.898
M×F <0.001 <0.001 0.687
M×T <0.001 0.016 0.154
F×T 0.565 0.5 0.777
M×F×T 0.791 0.944 0.7631 P < 0.05 are significant.2 CAmean = average claw-floor contact area; Fmean = corrected mean vertical force; StT = double-support phase (stance) time.3 Due to correction, Fmean is a unitless variable.
3.3 Gait ScoresGait scores at d 0 (1.7 ± 0.6), 1 mo (1.6 ± 0.6), 3 mo (1.7 ± 0.6), and overall gait scores corrected for measurement (1.7 ± 0.4) were not significantly influenced by floor or trimming method, indicating that gait scores remained stable throughout the experiment. Analysis of 1-mo gait scores corrected for gait score at d 0 and of 3-mo gait scores corrected for gait score at d 0 or at 1 mo revealed similar results. The maximum gait score was 4.
3.4 Activity MeasuresActivity traits were not significantly different between trimming methods, and no interactions of flooring and trimming method were found. Floor effects indicated there was more standing (55.4 ± 2.8 vs. 49.6 ± 2.8%; P < 0.001), more activity (4.9 ± 0.7 vs. 4.4 ± 0.7%; P < 0.001), and more steps (61 ± 3.7 vs. 53 ± 3.7; P < 0.001) for the cows on the SR floor compared with cows on the SC floor. Yet, the percentage of lying time was greater for cows on SC than SR(44.8 ± 3.9 vs. 38.2 ± 3.0; P < 0.014). The IceTag data were linked to the scores for sole hemorrhages. Although these data were not statistically analyzed, cows without sole hemorrhages at mo 1 and 3 spent more time standing in the alleys (54 vs. 50%) and made more steps (60 vs. 54) than the animals with sole hemorrhages. Most animals with sole hemorrhages were from the SC floor, and cows on this floor generally stood and stepped less. The greater activity of cows on the SR floor was reflected in shorter milking intervals for SR

Chapter 2
38
floor with ST trimming and SR floor with HO trimming (465 ± 70 and 479 ± 77 min) than for SC floor with ST trimming and SC floor with HO trimming (504 ± 68 and 519 ± 81 min). Despite that, average daily yields (33.0 ± 4.7, 33.1 ± 5.6, 34.4 ± 5.1, and 33.8 ± 5.6 kg/d for SR+ST, SR+HO, SC+ST, and SC+HO) were not significantly different between treatment groups.
3.5 Step MeasuresSignificance levels of fixed effects for development of step measures during double-support phase time are summarized in Table 3. Because these variables were expressed as percentage of mean values, means are omitted. All variables changed significantly during the double-support phase. Residual variance of COPx was larger than that of COPy (63.6 vs. 43.5). Predicted patterns for all traits were calculated with the full model and compared; this revealed that the patterns were not different for the 3 measurements or treatment classes, despite the significance of measurement date (0, 1, or 3 mo) by floor type, measurement date by trimming method, and measurement date by floor type by trimming method interactions for these traits. Therefore, overall patterns are presented in Figure 4. Claw-floor contact area increased to a maximum in the first 30% of double-support phase time, remained more or less stable until 80% of double-support phase time, and decreased sharply until push off. Total vertical force showed a similar pattern. Maximum vertical force per sensor had low values only in the early and late stages of a step. The COP for hind legs slowly shifted in medial and forward direction. Weight was clearly shifted to the front part of the claw in the last 20% of double-support phase time. Predicted mean values and significance of effects for step measures are summarized in Table 4. For CAmean differences between SR and SC floors (30.2 ± 1.8 and 36.0 ± 1.7 cm2, respectively) and trimming methods (31.9 ± 1.8 and 34.2 ± 1.7 cm2 for HO and ST, respectively) were significant, and both these factors interacted with measurement number. The floor type by trimming method interactions were not significant for any of these traits, indicating that flooring did not affect the effects of trimming. Standing time was not affected by treatment factors and did not change over time. The estimates for CAmean for treatment groups are presented in Figure 5. This figure shows that CAmean on SC quickly increased after trimming for both trimming methods. Differences between floors increased toward the end of the experiment. Hollow trimming resulted in smaller CAmean values at d 0 (26.3 ± 2.9 vs. 31.9 ± 2.9 cm2), but the difference with standard trimming diminished within 1 mo after trimming and had completely disappeared at the end of the experiment for both floors. Predicted means for Fmean for treatment groups for the 3 measurement months are presented in Figure 6. Figures for the third measurement were clearly different from the other 2 measurements. Only for this measurement was there a substantial difference in Fmean between both floor types (495 ± 17 for SC vs. 350 ± 19 for SR); it is remarkable that both Fmean and CAmean (39.6 ± 2.9 for SC vs. 28.7 ± 3.0 for SR) were lower for the SR floor.
Flooring and trimming
39
Figure 5. Predicted mean values (±SE) for claw-floor contact area for treatment groups.
Figure 6. Predicted mean corrected values (±SE) for vertical force for treatment groups.

2
Chapter 2
38
floor with ST trimming and SR floor with HO trimming (465 ± 70 and 479 ± 77 min) than for SC floor with ST trimming and SC floor with HO trimming (504 ± 68 and 519 ± 81 min). Despite that, average daily yields (33.0 ± 4.7, 33.1 ± 5.6, 34.4 ± 5.1, and 33.8 ± 5.6 kg/d for SR+ST, SR+HO, SC+ST, and SC+HO) were not significantly different between treatment groups.
3.5 Step MeasuresSignificance levels of fixed effects for development of step measures during double-support phase time are summarized in Table 3. Because these variables were expressed as percentage of mean values, means are omitted. All variables changed significantly during the double-support phase. Residual variance of COPx was larger than that of COPy (63.6 vs. 43.5). Predicted patterns for all traits were calculated with the full model and compared; this revealed that the patterns were not different for the 3 measurements or treatment classes, despite the significance of measurement date (0, 1, or 3 mo) by floor type, measurement date by trimming method, and measurement date by floor type by trimming method interactions for these traits. Therefore, overall patterns are presented in Figure 4. Claw-floor contact area increased to a maximum in the first 30% of double-support phase time, remained more or less stable until 80% of double-support phase time, and decreased sharply until push off. Total vertical force showed a similar pattern. Maximum vertical force per sensor had low values only in the early and late stages of a step. The COP for hind legs slowly shifted in medial and forward direction. Weight was clearly shifted to the front part of the claw in the last 20% of double-support phase time. Predicted mean values and significance of effects for step measures are summarized in Table 4. For CAmean differences between SR and SC floors (30.2 ± 1.8 and 36.0 ± 1.7 cm2, respectively) and trimming methods (31.9 ± 1.8 and 34.2 ± 1.7 cm2 for HO and ST, respectively) were significant, and both these factors interacted with measurement number. The floor type by trimming method interactions were not significant for any of these traits, indicating that flooring did not affect the effects of trimming. Standing time was not affected by treatment factors and did not change over time. The estimates for CAmean for treatment groups are presented in Figure 5. This figure shows that CAmean on SC quickly increased after trimming for both trimming methods. Differences between floors increased toward the end of the experiment. Hollow trimming resulted in smaller CAmean values at d 0 (26.3 ± 2.9 vs. 31.9 ± 2.9 cm2), but the difference with standard trimming diminished within 1 mo after trimming and had completely disappeared at the end of the experiment for both floors. Predicted means for Fmean for treatment groups for the 3 measurement months are presented in Figure 6. Figures for the third measurement were clearly different from the other 2 measurements. Only for this measurement was there a substantial difference in Fmean between both floor types (495 ± 17 for SC vs. 350 ± 19 for SR); it is remarkable that both Fmean and CAmean (39.6 ± 2.9 for SC vs. 28.7 ± 3.0 for SR) were lower for the SR floor.
Flooring and trimming
39
Figure 5. Predicted mean values (±SE) for claw-floor contact area for treatment groups.
Figure 6. Predicted mean corrected values (±SE) for vertical force for treatment groups.

Chapter 2
40
4 DISCUSSIONThe hypothesis was that the standard Dutch flat trimming method provides suboptimal results compared with the alternative hollow trimming on soft floors. This was based on 2 phenomena. First, results from PD plate measurements showed that the sole area under the claw bone was loaded relatively heavily after trimming by the Dutch method (Van der Tol et al., 2004). Second, some studies have indicated that soft floors result in lesser wear and larger claws (Kremer et al., 2007; Telezhenko, 2007). Removal of horn in the sole area under the claw bone was expected to reduce the load on this sensitive area, and thus improve locomotion. On hard and more abrasive floors the smaller claw floor contact area might eventually cause increased wear and result in thinner soles, but on soft floors, this method was expected to have beneficial effects. The hypothesis was not supported by our findings. None of the traits studied showed an interaction of flooring and trimming method. Nevertheless, effects of trimming method were significant for claw-floor contact area. Differences in CAmean between trimming methods quickly disappeared after trimming. There were no indications that alternative trimming on hard floors increased horn wear. It remains unclear which trimming method is optimal under the given conditions in the long term. Nuss and Paulus (2006) argued that the standard Dutch trimming method can result in excessive thinning of soles of lateral claws. Thinning soles could be exacerbated by paring out the soles in the areas A and B (Figure 1) if not done correctly, but this was not the case with our alternative method. Nuss and Paulus (2006) suggest that medial claw soles should be 8 mm thick instead of 5 mm. All animals in our experiment were kept in a pen with a concrete slatted floor before calving and were trimmed according to the standard Dutch method at drying off. Because claw conformation changes only gradually, the claws of the experimental cows on the SR floor may not have been representative of claws of cows kept on soft floors for a longer period. If cows are kept on soft flooring for a longer time and sole concavity can be maintained during trimming instead of created by paring out soles, the results might have been different. Although claw dimensions were not measured before trimming, the larger claw length after trimming for the cows on SR floor suggests that flooring affected the claw shape of the cows at the start of the study. Therefore, these cows, to some extent, do represent animals kept on different floor systems. Our results suggest that differences between hard and soft flooring are more relevant for claw health and conformation and locomotor behavior than differences between the trimming methods we applied, although only sole hemorrhages occurred significantly less on the soft floor. Fjeldaas et al. (2006) reported that routine claw trimming did not improve claw health and claw shape in free stalls, but a preventive effect was found for claw disorders in tie stalls, suggesting that the Norwegian claw trimming method was not adjusted to free-stall housing and flooring. Manske et al. (2002) reported beneficial effects of trimming on claw health for herds mostly kept in tie stalls. They did not report differences in effects of trimming between tie stalls and free stalls. Therefore, it can be speculated that regular trimming is important for good claw health and that different housing conditions may have different optimal trimming methods,
Flooring and trimming
41
but that the methods we applied did not differ substantially despite the initial change in pressure patterns after trimming.The reasons why we did not find significant effects of trimming could be the limited size of the experimental groups or the short duration of the experiment. Still, predicted means of trimming methods for claw dimensions were not different for any of the measurements. Furthermore, differences between floor groups in claw dimensions were established within the same time frame. Thus, it is not expected that trimming effects would become significant with substantially larger experimental groups or a longer study period. Moreover, if cows were trimmed again at drying off, effects of the initial trimming would be obscured thereafter.Supporting the results of Jungbluth et al. (2003) and Kremer et al. (2007), a significant difference between the floors appeared in mo 1 and 3 for sole hemorrhages. Nonetheless, an experimental study on the same floors (P. P. J. Van der Tol; unpublished data) did not reveal significant differences for sole hemorrhages. Similarly, Boyle et al. (2007) reported no effect of rubber flooring on hemorrhages. Differences between the latter study and our study might be explained in part by differences in rubber quality and rubber thickness. Most hemorrhages we observed were mild or small discolorations. In all treatment groups there was a marked decline in prevalence of hemorrhages in the first month of the experiment. The majority of hemorrhages present during the study may have had their origin in the period before claws were trimmed. The greater reduction of sole hemorrhages found on soft floors could be due to a reduced mechanical load.No differences between floors were found for the other claw disorders, in line with the results of Boyle et al. (2007), Kremer et al. (2007), and Vanegas et al. (2006). Although observer differences explained some variation, differences between the 3 experienced people who scored the lesions were small, and analysis without correction for observer differences yielded similar results. The significance of the lesion score at d 0 for scores obtained at mo 1 and 3 for both digital dermatitis and interdigital dermatitis illustrated the chronic character of these disorders. The significance of the interaction between floor and trimming method for digital dermatitis at mo 3 was probably influenced by initial differences in prevalence between treatment groups, as the predicted treatment means were similar to those at d 0.The results of this study regarding claw dimensions support earlier findings (Vanegas et al., 2006; Kremer et al., 2007; Telezhenko, 2007) with regard to flooring. Soft floors resulted in lower growth and wear and smaller claw angles, and cows on the SR floor had somewhat larger claws. Except for CAmean immediately after trimming, trimming method did not affect any of the claw shape measures until 3 mo later. The differences we found between lateral and medial claws agree with the results of Nuss and Paulus (2006), who also reported significantly larger size of lateral hind claws.Similar to other studies (Vanegas et al., 2006; Kremer et al., 2007) we did not find significant differences between treatments in gait scores. The cows were filmed when they were forced to walk on a strip of concrete slatted floor outside of their home area. Thus, the gait scores obtained may not represent the voluntary locomotion of the animals on their home floors. Despite the absence of floor effects on gait scores, the IceTag data revealed less activity and less standing for cows on the SC floor. This supports the results of Kremer et al. (2007), but

2
Chapter 2
40
4 DISCUSSIONThe hypothesis was that the standard Dutch flat trimming method provides suboptimal results compared with the alternative hollow trimming on soft floors. This was based on 2 phenomena. First, results from PD plate measurements showed that the sole area under the claw bone was loaded relatively heavily after trimming by the Dutch method (Van der Tol et al., 2004). Second, some studies have indicated that soft floors result in lesser wear and larger claws (Kremer et al., 2007; Telezhenko, 2007). Removal of horn in the sole area under the claw bone was expected to reduce the load on this sensitive area, and thus improve locomotion. On hard and more abrasive floors the smaller claw floor contact area might eventually cause increased wear and result in thinner soles, but on soft floors, this method was expected to have beneficial effects. The hypothesis was not supported by our findings. None of the traits studied showed an interaction of flooring and trimming method. Nevertheless, effects of trimming method were significant for claw-floor contact area. Differences in CAmean between trimming methods quickly disappeared after trimming. There were no indications that alternative trimming on hard floors increased horn wear. It remains unclear which trimming method is optimal under the given conditions in the long term. Nuss and Paulus (2006) argued that the standard Dutch trimming method can result in excessive thinning of soles of lateral claws. Thinning soles could be exacerbated by paring out the soles in the areas A and B (Figure 1) if not done correctly, but this was not the case with our alternative method. Nuss and Paulus (2006) suggest that medial claw soles should be 8 mm thick instead of 5 mm. All animals in our experiment were kept in a pen with a concrete slatted floor before calving and were trimmed according to the standard Dutch method at drying off. Because claw conformation changes only gradually, the claws of the experimental cows on the SR floor may not have been representative of claws of cows kept on soft floors for a longer period. If cows are kept on soft flooring for a longer time and sole concavity can be maintained during trimming instead of created by paring out soles, the results might have been different. Although claw dimensions were not measured before trimming, the larger claw length after trimming for the cows on SR floor suggests that flooring affected the claw shape of the cows at the start of the study. Therefore, these cows, to some extent, do represent animals kept on different floor systems. Our results suggest that differences between hard and soft flooring are more relevant for claw health and conformation and locomotor behavior than differences between the trimming methods we applied, although only sole hemorrhages occurred significantly less on the soft floor. Fjeldaas et al. (2006) reported that routine claw trimming did not improve claw health and claw shape in free stalls, but a preventive effect was found for claw disorders in tie stalls, suggesting that the Norwegian claw trimming method was not adjusted to free-stall housing and flooring. Manske et al. (2002) reported beneficial effects of trimming on claw health for herds mostly kept in tie stalls. They did not report differences in effects of trimming between tie stalls and free stalls. Therefore, it can be speculated that regular trimming is important for good claw health and that different housing conditions may have different optimal trimming methods,
Flooring and trimming
41
but that the methods we applied did not differ substantially despite the initial change in pressure patterns after trimming.The reasons why we did not find significant effects of trimming could be the limited size of the experimental groups or the short duration of the experiment. Still, predicted means of trimming methods for claw dimensions were not different for any of the measurements. Furthermore, differences between floor groups in claw dimensions were established within the same time frame. Thus, it is not expected that trimming effects would become significant with substantially larger experimental groups or a longer study period. Moreover, if cows were trimmed again at drying off, effects of the initial trimming would be obscured thereafter.Supporting the results of Jungbluth et al. (2003) and Kremer et al. (2007), a significant difference between the floors appeared in mo 1 and 3 for sole hemorrhages. Nonetheless, an experimental study on the same floors (P. P. J. Van der Tol; unpublished data) did not reveal significant differences for sole hemorrhages. Similarly, Boyle et al. (2007) reported no effect of rubber flooring on hemorrhages. Differences between the latter study and our study might be explained in part by differences in rubber quality and rubber thickness. Most hemorrhages we observed were mild or small discolorations. In all treatment groups there was a marked decline in prevalence of hemorrhages in the first month of the experiment. The majority of hemorrhages present during the study may have had their origin in the period before claws were trimmed. The greater reduction of sole hemorrhages found on soft floors could be due to a reduced mechanical load.No differences between floors were found for the other claw disorders, in line with the results of Boyle et al. (2007), Kremer et al. (2007), and Vanegas et al. (2006). Although observer differences explained some variation, differences between the 3 experienced people who scored the lesions were small, and analysis without correction for observer differences yielded similar results. The significance of the lesion score at d 0 for scores obtained at mo 1 and 3 for both digital dermatitis and interdigital dermatitis illustrated the chronic character of these disorders. The significance of the interaction between floor and trimming method for digital dermatitis at mo 3 was probably influenced by initial differences in prevalence between treatment groups, as the predicted treatment means were similar to those at d 0.The results of this study regarding claw dimensions support earlier findings (Vanegas et al., 2006; Kremer et al., 2007; Telezhenko, 2007) with regard to flooring. Soft floors resulted in lower growth and wear and smaller claw angles, and cows on the SR floor had somewhat larger claws. Except for CAmean immediately after trimming, trimming method did not affect any of the claw shape measures until 3 mo later. The differences we found between lateral and medial claws agree with the results of Nuss and Paulus (2006), who also reported significantly larger size of lateral hind claws.Similar to other studies (Vanegas et al., 2006; Kremer et al., 2007) we did not find significant differences between treatments in gait scores. The cows were filmed when they were forced to walk on a strip of concrete slatted floor outside of their home area. Thus, the gait scores obtained may not represent the voluntary locomotion of the animals on their home floors. Despite the absence of floor effects on gait scores, the IceTag data revealed less activity and less standing for cows on the SC floor. This supports the results of Kremer et al. (2007), but

Chapter 2
42
does not completely agree with results of Boyle et al. (2007). These authors reported similar standing times for cows on concrete and cows on rubber alley floors, but more standing in the free stalls for concrete floors. It is tempting to interpret the higher activity level on the SR floor as a sign of improved claw comfort, but it remains uncertain whether this finding coincided with better locomotion.In line with the other measures, step traits revealed some effects of flooring but no effects of trimming. Patterns during the double-support phase were very similar for all treatments, however, and similar for the succeeding measurements. This indicated there were likely no subtle effects of treatments on step characteristics. Meyer et al. (2007) reported that trimming affected the area of first claw-floor contact for cows on a treadmill. Differences in CAmean between the 2 trimming methods disappeared quickly after trimming; this could explain the absence of effects of trimming on other measures. Compared with values reported by Telezhenko (2007) our values for CAmean are high. This is not expected to affect our results regarding treatment effects, because measurement sessions were balanced over treatments. The lower (corrected) Fmean for the SR floor and higher Fmean for the SC floor at the third measurement are remarkable. It would be expected that the larger CAmean, which is in agreement with results for claw dimensions, would result in lower values for Fmean for the SC floor. These results need to be treated with some caution.
5 CONCLUSIONSThe hypothesis that the alternative hollow trimming method is preferred over the standard Dutch method for cows on soft floors in a 3-mo time window was rejected. No interactions were found between flooring and trimming method, and none of the claw health or locomotion traits studied differed for the trimming methods. Cows on the rubber-topped floor had significantly fewer sole hemorrhages, spent more time standing, and had higher activity. Claw angles significantly decreased within 3 mo after trimming for all treatments, and claw dimensions generally increased. Cows developed larger claws with smaller angles and smaller claw-floor contact area on rubber-topped floors compared with concrete floors. Development of pressure patterns during the double-support phase time was similar for all treatments. Claw-floor contact area increased to a maximum in the first 30% of double-support phase time, remained more or less stable until 80% of double-support phase time, and sharply decreased as the leg pushed off.
6 ACKNOWLEDGMENTSThe support of the staff of research farm the Waiboerhoeve (especially Gerard de Bree and Jan van Dieren) is appreciated and we are indebted to Klaas Blanken and Sjieuwke Wind for their assistance with data collection, Johan van Riel for statistical analysis, and Piet Kloosterman for trimming instruction. The work was supported by RsScan International
Flooring and trimming
43
(Olen, Belgium) and was funded by the Dutch Ministry of Agriculture, Nature and Food Quality (LNV), research program Animal Welfare (P434).

2
Chapter 2
42
does not completely agree with results of Boyle et al. (2007). These authors reported similar standing times for cows on concrete and cows on rubber alley floors, but more standing in the free stalls for concrete floors. It is tempting to interpret the higher activity level on the SR floor as a sign of improved claw comfort, but it remains uncertain whether this finding coincided with better locomotion.In line with the other measures, step traits revealed some effects of flooring but no effects of trimming. Patterns during the double-support phase were very similar for all treatments, however, and similar for the succeeding measurements. This indicated there were likely no subtle effects of treatments on step characteristics. Meyer et al. (2007) reported that trimming affected the area of first claw-floor contact for cows on a treadmill. Differences in CAmean between the 2 trimming methods disappeared quickly after trimming; this could explain the absence of effects of trimming on other measures. Compared with values reported by Telezhenko (2007) our values for CAmean are high. This is not expected to affect our results regarding treatment effects, because measurement sessions were balanced over treatments. The lower (corrected) Fmean for the SR floor and higher Fmean for the SC floor at the third measurement are remarkable. It would be expected that the larger CAmean, which is in agreement with results for claw dimensions, would result in lower values for Fmean for the SC floor. These results need to be treated with some caution.
5 CONCLUSIONSThe hypothesis that the alternative hollow trimming method is preferred over the standard Dutch method for cows on soft floors in a 3-mo time window was rejected. No interactions were found between flooring and trimming method, and none of the claw health or locomotion traits studied differed for the trimming methods. Cows on the rubber-topped floor had significantly fewer sole hemorrhages, spent more time standing, and had higher activity. Claw angles significantly decreased within 3 mo after trimming for all treatments, and claw dimensions generally increased. Cows developed larger claws with smaller angles and smaller claw-floor contact area on rubber-topped floors compared with concrete floors. Development of pressure patterns during the double-support phase time was similar for all treatments. Claw-floor contact area increased to a maximum in the first 30% of double-support phase time, remained more or less stable until 80% of double-support phase time, and sharply decreased as the leg pushed off.
6 ACKNOWLEDGMENTSThe support of the staff of research farm the Waiboerhoeve (especially Gerard de Bree and Jan van Dieren) is appreciated and we are indebted to Klaas Blanken and Sjieuwke Wind for their assistance with data collection, Johan van Riel for statistical analysis, and Piet Kloosterman for trimming instruction. The work was supported by RsScan International
Flooring and trimming
43
(Olen, Belgium) and was funded by the Dutch Ministry of Agriculture, Nature and Food Quality (LNV), research program Animal Welfare (P434).

Chapter 2
44
REFERENCESBoyle, L.A., Mee, J.F., Kiernan, P.J., 2007. The effect of rubber versus concrete passageways
in cubicle housing on claw health and reproduction of pluriparous dairy cows. Applied Animal Behaviour Science 106, 1-12.
Fjeldaas, T., Sogstad, Å.M., Østerås, O., 2006. Claw trimming routines in relation to claw lesions, claw shape and lameness in Norwegian dairy herds housed in tie stalls and free stalls. Preventive Veterinary Medicine 73, 255-271.
Flower, F.C., de Passillé, A.M., Weary, D.M., Sanderson, D.J., Rushen, J., 2007. Softer, higher-friction flooring improves gait of cows with and without sole ulcers. Journal of Dairy Science 90, 1235-1242.
Galindo, F., Broom, D.M., 2002. The effects of lameness on social and individual behavior of dairy cows. Journal of Applied Animal Welfare Science 5, 193-201.
Gilmour, A.R., Gogel, B.J., Cullis, B.R., Thompson, R., 2006. ASREML User Guide Release 2.0. VSN International Ltd., Hemel Hempstead, UK.
Holzhauer, M., 2006. Claw health in dairy cows in the Netherlands. Epidemiological aspects of different claw disorders in dairy cattle in the Netherlands. PhD thesis, Veterinary Faculty Utrecht University, Utrecht, the Netherlands.
Holzhauer, M., Bartels, C.J.M., van den Borne, B.H.P., van Schaik, G., 2006. Intra-class correlation attributable to claw trimmers scoring common hind-claw disorders in Dutch dairy herds. Preventive Veterinary Medicine 75, 47-55.
Jungbluth, T., Benz, B., Wandel, H., 2003. Soft walking on loose housing systems for dairy cows. Pages 171–177 in Proc. 5th Int. Dairy Housing Conf., Fort Worth, TX. Am. Soc. Agric. Eng., St. Joseph, MI.
Kremer, P., Nueske, S., Scholz, A., Foerster, M., 2007. Comparison of claw health and milk yield in dairy cows on elastic or concrete flooring. Journal of Dairy Science 90, 4603-4611.
Manske, T., Hultgren, J., Bergsten, C., 2002. The effect of claw trimming on the hoof health of Swedish dairy cattle. Preventive Veterinary Medicine 54, 113-129.
Manson, F.J., Leaver, J.D., 1988. The influence of concentrate amount on locomotion and clinical lameness in dairy cattle. Anim Prod 47.
Meyer, S.W., Weishaupt, M.A., Nuss, K.A., 2007. Gait pattern of heifers before and after claw trimming: A high-speed cinematographic study on a treadmill. Journal of Dairy Science 90, 670-676.
Nuss, K., Paulus, N., 2006. Measurements of claw dimensions in cows before and after functional trimming: A post-mortem study. The Veterinary Journal 172, 284-292.
Rushen, J., De Passillé, A., 2006. Effects of roughness and compressibility of flooring on cow locomotion. Journal of Dairy Science 89, 2965-2972.
Sogstad, Å.M., Fjeldaas, T., Østerås, O., Forshell, K.P., 2005. Prevalence of claw lesions in Norwegian dairy cattle housed in tie stalls and free stalls. Preventive Veterinary Medicine 70, 191-209.
Flooring and trimming
45
Somers, J., Schouten, W., Frankena, K., Noordhuizen-Stassen, E., Metz, J., 2005.Development of claw traits and claw lesions in dairy cows kept on different floor systems. Journal of Dairy Science 88, 110-120.
Somers, J.G.C.J., 2004. Claw disorders and disturbed locomotion in dairy cows : the effect of floor systems and implications for animal welfare. PhD thesis, Veterinary Faculty Utrecht University, Utrecht, the Netherlands.
Somers, J.G.C.J., Frankena, K., Noordhuizen-Stassen, E.N., Metz, J.H.M., 2003. Prevalence of claw disorders in Dutch dairy cows exposed to several floor systems. Journal of Dairy Science 86, 2082-2093.
Telezhenko, E., 2007. Effect of flooring system on locomotion comfort in dairy cows: Aspects of gait, preference and claw condition. PhD thesis. Swedish University of Agricultural Sciences (SLU), Skara, Sweden.
Toussaint-Raven, E., 1989. Cattle foot care and claw trimming. Farming press. Ipswich. UK.Tucker, C.B., Weary, D.M., de Passillé, A.M., Campbell, B., Rushen, J., 2006. Flooring in
front of the feed bunk affects feeding behavior and use of freestalls by dairy cows. Journal of Dairy Science 89, 2065-2071.
Van der Tol, P., Van Der Beek, S., Metz, J., Noordhuizen-Stassen, E., Back, W., Braam, C., Weijs, W., 2004. The effect of preventive trimming on weight bearing and force balance on the claws of dairy cattle. Journal of Dairy Science 87, 1732-1738.
Van der Tol, P.P.J., 2004. Biomechanical aspects of the claw-floor interaction in dairy cattle. Implications for locomotion and claw disorders. PhD thesis, Veterinary Faculty Utrecht University, Utrecht, the Netherlands.
Vanegas, J., Overton, M., Berry, S., Sischo, W., 2006. Effect of rubber flooring on claw health in lactating dairy cows housed in free-stall barns. Journal of dairy science 89, 4251-4258.

2
Chapter 2
44
REFERENCESBoyle, L.A., Mee, J.F., Kiernan, P.J., 2007. The effect of rubber versus concrete passageways
in cubicle housing on claw health and reproduction of pluriparous dairy cows. Applied Animal Behaviour Science 106, 1-12.
Fjeldaas, T., Sogstad, Å.M., Østerås, O., 2006. Claw trimming routines in relation to claw lesions, claw shape and lameness in Norwegian dairy herds housed in tie stalls and free stalls. Preventive Veterinary Medicine 73, 255-271.
Flower, F.C., de Passillé, A.M., Weary, D.M., Sanderson, D.J., Rushen, J., 2007. Softer, higher-friction flooring improves gait of cows with and without sole ulcers. Journal of Dairy Science 90, 1235-1242.
Galindo, F., Broom, D.M., 2002. The effects of lameness on social and individual behavior of dairy cows. Journal of Applied Animal Welfare Science 5, 193-201.
Gilmour, A.R., Gogel, B.J., Cullis, B.R., Thompson, R., 2006. ASREML User Guide Release 2.0. VSN International Ltd., Hemel Hempstead, UK.
Holzhauer, M., 2006. Claw health in dairy cows in the Netherlands. Epidemiological aspects of different claw disorders in dairy cattle in the Netherlands. PhD thesis, Veterinary Faculty Utrecht University, Utrecht, the Netherlands.
Holzhauer, M., Bartels, C.J.M., van den Borne, B.H.P., van Schaik, G., 2006. Intra-class correlation attributable to claw trimmers scoring common hind-claw disorders in Dutch dairy herds. Preventive Veterinary Medicine 75, 47-55.
Jungbluth, T., Benz, B., Wandel, H., 2003. Soft walking on loose housing systems for dairy cows. Pages 171–177 in Proc. 5th Int. Dairy Housing Conf., Fort Worth, TX. Am. Soc. Agric. Eng., St. Joseph, MI.
Kremer, P., Nueske, S., Scholz, A., Foerster, M., 2007. Comparison of claw health and milk yield in dairy cows on elastic or concrete flooring. Journal of Dairy Science 90, 4603-4611.
Manske, T., Hultgren, J., Bergsten, C., 2002. The effect of claw trimming on the hoof health of Swedish dairy cattle. Preventive Veterinary Medicine 54, 113-129.
Manson, F.J., Leaver, J.D., 1988. The influence of concentrate amount on locomotion and clinical lameness in dairy cattle. Anim Prod 47.
Meyer, S.W., Weishaupt, M.A., Nuss, K.A., 2007. Gait pattern of heifers before and after claw trimming: A high-speed cinematographic study on a treadmill. Journal of Dairy Science 90, 670-676.
Nuss, K., Paulus, N., 2006. Measurements of claw dimensions in cows before and after functional trimming: A post-mortem study. The Veterinary Journal 172, 284-292.
Rushen, J., De Passillé, A., 2006. Effects of roughness and compressibility of flooring on cow locomotion. Journal of Dairy Science 89, 2965-2972.
Sogstad, Å.M., Fjeldaas, T., Østerås, O., Forshell, K.P., 2005. Prevalence of claw lesions in Norwegian dairy cattle housed in tie stalls and free stalls. Preventive Veterinary Medicine 70, 191-209.
Flooring and trimming
45
Somers, J., Schouten, W., Frankena, K., Noordhuizen-Stassen, E., Metz, J., 2005.Development of claw traits and claw lesions in dairy cows kept on different floor systems. Journal of Dairy Science 88, 110-120.
Somers, J.G.C.J., 2004. Claw disorders and disturbed locomotion in dairy cows : the effect of floor systems and implications for animal welfare. PhD thesis, Veterinary Faculty Utrecht University, Utrecht, the Netherlands.
Somers, J.G.C.J., Frankena, K., Noordhuizen-Stassen, E.N., Metz, J.H.M., 2003. Prevalence of claw disorders in Dutch dairy cows exposed to several floor systems. Journal of Dairy Science 86, 2082-2093.
Telezhenko, E., 2007. Effect of flooring system on locomotion comfort in dairy cows: Aspects of gait, preference and claw condition. PhD thesis. Swedish University of Agricultural Sciences (SLU), Skara, Sweden.
Toussaint-Raven, E., 1989. Cattle foot care and claw trimming. Farming press. Ipswich. UK.Tucker, C.B., Weary, D.M., de Passillé, A.M., Campbell, B., Rushen, J., 2006. Flooring in
front of the feed bunk affects feeding behavior and use of freestalls by dairy cows. Journal of Dairy Science 89, 2065-2071.
Van der Tol, P., Van Der Beek, S., Metz, J., Noordhuizen-Stassen, E., Back, W., Braam, C., Weijs, W., 2004. The effect of preventive trimming on weight bearing and force balance on the claws of dairy cattle. Journal of Dairy Science 87, 1732-1738.
Van der Tol, P.P.J., 2004. Biomechanical aspects of the claw-floor interaction in dairy cattle. Implications for locomotion and claw disorders. PhD thesis, Veterinary Faculty Utrecht University, Utrecht, the Netherlands.
Vanegas, J., Overton, M., Berry, S., Sischo, W., 2006. Effect of rubber flooring on claw health in lactating dairy cows housed in free-stall barns. Journal of dairy science 89, 4251-4258.

46 1 Figures 3, 4 and 5 were replotted to increase the readability, and a figure and table were added to provide additional information on the estimates.
CHAPTER 3
Effects of flooring and restricted freestall access on behavior and claw
health of dairy heifersW. Ouweltjes a, J.T.N. van der Werf a, K. Frankena b and J.L. van Leeuwen c
a Wageningen UR Livestock Research, P.O. Box 65, 8200 AB, Lelystad, The Netherlands
b Wageningen University, Quantitative Veterinary Epidemiology group, Department of Animal Sciences, P.O. Box 338, 6700 AH, Wageningen, The Netherlands
c Wageningen University, Experimental Zoology Group, Department of Animal Sciences, P.O. Box 338, 6700 AH, Wageningen, The Netherlands
Published in Journal of Dairy Science (2011) 94:705-7151

48
Housing condition and bovine claw health
49
ABSTRACTClaw health, locomotion, feed intake, milk yield, body weight, activity, and lying and standing behavior of dairy heifers were monitored in a single dairy herd during the first 3 mo after calving. During the first 8 wk after calving, 2 treatments were applied: restricted free stall access by closing the stalls between 23 h and 5 h (yes or no) and alley flooring (concrete or rubber topped slatted floors). Apart from treatments, housing was identical. The animals were kept in small groups (n = 4 to 6) in adjacent barn pens. Hereafter, the animals were kept in one group in a free stall section with concrete slatted floor and unrestricted access to the stalls for 5 wk. All animals were fed the same partial mixed ration. We hypothesized 1) that hard flooring causes high mechanical load of the claws and 2) that restricted free stall access causes prolonged standing bouts and reinforced effects of hard flooring on claws. The heifers had only minor claw lesions before first calving, and the prevalence and severity of sole hemorrhages increased during the first 3 mo after calving (from 0.24 ± 0.08 to 1.18 ± 0.14 and from 0.04 ± 0.01 to 0.24 ± 0.02 respectively), particularly in the outer hind claws. Animals kept on rubber alley flooring had lower average hemorrhage scores (0.13 ± 0.03 and 0.20 ± 0.03 respectively) in wk 9 and 14 after calving than animals kept on hard concrete alley floors (0.21 ± 0.03 and 0.27 ± 0.03 respectively), had a slower feed intake (3.05 ± 0.14 vs. 3.46 ± 0.14 g/s) and spent more time feeding (7.3 ± 0.3 vs. 6.6 ± 0.3 min/h). Restricted free stall access resulted in fewer standing bouts per day (14.4 ± 1.0 vs. 17.9 ± 1.0) and more strides per hour (99.8 ± 5.4 vs. 87.2 ± 5.4) without changing overall standing time (15.0 ± 0.3 vs. 14.7 ± 0.3 h/d), and did not affect the occurrence of sole hemorrhages. The animals with no overnight free stall access spent more time standing (55.9 ± 0.9 vs. 35.8 ± 0.9 min/h) and feeding (7.8 ± 0.3 vs. 4.3 ± 0.3 min/h) between 23 and 5 h and less during the rest of the 24 hour period (31.3 ± 0.8 vs. 37.0 ± 0.8 min/h and 6.8 ± 0.3 vs. 7.6 ± 0.3 min/h). Thus the animals adapted to restricted free stall access causing increased overnight standing by additional lying during daytime and used part of the extra standing time at night for feeding The restrictions probably had only a minor effect on the mechanical load of their claws. Therefore, the first part of the hypothesis was confirmed and the second part was rejected.
Key words: alley floor, claw health, lying and standing behavior, restricted free stall access.

3
48
Housing condition and bovine claw health
49
ABSTRACTClaw health, locomotion, feed intake, milk yield, body weight, activity, and lying and standing behavior of dairy heifers were monitored in a single dairy herd during the first 3 mo after calving. During the first 8 wk after calving, 2 treatments were applied: restricted free stall access by closing the stalls between 23 h and 5 h (yes or no) and alley flooring (concrete or rubber topped slatted floors). Apart from treatments, housing was identical. The animals were kept in small groups (n = 4 to 6) in adjacent barn pens. Hereafter, the animals were kept in one group in a free stall section with concrete slatted floor and unrestricted access to the stalls for 5 wk. All animals were fed the same partial mixed ration. We hypothesized 1) that hard flooring causes high mechanical load of the claws and 2) that restricted free stall access causes prolonged standing bouts and reinforced effects of hard flooring on claws. The heifers had only minor claw lesions before first calving, and the prevalence and severity of sole hemorrhages increased during the first 3 mo after calving (from 0.24 ± 0.08 to 1.18 ± 0.14 and from 0.04 ± 0.01 to 0.24 ± 0.02 respectively), particularly in the outer hind claws. Animals kept on rubber alley flooring had lower average hemorrhage scores (0.13 ± 0.03 and 0.20 ± 0.03 respectively) in wk 9 and 14 after calving than animals kept on hard concrete alley floors (0.21 ± 0.03 and 0.27 ± 0.03 respectively), had a slower feed intake (3.05 ± 0.14 vs. 3.46 ± 0.14 g/s) and spent more time feeding (7.3 ± 0.3 vs. 6.6 ± 0.3 min/h). Restricted free stall access resulted in fewer standing bouts per day (14.4 ± 1.0 vs. 17.9 ± 1.0) and more strides per hour (99.8 ± 5.4 vs. 87.2 ± 5.4) without changing overall standing time (15.0 ± 0.3 vs. 14.7 ± 0.3 h/d), and did not affect the occurrence of sole hemorrhages. The animals with no overnight free stall access spent more time standing (55.9 ± 0.9 vs. 35.8 ± 0.9 min/h) and feeding (7.8 ± 0.3 vs. 4.3 ± 0.3 min/h) between 23 and 5 h and less during the rest of the 24 hour period (31.3 ± 0.8 vs. 37.0 ± 0.8 min/h and 6.8 ± 0.3 vs. 7.6 ± 0.3 min/h). Thus the animals adapted to restricted free stall access causing increased overnight standing by additional lying during daytime and used part of the extra standing time at night for feeding The restrictions probably had only a minor effect on the mechanical load of their claws. Therefore, the first part of the hypothesis was confirmed and the second part was rejected.
Key words: alley floor, claw health, lying and standing behavior, restricted free stall access.

Chapter 3
50
1 INTRODUCTIONSeveral studies reported that claw lesions and locomotor problems are widespread among dairy cattle (Somers, 2004; Holzhauer, 2006); especially in free stall herds (Sogstad et al., 2005b). Claw disorders in dairy cows probably cause pain and are the main cause for impaired mobility in an environment that requires cows to move around for resources. Sole hemorrhages, indicating tissue damage inside the claw, are often detected in claws of Dutch dairy cattle (Holzhauer, 2006).The etiology of hemorrhages is complex and is traditionally linked to metabolic factors, but it is hypothesized that mechanical overload of the claws is a main cause of sole hemorrhages (Logue et al., 2004). Yet, mechanical load is not easily quantifiable under practical circumstances. Galindo et al. (2000) argue that social and individual behavior affect individual susceptibility to present foot lesions under the same environment. Epidemiological research has shown that heifers experience higher incidences of sole hemorrhages than older cows (Donovan et al., 2004; Sogstad et al., 2005a) and that the occurrence of sole hemorrhages increases after parturition (Le Fevre et al., 2001; Tarlton et al., 2002). This suggests that sensitivity for overload not only differs between animals, but varies in time for each animal.Around 80% of the Dutch dairy cows are housed in free stall barns, of which more than 90% are equipped with slatted concrete floors (Somers, 2004), and such floors are associated with suboptimal locomotion. Several investigations reported beneficial effects on locomotion when concrete floors were equipped with rubber walking surfaces (Rushen and De Passillé, 2006; Flower et al., 2007; Telezhenko, 2007), and there is growing interest among farmers to apply rubber top layers in their barns. Ouweltjes et al. (2009) reported a lower prevalence of sole hemorrhages, but more standing and walking on a rubber-topped slatted floor vs. a concrete slatted floor. Kremer et al. (2007) reported similar results. Tucker et al. (2006)showed that cows preferred compliant surfaces (sawdust or Animat rubber) in front of the feed bunk over hard concrete floors and Telezhenko (2007) reported a preference of cows for compliant flooring both for standing and walking. Although rubber topped alley floors decrease the environmental challenge for mechanical overload compared to concrete floors, Kremer et al. (2007) and Vanegas et al. (2006) reported that such flooring did not significantly reduce the overall incidence of claw disorders. In contrast, Somers (2004) reported substantially lower incidences of claw lesions for cows kept in straw pens vs. free stall barns. Straw pens are not only characterized by compliant flooring in the bedding area, but the animals are not limited lying. This could affect their lying and standing behavior. Leonard et al. (1996) concluded that reduced lying time exacerbated the development of claw lesions. Correspondingly, Cook and Nordlund (2009) stressed the importance of sufficient resting time for claw health. These studies suggest that prolonged standing has negative effects on claw tissues that can be compensated by lying bouts of sufficient length. Positive effects of straw pens on claw health could be due to changes in
Housing condition and bovine claw health
51
time budgets. Changes in alteration of lying and standing could affect claw health, even with fixed overall time budgets.The effect of the interaction of floor hardness and lying and standing behavior on the overall risk of overloading claws is currently unknown. This hampers tailored prevention of overload in practice. Moreover, timely detection of overload is not yet possible because there are no good early warning signals. Hemorrhages become visible in sole horn around 2 mo after the tissue is actually damaged and are currently the best measure for overload, but their occurrence is not solely attributable to overload. Often animals with hemorrhages are not visibly lame, but tissue damage causing the hemorrhages may lead to discomfort and could affect behavior. This hypothesis can be investigated with motion sensors such as IceTags and feed intake recordings (RIC) that enable more or less continuous recording of behavioral measures.The aim was to quantify effects of housing conditions that could affect mechanical load on behavior and the development of sole hemorrhages in heifers after first calving. We hypothesized 1) that hard concrete flooring causes high mechanical load of the claws (relative to more compliant rubber flooring), and 2) that restricted free stall access causes prolonged standing bouts and reinforces effects of hard flooring on claws. Both factors will increase the occurrence of sole hemorrhages, and effects will be visible within 3 mo after calving.
2 MATERIALS AND METHODS
2.1 Animals and Housing ConditionsThe study was carried out at research farm “De Waiboerhoeve” of the Animal Sciences Group (current name: Wageningen UR Livestock Research) in Lelystad, The Netherlands. Criteria for inclusion of heifers were that they had normally developed and were clinically healthy by visual observation, calved within 2 wk from expected calving date, did not have a difficult calving or a retained placenta and had a locomotion score of 2 or less on the 5-point scale (Manson and Leaver, 1988). All 44 Holstein heifers used were raised on a contract farm where they were kept in free stalls with concrete alley floors and returned to the research farm around 5 wk before the expected calving date. From then on, they were kept in a straw pen (together with cows in the close up period). This comprised the pretreatment period. The day after calving, the heifers entered the experiment: treatments were allotted in blocks of 4, and consisted of a combination of floor and restricted stall access (see treatments) in a free stall barn with slatted alley floors. Besides the free stalls, the animals had ≈20 m2 of alley space available per treatment group of 6 animals.All animals were kept in their treatment environment for 8 wk (treatment period) and kept in a barn pen with concrete slatted floor with unrestricted access to the free stalls in wk 9 to 13 of the experiment (posttreatment period). Group size during the treatment phase was a minimum of 4 animals, with maximum size of treatment groups of 6 animals. If needed, fill animals (heifers only) were added to the groups. During the posttreatment period, group size varied between 6 and 17. Throughout the experiment 1 stall was available per animal.

3
Chapter 3
50
1 INTRODUCTIONSeveral studies reported that claw lesions and locomotor problems are widespread among dairy cattle (Somers, 2004; Holzhauer, 2006); especially in free stall herds (Sogstad et al., 2005b). Claw disorders in dairy cows probably cause pain and are the main cause for impaired mobility in an environment that requires cows to move around for resources. Sole hemorrhages, indicating tissue damage inside the claw, are often detected in claws of Dutch dairy cattle (Holzhauer, 2006).The etiology of hemorrhages is complex and is traditionally linked to metabolic factors, but it is hypothesized that mechanical overload of the claws is a main cause of sole hemorrhages (Logue et al., 2004). Yet, mechanical load is not easily quantifiable under practical circumstances. Galindo et al. (2000) argue that social and individual behavior affect individual susceptibility to present foot lesions under the same environment. Epidemiological research has shown that heifers experience higher incidences of sole hemorrhages than older cows (Donovan et al., 2004; Sogstad et al., 2005a) and that the occurrence of sole hemorrhages increases after parturition (Le Fevre et al., 2001; Tarlton et al., 2002). This suggests that sensitivity for overload not only differs between animals, but varies in time for each animal.Around 80% of the Dutch dairy cows are housed in free stall barns, of which more than 90% are equipped with slatted concrete floors (Somers, 2004), and such floors are associated with suboptimal locomotion. Several investigations reported beneficial effects on locomotion when concrete floors were equipped with rubber walking surfaces (Rushen and De Passillé, 2006; Flower et al., 2007; Telezhenko, 2007), and there is growing interest among farmers to apply rubber top layers in their barns. Ouweltjes et al. (2009) reported a lower prevalence of sole hemorrhages, but more standing and walking on a rubber-topped slatted floor vs. a concrete slatted floor. Kremer et al. (2007) reported similar results. Tucker et al. (2006)showed that cows preferred compliant surfaces (sawdust or Animat rubber) in front of the feed bunk over hard concrete floors and Telezhenko (2007) reported a preference of cows for compliant flooring both for standing and walking. Although rubber topped alley floors decrease the environmental challenge for mechanical overload compared to concrete floors, Kremer et al. (2007) and Vanegas et al. (2006) reported that such flooring did not significantly reduce the overall incidence of claw disorders. In contrast, Somers (2004) reported substantially lower incidences of claw lesions for cows kept in straw pens vs. free stall barns. Straw pens are not only characterized by compliant flooring in the bedding area, but the animals are not limited lying. This could affect their lying and standing behavior. Leonard et al. (1996) concluded that reduced lying time exacerbated the development of claw lesions. Correspondingly, Cook and Nordlund (2009) stressed the importance of sufficient resting time for claw health. These studies suggest that prolonged standing has negative effects on claw tissues that can be compensated by lying bouts of sufficient length. Positive effects of straw pens on claw health could be due to changes in
Housing condition and bovine claw health
51
time budgets. Changes in alteration of lying and standing could affect claw health, even with fixed overall time budgets.The effect of the interaction of floor hardness and lying and standing behavior on the overall risk of overloading claws is currently unknown. This hampers tailored prevention of overload in practice. Moreover, timely detection of overload is not yet possible because there are no good early warning signals. Hemorrhages become visible in sole horn around 2 mo after the tissue is actually damaged and are currently the best measure for overload, but their occurrence is not solely attributable to overload. Often animals with hemorrhages are not visibly lame, but tissue damage causing the hemorrhages may lead to discomfort and could affect behavior. This hypothesis can be investigated with motion sensors such as IceTags and feed intake recordings (RIC) that enable more or less continuous recording of behavioral measures.The aim was to quantify effects of housing conditions that could affect mechanical load on behavior and the development of sole hemorrhages in heifers after first calving. We hypothesized 1) that hard concrete flooring causes high mechanical load of the claws (relative to more compliant rubber flooring), and 2) that restricted free stall access causes prolonged standing bouts and reinforces effects of hard flooring on claws. Both factors will increase the occurrence of sole hemorrhages, and effects will be visible within 3 mo after calving.
2 MATERIALS AND METHODS
2.1 Animals and Housing ConditionsThe study was carried out at research farm “De Waiboerhoeve” of the Animal Sciences Group (current name: Wageningen UR Livestock Research) in Lelystad, The Netherlands. Criteria for inclusion of heifers were that they had normally developed and were clinically healthy by visual observation, calved within 2 wk from expected calving date, did not have a difficult calving or a retained placenta and had a locomotion score of 2 or less on the 5-point scale (Manson and Leaver, 1988). All 44 Holstein heifers used were raised on a contract farm where they were kept in free stalls with concrete alley floors and returned to the research farm around 5 wk before the expected calving date. From then on, they were kept in a straw pen (together with cows in the close up period). This comprised the pretreatment period. The day after calving, the heifers entered the experiment: treatments were allotted in blocks of 4, and consisted of a combination of floor and restricted stall access (see treatments) in a free stall barn with slatted alley floors. Besides the free stalls, the animals had ≈20 m2 of alley space available per treatment group of 6 animals.All animals were kept in their treatment environment for 8 wk (treatment period) and kept in a barn pen with concrete slatted floor with unrestricted access to the free stalls in wk 9 to 13 of the experiment (posttreatment period). Group size during the treatment phase was a minimum of 4 animals, with maximum size of treatment groups of 6 animals. If needed, fill animals (heifers only) were added to the groups. During the posttreatment period, group size varied between 6 and 17. Throughout the experiment 1 stall was available per animal.

Chapter 3
52
The same partially-mixed ration (PMR) was available ad libitum in the RIC feeding troughs (Insentec, Marknesse, The Netherlands) for all treatments; ration formulation was according to Dutch nutritional guidelines. Feeders were emptied and refilled once daily, for each treatment a minimum of 1 feeder was available per 2 cows. Ration consisted of soy hulls (3.4%), mineral mixture (0.1%), salt (0.1%), concentrate (12.9%), corn silage (43.3%) andgrass silage (40.0%) and had 43.4% DM. The cows were milked twice daily in a conventional parlor and received 1 to 4 kg of concentrate daily during milking, depending on their production level and day in lactation. Floors between the treatment compartments and the parlor were slatted concrete. Every 2 wk a footbath, with alternately a solution of formalin and formalin-copper sulfate, was placed in their path for 2 d. The study was approved by the institute’s Animal Care and Ethics Committee. The animals entered the study between November 28, 2008 and March 28, 2009.
2.2 Treatments Four treatments were applied in adjacent barn compartments separated with metal bars: concrete floor and restricted free stall access, concrete floor and unrestricted access to thefree stalls, rubber topped floor and restricted access to the free stalls, and rubber topped floor and unrestricted access to the free stalls. Restricted free stall access was achieved by locking the stalls with a metal bar between 23 h and 5 h. In wk 9 to 13 the animals were kept were kept on concrete floors with unrestricted access to the freestalls. Two of the free stall sections used for the experiment had a slatted concrete floor covered with rubber (Kraiburg KuraS, Tittmoning, Germany), the other free stall sections had an identical slatted concrete floor without rubber top layer. The prefabricated concrete floors were provided by Concrelit Betonindustrie (Steenwijk, The Netherlands). The floors were cleaned with a robotic manure scraper (Lely Industries, Maassluis, The Netherlands).
2.3 MeasurementsThe cows were monitored for claw health, time spent lying or standing and activity (with IceTags), locomotion, feed intake, milk production and BW. Measurement frequenciesvaried per variable (Table 1).
Housing condition and bovine claw health
53
Table 1 Measurement scheme for all variables1
Experimental week
Measurement 1 2 3 4 5 6 7 8 9 10 11 12 13 14
Claw health v v v
Time budgets x x x x x x x x x x x x x
Locomotion v v v v v v v v v v v v v
Feed intake x x x x x x x x x x x x x
Milk production m m m m m m m m m m m m m
BW m m m m m m m m m m m m m1 v = 1 visual observation per animal per week, x = continuous automated recording, m = daily automated recording per milking
Occurrence of claw disorders was recorded for each inner and outer claw of front and hind legs by scoring the presence of sole hemorrhages (SH), sole ulcer, digital dermatitis (DD), interdigital dermatitis (ID), tyloma (also known as interdigital hyperplasia) and interdigital phlegmon according to Holzhauer (2006). The SH were scored for 6 different regions on a scale of 1 (mild) to 5 (severe) according to Leach et al. (1998, Figure 1). If present, DD and ID were scored on a scale from 1 (mild) to 3 (severe) according to judgment of the observer, the other disorders were scored as either present (1) or absent (0). Prior to the observations, claws were cleaned and a minimum of sole horn was removed to enable scoring of horn lesions. The claws were scored in wk 1, 9, and 14 after calving.
Figure 1. Claw zones separately scored for each claw (Leach et al., 1998)
From at least 1 wk before calving onwards, the animals were equipped with IceTag activity sensors (version 2.004 and 3.001, IceRobotics Ltd, Roslin, Midlothian, Scotland). The sensors sampled acceleration data with 8 and 16 Hz, respectively and on board software reported the percentage of time the animal was lying, standing or active and the number of

3
Chapter 3
52
The same partially-mixed ration (PMR) was available ad libitum in the RIC feeding troughs (Insentec, Marknesse, The Netherlands) for all treatments; ration formulation was according to Dutch nutritional guidelines. Feeders were emptied and refilled once daily, for each treatment a minimum of 1 feeder was available per 2 cows. Ration consisted of soy hulls (3.4%), mineral mixture (0.1%), salt (0.1%), concentrate (12.9%), corn silage (43.3%) andgrass silage (40.0%) and had 43.4% DM. The cows were milked twice daily in a conventional parlor and received 1 to 4 kg of concentrate daily during milking, depending on their production level and day in lactation. Floors between the treatment compartments and the parlor were slatted concrete. Every 2 wk a footbath, with alternately a solution of formalin and formalin-copper sulfate, was placed in their path for 2 d. The study was approved by the institute’s Animal Care and Ethics Committee. The animals entered the study between November 28, 2008 and March 28, 2009.
2.2 Treatments Four treatments were applied in adjacent barn compartments separated with metal bars: concrete floor and restricted free stall access, concrete floor and unrestricted access to thefree stalls, rubber topped floor and restricted access to the free stalls, and rubber topped floor and unrestricted access to the free stalls. Restricted free stall access was achieved by locking the stalls with a metal bar between 23 h and 5 h. In wk 9 to 13 the animals were kept were kept on concrete floors with unrestricted access to the freestalls. Two of the free stall sections used for the experiment had a slatted concrete floor covered with rubber (Kraiburg KuraS, Tittmoning, Germany), the other free stall sections had an identical slatted concrete floor without rubber top layer. The prefabricated concrete floors were provided by Concrelit Betonindustrie (Steenwijk, The Netherlands). The floors were cleaned with a robotic manure scraper (Lely Industries, Maassluis, The Netherlands).
2.3 MeasurementsThe cows were monitored for claw health, time spent lying or standing and activity (with IceTags), locomotion, feed intake, milk production and BW. Measurement frequenciesvaried per variable (Table 1).
Housing condition and bovine claw health
53
Table 1 Measurement scheme for all variables1
Experimental week
Measurement 1 2 3 4 5 6 7 8 9 10 11 12 13 14
Claw health v v v
Time budgets x x x x x x x x x x x x x
Locomotion v v v v v v v v v v v v v
Feed intake x x x x x x x x x x x x x
Milk production m m m m m m m m m m m m m
BW m m m m m m m m m m m m m1 v = 1 visual observation per animal per week, x = continuous automated recording, m = daily automated recording per milking
Occurrence of claw disorders was recorded for each inner and outer claw of front and hind legs by scoring the presence of sole hemorrhages (SH), sole ulcer, digital dermatitis (DD), interdigital dermatitis (ID), tyloma (also known as interdigital hyperplasia) and interdigital phlegmon according to Holzhauer (2006). The SH were scored for 6 different regions on a scale of 1 (mild) to 5 (severe) according to Leach et al. (1998, Figure 1). If present, DD and ID were scored on a scale from 1 (mild) to 3 (severe) according to judgment of the observer, the other disorders were scored as either present (1) or absent (0). Prior to the observations, claws were cleaned and a minimum of sole horn was removed to enable scoring of horn lesions. The claws were scored in wk 1, 9, and 14 after calving.
Figure 1. Claw zones separately scored for each claw (Leach et al., 1998)
From at least 1 wk before calving onwards, the animals were equipped with IceTag activity sensors (version 2.004 and 3.001, IceRobotics Ltd, Roslin, Midlothian, Scotland). The sensors sampled acceleration data with 8 and 16 Hz, respectively and on board software reported the percentage of time the animal was lying, standing or active and the number of

Chapter 3
54
strides of the leg to which the sensor was attached with a sampling rate of 1 Hz. The term “stride” was adopted from McNeill Alexander (2003), who defines a stride as a complete cycle of movement of a foot. Locomotion variables were scored weekly when the animals walked back to their pen along a straight alley with concrete slatted floor after they were locked up in a feeding headlock to read the IceTags. Traits observed were: locomotion score (according to the method of Manson and Leaver, 1988) and the duration and the number of strides with both hind legs needing to travel 10.36 m of the alley floor. Feed intake and each individual visit to a feeder were recorded with the automated RIC system. Milk yield was recorded in the parlor with ICAR approved equipment. Body weights were measured with a scale before entering the parlor. During the experiment the performance of the equipment was monitored according to standard farm procedures.
2.4 Data processingIceTag data were preprocessed before statistical analysis. IceTag data was disregarded on days when claw condition or locomotion performances were visually scored because cows were disturbed by these interventions. Similarly, data from the day the animals went from treatment to posttreatment group were excluded because data from these days may be not representative. Remaining data per second were redefined to represent either lying (when % lying was ≥ 50) or standing. Then the data were aggregated per minute. Variables calculated were: number of seconds with records, number of seconds recorded as standing and number of strides. These data were aggregated further per hour and per day. From the data aggregated per minute, standing bouts were derived. First, data per minute were classified as lying or standing. Second, standing bouts were defined to start at the first minute classified as standing after at least 1 min classified as lying and to end when the next minute was classified as lying. Finally, the number of standing bouts starting in each hourly period was counted. Separate datasets were made for the pre calving period, treatment period, and posttreatment period. For each experimental phase 3 traits were analyzed: %standing, #strides and #standing bouts. Feeding data were processed before creating datasets for analysis; 2.7% of the records of feeding visits were marked as unreliable and removed from the dataset. Data for which calculated individual daily intake was < 10 kg roughage/d or where calculated daily intake deviated more than 3 units standard deviation from the trend calculated for the animal (with third order polynomials) were discarded for analysis. After these edits, 1,901 daily intakes for the treatment period and 1,025 daily intakes for the posttreatment period could be calculated. From the available data, the following traits were derived: feeding time, feed intake, #meals and intake speed. For further analysis, data were aggregated per hour and per day.For each milking length of preceding interval was calculated in minutes by subtracting milking time of preceding milking from current milking time. Milk yields were recalculated in g/h of preceding interval, then trends per animal were fitted with third order polynomials and productions that deviated more than 2 units standard deviation from the trend were removed from the dataset. A similar filter was applied to BW data. Smaller deviations (2
Housing condition and bovine claw health
55
units instead of 3) from the calculated trends were accepted for milk yield and BW compared to feed intake because it was assumed that these were more likely to be due to recording errors.
2.5 Statistical Procedure Claw disorders were analyzed with ASReml statistical package with the following general linear mixed model (where x represents main effects and interactions):
𝑌𝑌𝑌𝑌𝑖𝑖𝑖𝑖𝑖𝑖𝑖𝑖𝑖𝑖𝑖𝑖𝑖𝑖𝑖𝑖𝑖𝑖𝑖𝑖𝑖𝑖𝑖𝑖𝑖𝑖𝑖𝑖 = 𝜇𝜇𝜇𝜇 + 𝐹𝐹𝐹𝐹𝑖𝑖𝑖𝑖 × 𝐿𝐿𝐿𝐿𝐿𝐿𝐿𝐿𝑖𝑖𝑖𝑖 + 𝐿𝐿𝐿𝐿𝐿𝐿𝐿𝐿𝑖𝑖𝑖𝑖 × 𝐶𝐶𝐶𝐶𝑖𝑖𝑖𝑖 + 𝐵𝐵𝐵𝐵𝐵𝐵𝐵𝐵𝑖𝑖𝑖𝑖 + 𝐴𝐴𝐴𝐴𝐴𝐴𝐴𝐴𝑖𝑖𝑖𝑖𝑖𝑖𝑖𝑖 + 𝑒𝑒𝑒𝑒𝑖𝑖𝑖𝑖𝑖𝑖𝑖𝑖𝑖𝑖𝑖𝑖𝑖𝑖𝑖𝑖𝑖𝑖𝑖𝑖𝑖𝑖𝑖𝑖𝑖𝑖𝑖𝑖 (1)
where 𝑌𝑌𝑌𝑌𝑖𝑖𝑖𝑖𝑖𝑖𝑖𝑖𝑖𝑖𝑖𝑖𝑖𝑖𝑖𝑖𝑖𝑖𝑖𝑖𝑖𝑖𝑖𝑖𝑖𝑖𝑖𝑖 is the variable recorded for floor i, restricted free stall access j, leg k, claw l,block of entry m, and cow n within block m, and repeated observation o; 𝜇𝜇𝜇𝜇 is the overall mean, 𝐹𝐹𝐹𝐹𝑖𝑖𝑖𝑖 is the type of floor on which a cow was kept (concrete, rubber), 𝐿𝐿𝐿𝐿𝐿𝐿𝐿𝐿𝑖𝑖𝑖𝑖 represents restricted free stall access (yes, no), 𝐿𝐿𝐿𝐿𝐿𝐿𝐿𝐿𝑖𝑖𝑖𝑖 represents leg, 𝐶𝐶𝐶𝐶𝑖𝑖𝑖𝑖 is claw (inner or outer), 𝐵𝐵𝐵𝐵𝐵𝐵𝐵𝐵𝑖𝑖𝑖𝑖represents the block of entry (m = 1, 11), and 𝐴𝐴𝐴𝐴𝐴𝐴𝐴𝐴𝑖𝑖𝑖𝑖𝑖𝑖𝑖𝑖 is the individual animal effect (l = 1, 44) and 𝑒𝑒𝑒𝑒𝑖𝑖𝑖𝑖𝑖𝑖𝑖𝑖𝑖𝑖𝑖𝑖𝑖𝑖𝑖𝑖𝑖𝑖𝑖𝑖𝑖𝑖𝑖𝑖𝑖𝑖𝑖𝑖 is the error term; 𝐵𝐵𝐵𝐵𝐵𝐵𝐵𝐵𝑖𝑖𝑖𝑖, 𝐴𝐴𝐴𝐴𝐴𝐴𝐴𝐴𝑖𝑖𝑖𝑖𝑖𝑖𝑖𝑖 and 𝑒𝑒𝑒𝑒𝑖𝑖𝑖𝑖𝑖𝑖𝑖𝑖𝑖𝑖𝑖𝑖𝑖𝑖𝑖𝑖𝑖𝑖𝑖𝑖𝑖𝑖𝑖𝑖𝑖𝑖𝑖𝑖 are the random components of the model. Digital dermatitis, ID, and sole ulcers were seldom diagnosed: DD was scored for 2, 1, and 4 legs when the animals entered the experiment and 8 and 13 wk later, respectively; ID was scored for 3, 1 and 1 legs, and sole ulcer was only scored once in wk 14. Therefore, only data for SH were statistically analyzed. Traits analyzed were number of zones with SH (Num_sh) for each inner or outer claw and average score for SH in zones 1 to 6 (Score_sh). A zone effect was added to model (1) for the analysis of SH per zone. Data were analyzed separately for measurements in wk 1, 9, and 14.Locomotion, IceTag data, feed intake, milk yield and BW were analyzed with ASReml statistical package with the following general linear mixed model (where x represents main effects and interactions and . represents interactions only):
𝑌𝑌𝑌𝑌𝑖𝑖𝑖𝑖𝑖𝑖𝑖𝑖𝑖𝑖𝑖𝑖𝑖𝑖𝑖𝑖𝑖𝑖𝑖𝑖𝑖𝑖𝑖𝑖𝑖𝑖𝑖𝑖𝑖𝑖𝑖𝑖 = 𝜇𝜇𝜇𝜇 + 𝐹𝐹𝐹𝐹𝑖𝑖𝑖𝑖 × 𝐿𝐿𝐿𝐿𝐿𝐿𝐿𝐿𝑖𝑖𝑖𝑖 + 𝐹𝐹𝐹𝐹𝑖𝑖𝑖𝑖. 𝐿𝐿𝐿𝐿𝐿𝐿𝐿𝐿𝑖𝑖𝑖𝑖 . 𝐿𝐿𝐿𝐿𝐿𝐿𝐿𝐿𝑖𝑖𝑖𝑖 + 𝐹𝐹𝐹𝐹𝑖𝑖𝑖𝑖 . 𝐿𝐿𝐿𝐿𝐿𝐿𝐿𝐿𝑖𝑖𝑖𝑖 .𝐷𝐷𝐷𝐷𝐷𝐷𝐷𝐷𝑖𝑖𝑖𝑖 + 𝐵𝐵𝐵𝐵𝐵𝐵𝐵𝐵𝑖𝑖𝑖𝑖 + 𝐴𝐴𝐴𝐴𝐴𝐴𝐴𝐴𝑖𝑖𝑖𝑖𝑖𝑖𝑖𝑖 + 𝑠𝑠𝑠𝑠𝐷𝐷𝐷𝐷𝐵𝐵𝐵𝐵(𝑊𝑊𝑊𝑊𝑊𝑊𝑊𝑊𝑖𝑖𝑖𝑖) + 𝑒𝑒𝑒𝑒𝑖𝑖𝑖𝑖𝑖𝑖𝑖𝑖𝑖𝑖𝑖𝑖𝑖𝑖𝑖𝑖𝑖𝑖𝑖𝑖𝑖𝑖𝑖𝑖𝑖𝑖𝑖𝑖𝑖𝑖𝑖𝑖 (2)
where 𝑌𝑌𝑌𝑌𝑖𝑖𝑖𝑖𝑖𝑖𝑖𝑖𝑖𝑖𝑖𝑖𝑖𝑖𝑖𝑖𝑖𝑖𝑖𝑖𝑖𝑖𝑖𝑖𝑖𝑖𝑖𝑖𝑖𝑖𝑖𝑖 is the variable recorded for floor i, restricted free stall access j, stage of lactation k, period l within day, block of entry m, animal n within block m, day or week oduring the experiment and repeated observation p; 𝜇𝜇𝜇𝜇 is the overall mean; 𝐹𝐹𝐹𝐹𝑖𝑖𝑖𝑖 is the type of floor on which a cow was kept during the treatment period (concrete, rubber); 𝐿𝐿𝐿𝐿𝐿𝐿𝐿𝐿𝑖𝑖𝑖𝑖 represents restricted free stall access (yes, no); 𝐿𝐿𝐿𝐿𝐿𝐿𝐿𝐿𝑖𝑖𝑖𝑖 represents week or day of lactation; 𝐷𝐷𝐷𝐷𝐷𝐷𝐷𝐷𝑖𝑖𝑖𝑖 represents diurnal effects of hour period or morning vs. afternoon; 𝐵𝐵𝐵𝐵𝐵𝐵𝐵𝐵𝑖𝑖𝑖𝑖 represents the block of entry (m = 1, 11); 𝐴𝐴𝐴𝐴𝐴𝐴𝐴𝐴𝑖𝑖𝑖𝑖𝑖𝑖𝑖𝑖 is the individual animal effect (l = 1, 44); 𝑠𝑠𝑠𝑠𝐷𝐷𝐷𝐷𝐵𝐵𝐵𝐵(𝑊𝑊𝑊𝑊𝑊𝑊𝑊𝑊𝑖𝑖𝑖𝑖) represents daily or weekly environmental fluctuations throughout the experiment; and 𝑒𝑒𝑒𝑒𝑖𝑖𝑖𝑖𝑖𝑖𝑖𝑖𝑖𝑖𝑖𝑖𝑖𝑖𝑖𝑖𝑖𝑖𝑖𝑖𝑖𝑖𝑖𝑖𝑖𝑖𝑖𝑖𝑖𝑖𝑖𝑖 is the error term. 𝐵𝐵𝐵𝐵𝐵𝐵𝐵𝐵𝑖𝑖𝑖𝑖, 𝐴𝐴𝐴𝐴𝐴𝐴𝐴𝐴𝑖𝑖𝑖𝑖𝑖𝑖𝑖𝑖, 𝑠𝑠𝑠𝑠𝐷𝐷𝐷𝐷𝐵𝐵𝐵𝐵(𝑊𝑊𝑊𝑊𝑊𝑊𝑊𝑊𝑖𝑖𝑖𝑖) and 𝑒𝑒𝑒𝑒𝑖𝑖𝑖𝑖𝑖𝑖𝑖𝑖𝑖𝑖𝑖𝑖𝑖𝑖𝑖𝑖𝑖𝑖𝑖𝑖𝑖𝑖𝑖𝑖𝑖𝑖𝑖𝑖𝑖𝑖𝑖𝑖 are the random components of the model. Most variables were corrected for effects of day in lactation within treatment, but locomotion traits (scored once per week) were corrected for lactation weeks within treatment. IceTag data and feed intake data were corrected for hour within day and milk yield and BW were corrected

3
Chapter 3
54
strides of the leg to which the sensor was attached with a sampling rate of 1 Hz. The term “stride” was adopted from McNeill Alexander (2003), who defines a stride as a complete cycle of movement of a foot. Locomotion variables were scored weekly when the animals walked back to their pen along a straight alley with concrete slatted floor after they were locked up in a feeding headlock to read the IceTags. Traits observed were: locomotion score (according to the method of Manson and Leaver, 1988) and the duration and the number of strides with both hind legs needing to travel 10.36 m of the alley floor. Feed intake and each individual visit to a feeder were recorded with the automated RIC system. Milk yield was recorded in the parlor with ICAR approved equipment. Body weights were measured with a scale before entering the parlor. During the experiment the performance of the equipment was monitored according to standard farm procedures.
2.4 Data processingIceTag data were preprocessed before statistical analysis. IceTag data was disregarded on days when claw condition or locomotion performances were visually scored because cows were disturbed by these interventions. Similarly, data from the day the animals went from treatment to posttreatment group were excluded because data from these days may be not representative. Remaining data per second were redefined to represent either lying (when % lying was ≥ 50) or standing. Then the data were aggregated per minute. Variables calculated were: number of seconds with records, number of seconds recorded as standing and number of strides. These data were aggregated further per hour and per day. From the data aggregated per minute, standing bouts were derived. First, data per minute were classified as lying or standing. Second, standing bouts were defined to start at the first minute classified as standing after at least 1 min classified as lying and to end when the next minute was classified as lying. Finally, the number of standing bouts starting in each hourly period was counted. Separate datasets were made for the pre calving period, treatment period, and posttreatment period. For each experimental phase 3 traits were analyzed: %standing, #strides and #standing bouts. Feeding data were processed before creating datasets for analysis; 2.7% of the records of feeding visits were marked as unreliable and removed from the dataset. Data for which calculated individual daily intake was < 10 kg roughage/d or where calculated daily intake deviated more than 3 units standard deviation from the trend calculated for the animal (with third order polynomials) were discarded for analysis. After these edits, 1,901 daily intakes for the treatment period and 1,025 daily intakes for the posttreatment period could be calculated. From the available data, the following traits were derived: feeding time, feed intake, #meals and intake speed. For further analysis, data were aggregated per hour and per day.For each milking length of preceding interval was calculated in minutes by subtracting milking time of preceding milking from current milking time. Milk yields were recalculated in g/h of preceding interval, then trends per animal were fitted with third order polynomials and productions that deviated more than 2 units standard deviation from the trend were removed from the dataset. A similar filter was applied to BW data. Smaller deviations (2
Housing condition and bovine claw health
55
units instead of 3) from the calculated trends were accepted for milk yield and BW compared to feed intake because it was assumed that these were more likely to be due to recording errors.
2.5 Statistical Procedure Claw disorders were analyzed with ASReml statistical package with the following general linear mixed model (where x represents main effects and interactions):
𝑌𝑌𝑌𝑌𝑖𝑖𝑖𝑖𝑖𝑖𝑖𝑖𝑖𝑖𝑖𝑖𝑖𝑖𝑖𝑖𝑖𝑖𝑖𝑖𝑖𝑖𝑖𝑖𝑖𝑖𝑖𝑖 = 𝜇𝜇𝜇𝜇 + 𝐹𝐹𝐹𝐹𝑖𝑖𝑖𝑖 × 𝐿𝐿𝐿𝐿𝐿𝐿𝐿𝐿𝑖𝑖𝑖𝑖 + 𝐿𝐿𝐿𝐿𝐿𝐿𝐿𝐿𝑖𝑖𝑖𝑖 × 𝐶𝐶𝐶𝐶𝑖𝑖𝑖𝑖 + 𝐵𝐵𝐵𝐵𝐵𝐵𝐵𝐵𝑖𝑖𝑖𝑖 + 𝐴𝐴𝐴𝐴𝐴𝐴𝐴𝐴𝑖𝑖𝑖𝑖𝑖𝑖𝑖𝑖 + 𝑒𝑒𝑒𝑒𝑖𝑖𝑖𝑖𝑖𝑖𝑖𝑖𝑖𝑖𝑖𝑖𝑖𝑖𝑖𝑖𝑖𝑖𝑖𝑖𝑖𝑖𝑖𝑖𝑖𝑖𝑖𝑖 (1)
where 𝑌𝑌𝑌𝑌𝑖𝑖𝑖𝑖𝑖𝑖𝑖𝑖𝑖𝑖𝑖𝑖𝑖𝑖𝑖𝑖𝑖𝑖𝑖𝑖𝑖𝑖𝑖𝑖𝑖𝑖𝑖𝑖 is the variable recorded for floor i, restricted free stall access j, leg k, claw l,block of entry m, and cow n within block m, and repeated observation o; 𝜇𝜇𝜇𝜇 is the overall mean, 𝐹𝐹𝐹𝐹𝑖𝑖𝑖𝑖 is the type of floor on which a cow was kept (concrete, rubber), 𝐿𝐿𝐿𝐿𝐿𝐿𝐿𝐿𝑖𝑖𝑖𝑖 represents restricted free stall access (yes, no), 𝐿𝐿𝐿𝐿𝐿𝐿𝐿𝐿𝑖𝑖𝑖𝑖 represents leg, 𝐶𝐶𝐶𝐶𝑖𝑖𝑖𝑖 is claw (inner or outer), 𝐵𝐵𝐵𝐵𝐵𝐵𝐵𝐵𝑖𝑖𝑖𝑖represents the block of entry (m = 1, 11), and 𝐴𝐴𝐴𝐴𝐴𝐴𝐴𝐴𝑖𝑖𝑖𝑖𝑖𝑖𝑖𝑖 is the individual animal effect (l = 1, 44) and 𝑒𝑒𝑒𝑒𝑖𝑖𝑖𝑖𝑖𝑖𝑖𝑖𝑖𝑖𝑖𝑖𝑖𝑖𝑖𝑖𝑖𝑖𝑖𝑖𝑖𝑖𝑖𝑖𝑖𝑖𝑖𝑖 is the error term; 𝐵𝐵𝐵𝐵𝐵𝐵𝐵𝐵𝑖𝑖𝑖𝑖, 𝐴𝐴𝐴𝐴𝐴𝐴𝐴𝐴𝑖𝑖𝑖𝑖𝑖𝑖𝑖𝑖 and 𝑒𝑒𝑒𝑒𝑖𝑖𝑖𝑖𝑖𝑖𝑖𝑖𝑖𝑖𝑖𝑖𝑖𝑖𝑖𝑖𝑖𝑖𝑖𝑖𝑖𝑖𝑖𝑖𝑖𝑖𝑖𝑖 are the random components of the model. Digital dermatitis, ID, and sole ulcers were seldom diagnosed: DD was scored for 2, 1, and 4 legs when the animals entered the experiment and 8 and 13 wk later, respectively; ID was scored for 3, 1 and 1 legs, and sole ulcer was only scored once in wk 14. Therefore, only data for SH were statistically analyzed. Traits analyzed were number of zones with SH (Num_sh) for each inner or outer claw and average score for SH in zones 1 to 6 (Score_sh). A zone effect was added to model (1) for the analysis of SH per zone. Data were analyzed separately for measurements in wk 1, 9, and 14.Locomotion, IceTag data, feed intake, milk yield and BW were analyzed with ASReml statistical package with the following general linear mixed model (where x represents main effects and interactions and . represents interactions only):
𝑌𝑌𝑌𝑌𝑖𝑖𝑖𝑖𝑖𝑖𝑖𝑖𝑖𝑖𝑖𝑖𝑖𝑖𝑖𝑖𝑖𝑖𝑖𝑖𝑖𝑖𝑖𝑖𝑖𝑖𝑖𝑖𝑖𝑖𝑖𝑖 = 𝜇𝜇𝜇𝜇 + 𝐹𝐹𝐹𝐹𝑖𝑖𝑖𝑖 × 𝐿𝐿𝐿𝐿𝐿𝐿𝐿𝐿𝑖𝑖𝑖𝑖 + 𝐹𝐹𝐹𝐹𝑖𝑖𝑖𝑖. 𝐿𝐿𝐿𝐿𝐿𝐿𝐿𝐿𝑖𝑖𝑖𝑖 . 𝐿𝐿𝐿𝐿𝐿𝐿𝐿𝐿𝑖𝑖𝑖𝑖 + 𝐹𝐹𝐹𝐹𝑖𝑖𝑖𝑖 . 𝐿𝐿𝐿𝐿𝐿𝐿𝐿𝐿𝑖𝑖𝑖𝑖 .𝐷𝐷𝐷𝐷𝐷𝐷𝐷𝐷𝑖𝑖𝑖𝑖 + 𝐵𝐵𝐵𝐵𝐵𝐵𝐵𝐵𝑖𝑖𝑖𝑖 + 𝐴𝐴𝐴𝐴𝐴𝐴𝐴𝐴𝑖𝑖𝑖𝑖𝑖𝑖𝑖𝑖 + 𝑠𝑠𝑠𝑠𝐷𝐷𝐷𝐷𝐵𝐵𝐵𝐵(𝑊𝑊𝑊𝑊𝑊𝑊𝑊𝑊𝑖𝑖𝑖𝑖) + 𝑒𝑒𝑒𝑒𝑖𝑖𝑖𝑖𝑖𝑖𝑖𝑖𝑖𝑖𝑖𝑖𝑖𝑖𝑖𝑖𝑖𝑖𝑖𝑖𝑖𝑖𝑖𝑖𝑖𝑖𝑖𝑖𝑖𝑖𝑖𝑖 (2)
where 𝑌𝑌𝑌𝑌𝑖𝑖𝑖𝑖𝑖𝑖𝑖𝑖𝑖𝑖𝑖𝑖𝑖𝑖𝑖𝑖𝑖𝑖𝑖𝑖𝑖𝑖𝑖𝑖𝑖𝑖𝑖𝑖𝑖𝑖𝑖𝑖 is the variable recorded for floor i, restricted free stall access j, stage of lactation k, period l within day, block of entry m, animal n within block m, day or week oduring the experiment and repeated observation p; 𝜇𝜇𝜇𝜇 is the overall mean; 𝐹𝐹𝐹𝐹𝑖𝑖𝑖𝑖 is the type of floor on which a cow was kept during the treatment period (concrete, rubber); 𝐿𝐿𝐿𝐿𝐿𝐿𝐿𝐿𝑖𝑖𝑖𝑖 represents restricted free stall access (yes, no); 𝐿𝐿𝐿𝐿𝐿𝐿𝐿𝐿𝑖𝑖𝑖𝑖 represents week or day of lactation; 𝐷𝐷𝐷𝐷𝐷𝐷𝐷𝐷𝑖𝑖𝑖𝑖 represents diurnal effects of hour period or morning vs. afternoon; 𝐵𝐵𝐵𝐵𝐵𝐵𝐵𝐵𝑖𝑖𝑖𝑖 represents the block of entry (m = 1, 11); 𝐴𝐴𝐴𝐴𝐴𝐴𝐴𝐴𝑖𝑖𝑖𝑖𝑖𝑖𝑖𝑖 is the individual animal effect (l = 1, 44); 𝑠𝑠𝑠𝑠𝐷𝐷𝐷𝐷𝐵𝐵𝐵𝐵(𝑊𝑊𝑊𝑊𝑊𝑊𝑊𝑊𝑖𝑖𝑖𝑖) represents daily or weekly environmental fluctuations throughout the experiment; and 𝑒𝑒𝑒𝑒𝑖𝑖𝑖𝑖𝑖𝑖𝑖𝑖𝑖𝑖𝑖𝑖𝑖𝑖𝑖𝑖𝑖𝑖𝑖𝑖𝑖𝑖𝑖𝑖𝑖𝑖𝑖𝑖𝑖𝑖𝑖𝑖 is the error term. 𝐵𝐵𝐵𝐵𝐵𝐵𝐵𝐵𝑖𝑖𝑖𝑖, 𝐴𝐴𝐴𝐴𝐴𝐴𝐴𝐴𝑖𝑖𝑖𝑖𝑖𝑖𝑖𝑖, 𝑠𝑠𝑠𝑠𝐷𝐷𝐷𝐷𝐵𝐵𝐵𝐵(𝑊𝑊𝑊𝑊𝑊𝑊𝑊𝑊𝑖𝑖𝑖𝑖) and 𝑒𝑒𝑒𝑒𝑖𝑖𝑖𝑖𝑖𝑖𝑖𝑖𝑖𝑖𝑖𝑖𝑖𝑖𝑖𝑖𝑖𝑖𝑖𝑖𝑖𝑖𝑖𝑖𝑖𝑖𝑖𝑖𝑖𝑖𝑖𝑖 are the random components of the model. Most variables were corrected for effects of day in lactation within treatment, but locomotion traits (scored once per week) were corrected for lactation weeks within treatment. IceTag data and feed intake data were corrected for hour within day and milk yield and BW were corrected

Chapter 3
56
for differences between morning and afternoon. Locomotion variables were not corrected for diurnal effects because these were observed once per week. Furthermore, IceTag data were corrected for sensor type (2D or 3D) and feed intake data were corrected for feeder effects. These variables were added as random variables. For all variables, effects were tested against variation between animals within treatments.
3 RESULTS
3.1 GeneralOne animal was removed from the trial 3 wk after calving and replaced because it lay down in the alley too often during the restriction period. This animal did not have visible health problems and the data from this animal were excluded from the analysis. The other animals resigned to the lying restriction and mainly kept standing during this period, although occasionally animals were seen lying on the alley floor. One animal from the rubber-topped floor and unrestricted access to the freestalls treatment could not be kept in the experiment until 3 mo after calving because it became seriously ill 10 wk after calving and was transferred to the straw covered pen. The illness was not due to claw or leg disorders, and the data from this animal until she became ill are included in the analysis.
3.2 Behavior recorded with IceTagsResults regarding treatment effects were similar for the data aggregated per hour and per day, and because the analysis per hour provides more information results presented are from the analysis of data aggregated per hour. Predicted means and significance levels of the fixed effects in the model for each experimental phase are in Table 2. The figures in Table 2 indicate that the percentage of time spent standing was increased in the treatment period compared with the precalving and posttreatment periods. For number of strides per hour, a similar increase occurred after calving in the treatment period, but the number of strides in the posttreatment period remained higher than precalving. The number of bouts per hour increased over time. Treatment groups did not differ for percentage of time spent standing, number of bouts or number of strides per hour before calving. During the treatment period, the animals with restricted freestall access had significantly more strides per hour and less standing bouts per hour than the unrestricted animals. These differences disappeared in the posttreatment period. The overall percentage of time spent standing was not affected. The predicted means (±SE) for restricted and unrestricted groups in each experimental phase for all 3 traits are presented in Figure 2. To obtain more comparable scales, the number of standing bouts was expressed per day. Figure 2 illustrates that lying restricted animals made more strides per hour (99.8 ± 5.4 vs. 87.2 ± 5.4) and had fewer standing bouts per day (14.4 ± 1.0 vs. 17.9 ± 1.0) during the treatment period than the unrestricted animals.
Housing condition and bovine claw health
57
Figure 2. Predicted means (± SE) for restricted and unrestricted groups for percentage of time spent standing, number of strides per hour, and number of standing bouts per day for each experimental phase.
For all traits, significant effects of 𝐹𝐹𝐹𝐹𝑖𝑖𝑖𝑖 × 𝐿𝐿𝐿𝐿𝐿𝐿𝐿𝐿𝑖𝑖𝑖𝑖 × 𝐿𝐿𝐿𝐿𝐿𝐿𝐿𝐿𝑖𝑖𝑖𝑖 and 𝐹𝐹𝐹𝐹𝑖𝑖𝑖𝑖 × 𝐿𝐿𝐿𝐿𝐿𝐿𝐿𝐿𝑖𝑖𝑖𝑖 × 𝐷𝐷𝐷𝐷𝐷𝐷𝐷𝐷𝑖𝑖𝑖𝑖 were found. The effect of 𝐹𝐹𝐹𝐹𝑖𝑖𝑖𝑖 × 𝐿𝐿𝐿𝐿𝐿𝐿𝐿𝐿𝑖𝑖𝑖𝑖 × 𝐿𝐿𝐿𝐿𝐿𝐿𝐿𝐿𝑖𝑖𝑖𝑖 reflected that trait levels were not constant over time. Differences between the treatment groups in development of the levels over time were not substantial (Figure 3). Particularly around calving, the percentage of time spent standing and the number of strides per hour were increased, but returned to more moderate levels within a few days after calving. The number of standing bouts was low the first days after calving for all treatment groups. The effect of 𝐹𝐹𝐹𝐹𝑖𝑖𝑖𝑖 × 𝐿𝐿𝐿𝐿𝐿𝐿𝐿𝐿𝑖𝑖𝑖𝑖 × 𝐷𝐷𝐷𝐷𝐷𝐷𝐷𝐷𝑖𝑖𝑖𝑖 reflected 2 phenomena: (1) lying and standing were not evenly distributed over the 24-h period and (2) despite the absence of overall effects of restricted freestall access on the percentage of time spent standing, this treatment factor did affect diurnal patterns of lying and standing. This is illustrated in Figure 4. Patterns for percentage of time spent standing and number of strides per hour were quite similar, but the number of standing bouts showed a reverse pattern. Prior to calving, the animals were lying most of the time at night. During the treatment period, the animals that had no overnight access to the freestalls were standing most of the time at night, and the unrestricted animals stood more at night than before calving and posttreatment. The restricted animals compensated by lying during the day and after the afternoon milking. Peaks of activity in early morning and afternoon indicate milkings. Posttreatment differences between treatment groups had disappeared, but nighttime activity remained higher than precalving.
0.020.040.060.0
80.0100.0120.0
unre
stric
ted
rest
ricte
d
unre
stric
ted
rest
ricte
d
unre
stric
ted
rest
ricte
d
pre-calving
pre-calving
treatment treatment posttreatment
posttreatment
estim
ate %standing
#strides/hour#standing bouts/day

3
Chapter 3
56
for differences between morning and afternoon. Locomotion variables were not corrected for diurnal effects because these were observed once per week. Furthermore, IceTag data were corrected for sensor type (2D or 3D) and feed intake data were corrected for feeder effects. These variables were added as random variables. For all variables, effects were tested against variation between animals within treatments.
3 RESULTS
3.1 GeneralOne animal was removed from the trial 3 wk after calving and replaced because it lay down in the alley too often during the restriction period. This animal did not have visible health problems and the data from this animal were excluded from the analysis. The other animals resigned to the lying restriction and mainly kept standing during this period, although occasionally animals were seen lying on the alley floor. One animal from the rubber-topped floor and unrestricted access to the freestalls treatment could not be kept in the experiment until 3 mo after calving because it became seriously ill 10 wk after calving and was transferred to the straw covered pen. The illness was not due to claw or leg disorders, and the data from this animal until she became ill are included in the analysis.
3.2 Behavior recorded with IceTagsResults regarding treatment effects were similar for the data aggregated per hour and per day, and because the analysis per hour provides more information results presented are from the analysis of data aggregated per hour. Predicted means and significance levels of the fixed effects in the model for each experimental phase are in Table 2. The figures in Table 2 indicate that the percentage of time spent standing was increased in the treatment period compared with the precalving and posttreatment periods. For number of strides per hour, a similar increase occurred after calving in the treatment period, but the number of strides in the posttreatment period remained higher than precalving. The number of bouts per hour increased over time. Treatment groups did not differ for percentage of time spent standing, number of bouts or number of strides per hour before calving. During the treatment period, the animals with restricted freestall access had significantly more strides per hour and less standing bouts per hour than the unrestricted animals. These differences disappeared in the posttreatment period. The overall percentage of time spent standing was not affected. The predicted means (±SE) for restricted and unrestricted groups in each experimental phase for all 3 traits are presented in Figure 2. To obtain more comparable scales, the number of standing bouts was expressed per day. Figure 2 illustrates that lying restricted animals made more strides per hour (99.8 ± 5.4 vs. 87.2 ± 5.4) and had fewer standing bouts per day (14.4 ± 1.0 vs. 17.9 ± 1.0) during the treatment period than the unrestricted animals.
Housing condition and bovine claw health
57
Figure 2. Predicted means (± SE) for restricted and unrestricted groups for percentage of time spent standing, number of strides per hour, and number of standing bouts per day for each experimental phase.
For all traits, significant effects of 𝐹𝐹𝐹𝐹𝑖𝑖𝑖𝑖 × 𝐿𝐿𝐿𝐿𝐿𝐿𝐿𝐿𝑖𝑖𝑖𝑖 × 𝐿𝐿𝐿𝐿𝐿𝐿𝐿𝐿𝑖𝑖𝑖𝑖 and 𝐹𝐹𝐹𝐹𝑖𝑖𝑖𝑖 × 𝐿𝐿𝐿𝐿𝐿𝐿𝐿𝐿𝑖𝑖𝑖𝑖 × 𝐷𝐷𝐷𝐷𝐷𝐷𝐷𝐷𝑖𝑖𝑖𝑖 were found. The effect of 𝐹𝐹𝐹𝐹𝑖𝑖𝑖𝑖 × 𝐿𝐿𝐿𝐿𝐿𝐿𝐿𝐿𝑖𝑖𝑖𝑖 × 𝐿𝐿𝐿𝐿𝐿𝐿𝐿𝐿𝑖𝑖𝑖𝑖 reflected that trait levels were not constant over time. Differences between the treatment groups in development of the levels over time were not substantial (Figure 3). Particularly around calving, the percentage of time spent standing and the number of strides per hour were increased, but returned to more moderate levels within a few days after calving. The number of standing bouts was low the first days after calving for all treatment groups. The effect of 𝐹𝐹𝐹𝐹𝑖𝑖𝑖𝑖 × 𝐿𝐿𝐿𝐿𝐿𝐿𝐿𝐿𝑖𝑖𝑖𝑖 × 𝐷𝐷𝐷𝐷𝐷𝐷𝐷𝐷𝑖𝑖𝑖𝑖 reflected 2 phenomena: (1) lying and standing were not evenly distributed over the 24-h period and (2) despite the absence of overall effects of restricted freestall access on the percentage of time spent standing, this treatment factor did affect diurnal patterns of lying and standing. This is illustrated in Figure 4. Patterns for percentage of time spent standing and number of strides per hour were quite similar, but the number of standing bouts showed a reverse pattern. Prior to calving, the animals were lying most of the time at night. During the treatment period, the animals that had no overnight access to the freestalls were standing most of the time at night, and the unrestricted animals stood more at night than before calving and posttreatment. The restricted animals compensated by lying during the day and after the afternoon milking. Peaks of activity in early morning and afternoon indicate milkings. Posttreatment differences between treatment groups had disappeared, but nighttime activity remained higher than precalving.
0.020.040.060.0
80.0100.0120.0
unre
stric
ted
rest
ricte
d
unre
stric
ted
rest
ricte
d
unre
stric
ted
rest
ricte
d
pre-calving
pre-calving
treatment treatment posttreatment
posttreatment
estim
ate %standing
#strides/hour#standing bouts/day

Chapter 3
58
Tabl
e 2
Pred
icte
d m
eans
for p
erce
ntag
e of
tim
e sp
ent s
tand
ing,
num
ber o
f stri
des
per
hour
, and
num
ber
of s
tand
ing
bout
s pe
r ho
ur (I
ceTa
g da
ta) a
nd P
-val
ues f
or m
odel
term
s
Mod
el te
rm1
Item
Mea
n ±
SE𝐹𝐹𝐹𝐹 𝑖𝑖𝑖𝑖
𝐿𝐿𝐿𝐿𝐿𝐿𝐿𝐿𝑗𝑗𝑗𝑗
𝐹𝐹𝐹𝐹 𝑖𝑖𝑖𝑖 ×
𝐿𝐿𝐿𝐿𝐿𝐿𝐿𝐿 𝑗𝑗𝑗𝑗
𝐹𝐹𝐹𝐹 𝑖𝑖𝑖𝑖×𝐿𝐿𝐿𝐿𝐿𝐿𝐿𝐿𝑗𝑗𝑗𝑗
×𝐿𝐿𝐿𝐿𝐿𝐿𝐿𝐿
𝑊𝑊𝑊𝑊𝐹𝐹𝐹𝐹 𝑖𝑖𝑖𝑖
×𝐿𝐿𝐿𝐿𝐿𝐿𝐿𝐿𝑗𝑗𝑗𝑗
×𝐷𝐷𝐷𝐷𝐷𝐷𝐷𝐷 𝐵𝐵𝐵𝐵
Perc
enta
ge o
f tim
e sp
ent s
tand
ing
Pre-
calv
ing
51.3
± 2
.50.
978
0.50
80.
259
< 0.
001
< 0.
001
Trea
tmen
t61
.9 ±
1.3
0.16
60.
271
0.30
5<
0.00
1<
0.00
1
Postt
reat
men
t51
.7 ±
1.4
0.05
50.
269
0.85
6<
0.00
1<
0.00
1
Num
ber o
f stri
des p
er h
our
Pre-
calv
ing
72.6
± 6
.20.
930
0.94
20.
968
< 0.
001
< 0.
001
Trea
tmen
t93
.5 ±
4.7
0.21
70.
030
0.78
0<
0.00
1<
0.00
1
Postt
reat
men
t83
.2 ±
4.1
0.50
80.
569
0.98
5<
0.00
1<
0.00
1
Num
ber o
f sta
ndin
g bo
uts p
er h
our
Pre-
calv
ing
0.58
± 0
.04
0.30
10.
508
0.65
10.
001
< 0.
001
Trea
tmen
t0.
67 ±
0.0
30.
489
0.02
00.
311
< 0.
001
< 0.
001
Postt
reat
men
t0.
91±
0.04
0.42
90.
784
0.48
20.
023
< 0.
001
1𝐹𝐹𝐹𝐹 𝑖𝑖𝑖𝑖
= flo
orin
g i,𝐿𝐿𝐿𝐿𝐿𝐿𝐿𝐿𝑗𝑗𝑗𝑗
= re
stric
ted
frees
tall
acce
ss j,𝐿𝐿𝐿𝐿𝐿𝐿𝐿𝐿
𝑊𝑊𝑊𝑊=
lact
atio
n sta
ge k
(d) a
nd 𝐷𝐷𝐷𝐷𝐷𝐷𝐷𝐷 𝐵𝐵𝐵𝐵
= ho
ur p
erio
d l
Housing condition and bovine claw health
59
Figure 3. Model predictions (±SE) for each experimental group for average percentage of time spent standing, number of strides per hour, and number of standing bouts per hour per day for each experimental phase [model term F × Lr × Lw in model [2]; F = flooring, Lr = restricted freestall access, Lw = lactation stage (d)]. Magnitudes of SE are similar for all groups; to improve readability, SE is only presented for the group kept on rubber floors with restricted access to the freestalls. C = concrete floor; R = rubber-topped floor; Ur = unrestricted access to the freestalls; Lr = restricted acccess to the freestalls.

3
Chapter 3
58
Tabl
e 2
Pred
icte
d m
eans
for p
erce
ntag
e of
tim
e sp
ent s
tand
ing,
num
ber o
f stri
des
per
hour
, and
num
ber
of s
tand
ing
bout
s pe
r ho
ur (I
ceTa
g da
ta) a
nd P
-val
ues f
or m
odel
term
s
Mod
el te
rm1
Item
Mea
n ±
SE𝐹𝐹𝐹𝐹 𝑖𝑖𝑖𝑖
𝐿𝐿𝐿𝐿𝐿𝐿𝐿𝐿𝑗𝑗𝑗𝑗
𝐹𝐹𝐹𝐹 𝑖𝑖𝑖𝑖 ×
𝐿𝐿𝐿𝐿𝐿𝐿𝐿𝐿 𝑗𝑗𝑗𝑗
𝐹𝐹𝐹𝐹 𝑖𝑖𝑖𝑖×𝐿𝐿𝐿𝐿𝐿𝐿𝐿𝐿𝑗𝑗𝑗𝑗
×𝐿𝐿𝐿𝐿𝐿𝐿𝐿𝐿
𝑊𝑊𝑊𝑊𝐹𝐹𝐹𝐹 𝑖𝑖𝑖𝑖
×𝐿𝐿𝐿𝐿𝐿𝐿𝐿𝐿𝑗𝑗𝑗𝑗
×𝐷𝐷𝐷𝐷𝐷𝐷𝐷𝐷 𝐵𝐵𝐵𝐵
Perc
enta
ge o
f tim
e sp
ent s
tand
ing
Pre-
calv
ing
51.3
± 2
.50.
978
0.50
80.
259
< 0.
001
< 0.
001
Trea
tmen
t61
.9 ±
1.3
0.16
60.
271
0.30
5<
0.00
1<
0.00
1
Postt
reat
men
t51
.7 ±
1.4
0.05
50.
269
0.85
6<
0.00
1<
0.00
1
Num
ber o
f stri
des p
er h
our
Pre-
calv
ing
72.6
± 6
.20.
930
0.94
20.
968
< 0.
001
< 0.
001
Trea
tmen
t93
.5 ±
4.7
0.21
70.
030
0.78
0<
0.00
1<
0.00
1
Postt
reat
men
t83
.2 ±
4.1
0.50
80.
569
0.98
5<
0.00
1<
0.00
1
Num
ber o
f sta
ndin
g bo
uts p
er h
our
Pre-
calv
ing
0.58
± 0
.04
0.30
10.
508
0.65
10.
001
< 0.
001
Trea
tmen
t0.
67 ±
0.0
30.
489
0.02
00.
311
< 0.
001
< 0.
001
Postt
reat
men
t0.
91±
0.04
0.42
90.
784
0.48
20.
023
< 0.
001
1𝐹𝐹𝐹𝐹 𝑖𝑖𝑖𝑖
= flo
orin
g i,𝐿𝐿𝐿𝐿𝐿𝐿𝐿𝐿𝑗𝑗𝑗𝑗
= re
stric
ted
frees
tall
acce
ss j,𝐿𝐿𝐿𝐿𝐿𝐿𝐿𝐿
𝑊𝑊𝑊𝑊=
lact
atio
n sta
ge k
(d) a
nd 𝐷𝐷𝐷𝐷𝐷𝐷𝐷𝐷 𝐵𝐵𝐵𝐵
= ho
ur p
erio
d l
Housing condition and bovine claw health
59
Figure 3. Model predictions (±SE) for each experimental group for average percentage of time spent standing, number of strides per hour, and number of standing bouts per hour per day for each experimental phase [model term F × Lr × Lw in model [2]; F = flooring, Lr = restricted freestall access, Lw = lactation stage (d)]. Magnitudes of SE are similar for all groups; to improve readability, SE is only presented for the group kept on rubber floors with restricted access to the freestalls. C = concrete floor; R = rubber-topped floor; Ur = unrestricted access to the freestalls; Lr = restricted acccess to the freestalls.

Chapter 3
60
Figure 4. Model predictions (±SE) for each experimental group for average percentage of time spent standing, number of strides, and number of standing bouts per hour period for each experimental phase (model term F × Lr × Dp in model [2]; F = flooring; Lr = restricted freestall access; Dp = hour period). Magnitudes of SE are similar for all groups; to improve readability, SE is only presented for the group kept on rubber floors with restricted access to the freestalls. C = concrete floor; R = rubber-topped floor; Ur = unrestricted access to the freestalls; Lr = restricted acccess to the freestalls.
3.3 Feed IntakeDuring the treatment period, the average PMR intake was 30.6 ± 0.6 kg/animal per day (12.1 ± 0.3 kg of DM); during the posttreatment period, the average PMR intake was 36.0 ± 0.6 kg/animal per day (16.4 ± 0.3 kg of DM). Results regarding treatment effects were similar for the data aggregated per hour and per day. Because the analysis per hour provides more information, results refer to data aggregated per hour. Predicted means and significance levels of the fixed effects in the model for each experimental phase are given in Table 3.
Housing condition and bovine claw health
61

3
Chapter 3
60
Figure 4. Model predictions (±SE) for each experimental group for average percentage of time spent standing, number of strides, and number of standing bouts per hour period for each experimental phase (model term F × Lr × Dp in model [2]; F = flooring; Lr = restricted freestall access; Dp = hour period). Magnitudes of SE are similar for all groups; to improve readability, SE is only presented for the group kept on rubber floors with restricted access to the freestalls. C = concrete floor; R = rubber-topped floor; Ur = unrestricted access to the freestalls; Lr = restricted acccess to the freestalls.
3.3 Feed IntakeDuring the treatment period, the average PMR intake was 30.6 ± 0.6 kg/animal per day (12.1 ± 0.3 kg of DM); during the posttreatment period, the average PMR intake was 36.0 ± 0.6 kg/animal per day (16.4 ± 0.3 kg of DM). Results regarding treatment effects were similar for the data aggregated per hour and per day. Because the analysis per hour provides more information, results refer to data aggregated per hour. Predicted means and significance levels of the fixed effects in the model for each experimental phase are given in Table 3.
Housing condition and bovine claw health
61

Chapter 3
62
Data in Table 3 show that flooring was related to time spent feeding and intake speed during the treatment period, but other than that, no differences between the treatment groups were found. The animals on the rubber floor spent more time feeding (7.3 ± 0.3 vs. 6.6 ± 0.3 min/h) and ate more slowly (3.05 ± 0.14 vs. 3.46 ± 0.14 g/s) than the animals on the concrete floor. The estimates for 𝐹𝐹𝐹𝐹𝑖𝑖𝑖𝑖 × 𝐿𝐿𝐿𝐿𝐿𝐿𝐿𝐿𝑖𝑖𝑖𝑖 × 𝐿𝐿𝐿𝐿𝐿𝐿𝐿𝐿𝑖𝑖𝑖𝑖 revealed the same pattern for all experimental groups and showed a gradual increase in feeding time and feed intake during the treatment period1. The estimates for 𝐹𝐹𝐹𝐹𝑖𝑖𝑖𝑖 × 𝐿𝐿𝐿𝐿𝐿𝐿𝐿𝐿𝑖𝑖𝑖𝑖 × 𝐷𝐷𝐷𝐷𝐷𝐷𝐷𝐷𝑖𝑖𝑖𝑖 during the treatment period in Figure 5 show diurnal patterns that were different for the animals with restricted and unrestricted freestall access. The animals that had no overnight freestall access spent more time feeding at night. Patterns for feeding time, number of meals, and feed intake were similar, but feed intake speed was higher during the day than at night. In the posttreatment period, the diurnal patterns of feed intake for all treatment groups were similar to those for the unrestricted groups in the treatment period.
Figure 5. Model predictions (±SE) for each experimental group for average feeding time, feed intake, number of meals, and intake speed per hour period during the treatment phase (model term F × Lr × Dp in model [2]; F = flooring; Lr = restricted freestall access; Dp = hour period). Magnitudes of SE are similar for all groups; to improve readability, SE is only presented for group on rubber floors with restricted access to the freestalls. C = concrete floor; R = rubber-topped floor; Ur = unrestricted access to the freestalls; Lr = restricted access to the freestalls.
1 See figure 1 in the appendix for graphs of the estimates.
Housing condition and bovine claw health
63
3.4 Claw DisordersFigures for Num_sh represent the number of claw zones with hemorrhages per claw half (maximum theoretically is 6) and figures for Score_sh represent the average hemorrhage score per zone for each inner or outer claw (scored on a scale from 0 to 5). Predicted means and significance levels of the fixed effects in the model are given in Table 4.Table 4 indicates that no significant differences were found in claw health between groups at the start of the treatments. The prevalence of hemorrhaged zones increased during the first 3 mo after calving. Significantly more hemorrhaged zones were found in hind legs than in fore legs for all measurements. In hind legs, most hemorrhages occurred in outer claws; in fore legs, most hemorrhages occurred in inner claws, but the interaction was not significant for Num_sh in wk 1, probably because of the low prevalence and severity. In wk 1 Score_sh was only slightly higher than Num_sh/6, but the difference increased in wk 9 and 14. This indicates that the hemorrhages initially were usually small and mild, but severity increased during the first 3 mo after calving. Significant differences between zones were found for Score_sh throughout the experiment; the predicted means for each zone are presented in Figure 6. Zones 3, 4, and 6 had significantly more hemorrhages than zones 1, 2, and 5, particularly 9 and 14 wk after calving. The estimates are dominated by the occurrence of hemorrhages in outer hind claws2.
Table 4 Predicted means for number of sole hemorrhages (Num_sh) and hemorrhage score per zone (Score_sh) and P-values for model terms
Num_sh Score_sh
Week 1 Week 9 Week 14 Week 1 Week 9 Week 14
Mean ± SE 0.24 ± 0.08 0.78 ± 0.11 1.18 ± 0.14 0.04 ± 0.01 0.17 ± 0.02 0.24 ± 0.02
Model term1
F 0.515 0.05 0.029 0.614 0.024 0.066
Lr 0.859 0.918 0.966 0.955 0.878 0.803
F x Lr 0.953 0.864 0.086 0.866 0.61 0.042
Lg < 0.001 < 0.001 < 0.001 < 0.001 < 0.001 < 0.001
C 0.131 < 0.001 < 0.001 0.117 < 0.001 < 0.001
Lg x C 0.147 < 0.001 < 0.001 0.034 < 0.001 < 0.001
zone 0.003 < 0.001 < 0.0011 F = flooring, Lr = restricted freestall access, Lg = leg, Cl = claw and zone = area of sole
2 See table 1 in the appendix for the model estimates

3
Chapter 3
62
Data in Table 3 show that flooring was related to time spent feeding and intake speed during the treatment period, but other than that, no differences between the treatment groups were found. The animals on the rubber floor spent more time feeding (7.3 ± 0.3 vs. 6.6 ± 0.3 min/h) and ate more slowly (3.05 ± 0.14 vs. 3.46 ± 0.14 g/s) than the animals on the concrete floor. The estimates for 𝐹𝐹𝐹𝐹𝑖𝑖𝑖𝑖 × 𝐿𝐿𝐿𝐿𝐿𝐿𝐿𝐿𝑖𝑖𝑖𝑖 × 𝐿𝐿𝐿𝐿𝐿𝐿𝐿𝐿𝑖𝑖𝑖𝑖 revealed the same pattern for all experimental groups and showed a gradual increase in feeding time and feed intake during the treatment period1. The estimates for 𝐹𝐹𝐹𝐹𝑖𝑖𝑖𝑖 × 𝐿𝐿𝐿𝐿𝐿𝐿𝐿𝐿𝑖𝑖𝑖𝑖 × 𝐷𝐷𝐷𝐷𝐷𝐷𝐷𝐷𝑖𝑖𝑖𝑖 during the treatment period in Figure 5 show diurnal patterns that were different for the animals with restricted and unrestricted freestall access. The animals that had no overnight freestall access spent more time feeding at night. Patterns for feeding time, number of meals, and feed intake were similar, but feed intake speed was higher during the day than at night. In the posttreatment period, the diurnal patterns of feed intake for all treatment groups were similar to those for the unrestricted groups in the treatment period.
Figure 5. Model predictions (±SE) for each experimental group for average feeding time, feed intake, number of meals, and intake speed per hour period during the treatment phase (model term F × Lr × Dp in model [2]; F = flooring; Lr = restricted freestall access; Dp = hour period). Magnitudes of SE are similar for all groups; to improve readability, SE is only presented for group on rubber floors with restricted access to the freestalls. C = concrete floor; R = rubber-topped floor; Ur = unrestricted access to the freestalls; Lr = restricted access to the freestalls.
1 See figure 1 in the appendix for graphs of the estimates.
Housing condition and bovine claw health
63
3.4 Claw DisordersFigures for Num_sh represent the number of claw zones with hemorrhages per claw half (maximum theoretically is 6) and figures for Score_sh represent the average hemorrhage score per zone for each inner or outer claw (scored on a scale from 0 to 5). Predicted means and significance levels of the fixed effects in the model are given in Table 4.Table 4 indicates that no significant differences were found in claw health between groups at the start of the treatments. The prevalence of hemorrhaged zones increased during the first 3 mo after calving. Significantly more hemorrhaged zones were found in hind legs than in fore legs for all measurements. In hind legs, most hemorrhages occurred in outer claws; in fore legs, most hemorrhages occurred in inner claws, but the interaction was not significant for Num_sh in wk 1, probably because of the low prevalence and severity. In wk 1 Score_sh was only slightly higher than Num_sh/6, but the difference increased in wk 9 and 14. This indicates that the hemorrhages initially were usually small and mild, but severity increased during the first 3 mo after calving. Significant differences between zones were found for Score_sh throughout the experiment; the predicted means for each zone are presented in Figure 6. Zones 3, 4, and 6 had significantly more hemorrhages than zones 1, 2, and 5, particularly 9 and 14 wk after calving. The estimates are dominated by the occurrence of hemorrhages in outer hind claws2.
Table 4 Predicted means for number of sole hemorrhages (Num_sh) and hemorrhage score per zone (Score_sh) and P-values for model terms
Num_sh Score_sh
Week 1 Week 9 Week 14 Week 1 Week 9 Week 14
Mean ± SE 0.24 ± 0.08 0.78 ± 0.11 1.18 ± 0.14 0.04 ± 0.01 0.17 ± 0.02 0.24 ± 0.02
Model term1
F 0.515 0.05 0.029 0.614 0.024 0.066
Lr 0.859 0.918 0.966 0.955 0.878 0.803
F x Lr 0.953 0.864 0.086 0.866 0.61 0.042
Lg < 0.001 < 0.001 < 0.001 < 0.001 < 0.001 < 0.001
C 0.131 < 0.001 < 0.001 0.117 < 0.001 < 0.001
Lg x C 0.147 < 0.001 < 0.001 0.034 < 0.001 < 0.001
zone 0.003 < 0.001 < 0.0011 F = flooring, Lr = restricted freestall access, Lg = leg, Cl = claw and zone = area of sole
2 See table 1 in the appendix for the model estimates

Chapter 3
64
Figure 6. Predicted means (± SE) per observation for each claw zone for hemorrhage score per zone.
The results for wk 9 and 14 indicate significant effects of flooring, but no effects of restricted freestall access on the occurrence of SH. Generally, the animals kept on the concrete floor had higher scores for Num_sh (0.94 ± 0.14, wk 9; 1.36 ± 0.16, wk 14) and Score_sh (0.21 ± 0.03, wk 9; 0.27 ± 0.03, wk 14) than the animals kept on the rubber floor (0.61 ± 0.14, wk 9; 1.01 ± 0.16, wk 14; 0.13 ± 0.03, wk 9; 0.20 ± 0.03, wk 14), respectively. In wk 14, the animals with no overnight freestall access on the concrete floor had higher scores (P < 0.05) for Score_sh than the animals in the other treatment groups (0.31 ± 0.04), whereas those on the rubber floor had the lowest scores (0.17 ± 0.04). Therefore, the effect of floor was notsignificant, but the interaction of floor and lying restriction was.
3.5 Locomotion, BW, and Milk YieldLocomotion variables did not differ for the treatment groups; overall predicted means were 1.7 ± 0.1 for locomotion score, 8.6 ± 0.2 s for duration, and 15.9 ± 0.1 steps to travel 10.36 m. Similarly, no significant differences were found between treatment groups in daily milk yield during the treatment and posttreatment periods. The milk yield was 30.4 ± 0.6 kg/d during the treatment period and 32.5 ± 0.6 kg/d during the posttreatment period. Body weight and patterns of BW change were not significantly different between treatment groups. On average, BW declined from 554 ± 8 kg 1 d after calving to 527 ± 8 kg 25 d after calving, and from then on, gradually increased to 560 ± 9 kg 3 mo after calving.
4 DISCUSSIONThe aim was to quantify effects of housing conditions that presumably differ in mechanical load and thus might affect the prevalence of SH. The results support the hypothesis that
-0.1
0
0.1
0.2
0.3
0.4
0.5
0.6
zone 1 zone 2 zone 3 zone 4 zone 5 zone 6
pred
icte
d m
ean
scor
e_sh
week 1week 9week 14
Housing condition and bovine claw health
65
compliant rubber-topped floors decrease the occurrence of SH compared with hard concrete floors, probably because of a reduction in mechanical load, in particular, mechanical stresses. Restricted freestall access resulted in longer standing bouts and increased activity, but did not result in a significant increase in hemorrhages, and presumably overall mechanical load was only slightly affected. The animals adapted to their circumstances by additional lyingtime during the rest of the day, such that overall lying time was not significantly affected. Tucker et al. (2006) reported increased occurrence of lying on rubber-topped alley floors compared with concrete alley floors when lying comfort in the freestalls was insufficient. In our study, lying on the alley floor occurred only occasionally while freestalls were inaccessible, and the similarity of diurnal patterns for animals on concrete floors with restricted freestall access and those on rubber-topped floor with restricted freestall access in Figure 4 indicates that this did not differ between the floor types. We found no cumulative negative effects of repeated periods of lying deprivation on animal well-being as was expected by Cooper et al. (2007), presumably because the animals in our experiment recovered their lying time lost overnight during the next day. Daily feed intakes were not affected by treatments, but animals on hard floors had higher intake speed and shorter meal durations. Figure 5 shows that diurnal variation in feed intake corresponds with patterns for number of standing bouts. Animals without overnight access to the freestalls spent part of the additional nightly standing time feeding. The animals spent around 3 h/d on PMR intake. Productive performance and BW change were not affected significantly by treatments.Heifers were chosen as experimental animals because they presumably are relatively susceptible to hemorrhages and have minimal history regarding claw disorders. Information on the claw health of heifers before first calving is scarce, but Frankena et al. (1992)suggested that they may already have lower claw health at the time of first calving. The scores for claw disorders in the first week after calving indicated that apart from some small hemorrhages, the animals had good claw health after calving. We assume that keeping them in a straw pen the last 5 wk before calving was beneficial for their claws. Because of the low claw disorder prevalence when the animals entered the experiment, the 3 periods were analyzed separately. Additional analyses showed that analyzing the incidence of SH posttreatment (i.e., taking only claws into account that did not show SH during the first observation) gave almost identical results.Both restricted freestall access and hard concrete floors were expected to increase mechanical load and thus would be risk factors for SH occurrence. The lower prevalence of SH on rubber floors found in this study indicated beneficial effects of compliant flooring on claw health, even though the effects of rubber flooring were probably underestimated. A substantial portion of activity took place around milking, when all animals walked on the same concrete slatted floor, whereas peak loads during walking are higher than those during standing. Moreover, this exposure to concrete flooring could have diminished beneficial effects of soft flooring on the maintenance of sole concavity that were reported by Telezhenko (2007). In contrast to results reported by Kremer et al. (2007) and Ouweltjes et al. (2009), more standing or higher activity was not found on the rubber floor. This may be due in part to differences in conditions. The pens where the animals were kept were rather compact; the animals only

3
Chapter 3
64
Figure 6. Predicted means (± SE) per observation for each claw zone for hemorrhage score per zone.
The results for wk 9 and 14 indicate significant effects of flooring, but no effects of restricted freestall access on the occurrence of SH. Generally, the animals kept on the concrete floor had higher scores for Num_sh (0.94 ± 0.14, wk 9; 1.36 ± 0.16, wk 14) and Score_sh (0.21 ± 0.03, wk 9; 0.27 ± 0.03, wk 14) than the animals kept on the rubber floor (0.61 ± 0.14, wk 9; 1.01 ± 0.16, wk 14; 0.13 ± 0.03, wk 9; 0.20 ± 0.03, wk 14), respectively. In wk 14, the animals with no overnight freestall access on the concrete floor had higher scores (P < 0.05) for Score_sh than the animals in the other treatment groups (0.31 ± 0.04), whereas those on the rubber floor had the lowest scores (0.17 ± 0.04). Therefore, the effect of floor was notsignificant, but the interaction of floor and lying restriction was.
3.5 Locomotion, BW, and Milk YieldLocomotion variables did not differ for the treatment groups; overall predicted means were 1.7 ± 0.1 for locomotion score, 8.6 ± 0.2 s for duration, and 15.9 ± 0.1 steps to travel 10.36 m. Similarly, no significant differences were found between treatment groups in daily milk yield during the treatment and posttreatment periods. The milk yield was 30.4 ± 0.6 kg/d during the treatment period and 32.5 ± 0.6 kg/d during the posttreatment period. Body weight and patterns of BW change were not significantly different between treatment groups. On average, BW declined from 554 ± 8 kg 1 d after calving to 527 ± 8 kg 25 d after calving, and from then on, gradually increased to 560 ± 9 kg 3 mo after calving.
4 DISCUSSIONThe aim was to quantify effects of housing conditions that presumably differ in mechanical load and thus might affect the prevalence of SH. The results support the hypothesis that
-0.1
0
0.1
0.2
0.3
0.4
0.5
0.6
zone 1 zone 2 zone 3 zone 4 zone 5 zone 6
pred
icte
d m
ean
scor
e_sh
week 1week 9week 14
Housing condition and bovine claw health
65
compliant rubber-topped floors decrease the occurrence of SH compared with hard concrete floors, probably because of a reduction in mechanical load, in particular, mechanical stresses. Restricted freestall access resulted in longer standing bouts and increased activity, but did not result in a significant increase in hemorrhages, and presumably overall mechanical load was only slightly affected. The animals adapted to their circumstances by additional lyingtime during the rest of the day, such that overall lying time was not significantly affected. Tucker et al. (2006) reported increased occurrence of lying on rubber-topped alley floors compared with concrete alley floors when lying comfort in the freestalls was insufficient. In our study, lying on the alley floor occurred only occasionally while freestalls were inaccessible, and the similarity of diurnal patterns for animals on concrete floors with restricted freestall access and those on rubber-topped floor with restricted freestall access in Figure 4 indicates that this did not differ between the floor types. We found no cumulative negative effects of repeated periods of lying deprivation on animal well-being as was expected by Cooper et al. (2007), presumably because the animals in our experiment recovered their lying time lost overnight during the next day. Daily feed intakes were not affected by treatments, but animals on hard floors had higher intake speed and shorter meal durations. Figure 5 shows that diurnal variation in feed intake corresponds with patterns for number of standing bouts. Animals without overnight access to the freestalls spent part of the additional nightly standing time feeding. The animals spent around 3 h/d on PMR intake. Productive performance and BW change were not affected significantly by treatments.Heifers were chosen as experimental animals because they presumably are relatively susceptible to hemorrhages and have minimal history regarding claw disorders. Information on the claw health of heifers before first calving is scarce, but Frankena et al. (1992)suggested that they may already have lower claw health at the time of first calving. The scores for claw disorders in the first week after calving indicated that apart from some small hemorrhages, the animals had good claw health after calving. We assume that keeping them in a straw pen the last 5 wk before calving was beneficial for their claws. Because of the low claw disorder prevalence when the animals entered the experiment, the 3 periods were analyzed separately. Additional analyses showed that analyzing the incidence of SH posttreatment (i.e., taking only claws into account that did not show SH during the first observation) gave almost identical results.Both restricted freestall access and hard concrete floors were expected to increase mechanical load and thus would be risk factors for SH occurrence. The lower prevalence of SH on rubber floors found in this study indicated beneficial effects of compliant flooring on claw health, even though the effects of rubber flooring were probably underestimated. A substantial portion of activity took place around milking, when all animals walked on the same concrete slatted floor, whereas peak loads during walking are higher than those during standing. Moreover, this exposure to concrete flooring could have diminished beneficial effects of soft flooring on the maintenance of sole concavity that were reported by Telezhenko (2007). In contrast to results reported by Kremer et al. (2007) and Ouweltjes et al. (2009), more standing or higher activity was not found on the rubber floor. This may be due in part to differences in conditions. The pens where the animals were kept were rather compact; the animals only

Chapter 3
66
had to cross the alley to go from the freestalls to the feeders. Despite this, the cows in Ouweltjes et al. (2009) had lower percentages of standing (50 to 55%) and fewer strides per hour (53 to 61) than the heifers in this study, particularly during the treatment period. In the current study, heifers were milked twice daily in a conventional parlor and were monitored in the first 3 mo after calving, whereas in the earlier studies older cows were milked with automated milking systems and were monitored not solely in early lactation.During the experimental period, the prevalence and severity of SH clearly increased, particularly in zones 3, 4, and 6. This largely supports the patterns for pressure distribution reported by Van der Tol et al. (2002). The increase in SH occurrence after calving supports the results of Leach et al. (1997) and Webster (2002), who reported peak prevalence of hemorrhages within 3 mo after calving. In contrast, Sogstad et al. (2005a) observed a peak in hemorrhage occurrence around 5 to 7 mo after calving. Therefore, our observations could have missed the effects of the treatments on claw health that would become visible beyond 3 mo after calving. No remaining effects of the treatments were found during the posttreatment period for behavioral variables, milk yield, BW, and feed consumption. Furthermore, peaks of standing time and activity occurred around calving and time budgets for lying and standing, and activity levels were stable at the end of the posttreatment period. Therefore, it is unlikely that continued recording would have shown additional effects of the treatments.Because Kremer et al. (2007) and Ouweltjes et al. (2009) reported more standing and higher activity for cows kept in stalls with rubber alley floors instead of concrete floors, it was suggested that flooring might affect feed intake. Despite the absence of effects of flooring on the percentage of time spent standing and activity, the animals on the rubber alley floor in our study indeed spent more time feeding, but at a lower rate. This did not result in an increased feed intake. Restricted freestall access affected diurnal feed intake patterns, but did not affect overall feed intake. Similarly, effects of the treatments on locomotion, BW change, and milk yield were not significant. For restricted freestall access, this corresponded with the absence of detectable effects on claw health and feed intake. Apparently, the lower numberof hemorrhages of the animals on the rubber floor did not significantly affect their locomotion or performance. In contrast, Telezhenko (2007) reported improved locomotion for cows on rubber flooring, but we scored locomotion when the animals walked on a concrete slatted floor and not on the alley floors in their treatment environment. Moreover, contrasts between concrete and rubber flooring groups in our study might have been reduced because the alleys between the treatment compartments and the parlor, which the animals crossed twice daily, had concrete slatted floors.
5 CONCLUSIONSThe heifers showed increased activity and increased standing around parturition. The results confirm the hypothesis that hard concrete flooring causes claw hemorrhages induced by high mechanical load. The hypothesis that restricted freestall access reinforces effects of hard flooring on claws through prolonged standing bouts is rejected for the circumstances of the study. The applied restrictions on freestall access may not be representative for lying
Housing condition and bovine claw health
67
restrictions under practical circumstances. Heifers kept on hard flooring spend less time feeding than heifers kept on soft rubber flooring, but other behavioral differences that could be related to flooring were not detected. Neither flooring nor restricted freestall access affected feed intake level, milk yield, or BW changes.
6 ACKNOWLEDGMENTSThe support of the Waiboerhoeve research farm staff (especially M. de Bree, H. Bakker, and A. Mooiweer; Wageningen UR Livestock Research, Lelystad, the Netherlands) isappreciated, and we are indebted to M. Janssen and L. Nootenboom (Hogeschool InHolland, Delft, the Netherlands) for their assistance with data collection. R. Zom (Wageningen UR Livestock Research, Lelystad, the Netherlands) took care of ration formulation. The work was funded by the Dutch Ministry of Agriculture, Nature and Food Quality (LNV), research program Animal Welfare (KB-08-001-006).

3
Chapter 3
66
had to cross the alley to go from the freestalls to the feeders. Despite this, the cows in Ouweltjes et al. (2009) had lower percentages of standing (50 to 55%) and fewer strides per hour (53 to 61) than the heifers in this study, particularly during the treatment period. In the current study, heifers were milked twice daily in a conventional parlor and were monitored in the first 3 mo after calving, whereas in the earlier studies older cows were milked with automated milking systems and were monitored not solely in early lactation.During the experimental period, the prevalence and severity of SH clearly increased, particularly in zones 3, 4, and 6. This largely supports the patterns for pressure distribution reported by Van der Tol et al. (2002). The increase in SH occurrence after calving supports the results of Leach et al. (1997) and Webster (2002), who reported peak prevalence of hemorrhages within 3 mo after calving. In contrast, Sogstad et al. (2005a) observed a peak in hemorrhage occurrence around 5 to 7 mo after calving. Therefore, our observations could have missed the effects of the treatments on claw health that would become visible beyond 3 mo after calving. No remaining effects of the treatments were found during the posttreatment period for behavioral variables, milk yield, BW, and feed consumption. Furthermore, peaks of standing time and activity occurred around calving and time budgets for lying and standing, and activity levels were stable at the end of the posttreatment period. Therefore, it is unlikely that continued recording would have shown additional effects of the treatments.Because Kremer et al. (2007) and Ouweltjes et al. (2009) reported more standing and higher activity for cows kept in stalls with rubber alley floors instead of concrete floors, it was suggested that flooring might affect feed intake. Despite the absence of effects of flooring on the percentage of time spent standing and activity, the animals on the rubber alley floor in our study indeed spent more time feeding, but at a lower rate. This did not result in an increased feed intake. Restricted freestall access affected diurnal feed intake patterns, but did not affect overall feed intake. Similarly, effects of the treatments on locomotion, BW change, and milk yield were not significant. For restricted freestall access, this corresponded with the absence of detectable effects on claw health and feed intake. Apparently, the lower numberof hemorrhages of the animals on the rubber floor did not significantly affect their locomotion or performance. In contrast, Telezhenko (2007) reported improved locomotion for cows on rubber flooring, but we scored locomotion when the animals walked on a concrete slatted floor and not on the alley floors in their treatment environment. Moreover, contrasts between concrete and rubber flooring groups in our study might have been reduced because the alleys between the treatment compartments and the parlor, which the animals crossed twice daily, had concrete slatted floors.
5 CONCLUSIONSThe heifers showed increased activity and increased standing around parturition. The results confirm the hypothesis that hard concrete flooring causes claw hemorrhages induced by high mechanical load. The hypothesis that restricted freestall access reinforces effects of hard flooring on claws through prolonged standing bouts is rejected for the circumstances of the study. The applied restrictions on freestall access may not be representative for lying
Housing condition and bovine claw health
67
restrictions under practical circumstances. Heifers kept on hard flooring spend less time feeding than heifers kept on soft rubber flooring, but other behavioral differences that could be related to flooring were not detected. Neither flooring nor restricted freestall access affected feed intake level, milk yield, or BW changes.
6 ACKNOWLEDGMENTSThe support of the Waiboerhoeve research farm staff (especially M. de Bree, H. Bakker, and A. Mooiweer; Wageningen UR Livestock Research, Lelystad, the Netherlands) isappreciated, and we are indebted to M. Janssen and L. Nootenboom (Hogeschool InHolland, Delft, the Netherlands) for their assistance with data collection. R. Zom (Wageningen UR Livestock Research, Lelystad, the Netherlands) took care of ration formulation. The work was funded by the Dutch Ministry of Agriculture, Nature and Food Quality (LNV), research program Animal Welfare (KB-08-001-006).
Chapter 3
68
REFERENCESCook, N.B., Nordlund, K.V., 2009. The influence of the environment on dairy cow behavior,
claw health and herd lameness dynamics. The Veterinary Journal 179, 360-369.Cooper, M.D., Arney, D.R., Phillips, C.J.C., 2007. Two- or four-hour lying deprivation on
the behavior of lactating dairy cows. Journal of Dairy Science 90, 1149-1158.Donovan, G.A., Risco, C.A., DeChant Temple, G.M., Tran, T.Q., van Horn, H.H., 2004.
Influence of transition diets on occurrence of subclinical laminitis in holstein dairy cows. Journal of Dairy Science 87, 73-84.
Flower, F.C., de Passillé, A.M., Weary, D.M., Sanderson, D.J., Rushen, J., 2007. Softer, higher-friction flooring improves gait of cows with and without sole ulcers. Journal of Dairy Science 90, 1235-1242.
Frankena, K., Keulen, K.A.S.v., Noordhuizen, J.P., Noordhuizen-Stassen, E.N., Gundelach, J., Jong, D.J.d., Saedt, I., 1992. A cross-sectional study into prevalence and risk indicators of digital haemorrhages in female dairy calves. Preventive Veterinary Medicine 14, 1-12.
Galindo, F., Broom, D.M., Jackson, P.G.G., 2000. A note on possible link between behaviour and the occurrence of lameness in dairy cows. Applied Animal Behaviour Science 67, 335-341.
Holzhauer, M., 2006. Claw health in dairy cows in the Netherlands. Epidemiological aspects of different claw disorders in dairy cattle in the Netherlands. PhD thesis, Veterinary Faculty Utrecht University, Utrecht, the Netherlands.
Kremer, P., Nueske, S., Scholz, A., Foerster, M., 2007. Comparison of claw health and milk yield in dairy cows on elastic or concrete flooring. Journal of Dairy Science 90, 4603-4611.
Le Fevre, A.M., Logue, D.N., Offer, J.E., McKendrick, I., Gettinby, G., 2001. Correlations of measurements of subclinical claw horn lesions in dairy cattle. Veterinary Record 148, 135-138.
Leach, K.A., Logue, D.N., Kempson, S.A., Offer, J.E., Ternent, H.E., Randalls, J.M., 1997. Claw lesions in dairy cattle: Development of sole and white line haemorrhages during the first lactation. The Veterinary Journal 154, 215-225.
Leonard, F.C., Oconnell, J.M., Ofarrell, K.J., 1996. Effect of overcrowding on claw health in first-calved Friesian heifers. Brithsh Veterinary Journal 152, 459-472.
Logue, D.N., Offer, J.E., McGovern, R.D., 2004. The bovine digital cushion – how crucial is it to contusions on the bearing surface of the claw of the cow? The Veterinary Journal 167, 220-221.
Manson, F.J., Leaver, J.D., 1988. The influence of concentrate amount on locomotion and clinical lameness in dairy cattle. Anim Prod 47.
McNeill Alexander, R., 2003. Principles of animal locomotion. Princeton University Press, Princeton, NJ.
Ouweltjes, W., Holzhauer, M., Van der Tol, P., Van der Werf, J., 2009. Effects of two trimming methods of dairy cattle on concrete or rubber-covered slatted floors. Journal of Dairy Science 92, 960-971.
Housing condition and bovine claw health
69
Rushen, J., De Passillé, A., 2006. Effects of roughness and compressibility of flooring on cow locomotion. Journal of Dairy Science 89, 2965-2972.
Sogstad, Å., Fjeldaas, T., Østerås, O., 2005a. Lameness and claw lesions of the Norwegian Red dairy cattle housed in free stalls in relation to environment, parity and stage of lactation. Acta Veterinaria Scandinavica 46, 203-217.
Sogstad, Å.M., Fjeldaas, T., Østerås, O., Forshell, K.P., 2005b. Prevalence of claw lesions in Norwegian dairy cattle housed in tie stalls and free stalls. Preventive Veterinary Medicine 70, 191-209.
Somers, J.G.C.J., 2004. Claw disorders and disturbed locomotion in dairy cows : the effect of floor systems and implications for animal welfare. PhD thesis, Veterinary Faculty Utrecht University, Utrecht, the Netherlands.
Tarlton, J.F., Holah, D.E., Evans, K.M., Jones, S., Pearson, G.R., Webster, A.J.F., 2002. Biomechanical and histopathological changes in the support structures of bovine hooves around the time of first calving. The Veterinary Journal 163, 196-204.
Telezhenko, E., 2007. Effect of flooring system on locomotion comfort in dairy cows: Aspects of gait, preference and claw condition. PhD thesis. Swedish University of Agricultural Sciences (SLU), Skara, Sweden.
Tucker, C.B., Weary, D.M., de Passillé, A.M., Campbell, B., Rushen, J., 2006. Flooring in front of the feed bunk affects feeding behavior and use of freestalls by dairy cows. Journal of Dairy Science 89, 2065-2071.
Van der Tol, P., Metz, J., Noordhuizen-Stassen, E., Back, W., Braam, C., Weijs, W., 2002. The pressure distribution under the bovine claw during square standing on a flat substrate. Journal of Dairy Science 85, 1476-1481.
Vanegas, J., Overton, M., Berry, S., Sischo, W., 2006. Effect of rubber flooring on claw health in lactating dairy cows housed in free-stall barns. Journal of dairy science 89, 4251-4258.
Webster, A.J., 2002. Effects of housing practices on the development of foot lesions in dairy heifers in early lactation. Veterinary Record 151, 9-12.

3
Chapter 3
68
REFERENCESCook, N.B., Nordlund, K.V., 2009. The influence of the environment on dairy cow behavior,
claw health and herd lameness dynamics. The Veterinary Journal 179, 360-369.Cooper, M.D., Arney, D.R., Phillips, C.J.C., 2007. Two- or four-hour lying deprivation on
the behavior of lactating dairy cows. Journal of Dairy Science 90, 1149-1158.Donovan, G.A., Risco, C.A., DeChant Temple, G.M., Tran, T.Q., van Horn, H.H., 2004.
Influence of transition diets on occurrence of subclinical laminitis in holstein dairy cows. Journal of Dairy Science 87, 73-84.
Flower, F.C., de Passillé, A.M., Weary, D.M., Sanderson, D.J., Rushen, J., 2007. Softer, higher-friction flooring improves gait of cows with and without sole ulcers. Journal of Dairy Science 90, 1235-1242.
Frankena, K., Keulen, K.A.S.v., Noordhuizen, J.P., Noordhuizen-Stassen, E.N., Gundelach, J., Jong, D.J.d., Saedt, I., 1992. A cross-sectional study into prevalence and risk indicators of digital haemorrhages in female dairy calves. Preventive Veterinary Medicine 14, 1-12.
Galindo, F., Broom, D.M., Jackson, P.G.G., 2000. A note on possible link between behaviour and the occurrence of lameness in dairy cows. Applied Animal Behaviour Science 67, 335-341.
Holzhauer, M., 2006. Claw health in dairy cows in the Netherlands. Epidemiological aspects of different claw disorders in dairy cattle in the Netherlands. PhD thesis, Veterinary Faculty Utrecht University, Utrecht, the Netherlands.
Kremer, P., Nueske, S., Scholz, A., Foerster, M., 2007. Comparison of claw health and milk yield in dairy cows on elastic or concrete flooring. Journal of Dairy Science 90, 4603-4611.
Le Fevre, A.M., Logue, D.N., Offer, J.E., McKendrick, I., Gettinby, G., 2001. Correlations of measurements of subclinical claw horn lesions in dairy cattle. Veterinary Record 148, 135-138.
Leach, K.A., Logue, D.N., Kempson, S.A., Offer, J.E., Ternent, H.E., Randalls, J.M., 1997. Claw lesions in dairy cattle: Development of sole and white line haemorrhages during the first lactation. The Veterinary Journal 154, 215-225.
Leonard, F.C., Oconnell, J.M., Ofarrell, K.J., 1996. Effect of overcrowding on claw health in first-calved Friesian heifers. Brithsh Veterinary Journal 152, 459-472.
Logue, D.N., Offer, J.E., McGovern, R.D., 2004. The bovine digital cushion – how crucial is it to contusions on the bearing surface of the claw of the cow? The Veterinary Journal 167, 220-221.
Manson, F.J., Leaver, J.D., 1988. The influence of concentrate amount on locomotion and clinical lameness in dairy cattle. Anim Prod 47.
McNeill Alexander, R., 2003. Principles of animal locomotion. Princeton University Press, Princeton, NJ.
Ouweltjes, W., Holzhauer, M., Van der Tol, P., Van der Werf, J., 2009. Effects of two trimming methods of dairy cattle on concrete or rubber-covered slatted floors. Journal of Dairy Science 92, 960-971.
Housing condition and bovine claw health
69
Rushen, J., De Passillé, A., 2006. Effects of roughness and compressibility of flooring on cow locomotion. Journal of Dairy Science 89, 2965-2972.
Sogstad, Å., Fjeldaas, T., Østerås, O., 2005a. Lameness and claw lesions of the Norwegian Red dairy cattle housed in free stalls in relation to environment, parity and stage of lactation. Acta Veterinaria Scandinavica 46, 203-217.
Sogstad, Å.M., Fjeldaas, T., Østerås, O., Forshell, K.P., 2005b. Prevalence of claw lesions in Norwegian dairy cattle housed in tie stalls and free stalls. Preventive Veterinary Medicine 70, 191-209.
Somers, J.G.C.J., 2004. Claw disorders and disturbed locomotion in dairy cows : the effect of floor systems and implications for animal welfare. PhD thesis, Veterinary Faculty Utrecht University, Utrecht, the Netherlands.
Tarlton, J.F., Holah, D.E., Evans, K.M., Jones, S., Pearson, G.R., Webster, A.J.F., 2002. Biomechanical and histopathological changes in the support structures of bovine hooves around the time of first calving. The Veterinary Journal 163, 196-204.
Telezhenko, E., 2007. Effect of flooring system on locomotion comfort in dairy cows: Aspects of gait, preference and claw condition. PhD thesis. Swedish University of Agricultural Sciences (SLU), Skara, Sweden.
Tucker, C.B., Weary, D.M., de Passillé, A.M., Campbell, B., Rushen, J., 2006. Flooring in front of the feed bunk affects feeding behavior and use of freestalls by dairy cows. Journal of Dairy Science 89, 2065-2071.
Van der Tol, P., Metz, J., Noordhuizen-Stassen, E., Back, W., Braam, C., Weijs, W., 2002. The pressure distribution under the bovine claw during square standing on a flat substrate. Journal of Dairy Science 85, 1476-1481.
Vanegas, J., Overton, M., Berry, S., Sischo, W., 2006. Effect of rubber flooring on claw health in lactating dairy cows housed in free-stall barns. Journal of dairy science 89, 4251-4258.
Webster, A.J., 2002. Effects of housing practices on the development of foot lesions in dairy heifers in early lactation. Veterinary Record 151, 9-12.

Chapter 3
70
APPENDIX: SUPPLEMENTARY INFORMATION
Figure 1. Model predictions (±SE) for each experimental group for average feeding time, feed intake, number of meals, and intake speed per hour period during the treatment phase (model term F × Lr × Lw in model [2]; F = flooring; Lr = restricted freestall access; Lw = lactation stage (d)). Magnitudes of SE are similar for all groups; to improve readability, SE is only presented for group on rubber floors with restricted access to the freestalls. C = concrete floor; R = rubber-topped floor; Ur = unrestricted access to the freestalls; Lr = restricted access to the freestalls.
Housing condition and bovine claw health
71
Table 1 Model predictions and SE for model terms in the analysis of Score_sh.week 1 week 9 week 14
model term class1 pedicted value se pedicted value se pedicted value seF R 0.05 0.02 0.13 0.03 0.20 0.03
C 0.04 0.02 0.21 0.03 0.27 0.03Lr Lr 0.04 0.02 0.17 0.03 0.24 0.03
Ur 0.04 0.02 0.17 0.03 0.23 0.03F*Lr R-Lr 0.05 0.02 0.11 0.04 0.17 0.04
R-Ur 0.05 0.02 0.14 0.04 0.24 0.04C-Lr 0.04 0.02 0.22 0.04 0.31 0.04C-Ur 0.04 0.02 0.21 0.04 0.23 0.04
Lg LH 0.07 0.02 0.25 0.03 0.34 0.03LF 0.01 0.02 0.08 0.03 0.13 0.03RH 0.07 0.02 0.30 0.03 0.39 0.03RF 0.02 0.02 0.05 0.03 0.09 0.03
C M 0.04 0.02 0.08 0.03 0.15 0.02L 0.05 0.02 0.26 0.03 0.32 0.02
Lg*C LH-M 0.05 0.02 0.03 0.03 0.10 0.03LH-L 0.09 0.02 0.47 0.03 0.57 0.03LF-M 0.02 0.02 0.11 0.03 0.21 0.03LF-L 0.00 0.02 0.05 0.03 0.05 0.03
RH-M 0.06 0.02 0.10 0.03 0.14 0.03RH-L 0.09 0.02 0.50 0.03 0.64 0.03RF-M 0.02 0.02 0.07 0.03 0.15 0.03RF-L 0.02 0.02 0.02 0.03 0.02 0.03
zone 1 0.02 0.02 0.09 0.03 0.06 0.032 0.05 0.02 0.11 0.03 0.08 0.033 0.08 0.02 0.20 0.03 0.36 0.034 0.05 0.02 0.21 0.03 0.36 0.035 0.04 0.02 0.10 0.03 0.10 0.036 0.03 0.02 0.31 0.03 0.46 0.03
1 R = rubber, C = Concrete, Lr = lying restriction, Ur = no lying restriction, LH = left hind, LF= left front, RH = right hind, RF = right front, M = medial, L = lateral. For zones see Figure 1 in the main manuscript.

3
Chapter 3
70
APPENDIX: SUPPLEMENTARY INFORMATION
Figure 1. Model predictions (±SE) for each experimental group for average feeding time, feed intake, number of meals, and intake speed per hour period during the treatment phase (model term F × Lr × Lw in model [2]; F = flooring; Lr = restricted freestall access; Lw = lactation stage (d)). Magnitudes of SE are similar for all groups; to improve readability, SE is only presented for group on rubber floors with restricted access to the freestalls. C = concrete floor; R = rubber-topped floor; Ur = unrestricted access to the freestalls; Lr = restricted access to the freestalls.
Housing condition and bovine claw health
71
Table 1 Model predictions and SE for model terms in the analysis of Score_sh.week 1 week 9 week 14
model term class1 pedicted value se pedicted value se pedicted value seF R 0.05 0.02 0.13 0.03 0.20 0.03
C 0.04 0.02 0.21 0.03 0.27 0.03Lr Lr 0.04 0.02 0.17 0.03 0.24 0.03
Ur 0.04 0.02 0.17 0.03 0.23 0.03F*Lr R-Lr 0.05 0.02 0.11 0.04 0.17 0.04
R-Ur 0.05 0.02 0.14 0.04 0.24 0.04C-Lr 0.04 0.02 0.22 0.04 0.31 0.04C-Ur 0.04 0.02 0.21 0.04 0.23 0.04
Lg LH 0.07 0.02 0.25 0.03 0.34 0.03LF 0.01 0.02 0.08 0.03 0.13 0.03RH 0.07 0.02 0.30 0.03 0.39 0.03RF 0.02 0.02 0.05 0.03 0.09 0.03
C M 0.04 0.02 0.08 0.03 0.15 0.02L 0.05 0.02 0.26 0.03 0.32 0.02
Lg*C LH-M 0.05 0.02 0.03 0.03 0.10 0.03LH-L 0.09 0.02 0.47 0.03 0.57 0.03LF-M 0.02 0.02 0.11 0.03 0.21 0.03LF-L 0.00 0.02 0.05 0.03 0.05 0.03
RH-M 0.06 0.02 0.10 0.03 0.14 0.03RH-L 0.09 0.02 0.50 0.03 0.64 0.03RF-M 0.02 0.02 0.07 0.03 0.15 0.03RF-L 0.02 0.02 0.02 0.03 0.02 0.03
zone 1 0.02 0.02 0.09 0.03 0.06 0.032 0.05 0.02 0.11 0.03 0.08 0.033 0.08 0.02 0.20 0.03 0.36 0.034 0.05 0.02 0.21 0.03 0.36 0.035 0.04 0.02 0.10 0.03 0.10 0.036 0.03 0.02 0.31 0.03 0.46 0.03
1 R = rubber, C = Concrete, Lr = lying restriction, Ur = no lying restriction, LH = left hind, LF= left front, RH = right hind, RF = right front, M = medial, L = lateral. For zones see Figure 1 in the main manuscript.

72
CHAPTER 4
A new technique using roentgen stereo photogrammetry to measure changes in the spatial conformation of bovine hind
claws in response to external loadsW. Ouweltjes a,b, S.W.S. Gussekloo b, C.W. Spoor b, J.L. van Leeuwen b
a Wageningen UR Livestock Research, P.O. Box 338, 6700 AH Wageningen, The Netherlands
b Wageningen UR Experimental Zoology group, P.O. Box 338, 6700 AH Wageningen,The Netherlands
Published in The Veterinary Journal (2016) 208:81-86

74
A new technique to measure spatial conformation
75
ABSTRACTClaw and locomotion problems are widespread in ungulates. Although it is presumed that mechanical overload is an important contributor to claw tissue damage and impaired locomotion, deformation and claw injury as a result of mechanical loading has been poorly quantified and, as a result, practical solutions to reduce such lesions have been established mostly through trial and error. In this study, an experimental technique was developed that allowed the measurement under controlled loading regimes of minute deformations in the lower limbs of dissected specimens from large ungulates. Roentgen stereophotogrammetric analysis (RSA) was applied to obtain 3D marker coordinates with an accuracy of up to 0.1 mm with optimal contrast and to determine changes in the spatial conformation. A force plate was used to record the applied forces in three dimensions.The results obtained for a test sample (cattle hind leg) under three loading conditions showed that small load-induced deformations and translations as well as small changes in centres of force application could be measured. Accuracy of the order of 0.2–0.3 mm was feasible under practical circumstances with suboptimal contrast. These quantifications of claw deformation during loading improve understanding of the spatial strain distribution as a result of external loading and the risks of tissue overload. The method promises to be useful in determining load–deformation relationships for a wide variety of specimens and circumstances.
Keywords: RSA; Limb deformation; Mechanical loading; Cattle.

4
74
A new technique to measure spatial conformation
75
ABSTRACTClaw and locomotion problems are widespread in ungulates. Although it is presumed that mechanical overload is an important contributor to claw tissue damage and impaired locomotion, deformation and claw injury as a result of mechanical loading has been poorly quantified and, as a result, practical solutions to reduce such lesions have been established mostly through trial and error. In this study, an experimental technique was developed that allowed the measurement under controlled loading regimes of minute deformations in the lower limbs of dissected specimens from large ungulates. Roentgen stereophotogrammetric analysis (RSA) was applied to obtain 3D marker coordinates with an accuracy of up to 0.1 mm with optimal contrast and to determine changes in the spatial conformation. A force plate was used to record the applied forces in three dimensions.The results obtained for a test sample (cattle hind leg) under three loading conditions showed that small load-induced deformations and translations as well as small changes in centres of force application could be measured. Accuracy of the order of 0.2–0.3 mm was feasible under practical circumstances with suboptimal contrast. These quantifications of claw deformation during loading improve understanding of the spatial strain distribution as a result of external loading and the risks of tissue overload. The method promises to be useful in determining load–deformation relationships for a wide variety of specimens and circumstances.
Keywords: RSA; Limb deformation; Mechanical loading; Cattle.

Chapter 4
76
1 INTRODUCTIONDuring standing and locomotion, the legs of large animals are subjected to high loads resulting in three dimensional (3D) deformations in the limbs including paws, hoofs or claws. Deformations give information about internal load distribution but those in the distal leg elements are hard to quantify as they are generally small and distributed over a range of tissues and elements. As a result, our knowledge base is low and accurate predictions of which tissues can become overloaded and under what circumstances are lacking. Up to now, practical improvements (for example, in housing for dairy cattle) aiming to reduce load induced claw lesions have been mostly established through trial and error.3D roentgen stereophotogrammetric analysis (RSA) (Selvik, 1989) is considered the gold standard for analysis of motions of rigid bodies (Tranberg, 2010) and joints (Kibsgård et al., 2012). The method is used in human medicine for precise measurements of displacements of prostheses such as stent grafts (Koning et al., 2006), knee implants (Wolterbeek et al., 2012),hip stems (Nelissen et al., 2002) and mandibular implants (Sarnäs et al., 2012). It is also used to determine the laxity of joints (Kärrholm et al., 2006), which helps to improve prosthesis design (Leardini, 2001), and in gait analysis to determine the accuracy of optical markers (Tranberg, 2010). Translations as low as 0.032 mm and rotations as small as 0.121° can be determined in kinematic studies (Kedgley et al., 2009), and even smaller deformations were determined in fracture studies (Madanat et al., 2005; Solomon et al., 2010). RSA has rarely been used in veterinary studies but, using optical markers, displacements and rotations in the distal leg of horses (Clayton et al., 1998; Meershoek et al., 2001) were significantly larger (30–40 degrees) than the accuracy that can be obtained with RSA.Here we present an RSA technique to accurately determine load induced deformations in claws of large animals. We combined the RSA method with a force platform to determine actual loading and the point of application of the ground reaction force vector, commonly known as the centre of pressure (COP). This enabled us to correlate deformation with the actual load applied on the leg. The COP depends on claw conformation and leg stature (Van der Tol et al., 2004), and therefore could change during load experiments. In order to develop and test the methodology we selected a dairy cattle limb in which claw tissue damage is widespread and mechanical overload is an important risk factor for dairy cows (Bicalho and Oikonomou, 2013).
2 MATERIALS AND METHODSIn RSA, 3D positions of elements (usually radiopaque markers) are determined from two separate radiograms. In each radiogram, a spatially distributed set of body-attached markers and markers from a calibration box must be visible. The calibration box (see below) has a bottom plate with so-called ‘fiducial markers’ and a top plate with control markers. The relative positions of these markers must be known precisely since the RSA software (Medis Specials, 2011) uses the projections of these markers in the radiograms to find the locations
A new technique to measure spatial conformation
77
of the roentgen foci and the body-attached markers. The experimental set-up (Fig. 1) consisted of several elements: (1) a frame for fixation and loading; (2) two roentgen systems and a cassette for obtaining the radiograms; (3) a calibration box for 3D reconstruction; (4) a force plate; and (5) the test specimen (in this case, a dissected hind limb).
Fig. 1. Schematic representation of test equipment from two orthogonal viewpoints: (a) and (b): (1) roentgen tubes; (2) pneumatic cylinder for loading; (3) test frame; (4) tested specimen; (5) casing with supporting plate; (6) calibration box; (7) roentgen cassette drawer; (8) force plate.
The frame (see ‘3’ in Fig. 1) consisted of a heavy foot (for stability) and a 187.5 cm high bridge on which a pneumatic cylinder (‘2’ in Fig. 1) was mounted and used to load the specimen. Air pressure in the cylinder could be regulated with a precision regulator combined with a manometer. The force output of the pneumatic cylinder was calibrated using two series of measurements with a metal rod placed vertically between the cylinder and the casing with supporting plate (‘5’ in Fig. 1).The first series used manometer settings between 1 and 7 bar with increments of 1 bar; the second series used settings between 2 and 6 bar and increments of 2 bar. A linear regression

4
Chapter 4
76
1 INTRODUCTIONDuring standing and locomotion, the legs of large animals are subjected to high loads resulting in three dimensional (3D) deformations in the limbs including paws, hoofs or claws. Deformations give information about internal load distribution but those in the distal leg elements are hard to quantify as they are generally small and distributed over a range of tissues and elements. As a result, our knowledge base is low and accurate predictions of which tissues can become overloaded and under what circumstances are lacking. Up to now, practical improvements (for example, in housing for dairy cattle) aiming to reduce load induced claw lesions have been mostly established through trial and error.3D roentgen stereophotogrammetric analysis (RSA) (Selvik, 1989) is considered the gold standard for analysis of motions of rigid bodies (Tranberg, 2010) and joints (Kibsgård et al., 2012). The method is used in human medicine for precise measurements of displacements of prostheses such as stent grafts (Koning et al., 2006), knee implants (Wolterbeek et al., 2012),hip stems (Nelissen et al., 2002) and mandibular implants (Sarnäs et al., 2012). It is also used to determine the laxity of joints (Kärrholm et al., 2006), which helps to improve prosthesis design (Leardini, 2001), and in gait analysis to determine the accuracy of optical markers (Tranberg, 2010). Translations as low as 0.032 mm and rotations as small as 0.121° can be determined in kinematic studies (Kedgley et al., 2009), and even smaller deformations were determined in fracture studies (Madanat et al., 2005; Solomon et al., 2010). RSA has rarely been used in veterinary studies but, using optical markers, displacements and rotations in the distal leg of horses (Clayton et al., 1998; Meershoek et al., 2001) were significantly larger (30–40 degrees) than the accuracy that can be obtained with RSA.Here we present an RSA technique to accurately determine load induced deformations in claws of large animals. We combined the RSA method with a force platform to determine actual loading and the point of application of the ground reaction force vector, commonly known as the centre of pressure (COP). This enabled us to correlate deformation with the actual load applied on the leg. The COP depends on claw conformation and leg stature (Van der Tol et al., 2004), and therefore could change during load experiments. In order to develop and test the methodology we selected a dairy cattle limb in which claw tissue damage is widespread and mechanical overload is an important risk factor for dairy cows (Bicalho and Oikonomou, 2013).
2 MATERIALS AND METHODSIn RSA, 3D positions of elements (usually radiopaque markers) are determined from two separate radiograms. In each radiogram, a spatially distributed set of body-attached markers and markers from a calibration box must be visible. The calibration box (see below) has a bottom plate with so-called ‘fiducial markers’ and a top plate with control markers. The relative positions of these markers must be known precisely since the RSA software (Medis Specials, 2011) uses the projections of these markers in the radiograms to find the locations
A new technique to measure spatial conformation
77
of the roentgen foci and the body-attached markers. The experimental set-up (Fig. 1) consisted of several elements: (1) a frame for fixation and loading; (2) two roentgen systems and a cassette for obtaining the radiograms; (3) a calibration box for 3D reconstruction; (4) a force plate; and (5) the test specimen (in this case, a dissected hind limb).
Fig. 1. Schematic representation of test equipment from two orthogonal viewpoints: (a) and (b): (1) roentgen tubes; (2) pneumatic cylinder for loading; (3) test frame; (4) tested specimen; (5) casing with supporting plate; (6) calibration box; (7) roentgen cassette drawer; (8) force plate.
The frame (see ‘3’ in Fig. 1) consisted of a heavy foot (for stability) and a 187.5 cm high bridge on which a pneumatic cylinder (‘2’ in Fig. 1) was mounted and used to load the specimen. Air pressure in the cylinder could be regulated with a precision regulator combined with a manometer. The force output of the pneumatic cylinder was calibrated using two series of measurements with a metal rod placed vertically between the cylinder and the casing with supporting plate (‘5’ in Fig. 1).The first series used manometer settings between 1 and 7 bar with increments of 1 bar; the second series used settings between 2 and 6 bar and increments of 2 bar. A linear regression

Chapter 4
78
line (Fz = 498x − 18, where x = manometer setting in bar and Fz = measured vertical force in N) fitted well (R2 = 1) (for underlying data see Appendix: Supplementary material).Test objects were placed on a 10 mm thick carbon fibre plate (KVE Composites Group, The Hague, The Netherlands) that protects the calibration box (‘6’ in Fig. 1) and roentgen cassette drawer (‘7’ in Fig. 1). A deflection of 2.4 mm was predicted for this plate under a centred load of 3000 N from a bending test of an unmounted test sample of the same material using basic bending equations. In the final setup, the plate was clamped and firmly mounted in thecasing, leaving sufficient space such that even after deflection it would not touch the calibration box. We assumed that clamping would significantly reduce the deflection.
2.1 Force plateThe casing was attached to a force plate (‘8’ in Fig. 1) with an eight-channel charge amplifier (Kistler 9253B and 9865E respectively), which recorded the load of the claws in 3D with a frequency of 10 Hz. These recordings were used to monitor the actual load applied and to calculate the location of the COP relative to the origin of the force plate.
2.2 Roentgen systemsThe two roentgen tubes (‘1’ in Fig. 1; Philips Maximus CM100 and Philips Practix 400) were positioned approximately 1.5 m above the cassette, both at an angle of 30° to the vertical and independent of the loading frame. Both tubes were energised by manually pressing the exposure buttons simultaneously.Images were captured on photostimulable phosphor plates (Agfa CR MD4.0 General 35 × 43 cm) and digitised (Agfa CR 35-X or Agfa CR 85-X digitizers). During exposure, a cassette was located in the drawer below the calibration box.
2.3 Calibration boxThe 570 × 396 × 92 mm calibration box was constructed with top and bottom layers of 21 mm sandwich plates with foamed poly(methyl methacrylate) (PMMA) in between 1 mm carbon fibre facings and sides of 6 mm sandwich plates with foamed PMMA in between 0.5 mm carbon fibre facings (KVE Composites) resulting in a stable and radiolucent object with parallel top and bottom layers. In these layers, 1 mm tantalum markers were inserted in pre-defined spots with a CNC machine and glued with cyanoacrylate (top layer 40 control markers, bottom layer 44 fiducial markers), such that their projections surrounded those of the markers in the tested specimen. The calibration box was mounted in the casing beneath the load bearing carbon fibre plate. Calibration of the box is described in the Appendix: Supplementary material, and showed that an accuracy of about 0.1 mm was achievable for markers throughout the detection area.
A new technique to measure spatial conformation
79
2.4 Preparation of test specimenThe system was tested by loading a bovine hind limb. The limb was obtained from a fresh cadaver brought to the Department of Pathobiology, Faculty of Veterinary Medicine, University of Utrecht, for post-mortem analysis. The animal was euthanased for clinical reasons, but did not show claw or leg disorders or infectious disease. The cow’s bodyweight (550 kg) was obtained from the autopsy report. After dissection, the leg was stored in a freezer (−18 °C) until thawed at room temperature for two days prior to preparation and testing. For description of anatomical structures we followed the terminology of the Nomina Anatomica Veterinaria (Schaller, 1992).Muscles around the femur were removed, but the tendon of the quadriceps muscle, the gastrocnemius, and the deep and superficial flexor muscles were kept intact. This ensured that, after fixation of the patella, the limb could be loaded without buckling in any of the joints. The patella was pulled over the medial ridge of the femoral trochlea and fixed to the femur with two screws to simulate a natural standing position.On each hoof capsule a total of 18 × 1.5 mm tungsten markers (Tungsten Heavy Powder) were glued with cyanoacrylate in a predefined pattern (Fig. 2). For marker placement in the phalanges (Fig. 3), proximal and middle phalanges were located by palpation. Four small holes were drilled from the dorsolateral/dorsomedial direction in the lateral and medial phalanges respectively through small skin incisions. In each hole a 2.0 mm tungsten marker (Tungsten Heavy Powder) was placed and secured with cyanoacrylate. In the distal phalanges four 1.0 mm tantalum markers (Wennbergs Finmekaniska) were inserted through holes drilled in the hoof capsules. Larger markers were used for the proximal and middle phalanges because absorption of radiation by bone tissue reduced contrast between background and markers.
Fig. 2. Marker placement on the hoof capsule: (a) lateral view of medial abaxial wall, (b) sole view and (c) lateral view of medial axial wall. Lateral abaxial wall and axial wall are not shown, but are similar to the medial claw. Anatomical features of pictures (a) and (b) redrawn from examples on internet (see: http://rubber-cow-mat.com/hp2921/soft-walking-areas.htm and http://www.slideshare.net/fullscreen/drawadrizk2012/claw-affection-presented-by-dr-awad-rizk/10, respectively).

4
Chapter 4
78
line (Fz = 498x − 18, where x = manometer setting in bar and Fz = measured vertical force in N) fitted well (R2 = 1) (for underlying data see Appendix: Supplementary material).Test objects were placed on a 10 mm thick carbon fibre plate (KVE Composites Group, The Hague, The Netherlands) that protects the calibration box (‘6’ in Fig. 1) and roentgen cassette drawer (‘7’ in Fig. 1). A deflection of 2.4 mm was predicted for this plate under a centred load of 3000 N from a bending test of an unmounted test sample of the same material using basic bending equations. In the final setup, the plate was clamped and firmly mounted in thecasing, leaving sufficient space such that even after deflection it would not touch the calibration box. We assumed that clamping would significantly reduce the deflection.
2.1 Force plateThe casing was attached to a force plate (‘8’ in Fig. 1) with an eight-channel charge amplifier (Kistler 9253B and 9865E respectively), which recorded the load of the claws in 3D with a frequency of 10 Hz. These recordings were used to monitor the actual load applied and to calculate the location of the COP relative to the origin of the force plate.
2.2 Roentgen systemsThe two roentgen tubes (‘1’ in Fig. 1; Philips Maximus CM100 and Philips Practix 400) were positioned approximately 1.5 m above the cassette, both at an angle of 30° to the vertical and independent of the loading frame. Both tubes were energised by manually pressing the exposure buttons simultaneously.Images were captured on photostimulable phosphor plates (Agfa CR MD4.0 General 35 × 43 cm) and digitised (Agfa CR 35-X or Agfa CR 85-X digitizers). During exposure, a cassette was located in the drawer below the calibration box.
2.3 Calibration boxThe 570 × 396 × 92 mm calibration box was constructed with top and bottom layers of 21 mm sandwich plates with foamed poly(methyl methacrylate) (PMMA) in between 1 mm carbon fibre facings and sides of 6 mm sandwich plates with foamed PMMA in between 0.5 mm carbon fibre facings (KVE Composites) resulting in a stable and radiolucent object with parallel top and bottom layers. In these layers, 1 mm tantalum markers were inserted in pre-defined spots with a CNC machine and glued with cyanoacrylate (top layer 40 control markers, bottom layer 44 fiducial markers), such that their projections surrounded those of the markers in the tested specimen. The calibration box was mounted in the casing beneath the load bearing carbon fibre plate. Calibration of the box is described in the Appendix: Supplementary material, and showed that an accuracy of about 0.1 mm was achievable for markers throughout the detection area.
A new technique to measure spatial conformation
79
2.4 Preparation of test specimenThe system was tested by loading a bovine hind limb. The limb was obtained from a fresh cadaver brought to the Department of Pathobiology, Faculty of Veterinary Medicine, University of Utrecht, for post-mortem analysis. The animal was euthanased for clinical reasons, but did not show claw or leg disorders or infectious disease. The cow’s bodyweight (550 kg) was obtained from the autopsy report. After dissection, the leg was stored in a freezer (−18 °C) until thawed at room temperature for two days prior to preparation and testing. For description of anatomical structures we followed the terminology of the Nomina Anatomica Veterinaria (Schaller, 1992).Muscles around the femur were removed, but the tendon of the quadriceps muscle, the gastrocnemius, and the deep and superficial flexor muscles were kept intact. This ensured that, after fixation of the patella, the limb could be loaded without buckling in any of the joints. The patella was pulled over the medial ridge of the femoral trochlea and fixed to the femur with two screws to simulate a natural standing position.On each hoof capsule a total of 18 × 1.5 mm tungsten markers (Tungsten Heavy Powder) were glued with cyanoacrylate in a predefined pattern (Fig. 2). For marker placement in the phalanges (Fig. 3), proximal and middle phalanges were located by palpation. Four small holes were drilled from the dorsolateral/dorsomedial direction in the lateral and medial phalanges respectively through small skin incisions. In each hole a 2.0 mm tungsten marker (Tungsten Heavy Powder) was placed and secured with cyanoacrylate. In the distal phalanges four 1.0 mm tantalum markers (Wennbergs Finmekaniska) were inserted through holes drilled in the hoof capsules. Larger markers were used for the proximal and middle phalanges because absorption of radiation by bone tissue reduced contrast between background and markers.
Fig. 2. Marker placement on the hoof capsule: (a) lateral view of medial abaxial wall, (b) sole view and (c) lateral view of medial axial wall. Lateral abaxial wall and axial wall are not shown, but are similar to the medial claw. Anatomical features of pictures (a) and (b) redrawn from examples on internet (see: http://rubber-cow-mat.com/hp2921/soft-walking-areas.htm and http://www.slideshare.net/fullscreen/drawadrizk2012/claw-affection-presented-by-dr-awad-rizk/10, respectively).

Chapter 4
80
Fig. 3. Marker placement in the phalanges (in lateral view only one toe is shown) and joint angles considered in calculating bone motions. Anatomical features redrawn from examples on internet (see: http://threeriversvetgroup.co.uk/veterinary-services/farm-animals/info-for-farmers/lameness-in-dairy-cows/).
2.5 Analysis of imagesApproximate marker positions were obtained from computerised tomography (CT) scans (slice thickness 1 mm, images 512 × 512 pixels, pixel size 0.4824 mm2) with custom-made MATLAB routines3. For each phalanx, axial and abaxial horn wall, and sole area models were made that described the relative positions of the markers in these components. These models were used to facilitate labelling of markers detected in the roentgen images with Model-Based RSA software (Medis Specials, 2011), referred to as MBRSA.
2.6 Calculation of deformationTo test the applicability of the method, we collected data for three load conditions of the test specimen: (1) loaded by its own weight only for 1 min; (2) loaded with 35% of the animals’ bodyweight for 1 min; and (3) loaded with 35% of the animals bodyweight for 10 min. Load in condition (2) was well above the normal value for standing, but lower than maximum loading experienced during locomotion (Van der Tol et al., 2003; Walker et al., 2010). To obtain some insight in ongoing deformation after applying the 35% bodyweight load, we also compared the geometries after 1 and 10 min loading.In the deformation analyses all components (bones, claw walls, sole) were considered rigid bodies, although it is unlikely that the hoof capsules actually behave as such. A rotation matrix and displacement vector were calculated according to Söderkvist and Wedin (1993),from which the position of the screw axis, the angle of rotation about this axis and the translation along this axis were calculated according to Spoor and Veldpaus (1980). The position of the distal phalanx in the lateral toe in condition (1) was arbitrarily used as reference for the description of deformation of condition (2). The relative position of thelateral middle phalanx was calculated, and then the position of the proximal phalanx relative
3 See: http://uk.mathworks.com/products/matlab/ (accessed 5 July 2015).
A new technique to measure spatial conformation
81
to the middle phalanx. The positions of the lateral abaxial claw wall, sole and axial wall were calculated relative to the reference. Next, the position of the distal phalanx of the medial toe relative to the reference was calculated, followed by the same calculations as described for the lateral toe with the medial distal phalanx as basis, but with the distal phalanx in the medial toe in condition (1) as a new reference. Then condition (2) was compared with condition (3) in a similar way.
3 RESULTSThe first step in our analyses was the determination of the rigid model descriptions based on the CT scans. All 60 markers in the specimen were detected in the scan and applied to the correct rigid body. The next step was the analysis of the roentgen images to determine 3D marker positions. Nearly all (85–100%) of the fiducial and control markers could be detected (see Table 1), and the root mean squares of the errors of their positions (Table 1) were in accordance with the values mentioned in the MBRSA user manual.
Table 1. Root mean square errors of detected fiducial and control marker positions (in mm) for different load conditionsa.
Load conditionLeft
fiducial (22)a
Leftcontrol (21)a
Rightfiducial (22)a
Rightcontrol (19)a
1: Loaded with own weight 0.0307 (22)b 0.370 (20) 0.0283 (21) 0.346 (17)
2: 35% BW load, 1 min 0.0327 (22) 0.330 (18) 0.0237 (21) 0.393 (17)
3: 35% BW load, 10 min 0.0351 (22) 0.454 (18) 0.0273 (21) 0.439 (17)a Total number of markers in calibration box.b Number of projected markers detected in the roentgen images added between brackets.
The automatic marker detection algorithm did not detect all marker projections because of the low contrast of markers so these were checked manually and adjusted when necessary. In this way all 60 specimen marker projections were detected in both the left and the right images for each loading condition. The MBRSA program calculated 117, 86 and 88 possible 3D coordinates for markers under respective loading conditions (Table 2). The correct combinations were selected by comparing the coordinates with those determined from the CT scan. Average crossing line distances of these markers were <0.05 mm (Table 2).The distances between all pairs of markers in the same bone in successive images were compared to check whether the bone behaved like a rigid body. On average, differences in distance were small (0.04 mm), and overall configuration of markers within bones did not change except for one marker in the middle phalanx in the medial toe (Appendix: Supplementary material). This marker was ignored for further processing because it apparently was not inserted into the bone.

4
Chapter 4
80
Fig. 3. Marker placement in the phalanges (in lateral view only one toe is shown) and joint angles considered in calculating bone motions. Anatomical features redrawn from examples on internet (see: http://threeriversvetgroup.co.uk/veterinary-services/farm-animals/info-for-farmers/lameness-in-dairy-cows/).
2.5 Analysis of imagesApproximate marker positions were obtained from computerised tomography (CT) scans (slice thickness 1 mm, images 512 × 512 pixels, pixel size 0.4824 mm2) with custom-made MATLAB routines3. For each phalanx, axial and abaxial horn wall, and sole area models were made that described the relative positions of the markers in these components. These models were used to facilitate labelling of markers detected in the roentgen images with Model-Based RSA software (Medis Specials, 2011), referred to as MBRSA.
2.6 Calculation of deformationTo test the applicability of the method, we collected data for three load conditions of the test specimen: (1) loaded by its own weight only for 1 min; (2) loaded with 35% of the animals’ bodyweight for 1 min; and (3) loaded with 35% of the animals bodyweight for 10 min. Load in condition (2) was well above the normal value for standing, but lower than maximum loading experienced during locomotion (Van der Tol et al., 2003; Walker et al., 2010). To obtain some insight in ongoing deformation after applying the 35% bodyweight load, we also compared the geometries after 1 and 10 min loading.In the deformation analyses all components (bones, claw walls, sole) were considered rigid bodies, although it is unlikely that the hoof capsules actually behave as such. A rotation matrix and displacement vector were calculated according to Söderkvist and Wedin (1993),from which the position of the screw axis, the angle of rotation about this axis and the translation along this axis were calculated according to Spoor and Veldpaus (1980). The position of the distal phalanx in the lateral toe in condition (1) was arbitrarily used as reference for the description of deformation of condition (2). The relative position of thelateral middle phalanx was calculated, and then the position of the proximal phalanx relative
3 See: http://uk.mathworks.com/products/matlab/ (accessed 5 July 2015).
A new technique to measure spatial conformation
81
to the middle phalanx. The positions of the lateral abaxial claw wall, sole and axial wall were calculated relative to the reference. Next, the position of the distal phalanx of the medial toe relative to the reference was calculated, followed by the same calculations as described for the lateral toe with the medial distal phalanx as basis, but with the distal phalanx in the medial toe in condition (1) as a new reference. Then condition (2) was compared with condition (3) in a similar way.
3 RESULTSThe first step in our analyses was the determination of the rigid model descriptions based on the CT scans. All 60 markers in the specimen were detected in the scan and applied to the correct rigid body. The next step was the analysis of the roentgen images to determine 3D marker positions. Nearly all (85–100%) of the fiducial and control markers could be detected (see Table 1), and the root mean squares of the errors of their positions (Table 1) were in accordance with the values mentioned in the MBRSA user manual.
Table 1. Root mean square errors of detected fiducial and control marker positions (in mm) for different load conditionsa.
Load conditionLeft
fiducial (22)a
Leftcontrol (21)a
Rightfiducial (22)a
Rightcontrol (19)a
1: Loaded with own weight 0.0307 (22)b 0.370 (20) 0.0283 (21) 0.346 (17)
2: 35% BW load, 1 min 0.0327 (22) 0.330 (18) 0.0237 (21) 0.393 (17)
3: 35% BW load, 10 min 0.0351 (22) 0.454 (18) 0.0273 (21) 0.439 (17)a Total number of markers in calibration box.b Number of projected markers detected in the roentgen images added between brackets.
The automatic marker detection algorithm did not detect all marker projections because of the low contrast of markers so these were checked manually and adjusted when necessary. In this way all 60 specimen marker projections were detected in both the left and the right images for each loading condition. The MBRSA program calculated 117, 86 and 88 possible 3D coordinates for markers under respective loading conditions (Table 2). The correct combinations were selected by comparing the coordinates with those determined from the CT scan. Average crossing line distances of these markers were <0.05 mm (Table 2).The distances between all pairs of markers in the same bone in successive images were compared to check whether the bone behaved like a rigid body. On average, differences in distance were small (0.04 mm), and overall configuration of markers within bones did not change except for one marker in the middle phalanx in the medial toe (Appendix: Supplementary material). This marker was ignored for further processing because it apparently was not inserted into the bone.

Chapter 4
82
Table 2. Crossing line distances (mm) of reconstructed specimen markers for different load conditions.
Load condition Numbera Min Average Max
1: Loaded with own weight 117 0.000 0.049 0.485
2: 35% BW load, 1 min 86 0.000 0.034 0.324
3: 35% BW load, 10 min 88 0.002 0.040 0.168a Total number of 3D reconstructions from which the 60 specimen markers were selected.
Rotations of the distal phalanges and changes of joint angles for the coffin joints (α in Fig. 3) and the pastern joints (β in Fig. 3) are presented in Table 3. These rotations imply that both joints were overextended. The data show that deformation continued under static loading at 35% of bodyweight. The displacements of phalanges in a downward direction (calculated from average z-coordinates of the markers, Table 4) confirmed that all phalanges rotated to some extent; otherwise, the standard deviations would have been (close to) zero. Distances between the medial and lateral phalanges of the two toes (calculated from the average x-coordinates of the markers) decreased by 0.4, 1.4 and 0.9 mm for the distal, middle and proximal phalanx, respectively, for condition (2) compared with condition (1). This suggests the toes did not spread during loading. Maintaining the load for 10 min resulted in a further decrease of the distances between medial and lateral phalanges with 0.3, 0.3 and 0.2 mm, respectively.
Table 3. Calculated angles of increased overextension of coffin and pastern joints and rotation of the distal phalanx (in degrees) under different load conditions.
Loadconditions compareda
Increased overextension Rotation of distal phalanxCoffin joint Pastern joint
Lateral Medial Lateral Medial Lateral Medial
1 vs. 2 11.5 7.9 3.1 4.4 1.9 4.9
2 vs. 3 1.5 0.9 1.1 0.5 0.3 1.2a 1 = Loaded with own weight; 2 = 35% BW load for 1 min; 3 = 35% BW load for 10 min.
As a control, distances between markers within the same element (bone or horn section) and their root mean squared differences were calculated for all loading conditions. For elements that are indeed rigid bodies and have all markers rigidly attached, the distances between markers would be equal under all loading conditions. In general, only small differences werefound, confirming that the elements could be considered rigid bodies (Table 5). The relatively large value of d1 for the middle phalanx in the lateral toe probably was caused by errors in marker detection. The differences for wall areas, similar to those for bones, suggested that the wall showed little deformation. As expected, the sole region showed the largest deformations.
A new technique to measure spatial conformation
83
Table 4. Calculated downward displacement of phalanges (in mm) for different load conditions.
Loadconditions compareda
1st phalanx 2nd phalanx 3rd phalanx
Lateral Medial Lateral Medial Lateral Medial
1 vs. 2 7.1 ± 0.7 8.8 ± 1.9 3.9 ± 1.8 7.8 ± 2.9 2.1 ± 0.6 3.7 ± 0.8
2 vs. 3 0.9 ± 0.2 1.0 ± 0.3 0.7 ± 0.3 0.9 ± 0.1 0.3 ± 0.0 0.5 ± 0.2a 1 = Loaded with own weight; 2 = 35% BW load for 1 min; 3 = 35% BW load for 10 min.
Table 5. Root mean square deviations (in mm) from rigid-body behaviour.
Lateral toe Medial toe
Claw element d1a d2b d1 d2
Distal phalanx 0.0377 0.0015 0.0028 0.0036
Middle phalanx 0.1077 0.0132 0.0065 0.0008
Proximal phalanx 0.0091 0.0257 0.0396 0.0186
Horn abaxial wall 0.0564 0.0057 0.0215 0.0013
Horn sole 0.7280 0.0179 1.7016 0.0400
Horn axial wall 0.0065 0.0029 0.0026 0.0019a d1 = detected vs. predicted positions for leg loaded with 35% of BW for 1 min.b d2 = detected vs. predicted positions for leg loaded with 35% of BW for 10 min.
Post hoc we used the downward displacements of markers 1, 4 and 7 on the abaxial walls and 1 and 4 on the axial walls of the hoof capsules (numbers refer to marker locations in Fig. 2, results are given in Fig. 4) to determine the actual deflection of the carbon fibre supporting plate during the experiment. We assumed that the minimum value of these figures was a reliable indicator of the deflection at the position of the marker since little deformation occurred in the walls. The markers on the axial walls showed differences between the toes and did not provide reliable estimates for deflection. From the vertical displacements of the abaxial wall markers we concluded that the maximum deflection was 0.8 mm, compared to 2.4 mm predicted for an unclamped plate.Using the force platform we were able to detect very small changes in the normal force. The longitudinal and transverse components of the force applied were small (about 12 and 16 N, respectively) compared to the vertical component (340 N for minimal load and 1865 N for 35% of bodyweight). We were also able to detect a small shift in the COP, which in our test experiment moved in a caudal and medial direction from the first to the second loading of 29 and 12 mm, respectively.

4
Chapter 4
82
Table 2. Crossing line distances (mm) of reconstructed specimen markers for different load conditions.
Load condition Numbera Min Average Max
1: Loaded with own weight 117 0.000 0.049 0.485
2: 35% BW load, 1 min 86 0.000 0.034 0.324
3: 35% BW load, 10 min 88 0.002 0.040 0.168a Total number of 3D reconstructions from which the 60 specimen markers were selected.
Rotations of the distal phalanges and changes of joint angles for the coffin joints (α in Fig. 3) and the pastern joints (β in Fig. 3) are presented in Table 3. These rotations imply that both joints were overextended. The data show that deformation continued under static loading at 35% of bodyweight. The displacements of phalanges in a downward direction (calculated from average z-coordinates of the markers, Table 4) confirmed that all phalanges rotated to some extent; otherwise, the standard deviations would have been (close to) zero. Distances between the medial and lateral phalanges of the two toes (calculated from the average x-coordinates of the markers) decreased by 0.4, 1.4 and 0.9 mm for the distal, middle and proximal phalanx, respectively, for condition (2) compared with condition (1). This suggests the toes did not spread during loading. Maintaining the load for 10 min resulted in a further decrease of the distances between medial and lateral phalanges with 0.3, 0.3 and 0.2 mm, respectively.
Table 3. Calculated angles of increased overextension of coffin and pastern joints and rotation of the distal phalanx (in degrees) under different load conditions.
Loadconditions compareda
Increased overextension Rotation of distal phalanxCoffin joint Pastern joint
Lateral Medial Lateral Medial Lateral Medial
1 vs. 2 11.5 7.9 3.1 4.4 1.9 4.9
2 vs. 3 1.5 0.9 1.1 0.5 0.3 1.2a 1 = Loaded with own weight; 2 = 35% BW load for 1 min; 3 = 35% BW load for 10 min.
As a control, distances between markers within the same element (bone or horn section) and their root mean squared differences were calculated for all loading conditions. For elements that are indeed rigid bodies and have all markers rigidly attached, the distances between markers would be equal under all loading conditions. In general, only small differences werefound, confirming that the elements could be considered rigid bodies (Table 5). The relatively large value of d1 for the middle phalanx in the lateral toe probably was caused by errors in marker detection. The differences for wall areas, similar to those for bones, suggested that the wall showed little deformation. As expected, the sole region showed the largest deformations.
A new technique to measure spatial conformation
83
Table 4. Calculated downward displacement of phalanges (in mm) for different load conditions.
Loadconditions compareda
1st phalanx 2nd phalanx 3rd phalanx
Lateral Medial Lateral Medial Lateral Medial
1 vs. 2 7.1 ± 0.7 8.8 ± 1.9 3.9 ± 1.8 7.8 ± 2.9 2.1 ± 0.6 3.7 ± 0.8
2 vs. 3 0.9 ± 0.2 1.0 ± 0.3 0.7 ± 0.3 0.9 ± 0.1 0.3 ± 0.0 0.5 ± 0.2a 1 = Loaded with own weight; 2 = 35% BW load for 1 min; 3 = 35% BW load for 10 min.
Table 5. Root mean square deviations (in mm) from rigid-body behaviour.
Lateral toe Medial toe
Claw element d1a d2b d1 d2
Distal phalanx 0.0377 0.0015 0.0028 0.0036
Middle phalanx 0.1077 0.0132 0.0065 0.0008
Proximal phalanx 0.0091 0.0257 0.0396 0.0186
Horn abaxial wall 0.0564 0.0057 0.0215 0.0013
Horn sole 0.7280 0.0179 1.7016 0.0400
Horn axial wall 0.0065 0.0029 0.0026 0.0019a d1 = detected vs. predicted positions for leg loaded with 35% of BW for 1 min.b d2 = detected vs. predicted positions for leg loaded with 35% of BW for 10 min.
Post hoc we used the downward displacements of markers 1, 4 and 7 on the abaxial walls and 1 and 4 on the axial walls of the hoof capsules (numbers refer to marker locations in Fig. 2, results are given in Fig. 4) to determine the actual deflection of the carbon fibre supporting plate during the experiment. We assumed that the minimum value of these figures was a reliable indicator of the deflection at the position of the marker since little deformation occurred in the walls. The markers on the axial walls showed differences between the toes and did not provide reliable estimates for deflection. From the vertical displacements of the abaxial wall markers we concluded that the maximum deflection was 0.8 mm, compared to 2.4 mm predicted for an unclamped plate.Using the force platform we were able to detect very small changes in the normal force. The longitudinal and transverse components of the force applied were small (about 12 and 16 N, respectively) compared to the vertical component (340 N for minimal load and 1865 N for 35% of bodyweight). We were also able to detect a small shift in the COP, which in our test experiment moved in a caudal and medial direction from the first to the second loading of 29 and 12 mm, respectively.

Chapter 4
84
Fig. 4. Decrease in z-values of horn markers when comparing the minimally loaded leg and the leg loaded with 35% of BW. Marker numbers refer to positions in Fig. 2.
4 DISCUSSIONWe showed that our method can determine load induced translations as small as 0.3 mm and rotations as small as 0.3°, values that are considerably smaller than changes observed in the previous studies on large animals using other techniques (Clayton et al., 1998; Meershoek et al., 2001). Thus, we can accurately determine the effects of load on the positions of phalanges in the medial and lateral toes. Moreover, we showed that this method can determine small shifts in COP that occur under changing loading conditions. Our methodology could therefore contribute to a better understanding of the effects of mechanical load on deformation of limbs and claws and on internal distribution of load.Although accuracy was high enough to determine small differences, we failed to achieve the accuracy obtained during calibration, probably due to poor contrast of markers in the proximal and middle phalanges, which made it difficult to locate the marker projections accurately. Systematic errors due to misplacement of bone markers (outside of the bone) can be filtered out by analysis of marker distances within a rigid body for series of measurements with increasing load levels applied.A measurable deflection of the carbon fibre supporting plate occurred, but this had little effect on the final outcome as it was very small and had no effect on the relative position of markers within the limb. We were able to obtain detailed information on deformation in the leg from calculated rotations and translations. These figures are somewhat difficult to interpret because the directions of the screwing axes were variable, but changes mainly occurred in the sagittal plane. We were able to determine different deformations in the medial and lateral toes, and we did see effects of amplitude and duration of loading. The duration effect was probably the
A new technique to measure spatial conformation
85
result of ‘creep’ of tendons and ligaments and elongation of the muscles. Thus, duration of loading is relevant and should be standardised when determining load–deformation relationships in limbs.We assumed that the observed deformations resembled deformations in vivo during standing on a hard surface, but we are aware that in live animals, activation of flexor and extensor muscles might affect joint angles in a static limb (Clayton et al., 1998). Moreover, the angle between the limb and the floor changes between heel strike and push off for a walking animal. In principle these assumptions could be tested, but would require modifications of the experimental setup and so far we have not investigated different floor angles. Moreover, the effects of these and other modified circumstances (e.g. soft instead of hard flooring) could be investigated using a finite element model of the claw and information obtained from the present study. It is also possible that freezing and thawing of the specimen may have affected the mechanical properties of the limb, although previous studies have shown that such effects are negligible (Boettcher et al., 2014). The loads we applied approximated loading during static standing (Van der Tol et al., 2002), but were much smaller than peak load experienced during walking (Van der Tol et al., 2003). However, the load duration during normal walking of dairy cows is <2s (Walker et al., 2010), while deformation under static load continues for much longer time. It is therefore essential to adjust loading duration in deformation experiments according to the specific questions being investigated.
5 CONCLUSIONSThe methodology developed to measure motions and deformations in loaded claws enabled the detection of small deformations in 3D with an accuracy of 0.2–0.3 mm for displacements of phalanges. Moreover, small changes in the location of the COP due to these phenomena can be detected.
6 CONFLICT OF INTEREST STATEMENTNone of the authors has any financial or personal relationships that could inappropriately influence or bias the content of the paper.
7 ACKNOWLEDGEMENTSWe are indebted to Joost Holthof, George Voorhout, Henk van Dijk, Louis van den Boom and Arend Schot (Veterinary Faculty, University of Utrecht) for their cooperation and assistance with the in vitro experiments, Erik Karruppannan and Evert Janssen (R&D workshop, Wageningen University), and to Bart Kaptein (Biomechanics and Imaging Group, Leiden University) for assistance with using the MBRSA software. The work was funded by the former Dutch Ministry of Agriculture, Nature and Food Quality (LNV), research programme Animal Welfare (KB-08-001-006).

4
Chapter 4
84
Fig. 4. Decrease in z-values of horn markers when comparing the minimally loaded leg and the leg loaded with 35% of BW. Marker numbers refer to positions in Fig. 2.
4 DISCUSSIONWe showed that our method can determine load induced translations as small as 0.3 mm and rotations as small as 0.3°, values that are considerably smaller than changes observed in the previous studies on large animals using other techniques (Clayton et al., 1998; Meershoek et al., 2001). Thus, we can accurately determine the effects of load on the positions of phalanges in the medial and lateral toes. Moreover, we showed that this method can determine small shifts in COP that occur under changing loading conditions. Our methodology could therefore contribute to a better understanding of the effects of mechanical load on deformation of limbs and claws and on internal distribution of load.Although accuracy was high enough to determine small differences, we failed to achieve the accuracy obtained during calibration, probably due to poor contrast of markers in the proximal and middle phalanges, which made it difficult to locate the marker projections accurately. Systematic errors due to misplacement of bone markers (outside of the bone) can be filtered out by analysis of marker distances within a rigid body for series of measurements with increasing load levels applied.A measurable deflection of the carbon fibre supporting plate occurred, but this had little effect on the final outcome as it was very small and had no effect on the relative position of markers within the limb. We were able to obtain detailed information on deformation in the leg from calculated rotations and translations. These figures are somewhat difficult to interpret because the directions of the screwing axes were variable, but changes mainly occurred in the sagittal plane. We were able to determine different deformations in the medial and lateral toes, and we did see effects of amplitude and duration of loading. The duration effect was probably the
A new technique to measure spatial conformation
85
result of ‘creep’ of tendons and ligaments and elongation of the muscles. Thus, duration of loading is relevant and should be standardised when determining load–deformation relationships in limbs.We assumed that the observed deformations resembled deformations in vivo during standing on a hard surface, but we are aware that in live animals, activation of flexor and extensor muscles might affect joint angles in a static limb (Clayton et al., 1998). Moreover, the angle between the limb and the floor changes between heel strike and push off for a walking animal. In principle these assumptions could be tested, but would require modifications of the experimental setup and so far we have not investigated different floor angles. Moreover, the effects of these and other modified circumstances (e.g. soft instead of hard flooring) could be investigated using a finite element model of the claw and information obtained from the present study. It is also possible that freezing and thawing of the specimen may have affected the mechanical properties of the limb, although previous studies have shown that such effects are negligible (Boettcher et al., 2014). The loads we applied approximated loading during static standing (Van der Tol et al., 2002), but were much smaller than peak load experienced during walking (Van der Tol et al., 2003). However, the load duration during normal walking of dairy cows is <2s (Walker et al., 2010), while deformation under static load continues for much longer time. It is therefore essential to adjust loading duration in deformation experiments according to the specific questions being investigated.
5 CONCLUSIONSThe methodology developed to measure motions and deformations in loaded claws enabled the detection of small deformations in 3D with an accuracy of 0.2–0.3 mm for displacements of phalanges. Moreover, small changes in the location of the COP due to these phenomena can be detected.
6 CONFLICT OF INTEREST STATEMENTNone of the authors has any financial or personal relationships that could inappropriately influence or bias the content of the paper.
7 ACKNOWLEDGEMENTSWe are indebted to Joost Holthof, George Voorhout, Henk van Dijk, Louis van den Boom and Arend Schot (Veterinary Faculty, University of Utrecht) for their cooperation and assistance with the in vitro experiments, Erik Karruppannan and Evert Janssen (R&D workshop, Wageningen University), and to Bart Kaptein (Biomechanics and Imaging Group, Leiden University) for assistance with using the MBRSA software. The work was funded by the former Dutch Ministry of Agriculture, Nature and Food Quality (LNV), research programme Animal Welfare (KB-08-001-006).

Chapter 4
86
REFERENCESBicalho, R.C., Oikonomou, G., 2013. Control and prevention of lameness associated with
claw lesions in dairy cows. Livestock Science 156, 96-105.Boettcher, H.S., Knudsen, J.C., Andersen, P.H., Danscher, A.M., 2014. Technical note:
Effects of frozen storage on the mechanical properties of the suspensory tissue in the bovine claw. Journal of Dairy Science 97, 2969-2973.
Clayton, H.M., Lanovaz, J.L., Schamhardt, H.C., Willemen, M.A., Colborne, G.R., 1998. Net joint moments and powers in the equine forelimb during the stance phase of the trot. Equine Veterinary Journal 30, 384-389.
Kärrholm, J., Gill, R.H., Valstar, E.R., 2006. The history and future of radiostereometric analysis. Clinical orthopaedics and Related Research 448, 10-21.
Kedgley, A.E., Birmingham, T., Jenkyn, T.R., 2009. Comparative accuracy of radiostereometric and optical tracking systems. Journal of Biomechanics 42, 1350-1354.
Kibsgård, T., Røise, O., Stuge, B., Röhrl, S., 2012. Precision and accuracy measurement of radiostereometric analysis applied to movement of the sacroiliac joint. Clinical Orthopaedics and Related Research 470, 3187-3194.
Koning, O.H.J., Oudegeest, O.R., Valstar, E.R., Garling, E.H., van der Linden, E., Hinnen, J.-W., Hamming, J.F., Vossepoel, A.M., van Bockel, J.H., 2006. Roentgen stereophotogrammetric analysis: An accurate tool to assess stent-graft migration. Journal of Endovascular Therapy 13, 468-475.
Leardini, A., 2001. Geometry and mechanics of the human ankle complex and ankle prosthesis design. Clinical Biomechanics 16, 706-709.
Madanat, R., Mäkinen, T.J., Moritz, N., Mattila, K.T., Aro, H.T., 2005. Accuracy and precision of radiostereometric analysis in the measurement of three‐dimensional micromotion in a fracture model of the distal radius. Journal of Orthopaedic Research 23, 481-488.
Medis Specials, 2011. Model-based RSA 3.3.2 User Manual. Leiden, the Netherlands.Meershoek, L., Roepstorff, L., Schamhardt, H., Johnston, C., Bobbert, M., 2001. Joint
moments in the distal forelimbs of jumping horses during landing. Equine Veterinary Journal 33, 410-415.
Nelissen, R.G.H.H., Valstar, E.R., Pöll, R.G., Garling, E.H., Brand, R., 2002. Factors associated with excessive migration in bone impaction hip revision surgery: A radiostereometric analysis study. The Journal of Arthroplasty 17, 826-833.
Sarnäs, K.-V., Åberg, M., Svensson, H., 2012. Mandibular widening in hemifacial microsomia: A roentgen stereometric study of 11 patients with the aid of metallic implants. American Journal of Orthodontics and Dentofacial Orthopedics 141, S88-S91.
Schaller, O., 1992. Illustrated Veterinary Anatomical Nomenclature (with the cooperation of Constantinescu MG, Habel RE, Sack WO, Schaller O., Simoens P. and de Vos NR). Ferdinand Enke Verlag, Stuttgart, Germany.
Selvik, G., 1989. Roentgen stereophotogrammetry. A method for the study of the kinematics of the skeletal system. Acta Orthopaedica Scandinavica. Supplementum 232, 1-51.
A new technique to measure spatial conformation
87
Söderkvist, I., Wedin, P.-Å., 1993. Determining the movements of the skeleton using well-configured markers. Journal of Biomechanics 26, 1473-1477.
Solomon, L.B., Stevenson, A.W., Callary, S.A., Sullivan, T.R., Howie, D.W., Chehade, M.J., 2010. The accuracy and precision of radiostereometric analysis in monitoring tibial plateau fractures. Acta Orthopaedica 81, 487-494.
Spoor, C.W., Veldpaus, F.E., 1980. Rigid body motion calculated from spatial co-ordinates of markers. Journal of Biomechanics 13, 391-393.
Tranberg, R., 2010. Analysis of body motions based on optical markers. Accuracy, error analysis and clinical applications. PhD thesis, Department of Orthopaedics, University of Gothenburg, Sweden.
Van der Tol, P., Metz, J., Noordhuizen-Stassen, E., Back, W., Braam, C., Weijs, W., 2002. The pressure distribution under the bovine claw during square standing on a flat substrate. Journal of Dairy Science 85, 1476-1481.
Van der Tol, P., Metz, J., Noordhuizen-Stassen, E., Back, W., Braam, C., Weijs, W., 2003. The vertical ground reaction force and the pressure distribution on the claws of dairy cows while walking on a flat substrate. Journal of Dairy Science 86, 2875-2883.
Van der Tol, P., Van Der Beek, S., Metz, J., Noordhuizen-Stassen, E., Back, W., Braam, C., Weijs, W., 2004. The effect of preventive trimming on weight bearing and force balance on the claws of dairy cattle. Journal of Dairy Science 87, 1732-1738.
Walker, A.M., Pfau, T., Channon, A., Wilson, A., 2010. Assessment of dairy cow locomotion in a commercial farm setting: The effects of walking speed on ground reaction forces and temporal and linear stride characteristics. Research in Veterinary Science 88, 179-187.
Wolterbeek, N., Garling, E.H., van der Linden, H.M.J., Nelissen, R.G.H.H., Valstar, E.R., 2012. Integrated assessment techniques for linking kinematics, kinetics and muscle activation to early migration: A pilot study. Gait & Posture 36, 394-398.

4
Chapter 4
86
REFERENCESBicalho, R.C., Oikonomou, G., 2013. Control and prevention of lameness associated with
claw lesions in dairy cows. Livestock Science 156, 96-105.Boettcher, H.S., Knudsen, J.C., Andersen, P.H., Danscher, A.M., 2014. Technical note:
Effects of frozen storage on the mechanical properties of the suspensory tissue in the bovine claw. Journal of Dairy Science 97, 2969-2973.
Clayton, H.M., Lanovaz, J.L., Schamhardt, H.C., Willemen, M.A., Colborne, G.R., 1998. Net joint moments and powers in the equine forelimb during the stance phase of the trot. Equine Veterinary Journal 30, 384-389.
Kärrholm, J., Gill, R.H., Valstar, E.R., 2006. The history and future of radiostereometric analysis. Clinical orthopaedics and Related Research 448, 10-21.
Kedgley, A.E., Birmingham, T., Jenkyn, T.R., 2009. Comparative accuracy of radiostereometric and optical tracking systems. Journal of Biomechanics 42, 1350-1354.
Kibsgård, T., Røise, O., Stuge, B., Röhrl, S., 2012. Precision and accuracy measurement of radiostereometric analysis applied to movement of the sacroiliac joint. Clinical Orthopaedics and Related Research 470, 3187-3194.
Koning, O.H.J., Oudegeest, O.R., Valstar, E.R., Garling, E.H., van der Linden, E., Hinnen, J.-W., Hamming, J.F., Vossepoel, A.M., van Bockel, J.H., 2006. Roentgen stereophotogrammetric analysis: An accurate tool to assess stent-graft migration. Journal of Endovascular Therapy 13, 468-475.
Leardini, A., 2001. Geometry and mechanics of the human ankle complex and ankle prosthesis design. Clinical Biomechanics 16, 706-709.
Madanat, R., Mäkinen, T.J., Moritz, N., Mattila, K.T., Aro, H.T., 2005. Accuracy and precision of radiostereometric analysis in the measurement of three‐dimensional micromotion in a fracture model of the distal radius. Journal of Orthopaedic Research 23, 481-488.
Medis Specials, 2011. Model-based RSA 3.3.2 User Manual. Leiden, the Netherlands.Meershoek, L., Roepstorff, L., Schamhardt, H., Johnston, C., Bobbert, M., 2001. Joint
moments in the distal forelimbs of jumping horses during landing. Equine Veterinary Journal 33, 410-415.
Nelissen, R.G.H.H., Valstar, E.R., Pöll, R.G., Garling, E.H., Brand, R., 2002. Factors associated with excessive migration in bone impaction hip revision surgery: A radiostereometric analysis study. The Journal of Arthroplasty 17, 826-833.
Sarnäs, K.-V., Åberg, M., Svensson, H., 2012. Mandibular widening in hemifacial microsomia: A roentgen stereometric study of 11 patients with the aid of metallic implants. American Journal of Orthodontics and Dentofacial Orthopedics 141, S88-S91.
Schaller, O., 1992. Illustrated Veterinary Anatomical Nomenclature (with the cooperation of Constantinescu MG, Habel RE, Sack WO, Schaller O., Simoens P. and de Vos NR). Ferdinand Enke Verlag, Stuttgart, Germany.
Selvik, G., 1989. Roentgen stereophotogrammetry. A method for the study of the kinematics of the skeletal system. Acta Orthopaedica Scandinavica. Supplementum 232, 1-51.
A new technique to measure spatial conformation
87
Söderkvist, I., Wedin, P.-Å., 1993. Determining the movements of the skeleton using well-configured markers. Journal of Biomechanics 26, 1473-1477.
Solomon, L.B., Stevenson, A.W., Callary, S.A., Sullivan, T.R., Howie, D.W., Chehade, M.J., 2010. The accuracy and precision of radiostereometric analysis in monitoring tibial plateau fractures. Acta Orthopaedica 81, 487-494.
Spoor, C.W., Veldpaus, F.E., 1980. Rigid body motion calculated from spatial co-ordinates of markers. Journal of Biomechanics 13, 391-393.
Tranberg, R., 2010. Analysis of body motions based on optical markers. Accuracy, error analysis and clinical applications. PhD thesis, Department of Orthopaedics, University of Gothenburg, Sweden.
Van der Tol, P., Metz, J., Noordhuizen-Stassen, E., Back, W., Braam, C., Weijs, W., 2002. The pressure distribution under the bovine claw during square standing on a flat substrate. Journal of Dairy Science 85, 1476-1481.
Van der Tol, P., Metz, J., Noordhuizen-Stassen, E., Back, W., Braam, C., Weijs, W., 2003. The vertical ground reaction force and the pressure distribution on the claws of dairy cows while walking on a flat substrate. Journal of Dairy Science 86, 2875-2883.
Van der Tol, P., Van Der Beek, S., Metz, J., Noordhuizen-Stassen, E., Back, W., Braam, C., Weijs, W., 2004. The effect of preventive trimming on weight bearing and force balance on the claws of dairy cattle. Journal of Dairy Science 87, 1732-1738.
Walker, A.M., Pfau, T., Channon, A., Wilson, A., 2010. Assessment of dairy cow locomotion in a commercial farm setting: The effects of walking speed on ground reaction forces and temporal and linear stride characteristics. Research in Veterinary Science 88, 179-187.
Wolterbeek, N., Garling, E.H., van der Linden, H.M.J., Nelissen, R.G.H.H., Valstar, E.R., 2012. Integrated assessment techniques for linking kinematics, kinetics and muscle activation to early migration: A pilot study. Gait & Posture 36, 394-398.

Chapter 4
88
APPENDIX: SUPPLEMENTARY MATERIAL1 Data used to calculate the calibration line for the manometer
Manometer setting (bar) Average vertical force measured (N)
1 481
2 978
3 1474
4 1973
5 2477
6 2969
7 3461
2 978
4 1964
6 2973
2 Box calibration The actual relative coordinates of the fiducial and control markers were checked and possible inaccuracies in the marker coordinates were reduced iteratively. Firstly, two test images (one from each tube) were made that showed all fiducial and control markers. Fiducial and control marker positions were recalculated from their projections and the positions of the roentgen tubes as calculated from the projections of the other markers and their positions until convergence was reached. In this way, fiducial and control marker positions were determined more accurately, but the set of control markers as a whole still needed a correcting translation. This was derived from images of an object (glass, 96×112×297 mm) with 50 markers that was placed successively on the supporting plate (5) in three orientations: the first was a lying position; the second was obtained by rotating the object 180º about the vertical axis, and the third was obtained by a rotation over 90º about a horizontal axis. The horizontal correction of the control markers followed on by comparing the first two orientations. The vertical correction followed from comparison of orientations 1 and 3. After these corrections, differences of calculated glass object marker positions between orientations 1 and 2 had a root mean square of 0.089 mm and maximum of 0.205 mm. The differences between orientations 1 and 3 had a root mean square of 0.111 mm and maximum of 0.240 mm. This showed that an accuracy of about 0.1 mm is achievable for markers throughout the detection area. The marker coordinates determined with this calibration procedure were used for all calculations of specimen marker coordinates with the RSA software.
A new technique to measure spatial conformation
89
Appe
ndix
3: C
alcu
late
d m
arke
r dist
ance
s (m
m) i
n ea
ch p
hala
nxM
arke
r com
bina
tion1
Toe
Phal
anx
Cond
ition
21
and
21
and
31
and
42
and
32
and
43
and
4M
edia
lPr
oxim
ala
18.3
5325
.425
30.4
6828
.558
24.8
2113
.185
b18
.247
25.2
2030
.130
28.7
2424
.636
13.4
79c
18.3
8224
.984
30.0
6128
.784
24.8
6113
.383
Mid
dle
a16
.582
26.1
0544
.252
11.6
2229
.150
20.3
32b
18.4
4427
.526
46.0
4611
.588
28.9
7920
.168
c18
.678
27.7
9846
.368
11.5
7929
.034
20.2
31D
istal
a16
.252
18.0
1036
.355
16.3
4729
.311
19.1
24b
16.3
0317
.976
36.4
3916
.378
29.4
2019
.224
c16
.258
17.9
6636
.439
16.3
4629
.408
19.1
85La
tera
lPr
oxim
ala
18.7
4322
.816
29.7
1520
.214
19.8
8710
.025
b18
.754
22.9
8629
.754
20.3
2620
.013
9.86
1c
18.7
1122
.729
29.7
9420
.383
20.3
2310
.014
Mid
dle
a14
.092
13.8
5623
.758
19.5
0129
.912
12.6
71b
13.3
6213
.596
23.5
2619
.515
29.8
2312
.691
c13
.288
13.5
3823
.624
19.4
9229
.940
12.9
69D
istal
a27
.060
44.3
1957
.613
24.8
8542
.893
18.7
55b
27.1
2244
.501
57.4
8924
.851
42.6
9418
.633
c27
.143
44.5
2457
.429
24.8
6142
.630
18.5
751Fo
ur m
arke
rs in
eac
h ph
alan
x, n
umbe
red
from
1 –
4.2a
= lo
aded
with
ow
n w
eigh
t; b
= 35
% B
W lo
ad, 1
min
; c =
35%
BW
load
, 10
min
.

4
Chapter 4
88
APPENDIX: SUPPLEMENTARY MATERIAL1 Data used to calculate the calibration line for the manometer
Manometer setting (bar) Average vertical force measured (N)
1 481
2 978
3 1474
4 1973
5 2477
6 2969
7 3461
2 978
4 1964
6 2973
2 Box calibration The actual relative coordinates of the fiducial and control markers were checked and possible inaccuracies in the marker coordinates were reduced iteratively. Firstly, two test images (one from each tube) were made that showed all fiducial and control markers. Fiducial and control marker positions were recalculated from their projections and the positions of the roentgen tubes as calculated from the projections of the other markers and their positions until convergence was reached. In this way, fiducial and control marker positions were determined more accurately, but the set of control markers as a whole still needed a correcting translation. This was derived from images of an object (glass, 96×112×297 mm) with 50 markers that was placed successively on the supporting plate (5) in three orientations: the first was a lying position; the second was obtained by rotating the object 180º about the vertical axis, and the third was obtained by a rotation over 90º about a horizontal axis. The horizontal correction of the control markers followed on by comparing the first two orientations. The vertical correction followed from comparison of orientations 1 and 3. After these corrections, differences of calculated glass object marker positions between orientations 1 and 2 had a root mean square of 0.089 mm and maximum of 0.205 mm. The differences between orientations 1 and 3 had a root mean square of 0.111 mm and maximum of 0.240 mm. This showed that an accuracy of about 0.1 mm is achievable for markers throughout the detection area. The marker coordinates determined with this calibration procedure were used for all calculations of specimen marker coordinates with the RSA software.
A new technique to measure spatial conformation
89
Appe
ndix
3: C
alcu
late
d m
arke
r dist
ance
s (m
m) i
n ea
ch p
hala
nxM
arke
r com
bina
tion1
Toe
Phal
anx
Cond
ition
21
and
21
and
31
and
42
and
32
and
43
and
4M
edia
lPr
oxim
ala
18.3
5325
.425
30.4
6828
.558
24.8
2113
.185
b18
.247
25.2
2030
.130
28.7
2424
.636
13.4
79c
18.3
8224
.984
30.0
6128
.784
24.8
6113
.383
Mid
dle
a16
.582
26.1
0544
.252
11.6
2229
.150
20.3
32b
18.4
4427
.526
46.0
4611
.588
28.9
7920
.168
c18
.678
27.7
9846
.368
11.5
7929
.034
20.2
31D
istal
a16
.252
18.0
1036
.355
16.3
4729
.311
19.1
24b
16.3
0317
.976
36.4
3916
.378
29.4
2019
.224
c16
.258
17.9
6636
.439
16.3
4629
.408
19.1
85La
tera
lPr
oxim
ala
18.7
4322
.816
29.7
1520
.214
19.8
8710
.025
b18
.754
22.9
8629
.754
20.3
2620
.013
9.86
1c
18.7
1122
.729
29.7
9420
.383
20.3
2310
.014
Mid
dle
a14
.092
13.8
5623
.758
19.5
0129
.912
12.6
71b
13.3
6213
.596
23.5
2619
.515
29.8
2312
.691
c13
.288
13.5
3823
.624
19.4
9229
.940
12.9
69D
istal
a27
.060
44.3
1957
.613
24.8
8542
.893
18.7
55b
27.1
2244
.501
57.4
8924
.851
42.6
9418
.633
c27
.143
44.5
2457
.429
24.8
6142
.630
18.5
751Fo
ur m
arke
rs in
eac
h ph
alan
x, n
umbe
red
from
1 –
4.2a
= lo
aded
with
ow
n w
eigh
t; b
= 35
% B
W lo
ad, 1
min
; c =
35%
BW
load
, 10
min
.

90
CHAPTER 5
Spatial distribution of load induced soft tissue strain in cattle claws
W. Ouweltjes a,b, C.W. Spoor b, J.L. van Leeuwen b, S.W.S. Gussekloo b
a Wageningen Livestock Research, P.O. Box 338, 6700 AH Wageningen, The Netherlands
b Wageningen UR Experimental Zoology group, P.O. Box 338, 6700 AH Wageningen, The Netherlands

92
Spatial distribution
93
ABSTRACTClaw disorders in dairy cattle have negative effects on both animal welfare and farm profits. One possible cause of claw disorders might be the high mechanical loads that cattle encounter when walking and standing on hard concrete floors. It is currently unclear how high mechanical loading leads to claw disorders and lameness. We hypothesize that mechanical loading leads to compression of the soft tissue in the claws, which may directly or indirectly lead to tissue damage. We used roentgen stereophotogrammetry in combination with CT-reconstruction to detect deformations in the distal hind limbs of dissected specimens of dairy cows under a range of loading regimens. The loading was recorded in 3D using a force plate. We show that loading causes deformation of the soft tissue layer in the bovine claw, especially where the sole rests on the surface. The deformation enlarges due to increased and/or prolonged load. Even at moderate load levels, such as will occur during standing, the soft tissue layer is considerably compressed (more than 10% of the initial thickness). Most importantly, the location of areas of highest load coincides with the locations were sole ulcers are most often found. These findings provide insight into the aetiology of bovine claw disorders, and may contribute to solutions to reduce them.
Key words: RSA, Limb deformation, Mechanical loading, Sole Ulcers, Cattle

5
92
Spatial distribution
93
ABSTRACTClaw disorders in dairy cattle have negative effects on both animal welfare and farm profits. One possible cause of claw disorders might be the high mechanical loads that cattle encounter when walking and standing on hard concrete floors. It is currently unclear how high mechanical loading leads to claw disorders and lameness. We hypothesize that mechanical loading leads to compression of the soft tissue in the claws, which may directly or indirectly lead to tissue damage. We used roentgen stereophotogrammetry in combination with CT-reconstruction to detect deformations in the distal hind limbs of dissected specimens of dairy cows under a range of loading regimens. The loading was recorded in 3D using a force plate. We show that loading causes deformation of the soft tissue layer in the bovine claw, especially where the sole rests on the surface. The deformation enlarges due to increased and/or prolonged load. Even at moderate load levels, such as will occur during standing, the soft tissue layer is considerably compressed (more than 10% of the initial thickness). Most importantly, the location of areas of highest load coincides with the locations were sole ulcers are most often found. These findings provide insight into the aetiology of bovine claw disorders, and may contribute to solutions to reduce them.
Key words: RSA, Limb deformation, Mechanical loading, Sole Ulcers, Cattle

Chapter 5
94
1 INTRODUCTIONClaw disorders are widespread amongst Dutch dairy cattle (Holzhauer, 2006). These disorders do not only cause impaired locomotion and lameness and negatively impact animal welfare, but also result in early culling and economic losses (Bruijnis et al., 2010). One possible cause for claw disorders is the high mechanical loads experienced by cattle while walking on hard substrates such as concrete barn floors (Van der Tol, 2004; Nuss, 2014). In line with this hypothesis, application of soft flooring surfaces in the walking areas of dairy barns have become increasingly popular alternatives to hard floors (Alsaaod et al., 2017).Several studies showed positive effects of soft flooring compared to hard flooring. Softer flooring in walking areas in barns improved locomotion and caused higher activity (Telezhenko and Bergsten, 2005; Flower et al., 2007; Kremer et al., 2007; Haufe et al., 2009; Ouweltjes et al., 2009; Eicher et al., 2013), and was preferred by non-lame cows over hard concrete floors for walking and standing (Telezhenko et al., 2007). Soft flooring reduced sole haemorrhages and white line fissures (Kremer et al., 2007; Ouweltjes et al., 2009; Fjeldaas et al., 2011; Ouweltjes et al., 2011), and reduced the number of hoof and leg treatments (Eicher et al., 2013).However, not only positive effects of soft flooring materials were reported. A number of studies showed no significant differences in locomotion or clinical lameness between cows kept on soft solid rubber flooring or hard substrates as asphalt or concrete (Kremer et al., 2007; Fjeldaas et al., 2011; Alsaaod et al., 2017). Another study reported less sole haemorrhages and white line fissures for cows that were kept on asphalt instead of rubber or concrete Haufe et al. (2012), and a clear disadvantage of rubber flooring is that it will often increase the number of infectious disorders (Kremer et al., 2007; Fjeldaas et al., 2011; Haufe et al., 2012).When cattle have access to even softer substrates such as pasture, the levels of lameness, hoof pathologies, and hock lesions in general decrease and locomotion patterns improve (Alsaaod et al., 2017; Arnott et al., 2017). Although pasture is indeed considerably softer than indoor surfaces, it should be noted that the positive effects of pasture access can have other causes than reduced mechanical loading alone, e.g. increased walking times (Dohme-Meier et al., 2014), changes in lying behaviour (Olmos et al., 2009), or less contact of the claws with manure (Volkmann and Kemper, 2018).Currently it is unclear which mechanisms link hard flooring to claw lesions. Bovine claws consist of a hard outer rim of wall horn, which is connected to the distal phalanx via dermal and subdermal connective tissues. The bottom of the claw consists of softer sole horn. We hypothesize that, when a limb is loaded, the distal phalanx is pushed down relative to the wall horn. This results in compression of the soft tissue layer beneath the distal phalanx, especially when the sole horn is resting on the ground. High loads will either directly provoke tissue damage, or cause a reduction in blood flow through the soft tissue layer, which impairs tissue metabolism. Particularly in the latter case not only the amplitude but also the duration of the load will be an important factor determining the level of damage to the tissue. To our
Spatial distribution
95
knowledge, load induced strain of soft tissues within the digits has never been measured. The aim of this study was to quantify the spatial conformational changes as a result of mechanical loads up to 35% of body weight on a single limb in joints, horn capsules and the soft tissues of cattle claws. The results are compared with the locations of lesions as they are observed in modern dairy cattle farming, such that possible links between mechanical load and claw pathologies can be found.
2 MATERIAL AND METHODSWe used the method described in Ouweltjes et al. (2016) to load dissected bovine hind limbs and accurately measured deformations using roentgen stereophotogrammetry. We used a total of 10 pairs of hind limbs taken from fresh cadavers brought to the Department of Pathobiology, Faculty of Veterinary Medicine, University of Utrecht, for post-mortem examination. In none of the limbs, pathologies in the musculoskeletal system were found. Body masses of the animals were obtained from the autopsy reports. The limbs were dissected at the hip joint, muscles around the femur were removed and the patella was fixed as previously described (Ouweltjes et al., 2016).Three or four radiopaque markers were inserted into holes drilled in the phalanges of both lateral and medial digits (diameter of 1 mm for distal and 2 mm for other phalanges). Initially, markers in the distal phalanges were inserted through small incisions around the coronary band to avoid damage to the wall horn, but CT-scans revealed that this often resulted in incorrect placement. Therefore in the last eight limbs, markers in the distal phalanges were inserted via holes drilled through the horn shoe wall. For the other phalanges, skin incisions were made to reach the bone. Eighteen radiopaque markers (diameter of 1.5 mm) were glued on the axial and abaxial walls and the soles according to a predefined pattern (Fig. 1, (Ouweltjes et al., 2016)). Between dissection and preparation the limbs were stored in a freezer, which has been shown not to affect the results of mechanical tests (Boettcher et al., 2014).

5
Chapter 5
94
1 INTRODUCTIONClaw disorders are widespread amongst Dutch dairy cattle (Holzhauer, 2006). These disorders do not only cause impaired locomotion and lameness and negatively impact animal welfare, but also result in early culling and economic losses (Bruijnis et al., 2010). One possible cause for claw disorders is the high mechanical loads experienced by cattle while walking on hard substrates such as concrete barn floors (Van der Tol, 2004; Nuss, 2014). In line with this hypothesis, application of soft flooring surfaces in the walking areas of dairy barns have become increasingly popular alternatives to hard floors (Alsaaod et al., 2017).Several studies showed positive effects of soft flooring compared to hard flooring. Softer flooring in walking areas in barns improved locomotion and caused higher activity (Telezhenko and Bergsten, 2005; Flower et al., 2007; Kremer et al., 2007; Haufe et al., 2009; Ouweltjes et al., 2009; Eicher et al., 2013), and was preferred by non-lame cows over hard concrete floors for walking and standing (Telezhenko et al., 2007). Soft flooring reduced sole haemorrhages and white line fissures (Kremer et al., 2007; Ouweltjes et al., 2009; Fjeldaas et al., 2011; Ouweltjes et al., 2011), and reduced the number of hoof and leg treatments (Eicher et al., 2013).However, not only positive effects of soft flooring materials were reported. A number of studies showed no significant differences in locomotion or clinical lameness between cows kept on soft solid rubber flooring or hard substrates as asphalt or concrete (Kremer et al., 2007; Fjeldaas et al., 2011; Alsaaod et al., 2017). Another study reported less sole haemorrhages and white line fissures for cows that were kept on asphalt instead of rubber or concrete Haufe et al. (2012), and a clear disadvantage of rubber flooring is that it will often increase the number of infectious disorders (Kremer et al., 2007; Fjeldaas et al., 2011; Haufe et al., 2012).When cattle have access to even softer substrates such as pasture, the levels of lameness, hoof pathologies, and hock lesions in general decrease and locomotion patterns improve (Alsaaod et al., 2017; Arnott et al., 2017). Although pasture is indeed considerably softer than indoor surfaces, it should be noted that the positive effects of pasture access can have other causes than reduced mechanical loading alone, e.g. increased walking times (Dohme-Meier et al., 2014), changes in lying behaviour (Olmos et al., 2009), or less contact of the claws with manure (Volkmann and Kemper, 2018).Currently it is unclear which mechanisms link hard flooring to claw lesions. Bovine claws consist of a hard outer rim of wall horn, which is connected to the distal phalanx via dermal and subdermal connective tissues. The bottom of the claw consists of softer sole horn. We hypothesize that, when a limb is loaded, the distal phalanx is pushed down relative to the wall horn. This results in compression of the soft tissue layer beneath the distal phalanx, especially when the sole horn is resting on the ground. High loads will either directly provoke tissue damage, or cause a reduction in blood flow through the soft tissue layer, which impairs tissue metabolism. Particularly in the latter case not only the amplitude but also the duration of the load will be an important factor determining the level of damage to the tissue. To our
Spatial distribution
95
knowledge, load induced strain of soft tissues within the digits has never been measured. The aim of this study was to quantify the spatial conformational changes as a result of mechanical loads up to 35% of body weight on a single limb in joints, horn capsules and the soft tissues of cattle claws. The results are compared with the locations of lesions as they are observed in modern dairy cattle farming, such that possible links between mechanical load and claw pathologies can be found.
2 MATERIAL AND METHODSWe used the method described in Ouweltjes et al. (2016) to load dissected bovine hind limbs and accurately measured deformations using roentgen stereophotogrammetry. We used a total of 10 pairs of hind limbs taken from fresh cadavers brought to the Department of Pathobiology, Faculty of Veterinary Medicine, University of Utrecht, for post-mortem examination. In none of the limbs, pathologies in the musculoskeletal system were found. Body masses of the animals were obtained from the autopsy reports. The limbs were dissected at the hip joint, muscles around the femur were removed and the patella was fixed as previously described (Ouweltjes et al., 2016).Three or four radiopaque markers were inserted into holes drilled in the phalanges of both lateral and medial digits (diameter of 1 mm for distal and 2 mm for other phalanges). Initially, markers in the distal phalanges were inserted through small incisions around the coronary band to avoid damage to the wall horn, but CT-scans revealed that this often resulted in incorrect placement. Therefore in the last eight limbs, markers in the distal phalanges were inserted via holes drilled through the horn shoe wall. For the other phalanges, skin incisions were made to reach the bone. Eighteen radiopaque markers (diameter of 1.5 mm) were glued on the axial and abaxial walls and the soles according to a predefined pattern (Fig. 1, (Ouweltjes et al., 2016)). Between dissection and preparation the limbs were stored in a freezer, which has been shown not to affect the results of mechanical tests (Boettcher et al., 2014).

Chapter 5
96
Fig. 1. Marker placement on the hoof capsule: (a) medio-lateral view of medial abaxial wall, (b) sole view and (c) latero-medial view of medial axial wall. Lateral abaxial wall and axial wall are not shown, but are similar to the medial claw. Anatomical features of pictures (a) and (b) redrawn from examples on internet (see: http://rubber-cow-mat.com/hp2921/soft-walking-areas.htm and http://www.slideshare.net/fullscreen/drawadrizk2012/claw-affection-presented-by-dr-awad-rizk/10, respectively)
2.1 Loading procedures The individual limbs were placed in a previously described loading device (Ouweltjes et al., 2016), and loaded 10 times according to a cycle of 1 minute loading at 12.5% of body weight and 1 minute unloading to prepare the tissues for testing. During measurements, each specimen was loaded from minimal load, which was just sufficient for the limb to remain standing, up to 35% of the body weight of the animal from which the limb was dissected, following a pre-defined loading protocol (Table 1). At each loading condition, two roentgen systems (Philips Maximus CM100 and Philips Practix 400) were used to obtain roentgen stereo-images, from which 3D-marker coordinates were obtained using Model Based Roentgen Stereophotogrammetry software (Medis Specials, 2011). Images were obtained at the end of each loading condition and at 1, 5 and 10 minutes when the load duration was longer than those time intervals. During the loading procedure, the load under the limb was recorded in three directions with a force plate (Kistler 9253B) with a frequency of 10 Hz. Both the magnitude of the forces and the location of the centre of pressure (COP) were digitally recorded.
Spatial distribution
97
Table 1. Sequence of loading conditions applied to each leg.
load duration
load 1 min 5 min 10 min 20 min
Minimal 1 2
10% of BW1 3 4 5 6
20% of BW 7 8 9 10
35% of BW 11 12 13 141 BW = body weight
2.2 CT scanning and calculation of reference geometryAfter the loading experiments, the limbs were CT-scanned (Philips CT Secura) with slices of 512*512 pixels at 1 mm intervals. Pixel size for the scans ranged from 0.2859 to 0.5352 mm2.We expanded the procedures described in Ouweltjes et al. (2016) to enable an assessment of soft-tissue deformation between the distal phalanx and the sole layer of the horn shoe. From the CT-images, we determined the geometry of three surfaces in the claws: the outer and inner surface of the sole horn and the plantar surface of the distal phalanx (Fig. 2, paragraph 1 in the supplementary information (SI)). The inner surface of the sole horn was determined only for the region below the plantar surface of the distal phalanx. The three surfaces obtained from the CT-scans were transferred to the minimally loaded condition in the test frame coordinate system based on the position of the axial and abaxial wall markers, and smoothed with Matlab routine tpaps (see paragraph 2 in SI). To confirm a good fit, the position of the transferred sole area obtained from the CT-scans was matched with the coordinates of the markers on the sole area obtained from the stereophotogrammetry. For visual inspection of the location of the estimated surfaces, we transferred the 3D voxel space of the CT-scan (voxel size 1 mm3) with the same transformation matrix to the test frame coordinate system (Fig 2.).

5
Chapter 5
96
Fig. 1. Marker placement on the hoof capsule: (a) medio-lateral view of medial abaxial wall, (b) sole view and (c) latero-medial view of medial axial wall. Lateral abaxial wall and axial wall are not shown, but are similar to the medial claw. Anatomical features of pictures (a) and (b) redrawn from examples on internet (see: http://rubber-cow-mat.com/hp2921/soft-walking-areas.htm and http://www.slideshare.net/fullscreen/drawadrizk2012/claw-affection-presented-by-dr-awad-rizk/10, respectively)
2.1 Loading procedures The individual limbs were placed in a previously described loading device (Ouweltjes et al., 2016), and loaded 10 times according to a cycle of 1 minute loading at 12.5% of body weight and 1 minute unloading to prepare the tissues for testing. During measurements, each specimen was loaded from minimal load, which was just sufficient for the limb to remain standing, up to 35% of the body weight of the animal from which the limb was dissected, following a pre-defined loading protocol (Table 1). At each loading condition, two roentgen systems (Philips Maximus CM100 and Philips Practix 400) were used to obtain roentgen stereo-images, from which 3D-marker coordinates were obtained using Model Based Roentgen Stereophotogrammetry software (Medis Specials, 2011). Images were obtained at the end of each loading condition and at 1, 5 and 10 minutes when the load duration was longer than those time intervals. During the loading procedure, the load under the limb was recorded in three directions with a force plate (Kistler 9253B) with a frequency of 10 Hz. Both the magnitude of the forces and the location of the centre of pressure (COP) were digitally recorded.
Spatial distribution
97
Table 1. Sequence of loading conditions applied to each leg.
load duration
load 1 min 5 min 10 min 20 min
Minimal 1 2
10% of BW1 3 4 5 6
20% of BW 7 8 9 10
35% of BW 11 12 13 141 BW = body weight
2.2 CT scanning and calculation of reference geometryAfter the loading experiments, the limbs were CT-scanned (Philips CT Secura) with slices of 512*512 pixels at 1 mm intervals. Pixel size for the scans ranged from 0.2859 to 0.5352 mm2.We expanded the procedures described in Ouweltjes et al. (2016) to enable an assessment of soft-tissue deformation between the distal phalanx and the sole layer of the horn shoe. From the CT-images, we determined the geometry of three surfaces in the claws: the outer and inner surface of the sole horn and the plantar surface of the distal phalanx (Fig. 2, paragraph 1 in the supplementary information (SI)). The inner surface of the sole horn was determined only for the region below the plantar surface of the distal phalanx. The three surfaces obtained from the CT-scans were transferred to the minimally loaded condition in the test frame coordinate system based on the position of the axial and abaxial wall markers, and smoothed with Matlab routine tpaps (see paragraph 2 in SI). To confirm a good fit, the position of the transferred sole area obtained from the CT-scans was matched with the coordinates of the markers on the sole area obtained from the stereophotogrammetry. For visual inspection of the location of the estimated surfaces, we transferred the 3D voxel space of the CT-scan (voxel size 1 mm3) with the same transformation matrix to the test frame coordinate system (Fig 2.).

Chapter 5
98
Fig. 2. Height of the inner and outer surface of the sole horn layer and plantar surface of the distal phalanx above the floor in cross sections of the lateral digit of an example leg for 2 loading conditions. Solid lines represent the surfaces in minimally loaded condition, dashed lines represent the surfaces in 35% BW loaded condition. Blue lines indicate the location of the orthogonal cross sections.
2.3 Load induced deformations in the clawsThe 3D positions of all bones and horn structures were determined for all loading conditions. Using custom made MatLab routines, we compared these positions with the minimally loaded reference geometry to determine movements and deformations in the limb. Rotation matrices and translation vectors were calculated for axial and abaxial wall areas, soles and phalanges of the lateral and medial digits according to Söderkvist and Wedin (1993). Changes of the angles of the coffin and pastern joints relative to the minimally loaded reference geometry were calculated for the loading sequences 3, 7, 11 and 14 (see Table 1). For the pastern joint, the movement of the proximal phalanx relative to the middle phalanx was calculated; for the coffin joint, the movement of the middle phalanx relative to the distal phalanx was calculated. In addition, the orientation of the helical axes for these joints were calculated according to Spoor and Veldpaus (1980). We calculated the thickness of the sole horn layer for every mm2 of the surface area as the average vertical distance between the inner and outer sole horn surfaces in the CT-scan. It was assumed that the sole horn would minimally compress and its thickness would not be affected by loading regime. It was also assumed that the sole area would not deform until the outer surface contacted the carbon fibre plate on which the claws were standing (Fig. 2).For each loading condition, the thickness of the soft tissue layer under the distal phalanx was calculated per 1 mm2 as the average vertical distance between the inner sole horn surface and the plantar surface of the distal phalanx. The orientation of the latter surface was obtained by displacing it with the transformation parameters obtained for the distal phalanx. The sole horn surfaces were displaced with parameters calculated for the combination of axial and abaxial wall markers.Change in the thickness of the soft tissue layer is expressed as a percentage of the original thickness and was calculated for every 1 mm2 of the surfaces with the following formula:
Spatial distribution
99
𝑆𝑆𝑆𝑆𝑖𝑖𝑖𝑖 = 100 × (𝑑𝑑𝑑𝑑𝑖𝑖𝑖𝑖 − 𝑑𝑑𝑑𝑑0)
𝑑𝑑𝑑𝑑0
Where 𝑆𝑆𝑆𝑆𝑖𝑖𝑖𝑖 is the percentage with which the layer thickness has changed for loading condition i (1 = 1 – 14), 𝑑𝑑𝑑𝑑𝑖𝑖𝑖𝑖 is the soft tissue layer thickness for loading condition i and 𝑑𝑑𝑑𝑑0 is the soft tissue layer thickness for the minimally loaded state. Negative values for 𝑆𝑆𝑆𝑆𝑖𝑖𝑖𝑖 indicate tissue compression. For each toe, we estimated the contact area of the sole with the carbon fibre plate for each loading condition. It was assumed that the sole made contact with the floor when the calculated distance between the rotated sole surface and the floor was equal or less than 0. We took into account the deflection of the carbon fibre plate that was measured during tests with an artificial leg, which was estimated to be 0.2 mm at 10% body weight (BW) load, 0.4 mm at 20% BW load and 0.8 mm at 35% BW load. For the interpretation of the results data of all limbs were combined. For this, we mirrored the data from left claws so they had the same orientation as right claws. All data were scaled such that each digit had the same relative length and width (see paragraph 3 SI).
3 RESULTSFrom the total of 20 legs tested, data from one leg were excluded because a rupture occurred in the m. flexor digitalis profundus during loading. Data from two other legs were excluded because of a failure of the fixation of the patella. Data from 2 other legs were excluded because during storage they deformed in an abnormal way with overextension of the hock and overflexion of the more distal joints as also seen in animals with peroneal paralysis (Dyce et al., 2010). This left a total of 15 limbs that could be used to determine general morphology and load-induced displacement of markers. Only eight limbs had sufficient markers in the distal phalanx for the analysis of soft tissue deformations in the distal limb. In one of those eight limbs, muscle damage at applying the loading of 35% BW caused failure, and therefore data of the final four loading regimes were not obtained for this limb.We used the minimally loaded condition as our reference condition, but small differences in positions of individual markers between 1 minute and 5 minutes under minimal load were present. We used averages of the coordinates under these two conditions as the reference configuration, assuming this would be more accurate than either set of coordinates alone. The very low mean squared errors in marker distance within bones and hoof wall markers calculated for the series of loading conditions confirmed that they behave as rigid structures (see paragraph 4 in SI). In a few cases, larger mean squared errors were found in some phalanges, which could all be linked to either poor contrast in the radiograms or to insufficient attachment of the marker to the bone.
3.1 General AnatomyThe total sole area is slightly bigger for the lateral claw than for the medial claw, but the plantar area of the distal phalanx is of equal size in both claws (Table 2). The size of the two

5
Chapter 5
98
Fig. 2. Height of the inner and outer surface of the sole horn layer and plantar surface of the distal phalanx above the floor in cross sections of the lateral digit of an example leg for 2 loading conditions. Solid lines represent the surfaces in minimally loaded condition, dashed lines represent the surfaces in 35% BW loaded condition. Blue lines indicate the location of the orthogonal cross sections.
2.3 Load induced deformations in the clawsThe 3D positions of all bones and horn structures were determined for all loading conditions. Using custom made MatLab routines, we compared these positions with the minimally loaded reference geometry to determine movements and deformations in the limb. Rotation matrices and translation vectors were calculated for axial and abaxial wall areas, soles and phalanges of the lateral and medial digits according to Söderkvist and Wedin (1993). Changes of the angles of the coffin and pastern joints relative to the minimally loaded reference geometry were calculated for the loading sequences 3, 7, 11 and 14 (see Table 1). For the pastern joint, the movement of the proximal phalanx relative to the middle phalanx was calculated; for the coffin joint, the movement of the middle phalanx relative to the distal phalanx was calculated. In addition, the orientation of the helical axes for these joints were calculated according to Spoor and Veldpaus (1980). We calculated the thickness of the sole horn layer for every mm2 of the surface area as the average vertical distance between the inner and outer sole horn surfaces in the CT-scan. It was assumed that the sole horn would minimally compress and its thickness would not be affected by loading regime. It was also assumed that the sole area would not deform until the outer surface contacted the carbon fibre plate on which the claws were standing (Fig. 2).For each loading condition, the thickness of the soft tissue layer under the distal phalanx was calculated per 1 mm2 as the average vertical distance between the inner sole horn surface and the plantar surface of the distal phalanx. The orientation of the latter surface was obtained by displacing it with the transformation parameters obtained for the distal phalanx. The sole horn surfaces were displaced with parameters calculated for the combination of axial and abaxial wall markers.Change in the thickness of the soft tissue layer is expressed as a percentage of the original thickness and was calculated for every 1 mm2 of the surfaces with the following formula:
Spatial distribution
99
𝑆𝑆𝑆𝑆𝑖𝑖𝑖𝑖 = 100 × (𝑑𝑑𝑑𝑑𝑖𝑖𝑖𝑖 − 𝑑𝑑𝑑𝑑0)
𝑑𝑑𝑑𝑑0
Where 𝑆𝑆𝑆𝑆𝑖𝑖𝑖𝑖 is the percentage with which the layer thickness has changed for loading condition i (1 = 1 – 14), 𝑑𝑑𝑑𝑑𝑖𝑖𝑖𝑖 is the soft tissue layer thickness for loading condition i and 𝑑𝑑𝑑𝑑0 is the soft tissue layer thickness for the minimally loaded state. Negative values for 𝑆𝑆𝑆𝑆𝑖𝑖𝑖𝑖 indicate tissue compression. For each toe, we estimated the contact area of the sole with the carbon fibre plate for each loading condition. It was assumed that the sole made contact with the floor when the calculated distance between the rotated sole surface and the floor was equal or less than 0. We took into account the deflection of the carbon fibre plate that was measured during tests with an artificial leg, which was estimated to be 0.2 mm at 10% body weight (BW) load, 0.4 mm at 20% BW load and 0.8 mm at 35% BW load. For the interpretation of the results data of all limbs were combined. For this, we mirrored the data from left claws so they had the same orientation as right claws. All data were scaled such that each digit had the same relative length and width (see paragraph 3 SI).
3 RESULTSFrom the total of 20 legs tested, data from one leg were excluded because a rupture occurred in the m. flexor digitalis profundus during loading. Data from two other legs were excluded because of a failure of the fixation of the patella. Data from 2 other legs were excluded because during storage they deformed in an abnormal way with overextension of the hock and overflexion of the more distal joints as also seen in animals with peroneal paralysis (Dyce et al., 2010). This left a total of 15 limbs that could be used to determine general morphology and load-induced displacement of markers. Only eight limbs had sufficient markers in the distal phalanx for the analysis of soft tissue deformations in the distal limb. In one of those eight limbs, muscle damage at applying the loading of 35% BW caused failure, and therefore data of the final four loading regimes were not obtained for this limb.We used the minimally loaded condition as our reference condition, but small differences in positions of individual markers between 1 minute and 5 minutes under minimal load were present. We used averages of the coordinates under these two conditions as the reference configuration, assuming this would be more accurate than either set of coordinates alone. The very low mean squared errors in marker distance within bones and hoof wall markers calculated for the series of loading conditions confirmed that they behave as rigid structures (see paragraph 4 in SI). In a few cases, larger mean squared errors were found in some phalanges, which could all be linked to either poor contrast in the radiograms or to insufficient attachment of the marker to the bone.
3.1 General AnatomyThe total sole area is slightly bigger for the lateral claw than for the medial claw, but the plantar area of the distal phalanx is of equal size in both claws (Table 2). The size of the two

Chapter 5
100
surfaces is positively correlated within the same claw, between the medial and lateral claw and also between the left and right limb (see paragraph 5 in SI).The thickness of the soft tissue layer under the distal phalanx is about 6.6 mm, and the sole horn layer is slightly thicker at about 8.0 mm (Table 2). There is no significant difference in thickness in either layer between lateral and medial claws. The soft tissue layer is thinnest near the hoof wall with increasing thickness towards the centre (Fig. 3). The sole horn layer is thickest in the bulb area and becomes thinner towards the tip of the claw (Fig. 4). The reduced dataset used for soft tissue analysis differed in none of the four above described anatomical characters significantly from the full dataset (Table 2).
Spatial distribution
101
Tabl
e 2.
Size
of a
nato
mic
al c
hara
cter
s fo
r th
e co
mpl
ete
data
set (
n=15
) and
the
redu
ced
data
set u
sed
for
anal
ysis
of t
he s
oft
tissu
e de
form
atio
n (n
=8)
. Sig
nific
ance
of d
iffer
ence
bet
ween
late
ral a
n m
edia
l cla
ws (
Diff
. Lat
eral
-med
ial)
and
betw
een
the
tota
l dat
aset
and
the
redu
ce d
atas
et (D
iff. f
rom
tota
l) we
re d
eter
min
ed w
ith th
e M
ann-
Whi
tney
U te
st.
Late
ral c
law
Med
ial c
law
Diff
. la
tera
l-m
edia
l*M
ean
Min
Max
Mea
nM
inM
ax
Are
aFu
ll D
atas
et (n
= 1
5)
Tota
l sol
e su
rface
cm2
58.9
50.9
77.9
50.2
41.4
62.4
Plan
tar s
urfa
ce o
f dist
al p
hala
nxcm
216
.813
.519
.416
.814
.520
.0p=
N.S
.
Mea
n so
ft tis
sue
laye
r thi
ckne
ssm
m6.
85.
68.
06.
54.
98.
2p=
N.S
.
Mea
n so
le h
orn
thic
knes
sm
m8.
74.
612
.97.
45.
010
.1p=
N.S
.
Redu
ced
Dat
aset
(n =
8)
Tota
l sol
e su
rface
cm2
61.3
52.3
77.9
61.3
52.3
77.9
p<0.
05
Diff
. fro
m to
tal*
p=N
.S.
p=N
.S.
Plan
tar s
urfa
ce o
f dist
al p
hala
nxcm
216
.413
.519
.216
.614
.520
.0p=
N.S
.
Diff
. fro
m to
tal*
p=N
.S.
p=N
.S.
Mea
n so
ft tis
sue
laye
r thi
ckne
ssm
m7.
36.
78.
06.
64.
97.
5p=
N.S
.
Diff
. fro
m to
tal*
p=N
.S.
p=N
.S.
Mea
n so
le h
orn
thic
knes
sm
m8.
74.
611
.27.
25.
010
.1p=
N.S
.
Diff
. fro
m to
tal*
p=N
.S.
p=N
.S.
*M
ann-
Whi
tney
U te
st

5
Chapter 5
100
surfaces is positively correlated within the same claw, between the medial and lateral claw and also between the left and right limb (see paragraph 5 in SI).The thickness of the soft tissue layer under the distal phalanx is about 6.6 mm, and the sole horn layer is slightly thicker at about 8.0 mm (Table 2). There is no significant difference in thickness in either layer between lateral and medial claws. The soft tissue layer is thinnest near the hoof wall with increasing thickness towards the centre (Fig. 3). The sole horn layer is thickest in the bulb area and becomes thinner towards the tip of the claw (Fig. 4). The reduced dataset used for soft tissue analysis differed in none of the four above described anatomical characters significantly from the full dataset (Table 2).
Spatial distribution
101
Tabl
e 2.
Size
of a
nato
mic
al c
hara
cter
s fo
r th
e co
mpl
ete
data
set (
n=15
) and
the
redu
ced
data
set u
sed
for
anal
ysis
of t
he s
oft
tissu
e de
form
atio
n (n
=8)
. Sig
nific
ance
of d
iffer
ence
bet
ween
late
ral a
n m
edia
l cla
ws (
Diff
. Lat
eral
-med
ial)
and
betw
een
the
tota
l dat
aset
and
the
redu
ce d
atas
et (D
iff. f
rom
tota
l) we
re d
eter
min
ed w
ith th
e M
ann-
Whi
tney
U te
st.
Late
ral c
law
Med
ial c
law
Diff
. la
tera
l-m
edia
l*M
ean
Min
Max
Mea
nM
inM
ax
Are
aFu
ll D
atas
et (n
= 1
5)
Tota
l sol
e su
rface
cm2
58.9
50.9
77.9
50.2
41.4
62.4
Plan
tar s
urfa
ce o
f dist
al p
hala
nxcm
216
.813
.519
.416
.814
.520
.0p=
N.S
.
Mea
n so
ft tis
sue
laye
r thi
ckne
ssm
m6.
85.
68.
06.
54.
98.
2p=
N.S
.
Mea
n so
le h
orn
thic
knes
sm
m8.
74.
612
.97.
45.
010
.1p=
N.S
.
Redu
ced
Dat
aset
(n =
8)
Tota
l sol
e su
rface
cm2
61.3
52.3
77.9
61.3
52.3
77.9
p<0.
05
Diff
. fro
m to
tal*
p=N
.S.
p=N
.S.
Plan
tar s
urfa
ce o
f dist
al p
hala
nxcm
216
.413
.519
.216
.614
.520
.0p=
N.S
.
Diff
. fro
m to
tal*
p=N
.S.
p=N
.S.
Mea
n so
ft tis
sue
laye
r thi
ckne
ssm
m7.
36.
78.
06.
64.
97.
5p=
N.S
.
Diff
. fro
m to
tal*
p=N
.S.
p=N
.S.
Mea
n so
le h
orn
thic
knes
sm
m8.
74.
611
.27.
25.
010
.1p=
N.S
.
Diff
. fro
m to
tal*
p=N
.S.
p=N
.S.
*M
ann-
Whi
tney
U te
st

Chapter 5
102
Fig. 3. Contour plots of the thickness of the soft tissue layer under the distal phalanges (in mm) under the minimally loaded condition for (a) an example claw, (b) the overall average (n=8), and (c) its standard deviation. Peripheral solid curves indicate the outer edge of the horn shoes. Lateral digits are shown at the top, medial digits are in the bottom of the pictures. Colour bars relate colour and thickness. Difference between contours is 1 mm for the average claw and the example claw and 0.5 mm for the standard deviation.
Fig. 4. Thickness of the sole horn layer under the distal phalanges (in mm) for (a) an example claw, (b) the overall average (n=8), and (c) its standard deviation. Peripheral solid curves indicate the outer edge of the horn shoes. Lateral digits are shown at the top, medial digits are in the bottom of the pictures. Colour bars relate colour and thickness. Difference between contours is 1 mm for the example and the average claw and 0.5 mm for the standard deviation.
3.2 Loading Most of the loading resulted in vertical forces, but also some small horizontal forces were detected (Table 3). With an increase in loading both the pastern and coffin joints showed increased overextension in a very similar way, with almost equal changes in joint angle (Fig. 5). Particularly the lateral coffin joint showed large changes, with large variation between individual limbs. Because the error analysis (see paragraph 4 in SI) revealed that only the orientation of the joint rotation axes for large transformations could be determined accurately, we only present data based on the transition from 10% BW loading to maximal loading (Table 4). In the horizontal plane, we see that the toes spread as expected.
Spatial distribution
103
Table 3. Reaction forces (Average ± SD) during the different loading regimes.
Load applied (n = 15)
Direction of force Minimal 10% BW 20% BW 35% BW
Medio-lateral1 6 ± 4 N 12 ± 6 N 13 ± 10 N 3 ± 22 N
Posterior-anterior2 8 ± 12 N 10 ± 18 N 13 ± 24 N 20 ± 32 N
Vertical3 305 ± 22 N 562 ± 48 N 1104 ± 121 N 1914 ± 191 N1 Positive values indicate force in medial direction2 Positive values indicate force in anterior direction3 Positive values indicate force in the downward direction
Table 4. Orientation of the helical axes for deformations from 10% BW loads to 35% BW loads. Orientations and observed range are expressed as the median orientation angle in the surface plane (azimuth angle, φ) and median elevation angle relative to the surface plane (elevation angle, θ), both in degrees. In both cases, the range of values is indicated. An azimuth of 0 degrees points lateral, 90 degrees points in the cranial direction.
Azimuth angle Elevation angle
(rotation in surface plane)(rotation relative to surface
plane)
Joint ClawMedian(n=7) Min Max
Median(n=7) Min Max
PasternLateral -2.4 -46.1 57.7 12.2 -2.3 41.6
Medial 8.2 -4.5 50.3 -21.7 -42.9 -13.0
CoffinLateral 0.6 -45.7 15.6 -35.2 -86.2 -20.4
Medial 14.4 -17.8 54.4 28.8 12.9 47.7
In concert with the increase in joint angle, the toes started to spread, mainly because of movement of the medial toe in medial direction (Fig. 6). There was, however, substantial variation in the amount of spreading between limbs. On average there was no displacement along the posterior-anterior axis of the digits (see paragraph 6 Fig S5 in SI).

5
Chapter 5
102
Fig. 3. Contour plots of the thickness of the soft tissue layer under the distal phalanges (in mm) under the minimally loaded condition for (a) an example claw, (b) the overall average (n=8), and (c) its standard deviation. Peripheral solid curves indicate the outer edge of the horn shoes. Lateral digits are shown at the top, medial digits are in the bottom of the pictures. Colour bars relate colour and thickness. Difference between contours is 1 mm for the average claw and the example claw and 0.5 mm for the standard deviation.
Fig. 4. Thickness of the sole horn layer under the distal phalanges (in mm) for (a) an example claw, (b) the overall average (n=8), and (c) its standard deviation. Peripheral solid curves indicate the outer edge of the horn shoes. Lateral digits are shown at the top, medial digits are in the bottom of the pictures. Colour bars relate colour and thickness. Difference between contours is 1 mm for the example and the average claw and 0.5 mm for the standard deviation.
3.2 Loading Most of the loading resulted in vertical forces, but also some small horizontal forces were detected (Table 3). With an increase in loading both the pastern and coffin joints showed increased overextension in a very similar way, with almost equal changes in joint angle (Fig. 5). Particularly the lateral coffin joint showed large changes, with large variation between individual limbs. Because the error analysis (see paragraph 4 in SI) revealed that only the orientation of the joint rotation axes for large transformations could be determined accurately, we only present data based on the transition from 10% BW loading to maximal loading (Table 4). In the horizontal plane, we see that the toes spread as expected.
Spatial distribution
103
Table 3. Reaction forces (Average ± SD) during the different loading regimes.
Load applied (n = 15)
Direction of force Minimal 10% BW 20% BW 35% BW
Medio-lateral1 6 ± 4 N 12 ± 6 N 13 ± 10 N 3 ± 22 N
Posterior-anterior2 8 ± 12 N 10 ± 18 N 13 ± 24 N 20 ± 32 N
Vertical3 305 ± 22 N 562 ± 48 N 1104 ± 121 N 1914 ± 191 N1 Positive values indicate force in medial direction2 Positive values indicate force in anterior direction3 Positive values indicate force in the downward direction
Table 4. Orientation of the helical axes for deformations from 10% BW loads to 35% BW loads. Orientations and observed range are expressed as the median orientation angle in the surface plane (azimuth angle, φ) and median elevation angle relative to the surface plane (elevation angle, θ), both in degrees. In both cases, the range of values is indicated. An azimuth of 0 degrees points lateral, 90 degrees points in the cranial direction.
Azimuth angle Elevation angle
(rotation in surface plane)(rotation relative to surface
plane)
Joint ClawMedian(n=7) Min Max
Median(n=7) Min Max
PasternLateral -2.4 -46.1 57.7 12.2 -2.3 41.6
Medial 8.2 -4.5 50.3 -21.7 -42.9 -13.0
CoffinLateral 0.6 -45.7 15.6 -35.2 -86.2 -20.4
Medial 14.4 -17.8 54.4 28.8 12.9 47.7
In concert with the increase in joint angle, the toes started to spread, mainly because of movement of the medial toe in medial direction (Fig. 6). There was, however, substantial variation in the amount of spreading between limbs. On average there was no displacement along the posterior-anterior axis of the digits (see paragraph 6 Fig S5 in SI).
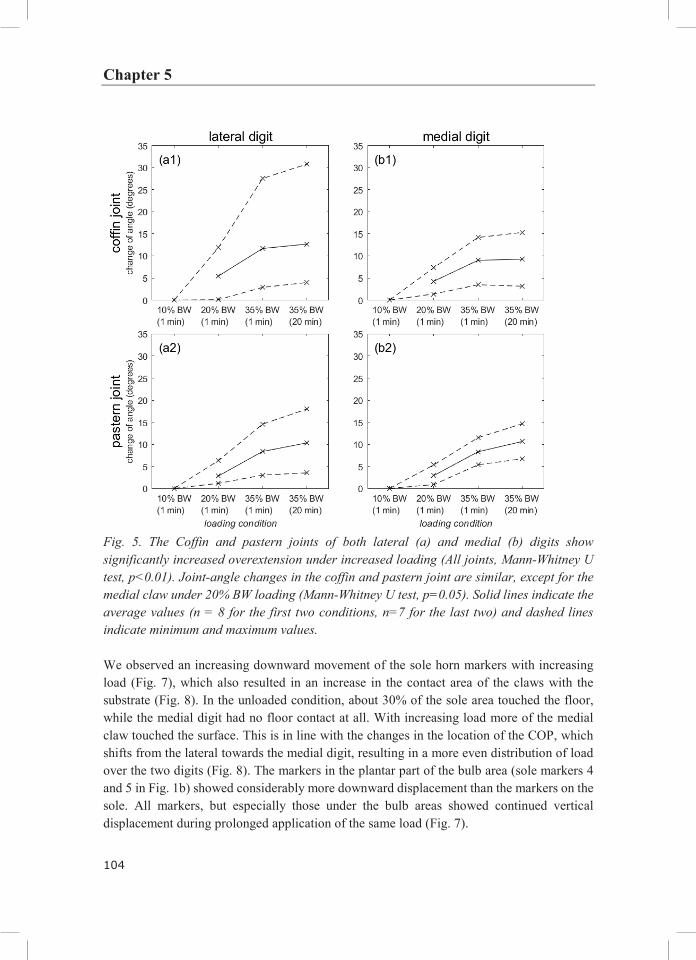
Chapter 5
104
Fig. 5. The Coffin and pastern joints of both lateral (a) and medial (b) digits show significantly increased overextension under increased loading (All joints, Mann-Whitney U test, p<0.01). Joint-angle changes in the coffin and pastern joint are similar, except for the medial claw under 20% BW loading (Mann-Whitney U test, p=0.05). Solid lines indicate the average values (n = 8 for the first two conditions, n=7 for the last two) and dashed lines indicate minimum and maximum values.
We observed an increasing downward movement of the sole horn markers with increasing load (Fig. 7), which also resulted in an increase in the contact area of the claws with the substrate (Fig. 8). In the unloaded condition, about 30% of the sole area touched the floor, while the medial digit had no floor contact at all. With increasing load more of the medial claw touched the surface. This is in line with the changes in the location of the COP, which shifts from the lateral towards the medial digit, resulting in a more even distribution of load over the two digits (Fig. 8). The markers in the plantar part of the bulb area (sole markers 4 and 5 in Fig. 1b) showed considerably more downward displacement than the markers on the sole. All markers, but especially those under the bulb areas showed continued vertical displacement during prolonged application of the same load (Fig. 7).
Spatial distribution
105
Fig. 6. Displacement of sole horn markers along medio-lateral axis (average + SD, n=15) from position in minimally loaded condition (positive value indicates shift in medial direction) for sole horn markers under the distal phalanx.
Fig. 7. Downward displacement (average + SD, n=15) for sole horn markers (“P3” refers to markers located under the distal phalanx (1 and 2 in Fig. 1b) and “bulb” refers to markers located in the bulb area of the sole (4 and 5 in Fig. 1b)).

5
Chapter 5
104
Fig. 5. The Coffin and pastern joints of both lateral (a) and medial (b) digits show significantly increased overextension under increased loading (All joints, Mann-Whitney U test, p<0.01). Joint-angle changes in the coffin and pastern joint are similar, except for the medial claw under 20% BW loading (Mann-Whitney U test, p=0.05). Solid lines indicate the average values (n = 8 for the first two conditions, n=7 for the last two) and dashed lines indicate minimum and maximum values.
We observed an increasing downward movement of the sole horn markers with increasing load (Fig. 7), which also resulted in an increase in the contact area of the claws with the substrate (Fig. 8). In the unloaded condition, about 30% of the sole area touched the floor, while the medial digit had no floor contact at all. With increasing load more of the medial claw touched the surface. This is in line with the changes in the location of the COP, which shifts from the lateral towards the medial digit, resulting in a more even distribution of load over the two digits (Fig. 8). The markers in the plantar part of the bulb area (sole markers 4 and 5 in Fig. 1b) showed considerably more downward displacement than the markers on the sole. All markers, but especially those under the bulb areas showed continued vertical displacement during prolonged application of the same load (Fig. 7).
Spatial distribution
105
Fig. 6. Displacement of sole horn markers along medio-lateral axis (average + SD, n=15) from position in minimally loaded condition (positive value indicates shift in medial direction) for sole horn markers under the distal phalanx.
Fig. 7. Downward displacement (average + SD, n=15) for sole horn markers (“P3” refers to markers located under the distal phalanx (1 and 2 in Fig. 1b) and “bulb” refers to markers located in the bulb area of the sole (4 and 5 in Fig. 1b)).

Chapter 5
106
Fig. 8. Increased loading results in an increased contact with the floor, and a more medial positioned centre of pressure. Contour plots of the distance between the horn and the floor for column a: an example claw, column b: overall average (b1, b2 n=8; b3, b4 n=7) and column c: its standard deviations. Row 1 represents minimal load, row 2 represents 10% BW load for 1 min, row 3 represents 1 min under 20% BW load for 1 min and row 4 represents 35% BW load for 1 min. Lateral digits are shown at the top, medial digits are in the bottom of the pictures. Colour bars relate colour and height. Difference between contours is 1 mm in columns 1 and 2 and 0.5 mm in column 3. The red dot indicates average COP at minimal loading conditions, the green dot indicates the average COP for the specific loaded condition.
Spatial distribution
107
Deformation of the soft tissue layer in between the distal phalanx and the sole horn progressed with increasing load (Fig. 9). At loads of 20% BW, the compressions in the soft tissue layer were up to 30% of the initial thickness and even increased to 40% under thehighest load condition. It is clear that maximum deformation in the soft tissue layer mainly occurred in the area near the caudal end of the distal phalanx, while relative compressions at the tip were considerably smaller (0–5%). This pattern was similar in all legs, although considerable variation in strain was observed towards the bulb area.
Fig. 9. Increased loading results in increased deformation of the soft tissue layer. Contour plots of deformation (in % of the initial layer thickness) of the soft tissue layer under the distal phalanges in the different loading conditions for column a: an example claw, column b: overall average (b1, b2 n=8; b3 n=7) and column c: its standard deviations. Row 1 represents 10% BW load for 1 min, row 2 represents 1 min under 20% BW load for 1 min and row 3 represents 35% BW load for 1 min. Lateral digits are shown at the top, medial digits are in the bottom of the pictures. Colour bars relate colour and height. Difference between contours is 1% in column 1 and 2 and 0.5% in column 3.

5
Chapter 5
106
Fig. 8. Increased loading results in an increased contact with the floor, and a more medial positioned centre of pressure. Contour plots of the distance between the horn and the floor for column a: an example claw, column b: overall average (b1, b2 n=8; b3, b4 n=7) and column c: its standard deviations. Row 1 represents minimal load, row 2 represents 10% BW load for 1 min, row 3 represents 1 min under 20% BW load for 1 min and row 4 represents 35% BW load for 1 min. Lateral digits are shown at the top, medial digits are in the bottom of the pictures. Colour bars relate colour and height. Difference between contours is 1 mm in columns 1 and 2 and 0.5 mm in column 3. The red dot indicates average COP at minimal loading conditions, the green dot indicates the average COP for the specific loaded condition.
Spatial distribution
107
Deformation of the soft tissue layer in between the distal phalanx and the sole horn progressed with increasing load (Fig. 9). At loads of 20% BW, the compressions in the soft tissue layer were up to 30% of the initial thickness and even increased to 40% under thehighest load condition. It is clear that maximum deformation in the soft tissue layer mainly occurred in the area near the caudal end of the distal phalanx, while relative compressions at the tip were considerably smaller (0–5%). This pattern was similar in all legs, although considerable variation in strain was observed towards the bulb area.
Fig. 9. Increased loading results in increased deformation of the soft tissue layer. Contour plots of deformation (in % of the initial layer thickness) of the soft tissue layer under the distal phalanges in the different loading conditions for column a: an example claw, column b: overall average (b1, b2 n=8; b3 n=7) and column c: its standard deviations. Row 1 represents 10% BW load for 1 min, row 2 represents 1 min under 20% BW load for 1 min and row 3 represents 35% BW load for 1 min. Lateral digits are shown at the top, medial digits are in the bottom of the pictures. Colour bars relate colour and height. Difference between contours is 1% in column 1 and 2 and 0.5% in column 3.

Chapter 5
108
4 DISCUSSIONUsing a combination of roentgen stereophotogrammetry and CT-scan data, we estimated the spatial deformations in the lower hind limbs of cattle under natural loading regimes. The horn shoe (except for the sole) and bones showed almost no deformation, indicating that these are effectively rigid structures under these conditions. Franck et al. (2006) showed that claw wall horn is deformable when loaded with up to 500 N, but in their study only small isolated pieces of horn were tested that may behave differently than complete biological structures. Moreover, the accuracy of our method was insufficient to detect very small deformations within the horn.
4.1 AnatomyLateral claws on average had 17–18% larger sole surfaces than medial claws, as was previously described by (Nuss, 2014), while the plantar surfaces of the distal phalanges were equally large. This might indicate that forces on the limbs result in smaller local stresses in the lateral sole than in the medial sole. The fact that bone diameters scale isometrically with body weight (Scott, 1985), and total sole area is correlated with the plantar surface of the distal phalanx, might indicate that claw area scales in a similar fashion to body weight. We did not observe any differences between lateral and medial claws in the thickness of either the soft tissue layer or the sole horn layer. This contradicts results obtained by Van Amstel et al. (2004), who did report a difference in the thickness of the soft layer. An obvious reason can be that we measured the whole area under the distal phalanx, while they measured at the tip only. The thickness of the sole we determined at the tip is very similar to values found in the previous study. It must be noted that the thickness of the sole area is affected by trimming (Ouweltjes et al., 2009), and that both trimming and differences in wear can have contributed to the variation in sole horn thickness.
4.2 LoadingIncreased loading caused a number of changes in the configuration of the distal limbs. We saw increased overextension of the joints in the distal limb, increased floor contact and occurrence of large deformations in the soft tissue layer underneath the distal phalanx. The accuracy of our measurement is highly dependent on the accuracy of the reconstruction of the 3D coordinates of the markers involved. Overall the average mean square errors were below 0.025 mm, indicating a high precision, even though reconstruction was sometimes difficult, especially where we encountered low contrast between markers and bone. This might be improved by using larger markers that provide more contrast in those areas. The increased floor contact can only be explained by downward movement of the sole, since the horn wall is, as mentioned before, non-compressible and much stiffer than sole horn (Franck et al. (2006). Where the sole touches the ground, we see compression of the soft tissue layer as the distal phalanx is pressed down under loading. The almost equal tissue strain
Spatial distribution
109
in the medial and lateral claws we observed from loadings of 20% BW and more were not expected as previous studies showed that both in walking and stance the lateral hind claws exert more pressure on the substrate than the medial ones, even when higher ground reaction forces were measured than in this study (Van der Tol et al., 2002, 2003). This might, again, be only an effect of claw trimming.Most importantly, under all loading conditions the highest levels of strain in the soft tissue layer occurred in the zone 4 (Fig. 10), an area described as the “typical place for a sole ulcer” (Van Amstel and Shearer, 2006), and frequently affected by sole haemorrhages (Solano et al., 2016). This overlap suggests a causal connection between high strains and the development of pathologies. The amount of strain is considerable, especially under high loads where it reaches a level of 30% compression within one minute after application of the load. These load levels are an order of magnitude higher than the 2.4% estimated on the basis of finite element modelling (Hinterhofer et al., 2009), which shows that much more research isnecessary to establish reliable models, most probably in the area of material properties and the distribution of the soft tissues in the distal bovine claw.
Fig. 10. Correlation between high strains and zones used for claw health scoring. Zone 4 is the typical zone where sole ulcers occur. The contour plot shows strain distribution for the average claw loaded with 35% BW after 20 minutes. The colour bar indicates the relative strain. Difference between contours is 1%.
Since prolonged steady loading results in increased ventral displacement of the sole, even at 10% BW load level (Fig. 6), it can be assumed that this will increase the soft tissue strain even further. This might indicate that standing for long periods of time, particularly on hard substrates, is maleficent for general claw health (Vermunt and Greenough, 1994). Even on soft surfaces, where load can be distributed over larger areas, claw health could be impaired by long standing bouts if strain in the soft tissue layer occurs.Although the location of the strains is accurate, it must be mentioned that for the calculation of the strain in the soft tissue layer we assumed that the thickness of the sole horn was

5
Chapter 5
108
4 DISCUSSIONUsing a combination of roentgen stereophotogrammetry and CT-scan data, we estimated the spatial deformations in the lower hind limbs of cattle under natural loading regimes. The horn shoe (except for the sole) and bones showed almost no deformation, indicating that these are effectively rigid structures under these conditions. Franck et al. (2006) showed that claw wall horn is deformable when loaded with up to 500 N, but in their study only small isolated pieces of horn were tested that may behave differently than complete biological structures. Moreover, the accuracy of our method was insufficient to detect very small deformations within the horn.
4.1 AnatomyLateral claws on average had 17–18% larger sole surfaces than medial claws, as was previously described by (Nuss, 2014), while the plantar surfaces of the distal phalanges were equally large. This might indicate that forces on the limbs result in smaller local stresses in the lateral sole than in the medial sole. The fact that bone diameters scale isometrically with body weight (Scott, 1985), and total sole area is correlated with the plantar surface of the distal phalanx, might indicate that claw area scales in a similar fashion to body weight. We did not observe any differences between lateral and medial claws in the thickness of either the soft tissue layer or the sole horn layer. This contradicts results obtained by Van Amstel et al. (2004), who did report a difference in the thickness of the soft layer. An obvious reason can be that we measured the whole area under the distal phalanx, while they measured at the tip only. The thickness of the sole we determined at the tip is very similar to values found in the previous study. It must be noted that the thickness of the sole area is affected by trimming (Ouweltjes et al., 2009), and that both trimming and differences in wear can have contributed to the variation in sole horn thickness.
4.2 LoadingIncreased loading caused a number of changes in the configuration of the distal limbs. We saw increased overextension of the joints in the distal limb, increased floor contact and occurrence of large deformations in the soft tissue layer underneath the distal phalanx. The accuracy of our measurement is highly dependent on the accuracy of the reconstruction of the 3D coordinates of the markers involved. Overall the average mean square errors were below 0.025 mm, indicating a high precision, even though reconstruction was sometimes difficult, especially where we encountered low contrast between markers and bone. This might be improved by using larger markers that provide more contrast in those areas. The increased floor contact can only be explained by downward movement of the sole, since the horn wall is, as mentioned before, non-compressible and much stiffer than sole horn (Franck et al. (2006). Where the sole touches the ground, we see compression of the soft tissue layer as the distal phalanx is pressed down under loading. The almost equal tissue strain
Spatial distribution
109
in the medial and lateral claws we observed from loadings of 20% BW and more were not expected as previous studies showed that both in walking and stance the lateral hind claws exert more pressure on the substrate than the medial ones, even when higher ground reaction forces were measured than in this study (Van der Tol et al., 2002, 2003). This might, again, be only an effect of claw trimming.Most importantly, under all loading conditions the highest levels of strain in the soft tissue layer occurred in the zone 4 (Fig. 10), an area described as the “typical place for a sole ulcer” (Van Amstel and Shearer, 2006), and frequently affected by sole haemorrhages (Solano et al., 2016). This overlap suggests a causal connection between high strains and the development of pathologies. The amount of strain is considerable, especially under high loads where it reaches a level of 30% compression within one minute after application of the load. These load levels are an order of magnitude higher than the 2.4% estimated on the basis of finite element modelling (Hinterhofer et al., 2009), which shows that much more research isnecessary to establish reliable models, most probably in the area of material properties and the distribution of the soft tissues in the distal bovine claw.
Fig. 10. Correlation between high strains and zones used for claw health scoring. Zone 4 is the typical zone where sole ulcers occur. The contour plot shows strain distribution for the average claw loaded with 35% BW after 20 minutes. The colour bar indicates the relative strain. Difference between contours is 1%.
Since prolonged steady loading results in increased ventral displacement of the sole, even at 10% BW load level (Fig. 6), it can be assumed that this will increase the soft tissue strain even further. This might indicate that standing for long periods of time, particularly on hard substrates, is maleficent for general claw health (Vermunt and Greenough, 1994). Even on soft surfaces, where load can be distributed over larger areas, claw health could be impaired by long standing bouts if strain in the soft tissue layer occurs.Although the location of the strains is accurate, it must be mentioned that for the calculation of the strain in the soft tissue layer we assumed that the thickness of the sole horn was

Chapter 5
110
constant. Although this assumption seems reasonable, the strain of the soft tissue layer could be slightly overestimated if there would also be compression in the sole horn layer. In liveanimals, strains might also differ from our estimations due to the lack of cushioning by haemal systems in the soft tissue of our test limbs. Under normal housing conditions softening of horn due to moisture can also play a role (Borderas et al., 2004). If the wall horn is softer and can deform, it is expected to result in increased vertical strain in the soft tissue layer between the sole and the distal phalanx.
5 CONCLUSIONOur study shows that load can induce considerable strain in soft tissue in the area known as the typical place for sole ulcers. Most of the strain of the soft tissue occurred where the sole touched the substrate. Prolonged loading increases strain even under low load levels. If strain in soft tissue indeed links to the occurrence of sole ulcers and haemorrhages in dairy cattle, the following actions could reduce the prevalence of claw disorders. Claw trimming should be aimed at reducing the contact area between the sole and the surface, and prolonged or heavy loading of the claws should be avoided by providing soft substrates and sufficient and adequate lying facilities.
6 CONFLICT OF INTEREST STATEMENTThe authors declare no conflict of interest.
7 ACKNOWLEDGEMENTSWe are indebted to Joost Holthof, George Voorhout, Henk van Dijk, Louis van den Boom and Arend Schot (Veterinary Faculty, University of Utrecht) for their cooperation and assistance with the in vitro experiments, Erik Karruppannan and Evert Janssen (R&D workshop, Wageningen University), and to Bart Kaptein (Biomechanics and Imaging Group, Leiden University) for assistance with using the MBRSA software. The work was funded by the former Dutch Ministry of Agriculture, Nature and Food Quality (LNV), research program Animal Welfare (KB-08-001-006).
Spatial distribution
111
REFERENCESAlsaaod, M., Huber, S., Beer, G., Kohler, P., Schüpbach-Regula, G., Steiner, A., 2017.
Locomotion characteristics of dairy cows walking on pasture and the effect of artificial flooring systems on locomotion comfort. Journal of Dairy Science 100, 8330-8337.
Arnott, G., Ferris, C., O’Connell, N., 2017. welfare of dairy cows in continuously housed and pasture-based production systems. animal 11, 261-273.
Boettcher, H.S., Knudsen, J.C., Andersen, P.H., Danscher, A.M., 2014. Technical note: Effects of frozen storage on the mechanical properties of the suspensory tissue in the bovine claw. Journal of Dairy Science 97, 2969-2973.
Borderas, T.F., Pawluczuk, B., de Passille, A.M., Rushen, J., 2004. Claw hardness of dairy cows: Relationship to water content and claw lesions. Journal of Dairy Science 87, 2085-2093.
Bruijnis, M.R.N., Hogeveen, H., Stassen, E.N., 2010. Assessing economic consequences of foot disorders in dairy cattle using a dynamic stochastic simulation model. J. Dairy Sci. 93, 2419-2432.
Dohme-Meier, F., Kaufmann, L.D., Görs, S., Junghans, P., Metges, C.C., van Dorland, H.A., Bruckmaier, R.M., Münger, A., 2014. Comparison of energy expenditure, eating pattern and physical activity of grazing and zero-grazing dairy cows at different time points during lactation. Livestock Science 162, 86-96.
Dyce, K.M., Sack, W.O., Wensing, C.J.G., 2010. Textbook of Veterinary Anatomy fourth edition. Elsevier Health Sciences.
Eicher, S.D., Lay, D.C., Arthington, J.D., Schutz, M.M., 2013. Effects of rubber flooring during the first 2 lactations on production, locomotion, hoof health, immune functions, and stress1. Journal of Dairy Science 96, 3639-3651.
Fjeldaas, T., Sogstad, Å., Østerås, O., 2011. Locomotion and claw disorders in Norwegian dairy cows housed in freestalls with slatted concrete, solid concrete, or solid rubber flooring in the alleys. Journal of dairy science 94, 1243-1255.
Flower, F.C., de Passillé, A.M., Weary, D.M., Sanderson, D.J., Rushen, J., 2007. Softer, Higher-Friction Flooring Improves Gait of Cows With and Without Sole Ulcers. Journal of Dairy Science 90, 1235-1242.
Franck, A., Cocquyt, G., Simoens, P., De Belie, N., 2006. Biomechanical properties of bovine claw horn. Biosystems Engineering 93, 459-467.
Haufe, H.C., Gygax, L., Steiner, B., Friedli, K., Stauffacher, M., Wechsler, B., 2009. Influence of floor type in the walking area of cubicle housing systems on the behaviour of dairy cows. Applied Animal Behaviour Science 116, 21-27.
Haufe, H.C., Gygax, L., Wechsler, B., Stauffacher, M., Friedli, K., 2012. Influence of floor surface and access to pasture on claw health in dairy cows kept in cubicle housing systems. Preventive Veterinary Medicine 105, 85-92.
Hinterhofer, C., Haider, H., Apprich, V., Ferguson, J.C., Collins, S.N., Stanek, C., 2009. Development of a twenty-one-component finite element distal hind limb model: Stress

5
Chapter 5
110
constant. Although this assumption seems reasonable, the strain of the soft tissue layer could be slightly overestimated if there would also be compression in the sole horn layer. In liveanimals, strains might also differ from our estimations due to the lack of cushioning by haemal systems in the soft tissue of our test limbs. Under normal housing conditions softening of horn due to moisture can also play a role (Borderas et al., 2004). If the wall horn is softer and can deform, it is expected to result in increased vertical strain in the soft tissue layer between the sole and the distal phalanx.
5 CONCLUSIONOur study shows that load can induce considerable strain in soft tissue in the area known as the typical place for sole ulcers. Most of the strain of the soft tissue occurred where the sole touched the substrate. Prolonged loading increases strain even under low load levels. If strain in soft tissue indeed links to the occurrence of sole ulcers and haemorrhages in dairy cattle, the following actions could reduce the prevalence of claw disorders. Claw trimming should be aimed at reducing the contact area between the sole and the surface, and prolonged or heavy loading of the claws should be avoided by providing soft substrates and sufficient and adequate lying facilities.
6 CONFLICT OF INTEREST STATEMENTThe authors declare no conflict of interest.
7 ACKNOWLEDGEMENTSWe are indebted to Joost Holthof, George Voorhout, Henk van Dijk, Louis van den Boom and Arend Schot (Veterinary Faculty, University of Utrecht) for their cooperation and assistance with the in vitro experiments, Erik Karruppannan and Evert Janssen (R&D workshop, Wageningen University), and to Bart Kaptein (Biomechanics and Imaging Group, Leiden University) for assistance with using the MBRSA software. The work was funded by the former Dutch Ministry of Agriculture, Nature and Food Quality (LNV), research program Animal Welfare (KB-08-001-006).
Spatial distribution
111
REFERENCESAlsaaod, M., Huber, S., Beer, G., Kohler, P., Schüpbach-Regula, G., Steiner, A., 2017.
Locomotion characteristics of dairy cows walking on pasture and the effect of artificial flooring systems on locomotion comfort. Journal of Dairy Science 100, 8330-8337.
Arnott, G., Ferris, C., O’Connell, N., 2017. welfare of dairy cows in continuously housed and pasture-based production systems. animal 11, 261-273.
Boettcher, H.S., Knudsen, J.C., Andersen, P.H., Danscher, A.M., 2014. Technical note: Effects of frozen storage on the mechanical properties of the suspensory tissue in the bovine claw. Journal of Dairy Science 97, 2969-2973.
Borderas, T.F., Pawluczuk, B., de Passille, A.M., Rushen, J., 2004. Claw hardness of dairy cows: Relationship to water content and claw lesions. Journal of Dairy Science 87, 2085-2093.
Bruijnis, M.R.N., Hogeveen, H., Stassen, E.N., 2010. Assessing economic consequences of foot disorders in dairy cattle using a dynamic stochastic simulation model. J. Dairy Sci. 93, 2419-2432.
Dohme-Meier, F., Kaufmann, L.D., Görs, S., Junghans, P., Metges, C.C., van Dorland, H.A., Bruckmaier, R.M., Münger, A., 2014. Comparison of energy expenditure, eating pattern and physical activity of grazing and zero-grazing dairy cows at different time points during lactation. Livestock Science 162, 86-96.
Dyce, K.M., Sack, W.O., Wensing, C.J.G., 2010. Textbook of Veterinary Anatomy fourth edition. Elsevier Health Sciences.
Eicher, S.D., Lay, D.C., Arthington, J.D., Schutz, M.M., 2013. Effects of rubber flooring during the first 2 lactations on production, locomotion, hoof health, immune functions, and stress1. Journal of Dairy Science 96, 3639-3651.
Fjeldaas, T., Sogstad, Å., Østerås, O., 2011. Locomotion and claw disorders in Norwegian dairy cows housed in freestalls with slatted concrete, solid concrete, or solid rubber flooring in the alleys. Journal of dairy science 94, 1243-1255.
Flower, F.C., de Passillé, A.M., Weary, D.M., Sanderson, D.J., Rushen, J., 2007. Softer, Higher-Friction Flooring Improves Gait of Cows With and Without Sole Ulcers. Journal of Dairy Science 90, 1235-1242.
Franck, A., Cocquyt, G., Simoens, P., De Belie, N., 2006. Biomechanical properties of bovine claw horn. Biosystems Engineering 93, 459-467.
Haufe, H.C., Gygax, L., Steiner, B., Friedli, K., Stauffacher, M., Wechsler, B., 2009. Influence of floor type in the walking area of cubicle housing systems on the behaviour of dairy cows. Applied Animal Behaviour Science 116, 21-27.
Haufe, H.C., Gygax, L., Wechsler, B., Stauffacher, M., Friedli, K., 2012. Influence of floor surface and access to pasture on claw health in dairy cows kept in cubicle housing systems. Preventive Veterinary Medicine 105, 85-92.
Hinterhofer, C., Haider, H., Apprich, V., Ferguson, J.C., Collins, S.N., Stanek, C., 2009. Development of a twenty-one-component finite element distal hind limb model: Stress

Chapter 5
112
and strain in bovine digit structures as a result of loading on different floorings. J. Dairy Sci. 92, 972-979.
Kremer, P., Nueske, S., Scholz, A., Foerster, M., 2007. Comparison of claw health and milk yield in dairy cows on elastic or concrete flooring. Journal of dairy science 90, 4603-4611.
Medis Specials, 2011. Model-based RSA 3.3.2 User Manual. Leiden, the Netherlands.Nuss, K., 2014. The role of biomechanical factors in the development of sole ulcer in dairy
cattle. Cattle Lameness Conference, Worcester. The Dairy Group, Taunton, UK, pp. 1-11.
Olmos, G., Boyle, L., Hanlon, A., Patton, J., Murphy, J.J., Mee, J.F., 2009. Hoof disorders, locomotion ability and lying times of cubicle-housed compared to pasture-based dairy cows. Livestock Science 125, 199-207.
Ouweltjes, W., Gussekloo, S.W.S., Spoor, C.W., van Leeuwen, J.L., 2016. A new technique using roentgen stereophotogrammetry to measure changes in the spatial conformation of bovine hind claws in response to external loads. The Veterinary Journal 208, 81-86.
Ouweltjes, W., Holzhauer, M., Van der Tol, P., Van der Werf, J., 2009. Effects of two trimming methods of dairy cattle on concrete or rubber-covered slatted floors. Journal of Dairy Science 92, 960-971.
Ouweltjes, W., van der Werf, J., Frankena, K., van Leeuwen, J., 2011. Effects of flooring and restricted freestall access on behavior and claw health of dairy heifers. Journal of Dairy Science 94, 705-715.
Scott, K.M., 1985. Allometric trends and locomotor adaptations in the Bovidae. Bulletin of the AMNH; v. 179, article 2.
Solano, L., Barkema, H., Mason, S., Pajor, E., LeBlanc, S., Orsel, K., 2016. Prevalence and distribution of foot lesions in dairy cattle in Alberta, Canada. Journal of dairy science 99, 6828-6841.
Telezhenko, E., Bergsten, C., 2005. Influence of floor type on the locomotion of dairy cows. Applied Animal Behaviour Science 93, 183-197.
Telezhenko, E., Lidfors, L., Bergsten, C., 2007. Dairy cow preferences for soft or hard flooring when standing or walking. Journal of dairy science 90, 3716-3724.
Van Amstel, S., Palin, F., Shearer, J., Cole, F., Mellor, D., Hodgson, D., Reid, S., Onnasch, H., Gunn, H., Bradshaw, B., 2004. Measurement of the thickness of the corium and subcutaneous tissue on the hind claws of dairy cattle by ultrasound. The Veterinary Record 155, 630-633.
Van Amstel, S.R., Shearer, J.K., 2006. Review of pododermatitis circumscripta (ulceration of the sole) in dairy cows. Journal of veterinary internal medicine 20, 805-811.
Van der Tol, P., Metz, J., Noordhuizen-Stassen, E., Back, W., Braam, C., Weijs, W., 2002. The pressure distribution under the bovine claw during square standing on a flat substrate. Journal of Dairy Science 85, 1476-1481.
Van der Tol, P., Metz, J., Noordhuizen-Stassen, E., Back, W., Braam, C., Weijs, W., 2003. The vertical ground reaction force and the pressure distribution on the claws of dairy cows while walking on a flat substrate. Journal of Dairy Science 86, 2875-2883.
Spatial distribution
113
Van der Tol, P.P.J., 2004. Biomechanical aspects of the claw-floor interaction in dairy cattle. Implications for locomotion and claw disorders. PhD thesis, Veterinary Faculty Utrecht University, Utrecht, the Netherlands.
Vermunt, J.J., Greenough, P.R., 1994. Predisposing factors of laminitis in cattle. British Veterinary Journal 150, 151-164.
Volkmann, N., Kemper, N., 2018. Claw condition and claw health in dairy cows: how important is access to pasture? Vet. Rec. 182, 76-78.

5
Chapter 5
112
and strain in bovine digit structures as a result of loading on different floorings. J. Dairy Sci. 92, 972-979.
Kremer, P., Nueske, S., Scholz, A., Foerster, M., 2007. Comparison of claw health and milk yield in dairy cows on elastic or concrete flooring. Journal of dairy science 90, 4603-4611.
Medis Specials, 2011. Model-based RSA 3.3.2 User Manual. Leiden, the Netherlands.Nuss, K., 2014. The role of biomechanical factors in the development of sole ulcer in dairy
cattle. Cattle Lameness Conference, Worcester. The Dairy Group, Taunton, UK, pp. 1-11.
Olmos, G., Boyle, L., Hanlon, A., Patton, J., Murphy, J.J., Mee, J.F., 2009. Hoof disorders, locomotion ability and lying times of cubicle-housed compared to pasture-based dairy cows. Livestock Science 125, 199-207.
Ouweltjes, W., Gussekloo, S.W.S., Spoor, C.W., van Leeuwen, J.L., 2016. A new technique using roentgen stereophotogrammetry to measure changes in the spatial conformation of bovine hind claws in response to external loads. The Veterinary Journal 208, 81-86.
Ouweltjes, W., Holzhauer, M., Van der Tol, P., Van der Werf, J., 2009. Effects of two trimming methods of dairy cattle on concrete or rubber-covered slatted floors. Journal of Dairy Science 92, 960-971.
Ouweltjes, W., van der Werf, J., Frankena, K., van Leeuwen, J., 2011. Effects of flooring and restricted freestall access on behavior and claw health of dairy heifers. Journal of Dairy Science 94, 705-715.
Scott, K.M., 1985. Allometric trends and locomotor adaptations in the Bovidae. Bulletin of the AMNH; v. 179, article 2.
Solano, L., Barkema, H., Mason, S., Pajor, E., LeBlanc, S., Orsel, K., 2016. Prevalence and distribution of foot lesions in dairy cattle in Alberta, Canada. Journal of dairy science 99, 6828-6841.
Telezhenko, E., Bergsten, C., 2005. Influence of floor type on the locomotion of dairy cows. Applied Animal Behaviour Science 93, 183-197.
Telezhenko, E., Lidfors, L., Bergsten, C., 2007. Dairy cow preferences for soft or hard flooring when standing or walking. Journal of dairy science 90, 3716-3724.
Van Amstel, S., Palin, F., Shearer, J., Cole, F., Mellor, D., Hodgson, D., Reid, S., Onnasch, H., Gunn, H., Bradshaw, B., 2004. Measurement of the thickness of the corium and subcutaneous tissue on the hind claws of dairy cattle by ultrasound. The Veterinary Record 155, 630-633.
Van Amstel, S.R., Shearer, J.K., 2006. Review of pododermatitis circumscripta (ulceration of the sole) in dairy cows. Journal of veterinary internal medicine 20, 805-811.
Van der Tol, P., Metz, J., Noordhuizen-Stassen, E., Back, W., Braam, C., Weijs, W., 2002. The pressure distribution under the bovine claw during square standing on a flat substrate. Journal of Dairy Science 85, 1476-1481.
Van der Tol, P., Metz, J., Noordhuizen-Stassen, E., Back, W., Braam, C., Weijs, W., 2003. The vertical ground reaction force and the pressure distribution on the claws of dairy cows while walking on a flat substrate. Journal of Dairy Science 86, 2875-2883.
Spatial distribution
113
Van der Tol, P.P.J., 2004. Biomechanical aspects of the claw-floor interaction in dairy cattle. Implications for locomotion and claw disorders. PhD thesis, Veterinary Faculty Utrecht University, Utrecht, the Netherlands.
Vermunt, J.J., Greenough, P.R., 1994. Predisposing factors of laminitis in cattle. British Veterinary Journal 150, 151-164.
Volkmann, N., Kemper, N., 2018. Claw condition and claw health in dairy cows: how important is access to pasture? Vet. Rec. 182, 76-78.

Chapter 5
114
APPENDIX: SUPPLEMENTARY INFORMATION1 Construction of inner and outer sole surfaces and plantar surfaces
of the distal phalangesCT-scan data were used to obtain grids representing the inner and outer sole surface and the plantar surfaces of the distal phalanges in every 10th image line in anterior-posterior and medio-lateral cross sections. Detection of horn and bone was based on grey values, with horn in the range of 80–95 and bone in the range of 100–150 on a scale of 0–255. We used a three-dimensional spline fit on the 3D coordinates of the obtained boundaries to calculate the surface of the distal phalanx and the inner and outer surface of the sole. Visual inspection of the surfaces (see for example Fig. 2 in the main document) showed good correspondence with the CT-images..The three layers determined in the CT-scans were transferred to the minimally loaded configuration (reference configuration) in the coordinate system of the test frame. The accuracy of the marker localisation in the CT-scans was lower than that from the stereophotogrammetry due to the relatively low resolution of the CT-scan, particularly in the direction along the axis of the limbs. Therefore, we first calculated the transformation from the markers in the test frame to the CT-coordinates based on the axial wall markers, abaxial wall markers, and the combinations thereof (Table S1). We back-transferred the markers of the distal phalanges and soles from the CT information to the test frame coordinate system. Mean squared errors of the distances between the calculated marker positions and observed positions were calculated for all options (Table S1). We also analysed the sole without the bulb area, because that area is less rigid than towards the toes, and some deviations were therefore to be expected.
Table S1. Mean squared errors for markers of the distal phalanx and sole when transferred from CT to the minimally loaded condition in the loading frame.
distal phalanx total solesole without bulb
area
markers*lateral digit
medial digit
lateral digit
medial digit
lateral digit
medial digit
abaxial wall 0.2792 0.1528 0.8738 0.5129 0.3051 0.3339
axial wall 0.3745 0.1976 1.7650 0.6488 0.4694 0.2670
axial + abaxial wall 0.2238 0.1288 0.7809 0.4189 0.2471 0.2445*set of markers used to calculate displacement parameters
Alignment of the CT-scan coordinates to the test frame coordinates was within the 1 mm vertical resolution of the CT-scan for both the distal phalanges and the sole without bulb area (Table S1), but not always for the sole as a whole. This confirmed our hypothesis that the
Spatial distribution
115
bulb area is less rigid than the rest of the sole. The best alignment for all elements was found with the transformation based on displacement parameters calculated for a combination of the axial and abaxial wall. In addition, we used these displacement parameters to transfer the outer sole surfaces obtained from the CT-scans to the reference configuration in the test frame coordinate system. We compared the vertical distance of positions of sole markers 1 and 2(see Fig. 1 in the main document) as determined with MBRSA to the calculated surfaces. These values showed a high correlation (n=58, R2=0.998) and very small overall differences (0.02 +/- 0.05) which also confirmed a good fit. We therefore used the transformation based on both axial and abaxial wall for further analyses.
2 Determination of appropriate settings for surface smoothing parameters
Due to the 1 mm resolution of the CT scans, but also because of poor contrast in some images (particularly between the sole horn layer and the soft tissue layer), the three surfaces as determined in the CT-scans needed to be smoothed before further calculations could be performed. We used Matlab-routine tpaps to smooth the height of the surfaces with thin plate smoothing splines. To determine optimal settings we smoothed the surfaces of one limb with p-values 0.001, 0.01, 0.1, 0.2 and 0.4. Differences between the heights derived from the CT scans and the smoothed values for the outer sole surface ranged from around -3 mm up to around +10 mm, but more than 98% were within 2 mm (Fig. S1). Large positive differences mainly occurred around the edges of the sole. For p-values 0.1 and 0.2 the differences with the distribution for p=0.4 were too small to be visible.
Fig. S1. Distribution of height differences between rough and smoothed outer sole surfaces for different p-values.
We evaluated the fit of the smoothed values for cross sections through the surface, which showed that a p-value of 0.4 was to be preferred, since a p-value of 0.001 resulted in too much smoothing of the relatively rough sole surface (Fig. S2).

5
Chapter 5
114
APPENDIX: SUPPLEMENTARY INFORMATION1 Construction of inner and outer sole surfaces and plantar surfaces
of the distal phalangesCT-scan data were used to obtain grids representing the inner and outer sole surface and the plantar surfaces of the distal phalanges in every 10th image line in anterior-posterior and medio-lateral cross sections. Detection of horn and bone was based on grey values, with horn in the range of 80–95 and bone in the range of 100–150 on a scale of 0–255. We used a three-dimensional spline fit on the 3D coordinates of the obtained boundaries to calculate the surface of the distal phalanx and the inner and outer surface of the sole. Visual inspection of the surfaces (see for example Fig. 2 in the main document) showed good correspondence with the CT-images..The three layers determined in the CT-scans were transferred to the minimally loaded configuration (reference configuration) in the coordinate system of the test frame. The accuracy of the marker localisation in the CT-scans was lower than that from the stereophotogrammetry due to the relatively low resolution of the CT-scan, particularly in the direction along the axis of the limbs. Therefore, we first calculated the transformation from the markers in the test frame to the CT-coordinates based on the axial wall markers, abaxial wall markers, and the combinations thereof (Table S1). We back-transferred the markers of the distal phalanges and soles from the CT information to the test frame coordinate system. Mean squared errors of the distances between the calculated marker positions and observed positions were calculated for all options (Table S1). We also analysed the sole without the bulb area, because that area is less rigid than towards the toes, and some deviations were therefore to be expected.
Table S1. Mean squared errors for markers of the distal phalanx and sole when transferred from CT to the minimally loaded condition in the loading frame.
distal phalanx total solesole without bulb
area
markers*lateral digit
medial digit
lateral digit
medial digit
lateral digit
medial digit
abaxial wall 0.2792 0.1528 0.8738 0.5129 0.3051 0.3339
axial wall 0.3745 0.1976 1.7650 0.6488 0.4694 0.2670
axial + abaxial wall 0.2238 0.1288 0.7809 0.4189 0.2471 0.2445*set of markers used to calculate displacement parameters
Alignment of the CT-scan coordinates to the test frame coordinates was within the 1 mm vertical resolution of the CT-scan for both the distal phalanges and the sole without bulb area (Table S1), but not always for the sole as a whole. This confirmed our hypothesis that the
Spatial distribution
115
bulb area is less rigid than the rest of the sole. The best alignment for all elements was found with the transformation based on displacement parameters calculated for a combination of the axial and abaxial wall. In addition, we used these displacement parameters to transfer the outer sole surfaces obtained from the CT-scans to the reference configuration in the test frame coordinate system. We compared the vertical distance of positions of sole markers 1 and 2(see Fig. 1 in the main document) as determined with MBRSA to the calculated surfaces. These values showed a high correlation (n=58, R2=0.998) and very small overall differences (0.02 +/- 0.05) which also confirmed a good fit. We therefore used the transformation based on both axial and abaxial wall for further analyses.
2 Determination of appropriate settings for surface smoothing parameters
Due to the 1 mm resolution of the CT scans, but also because of poor contrast in some images (particularly between the sole horn layer and the soft tissue layer), the three surfaces as determined in the CT-scans needed to be smoothed before further calculations could be performed. We used Matlab-routine tpaps to smooth the height of the surfaces with thin plate smoothing splines. To determine optimal settings we smoothed the surfaces of one limb with p-values 0.001, 0.01, 0.1, 0.2 and 0.4. Differences between the heights derived from the CT scans and the smoothed values for the outer sole surface ranged from around -3 mm up to around +10 mm, but more than 98% were within 2 mm (Fig. S1). Large positive differences mainly occurred around the edges of the sole. For p-values 0.1 and 0.2 the differences with the distribution for p=0.4 were too small to be visible.
Fig. S1. Distribution of height differences between rough and smoothed outer sole surfaces for different p-values.
We evaluated the fit of the smoothed values for cross sections through the surface, which showed that a p-value of 0.4 was to be preferred, since a p-value of 0.001 resulted in too much smoothing of the relatively rough sole surface (Fig. S2).

Chapter 5
116
Fig. S2. Cross sections showing CT-values and smoothed values for the outer sole surface
In a similar manner, we checked the fit of the different smoothing parameters for the inner sole surface and the plantar surface of the distal phalanges. We concluded that a realistic p-value for the smoothing was 0.4 for the outer sole surface, 0.001 for the inner sole surface, and 0.1 for the plantar surface of the distal phalanx. We compared the results of the calculations of deformations when all surfaces were smoothed with p=0.1 vs. when they were smoothed with the specific p-values for each surface. Smoothing the inner sole surface with a low p-value gave more regular patterns of compression of the soft tissue layer for individual cows, but essentially showed the same overall pattern. Other than that the impact of the smoothing parameters on the results was negligible.
3 Scaling of the clawsFor each claw the length (x-axis or medio-lateral axis) and width (y-axis or anterior-posterior axis) expressed in pixels from the CT-scan were divided in 100 equal segments as follows: 1 – 100: xstandardised = 99* (x-xmin)/(xmax-xmin) +1 and ystandardised = 99* (y-ymin)/(ymax-ymin) +1. In the example (Fig. S3), the x-values ranged from 82 – 138 mm, y-values ranged from 40 –169 mm. Thus, each x-% unit represented 0.5657 mm and each y-% unit represented 1.3030 mm for this digit. For standardised x- and y-values 1 – 100 the minimum and maximum orthogonal coordinates of pixels belonging to the surface (expressed in percentages) were calculated, see Fig. S3b. Some examples:
• For xstandardised = 1 (x=82 mm) y-values ranged from 62 – 79 mm or ystandardised values 17.88 - 30.93. These points are indicated with black x-symbols in Fig S3b.
• For xstandardised = 50 (x=82+49*0.5657=109.72 mm) y-values ranged from 41 – 163 or ystandardised values 1.77 – 95.40. These points are indicated with red x-symbols in Fig. S3b.
• For ystandardised = 10 (y=40+9*1.3030=51.73 mm) x-values ranged from 93 – 134 mm or xstandardised values 18.20 – 92.93. These points are indicated with blue filled o-symbols in Fig S3c.
This procedure was carried out for all claws (separately for lateral and medial digits) for all three surfaces yielding four curves per surface describing the edges.
Spatial distribution
117
Fig. S3. Illustration of procedure used for standardisation of sole layer: a- map of sole surface in xy-plane; b- medio-lateral sole surface edge lines; c- posterior-anterior solesurface edge lines.
From these curves shapes were constructed for each layer of the claw. See the red and black dotted pixels in Fig. S4a for the sole layer of the lateral digit of the example claw. Average values for each of the four surface edge lines for the 15 claws were calculated (see the coloured lines in Fig. S4b) and the area inside these four lines was considered the average shape of each surface. For example, for ystandardised = 30 the average minimal xstandardised was 6.1 (a point on the red line in Fig. S4b), whereas the xstandardised value with ystandardised = 30 was between 2 and 3 (a point on the green line in Fig. S4b). The area that is between the lines for average minimum and average maximum values along the medio-lateral axis is only taken into account in determining the average surface shape if it also falls between the lines for average minimum and average maximum values along the posterior-anterior axis (the dotted area in Fig. S4b). Information from the individual digits was combined based on the relative shapes of the surfaces such as Fig. S4a for the example digit. This implies that some information from the edges of surfaces of individual digits is lost because it falls outside of the average shape. For the example, this is the area indicated with red dots in Fig. S4a. There also can be some parts of the average shape that are not represented in individual claws, indicated for the example as the green dots (Fig. S4a). Although some pixels were excluded, a total of 93-94% of pixels in a surface were used, with a small variation between the different claws. This indicates that the relative shapes of the layers were quite similar and most of the information was retained while integrating the findings.

5
Chapter 5
116
Fig. S2. Cross sections showing CT-values and smoothed values for the outer sole surface
In a similar manner, we checked the fit of the different smoothing parameters for the inner sole surface and the plantar surface of the distal phalanges. We concluded that a realistic p-value for the smoothing was 0.4 for the outer sole surface, 0.001 for the inner sole surface, and 0.1 for the plantar surface of the distal phalanx. We compared the results of the calculations of deformations when all surfaces were smoothed with p=0.1 vs. when they were smoothed with the specific p-values for each surface. Smoothing the inner sole surface with a low p-value gave more regular patterns of compression of the soft tissue layer for individual cows, but essentially showed the same overall pattern. Other than that the impact of the smoothing parameters on the results was negligible.
3 Scaling of the clawsFor each claw the length (x-axis or medio-lateral axis) and width (y-axis or anterior-posterior axis) expressed in pixels from the CT-scan were divided in 100 equal segments as follows: 1 – 100: xstandardised = 99* (x-xmin)/(xmax-xmin) +1 and ystandardised = 99* (y-ymin)/(ymax-ymin) +1. In the example (Fig. S3), the x-values ranged from 82 – 138 mm, y-values ranged from 40 –169 mm. Thus, each x-% unit represented 0.5657 mm and each y-% unit represented 1.3030 mm for this digit. For standardised x- and y-values 1 – 100 the minimum and maximum orthogonal coordinates of pixels belonging to the surface (expressed in percentages) were calculated, see Fig. S3b. Some examples:
• For xstandardised = 1 (x=82 mm) y-values ranged from 62 – 79 mm or ystandardised values 17.88 - 30.93. These points are indicated with black x-symbols in Fig S3b.
• For xstandardised = 50 (x=82+49*0.5657=109.72 mm) y-values ranged from 41 – 163 or ystandardised values 1.77 – 95.40. These points are indicated with red x-symbols in Fig. S3b.
• For ystandardised = 10 (y=40+9*1.3030=51.73 mm) x-values ranged from 93 – 134 mm or xstandardised values 18.20 – 92.93. These points are indicated with blue filled o-symbols in Fig S3c.
This procedure was carried out for all claws (separately for lateral and medial digits) for all three surfaces yielding four curves per surface describing the edges.
Spatial distribution
117
Fig. S3. Illustration of procedure used for standardisation of sole layer: a- map of sole surface in xy-plane; b- medio-lateral sole surface edge lines; c- posterior-anterior solesurface edge lines.
From these curves shapes were constructed for each layer of the claw. See the red and black dotted pixels in Fig. S4a for the sole layer of the lateral digit of the example claw. Average values for each of the four surface edge lines for the 15 claws were calculated (see the coloured lines in Fig. S4b) and the area inside these four lines was considered the average shape of each surface. For example, for ystandardised = 30 the average minimal xstandardised was 6.1 (a point on the red line in Fig. S4b), whereas the xstandardised value with ystandardised = 30 was between 2 and 3 (a point on the green line in Fig. S4b). The area that is between the lines for average minimum and average maximum values along the medio-lateral axis is only taken into account in determining the average surface shape if it also falls between the lines for average minimum and average maximum values along the posterior-anterior axis (the dotted area in Fig. S4b). Information from the individual digits was combined based on the relative shapes of the surfaces such as Fig. S4a for the example digit. This implies that some information from the edges of surfaces of individual digits is lost because it falls outside of the average shape. For the example, this is the area indicated with red dots in Fig. S4a. There also can be some parts of the average shape that are not represented in individual claws, indicated for the example as the green dots (Fig. S4a). Although some pixels were excluded, a total of 93-94% of pixels in a surface were used, with a small variation between the different claws. This indicates that the relative shapes of the layers were quite similar and most of the information was retained while integrating the findings.

Chapter 5
118
Fig. S4. a- Relative shape of sole surface for the lateral digit of the example claw; b- Average relative shape of sole surface of the lateral digit
For each 1 mm2 (equal to 1 pixel) of these standardised surfaces, distances were calculated. For pixels around the edge of the average shape, information was available for only part of the digits, but for most pixels the averages were based on all 15 or 8 legs depending on the parameter.
4 Error analysis of calculated displacement and reorientation of phalanges
The marker positions in the series of X-ray photographs inevitably contain small measurement inaccuracies. The consequence of these inaccuracies is that rotation and translation of marker configurations representing a truly rigid bone from one loading condition to another shows a non-zero mean squared error. These inaccuracies in marker positions could have their impact on the rotation angles and helical axis directions calculated for the phalanx positions. To investigate the impact of these measurement errors, we determined the mean squared error for each phalanx of the 8 limbs that were also used for the calculations of soft tissue strain for all loading conditions. Although the combination of axial and abaxial walls of the horn shoes will not be truly rigid, we have treated these as rigid as well because the mean squared errors calculated for these combinations were of similar size as those of the distal phalanges (Table S2).
Spatial distribution
119
Table S2. Average, minimum and maximum mean squared errors of marker positions of phalanges and combinations of axial and abaxial horn walls (in mm).
lateral digit medial digitelement avg min max avg min maxproximal phalanx 0.0117 0.0038 0.0426 0.0110 0.0037 0.0211middle phalanx 0.0095 0.0016 0.0363 0.0244 0.0016 0.0993distal phalanx 0.0014 0.0009 0.0041 0.0061 0.0009 0.0238axial/abaxial wall 0.0017 0.0010 0.0030 0.0021 0.0012 0.0031
We have determined the relationship between the standard deviation of the marker positions and the mean squared errors of the distances between markers as follows. Standard deviation of marker accuracy for an example bone was varied from 0.01 to 0.5 in steps of 0.1. Both the size and the direction of the error were varied at random. The size of the error was a random sample from a normal distribution with the know standard deviation. For each simulation, 14 replicates were generated to calculate a mean squared error of the distances between markers. The average relationship was determined from the results of 1000 repeated simulations for each standard deviation. The following formula was estimated to calculate a standard deviation from a given mean squared error value by fitting a third order polynomial through the data:
𝜎𝜎𝜎𝜎𝑖𝑖𝑖𝑖𝑚𝑚𝑚𝑚𝑚𝑚𝑚𝑚𝑖𝑖𝑖𝑖𝑚𝑚𝑚𝑚𝑚𝑚𝑚𝑚 = 86.879 ∗ 𝑚𝑚𝑚𝑚𝑠𝑠𝑠𝑠𝑠𝑠𝑠𝑠𝑠𝑠𝑠𝑠𝑠𝑠𝑠𝑠3 − 33.859 ∗ 𝑚𝑚𝑚𝑚𝑠𝑠𝑠𝑠𝑠𝑠𝑠𝑠𝑠𝑠𝑠𝑠𝑠𝑠𝑠𝑠2 + 5.6605 ∗ 𝑚𝑚𝑚𝑚𝑠𝑠𝑠𝑠𝑠𝑠𝑠𝑠𝑠𝑠𝑠𝑠𝑠𝑠𝑠𝑠 + 0.0449
Where 𝜎𝜎𝜎𝜎𝑖𝑖𝑖𝑖𝑚𝑚𝑚𝑚𝑚𝑚𝑚𝑚𝑖𝑖𝑖𝑖𝑚𝑚𝑚𝑚𝑚𝑚𝑚𝑚 is the standard deviation of the marker positions and mserr the mean squared error. The effects of the propagated error on rotation angles and helical axis directions were calculated as follows: for each phalanx, we simulated marker position errors that had a random variation in their direction vector from the true marker position and a size that was a random sample from a normal distribution with zero mean and bone specific standard deviation.First, the movement from minimally loaded condition to the final loading condition was analysed. Values per phalanx (Table S3) indicate that the impact of detection inaccuracies on rotation angles was small, but substantial standard deviations did occur for the axis direction calculated for some limbs.

5
Chapter 5
118
Fig. S4. a- Relative shape of sole surface for the lateral digit of the example claw; b- Average relative shape of sole surface of the lateral digit
For each 1 mm2 (equal to 1 pixel) of these standardised surfaces, distances were calculated. For pixels around the edge of the average shape, information was available for only part of the digits, but for most pixels the averages were based on all 15 or 8 legs depending on the parameter.
4 Error analysis of calculated displacement and reorientation of phalanges
The marker positions in the series of X-ray photographs inevitably contain small measurement inaccuracies. The consequence of these inaccuracies is that rotation and translation of marker configurations representing a truly rigid bone from one loading condition to another shows a non-zero mean squared error. These inaccuracies in marker positions could have their impact on the rotation angles and helical axis directions calculated for the phalanx positions. To investigate the impact of these measurement errors, we determined the mean squared error for each phalanx of the 8 limbs that were also used for the calculations of soft tissue strain for all loading conditions. Although the combination of axial and abaxial walls of the horn shoes will not be truly rigid, we have treated these as rigid as well because the mean squared errors calculated for these combinations were of similar size as those of the distal phalanges (Table S2).
Spatial distribution
119
Table S2. Average, minimum and maximum mean squared errors of marker positions of phalanges and combinations of axial and abaxial horn walls (in mm).
lateral digit medial digitelement avg min max avg min maxproximal phalanx 0.0117 0.0038 0.0426 0.0110 0.0037 0.0211middle phalanx 0.0095 0.0016 0.0363 0.0244 0.0016 0.0993distal phalanx 0.0014 0.0009 0.0041 0.0061 0.0009 0.0238axial/abaxial wall 0.0017 0.0010 0.0030 0.0021 0.0012 0.0031
We have determined the relationship between the standard deviation of the marker positions and the mean squared errors of the distances between markers as follows. Standard deviation of marker accuracy for an example bone was varied from 0.01 to 0.5 in steps of 0.1. Both the size and the direction of the error were varied at random. The size of the error was a random sample from a normal distribution with the know standard deviation. For each simulation, 14 replicates were generated to calculate a mean squared error of the distances between markers. The average relationship was determined from the results of 1000 repeated simulations for each standard deviation. The following formula was estimated to calculate a standard deviation from a given mean squared error value by fitting a third order polynomial through the data:
𝜎𝜎𝜎𝜎𝑖𝑖𝑖𝑖𝑚𝑚𝑚𝑚𝑚𝑚𝑚𝑚𝑖𝑖𝑖𝑖𝑚𝑚𝑚𝑚𝑚𝑚𝑚𝑚 = 86.879 ∗ 𝑚𝑚𝑚𝑚𝑠𝑠𝑠𝑠𝑠𝑠𝑠𝑠𝑠𝑠𝑠𝑠𝑠𝑠𝑠𝑠3 − 33.859 ∗ 𝑚𝑚𝑚𝑚𝑠𝑠𝑠𝑠𝑠𝑠𝑠𝑠𝑠𝑠𝑠𝑠𝑠𝑠𝑠𝑠2 + 5.6605 ∗ 𝑚𝑚𝑚𝑚𝑠𝑠𝑠𝑠𝑠𝑠𝑠𝑠𝑠𝑠𝑠𝑠𝑠𝑠𝑠𝑠 + 0.0449
Where 𝜎𝜎𝜎𝜎𝑖𝑖𝑖𝑖𝑚𝑚𝑚𝑚𝑚𝑚𝑚𝑚𝑖𝑖𝑖𝑖𝑚𝑚𝑚𝑚𝑚𝑚𝑚𝑚 is the standard deviation of the marker positions and mserr the mean squared error. The effects of the propagated error on rotation angles and helical axis directions were calculated as follows: for each phalanx, we simulated marker position errors that had a random variation in their direction vector from the true marker position and a size that was a random sample from a normal distribution with zero mean and bone specific standard deviation.First, the movement from minimally loaded condition to the final loading condition was analysed. Values per phalanx (Table S3) indicate that the impact of detection inaccuracies on rotation angles was small, but substantial standard deviations did occur for the axis direction calculated for some limbs.
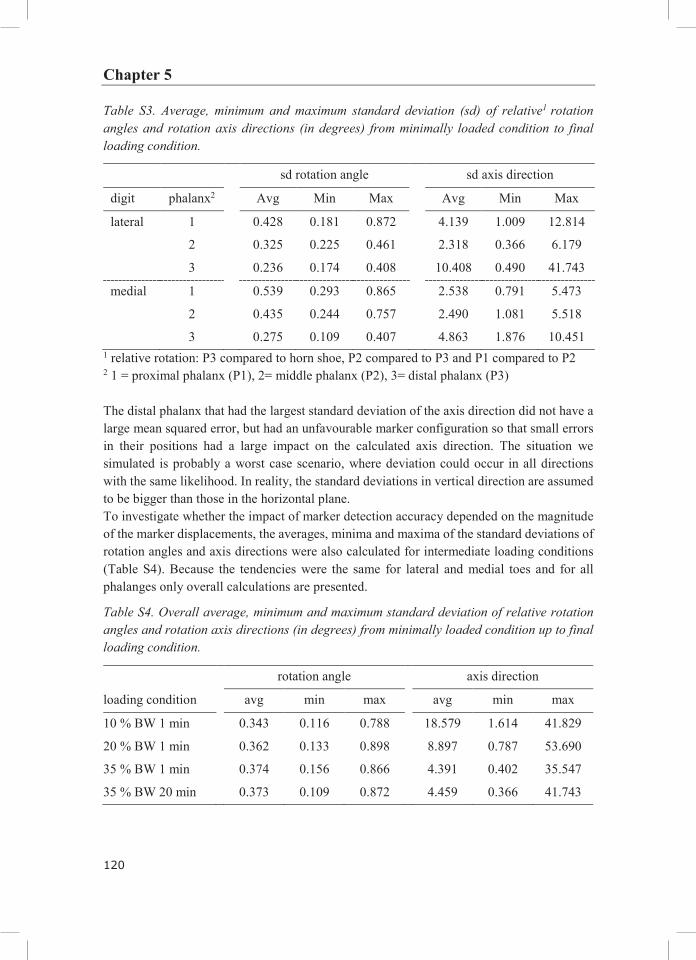
Chapter 5
120
Table S3. Average, minimum and maximum standard deviation (sd) of relative1 rotation angles and rotation axis directions (in degrees) from minimally loaded condition to final loading condition.
sd rotation angle sd axis direction
digit phalanx2 Avg Min Max Avg Min Max
lateral 1 0.428 0.181 0.872 4.139 1.009 12.814
2 0.325 0.225 0.461 2.318 0.366 6.179
3 0.236 0.174 0.408 10.408 0.490 41.743
medial 1 0.539 0.293 0.865 2.538 0.791 5.473
2 0.435 0.244 0.757 2.490 1.081 5.518
3 0.275 0.109 0.407 4.863 1.876 10.4511 relative rotation: P3 compared to horn shoe, P2 compared to P3 and P1 compared to P22 1 = proximal phalanx (P1), 2= middle phalanx (P2), 3= distal phalanx (P3)
The distal phalanx that had the largest standard deviation of the axis direction did not have a large mean squared error, but had an unfavourable marker configuration so that small errors in their positions had a large impact on the calculated axis direction. The situation we simulated is probably a worst case scenario, where deviation could occur in all directions with the same likelihood. In reality, the standard deviations in vertical direction are assumed to be bigger than those in the horizontal plane. To investigate whether the impact of marker detection accuracy depended on the magnitude of the marker displacements, the averages, minima and maxima of the standard deviations of rotation angles and axis directions were also calculated for intermediate loading conditions (Table S4). Because the tendencies were the same for lateral and medial toes and for all phalanges only overall calculations are presented.
Table S4. Overall average, minimum and maximum standard deviation of relative rotation angles and rotation axis directions (in degrees) from minimally loaded condition up to final loading condition.
rotation angle axis direction
loading condition avg min max avg min max
10 % BW 1 min 0.343 0.116 0.788 18.579 1.614 41.829
20 % BW 1 min 0.362 0.133 0.898 8.897 0.787 53.690
35 % BW 1 min 0.374 0.156 0.866 4.391 0.402 35.547
35 % BW 20 min 0.373 0.109 0.872 4.459 0.366 41.743
Spatial distribution
121
The standard deviations of the rotation angles did not change substantially with increasing load and increasing rotation angles. However, the standard deviations of the axis directions declined with increasing load. Particularly for 10 and 20%, BW load levels the standard deviations were substantial in comparison to the average rotation angles. In conclusion, the impact of inaccuracies in marker detection on calculated relative rotation angles for rotation from minimally loaded condition to maximally loaded conditions were small, even if the direction of the error could vary at random. Calculated rotation axis directions for marker configurations where the distance between two markers is small are particularly sensitive to marker detection inaccuracies.
5 Correlation between surfaces in the claw
Table S5. Correlations between claw surfaces with 95% confidence intervals
Correlation CI1
Correlation Lateral - Medial
total sole area: 0.83 0.56 – 0.94
plantar surface area of the distal phalanx 0.85 0.61 – 0.95
Correlation sole area – plantar area within same claw
lateral claw 0.67 0.23 – 0.88
medial claw 0.65 0.21 – 0.87
Correlation Left limb – right limb
sole surface area lateral claw 0.91 0.49 – 0.99
sole surface area medial claw 0.96 0.73 – 0.99
plantar surface area lateral claw 0.86 0.30 – 0.98
plantar surface area medial claw 0.99 0.95 – 0.99195% confidence interval

5
Chapter 5
120
Table S3. Average, minimum and maximum standard deviation (sd) of relative1 rotation angles and rotation axis directions (in degrees) from minimally loaded condition to final loading condition.
sd rotation angle sd axis direction
digit phalanx2 Avg Min Max Avg Min Max
lateral 1 0.428 0.181 0.872 4.139 1.009 12.814
2 0.325 0.225 0.461 2.318 0.366 6.179
3 0.236 0.174 0.408 10.408 0.490 41.743
medial 1 0.539 0.293 0.865 2.538 0.791 5.473
2 0.435 0.244 0.757 2.490 1.081 5.518
3 0.275 0.109 0.407 4.863 1.876 10.4511 relative rotation: P3 compared to horn shoe, P2 compared to P3 and P1 compared to P22 1 = proximal phalanx (P1), 2= middle phalanx (P2), 3= distal phalanx (P3)
The distal phalanx that had the largest standard deviation of the axis direction did not have a large mean squared error, but had an unfavourable marker configuration so that small errors in their positions had a large impact on the calculated axis direction. The situation we simulated is probably a worst case scenario, where deviation could occur in all directions with the same likelihood. In reality, the standard deviations in vertical direction are assumed to be bigger than those in the horizontal plane. To investigate whether the impact of marker detection accuracy depended on the magnitude of the marker displacements, the averages, minima and maxima of the standard deviations of rotation angles and axis directions were also calculated for intermediate loading conditions (Table S4). Because the tendencies were the same for lateral and medial toes and for all phalanges only overall calculations are presented.
Table S4. Overall average, minimum and maximum standard deviation of relative rotation angles and rotation axis directions (in degrees) from minimally loaded condition up to final loading condition.
rotation angle axis direction
loading condition avg min max avg min max
10 % BW 1 min 0.343 0.116 0.788 18.579 1.614 41.829
20 % BW 1 min 0.362 0.133 0.898 8.897 0.787 53.690
35 % BW 1 min 0.374 0.156 0.866 4.391 0.402 35.547
35 % BW 20 min 0.373 0.109 0.872 4.459 0.366 41.743
Spatial distribution
121
The standard deviations of the rotation angles did not change substantially with increasing load and increasing rotation angles. However, the standard deviations of the axis directions declined with increasing load. Particularly for 10 and 20%, BW load levels the standard deviations were substantial in comparison to the average rotation angles. In conclusion, the impact of inaccuracies in marker detection on calculated relative rotation angles for rotation from minimally loaded condition to maximally loaded conditions were small, even if the direction of the error could vary at random. Calculated rotation axis directions for marker configurations where the distance between two markers is small are particularly sensitive to marker detection inaccuracies.
5 Correlation between surfaces in the claw
Table S5. Correlations between claw surfaces with 95% confidence intervals
Correlation CI1
Correlation Lateral - Medial
total sole area: 0.83 0.56 – 0.94
plantar surface area of the distal phalanx 0.85 0.61 – 0.95
Correlation sole area – plantar area within same claw
lateral claw 0.67 0.23 – 0.88
medial claw 0.65 0.21 – 0.87
Correlation Left limb – right limb
sole surface area lateral claw 0.91 0.49 – 0.99
sole surface area medial claw 0.96 0.73 – 0.99
plantar surface area lateral claw 0.86 0.30 – 0.98
plantar surface area medial claw 0.99 0.95 – 0.99195% confidence interval

Chapter 5
122
6 Posterior-anterior displacement of the claws with increased loading
Fig. S5. Displacement of sole horn markers along posterior-anterior axis (average + SD, n=15) from position in minimally loaded condition (positive value indicates shift in posterior direction) for sole horn markers under the distal phalanx.
CHAPTER 6
General Discussion

124
General Discussion
125
1 GENERAL DISCUSSION
1.1 Claw problems in cattleClaw and leg disorders are identified as major welfare problem for dairy cattle (EFSA, 2009a). The majority of these problems is caused by claw disorders (Logue et al., 1993; Murray, 1996; EFSA, 2009a; Frankena et al., 2009). Farmers tend to underestimate the prevalence of lameness in their herds considerably (Espejo et al., 2006; Rutherford et al., 2009; Fabian et al., 2014). This could be linked with difficulties in detecting indications of pain, and cause limited awareness of the consequences of claw health and locomotion problems amongst dairy farmers. The majority of dairy farmers participating in the study of Leach et al. (2010) did not perceive lameness to be a major problem, despite the high prevalence (on average 36% for the farms investigated). In line with this, Barker et al. (2010)reported that less than half of the farmers participating in their study were engaged in proactive detection of lame cows and Ivemeyer et al. (2012) found that implementation of health and welfare planning resulted in an increase in the treatment of lame cows. Claw disorders not only impair welfare but also cause substantial economic losses for dairy farmers due to milk production losses, reduced fertility, labour, trimming costs, veterinary costs, treatment cost and culling. For Dutch dairy farms these range from €35 to €76 per cow per year on average (Bruijnis et al., 2010). Nevertheless, farmers often are not fully aware of the economic consequences of impaired locomotion (Leach et al., 2010).Improvement of claw health seems feasible in practice, because there is a huge variation between farms in prevalence of lameness and claw disorders (see description in the Introduction). However, despite a large amount of research, and application of measures such as preventive trimming, use of footbaths, and governmental policies to stimulate investment in animal welfare friendly housing, improvement has not been realised in general. One of the presumed reasons for this is that aetiology of claw and locomotion disorders is currently incompletely understood, but economic constraints also limit the scope for dairy farmers to implement costly interventions.Rubber walking surfaces have shown to preserve sole concavity (Telezhenko et al., 2009),which is assumed to prevent overloading in the bulb area. Van der Tol (2004) proposed an alternative trimming method that could have a similar effect on load distribution. Mechanical overload is indicated as a potential cause of non-infectious claw lesions (Distl and Mair, 1993; Van der Tol, 2004), but how external load is distributed inside the claws is largely unknown. The main aim of this thesis is to improve understanding of effects of housing circumstances on claw tissues, and in particular effects of flooring and lying conditions. These both are known to affect lying and standing behaviour of cows, and thus mechanical load exerted on the claws, and are also linked with the occurrence of claw lesions. Two experiments were carried out at Waiboerhoeve research farm, Lelystad, the Netherlands. In both experiments, sole haemorrhages were used as indicator for tissue overload. In the first experiment (Chapter 2), effects of the aforementioned alternative trimming technique were

6
124
General Discussion
125
1 GENERAL DISCUSSION
1.1 Claw problems in cattleClaw and leg disorders are identified as major welfare problem for dairy cattle (EFSA, 2009a). The majority of these problems is caused by claw disorders (Logue et al., 1993; Murray, 1996; EFSA, 2009a; Frankena et al., 2009). Farmers tend to underestimate the prevalence of lameness in their herds considerably (Espejo et al., 2006; Rutherford et al., 2009; Fabian et al., 2014). This could be linked with difficulties in detecting indications of pain, and cause limited awareness of the consequences of claw health and locomotion problems amongst dairy farmers. The majority of dairy farmers participating in the study of Leach et al. (2010) did not perceive lameness to be a major problem, despite the high prevalence (on average 36% for the farms investigated). In line with this, Barker et al. (2010)reported that less than half of the farmers participating in their study were engaged in proactive detection of lame cows and Ivemeyer et al. (2012) found that implementation of health and welfare planning resulted in an increase in the treatment of lame cows. Claw disorders not only impair welfare but also cause substantial economic losses for dairy farmers due to milk production losses, reduced fertility, labour, trimming costs, veterinary costs, treatment cost and culling. For Dutch dairy farms these range from €35 to €76 per cow per year on average (Bruijnis et al., 2010). Nevertheless, farmers often are not fully aware of the economic consequences of impaired locomotion (Leach et al., 2010).Improvement of claw health seems feasible in practice, because there is a huge variation between farms in prevalence of lameness and claw disorders (see description in the Introduction). However, despite a large amount of research, and application of measures such as preventive trimming, use of footbaths, and governmental policies to stimulate investment in animal welfare friendly housing, improvement has not been realised in general. One of the presumed reasons for this is that aetiology of claw and locomotion disorders is currently incompletely understood, but economic constraints also limit the scope for dairy farmers to implement costly interventions.Rubber walking surfaces have shown to preserve sole concavity (Telezhenko et al., 2009),which is assumed to prevent overloading in the bulb area. Van der Tol (2004) proposed an alternative trimming method that could have a similar effect on load distribution. Mechanical overload is indicated as a potential cause of non-infectious claw lesions (Distl and Mair, 1993; Van der Tol, 2004), but how external load is distributed inside the claws is largely unknown. The main aim of this thesis is to improve understanding of effects of housing circumstances on claw tissues, and in particular effects of flooring and lying conditions. These both are known to affect lying and standing behaviour of cows, and thus mechanical load exerted on the claws, and are also linked with the occurrence of claw lesions. Two experiments were carried out at Waiboerhoeve research farm, Lelystad, the Netherlands. In both experiments, sole haemorrhages were used as indicator for tissue overload. In the first experiment (Chapter 2), effects of the aforementioned alternative trimming technique were

Chapter 6
126
determined for mid-lactation cows kept in barns with either concrete or rubber topped slatted alley flooring. In the second experiment (Chapter 3), effects of nocturnal restrictions in access to the cubicles with supposed maleficent effects on claw tissues were determined for heifers in the first three months of their first lactation. Again, effects were estimated both for concrete and rubber topped flooring. Lying and standing behaviour were monitored continuously with Icetag pedometers. It is assumed that load causes internal deformations of claw tissues, which could contribute to understanding the effects of lying and standing and of claw shape on claw health. Therefore, a methodology was developed to accurately measure load induced spatial deformation of lower hind limbs of cattle (Chapter 4). This methodology was applied in a series of load deformation experiments with dissected hind limbs (Chapter 5). In this chapter, the results reported in Chapters 2 to 5 are reviewed and integrated. Possible links between behaviour and internal deformation inside the claws are discussed. The distribution of compressive strain in the soft tissues between the sole horn and the distal phalanges is compared with the locations of sole haemorrhages and sole ulcers. At the end of this chapter, possible applications of the knowledge that is gathered are indicated, recommendations for additional research are presented, and finally the main conclusions are outlined.
1.2 Intervention: claw trimmingImprovements of claw health and locomotion are difficult to achieve in practice. Effects of interventions and preventive strategies are not well studied (Potterton et al., 2012). Moreover, these effects also will depend on how the strategies are implemented (Bell et al., 2009). On many farms routine trimming is applied biannually to correct malformation of claws due to an imbalance in growth and wear, particularly for hind claws. It is also useful to detect subclinical claw lesions that otherwise remain unnoticed. However, trimming can have a serious negative influence on claw health if it is not done properly (Sanders et al., 2009).Trimming may not be needed or applied at longer intervals if cows are kept on soft flooring and have good claw health, because soft flooring reduces horn growth (Kremer et al., 2007; Telezhenko et al., 2009). However, there is very limited knowledge on optimal trimming intervals (Manning et al., 2016).Epidemiological studies in general show positive effects of herd trimming on claw health (Bicalho and Oikonomou, 2013), but ineffectiveness (Mahendran et al., 2017) and negative effects (Amory et al., 2006; Fjeldaas et al., 2011) are also reported. Trimming of moderately lame cows was not beneficial for gait score or milk yield (García-Muñoz et al., 2017). Van der Tol (2004) showed that the maximum pressure on the sole was not significantly reduced, and lateral claws were still loaded more than medial claws after trimming according to the standard Dutch method. Moreover, the highest pressures usually occurred in the bulb area, a region vulnerable for overloading. Therefore, it was hypothesised that an alternative trimming method would have beneficial effects on claw health, particularly on rubber-covered floors. Key element of this method is that, after correcting length and height of the claws, 3 to 5 mm of sole horn is dished out from the bulb area (the typical sole ulcer site).
General Discussion
127
We investigated this hypothesis (Chapter 2). The cows trimmed according to the alternative strategy had smaller claw-floor contact area immediately after trimming, but these differences quickly disappeared thereafter. Moreover, this study showed no significant differences between trimming strategies on claw health or claw shape, so we had to reject the hypothesis. However, a significantly lower sole haemorrhage prevalence and lower horn growth and wear were found on the rubber topped floor vs. the concrete floor. Moreover, animals on the rubber topped floor spent more time standing in the alleys and had higher activity (61.0 ± 3.7 vs. 53.0 ± 3.7 steps/h). Results of the load-deformation experiments (Chapter 5) show that the soft tissue under the distal phalanx can be considerably strained under increasing load, particularly for flat soles. Preservation of concavity on rubber flooring (Telezhenko et al., 2009) probably contributes more to the reduction of mechanical load at the typical sole ulcer site than the fact that rubber is more compliant than concrete. Therefore, despite the results of our study, I hypothesizethat the alternative trimming method is beneficial when applied to cows kept on soft flooring, with concave soles before trimming. Instead of dishing out the sole, it should be attempted to conserve the concavity. However, the concave method could in fact be detrimental when applied for cows with flat and thin soles. Excessive thinning of soles at trimming is regarded as a risk factor for claw disorders (Nuss and Paulus, 2006). Dairy cows currently are much bigger than those present when the trimming method was developed (more than 30 years ago), and this may not always be taken into account correctly (Tsuka et al., 2014; Archer et al., 2015). Therefore, on concrete floors the standard method is probably to be preferred.
1.3 Effects of housingHousing circumstances are assumed to have a major impact on claw health and locomotion. In general, cubicle barns with concrete flooring compare unfavourably with pasture, but also with straw yards and bedded pack barns. Adverse effects have more impact in cubicle barns (EFSA, 2009b), so management of herds in cubicle barns requires excellent management skills. The alternative systems have much softer flooring than conventional cubicle barns, usually more space per animal and better lying provisions. Restrictive stalls coincide with impaired gait and claw lesions, but also with cleaner cows and stalls (Bernardi et al., 2009).Cook and Nordlund (2009) argue that deep bedded, well designed cubicles filled with sand do not affect lying behaviour of lame cows. However, cubicles in practice often hamper cows while getting up or lying down (Faull et al., 1996; Sarjokari et al., 2013). Size differences between cows in a herd make it nearly impossible to properly adjust cubicle dimensions for all animals. Due to selection, the size of Dutch dairy cows has increased considerably, and therefore they need more space to lie down and get up, but increasing cubicle dimensions in existing barns is costly and complicated. Moreover, long waiting times in yards before milking and overstocking can limit the availability of cubicles and cause reduced lying time. It is assumed that sub-optimal lying conditions increase impact of load on the claws due to increased time standing and/or prolonged standing bouts.

6
Chapter 6
126
determined for mid-lactation cows kept in barns with either concrete or rubber topped slatted alley flooring. In the second experiment (Chapter 3), effects of nocturnal restrictions in access to the cubicles with supposed maleficent effects on claw tissues were determined for heifers in the first three months of their first lactation. Again, effects were estimated both for concrete and rubber topped flooring. Lying and standing behaviour were monitored continuously with Icetag pedometers. It is assumed that load causes internal deformations of claw tissues, which could contribute to understanding the effects of lying and standing and of claw shape on claw health. Therefore, a methodology was developed to accurately measure load induced spatial deformation of lower hind limbs of cattle (Chapter 4). This methodology was applied in a series of load deformation experiments with dissected hind limbs (Chapter 5). In this chapter, the results reported in Chapters 2 to 5 are reviewed and integrated. Possible links between behaviour and internal deformation inside the claws are discussed. The distribution of compressive strain in the soft tissues between the sole horn and the distal phalanges is compared with the locations of sole haemorrhages and sole ulcers. At the end of this chapter, possible applications of the knowledge that is gathered are indicated, recommendations for additional research are presented, and finally the main conclusions are outlined.
1.2 Intervention: claw trimmingImprovements of claw health and locomotion are difficult to achieve in practice. Effects of interventions and preventive strategies are not well studied (Potterton et al., 2012). Moreover, these effects also will depend on how the strategies are implemented (Bell et al., 2009). On many farms routine trimming is applied biannually to correct malformation of claws due to an imbalance in growth and wear, particularly for hind claws. It is also useful to detect subclinical claw lesions that otherwise remain unnoticed. However, trimming can have a serious negative influence on claw health if it is not done properly (Sanders et al., 2009).Trimming may not be needed or applied at longer intervals if cows are kept on soft flooring and have good claw health, because soft flooring reduces horn growth (Kremer et al., 2007; Telezhenko et al., 2009). However, there is very limited knowledge on optimal trimming intervals (Manning et al., 2016).Epidemiological studies in general show positive effects of herd trimming on claw health (Bicalho and Oikonomou, 2013), but ineffectiveness (Mahendran et al., 2017) and negative effects (Amory et al., 2006; Fjeldaas et al., 2011) are also reported. Trimming of moderately lame cows was not beneficial for gait score or milk yield (García-Muñoz et al., 2017). Van der Tol (2004) showed that the maximum pressure on the sole was not significantly reduced, and lateral claws were still loaded more than medial claws after trimming according to the standard Dutch method. Moreover, the highest pressures usually occurred in the bulb area, a region vulnerable for overloading. Therefore, it was hypothesised that an alternative trimming method would have beneficial effects on claw health, particularly on rubber-covered floors. Key element of this method is that, after correcting length and height of the claws, 3 to 5 mm of sole horn is dished out from the bulb area (the typical sole ulcer site).
General Discussion
127
We investigated this hypothesis (Chapter 2). The cows trimmed according to the alternative strategy had smaller claw-floor contact area immediately after trimming, but these differences quickly disappeared thereafter. Moreover, this study showed no significant differences between trimming strategies on claw health or claw shape, so we had to reject the hypothesis. However, a significantly lower sole haemorrhage prevalence and lower horn growth and wear were found on the rubber topped floor vs. the concrete floor. Moreover, animals on the rubber topped floor spent more time standing in the alleys and had higher activity (61.0 ± 3.7 vs. 53.0 ± 3.7 steps/h). Results of the load-deformation experiments (Chapter 5) show that the soft tissue under the distal phalanx can be considerably strained under increasing load, particularly for flat soles. Preservation of concavity on rubber flooring (Telezhenko et al., 2009) probably contributes more to the reduction of mechanical load at the typical sole ulcer site than the fact that rubber is more compliant than concrete. Therefore, despite the results of our study, I hypothesizethat the alternative trimming method is beneficial when applied to cows kept on soft flooring, with concave soles before trimming. Instead of dishing out the sole, it should be attempted to conserve the concavity. However, the concave method could in fact be detrimental when applied for cows with flat and thin soles. Excessive thinning of soles at trimming is regarded as a risk factor for claw disorders (Nuss and Paulus, 2006). Dairy cows currently are much bigger than those present when the trimming method was developed (more than 30 years ago), and this may not always be taken into account correctly (Tsuka et al., 2014; Archer et al., 2015). Therefore, on concrete floors the standard method is probably to be preferred.
1.3 Effects of housingHousing circumstances are assumed to have a major impact on claw health and locomotion. In general, cubicle barns with concrete flooring compare unfavourably with pasture, but also with straw yards and bedded pack barns. Adverse effects have more impact in cubicle barns (EFSA, 2009b), so management of herds in cubicle barns requires excellent management skills. The alternative systems have much softer flooring than conventional cubicle barns, usually more space per animal and better lying provisions. Restrictive stalls coincide with impaired gait and claw lesions, but also with cleaner cows and stalls (Bernardi et al., 2009).Cook and Nordlund (2009) argue that deep bedded, well designed cubicles filled with sand do not affect lying behaviour of lame cows. However, cubicles in practice often hamper cows while getting up or lying down (Faull et al., 1996; Sarjokari et al., 2013). Size differences between cows in a herd make it nearly impossible to properly adjust cubicle dimensions for all animals. Due to selection, the size of Dutch dairy cows has increased considerably, and therefore they need more space to lie down and get up, but increasing cubicle dimensions in existing barns is costly and complicated. Moreover, long waiting times in yards before milking and overstocking can limit the availability of cubicles and cause reduced lying time. It is assumed that sub-optimal lying conditions increase impact of load on the claws due to increased time standing and/or prolonged standing bouts.

Chapter 6
128
Chapter 3 describes a study in which we aimed to quantify effects of combinations of hard vs. soft flooring and restricted vs. unrestricted cubicle access. These restrictions were achieved by blocking access to the cubicles between 23 and 05 h. The experiment was carried out with heifers in the first three months of their first lactation. We hypothesised that hard concrete flooring would cause higher mechanical load on claws than compliant rubber flooring, and that restricted cubicle access causes prolonged standing bouts and increases the negative effects of concrete vs. rubber topped floors on claw health. Our experiment again showed significantly less sole haemorrhages on rubber vs. concrete flooring. Both the number of lesions and severity were reduced. For all treatments, prevalence increased during the first 3 months after calving, particularly in the lateral toes of the hind legs, which corresponds with results of Bergsten and Herlin (1996). The location of the lesions corresponded with the pressure distribution patterns reported by van der Tol et al. (2002). We rejected the hypothesis that restricted cubicle access would reinforce the effects of hard flooring on claws. However, in the last week of the experiment the treatment group kept on concrete flooring and with no overnight cubicle access had significantly higher haemorrhage scores than the other treatment groups, and the two groups kept on rubber flooring had lowest scores. This suggests that blocking of cubicles overnight did have some effect on the animals kept on the concrete floor, but none on the animals kept on the rubber floor.The animals with no overnight access to the cubicles compensated for the lost lying time by lying down during the rest of the day, similar to observations of Winckler et al. (2015). This probably diminished the effect of the restriction, although the number of standing bouts per day decreased and the number of bouts longer than 6 h increased. This phenomenon may have caused the higher haemorrhage scores for the lying restricted cows on concrete flooring at the end of the experiment. Neveux et al. (2006) showed that cows respond to foot discomfort with weight shifting between the legs. Krebs et al. (2011) showed that restless behaviour of cows increased during standing bouts of 4 h, both for concrete and rubber flooring, and suggest this can be interpreted as indicator of increased discomfort during prolonged standing. In line with their results, we observed an increase in the number of strides/min during prolonged standing. The animals with restricted cubicle access showed increased activity during the overnight restriction period according to the IceTag sensors. Although part of this is probably related to more overnight feed intake, it could also indicate frustration or discomfort due to prolonged standing. Presumably, the animals were motivated to lie down at the end of the overnight period: Tucker et al. (2018) reported that cows after being deprived of lying for 4 h showed increased motivation to lie down. Contrary to the stocking density experiment of Winckler et al. (2015), increased activity due to more displacements is unlikely since there were either no cubicles available, or one cubicle for each animal. The impact of the restrictions in our experiment probably was less variable than in theirs, because they concluded that behavioural change was larger for cows that were lesssuccessful at displacing others. Several studies have shown that prevalence of sole haemorrhages is relatively high in heifers around their first calving (e.g. Bergsten and Herlin (1996) and Sogstad et al. (2005)).
General Discussion
129
Although heifers experience considerable physiological and metabolic changes around the first parturition that can be linked to the occurrence of sole haemorrhages (Tarlton et al., 2002; Knott et al., 2007), our study clearly showed that there also are considerable changes in their time budgets. Particularly in the first days after calving, the heifers spent more than 70% of time standing and according to records obtained with IceTags were more active than before or after this episode, even while being introduced in small groups with heifers only right after calving. Hereafter, percentage of time standing stabilised but at a higher level than in our earlier experiment for cows (Chapter 2). The extra activity in the first days after calving presumably is not of the same kind as the activity performed later on, but more linked to social interactions. Particularly increased standing time, but probably also increased activity, are presumably linked with increased mechanical load of the claws. The research setting probably reduced the competition that the heifers encountered compared to regular circumstances on commercial farms. This might have reduced the impact of their introduction in the milking herd on mechanical load of the claws compared with circumstances more common in practice. After the treatment period, the activity and time budgets of all treatment groups were similar, indicating that the treatments did not have serious carry-over effects. In the first experiment (Chapter 2), we found smaller claw-floor contact areas for cows kept on rubber vs. concrete flooring. We assume this was linked with the development of sole concavity on compliant flooring. In the second experiment (Chapter 3), we did not measure claw-floor contact areas or pressure distributions, but if the same phenomenon would have occurred in this study, carry over effects were to be expected. However, the cows in this study were milked in aparlour and were exposed to concrete flooring around milking twice a day, whereas the cows in the first experiment were milked with an automatic milking system and not exposed to other flooring than that of their home pen. Probably the exposure to concrete prevented the development of sole concavity, and may have reduced the impact of rubber flooring in this study. This might explain why we did not find increased standing time on rubber flooring, as we did in the experiment described in Chapter 2 and was also found in several other studies (Kremer et al., 2007; Haufe et al., 2009). In the study of (Haufe et al., 2009) however, overall standing time was similar for cows kept on soft vs. hard floors, but on hard floors they stood more in the cubicles that presumably have softer surfaces. In our study, the cows on rubber flooring spent more time feeding and ate slower, while their feed intake was the same as that of the cows on concrete. These two phenomena suggest that standing on concrete flooring is not comfortable. Similar to the study described in Chapter 2, this study did not show significant effects of flooring on locomotion. This is in line with studies that showed that often hoof lesions observed at trimming do not cause obvious lameness (Smits et al., 1992; Manske et al., 2002).If sole haemorrhages can be linked to discomfort while standing on hard flooring, at least subtle effects on behaviour of affected cows are to be expected. Difficulty with sole haemorrhages is that the discomfort most likely occurs before the lesions become visible in the sole. More detailed behavioural monitoring of cows at risk of developing sole

6
Chapter 6
128
Chapter 3 describes a study in which we aimed to quantify effects of combinations of hard vs. soft flooring and restricted vs. unrestricted cubicle access. These restrictions were achieved by blocking access to the cubicles between 23 and 05 h. The experiment was carried out with heifers in the first three months of their first lactation. We hypothesised that hard concrete flooring would cause higher mechanical load on claws than compliant rubber flooring, and that restricted cubicle access causes prolonged standing bouts and increases the negative effects of concrete vs. rubber topped floors on claw health. Our experiment again showed significantly less sole haemorrhages on rubber vs. concrete flooring. Both the number of lesions and severity were reduced. For all treatments, prevalence increased during the first 3 months after calving, particularly in the lateral toes of the hind legs, which corresponds with results of Bergsten and Herlin (1996). The location of the lesions corresponded with the pressure distribution patterns reported by van der Tol et al. (2002). We rejected the hypothesis that restricted cubicle access would reinforce the effects of hard flooring on claws. However, in the last week of the experiment the treatment group kept on concrete flooring and with no overnight cubicle access had significantly higher haemorrhage scores than the other treatment groups, and the two groups kept on rubber flooring had lowest scores. This suggests that blocking of cubicles overnight did have some effect on the animals kept on the concrete floor, but none on the animals kept on the rubber floor.The animals with no overnight access to the cubicles compensated for the lost lying time by lying down during the rest of the day, similar to observations of Winckler et al. (2015). This probably diminished the effect of the restriction, although the number of standing bouts per day decreased and the number of bouts longer than 6 h increased. This phenomenon may have caused the higher haemorrhage scores for the lying restricted cows on concrete flooring at the end of the experiment. Neveux et al. (2006) showed that cows respond to foot discomfort with weight shifting between the legs. Krebs et al. (2011) showed that restless behaviour of cows increased during standing bouts of 4 h, both for concrete and rubber flooring, and suggest this can be interpreted as indicator of increased discomfort during prolonged standing. In line with their results, we observed an increase in the number of strides/min during prolonged standing. The animals with restricted cubicle access showed increased activity during the overnight restriction period according to the IceTag sensors. Although part of this is probably related to more overnight feed intake, it could also indicate frustration or discomfort due to prolonged standing. Presumably, the animals were motivated to lie down at the end of the overnight period: Tucker et al. (2018) reported that cows after being deprived of lying for 4 h showed increased motivation to lie down. Contrary to the stocking density experiment of Winckler et al. (2015), increased activity due to more displacements is unlikely since there were either no cubicles available, or one cubicle for each animal. The impact of the restrictions in our experiment probably was less variable than in theirs, because they concluded that behavioural change was larger for cows that were lesssuccessful at displacing others. Several studies have shown that prevalence of sole haemorrhages is relatively high in heifers around their first calving (e.g. Bergsten and Herlin (1996) and Sogstad et al. (2005)).
General Discussion
129
Although heifers experience considerable physiological and metabolic changes around the first parturition that can be linked to the occurrence of sole haemorrhages (Tarlton et al., 2002; Knott et al., 2007), our study clearly showed that there also are considerable changes in their time budgets. Particularly in the first days after calving, the heifers spent more than 70% of time standing and according to records obtained with IceTags were more active than before or after this episode, even while being introduced in small groups with heifers only right after calving. Hereafter, percentage of time standing stabilised but at a higher level than in our earlier experiment for cows (Chapter 2). The extra activity in the first days after calving presumably is not of the same kind as the activity performed later on, but more linked to social interactions. Particularly increased standing time, but probably also increased activity, are presumably linked with increased mechanical load of the claws. The research setting probably reduced the competition that the heifers encountered compared to regular circumstances on commercial farms. This might have reduced the impact of their introduction in the milking herd on mechanical load of the claws compared with circumstances more common in practice. After the treatment period, the activity and time budgets of all treatment groups were similar, indicating that the treatments did not have serious carry-over effects. In the first experiment (Chapter 2), we found smaller claw-floor contact areas for cows kept on rubber vs. concrete flooring. We assume this was linked with the development of sole concavity on compliant flooring. In the second experiment (Chapter 3), we did not measure claw-floor contact areas or pressure distributions, but if the same phenomenon would have occurred in this study, carry over effects were to be expected. However, the cows in this study were milked in aparlour and were exposed to concrete flooring around milking twice a day, whereas the cows in the first experiment were milked with an automatic milking system and not exposed to other flooring than that of their home pen. Probably the exposure to concrete prevented the development of sole concavity, and may have reduced the impact of rubber flooring in this study. This might explain why we did not find increased standing time on rubber flooring, as we did in the experiment described in Chapter 2 and was also found in several other studies (Kremer et al., 2007; Haufe et al., 2009). In the study of (Haufe et al., 2009) however, overall standing time was similar for cows kept on soft vs. hard floors, but on hard floors they stood more in the cubicles that presumably have softer surfaces. In our study, the cows on rubber flooring spent more time feeding and ate slower, while their feed intake was the same as that of the cows on concrete. These two phenomena suggest that standing on concrete flooring is not comfortable. Similar to the study described in Chapter 2, this study did not show significant effects of flooring on locomotion. This is in line with studies that showed that often hoof lesions observed at trimming do not cause obvious lameness (Smits et al., 1992; Manske et al., 2002).If sole haemorrhages can be linked to discomfort while standing on hard flooring, at least subtle effects on behaviour of affected cows are to be expected. Difficulty with sole haemorrhages is that the discomfort most likely occurs before the lesions become visible in the sole. More detailed behavioural monitoring of cows at risk of developing sole

Chapter 6
130
haemorrhages could reveal such changes, and could also provide more understanding of potential behaviour that can predispose an animal to claw lesions.
1.4 Mechanical loading as a cause for claw disordersParticularly housing related parameters are identified as important herd level risk factors for claw disorders (EFSA, 2009b). In general, clean and soft walking substrates and unlimited availability of spacious and sufficiently bedded provisions for lying are beneficial for claw health. It is assumed that pasture in general provides optimal provisions for lying, standing and walking. Non-infectious claw lesions are assumed to be part of the same aetiologic process (Holzhauer, 2006; Newsome et al., 2017). Mechanical load is presumably involved in the development of these lesions (Van der Tol, 2004). The influence of lying provisions on claw health indicates that the effects of mechanical load probably are more complex than strictly related to peak load. Prolonged standing in itself will not cause increased peak loads (Van der Tol, 2004), but can increase episodes of uninterrupted moderate loading, particularly when more standing coincides with increased standing bout lengths. The effects of such standing on claw tissues can be better understood when their impact on internal load distribution is known. Therefore, we developed a method to measure load-induced deformations in cattle claws (Chapter 4) and performed a series of load induced deformation experiments with dissected hind limbs (Chapter 5).The results of the load deformation experiments are described in chapter 5. In line with Nuss (2014) the lateral claws in our study had 17-18% larger sole surfaces than the medial claw of the same limb. The plantar surfaces of the distal phalanges of lateral and medial toes were equally large. The horn shoes showed no measurable deformation, except for the soles. This could be different under normal housing conditions in vivo, if horn is softened due to moisture (Borderas et al., 2004). The experiments revealed a considerable compressive strain in the soft tissues between the distal phalanges and the sole horn. At a load of 20% of BW maximum compressive strain in the soft tissue of an average claw was more than 10% of the initial layer thickness, and for individual claws compressive strain could be more than 25%. At a load of 35% of BW maximum compressive strain of more than 30% was determined in some claws. An important cause of the strain was that the distal phalanges were displaced downwards while the soles contacted the floor surface. We assumed that the sole horn layer would not be compressed. Remarkably, the strain in the lateral and medial toes was of similar magnitude at 35% BW load. The centre of pressure gradually shifted from the dorsal half of the lateral claw towards the centre of the two digits, which indicates that load was distributed more equal. The location of the maximum compressive strain corresponded remarkably well with the sole area known as the typical sole ulcer location (Van Amstel and Shearer, 2006). This suggest a causal link between the strain and the development of haemorrhages that to our knowledge is not published before. That we determined considerable compressive strain at 20% BW load indicates that compressive strain is likely to occur during standing. Although the changes were small, we also detected that at sustained load the strain increased. Signs of discomfort observed from animals that experience long standing bouts probably are linked
General Discussion
131
with compressive strain in the soft tissues, although we acknowledge that strain in the dead limbs we tested might be larger than under in vivo circumstances.Measurements of claw conformation and external load distribution (Van der Tol, 2004;Telezhenko et al., 2008) have provided insight in the areas of the sole that are most prone to overloading and in effects of flooring on load distribution. Such measurements, however, cannot explain why prolonged standing has detrimental effects, and also are not suited to determine consequences of partial support of the claws as can occur on slatted flooring. With a finite element model (FEM), Hinterhofer et al. (2009) calculated the internal load distribution inside the claw both with full and partial support. The study showed that partial support can cause a considerable internal load concentration, and therefore solid flooring (which is flooring which provides full support) was recommended. For a load of 2000 N, a fully supported claw was predicted to have a peak compressive strain of up to 2.4% in the bulb region of the sole. Strain levels of up to 11% were predicted in the soft tissue between the distal phalanx of the supported digit and the sole horn on a slatted floor with only one digit supported by flooring. The largest strain predicted for the soft tissue between the sole horn and the distal phalanges for claws that were only supported in the dorsal half was 4%, and was located below the dorsal tip of the bone. Compared with our own findings on a flat solid floor (we found relative compression of 40% and more at a similar load) the FEM seems to considerably underestimate mechanical stress in the soft tissue layer under the distal phalanx. Moreover, none of the FEM-predictions located the highest strain in the sole-area where sole ulcers and sole haemorrhages are most frequently found, like our study did. The FEM is based on a CT scan of an unloaded dissected hind limb, and presumably the load induced deformations that we were able to capture are not accounted for by the material properties of the FEM. In line with this, Salo et al. (2010) showed that strain calculated with a FEM can considerably differ from in vivo measured values at the equine hoof wall. The fact that comparative studies have not shown unambiguously detrimental effects of slatted vs. solid flooring on claw health can be caused by moderate impact of short term peak load vs. lower but sustained load. Moreover, cows could avoid partial support of their claws by placing their feet on the slats, but we have no indication at all that they do so (Ouweltjes et al., 2011).Bone development within the tuberculum flexorium contributes to the development of sole haemorrhages and sole ulcers (Tsuka et al., 2012; Newsome et al., 2016). According to Newsome et al. (2016), the process is stimulated by claw horn disruption lesions and increases with aging. Although the mechanism behind this bone formation in unclear, it is hypothesized that laminitis related ‘sinking’ of the distal phalanx is involved (Tsuka et al., 2012). This phenomenon probably contributes to the concentration of strain in the typical sole ulcer area.The two in vivo experiments performed for this study both provided some evidence for the impact of mechanical load on claw tissues, and this corresponds well with the results from the load deformation experiments. The study described in Chapter 2 revealed that lying time decreased on rubber flooring, and similarly Hernandez-Mendo et al. (2007) reported that grazing cows had reduced lying times vs. cows kept indoors (10.9 vs. 12.3 h/d). They also

6
Chapter 6
130
haemorrhages could reveal such changes, and could also provide more understanding of potential behaviour that can predispose an animal to claw lesions.
1.4 Mechanical loading as a cause for claw disordersParticularly housing related parameters are identified as important herd level risk factors for claw disorders (EFSA, 2009b). In general, clean and soft walking substrates and unlimited availability of spacious and sufficiently bedded provisions for lying are beneficial for claw health. It is assumed that pasture in general provides optimal provisions for lying, standing and walking. Non-infectious claw lesions are assumed to be part of the same aetiologic process (Holzhauer, 2006; Newsome et al., 2017). Mechanical load is presumably involved in the development of these lesions (Van der Tol, 2004). The influence of lying provisions on claw health indicates that the effects of mechanical load probably are more complex than strictly related to peak load. Prolonged standing in itself will not cause increased peak loads (Van der Tol, 2004), but can increase episodes of uninterrupted moderate loading, particularly when more standing coincides with increased standing bout lengths. The effects of such standing on claw tissues can be better understood when their impact on internal load distribution is known. Therefore, we developed a method to measure load-induced deformations in cattle claws (Chapter 4) and performed a series of load induced deformation experiments with dissected hind limbs (Chapter 5).The results of the load deformation experiments are described in chapter 5. In line with Nuss (2014) the lateral claws in our study had 17-18% larger sole surfaces than the medial claw of the same limb. The plantar surfaces of the distal phalanges of lateral and medial toes were equally large. The horn shoes showed no measurable deformation, except for the soles. This could be different under normal housing conditions in vivo, if horn is softened due to moisture (Borderas et al., 2004). The experiments revealed a considerable compressive strain in the soft tissues between the distal phalanges and the sole horn. At a load of 20% of BW maximum compressive strain in the soft tissue of an average claw was more than 10% of the initial layer thickness, and for individual claws compressive strain could be more than 25%. At a load of 35% of BW maximum compressive strain of more than 30% was determined in some claws. An important cause of the strain was that the distal phalanges were displaced downwards while the soles contacted the floor surface. We assumed that the sole horn layer would not be compressed. Remarkably, the strain in the lateral and medial toes was of similar magnitude at 35% BW load. The centre of pressure gradually shifted from the dorsal half of the lateral claw towards the centre of the two digits, which indicates that load was distributed more equal. The location of the maximum compressive strain corresponded remarkably well with the sole area known as the typical sole ulcer location (Van Amstel and Shearer, 2006). This suggest a causal link between the strain and the development of haemorrhages that to our knowledge is not published before. That we determined considerable compressive strain at 20% BW load indicates that compressive strain is likely to occur during standing. Although the changes were small, we also detected that at sustained load the strain increased. Signs of discomfort observed from animals that experience long standing bouts probably are linked
General Discussion
131
with compressive strain in the soft tissues, although we acknowledge that strain in the dead limbs we tested might be larger than under in vivo circumstances.Measurements of claw conformation and external load distribution (Van der Tol, 2004;Telezhenko et al., 2008) have provided insight in the areas of the sole that are most prone to overloading and in effects of flooring on load distribution. Such measurements, however, cannot explain why prolonged standing has detrimental effects, and also are not suited to determine consequences of partial support of the claws as can occur on slatted flooring. With a finite element model (FEM), Hinterhofer et al. (2009) calculated the internal load distribution inside the claw both with full and partial support. The study showed that partial support can cause a considerable internal load concentration, and therefore solid flooring (which is flooring which provides full support) was recommended. For a load of 2000 N, a fully supported claw was predicted to have a peak compressive strain of up to 2.4% in the bulb region of the sole. Strain levels of up to 11% were predicted in the soft tissue between the distal phalanx of the supported digit and the sole horn on a slatted floor with only one digit supported by flooring. The largest strain predicted for the soft tissue between the sole horn and the distal phalanges for claws that were only supported in the dorsal half was 4%, and was located below the dorsal tip of the bone. Compared with our own findings on a flat solid floor (we found relative compression of 40% and more at a similar load) the FEM seems to considerably underestimate mechanical stress in the soft tissue layer under the distal phalanx. Moreover, none of the FEM-predictions located the highest strain in the sole-area where sole ulcers and sole haemorrhages are most frequently found, like our study did. The FEM is based on a CT scan of an unloaded dissected hind limb, and presumably the load induced deformations that we were able to capture are not accounted for by the material properties of the FEM. In line with this, Salo et al. (2010) showed that strain calculated with a FEM can considerably differ from in vivo measured values at the equine hoof wall. The fact that comparative studies have not shown unambiguously detrimental effects of slatted vs. solid flooring on claw health can be caused by moderate impact of short term peak load vs. lower but sustained load. Moreover, cows could avoid partial support of their claws by placing their feet on the slats, but we have no indication at all that they do so (Ouweltjes et al., 2011).Bone development within the tuberculum flexorium contributes to the development of sole haemorrhages and sole ulcers (Tsuka et al., 2012; Newsome et al., 2016). According to Newsome et al. (2016), the process is stimulated by claw horn disruption lesions and increases with aging. Although the mechanism behind this bone formation in unclear, it is hypothesized that laminitis related ‘sinking’ of the distal phalanx is involved (Tsuka et al., 2012). This phenomenon probably contributes to the concentration of strain in the typical sole ulcer area.The two in vivo experiments performed for this study both provided some evidence for the impact of mechanical load on claw tissues, and this corresponds well with the results from the load deformation experiments. The study described in Chapter 2 revealed that lying time decreased on rubber flooring, and similarly Hernandez-Mendo et al. (2007) reported that grazing cows had reduced lying times vs. cows kept indoors (10.9 vs. 12.3 h/d). They also

Chapter 6
132
reported a larger number of lying bouts (15.3 vs. 12.2) and improved locomotion for grazing cows. Presumably, animals with poor claw health lie down for longer, and because they have more difficulty getting up and lying down they also have longer lying bouts. It is not likely that lying behaviour characterised by long lying bout duration and long lying time causes impaired claw health, because during the lying bouts the claws are not loaded.Van Gastelen et al. (2011) reported decreased time needed to lay down and shorter lying bouts on comfortable bedding. Leonard et al. (1994) reported that more spacious and bedded cubicles coincided with more lying time compared with smaller cubicles without bedding. Solano et al. (2015) reported higher lameness risks in barns with low-comfort bedding and Barker et al. (2009) identified cubicles with sparse bedding as risk factor for sole ulcers. Thestudy described in Chapter 3 and the studies of Leonard et al. (1996), Fregonesi et al. (2007a)and Winckler et al. (2015) all indicate that impaired lying provisions result in both reduced lying time and prolonged standing bouts. Reduced lying duration on less comfortable bedding is also found by authors who did not report standing bout lengths (Leonard et al., 1994; Tucker and Weary, 2004; Fregonesi et al., 2007b; Norring et al., 2008; Norring et al., 2010).Presumably poor lying conditions induce behavioural changes that can impair claw health and locomotion: more standing time and longer standing bout duration. More standing time means more time that the claws are loaded, and prolonged standing bouts mean more episodes of sustained moderate load with compressive strain in the soft tissues under the distal phalanges. This could impair blood circulation in the claws, and cause tissue damage.Cook and Nordlund (2009) argued that prevalence of lameness can be minimised by providing optimal lying provisions such that time spent resting is not compromised. Comparison with pasture suggests however that long lying time with good lying provisions also can indicate poor comfort while standing. Soft alley flooring in cubicle barns has beneficial effects on non-infectious claw disorders, and indications are found that they provide more comfort. Overall effects of flooring on claw health may be mitigated by impaired hygiene. Events such as displacements (due to rank conflicts) could go together with short episodes of high peak loads. Cow level risk factors, such as parturition, aging and BCS could also be linked with mechanical load through behavioural or physiological effects. Soft flooring can directly cause reduced peak loads, particularly during locomotion, but also indirectly reduce load on the area vulnerable for overloading by conserving concavity of the sole. This can particularly be beneficial for claw tissues during more sustained loading.
1.5 PerspectivesAlthough sound locomotion requires healthy feet, cows diagnosed with claw disorders at trimming often are not considered clinically lame (Smits et al., 1992; Manske et al., 2002; Somers et al., 2003). Currently, the gold standard to assess claw health is to record abnormalities during trimming (Egger-Danner et al., 2015). However, claw trimming is laborious and not suited for day to day health management. Gait scoring systems for cattle are typically developed to detect lame cows that should be inspected in a trimming box, but have limited validity for claw health management due to the occurrence of subclinical claw
General Discussion
133
disorders (Schlageter Tello, 2015) and often are too laborious to be implemented (García-Muñoz et al., 2016). However, numerous studies have reported promising results for either improved visual lameness detection (Hoffman et al., 2014; García-Muñoz et al., 2016) or automated monitoring systems. The latter can be based on video image analysis (Abdul Jabbar et al., 2017), accelerometers (Thorup et al., 2015; Alsaaod et al., 2017), force plates (Walker et al., 2010; Ghotoorlar et al., 2012; Skjøth et al., 2013; Thorup et al., 2014), pressure mats (Van Nuffel et al., 2015; Van De Gucht et al., 2017) and/or GPS data (Williams et al., 2016). Although these systems probably need to be optimised and validated for practical use, it can be expected that automated farm management tools will become available in the coming years. These can contribute to improved claw health management at dairy farms. Moreover, image analysis could be used to evaluate and improve trimming (Vlček et al., 2017).
1.5.1 MANAGERIAL CONSEQUENCESTo optimize claw health, it is important to avoid situations where cows have to remain standing for prolonged periods. This can be achieved by providing lying space that does not restrict lying down and getting up movements and has dry and comfortable bedding in such a quantity that all animals can lie down simultaneously, and having a capacity of the milking parlour that does not require long standing in the holding area. Particularly in areas where cows are turning, soft flooring can be implemented, in combination with adequate cleaning. Pedometers can be used both to monitor time budgets and locomotion, and thus can help to detect moderately lame cows or cows at risk in an early stage. The latter could temporarily be housed in e.g. hospital pens or straw yards. Furthermore, preventive trimming at regular intervals by certified professional claw trimmers is recommended, unless the claw inspections at trimming reveal that trimming is only incidentally needed. Moreover, it is recommended to record the lesions electronically during trimming such that the claw health status of the farm can be evaluated. If infectious lesions are prevalent on the farm, footbaths can be applied according to correct guidelines, in combination with effective cleaning of the alley floors. It is also recommended to regularly evaluate the effect of claw therapies applied for cows with claw lesions. Evaluation of management of cows during the dry period and around parturition and the strategy to introduce heifers in the milking herd can contribute to an optimal start of the first and later lactations. Although it is a long term procedure, selection of semen from bulls with favourable breeding values for claw health also can contribute to improved claw health.
1.5.2 RESEARCH OPPORTUNITIESThe existing FEM of bovine claws can be improved substantially. This study shows that more accurate estimates of material properties are required to enable more accurate predictions of internal load distribution, particularly in the soft tissues under the distal phalanx. An improved FEM is useful to predict effects of different external loading patterns (e.g. floors

6
Chapter 6
132
reported a larger number of lying bouts (15.3 vs. 12.2) and improved locomotion for grazing cows. Presumably, animals with poor claw health lie down for longer, and because they have more difficulty getting up and lying down they also have longer lying bouts. It is not likely that lying behaviour characterised by long lying bout duration and long lying time causes impaired claw health, because during the lying bouts the claws are not loaded.Van Gastelen et al. (2011) reported decreased time needed to lay down and shorter lying bouts on comfortable bedding. Leonard et al. (1994) reported that more spacious and bedded cubicles coincided with more lying time compared with smaller cubicles without bedding. Solano et al. (2015) reported higher lameness risks in barns with low-comfort bedding and Barker et al. (2009) identified cubicles with sparse bedding as risk factor for sole ulcers. Thestudy described in Chapter 3 and the studies of Leonard et al. (1996), Fregonesi et al. (2007a)and Winckler et al. (2015) all indicate that impaired lying provisions result in both reduced lying time and prolonged standing bouts. Reduced lying duration on less comfortable bedding is also found by authors who did not report standing bout lengths (Leonard et al., 1994; Tucker and Weary, 2004; Fregonesi et al., 2007b; Norring et al., 2008; Norring et al., 2010).Presumably poor lying conditions induce behavioural changes that can impair claw health and locomotion: more standing time and longer standing bout duration. More standing time means more time that the claws are loaded, and prolonged standing bouts mean more episodes of sustained moderate load with compressive strain in the soft tissues under the distal phalanges. This could impair blood circulation in the claws, and cause tissue damage.Cook and Nordlund (2009) argued that prevalence of lameness can be minimised by providing optimal lying provisions such that time spent resting is not compromised. Comparison with pasture suggests however that long lying time with good lying provisions also can indicate poor comfort while standing. Soft alley flooring in cubicle barns has beneficial effects on non-infectious claw disorders, and indications are found that they provide more comfort. Overall effects of flooring on claw health may be mitigated by impaired hygiene. Events such as displacements (due to rank conflicts) could go together with short episodes of high peak loads. Cow level risk factors, such as parturition, aging and BCS could also be linked with mechanical load through behavioural or physiological effects. Soft flooring can directly cause reduced peak loads, particularly during locomotion, but also indirectly reduce load on the area vulnerable for overloading by conserving concavity of the sole. This can particularly be beneficial for claw tissues during more sustained loading.
1.5 PerspectivesAlthough sound locomotion requires healthy feet, cows diagnosed with claw disorders at trimming often are not considered clinically lame (Smits et al., 1992; Manske et al., 2002; Somers et al., 2003). Currently, the gold standard to assess claw health is to record abnormalities during trimming (Egger-Danner et al., 2015). However, claw trimming is laborious and not suited for day to day health management. Gait scoring systems for cattle are typically developed to detect lame cows that should be inspected in a trimming box, but have limited validity for claw health management due to the occurrence of subclinical claw
General Discussion
133
disorders (Schlageter Tello, 2015) and often are too laborious to be implemented (García-Muñoz et al., 2016). However, numerous studies have reported promising results for either improved visual lameness detection (Hoffman et al., 2014; García-Muñoz et al., 2016) or automated monitoring systems. The latter can be based on video image analysis (Abdul Jabbar et al., 2017), accelerometers (Thorup et al., 2015; Alsaaod et al., 2017), force plates (Walker et al., 2010; Ghotoorlar et al., 2012; Skjøth et al., 2013; Thorup et al., 2014), pressure mats (Van Nuffel et al., 2015; Van De Gucht et al., 2017) and/or GPS data (Williams et al., 2016). Although these systems probably need to be optimised and validated for practical use, it can be expected that automated farm management tools will become available in the coming years. These can contribute to improved claw health management at dairy farms. Moreover, image analysis could be used to evaluate and improve trimming (Vlček et al., 2017).
1.5.1 MANAGERIAL CONSEQUENCESTo optimize claw health, it is important to avoid situations where cows have to remain standing for prolonged periods. This can be achieved by providing lying space that does not restrict lying down and getting up movements and has dry and comfortable bedding in such a quantity that all animals can lie down simultaneously, and having a capacity of the milking parlour that does not require long standing in the holding area. Particularly in areas where cows are turning, soft flooring can be implemented, in combination with adequate cleaning. Pedometers can be used both to monitor time budgets and locomotion, and thus can help to detect moderately lame cows or cows at risk in an early stage. The latter could temporarily be housed in e.g. hospital pens or straw yards. Furthermore, preventive trimming at regular intervals by certified professional claw trimmers is recommended, unless the claw inspections at trimming reveal that trimming is only incidentally needed. Moreover, it is recommended to record the lesions electronically during trimming such that the claw health status of the farm can be evaluated. If infectious lesions are prevalent on the farm, footbaths can be applied according to correct guidelines, in combination with effective cleaning of the alley floors. It is also recommended to regularly evaluate the effect of claw therapies applied for cows with claw lesions. Evaluation of management of cows during the dry period and around parturition and the strategy to introduce heifers in the milking herd can contribute to an optimal start of the first and later lactations. Although it is a long term procedure, selection of semen from bulls with favourable breeding values for claw health also can contribute to improved claw health.
1.5.2 RESEARCH OPPORTUNITIESThe existing FEM of bovine claws can be improved substantially. This study shows that more accurate estimates of material properties are required to enable more accurate predictions of internal load distribution, particularly in the soft tissues under the distal phalanx. An improved FEM is useful to predict effects of different external loading patterns (e.g. floors

Chapter 6
134
with different degrees of compliance or different textures) on internal load distribution and as a consequence on claw health.Relationships between behaviour and claw health can be determined with automated detection systems for claw health and behavioural monitoring (e.g. accelerometers and image analysis). This is useful to evaluate effects of housing systems on behaviour and claw health. This in turn can be used to substantiate policies to stimulate investments, and can also be applied in welfare assessment schemes. Moreover, effects of interventions on claw can be determined accurately.
1.6 ConclusionsFrom the study reported in Chapter 2 it can be concluded that concave hoof trimming is not beneficial for dairy cows kept on concrete flooring. Rubber topping on concrete slatted flooring causes reduced prevalence of sole haemorrhages, but floor cleaning with scraping systems designed for slatted concrete flooring is less effective on rubber topped slatted flooring (Chapter 2 and Chapter 3). Considerable compressive strain can occur in the soft tissues between the distal phalanx and the sole in the area known as the typical place for sole ulcers, both in lateral and medial hind claws (Chapter 5). Particularly cows with flat soles are at risk. The results of the studies included in this thesis suggest that moderate load such as experienced during standing is sufficient to cause compressive strain in the soft tissues under the distal phalanges and cause discomfort for the animal. This could at least partly explain the interacting effects of flooring and lying conditions on development of non-infectious claw lesions, but also the behavioural patterns that can be linked to claw horn lesions. It is likely that long standing is detrimental for claw health. Although this study has revealed load induced internal deformations of cattle claws, the internal load distribution is not fully understood.
General Discussion
135
REFERENCES Abdul Jabbar, K., Hansen, M.F., Smith, M.L., Smith, L.N., 2017. Early and non-intrusive
lameness detection in dairy cows using 3-dimensional video. Biosystems Engineering 153, 63-69.
Alsaaod, M., Luternauer, M., Hausegger, T., Kredel, R., Steiner, A., 2017. The cow pedogram—Analysis of gait cycle variables allows the detection of lameness and foot pathologies. Journal of Dairy Science 100, 1417-1426.
Amory, J., Kloosterman, P., Barker, Z., Wright, J.L., Blowey, R., Green, L.E., 2006. Risk factors for reduced locomotion in dairy cattle on nineteen farms in the Netherlands. Journal of Dairy Science 89, 1509-1515.
Archer, S.C., Newsome, R., Dibble, H., Sturrock, C.J., Chagunda, M.G.G., Mason, C.S.,Huxley, J.N., 2015. Claw length recommendations for dairy cow foot trimming. Veterinary Record 177, 222-222.
Barker, Z.E., Amory, J.R., Wright, J.L., Mason, S.A., Blowey, R.W., Green, L.E., 2009. Risk factors for increased rates of sole ulcers, white line disease, and digital dermatitis in dairy cattle from twenty-seven farms in England and Wales. Journal of Dairy Science 92, 1971-1978.
Barker, Z.E., Leach, K.A., Whay, H.R., Bell, N.J., Main, D.C.J., 2010. Assessment of lameness prevalence and associated risk factors in dairy herds in England and Wales. Journal of Dairy Science 93, 932-941.
Bell, N.J., Bell, M.J., Knowles, T.G., Whay, H.R., Main, D.J., Webster, A.J.F., 2009. The development, implementation and testing of a lameness control programme based onHACCP principles and designed for heifers on dairy farms. The Veterinary Journal 180, 178-188.
Bergsten, C., Herlin, A.H., 1996. Sole haemorrhages and heel horn erosion in dairy cows: The influence of housing system on their prevalence and severity. Acta Veterinaria Scandinavica 37, 395-408.
Bernardi, F., Fregonesi, J., Winckler, C., Veira, D.M., von Keyserlingk, M.A.G., Weary, D.M., 2009. The stall-design paradox: Neck rails increase lameness but improve udder and stall hygiene. Journal of Dairy Science 92, 3074-3080.
Bicalho, R.C., Oikonomou, G., 2013. Control and prevention of lameness associated with claw lesions in dairy cows. Livestock Science 156, 96-105.
Borderas, T.F., Pawluczuk, B., de Passille, A.M., Rushen, J., 2004. Claw hardness of dairy cows: Relationship to water content and claw lesions. Journal of Dairy Science 87, 2085-2093.
Bruijnis, M.R.N., Hogeveen, H., Stassen, E.N., 2010. Assessing economic consequences of foot disorders in dairy cattle using a dynamic stochastic simulation model. Journal of Dairy Science 93, 2419-2432.
Cook, N.B., Nordlund, K.V., 2009. The influence of the environment on dairy cow behavior, claw health and herd lameness dynamics. The Veterinary Journal 179, 360-369.

6
Chapter 6
134
with different degrees of compliance or different textures) on internal load distribution and as a consequence on claw health.Relationships between behaviour and claw health can be determined with automated detection systems for claw health and behavioural monitoring (e.g. accelerometers and image analysis). This is useful to evaluate effects of housing systems on behaviour and claw health. This in turn can be used to substantiate policies to stimulate investments, and can also be applied in welfare assessment schemes. Moreover, effects of interventions on claw can be determined accurately.
1.6 ConclusionsFrom the study reported in Chapter 2 it can be concluded that concave hoof trimming is not beneficial for dairy cows kept on concrete flooring. Rubber topping on concrete slatted flooring causes reduced prevalence of sole haemorrhages, but floor cleaning with scraping systems designed for slatted concrete flooring is less effective on rubber topped slatted flooring (Chapter 2 and Chapter 3). Considerable compressive strain can occur in the soft tissues between the distal phalanx and the sole in the area known as the typical place for sole ulcers, both in lateral and medial hind claws (Chapter 5). Particularly cows with flat soles are at risk. The results of the studies included in this thesis suggest that moderate load such as experienced during standing is sufficient to cause compressive strain in the soft tissues under the distal phalanges and cause discomfort for the animal. This could at least partly explain the interacting effects of flooring and lying conditions on development of non-infectious claw lesions, but also the behavioural patterns that can be linked to claw horn lesions. It is likely that long standing is detrimental for claw health. Although this study has revealed load induced internal deformations of cattle claws, the internal load distribution is not fully understood.
General Discussion
135
REFERENCES Abdul Jabbar, K., Hansen, M.F., Smith, M.L., Smith, L.N., 2017. Early and non-intrusive
lameness detection in dairy cows using 3-dimensional video. Biosystems Engineering 153, 63-69.
Alsaaod, M., Luternauer, M., Hausegger, T., Kredel, R., Steiner, A., 2017. The cow pedogram—Analysis of gait cycle variables allows the detection of lameness and foot pathologies. Journal of Dairy Science 100, 1417-1426.
Amory, J., Kloosterman, P., Barker, Z., Wright, J.L., Blowey, R., Green, L.E., 2006. Risk factors for reduced locomotion in dairy cattle on nineteen farms in the Netherlands. Journal of Dairy Science 89, 1509-1515.
Archer, S.C., Newsome, R., Dibble, H., Sturrock, C.J., Chagunda, M.G.G., Mason, C.S.,Huxley, J.N., 2015. Claw length recommendations for dairy cow foot trimming. Veterinary Record 177, 222-222.
Barker, Z.E., Amory, J.R., Wright, J.L., Mason, S.A., Blowey, R.W., Green, L.E., 2009. Risk factors for increased rates of sole ulcers, white line disease, and digital dermatitis in dairy cattle from twenty-seven farms in England and Wales. Journal of Dairy Science 92, 1971-1978.
Barker, Z.E., Leach, K.A., Whay, H.R., Bell, N.J., Main, D.C.J., 2010. Assessment of lameness prevalence and associated risk factors in dairy herds in England and Wales. Journal of Dairy Science 93, 932-941.
Bell, N.J., Bell, M.J., Knowles, T.G., Whay, H.R., Main, D.J., Webster, A.J.F., 2009. The development, implementation and testing of a lameness control programme based onHACCP principles and designed for heifers on dairy farms. The Veterinary Journal 180, 178-188.
Bergsten, C., Herlin, A.H., 1996. Sole haemorrhages and heel horn erosion in dairy cows: The influence of housing system on their prevalence and severity. Acta Veterinaria Scandinavica 37, 395-408.
Bernardi, F., Fregonesi, J., Winckler, C., Veira, D.M., von Keyserlingk, M.A.G., Weary, D.M., 2009. The stall-design paradox: Neck rails increase lameness but improve udder and stall hygiene. Journal of Dairy Science 92, 3074-3080.
Bicalho, R.C., Oikonomou, G., 2013. Control and prevention of lameness associated with claw lesions in dairy cows. Livestock Science 156, 96-105.
Borderas, T.F., Pawluczuk, B., de Passille, A.M., Rushen, J., 2004. Claw hardness of dairy cows: Relationship to water content and claw lesions. Journal of Dairy Science 87, 2085-2093.
Bruijnis, M.R.N., Hogeveen, H., Stassen, E.N., 2010. Assessing economic consequences of foot disorders in dairy cattle using a dynamic stochastic simulation model. Journal of Dairy Science 93, 2419-2432.
Cook, N.B., Nordlund, K.V., 2009. The influence of the environment on dairy cow behavior, claw health and herd lameness dynamics. The Veterinary Journal 179, 360-369.

Chapter 6
136
Distl, O., Mair, A., 1993. Computerized analysis of pedobarometric forces in cattle at the ground surface/floor interface. Computers and Electronics in Agriculture 8, 237-250.
EFSA, 2009a. Scientific opinion on the overall effects of farming systems on dairy cow welfare and disease. EFSA Journal 7 (1143), 1-38.
EFSA, 2009b. Scientific opinion on welfare of dairy cows in relation to leg and locomotion problems based on a risk assessment with special reference to the impact of housing, feeding, management and genetic selection. EFSA Journal 7 (1142), 1-57.
Egger-Danner, C., Nielsen, P., Fiedler, A., Müller, K., Fjeldaas, T., Döpfer, D., Daniel, V., Bergsten, C., Cramer, G., Christen, A.M., Stock, K.F., Thomas, G., Holzhauer, M., Steiner, A., Clarke, J., Capion, N., Charfeddine, N., Pryce, E., Oakes, E., Burgstaller, J., Heringstad, B., Ødegǻrd, C., Kofler, J., 2015. ICAR Claw Health Atlas. International Committee for Animal Recording (ICAR), Rome, 45 pp.
Espejo, L.A., Endres, M.I., Salfer, J.A., 2006. Prevalence of lameness in high-producing Holstein cows housed in freestall barns in Minnesota. Journal of Dairy Science 89, 3052-3058.
Fabian, J., Laven, R.A., Whay, H.R., 2014. The prevalence of lameness on New Zealand dairy farms: A comparison of farmer estimate and locomotion scoring. The Veterinary Journal 201, 31-38.
Faull, W.B., Hughes, J.W., Clarkson, M.J., Downham, D.Y., Manson, F.J., Merritt, J.B., Murray, R.D., Russell, W.B., Sutherst, J.E., Ward, W.R., 1996. Epidemiology of lameness in dairy cattle: the influence of cubicles and indoor and outdoor walkingsurfaces. Veterinary Record 139, 130-136.
Fjeldaas, T., Sogstad, Å., Østerås, O., 2011. Locomotion and claw disorders in Norwegian dairy cows housed in freestalls with slatted concrete, solid concrete, or solid rubber flooring in the alleys. Journal of Dairy Science 94, 1243-1255.
Frankena, K., Somers, J.G.C.J., Schouten, W.G.P., van Stek, J.V., Metz, J.H.M., Stassen, E.N., Graat, E.A.M., 2009. The effect of digital lesions and floor type on locomotion score in Dutch dairy cows. Preventive Veterinary Medicine 88, 150-157.
Fregonesi, J.A., Tucker, C.B., Weary, D.M., 2007a. Overstocking reduces lying time in dairy cows. Journal of Dairy Science 90, 3349-3354.
Fregonesi, J.A., Veira, D.M., von Keyserlingk, M.A.G., Weary, D.M., 2007b. Effects of bedding quality on lying behavior of dairy cows. Journal of Dairy Science 90, 5468-5472.
García-Muñoz, A., Singh, N., Leonardi, C., Silva-del-Río, N., 2017. Effect of hoof trimmer intervention in moderately lame cows on lameness progression and milk yield. Journal of Dairy Science 100, 9205-9214.
García-Muñoz, A., Vidal, G., Singh, N., Silva-del-Río, N., 2016. Evaluation of two methodologies for lameness detection in dairy cows based on postural and gait abnormalities observed during milking and while restrained at headlock stanchions. Preventive Veterinary Medicine 128, 33-40.
Ghotoorlar, S.M., Ghamsari, S.M., Nowrouzian, I., Ghotoorlar, S.M., Ghidary, S.S., 2012. Lameness scoring system for dairy cows using force plates and artificial intelligence. Veterinary Record 170, 126-126.
General Discussion
137
Haufe, H.C., Gygax, L., Steiner, B., Friedli, K., Stauffacher, M., Wechsler, B., 2009. Influence of floor type in the walking area of cubicle housing systems on the behaviour of dairy cows. Applied Animal Behaviour Science 116, 21-27.
Hernandez-Mendo, O., Von Keyserlingk, M., Veira, D., Weary, D., 2007. Effects of pasture on lameness in dairy cows. Journal of Dairy Science 90, 1209-1214.
Hinterhofer, C., Haider, H., Apprich, V., Ferguson, J.C., Collins, S.N., Stanek, C., 2009. Development of a twenty-one-component finite element distal hind limb model: Stress and strain in bovine digit structures as a result of loading on different floorings. Journal of Dairy Science 92, 972-979.
Hoffman, A.C., Moore, D.A., Vanegas, J., Wenz, J.R., 2014. Association of abnormal hind-limb postures and back arch with gait abnormality in dairy cattle. Journal of Dairy Science 97, 2178-2185.
Holzhauer, M., 2006. Claw health in dairy cows in the Netherlands. Epidemiological aspects of different claw disorders in dairy cattle in the Netherlands. PhD thesis, Veterinary Faculty Utrecht University, Utrecht, the Netherlands.
Ivemeyer, S., Smolders, G., Brinkmann, J., Gratzer, E., Hansen, B., Henriksen, B.I.F., Huber, J., Leeb, C., March, S., Mejdell, C., Nicholas, P., Roderick, S., Stöger, E., Vaarst, M., Whistance, L.K., Winckler, C., Walkenhorst, M., 2012. Impact of animal health and welfare planning on medicine use, herd health and production in European organic dairy farms. Livestock Science 145, 63-72.
Knott, L., Tarlton, J.F., Craft, H., Webster, A.J.F., 2007. Effects of housing, parturition and diet change on the biochemistry and biomechanics of the support structures of the hoof of dairy heifers. The Veterinary Journal 174, 277-287.
Krebs, N., Berry, S.L., Tucker, C.B., 2011. Restless behavior increases over time, but not with compressibility of the flooring surface, during forced standing at the feed bunk. Journal of Dairy Science 94, 97-105.
Kremer, P., Nueske, S., Scholz, A., Foerster, M., 2007. Comparison of claw health and milk yield in dairy cows on elastic or concrete flooring. Journal of Dairy Science 90, 4603-4611.
Leach, K.A., Whay, H.R., Maggs, C.M., Barker, Z.E., Paul, E.S., Bell, A.K., Main, D.C.J., 2010. Working towards a reduction in cattle lameness: 1. Understanding barriers to lameness control on dairy farms. Research in Veterinary Science 89, 311-317.
Leonard, F.C., O'connell, J., O'farrell, K., 1994. Effect of different housing conditions on behavior and foot lesions in Friesian Heifers. Veterinary Record 134, 490-494.
Leonard, F.C., Oconnell, J.M., Ofarrell, K.J., 1996. Effect of overcrowding on claw health in first-calved Friesian heifers. Brithsh Veterinary Journal 152, 459-472.
Logue, D.N., Offer, J.E., Kempson, S.A., 1993. Lameness in dairy cattle. Irish Veterinary Journal 46, 47-58.
Mahendran, S.A., Huxley, J.N., Chang, Y.M., Burnell, M., Barrett, D.C., Whay, H.R., Blackmore, T., Mason, C.S., Bell, N.J., 2017. Randomised controlled trial to evaluate the effect of foot trimming before and after first calving on subsequent lameness episodes and productivity in dairy heifers. The Veterinary Journal 220, 105-110.

6
Chapter 6
136
Distl, O., Mair, A., 1993. Computerized analysis of pedobarometric forces in cattle at the ground surface/floor interface. Computers and Electronics in Agriculture 8, 237-250.
EFSA, 2009a. Scientific opinion on the overall effects of farming systems on dairy cow welfare and disease. EFSA Journal 7 (1143), 1-38.
EFSA, 2009b. Scientific opinion on welfare of dairy cows in relation to leg and locomotion problems based on a risk assessment with special reference to the impact of housing, feeding, management and genetic selection. EFSA Journal 7 (1142), 1-57.
Egger-Danner, C., Nielsen, P., Fiedler, A., Müller, K., Fjeldaas, T., Döpfer, D., Daniel, V., Bergsten, C., Cramer, G., Christen, A.M., Stock, K.F., Thomas, G., Holzhauer, M., Steiner, A., Clarke, J., Capion, N., Charfeddine, N., Pryce, E., Oakes, E., Burgstaller, J., Heringstad, B., Ødegǻrd, C., Kofler, J., 2015. ICAR Claw Health Atlas. International Committee for Animal Recording (ICAR), Rome, 45 pp.
Espejo, L.A., Endres, M.I., Salfer, J.A., 2006. Prevalence of lameness in high-producing Holstein cows housed in freestall barns in Minnesota. Journal of Dairy Science 89, 3052-3058.
Fabian, J., Laven, R.A., Whay, H.R., 2014. The prevalence of lameness on New Zealand dairy farms: A comparison of farmer estimate and locomotion scoring. The Veterinary Journal 201, 31-38.
Faull, W.B., Hughes, J.W., Clarkson, M.J., Downham, D.Y., Manson, F.J., Merritt, J.B., Murray, R.D., Russell, W.B., Sutherst, J.E., Ward, W.R., 1996. Epidemiology of lameness in dairy cattle: the influence of cubicles and indoor and outdoor walkingsurfaces. Veterinary Record 139, 130-136.
Fjeldaas, T., Sogstad, Å., Østerås, O., 2011. Locomotion and claw disorders in Norwegian dairy cows housed in freestalls with slatted concrete, solid concrete, or solid rubber flooring in the alleys. Journal of Dairy Science 94, 1243-1255.
Frankena, K., Somers, J.G.C.J., Schouten, W.G.P., van Stek, J.V., Metz, J.H.M., Stassen, E.N., Graat, E.A.M., 2009. The effect of digital lesions and floor type on locomotion score in Dutch dairy cows. Preventive Veterinary Medicine 88, 150-157.
Fregonesi, J.A., Tucker, C.B., Weary, D.M., 2007a. Overstocking reduces lying time in dairy cows. Journal of Dairy Science 90, 3349-3354.
Fregonesi, J.A., Veira, D.M., von Keyserlingk, M.A.G., Weary, D.M., 2007b. Effects of bedding quality on lying behavior of dairy cows. Journal of Dairy Science 90, 5468-5472.
García-Muñoz, A., Singh, N., Leonardi, C., Silva-del-Río, N., 2017. Effect of hoof trimmer intervention in moderately lame cows on lameness progression and milk yield. Journal of Dairy Science 100, 9205-9214.
García-Muñoz, A., Vidal, G., Singh, N., Silva-del-Río, N., 2016. Evaluation of two methodologies for lameness detection in dairy cows based on postural and gait abnormalities observed during milking and while restrained at headlock stanchions. Preventive Veterinary Medicine 128, 33-40.
Ghotoorlar, S.M., Ghamsari, S.M., Nowrouzian, I., Ghotoorlar, S.M., Ghidary, S.S., 2012. Lameness scoring system for dairy cows using force plates and artificial intelligence. Veterinary Record 170, 126-126.
General Discussion
137
Haufe, H.C., Gygax, L., Steiner, B., Friedli, K., Stauffacher, M., Wechsler, B., 2009. Influence of floor type in the walking area of cubicle housing systems on the behaviour of dairy cows. Applied Animal Behaviour Science 116, 21-27.
Hernandez-Mendo, O., Von Keyserlingk, M., Veira, D., Weary, D., 2007. Effects of pasture on lameness in dairy cows. Journal of Dairy Science 90, 1209-1214.
Hinterhofer, C., Haider, H., Apprich, V., Ferguson, J.C., Collins, S.N., Stanek, C., 2009. Development of a twenty-one-component finite element distal hind limb model: Stress and strain in bovine digit structures as a result of loading on different floorings. Journal of Dairy Science 92, 972-979.
Hoffman, A.C., Moore, D.A., Vanegas, J., Wenz, J.R., 2014. Association of abnormal hind-limb postures and back arch with gait abnormality in dairy cattle. Journal of Dairy Science 97, 2178-2185.
Holzhauer, M., 2006. Claw health in dairy cows in the Netherlands. Epidemiological aspects of different claw disorders in dairy cattle in the Netherlands. PhD thesis, Veterinary Faculty Utrecht University, Utrecht, the Netherlands.
Ivemeyer, S., Smolders, G., Brinkmann, J., Gratzer, E., Hansen, B., Henriksen, B.I.F., Huber, J., Leeb, C., March, S., Mejdell, C., Nicholas, P., Roderick, S., Stöger, E., Vaarst, M., Whistance, L.K., Winckler, C., Walkenhorst, M., 2012. Impact of animal health and welfare planning on medicine use, herd health and production in European organic dairy farms. Livestock Science 145, 63-72.
Knott, L., Tarlton, J.F., Craft, H., Webster, A.J.F., 2007. Effects of housing, parturition and diet change on the biochemistry and biomechanics of the support structures of the hoof of dairy heifers. The Veterinary Journal 174, 277-287.
Krebs, N., Berry, S.L., Tucker, C.B., 2011. Restless behavior increases over time, but not with compressibility of the flooring surface, during forced standing at the feed bunk. Journal of Dairy Science 94, 97-105.
Kremer, P., Nueske, S., Scholz, A., Foerster, M., 2007. Comparison of claw health and milk yield in dairy cows on elastic or concrete flooring. Journal of Dairy Science 90, 4603-4611.
Leach, K.A., Whay, H.R., Maggs, C.M., Barker, Z.E., Paul, E.S., Bell, A.K., Main, D.C.J., 2010. Working towards a reduction in cattle lameness: 1. Understanding barriers to lameness control on dairy farms. Research in Veterinary Science 89, 311-317.
Leonard, F.C., O'connell, J., O'farrell, K., 1994. Effect of different housing conditions on behavior and foot lesions in Friesian Heifers. Veterinary Record 134, 490-494.
Leonard, F.C., Oconnell, J.M., Ofarrell, K.J., 1996. Effect of overcrowding on claw health in first-calved Friesian heifers. Brithsh Veterinary Journal 152, 459-472.
Logue, D.N., Offer, J.E., Kempson, S.A., 1993. Lameness in dairy cattle. Irish Veterinary Journal 46, 47-58.
Mahendran, S.A., Huxley, J.N., Chang, Y.M., Burnell, M., Barrett, D.C., Whay, H.R., Blackmore, T., Mason, C.S., Bell, N.J., 2017. Randomised controlled trial to evaluate the effect of foot trimming before and after first calving on subsequent lameness episodes and productivity in dairy heifers. The Veterinary Journal 220, 105-110.

Chapter 6
138
Manning, A., Mahendran, S., Bell, N.J., 2016. Evidence base behind foot trimming in UK dairy cattle. Livestock 21, 6-14.
Manske, T., Hultgren, J., Bergsten, C., 2002. Prevalence and interrelationships of hoof lesions and lameness in Swedish dairy cows. Preventive Veterinary Medicine 54, 247-263.
Murray, R.D., 1996. Epidemiology of lameness in dairy cattle: Description and analysis of foot lesions. Veterinary Record 138.
Neveux, S., Weary, D.M., Rushen, J., von Keyserlingk, M.A.G., de Passillé, A.M., 2006. Hoof discomfort changes how dairy cattle distribute their body weight. Journal of Dairy Science 89, 2503-2509.
Newsome, R., Green, M.J., Bell, N.J., Chagunda, M.G.G., Mason, C.S., Rutland, C.S., Sturrock, C.J., Whay, H.R., Huxley, J.N., 2016. Linking bone development on the caudal aspect of the distal phalanx with lameness during life. Journal of Dairy Science 99, 4512-4525.
Newsome, R.F., Green, M.J., Bell, N.J., Bollard, N.J., Mason, C.S., Whay, H.R., Huxley, J.N., 2017. A prospective cohort study of digital cushion and corium thickness. Part 2: Does thinning of the digital cushion and corium lead to lameness and claw horn disruption lesions? Journal of Dairy Science 100, 4759-4771.
Norring, M., Manninen, E., de Passillé, A.M., Rushen, J., Munksgaard, L., Saloniemi, H., 2008. Effects of sand and straw bedding on the lying behavior, cleanliness, and hoof and hock injuries of dairy cows. Journal of Dairy Science 91, 570-576.
Norring, M., Manninen, E., de Passillé, A.M., Rushen, J., Saloniemi, H., 2010. Preferences of dairy cows for three stall surface materials with small amounts of bedding. Journal of Dairy Science 93, 70-74.
Nuss, K., 2014. The role of biomechanical factors in the development of sole ulcer in dairy cattle. Cattle Lameness Conference, Worcester. The Dairy Group, Taunton, UK, pp. 1-11.
Nuss, K., Paulus, N., 2006. Measurements of claw dimensions in cows before and after functional trimming: A post-mortem study. The Veterinary Journal 172, 284-292.
Ouweltjes, W., Priester, M., Beerda, B., 2011. Walking and standing on slatted floors: do cows avoid slat space? 16th International Symposium and 8th conference on Lameness in Ruminants, Rotorua, New Zealand.
Potterton, S.L., Bell, N.J., Whay, H.R., Berry, E.A., Atkinson, O.C.D., Dean, R.S., Main, D.C.J., Huxley, J.N., 2012. A descriptive review of the peer and non-peer reviewed literature on the treatment and prevention of foot lameness in cattle published between 2000 and 2011. The Veterinary Journal 193, 612-616.
Rutherford, K.M.D., Langford, F.M., Jack, M.C., Sherwood, L., Lawrence, A.B., Haskell, M.J., 2009. Lameness prevalence and risk factors in organic and non-organic dairy herds in the United Kingdom. The Veterinary Journal 180, 95-105.
Salo, Z., Thomason, J.J., Runciman, R.J., 2010. Analysis of strain and stress in the equine hoof using finite element analysis: Comparison with minimum principal strains recorded in vivo. Biosystems Engineering 107, 262-270.
General Discussion
139
Sanders, A.H., Shearer, J.K., De Vries, A., 2009. Seasonal incidence of lameness and risk factors associated with thin soles, white line disease, ulcers, and sole punctures in dairy cattle. Journal of Dairy Science 92, 3165-3174.
Sarjokari, K., Kaustell, K.O., Hurme, T., Kivinen, T., Peltoniemi, O.A.T., Saloniemi, H., Rajala-Schultz, P.J., 2013. Prevalence and risk factors for lameness in insulated free stall barns in Finland. Livestock Science 156, 44-52.
Schlageter Tello, A., 2015. Performance of raters to assess locomotion in dairy cattle. PhD thesis, Wageningen University, Wageningen, the Netherlands.
Skjøth, F., Thorup, V.M., do Nascimento, O.F., Ingvartsen, K.L., Rasmussen, M.D., Voigt, M., 2013. Computerized identification and classification of stance phases as made by front or hind feet of walking cows based on 3-dimensional ground reaction forces. Computers and Electronics in Agriculture 90, 7-13.
Smits, M.C.J., Frankena, K., Metz, J.H.M., Noordhuizen, J.P.T.M., 1992. Prevalence ofdigital disorders in zero-grazing dairy cows. Livestock Production Science 32, 231-244.
Sogstad, Å., Fjeldaas, T., Østerås, O., 2005. Lameness and claw lesions of the Norwegian Red dairy cattle housed in free stalls in relation to environment, parity and stage of lactation. Acta Veterinaria Scandinavica 46, 203-217.
Solano, L., Barkema, H.W., Pajor, E.A., Mason, S., LeBlanc, S.J., Zaffino Heyerhoff, J.C., Nash, C.G.R., Haley, D.B., Vasseur, E., Pellerin, D., Rushen, J., de Passillé, A.M., Orsel, K., 2015. Prevalence of lameness and associated risk factors in Canadian Holstein-Friesian cows housed in freestall barns. Journal of Dairy Science 98, 6978-6991.
Somers, J.G.C.J., Frankena, K., Noordhuizen-Stassen, E.N., Metz, J.H.M., 2003. Prevalence of claw disorders in Dutch dairy cows exposed to several floor systems. Journal of Dairy Science 86, 2082-2093.
Tarlton, J.F., Holah, D.E., Evans, K.M., Jones, S., Pearson, G.R., Webster, A.J.F., 2002. Biomechanical and histopathological changes in the support structures of bovine hooves around the time of first calving. The Veterinary Journal 163, 196-204.
Telezhenko, E., Bergsten, C., Magnusson, M., Nilsson, C., 2009. Effect of different flooring systems on claw conformation of dairy cows. Journal of Dairy Science 92, 2625-2633.
Telezhenko, E., Bergsten, C., Magnusson, M., Ventorp, M., Nilsson, C., 2008. Effect of different flooring systems on weight and pressure distribution on claws of dairy cows. Journal of Dairy Science 91, 1874-1884.
Thorup, V.M., do Nascimento, O.F., Skjøth, F., Voigt, M., Rasmussen, M.D., Bennedsgaard, T.W., Ingvartsen, K.L., 2014. Short communication: Changes in gait symmetry in healthy and lame dairy cows based on 3-dimensional ground reaction force curves following claw trimming. Journal of Dairy Science 97, 7679-7684.
Thorup, V.M., Munksgaard, L., Robert, P.-E., Erhard, H., Thomsen, P., Friggens, N., 2015. Lameness detection via leg-mounted accelerometers on dairy cows on four commercial farms. Animal 9, 1704-1712.

6
Chapter 6
138
Manning, A., Mahendran, S., Bell, N.J., 2016. Evidence base behind foot trimming in UK dairy cattle. Livestock 21, 6-14.
Manske, T., Hultgren, J., Bergsten, C., 2002. Prevalence and interrelationships of hoof lesions and lameness in Swedish dairy cows. Preventive Veterinary Medicine 54, 247-263.
Murray, R.D., 1996. Epidemiology of lameness in dairy cattle: Description and analysis of foot lesions. Veterinary Record 138.
Neveux, S., Weary, D.M., Rushen, J., von Keyserlingk, M.A.G., de Passillé, A.M., 2006. Hoof discomfort changes how dairy cattle distribute their body weight. Journal of Dairy Science 89, 2503-2509.
Newsome, R., Green, M.J., Bell, N.J., Chagunda, M.G.G., Mason, C.S., Rutland, C.S., Sturrock, C.J., Whay, H.R., Huxley, J.N., 2016. Linking bone development on the caudal aspect of the distal phalanx with lameness during life. Journal of Dairy Science 99, 4512-4525.
Newsome, R.F., Green, M.J., Bell, N.J., Bollard, N.J., Mason, C.S., Whay, H.R., Huxley, J.N., 2017. A prospective cohort study of digital cushion and corium thickness. Part 2: Does thinning of the digital cushion and corium lead to lameness and claw horn disruption lesions? Journal of Dairy Science 100, 4759-4771.
Norring, M., Manninen, E., de Passillé, A.M., Rushen, J., Munksgaard, L., Saloniemi, H., 2008. Effects of sand and straw bedding on the lying behavior, cleanliness, and hoof and hock injuries of dairy cows. Journal of Dairy Science 91, 570-576.
Norring, M., Manninen, E., de Passillé, A.M., Rushen, J., Saloniemi, H., 2010. Preferences of dairy cows for three stall surface materials with small amounts of bedding. Journal of Dairy Science 93, 70-74.
Nuss, K., 2014. The role of biomechanical factors in the development of sole ulcer in dairy cattle. Cattle Lameness Conference, Worcester. The Dairy Group, Taunton, UK, pp. 1-11.
Nuss, K., Paulus, N., 2006. Measurements of claw dimensions in cows before and after functional trimming: A post-mortem study. The Veterinary Journal 172, 284-292.
Ouweltjes, W., Priester, M., Beerda, B., 2011. Walking and standing on slatted floors: do cows avoid slat space? 16th International Symposium and 8th conference on Lameness in Ruminants, Rotorua, New Zealand.
Potterton, S.L., Bell, N.J., Whay, H.R., Berry, E.A., Atkinson, O.C.D., Dean, R.S., Main, D.C.J., Huxley, J.N., 2012. A descriptive review of the peer and non-peer reviewed literature on the treatment and prevention of foot lameness in cattle published between 2000 and 2011. The Veterinary Journal 193, 612-616.
Rutherford, K.M.D., Langford, F.M., Jack, M.C., Sherwood, L., Lawrence, A.B., Haskell, M.J., 2009. Lameness prevalence and risk factors in organic and non-organic dairy herds in the United Kingdom. The Veterinary Journal 180, 95-105.
Salo, Z., Thomason, J.J., Runciman, R.J., 2010. Analysis of strain and stress in the equine hoof using finite element analysis: Comparison with minimum principal strains recorded in vivo. Biosystems Engineering 107, 262-270.
General Discussion
139
Sanders, A.H., Shearer, J.K., De Vries, A., 2009. Seasonal incidence of lameness and risk factors associated with thin soles, white line disease, ulcers, and sole punctures in dairy cattle. Journal of Dairy Science 92, 3165-3174.
Sarjokari, K., Kaustell, K.O., Hurme, T., Kivinen, T., Peltoniemi, O.A.T., Saloniemi, H., Rajala-Schultz, P.J., 2013. Prevalence and risk factors for lameness in insulated free stall barns in Finland. Livestock Science 156, 44-52.
Schlageter Tello, A., 2015. Performance of raters to assess locomotion in dairy cattle. PhD thesis, Wageningen University, Wageningen, the Netherlands.
Skjøth, F., Thorup, V.M., do Nascimento, O.F., Ingvartsen, K.L., Rasmussen, M.D., Voigt, M., 2013. Computerized identification and classification of stance phases as made by front or hind feet of walking cows based on 3-dimensional ground reaction forces. Computers and Electronics in Agriculture 90, 7-13.
Smits, M.C.J., Frankena, K., Metz, J.H.M., Noordhuizen, J.P.T.M., 1992. Prevalence ofdigital disorders in zero-grazing dairy cows. Livestock Production Science 32, 231-244.
Sogstad, Å., Fjeldaas, T., Østerås, O., 2005. Lameness and claw lesions of the Norwegian Red dairy cattle housed in free stalls in relation to environment, parity and stage of lactation. Acta Veterinaria Scandinavica 46, 203-217.
Solano, L., Barkema, H.W., Pajor, E.A., Mason, S., LeBlanc, S.J., Zaffino Heyerhoff, J.C., Nash, C.G.R., Haley, D.B., Vasseur, E., Pellerin, D., Rushen, J., de Passillé, A.M., Orsel, K., 2015. Prevalence of lameness and associated risk factors in Canadian Holstein-Friesian cows housed in freestall barns. Journal of Dairy Science 98, 6978-6991.
Somers, J.G.C.J., Frankena, K., Noordhuizen-Stassen, E.N., Metz, J.H.M., 2003. Prevalence of claw disorders in Dutch dairy cows exposed to several floor systems. Journal of Dairy Science 86, 2082-2093.
Tarlton, J.F., Holah, D.E., Evans, K.M., Jones, S., Pearson, G.R., Webster, A.J.F., 2002. Biomechanical and histopathological changes in the support structures of bovine hooves around the time of first calving. The Veterinary Journal 163, 196-204.
Telezhenko, E., Bergsten, C., Magnusson, M., Nilsson, C., 2009. Effect of different flooring systems on claw conformation of dairy cows. Journal of Dairy Science 92, 2625-2633.
Telezhenko, E., Bergsten, C., Magnusson, M., Ventorp, M., Nilsson, C., 2008. Effect of different flooring systems on weight and pressure distribution on claws of dairy cows. Journal of Dairy Science 91, 1874-1884.
Thorup, V.M., do Nascimento, O.F., Skjøth, F., Voigt, M., Rasmussen, M.D., Bennedsgaard, T.W., Ingvartsen, K.L., 2014. Short communication: Changes in gait symmetry in healthy and lame dairy cows based on 3-dimensional ground reaction force curves following claw trimming. Journal of Dairy Science 97, 7679-7684.
Thorup, V.M., Munksgaard, L., Robert, P.-E., Erhard, H., Thomsen, P., Friggens, N., 2015. Lameness detection via leg-mounted accelerometers on dairy cows on four commercial farms. Animal 9, 1704-1712.

Chapter 6
140
Tsuka, T., Murahata, Y., Azuma, K., Osaki, T., Ito, N., Okamoto, Y., Imagawa, T., 2014. Quantitative evaluation of the relationship between dorsal wall length, sole thickness, and rotation of the distal phalanx in the bovine claw using computed tomography. Journal of Dairy Science 97, 6271-6285.
Tsuka, T., Ooshita, K., Sugiyama, A., Osaki, T., Okamoto, Y., Minami, S., Imagawa, T., 2012. Quantitative evaluation of bone development of the distal phalanx of the cow hind limb using computed tomography. Journal of Dairy Science 95, 127-138.
Tucker, C.B., Munksgaard, L., Mintline, E.M., Jensen, M.B., 2018. Use of a pneumatic push gate to measure dairy cattle motivation to lie down in a deep-bedded area. Applied Animal Behaviour Science.
Tucker, C.B., Weary, D.M., 2004. Bedding on geotextile mattresses: How much is needed to improve cow comfort? Journal of Dairy Science 87, 2889-2895.
Van Amstel, S.R., Shearer, J.K., 2006. Review of pododermatitis circumscripta (ulceration of the sole) in dairy cows. Journal of Veterinary Internal Medicine 20, 805-811.
Van De Gucht, T., Saeys, W., Van Weyenberg, S., Lauwers, L., Mertens, K., Vandaele, L., Vangeyte, J., Van Nuffel, A., 2017. Automatically measured variables related to tenderness of hoof placement and weight distribution are valuable indicators for lameness in dairy cows. Applied Animal Behaviour Science 189, 13-22.
van der Tol, P.P., Metz, J.H., Noordhuizen-Stassen, E.N., Back, W., Braam, C.R., Weijs, W.A., 2002. The pressure distribution under the bovine claw during square standing on a flat substrate. Journal of Dairy Science 85, 1476-1481.
Van der Tol, P.P.J., 2004. Biomechanical aspects of the claw-floor interaction in dairy cattle. Implications for locomotion and claw disorders. PhD thesis, Veterinary Faculty Utrecht University, Utrecht, the Netherlands.
Van Gastelen, S., Westerlaan, B., Houwers, D.J., van Eerdenburg, F.J., 2011. A study on cow comfort and risk for lameness and mastitis in relation to different types of bedding materials. Journal of Dairy Science 94, 4878-4888.
Van Nuffel, A., Saeys, W., Sonck, B., Vangeyte, J., Mertens, K.C., De Ketelaere, B., Van Weyenberg, S., 2015. Variables of gait inconsistency outperform basic gait variables in detecting mildly lame cows. Livestock Science 177, 125-131.
Vlček, M., Tomka, J., Kasarda, R., 2017. Evaluation of claw conformation by using two methods of measuring-by ruler and image analysis. Agriculturae Conspectus Scientificus 82, 193-196.
Walker, A.M., Pfau, T., Channon, A., Wilson, A., 2010. Assessment of dairy cow locomotion in a commercial farm setting: The effects of walking speed on ground reaction forces and temporal and linear stride characteristics. Research in Veterinary Science 88, 179-187.
Williams, M.L., Mac Parthalain, N., Brewer, P., James, W.P.J., Rose, M.T., 2016. A novel behavioral model of the pasture-based dairy cow from GPS data using data mining and machine learning techniques. Journal of Dairy Science 99, 2063-2075.
Winckler, C., Tucker, C.B., Weary, D.M., 2015. Effects of under- and overstocking freestalls on dairy cattle behaviour. Applied Animal Behaviour Science 170, 14-19.
SUMMARY

142 143
SUMMARYIn the Netherlands, dairy cows are kept indoors at least from November until April. Many cows spend more time indoors, either because they are not given access to pasture at all, or because grazing time is restricted to e.g. the time between morning and afternoon milking. The consequence is that housing circumstances have a large impact on their health and welfare. Although housing can have beneficial effects as well, e.g. protection from inclement weather or intense solar radiation, circumstances at pasture are generally considered to be better for good welfare. Compared with indoors, cattle at pasture have an abundance of space at their disposal, walk on a deformable soft substrate and are not restricted regarding the place where they lie down in the pasture. Moreover, their feet are much less in contact with manure, because eliminations are spread over a larger surface and usually they get a fresh pasture frequently. Thus, pasture provides good circumstances for healthy claws. Locomotion problems are identified as major welfare problem for dairy cattle, because they are painful and restrict the animals’ movement. The majority of locomotion problems is caused by claw disorders, either infectious or non-infectious. Although severe claw disorders usually are manifested by lameness, clinical lameness can be regarded as the top of the iceberg of claw and locomotion problems. Claw inspections during herd trimming sessions have revealed that more than 70% of the Dutch dairy cows have at least one claw disorder when they are subjected to herd trimming. The so-called subclinical claw disorders in fact do influence behaviour of the affected cows, but the changes are subtle and therefore difficult to observe. Besides impaired welfare, claw disorders also cause financial losses for the dairy farmers. Improvement of claw health seems feasible in practice, because there is a huge variation between farms in prevalence of lameness and claw disorders. In general however, improvement has not been realised in the last 25 years, despite a large amount of research and application of management strategies such as preventive trimming and use of footbaths by dairy farmers.The aetiology of claw disorders is only partially known and is assumed to be multifactorial. In this thesis, only non-infectious claw disorders are considered. In general, this category of claw disorders is assumed to be caused by similar mechanism. Although good feeding is important for claw health, and Holstein cows in general are more vulnerable for claw disorders than cows of other breeds, it has become clear that the impact of nutrition is smaller for dairy cattle than for horses, and farmers with Holstein cows can have herds with good claw health. Housing and management have a large influence on claw health, and particularly flooring in the walking areas and provisions for lying are elements of housing that are related with claw health. Soft alley flooring in cubicle barns has beneficial effects on non-infectious claw disorders, and indications are found that they provide more comfort. Overall, effects of flooring on claw health may be mitigated by impaired hygiene. Unlimited availability of spacious cubicles with soft bedding in general coincides with better claw health and less lameness. Both hardness of alley flooring and cubicle bedding and dimensioning of cubicles also affect lying and standing behaviour. The main objective of this thesis is to improve

144
understanding of the aetiology of non-infectious claw lesions, and in particular the effects of mechanical load on claw tissues.For this study, two experiments were carried out at Waiboerhoeve research farm, Lelystad, the Netherlands. In both experiments, sole haemorrhages were used as indicator for tissue overload. In the first experiment (Chapter 2), effects of an alternative trimming technique were determined for mid-lactation cows kept in barns with either concrete or rubber topped slatted alley flooring. In the second experiment (Chapter 3), effects of nocturnal restrictions in access to the cubicles with supposed maleficent effects on claw tissues were determined for heifers in the first three months of their first lactation. Again, effects were estimated both for concrete and rubber topped flooring. Lying and standing behaviour were monitored continuously with pedometers. These experiments aimed to provide knowledge regarding the impact of claw shape, hard vs. soft flooring and restrictions of lying conditions on claw health and behaviour, but were insufficient to predict how other circumstances than those implemented during the studies would affect claw health. It is assumed that load causes internal deformations of claw tissues, which could contribute to understanding the effects of lying and standing and of claw shape on claw health. Therefore, a methodology was developed to accurately measure load induced spatial deformation of lower hind limbs of cattle (Chapter 4). We applied a range of loadings to dissected hind limbs, and used the developed methodology to determine the effects on spatial deformation inside the hooves and the displacements of the middle and proximal phalanges. The results enabled us to estimate the load induced compressive strain in the soft tissues between the sole horn layer and the distal phalanges. Moreover, we could compare the strain distribution with the location of sole haemorrhages and sole ulcers, two main non-infectious claw disorders (Chapter 5).It was hypothesised that the alternative trimming method we applied in the first experiment would have beneficial effects on claw health, particularly on rubber-covered floors. Key element of this alternative trimming method is that, after correcting length and height of the claws, 3 to 5 mm of sole horn is dished out from the bulb area (the typical sole ulcer site). Results showed that the cows trimmed according to this strategy had smaller claw-floor contact area immediately after trimming, as intended, but that these differences quickly disappeared thereafter. Moreover, this study showed no significant differences between trimming strategies on claw health or claw shape, so we had to reject the hypothesis. However, a significantly lower sole haemorrhage prevalence and lower horn growth and wear were found on the rubber topped floor vs. the concrete floor. Moreover, animals on the rubber topped floor spent more time standing in the alleys and had higher activity (61.0 ± 3.7 vs. 53.0 ± 3.7 steps/h), indicating that standing was more comfortable on this floor. Presumably, the rubber flooring caused sufficient concavity of the soles to reduce discomfort while standing caused by high load on the bulb area of the sole. The second experiment again showed significantly less sole haemorrhages on rubber vs. concrete flooring. Both the number of lesions and severity of the lesions were reduced. Prevalence of sole haemorrhages increased during the first 3 months after calving, particularly in the lateral toes of the hind legs. The location of the lesions corresponded with the pressure distribution patterns reported from other studies. There was no significant
145
interaction of effects of overnight restrictions of cubicle access and effects of hard flooring on claws, which could be caused by a change in behaviour. However, in the last week of the experiment the treatment group kept on concrete flooring and with no overnight cubicle access had significantly higher haemorrhage scores than the other treatment groups, and the two groups kept on rubber flooring had lowest scores. This suggests that blocking of cubicles overnight did have some effect for animals kept on concrete flooring, but none for animals kept on rubber flooring.The results of the load deformation experiments showed that the horn shoes were not measurably deformed, except for the soles. This could be different under normal housing conditions in vivo, when horn is softened due to moisture. The experiments revealed a considerable compressive strain in the soft tissues between the distal phalanges and the sole horn. At a load of 20% of BW maximum compressive strain in the soft tissue of an average claw was more than 10% of the initial layer thickness, and for individual claws compressive strain could be more than 25%. At a load of 35% of BW maximum compressive strain of more than 30% was determined in some claws. Remarkably, the strain in the lateral and medial toes was of similar magnitude at 35% BW load. The centre of pressure gradually shifted from the dorsal half of the lateral claw towards the centre of the two digits, which indicates that load was distributed about equally over the two digits. The location of the maximum compressive strain corresponded remarkably well with the sole area known as the typical sole ulcer location. This suggest a causal link between the areas with a high compressive strain and the development of haemorrhages that to our knowledge has not been published before. The observed considerable compressive strain at 20% BW load indicates that compressive strain is likely to occur in dairy cattle claws during standing. Although the changes were small, we also detected that at sustained load the strain increased. Signs of discomfort observed from animals that experience long standing bouts probably are linked with compressive strain in the soft tissues, although strain in the dead limbs we tested might be larger than under in vivo circumstances.From the experiments, it can be concluded that concave hoof trimming is not beneficial for dairy cows kept on concrete flooring. Rubber flooring reduces the prevalence and seriousness of haemorrhages. Sole concavity can help to prevent overloading in the bulb area, and it is likely that long standing is detrimental for claw health because of compressive strain that occurs in the soft tissues between the distal phalanges and the sole horn during standing. There is a similarity between the location of high mechanical strain and the location of sole horn lesions.

146
SAMENVATTING

146
SAMENVATTING

148 149
SAMENVATTINGIn Nederland worden melkkoeien, ook indien ze weidegang krijgen, tussen november en april opgestald. Een aanzienlijk deel van de veestapel brengt echter aanzienlijk meer tijd in de stal door dan alleen gedurende de winterperiode. Op veel melkveebedrijven worden de melkkoeien alleen tussen de ochtend- en avondmelking geweid en blijven ze ’s nachts binnen. Daarnaast is er een deel van de bedrijven waar de koeien permanent worden opgestald. Volgens de Stichting Weidegang betrof dat in 2017 19.6% van de Nederlandse melkveebedrijven. De consequentie van het opstallen is dat huisvestingsomstandigheden een grote invloed hebben gezondheid en welzijn van melkkoeien. Het is niet zo dat binnen houden hiervoor per definitie nadelig is in vergelijking met weiden, zo kunnen koeien bijvoorbeeld worden beschermd tegen gure weersomstandigheden en intense zonneschijn. Maar met het oog op gezondheid en welzijn worden de leefomstandigheden in weide in het algemeen gunstiger geacht. In de weide hebben de koeien veel meer ruimte tot hun beschikking dan in de stal, lopen ze op een zachte en vervormbare ondergrond en worden ze niet beperkt wat betreft waar ze willen gaan liggen. Daarnaast zijn hun klauwen veel minder in contact met mest en urine, omdat de mest over een veel groter oppervlak wordt verspreid en de urine snel in de bodem wordt geabsorbeerd en ze bovendien vaak regelmatig een nieuw perceel krijgen. Daarom biedt de weide goed omstandigheden voor gezonde klauwen.Locomotieproblemen zijn een belangrijk welzijnsprobleem voor melkkoeien, omdat ze pijnlijk zijn, lang duren en de bewegingsvrijheid van de dieren beperken. Het merendeel van de locomotieproblemen wordt veroorzaakt door klauwaandoeningen. Naar hun aard worden klauwaandoeningen onderscheiden in infectieuze en niet-infectieuze aandoeningen. Ernstige klauwaandoeningen gaan vaak gepaard met kreupelheid, maar zichtbare kreupelheid kan worden gezien als top van de ijsberg wat betreft klauw- en locomotieproblemen. Uit beoordeling van klauwen tijdens koppel-bekappingen is gebleken dat meer dan 70% van de Nederlandse melkkoeien minimaal één klauwaandoening heeft als ze routinematig worden bekapt. Deze zogenoemde subklinische klauwaandoeningen beïnvloeden naar verwachting het gedrag van betreffende koeien wel degelijk, maar de veranderingen zijn dermate subtiel dat ze moeilijk zijn waar te nemen. Behalve een welzijnsprobleem zijn klauwaandoeningen ook een kostenpost voor de melkveehouders. Omdat er een groot verschil is tussen bedrijven in de prevalentie van kreupelheid en klauwaandoeningen lijkt verbetering van klauwgezondheid onder praktische omstandigheden mogelijk,. In het algemeen is de klauwgezondheid van de Nederlandse melkveestapel echter de afgelopen 25 jaar niet verbeterd, ondanks veel onderzoek en toepassing van management maatregelen zoals preventief bekappen en gebruik van voetbaden.De kennis over oorzaken en ontstaan van klauwaandoeningen is onvolledig, maar duidelijk is wel dat de oorzaken multifactorieel zijn. In dit proefschrift worden alleen niet-infectieuze klauwaandoeningen in beschouwing genomen. Aangenomen wordt dat alle niet infectieuze klauwaandoeningen door vergelijkbare oorzaken ontstaan. Goede voeding is van belang voor gezonde klauwen, en Holstein koeien zijn in het algemeen vatbaarder voor klauwaandoeningen dan koeien van andere melkveerassen. Uit onderzoek blijkt echter dat de

148 149
SAMENVATTINGIn Nederland worden melkkoeien, ook indien ze weidegang krijgen, tussen november en april opgestald. Een aanzienlijk deel van de veestapel brengt echter aanzienlijk meer tijd in de stal door dan alleen gedurende de winterperiode. Op veel melkveebedrijven worden de melkkoeien alleen tussen de ochtend- en avondmelking geweid en blijven ze ’s nachts binnen. Daarnaast is er een deel van de bedrijven waar de koeien permanent worden opgestald. Volgens de Stichting Weidegang betrof dat in 2017 19.6% van de Nederlandse melkveebedrijven. De consequentie van het opstallen is dat huisvestingsomstandigheden een grote invloed hebben gezondheid en welzijn van melkkoeien. Het is niet zo dat binnen houden hiervoor per definitie nadelig is in vergelijking met weiden, zo kunnen koeien bijvoorbeeld worden beschermd tegen gure weersomstandigheden en intense zonneschijn. Maar met het oog op gezondheid en welzijn worden de leefomstandigheden in weide in het algemeen gunstiger geacht. In de weide hebben de koeien veel meer ruimte tot hun beschikking dan in de stal, lopen ze op een zachte en vervormbare ondergrond en worden ze niet beperkt wat betreft waar ze willen gaan liggen. Daarnaast zijn hun klauwen veel minder in contact met mest en urine, omdat de mest over een veel groter oppervlak wordt verspreid en de urine snel in de bodem wordt geabsorbeerd en ze bovendien vaak regelmatig een nieuw perceel krijgen. Daarom biedt de weide goede omstandigheden voor gezonde klauwen. Locomotieproblemen zijn een belangrijk welzijnsprobleem voor melkkoeien, omdat ze pijnlijk zijn, lang duren en de bewegingsvrijheid van de dieren beperken. Het merendeel van de locomotieproblemen wordt veroorzaakt door klauwaandoeningen. Naar hun aard worden klauwaandoeningen onderscheiden in infectieuze en niet-infectieuze aandoeningen. Ernstige klauwaandoeningen gaan vaak gepaard met kreupelheid, maar zichtbare kreupelheid kan worden gezien als top van de ijsberg wat betreft klauw- en locomotieproblemen. Uit beoordeling van klauwen tijdens koppel-bekappingen is gebleken dat meer dan 70% van de Nederlandse melkkoeien minimaal één klauwaandoening heeft als ze routinematig worden bekapt. Deze zogenoemde subklinische klauwaandoeningen beïnvloeden naar verwachting het gedrag van betreffende koeien wel degelijk, maar de veranderingen zijn dermate subtiel dat ze moeilijk zijn waar te nemen. Behalve een welzijnsprobleem zijn klauwaandoeningen ook een kostenpost voor de melkveehouders. Omdat er een groot verschil is tussen bedrijven in de prevalentie van kreupelheid en klauwaandoeningen lijkt verbetering van klauwgezondheid onder praktische omstandigheden mogelijk. In het algemeen is de klauwgezondheid van de Nederlandse melkveestapel echter de afgelopen 25 jaar niet verbeterd, ondanks veel onderzoek en toepassing van management maatregelen zoals preventief bekappen en gebruik van voetbaden.De kennis over oorzaken en ontstaan van klauwaandoeningen is onvolledig, maar duidelijk is wel dat de oorzaken multifactorieel zijn. In dit proefschrift worden alleen niet-infectieuze klauwaandoeningen in beschouwing genomen. Aangenomen wordt dat alle niet infectieuze klauwaandoeningen door vergelijkbare oorzaken ontstaan. Goede voeding is van belang voor gezonde klauwen, en Holstein koeien zijn in het algemeen vatbaarder voor klauwaandoeningen dan koeien van andere melkveerassen. Uit onderzoek blijkt echter dat de

150
invloed van voeding op klauwgezondheid bij melkkoeien veel kleiner is dan bij paarden, en dat ook melkveehouders met Holstein koeien veestapels kunnen hebben met een goede klauwgezondheid. Huisvesting en management hebben een zeer grote invloed op klauwgezondheid. Vooral de vloeren in de loopgangen en de uitvoering van de ligplaatsen zijn huisvestingsaspecten met invloed op klauwgezondheid. Gebleken is dat zachte loopvloeren in ligboxenstallen bijdragen aan een verminderd voorkomen van niet infectieuze klauwaandoeningen, en er zijn aanwijzingen dat ze meer comfort geven voor de koeien die er op staan en lopen. Het uiteindelijke effect van een zacht vloeroppervlak op klauwgezondheid wordt ook beïnvloed door hygiëne, en indien deze minder goed is dan op harde vloeren dan kan het gepaard gaan met meer infectieuze klauwproblemen. Goede ligomstandigheden worden gekenmerkt door beschikbaarheid van ruime ligboxen met een zacht ligbed voor alle dieren (minstens 1 ligplek per dier). Optimale ligomstandigheden blijken samen te hangen met betere klauwgezondheid en minder kreupelheid dan minder goede ligomstandigheden. Zowel de hardheid van de loopvloeren als de ligomstandigheden beïnvloeden het lig- en stagedrag van koeien: ze liggen bij dezelfde ligomstandigheden meer als de loopvloeren hard zijn en staan meer als de ligomstandigheden niet optimaal zijn. Het belangrijkste doel van het onderzoek beschreven in dit proefschrift is het beter begrijpen van het ontstaan van niet infectieuze klauwaandoeningen, en in het bijzonder de effecten van mechanische belasting op de weefsels in de klauwen.Voor het onderzoek zijn twee experimenten uitgevoerd op proefbedrijf de Waiboerhoeve in Lelystad. In beide experimenten zijn zoolbloedingen gebruikt als indicator voor overbelasting. In het eerste experiment (beschreven in hoofdstuk 2) zijn effecten van een alternatieve bekap-techniek onderzocht bij koeien die in het midden van de lactatie waren en die gehouden werden in een stal met een roostervloer met een betonnen of rubber toplaag. In het tweede experiment (beschreven in hoofdstuk 3) zijn effecten van het ’s nachts afsluiten van ligboxen, met een verwacht negatief effect op klauwen, onderzocht voor vaarzen in de eerste 3 maanden van de 1e lactatie. Wederom zijn hierbij dieren gehouden in een ligboxenstal met betonnen roostervloer vergeleken met dieren gehouden in een ligboxenstal met een roostervloer met rubber toplaag. Het lig- en stagedrag is hierbij continu gemeten met stappentellers. Het doel van beide experimenten was meer kennis te verkrijgen over de impact van klauwvorm, hard vs. zacht vloeroppervlak en verminderd ligcomfort. Ze leverden echter onvoldoende inzicht op om voorspellingen te doen van de invloed van andere omstandigheden dan die aanwezig tijdens de experimenten op klauwgezondheid. Verondersteld wordt dat belasting resulteert in interne vervorming van klauwweefsels, en dat inzicht hierin bijdraagt aan het begrijpen van effecten van klauwvorm en van lig- en stagedrag op klauwgezondheid. Daarom is een methodiek uitgewerkt om vervorming van klauwen als gevolg van mechanische belasting nauwkeurig te meten, deze is beschreven in hoofdstuk 4. Vervolgens is een aantal belastings-proeven uitgevoerd waarbij een aantal uiteenlopende belastings-niveaus zijn toegepast op geprepareerde achterpoten van melkkoeien. Hierbij zijn de effecten op in- en externe ruimtelijke vervorming in de tenen bepaald. Hiermee konden we de verdeling van de door belasting veroorzaakte spanning in de zachte weefsels tussen de hoornlaag van de zool en de onderste kootjes bepalen en vergelijken met de waargenomen
151
plekken voor zoolbloedingen en zoolzweren. Dit zijn belangrijke niet-infectieuze klauwaandoeningen, dit onderzoek is beschreven in hoofdstuk 5.In het onderzoek beschreven in hoofdstuk 2 is onderzocht of de alternatieve bekapmethode effect had op klauwgezondheid. De kern van deze bekapmethode is dat, na op de juiste lengte en hoogte brengen van de tenen, 3 tot 5 mm van het zoolhoorn wordt weggenomen in het balgebied op de typische plaats voor zoolzweren. De hypothese was dat deze methode met name op een vloer met een rubber toplaag een gunstig effect zou hebben. Uit de waarnemingen bleek dat de koeien die volgens deze methode waren bekapt zoals de bedoeling was kleinere contactoppervlakken tussen de klauwen en de ondergrond hadden direct na het bekappen, maar ook dat deze verschillen hierna snel verdwenen. Bovendien bleek uit dit onderzoek geen significant effect van de bekapmethode op klauwgezondheid of klauwvorm. Daarom moest de onderzoekshypothese verworpen worden. Er werd echter wel een significant lagere prevalentie van zoolbloedingen en een geringere groei en slijtage van het hoorn gevonden voor de koeien op de roostervloer met rubber toplaag in vergelijking met de koeien op de betonnen roostervloer. Verder bleken de koeien op de roostervloer met rubber toplaag meer tijd staand in de loopgangen door te brengen en waren ze actiever dan de koeien op de betonnen roostervloer (61.0 ± 3.7 en 53.0 ± 3.7 stappen/uur respectievelijk). We zien dit als een aanwijzing dat de rubber toplaag comfortabeler is voor de koeien, en veronderstellen dat op deze toplaag onder de klauwen een dragende buitenrand ontstaat waardoor de belasting van het balgebied tijdens staan vermindert.Uit het onderzoek beschreven in hoofdstuk 3 bleek wederom dat de prevalentie van zoolbloedingen bij koeien lager is wanneer ze gehouden in een stal met een roostervloer met rubber toplaag dan wanneer ze gehouden worden in een stal met een betonnen roostervloer. Zowel het aantal als de ernst van de zoolbloedingen was geringer. De prevalentie van zoolbloedingen nam in alle proefgroepen toe gedurende de eerste 3 maanden na de eerste afkalving, met name in de buitenklauwen van de achterpoten. De locatie van de bloedingen was in overeenstemming met verdeling van druk over het zooloppervlak zoals gemeten in andere onderzoeken. In tegenstelling tot de verwachting vooraf had het ’s nachts geen toegang hebben tot de ligboxen geen invloed op de verschillen tussen de betonnen en rubber bedekte roostervloer wat betreft de prevalentie van zoolbloedingen. Dieren die ’s nachts niet in de ligboxen konden liggen bleken dit te compenseren door overdag meer te liggen, waardoor de totale ligtijd niet afweek van die van dieren met onbeperkte toegang tot de ligboxen. In de laatste week van het experiment hadden de dieren die gedurende de eerste twee maanden na afkalven gehuisvest waren in een stal met betonnen roostervloer en die ’s nachts geen toegang hadden tot de ligboxen echter wel significant hogere scores voor zoolbloedingen dan de andere proefgroepen, en de beide groepen gehouden in stallen met roostervloeren met een rubber toplaag hadden de laagste scores. Dit suggereert dat ’s nachts afsluiten van ligboxen enig nadelig effect had voor de dieren die gehouden werden in een stal met een betonnen roostervloer, maar niet voor dieren gehouden in een stal met een rubber toplaag op de roostervloer.De resultaten van de belastings-experimenten beschreven in hoofdstuk 5 lieten zien dat de hoornschoen afgezien van de zool niet meetbaar vervormde als gevolg van belasting. Dit zou

152
anders kunnen zijn onder praktische omstandigheden bij levende koeien, waarbij het hoorn als gevolg van vocht en bevuiling vaak zachter is. Verder bleek uit de experimenten dat er een aanzienlijke samendrukking optreedt in de zachte weefsels tussen de distale phalanges en de zool. Bij een belastings-niveau van 20% van het lichaamsgewicht op één achterpoot was de maximale samendrukking van het zachte weefsel op een vlakke harde ondergrond gemiddeld meer dan 10% van de dikte in onbelaste toestand. Dit kon voor individuele poten zelfs oplopen tot meer dan 25%. Bij een belasting van 35% van het lichaamsgewicht werd een maximale samendrukking van het zachte weefsel gevonden van meer dan 30% in enkele klauwen. Opvallend was dat bij het 35% belastings-niveau de mate van samendrukking vergelijkbaar was voor de binnen- en buitenklauwen. Bij toenemende belasting verplaatste het drukcentrum geleidelijk van de dorsale helft van de buitenklauwen naar het midden tussen de binnen- en buitenklauwen, wat aangeeft dat de belasting geleidelijk meer evenredig over de beide klauwen werd verdeeld. Het zoolgebied waar de maximale samendrukking van de zachte weefsels werd gevonden was goed in overeenstemming met de locatie van de typische plaats voor zoolzweren. Dit suggereert dat er een oorzakelijk verband is tussen gebieden met een hoge mate van samendrukking van zacht weefsel en het ontstaan van zoolbloedingen, hetgeen bij ons weten niet eerder is aangetoond. De aanzienlijke samendrukking zoals waargenomen bij een belastings-niveau van 20% van het lichaamsgewicht geeft aan dat naar alle waarschijnlijkheid tijdens staan het zachte weefsel wordt samengedrukt. Alhoewel de veranderingen klein waren, bleek dat de samendrukking toenam bij voortduren van gelijke belasting. Signalen van ongemak die kunnen worden waargenomen bij dieren die langdurig staan, zoals verplaatsen van het gewicht, zijn waarschijnlijk gelinkt aan samendrukking van de zachte weefsels en daarmee verminderde doorbloeding van dit weefsel. Een kanttekening is dat de samendrukking zoals gemeten in dode poten mogelijk groter is dan die in levende dieren.Uit de onderzoeken beschreven in dit proefschrift kan worden geconcludeerd dat hol bekappen geen gunstig effect heeft voor koeien gehouden in stallen met loopvloeren met een betonnen oppervlak. Een rubber toplaag resulteert in verminderd voorkomen en ernst van zoolbloedingen. Een zool met een dragende wand (concave zool) kan bijdragen aan het voorkomen van overbelasting in het balgebied. Het is waarschijnlijk dat lang staan nadelig is voor klauwgezondheid omdat de zachte weefsels onder de distale phalanges tijdens staan worden samengedrukt. De locatie van beschadigingen van zoolhoorn komt overeen met locatie waar de hoogste mate van samendrukking van het zachte weefsel plaatsvindt.
CURRICULUM VITAE

154 155
CURRICULUM VITAEWijbrand Ouweltjes werd op 22 april 1962 geboren in Heiloo. In 1980 behaalde hij het VWO-diploma aan de rijksscholengemeenschap Noord Kennemerland in Alkmaar. Na een jaar werken op het melkveebedrijf van Jan en Trien de Graaf in Heiloo (waar in de jaren daarvoor ook al veel tijd was doorgebracht) is mede onder invloed van een dreigende militaire dienst in 1981 gestart met een studie zoötechniek in Wageningen. Daarmee trad hij in de voetsporen van zijn vader, die in de jaren 50 in Wageningen had gestudeerd en daar ook zijn moeder had leren kennen die werkte bij professor Hofstee. In 1988 studeerde hij af met als hoofdvakken veefokkerij en agrarische bedrijfseconomie en als bijvak veevoeding. Na de studie volgde alsnog de militaire dienst, waarna hij in 1989 als onderzoeker in dienst trad bij het toenmalige NRS. Vanaf 1992 is hij werkzaam geweest als onderzoeker bij de sectie management en diergezondheid bij het praktijkonderzoek rundvee, schapen en paarden in Lelystad. Na een aantal fusies (eerst met het praktijkonderzoek voor varkens en voor pluimvee en naderhand met ID-DLO) is hij tegenwoordig werkzaam als onderzoeker bij Wageningen Livestock Research in Wageningen.

156
TRAINING AND SUPERVISION PLANThe Basic Package (3 ECTS)
• WIAS Introduction Course (2012)• Course on philosophy of science and/or ethics (2015)
Scientific Exposure (13 ECTS)International conferences
• 15th International Symposium and 7th conference on Lameness in Ruminants, Kuopio, Finland, 9-13 june (2008)
• 16th International Symposium and 8th conference on Lameness in Ruminants, Rotorua, New Zealand, 28 feb – 3 march (2011)
• Annual meeting EAAP, Crete, Greece, 23 – 27 August 2010• 17th International Symposium and 9th conference on Lameness in Ruminants,
Bristol, UK, 11 -14 august 2013• Annual meeting EAAP, Copenhagen, Denmark, 25 -29 August 2014
Workshops and Seminars• Improving claw health: from theory to practice, Lelystad, 10 may 2007
Presentations• Impact of floor type on animal behaviour and milk production, Kuopio (Fi), 10 june
2008, oral• Effects of high or low concentrate intake on sole heamorrhages, Kuopio (Fi), 10
june 2008, poster• Relationships of individual animal traits and sole haemorrhage scores in fresh
heifers, Heraklion (Gr), 24 August, oral• Effects of flooring and restricted freestall access of dairy cattle heifers on behavior
and claw health, Rotorua (NZ), 29 February 2011, poster• Walking and standing on slatted floors: do cows avoid slat space? Rotorua (NZ), 1
march 2011, oral• Development of a method to determine internal tissue deformation due to external
load in cattle hind claws, 13 August 2013, oral• Cow health and welfare in bedded pack dairy barns, Copenhagen (Dk), 28 August
2014, oralIn-Depth Studies (10 ECTS)
• PHLO-cursus fokkerij en genetica (1990)• PHLO-cursus Vruchtbaarheid en voortplanting (1992)• WIAS-course Resilience of living systems – from fundamental concepts to
interdisciplinary applications (2018)• Cursus medische statistiek UU (1995)• MSc Course Biomechanics (FTE 23306) (2010)
157
Statutory Courses (3 ECTS)• Use of Laboratory Animals (2012)
Professional Skills Support Courses (4 ECTS)• Course Techniques for Scientific Writing (1994)• Cursus projectmatig werken (2000)• Cursus presentatietechnieken (2005)
Research Skills Training (6 ECTS)• Preparing own PhD research proposal (2008)
Total ECTS in training and supervision plan: 40 ECTS

158
COLOPHONThe research described in this thesis was partially funded by the Dutch Ministry of Agriculture, Nature and Food Quality (LNV), research program Animal Welfare (P434) and KB-08-001-006.
Cover by Anjo Versteijnen

PROPOSITIONS
1. Sustained moderate load caused by prolonged standing bouts may
have more detrimental effects on claw tissues of dairy cows than high peak load that occurs during locomotion. (this thesis)
2. Lying duration and frequency of lying and standing of cattle are
unreliable indicators for lying comfort, particularly in barns with hard flooring. (this thesis)
3. The fact that the journal Science reports on fake news proofs that
such news is a concern to the scientific community. 4. Automation in healthcare improves physical health of elderly
people, but may reduce their well-being by reduced human interaction.
5. Globalisation impairs biodiversity in the Netherlands. 6. Implementation of legislation to protect laboratory animals
hampers improvement of welfare of production animals.
Propositions belonging to the thesis:
Effects of mechanical loads on the deformation and health status of claws in dairy cows.
Wijbrand Ouweltjes
Wageningen, 13 juni 2018