Preliminary Assessment of Chloride Concentrations, Loads ...
52
Prepared in cooperation with the Federal Highway Administration and the Connecticut Department of Transportation Preliminary Assessment of Chloride Concentrations, Loads, and Yields in Selected Watersheds along the Interstate 95 Corridor, Southeastern Connecticut, 2008–09 Open-File Report 2011–1018 U.S. Department of the Interior U.S. Geological Survey
-
Upload
khangminh22 -
Category
Documents
-
view
1 -
download
0
Transcript of Preliminary Assessment of Chloride Concentrations, Loads ...

Prepared in cooperation with the Federal Highway Administration and the Connecticut Department of Transportation
Preliminary Assessment of Chloride Concentrations, Loads, and Yields in Selected Watersheds along the Interstate 95 Corridor, Southeastern Connecticut, 2008–09
Open-File Report 2011–1018
U.S. Department of the InteriorU.S. Geological Survey

Cover. Photograph of the Oil Mill Brook downstream site in Waterford, Connecticut.

Preliminary Assessment of Chloride Concentrations, Loads, and Yields in Selected Watersheds along the Interstate 95 Corridor, Southeastern Connecticut, 2008–09
By Craig J. Brown, John R. Mullaney, Jonathan Morrison, and Remo Mondazzi
Prepared in cooperation with the Federal Highway Administration and the Connecticut Department of Transportation
Open-File Report 2011–1018
U.S. Department of the InteriorU.S. Geological Survey
U.S. Department of the InteriorKEN SALAZAR, Secretary
U.S. Geological SurveyMarcia K. McNutt, Director
U.S. Geological Survey, Reston, Virginia: 2011
For more information on the USGS—the Federal source for science about the Earth, its natural and living resources, natural hazards, and the environment, visit http://www.usgs.gov or call 1-888-ASK-USGS
For an overview of USGS information products, including maps, imagery, and publications, visit http://www.usgs.gov/pubprod
To order this and other USGS information products, visit http://store.usgs.gov
Any use of trade, product, or firm names is for descriptive purposes only and does not imply endorsement by the U.S. Government.
Although this report is in the public domain, permission must be secured from the individual copyright owners to reproduce any copyrighted materials contained within this report.
Suggested citation:Brown, C.J., Mullaney, J. R., Morrison, Jonathan, and Mondazzi, Remo, 2011, Preliminary assessment of chloride concentrations, loads, and yields in selected watersheds along the Interstate 95 corridor, southeastern Connecticut, 2008–09: U.S. Geological Survey Open-File Report 2011–1018, 41 p. at http://pubs.usgs.gov/ofr/2011–1018/.

iii
Contents
Abstract ..........................................................................................................................................................1Introduction.....................................................................................................................................................2
Purpose and Scope ..............................................................................................................................2Description of Study Area ...................................................................................................................3Sources of Dissolved Constituents to Streams and Groundwater ...............................................3Road Deicing Chemicals and their Application in the Study Areas .............................................6
Methods of Data Collection and Analysis ...............................................................................................10Site Selection.......................................................................................................................................10Weather Data ......................................................................................................................................10Streamflow ...........................................................................................................................................10Water Quality .......................................................................................................................................10
Continuous Monitoring .............................................................................................................15Water-Quality Sampling and Laboratory Analysis ...............................................................15Quality Assurance......................................................................................................................15
Data Analysis .......................................................................................................................................15Estimation of Chloride Concentrations ...................................................................................15Estimation of Cl Loads and Yields ............................................................................................15
Preliminary Assessment of the Effects of Road Deicers on Water Quality .......................................17Weather Data and Storm Events ......................................................................................................17Water Quality .......................................................................................................................................17
Base-Flow Chemistry ................................................................................................................17Stormflow Chemistry .................................................................................................................18
Four Mile River ..................................................................................................................19Oil Mill Brook .....................................................................................................................23Stony Brook .......................................................................................................................23Jordan Brook .....................................................................................................................23
Chloride Loads ............................................................................................................................27Summary and Conclusions .........................................................................................................................35Acknowledgments .......................................................................................................................................35References Cited..........................................................................................................................................35Appendix 1. Specific conductance and chloride concentrations in water samples from upstream
and downstream monitoring sites at Four Mile River, Oil Mill Brook, Stony Brook, and Jordan Brook, southeastern Connecticut, November 2008 to January 2010 .............................................38
Figures 1. Map showing location of water-quality monitoring sites for this study, and sites on
other rivers in Connecticut, and several weather stations, including the Groton-New London airport weather station, a Snow Observation weather station, and three National Atmospheric Deposition Program sites ..................................................4
2. Map showing upstream and downstream water-quality monitoring sites and downstream streamgages on the four selected streams and their watersheds along the Interstate 95 corridor study area, southeastern Connecticut .............................5

iv
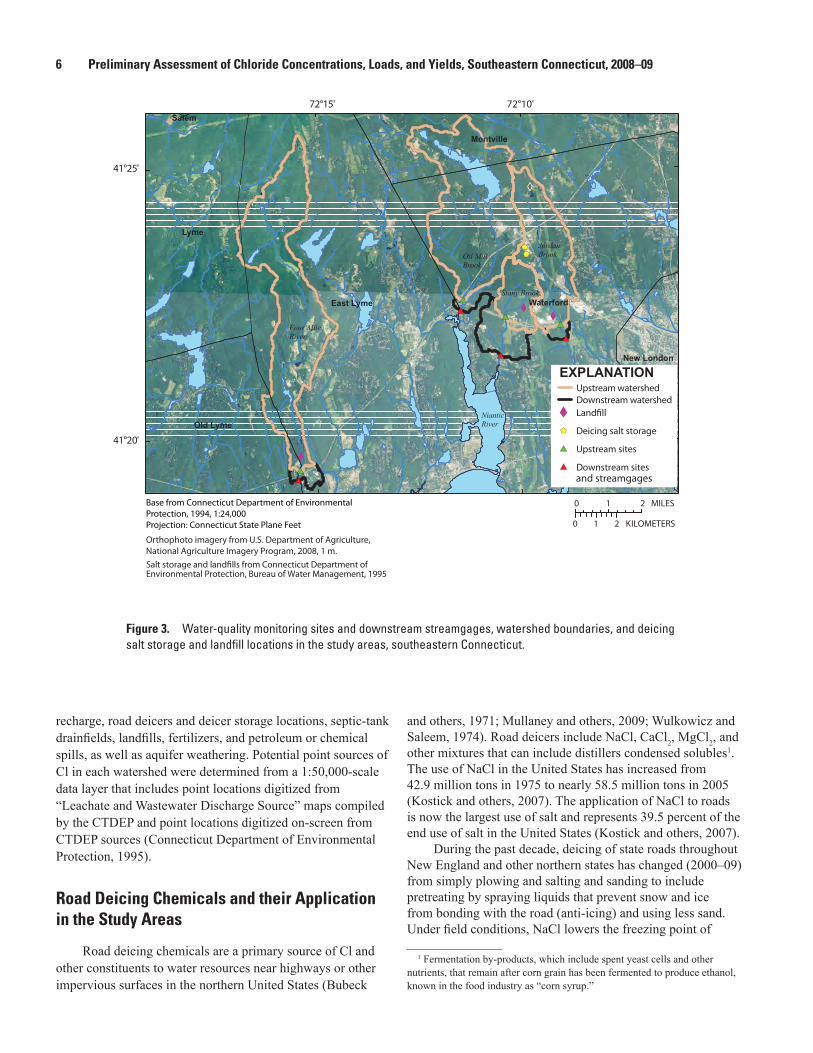
3. Map showing water-quality monitoring sites and downstream streamgages, watershed boundaries, and deicing salt storage and landfill locations in the study areas, southeastern Connecticut ...............................................................................................6
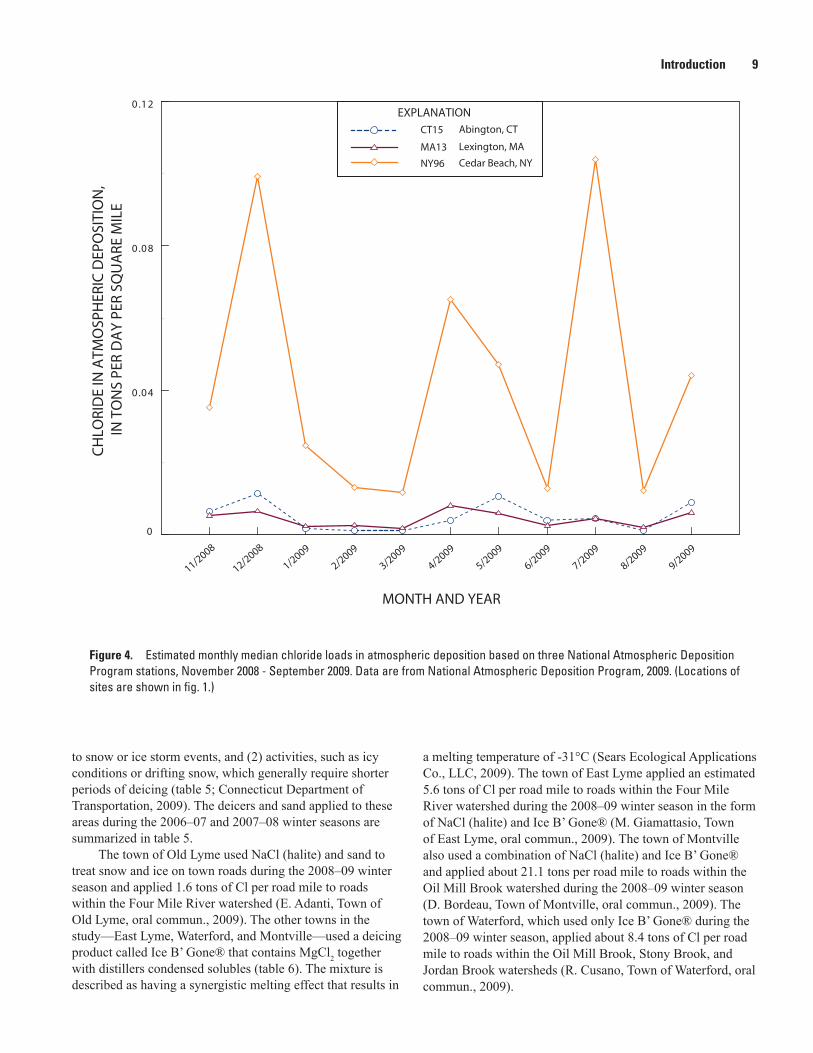
4. Graph showing estimated monthly median chloride loads in atmospheric deposition based on three National Atmospheric Deposition Program stations, November 2008 - September 2009. Data are from National Atmospheric Deposition Program, 2009 ................................................................................................................................9
5. Graph showing A, Maximum and minimum daily air temperature and continuous precipitation at the Groton-New London airport weather station, and B, estimated hourly snow thickness and snow melt at a snow observation station in southeastern Connecticut, November 2008–September 2009 ............................................18
6. Graph showing continuous streamflow at the downstream monitoring sites at Four Mile River, Oil Mill Brook, Stony Brook, and Jordan Brook, and precipitation at Groton-New London airport weather station, southeastern Connecticut, November 2008–September 2009 ................................................................................................................19
7. Diagrams depicting the concentrations of major ions in water at upstream and downstream monitoring sites at Four Mile River, Oil Mill Brook, Stony Brook, and Jordan Brook, southeastern Connecticut, and shallow groundwater samples from wells in forested land-use settings in Connecticut ...............................................................21
8. Graphs showing A, Specific conductance in grab samples, continuous specific conductance at Four Mile River upstream and downstream sites, continuous streamflow at the downstream site, and precipitation at Groton-New London airport weather station, and B, chloride concentrations measured in grab samples and estimated continuous chloride concentrations at Four Mile River upstream and downstream sites, southeastern Connecticut, November 2008–September 2009 ..........22
9. Graphs showing A, Specific conductance in grab samples and continuous specific conductance at Oil Mill Brook upstream and downstream sites, continuous streamflow at the downstream site, and precipitation at Groton-New London airport weather station, and B, chloride concentrations measured in grab samples and estimated continuous chloride concentrations at Oil Mill Brook upstream and downstream sites, southeastern Connecticut, November 2008–September 2009 ..........24
10. Graphs showing A, Specific conductance in grab samples and continuous specific conductance at Stony Brook upstream and downstream sites, continuous streamflow at the downstream site, and precipitation at Groton-New London airport weather station, and B, chloride concentrations measured in grab samples and estimated continuous chloride concentrations at Stony Brook upstream and downstream sites, southeastern Connecticut, November 2008–September 2009 ..........25
11. Graphs showing A, specific conductance in grab samples and continuous specific conductance at Jordan Brook upstream and downstream sites, continuous streamflow at the downstream site, and precipitation at Groton-New London airport weather station, and B, chloride concentrations measured in grab samples and estimated continuous chloride concentrations at Jordan Brook upstream and downstream sites, southeastern Connecticut, November 2008–September 2009 ..........26
12. Graphs showing A, estimated daily mean chloride concentrations at Four Mile River upstream and downstream sites, and B, estimated daily mean chloride load and streamflow for the Four Mile River downstream site, southeastern Connecticut, November 2008–September 2009 ....................................................................28
13. Graphs showing A, estimated daily mean chloride concentrations at Oil Mill Brook upstream and downstream sites, and B, estimated daily mean chloride load and streamflow for the Oil Mill Brook downstream site, southeastern Connecticut, November 2008–September 2009 .............................................................................................29

v
14. Graphs showing A, estimated daily mean chloride concentrations at Stony Brook upstream and downstream sites, and B, estimated daily mean chloride load and streamflow for the Stony Brook downstream site, southeastern Connecticut, November 2008–September 2009 .............................................................................................30
15. Graphs showing A, estimated daily mean chloride concentrations at Jordan Brook upstream and downstream sites, and B, estimated daily mean chloride load and streamflow for the Jordan Brook downstream site, southeastern Connecticut, November 2008–September 2009 .............................................................................................31
16. Diagram showing distribution of annual chloride yields estimated using LOADEST for selected rivers in Connecticut for water years 1998–2007, and estimated annual chloride yields for the downstream sites at Four Mile River, Oil Mill Brook, Stony Brook, and Jordan Brook for their periods of record ...........................................................33
17. Graph showing percentage of impervious cover as a function of (1) the chloride yields for the downstream monitoring stations at Four Mile River, Oil Mill Brook, Stony Brook, and Jordan Brook during the periods of record for this study, and (2) the median of the mean chloride yields at other selected rivers in Connecticut during water years 1998–2007 ..................................................................................................34
Tables 1. Land use, numbers of salt-storage facilities and landfills, and percentage of
impervious area for four selected watersheds, southeastern Connecticut. .....................7 2. Classification of surficial materials for watersheds above each monitoring site in
the study area, southeastern Connecticut ...............................................................................8 3. Estimated atmospheric deposition yields and loads of chloride for the four selected
watersheds in southeastern Connecticut. Loads were computed from National Atmospheric Deposition Program station ..............................................................................10
4. Description of two areas of Interstate 95 in which the deicing chemicals were applied to state-operated roads within areas of (1) the Four Mile River watershed, and (2) the combined Oil Mill Brook, Stony Brook, and Jordan Brook watersheds, southeastern Connecticut .........................................................................................................11
5. Description of the applications of deicing materials to state-operated roads during winter storms and deicing activities within the areas of (1) the Four Mile River watershed, and (2) the Oil Mill Brook, Stony Brook, and Jordan Brook area watersheds, southeastern Connecticut, for the 2008–09 winter seasons, and summaries for the 2006–07 and 2007–08 winter seasons ....................................................12
6. Deicing materials applied to town roads during the 2008–09 winter season, southeastern Connecticut .........................................................................................................14
7. Multiple linear regression estimates of model coefficients and standard errors, t-statistics, and p-values for the dependent variable chloride concentration at monitoring sites upstream and downstream from Interstate 95, southeastern Connecticut .........................................................................................................16
8. Summary statistics for A, specific conductance and B, estimated chloride concentrations for continuous data, and grab samples at the eight monitoring sites, southeastern Connecticut, November 2008–September 2009 .............20
9A. Estimated mean chloride loads for streams at the four monitoring sites downstream from Interstate 95, southeastern Connecticut, November 2008 to January 2010 ................................................................................................................................32
9B. Estimated mean chloride loads for streams, atmospheric deposition, and deicers applied to town and state roads in the study areas of the Four Mile River watershed and the Oil Mill Brook-Stony Brook-Jordan Brook watersheds, November 2008 to January 2010 ..............................................................................................32

vi
Conversion Factors, Abbreviations, and DatumsMultiply By To obtain
Length
inch (in.) 2.54 centimeter (cm)inch (in.) 25.4 millimeter (mm)foot (ft) 0.3048 meter (m)mile (mi) 1.609 kilometer (km)
Area
square mile (mi2) 2.590 square kilometer (km2)
Volume
gallon (gal) 3.785 liter (L) gallon (gal) 0.003785 cubic meter (m3)
Flow rate
cubic foot per second (ft3/s) 0.02832 cubic meter per second (m3/s)inch per year (in/yr) 25.4 millimeter per year (mm/yr)
Mass
pound, avoirdupois (lb) 0.4536 kilogram (kg) ton, short (2,000 lb) 0.9072 megagram (Mg) ton per day (ton/d) 0.9072 metric ton per dayton per day (ton/d) 0.9072 megagram per day (Mg/d)ton per day per square mile [(ton/d)/mi2]
0.3503 megagram per day per square kilome-ter [(Mg/d)/km2]
Temperature in degrees Celsius (°C) may be converted to degrees Fahrenheit (°F) as follows:
°F=(1.8×°C)+32
Temperature in degrees Fahrenheit (°F) may be converted to degrees Celsius (°C) as follows:
°C=(°F-32)/1.8
Vertical coordinate information is referenced to the North American Vertical Datum of 1988 (NAVD 88).
Horizontal coordinate information is referenced to the North American Datum of 1983 (NAD 83).
Altitude, as used in this report, refers to distance above the vertical datum.
* Specific conductance is given in microsiemens per centimeter at 25 degrees Celsius (µS/cm at 25 °C).
Concentrations of chemical constituents in water are given in milligrams per liter (mg/L).
List of Abbreviations
ConnDOT Connecticut Department of TransportationEIS Environmental Impact StatementFHWA Federal Highway AdministrationUSGS U.S. Geological SurveyUSEPA U.S. Environmental Protection Agency

Preliminary Assessment of Chloride Concentrations, Loads, and Yields in Selected Watersheds along the Interstate 95 Corridor, Southeastern Connecticut, 2008–09
By Craig J. Brown, John R. Mullaney, Jonathan Morrison, and Remo Mondazzi
Abstract Water-quality conditions were assessed to evaluate
potential effects of road-deicer applications on stream-water quality in four watersheds along Interstate 95 (I-95) in southeastern Connecticut from November 1, 2008, through September 30, 2009. This preliminary study is part of a four-year cooperative study by the U.S. Geological Survey (USGS), the Federal Highway Administration (FHWA), and the Connecticut Department of Transportation (ConnDOT). Streamflow and water quality were studied at four watersheds—Four Mile River, Oil Mill Brook, Stony Brook, and Jordan Brook. Water-quality samples were collected and specific conductance was measured continuously at paired water-quality monitoring sites upstream and downstream from I-95. Specific conductance values were related to chloride (Cl) concentrations to assist in determining the effects of road-deicing operations on the levels of Cl in the streams. Streamflow and water-quality data were compared with weather data and with the timing, amount, and composition of deicers applied to state highways. Grab samples were collected during winter stormwater-runoff events, such as winter storms or periods of rain or warm temperatures in which melting takes place, and periodically during the spring and summer.
Cl concentrations at the eight water-quality monitoring sites were well below the U.S. Environmental Protection Agency (USEPA) recommended chronic and acute Cl toxicity criteria of 230 and 860 milligrams per liter (mg/L), respectively. Specific conductance and estimated Cl concentrations in streams, particularly at sites downstream from I-95, peaked during discharge events in the winter and early spring as a result of deicers applied to roads and washed off by stormwater or meltwater. During winter storms, deicing activities, or subsequent periods of melting, specific conductance and estimated Cl concentrations peaked as high as 703 microsiemens per centimeter (µS/cm) and 160 mg/L at the downstream sites.
During most of the spring and summer, specific conductance and estimated Cl concentrations decreased during discharge events because the low-ionic strength of stormwater had a diluting effect on stream-water quality. However, peaks in specific conductance and estimated Cl concentrations at Jordan Brook and Stony Brook corresponded to peaks in streamflow well after winter snow or ice events; these delayed peaks in Cl concentration likely resulted from deicing salts that remained in melting snow piles and (or) that were flushed from soils and shallow groundwater, then discharged downstream.
Cl loads in streams generally were highest in the winter and early spring. The estimated load for the period of record at the four monitoring sites downstream from I-95 ranged from 0.33 ton per day (ton/d) at the Stony Brook watershed to 0.59 ton/d at the Jordan Brook watershed. The Cl yields ranged from 0.07 ton per day per square mile (ton/d/)mi2) at Oil Mill Brook, one of the least developed watersheds, to 0.21 (ton/d)/mi2) at Jordan Brook, the watershed with the highest percentage of urban development and impervious surfaces. The median estimates of Cl load from atmospheric deposition ranged from 11 to 19 tons, and contributed 4.3 to 7.1 percent of the Cl load in streamflow from the watershed areas. A comparison of the Cl load input and output estimates indicates that less Cl is leaving the watersheds than is entering through atmospheric deposition and application of deicers. The lag time between introduction of Cl to the watershed and transport to the stream, and uncertainty in the load estimates may be the reasons for this discrepancy. In addition, estimates of direct infiltration of Cl to groundwater from atmospheric deposition, deicer applications, and septic-tank drainfields to groundwater were outside the scope of the November 2008 to September 2009 assessment. However, increased concentrations of ions were observed between upstream and downstream sites and could result from deicer applications.
Cl yields per square mile at the downstream monitoring sites at each of the four streams were compared with Cl yield estimates for 10 selected rivers in Connecticut. Four

2 Preliminary Assessment of Chloride Concentrations, Loads, and Yields, Southeastern Connecticut, 2008–09
Mile River and Oil Mill Brook had low estimated Cl yields, similar to yields at Bunnell (Burlington) Brook and Shetucket River, that reflect the low percentages of developed land and impervious area. Estimated Cl yields at Jordan Brook and Stony Brook were relatively high but were not as high as those in more urbanized watersheds such as those that drain the Still River at Brookfield Center and the Hockanum River. Cl yields for these sites were positively correlated with the percentage of impervious cover and probably reflect the application of deicers to roadways, as well as sources and practices associated with greater impervious cover, such as wastewater and septic-system discharges, and leachate from landfills and salt-storage areas.
IntroductionThe Federal Highway Administration (FHWA) and
the Connecticut Department of Transportation (ConnDOT) are developing an Environmental Impact Statement (EIS) for the expansion of Interstate 95 (I-95) between Old Lyme and New London, Conn. Concerns have been raised by the U.S. Environmental Protection Agency (USEPA) about the effects of highway expansion on the water quality and biological resources associated with streams crossed by I-95. Of particular concern are the water-quality changes that could result from expansion of impervious areas that require deicing and the subsequent changes in concentrations of chloride (Cl) and other ions and loads of Cl to streams.
A primary concern regarding road-deicing practices is the degradation of surface water and groundwater that may be used for aquatic habitat or for drinking-water supply. The USEPA-recommended chronic criterion for aquatic life is a 4-day average Cl concentration of 230 mg/L with an occurrence interval of once every 3 years, and the recommended acute criterion concentration for Cl is 860 mg/L (U.S. Environmental Protection Agency, 1988). The latter criterion relates to a 1-hour average concentration with a recurrence interval of less than once every 3 years. The Connecticut Department of Environmental Protection (CTDEP) has recently proposed revisions to the standards for aquatic-life criteria for Cl that are identical to the USEPA standards (Connecticut Department of Environmental Protection, 2009). The USEPA has set a Secondary Maximum Contaminant Level (SMCL) of 250 mg/L for Cl in drinking water (U.S. Environmental Protection Agency, 1992). The SMCL for Cl is an unenforceable guideline that relates to the aesthetics of the water and the perceived salty taste of water at concentrations above 250 mg/L. Another concern regarding salt inputs is the effects of cation-exchange reactions, which result in the release of other constituents from soils that can be detrimental to the quality of water (Granato and others, 1995).
Widespread upward trends in Cl concentrations in streams have been reported nationwide and may be related to a variety of factors, including increased road area and
consequent deicing, increased wastewater and septic-system discharges, livestock waste and fertilizers, and leachate from landfills and salt-storage areas (Smith and others, 1987; Mullaney and others, 2009). Similar trends have been reported in Connecticut from the 1970s to 1990s (Trench, 1996; Colombo and Trench, 2002). Elevated concentrations of Cl and sodium (Na) in glacial aquifers in Connecticut have been related to urban land use (Grady, 1993; Grady and Mullaney, 1998). A dramatic increase in the use of salt in the United States since 1950 (Kostick, 1993; Kostick and others, 2007) primarily results from the use of salt for deicing of roads, parking lots, and other impervious surfaces during the winter months. The use of salt for deicing has raised awareness of potential adverse effects of its use and application on water resources (Ramakrishna and Viraraghavan, 2005; Kaushal and others, 2005; Kelly and others, 2010).
ConnDOT has recently adopted (2007–08) new road-deicing practices to reduce the use of sand for traction control and to increase the use of pretreatment sodium chloride (NaCl) brine before storms (Connecticut Department of Transportation, 2009). ConnDOT also began using halite, amended with liquid calcium chloride (CaCl2), for ice or snow events during 2007–08.
Effects of road deicers on water quality can be monitored effectively through continuous records of specific conductance, together with periodic solute analysis, and continuous estimates of streamflow (Gurnell and others, 1994; Granato and Smith, 1999). Additional knowledge of the use of salt, including the timing, amount, and composition of deicers applied to roadways, as well as the weather details, is beneficial in understanding the effects of road-salt wash off on concentrations and loads of Cl in streamflow. Collection of data to determine the Cl concentrations and streamflow, and how they affect specific conductance, is important to the development of a regression model to estimate Cl concentrations.
A study is being conducted by the U.S. Geological Survey (USGS), in cooperation with the FHWA and ConnDOT, to assess the water quality of streams and the effects of deicing of roads on stream-water quality. This is an interim report on that study and covers November 2008 through September 2009. The data collected for this study will be useful in understanding the water-quality implications of an I-95 expansion and can be used to assist in development of low-impact design alternatives.
Purpose and Scope
This interim report, which covers part of the 2008–09 winter season as well as the spring and summer of 2009, describes the collection and analysis of geologic, hydrologic, and water-quality data to assess baseline water-quality conditions along the I-95 corridor; the data can be used to develop an EIS on water quality. Specific conductance and Cl concentration data cover a longer period, 2008 to January
Introduction 3
2010, at some sites and were used to improve the regression models. This report describes the effects of upstream land use on stream-water quality, the variations in concentrations and loads of Cl during winter storms or deicing activities, and concentrations and loads of Cl during base-flow conditions. Other major ions also are discussed. Baseline water-quality data were collected to evaluate the water-quality conditions in streams crossed by I-95 and to evaluate sources of Cl delivered from I-95 and upstream areas. Specific conductance, which was measured continuously, was used as a surrogate to estimate Cl concentrations. These data were used to determine whether Cl concentrations frequently exceeded recommended water-quality criteria for protection of aquatic life in watersheds that are typical of many parts of Connecticut. This report also describes the sampling sites in detail, as well as the collection of water stage and streamflow data, continuous water-quality monitoring, and water-quality sampling.
Description of Study Area
The study area encompasses four watersheds in southeastern Connecticut crossed by I-95—Four Mile River, Oil Mill Brook, Stony Brook, and Jordan Brook (figs. 1 and 2). The watersheds encompass parts of the towns of Lyme, Old Lyme, East Lyme, Montville, and Waterford (fig. 2). Two locations in each watershed were selected for sample collection and water-quality monitoring, including one upstream and one downstream from I-95 (fig. 3). Streamgages are located at the downstream sites. The watersheds vary in size from 1.86 to 5.98 mi2 and include both commercial and undeveloped areas; developed land ranges from 9.4 percent at the Four Mile River watershed to 30.5 percent at the Jordan Brook watershed (table 1). Data on highway drainage, which were acquired from ConnDOT, were considered in the delineation of the watershed boundaries. Data on 2002 land-use and land-cover characteristics were determined from LANDSAT Thematic Mapper (TM) data, retrieved from the Center for Land use Education And Research (CLEAR) website (University of Connecticut, 2009). Data on land-use and land-cover characteristics also were determined from TM images created for the National Land Cover Dataset (NLCD; U.S. Environmental Protection Agency, 2001).
The study area is underlain by surficial deposits, including Pleistocene glacial stratified deposits, glacial till, and Holocene alluvial deposits, which occur primarily in stream channels (table 2). These deposits are underlain by crystalline bedrock. Effective recharge to the glacial stratified deposits (Melvin and Bingham, 1991) and groundwater storage and flow within these deposits is much larger than in till deposits. There is a 10-percent increase in coarse-grained surficial deposits (8.0 to 18.3 percent of watershed area) between the Stony Brook upstream and downstream sites; therefore, base flow is likely an important contribution to streamflow downstream from I-95 in this watershed.
Sources of Dissolved Constituents to Streams and Groundwater
The primary water-quality constituents of interest in this study are dissolved Cl, Na, and calcium (Ca) because these are the major dissolved ions in meltwater from road deicers applied to highways. These ions are derived from ionic compounds or “salts” such as NaCl, CaCl2, and magnesium chloride (MgCl2) that dissolve easily in water. Other anthropogenic sources of Cl include discharge from drinking-water and wastewater-treatment facilities or septic systems, leachate from landfills, fertilizers, and petroleum or chemical spills. Natural sources of salts to freshwater resources include (1) atmospheric deposition; (2) the natural weathering of bedrock, surficial materials, and soils; (3) seawater; and (4) geologic deposits containing halite or saline groundwater (brines). Halite and brines are not present in geologic deposits in this area and, therefore, are not likely to affect stream chemistry in this study.
Atmospheric deposition generally transmits salts from both anthropogenic and natural sources to watersheds and groundwater. Atmospheric deposition of major ions is more concentrated in coastal areas than in inland areas (Gay and Melching, 1995). Cl load in precipitation can be a substantial part of the total Cl load in relatively undeveloped areas, particularly in coastal areas (Mullaney and others, 2009; National Atmospheric Deposition Program, 2009) (fig. 4). The Cl load from atmospheric deposition was estimated by using the monthly median concentrations and the amount of rainfall at three National Atmospheric Deposition Program (NADP) stations (fig. 1), then calculating the Cl mass per unit area. Estimated Cl loads ranged from 0.0012 (ton/d)/mi2 at an inland site in Abington, Conn., to 0.11 (ton/d)/mi2 at a coastal site in Cedar Beach, N.Y., during November 2008 to September 2009. The Cedar Beach, N.Y., station is located on an island peninsula within 200 ft of saltwater and is strongly affected by sea spray; therefore, the value for Cedar Beach probably is an overestimate of atmospheric deposition for watersheds in this study (table 3). Chloride estimates for the station at Lexington, Mass., is probably most representative of the study area. The estimates of Cl load from the atmospheric deposition, based on the range of monthly concentrations at the NADP stations (fig. 1), vary from 0.1 ton per day (ton/d) for the Stony Brook downstream site watershed to 3.1 ton/d for the Four Mile River downstream site watershed (table 3).
The primary road deicers used by the ConnDOT include NaCl (both in the brine and halite form) and CaCl2; those used by the towns include NaCl (halite) and a product that contains MgCl2 together with distillers condensed solubles, as described in the section “Road Deicing Chemicals and their Application in the Study Areas.” Stormwater runoff from I-95 is the primary focus of this study, but there are other contributions to streamflow in each watershed, including stormwater runoff from other roadways and impervious surfaces, interflow, and the groundwater component (base flow). Sources of major ions in base flow include groundwater

4 Preliminary Assessment of Chloride Concentrations, Loads, and Yields, Southeastern Connecticut, 2008–09
KGON
LEXINGTON (MA13)
73 °
42 °
41 °
0 10 20 MILES
0 10 20 KILOMETERSEXPLANATION
MASSACHUSETTS
NEW YORK
NEWYORK
RHODEISLAND
Watershed and water-quality site (this study)
National Atmospheric Deposition Program siteWeather station
71 °
CONNECTICUT
Water-quality site for chloride load comparison
LONG ISLAND SOUND
ATLANTIC OCEAN
Base from Connecticut Department of Environmental Protection, 1994, 1:24,000Projection: Connecticut State Plane Feet
01201487
01208990
01209710
0120850001196500
01188000
01184490
01192500 Con
nect
icut
Riv
e r
01193500
011277695MADIS AP750Snow observation
Tha
mes
Rive
r
01127791601127821
01122610
ABINGTON (CT15)
01127819
01208500
CEDAR BEACH (NY96)
Housaton
ic R
iver
01127819011277914
011277696
011277915
0112779135
Figure 1. Location of water-quality monitoring sites for this study, and sites on other rivers in Connecticut, and several weather stations, including the Groton-New London airport weather station, a Snow Observation weather station, and three National Atmospheric Deposition Program sites.

Introduction 5
72°05'72°10'72°15'72°20'
41°25'
41°20'
I-395
I-95
I-95
Downstream water-quality site and streamgage
Upstream water-quality site and streamgage
Road type
Upstream watershed
Primary highwaySecondary highwayLocal roadMinor road
Downstream watershed
Base from Connecticut Department of Environmental Protection, 1994, 1:24,000Projection: Connecticut State Plane Feet
1 2 3 4 MILES0
1 2 3 4 KILOMETERS0
EXPLANATION
LymeWaterford
New London
Montville
Groton
Old Lyme
East Lyme
Long Island Sound
Tham
es R
iver
Nian
tic R
iver
Conn
ectic
ut
R
iver
Figure 2. Upstream and downstream water-quality monitoring sites and downstream streamgages on the four selected streams and their watersheds along the Interstate 95 corridor study area, southeastern Connecticut.
6 Preliminary Assessment of Chloride Concentrations, Loads, and Yields, Southeastern Connecticut, 2008–09
#
#*
#*
#*
*
#*
#*
#*
#*
$+$+
XY
XX
X
WaterfordEast Lyme
Lyme
Old Lyme
Montville
New London
Salem72°15'
41°25'
41°20'
NianticRiver
EXPLANATIONUpstream watershed
X Land ll
$+ Deicing salt storage
#* Upstream sites
#* Downstream sites
Four MileRiver
Oil MillBrook
Stony Brook
JordanBrook
Salt storage and land lls from Connecticut Department ofEnvironmental Protection, Bureau of Water Management, 1995
0 1 2 MILES
0 21 KILOMETERS
Downstream watershed
and streamgages
Orthophoto imagery from U.S. Department of Agriculture,National Agriculture Imagery Program, 2008, 1 m.
Base from Connecticut Department of EnvironmentalProtection, 1994, 1:24,000Projection: Connecticut State Plane Feet
72°10'
Figure 3. Water-quality monitoring sites and downstream streamgages, watershed boundaries, and deicing salt storage and landfill locations in the study areas, southeastern Connecticut.
recharge, road deicers and deicer storage locations, septic-tank drainfields, landfills, fertilizers, and petroleum or chemical spills, as well as aquifer weathering. Potential point sources of Cl in each watershed were determined from a 1:50,000-scale data layer that includes point locations digitized from “Leachate and Wastewater Discharge Source” maps compiled by the CTDEP and point locations digitized on-screen from CTDEP sources (Connecticut Department of Environmental Protection, 1995).
Road Deicing Chemicals and their Application in the Study Areas
Road deicing chemicals are a primary source of Cl and other constituents to water resources near highways or other impervious surfaces in the northern United States (Bubeck
and others, 1971; Mullaney and others, 2009; Wulkowicz and Saleem, 1974). Road deicers include NaCl, CaCl2, MgCl2, and other mixtures that can include distillers condensed solubles1. The use of NaCl in the United States has increased from 42.9 million tons in 1975 to nearly 58.5 million tons in 2005 (Kostick and others, 2007). The application of NaCl to roads is now the largest use of salt and represents 39.5 percent of the end use of salt in the United States (Kostick and others, 2007).
During the past decade, deicing of state roads throughout New England and other northern states has changed (2000–09) from simply plowing and salting and sanding to include pretreating by spraying liquids that prevent snow and ice from bonding with the road (anti-icing) and using less sand. Under field conditions, NaCl lowers the freezing point of
1 Fermentation by-products, which include spent yeast cells and other nutrients, that remain after corn grain has been fermented to produce ethanol, known in the food industry as “corn syrup.”

Introduction 7Ta
ble
1.
Land
use
, num
bers
of s
alt-s
tora
ge fa
cilit
ies
and
land
fills
, and
per
cent
age
of im
perv
ious
are
a fo
r fou
r sel
ecte
d w
ater
shed
s, s
outh
east
ern
Conn
ectic
ut.
[USG
S, U
.S. G
eolo
gica
l Sur
vey;
USE
PA, U
.S. E
nviro
nmen
tal P
rote
ctio
n A
genc
y]
Wat
ersh
ed n
ame
USG
S
site
id
entifi
catio
n nu
mbe
r
Wat
ersh
ed
area
, in
sq
uare
m
iles
Dis
tanc
e be
twee
n up
stre
am
and
dow
nstr
eam
si
tes,
in
mile
s
Land
use
(per
cent
of w
ater
shed
are
a)N
umbe
r of
sa
lt
stor
age
faci
litie
s1
Num
ber
of
land
fills
1
Impe
rvio
us a
rea
(p
erce
nt o
f wat
ersh
ed
area
)
Dev
elop
ed
land
Turf
an
d
gras
s
Agr
icul
ture
an
d
othe
r gr
asse
s
Fore
st
and
w
etla
nd
Uni
vers
ity
of
Conn
ectic
ut2 ,
2009
USE
PA,
2001
Four
Mile
Riv
er
upst
ream
0112
7819
5.75
0.2
9.4
2.5
7.7
80.4
01
2.92
0.95
Four
Mile
Riv
er
dow
nstre
am01
1278
215.
9811
.02.
77.
578
.80
03.
31.
58
Diffe
renc
e be
twee
n si
tes:
0.38
0.63
Oil
Mill
Bro
ok
upst
ream
0112
7791
355.
37
0.23
12.9
2.2
3.4
81.5
00
3.63
1.69
Oil
Mill
Bro
ok
dow
nstre
am01
1277
914
5.67
13.5
2.2
3.5
80.9
00
3.75
1.91
Diffe
renc
e be
twee
n si
tes:
0.12
0.22
Ston
y B
rook
up
stre
am01
1277
9155
1.02
0.82
18.2
1.4
4.0
76.4
01
4.72
5.53
Ston
y B
rook
do
wns
tream
0112
7791
61.
8618
.12.
38.
171
.50
05.
776.
3
Diffe
renc
e be
twee
n si
tes:
1.05
0.77
Jord
an B
rook
up
stre
am01
1277
695
2.67
0.32
30.5
4.9
4.1
60.5
22
6.02
7.84
Jord
an B
rook
do
wns
tream
0112
7769
62.
8030
.54.
94.
560
.10
06.
298.
01
Diffe
renc
e be
twee
n si
tes:
0.27
0.17
1 Dat
a on
salt
stor
age
and
land
fill l
ocat
ions
from
Lea
chat
e an
d W
aste
wat
er D
isch
arge
Sou
rce
map
s at 1
:50,
000
scal
e co
mpi
led
by th
e C
onne
ctic
ut D
epar
tmen
t of E
nviro
nmen
tal P
rote
ctio
n (1
995)
.2 C
ente
r for
Lan
d us
e Ed
ucat
ion
And
Res
earc
h, U
nive
rsity
of C
onne
ctic
ut, 2
009,
bas
ed o
n m
etho
ds d
escr
ibed
by
Cha
baev
a an
d ot
hers
(200
4) a
nd P
rislo
e an
d ot
hers
(200
3).

8 Preliminary Assessment of Chloride Concentrations, Loads, and Yields, Southeastern Connecticut, 2008–09
Table 2. Classification of surficial materials for watersheds above each monitoring site in the study area, southeastern Connecticut.
[Data from Stone and others, 1992. USGS, U.S. Geological Survey; us, upstream; ds, downstream]
Watershed nameUSGS
site identification number
Surficial material, in percent of watershed area
Coarse grained Swamp or fines Till Thick till Water
Four Mile River us 01127819 16.3 1.6 73.7 7.5 0.9Four Mile River ds 01127821 16.2 1.5 73.3 8.1 0.9
Oil Mill Brook us 0112779135 13.3 1.6 71.5 4.8 8.8Oil Mill Brook ds 011277914 18.7 1.5 71.7 4.5 8.4
Stony Brook usStony Brook ds
0112779155011277916
8.018.3
14.87.5
77.274.2
0.00.0
0.00.0
Jordan Brook us 011277695 17.9 3.1 74.7 4.3 0.0Jordan Brook ds 011277696 18.7 3.0 74.2 4.1 0.0
water to -9°C; other salts, such as CaCl2, depress the freezing point even lower (to -29°C), but these are more expensive (Connecticut Department of Transportation, 2009). NaCl brine, therefore, is generally applied to state bridges, ramps, overpasses, and some roads before snow or ice events.
ConnDOT initiated a new snow and ice removal program beginning in the 2006–07 winter season (Connecticut Department of Transportation, 2009). ConnDOT crews generally avoid using sand on roadways because it provides only temporary traction, fouls waterways and the air, clogs drains, and is costly to clean up. The primary purpose of the new program is to reduce the use of sand and improve winter driving conditions by (1) pretreating pavements with NaCl brine, thus preventing bonding of snow or ice, and (2) using liquid CaCl2 as a wetting agent for rock salt (halite), which is applied during snow or ice events, to lower the freezing point, to reduce bounce and scatter, and to accelerate the melting time.
ConnDOT uses a 23-percent NaCl brine solution for anti-icing at a rate of about 30 gal per lane mile. Larger rates (40 gal per lane mile) of the NaCl brine solution are applied at pavement temperatures below -1°C, but none is applied below -5.5°C because it is ineffective at colder temperatures. The brine solution is applied by a tanker truck using spray bars with nozzles that are spaced about 10 in. apart. After application of the brine solution, the water evaporates as 2-in. strips that melt frozen precipitation on contact. The program also calls for the pretreating of bridges and selected roadways with salt brine up to 5 days prior to an anticipated precipitation event.
CaCl2 in liquid form (about 32 percent by weight) has been used on Connecticut state roads since the 2006–07 winter. It is sprayed onto halite rock salt in the spreader chute on plows and other snow-removal equipment. The CaCl2 brine-halite combination melts snow or ice faster during application than using only halite and sand. The typical mixing rate is 10 gal of liquid CaCl2 per ton of rock salt, but the rates are varied depending on such factors as temperature, humidity, the type and timing of storms, and traffic conditions (Connecticut Department of Transportation, 2009). In some situations where ice has already formed, liquid ice-control chemicals (CaCl2 or NaCl brine) are applied directly to the pavement.
During this study, ConnDOT maintained records of deicers applied to I-95 along specific lengths of roads. These records include the length and type of state-operated roads within (1) the Four Mile River watershed and (2) the combined watersheds of Oil Mill Brook, Stony Brook, and Jordan Brook (table 4); the dates and times of application; and the quantity of deicers and sand applied over a given spreader route (table 5). All road salt applied to I-95 meets standards that specify chemical purity. NaCl conforms to the standard ASTM D632-84, which specifies that all samples tested must be at a minimum of 95-percent pure NaCl, and all CaCl2 must be a minimum of 90-percent pure as specified by the standard ASTM D98-93. Typical spreading rates from trucks with calibrated spreaders are about 300 lb per lane-mile, +/- 20 percent (Connecticut Department of Transportation, 2009). The total amount of deicers applied to the highway varied from storm to storm and year to year (table 5). The deicers applied to I-95 and other state roads for the 2008–09 winter season were categorized by (1) storms, which refers
Introduction 9
0.04
0
0.08
0.12
11/2008
12/2008
1/2009
2/2009
3/2009
4/2009
5/2009
6/2009
7/2009
8/2009
9/2009
MONTH AND YEAR
CHLO
RID
E IN
ATM
OSP
HER
IC D
EPO
SITI
ON
, IN
TO
NS
PER
DA
Y PE
R SQ
UA
RE M
ILE
CT15
MA13
EXPLANATIONAbington, CT
Lexington, MA
NY96 Cedar Beach, NY
Figure 4. Estimated monthly median chloride loads in atmospheric deposition based on three National Atmospheric Deposition Program stations, November 2008 - September 2009. Data are from National Atmospheric Deposition Program, 2009. (Locations of sites are shown in fig. 1.)
to snow or ice storm events, and (2) activities, such as icy conditions or drifting snow, which generally require shorter periods of deicing (table 5; Connecticut Department of Transportation, 2009). The deicers and sand applied to these areas during the 2006–07 and 2007–08 winter seasons are summarized in table 5.
The town of Old Lyme used NaCl (halite) and sand to treat snow and ice on town roads during the 2008–09 winter season and applied 1.6 tons of Cl per road mile to roads within the Four Mile River watershed (E. Adanti, Town of Old Lyme, oral commun., 2009). The other towns in the study—East Lyme, Waterford, and Montville—used a deicing product called Ice B’ Gone® that contains MgCl2 together with distillers condensed solubles (table 6). The mixture is described as having a synergistic melting effect that results in
a melting temperature of -31°C (Sears Ecological Applications Co., LLC, 2009). The town of East Lyme applied an estimated 5.6 tons of Cl per road mile to roads within the Four Mile River watershed during the 2008–09 winter season in the form of NaCl (halite) and Ice B’ Gone® (M. Giamattasio, Town of East Lyme, oral commun., 2009). The town of Montville also used a combination of NaCl (halite) and Ice B’ Gone® and applied about 21.1 tons per road mile to roads within the Oil Mill Brook watershed during the 2008–09 winter season (D. Bordeau, Town of Montville, oral commun., 2009). The town of Waterford, which used only Ice B’ Gone® during the 2008–09 winter season, applied about 8.4 tons of Cl per road mile to roads within the Oil Mill Brook, Stony Brook, and Jordan Brook watersheds (R. Cusano, Town of Waterford, oral commun., 2009).

10 Preliminary Assessment of Chloride Concentrations, Loads, and Yields, Southeastern Connecticut, 2008–09
Table 3. Estimated atmospheric deposition yields and loads of chloride for the four selected watersheds in southeastern Connecticut. Loads were computed from National Atmospheric Deposition Program stations in Abington, Conn., Lexington, Mass., and Cedar Beach, N.Y., November 2008–September 2009.
[Data from National Atmospheric Deposition Program (NADP), 2009. Location of stations shown in fig. 1.]
NADP station
NADP station location
Atmospheric deposition yields, in tons per day per square mile
Atmospheric deposition loads, in tons per day
(November 2008 to September 2009)
Lower range
Upper range
Median1 Four Mile River
Oil Mill Brook
Stony Brook
Jordan Brook
CT15 Abington, CT 0.001 0.012 0.005 0.36 0.34 0.11 0.17MA13 Lexington, MA 0.002 0.009 0.005 0.31 0.30 0.10 0.15NY96 Cedar Beach, NY 0.013 0.11 0.040 3.1 2.9 0.96 1.4
1Median values were used to compute atmospheric deposition for study watersheds.
Methods of Data Collection and Analysis
Data were collected during the interim study period (as early as November 1, 2008, to September 30, 2009) using methods described below to assess weather information, water quality, stream stage, and streamflow for the four selected streams. All water-quality, stream-stage, and streamflow data are stored in the USGS National Water Information System (NWIS) database.
Site Selection
Approximately 17 streams between the Connecticut River and the Thames River that are crossed by I-95 were initially considered as locations for potential monitoring sites. Site selection involved assessment of available geographic information system (GIS) data and streamflow characteristics of all the watersheds upstream from and encompassing parts of I-95. Four streams between the Connecticut River and the Thames River (fig. 1)—Four Mile River, Oil Mill Brook, Stony Brook, and Jordan Brook—were selected for study on the basis of the percentage of land-use types, percentage of impervious surfaces, road types and density, presence of coarse glacial stratified deposits, suitability for streamflow and water-quality monitoring, site accessibility, representativeness and transferability, and the absence of estuarine or brackish waters.
Weather Data
Hourly measurements of air temperature and precipitation for the study period were obtained from continuous temperature and precipitation data collected by the National Weather Service at the Groton-New London airport weather station (KGON; fig. 1) as part of the Meteorological Assimilation Data Ingest System (MADIS). The data were
accessed through Weather Underground (http://www.wunderground.com).
Another branch of the National Weather Service, the National Operational Hydrologic Remote Sensing Center, assembles daily ground-based, airborne, and satellite snow observations for the conterminous United States (National Operational Hydrologic Remote Sensing Center, 2005). These data are used together with estimates of snowpack characteristics generated by a snow model to generate the operational, daily NOAA National Snow Analysis for the United States, for which estimates are made for snow depth, snow-water equivalent, and snow melt. The snow observation station (MADIS AP750) nearest the study area is located at N41.36733°, W72.216°, at an altitude of 72 ft above NAVD 88 (fig. 1).
Streamflow
Stream stage and streamflow were measured at four sites downstream from I-95 on Four Mile River, Oil Mill Brook, Stony Brook, and Jordan Brook (fig. 3) and used for computations of Cl loads in highway stormwater runoff. Stream stage was recorded at 5-minute intervals with pressure transducers and data loggers, and streamflow measurements were made periodically at these sites. These data were used to develop a rating curve to convert stage measurements into streamflow. All streamflow records were computed in accordance with standard USGS protocols for computation of streamflow records as described by Rantz and others (1982).
Water Quality
Water-quality data were collected at sites upstream and downstream from I-95 on the Four Mile River, Oil Mill Brook, Stony Brook, and Jordan Brook to monitor Cl concentrations and to evaluate the loads at downstream sites. Water quality was assessed using continuous monitors and periodic grab samples collected during base flow and winter storms.

Methods of Data Collection and Analysis 11
Table 4. Description of two areas of Interstate 95 in which the deicing chemicals were applied to state-operated roads within areas of (1) the Four Mile River watershed and (2) the combined Oil Mill Brook, Stony Brook, and Jordan Brook watersheds, southeastern Connecticut.
[Data from K. Carifa, Connecticut Department of Transportation, written commun., 2009; mi, mile; ft, feet; N/B, northbound; S/B, southbound]
(1) Four Mile River watershed study areaDistance, in miles
(2) Oil Mill-Stony Brook-Jordan Brook watersheds study area:
Distance, in miles
I-95 N/B (Old Lyme/East Lym) Mile Marker 83 to 84 I-95 N/B (Waterford) Mile Marker 88 to 92
Two 12-ft lanes w/shoulder 1 Two 12-inch lanes with shoulder 4N/B Exit 71 off ramp 0.24 On ramp from Oil Mill 0.11N/B Exit 71 on ramp 0.30 Exit 81 Cross Roads off 0.09N/B Exit 72 to Rocky Neck Connector 0.20 Exit 81 Cross Roads on 0.15
Scale House exit ramp 0.18
I-95 N/B (East Lyme/Old Lyme) Mile Marker 84 to 83 Scale House on ramp 0.18
Two 12-ft lanes with shoulder 1 Exit 82 off ramp to 85 0.19S/B Exit 72 to Rocky Neck Connector 0 Exit 82 on ramp from 85 0.06S/B on ramp from Rocky Neck Connector 0
S/B Exit 71 off ramp 0 I-95 S/B (Waterford) -Mile marker 92 to 88
S/B Exit 71 on ramp 0 Two 12-ft lanes with shoulder lane 4Exit 82 off ramp to 85 0.13
Route 1 N & S (Old Lyme/East Lyme) Mile marker 87 to 90 Exit 82 on ramp to 85 0.14
Two 12-ft lanes with approximately 4 ft shoulder 3 Scale House exit ramp 0.18Scale House on ramp 0.18
Service Road 432 East Lyme Exit 81 Cross Roads off 0.07
Two 12-ft lanes, no shoulder 0.54 Exit 81 Cross Roads on 0.16Total 2 lane mi: 5.5 Off ramp to Oil Mill 0.12Total ramp mileage: 1.7
I-395 N/B (Waterford) Mile Marker 1 to 3
Two 12-ft lanes with shoulder 3
Exit 77 N/B off ramp (Route 85) 0.22
Exit 77 N/B on ramp (Route 85) 0.18
I-395 S/B (Waterford) Mile Marker 3 to 1
Two 12 ft lanes with shoulder 3
exit 77S/B off ramp (Route 85) 0.18
exit 77S/B on ramp (Route 85) 0.19
Route 85 N/B (Waterford/Montville) Marker 1 to 7
Two 12-ft lanes with shoulder 6
Route 1 N & S
Route 1 N/B (Waterford) Marker 93 to 94 0.97
Total 2 lane mi 21
Total ramp mileage: 2.7

12 Preliminary Assessment of Chloride Concentrations, Loads, and Yields, Southeastern Connecticut, 2008–09Ta
ble
5.
Desc
riptio
n of
the
appl
icat
ions
of d
eici
ng m
ater
ials
to s
tate
-ope
rate
d ro
ads
durin
g w
inte
r sto
rms
and
deic
ing
activ
ities
with
in th
e ar
eas
of (1
) the
Fou
r Mile
Riv
er
wat
ersh
ed, a
nd (2
) the
Oil
Mill
Bro
ok, S
tony
Bro
ok, a
nd J
orda
n Br
ook
area
wat
ersh
eds,
sou
thea
ster
n Co
nnec
ticut
, for
the
2008
–09
win
ter s
easo
ns, a
nd s
umm
arie
s fo
r the
20
06–0
7 an
d 20
07–0
8 w
inte
r sea
sons
.
[Dat
a fr
om K
. Car
ifa, C
onne
ctic
ut D
epar
tmen
t of T
rans
porta
tion
(Con
nDO
T), w
ritte
n co
mm
un.,
2009
. Len
gths
of s
tate
road
s tha
t und
ergo
dei
cing
are
show
n in
tabl
e 4.
Cl,
chlo
ride;
NaC
l, so
dium
chl
orid
e;
CaC
l 2, ca
lciu
m c
hlor
ide]
Type
Star
tEn
dD
urat
ion,
in
ho
urs
Num
ber o
f ap
plic
atio
ns,
3-ho
ur
inte
rval
s
(1) F
our M
ile R
iver
wat
ersh
ed s
tudy
are
a
NaC
l (to
ns)
CaCl
2 (gal
lons
)To
tal
sand
, in
cu
bic
yard
s
Tota
l Cl
, in
to
ns2
lane
sM
ulti
lane
sRa
mps
Tota
lTw
o la
nes
Mul
ti la
nes
Ram
psTo
tal
Act
ivity
No.
111
/30/
08 1
6:30
11/3
0/08
18:
0011
.53.
832.
531.
411.
195.
1327
.215
.312
.755
.2
Stor
m N
o. 1
12/6
/08
19:0
012
/7/0
8 10
:00
165.
333.
521.
971.
657.
1437
.821
.317
.776
.8
Stor
m N
o. 2
12/1
6/08
16:
0012
/17/
08 8
:00
175.
663.
742.
091.
757.
5840
.122
.618
.881
.6
Stor
m N
o. 3
12/1
9/08
8:0
012
/20/
08 1
6:00
3210
.66
7.04
3.94
3.3
14.3
75.6
42.6
35.4
153.
6
Stor
m N
o. 4
12/2
1/08
3:0
012
/21/
08 2
1:00
186
3.96
2.22
1.86
8.04
42.5
2419
.986
.5
Stor
m N
o. 5
12/2
4/08
1:0
012
/24/
08 1
0:00
93
1.98
1.11
0.93
4.02
21.3
1210
.043
.2
Act
ivity
No.
212
/26/
08 2
2:00
12/2
7/08
9:0
012
42.
641.
481.
245.
3628
.416
13.3
57.6
Stor
m N
o. 6
12/3
1/08
4:0
01/
1/09
9:0
029
9.66
6.38
3.57
313
.068
.538
.632
.113
9.2
Act
ivity
No.
31/
4/09
0:0
01/
5/09
8:0
09
31.
981.
110.
934.
0221
.312
10.0
43.2
Stor
m N
o. 7
1/6/
09 1
6:00
1/7/
09 1
5:59
248
5.28
2.96
2.48
10.7
56.7
3226
.611
5.3
Stor
m N
o. 8
1/10
/09
11:0
01/
11/0
9 14
:00
289.
336.
163.
452.
8912
.566
.237
.331
.013
4.5
Act
ivity
No.
41/
15/0
9 0:
301/
15/0
9 16
:00
14.5
4.83
3.19
1.78
1.5
6.47
34.2
19.3
16.0
69.6
Stor
m N
o. 9
1/18
/09
0:30
1/19
/09
12:0
023
.57.
835.
172.
92.
4310
.555
.431
.326
112.
7
Act
ivity
No.
51/
19/0
9 15
:00
1/20
/09
1:45
11.7
53.
912.
581.
451.
215.
2427
.715
.613
.056
.3
Stor
m N
o. 1
01/
27/0
9 22
:00
1/29
/09
8:00
3511
.66
7.7
4.31
3.61
15.6
82.7
46.6
38.7
168.
0
Stor
m N
o. 1
12/
2/09
21:
302/
4/09
8:0
035
.511
.83
7.8
4.38
3.67
15.9
83.9
47.3
39.3
170.
5
Act
ivity
No.
62/
18/0
9 16
:00
2/19
/09
8:00
175.
663.
742.
091.
757.
5840
.122
.618
.881
.6
Act
ivity
No.
72/
19/0
9 15
:59
2/20
/09
8:00
175.
663.
742.
091.
757.
5840
.122
.618
.881
.6
Stor
m N
o. 1
22/
22/0
9 11
:00
2/23
/09
8:00
227.
334.
842.
712.
279.
8252
.029
.324
.310
5.6
Act
ivity
No.
83/
1/09
2:0
03/
1/09
14:
0012
42.
641.
481.
245.
3628
.416
13.3
57.6
Stor
m N
o. 1
33/
1/09
20:
003/
2/09
21:
0025
8.33
5.5
3.08
2.58
11.2
59.1
33.3
27.7
120.
0
Win
ter
2008
-09
Sum
mar
y to
tal:
140
92.1
51.6
43.2
187
989
558
463
2,01
00
121
Win
ter
2007
-08
Sum
mar
y to
tal:
160
106
59.2
49.5
214
1,13
561
953
22,
286
013
8W
inte
r 20
06-0
7Su
mm
ary
tota
l:77
.951
.528
.824
.110
455
331
225
91,
123
4667
.4

Methods of Data Collection and Analysis 13Ta
ble
5.
Desc
riptio
n of
the
appl
icat
ions
of d
eici
ng m
ater
ials
to s
tate
-ope
rate
d ro
ads
durin
g w
inte
r sto
rms
and
deic
ing
activ
ities
with
in th
e ar
eas
of (1
) the
Fou
r Mile
Riv
er
wat
ersh
ed, a
nd (2
) the
Oil
Mill
Bro
ok, S
tony
Bro
ok, a
nd J
orda
n Br
ook
area
wat
ersh
eds,
sou
thea
ster
n Co
nnec
ticut
, for
the
2008
–09
win
ter s
easo
ns, a
nd s
umm
arie
s fo
r the
20
06–0
7 an
d 20
07–0
8 w
inte
r sea
sons
. —Co
ntin
ued
[Dat
a fr
om K
. Car
ifa, C
onne
ctic
ut D
epar
tmen
t of T
rans
porta
tion
(Con
nDO
T), w
ritte
n co
mm
un.,
2009
. Len
gths
of s
tate
road
s tha
t und
ergo
dei
cing
are
show
n in
tabl
e 4.
Cl,
chlo
ride;
NaC
l, so
dium
chl
orid
e;
CaC
l 2, ca
lciu
m c
hlor
ide]
Type
Star
tEn
dD
urat
ion,
in
ho
urs
Num
ber
of
appl
icat
ions
, 3-
hour
in
terv
als
(2) O
il M
ill/S
tony
Bro
ok/J
orda
n B
rook
wat
ersh
eds
stud
y ar
ea
NaC
l (to
ns)
CaCl
2 (gal
lons
)To
tal
sand
, in
cu
bic
yard
s
Tota
l Cl
, in
to
ns2
lane
sM
ulti
lane
sRa
mps
Tota
l T
wo
lane
sM
ulti
lane
sRa
mps
Tota
l
Act
ivity
No.
111
/30/
08 1
6:30
11/3
0/08
18:
0011
.53.
836.
510
.41.
9218
.864
.611
2.5
20.8
198
Stor
m N
o. 1
12/6
/08
19:0
012
/7/0
8 10
:00
165.
339.
014
.52.
6726
.289
.915
6.5
28.9
275
Stor
m N
o. 2
12/1
6/08
16:
0012
/17/
08 8
:00
175.
669.
615
.32.
8327
.795
.416
6.2
30.7
292
Stor
m N
o. 3
12/1
9/08
8:0
012
/20/
08 1
6:00
3210
.66
18.0
295.
3352
.418
031
357
.855
0St
orm
No.
412
/21/
08 3
:00
12/2
1/08
21:
0018
610
.116
.33.
029
.510
117
632
.531
0St
orm
No.
512
/24/
08 1
:00
12/2
4/08
10:
009
35.
18.
21.
514
.750
.688
.116
.315
5A
ctiv
ity N
o. 2
12/2
6/08
22:
0012
/27/
08 9
:00
124
6.8
10.9
2.0
19.6
67.4
117
21.7
207
Stor
m N
o. 6
12/3
1/08
4:0
01/
1/09
9:0
029
9.66
16.3
26.3
4.83
47.4
163
284
52.4
499
Act
ivity
No.
31/
4/09
0:0
01/
5/09
8:0
09
35.
18.
21.
514
.750
.688
.116
.315
5St
orm
No.
71/
6/09
16:
001/
7/09
15:
5924
813
.521
.84.
039
.313
523
543
.441
3St
orm
No.
81/
10/0
9 11
:00
1/11
/09
14:0
028
9.33
15.8
25.4
4.67
45.8
157
274
50.6
482
Act
ivity
No.
41/
15/0
9 0:
301/
15/0
9 16
:00
14.5
4.83
8.2
13.1
2.42
23.7
81.4
142
26.2
249
Stor
m N
o. 9
1/18
/09
0:30
1/19
/09
12:0
023
.57.
834.
621
.33.
9229
.913
223
042
.440
4A
ctiv
ity N
o. 5
1/19
/09
15:0
01/
20/0
9 1:
4511
.75
3.91
6.6
14.7
1.96
23.3
65.9
115
21.2
202
Stor
m N
o. 1
01/
27/0
9 22
:00
1/29
/09
8:00
3511
.66
19.7
43.8
5.83
69.3
197
342
63.2
602
Stor
m N
o. 1
12/
2/09
21:
302/
4/09
8:0
035
.511
.83
20.0
44.4
5.92
70.3
199
347
64.1
611
Act
ivity
No.
62/
18/0
9 16
:00
2/19
/09
8:00
175.
669.
65.
42.
8317
.895
.416
630
.729
2A
ctiv
ity N
o. 7
2/19
/09
15:5
92/
20/0
9 8:
0017
5.66
9.6
5.4
2.83
17.8
95.4
166
30.7
292
Stor
m N
o. 1
22/
22/0
9 11
:00
2/23
/09
8:00
227.
3312
.419
.93.
6736
.012
421
539
.737
9A
ctiv
ity N
o. 8
3/1/
09 2
:00
3/1/
09 1
4:00
124
6.8
10.9
219
.667
.411
721
.720
7St
orm
No.
13
3/1/
09 2
0:00
3/2/
09 2
1:00
258.
3314
.122
.74.
1740
.914
024
545
.243
0W
inte
r 20
08-0
9Su
mm
ary
tota
l:14
022
738
869
.868
52,
352
4,09
675
6.2
7,20
40
442
Win
ter
2007
-08
Sum
mar
y to
tal:
160
221
433
80.1
733.
82,
389
4,70
079
57,
884
047
4W
inte
r 20
06-0
7Su
mm
ary
tota
l:77
.910
821
239
.035
8.5
1,16
32,
288
422
3,87
321
023
2

14 Preliminary Assessment of Chloride Concentrations, Loads, and Yields, Southeastern Connecticut, 2008–09Ta
ble
6.
Deic
ing
mat
eria
ls a
pplie
d to
tow
n ro
ads
durin
g th
e 20
08–0
9 w
inte
r sea
son,
sou
thea
ster
n Co
nnec
ticut
.
[--,
none
repo
rted;
Cl,
chlo
ride;
NaC
l, so
dium
chl
orid
e]
Tow
nCo
ntac
t
Tota
l dei
cing
pro
duct
app
lied,
in to
nsTo
tal C
l am
ount
app
lied,
in to
nsTo
tal
leng
th
of to
wn
road
s,
in
mile
s
Cl a
mou
nt a
pplie
d
per t
own
road
mile
, in
tons
Leng
th
of
tow
n ro
ads
in
ba
sins
, in
m
iles
Leng
th
of to
wn
road
s
in
grou
ped
area
s,
in m
iles
Cl lo
ad
in
grou
ped
stud
y ar
eas,
in
tons
Sand
an
d sa
lt m
ixtu
re
NaC
l fr
om
salt
and
sand
m
ixtu
re
NaC
l (h
alite
)
ICE
B
’ Gon
e1 bl
end
Sand
an
d
salt
mix
ture
NaC
l (h
alite
)
ICE
B’
GO
NE
blen
dTo
tal
Tota
l
Sand
an
d
salt
mix
ture
NaC
l (h
alite
)
ICE
B
’ GO
NE
blen
d
Four
Mile
Riv
er w
ater
shed
East
Lym
eM
. Gia
nnat
tasi
o--
--70
030
0--
425
201
626
112
5.6
--3.
81.
812
.514
.472
.8O
ld L
yme
E. A
dant
i22
055
99--
33.4
60.1
--93
601.
60.
561.
0--
1.9
Oil M
ill B
rook
, Sto
ny B
rook
, and
Jor
dan
Broo
k w
ater
shed
s
Wat
erfo
rdR
. Cus
ano
----
--1,
500
----
1,00
5 1,
005
120
8.4
----
8.4
24.2
2828
3M
ontv
ille
D. B
orde
au--
--2,
623
1,37
9--
1,59
192
42,
515
119
21.1
--13
.47.
83.
81 Ic
e B
’ Gon
e bl
end
cons
ists
of 1
4 pe
rcen
t mag
nesi
um c
hlor
ide
(MgC
l 2), 4
.2 p
erce
nt c
alci
um c
hlor
ide
(CaC
l 2), 0
.3 p
erce
nt so
dium
chl
orid
e (N
aCl),
0.1
per
cent
pot
assi
um c
hlor
ide
(KC
l), a
nd 5
0 pe
rcen
t di
still
ers c
onde
nsed
solu
bles
(by
wei
ght)
in 8
gal
lons
of s
olut
ion
per t
on o
f NaC
l.

Methods of Data Collection and Analysis 15
Continuous Monitoring
Continuous monitoring of water quality at each sampling site was accomplished using a water-quality monitoring instrument for measurement of temperature, specific conductance, and pH at 10-minute intervals. All procedures relating to water-quality monitors (calibration, maintenance, record computation, storage, and archiving) are described by Wagner and others (2006).
Water-Quality Sampling and Laboratory Analysis
Water-quality grab samples were collected (1) approximately monthly during routine conditions, (2) during base-flow conditions, and (3) during winter runoff events, such as winter storms or warm periods in which snow or ice melts. Field characteristics, which include water temperature, pH, and specific conductance, were measured during sample collection in accordance with USGS procedures described by Wilde (2004; 2005). Grab samples generally were analyzed for Cl concentrations only, and samples collected on August 19, 2009, during base-flow conditions were analyzed for major ions. All water samples collected were analyzed by the USGS National Water-Quality Laboratory (NWQL) in Denver, Colo., using the methodology described in Fishman and Friedman (1989).
Quality Assurance
Field sensors were regularly cleaned and calibrated with standard solutions and checked periodically with independent field and laboratory sensors. Continuous stage data and water-quality data were checked and corrected or censored for interruptions or shifts caused by debris, ice, or low-flow conditions. Quality-control procedures for the collection of continuous specific-conductance data followed procedures described in Wagner and others (2006).
Field quality-control procedures included the collection and analysis of replicate and blank samples. Field-blank samples provided information on bias or possible contamination during sample collection, processing, or analysis. Analytical results from the field-blank samples showed that concentrations of constituents were less than the reporting level. Analysis of replicate samples provided information on the variability of analytical results caused by sample collection, processing, and analysis. Analytical methods used in the laboratory for analysis of constituent concentrations were reported to be accurate within 3 to 12 percent for major ions, depending on the ionic concentration and the analytical method used (Fishman and Friedman, 1989). The charge balances for major ion analyses were all within +/- 3 percent.
Data Analysis
Data analysis included graphical plotting of concentrations of water-quality constituents, multiple-comparison tests, and statistical analyses of the relations between ancillary variables and Cl concentrations and yields in surface water.
Estimation of Chloride Concentrations
Cl concentrations were estimated using regression models that described the relation among measured Cl concentrations, specific conductance, and instantaneous streamflow. Grab samples collected manually at each of the sites upstream and downstream from I-95 from November 2008 to January 2010 and analyzed for Cl concentrations provided the “measured” Cl concentrations used in the regression models specific to each site (appendix 1).
The resulting multiple linear regression models were then used to predict daily mean Cl concentrations on the basis of daily mean values of specific conductance and flow. Instantaneous Cl concentrations, based on specific conductance and flow data collected every 10 minutes, were calculated for the period of available record at each station from November 2008 to September 2009.
The variables specific conductance and natural log of estimated instantaneous streamflow were found to be significant in relating ancillary variables to the dependent variable Cl concentration at seven of the eight sites (table 7). The instantaneous streamflow estimates were made at each of the four downstream sites but were significant when applied to the corresponding upstream site as well. At Oil Mill Brook downstream from I-95, the variable instantaneous flow was significant at p less than 0.05, but natural log of instantaneous flow was not. The use of the instantaneous flow variable improved the fit of each regression model and helped to explain additional variability, in comparison with the traditional method of using only specific conductance in a simple linear regression.
Estimation of Cl Loads and Yields
Cl loads in streams were estimated for each of the four sites downstream from I-95. Loads were estimated by multiplying the daily mean estimated Cl concentration by the daily mean streamflow for each day with available record. Total Cl loads in streams for the period of record were summarized along with daily loads and daily yields per square mile of watershed area. Lower and upper bounds of a 95-percent confidence interval were calculated for estimated Cl concentrations, and subsequently for daily Cl load and yield, to provide a range of plausible values.
Mean chloride yields per square mile at the downstream monitoring sites at Four Mile River, Oil Mill Brook, Stony Brook, and Jordan Brook were compared with annual Cl yield

16 Preliminary Assessment of Chloride Concentrations, Loads, and Yields, Southeastern Connecticut, 2008–09Ta
ble
7.
Mul
tiple
line
ar re
gres
sion
est
imat
es o
f mod
el c
oeffi
cien
ts a
nd s
tand
ard
erro
rs, t
-sta
tistic
s, a
nd p
-val
ues
for t
he d
epen
dent
var
iabl
e ch
lorid
e co
ncen
tratio
n at
m
onito
ring
site
s up
stre
am a
nd d
owns
tream
from
Inte
rsta
te 9
5, s
outh
east
ern
Conn
ectic
ut.
[µS/
cm; m
icro
siem
ens p
er c
entim
eter
; °C
; deg
rees
Cel
sius
; ft3 /s
, cub
ic fe
et p
er se
cond
; <, l
ess t
han]
Adj
uste
d r2
Vari
able
Uni
tsPa
ram
eter
es
timat
eSt
anda
rd
erro
rt-
stat
istic
p-va
lue
Four
Mile
Riv
er d
owns
tream
0.99
7In
terc
ept
Dim
ensi
onle
ss-8
.541
0.96
9-8
.811
<0.0
001
Spec
ific
cond
ucta
nce
μS/c
m a
t 25°
C0.
198
0.00
729
.115
<0.0
001
Nat
ural
log
inst
anta
neou
s flow
ft3 /s1.
336
0.19
66.
808
<0.0
001
Four
Mile
Riv
er u
pstre
am0.
798
Inte
rcep
tD
imen
sion
less
-10.
935
2.91
9-3
.746
0.00
2Sp
ecifi
c co
nduc
tanc
eμS
/cm
at 2
5°C
0.21
40.
027
7.81
9<0
.000
1N
atur
al lo
g in
stan
tane
ous fl
ow a
t dow
nstre
am si
teft3 /s
1.65
90.
341
4.87
20.
000
Oil
Mill
Bro
ok d
owns
tream
0.94
6In
terc
ept
Dim
ensi
onle
ss-6
.134
1.37
9-4
.449
0.00
0Sp
ecifi
c co
nduc
tanc
eμS
/cm
at 2
5°C
0.24
00.
016
15.2
32<0
.000
1In
stan
tane
ous fl
owft3 /s
0.14
70.
070
2.10
70.
049
Oil
Mill
Bro
ok u
pstre
am0.
958
Inte
rcep
tD
imen
sion
less
-10.
423
1.55
2-6
.715
<0.0
001
Spec
ific
cond
ucta
nce
μS/c
m a
t 25°
C0.
258
0.01
715
.449
<0.0
001
Nat
ural
log
inst
anta
neou
s flow
at d
owns
tream
site
ft3 /s1.
803
0.45
53.
959
0.00
2
Ston
y B
rook
dow
nstre
am0.
917
Inte
rcep
tD
imen
sion
less
-10.
194
2.73
0-3
.735
0.00
2Sp
ecifi
c co
nduc
tanc
eμS
/cm
at 2
5°C
0.24
80.
019
13.3
67<0
.000
1N
atur
al lo
g in
stan
tane
ous fl
owft3 /s
1.82
90.
519
3.52
60.
003
Ston
y B
rook
ups
tream
0.95
5In
terc
ept
Dim
ensi
onle
ss-1
6.42
03.
140
-5.2
290.
000
Spec
ific
cond
ucta
nce
μS/c
m a
t 25°
C0.
297
0.01
816
.250
<0.0
001
Nat
ural
log
inst
anta
neou
s flow
at d
owns
tream
site
ft3 /s2.
412
0.63
13.
825
0.00
2
Jord
an B
rook
dow
nstre
am0.
918
Inte
rcep
tD
imen
sion
less
-16.
625
5.06
3-3
.284
0.00
8Sp
ecifi
c co
nduc
tanc
eμS
/cm
at 2
5°C
0.28
80.
025
11.5
96<0
.000
1N
atur
al lo
g in
stan
tane
ous fl
owft3 /s
2.34
80.
631
3.72
30.
004
Jord
an B
rook
ups
tream
0.96
6In
terc
ept
Dim
ensi
onle
ss-2
2.69
33.
489
-6.5
05<0
.000
1Sp
ecifi
c co
nduc
tanc
eμS
/cm
at 2
5°C
0.31
20.
016
19.0
85<0
.000
1N
atur
al lo
g in
stan
tane
ous fl
ow a
t dow
nstre
am si
teft3 /s
3.29
50.
505
6.52
6<0
.000
1
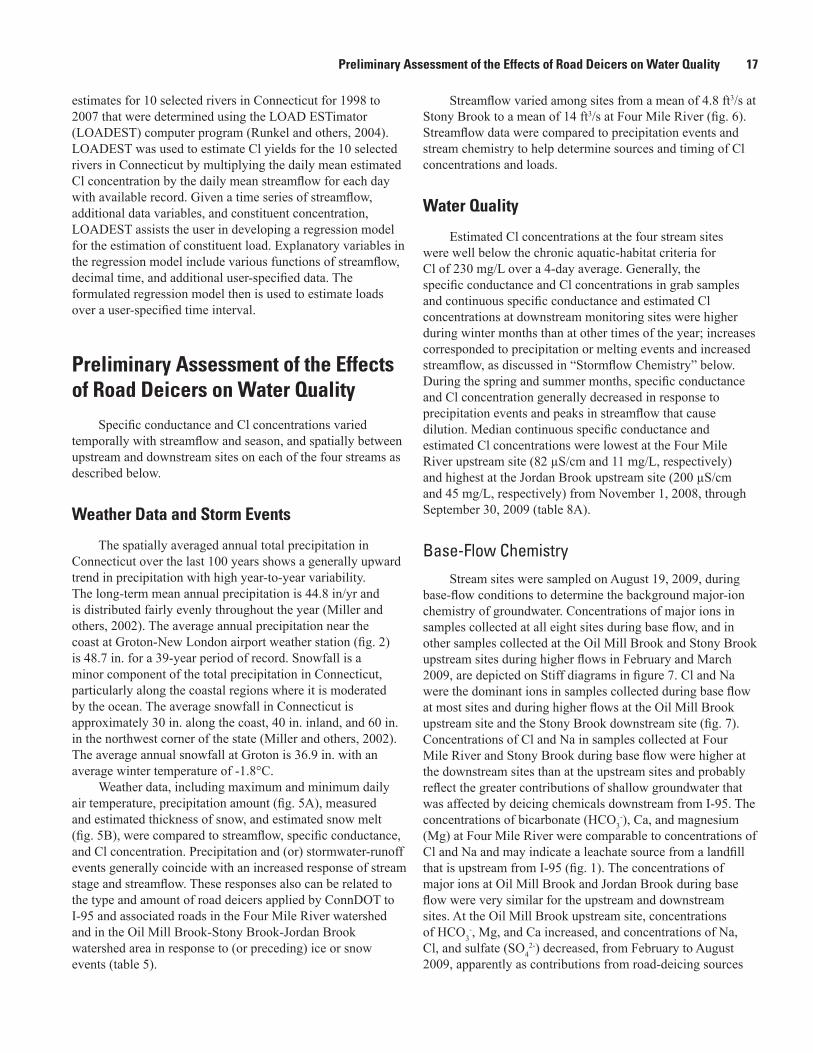
Preliminary Assessment of the Effects of Road Deicers on Water Quality 17
estimates for 10 selected rivers in Connecticut for 1998 to 2007 that were determined using the LOAD ESTimator (LOADEST) computer program (Runkel and others, 2004). LOADEST was used to estimate Cl yields for the 10 selected rivers in Connecticut by multiplying the daily mean estimated Cl concentration by the daily mean streamflow for each day with available record. Given a time series of streamflow, additional data variables, and constituent concentration, LOADEST assists the user in developing a regression model for the estimation of constituent load. Explanatory variables in the regression model include various functions of streamflow, decimal time, and additional user-specified data. The formulated regression model then is used to estimate loads over a user-specified time interval.
Preliminary Assessment of the Effects of Road Deicers on Water Quality
Specific conductance and Cl concentrations varied temporally with streamflow and season, and spatially between upstream and downstream sites on each of the four streams as described below.
Weather Data and Storm Events
The spatially averaged annual total precipitation in Connecticut over the last 100 years shows a generally upward trend in precipitation with high year-to-year variability. The long-term mean annual precipitation is 44.8 in/yr and is distributed fairly evenly throughout the year (Miller and others, 2002). The average annual precipitation near the coast at Groton-New London airport weather station (fig. 2) is 48.7 in. for a 39-year period of record. Snowfall is a minor component of the total precipitation in Connecticut, particularly along the coastal regions where it is moderated by the ocean. The average snowfall in Connecticut is approximately 30 in. along the coast, 40 in. inland, and 60 in. in the northwest corner of the state (Miller and others, 2002). The average annual snowfall at Groton is 36.9 in. with an average winter temperature of -1.8°C.
Weather data, including maximum and minimum daily air temperature, precipitation amount (fig. 5A), measured and estimated thickness of snow, and estimated snow melt (fig. 5B), were compared to streamflow, specific conductance, and Cl concentration. Precipitation and (or) stormwater-runoff events generally coincide with an increased response of stream stage and streamflow. These responses also can be related to the type and amount of road deicers applied by ConnDOT to I-95 and associated roads in the Four Mile River watershed and in the Oil Mill Brook-Stony Brook-Jordan Brook watershed area in response to (or preceding) ice or snow events (table 5).
Streamflow varied among sites from a mean of 4.8 ft3/s at Stony Brook to a mean of 14 ft3/s at Four Mile River (fig. 6). Streamflow data were compared to precipitation events and stream chemistry to help determine sources and timing of Cl concentrations and loads.
Water Quality
Estimated Cl concentrations at the four stream sites were well below the chronic aquatic-habitat criteria for Cl of 230 mg/L over a 4-day average. Generally, the specific conductance and Cl concentrations in grab samples and continuous specific conductance and estimated Cl concentrations at downstream monitoring sites were higher during winter months than at other times of the year; increases corresponded to precipitation or melting events and increased streamflow, as discussed in “Stormflow Chemistry” below. During the spring and summer months, specific conductance and Cl concentration generally decreased in response to precipitation events and peaks in streamflow that cause dilution. Median continuous specific conductance and estimated Cl concentrations were lowest at the Four Mile River upstream site (82 µS/cm and 11 mg/L, respectively) and highest at the Jordan Brook upstream site (200 µS/cm and 45 mg/L, respectively) from November 1, 2008, through September 30, 2009 (table 8A).
Base-Flow ChemistryStream sites were sampled on August 19, 2009, during
base-flow conditions to determine the background major-ion chemistry of groundwater. Concentrations of major ions in samples collected at all eight sites during base flow, and in other samples collected at the Oil Mill Brook and Stony Brook upstream sites during higher flows in February and March 2009, are depicted on Stiff diagrams in figure 7. Cl and Na were the dominant ions in samples collected during base flow at most sites and during higher flows at the Oil Mill Brook upstream site and the Stony Brook downstream site (fig. 7). Concentrations of Cl and Na in samples collected at Four Mile River and Stony Brook during base flow were higher at the downstream sites than at the upstream sites and probably reflect the greater contributions of shallow groundwater that was affected by deicing chemicals downstream from I-95. The concentrations of bicarbonate (HCO3
-), Ca, and magnesium (Mg) at Four Mile River were comparable to concentrations of Cl and Na and may indicate a leachate source from a landfill that is upstream from I-95 (fig. 1). The concentrations of major ions at Oil Mill Brook and Jordan Brook during base flow were very similar for the upstream and downstream sites. At the Oil Mill Brook upstream site, concentrations of HCO3
-, Mg, and Ca increased, and concentrations of Na, Cl, and sulfate (SO4
2-) decreased, from February to August 2009, apparently as contributions from road-deicing sources

18 Preliminary Assessment of Chloride Concentrations, Loads, and Yields, Southeastern Connecticut, 2008–09P
RECI
PITA
TIO
N, I
N IN
CHES
TEM
PERA
TURE
, IN
DEG
REES
CEL
SIU
S
ESTI
MA
TED
HO
URL
Y SN
OW
TH
ICKN
ESS,
IN IN
CHES
ESTI
MA
TED
HO
URL
Y SN
OW
M
ELT,
IN IN
CHES
1 2 3 4 5 6 7 8 9 10 11 12 13
1 2 3 4 5 6 7 8
0
5
10
15
20
0.06
0.08
0.04
0.02
0
Estimated snow thickness
Estimated snow melt
11 Storm (number de�ned in table 5)
PERIODS OF DEICER APPLICATION
EXPLANATION
Activity (number de�ned in table 5)
A
B
0
0.2
0.4
0.6
0.8
1.0
-10
0
10
20
30
-20
P re c ipitationEXPLANATION
Maximum daily air temperatureMinimum daily air temperature
D ecNov Jan F eb M ar A pr M ay Jun Jul A ug S ep2008
DATE2009
Figure 5. A, Maximum and minimum daily air temperature and continuous precipitation at the Groton-New London airport weather station, and B, estimated hourly snow thickness and snow melt at a snow observation station in southeastern Connecticut, November 2008–September 2009. (Details on application of deicers are shown in tables 4 and 5.)
decreased and contributions from base flow increased throughout the spring and summer. Major ion concentrations in base flow at the Four Mile River sites are comparable to concentrations in shallow groundwater from undeveloped areas. Concentrations of major ions in groundwater samples from three shallow wells in forested areas in Connecticut (Grady and Mullaney, 1998) indicate patterns of ions that are less dominated by Na and Cl than in stream-water samples that have relatively high concentrations of Ca, Mg, and HCO3 (fig. 7).
Stormflow ChemistryDuring winter months, specific conductance and
Cl concentrations in streams generally increased with precipitation or melting events and subsequent increases in streamflow as a result of road deicers washed from road surfaces by stormwater. Periods of increased continuous
specific conductance and estimated Cl concentrations were observed at downstream monitoring sites (1) in direct response to a storm or deicing activity (figs. 8–11; table 5) or (2) during a period of rain or melting that occurred after a storm or activity. Most of the increase in Cl concentrations between upstream and downstream sites probably resulted from deicing salts carried in stormwater washed from I-95 highway lanes, ramps, access roads (table 4), other state or town roads, parking lots, sidewalks, and driveways. Specific conductance and Cl concentrations at upstream monitoring sites generally decreased during precipitation and melting events as a result of dilution. Some upstream monitoring sites, however, including the Stony Brook upstream site (011277916), showed increased specific conductance and Cl concentrations during these events because some runoff from the highway is discharged to the upstream watershed. During the spring and summer months, specific conductance in continuous measurements and Cl concentrations in samples generally decreased in response

Preliminary Assessment of the Effects of Road Deicers on Water Quality 19
1.0
0.8
0.6
0.4
0.2
0
PREC
IPIT
ATI
ON
, IN
INCH
ES
D ecNov Jan F eb
DATE
M ar A pr M ay Jun Jul A ug S ep 2009 2008
0
40
80
120
150
F our Mile River stream�ow
EXPLANATION
O il Mill Brook stream�ow
S tony Brook stream�ow
Jordan Brook stream�ow
P recipitation
STRE
AM
FLO
W, I
N C
UBI
C FE
ET P
ER S
ECO
ND
Figure 6. Continuous streamflow at the downstream monitoring sites at Four Mile River, Oil Mill Brook, Stony Brook, and Jordan Brook, and precipitation at Groton-New London airport weather station, southeastern Connecticut, November 2008–September 2009.
to precipitation events and subsequent increases in streamflow. According to ConnDOT records, no road deicers were applied to state roads after March 2, 2009, during the 2008–09 winter season (table 5 and fig. 5). The continued increase in specific conductance and estimated Cl concentrations with increased stormflow at some sites after about April 21, 2009, when daily mean temperatures exceeded 0°C and all snow had melted indicates that high concentrations of Cl and other deicing constituents were retained in soils and or shallow groundwater and continued to affect stream chemistry through the early part of the spring.
Four Mile River
Water-quality data at the Four Mile River upstream and downstream sites were recorded continuously from January 12, 2009, and December 19, 2008, respectively, through the interim study period. Median specific conductance and estimated Cl concentrations were slightly higher at the
downstream site than at the upstream site through the study period (table 8A and fig. 8). During winter months, specific conductance and Cl concentrations at the downstream site increased in response to several deicing events—winter storms 4, 5, 7, 10, and 12 and activity 6, and rain or snow melting events on February 12 and February 27, 2009 (fig. 8 and table 5). The estimated amount of salt applied to I-95 and associated roads in the Four Mile River area indicate that, although the date and amount of deicers applied to state roads correspond to increases in specific conductance in some cases (table 5 and fig. 8A), the response in stream chemistry better relates to both the cumulative amount and period of deicer application in addition to the occurrence of rain and (or) warm temperatures and subsequent melting that washes deicers into the stream. For example, storms 4 and 5 (fig. 5B), which represent the first winter storms during the recording of data at the Four Mile River downstream site, resulted in increased levels of specific conductance and estimated Cl concentrations in the stream (fig. 8). However, deicers applied during storm

20 Preliminary Assessment of Chloride Concentrations, Loads, and Yields, Southeastern Connecticut, 2008–09Ta
ble
8.
Sum
mar
y st
atis
tics
for s
peci
fic c
ondu
ctan
ce a
nd e
stim
ated
chl
orid
e co
ncen
tratio
ns fo
r A, c
ontin
uous
dat
a an
d B,
gra
b sa
mpl
es a
t the
eig
ht m
onito
ring
site
s,
sout
heas
tern
Con
nect
icut
, Nov
embe
r 200
8–Se
ptem
ber 2
009.
[Spe
cific
con
duct
ance
is in
mic
rosi
emen
s per
cen
timet
er a
t 25
degr
ees C
elsi
us; c
once
ntra
tion
is in
mill
igra
ms p
er li
ter]
Stre
amW
ater
-qua
lity
para
met
erU
pstr
eam
site
Dow
nstr
eam
site
Num
ber o
f sa
mpl
esM
inim
umM
ean
Med
ian
Max
imum
Num
ber o
f sa
mpl
esM
inim
umM
ean
Med
ian
Max
imum
A. C
ontin
uous
dat
a
Four
Mile
Riv
erSp
ecifi
c co
nduc
tanc
e 3
7,65
2 51
82.7
8212
6 4
1,25
8 55
.089
.689
527
Chl
orid
e co
ncen
tratio
n 3
7,65
2 6.
511
1121
51,
258
7.7
1212
100
Oil
Mill
Bro
okSp
ecifi
c co
nduc
tanc
e 3
0,71
3 34
89.3
91.0
231
30,
720
34.0
90.2
9270
3C
hlor
ide
conc
entra
tion
30,
713
6.7
1616
54 3
0,72
0 8.
817
1716
0St
ony
Bro
okSp
ecifi
c co
nduc
tanc
e 3
1,19
7 39
138
135
235
38,
517
45.0
144
144
431
Chl
orid
e co
ncen
tratio
n 3
1,19
7 1
2826
57 3
8,51
7 9.
328
2810
0Jo
rdan
Bro
okSp
ecifi
c co
nduc
tanc
e 1
0,86
5 11
619
820
035
2 3
4,19
5 54
186
188
341
Estim
ated
chl
orid
e co
ncen
tratio
n 1
0,86
5 26
4545
95 3
4,19
5 8.
940
4087
B. G
rab
sam
ples
Four
Mile
Riv
erSp
ecifi
c co
nduc
tanc
e12
64.0
80.5
83.5
98.0
1266
84.7
8910
0C
hlor
ide
conc
entra
tion
147
1011
1414
8.6
1212
14O
il M
ill B
rook
Spec
ific
cond
ucta
nce
1377
88.9
8998
1371
88.9
89.0
100.
0C
hlor
ide
conc
entra
tion
1714
1615
1916
1416
1719
Ston
y B
rook
Spec
ific
cond
ucta
nce
1211
014
814
421
416
91.0
144
144
181
Chl
orid
e co
ncen
tratio
n12
2130
2747
1615
2828
36Jo
rdan
Bro
okSp
ecifi
c co
nduc
tanc
e12
169
194
197
213
1216
919
619
721
9C
hlor
ide
conc
entra
tion
1335
4242
5112
5241
4142
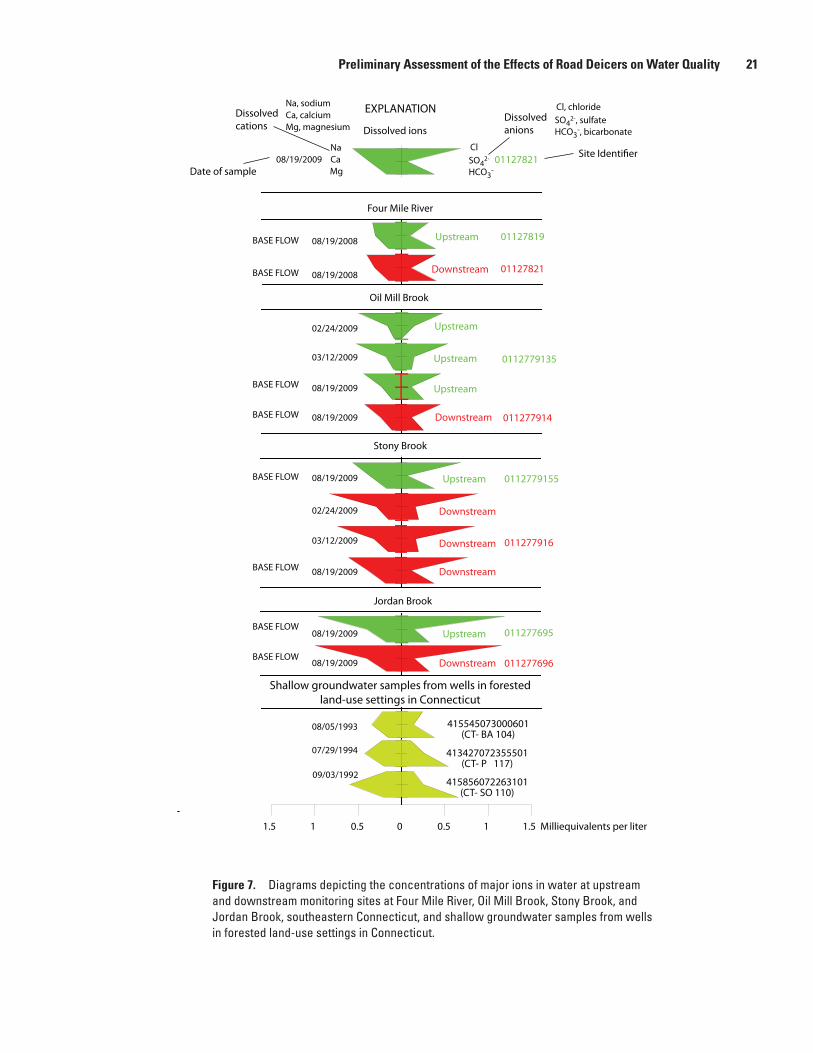
Preliminary Assessment of the Effects of Road Deicers on Water Quality 21
0.5 0 0.5 1 1 1.5 Milliequivalents per liter 1.5
Na ClCa SO4
2-
Mg
Na, sodiumCa, calciumMg, magnesium
HCO3-
Cl, chlorideSO4
2-, sulfateHCO3
-, bicarbonate
Site Identi�er
Date of sample
BASE FLOW
BASE FLOW
BASE FLOW
BASE FLOW
BASE FLOW
BASE FLOW
BASE FLOW
BASE FLOW
Jordan Brook
Four Mile River
Oil Mill Brook
Stony Brook
EXPLANATION
08/19/2009
08/05/1993
07/29/1994
09/03/1992
08/19/2009
08/19/2009
02/24/2009
03/12/2009
08/19/2009
08/19/2009
02/24/2009
03/12/2009
08/19/2009
08/19/2009
08/19/2008
08/19/2008
Shallow groundwater samples from wells in forested land-use settings in Connecticut
Upstream
Upstream
Upstream
Upstream
Downstream
Upstream
Upstream
Downstream
Downstream
Downstream
Downstream
Downstream
01127819
01127821
0112779135
011277914
0112779155
01127821
011277916
011277695
011277696
413427072355501(CT- P 117)
415856072263101(CT- SO 110)
415545073000601(CT- BA 104)
Dissolvedanions
Dissolvedcations Dissolved ions
Figure 7. Diagrams depicting the concentrations of major ions in water at upstream and downstream monitoring sites at Four Mile River, Oil Mill Brook, Stony Brook, and Jordan Brook, southeastern Connecticut, and shallow groundwater samples from wells in forested land-use settings in Connecticut.

22 Preliminary Assessment of Chloride Concentrations, Loads, and Yields, Southeastern Connecticut, 2008–09
-100
0
100
200
300
400
500
SPEC
IFIC
CO
ND
UCT
AN
CE, I
N M
ICRO
SIEM
ENS
PER
CEN
TIM
ETER
0
100
200
STRE
AM
FLO
W A
T TH
E D
OW
NST
REA
M
SITE
, IN
CU
BIC
FEE
T PE
R SE
CON
D
Chloride concentration, downstream (estimated)Chloride concentration, upstream (estimated)Chloride concentration, downstream (grab sample)Chloride concentration, upstream (grab sample)
EXPLANATION
CH
LOR
IDE
CO
NCE
NTR
ATI
ON
, IN
MIL
LIG
RA
MS
PE
R L
ITE
R
0
20
40
60
80
100
1.0
0.8
0.6
0.4
0.2
0
D ECNOV JAN F EB M AR A PR M AY JUN JUL A UG S EP
PREC
IPIT
ATI
ON
, IN
INCH
ES
DATE 2009 2008
1 2 3 4 5 6 7 8 9 10 11 12 13
1 2 3 4 5 6 7 8
2/12/09
A
B
Four Mile River
Speci�c conductance, downstream (continuous)Speci�c conductance, upstream (continuous)Speci�c conductance, downstream (grab sample)Speci�c conductance, upstream (grab sample)Stream�owPrecipitation
PERIODS OF DEICER APPLICATION
EXPLANATION
11 Storm (number de�ned in table 5)
Activity (number de�ned in table 5)
Figure 8. A, Specific conductance in grab samples, continuous specific conductance at Four Mile River upstream and downstream sites, continuous streamflow at the downstream site, and precipitation at Groton-New London airport weather station, and B, chloride concentrations measured in grab samples and estimated continuous chloride concentrations at Four Mile River upstream and downstream sites, southeastern Connecticut, November 2008–September 2009.

Preliminary Assessment of the Effects of Road Deicers on Water Quality 23
6, which consisted of several inches of snow with cold temperatures and no rain, and activities 2 and 3 (fig. 5B) did not lead to any observed response in specific conductance at the Four Mile River downstream site (fig. 8), most likely because of the subfreezing temperatures and absence of rain or melting and subsequent runoff. Storm 7 consisted of snow followed by rain and resulted in the highest specific conductance (527 µS/cm) and estimated Cl concentration (100 mg/L) during winter for this site (fig. 8 and table 8). An estimated 28.6 tons of NaCl and 307 gal of CaCl2 were applied to I-95 and associated state roadways (table 5) in the “frozen” period between the end of storm 5 on December 24 and the beginning of the increased levels of specific conductance on January 7 at 6 a.m., 14 hours into the deicer application. A similar cold period between storm 7 and storm 10 (during January 27–29) showed no increases in specific conductance or estimated Cl concentrations in response to applications for storms 8 and 9. Finally, the period between storm 10 and storm 12, and the deicer applications in between, had no major increases in specific conductance, except during a rain event on February 12, 2009, when specific conductance reached 289 µS/cm.
Oil Mill Brook
Water-quality data at the Oil Mill Brook upstream and downstream sites were recorded continuously beginning January 7, 2009, through the interim study period; however, data are missing for the period from February 4 to March 13, 2009, because of equipment failure. Specific conductance and estimated Cl concentrations were slightly higher at the downstream site than at the upstream site until the middle of August 2009 when values at the downstream site became slightly higher (fig. 9).
Specific conductance and estimated Cl concentrations increased at Oil Mill Brook upstream and downstream sites in response to winter storms 7, 8, and 10 and increased streamflow (fig. 9). Larger increases in specific conductance and estimated Cl concentrations at the downstream site than at the upstream site in response to storms 7, 8, and 10 likely were caused by deicers washed from I-95. At the downstream site, stormwater runoff from a local road and bridge was observed to flow into the stream near the monitor and may have affected specific conductance and estimated Cl concentrations during snow melt. In March 2010 (after the interim period of study), an additional monitor was added upstream from the existing monitor to measure conditions that are not affected by runoff from the town road.
Stony Brook
Water-quality data for Stony Brook were recorded continuously from January 6, 2009, at the downstream site and from February 2, 2009, at the upstream site through the interim study period (fig. 10); however, specific conductance and estimated Cl concentration data for the upstream site are missing for the period from May 20–29, 2009, because
of equipment failure. Median specific conductance and estimated Cl concentrations were slightly higher at the downstream site than at the upstream site through the study period (table 8A). Specific conductance was elevated at the Stony Brook downstream site during discharge events on January 7 (storm 7), January 28 (storm 10), and February 2–4, 2009 (storm 11), and during other deicing activities on February 18–19 and 19–20 (activities 6 and 7), presumably by increased concentrations of Cl, Na, and other ions in deicing chemicals washed off roads. Specific conductance and estimated Cl concentrations in February and early March, however, generally decreased during discharge events because of dilution (fig. 10). Specific conductance and estimated Cl concentrations were slightly higher at the downstream site than at the upstream site throughout the period of record with two exceptions. During February 15–18, 2009, elevated levels of specific conductance might have resulted from some melting of remaining snow near I-95 or other upstream roads; as discussed previously, some drainage from I-95 flows to the north and likely affects the upstream site water-quality monitor. Upstream and downstream sites are 0.82 mi apart; therefore, another possible cause for this discrepancy could be dilution from groundwater and (or) stormwater runoff between the upstream and downstream sites that acts to dampen the increase at the downstream site. Specific conductance also was higher at the upstream site than at the downstream site during August and September 2009. The reason for the increase at the upstream site is not known, but the absence of an increase in specific conductance at the downstream site could result from dilution. Elevated levels of specific conductance at the downstream site on March 9 and 12–13 were associated with rain events or warm air temperatures and likely resulted from salts in melting snow piles and (or) deicing salts that were flushed from soils and shallow groundwater, then discharged downstream. Studies have reported a substantial portion (45 to 85 percent) of Cl in deicers is not removed by overland flow but infiltrates into soils and (or) groundwater (Howard and Haynes, 1993; Church and Friez, 1993; Toler and Pollock, 1974).
Jordan Brook
Water-quality data for the Jordan Brook upstream and downstream sites were recorded continuously beginning February 5, 2009 (fig. 11). Median specific conductance and estimated Cl concentrations were slightly lower at the downstream site than at the upstream site throughout the study period (table 8A). Runoff from a parking lot adjacent to the upstream site likely contributed deicing salts in winter and early spring; base flow, which can include anthropogenic sources such as septic-tank drainfields, is also a possible contributor of salts throughout the year. Specific conductance and estimated Cl concentrations generally increased concurrently at the Jordan Brook upstream and downstream sites during winter and early spring discharge events. Increased levels of specific conductance and estimated

24 Preliminary Assessment of Chloride Concentrations, Loads, and Yields, Southeastern Connecticut, 2008–09
0
50
100
150
200
CHLO
RID
E CO
NCE
NTR
ATI
ON
, IN
MIL
LIG
RAM
S PE
R LI
TER
1.0
0.8
0.6
0.4
0.2
0
-100
0
100
200
300
400
O il M ill B rook
0
500
SPEC
IFIC
CO
ND
UCT
AN
CE, I
N M
ICRO
SIEM
ENS
PER
CEN
TIM
ETER
Missing record
Missing record
Missing record
STRE
AM
FLO
W, I
N C
UBI
C F
EET
PER
SECO
ND
PREC
IPIT
ATI
ON
, IN
INCH
ES
Peak is o� scale(703 microsiemens per centimeter)
A
B
D ecNov Jan F eb M ar A pr M ay Jun Jul A ug S ep
1 2 3 4 5 6 7 8 9 10 11 12 13
1 2 3 4 5 6 7 8
100
200
DATE
Chloride concentration, downstream (estimated)Chloride concentration, upstream (estimated)Chloride concentration, downstream (grab sample)Chloride concentration, upstream (grab sample)
EXPLANATION
2009 2008
Speci�c conductance, downstream (continuous)Speci�c conductance, upstream (continuous)Speci�c conductance, downstream (grab sample)Speci�c conductance, upstream (grab sample)Stream�owPrecipitation
PERIODS OF DEICER APPLICATION
EXPLANATION
11 Storm (number de�ned in table 5)
Activity (number de�ned in table 5)
Figure 9. A, Specific conductance in grab samples and continuous specific conductance at Oil Mill Brook upstream and downstream sites, continuous streamflow at the downstream site, and precipitation at Groton-New London airport weather station, and B, chloride concentrations measured in grab samples and estimated continuous chloride concentrations at Oil Mill Brook upstream and downstream sites, southeastern Connecticut, November 2008–September 2009.
Preliminary Assessment of the Effects of Road Deicers on Water Quality 25
0
50
100
150
200
CH
LOR
IDE
CO
NCE
NTR
ATI
ON
, IN
MIL
LIG
RA
MS
PE
R L
ITE
R
Chloride concentration, downstream (estimated)Chloride concentration, upstream (estimated)Chloride concentration, downstream (grab sample)Chloride concentration, upstream (grab sample)
EXPLANATION
Missing record
-100
0
100
200
300
400
500
SPEC
IFIC
CO
ND
UCT
AN
CE, I
N M
ICRO
SIEM
ENS
PER
CEN
TIM
ETER
S tony B rook
0
100
200
STRA
MFL
OW
, IN
CU
BIC
FEE
T PE
R SE
CON
DPR
ECIP
ITA
TIO
N,
IN IN
CHES
Meltingevents
Deicing salts from snow pilesor shallow groundwater
Missing record
2/15- 2/17
3/12- 3/133/9
A
B
DECNOV JAN FEB MAR APR MAY JUN JUL AUG SEP
1 2 3 4 5 6 7 8 9 10 11 12 13
1 2 3 4 5 6 7 8
1.0
0.8
0.6
0.4
0.2
0
DATE 2009 2008
Speci�c conductance, downstream (continuous)Speci�c conductance, upstream (continuous)Speci�c conductance, downstream (grab sample)Speci�c conductance, upstream (grab sample)Stream�owPrecipitation
PERIODS OF DEICER APPLICATION
11 Storm (number de�ned in table 5)
Activity (number de�ned in table 5)
EXPLANATION
Figure 10. A, Specific conductance in grab samples and continuous specific conductance at Stony Brook upstream and downstream sites, continuous streamflow at the downstream site, and precipitation at Groton-New London airport weather station, and B, chloride concentrations measured in grab samples and estimated continuous chloride concentrations at Stony Brook upstream and downstream sites, southeastern Connecticut, November 2008–September 2009.

26 Preliminary Assessment of Chloride Concentrations, Loads, and Yields, Southeastern Connecticut, 2008–09
Chloride concentration, downstream (estimated)Chloride concentration, upstream (estimated)Chloride concentration, downstream (grab sample)Chloride concentration, upstream (grab sample)
EXPLANATION
STRE
AM
FLO
W, I
N C
UBI
C F
EET
PER
SECO
ND
-100
0
100
200
300
400
500
Jordan B rook
0
100
200
0
50
100
150
200
CHLO
RID
E CO
NCE
NTR
ATI
ON
, IN
MIL
LIG
RAM
S PE
R LI
TER
2/8
3/9
3/193/62/28
2/12
PREC
IPIT
ATI
ON
, IN
INCH
ES
}
A
B
SPEC
IFIC
CO
ND
UCT
AN
CE, I
N M
ICRO
SIEM
ENS
PER
CEN
TIM
ETER Melting
events
Deicing salts from snow pilesor shallow groundwater
Speci�c conductance, downstream (continuous)Speci�c conductance, upstream (continuous)Speci�c conductance, downstream (grab sample)Speci�c conductance, upstream (grab sample)Stream�owPrecipitation
PERIODS OF DEICER APPLICATIONEXPLANATION
11 Storm (number de�ned in table 5)
Activity (number de�ned in table 5)
D ecNov Jan F eb M ar A pr M ay Jun Jul A ug S ep
1 2 3 4 5 6 7 8 9 10 11 12 13
1 2 3 4 5 6 7 8
1.0
0.8
0.6
0.4
0.2
0
DATE 2009 2008
Figure 11. A, Specific conductance in grab samples and continuous specific conductance at Jordan Brook upstream and downstream sites, continuous streamflow at the downstream site, and precipitation at Groton-New London airport weather station, and B, chloride concentrations measured in grab samples and estimated continuous chloride concentrations at Jordan Brook upstream and downstream sites, southeastern Connecticut, November 2008–September 2009.

Preliminary Assessment of the Effects of Road Deicers on Water Quality 27
Cl concentrations coincided with several winter storms or deicing activities, presumably as a result of Cl and other ions washed from road surfaces. Increases in specific conductance and Cl concentration on January 28 coincided with storm 10, and the multiple peaks during February 19 and March 2 coincided with deicing activities 6, 7, and 8 and storms 12 and 13 (table 5 and fig. 11). The highest specific conductance measured and Cl concentration estimated were 352 µS/cm and 95 mg/L, respectively, on February 8; these values are associated with warm temperatures and melting of snow (figs. 5 and 11).
Specific conductance and estimated Cl concentrations commonly were highest at the upstream site and probably relate to the large percentage of adjacent impervious surfaces, relative to the downstream site, that were subjected to deicing chemicals. The application of deicing chemicals to several large parking lots to the west of the upstream site during snow or ice events resulted in high concentrations of Cl, Na, and other ions that were washed into Jordan Brook. Large mounds of snow that are plowed from impervious surfaces contain deicers that are released through melting, which occurs well after winter storm events. Increases in specific conductance and estimated Cl concentrations at upstream and downstream sites on February 28 and March 3, 6, 9, and 19, 2009, probably resulted from delayed snow melt. Increases in specific conductance at the downstream site on March 26, 28, 29, and April 3, 2009, were associated with rain events and likely resulted from salts in melting snow piles and (or) Cl and other ions in deicers that were flushed from soils and shallow groundwater, then discharged downstream. A similar effect was observed at the Stony Brook downstream site (fig. 10). After April 3, specific conductance and estimated Cl concentrations in Jordan Brook decreased during precipitation and discharge events as a result of dilution (fig. 11).
Chloride LoadsDaily mean Cl concentrations were estimated for the
periods of the study at each of the upstream and downstream sites, and daily loads were estimated for each of the downstream sites (figs. 12, 13, 14, and 15). The estimated daily mean Cl concentration at downstream sites, like instantaneous Cl concentrations, increased with streamflow (and stormwater runoff of road deicers) during most winter storms but decreased through dilution during the warmer months (figs. 12A, 13A, 14A, and 15A). Estimated daily loads, however, generally increased with streamflow and reflect the greater overall Cl amounts that were transported despite the dilution that occurred (figs. 12B, 13B, 14B, and 15B). Cl loads in streams generally were highest in the winter and early spring. Estimated Cl yields for the four monitoring sites downstream from Interstate 95 during the interim study period ranged from 17.3 tons per square mile (ton/mi2 ) (98 tons total) at the Oil Mill Brook downstream site to 50 tons/mi2 (140 tons total) at the Jordan Brook downstream site (table 9A). The estimated daily yield in the downstream sites ranged from
0.07 (ton/d)/mi2 for Oil Mill Brook, which had the highest percentage of forest and wetland area, to 0.21 (ton/d)/mi2 for Jordan Brook, which had the lowest percentage of forest and wetland area and the highest percentage of urban development. The lower and upper bounds of a 95-percent confidence interval for estimated Cl loads and yields show a narrow range of values and indicate reasonably low uncertainty in the predicted values (table 9A).
Based on data from the three NADP stations, the estimated percent contribution of Cl load from atmospheric deposition ranged from 9.5 to 94 tons for the Four Mile River watershed area and from 16 to 160 tons for the Oil Mill Brook-Stony Brook-Jordan Brook watershed area (table 9B). The contribution of Cl from atmospheric deposition to the watershed areas during the study period was 6.1, 7.1, and 60 percent for the Four Mile River watershed and 3.9, 4.3, and 36 percent at the Oil Mill Brook-Stony Brook-Jordan Brook watersheds area, based on the concentrations at the Abington, Conn., Lexington, Mass., and Cedar Beach, N.Y., NADP stations, respectively. The highest value is based on the concentration at the Cedar Beach, N.Y., NADP station, which is strongly affected by sea spray. Atmospheric deposition in the watersheds in this study, in general, should not be as affected by seawater as is the Cedar Beach station, so the values based on the NADP station in Lexington, Mass., are considered to be most representative of the contribution from atmospheric deposition.
The Cl loads in streams (outputs) were compared with Cl load inputs, including atmospheric deposition and deicer applications by ConnDOT and by towns (table 9B). Using data from the Lexington, Mass., NADP station, the Cl load inputs for the Four Mile River watershed represented about 32 percent of the Cl load leaving the watershed by the stream, and the Cl load inputs for the Oil Mill Brook-Stony Brook-Jordan Brook watersheds area represented about 69 percent of the Cl load leaving by the streams (table 9B). The percent contribution of chloride input that is unaccounted for in the mass balance for the watershed areas could be related to the lag period between the application of deicers and concentrations observed in streams, which is difficult to account for. Furthermore, this assessment of load balance is only qualitative and does not include the Cl load in groundwater leaving the study areas. Estimates of direct infiltration of Cl that originates from atmospheric deposition, deicer applications, septic-tank drainfields, and others sources of groundwater were not within the scope of this project.
Cl yields at the downstream monitoring stations at Four Mile River, Oil Mill Brook, Stony Brook, and Jordan Brook (table 9A) were compared with annual Cl yield estimates for 10 selected rivers in Connecticut during 1998–2007 that were estimated using LOADEST (fig. 16). Four Mile River and Oil Mill Brook had low estimated Cl yields, similar to yields at Bunnell (Burlington) Brook and Shetucket River, and reflect the low percentages of developed land and impervious area (table 1). Estimated Cl yields at Jordan Brook and Stony Brook were relatively high but were not as high as those for

28 Preliminary Assessment of Chloride Concentrations, Loads, and Yields, Southeastern Connecticut, 2008–09ES
TIM
ATE
D M
EAN
CH
LOR
IDE
CON
CEN
TRA
TIO
N,
IN M
ILLI
GR
AM
S P
ER L
ITER
STRE
AM
FLO
W, I
N
CUBI
C FE
ET P
ER S
ECO
ND
LoadStream�ow
EXPLANATIONEstimated load =133 tons Estimated daily mean load = 0.46 tons
0
1
2
3
4
5
ESTI
MA
TED
MEA
N C
HLO
RID
E LO
AD
, IN
TO
NS
PER
DA
Y
11/1/2008 1/23/2009 4/16/2009
DATE
7/8/2009 9/30/2009
0
20
40
60DownstreamUpstream
0
50
100
150
EXPLANATION
B
A
Figure 12. A, Estimated daily mean chloride concentrations at Four Mile River upstream and downstream sites, and B, estimated daily mean chloride load and streamflow for the Four Mile River downstream site, southeastern Connecticut, November 2008–September 2009.

Preliminary Assessment of the Effects of Road Deicers on Water Quality 29
11/1/2008 1/23/2009 4/16/2009 7/8/2009 9/30/20090
1
2
3
4
5Estimated load = 98 tons (note missing record)Estimated daily mean load = 0.40 tons
0
50
100
150
ES
TIM
AT
ED
MEA
N C
HLO
RID
E L
OA
D,
IN T
ON
S P
ER
DA
Y
LoadStreamf low
EXPLANATION
DATE
STRE
AM
FLO
W, I
N
CUBI
C FE
ET P
ER S
ECO
ND
B
A
0
20
40
60
ESTI
MA
TED
MEA
N C
HLO
RID
E CO
NCE
NTR
ATI
ON
, IN
MIL
LIG
RA
MS
PER
LIT
ER
DownstreamUpstream
EXPLANATION
Missing record
Missing record
Missing record
Figure 13. A, Estimated daily mean chloride concentrations at Oil Mill Brook upstream and downstream sites, and B, estimated daily mean chloride load and streamflow for the Oil Mill Brook downstream site, southeastern Connecticut, November 2008–September 2009.

30 Preliminary Assessment of Chloride Concentrations, Loads, and Yields, Southeastern Connecticut, 2008–09
11/1/2008 1/23/2009 4/16/2009 7/8/2009 9/30/20090
1
2
3
4
5Estimated load = 88 tonsEstimated daily mean load = 0.32 tons
0
50
100
150
ES
TIM
AT
ED
MEA
N C
HLO
RID
E L
OA
D,
IN T
ON
S P
ER
DA
Y
LoadStream�ow
EXPLANATION
DATE
fitfit
0
STRE
AM
FLO
W, I
N
CUBI
C FE
ET P
ER S
ECO
ND
Missing record
20
40
60
ES
TIM
AT
ED
MEA
N C
HLO
RID
E
CON
CEN
TRA
TIO
N,
IN M
ILLI
GR
AM
S P
ER
LIT
ER
DownstreamUpstream
EXPLANATION
Missing record
B
A
Figure 14. A, Estimated daily mean chloride concentrations at Stony Brook upstream and downstream sites, and B, estimated daily mean chloride load and streamflow for the Stony Brook downstream site, southeastern Connecticut, November 2008–September 2009.

Preliminary Assessment of the Effects of Road Deicers on Water Quality 31
11/1/2008 1/23/2009 4/16/2009 7/8/2009 9/30/20090
1
2
3
4
5Estimated load = 140 tonsEstimated daily mean load = 0.59 tons
0
50
100
150
ES
TIM
AT
ED
MEA
N C
HLO
RID
E L
OA
D,
IN T
ON
S P
ER
DA
Y
LoadStream�ow
EXPLANATION
DATE
fitfit
0
20
40
60
ESTI
MA
TED
MEA
N C
HLO
RID
E CO
NCE
NTR
ATI
ON
, IN
MIL
LIG
RAM
S PE
R LI
TER
DownstreamUpstream
EXPLANATION
Missing record
STRE
AM
FLO
W, I
N
CUBI
C FE
ET P
ER S
ECO
ND
B
A
Figure 15. A, Estimated daily mean chloride concentrations at Jordan Brook upstream and downstream sites, and B, estimated daily mean chloride load and streamflow for the Jordan Brook downstream site, southeastern Connecticut, November 2008–September 2009.

32 Preliminary Assessment of Chloride Concentrations, Loads, and Yields, Southeastern Connecticut, 2008–09Ta
ble
9A.
Estim
ated
mea
n ch
lorid
e lo
ads
for s
tream
s at
the
four
mon
itorin
g si
tes
dow
nstre
am fr
om In
ters
tate
95,
sou
thea
ster
n Co
nnec
ticut
, Nov
embe
r 200
8 to
Jan
uary
201
0.
[Cl,
chlo
ride;
ds,
dow
nstre
am si
te; t
on/d
, ton
s per
day
; ton
/mi2 ,
tons
per
squa
re m
ile; (
ton/
d)/m
i2 , to
ns p
er d
ay p
er sq
uare
mile
; %, p
erce
nt]
Stre
amPe
riod
Tota
l Cl
load
for
peri
od,
in to
ns
Num
ber o
f da
ys
of re
cord
Cl y
ield
, in
to
n/m
i2
Mea
n Cl
lo
ad,
in
ton/
d
Mea
n Cl
load
, in
ton/
dM
ean
Cl
yiel
d,
in
ton/
mi2
Mea
n Cl
yie
ld,
in (t
on/d
)/mi2
Cl lo
ad
extr
apol
ated
fo
r per
iod
N
ovem
ber 1
, 20
08–
Sept
embe
r 30,
20
09,
in to
ns
Equi
vale
nt
annu
al C
l yi
eld,
in
to
n/m
i2
Bou
nds
of 9
5-pe
rcen
t co
nfide
nce
inte
rval
Bou
nds
of 9
5-pe
rcen
t co
nfide
nce
inte
rval
Valu
eLo
wer
Upp
erVa
lue
Low
erU
pper
Four
Mile
Riv
er d
s12
/19/
09–
9/30
/09
133
287
22.2
0.46
0.45
0.48
0.07
70.
075
0.08
015
528
.3
Oil
Mill
Bro
ok d
sa 1
2/18
/08–
9/30
/09
9824
817
.30.
390.
350.
440.
070
0.06
60.
077
132
25.4
Ston
y B
rook
ds
1/7/
09–
9/16
/09
8826
747
.30.
330.
310.
350.
180.
170.
1911
064
.7
Jord
an B
rook
ds
2/6/
09–
9/30
/09
140
237
500.
590.
560.
620.
210.
200.
2219
877
.0
a Mis
sing
reco
rd fo
r thi
s site
.
Tabl
e 9B
. Es
timat
ed m
ean
chlo
ride
load
s fo
r stre
ams,
atm
osph
eric
dep
ositi
on, a
nd d
eice
rs a
pplie
d to
tow
n an
d st
ate
road
s in
the
stud
y ar
eas
of th
e Fo
ur M
ile R
iver
w
ater
shed
and
the
Oil M
ill B
rook
-Sto
ny B
rook
-Jor
dan
Broo
k w
ater
shed
s, N
ovem
ber 2
008
to J
anua
ry 2
010.
[Cl,
chlo
ride;
ton/
d, to
ns p
er d
ay; t
on/m
i2 , to
ns p
er sq
uare
mile
; (to
n/d)
/mi2 ,
tons
per
day
per
squa
re m
ile; %
, per
cent
]
Stud
y
area
s
Cl lo
ad fo
r Nov
embe
r 1, 2
008–
Se
ptem
ber 3
0, 2
009,
in
tons
Cont
ribu
tion
of c
hlor
ide
in
atm
osph
eric
dep
ositi
on,
in p
erce
nt
Cont
ribu
tion
of c
hlor
ide
in
atm
osph
eric
dep
ositi
on a
nd d
eice
rs,
in
tons
Cont
ribu
tion
of c
hlor
ide
inpu
ts
(atm
osph
eric
dep
ositi
on a
nd d
eice
rs)
Stre
ams
Atm
osph
eric
de
posi
tion
Stat
e
road
sTo
wn
road
sA
bing
ton,
Co
nnec
ticut
Ceda
r Bea
ch,
New
Yor
kLe
ton,
M
assa
chus
etts
Abi
ngto
n,
Conn
ectic
utCe
dar B
each
, N
ew Y
ork
Lexi
ngto
n,
Mas
sach
uset
tsA
bing
ton,
Co
nnec
ticut
Ceda
r Bea
ch,
New
Yor
kLe
ton,
M
assa
chus
etts
Four
Mile
Riv
er15
5a 9
.5, b 1
1, c 9
412
172
.86.
160
7.1
203
288
205
48 to
ns(3
1%)
132
tons
(85%
)49
tons
(32%
)O
il M
ill B
rook
-Sto
ny
Bro
ok-J
orda
n B
rook
441
a 16,
b 19,
c 160
442
283
3.9
364.
374
188
574
427
8 to
ns(6
8%)
444
tons
(101
%)
281
tons
(69%
)a E
stim
ate
dete
rmin
ed fr
om m
onth
ly c
hlor
ide
conc
entra
tions
at N
atio
nal A
tmos
pher
ic D
epos
ition
Pro
gram
stat
ions
in A
bing
ton,
Con
nect
icut
.b E
stim
ate
dete
rmin
ed fr
om m
onth
ly c
hlor
ide
conc
entra
tions
at N
atio
nal A
tmos
pher
ic D
epos
ition
Pro
gram
stat
ions
in L
exin
gton
, Mas
sach
uset
ts.
c Est
imat
e de
term
ined
from
mon
thly
chl
orid
e co
ncen
tratio
ns a
t Nat
iona
l Atm
osph
eric
Dep
ositi
on P
rogr
am st
atio
ns in
Ced
ar B
each
, New
Yor
k.

Preliminary Assessment of the Effects of Road Deicers on Water Quality 33
x
Shetuck
et R.
(01122610)
Broad Br.
(01184490)
Bunnell (Burlin
gton) B
r.
(01188000)Hock
anum R.
(01192500)
Salmon R.
(01193500)
Quinnipiac R.
(01196500)Still
R.
(01201487)
Naugatuck
R.
(01208500)
Saugatuck
R.
(01208990)
Norwalk R.
(01209710)
Number of values
EXPLANATION
x
x
o
o
Upper adjacent
75th percentile
Median
Oil Mill Brook mean
Stony Brook mean
Jordan Brook mean
Four Mile River mean
25th percentile
Lower adjacentLower outside
Lower detached
Upper detached
Upper outside
U.S. GEOLOGICAL SURVEY MONITORING STATIONS
0
20
40
60
80
100
120
140
1608 10 10 10 10 10 105 10 10
10
ESTI
MAT
ED C
HLO
RID
E YI
ELD
, IN
TO
NS
PER
SQU
ARE
MIL
E
Figure 16. Distribution of annual chloride yields estimated using LOADEST for selected rivers in Connecticut for water years 1998–2007, and estimated annual chloride yields for the downstream sites at Four Mile River, Oil Mill Brook, Stony Brook, and Jordan Brook for their periods of record. Estimated annual chloride yields are based on daily loads. (See table 9 for periods of record. R, River; Br, Brook)

34 Preliminary Assessment of Chloride Concentrations, Loads, and Yields, Southeastern Connecticut, 2008–09
the more urbanized watersheds, such as those that drain the Still River at Brookfield Center and the Hockanum River (fig. 16). Cl yields for these sites were positively correlated with the percentage of impervious cover (U.S. Environmental Protection Agency, 2001; fig. 17) and probably reflect the
application of deicers to roadways, as well as sources and practices associated with greater impervious cover such as wastewater and septic-system discharges, recycling of Cl from drinking water, and leachate from landfills and salt-storage areas.
0 5 10 15 20
IMPERVIOUS COVER, IN PERCENT OF WATERSHED AREA
0
0.1
0.2
0.3
0.4
MED
IAN
OF
MEA
N C
HLO
RID
E YI
ELD
,IN
TO
NS
PER
DA
Y PE
R SQ
UA
RE M
ILE
Downstream sites for this studySites at other rivers in Connecticut
EXPLANATION
0.0713 + 0 .0122*xAdjusted R-squared: 0.7889
Shetucuck R. nrSouth Windham(01122610)
Broad Br. at Broad Brook(01184490)
Bunnell Br. near Burlington (01188000)
Hockanum R. near East Hartford(01192500)
Salmon R. at East Hampton (01193500)
Quinnipiac R. at Wallingford(01196500)
Still R. at Brook�eld Center(01201487)
Saugatuck R.near Redding
(01208990)
Norwalk R. at Winnipauk(01209710)
Norwalk R. at Beacon Falls(01208500)
Jordan Br. ds(011277696)
Oil Mill Br. ds (011277914)
Stony Br. ds(011277916)
Four Mile R. ds(01127821)
Figure 17. Percentage of impervious cover as a function of (1) the chloride yields for the downstream monitoring stations at Four Mile River, Oil Mill Brook, Stony Brook, and Jordan Brook during the periods of record for this study, and (2) the median of the mean chloride yields at other selected rivers in Connecticut during water years 1998–2007. (Impervious cover data from National Land Cover Database, (U.S. Environmental Protection Agency, 2001; R., River; Br., Brook; ds, downstream)

References Cited 35
Summary and ConclusionsThe U.S. Geological Survey, the Connecticut Department
of Transportation, and the Federal Highway Administration conducted a cooperative study to evaluate potential effects of road-salt application on the quality of stream water in four watersheds crossed by Interstate 95 (I-95) in southeastern Connecticut. The results of the study will be considered in an Environmental Impact Statement (EIS) for the expansion of I-95 between Old Lyme and New London, Conn.
Streamflow and water quality were studied at four selected watersheds —Four Mile River, Oil Mill Brook, Stony Brook, and Jordan Brook. Streamgages were instrumented and maintained at downstream sites, and continuous water-quality monitors were installed and maintained at upstream and downstream sites. Water quality was assessed by analyzing the dissolved ions in grab samples and by continuous recording of data from water temperature, specific conductance, and pH sensors. Grab samples were collected (1) during winter stormwater-runoff events, such as winter storms or subsequent periods of rain or warm temperatures in which melting takes place, (2) approximately monthly during routine conditions and analyzed for chloride concentrations and specific conductance, and (3) during base-flow conditions and analyzed for major ions and concentrations of dissolved Fe, Mn, and Br.
Chloride (Cl) concentrations at the eight water-quality monitoring sites were well below the U.S. Environmental Protection Agency (USEPA) recommended chronic and acute Cl toxicity criteria for aquatic life. Specific conductance and estimated Cl concentrations in streams, particularly at sites downstream from I-95, increased during discharge events in the winter and early spring as a result of deicers applied to roads and washed off by stormwater or meltwater. During winter storms, deicing activities, or subsequent periods of melting, specific conductance peaked as high as 703 microsiemens per centimeter (160 milligrams per liter estimated Cl concentration) at the Oil Mill Brook downstream site.
Cl loads in streams generally were highest in the winter and early spring. The estimated daily yield for the four monitoring sites downstream from Interstate 95 ranged from 0.07 ton per day per square mile ((ton/d)/mi2) for the least developed watershed to 0.21 (ton/d)/mi2 for the watershed with the highest percentage of urban development and impervious surfaces. The Cl load from atmospheric deposition was estimated on the basis of ranges of concentrations measured at National Atmospheric Deposition Program stations in Lexington, Mass.; Abington, Conn.; and Cedar Beach, N.Y. The estimated median contribution of Cl from atmospheric deposition ranged from 4.3 percent of Cl load at the Oil Mill Brook-Stony Brook-Jordan Brook study area to 7.1 percent at the Four Mile River watershed. A comparison of the Cl load estimated inputs and outputs indicates that more Cl is entering the watersheds through atmospheric deposition and application
of deicers than is leaving in streams. The lag time between introduction of Cl to the watershed and transport to the stream, and uncertainty in the load estimates may be the cause of this discrepancy. In addition, estimates of direct infiltration of Cl to groundwater that originates from atmospheric deposition, deicer applications, septic-tank drainfields, and other sources to groundwater were not within the scope of this project.
Cl yields at the downstream monitoring stations at Four Mile River, Oil Mill Brook, Stony Brook, and Jordan Brook were compared with annual Cl yield estimates for 10 selected rivers in Connecticut, which were generated using LOADEST. Four Mile River and Oil Mill Brook had low estimated Cl yields similar to yields at Bunnell (Burlington) Brook and Shetucket River, reflecting the low percentages of developed land and impervious area. Jordan Brook and Stony Brook had relatively high estimated Cl yields, but not as high as more urbanized watersheds such as those of the Still River at Brookfield Center and the Hockanum River. Cl yields for these sites were positively correlated with the percentage of impervious cover, probably reflecting the application of deicers to roadways, as well as sources and practices associated with greater impervious cover, such as wastewater and septic-system discharges, and leachate from landfills and salt-storage areas.
AcknowledgmentsThe authors would like to thank Robert Turner, Eloise
Powell, and Patricia Cazenas of FHWA, Paul Corrente and Kevin Carifa of Connecticut Department of Transportation, and the Connecticut Academy of Science and Engineering team for technical input and guidance and for providing data or information. In addition, the authors would like to thank U.S. Geological Survey employees Joseph Martin, Dan Lolos, Timothy Sargent, and Timothy Frick for maintenance of streamgages and water-quality monitors, and collection of water-quality samples.
References Cited
Bubeck, R.C., Diment, W.H., Deck, B.L., Baldwin, A.L., and Lipton, S.D., 1971, Runoff of deicing salt—Effect on Irondequoit Bay, Rochester, New York: Science, v. 172, p. 1128–1132.
Chabaeva, A.A., Civco, D.L., and Prisloe, S., 2004, Development of a population and land use based regression model to calculate the amount of imperviousness, in Proceedings, 2004 ASPRS conference, Denver, Colorado, 24–28 May: 9 p., accessed September 10, 2009, at http://nemo.uconn.edu/tools/impervious_surfaces/pdfs/Chabaeva_etal_2004.pdf.

36 Preliminary Assessment of Chloride Concentrations, Loads, and Yields, Southeastern Connecticut, 2008–09
Church, P.E., and Friesz, P.J., 1993, Effectiveness of highway-drainage systems in preventing road-salt contamination of groundwater—Preliminary findings: Transportation Research Record, v. 1420, p. 56–64.
Colombo, M.J., and Trench, E.C.T., 2002, Trends in surface-water quality in Connecticut: U.S. Geological Survey Water-Resources Investigations Report 02–4012, 39 p.
Connecticut Department of Transportation, 2009, Interim snow & ice guidelines—2008–09: Connecticut Department of Transportation, Bureau of Engineering & Highway Operations, 53 p.
Connecticut Department of Environmental Protection, 1995, Leachate and wastewater discharge inventory: Hartford, Connecticut, Connecticut Department of Environmental Protection, Environmental and Geographic Information Center, Digital Shapefile, 1:50,000, accessed September 10, 2009, at http://www.ct.gov/dep/cwp/view.asp?A=2698&Q=322898.
Connecticut Department of Environmental Protection, 2009, CTDEP Proposed Revisions to Connecticut Water Quality Standards, December 22, accessed November 1, 2009, at http://www.ct.gov/dep/lib/dep/ water/water_quality_standards/water_quality_standards_proposed_12_22_09.pdf.
Denner, J.C., Clark, S.F., Jr., Smith, T.E., and Medalie, Laura, 2010, Effects of highway road salting on the water quality of selected streams in Chittenden County, Vermont, November 2005–2007: U.S. Geological Survey Scientific Investigations Report 2009–5236, 43 p.
Fishman, M.J., and Friedman, L.C., 1989, Methods for determination of inorganic substances in water and fluvial sediments: U.S. Geological Survey Techniques of Water-Resources Investigations, book 5, chap. A1, 545 p.
Gay, F.B., and Melching, C.S., 1995, Relation of precipitation quality to storm type, and constituent loads in Massachusetts, 1983–85: U.S. Geological Survey Water-Resources Investigations Report 94–4224, 82 p.
Grady, S.J., 1993, Effects of land use on quality of water in stratified-drift aquifers in Connecticut: U.S. Geological Survey Open-File Report 91–200, 87 p.
Grady, S.J., and Mullaney, J.R., 1998, Natural and human factors affecting shallow water quality in surficial aquifers in the Connecticut, Housatonic, and Thames River Basins: U.S. Geological Survey Water-Resources Investigations Report 98–4042, 81 p.
Granato, G.E., Church, P.E., and Stone, V.J., 1995, Mobilization of major and trace constituents of highway runoff in groundwater potentially caused by deicing-chemical migration: Washington, D.C., Transportation Research Record 1483, Transportation Research Board, National Research Council, p. 92–104.
Granato, G.E., and Smith, K.P., 1999, Estimating concentrations road-salt constituents in highway-runoff from measurements of specific conductance: U.S. Geological Survey Water-Resources Investigations Report 99–4077, 22 p.
Gurnell, A.M., Brown, G.H., and Tranter, M., 1994, Sampling strategy to describe the temporal hydrochemical characteristics of an alpine proglacial stream: Hydrological Processes, v. 8, p. 1–25.
Howard, K.W.F., and Haynes, J., 1993, Groundwater contamination due to road de-icing chemicals—Salt balance implications: Geoscience Canada, v. 20, p. 1–8.
Kaushal, S.S., Groffman, P.M., Likens, G.E., Belt, K.T., Stack, W.P., Kelly, V.R., Band, L.E., and Fisher, G.T., 2005, Increased salinization of fresh water in the northeastern United States: Proceedings National Academy of Sciences, v. 102, p. 13517–13520.
Kelly, W.R., Panno, S.V., Hackley, K.C., Hwang, Hue-Hwa, Marinsek, A.T., and Markus, Momcilo, 2010, Using chloride and other ions to trace sewage and road salt in the Illinois Waterway: Applied Geochemistry, v. 25, p. 661–673.
Kostick, D.S., Milanovich, J.A., and Coleman, R.R., 2007, 2005 Minerals Yearbook—Salt: U.S. Geological Survey, March 2007, accessed November 1, 2009, at http://minerals.er.usgs.gov/minerals/pubs/commodity/salt/salt_myb05.pdf.
Kostick, D.S., 1993, The material flow of salt: U.S. Department of the Interior, Bureau of Mines, Information Circular 9343, 32 p.
Melvin, R.L., and Bingham, J.W., 1991, Availability of water from stratified-drift aquifers in the Farmington River valley, Simsbury, Connecticut: U.S. Geological Survey Water-Resources Investigations Report 89–4140, 77 p.
Miller, D.R., Warner, G.S., Ogden, F.L., and DeGaetano, A.T., 2002, Precipitation in Connecticut: Connecticut Institute of Water Resources Special Reports, 65 p.
Mullaney, J.R., Lorenz, D.L., and Arntson, A.D., 2009, Chloride in groundwater and surface water in areas underlain by the glacial aquifer system, northern United States: U.S. Geological Survey Scientific Investigations Report 2009–5086, 41 p.

References Cited 37
National Atmospheric Deposition Program (NRSP–3), 2009, Monitoring our changing chemical climate: Champaign, Ill., NADP Program Office, Illinois State Water Survey (http://nadp.sws.uiuc.edu).
National Operational Hydrologic Remote Sensing Center, 2005, Overview of the center’s web site and products: National Weather Service, National Oceanic and Atmospheric Administration, U.S. Department of Commerce, Minneapolis, Minnesota, 15 p. (http://www.nohrsc.noaa.gov/technology/pdf/NOHRSC_web_overview.pdf)
Prisloe, M., Wilson, E.H., Arnold, C., 2003, Final report—Refinement of population-calibrated land-cover-specific impervious surface coefficients for Connecticut: Nemo FY02 Workplan, DEP project 01–08, University of Connecticut, Middlesex County Extension Center, 20 p.
Ramakrishna, D.M., and Viraraghavan, T., 2005, Environmental impact of chemical deicers—A review: Water Air Soil Pollution, v. 166, p. 49–63.
Rantz, S.E., and others, 1982, Measurement and computation of streamflow—volume 1. Measurement of stage and discharge: U.S. Geological Survey Water-Supply Paper 2175, 284 p.
Runkel, R.L., Crawford, C.G., and Cohn, T.A., 2004, Load estimator (LOADEST)—A FORTRAN program for estimating constituent loads in streams and rivers: U.S. Geological Survey Techniques and Methods, book 4, chap. A5, 69 p.
Sears Ecological Applications Co, LLC, 2009, Material safety data sheet: 2 p., accessed on January 20, 2010, at http://www.seaco.com/images/MSDS%20IBG%20II%2020.pdf.
Smith, R.A., Alexander, R.B., and Wolman, M.G., 1987, Water-quality trends in the Nations’s Rivers: Science, v. 235, p. 1607–1615.
Stone, J.R., Schafer, J.P., London, E.H., and Thompson, W.B., 1992, Surficial materials map of Connecticut: U.S. Geological Special Map, scale 1:125,000, 2 sheets.
Toler, L.G., and Pollock, S.J., 1974, Retention of chloride in the unsaturated zone: U.S. Geological Survey Journal of Research, v. 2, no. 1, p. 119–123.
Trench, E.C.T., 1996, Trends in surface-water quality in Connecticut, 1969–88: U.S. Geological Survey Water-Resources Investigations Report 96–4161, 176 p.
University of Connecticut, 2009, Center for Land Use Education And Research (CLEAR): College of Agriculture & Natural Resources, accessed May 2, 2009, at http://clear.uconn.edu/projects/landscape/category_description.htm.
U.S. Environmental Protection Agency, 1988, Ambient water quality criteria for chloride–1988: Duluth, Minn., Office of Research and Development, Environmental Research Laboratory, EPA 440588001.
U.S. Environmental Protection Agency, 1992, Secondary Drinking Water Regulations—Guidance for Nuisance Chemicals: EPA 810/K–92–001, accessed June 13, 2006, at http://www.epa.gov/safewater/consumer/2ndstandards.html.
U.S. Environmental Protection Agency, 2001, 2001 National Land Cover Data: Multi-Resolution Land Characteristics Consortium, accessed February 1, 2010, at http://www.epa.gov/mrlc/nlcd-2001.html.
Vogelmann, J.E., Sohl, T.L., Campbell, P.V., Shaw, D.M., 1998, Regional land cover characterization using LANDSAT thematic mapper data and ancillary data sources: Environmental Monitoring and Assessment, v. 51, p. 415–428.
Wagner, R.J., Boulger, R.W., Jr., Oblinger, C.J., and Smith, B.A., 2006, Guidelines and standard procedures for continuous water-quality monitors—Station operation, record computation, and data reporting: U.S. Geological Survey Techniques and Methods 1–D3, 51 p., plus 8 attachments, accessed April 10, 2006, at http://pubs.water.usgs.gov/tm1d3.
Wilde, F.D., ed., 2004, Cleaning of equipment for water sampling (ver. 2.0): U.S. Geological Survey Techniques of Water-Resources Investigations, book 9, chap. A3, April, accessed March 17, 2009, at http://pubs.water.usgs.gov/twri9A3/.
Wilde, F.D., 2005, Preparations for water sampling: U.S. Geological Survey Techniques of Water-Resources Investigations, book 9, chap. A1, January, accessed March 17, 2009, at http://pubs.water.usgs.gov/twri9A1/.
Wulkowicz, G.M., and Saleem, Z.A., 1974, Chloride balance of an urban basin in the Chicago area: Water Resources Research, v. 10, no. 5, p. 974–982.
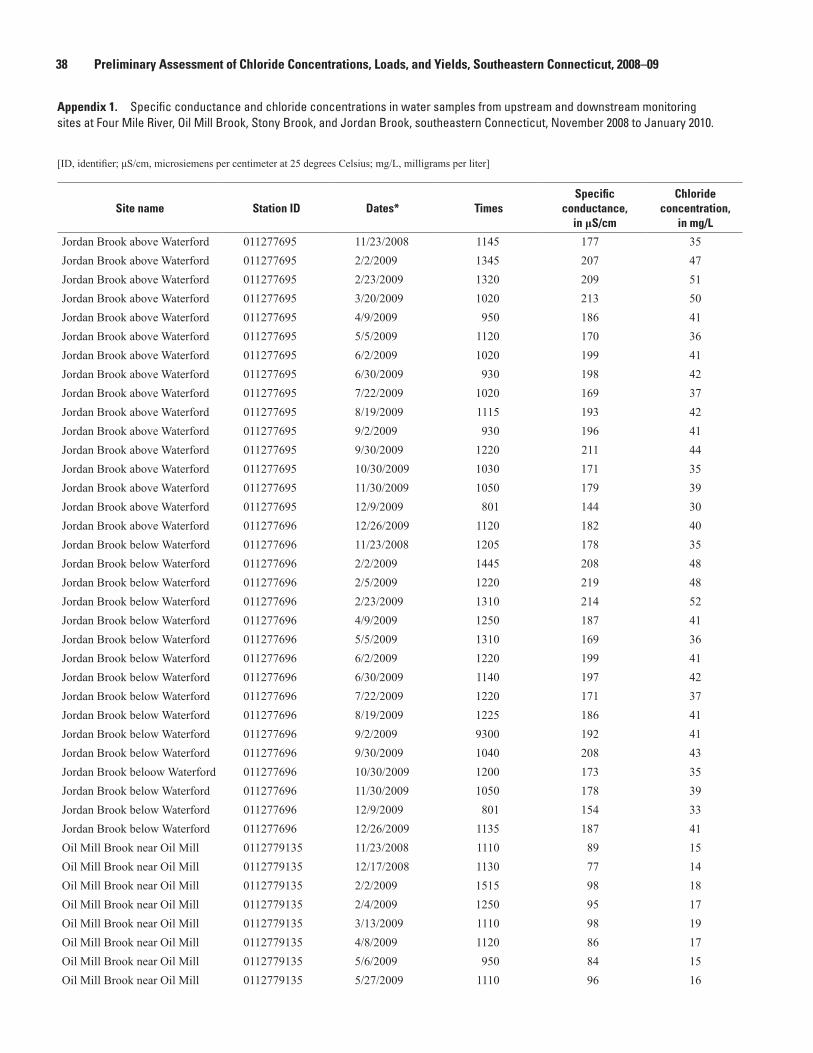
38 Preliminary Assessment of Chloride Concentrations, Loads, and Yields, Southeastern Connecticut, 2008–09
Appendix 1. Specific conductance and chloride concentrations in water samples from upstream and downstream monitoring sites at Four Mile River, Oil Mill Brook, Stony Brook, and Jordan Brook, southeastern Connecticut, November 2008 to January 2010.
[ID, identifier; μS/cm, microsiemens per centimeter at 25 degrees Celsius; mg/L, milligrams per liter]
Site name Station ID Dates* TimesSpecific
conductance, in μS/cm
Chloride concentration,
in mg/L
Jordan Brook above Waterford 011277695 11/23/2008 1145 177 35Jordan Brook above Waterford 011277695 2/2/2009 1345 207 47Jordan Brook above Waterford 011277695 2/23/2009 1320 209 51Jordan Brook above Waterford 011277695 3/20/2009 1020 213 50Jordan Brook above Waterford 011277695 4/9/2009 950 186 41Jordan Brook above Waterford 011277695 5/5/2009 1120 170 36Jordan Brook above Waterford 011277695 6/2/2009 1020 199 41Jordan Brook above Waterford 011277695 6/30/2009 930 198 42Jordan Brook above Waterford 011277695 7/22/2009 1020 169 37Jordan Brook above Waterford 011277695 8/19/2009 1115 193 42Jordan Brook above Waterford 011277695 9/2/2009 930 196 41Jordan Brook above Waterford 011277695 9/30/2009 1220 211 44Jordan Brook above Waterford 011277695 10/30/2009 1030 171 35Jordan Brook above Waterford 011277695 11/30/2009 1050 179 39Jordan Brook above Waterford 011277695 12/9/2009 801 144 30Jordan Brook above Waterford 011277696 12/26/2009 1120 182 40Jordan Brook below Waterford 011277696 11/23/2008 1205 178 35Jordan Brook below Waterford 011277696 2/2/2009 1445 208 48Jordan Brook below Waterford 011277696 2/5/2009 1220 219 48Jordan Brook below Waterford 011277696 2/23/2009 1310 214 52Jordan Brook below Waterford 011277696 4/9/2009 1250 187 41Jordan Brook below Waterford 011277696 5/5/2009 1310 169 36Jordan Brook below Waterford 011277696 6/2/2009 1220 199 41Jordan Brook below Waterford 011277696 6/30/2009 1140 197 42Jordan Brook below Waterford 011277696 7/22/2009 1220 171 37Jordan Brook below Waterford 011277696 8/19/2009 1225 186 41Jordan Brook below Waterford 011277696 9/2/2009 9300 192 41Jordan Brook below Waterford 011277696 9/30/2009 1040 208 43Jordan Brook beloow Waterford 011277696 10/30/2009 1200 173 35Jordan Brook below Waterford 011277696 11/30/2009 1050 178 39Jordan Brook below Waterford 011277696 12/9/2009 801 154 33Jordan Brook below Waterford 011277696 12/26/2009 1135 187 41Oil Mill Brook near Oil Mill 0112779135 11/23/2008 1110 89 15Oil Mill Brook near Oil Mill 0112779135 12/17/2008 1130 77 14Oil Mill Brook near Oil Mill 0112779135 2/2/2009 1515 98 18Oil Mill Brook near Oil Mill 0112779135 2/4/2009 1250 95 17Oil Mill Brook near Oil Mill 0112779135 3/13/2009 1110 98 19Oil Mill Brook near Oil Mill 0112779135 4/8/2009 1120 86 17Oil Mill Brook near Oil Mill 0112779135 5/6/2009 950 84 15Oil Mill Brook near Oil Mill 0112779135 5/27/2009 1110 96 16

Appendix 1 39
Appendix 1. Specific conductance and chloride concentrations in water samples from upstream and downstream monitoring sites at Four Mile River, Oil Mill Brook, Stony Brook, and Jordan Brook, southeastern Connecticut, November 2008 to January 2010.
[ID, identifier; μS/cm, microsiemens per centimeter at 25 degrees Celsius; mg/L, milligrams per liter]
Site name Station ID Dates* TimesSpecific
conductance, in μS/cm
Chloride concentration,
in mg/L
Oil Mill Brook near Oil Mill 0112779135 6/22/2009 1100 77 14Oil Mill Brook near Oil Mill 0112779135 7/14/2009 1050 89 15Oil Mill Brook near Oil Mill 0112779135 8/19/2009 840 93 16Oil Mill Brook near Oil Mill 0112779135 8/31/2009 1000 82.3 14Oil Mill Brook near Oil Mill 0112779135 9/29/2009 945 92 15Oil Mill Brook near Oil Mill 0112779135 10/28/2009 1100 83.7 15Oil Mill Brook near Oil Mill 0112779135 12/7/2009 1350 70.6 13Oil Mill Brook near Oil Mill 0112779135 12/9/2009 733 75.3 14Oil Mill Brook near Oil Mill 0112779135 12/9/2009 1125 141 33Oil Mill Brook near Oil Mill 0112779135 12/26/2009 1035 92.1 16Oil Mill Brook at Gurley River 011277914 11/23/2008 1125 89 15Oil Mill Brook at Gurley River 011277914 12/17/2008 1150 78 14Oil Mill Brook at Gurley River 011277914 2/2/2009 1525 99 18Oil Mill Brook at Gurley River 011277914 2/4/2009 1510 96 18Oil Mill Brook at Gurley River 011277914 2/24/2009 1250 88 17Oil Mill Brook at Gurley River 011277914 3/12/2009 1215 94 19Oil Mill Brook at Gurley R 011277914 4/7/2009 825 81 15Oil Mill Brook at Gurley River 011277914 4/8/2009 1300 87 17Oil Mill Brook at Gurley River 011277914 5/6/2009 1150 88 16Oil Mill Brook at Gurley River 011277914 5/27/2009 1220 97 17Oil Mill Brook at Gurley River 011277914 6/22/2009 1220 79 14Oil Mill Brook at Gurley River 011277914 7/14/2009 1320 90.8 17Oil Mill Brook at Gurley River 011277914 8/19/2009 840 71 16Oil Mill Brook at Gurley River 011277914 8/31/2009 1230 83.6 14Oil Mill Brook at Gurley River 011277914 9/29/2009 810 92.3 15Oil Mill Brook at Gurley River 011277914 10/28/2009 1215 84.4 15Oil Mill Brook at Gurley River 011277914 12/7/2009 1430 71.1 13Oil Mill Brook at Gurley River 011277914 12/9/2009 7110 74.7 14Oil Mill Brook at Gurley River 011277914 12/9/2009 1100 186 46Oil Mill Brook at Gurley River 011277914 12/26/2009 1025 95.3 17Oil Mill Brook at Gurley River 011277914 1/17/2010 2200 150 30Oil Mill Brook at Gurley River 011277914 1/17/2010 2330 144 28Oil Mill Brook at Gurley River 011277914 1/18/2010 1140 90 18Stony Brook above Waterford 0112779155 11/23/2008 1320 127 24Stony Brook above Waterford 0112779155 2/2/2009 1215 188 44Stony Brook above Waterford 0112779155 3/6/2009 1420 148 33Stony Brook above Waterford 0112779155 4/1/2009 1030 142 31Stony Brook above Waterford 0112779155 4/29/2009 1010 110 21Stony Brook above Waterford 0112779155 5/20/2009 1030 120 23

40 Preliminary Assessment of Chloride Concentrations, Loads, and Yields, Southeastern Connecticut, 2008–09
Appendix 1. Specific conductance and chloride concentrations in water samples from upstream and downstream monitoring sites at Four Mile River, Oil Mill Brook, Stony Brook, and Jordan Brook, southeastern Connecticut, November 2008 to January 2010.
[ID, identifier; μS/cm, microsiemens per centimeter at 25 degrees Celsius; mg/L, milligrams per liter]
Site name Station ID Dates* TimesSpecific
conductance, in μS/cm
Chloride concentration,
in mg/L
Stony Brook above Waterford 0112779155 6/8/2009 1030 148 28Stony Brook above Waterford 0112779155 7/1/2009 1050 135 24Stony Brook above Waterford 0112779155 7/20/2009 1140 145 26Stony Brook above Waterford 0112779155 8/19/2009 1302 131 24Stony Brook above Waterford 0112779155 9/1/2009 1020 172 32Stony Brook above Waterford 0112779155 9/28/2009 900 214 47Stony Brook above Waterford 0112779155 10/26/2009 1115 121 23Stony Brook above Waterford 0112779155 11/30/2009 1220 110 22Stony Brook above Waterford 0112779155 12/9/2009 902 121 27Stony Brook above Waterford 0112779155 12/9/2009 1010 81 13Stony Brook above Waterford 0112779155 12/26/2009 1100 112 21Stony Brook at Route 1 011277916 11/23/2008 1340 134 24Stony Brook at Route 1 011277916 2/2/2009 1500 165 35Stony Brook at Route 1 011277916 2/6/2009 1220 157 31Stony Brook at Route 1 011277916 2/24/2009 1455 141 31Stony Brook at Route 1 011277916 3/6/2009 1235 142 30Stony Brook at Route 1 011277916 3/12/2009 1310 138 30Stony Brook at Route 1 011277916 4/1/2009 1210 144 30Stony Brook at Route 1 011277916 4/7/2009 750 144 28Stony Brook at Route 1 011277916 4/29/2009 1250 128 24Stony Brook at Route 1 011277916 5/20/2009 1130 131 25Stony Brook at Route 1 011277916 6/8/2009 1150 152 28Stony Brook at Route 1 011277916 7/1/2009 1320 91 15Stony Brook at Route 1 011277916 7/20/2009 1400 149 27Stony Brook at Route 1 011277916 8/19/2009 1330 145 27Stony Brook at Route 1 011277916 9/1/2009 1330 162 29Stony Brook at Route 1 011277916 9/28/2009 1130 181 36Stony Brook at Route 1 011277916 10/26/2009 1230 128 24Stony Brook at Route 1 011277916 11/30/2009 1330 125 24Stony Brook at Route 1 011277916 12/9/2009 933 179 42Stony Brook at Route 1 011277916 12/9/2009 1030 215 48Stony Brook at Route 1 011277916 12/26/2009 1155 124 23Four Mile River above I-95 01127819 11/23/2008 910 84 11Four Mile River above I-95 01127819 1/23/2009 1040 85 10Four Mile River above I-95 01127819 2/2/2009 1545 83 11Four Mile River above I-95 01127819 2/25/2009 1220 78 11Four Mile River above I-95 01127819 3/31/2009 1200 92 14Four Mile River above I-95 01127819 5/1/2009 1050 79 10Four Mile River above I-95 01127819 5/21/2009 1045 88 12

Appendix 1 41
Appendix 1. Specific conductance and chloride concentrations in water samples from upstream and downstream monitoring sites at Four Mile River, Oil Mill Brook, Stony Brook, and Jordan Brook, southeastern Connecticut, November 2008 to January 2010.
[ID, identifier; μS/cm, microsiemens per centimeter at 25 degrees Celsius; mg/L, milligrams per liter]
Site name Station ID Dates* TimesSpecific
conductance, in μS/cm
Chloride concentration,
in mg/L
Four Mile River above I-95 01127819 6/19/2009 1120 67 9Four Mile River above I-95 01127819 7/8/2009 1020 64 8Four Mile River above I-95 01127819 7/29/2009 1040 64 7Four Mile River above I-95 01127819 8/19/2008 1000 98 11Four Mile River above I-95 01127819 9/3/2009 940 84.3 9.7Four Mile River above I-95 01127819 10/6/2009 920 90.1 11Four Mile River above I-95 01127819 11/2/2009 1030 79.6 9.9Four Mile River above I-95 01127819 12/7/2009 1115 63.6 8.6Four Mile River above I-95 01127819 12/9/2009 1011 72.2 11Four Mile River above I-95 01127819 12/9/2009 1310 69 11Four Mile River below I-95 01127821 11/23/2008 940 90 12Four Mile River below I-95 01127821 12/18/2008 1145 67 8.7Four Mile River below I-95 01127821 1/23/2009 1215 90 12Four Mile River below I-95 01127821 2/2/2009 1550 91 13Four Mile River below I-95 01127821 2/11/2009 1150 89 13Four Mile River below I-95 01127821 2/25/2009 1545 86 13Four Mile River below I-95 01127821 3/31/2009 1400 92 13Four Mile River below I-95 01127821 5/1/2009 1200 89 12Four Mile River below I-95 01127821 5/21/2009 1140 88 12Four Mile River below I-95 01127821 6/19/2009 1330 73 10Four Mile River below I-95 01127821 7/8/2009 1150 66 8.8Four Mile River below I-95 01127821 7/27/2009 1210 70.3 8.6Four Mile River below I-95 01127821 8/19/2008 1020 103 14Four Mile River below I-95 01127821 9/3/2009 1240 91.7 11Four Mile River below I-95 01127821 10/6/2009 1320 97.3 13Four Mile River below I-95 01127821 11/2/2009 1100 82.5 11Four Mile River below I-95 01127821 12/7/2010 1230 68 9.7Four Mile River below I-95 01127821 12/9/2009 1029 86.8 15Four Mile River below I-95 01127821 12/9/2009 1250 78 13Four Mile River below I-95 01127821 1/17/2010 2130 157 26Four Mile River below I-95 01127821 1/17/2010 2200 147 23
*The actual study period is November 2008 to September 2009; a longer period of record was included to improve the regression model.


Prepared by the Pembroke and West Trenton Publishing Service Centers.
For more information concerning this report, contact:
DirectorU.S. Geological SurveyConnecticut Water Science Center101 Pitkin StreetEast Hartford, CT [email protected]
or visit our Web site at:http://ct.water.usgs.gov

Brown and others—
Preliminary A
ssessment of Chloride Concentrations, Loads, and Yields in Southeastern Connecticut, 2008–09—
Open-File Report 2011-1018