Wind Loads for High-Solidity Open Frame Structures
13
Wind Loads for High-Solidity Open Frame Structures Samuel D. Amoroso 1 and Marc L. Levitan 2 Principal Engineer, Engensus, Baton Rouge, USA, [email protected] Associate Professor, LSU Hurricane Center, Baton Rouge, USA, [email protected] ABSTRACT Open frame structures, such as those commonly found in industrial process facilities, are often densely occupied with process related equipment. This paper presents an alternative method for estimating wind loads for high-solidity open frame structures that differs from current approaches, which accumulate wind load contributions from various individual components. The method considers the structure as a porous block of arbitrary plan dimension that is subject to wind from any direction. The proposed method compares favorably with wind tunnel test results for similar structures. The possibility of defining an upper bound force coefficient is also discussed. INTRODUCTION Open frame structures are common in the process industries. There are established methods available to estimate wind loads for open frame structures [1, 2]. Although these methods were originally developed for lattice towers and unclad building frames, which often do not have the internal equipment, ductwork, and piping that are common in the process industries, they have been extended for use in such applications. The basis of these methods is a summation of the contributions to the wind load for separate components of the system (such as framing and equipment), taking into account aerodynamic interaction effects among the different components. This approach works well for relatively open (i.e. low solidity) structures. However, as the overall solidity of a structure and equipment increases, not only do the methods become more cumbersome, but their accuracy may be diminished as the simple, empirical understanding of the aerodynamic interaction effects among the framing and equipment becomes insufficient. This paper examines the wind loads for more solid open frame structures from a different perspective. Rather than accounting for the effects of the various components, the approach here is to relate the force coefficient to variables which describe the overall geometry of the frame/equipment system. The frame and equipment together are treated as a generally rectangular body with some degree of porosity. As such, the presumption of an understanding of the flow field effects among the various individual system components is abandoned, and the force coefficient for the entire system is estimated as a whole. This paper briefly reviews literature relevant to the problem, presents an analytical basis for describing wind loads on three- dimensional porous bodies, and examines the relationships between existing wind tunnel data and relevant geometric variables. The possibility of estimating a reasonable upper bound force coefficient is also discussed. LITERATURE REVIEW Darcy’s Law is a method of describing the resistance to flow through porous media. This resistance is characterized by the pressure drop that occurs over the flow length. The pressure drop is related to other physical characteristics of the flow in the following Equation:
-
Upload
khangminh22 -
Category
Documents
-
view
1 -
download
0
Transcript of Wind Loads for High-Solidity Open Frame Structures

Wind Loads for High-Solidity Open Frame Structures
Samuel D. Amoroso1 and Marc L. Levitan2
Principal Engineer, Engensus, Baton Rouge, USA, [email protected] Professor, LSU Hurricane Center, Baton Rouge, USA, [email protected]
ABSTRACT
Open frame structures, such as those commonly found in industrial process facilities, are oftendensely occupied with process related equipment. This paper presents an alternative method forestimating wind loads for high-solidity open frame structures that differs from currentapproaches, which accumulate wind load contributions from various individual components.The method considers the structure as a porous block of arbitrary plan dimension that is subjectto wind from any direction. The proposed method compares favorably with wind tunnel testresults for similar structures. The possibility of defining an upper bound force coefficient is alsodiscussed.
INTRODUCTION
Open frame structures are common in the process industries. There are established methodsavailable to estimate wind loads for open frame structures [1, 2]. Although these methods wereoriginally developed for lattice towers and unclad building frames, which often do not have theinternal equipment, ductwork, and piping that are common in the process industries, they havebeen extended for use in such applications. The basis of these methods is a summation of thecontributions to the wind load for separate components of the system (such as framing andequipment), taking into account aerodynamic interaction effects among the differentcomponents. This approach works well for relatively open (i.e. low solidity) structures.However, as the overall solidity of a structure and equipment increases, not only do the methodsbecome more cumbersome, but their accuracy may be diminished as the simple, empiricalunderstanding of the aerodynamic interaction effects among the framing and equipment becomesinsufficient.
This paper examines the wind loads for more solid open frame structures from a differentperspective. Rather than accounting for the effects of the various components, the approach hereis to relate the force coefficient to variables which describe the overall geometry of theframe/equipment system. The frame and equipment together are treated as a generallyrectangular body with some degree of porosity. As such, the presumption of an understanding ofthe flow field effects among the various individual system components is abandoned, and theforce coefficient for the entire system is estimated as a whole. This paper briefly reviewsliterature relevant to the problem, presents an analytical basis for describing wind loads on three-dimensional porous bodies, and examines the relationships between existing wind tunnel dataand relevant geometric variables. The possibility of estimating a reasonable upper bound forcecoefficient is also discussed.
LITERATURE REVIEW
Darcy’s Law is a method of describing the resistance to flow through porous media. Thisresistance is characterized by the pressure drop that occurs over the flow length. The pressuredrop is related to other physical characteristics of the flow in the following Equation:

LPkV
(1)
whereV = flow velocity (length/time), = dynamic viscosity of fluid ([mass · length/time2 ] · time/length2 ),P = pressure drop (mass · length/time2 · length2),L = length of flow path (length), andk = empirically derived permeability index.
Equation 1 is appropriate for flows in which inertial effects are negligible. This is generally thecase when the flow under consideration is occurring in a microscopically porous medium such assoil or rock. The Forchheimer equation [5] accounts for inertial effects in flows through porousmedia of more generic scales:
2VVLP
(2)
where = the inverse of the permeability index, k,empirically derivedinertial parameter, andall other variables are as defined for Equation 1.
Using an approach such as the Darcy Law or its modification as the ForchheimerEquation is of limited utility in for estimating the wind loads on petrochemical structures for tworeasons: (1) all of the flow is considered to pass through the porous medium, but for a threedimensional structure, flow will increasingly be diverted around the body’s boundaries as theresistance to through flow increases, and (2) Equation 2 is really no different than the definitionof an empirical pressure coefficient for cases in which inertial effects are dominant.
Cook [6] addresses the balance of flow through and around porous plates by comparingthe process to the principle of minimum strain energy from mechanics. Cook describestheoretical attempts to define the combination flows around and through a body but concludesthat it is necessary to resort to empiricism.
Richards and Robinson [7] studied wind loads on porous structures, by which theyreferred to single planes of screens or fences. By interpreting various theoretical consideration inlight of both full-scale and wind tunnel experiments, they concluded that loads on thesestructures are directly proportional to the loads on their solid counterparts by the solidity ratio.They also concluded that the loss coefficient (or drag coefficient) for these structures varied withthe angle of wind incidence at a cosine-squared rate.
In an application more closely related to the problem at hand, Cook [6] offered anempirical relationship describing the relationship between the force coefficient, the windincidence angle, and the length to width aspect ratio of three-dimensional arrays or frames. Theapproach was limited to relatively open structures (solidity ratio < 0.3). The form of the equationreflects the fact that the maximum force coefficient for a structural axis occurs for winddirections that are skewed to the structural axes, and this effect increases as the relative along-wind length of the structure increases. The rate at which the force coefficient increases withlength/width ratio was given to be the aspect ratio to the 0.8 power.

ANALYTICAL CONSIDERATIONS
Prior to introducing any analytical considerations for the wind loads on dense open framestructures it is necessary to establish sign conventions and other conventions for describing thegeometry of the system. Figure 1 is a schematic representation of the plan view of a genericstructure. The structure is shown to be rectangular in plan with coordinate axes oriented parallelto the sides of the structure. The side of the structure parallel to the x-axis has length L, and theside parallel to the y-axis has length B. The wind direction is measured with respect to thenegative x-axis and is designated . Some other geometric constructions are also shown inFigure 1. The angle is formed between the side of the structure parallel to the x-axis and thehypotenuse of the right triangle with legs corresponding to the sides of the structure. Theprojected width perpendicular to the wind direction is designated B’. The projected width varieswith wind angle such that B’ is equal to B when = 0 radians, is equal to 22 LB when =/ 2 - radians, and is equal to L when = / 2 radians.
Figure 1: Schematic plan of a generic rectangular structure showing sign convention and angle convention
Having defined the geometry of the system, it is possible to derive mathematicalrepresentations for (1) the variation of the force coefficient with wind angle for a given plancoordinate direction, (2) the angle at which the maximum force coefficient occurs, and (3) thevalue of the maximum force coefficient. Some assumptions are required in order to develop themodel. These will be pointed out and explained during the derivation. The angle varies withthe plan dimensions B and L as follows:
)(tan),( 1
LBLB (3)
The projected width normal to the wind direction is:
Wind Direction

)),(sin(),,(' 22 LBLBLBB (4)
A baseline force coefficient for the structure is defined as a linear function of the solidity ratio, :
01 )( CC (5)where C0 is an empirical force coefficient representative of the solid body. A typical value for arectangular structure may be 1.3, but some discretion or calibration is accommodated byadjusting this value. The solidity ratio is the quotient of the projected area to envelope areanormal to the axis of interest. It is further assumed that the porosity of the structure ishomogeneous, and therefore Equation 5 is approximated at other wind angles. The linear formof Equation 5 is a simple assumption which follows previous research by Richards and Robinson[7]. Other functional forms could be easily substituted if justified. The resulting equation for thevariation of the force coefficient along the x-axis with respect to wind angle for a porous body is:
)cos(),,(')(),,,( 1 B
LBBCLBC fx (6)
Equation 6 represents the fact that the force coefficient for open frame structures almost alwaysincreases as deviates from 0 radians by using a new reference width – the width projectednormal to the flow direction. The cosine term reflects the assumption that the x-direction forcewill diminish as increases from 0 to / 2 radians (0° to 90°). From experience, thisassumption is true for homogenous porosity (i.e. the absence of any geometric singularities suchas partial cladding or asymmetric arrangement of framing or equipment). The behavior ofEquations 4 and 6 are illustrated in Figure 2.
0 20 40 60 80
0.5
1
1.5
2
2.5
Wind Angle (degrees)
A b L b' b L C2 This function defines the variation of x-direction forcecoefficient as a function of the model parameters.
Figure 2: Variation of the force coefficient of a porous structure with wind angle for L/B = 2, = 0.75, andC01.3 (Equations 4 and 6)
cos()
B’(, B, L)
Cf (, B, L, )

The angle at which the maximum force coefficient occurs can be calculated by evaluating thefirst derivative of Equation 6 with respect to , setting the result equal to zero, and solving for .
)(tan),,(22
1max L
LBBLB (7)
Since Equation 6 has been defined for forces acting along the positive x-direction and for angles,, between 0 and / 2 radians, only one of the solutions for max is appropriate:
)(tan),,(22
1max L
LBBLB (8)
The value of max varies between 0 and / 4 (0° and 45°) as the plan aspect ratio, L/B, for thestructure increases from 0 to ∞. Figure 3 illustrates this variation.
0.01 0.1 1 10 1000
5
10
15
20
25
30
35
40
45
Length
Ang
le o
f max
Cf f
or u
nit w
idth
(deg
rees
)
Figure 3: Variation of max with length, L, for a porous structure of unit width, B (Equation 8)
Substitution of Equation 8 into Equation 6 yields the following after some simplification:
2222
2
220
max
12),,(
LBLB
LB
LBCLBC (9)
Figure 4 shows how the maximum force coefficient varies with plan aspect ratio, L/B, for porousbodies of three different solidity ratios. It is apparent from the graph that the form of Equation 9is hyperbolic, and that the function is basically linear for L/B > 2. This infinite increase in forcecoefficient with length precludes the possibility of defining an upper bound force coefficient forporous, open frame structures of arbitrary dimensions. The possibility of determining an upper
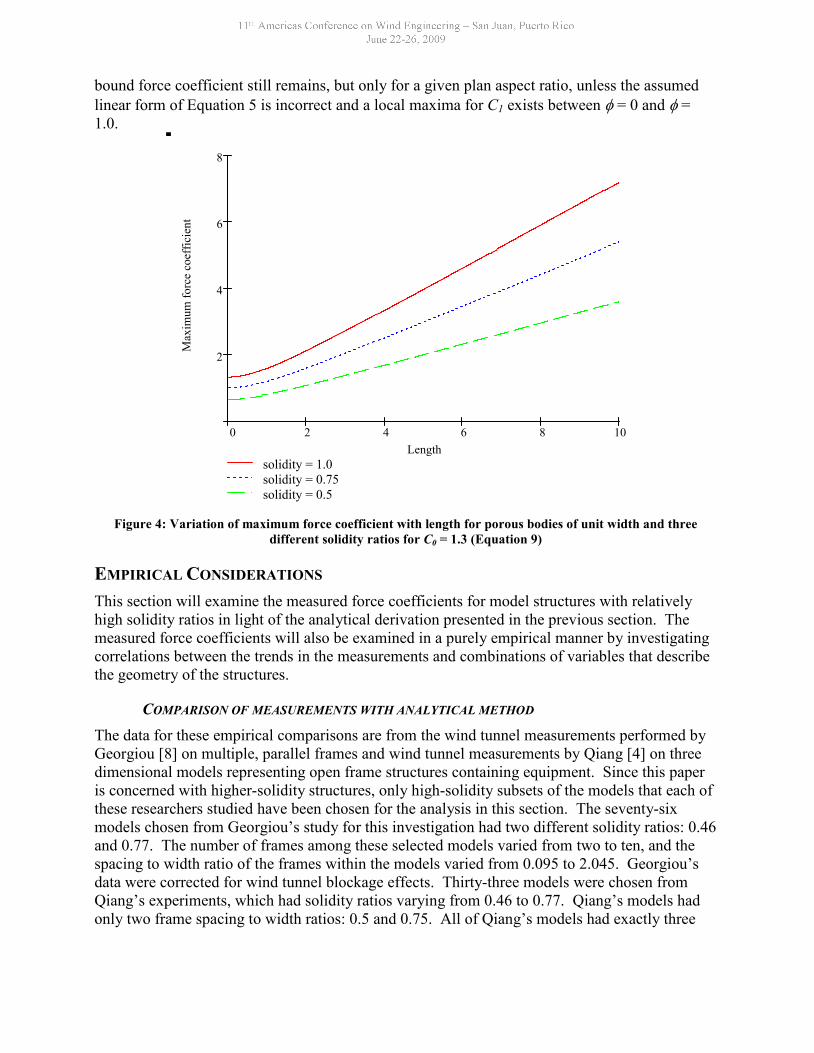
bound force coefficient still remains, but only for a given plan aspect ratio, unless the assumedlinear form of Equation 5 is incorrect and a local maxima for C1 exists between = 0 and =1.0.
0 2 4 6 8 10
2
4
6
8
solidity = 1.0solidity = 0.75solidity = 0.5
Length
Max
imum
forc
e co
effic
ient
Figure 4: Variation of maximum force coefficient with length for porous bodies of unit width and threedifferent solidity ratios for C0 = 1.3 (Equation 9)
EMPIRICAL CONSIDERATIONS
This section will examine the measured force coefficients for model structures with relativelyhigh solidity ratios in light of the analytical derivation presented in the previous section. Themeasured force coefficients will also be examined in a purely empirical manner by investigatingcorrelations between the trends in the measurements and combinations of variables that describethe geometry of the structures.
COMPARISON OF MEASUREMENTS WITH ANALYTICAL METHOD
The data for these empirical comparisons are from the wind tunnel measurements performed byGeorgiou [8] on multiple, parallel frames and wind tunnel measurements by Qiang [4] on threedimensional models representing open frame structures containing equipment. Since this paperis concerned with higher-solidity structures, only high-solidity subsets of the models that each ofthese researchers studied have been chosen for the analysis in this section. The seventy-sixmodels chosen from Georgiou’s study for this investigation had two different solidity ratios: 0.46and 0.77. The number of frames among these selected models varied from two to ten, and thespacing to width ratio of the frames within the models varied from 0.095 to 2.045. Georgiou’sdata were corrected for wind tunnel blockage effects. Thirty-three models were chosen fromQiang’s experiments, which had solidity ratios varying from 0.46 to 0.77. Qiang’s models hadonly two frame spacing to width ratios: 0.5 and 0.75. All of Qiang’s models had exactly three

frames. Qiang’s data were not originally corrected for wind tunnel blockage effects, so thesecorrections have been applied for this study.
Figure 5 shows the variation of the maximum measured force coefficient with respect toL/B, for all of the selected models from Georgiou and Qiang’s experiments. The figure alsoshows the variation of the maximum force coefficient that is predicted according to Equation 9for three different solidity ratios. It is apparent that the analytical method of section 2 representsthe trends in the data quite well. The magnitudes of the measured values for Georgiou’s modelsexceed the predictions to some degree. Georgiou’s models with = 0.77 generally fall betweenthe lines for = 0.75 and = 1.0 for the analytical model. Likewise, Georgiou’s models with = 0.46 generally fall above the line for = 0.5 and at or above the line for = 0.75 from theanalytical model. Qiang’s measurements, which are for models with 0.46 ≤ ≤ 0.77, showsomewhat better agreement with the analytical model, falling generally between the lines for =0.5 and = 0.75 generated by Equation 9. Qiang’s data do not cover a large enough range ofaspect ratios to discern whether or not the trend in the analytical model is represented in hismeasurements.
0.0
0.5
1.0
1.5
2.0
2.5
3.0
3.5
4.0
4.5
0.0 0.5 1.0 1.5 2.0 2.5 3.0 3.5 4.0 4.5 5.0
L/B
Max
C f
phi = 0.5phi = 0.75phi = 1.0Georgiou - phi = 0.773Georgiou - phi = 0.464Qiang
Figure 5: Variation of maximum force coefficient with length to width aspect ratio for wind tunnel modelsand analytical estimates using Equation 9. C0 has been set to 1.4 in this figure
Figure 6 illustrates the quality of the correlation between the measured and predictedvalues of the maximum force coefficient for the selected models. For these calculations the baseline force coefficient, C0 has been set to 1.4. The linear regression through the data has a slopeof almost exactly one, indicating that the Equation 9 does a good job of capturing the generaltrend of the variation in the data. There is a definite bias in the model for this data set. Thepositive offset of the regression Equation shows that the model will generally predict values thatare lower than what is measured in the wind tunnel. This effect will have a greater relative effectfor lower values of Cf. There is scatter in the data, but the correlation coefficient indicates thatthe model is capturing most of the variation.
It is also useful to examine a few descriptive statistics of the measured and modeled forcecoefficient values. The predicted values have been divided by the measured values in order to

normalize the data set. In this normalized data set, a value of 1.0 indicates that the modelperfectly predicted the measured force coefficient, whereas values above or below unity indicateeither overestimations or underestimations of the measured values, respectively. For Georgiouand Qiang’s models combined, the average value of this parameter is 0.86, indicating that themodel systematically underestimates the measured force coefficients. This is no surprise, as it isanother way of expressing the bias that was discussed in the previous paragraph. The standarddeviation of the combined data set is 0.17, and the coefficient of variation is therefore 0.20. Ifthese same statistics are examined for Georgiou and Qiang’s models in isolation, another storydevelops. For Georgiou’s models, the mean, standard deviation, and coefficient of variation are0.80, 0.15, and 0.19, respectively. For Qiang’s models, these same statistics are 0.99, 0.13, and0.13. It appears that the analytical model developed in the previous section is better suited forQiang’s models. There is a physical reason for this. The models in Qiang’s experiments werefully three dimensional models with two orthogonal frame lines and models of equipmentcontained inside the frame. Georgiou’s models, however, consisted of multiple, parallel planeframes. The assumption regarding the homogeneity of the structure’s porosity is clearly violatedfor Georgiou’s wind tunnel models.
0.5
1.0
1.5
2.0
2.5
3.0
3.5
0.5 1.0 1.5 2.0 2.5 3.0
predicted C f
mea
sure
dC
f
Georgiou
Qiang
1:1 Correlation
Linear Regression
Figure 6: Measured maximum force coefficients versus maximum force coefficients predicted according toEquation 9. C0 has been set to 1.4 for the calculation of the predicted Cf
OTHER EMPIRICAL CONSIDERATIONS
The development of the analytical model in section 2 identified the solidity ratio and the lengthto width aspect ratio of a structure as key parameters driving the wind loading force coefficientfor relatively dense open frame structures. The comparison of the model’s predictions withprevious wind tunnel results verifies the importance of these two parameters in the wind loadingprocess for these types of structures. The scatter in the data indicates that there are still otherimportant factors at work in determining the structures’ aerodynamic coefficients. The previouswork by Georgiou [8], Qiang [4], and Levitan et al [9] have identified a variety of other factors
y = 1.003x + 0.214R2 = 0.795

that influence the force coefficient for open frame structures. Among these are the number offrames, the spacing of the frames, the presence or absence of solid flooring, and whether theframes have equal or unequal solidity. In the face of so many variables, it is advantageous toidentify a small number of key geometric parameters, each of which is able to encompassmultiple variables affecting the force coefficient. This is similar in concept to the process ofdimensional analysis in fluid mechanics. Since the assumption of homogeneous porosity in theanalytical model of section 2 seemed to be too restrictive in some cases, another useful variablemight be one that describes the distribution of solidity within the structure.
Intuitively it seems that for open frame structures with the same envelope geometry, theaerodynamic behavior would differ for cases in which the solidity of the structure wasconcentrated at the center, evenly distributed throughout, or concentrated at the edges of thestructure. This geometric variation can be described mathematically using the second moment ofarea. This analytical tool is familiar to engineers when it is used to calculate moments of inertia.Another more common application is in the calculation of statistical variance (or by extension,the standard deviation). The following formula is proposed as a parameter to describe thedistribution of solidity within an open frame structure:
n
ii
n
i
ii
xL
xx
1
1
2
4
(10)
where the centroid, xi, is defined as:
n
ii
n
iii x
x
1
1
(11)
n = the number of elements along the x-axis. Example elements are frames andequipment elements.= the solidity ratio of element, i, along the x-axis. The solidity of each element is thesolid area of the element divided by the product of the height and width of the structure inthe plane normal to the x-axis.xi = the distance of element, i, from the centroid, xi.
The bracketed term in the numerator of Equation 10 is normalized by the length of the structure(along the x-axis) in order to eliminate overlap of coverage between this parameter, , and theparameter L/B. Equations 10 and 11 are divided by the cumulative solidity in order to eliminateoverlap of coverage between and the solidity ratio, . The lower and upper limits of Equation10 are (0, 1]. A value of zero corresponds to the case in which a structure of finite length, L,along the x-axis has all of its solidity concentrated at the centroid. This case is not possible andcan only be approached, since a structure with such a concentration of solidity would be a single,plane frame or plate of negligible thickness oriented normal to the x-axis. Such a structurewould have zero length, and Equation 10 would therefore be undefined. A value of unity
corresponds to the case of two plane frames or plates with negligible thickness orientedperpendicular to the x-axis and separated by some distance, L, along the x-axis. A value of 0.5represents a structure with a completely uniform distribution of solidity along its length, L.
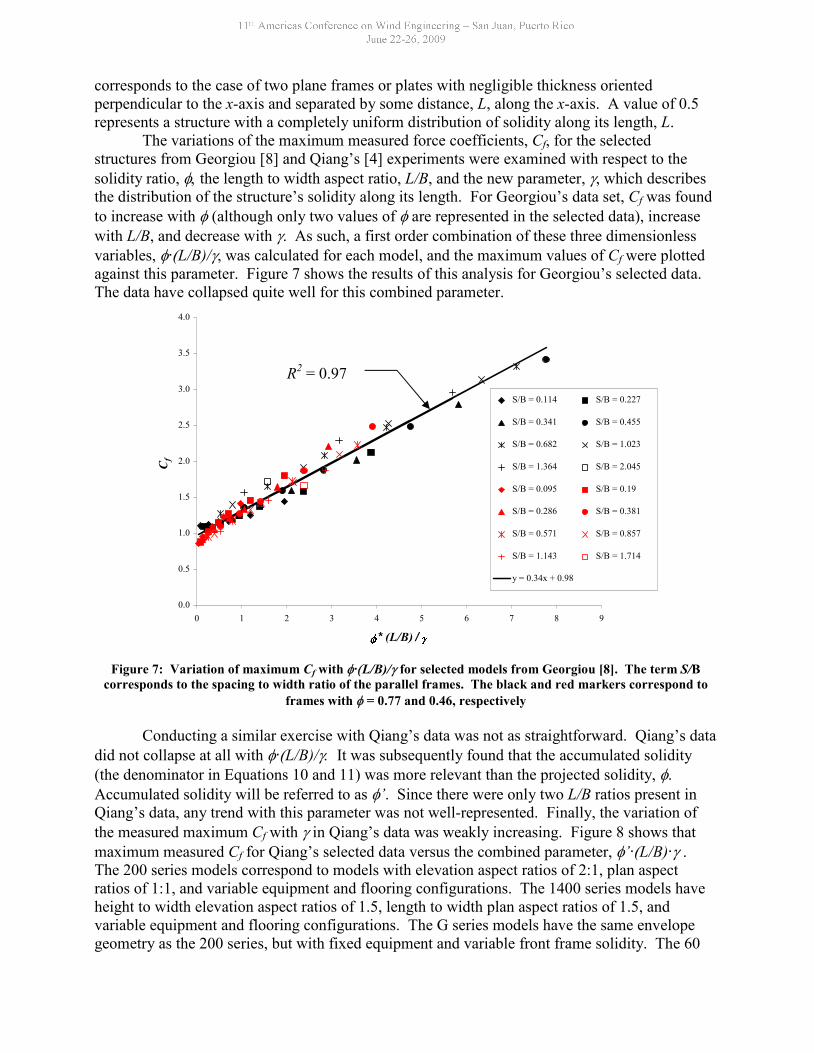
The variations of the maximum measured force coefficients, Cf, for the selectedstructures from Georgiou [8] and Qiang’s [4] experiments were examined with respect to thesolidity ratio, the length to width aspect ratio, L/B, and the new parameter, , which describesthe distribution of the structure’s solidity along its length. For Georgiou’s data set, Cf was foundto increase with (although only two values of are represented in the selected data), increasewith L/B, and decrease with . As such, a first order combination of these three dimensionlessvariables, ∙L/B)/, was calculated for each model, and the maximum values of Cf were plottedagainst this parameter. Figure 7 shows the results of this analysis for Georgiou’s selected data.The data have collapsed quite well for this combined parameter.
0.0
0.5
1.0
1.5
2.0
2.5
3.0
3.5
4.0
0 1 2 3 4 5 6 7 8 9
* (L/B) /
Cf
S/B = 0.114 S/B = 0.227
S/B = 0.341 S/B = 0.455
S/B = 0.682 S/B = 1.023
S/B = 1.364 S/B = 2.045
S/B = 0.095 S/B = 0.19
S/B = 0.286 S/B = 0.381
S/B = 0.571 S/B = 0.857
S/B = 1.143 S/B = 1.714
y = 0.34x + 0.98
Figure 7: Variation of maximum Cf with ∙L/B)/ for selected models from Georgiou [8]. The term S/Bcorresponds to the spacing to width ratio of the parallel frames. The black and red markers correspond to
frames with = 0.77 and 0.46, respectively
Conducting a similar exercise with Qiang’s data was not as straightforward. Qiang’s datadid not collapse at all with ∙L/B)/It was subsequently found that the accumulated solidity(the denominator in Equations 10 and 11) was more relevant than the projected solidity, .Accumulated solidity will be referred to as ’. Since there were only two L/B ratios present inQiang’s data, any trend with this parameter was not well-represented. Finally, the variation ofthe measured maximum Cf with in Qiang’s data was weakly increasing. Figure 8 shows thatmaximum measured Cf for Qiang’s selected data versus the combined parameter, ’∙L/B)∙ .The 200 series models correspond to models with elevation aspect ratios of 2:1, plan aspectratios of 1:1, and variable equipment and flooring configurations. The 1400 series models haveheight to width elevation aspect ratios of 1.5, length to width plan aspect ratios of 1.5, andvariable equipment and flooring configurations. The G series models have the same envelopegeometry as the 200 series, but with fixed equipment and variable front frame solidity. The 60
R2 = 0.97

series models also have the same envelope dimensions as the 200 and G series models, but withfixed frame solidity and variable equipment solidity. As was the case for the comparisons withthe analytical model, the differences in structure topology between Georgiou and Qiang’s studieshas resulted in quite different behaviors for the aerodynamic coefficients.
For the more three dimensional models in Qiang’s experiments, the distribution of thesolidity as measured by the parameter did not appear to be as important as it was in Georgiou’sexperiments on multiple, parallel plane frames. Despite the high level of empirical correlationthat was found for Georgiou’s selected data, there is limited practical application for the resultingrelationships. Neither petrochemical structures nor unclad building frames would have such highframe solidities. Furthermore, open frames in petrochemical applications exist to house processequipment.
0.5
0.6
0.7
0.8
0.9
1.0
1.1
1.2
1.3
1.4
1.5
0.4 0.6 0.8 1.0 1.2 1.4 1.6
'*(L/B)*
Cf
200 series
1400 series
G series
600 series
y = 0.66x + 0.46
Figure 8: Variation of maximum Cf with ’∙L/B)∙ for selected models from Qiang [4]
UPPER LIMIT FORCE COEFFICIENT
The analysis in the preceding sections has clearly illustrated that the maximum force coefficient,Cf , for an open frame structure will increase continually with increasing L/B. This factprecludes the establishment of any universal upper limit for Cf for this category of structure.What remains, then, is only the possibility of defining an upper limit Cf as a function of L/B.This possibility depends on the existence of an upper bound for the variable C0. It is reasonableto expect that such an upper bound on C0 exists, since the alternative implies that an externalflow in the neighborhood of a body with fixed L/B is capable of generating infinite force. Forrectangular bodies with homogeneous porosity, the upper bound for C0 is probably close to thevalue for an enclosed structure. (This is not to say that the Cf for an enclosed structure of similardimensions is the upper bound force coefficient. Equation 10 indicates that Cf can increaseindefinitely with L/B, regardless of the specified value of C0. The measured values of Cf for themodels referenced in this paper all fell below the values defined by Equation 10 with = 1.0 andC0 = 1.4.
R2 = 0.75

How well the geometry of the model conforms to the assumption of homogenousporosity will affect the quality of the model prediction. For example, as the solidity ofGeorgiou’s models increased, their geometry became more like parallel plates than a solid block.Previous research by the authors [10] has shown that an open frame structure with two parallelwalls clad can experience much higher wind loads than an enclosed building with the sameenvelope geometry. For Georgiou’s models, application of Equation 10 with C0 = 1.4 led to asystematic underestimation of the maximum value of Cf (see Figure 8). This is due to the factthat these models had a fundamentally different topology than either Qiang’s models or the idealporous block with homogeneous porosity. Any attempt to define an upper bound Cf must respectthese considerations.
SUMMARY AND CONCLUSIONS
This paper was concerned with the wind loading force coefficients for relatively solid openframe industrial process structures. It is advantageous to work toward a general understanding ofthe wind loads on these structures since accounting for the effects of all of the individualcomponents becomes tedious and, most likely, less accurate as the structures become moredensely occupied. Toward this end an analytical model of the force coefficient was derived forporous structures. The force coefficient in this model was found to depend strongly on thelength to width aspect ratio.
Comparisons of wind tunnel measurements for models consisting of multiple, parallellattice frames and fully three dimension frameworks with the analytical model showed goodagreement in the trends, a low bias, and some scatter. The experimental data displayed thecontinual increase in force coefficient with increasing plan aspect ratio, L/B, which the analyticalmodel predicts. On average, the analytical model predicted force coefficient values equal to only86% of the measured results. When the results for the fully three dimensional models werestudied in isolation, however, the model predicted force coefficient values equal to 99% of themeasured results, on average. The coefficient of variation of this ratio was 0.20 when bothGeorgiou and Qiang’s models are considered. The coefficient of variation dropped to 0.13 whenonly Qiang’s models were considered. The construction of this subset of models more closelymatched the assumptions used to develop the model. Furthermore, these models more closelyrepresented actual petrochemical structures, bolstering the potential utility of this analyticalmodel. On the other hand, only a limited range of length to width aspect ratios was included inQiang’s experiments.
In order to address the issue of the scatter, another descriptive parameter was devised.This additional parameter described the distribution of the solidity within the model in a mannersimilar in concept to the second moment of area. This parameter was very effective indescribing the variation of the force coefficients for multiple, parallel plane frame structures, butwas less useful for three dimensional structures more representative of a petrochemical structure.
The possibility of an upper bound force coefficient for open frame structures wasdiscussed. For structures conforming to the geometric assumption of the analytical modelderived in this paper, it is possible to describe the upper limit force coefficient only as a functionof the length to width ratio. So in the purest sense, no such upper bound force coefficient existsfor an open frame structure with arbitrary geometry. However, an upper bound can be defined asa function of L/B. This requires a selection of the empirical parameter C0 (a baseline solid bodyforce coefficient) which ensures that the results from the analytical model adequately envelopethe force coefficient for porous structures. A selection of C0 = 1.4 met this criteria for all of theexperimental data examined in this study.
REFERENCES
[1] ASCE (2006) Minimum Design Loads for Buildings and Other Structures, ASCE Standard SEI/ASCE7-05, American Society of Civil Engineers, Reston, VA.
[2] ASCE (1997) Wind Loads and Anchor Bolt Design for Petrochemical Facilities, Task Committee onWind Induced Forces and Task Committee on Anchor Bolt Design, American Society of Civil Engineers,New York.
[3] Georgiou, P.N. (1979) A Study of the Wind Loads on Building Frames, Masters Thesis, University ofWestern Ontario, Canada.
[4] Qiang, L. (1998) Wind Tunnel Tests for Wind Loads on Open Frame Petrochemical Structures,Masters Thesis, Louisiana State University, Baton Rouge, LA, 204p.
[5] Andrade, J.S., Costa, U. M. S., Almeida, M. P., Makse, H. A., and Stanley, H. E., Inertial effects onfluid flow through porous media, Physical Review Letters, v. 82, n. 26, June 1999, pp. 5249 - 5252.
[6] Cook, N.J., The Designer’s Guide to Wind Loading of Building Structures, Butterworths, London,1990.
[7] Richards, P. J. and Robinson, M. (1999) Wind loads on porous structures, Journal of windengineering and industrial aerodynamics, v. 83, pp. 455 – 466.
[8] Georgiou, P.N. (1979) A Study of the Wind Loads on Building Frames, Masters Thesis, University ofWestern Ontario, Canada.
[9] Levitan, M. L., Qiang, L., Amoroso, S. (2004), Wind Tunnel Tests on Open-FrameIndustrial/Petrochemical Structures, Fifth International Colloquium on Bluff Body Aerodynamics andApplications, Ottawa, Canada, July 11-15, vol. 1 pp. 343-346.
[10] Amoroso, S. Hebert, K., Levitan, M. (2005) Wind tunnel tests on partially clad buildings andstructures, Proceedings: Fourth European and African Conference on Wind Engineering, Prague.