WIND LOADS ON COMPLEX RESIDENTIAL ROOFS
48
A Resource for the State of Florida HURRICANE LOSS REDUCTION FOR HOUSING IN FLORIDA: WIND LOADS ON COMPLEX RESIDENTIAL ROOFS – PRELIMINARY COMPARISON OF FULL-SCALE AND WIND TUNNEL RESULTS A Research Project Funded by The State of Florida Department of Community Affairs Through Contract # 05RC-11-13-00-05-001 PREPARED BY THE INTERNATIONAL HURRICANE RESEARCH CENTER FLORIDA INTERNATIONAL UNIVERSITY
-
Upload
khangminh22 -
Category
Documents
-
view
2 -
download
0
Transcript of WIND LOADS ON COMPLEX RESIDENTIAL ROOFS
A Resource for the State of Florida
HURRICANE LOSS REDUCTION FOR
HOUSING IN FLORIDA:
WIND LOADS ON COMPLEX RESIDENTIAL ROOFS – PRELIMINARY COMPARISON OF FULL-SCALE AND WIND
TUNNEL RESULTS
A Research Project Funded by The State of Florida Department of Community Affairs
Through Contract # 05RC-11-13-00-05-001
PREPARED BY THE INTERNATIONAL HURRICANE RESEARCH CENTER
FLORIDA INTERNATIONAL UNIVERSITY
TABLE OF CONTENTS
1. INTRODUCTION ................................................................................................................................1 2. FULL SCALE WIND PRESSURE DATA ON PROTOTYPE HOUSES .......................................3
2.1 DATA COLLECTION.........................................................................................................................6 2.2 DATA ANALYSIS.............................................................................................................................6 2.3 WIND SPEED DATA AND PRESSURE COEFFICIENTS.........................................................................6 2.4 PRESSURE RESULTS FL-27 PROTOTYPE HOUSE............................................................................13
3. WIND TUNNEL MODEL-SCALE TESTS .....................................................................................14 3.1 FIELD OBSERVATIONS ..................................................................................................................14 3.2 TERRAIN ROUGHNESS AND SURROUNDINGS.................................................................................15 3.3 FIELD OBSERVATIONS ..................................................................................................................17
3.3.1 Prototype House FL-3 .............................................................................................................17 3.3.2 Prototype House FL-4 .............................................................................................................19 3.3.3 Prototype House FL-6 .............................................................................................................21 3.3.4 Prototype House FL-27 ...........................................................................................................23 3.3.5 Prototype House FL-28 ...........................................................................................................24 3.3.6 Prototype House FL-30 ...........................................................................................................26
3.4 WIND TUNNEL TESTING ...............................................................................................................27 3.5 MODELS .......................................................................................................................................29 3.6 DATA COLLECTION.......................................................................................................................29 3.7 COMPARISON OF FULL-SCALE AND MODEL-SCALE PRESSURE DATA...........................................34
4. CONCLUSIONS.................................................................................................................................41 REFERENCES............................................................................................................................................42
ii
LIST OF FIGURES Figure 1. Track of Hurricane Frances and locations of FCMP houses and wind tower locations. 5 Figure 2. Track of Hurricane Ivan and locations of FCMP houses and wind tower locations. 5 Figure 3. Measured wind speed for FL-28 in Hurricane Ivan (Note the wind speed anemometer did not record at peak of storm). .................................................................... 8 Figure 4. ARA’s modeled wind speed and direction at the FL-3 site. ......................... 9 Figure 5. ARA’s modeled wind speed and direction at the FL-4 site. ......................... 9 Figure 6. ARA’s modeled wind speed and direction at the FL-6 site. ....................... 10 Figure 7. ARA’s modeled wind speed and direction at the FL-27 site. ..................... 10 Figure 8. ARA’s modeled wind speed and direction at the FL-28 site. ..................... 11 Figure 9. ARA’s modeled wind speed and direction at the FL-28 site. ..................... 11 Figure 10. The comparison of ARA’s modeled wind speed and the measured wind speed at the FL-27 site. ..................................................................................................... 12 Figure 11. Schematic of FL-27 with peak minimum pressure results.......................... 13 Figure 12. Cardinal Directions for FL-4................................................................... 16 Figure 13. Roof Plan of Prototype FL-3 Showing Tap Locations............................ 18 Figure 14. Front View of Prototype FL-3................................................................. 18 Figure 16. Roof Plan of Prototype FL-4 Showing Tap Locations............................ 20 Figure 17. Side View of Prototype FL-4. ................................................................. 20 Figure 18. Roof Plan of Prototype FL-6 Showing Tap Locations............................ 21 Figure 19. Front View of Prototype FL-6................................................................. 22 Figure 20. Rear View of Prototype FL-6.................................................................. 22 Figure 21. Roof Plan of Prototype FL-27 Showing Tap Locations.......................... 23 Figure 22. Partial Front View of Prototype FL-27. .................................................. 24 Figure 23. Roof Plan of Prototype FL-28 Showing Tap Locations.......................... 25 Figure 24. Partial Rear View of Prototype FL-28. ................................................... 25 Figure 25. Roof Plan of Prototype FL-30 Showing Tap Locations.......................... 26 Figure 26. Partial Front View of Prototype FL-30. .................................................. 27 Figure 27. Wind tunnel terrain arrangement for 1:50 suburban exposure. .................. 28 Figure 28. Wind tunnel arrangement............................................................................ 28 Figure 29. Mean speed and turbulence intensity profile for 1:50 suburban terrain.. 29 Figure 30. Peak Minima and Maxima External Pressure Coefficients for FL-3. ..... 30 Figure 31. Peak Minima and Maxima External Pressure Coefficients for FL-4. ..... 31 Figure 32. Peak Minima and Maxima External Pressure Coefficients for FL-6 (modeled in flat terrain and not on slope)......................................................................... 31 Figure 33. Peak Minima and Maxima External Pressure Coefficients for FL-27. ... 32 Figure 34. Peak Minima and Maxima External Pressure Coefficients for FL-28. ... 32 Figure 35. Peak Minima and Maxima External Pressure Coefficients for FL-30. ... 33
iii
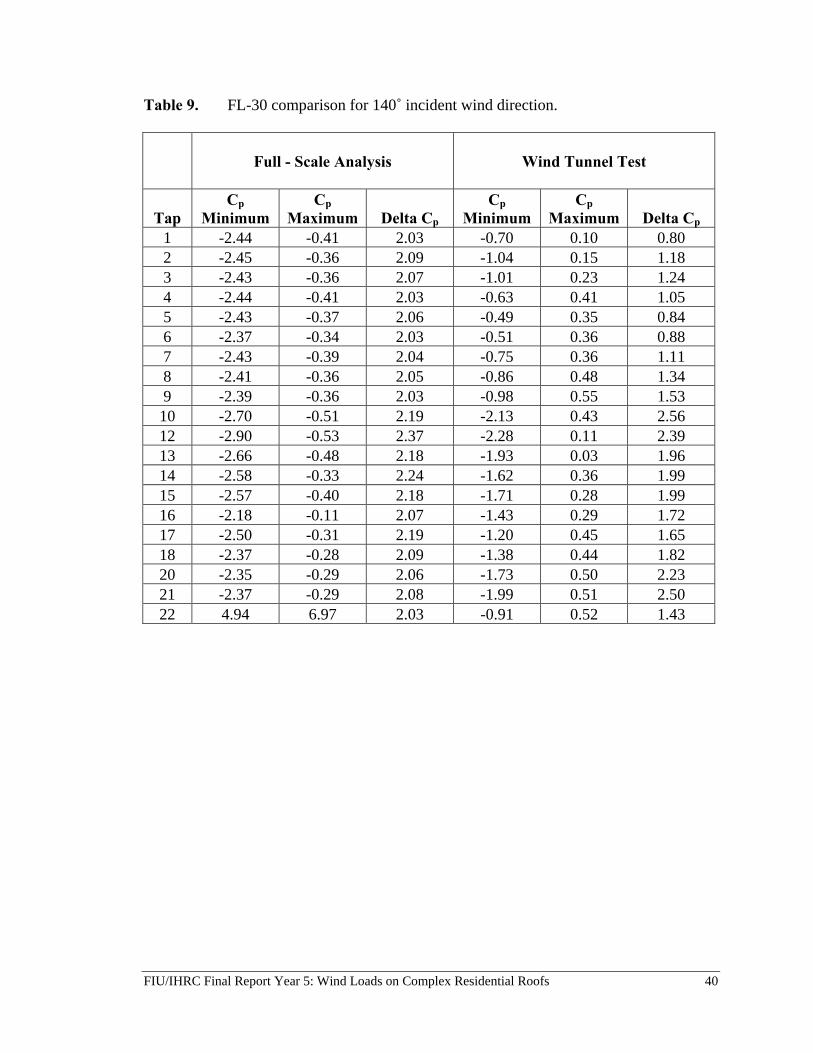
LIST OF TABLES Table 1. The 2004 List of FCMP Prototype Houses................................................... 4 Table 2. Comparison of ARA Model wind speeds to full-scale wind speeds. ........... 7 Table 3. House Identification and Location.............................................................. 14 Table 4. FL-3 comparison for 51˚ incident wind direction....................................... 35 Table 5. FL-4 comparison for 31˚ incident wind direction....................................... 36 Table 6. FL-6 comparison for 3˚ incident wind direction......................................... 37 Table 7. FL-27 comparison for 151˚ incident wind direction................................... 38 Table 8. FL-28 comparison for 153˚ incident wind direction................................... 39 Table 9. FL-30 comparison for 140˚ incident wind direction................................... 40
iv
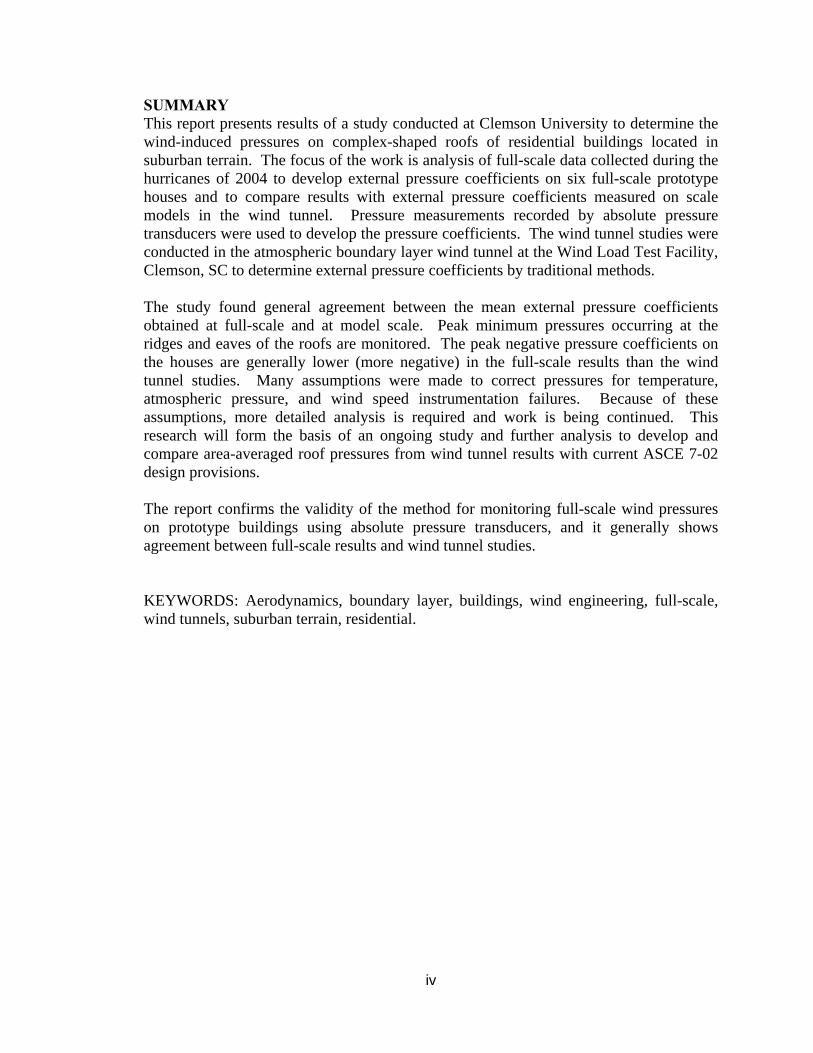
SUMMARY This report presents results of a study conducted at Clemson University to determine the wind-induced pressures on complex-shaped roofs of residential buildings located in suburban terrain. The focus of the work is analysis of full-scale data collected during the hurricanes of 2004 to develop external pressure coefficients on six full-scale prototype houses and to compare results with external pressure coefficients measured on scale models in the wind tunnel. Pressure measurements recorded by absolute pressure transducers were used to develop the pressure coefficients. The wind tunnel studies were conducted in the atmospheric boundary layer wind tunnel at the Wind Load Test Facility, Clemson, SC to determine external pressure coefficients by traditional methods. The study found general agreement between the mean external pressure coefficients obtained at full-scale and at model scale. Peak minimum pressures occurring at the ridges and eaves of the roofs are monitored. The peak negative pressure coefficients on the houses are generally lower (more negative) in the full-scale results than the wind tunnel studies. Many assumptions were made to correct pressures for temperature, atmospheric pressure, and wind speed instrumentation failures. Because of these assumptions, more detailed analysis is required and work is being continued. This research will form the basis of an ongoing study and further analysis to develop and compare area-averaged roof pressures from wind tunnel results with current ASCE 7-02 design provisions. The report confirms the validity of the method for monitoring full-scale wind pressures on prototype buildings using absolute pressure transducers, and it generally shows agreement between full-scale results and wind tunnel studies. KEYWORDS: Aerodynamics, boundary layer, buildings, wind engineering, full-scale, wind tunnels, suburban terrain, residential.
FIU/IHRC Final Report Year 5: Wind Loads on Complex Residential Roofs 1
1. INTRODUCTION
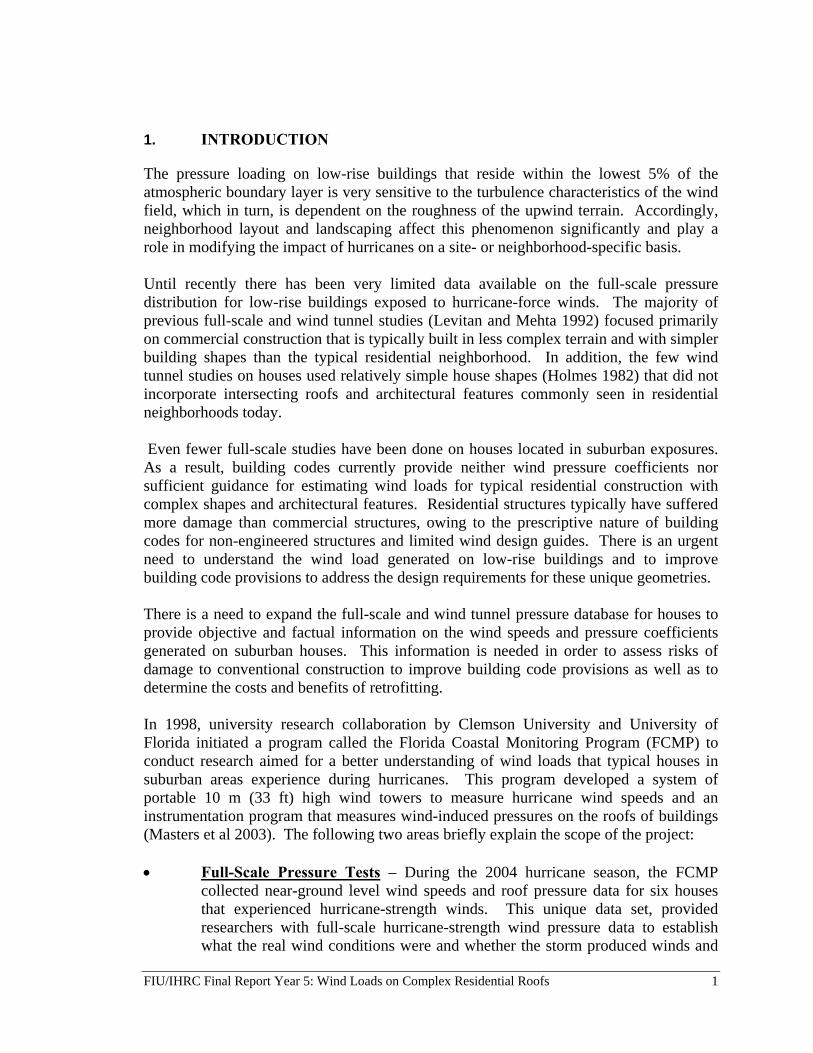
The pressure loading on low-rise buildings that reside within the lowest 5% of the atmospheric boundary layer is very sensitive to the turbulence characteristics of the wind field, which in turn, is dependent on the roughness of the upwind terrain. Accordingly, neighborhood layout and landscaping affect this phenomenon significantly and play a role in modifying the impact of hurricanes on a site- or neighborhood-specific basis. Until recently there has been very limited data available on the full-scale pressure distribution for low-rise buildings exposed to hurricane-force winds. The majority of previous full-scale and wind tunnel studies (Levitan and Mehta 1992) focused primarily on commercial construction that is typically built in less complex terrain and with simpler building shapes than the typical residential neighborhood. In addition, the few wind tunnel studies on houses used relatively simple house shapes (Holmes 1982) that did not incorporate intersecting roofs and architectural features commonly seen in residential neighborhoods today. Even fewer full-scale studies have been done on houses located in suburban exposures. As a result, building codes currently provide neither wind pressure coefficients nor sufficient guidance for estimating wind loads for typical residential construction with complex shapes and architectural features. Residential structures typically have suffered more damage than commercial structures, owing to the prescriptive nature of building codes for non-engineered structures and limited wind design guides. There is an urgent need to understand the wind load generated on low-rise buildings and to improve building code provisions to address the design requirements for these unique geometries. There is a need to expand the full-scale and wind tunnel pressure database for houses to provide objective and factual information on the wind speeds and pressure coefficients generated on suburban houses. This information is needed in order to assess risks of damage to conventional construction to improve building code provisions as well as to determine the costs and benefits of retrofitting. In 1998, university research collaboration by Clemson University and University of Florida initiated a program called the Florida Coastal Monitoring Program (FCMP) to conduct research aimed for a better understanding of wind loads that typical houses in suburban areas experience during hurricanes. This program developed a system of portable 10 m (33 ft) high wind towers to measure hurricane wind speeds and an instrumentation program that measures wind-induced pressures on the roofs of buildings (Masters et al 2003). The following two areas briefly explain the scope of the project: • Full-Scale Pressure Tests – During the 2004 hurricane season, the FCMP
collected near-ground level wind speeds and roof pressure data for six houses that experienced hurricane-strength winds. This unique data set, provided researchers with full-scale hurricane-strength wind pressure data to establish what the real wind conditions were and whether the storm produced winds and
FIU/IHRC Final Report Year 5: Wind Loads on Complex Residential Roofs 2
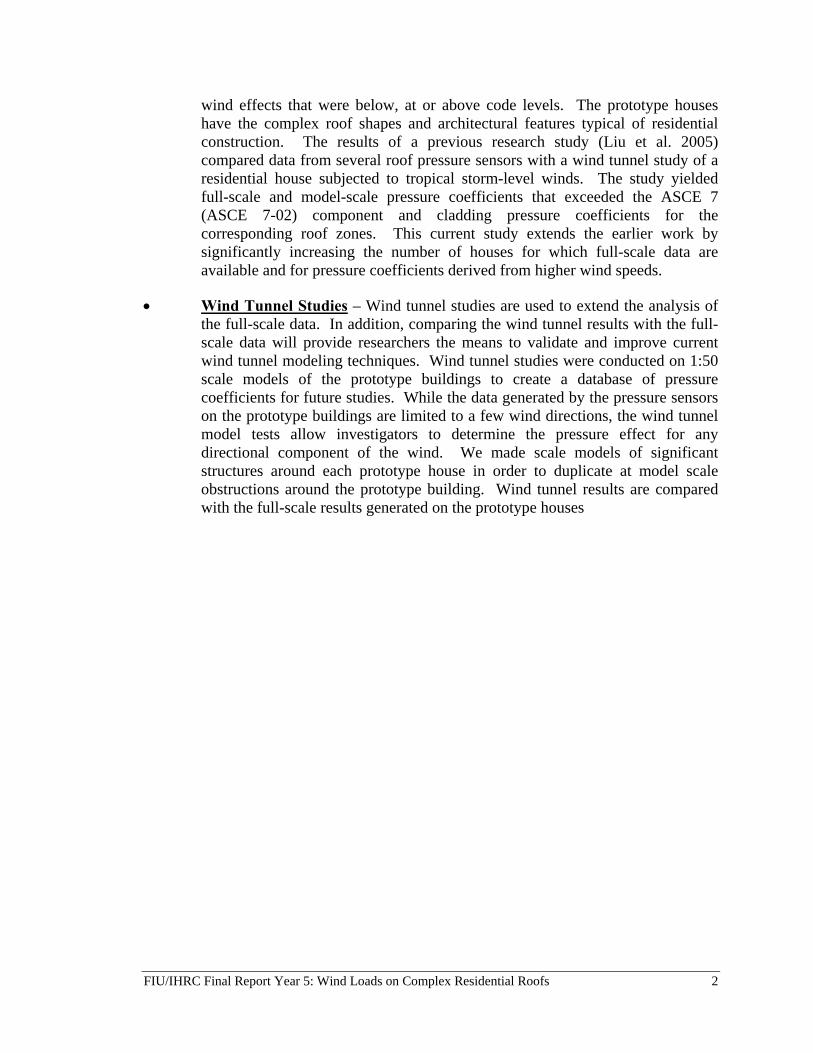
wind effects that were below, at or above code levels. The prototype houses have the complex roof shapes and architectural features typical of residential construction. The results of a previous research study (Liu et al. 2005) compared data from several roof pressure sensors with a wind tunnel study of a residential house subjected to tropical storm-level winds. The study yielded full-scale and model-scale pressure coefficients that exceeded the ASCE 7 (ASCE 7-02) component and cladding pressure coefficients for the corresponding roof zones. This current study extends the earlier work by significantly increasing the number of houses for which full-scale data are available and for pressure coefficients derived from higher wind speeds.
• Wind Tunnel Studies – Wind tunnel studies are used to extend the analysis of the full-scale data. In addition, comparing the wind tunnel results with the full-scale data will provide researchers the means to validate and improve current wind tunnel modeling techniques. Wind tunnel studies were conducted on 1:50 scale models of the prototype buildings to create a database of pressure coefficients for future studies. While the data generated by the pressure sensors on the prototype buildings are limited to a few wind directions, the wind tunnel model tests allow investigators to determine the pressure effect for any directional component of the wind. We made scale models of significant structures around each prototype house in order to duplicate at model scale obstructions around the prototype building. Wind tunnel results are compared with the full-scale results generated on the prototype houses
FIU/IHRC Final Report Year 5: Wind Loads on Complex Residential Roofs 3
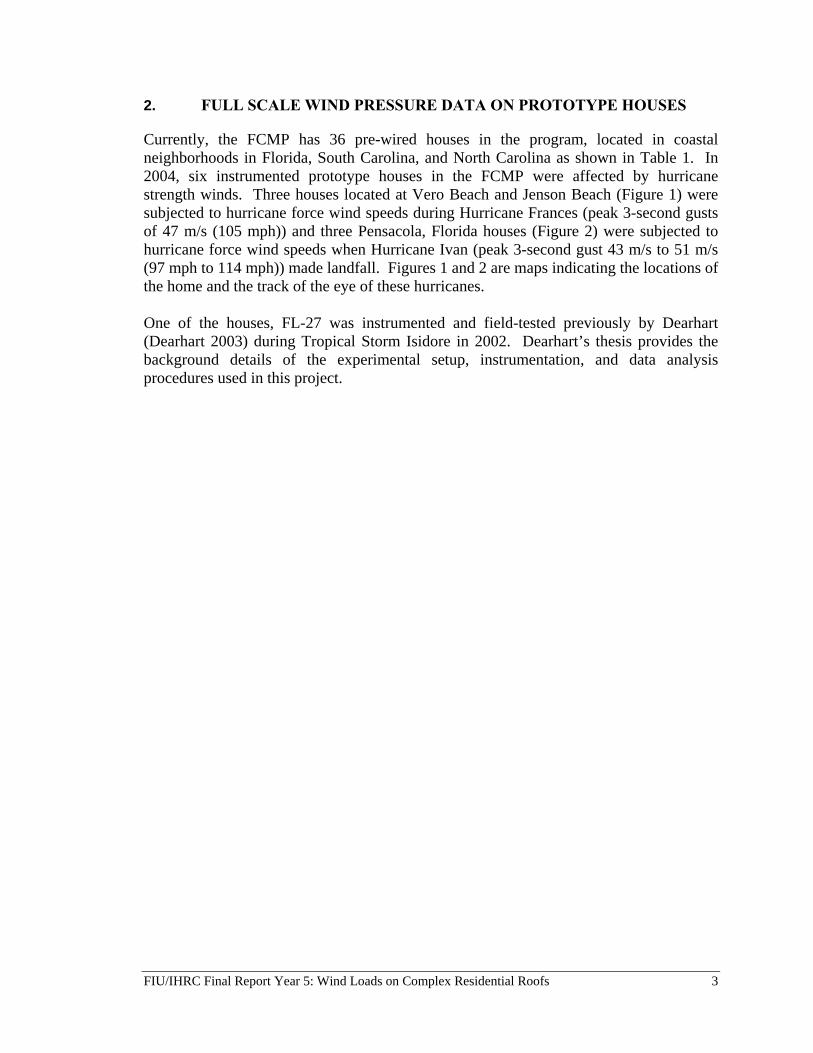
2. FULL SCALE WIND PRESSURE DATA ON PROTOTYPE HOUSES
Currently, the FCMP has 36 pre-wired houses in the program, located in coastal neighborhoods in Florida, South Carolina, and North Carolina as shown in Table 1. In 2004, six instrumented prototype houses in the FCMP were affected by hurricane strength winds. Three houses located at Vero Beach and Jenson Beach (Figure 1) were subjected to hurricane force wind speeds during Hurricane Frances (peak 3-second gusts of 47 m/s (105 mph)) and three Pensacola, Florida houses (Figure 2) were subjected to hurricane force wind speeds when Hurricane Ivan (peak 3-second gust 43 m/s to 51 m/s (97 mph to 114 mph)) made landfall. Figures 1 and 2 are maps indicating the locations of the home and the track of the eye of these hurricanes. One of the houses, FL-27 was instrumented and field-tested previously by Dearhart (Dearhart 2003) during Tropical Storm Isidore in 2002. Dearhart’s thesis provides the background details of the experimental setup, instrumentation, and data analysis procedures used in this project.
FIU/IHRC Final Report Year 5: Wind Loads on Complex Residential Roofs 4
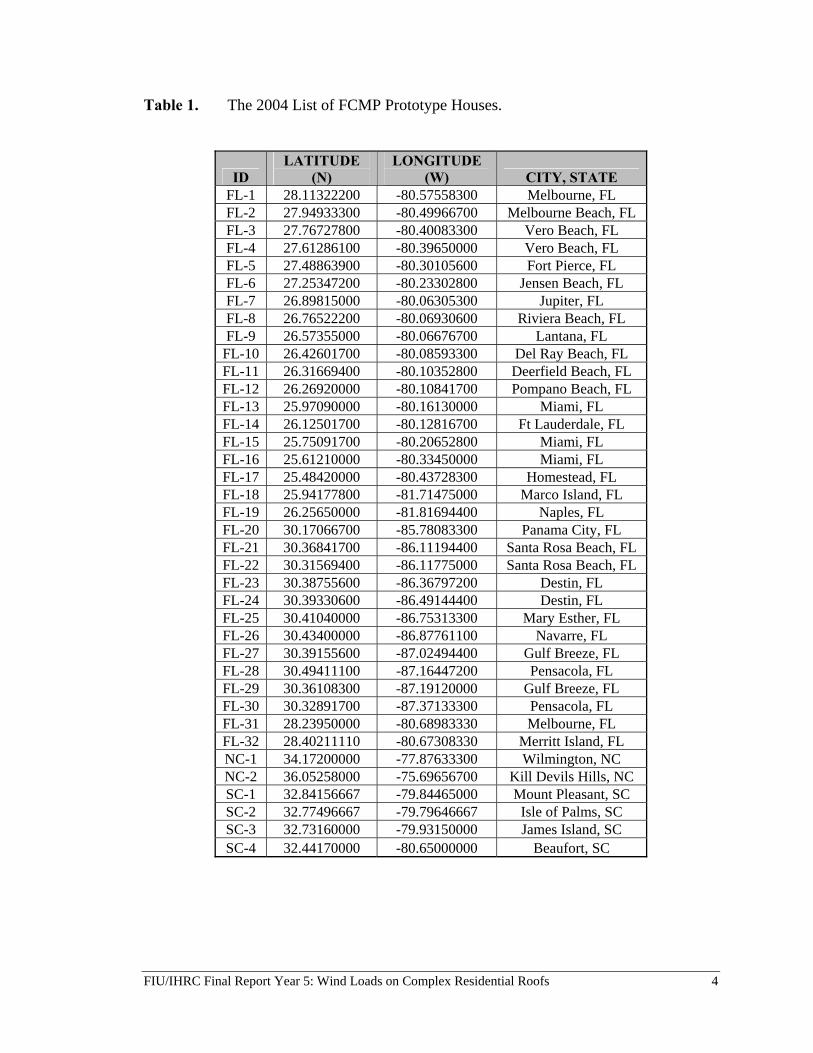
Table 1. The 2004 List of FCMP Prototype Houses.
ID LATITUDE
(N) LONGITUDE
(W) CITY, STATE FL-1 28.11322200 -80.57558300 Melbourne, FL FL-2 27.94933300 -80.49966700 Melbourne Beach, FL FL-3 27.76727800 -80.40083300 Vero Beach, FL FL-4 27.61286100 -80.39650000 Vero Beach, FL FL-5 27.48863900 -80.30105600 Fort Pierce, FL FL-6 27.25347200 -80.23302800 Jensen Beach, FL FL-7 26.89815000 -80.06305300 Jupiter, FL FL-8 26.76522200 -80.06930600 Riviera Beach, FL FL-9 26.57355000 -80.06676700 Lantana, FL
FL-10 26.42601700 -80.08593300 Del Ray Beach, FL FL-11 26.31669400 -80.10352800 Deerfield Beach, FL FL-12 26.26920000 -80.10841700 Pompano Beach, FL FL-13 25.97090000 -80.16130000 Miami, FL FL-14 26.12501700 -80.12816700 Ft Lauderdale, FL FL-15 25.75091700 -80.20652800 Miami, FL FL-16 25.61210000 -80.33450000 Miami, FL FL-17 25.48420000 -80.43728300 Homestead, FL FL-18 25.94177800 -81.71475000 Marco Island, FL FL-19 26.25650000 -81.81694400 Naples, FL FL-20 30.17066700 -85.78083300 Panama City, FL FL-21 30.36841700 -86.11194400 Santa Rosa Beach, FL FL-22 30.31569400 -86.11775000 Santa Rosa Beach, FL FL-23 30.38755600 -86.36797200 Destin, FL FL-24 30.39330600 -86.49144400 Destin, FL FL-25 30.41040000 -86.75313300 Mary Esther, FL FL-26 30.43400000 -86.87761100 Navarre, FL FL-27 30.39155600 -87.02494400 Gulf Breeze, FL FL-28 30.49411100 -87.16447200 Pensacola, FL FL-29 30.36108300 -87.19120000 Gulf Breeze, FL FL-30 30.32891700 -87.37133300 Pensacola, FL FL-31 28.23950000 -80.68983330 Melbourne, FL FL-32 28.40211110 -80.67308330 Merritt Island, FL NC-1 34.17200000 -77.87633300 Wilmington, NC NC-2 36.05258000 -75.69656700 Kill Devils Hills, NC SC-1 32.84156667 -79.84465000 Mount Pleasant, SC SC-2 32.77496667 -79.79646667 Isle of Palms, SC SC-3 32.73160000 -79.93150000 James Island, SC SC-4 32.44170000 -80.65000000 Beaufort, SC
FIU/IHRC Final Report Year 5: Wind Loads on Complex Residential Roofs 5
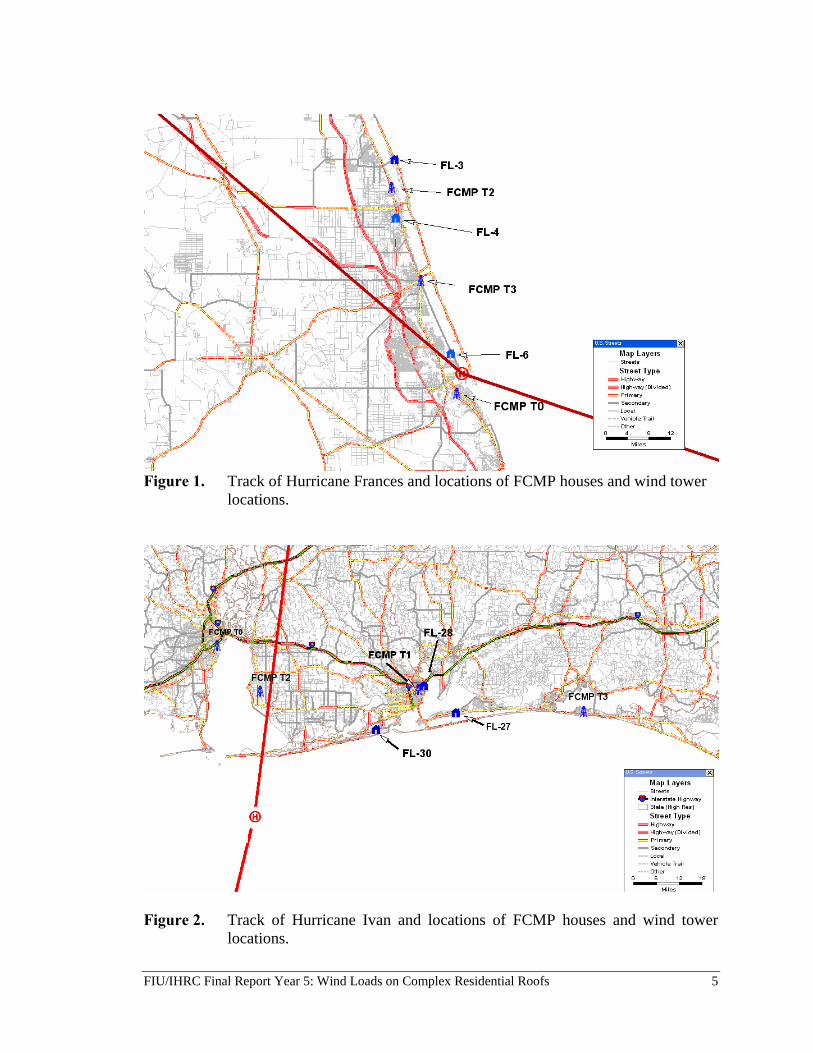
Figure 1. Track of Hurricane Frances and locations of FCMP houses and wind tower
locations.
Figure 2. Track of Hurricane Ivan and locations of FCMP houses and wind tower locations.
FIU/IHRC Final Report Year 5: Wind Loads on Complex Residential Roofs 6
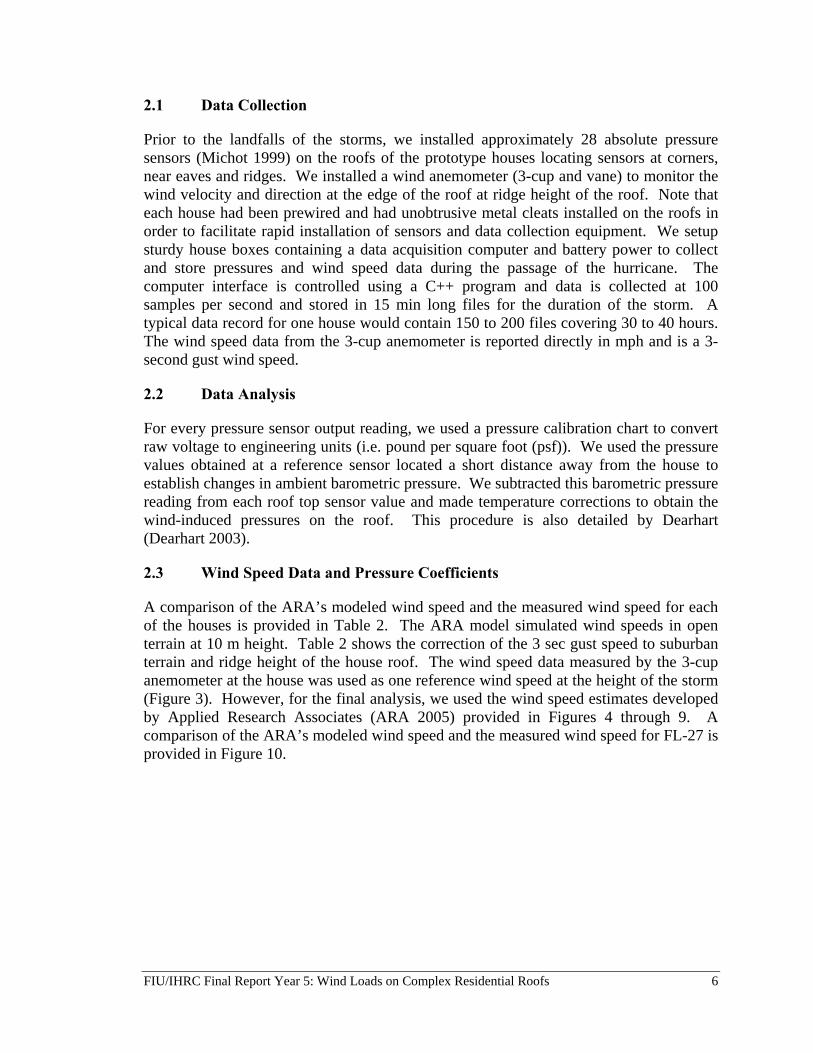
2.1 Data Collection
Prior to the landfalls of the storms, we installed approximately 28 absolute pressure sensors (Michot 1999) on the roofs of the prototype houses locating sensors at corners, near eaves and ridges. We installed a wind anemometer (3-cup and vane) to monitor the wind velocity and direction at the edge of the roof at ridge height of the roof. Note that each house had been prewired and had unobtrusive metal cleats installed on the roofs in order to facilitate rapid installation of sensors and data collection equipment. We setup sturdy house boxes containing a data acquisition computer and battery power to collect and store pressures and wind speed data during the passage of the hurricane. The computer interface is controlled using a C++ program and data is collected at 100 samples per second and stored in 15 min long files for the duration of the storm. A typical data record for one house would contain 150 to 200 files covering 30 to 40 hours. The wind speed data from the 3-cup anemometer is reported directly in mph and is a 3-second gust wind speed.
2.2 Data Analysis
For every pressure sensor output reading, we used a pressure calibration chart to convert raw voltage to engineering units (i.e. pound per square foot (psf)). We used the pressure values obtained at a reference sensor located a short distance away from the house to establish changes in ambient barometric pressure. We subtracted this barometric pressure reading from each roof top sensor value and made temperature corrections to obtain the wind-induced pressures on the roof. This procedure is also detailed by Dearhart (Dearhart 2003).
2.3 Wind Speed Data and Pressure Coefficients
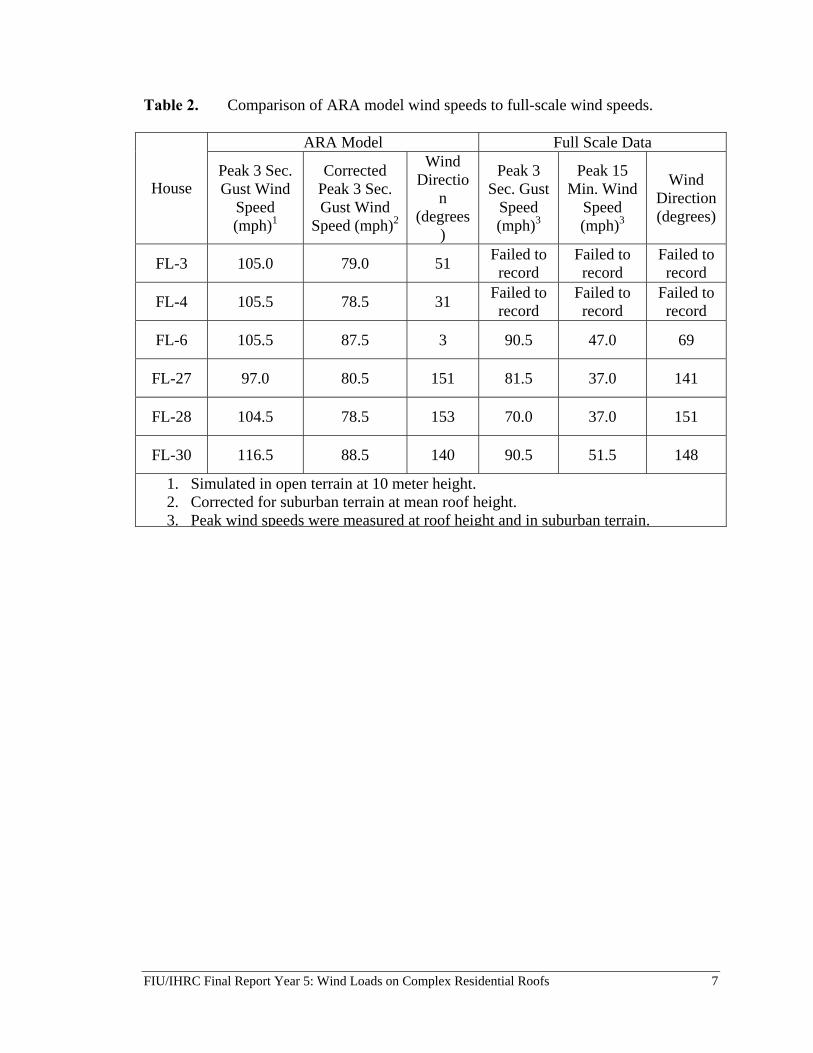
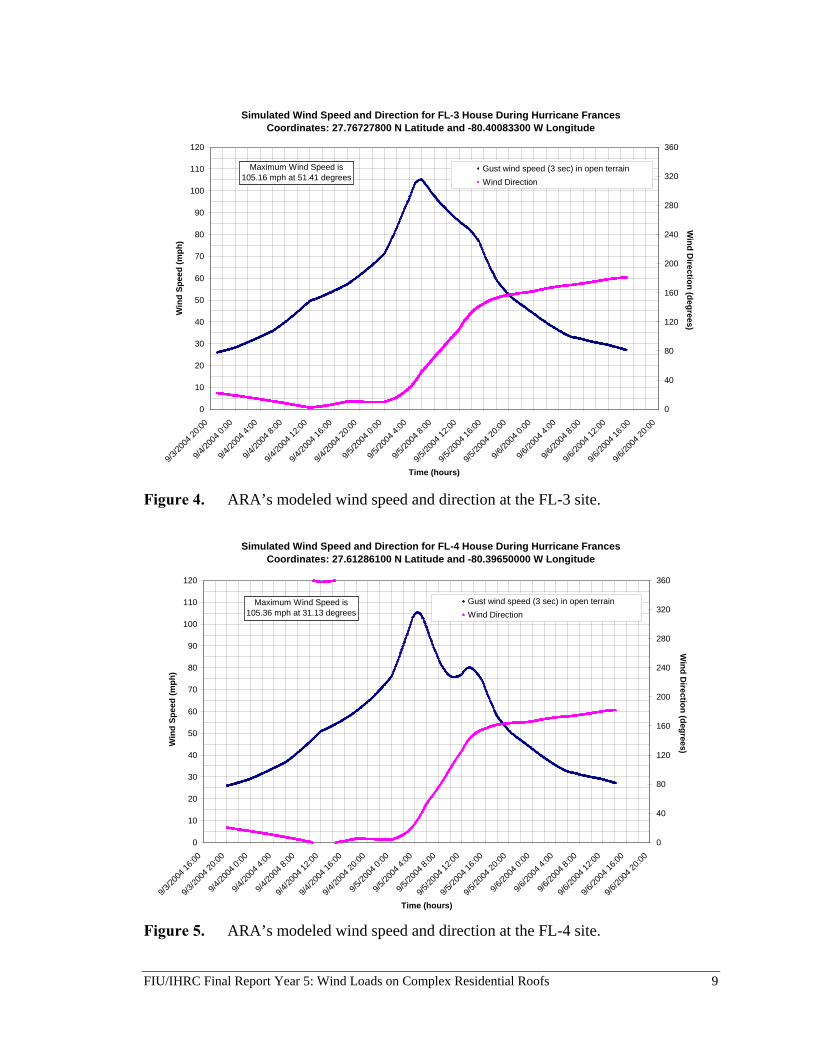
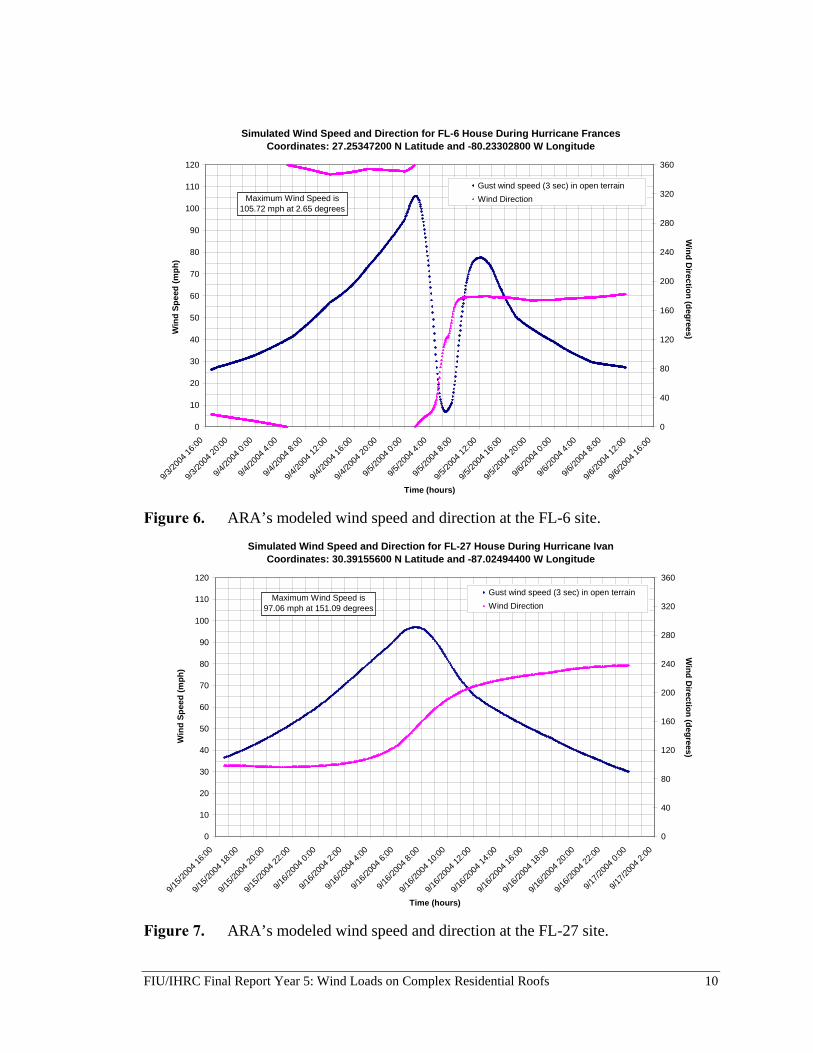
A comparison of the ARA’s modeled wind speed and the measured wind speed for each of the houses is provided in Table 2. The ARA model simulated wind speeds in open terrain at 10 m height. Table 2 shows the correction of the 3 sec gust speed to suburban terrain and ridge height of the house roof. The wind speed data measured by the 3-cup anemometer at the house was used as one reference wind speed at the height of the storm (Figure 3). However, for the final analysis, we used the wind speed estimates developed by Applied Research Associates (ARA 2005) provided in Figures 4 through 9. A comparison of the ARA’s modeled wind speed and the measured wind speed for FL-27 is provided in Figure 10.
FIU/IHRC Final Report Year 5: Wind Loads on Complex Residential Roofs 7
Table 2. Comparison of ARA model wind speeds to full-scale wind speeds.
ARA Model Full Scale Data
House Peak 3 Sec. Gust Wind
Speed (mph)1
Corrected Peak 3 Sec. Gust Wind
Speed (mph)2
Wind Directio
n (degrees
)
Peak 3 Sec. Gust
Speed (mph)3
Peak 15 Min. Wind
Speed (mph)3
Wind Direction (degrees)
FL-3 105.0 79.0 51 Failed to record
Failed to record
Failed to record
FL-4 105.5 78.5 31 Failed to record
Failed to record
Failed to record
FL-6 105.5 87.5 3 90.5 47.0 69
FL-27 97.0 80.5 151 81.5 37.0 141
FL-28 104.5 78.5 153 70.0 37.0 151
FL-30 116.5 88.5 140 90.5 51.5 148
1. Simulated in open terrain at 10 meter height. 2. Corrected for suburban terrain at mean roof height. 3. Peak wind speeds were measured at roof height and in suburban terrain.
FIU/IHRC Final Report Year 5: Wind Loads on Complex Residential Roofs 8
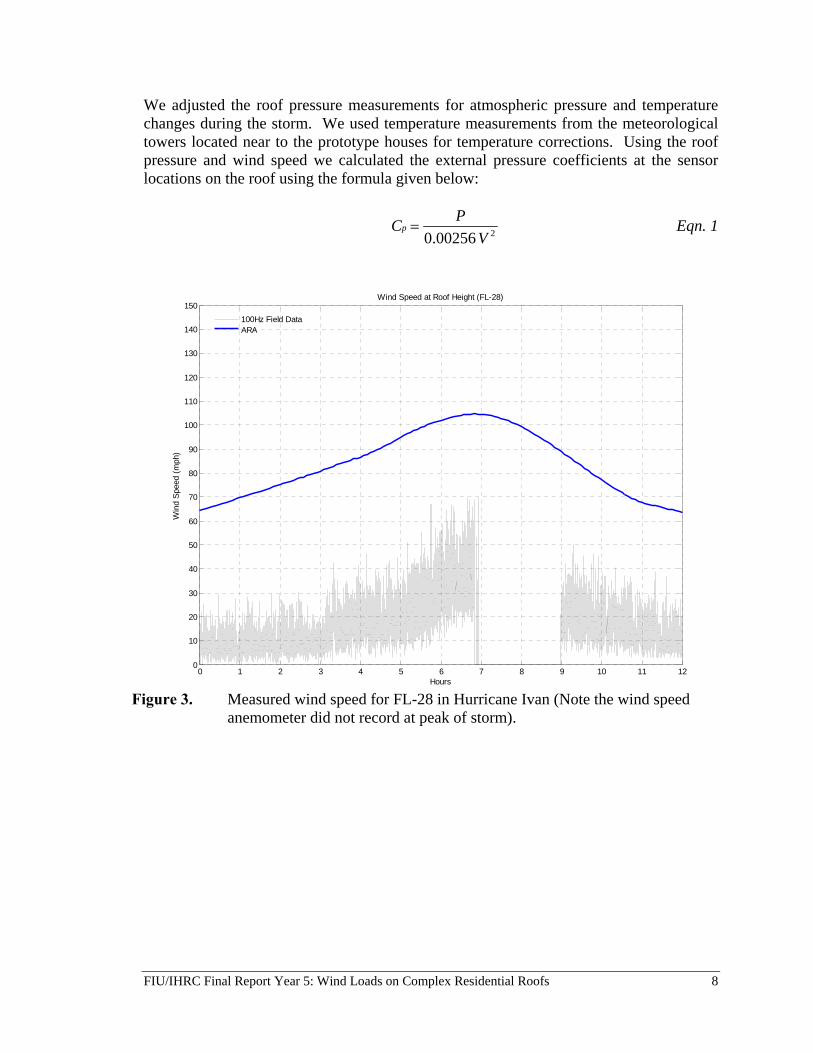
We adjusted the roof pressure measurements for atmospheric pressure and temperature changes during the storm. We used temperature measurements from the meteorological towers located near to the prototype houses for temperature corrections. Using the roof pressure and wind speed we calculated the external pressure coefficients at the sensor locations on the roof using the formula given below:
20.00256p
PCV
= Eqn. 1
0 1 2 3 4 5 6 7 8 9 10 11 120
10
20
30
40
50
60
70
80
90
100
110
120
130
140
150
Hours
Win
d Sp
eed
(mph
)
Wind Speed at Roof Height (FL-28)
100Hz Field DataARA
Figure 3. Measured wind speed for FL-28 in Hurricane Ivan (Note the wind speed
anemometer did not record at peak of storm).
FIU/IHRC Final Report Year 5: Wind Loads on Complex Residential Roofs 9
Simulated Wind Speed and Direction for FL-3 House During Hurricane FrancesCoordinates: 27.76727800 N Latitude and -80.40083300 W Longitude
0
10
20
30
40
50
60
70
80
90
100
110
120
9/3/20
04 20
:00
9/4/20
04 0:
00
9/4/20
04 4:
00
9/4/20
04 8:
00
9/4/20
04 12
:00
9/4/20
04 16
:00
9/4/20
04 20
:00
9/5/20
04 0:
00
9/5/20
04 4:
00
9/5/20
04 8:
00
9/5/20
04 12
:00
9/5/20
04 16
:00
9/5/20
04 20
:00
9/6/20
04 0:
00
9/6/20
04 4:
00
9/6/20
04 8:
00
9/6/20
04 12
:00
9/6/20
04 16
:00
9/6/20
04 20
:00
Time (hours)
Win
d Sp
eed
(mph
)
0
40
80
120
160
200
240
280
320
360
Gust wind speed (3 sec) in open terrainWind Direction
Wind D
irection (degrees)
Maximum Wind Speed is 105.16 mph at 51.41 degrees
Figure 4. ARA’s modeled wind speed and direction at the FL-3 site.
Simulated Wind Speed and Direction for FL-4 House During Hurricane FrancesCoordinates: 27.61286100 N Latitude and -80.39650000 W Longitude
0
10
20
30
40
50
60
70
80
90
100
110
120
9/3/20
04 16
:00
9/3/20
04 20
:00
9/4/20
04 0:
00
9/4/20
04 4:
00
9/4/20
04 8:
00
9/4/20
04 12
:00
9/4/20
04 16
:00
9/4/20
04 20
:00
9/5/20
04 0:
00
9/5/20
04 4:
00
9/5/20
04 8:
00
9/5/20
04 12
:00
9/5/20
04 16
:00
9/5/20
04 20
:00
9/6/20
04 0:
00
9/6/20
04 4:
00
9/6/20
04 8:
00
9/6/20
04 12
:00
9/6/20
04 16
:00
9/6/20
04 20
:00
Time (hours)
Win
d Sp
eed
(mph
)
0
40
80
120
160
200
240
280
320
360
Gust wind speed (3 sec) in open terrainWind Direction
Wind D
irection (degrees)
Maximum Wind Speed is105.36 mph at 31.13 degrees
Figure 5. ARA’s modeled wind speed and direction at the FL-4 site.
FIU/IHRC Final Report Year 5: Wind Loads on Complex Residential Roofs 10
Simulated Wind Speed and Direction for FL-6 House During Hurricane FrancesCoordinates: 27.25347200 N Latitude and -80.23302800 W Longitude
0
10
20
30
40
50
60
70
80
90
100
110
120
9/3/20
04 16
:00
9/3/20
04 20
:00
9/4/20
04 0:
00
9/4/20
04 4:
00
9/4/20
04 8:
00
9/4/20
04 12
:00
9/4/20
04 16
:00
9/4/20
04 20
:00
9/5/20
04 0:
00
9/5/20
04 4:
00
9/5/20
04 8:
00
9/5/20
04 12
:00
9/5/20
04 16
:00
9/5/20
04 20
:00
9/6/20
04 0:
00
9/6/20
04 4:
00
9/6/20
04 8:
00
9/6/20
04 12
:00
9/6/20
04 16
:00
Time (hours)
Win
d Sp
eed
(mph
)
0
40
80
120
160
200
240
280
320
360
Gust wind speed (3 sec) in open terrainWind Direction
Wind D
irection (degrees)
Maximum Wind Speed is105.72 mph at 2.65 degrees
Figure 6. ARA’s modeled wind speed and direction at the FL-6 site.
Simulated Wind Speed and Direction for FL-27 House During Hurricane IvanCoordinates: 30.39155600 N Latitude and -87.02494400 W Longitude
0
10
20
30
40
50
60
70
80
90
100
110
120
9/15/2
004 1
6:00
9/15/2
004 1
8:00
9/15/2
004 2
0:00
9/15/2
004 2
2:00
9/16/2
004 0
:00
9/16/2
004 2
:00
9/16/2
004 4
:00
9/16/2
004 6
:00
9/16/2
004 8
:00
9/16/2
004 1
0:00
9/16/2
004 1
2:00
9/16/2
004 1
4:00
9/16/2
004 1
6:00
9/16/2
004 1
8:00
9/16/2
004 2
0:00
9/16/2
004 2
2:00
9/17/2
004 0
:00
9/17/2
004 2
:00
Time (hours)
Win
d Sp
eed
(mph
)
0
40
80
120
160
200
240
280
320
360
Gust wind speed (3 sec) in open terrainWind Direction
Wind D
irection (degrees)
Maximum Wind Speed is97.06 mph at 151.09 degrees
Figure 7. ARA’s modeled wind speed and direction at the FL-27 site.
FIU/IHRC Final Report Year 5: Wind Loads on Complex Residential Roofs 11
Simulated Wind Speed and Direction for FL-28 House During Hurricane IvanCoordinates: 30.49411100 N Latitude and -87.16447200 W Longitude
0
10
20
30
40
50
60
70
80
90
100
110
120
9/15/2
004 1
6:00
9/15/2
004 1
8:00
9/15/2
004 2
0:00
9/15/2
004 2
2:00
9/16/2
004 0
:00
9/16/2
004 2
:00
9/16/2
004 4
:00
9/16/2
004 6
:00
9/16/2
004 8
:00
9/16/2
004 1
0:00
9/16/2
004 1
2:00
9/16/2
004 1
4:00
9/16/2
004 1
6:00
9/16/2
004 1
8:00
9/16/2
004 2
0:00
9/16/2
004 2
2:00
9/17/2
004 0
:00
9/17/2
004 2
:00
Time (hours)
Win
d Sp
eed
(mph
)
0
40
80
120
160
200
240
280
320
360
Gust wind speed (3 sec) in open terrainWind Direction
Wind D
irection (degrees)
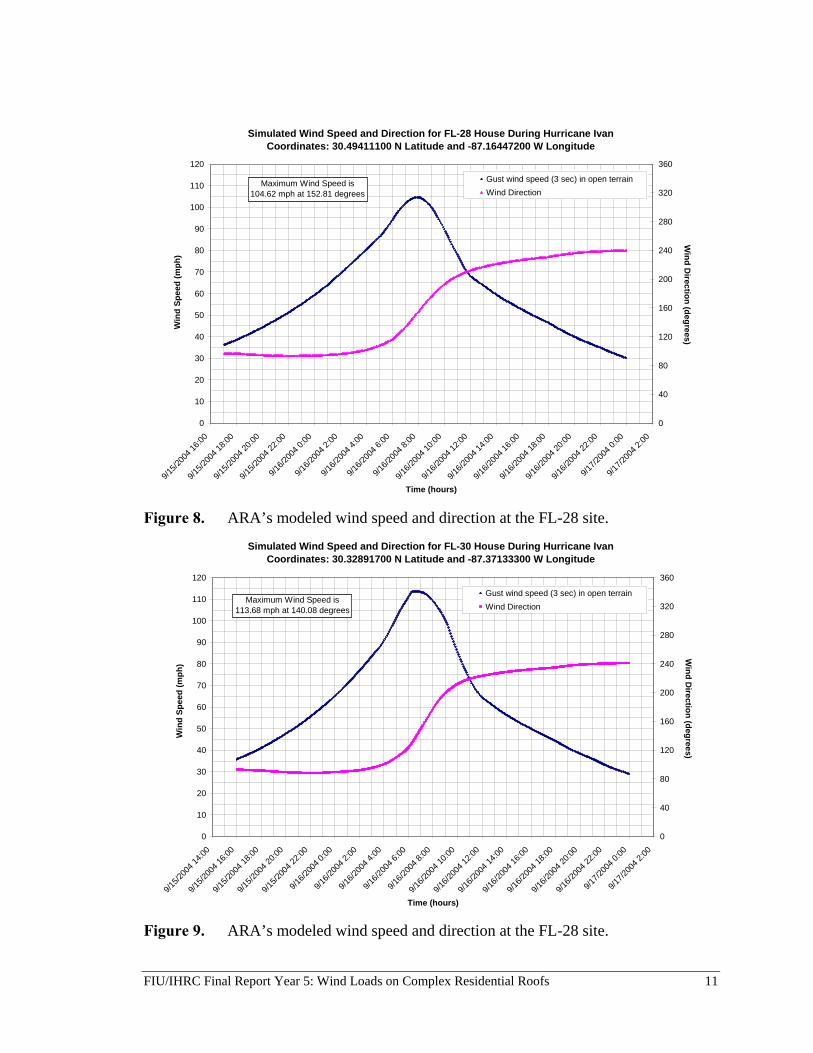
Maximum Wind Speed is104.62 mph at 152.81 degrees
Figure 8. ARA’s modeled wind speed and direction at the FL-28 site.
Simulated Wind Speed and Direction for FL-30 House During Hurricane IvanCoordinates: 30.32891700 N Latitude and -87.37133300 W Longitude
0
10
20
30
40
50
60
70
80
90
100
110
120
9/15/2
004 1
4:00
9/15/2
004 1
6:00
9/15/2
004 1
8:00
9/15/2
004 2
0:00
9/15/2
004 2
2:00
9/16/2
004 0
:00
9/16/2
004 2
:00
9/16/2
004 4
:00
9/16/2
004 6
:00
9/16/2
004 8
:00
9/16/2
004 1
0:00
9/16/2
004 1
2:00
9/16/2
004 1
4:00
9/16/2
004 1
6:00
9/16/2
004 1
8:00
9/16/2
004 2
0:00
9/16/2
004 2
2:00
9/17/2
004 0
:00
9/17/2
004 2
:00
Time (hours)
Win
d Sp
eed
(mph
)
0
40
80
120
160
200
240
280
320
360
Gust wind speed (3 sec) in open terrainWind Direction
Wind D
irection (degrees)
Maximum Wind Speed is113.68 mph at 140.08 degrees
Figure 9. ARA’s modeled wind speed and direction at the FL-28 site.
FIU/IHRC Final Report Year 5: Wind Loads on Complex Residential Roofs 12
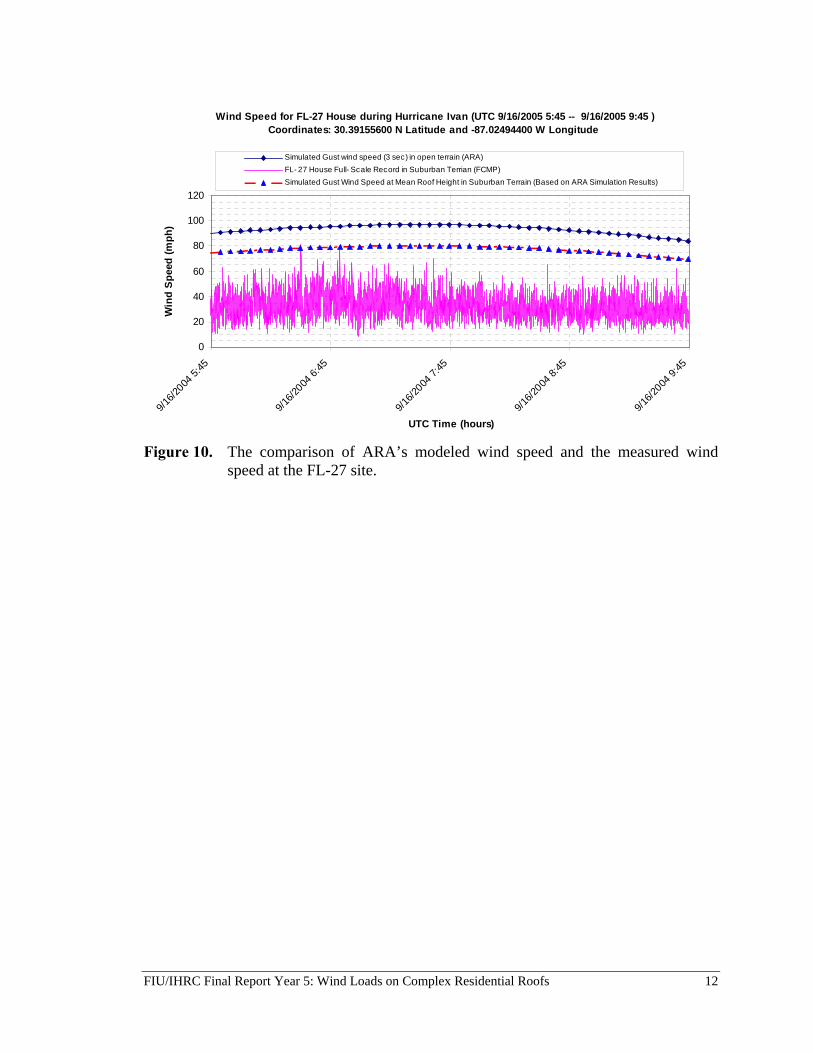
Wind Speed for FL-27 House during Hurricane Ivan (UTC 9/16/2005 5:45 -- 9/16/2005 9:45 )Coordinates: 30.39155600 N Latitude and -87.02494400 W Longitude
0
20
40
60
80
100
120
9/16/2
004 5:
45
9/16/2
004 6:
45
9/16/2
004 7:
45
9/16/2
004 8:
45
9/16/2
004 9:
45
UTC Time (hours)
Win
d Sp
eed
(mph
)Simulated Gust wind speed (3 sec) in open terrain (ARA)FL- 27 House Full- Scale Record in Suburban Terrian (FCMP)Simulated Gust Wind Speed at Mean Roof Height in Suburban Terrain (Based on ARA Simulation Results)
Figure 10. The comparison of ARA’s modeled wind speed and the measured wind
speed at the FL-27 site.
FIU/IHRC Final Report Year 5: Wind Loads on Complex Residential Roofs 13
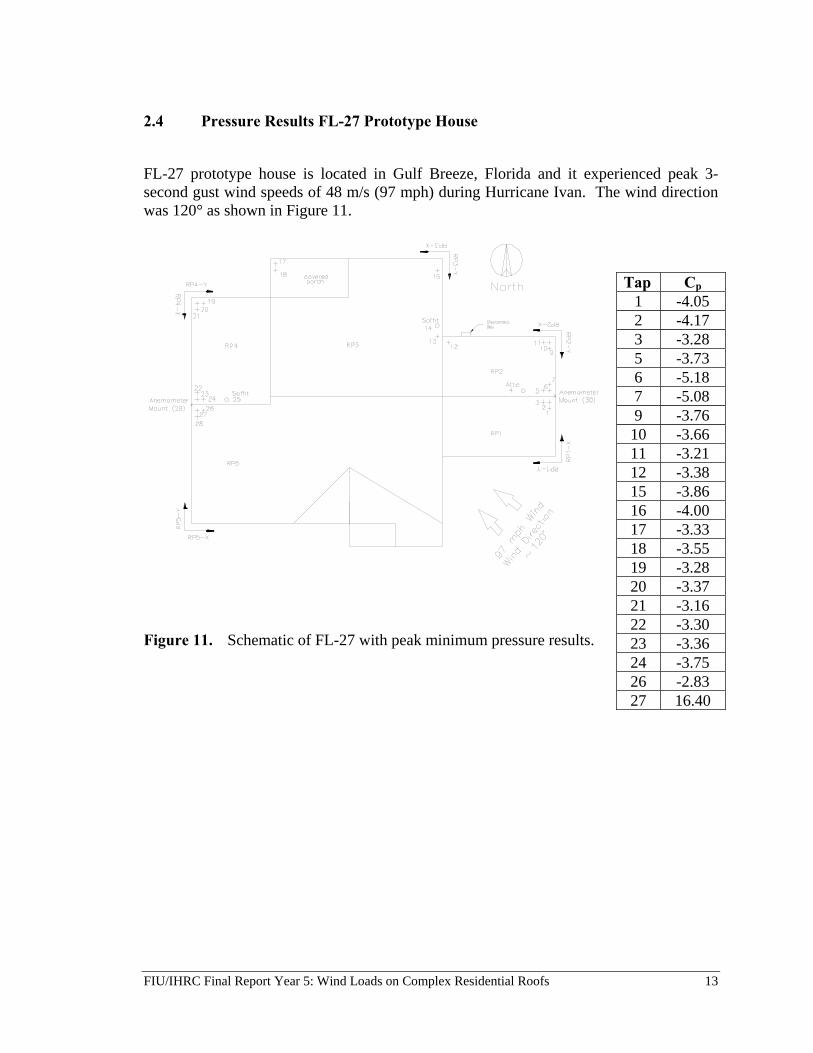
2.4 Pressure Results FL-27 Prototype House
FL-27 prototype house is located in Gulf Breeze, Florida and it experienced peak 3-second gust wind speeds of 48 m/s (97 mph) during Hurricane Ivan. The wind direction was 120° as shown in Figure 11.
Figure 11. Schematic of FL-27 with peak minimum pressure results.
Tap Cp 1 -4.05 2 -4.17 3 -3.28 5 -3.73 6 -5.18 7 -5.08 9 -3.76 10 -3.66 11 -3.21 12 -3.38 15 -3.86 16 -4.00 17 -3.33 18 -3.55 19 -3.28 20 -3.37 21 -3.16 22 -3.30 23 -3.36 24 -3.75 26 -2.83 27 16.40
FIU/IHRC Final Report Year 5: Wind Loads on Complex Residential Roofs 14
3. WIND TUNNEL MODEL-SCALE TESTS
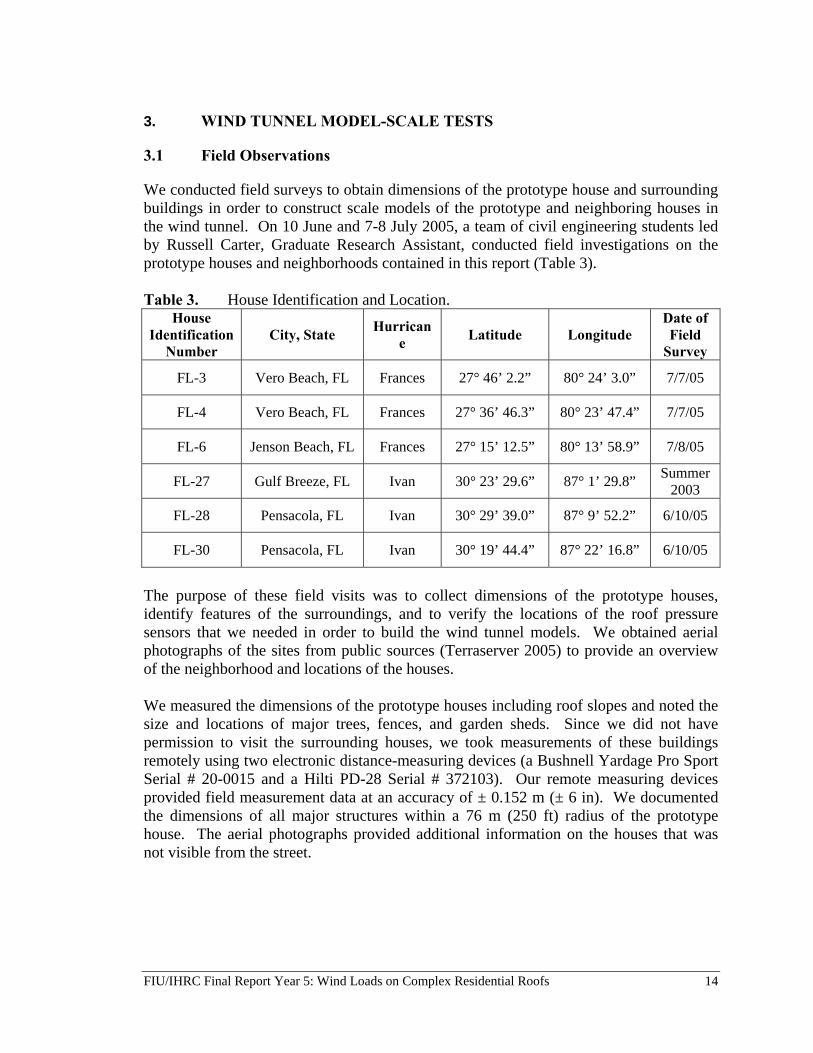
3.1 Field Observations
We conducted field surveys to obtain dimensions of the prototype house and surrounding buildings in order to construct scale models of the prototype and neighboring houses in the wind tunnel. On 10 June and 7-8 July 2005, a team of civil engineering students led by Russell Carter, Graduate Research Assistant, conducted field investigations on the prototype houses and neighborhoods contained in this report (Table 3). Table 3. House Identification and Location.
House Identification
Number City, State Hurrican
e Latitude Longitude Date of Field
Survey
FL-3 Vero Beach, FL Frances 27° 46’ 2.2” 80° 24’ 3.0” 7/7/05
FL-4 Vero Beach, FL Frances 27° 36’ 46.3” 80° 23’ 47.4” 7/7/05
FL-6 Jenson Beach, FL Frances 27° 15’ 12.5” 80° 13’ 58.9” 7/8/05
FL-27 Gulf Breeze, FL Ivan 30° 23’ 29.6” 87° 1’ 29.8” Summer 2003
FL-28 Pensacola, FL Ivan 30° 29’ 39.0” 87° 9’ 52.2” 6/10/05
FL-30 Pensacola, FL Ivan 30° 19’ 44.4” 87° 22’ 16.8” 6/10/05
The purpose of these field visits was to collect dimensions of the prototype houses, identify features of the surroundings, and to verify the locations of the roof pressure sensors that we needed in order to build the wind tunnel models. We obtained aerial photographs of the sites from public sources (Terraserver 2005) to provide an overview of the neighborhood and locations of the houses. We measured the dimensions of the prototype houses including roof slopes and noted the size and locations of major trees, fences, and garden sheds. Since we did not have permission to visit the surrounding houses, we took measurements of these buildings remotely using two electronic distance-measuring devices (a Bushnell Yardage Pro Sport Serial # 20-0015 and a Hilti PD-28 Serial # 372103). Our remote measuring devices provided field measurement data at an accuracy of ± 0.152 m (± 6 in). We documented the dimensions of all major structures within a 76 m (250 ft) radius of the prototype house. The aerial photographs provided additional information on the houses that was not visible from the street.

FIU/IHRC Final Report Year 5: Wind Loads on Complex Residential Roofs 15
3.2 Terrain Roughness and Surroundings
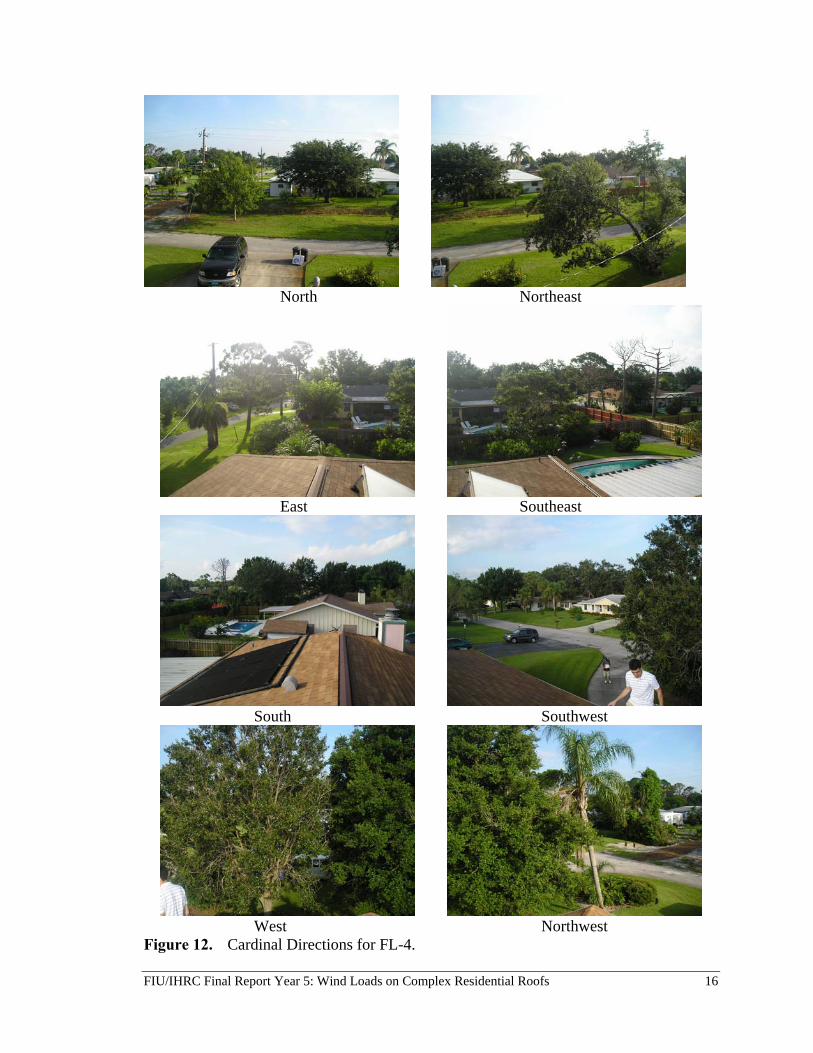
During our surveys of each house, we took photographs of the terrain and surroundings in eight cardinal directions to record the terrain roughness and obstructions to maintain a record of the upstream terrain for future studies (shown in Figure 12).
FIU/IHRC Final Report Year 5: Wind Loads on Complex Residential Roofs 16
North Northeast
East Southeast
South Southwest
West Northwest
Figure 12. Cardinal Directions for FL-4.
FIU/IHRC Final Report Year 5: Wind Loads on Complex Residential Roofs 17
3.3 Field Observations
3.3.1 Prototype House FL-3
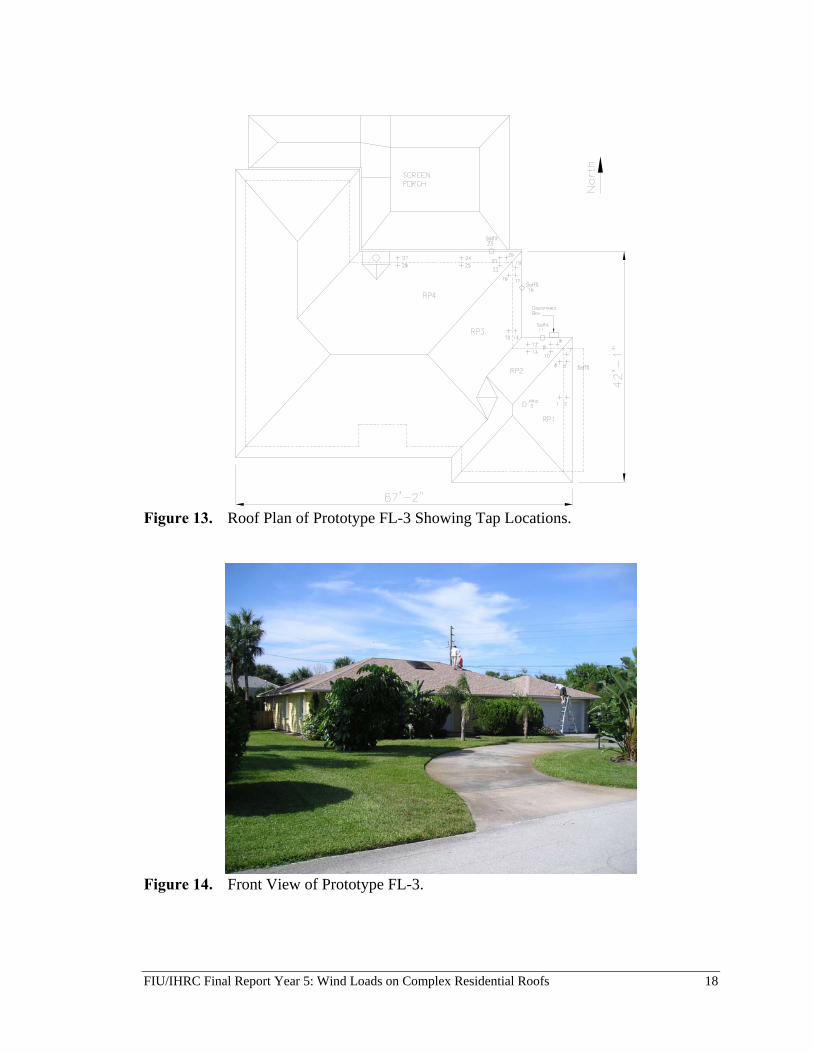
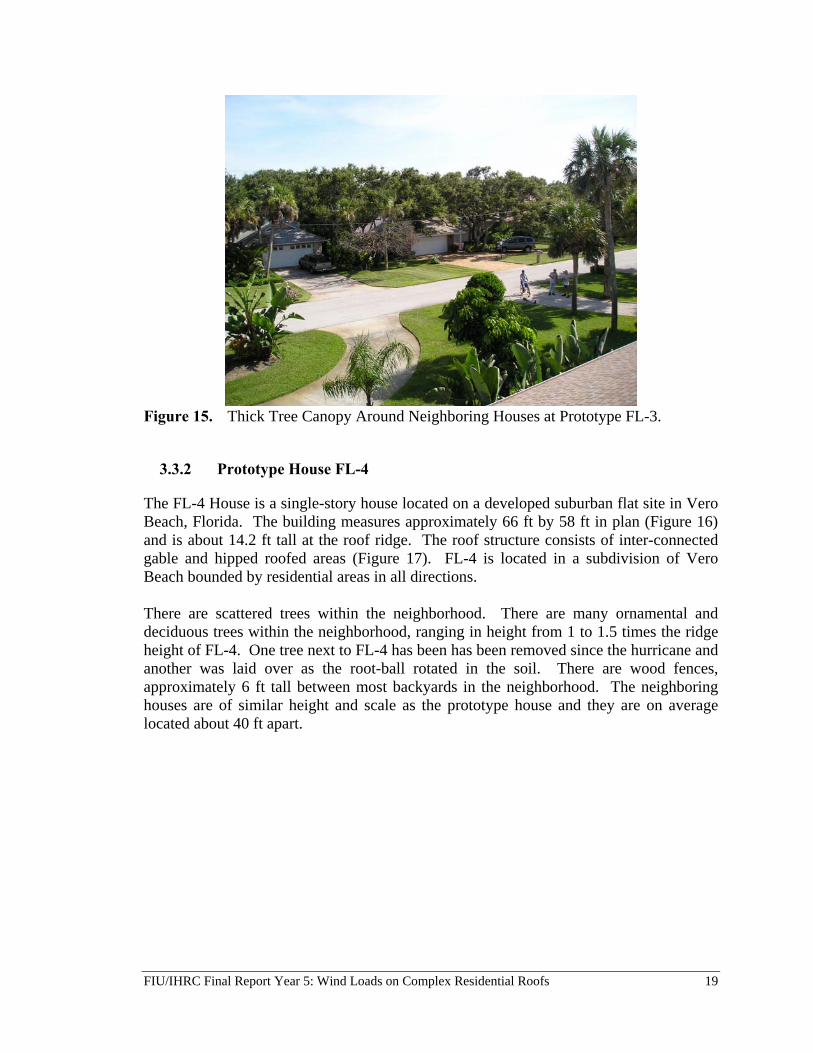
The FL-3 House is a single story house located on a flat site about 500 ft from the eastern shore line of a barrier island off the Atlantic coast of Florida. The house measures approximately 67 ft by 42 ft in plan (Figure 13) and is about 15 ft 5 in. tall at the roof ridge. The roof structure consists of inter-connected hipped roofed areas (Figure 14). The area is heavily wooded and the trees are approximately 2 times the height of the ridge of the house (Figure 15). Many neighboring structures are not fully visible from aerial photographs and from the ground due to the numerous trees. The neighboring structures vary in geometry and height. Several neighboring structures are two and three stories tall. The backyard is separated from the neighboring yards by a 6 ft tall wood fence. Other yards have either no fences or hedges.
FIU/IHRC Final Report Year 5: Wind Loads on Complex Residential Roofs 18
Figure 13. Roof Plan of Prototype FL-3 Showing Tap Locations.
Figure 14. Front View of Prototype FL-3.
FIU/IHRC Final Report Year 5: Wind Loads on Complex Residential Roofs 19
Figure 15. Thick Tree Canopy Around Neighboring Houses at Prototype FL-3.
3.3.2 Prototype House FL-4
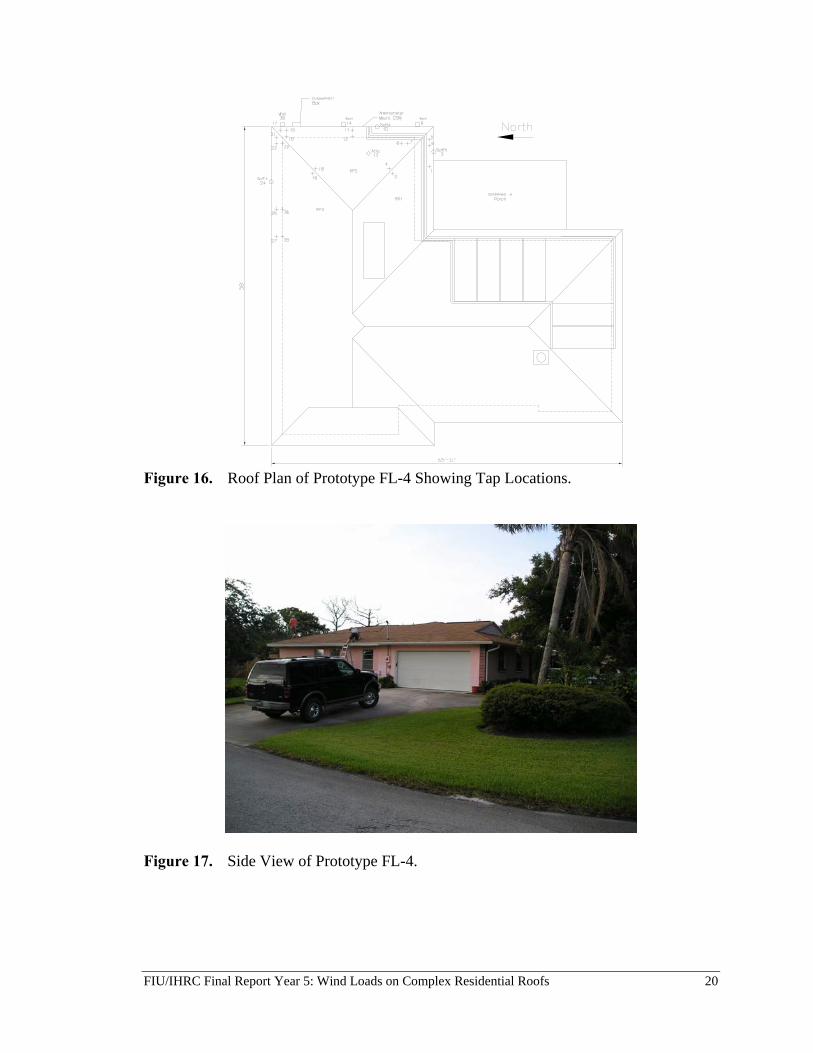
The FL-4 House is a single-story house located on a developed suburban flat site in Vero Beach, Florida. The building measures approximately 66 ft by 58 ft in plan (Figure 16) and is about 14.2 ft tall at the roof ridge. The roof structure consists of inter-connected gable and hipped roofed areas (Figure 17). FL-4 is located in a subdivision of Vero Beach bounded by residential areas in all directions. There are scattered trees within the neighborhood. There are many ornamental and deciduous trees within the neighborhood, ranging in height from 1 to 1.5 times the ridge height of FL-4. One tree next to FL-4 has been has been removed since the hurricane and another was laid over as the root-ball rotated in the soil. There are wood fences, approximately 6 ft tall between most backyards in the neighborhood. The neighboring houses are of similar height and scale as the prototype house and they are on average located about 40 ft apart.
FIU/IHRC Final Report Year 5: Wind Loads on Complex Residential Roofs 20
Figure 16. Roof Plan of Prototype FL-4 Showing Tap Locations.
Figure 17. Side View of Prototype FL-4.
FIU/IHRC Final Report Year 5: Wind Loads on Complex Residential Roofs 21
3.3.3 Prototype House FL-6
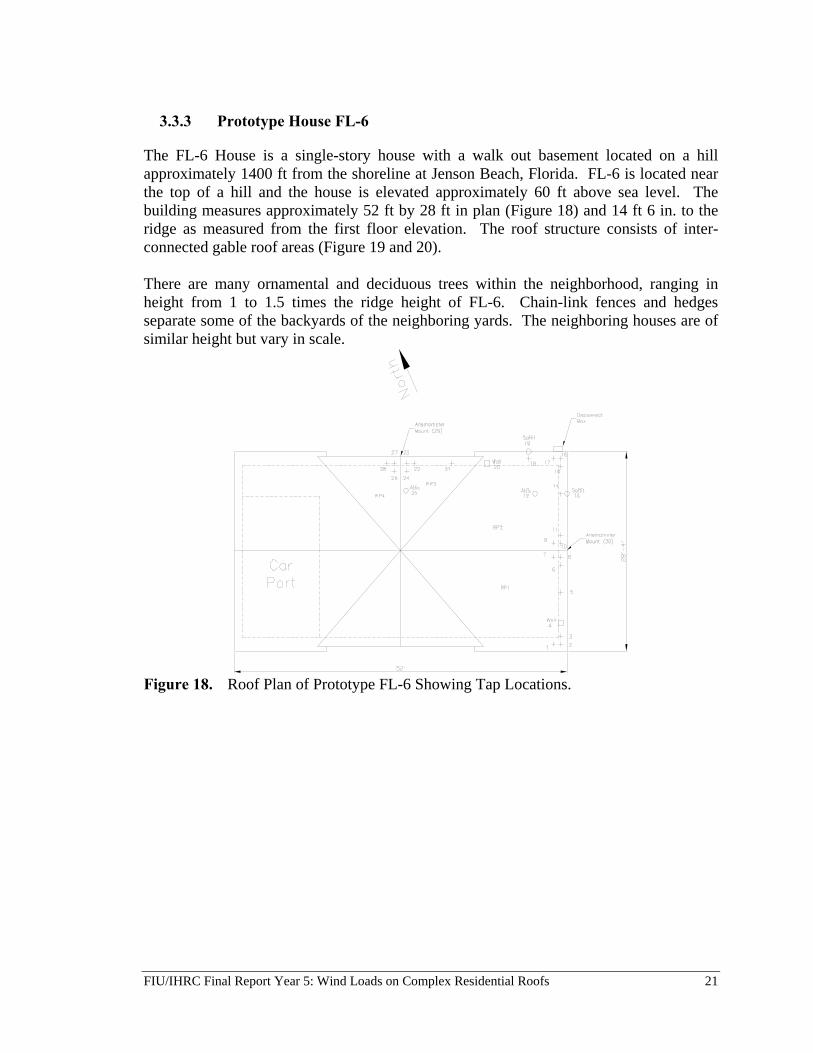
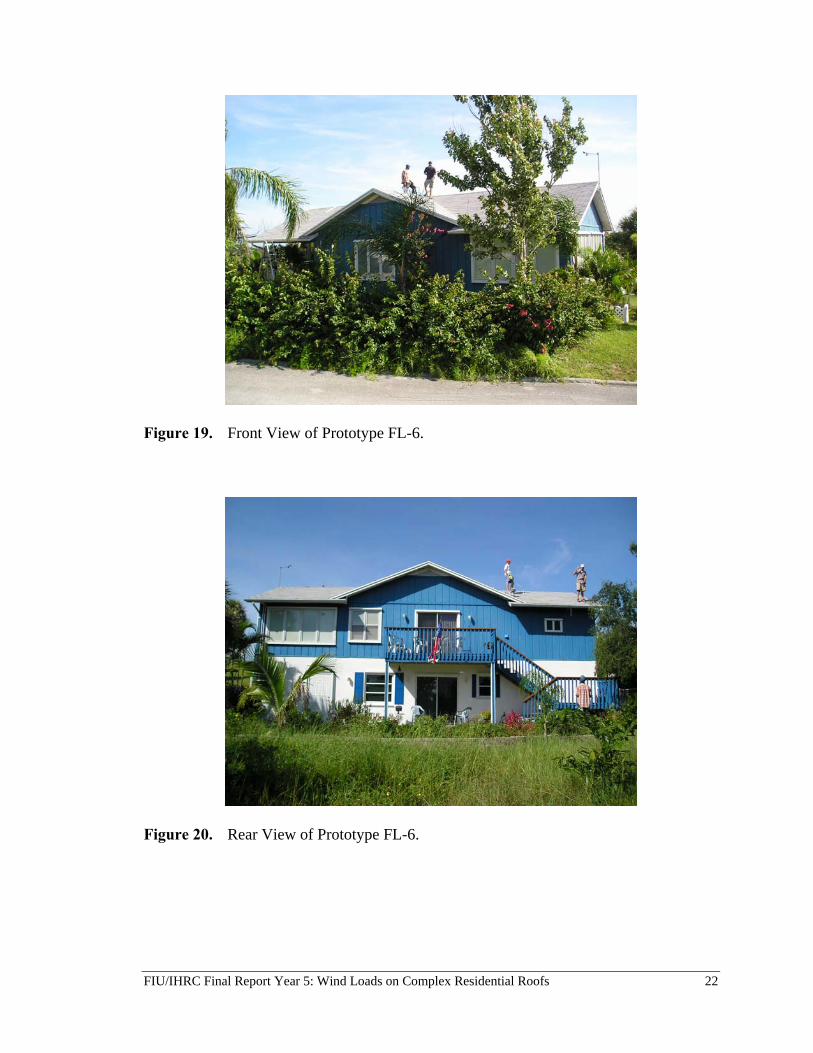
The FL-6 House is a single-story house with a walk out basement located on a hill approximately 1400 ft from the shoreline at Jenson Beach, Florida. FL-6 is located near the top of a hill and the house is elevated approximately 60 ft above sea level. The building measures approximately 52 ft by 28 ft in plan (Figure 18) and 14 ft 6 in. to the ridge as measured from the first floor elevation. The roof structure consists of inter-connected gable roof areas (Figure 19 and 20). There are many ornamental and deciduous trees within the neighborhood, ranging in height from 1 to 1.5 times the ridge height of FL-6. Chain-link fences and hedges separate some of the backyards of the neighboring yards. The neighboring houses are of similar height but vary in scale.
Figure 18. Roof Plan of Prototype FL-6 Showing Tap Locations.
FIU/IHRC Final Report Year 5: Wind Loads on Complex Residential Roofs 22
Figure 19. Front View of Prototype FL-6.
Figure 20. Rear View of Prototype FL-6.
FIU/IHRC Final Report Year 5: Wind Loads on Complex Residential Roofs 23
3.3.4 Prototype House FL-27
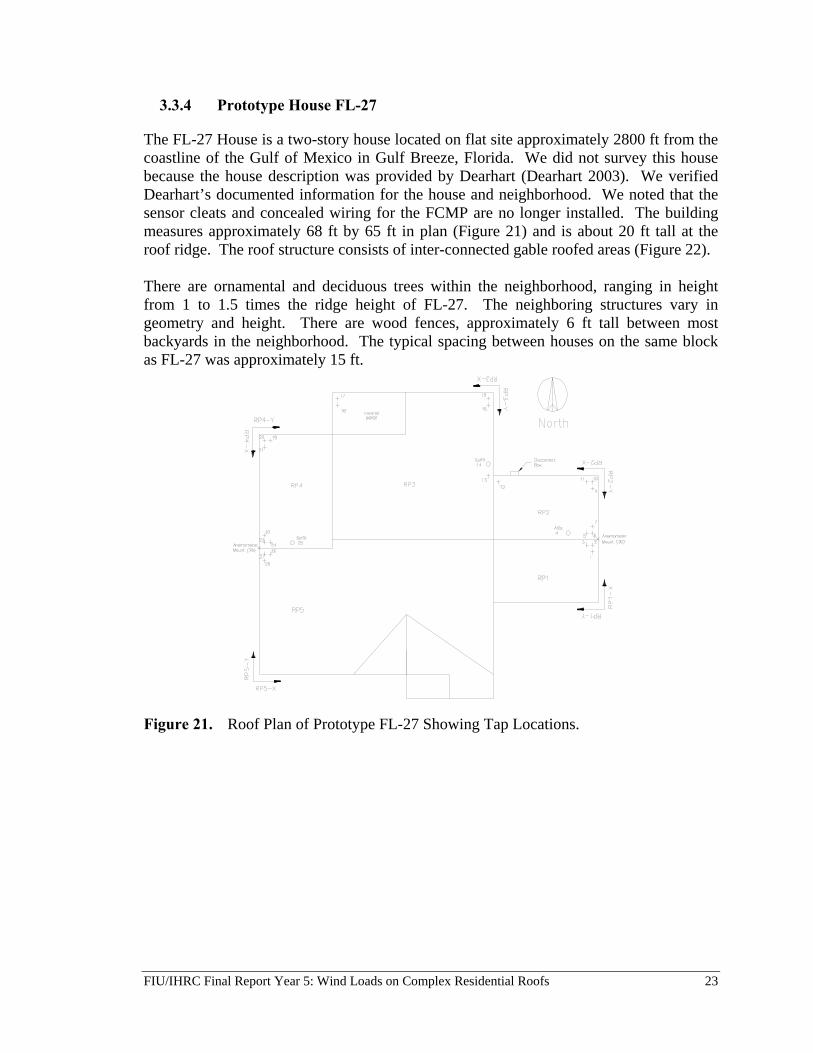
The FL-27 House is a two-story house located on flat site approximately 2800 ft from the coastline of the Gulf of Mexico in Gulf Breeze, Florida. We did not survey this house because the house description was provided by Dearhart (Dearhart 2003). We verified Dearhart’s documented information for the house and neighborhood. We noted that the sensor cleats and concealed wiring for the FCMP are no longer installed. The building measures approximately 68 ft by 65 ft in plan (Figure 21) and is about 20 ft tall at the roof ridge. The roof structure consists of inter-connected gable roofed areas (Figure 22). There are ornamental and deciduous trees within the neighborhood, ranging in height from 1 to 1.5 times the ridge height of FL-27. The neighboring structures vary in geometry and height. There are wood fences, approximately 6 ft tall between most backyards in the neighborhood. The typical spacing between houses on the same block as FL-27 was approximately 15 ft.
Figure 21. Roof Plan of Prototype FL-27 Showing Tap Locations.
FIU/IHRC Final Report Year 5: Wind Loads on Complex Residential Roofs 24
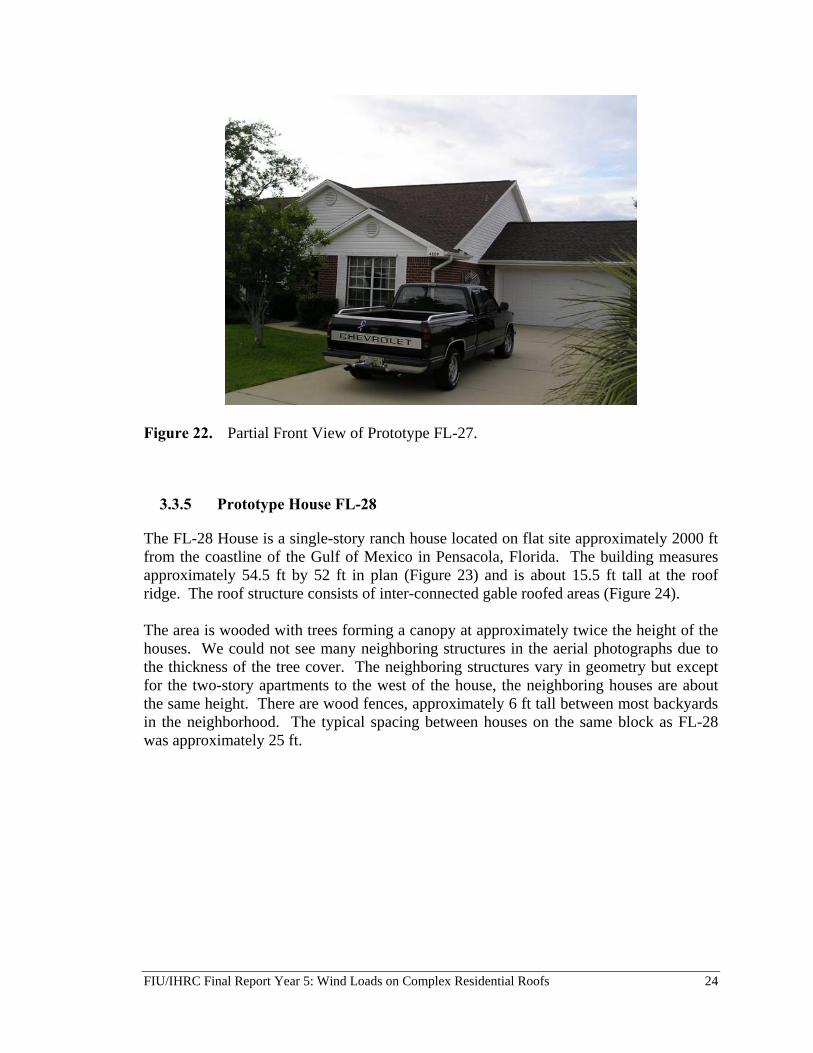
Figure 22. Partial Front View of Prototype FL-27.
3.3.5 Prototype House FL-28
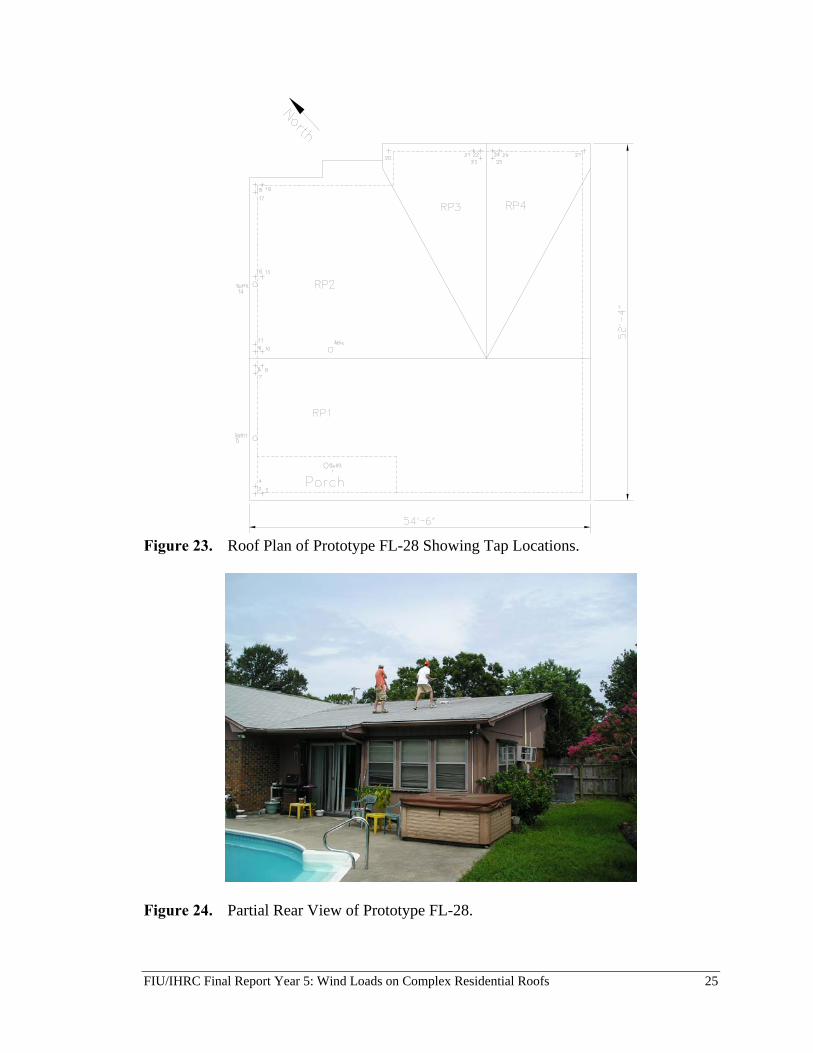
The FL-28 House is a single-story ranch house located on flat site approximately 2000 ft from the coastline of the Gulf of Mexico in Pensacola, Florida. The building measures approximately 54.5 ft by 52 ft in plan (Figure 23) and is about 15.5 ft tall at the roof ridge. The roof structure consists of inter-connected gable roofed areas (Figure 24). The area is wooded with trees forming a canopy at approximately twice the height of the houses. We could not see many neighboring structures in the aerial photographs due to the thickness of the tree cover. The neighboring structures vary in geometry but except for the two-story apartments to the west of the house, the neighboring houses are about the same height. There are wood fences, approximately 6 ft tall between most backyards in the neighborhood. The typical spacing between houses on the same block as FL-28 was approximately 25 ft.
FIU/IHRC Final Report Year 5: Wind Loads on Complex Residential Roofs 25
Figure 23. Roof Plan of Prototype FL-28 Showing Tap Locations.
Figure 24. Partial Rear View of Prototype FL-28.
FIU/IHRC Final Report Year 5: Wind Loads on Complex Residential Roofs 26
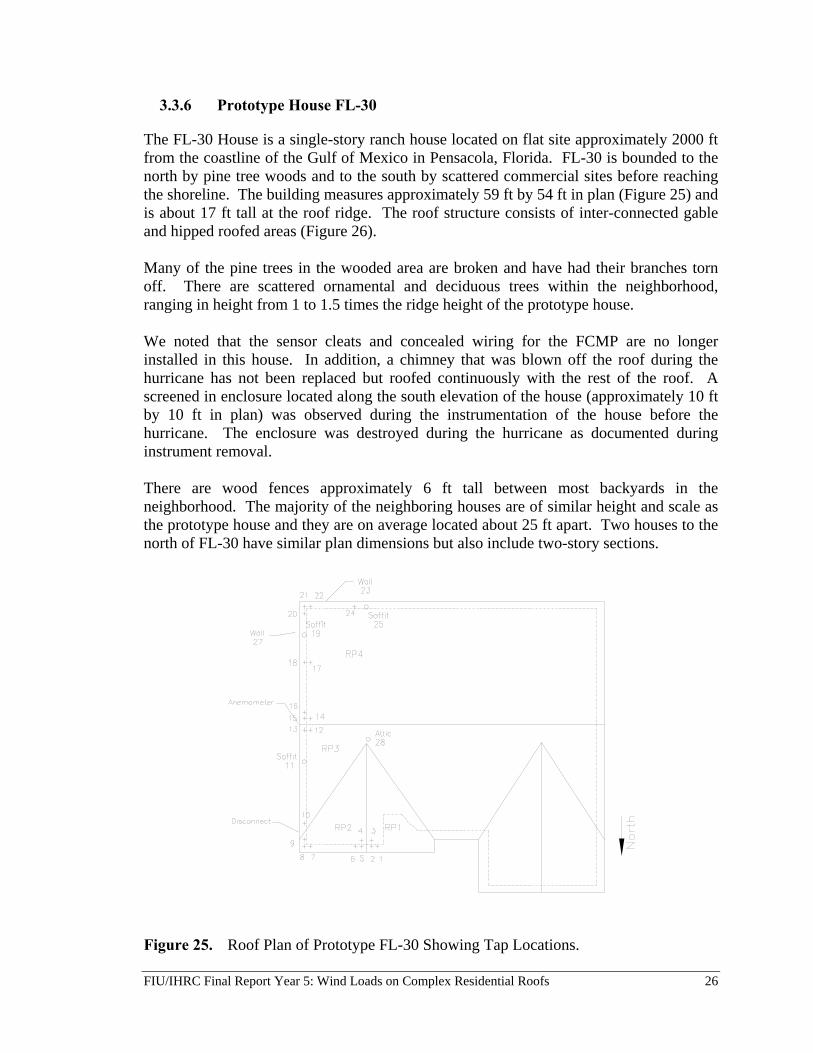
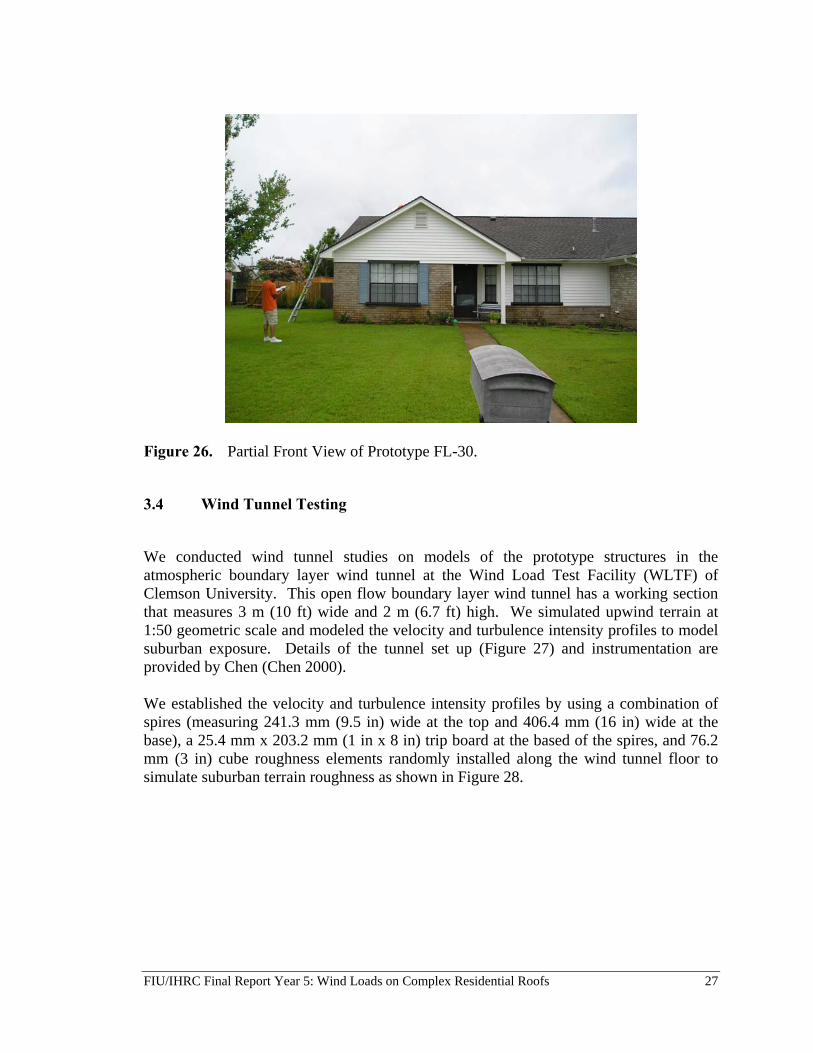
3.3.6 Prototype House FL-30
The FL-30 House is a single-story ranch house located on flat site approximately 2000 ft from the coastline of the Gulf of Mexico in Pensacola, Florida. FL-30 is bounded to the north by pine tree woods and to the south by scattered commercial sites before reaching the shoreline. The building measures approximately 59 ft by 54 ft in plan (Figure 25) and is about 17 ft tall at the roof ridge. The roof structure consists of inter-connected gable and hipped roofed areas (Figure 26). Many of the pine trees in the wooded area are broken and have had their branches torn off. There are scattered ornamental and deciduous trees within the neighborhood, ranging in height from 1 to 1.5 times the ridge height of the prototype house. We noted that the sensor cleats and concealed wiring for the FCMP are no longer installed in this house. In addition, a chimney that was blown off the roof during the hurricane has not been replaced but roofed continuously with the rest of the roof. A screened in enclosure located along the south elevation of the house (approximately 10 ft by 10 ft in plan) was observed during the instrumentation of the house before the hurricane. The enclosure was destroyed during the hurricane as documented during instrument removal. There are wood fences approximately 6 ft tall between most backyards in the neighborhood. The majority of the neighboring houses are of similar height and scale as the prototype house and they are on average located about 25 ft apart. Two houses to the north of FL-30 have similar plan dimensions but also include two-story sections.
Figure 25. Roof Plan of Prototype FL-30 Showing Tap Locations.
FIU/IHRC Final Report Year 5: Wind Loads on Complex Residential Roofs 27
Figure 26. Partial Front View of Prototype FL-30.
3.4 Wind Tunnel Testing
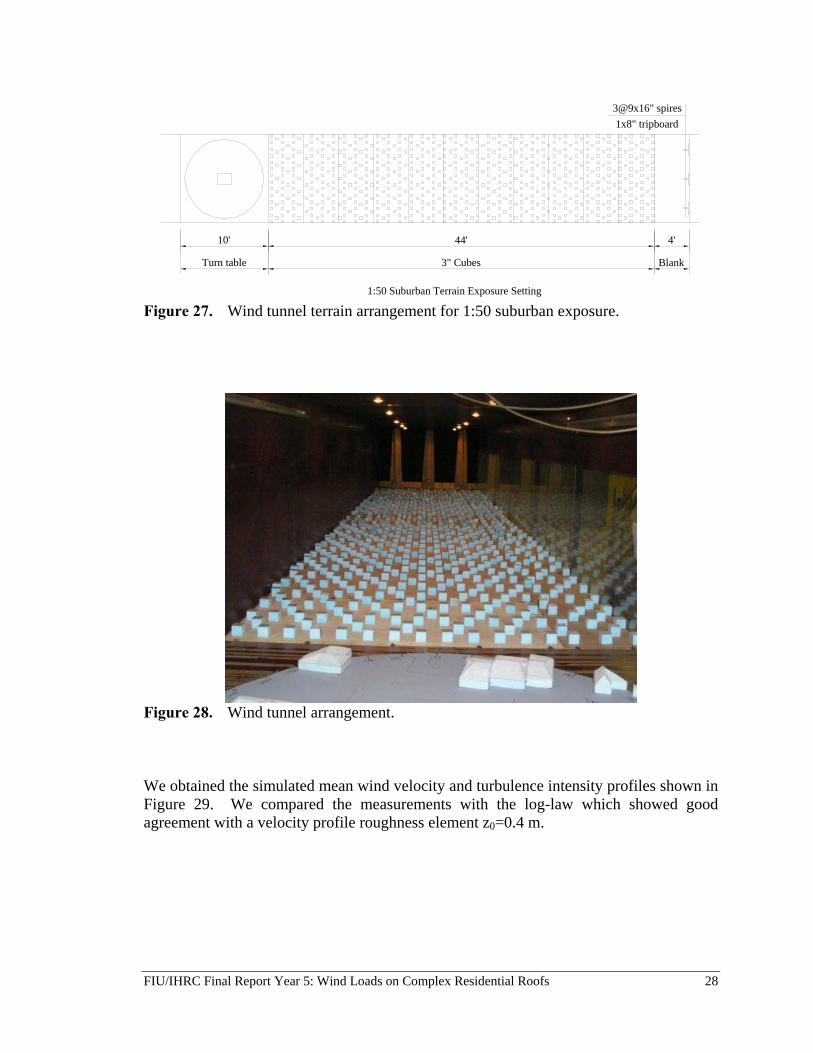
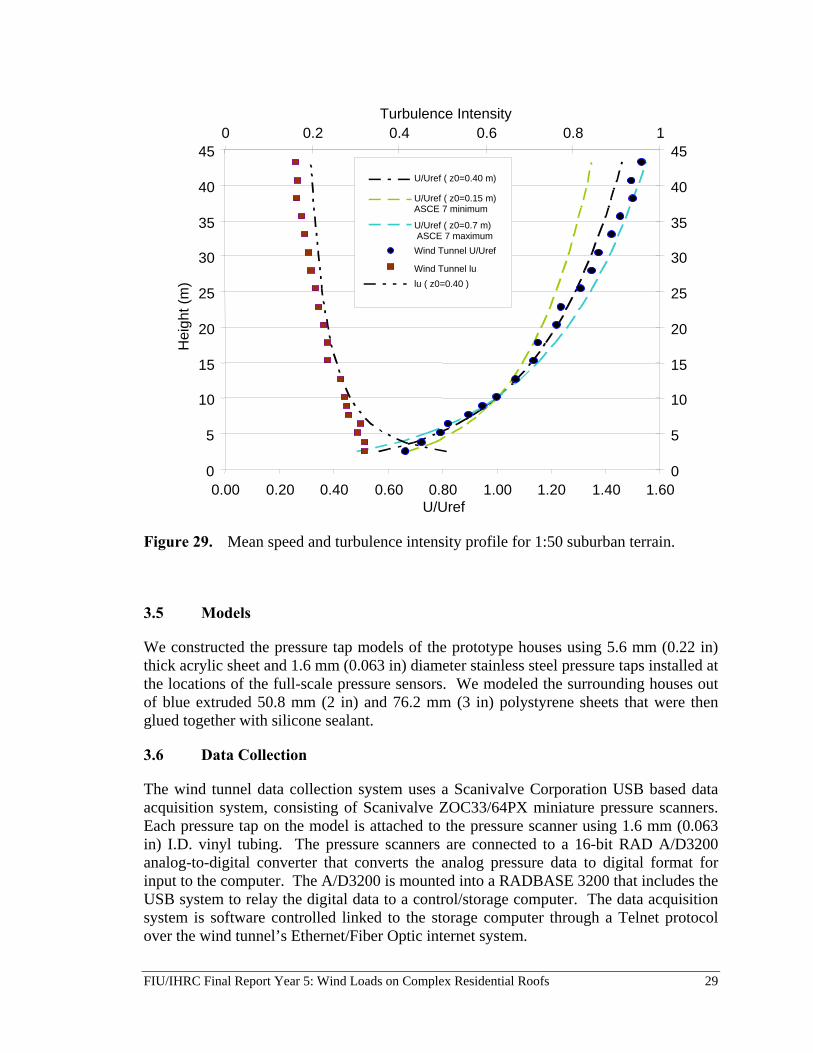
We conducted wind tunnel studies on models of the prototype structures in the atmospheric boundary layer wind tunnel at the Wind Load Test Facility (WLTF) of Clemson University. This open flow boundary layer wind tunnel has a working section that measures 3 m (10 ft) wide and 2 m (6.7 ft) high. We simulated upwind terrain at 1:50 geometric scale and modeled the velocity and turbulence intensity profiles to model suburban exposure. Details of the tunnel set up (Figure 27) and instrumentation are provided by Chen (Chen 2000). We established the velocity and turbulence intensity profiles by using a combination of spires (measuring 241.3 mm (9.5 in) wide at the top and 406.4 mm (16 in) wide at the base), a 25.4 mm x 203.2 mm (1 in x 8 in) trip board at the based of the spires, and 76.2 mm (3 in) cube roughness elements randomly installed along the wind tunnel floor to simulate suburban terrain roughness as shown in Figure 28.
FIU/IHRC Final Report Year 5: Wind Loads on Complex Residential Roofs 28
1:50 Suburban Terrain Exposure Setting
3@9x16" spires1x8" tripboard
10' 44' 4'
Turn table 3" Cubes Blank
Figure 27. Wind tunnel terrain arrangement for 1:50 suburban exposure.
Figure 28. Wind tunnel arrangement.
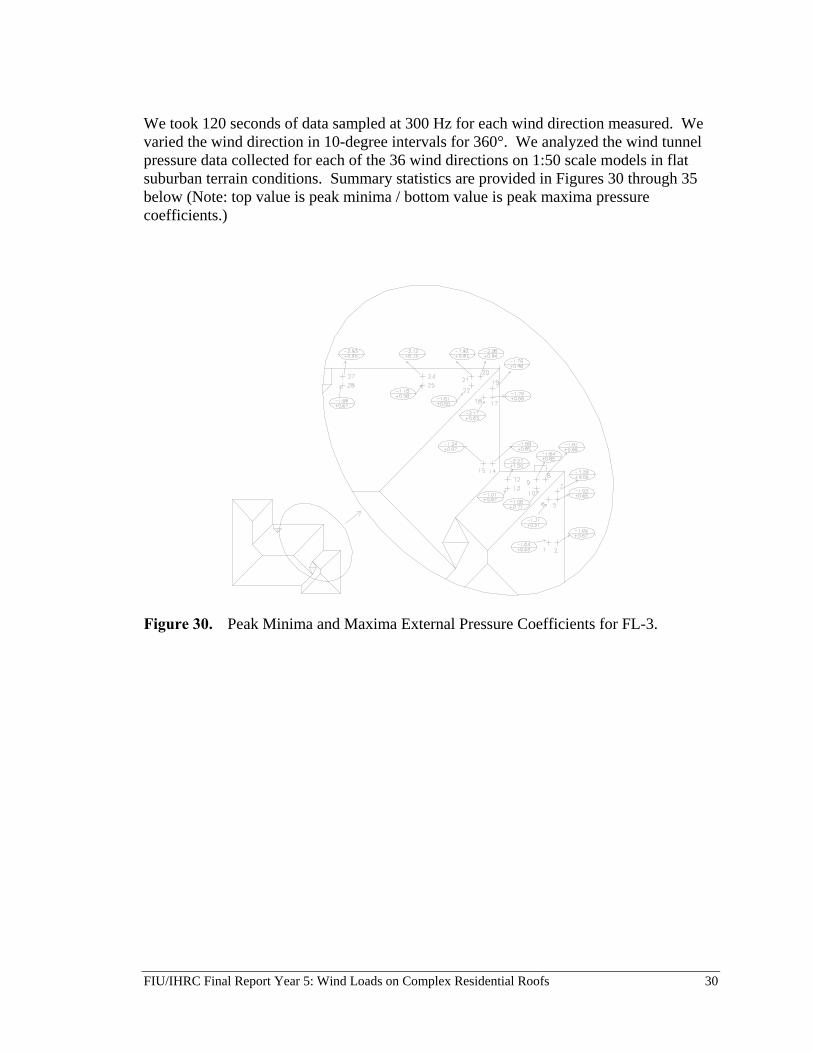
We obtained the simulated mean wind velocity and turbulence intensity profiles shown in Figure 29. We compared the measurements with the log-law which showed good agreement with a velocity profile roughness element z0=0.4 m.
FIU/IHRC Final Report Year 5: Wind Loads on Complex Residential Roofs 29
Figure 29. Mean speed and turbulence intensity profile for 1:50 suburban terrain.
3.5 Models
We constructed the pressure tap models of the prototype houses using 5.6 mm (0.22 in) thick acrylic sheet and 1.6 mm (0.063 in) diameter stainless steel pressure taps installed at the locations of the full-scale pressure sensors. We modeled the surrounding houses out of blue extruded 50.8 mm (2 in) and 76.2 mm (3 in) polystyrene sheets that were then glued together with silicone sealant.
3.6 Data Collection
The wind tunnel data collection system uses a Scanivalve Corporation USB based data acquisition system, consisting of Scanivalve ZOC33/64PX miniature pressure scanners. Each pressure tap on the model is attached to the pressure scanner using 1.6 mm (0.063 in) I.D. vinyl tubing. The pressure scanners are connected to a 16-bit RAD A/D3200 analog-to-digital converter that converts the analog pressure data to digital format for input to the computer. The A/D3200 is mounted into a RADBASE 3200 that includes the USB system to relay the digital data to a control/storage computer. The data acquisition system is software controlled linked to the storage computer through a Telnet protocol over the wind tunnel’s Ethernet/Fiber Optic internet system.
0
5
10
15
20
25
30
35
40
45
0.00 0.20 0.40 0.60 0.80 1.00 1.20 1.40 1.60U/Uref
0
5
10
15
20
25
30
35
40
450 0.2 0.4 0.6 0.8 1
Turbulence Intensity
U/Uref ( z0=0.40 m)
U/Uref ( z0=0.15 m) ASCE 7 minimum
U/Uref ( z0=0.7 m) ASCE 7 maximumWind Tunnel U/Uref
Wind Tunnel lulu ( z0=0.40 )
Hei
ght (
m)
FIU/IHRC Final Report Year 5: Wind Loads on Complex Residential Roofs 30
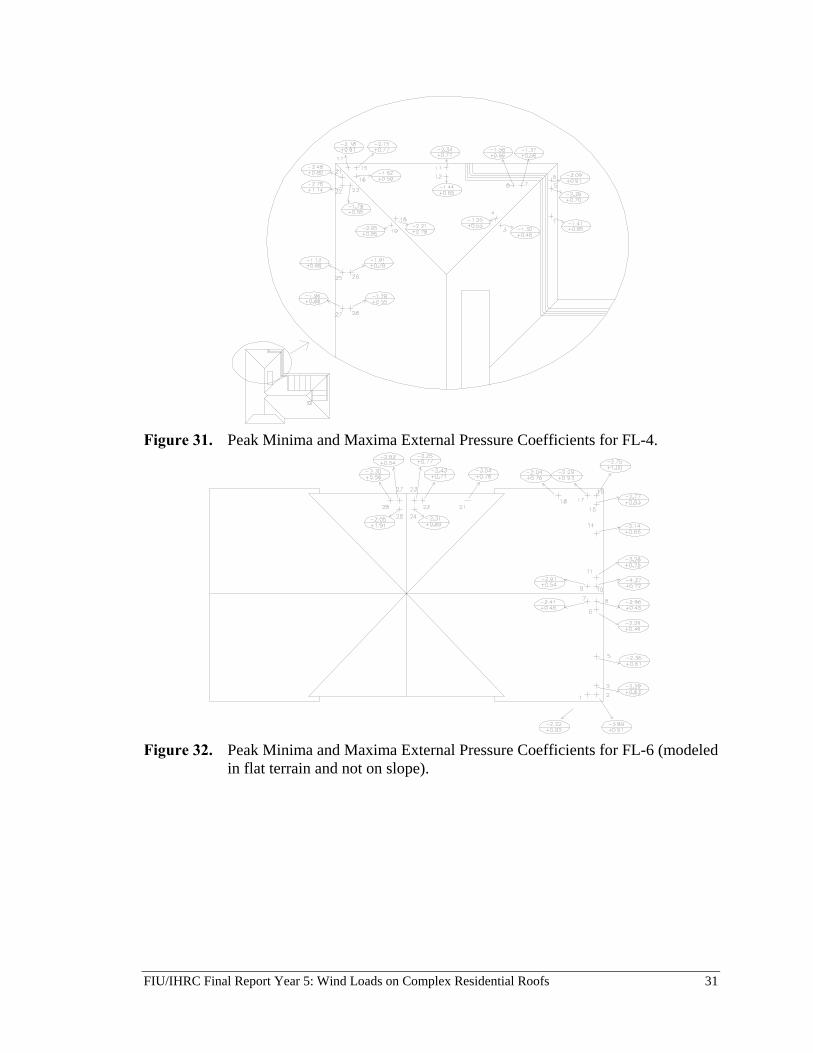
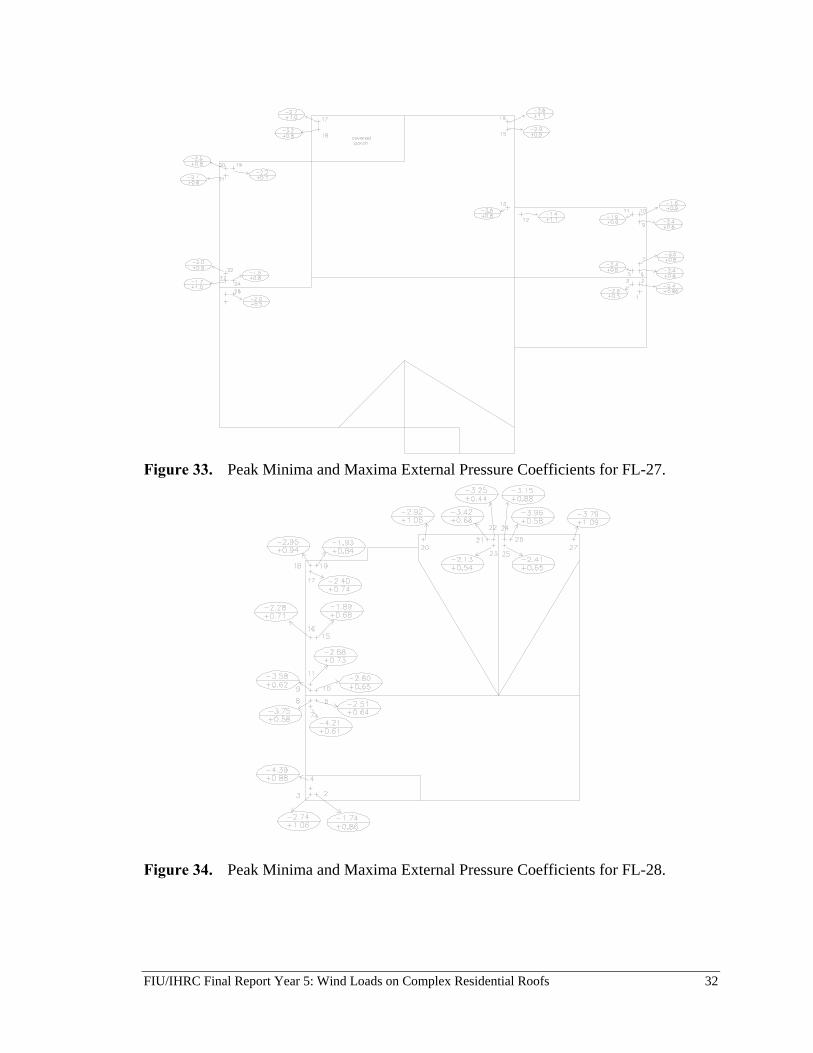
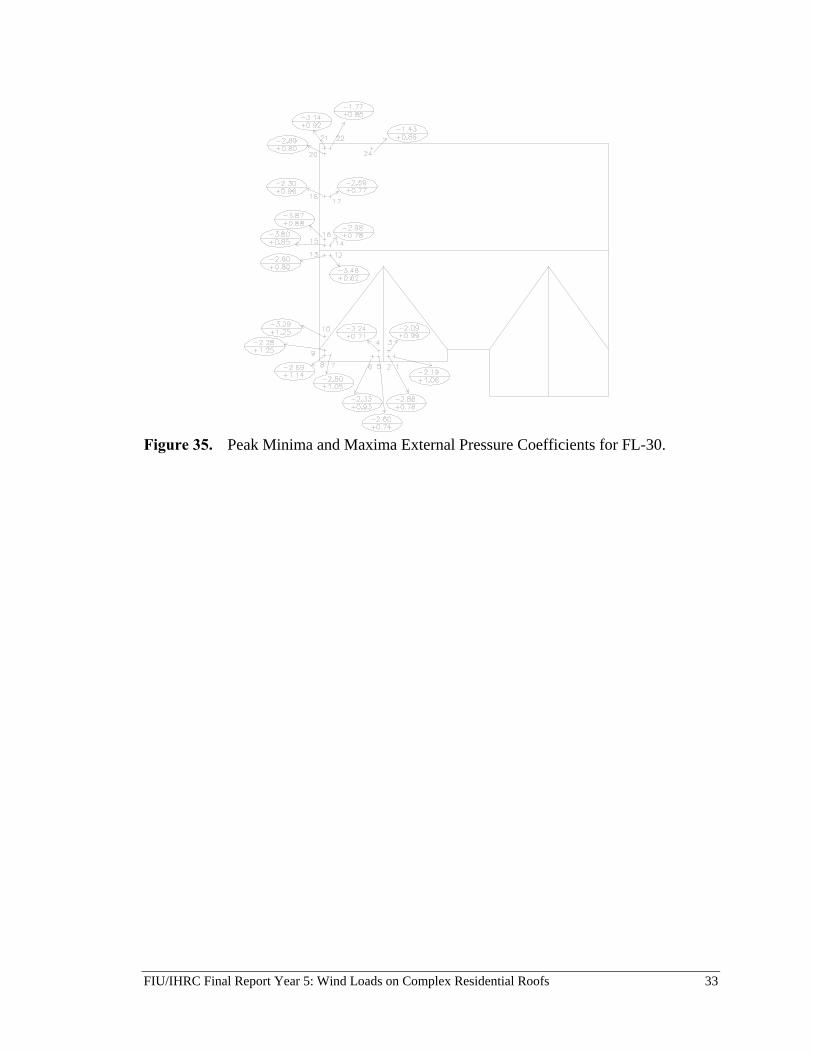
We took 120 seconds of data sampled at 300 Hz for each wind direction measured. We varied the wind direction in 10-degree intervals for 360°. We analyzed the wind tunnel pressure data collected for each of the 36 wind directions on 1:50 scale models in flat suburban terrain conditions. Summary statistics are provided in Figures 30 through 35 below (Note: top value is peak minima / bottom value is peak maxima pressure coefficients.)
Figure 30. Peak Minima and Maxima External Pressure Coefficients for FL-3.
FIU/IHRC Final Report Year 5: Wind Loads on Complex Residential Roofs 31
Figure 31. Peak Minima and Maxima External Pressure Coefficients for FL-4.
Figure 32. Peak Minima and Maxima External Pressure Coefficients for FL-6 (modeled
in flat terrain and not on slope).
FIU/IHRC Final Report Year 5: Wind Loads on Complex Residential Roofs 32
Figure 33. Peak Minima and Maxima External Pressure Coefficients for FL-27.
Figure 34. Peak Minima and Maxima External Pressure Coefficients for FL-28.
FIU/IHRC Final Report Year 5: Wind Loads on Complex Residential Roofs 33
Figure 35. Peak Minima and Maxima External Pressure Coefficients for FL-30.
FIU/IHRC Final Report Year 5: Wind Loads on Complex Residential Roofs 34
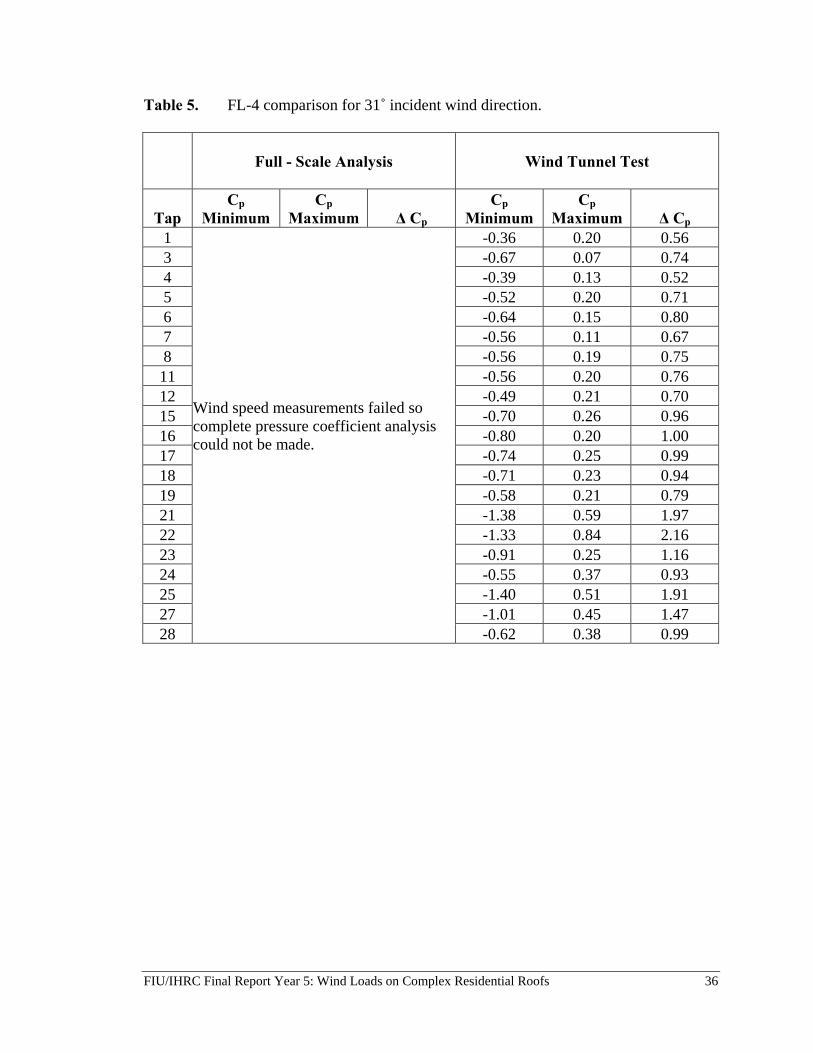
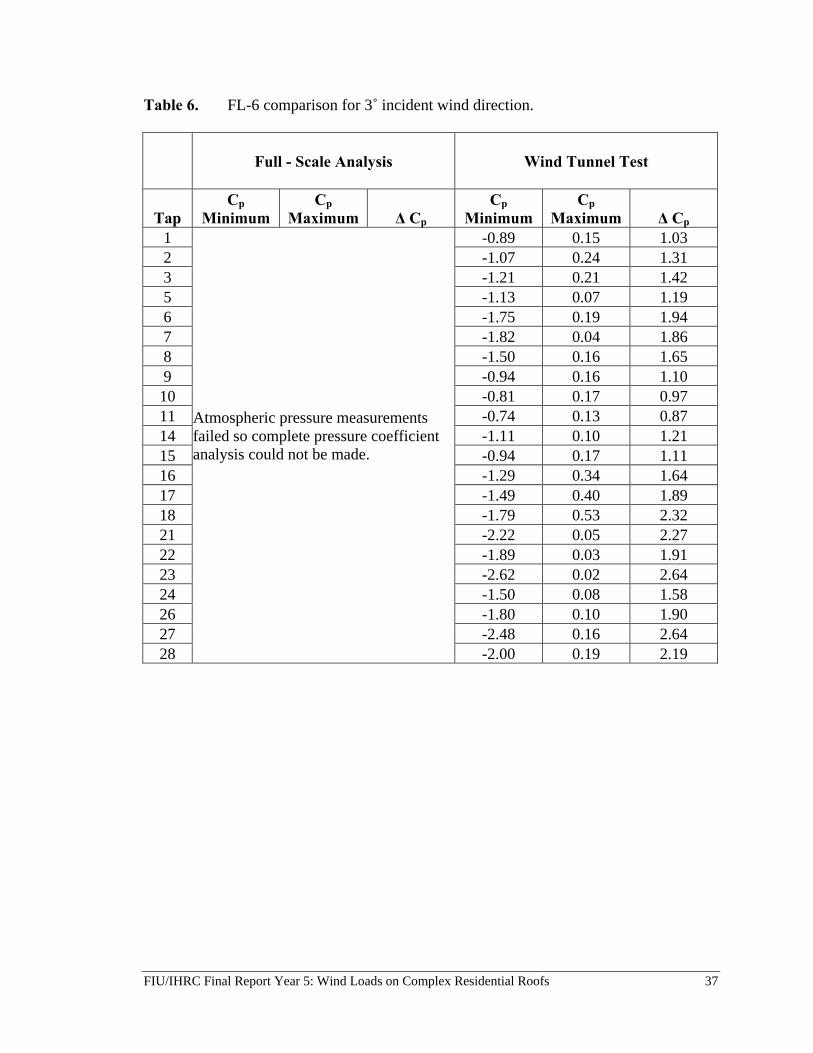
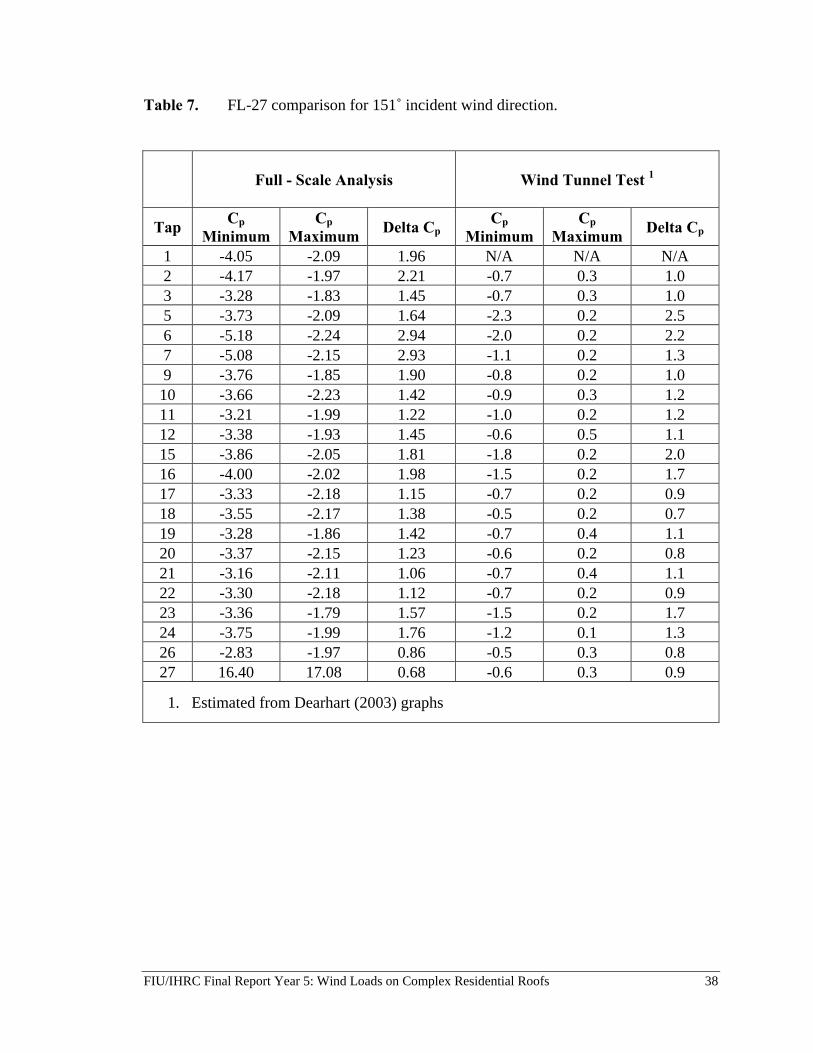
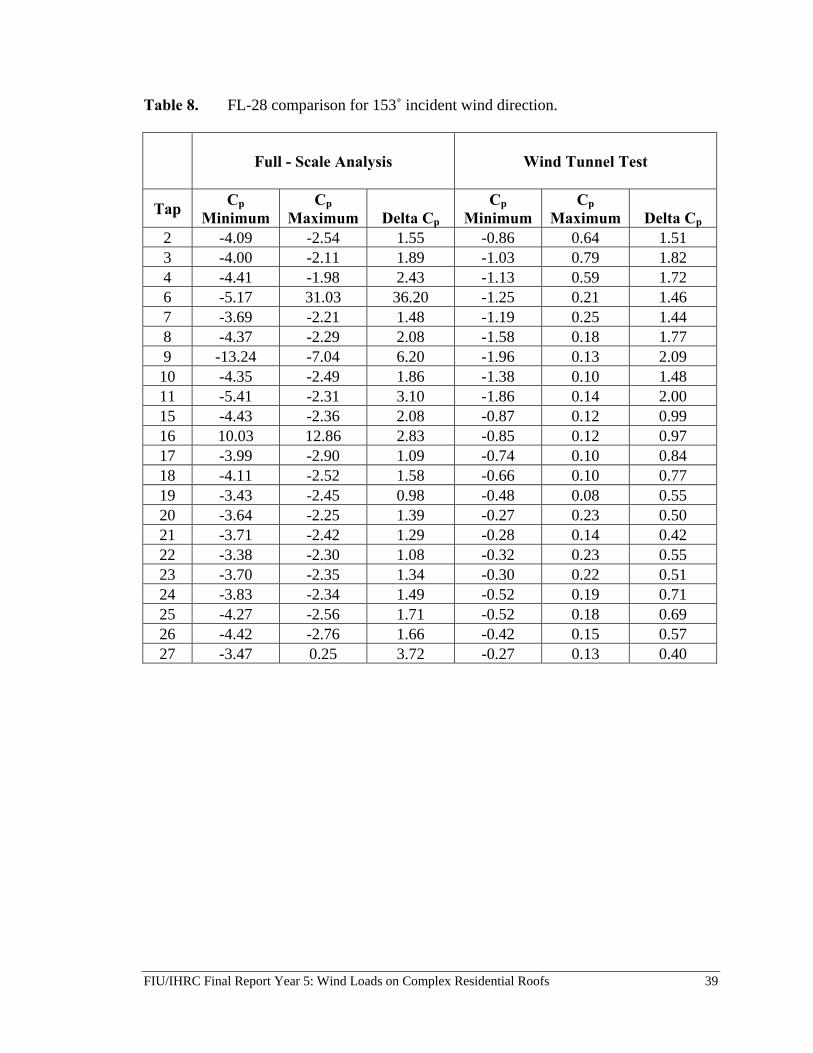
3.7 Comparison of Full-Scale and Model-Scale Pressure Data
The peak external measured minimum (negative) pressure coefficients from the full-scale data are compared to that of the model-scale tests for corresponding angle of attack in Tables 4 through 9 below. We were unable to calculate full-scale pressure coefficients for FL-3, FL-4, and FL-6 for two different reasons. FL-3 and FL-4 failed to record the wind speeds, and FL-6 failed to record the reference pressure. Without the wind speed, we are unable to calculate the velocity pressure. Without the reference pressure, we cannot adjust the absolute pressure values obtained from the instruments to provide accurate roof pressure coefficients without atmospheric pressure interference. The pressure coefficients from FL-27, FL-28, and FL-30 are not as accurate as they should be. We discovered during the analysis the importance of the sensor sensitivity factor. We do not currently know the sensitivity factors for each pressure sensor used on the houses. For this analysis, a theoretical sensitivity factor was used based on manufacturer specifications and previous sensitivity factors based on previous calibration of a limited number of pressure sensors. The values obtained from the sensors are dependent on temperature. We do not have temperature readings from any of the houses. The temperatures used in the analysis were obtained from the FCMP tower that was closest to the house during the storm. This gives a good estimate but is still not as accurate as it should be because of the potential time lag of temperature change between the tower and house locations.
FIU/IHRC Final Report Year 5: Wind Loads on Complex Residential Roofs 35
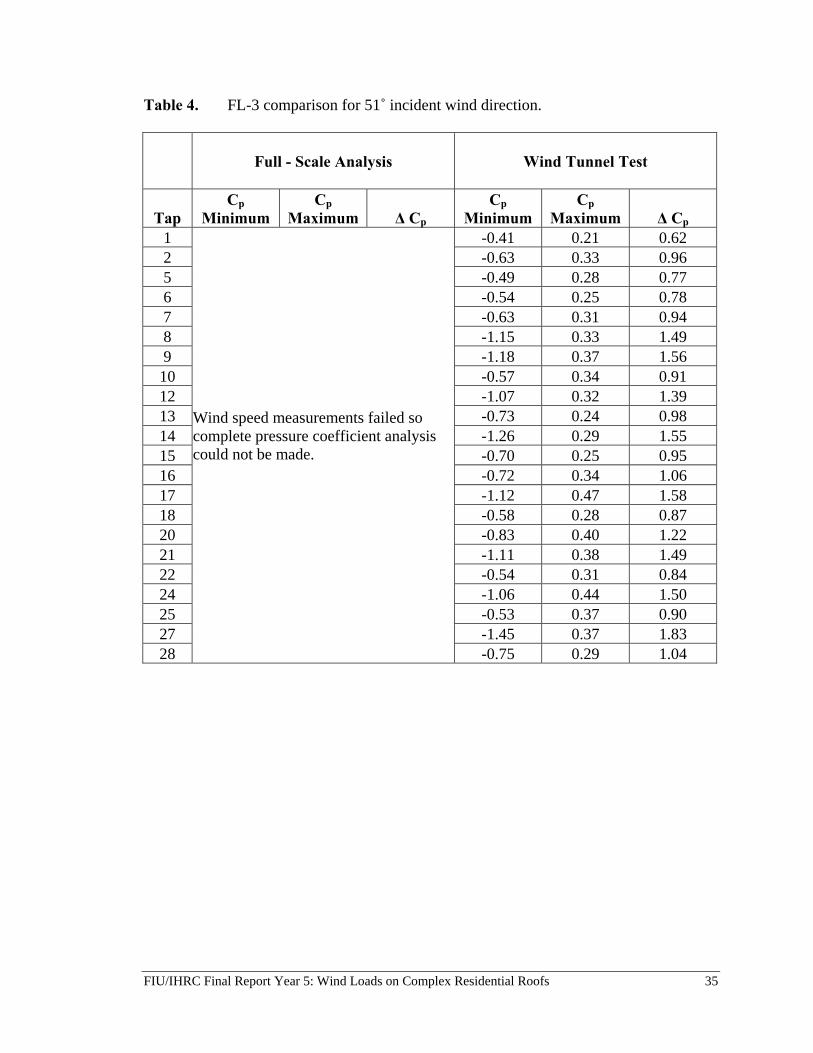
Table 4. FL-3 comparison for 51˚ incident wind direction.
Full - Scale Analysis
Wind Tunnel Test
Tap Cp
Minimum Cp
Maximum ∆ Cp Cp
Minimum Cp
Maximum ∆ Cp 1 -0.41 0.21 0.62 2 -0.63 0.33 0.96 5 -0.49 0.28 0.77 6 -0.54 0.25 0.78 7 -0.63 0.31 0.94 8 -1.15 0.33 1.49 9 -1.18 0.37 1.56 10 -0.57 0.34 0.91 12 -1.07 0.32 1.39 13 -0.73 0.24 0.98 14 -1.26 0.29 1.55 15 -0.70 0.25 0.95 16 -0.72 0.34 1.06 17 -1.12 0.47 1.58 18 -0.58 0.28 0.87 20 -0.83 0.40 1.22 21 -1.11 0.38 1.49 22 -0.54 0.31 0.84 24 -1.06 0.44 1.50 25 -0.53 0.37 0.90 27 -1.45 0.37 1.83 28
Wind speed measurements failed so complete pressure coefficient analysis could not be made.
-0.75 0.29 1.04
FIU/IHRC Final Report Year 5: Wind Loads on Complex Residential Roofs 36
Table 5. FL-4 comparison for 31˚ incident wind direction.
Full - Scale Analysis
Wind Tunnel Test
Tap Cp
Minimum Cp
Maximum ∆ Cp Cp
Minimum Cp
Maximum ∆ Cp 1 -0.36 0.20 0.56 3 -0.67 0.07 0.74 4 -0.39 0.13 0.52 5 -0.52 0.20 0.71 6 -0.64 0.15 0.80 7 -0.56 0.11 0.67 8 -0.56 0.19 0.75 11 -0.56 0.20 0.76 12 -0.49 0.21 0.70 15 -0.70 0.26 0.96 16 -0.80 0.20 1.00 17 -0.74 0.25 0.99 18 -0.71 0.23 0.94 19 -0.58 0.21 0.79 21 -1.38 0.59 1.97 22 -1.33 0.84 2.16 23 -0.91 0.25 1.16 24 -0.55 0.37 0.93 25 -1.40 0.51 1.91 27 -1.01 0.45 1.47 28
Wind speed measurements failed so complete pressure coefficient analysis could not be made.
-0.62 0.38 0.99
FIU/IHRC Final Report Year 5: Wind Loads on Complex Residential Roofs 37
Table 6. FL-6 comparison for 3˚ incident wind direction.
Full - Scale Analysis
Wind Tunnel Test
Tap Cp
Minimum Cp
Maximum ∆ Cp Cp
Minimum Cp
Maximum ∆ Cp 1 -0.89 0.15 1.03 2 -1.07 0.24 1.31 3 -1.21 0.21 1.42 5 -1.13 0.07 1.19 6 -1.75 0.19 1.94 7 -1.82 0.04 1.86 8 -1.50 0.16 1.65 9 -0.94 0.16 1.10 10 -0.81 0.17 0.97 11 -0.74 0.13 0.87 14 -1.11 0.10 1.21 15 -0.94 0.17 1.11 16 -1.29 0.34 1.64 17 -1.49 0.40 1.89 18 -1.79 0.53 2.32 21 -2.22 0.05 2.27 22 -1.89 0.03 1.91 23 -2.62 0.02 2.64 24 -1.50 0.08 1.58 26 -1.80 0.10 1.90 27 -2.48 0.16 2.64 28
Atmospheric pressure measurements failed so complete pressure coefficient analysis could not be made.
-2.00 0.19 2.19
FIU/IHRC Final Report Year 5: Wind Loads on Complex Residential Roofs 38
Table 7. FL-27 comparison for 151˚ incident wind direction.
Full - Scale Analysis
Wind Tunnel Test 1
Tap Cp Minimum
Cp Maximum Delta Cp Cp
Minimum Cp
Maximum Delta Cp
1 -4.05 -2.09 1.96 N/A N/A N/A 2 -4.17 -1.97 2.21 -0.7 0.3 1.0 3 -3.28 -1.83 1.45 -0.7 0.3 1.0 5 -3.73 -2.09 1.64 -2.3 0.2 2.5 6 -5.18 -2.24 2.94 -2.0 0.2 2.2 7 -5.08 -2.15 2.93 -1.1 0.2 1.3 9 -3.76 -1.85 1.90 -0.8 0.2 1.0 10 -3.66 -2.23 1.42 -0.9 0.3 1.2 11 -3.21 -1.99 1.22 -1.0 0.2 1.2 12 -3.38 -1.93 1.45 -0.6 0.5 1.1 15 -3.86 -2.05 1.81 -1.8 0.2 2.0 16 -4.00 -2.02 1.98 -1.5 0.2 1.7 17 -3.33 -2.18 1.15 -0.7 0.2 0.9 18 -3.55 -2.17 1.38 -0.5 0.2 0.7 19 -3.28 -1.86 1.42 -0.7 0.4 1.1 20 -3.37 -2.15 1.23 -0.6 0.2 0.8 21 -3.16 -2.11 1.06 -0.7 0.4 1.1 22 -3.30 -2.18 1.12 -0.7 0.2 0.9 23 -3.36 -1.79 1.57 -1.5 0.2 1.7 24 -3.75 -1.99 1.76 -1.2 0.1 1.3 26 -2.83 -1.97 0.86 -0.5 0.3 0.8 27 16.40 17.08 0.68 -0.6 0.3 0.9
1. Estimated from Dearhart (2003) graphs
FIU/IHRC Final Report Year 5: Wind Loads on Complex Residential Roofs 39
Table 8. FL-28 comparison for 153˚ incident wind direction.
Full - Scale Analysis
Wind Tunnel Test
Tap Cp Minimum
Cp Maximum Delta Cp
Cp Minimum
Cp Maximum Delta Cp
2 -4.09 -2.54 1.55 -0.86 0.64 1.51 3 -4.00 -2.11 1.89 -1.03 0.79 1.82 4 -4.41 -1.98 2.43 -1.13 0.59 1.72 6 -5.17 31.03 36.20 -1.25 0.21 1.46 7 -3.69 -2.21 1.48 -1.19 0.25 1.44 8 -4.37 -2.29 2.08 -1.58 0.18 1.77 9 -13.24 -7.04 6.20 -1.96 0.13 2.09 10 -4.35 -2.49 1.86 -1.38 0.10 1.48 11 -5.41 -2.31 3.10 -1.86 0.14 2.00 15 -4.43 -2.36 2.08 -0.87 0.12 0.99 16 10.03 12.86 2.83 -0.85 0.12 0.97 17 -3.99 -2.90 1.09 -0.74 0.10 0.84 18 -4.11 -2.52 1.58 -0.66 0.10 0.77 19 -3.43 -2.45 0.98 -0.48 0.08 0.55 20 -3.64 -2.25 1.39 -0.27 0.23 0.50 21 -3.71 -2.42 1.29 -0.28 0.14 0.42 22 -3.38 -2.30 1.08 -0.32 0.23 0.55 23 -3.70 -2.35 1.34 -0.30 0.22 0.51 24 -3.83 -2.34 1.49 -0.52 0.19 0.71 25 -4.27 -2.56 1.71 -0.52 0.18 0.69 26 -4.42 -2.76 1.66 -0.42 0.15 0.57 27 -3.47 0.25 3.72 -0.27 0.13 0.40
FIU/IHRC Final Report Year 5: Wind Loads on Complex Residential Roofs 40
Table 9. FL-30 comparison for 140˚ incident wind direction.
Full - Scale Analysis
Wind Tunnel Test
Tap Cp
Minimum Cp
Maximum Delta Cp Cp
Minimum Cp
Maximum Delta Cp 1 -2.44 -0.41 2.03 -0.70 0.10 0.80 2 -2.45 -0.36 2.09 -1.04 0.15 1.18 3 -2.43 -0.36 2.07 -1.01 0.23 1.24 4 -2.44 -0.41 2.03 -0.63 0.41 1.05 5 -2.43 -0.37 2.06 -0.49 0.35 0.84 6 -2.37 -0.34 2.03 -0.51 0.36 0.88 7 -2.43 -0.39 2.04 -0.75 0.36 1.11 8 -2.41 -0.36 2.05 -0.86 0.48 1.34 9 -2.39 -0.36 2.03 -0.98 0.55 1.53 10 -2.70 -0.51 2.19 -2.13 0.43 2.56 12 -2.90 -0.53 2.37 -2.28 0.11 2.39 13 -2.66 -0.48 2.18 -1.93 0.03 1.96 14 -2.58 -0.33 2.24 -1.62 0.36 1.99 15 -2.57 -0.40 2.18 -1.71 0.28 1.99 16 -2.18 -0.11 2.07 -1.43 0.29 1.72 17 -2.50 -0.31 2.19 -1.20 0.45 1.65 18 -2.37 -0.28 2.09 -1.38 0.44 1.82 20 -2.35 -0.29 2.06 -1.73 0.50 2.23 21 -2.37 -0.29 2.08 -1.99 0.51 2.50 22 4.94 6.97 2.03 -0.91 0.52 1.43
FIU/IHRC Final Report Year 5: Wind Loads on Complex Residential Roofs 41
4. CONCLUSIONS
This study addressing the wind loads on complex roof shapes of buildings in suburban terrain provides results for the full-scale pressure data collected during Hurricanes Frances and Ivan in 2004. The comparison with wind tunnel data, although preliminary, demonstrates the feasibility of validation studies for determining actual wind loads on buildings. Our results show that the range of peak-minima to peak-maxima pressure coefficients obtained at full-scale are of similar magnitudes to our wind tunnel studies for the same wind direction. However, the absolute peak minimum values are shifted lower than the values of the wind tunnel results, suggesting that a discrepancy exists in our assumptions used for this analysis. To reiterate, we made the following assumptions:
• voltage sensitivity of 34.0 psf/V, with zero offset for each sensor • voltage sensitivity of 20.0 psf/V for barometric pressure sensors
We suspect that our selection of instrument sensitivity for barometric pressure and for the roof sensors may account for some of the observed shift in full-scale pressure coefficients away from the wind tunnel results. These results and comparisons will need to be revisited once the post-storm calibrations of the sensors are completed. Challenges still exist in data collection of the full-scale results. Future experiments will require more robust procedures to ensure the reliability of instrumentation. Collecting pressure data on houses in hurricanes requires that instrumentation be set up a scant 6 to 8 hours prior to the storm; and at present, there is no provision to monitor or adjust the process. Collecting hurricane induced wind pressures on houses introduces significantly more complications than previous full-scale pressure experiments on buildings. Whereas the previous full-scale tests used experimental structures specifically set up for long-term data acquisition, this data acquisition method requires compromises in order to arrange equipment on occupied buildings at short notice. Working with occupied houses introduced another challenge of maintaining the integrity of the building envelope systems during and after the storms. Thus far, we have derived wind pressure coefficients for buildings exposed to hurricane-force winds; none of the houses experienced a design wind event. These values are preliminary and are likely to be modified in ongoing research.
FIU/IHRC Final Report Year 5: Wind Loads on Complex Residential Roofs 42
REFERENCES
Levitan, Marc. L, and Kishor C. Mehta “Texas Tech field experiments for wind loads
part 1: building and pressure measuring system,” Journal of Wind Engineering and Industrial Aerodynamics, 41-44 (1992), pp. 1565-1575.
Holmes, J. D. “Comparison of Model and Full-Scale Tests of the Aylesbury House,”
Wind Tunnel Modeling for Civil Engineering Applications, Proceedings of International Workshop on Wind Tunnel Modeling Criteria and Techniques in Civil Engineering Applications, Gaithersburg, MD, 1982, pp. 605-618.
Masters, F, Gurley, K and Reinhold, T (2003). “Ground level wind characteristics of
Isidore and Dennis”, 11th International Conference on Wind Engineering, Lubbock, Texas, June 2-5, 2003.
Liu, Z., D. Prevatt, E. Dearhart, T. Reinhold, K. Gurley, and F. Masters, “Wind Load on
Components and Cladding for Houses in Coastal Suburban Areas,” Proceedings of Americas Conference on Wind Engineering – 2005, Baton Rouge, LA, May 31-June 4, 2005.
ASCE 7 (2002) “Minimum Design Loads for Buildings and Other Structures,” American
Society of Civil Engineers, Reston, Virginia. Dearhart, E., “Comparison Of Field And Model Wind Pressures On Residential Buildings
In Tropical Storm Winds,” Master of Science Thesis, Department of Civil Engineering, Clemson University, Clemson, SC, 2003.
Michot, B. J., “Full-Scale Wind Pressure Measurement Utilizing Unobtrusive Absolute
Pressure Transducer Technology,” Master of Science Thesis, Clemson University, Department of Civil Engineering, 1999.
Applied Research Associates, “Comparisons Of Modeled And Observed Wind Speeds
For Hurricanes Charley, Frances, Jeanne, And Ivan,” Report by Applied Research Associates, Raleigh, NC, 2005.
Terraserver, www.terraserver.microsoft.com, 2005. Chen, M., “Characterization Of Wind Pressure Fluctuations On A Gable Roof House,”
Doctorate of Philosophy Civil Engineering, Department of Civil Engineering, Clemson University, Clemson, SC, 2000.
FIU/IHRC Final Report Year 5: Wind Loads on Complex Residential Roofs 43
Report Submitted to the International Hurricane Research Center Dr. David O. Prevatt Wind Load Test Facility Department of Civil Engineering Clemson University Lowry Hall Clemson, South Carolina 29634-0911 * This research was conducted by a team of faculty and students from Clemson University: Russell Carter, Zhuzhao, Bo Cui and Peter Datin