Tensioned Flat Slab Vs Conventional Slab - International ...
Upload
khangminh22Category
view
2download
0
STRUCTURAL ENGINEERS ASSOCIATION OF CALIFORNIA
Wind loads on low profile solar photovoltaic systems on flat roofs Report SEAOC PV2
DRAFT 28 March 2012
Page 1
WIND LOADS ON LOW PROFILE SOLAR
PHOTOVOLTAIC SYSTEMS ON FLAT ROOFS
Prepared by SEAOC Wind Subcommittee on Solar Photovoltaic Systems Report SEAOC PV2 DRAFT 28 March 2012
STRUCTURAL ENGINEERS ASSOCIATION OF CALIFORNIA
Wind loads on low profile solar photovoltaic systems on flat roofs Report SEAOC PV2
DRAFT 28 March 2012
Page 2
Board of Directors, 2011-2012
Douglas Hohbach, President*
Jim Amundson, President Elect* Janah Risha, Secretary
Bradley Lowe, Treasurer*
Stephen Pelham, Past President*
Don Schinske, Executive Director*
*Executive Committee
Kelly Cobeen, Director
Jeff Crosier, Director*
Diane Gould, Director
Grace Kang, Director
Zubaid Karim, Director
Joe LaBrie, Director
Peter Lee, Director
Jeffrey Marchant, Director
Michael West, Director
Disclaimer
Documents produced by the Structural Engineers Association of California (SEAOC) are published as part of our
association’s educational program. While the information presented in the document is believed to be correct, neither
SEAOC nor its Board, committees, writers, editors, or individuals who have contributed to this document make any
warranty, expressed or implied, or assume any legal liability or responsibility for the use, application of, and/or reference
to opinions, findings, conclusions, or recommendations expressed herein. The material presented in this document should
not be used or relied upon for any specific application without competent examination and verification of its accuracy,
suitability, and applicability by qualified professionals. Users of information from this document assume all liability
arising from such use.
Structural Engineers Association of California
© 2012 SEAOC
All rights reserved. This document or any part thereof may not be reproduced in any form without the written permission
of the Structural Engineers Association of California.
STRUCTURAL ENGINEERS ASSOCIATION OF CALIFORNIA
1020 12th Street, Suite 303
Sacramento, CA 95814
Phone: (916) 447-1198
Fax: (916) 444-1501
Email: [email protected]
http://www.seaoc.org

STRUCTURAL ENGINEERS ASSOCIATION OF CALIFORNIA
Wind loads on low profile solar photovoltaic systems on flat roofs Report SEAOC PV2
DRAFT 28 March 2012
Page 3
Wind loads on low profile solar photovoltaic systems on flat roofs
These guidelines were written by the SEAOC Solar Photovoltaic Systems Committee, a subcommittee of the SEAOC
Wind Committee.
SEAOC Solar Photovoltaic Systems Committee
Voting Members
Ron LaPlante (Chair) DSA
Joe Maffei (Vice Chair) Rutherford & Chekene
Joe Cain, Solar City
James S. Lai, S.E.
Ken Luttrell, CYS Structural Engineering
Shane Noel, KPFF Consulting Engineers, Inc.
Gary Searer, Wiss Janney Elstner & Assoc.
Norm Scheel, Norman Scheel Structural Engineer
Mason Walters, Forell/Elsesser Engineers
Rob Ward, SunLink
Corresponding Members
Geoff Bomba, Forell/Elsesser Engineers
John Harvey, Buehler & Buehler
Don Scott, NCSEA Wind Committee Chair
Associate Members
David Banks, CPP
Steve Bauer, Unirac
Pete Fischer, DSA
Ajay Friesen, Sunpower
Mark Gies, Panel Claw
Rick Hanson, Solar City
Kurt Johnson, DSA Advisory Board
Gregory Kopp, University of Western Ontario
Jonathan Lam, LA County
Tim Reinhold, Institute for Business & Home Safety
Karl Telleen, Rutherford & Chekene
Philip Yin, City of Long Beach
Osama Younan, City of LA
SEAOC Wind Committee 2011-2012
Ken Luttrell (Chair), CYS Structural Engineering
Stephen Kerr, Josephson-Werdowatz & Associates, Inc.
Scott Markle, Los Angeles World Airports
Brent Nuttall, Nabih Youssef & Associates
James S. Lai, S.E.
Dick Phillips, S.E.
James Sadler, Jasco Pacific Inc
Norm Scheel, Norman Scheel Structural Engineer
Gary Searer, Wiss Janney Elstner & Assoc.

STRUCTURAL ENGINEERS ASSOCIATION OF CALIFORNIA
Wind loads on low profile solar photovoltaic systems on flat roofs Report SEAOC PV2
DRAFT 28 March 2012
Page 4
Table of Contents
Section page
Disclaimer 2
Committee Members 3
1. Preface
2. Abstract
3. Introduction
4. Prescriptive GCn Values for Solar Arrays Mounted on Flat Roofs
4.1. Code Figure
4.2. Commentary
4.2.1. Procedure to Using Wind Load Figure
4.2.2. Wind Flow Characteristics on Roofs
4.2.3. Development of Wind Loading Figure Based on ASCE 7
4.2.3.1. General
4.2.3.2. Zoning
4.2.3.3. Building Edge and Parapet Effects
4.2.3.4. Net Pressure Coefficient, GCn
4.2.3.5. Module Shielding in an Array
4.2.3.6. Design of Roof Supporting Solar Array
5. Effective Wind Area
6. Wind Tunnel Test per ASCE 7
7. Acknowledgements
8. References
Appendix A: Example Calculation

STRUCTURAL ENGINEERS ASSOCIATION OF CALIFORNIA
Wind loads on low profile solar photovoltaic systems on flat roofs Report SEAOC PV2
DRAFT 28 March 2012
Page 5
1. Preface:
This document was developed by the Structural Engineering Association of California’s (SEAOC) Solar Photovoltaic Systems Committee, a subcommittee of the SEAOC Wind Committee.
2. Abstract:
The design wind loads for solar photovoltaic arrays on flat roof low-rise buildings are not covered by the prescriptive methods contained ASCE 7 “Minimum Design Loads for Buildings and Other Structures”. This paper describes the wind flow characteristics on rooftop solar photovoltaic (PV) panels and the development of this information into a figure similar to that used in the prescriptive methods contained in ASCE 7 using the same design methodology. The requirements for wind tunnel studies, effective wind area computation, and the wind loads on the roof itself are also addressed.
3. Introduction:
In the absence of detailed guidance from ASCE 7 for wind loads on PV arrays on flat roof low-rise buildings, often designers attempt to use a hybrid approach of the ASCE 7 components and cladding tables for enclosed buildings and main force resisting system tables for open structures or they use the wind tunnel procedure of ASCE 7. The hybrid approach can lead to unconservative results, particularly when considering the size of the edge and corner roof zones. The wind tunnel procedure can be costly and time consuming, particularly for small or single-use projects. Furthermore, there are no code based GCn index values to compare with those developed by wind tunnel studies. The solar industry and code enforcement agencies are in need of a prescriptive method similar to that provided in ASCE 7. ASCE recently formed a “Wind Loads on Solar Collectors Subcommittee” to develop wind design provisions for solar collectors. This committee may provide input for future code development provisions, such as those in ASCE 7. The final product of this committee may not be published in a code for some time. Recognizing that the solar industry and code enforcement agencies are in urgent need for these design provisions, SEAOC has formed a wind subcommittee to develop this white paper and provide interim guidelines. This paper describes the wind flow characteristics on rooftop solar photovoltaic panels and provides a figure similar to that
used in the prescriptive methods contained in ASCE 7, using the same design methodology in generating GCn values that are consistent with the design equations contained in ASCE 7. The intent is for this method to be used with either ASCE 7-05 or ASCE 7-10, and no distinction between the two standards has been made or needs to be made herein. ICC AC 428 “Acceptance Criteria for Modular Framing Systems Used to Support Photovoltaic (PV) Modules” may be used to determine the wind loads provisions for freestanding ground-mounted systems and flush-mounted systems. Freestanding ground-mounted systems are for stand-alone systems and utilize the open buildings prescriptive method contained in ASCE 7; this procedure is not applicable to rooftop installations on buildings. Flush-mounted systems are installed parallel to the roof surface of a building within 2 to 10 inches of the roof surface and may utilize the enclosed building components and cladding prescriptive method contained in ASCE 7. The focus of this paper is on PV arrays on flat roof low-rise buildings, and not on ground-mounted systems or roof-mounted systems on other roof types (e.g. hip, gable, saw-tooth, etc.).
4. Prescriptive GCn Values for Solar Arrays Mounted on
Flat Roofs
This section presents a figure similar to that used in the
prescriptive methods contained in ASCE 7 for wind loads on
rooftop solar photovoltaic panels installed on flat roofs.
4.1. Code GCn Figure
The following figure illustrates an ASCE 7 based prescriptive
method for determining the GCn values and wind loads for
solar photovoltaic panels installed on flat roofs. The figure is
applicable to the conditions illustrated therein with
corresponding limitations. No extrapolation beyond the
limitations shown shall be made. The equations and
methodology in ASCE 7 for determining the velocity pressures
and associated site coefficients shall be used with the GCn
values shown.

STRUCTURAL ENGINEERS ASSOCIATION OF CALIFORNIA
Wind loads on low profile solar photovoltaic systems on flat roofs Report SEAOC PV2
DRAFT 28 March 2012
Page 6

STRUCTURAL ENGINEERS ASSOCIATION OF CALIFORNIA
Wind loads on low profile solar photovoltaic systems on flat roofs Report SEAOC PV2
DRAFT 28 March 2012
Page 7

STRUCTURAL ENGINEERS ASSOCIATION OF CALIFORNIA
Wind loads on low profile solar photovoltaic systems on flat roofs Report SEAOC PV2
DRAFT 28 March 2012
Page 8
4.2. Commentary
4.2.1. Procedure to Using Wind Load Figure
In order to simplify the use of this figure, a step by step procedure was added to the figure. An example calculation has been performed on a typical solar photovoltaic array and provided in Appendix A to further clarify the applicability of the figure.
4.2.2. Wind Flow Characteristics on Roofs
Low-rise buildings are generally wider than they are high. As wind flow approaches the side of these buildings, the structure forces the wind to flow up and over the top, as illustrated in Figure 1. The air does not, however, flow smoothly over the roof. Instead, it breaks away at the leading edge of the roof causing a shear layer and leaving a zone of swirling air beneath it.
Figure 1: Flow Separation and reattachment (Diagram courtesy Cermak Peterka Petersen) This zone of swirling air is called a flow separation. If the building is wide enough the wind above the building eventually comes back down and meets the roof. The point at which this happens is called the reattachment point, and although this point shifts around during a high wind event, on average it is located about twice the building height from the roof edge. Beyond the reattachment point, the wind once again flows parallel to the roof on average. (Carpenter, 200x) Figure 2a shows a wind zone map for the roof of a typical low-rise building. The yellow edge and red corner zones are dominated by flow separations: the wind can come from any direction. If we are concerned about loads on the roof itself, each of these zones is about half as wide as the building is high (a ≈ 0.4), as depicted in Figure 2a. However, if we are interested in solar panels mounted on top of the roof, the zones are typically about twice as wide as the building is high (a ≈ 2h), as depicted in Figure 2b. The zones for the roof itself and for roof-mounted solar panels are of different widths because the two are vulnerable to different phenomena. The roof is mainly vulnerable to the difference between the pressure within the building and that above the roof. Solar panels mounted on the roof, on the other hand, are vulnerable to the speed of the wind approaching the panel, and therefore, particularly to the vertical component of the wind for typical tilt angles of roof-mounted arrays. Although the suction exerted by
a flow separation dies off rapidly with increasing distance from the roof edge, wind speeds do not behave the same way. Therefore, the edge zones for roofs and for solar panels are different. (Carpenter, 200x). Because of the sensitivity of the vertical components to the wind turbulence, which the building enhances, the aerodynamic forces on roof-mounted arrays are rather different than those on the ground.
Figure 2a: Wind zones for a flat roof using standard components and cladding figures in ASCE 7 (Diagram courtesy Cermak Peterka Petersen)
Figure 2b: Wind zones for a flat roof for solar photovoltaic array wind loading (Diagram courtesy Cermak Peterka Petersen)
STRUCTURAL ENGINEERS ASSOCIATION OF CALIFORNIA
Wind loads on low profile solar photovoltaic systems on flat roofs Report SEAOC PV2
DRAFT 28 March 2012
Page 9
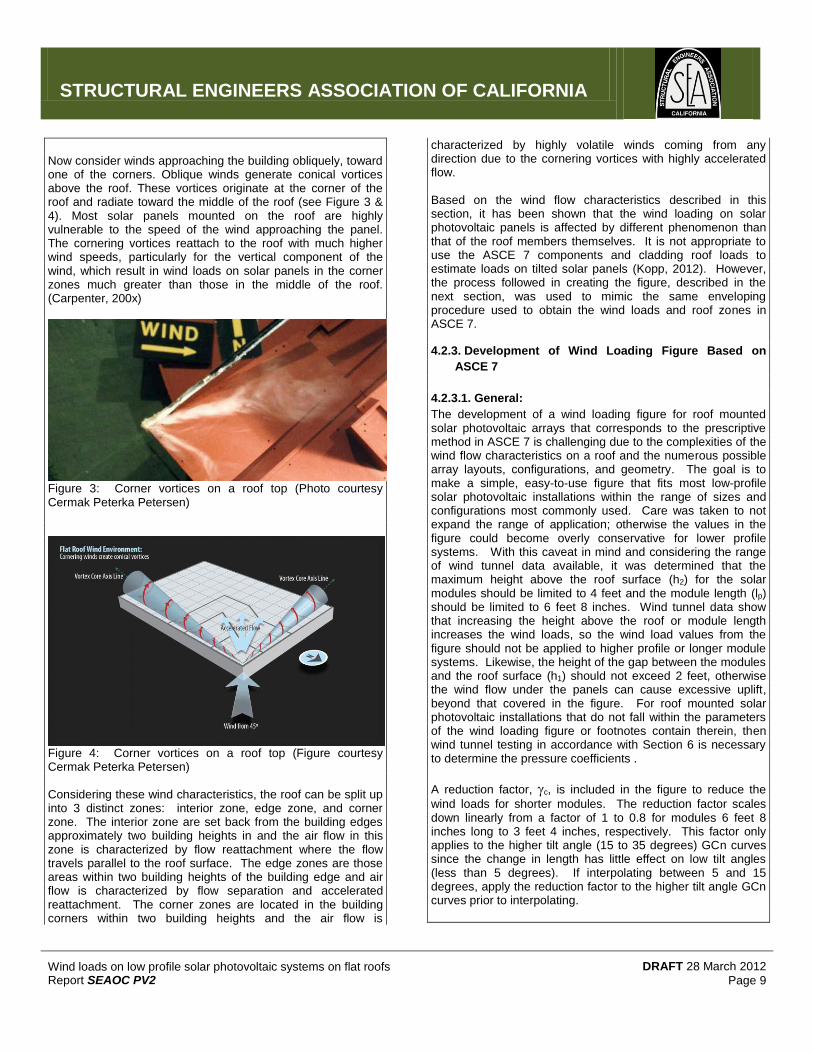
Now consider winds approaching the building obliquely, toward one of the corners. Oblique winds generate conical vortices above the roof. These vortices originate at the corner of the roof and radiate toward the middle of the roof (see Figure 3 & 4). Most solar panels mounted on the roof are highly vulnerable to the speed of the wind approaching the panel. The cornering vortices reattach to the roof with much higher wind speeds, particularly for the vertical component of the wind, which result in wind loads on solar panels in the corner zones much greater than those in the middle of the roof. (Carpenter, 200x)
Figure 3: Corner vortices on a roof top (Photo courtesy Cermak Peterka Petersen)
Figure 4: Corner vortices on a roof top (Figure courtesy Cermak Peterka Petersen) Considering these wind characteristics, the roof can be split up into 3 distinct zones: interior zone, edge zone, and corner zone. The interior zone are set back from the building edges approximately two building heights in and the air flow in this zone is characterized by flow reattachment where the flow travels parallel to the roof surface. The edge zones are those areas within two building heights of the building edge and air flow is characterized by flow separation and accelerated reattachment. The corner zones are located in the building corners within two building heights and the air flow is
characterized by highly volatile winds coming from any direction due to the cornering vortices with highly accelerated flow. Based on the wind flow characteristics described in this section, it has been shown that the wind loading on solar photovoltaic panels is affected by different phenomenon than that of the roof members themselves. It is not appropriate to use the ASCE 7 components and cladding roof loads to estimate loads on tilted solar panels (Kopp, 2012). However, the process followed in creating the figure, described in the next section, was used to mimic the same enveloping procedure used to obtain the wind loads and roof zones in ASCE 7.
4.2.3. Development of Wind Loading Figure Based on
ASCE 7
4.2.3.1. General:
The development of a wind loading figure for roof mounted solar photovoltaic arrays that corresponds to the prescriptive method in ASCE 7 is challenging due to the complexities of the wind flow characteristics on a roof and the numerous possible array layouts, configurations, and geometry. The goal is to make a simple, easy-to-use figure that fits most low-profile solar photovoltaic installations within the range of sizes and configurations most commonly used. Care was taken to not expand the range of application; otherwise the values in the figure could become overly conservative for lower profile systems. With this caveat in mind and considering the range of wind tunnel data available, it was determined that the maximum height above the roof surface (h2) for the solar modules should be limited to 4 feet and the module length (lp) should be limited to 6 feet 8 inches. Wind tunnel data show that increasing the height above the roof or module length increases the wind loads, so the wind load values from the figure should not be applied to higher profile or longer module systems. Likewise, the height of the gap between the modules and the roof surface (h1) should not exceed 2 feet, otherwise the wind flow under the panels can cause excessive uplift, beyond that covered in the figure. For roof mounted solar photovoltaic installations that do not fall within the parameters of the wind loading figure or footnotes contain therein, then wind tunnel testing in accordance with Section 6 is necessary to determine the pressure coefficients .
A reduction factor, c, is included in the figure to reduce the
wind loads for shorter modules. The reduction factor scales down linearly from a factor of 1 to 0.8 for modules 6 feet 8 inches long to 3 feet 4 inches, respectively. This factor only applies to the higher tilt angle (15 to 35 degrees) GCn curves since the change in length has little effect on low tilt angles (less than 5 degrees). If interpolating between 5 and 15 degrees, apply the reduction factor to the higher tilt angle GCn curves prior to interpolating.

STRUCTURAL ENGINEERS ASSOCIATION OF CALIFORNIA
Wind loads on low profile solar photovoltaic systems on flat roofs Report SEAOC PV2
DRAFT 28 March 2012
Page 10
The intent of the figure is to be applied to low-rise buildings, which are buildings less than or equal to 60 feet high. However, the behavior and physics of the wind flow contained herein can also be applied to buildings of any height provided the building is at least as wide as it is tall. The normalized wind area will account for increase wind loads of larger buildings as described in Section 4.2.3.4
4.2.3.2. Zoning:
As noted in a previous section, there are three distinct regions or zones on the roof where the wind flow characteristics and resulting wind loading on solar modules are different. They are the interior (1), edge (2), and corner (3) zones. In the northern hemisphere, most solar arrays are oriented such that the modules are facing the south, which leaves the north edge of the module elevated and exposed to northern winds. Wind tunnel test data have shown that the cornering winds from the northeast and northwest create the most severe loading in these respective corners due to the effects of the cornering vortices on exposed northern edge. The data also shows vortices in the southwest and southeast building corners, although the effects are less severe. The effects of the cornering vortices and accelerated flow extend further into the building on the northern corners than the southern corners. In order to simplify the use of the figure and assigning corner zone regions, all corner zones were made the same size. The size of the corner zones is directly proportional to the magnitude of the cornering wind vortices formed. Wind tunnel test data shows that the magnitude of the cornering wind vortices is proportional to the building height; however, for buildings where the width is shorter than approximately four times the building height, the full strength of the cornering vortices cannot be generated. The dimension of the corner zones is set at a length of two times the building height from each corner and scales down proportionally for buildings whose width is shorter than four times the building height. The edge zones are a continuation of the corner zones around the perimeter of the building where the wind loads are generally smaller than the corners zones. Some clarifications have been made where building setbacks occur and when the formation of another corner zone should occur. Interior reentrant corners do not require a corner since cornering vortices only form at outward or protruded corners. The interior zone is set back from the edges and corners and is where flow reattachment occurs with air flowing parallel to the roof surface, and wind loads are lower. For very large warehouse type buildings, there is a deep interior zone with further reduced wind loads, and this area has been denoted as zone ‘0’.
4.2.3.3. Building Edge and Parapet Effects
As noted in a previous section, as the wind flows up and over the top of the building, the air breaks away at the leading edge of the roof causing a shear layer. Above this shear layer is very high wind acceleration. For that reason, solar modules need to be kept below this shear layer otherwise the wind loads will significantly increase above those indicated in the figure. The shear layer ascends off of the roof edge at a slope of approximately 26 degrees (2:1 horizontal to vertical) toward the building. As such, solar modules should never be placed closer than two times the panel height (h2) from the roof edge (Banks, 200x). Where parapets occur, the shear layer is raised and modules can be placed closer to the roof edge. There is also an absolute minimum set back of 4 feet, which is due to the availability of test data (i.e., there is no test data available closer to a roof edge than this). These minimum setbacks are typically less than the fire marshal setback requirements to allow fire fighter roof access. Parapets typically worsen the wind loads on solar modules, particularly on wider buildings. The parapets lift the vortices higher above the roof surface and push them closer together, inward from the edges. It is not clear at this time why the vortex effects are more severe in this situation, but tests have shown that this can result in wind loads that are 50% greater than in the absence of a parapet, particularly for unprotected tilted panels. (Banks, 200x). As such, the figure limits the parapet height to 4 feet unless the GCn values are increase by a 1.3 factor.
4.2.3.4. Net Pressure Coefficient, GCn
The net pressure coefficient (GCn) curves were generated based on wind tunnel test data within the range of parameters allowed by the figure. These curves were created based on the same methodology as those shown in ASCE 7 for components and cladding. One important difference in this figure from those in ASCE 7 is the effective wind area on the horizontal axis is changed to normalized wind area. This represents a shift in methodology from that in ASCE 7. The wind tunnel test data indicates that larger buildings have larger GCn values than smaller buildings. When enveloping data to create these curves, it is quite apparent that taller low-rise buildings skew the GCn curves higher when compared to lower low-rise buildings. This effect is not currently addressed in ASCE 7 components and cladding figures. In order to not over-penalize shorter or smaller buildings, the use of a normalized wind area is used. The normalized wind area is approximately equal to the effective wind area for 33-foot high buildings. For shorter buildings, the normalized wind area will be larger than the effective wind area, thereby sliding to the right on the figure and reducing the GCn values or wind load. Taller buildings have the opposite effect. A lower limit on the height of the building used in computing the normalized wind area has been set at 15 feet, otherwise the calculated wind loads become lower than the data indicates.

STRUCTURAL ENGINEERS ASSOCIATION OF CALIFORNIA
Wind loads on low profile solar photovoltaic systems on flat roofs Report SEAOC PV2
DRAFT 28 March 2012
Page 11
The ASCE 7 components and cladding GCp curves all max out and remain constant at effective wind areas less than 10 square feet. When using normalized wind area, this cannot be capped since the factor of 10 is not an absolute area; it is a factor. Taller buildings will use the values in the 1 to 10 range for much of the components and cladding loads. Therefore values are instead capped at a value of less than 1. The GCn curves in the figure cover the range of panel tilt angles from 0 degree to 35 degrees since this is the practical range of inclination for typical installations. For module tilt angles less than 1 degree, ICC AC 428 can be utilized which allows the panels to be designed as components and cladding in accordance with the ASCE 7 figures. The wind tunnel data available covers module tilt angles up to 30 degrees, and since the change in wind loads on the steeper module inclination angles is small, the extrapolation to 35 degrees is rational. The wind tunnel data indicates that the GCn values are not linearly related to the panel tilt angle over the full tilt angle range. The data indicates that there is a relatively small change in GCn values for the lower tilt modules in the 1 to 5 degree range. Then there is a rapid increase in GCn values from 5 to 15 degrees. There is again a relatively small change in GCn values for higher tilt modules in the 15 to 35 degree range. This is because, for the higher tilt angles, upstream arrays create turbulence which increases the wind loads on all downstream arrays (Kopp et al., 2011). Thus, the figure was created with two GCn curves to address this phenomenon; a GCn curve for low tilt modules in the 1 to 5 degree range and another for high tilt modules in the 15 to 35 degree range. For module tilt angles in the 5 to 15 degree range, interpolation is permitted. The GCn curves are shown for each of the distinct roof zones previously noted. Based on the wind tunnel data, the values for zones 2 and 3 are approximately 1.3 and 1.5 times higher than zone 1 wind loads, respectively. At small and very large effective wind areas, these factors diverge from these constants as illustrated in the GCn curves. The GCn data has been typically rounded to the nearest tenth to allow easier extraction of the data off of the curves. GCn values are for both positive and negative values. Wind tunnel test data shows similar positive and negative pressures for solar panels, which is very different than typical roof member design wind loads.
4.2.3.5. Module Shielding in an Array
Solar modules are typically installed in large arrays with closely spaced rows. When the wind traveling above the roof surface approaches the array, the wind generally travels up and over the array. As the wind accelerates over the first module at the array edge, it causes a large wind load on this edge module.
As the wind continues across the array, it tries to reattached to the roof, but if the modules are in closely spaced rows, the wind cannot fully recover and it rolls over the top of the remaining downwind modules in a turbulent manner. Wind tunnel tests have shown that the edge modules can have wind loads in excess of two times that of closely spaced shielded modules. A typical array consists of closely spaced module rows that are sheltered by perimeter edge modules that have increased loading. In the development of the figure, the GCn curves were chosen for shielded modules since this represents the typical condition. To account for the higher loading at the perimeter edge modules, an edge increase factor needs to be applied. As noted earlier, most solar arrays are oriented such that the modules are facing the south, which leaves the north edge of the module elevated and exposed to northern winds. As such, the edge effects on the northern edge row are significantly higher than that on the southern edge row and east and west sides of the array. The figure has two different edge factors to account for this phenomenon. In order to take full advantage of the shielding effect between module rows, the space between rows needs to be less than the panel characteristic height (hc). As the space between rows increases, the wind load on these modules increases. The same phenomenon occurs where there are open spaces on the roof between adjacent arrays. As the open space between modules approaches 8 times the panel characteristic height (hc), all shielding has fully dissipated and full reattachment of the wind to the roof surface occurs. As such, the edge factors in the figure, increase linearly as spacing increases from 1 panel characteristic height to 8 panel characteristic heights. As noted in a previous section, the shear layer of wind coming up and over the edge of a building takes a long distance to reattach to the building roof surface. This begins to occur at approximately 80 percent of the building wall height, including parapet. As a result, when edge panels are placed in this region, where flow reattachment has not occurred, the edge increase factor is less than the maximum value. As such, the edge factors in the figure for the condition where panels are placed within 0.8 times the building wall height, vary linearly from 0.1 building wall heights to 0.8 building wall heights. <Add discussion on roof top equipment>
4.2.3.6. Design of Roof Supporting Solar Array
<need to work on this section> Note that in this situation, mechanically attached flush-mounted solar panels will not increase the wind load on the roof structure itself. The roof load remains roughly the same, with some fraction acting on the panels.

STRUCTURAL ENGINEERS ASSOCIATION OF CALIFORNIA
Wind loads on low profile solar photovoltaic systems on flat roofs Report SEAOC PV2
DRAFT 28 March 2012
Page 12
5. Effective wind area
The definition of effective wind area in ASCE 7-05 Section 6.2 (ASCE 7- 10 Section 26.2) is generally applicable to solar arrays. The following is the proposed definition to add to ASCE 7: EFFECTIVE WIND AREA - SOLAR ARRAY, A: The solar panel surface area used to determine GCn. For a structural element supporting a panel or a group of panels, the effective width need not be less than one-third the span of the element. For an individual panel fastener, the effective wind area shall not be greater than the panel area tributary to the fastener. For array supports connected to or bearing on the building roof structure, the effective wind area shall be the tributary panel areas to the support. <This is pasted from latest effective wind area document, needs work and updating>
Commentary:
The definition of effective wind area in ASCE 7-05 section 6.2 (ASCE 7- 10 Section 26.2) is generally applicable to solar arrays. For a framed, stanchion system, determination of effective wind area is based on the corresponding tributary panel area or a portion of the aggregate panel area if panels are interconnected. For a roof bearing system having different load paths for upward, downward, and lateral forces, and depending on the hold down system and/or the method of interconnection between the panels, the appropriate effective wind area in each direction should be used. For instance, when checking sliding, a roof bearing system might be able to engage a majority of the array, so a much larger effective wind area could be used for sliding compared to that used for uplift. The effective wind area to be used in determining wind load on an array framing or roof framing element supporting a solar array depends on the spacing and uniformity of supports (anchors) for the solar array system. As with Components and Cladding, the effective width of the solar panel effective wind area need not be less than one-third the span of the framing element being considered. The induced wind load should be applied over the actual area tributary to the element. Effective wind area for a drag strut, collector, or tie, which collects and transfers horizontal wind forces to the main wind-force resisting system, is the aggregate panel area tributary to the drag strut element. Stiffness of the array support structure relative to the roof structure can significantly influence the distribution of the forces imparted by the array on the roof and should be
considered in the analysis.
6. Wind tunnel tests per ASCE 7
When using the wind tunnel procedure in ASCE 7 to develop wind loads on solar photovoltaic module arrays mounted on a building roof, the wind tunnel model must include a basic array layout on the roof of a scaled building to properly model the
wind flow environment on the roof of a building in accordance with ASCE 7-05 Section 6.6.2 or ASCE 7-10 Section 31.2. The model shall include various features that affect the wind flow environment on the roof of a building, including, but not limited to, varied parapet heights and arrays located in different roof zones (corner, edge, center, etc.). A building replica of the actual installation is not necessary; rather a generic model building large enough in plan area to capture the wind flow environment over different roof zones can be used. The wind tunnel study shall generate recommendations for setback distances from larger rooftop equipment. The wind tunnel results shall not be extrapolated to other module geometry or inclination angle or to other roof shape types that were not part of the wind tunnel study, such as stepped roofs, clerestories, dome, and barrel roofs. (Kopp, 2011; Kopp, 2012) For solar photovoltaic systems that meet the limitations and geometry requirements of the figure in Appendix A, the minimum design wind load based on a wind tunnel study shall be 50% of the values in each respective zone resulting from this figure. For solar photovoltaic systems that exceed the limitations and geometry requirements of the figure in Section 4, the minimum design wind load based on a wind tunnel study shall be 65% the values in each respective zone resulting from this figure. The minimum design wind force based on a wind tunnel study for solar photovoltaic systems need not comply with the minimum net pressure of 10 psf (allowable stress design) per ASCE 7-05 Section 6.1.4.2 or 16 psf (strength design) per ASCE 7-10 Section 30.2.2. Values lower than those indicated above may be used when an independent peer review is performed (any minimum?). The independent peer review is an objective, technical review by knowledgeable reviewer(s) experienced in performing wind tunnel studies on buildings and similar systems, in properly simulated atmospheric boundary layers. The minimum qualifications for the peer reviewer shall be as follows:
The peer reviewer shall be independent from the wind tunnel laboratory that performed the study and prepared the report.
The peer reviewer shall have no other involvement in the study before, during or after the review, except in a review capacity.
The peer reviewer shall be selected and paid by the client requesting the wind tunnel study and shall have technical expertise in the application of wind tunnel studies on buildings similar to that being reviewed.
The peer reviewer shall have experience in performing or evaluating boundary layer wind tunnel studies and familiar with the technical issues and regulations governing the wind tunnel procedure in ASCE 7 as it is applied to systems similar to solar photovoltaic arrays. Professional engineer, any state, country?

STRUCTURAL ENGINEERS ASSOCIATION OF CALIFORNIA
Wind loads on low profile solar photovoltaic systems on flat roofs Report SEAOC PV2
DRAFT 28 March 2012
Page 13
The peer reviewer shall review the wind tunnel report, including, but not limited to, data collection method, data analysis, boundary layer, array and building modeling, conversion of data into GCn values, and conditions of applicability of results to different buildings types, array geometry, etc. The peer reviewer shall prepare a written report to the client. Such report should include, at a minimum, statements regarding the following:
Scope of peer review with limitations defined.
The status of the wind tunnel study at time of review.
Validity of wind tunnel study performed to meet the requirements in ASCE 7.
Presentation of the conclusions of the reviewer identifying any areas that need further review, investigation and/or clarification.
Recommendations.
Statement indicating whether, in the reviewer’s opinion, the wind tunnel study is in conformance with ASCE 7 for the intended use(s).
Commentary:
7. Acknowledgements
SEAOC is grateful to the dedication of all the committee members that participated in this process. In particular, the invaluable contribution by Dr. David Banks from Cermak Peterka Petersen (CPP) and Dr. Gregory Kopp from The University of Western Ontario on the development of the wind loads figure and laborious task of sifting through data at each iteration of the process. Also, thanks to David Carpenter and David Banks from CPP for use of CPP figures and write-up on the wind flow characteristics on flat roofs.
8. References
ASCE. (2006). “Minimum design loads for buildings and other structures.” ASCE7-05, Reston, VA. ASCE. (2010). “Minimum design loads for buildings and other structures.” ASCE7-10, Reston, VA. Banks, D. (200x). “How to Calculate Wind Loads on Roof Mounted Solar Panels in the US” Cermak Peterka Petersen (CPP) Carpenter, D. (200x). “Solar modules on flat roofs – why worry about wind?” Cermak Peterka Petersen (CPP) ICC AC 428 (2011) “Acceptance Criteria for Modular Framing Systems Used to Support Photovoltaic (PV) Modules.” ICC AC 428 Kopp, G., Maffei, J., Tilley, C. (2011) “Rooftop Solar Arrays and Wind Loading: A Primer on Using Wind Tunnel Testing as a Basis for Code Compliant Design per ASCE 7”, Boundary Layer Wind Tunnel Laboratory, The University of Western Ontario, Faculty of Engineering Kopp, G., Farquhar, S., Morrison, M., (2011). “Aerodynamic mechanisms for wind loads on tilted, roof--‐mounted, solar
arrays”, Journal of Wind Engineering & Industrial Aerodynamics (manuscript under review) Kopp, G., Banks, D. (2012) “Use of the Wind Tunnel Test Method for Obtaining Design Wind Loads on Roof-Mounted Solar Arrays”, Journal of Structural Engineering (manuscript under review)

STRUCTURAL ENGINEERS ASSOCIATION OF CALIFORNIA
Wind loads on low profile solar photovoltaic systems on flat roofs Report SEAOC PV2
DRAFT 28 March 2012
Page 14
Appendix A: Example Calculation of Solar Array Loading
Copyright © 2022 FDOKUMEN