Identification of chromosome abnormalities in subtelomeric regions by microarray analysis: A study...
18
Identification of Chromosome Abnormalities in Subtelomeric Regions by Microarray Analysis: A Study of 5,380 Cases Lina Shao, Chad A. Shaw, Xin-Yan Lu, Trilochan Sahoo, Carlos A. Bacino, Seema R. Lalani, Pawel Stankiewicz, Svetlana A. Yatsenko, Yinfeng Li, Sarah Neill, Amber N. Pursley, A. Craig Chinault, Ankita Patel, Arthur L. Beaudet, James R. Lupski, and Sau W. Cheung * Department of Molecular and Human Genetics, Baylor College of Medicine, Houston, Texas Abstract Subtelomeric imbalances are a significant cause of congenital disorders. Screening for these abnormalities has traditionally utilized GTG-banding analysis, fluorescence in situ hybridization (FISH) assays, and multiplex ligation-dependent probe amplification. Microarray-based comparative genomic hybridization (array-CGH) is a relatively new technology that can identify microscopic and submicroscopic chromosomal imbalances. It has been proposed that an array with extended coverage at subtelomeric regions could characterize subtelomeric aberrations more efficiently in a single experiment. The targeted arrays for chromosome microarray analysis (CMA), developed by Baylor College of Medicine, have on average 12 BAC/PAC clones covering 10 Mb of each of the 41 subtelomeric regions. We screened 5,380 consecutive clinical patients using CMA. The most common reasons for referral included developmental delay (DD), and/or mental retardation (MR), dysmorphic features (DF), multiple congenital anomalies (MCA), seizure disorders (SD), and autistic, or other behavioral abnormalities. We found pathogenic rearrangements at subtelomeric regions in 236 patients (4.4%). Among these patients, 103 had a deletion, 58 had a duplication, 44 had an unbalanced translocation, and 31 had a complex rearrangement. The detection rates varied among patients with a normal karyotype analysis (2.98%), with an abnormal karyotype analysis (43.4%), and with an unavailable or no karyotype analysis (3.16%). Six patients out of 278 with a prior normal subtelomere-FISH analysis showed an abnormality including an interstitial deletion, two terminal deletions, two interstitial duplications, and a terminal duplication. In conclusion, genomic imbalances at subtelomeric regions contribute significantly to congenital disorders. Targeted array-CGH with extended coverage (up to 10 Mb) of subtelomeric regions will enhance the detection of subtelomeric imbalances, especially for submicroscopic imbalances. Keywords array-CGH; subtelomere; chromosomal abnormality; FISH Introduction Abnormalities in genomic copy number are frequently found in patients with multiple congenital anomalies (MCA), dysmorphism, developmental delay/mental retardation (DD/ MR), and other neurological disorders [Lee and Lupski, 2006; Shaffer et al., 2006; Aradhya et al., 2007; Baris et al., 2007; Engels et al., 2007; Kriek et al., 2007; Lu et al., 2007; Stankiewicz and Beaudet, 2007]. Rearrangements of chromosome subtelomeric regions represent a high proportion of cytogenetic abnormalities. The largest study of subtelomeric abnormalities to *Correspondence to: Dr. Sau W. Cheung, Department of Molecular and Human Genetics, Baylor College of Medicine, 2450 Holcombe Blvd, Houston, TX 77021-2039. E-mail: E-mail: [email protected]. NIH Public Access Author Manuscript Am J Med Genet A. Author manuscript; available in PMC 2009 September 1. Published in final edited form as: Am J Med Genet A. 2008 September 1; 146A(17): 2242–2251. doi:10.1002/ajmg.a.32399. NIH-PA Author Manuscript NIH-PA Author Manuscript NIH-PA Author Manuscript
-
Upload
jewelrytiffanyandco -
Category
Documents
-
view
0 -
download
0
Transcript of Identification of chromosome abnormalities in subtelomeric regions by microarray analysis: A study...
Identification of Chromosome Abnormalities in SubtelomericRegions by Microarray Analysis: A Study of 5,380 Cases
Lina Shao, Chad A. Shaw, Xin-Yan Lu, Trilochan Sahoo, Carlos A. Bacino, Seema R. Lalani,Pawel Stankiewicz, Svetlana A. Yatsenko, Yinfeng Li, Sarah Neill, Amber N. Pursley, A. CraigChinault, Ankita Patel, Arthur L. Beaudet, James R. Lupski, and Sau W. Cheung*Department of Molecular and Human Genetics, Baylor College of Medicine, Houston, Texas
AbstractSubtelomeric imbalances are a significant cause of congenital disorders. Screening for theseabnormalities has traditionally utilized GTG-banding analysis, fluorescence in situ hybridization(FISH) assays, and multiplex ligation-dependent probe amplification. Microarray-based comparativegenomic hybridization (array-CGH) is a relatively new technology that can identify microscopic andsubmicroscopic chromosomal imbalances. It has been proposed that an array with extended coverageat subtelomeric regions could characterize subtelomeric aberrations more efficiently in a singleexperiment. The targeted arrays for chromosome microarray analysis (CMA), developed by BaylorCollege of Medicine, have on average 12 BAC/PAC clones covering 10 Mb of each of the 41subtelomeric regions. We screened 5,380 consecutive clinical patients using CMA. The mostcommon reasons for referral included developmental delay (DD), and/or mental retardation (MR),dysmorphic features (DF), multiple congenital anomalies (MCA), seizure disorders (SD), andautistic, or other behavioral abnormalities. We found pathogenic rearrangements at subtelomericregions in 236 patients (4.4%). Among these patients, 103 had a deletion, 58 had a duplication, 44had an unbalanced translocation, and 31 had a complex rearrangement. The detection rates variedamong patients with a normal karyotype analysis (2.98%), with an abnormal karyotype analysis(43.4%), and with an unavailable or no karyotype analysis (3.16%). Six patients out of 278 with aprior normal subtelomere-FISH analysis showed an abnormality including an interstitial deletion,two terminal deletions, two interstitial duplications, and a terminal duplication. In conclusion,genomic imbalances at subtelomeric regions contribute significantly to congenital disorders.Targeted array-CGH with extended coverage (up to 10 Mb) of subtelomeric regions will enhancethe detection of subtelomeric imbalances, especially for submicroscopic imbalances.
Keywordsarray-CGH; subtelomere; chromosomal abnormality; FISH
IntroductionAbnormalities in genomic copy number are frequently found in patients with multiplecongenital anomalies (MCA), dysmorphism, developmental delay/mental retardation (DD/MR), and other neurological disorders [Lee and Lupski, 2006; Shaffer et al., 2006; Aradhyaet al., 2007; Baris et al., 2007; Engels et al., 2007; Kriek et al., 2007; Lu et al., 2007; Stankiewiczand Beaudet, 2007]. Rearrangements of chromosome subtelomeric regions represent a highproportion of cytogenetic abnormalities. The largest study of subtelomeric abnormalities to
*Correspondence to: Dr. Sau W. Cheung, Department of Molecular and Human Genetics, Baylor College of Medicine, 2450 HolcombeBlvd, Houston, TX 77021-2039. E-mail: E-mail: [email protected].
NIH Public AccessAuthor ManuscriptAm J Med Genet A. Author manuscript; available in PMC 2009 September 1.
Published in final edited form as:Am J Med Genet A. 2008 September 1; 146A(17): 2242–2251. doi:10.1002/ajmg.a.32399.
NIH
-PA Author Manuscript
NIH
-PA Author Manuscript
NIH
-PA Author Manuscript
date examined 11,688 unselected cases using subtelomere fluorescence in situ hybridization(FISH) analysis and found an overall abnormality rate of 3.0% with 2.6% deemed pathogenic[Ravnan et al., 2006]. In a recent report of ∼7,000 unselected cases using targeted microarrayanalysis with evolving arrays of varied subtelomere coverage, 2.4% of the cases weredetermined to have clinically significant subtelomeric rearrangements [Ballif et al., 2007].Earlier studies that focused on patients with DD/MR indicated an average overall abnormalityrate of ∼5% and a rate of 2.6% for cryptic (i.e., not resolved by G-banding) subtelomericaneusomies [Biesecker, 2002; Xu and Chen, 2003; Moog et al., 2005; Yu et al., 2005; Mentenet al., 2006].
Substantial phenotypic abnormalities are likely to occur from subtelomeric rearrangementsbecause these regions are gene-rich and particularly prone to genomic instability due to therepeat sequences found in these areas [Linardopoulou et al., 2005; Riethman et al., 2005]. Themost commonly used methods to detect subtelomeric rearrangements include GTG-banding,FISH with a complete set of subtelomeric probes (subtelomere-FISH), multiplex ligation-dependent probe amplification, and more recently microarray-based comparative genomichybridization (array-CGH). The advantages and disadvantages of array-CGH over other assayshave been described in detail elsewhere [Stankiewicz and Beaudet, 2007]. Array-CGH hasbecome the method of choice for high-resolution genome analysis and screening for genomiccopy number changes [Smeets, 2004; Cheung et al., 2005; Le Caignec et al., 2005; Sanlavilleet al., 2005; Bar-Shira et al., 2006; Poss et al., 2006; Shaffer and Bejjani, 2006; Lu et al.,2007]. Several groups evaluated patients with DD/MR using subtelomere specific arrays withcoverage ranging from several hundred kb to 5 Mb of subtelomeric regions and showed a highsensitivity of such assays in detecting known and novel cytogenetic abnormalities [Veltmanet al., 2002; Harada et al., 2004; Kok et al., 2005]. Whole genome or targeted array-CGH hasalso proven to be a powerful tool for the rapid and accurate detection of subtelomericrearrangements [Le Caignec et al., 2005; Bar-Shira et al., 2006; Shaffer et al., 2006; Ballif etal., 2007; Fan et al., 2007; Lu et al., 2007; Martin et al., 2007].
Targeted array-CGH with extended coverage at subtelomeric regions was first introduced atBaylor College of Medicine in February of 2004 as a clinical test coupled with FISHverification [Cheung et al., 2005]. We have defined the chromosome ends up to 10 Mb as thesubtelomeric regions. In this study, we applied chromosome microarray analysis (CMA) toinvestigate 5,380 consecutive clinical patients and identified 499 cases with subtelomericimbalances (9.3%) of which 236 cases were interpreted as pathogenic chromosomalabnormalities (4.4%). Our results support the previous observations that array-CGH is asensitive and robust platform for the detection of unbalanced subtelomeric abnormalities andrevealed genomic gains consistent with duplications as a frequent cause of subtelomericimbalances.
Materials and MethodsPatients
We analyzed the results obtained from 5,380 consecutive clinical cases submitted to theKleberg Cytogenetics Laboratory of Baylor College of Medicine for CMA analysis betweenJuly 16, 2005 and December 31, 2006. We used CMA V5 for the first 4,493 patients and CMAV6 for the next 887 patients. These samples were submitted by a variety of health careproviders, predominantly pediatricians, geneticists, and neurologists from the United Statesand abroad. Patients referred for CMA analysis had diverse clinical phenotypes, including butnot limited to DD/MR, dysmorphic features (DF), MCA, seizure disorders (SD), and autisticor other behavioral abnormalities. Ages varied from 1 day to 75 years, with a median age of 4years. Among these patients, 2,550 (47.4%) had a normal prior or concurrent karyotypeanalysis, 175 (3.2%) had an abnormal prior or concurrent karyotype analysis, the remaining
Shao et al. Page 2
Am J Med Genet A. Author manuscript; available in PMC 2009 September 1.
NIH
-PA Author Manuscript
NIH
-PA Author Manuscript
NIH
-PA Author Manuscript

2,655 patients (49.3%) had no or unavailable karyotype analysis. Overall, 278 patients had aprior normal subtelomere-FISH analysis.
CMA AnalysisThe CMA V5 array has 853 BAC clones, interrogating genomic regions for >70 genomicdisorders [Lupski, 1998], 41 subtelomeric regions (average 10 Mb/region), and 43 pericentricregions (www.bcm.edu/cma/table.htm, Chip Map V5.0). Of the 853 distinct clones, 481 coversubtelomeric regions with an average density of 12 clones per region. The subsequent andenhanced CMA V6 array included 1,475 clones covering ∼150 genomic disorders andbackbone clones for every G-band at the 650-band level (www.bcm.edu/cma/table.htm, ChipMap V6.0). The subtelomeric region coverage in CMA V6 is similar to CMA V5 except forthe removal of 17 clones and addition of 37 new clones yielding a total of 501 clones. Theclones were selected from NCBI/UCSC public databases or from the FISH probe panelroutinely used in our cytogenetic laboratory. All clones were FISH-verified before use on themicroarray. Any clone that hybridized to multiple chromosomal locations or to a differentchromosomal region was excluded from the array. In general, 3–5 BAC/PAC clones wereselected to cover the most distal 1 Mb and 1 BAC/PAC clone was selected for each proximalMb. The starting point of the subtelomere coverage from telomere ranged from 0.04 to 0.8 Mbwith an average of 0.24 Mb. The clones were chosen from segmental duplication free regionsor contain segmental duplication sequence less than 30% of the clone sequence. Versions ofthe array are periodically updated to add clones of clinical significance and remove clonesfound to be highly polymorphic.
The manufacture of arrays, experimental procedures and data analysis methods were describedelsewhere [Cheung et al., 2005; Lu et al., 2007]. For each patient sample, two experimentswere performed with a dye-swap for the test sample and gender-matched control. Data weresubjected to normalization and the dye-reversed results were integrated to determine inferencesfor each clone. The log2 test/reference intensity ratio and T-statistics permutation based P-value were the parameters used to objectively determine whether a clone deviates significantlyfrom the baseline. Abnormal results were classified as gain or loss. A gain was defined whenthe combined log2 ratio of a clone was greater than 0.2 and T-statistics permutation based P-value was <0.05 whereas a loss was defined by the combined log2 ratio <−0.2 and T-statisticspermutation based P-value <0.05.
Verification by FISH or G-Banding AnalysisAll potential cytogenetic alterations detected on the arrays were verified independently byGTG-banding and/or FISH tests except copy number polymorphisms which had been detectedfrequently in patients and observed in multiple unaffected parents. The confirmatory methodused was dependent on the size of the genomic imbalance detected by CMA. ConfirmatoryFISH was performed with the BAC/PACs that showed the alterations on the micro-array.Metaphase and/or interphase preparations from patient peripheral lymphocytes and FISHanalysis followed a standard clinical cytogenetics laboratory protocol [Trask, 1991]. Werequested parental samples for patients with copy number changes of clinical significance orunknown significance. The parental samples were studied either by FISH with the clone alteredin the proband or karyotype depending on the size of copy number change detected in theproband. If the copy number change in the proband does not exist in the father nor the mother,it will be interpreted as de novo. However, paternity or maternity tests were not regularlyperformed in the laboratory.
Shao et al. Page 3
Am J Med Genet A. Author manuscript; available in PMC 2009 September 1.
NIH
-PA Author Manuscript
NIH
-PA Author Manuscript
NIH
-PA Author Manuscript
ResultsHigh Frequency of Subtelomeric Rearrangments
We used CMA V5 for the first 4,493 patients and CMA V6 for the next 887 patients. From the5,380 consecutive clinical cases evaluated by CMA, we detected DNA copy number alterationsin subtelomeric regions in 499 (9.3%) patients. In 175 patients (3.2%), the alterations wereseen in both the proband and a normal parent and therefore interpreted as benign familialvariants. In 88 patients (1.7%), the parental samples were not available and since the alterationswere small (≤1 Mb) and did not involve a known disease region, the clinical relevance couldnot be determined. Most of the subtelomeric familial variants (98/175) and variants withunknown clinical relevance (54/88) were consistent with copy number variations (CNVs) asarchived in the Human Genome Segmental Duplication Database(http://projects.tcag.ca/humandup). The majority of these variants, with the exception of 11single-clone changes, have been reported in an earlier publication [Lu et al., 2007] and thereforeare not discussed in this study.
In the remaining 236 patients (4.4%), the rearrangements were either de novo (41), or inheritedfrom a parent with either a similar phenotype or a balanced translocation carrier (20), oroccurred in known disease regions (20), or were greater than 1 Mb in size when the inheritancewas unknown (155), and therefore were interpreted as pathogenic. Among these abnormalities,85% (200/236) were identified by CMA V5 with an overall detection rate of 4.4% (200/4,493)and the remaining 15% (36/236) were identified by CMA V6 with an overall detection rate of4.1% (36/887).
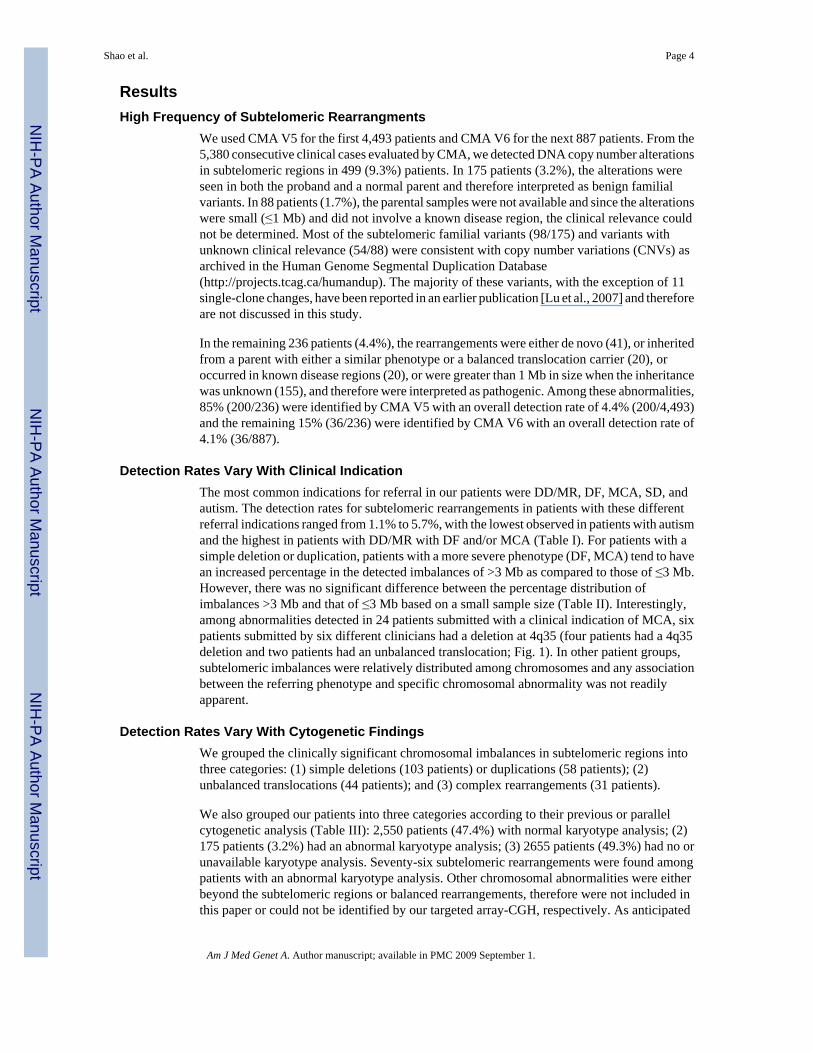
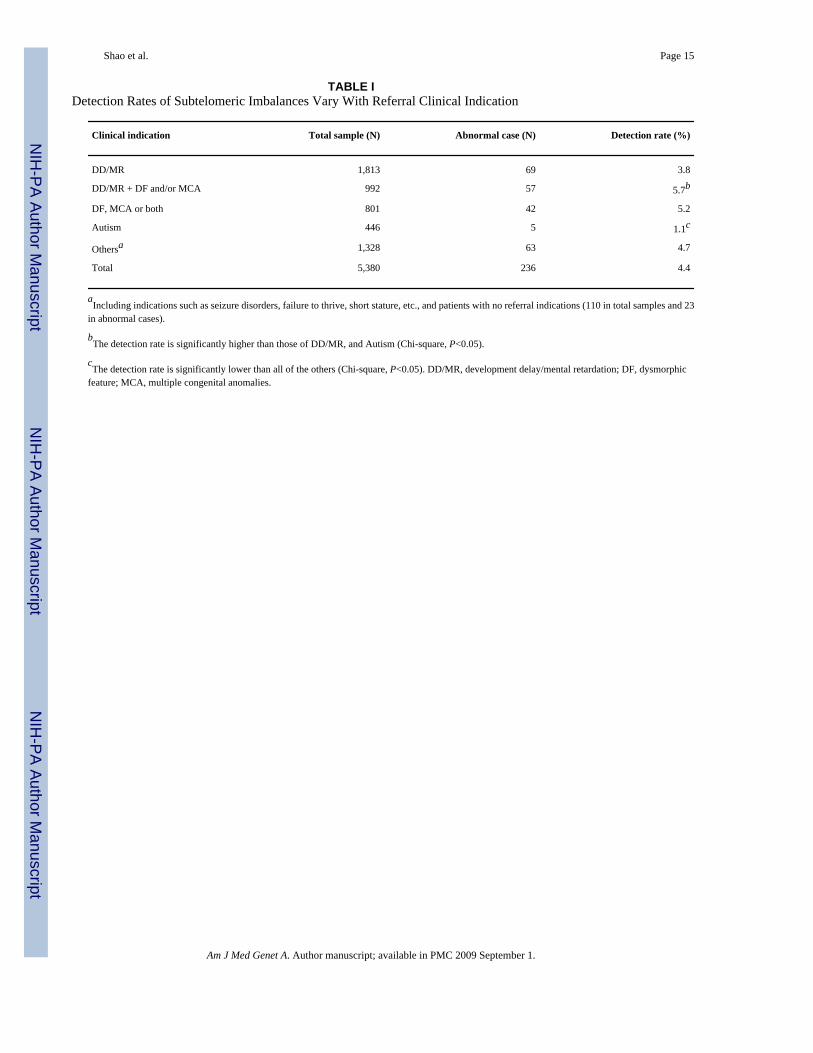
Detection Rates Vary With Clinical IndicationThe most common indications for referral in our patients were DD/MR, DF, MCA, SD, andautism. The detection rates for subtelomeric rearrangements in patients with these differentreferral indications ranged from 1.1% to 5.7%, with the lowest observed in patients with autismand the highest in patients with DD/MR with DF and/or MCA (Table I). For patients with asimple deletion or duplication, patients with a more severe phenotype (DF, MCA) tend to havean increased percentage in the detected imbalances of >3 Mb as compared to those of ≤3 Mb.However, there was no significant difference between the percentage distribution ofimbalances >3 Mb and that of ≤3 Mb based on a small sample size (Table II). Interestingly,among abnormalities detected in 24 patients submitted with a clinical indication of MCA, sixpatients submitted by six different clinicians had a deletion at 4q35 (four patients had a 4q35deletion and two patients had an unbalanced translocation; Fig. 1). In other patient groups,subtelomeric imbalances were relatively distributed among chromosomes and any associationbetween the referring phenotype and specific chromosomal abnormality was not readilyapparent.
Detection Rates Vary With Cytogenetic FindingsWe grouped the clinically significant chromosomal imbalances in subtelomeric regions intothree categories: (1) simple deletions (103 patients) or duplications (58 patients); (2)unbalanced translocations (44 patients); and (3) complex rearrangements (31 patients).
We also grouped our patients into three categories according to their previous or parallelcytogenetic analysis (Table III): 2,550 patients (47.4%) with normal karyotype analysis; (2)175 patients (3.2%) had an abnormal karyotype analysis; (3) 2655 patients (49.3%) had no orunavailable karyotype analysis. Seventy-six subtelomeric rearrangements were found amongpatients with an abnormal karyotype analysis. Other chromosomal abnormalities were eitherbeyond the subtelomeric regions or balanced rearrangements, therefore were not included inthis paper or could not be identified by our targeted array-CGH, respectively. As anticipated
Shao et al. Page 4
Am J Med Genet A. Author manuscript; available in PMC 2009 September 1.
NIH
-PA Author Manuscript
NIH
-PA Author Manuscript
NIH
-PA Author Manuscript

for the array-CGH analysis, this was the group with the highest abnormality detection rate of43.4%, among which were 31 simple deletions, four simple duplications, 23 unbalancedtranslocations, and 18 complex rearrangements. The smallest visible rearrangement was 2.5Mb. The CMA results were concordant with the karyotype analysis. Eighty-four subtelomericrearrangements (36 simple deletions, 24 duplications, 12 unbalanced translocations, and 12complex rearrangements) were found among patients with no or unavailable karyotype analysiswith a detection rate of 3.16%. The remaining 76 subtelomeric rearrangements (36 simpledeletions, 30 simple duplications, nine unbalanced translocations, and one complexrearrangement) were found in patients with a normal karyotype analysis; the group with thelowest detection rate of 2.98%. Eight deletions, five duplications, and four unbalancedtranslocations with an estimated size ≥5 Mb were initially not detected by karyotype analysis,although in retrospect, some of them were apparent.
Two hundred seventy-eight patients had a previous normal subtelomere-FISH analysis. Amongthem six subtelomeric rearrangements were identified by CMA (an interstitial deletion at1p36.3 and 10q26, a terminal duplication at 4q35, and three interstitial duplications at Xq28).As expected, a previously identified apparently balanced translocation and a pericentricinversion were not resolved by array-CGH. Two terminal deletions in the long arm ofacrocentric chromosomes identified by array-CGH were found to involve a ring chromosomeby karyotype analysis. A mosaic deletion identified in approximately 75% of cells wasdiscerned by both array-CGH and concurrent karyotype analysis.
Simple Subtelomeric Rearrangements Vary in Size and Often Evade Detection byConventional Cytogenetics Techniques
Figure 2 shows the chromosomal distribution by arm (p or q) for simple imbalances. The mostcommonly detected subtelomeric alterations were 1p36.3 deletion (15), 22q13.3 deletion (10),and Xq28 duplication involving MECP2 gene (16), comprising 25% of all simple subtelomericimbalances.
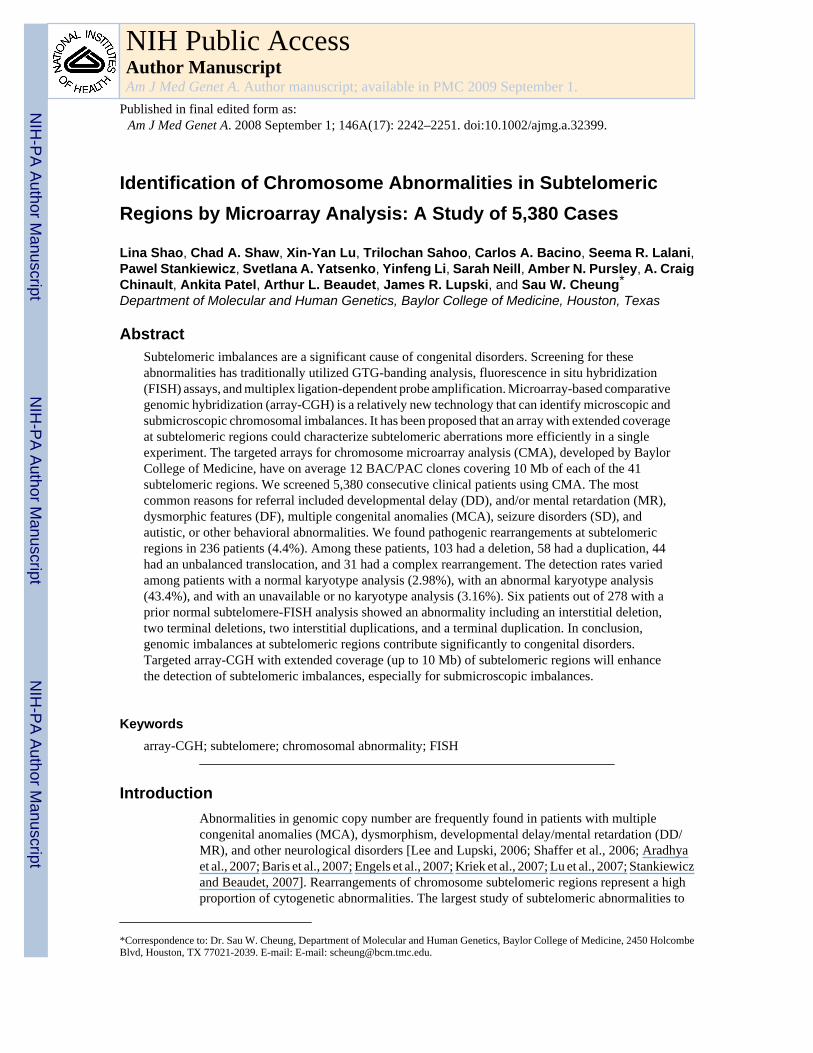
Figure 3 shows the regions and estimated sizes of the simple deletions and duplications. Themajority of deleted (91/103=88.3%) and duplicated (51/58=87.9%) genomic intervals werelocated in or extended from the terminal 5 Mb. The rearrangements were interstitial in 39/103(37.9%) deletions and 44/58 (75.9%) duplications.
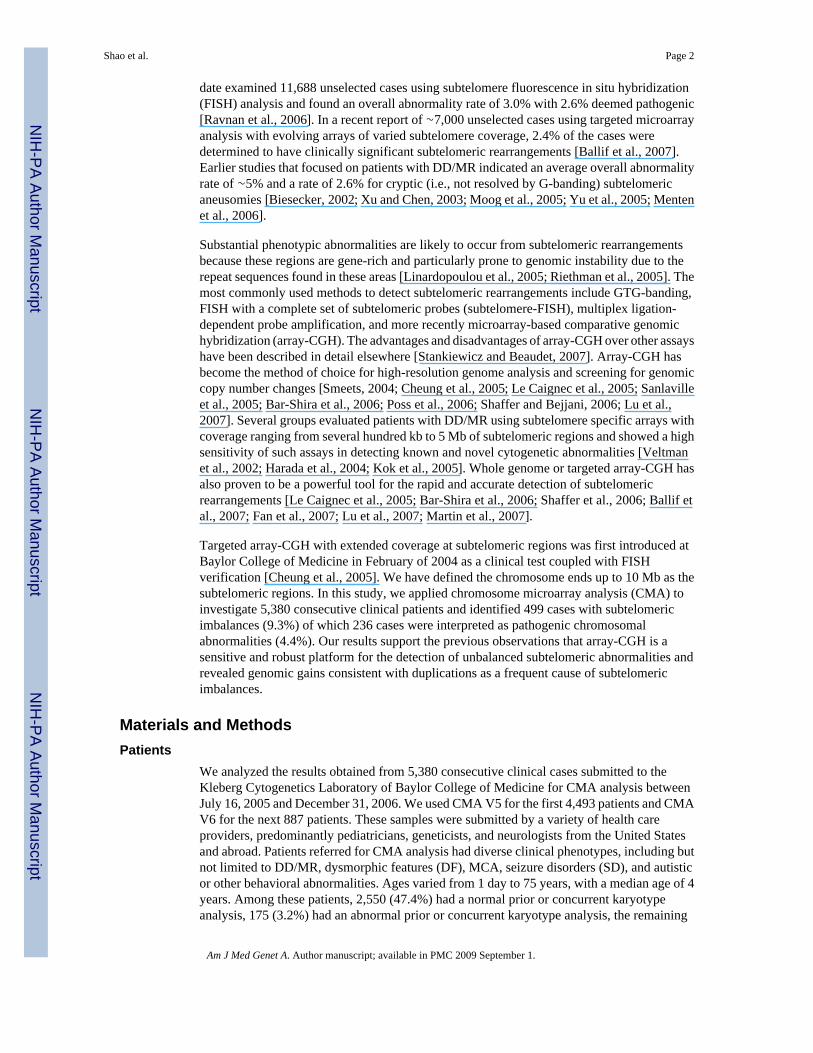
Figure 4 shows the cumulative percentage distribution of simple imbalances by size.Rearrangements ≤3 Mb in size constituted 42.7% (44/103) of the deletions and 79.3% (46/58)of the duplications, the majority of which would not be identified by karyotype analysis alone.
DiscussionThe detection rate of clinically significant chromosomal imbalances is ∼9.6% using targetedarray CMA V5 and ∼13.5% for targeted array CMA V6 (unpublished data). Therefore, theabnormality rate detected of 4.4% (4.4% in V5 and 4.1% in V6) in subtelomeric regions in thispatient cohort is about 46% of all the genomic abnormalities identified by CMA V5 and 30%of those identified by CMA V6. The subtelomeric regions are covered at a higher density thanthe average interstitial region in the genome; therefore, it is unclear whether subtelomericregions are more frequently affected than interstitial genomic regions in this patient cohort.
The overall disease-related subtelomeric aberrations in patients with DD/MR has beenestimated as 5%, ranging from 0% to 23% depending on the sample size and patientascertainment criteria [Biesecker, 2002; Xu and Chen, 2003; Moog et al., 2005; Yu et al.,2005; Menten et al., 2006]. The detection rate is higher in patients with a severe phenotypethan in patients with a milder phenotype [Knight et al., 1999]. Our detection rate of 4.4%,
Shao et al. Page 5
Am J Med Genet A. Author manuscript; available in PMC 2009 September 1.
NIH
-PA Author Manuscript
NIH
-PA Author Manuscript
NIH
-PA Author Manuscript

which reflects pathogenic subtelomeric rearrangements in unselected patients, regardless ofthe severity of DD/MR or presence of other indications, is significantly higher than that in thelargest published study of similarly unselected patients (N=11,688 patients, detectionrate=2.6%) using a subtelomere- FISH assay (Table IV, P≤0.01) [Ravnan et al., 2006]. Themost likely reasons for this detection rate difference are that array-CGH has greater coverageat the subtelomeric regions than FISH (10 Mb vs. 200 kb) and duplications are difficult toidentify using FISH analysis. Our detection rate is also higher than that in a recently publishedstudy using targeted array-CGH [Ballif et al., 2007]. The latter study had the similarlyunselected patients regarding referral indication with the exception that only patients with noknown cytogenetic abnormalities were included. Therefore, we excluded samples with knowncytogenetic abnormalities from the current database and the detection rate for patients with anormal or no chromosome study at referral was 3.6%, still significantly higher than 2.4% (TableIV, P≤0.01). The main difference between the current study and that of Ballif et al. is that wereported 58 duplications as abnormal whereas none is reported in their study. The mostcommonly identified duplications in our patients were Xq28 duplications involving MECP2gene (16/58). This may reflect our use of gender matched controls in the CGH versus the gendermismatched approaches of Ballif et al. (data not shown). The frequency of deletion in our studyis slightly higher than their study (1.69% vs. 1.58%), however, it does not reach statisticalsignificance. The frequencies of unbalanced translocation and complex rearrangements differbetween the two studies, however, the combined frequency is similar (this study versus Ballifet al.: 0.92% vs. 0.85%), presumably the classification of complex rearrangements may bedifferent between the two studies.
Contrary to what can be inferred from the literature, we found that duplications occurredfrequently in the subtelomeric regions. The number of reported deletions is much higher thanthe number of duplications, which likely reflects both ascertainment bias and limitations ofavailable diagnostic methods. Duplications may result in milder phenotypes, or certaincharacteristic features that are different to those of the corresponding deletions [Somerville etal., 2005; Berg et al., 2007; Kirchhoff et al., 2007], and consequently, patients may not presentfor clinical evaluation. In this patient cohort, the indication for referral for CMA is usuallygeneral and its value to reflect the detailed clinical phenotype is limited. Therefore, phenotypicconsequence of gains versus losses for the same genomic interval is impossible to discern giventhe limited clinical information. In addition, duplication may evade detection by conventionalcytogenetic techniques. The majority of subtelomeric duplications detected were ≤3 Mb in sizeand not detectable by chromosome analysis, and were interstitial in position and not detectableby subtelomere-FISH. With the wider application of microarray and whole genome scans, moreduplication syndromes are likely to be defined.
In this study, the most commonly observed duplications were at Xq28 region. Xq28 deletioncausing loss of function of MECP2 is associated with Rett syndrome in females. Duplicationsof this region causing increased dosage of MECP2 has been associated withneurodevelopmental delay in males [Van Esch et al., 2005; del Gaudio et al., 2006]. All patients(N=16) with an Xq28 duplication were male in this cohort. The increasing number ofduplications at this region supports that it may be a common cause of DD in males. The sizeof duplication at Xq28 ranging from 0.8 to 2.5 Mb, is similar to the literature reports (0.2–2Mb). The different sizes and breakpoints of Xq28 duplication in 5 of the 16 patients have beenreported elsewhere [del Gaudio et al., 2006]. Variously oriented low copy repeats (LCRs) arefound scattered throughout a ∼4 Mb region flanking MECP2, suggesting the potentialinvolvement of these LCRs stimulating the rearrangements [Van Esch et al., 2005; del Gaudioet al., 2006; Bauters et al., 2008].
One of the limitations of conventional cytogenetics testing is genomic resolution. At the usual550-band level, the resolution is limited to 5–10 Mb. We detected 90 simple imbalances by
Shao et al. Page 6
Am J Med Genet A. Author manuscript; available in PMC 2009 September 1.
NIH
-PA Author Manuscript
NIH
-PA Author Manuscript
NIH
-PA Author Manuscript

array-CGH with a size ≤3 Mb, which would likely be missed by karyotype analysis. We alsofound subtelomeric imbalances in 76 patients with normal karyotypes results. As anticipated,array-CGH could not detect an apparently balanced translocation nor an inversion. Therefore,when a microarray result is normal and a chromosome anomaly is still suspected based on theclinical phenotype, a karyotype analysis should be considered. Array-CGH detects imbalancesof CNVs, but provides no positional nor orientation information. Array-CGH may reveal agenomic change (i.e., duplication), but FISH analysis is necessary to determine if the duplicatedgenomic segment has been transposed to a new position. Targeted arrays have limited coveragein non-disease regions, challenging one to estimate the size of deletion or duplication when itonly involves backbone clones due to the lack of clone coverage at the vicinity. High densitywhole genome oligonucleotide array has the capacity to detect more copy number changes andresolve smaller CNVs than high density whole genome BAC array [Aradhya et al., 2007]. Withthe evolving knowledge of CNVs, whole genome oligonucleotide arrays with higher densitywill eventually replace the BAC arrays and targeted arrays in clinical cytogenetics.
We observed the enrichment of 4q35 deletions in patients with MCA. Cytogenetically visibledeletions of 4q31–q35 are associated with clefting craniofacial malformations andmicrognathia [Brewer et al., 1998]. Small terminal deletions of 4q do not seem to lead to grossabnormalities and the predominant clinical feature is mild to moderate MR/learning disabilityand minor DF. One of the known disorders mapping to 4q35.1–q35.2 is facioscapulohumeralmuscular dystrophy 1A (FSHMD1A), wherein the underlying defect is suggested to be acontraction of the subtelomeric macrosatellite repeat D4Z4 at 4q35 [Tupler and Gabellini,2004]. Patients with 4q35 deletions do not have FSHMD symptoms [Tupler et al., 1996;Pickard et al., 2004]. Among our patients with 4q35 deletions, six had MCA with either DD/MR, DF, or SD, one had DF only, and one had respiratory distress syndrome and asthmaexacerbation. Further study into the potential association of 4q35 deletion and MCA is ongoing.
A large fraction of copy number changes (175/499=35%) was interpreted as familial variantsor with unknown clinical significance (88/499=18%), among which over half were consistentwith the CNVs archived in public database. CNVs average 250 kb in size encompassing ∼18%of the euchromatic genome, and overlap with genes frequently and may play a major role inphenotypic variation [Bechmann et al., 2007; Lupski, 2007; Scherer et al., 2007]. Theinterpretation of copy number changes is complicated by the frequent occurrence of CNVs inboth patients and the normal population [Lee et al., 2007]. Familial subtelomeric abnormalitieshave been observed in over 50% of the families [Adeyinka et al., 2005], which makes parentalstudies essential in interpreting subtelomeric copy number changes. However, the lack ofaccessibility of family members for testing, incomplete penetrance, the clinical variability ofchromosomal abnormalities, and multiple potential mechanisms (e.g., unmasking of recessivealleles) by which rearrangements may convey phenotypes [Lupski and Stankiewicz, 2005], arefactors complicating interpretation. It will be possible to avoid segmental duplications with theapplication of oligonucleotide arrays into cytogenetics and interpret the contribution of CNVsto a phenotype using the evolving knowledge and expanding databases characterizing CNVs.It has been reported that ∼6% of the CNVs in the apparently healthy population are >1 Mb insize [de Smith et al., 2007]. Caution should be exercised in explaining large copy numberchanges when the inheritance is unknown.
In conclusion, this study demonstrates that genomic imbalances at subtelomeric regionscontribute significantly to congenital disorders. The application of array-CGH with extendedcoverage at subtelomeric regions will likely reveal more submicroscopic syndromes andparticularly reveal novel duplication syndromes.
Shao et al. Page 7
Am J Med Genet A. Author manuscript; available in PMC 2009 September 1.
NIH
-PA Author Manuscript
NIH
-PA Author Manuscript
NIH
-PA Author Manuscript

AcknowledgementsWe thank all the referring physicians, patients and their families for their participation. We also thank all our colleaguesand coworkers from the CMA lab, Array Production lab, Cytogenetic/FISH lab, and DNA Diagnostic lab for theircontributions and support.
ReferencesAdeyinka A, Adams SA, Lorentz CP, Van Dyke DL, Jalal SM. Subtelomere deletions and translocations
are frequently familial. Am J Med Genet Part A 2005;135A:28–35.Aradhya S, Manning MA, Splendore A, Cherry AM. Whole-genome array-CGH identifies novel
contiguous gene deletions and duplications associated with developmental delay, mental retardation,and dysmorphic features. Am J Med Genet Part A 2007;143A:1431–1441.
Ballif BC, Sulpizio SG, Lloyd RM, Minier SL, Theisen A, Bejjani BA, Shaffer LG. The clinical utilityof enhanced subtelomeric coverage in array CGH. Am J Med Genet Part A 2007;143A:1850–1857.
Baris HN, Tan WH, Kimonis VE, Irons MB. Diagnostic utility of array-based comparative genomichybridization in a clinical setting. Am J Med Genet Part A 2007;143A:2523–2533.
Bar-Shira A, Rosner G, Rosner S, Goldstein M, Orr-Urtreger A. Array-based comparative genomehybridization in clinical genetics. Pediatr Res 2006;60:353–358. [PubMed: 16857771]
Bauters M, Van Esch H, Friez MJ, Boespflug-Tanguy O, Zenker M, Vianna-Morgante AM, RosenbergC, Ignatius J, Raynaud M, Hollanders K, Govaerts K, Vandenreijt K, Niel F, Blanc P, Stevenson RE,Fryns JP, Marynen P, Schwartz CE, Froyen G. Nonrecurrent MECP2 duplications mediated bygenomic architecture-driven DNA breaks and break-induced replication repair. Genome Res2008;18:847–858. [PubMed: 18385275]
Bechmann JS, Estivill X, SE A. Copy number variants and genetic traits: Closer to the resolution ofphenotypic to genotypic variability. Nat Rev Genet 2007;8:639–646. [PubMed: 17637735]
Berg JS, Brunetti-Pierri N, Peters SU, Kang SH, Fong CT, Salamone J, Freedenberg D, Hannig VL, ProckLA, Miller DT, Raffalli P, Harris DJ, Erickson RP, Cunniff C, Clark GD, Blazo MA, Peiffer DA,Gunderson KL, Sahoo T, Patel A, Lupski JR, Beaudet AL, Cheung SW. Speech delay and autismspectrum behaviors are frequently associated with duplication of the 7q11.23 Williams-Beurensyndrome region. Genet Med 2007;9:427–441. [PubMed: 17666889]
Biesecker LG. The end of the beginning of chromosome ends. Am J Med Genet 2002;107:263–266.[PubMed: 11840481]
Brewer C, Holloway S, Zawalnyski P, Schinzel A, FitzPatrick D. A chromosomal deletion map of humanmalformations. Am J Hum Genet 1998;63:1153–1159. [PubMed: 9758599]
Cheung SW, Shaw CA, Yu W, Li J, Ou Z, Patel A, Yatsenko SA, Cooper ML, Furman P, StankiewiczP, Lupski JR, Chinault AC, Beaudet AL. Development and validation of a CGH microarray forclinical cytogenetic diagnosis. Genet Med 2005;7:422–432. [PubMed: 16024975]
de Smith AJ, Tsalenko A, Sampas N, Scheffer A, Yamada NA, Tsang P, Ben-Dor A, Yaknini Z, EllisRJ, Bruhn L, Laderman S, Froguel P, Blakemore AI. Array CGH analysis of copy number variationidentifies 1284 new genes variant in healthy white males: Implications for association studies ofcomplex diseases. Hum Mol Genet 2007;16:2783–2794. [PubMed: 17666407]
del Gaudio D, Fang P, Scaglia F, Ward PA, Craigen WJ, Glaze DG, Neul JL, Patel A, Lee JA, Irons M,Berry SA, Pursley AA, Grebe TA, Freedenberg D, Martin RA, Hsich GE, Khera JR, Friedman NR,Zoghbi HY, Eng CM, Lupski JR, Beaudet AL, Cheung SW, Roa BB. Increased MECP2 gene copynumber as the result of genomic duplication in neurodevelopmentally delayed males. Genet Med2006;8:784–792. [PubMed: 17172942]
Engels H, Brockschmidt A, Hoischen A, Landwehr C, Bosse K, Walldorf C, Toedt G, Radlwimmer B,Propping P, Lichter P, Weber RG. DNA microarray analysis identifies candidate regions and genesin unexplained mental retardation. Neurology 2007;68:743–750. [PubMed: 17339581]
Fan YS, Jayakar P, Zhu H, Barbouth D, Sacharow S, Morales A, Carver V, Benke P, Mundy P, Elsas LJ.Detection of pathogenic gene copy number variations in patients with mental retardation bygenomewide oligonucleotide array comparative genomic hybridization. Hum Mutat 2007;28:1124–1132. [PubMed: 17621639]
Shao et al. Page 8
Am J Med Genet A. Author manuscript; available in PMC 2009 September 1.
NIH
-PA Author Manuscript
NIH
-PA Author Manuscript
NIH
-PA Author Manuscript
Harada N, Hatchwell E, Okamoto N, Tsukahara M, Kurosawa K, Kawame H, Kondoh T, Ohashi H,Tsukino R, Kondoh Y, Shimokawa O, Ida T, Nagai T, Fukushima Y, Yoshiura K, Niikawa N,Matsumoto N. Subtelomere specific micro-array based comparative genomic hybridisation: A rapiddetection system for cryptic rearrangements in idiopathic mental retardation. J Med Genet2004;41:130–136. [PubMed: 14757861]
Kirchhoff M, Bisgaard AM, Bryndorf T, Gerdes T. MLPA analysis for a panel of syndromes with mentalretardation reveals imbalances in 5.8% of patients with mental retardation and dysmorphic features,including duplications of the Sotos syndrome and Williams-Beuren syndrome regions. Eur J MedGenet 2007;50:33–42. [PubMed: 17090394]
Knight SJ, Regan R, Nicod A, Horsley SW, Kearney L, Homfray T, Winter RM, Bolton P, Flint J. Subtlechromosomal rearrangements in children with unexplained mental retardation. Lancet1999;354:1676–1681. [PubMed: 10568569]
Kok K, Dijkhuizen T, Swart YE, Zorgdrager H, van der Vlies P, Fehrmann R, te Meerman GJ, Gerssen-Schoorl KB, van Essen T, Sikkema-Raddatz B, Buys CH. Application of a comprehensivesubtelomere array in clinical diagnosis of mental retardation. Eur J Med Genet 2005;48:250–262.[PubMed: 16179221]
Kriek M, Knijnenburg J, White SJ, Rosenberg C, den Dunnen JT, van Ommen GJ, Tanke HJ, BreuningMH, Szuhai K. Diagnosis of genetic abnormalities in developmentally delayed patients: A newstrategy combining MLPA and array-CGH. Am J Med Genet Part A 2007;143A:610–614.
Le Caignec C, Boceno M, Saugier-Veber P, Jacquemont S, Joubert M, David A, Frebourg T, Rival JM.Detection of genomic imbalances by array based comparative genomic hybridisation in fetuses withmultiple malformations. J Med Genet 2005;42:121–128. [PubMed: 15689449]
Lee JA, Lupski JR. Genomic rearrangements and gene copy-number alterations as a cause of nervoussystem disorders. Neuron 2006;52:103–121. [PubMed: 17015230]
Lee C, Iafrate AJ, Brothman AR. Copy number variations and clinical cytogenetic diagnosis ofconstitutional disorders. Nat Genet 2007;39:S48–S54. [PubMed: 17597782]
Linardopoulou EV, Williams EM, Fan Y, Friedman C, Young JM, Trask BJ. Human subtelomeres arehot spots of interchromosomal recombination and segmental duplication. Nature 2005;437:94–100.[PubMed: 16136133]
Lu X, Shaw CA, Patel A, Li J, Cooper ML, Wells WR, Sullivan CM, Sahoo T, Yatsenko SA, BacinoCA, Stankiewicz P, Ou Z, Chinault AC, Beaudet AL, Lupski JR, Cheung SW, Ward PA. Clinicalimplementation of chromosomal microarray analysis: Summary of 2513 postnatal cases. PLoS ONE2007;2:e327. [PubMed: 17389918]
Lupski JR. Genomic disorders: Structural features of the genome can lead to DNA rearrangements andhuman disease traits. Trends Genet 1998;14:417–422. [PubMed: 9820031]
Lupski JR. Genomic rearrangements and sporadic disease. Nat Genet 2007;39:S43–S47. [PubMed:17597781]
Lupski JR, Stankiewicz P. Genomic disorders: Molecular mechanisms for rearrangements and conveyedphenotypes. Plos Genet 2005;1:e49. [PubMed: 16444292]
Martin CL, Nawaz Z, Baldwin EL, Wallace EJ, Justice AN, Ledbetter DH. The evolution of molecularruler analysis for characterizing telomere imbalances: From fluorescence in situ hybridization to arraycomparative genomic hybridization. Genet Med 2007;9:566–573. [PubMed: 17873644]
Menten B, Maas N, Thienpont B, Buysse K, Vandesompele J, Melotte C, de Ravel T, Van Vooren S,Balikova I, Backx L, Janssens S, De Paepe A, De Moor B, Moreau Y, Marynen P, Fryns JP, MortierG, Devriendt K, Speleman F, Vermeesch JR. Emerging patterns of cryptic chromosomal imbalancein patients with idiopathic mental retardation and multiple congenital anomalies: A new series of 140patients and review of published reports. J Med Genet 2006;43:625–633. [PubMed: 16490798]
Moog U, Arens YH, van Lent-Albrechts JC, Huijts PE, Smeets EE, Schrander-Stumpel CT, Engelen JJ.Subtelomeric chromosome aberrations: Still a lot to learn. Clin Genet 2005;68:397–407. [PubMed:16207207]
Pickard BS, Hollox EJ, Malloy MP, Porteous DJ, Blackwood DH, Armour JA, Muir WJ. A 4q35.2subtelomeric deletion identified in a screen of patients with co-morbid psychiatric illness and mentalretardation. BMC Med Genet 2004;5:21. [PubMed: 15310400]
Shao et al. Page 9
Am J Med Genet A. Author manuscript; available in PMC 2009 September 1.
NIH
-PA Author Manuscript
NIH
-PA Author Manuscript
NIH
-PA Author Manuscript
Poss AF, Goldenberg PC, Rehder CW, Kearney HM, Melvin EC, Koeberl DD, McDonald MT. Clinicalexperience with array CGH: Case presentations from nine months of practice. Am J Med Genet PartA 2006;140A:2050–2056.
Ravnan JB, Tepperberg JH, Papenhausen P, Lamb AN, Hedrick J, Eash D, Ledbetter DH, Martin CL.Subtelomere FISH analysis of 11 688 cases: An evaluation of the frequency and pattern ofsubtelomere rearrangements in individuals with developmental disabilities. J Med Genet2006;43:478–489. [PubMed: 16199540]
Riethman H, Ambrosini A, Paul S. Human subtelomere structure and variation. Chromosome Res2005;13:505–515. [PubMed: 16132815]
Sanlaville D, Lapierre JM, Turleau C, Coquin A, Borck G, Colleaux L, Vekemans M, Romana SP.Molecular karyotyping in human constitutional cytogenetics. Eur J Med Genet 2005;48:214–231.[PubMed: 16179218]
Scherer SW, Lee C, Birney E, Altshuler DM, Eichler EE, Carter NP, Hurles ME, Feuk L. Challengesand standards in integrating surveys of structural variation. Nat Genet 2007;39:S7–S15. [PubMed:17597783]
Shaffer LG, Bejjani BA. Medical applications of array CGH and the transformation of clinicalcytogenetics. Cytogenet Genome Res 2006;115:303–309. [PubMed: 17124414]
Shaffer LG, Kashork CD, Saleki R, Rorem E, Sundin K, Ballif BC, Bejjani BA. Targeted genomicmicroarray analysis for identification of chromosome abnormalities in 1500 consecutive clinicalcases. J Pediatr 2006;149:98–102. [PubMed: 16860135]
Smeets DF. Historical prospective of human cytogenetics: From microscope to microarray. Clin Biochem2004;37:439–446. [PubMed: 15183291]
Somerville MJ, Mervis CB, Young EJ, Seo EJ, del Campo M, Bamforth S, Peregrine E, Loo W, LilleyM, Perez-Jurado LA, Morris CA, Scherer SW, Osborne LR. Severe expressive-language delay relatedto duplication of the Williams-Beuren locus. N Engl J Med 2005;353:1694–1701. [PubMed:16236740]
Stankiewicz P, Beaudet AL. Use of array CGH in the evaluation of dysmorphology, malformations,developmental delay, and idiopathic mental retardation. Curr Opin Genet Dev 2007;17:182–192.[PubMed: 17467974]
Trask BJ. Fluorescence in situ hybridization: Applications in cytogenetics and gene mapping. TrendsGenet 1991;7:149–154. [PubMed: 2068787]
Tupler R, Gabellini D. Molecular basis of facioscapulohumeral muscular dystrophy. Cell Mol Life Sci2004;61:557–566. [PubMed: 15004695]
Tupler R, Berardinelli A, Barbierato L, Frants R, Hewitt JE, Lanzi G, Maraschio P, Tiepolo L. Monosomyof distal 4q does not cause facioscapulohumeral muscular dystrophy. J Med Genet 1996;33:366–370.[PubMed: 8733044]
Van Esch H, Bauters M, Ignatius J, Jansen M, Raynaud M, Hollanders K, Lugtenberg D, Bienvenu T,Jensen LR, Gecz J, Moraine C, Marynen P, Fryns JP, Froyen G. Duplication of the MECP2 regionis a frequent cause of severe mental retardation and progressive neurological symptoms in males.Am J Hum Genet 2005;77:442–453. [PubMed: 16080119]
Veltman JA, Schoenmakers EF, Eussen BH, Janssen I, Merkx G, van Cleef B, van Ravenswaaij CM,Brunner HG, Smeets D, van Kessel AG. High-throughput analysis of subtelomeric chromosomerearrangements by use of array-based comparative genomic hybridization. Am J Hum Genet2002;70:1269–1276. [PubMed: 11951177]
Xu J, Chen Z. Advances in molecular cytogenetics for the evaluation of mental retardation. Am J MedGenet Part C Semin Med Genet 2003;117C:15–24.
Yu S, Baker E, Hinton L, Eyre HJ, Waters W, Higgins S, Sutherland GR, Haan E. Frequency of trulycryptic subtelomere abnormalities—A study of 534 patients and literature review. Clin Genet2005;68:436–441. [PubMed: 16207211]
Shao et al. Page 10
Am J Med Genet A. Author manuscript; available in PMC 2009 September 1.
NIH
-PA Author Manuscript
NIH
-PA Author Manuscript
NIH
-PA Author Manuscript
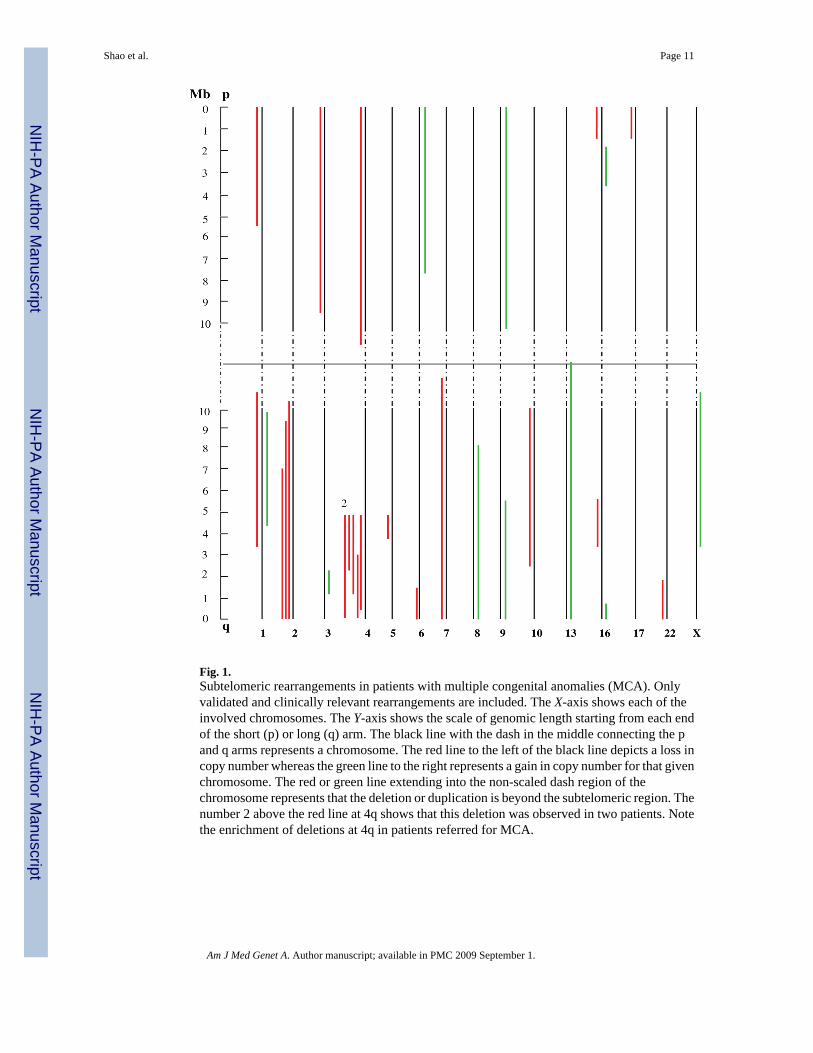
Fig. 1.Subtelomeric rearrangements in patients with multiple congenital anomalies (MCA). Onlyvalidated and clinically relevant rearrangements are included. The X-axis shows each of theinvolved chromosomes. The Y-axis shows the scale of genomic length starting from each endof the short (p) or long (q) arm. The black line with the dash in the middle connecting the pand q arms represents a chromosome. The red line to the left of the black line depicts a loss incopy number whereas the green line to the right represents a gain in copy number for that givenchromosome. The red or green line extending into the non-scaled dash region of thechromosome represents that the deletion or duplication is beyond the subtelomeric region. Thenumber 2 above the red line at 4q shows that this deletion was observed in two patients. Notethe enrichment of deletions at 4q in patients referred for MCA.
Shao et al. Page 11
Am J Med Genet A. Author manuscript; available in PMC 2009 September 1.
NIH
-PA Author Manuscript
NIH
-PA Author Manuscript
NIH
-PA Author Manuscript

Fig. 2.Submicroscopic imbalances in subtelomeric regions. Include only validated and clinicallyrelevant rearrangements. On the X-axis are shown the short (p) and long (q) arms of eachchromosome. The Y-axis (bar graph) displays the number of events detected for eachsubtelomeric rearrangement. Red bars represent loss whereas green bars represent gain. Notethe most frequently identified rearrangements map to 1p, 22q, and Xq. [Color figure can beviewed in the online issue, which is available at www.interscience.wiley.com.]
Shao et al. Page 12
Am J Med Genet A. Author manuscript; available in PMC 2009 September 1.
NIH
-PA Author Manuscript
NIH
-PA Author Manuscript
NIH
-PA Author Manuscript
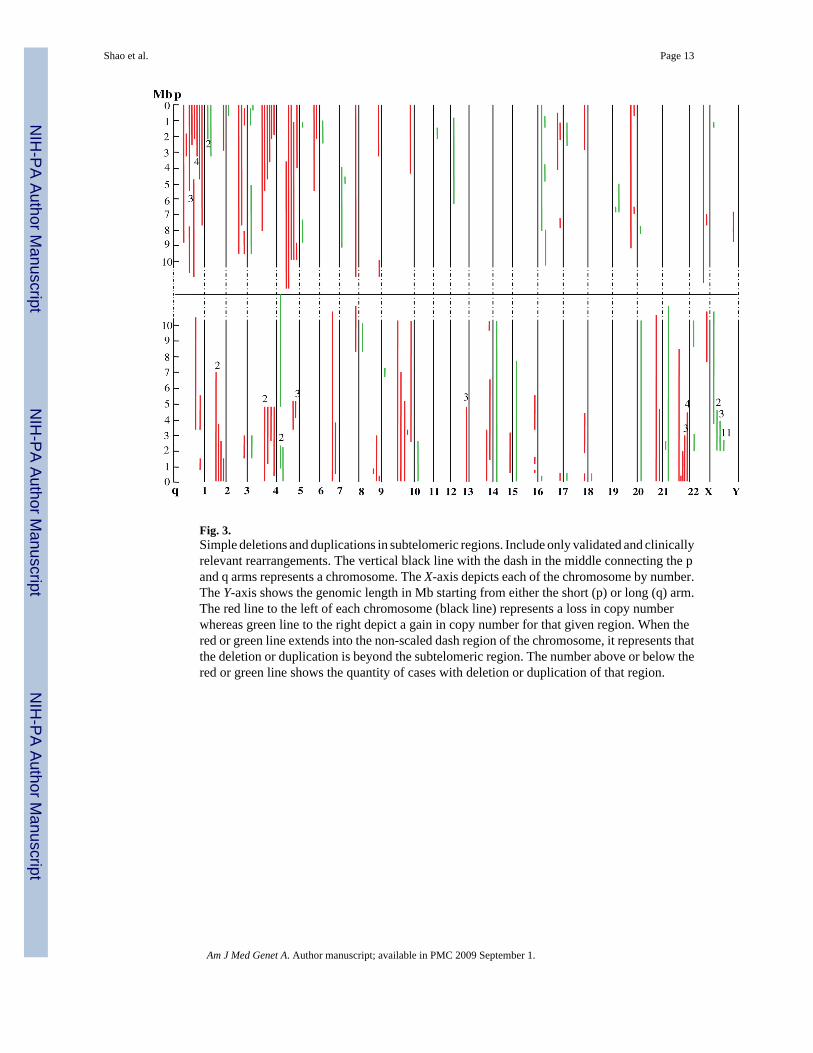
Fig. 3.Simple deletions and duplications in subtelomeric regions. Include only validated and clinicallyrelevant rearrangements. The vertical black line with the dash in the middle connecting the pand q arms represents a chromosome. The X-axis depicts each of the chromosome by number.The Y-axis shows the genomic length in Mb starting from either the short (p) or long (q) arm.The red line to the left of each chromosome (black line) represents a loss in copy numberwhereas green line to the right depict a gain in copy number for that given region. When thered or green line extends into the non-scaled dash region of the chromosome, it represents thatthe deletion or duplication is beyond the subtelomeric region. The number above or below thered or green line shows the quantity of cases with deletion or duplication of that region.
Shao et al. Page 13
Am J Med Genet A. Author manuscript; available in PMC 2009 September 1.
NIH
-PA Author Manuscript
NIH
-PA Author Manuscript
NIH
-PA Author Manuscript
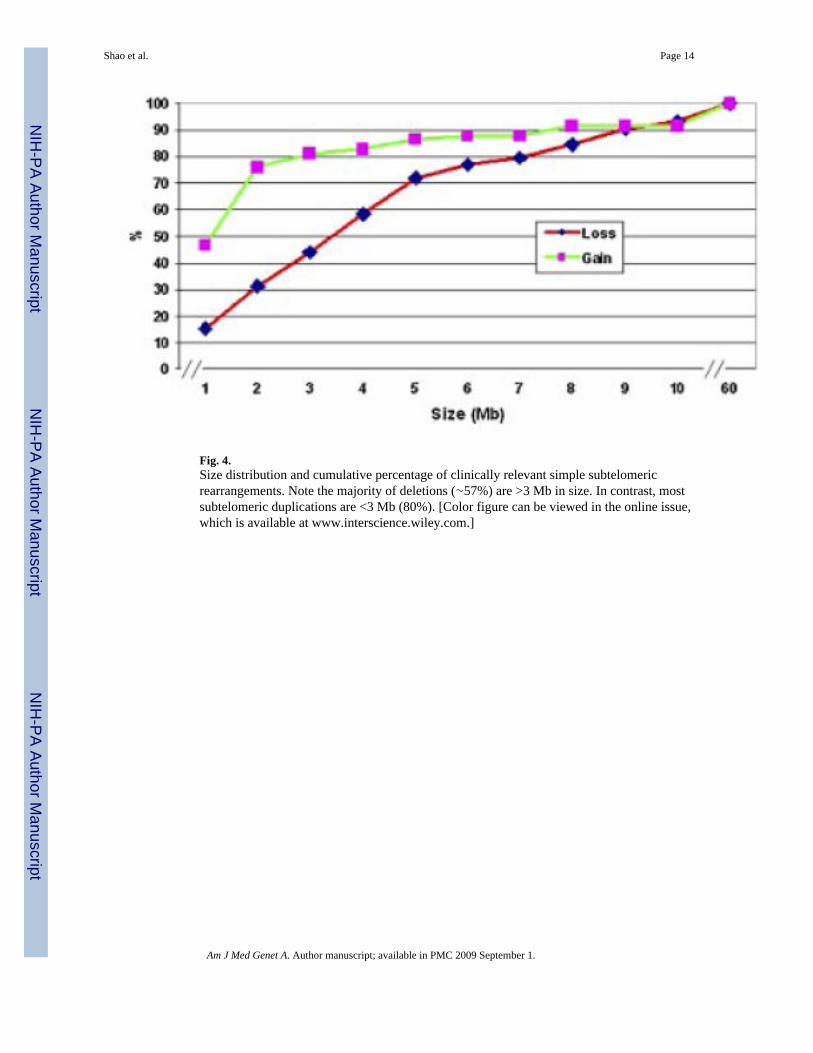
Fig. 4.Size distribution and cumulative percentage of clinically relevant simple subtelomericrearrangements. Note the majority of deletions (∼57%) are >3 Mb in size. In contrast, mostsubtelomeric duplications are <3 Mb (80%). [Color figure can be viewed in the online issue,which is available at www.interscience.wiley.com.]
Shao et al. Page 14
Am J Med Genet A. Author manuscript; available in PMC 2009 September 1.
NIH
-PA Author Manuscript
NIH
-PA Author Manuscript
NIH
-PA Author Manuscript
NIH
-PA Author Manuscript
NIH
-PA Author Manuscript
NIH
-PA Author Manuscript
Shao et al. Page 15
TABLE IDetection Rates of Subtelomeric Imbalances Vary With Referral Clinical Indication
Clinical indication Total sample (N) Abnormal case (N) Detection rate (%)
DD/MR 1,813 69 3.8
DD/MR + DF and/or MCA 992 57 5.7b
DF, MCA or both 801 42 5.2
Autism 446 5 1.1c
Othersa 1,328 63 4.7
Total 5,380 236 4.4
aIncluding indications such as seizure disorders, failure to thrive, short stature, etc., and patients with no referral indications (110 in total samples and 23
in abnormal cases).
bThe detection rate is significantly higher than those of DD/MR, and Autism (Chi-square, P<0.05).
cThe detection rate is significantly lower than all of the others (Chi-square, P<0.05). DD/MR, development delay/mental retardation; DF, dysmorphic
feature; MCA, multiple congenital anomalies.
Am J Med Genet A. Author manuscript; available in PMC 2009 September 1.

NIH
-PA Author Manuscript
NIH
-PA Author Manuscript
NIH
-PA Author Manuscript
Shao et al. Page 16TA
BLE
IIA
ssoc
iatio
n B
etw
een
the
Size
of S
impl
e Su
btel
omer
ic Im
bala
nces
and
Clin
ical
Indi
catio
n
DD
/MR
, N (%
)D
D/M
R +
DF
or M
CA
, N (%)
DF,
MC
A o
r bo
th, N
(%)
Oth
ersa , N
(%)
Tot
al
Del
etio
nb
≤3
Mb
15 (3
4.1)
11 (2
5)6
(13.
6)12
(27.
3)44
>3
Mb
18 (3
0.5)
13 (2
2)13
(22)
15 (2
5.4)
59
Dup
licat
ionb
≤3
Mb
20 (4
3.5)
8 (1
7.4)
5 (1
0.9)
13 (2
8.2)
46
>3
Mb
4 (3
3.3)
4 (3
3.3)
3 (2
5)1
(8.3
)12
a Incl
udin
g in
dica
tions
such
as a
utis
m, s
eizu
re d
isor
ders
, fai
lure
to th
rive,
shor
t sta
ture
, etc
., an
d pa
tient
s with
no
refe
rral
indi
catio
ns (2
3 ca
ses)
.
b Ther
e is
no
sign
ifica
nt d
iffer
ence
bet
wee
n th
e pe
rcen
tage
dis
tribu
tion
in im
bala
nces
of >
3 M
b an
d th
at o
f ≤3
Mb
(Chi
-squ
are,
P v
alue
s >0.
05).
DD
/MR
, dev
elop
men
t del
ay/m
enta
l ret
arda
tion;
DF,
dysm
orph
ic fe
atur
e; M
CA
, mul
tiple
con
geni
tal a
nom
alie
s.
Am J Med Genet A. Author manuscript; available in PMC 2009 September 1.

NIH
-PA Author Manuscript
NIH
-PA Author Manuscript
NIH
-PA Author Manuscript
Shao et al. Page 17TA
BLE
III
Ass
ocia
tion
Bet
wee
n D
etec
tion
Rat
e of
CM
A a
nd K
aryo
type
Res
ults
Sim
ple
dele
tion
(N)
Sim
ple
dupl
icat
ion
(N)
Unb
alan
ced
tran
sloc
atio
n (N
)C
ompl
ex r
earr
ange
men
t (N
)T
otal
(N)
Det
ectio
n ra
te (%
)
Patie
nt w
ithab
norm
alka
ryot
ype
anal
ysis
(N=1
75)
314
2318
7643
.4
Patie
nt w
ith n
o/un
avai
labl
eka
ryot
ype
anal
ysis
(N=2
655)
3624
1212
843.
16
Patie
nts w
ithno
rmal
kary
otyp
ean
alys
is(N
=255
0)
3630
91
762.
98
Tota
l (N
=538
0)10
358
4431
236
4.4
Am J Med Genet A. Author manuscript; available in PMC 2009 September 1.

NIH
-PA Author Manuscript
NIH
-PA Author Manuscript
NIH
-PA Author Manuscript
Shao et al. Page 18TA
BLE
IVC
ompa
rison
of t
he D
etec
tion
Rat
e of
Sub
telo
mer
ic R
earr
ange
men
ts A
mon
g Th
ree
Stud
ies
Stud
yT
echn
ique
Clo
ne c
over
age/
subt
elom
ere
regi
onSu
bjec
ts (N
)A
bnor
mal
cas
es (N
)D
etec
tion
rate
P-va
lue
Rav
nan
et a
l.[2
006]
Subt
elom
ere-
FISH
1 cl
one
11,6
8830
12.
6%≤0
.01b
Bal
lif e
t al.
[200
7]Ta
rget
ed a
rray
-CG
H27
clo
nes/
5.7
Mb
6,94
616
92.
4%≤0
.01c
FI
SH c
onfir
mat
ion
Pres
ent s
tudy
Targ
eted
arr
ay-C
GH
12 c
lone
s/10
Mb
5,38
023
64.
4%
FI
SH c
onfir
mat
ion
Pres
ent s
tudy
aTa
rget
ed a
rray
-CG
H12
clo
nes/
10 M
b5,
316
190
3.6%
FI
SH c
onfir
mat
ion
a Excl
udin
g 64
cas
es w
ith k
now
n ch
rom
osom
al a
bnor
mal
ities
(am
ong
whi
ch 4
6 ca
ses h
ad su
btel
omer
ic g
enom
ic im
bala
nces
).
b P-va
lue
was
der
ived
from
Chi
-squ
are
test
bet
wee
n R
avna
n's s
tudy
(2.6
%) a
nd p
rese
nt st
udy
(4.4
%).
c P-va
lue
was
der
ived
from
Chi
squa
re te
st b
etw
een
Bal
lif's
stud
y (2
.4%
) and
pre
sent
stud
y ex
clud
ing
case
s with
kno
wn
chro
mos
omal
abn
orm
aliti
es (3
.6%
).
Am J Med Genet A. Author manuscript; available in PMC 2009 September 1.