Plasmonic refractive index sensor based on resonant system ...

FRAIRE ET AL . VOL. XXX ’ NO. XX ’ 000–000 ’ XXXX
www.acsnano.org
A
CXXXX American Chemical Society
Identification, Localization, andQuantification of Neuronal CellMembrane Receptors with PlasmonicProbes: Role of Protein Kinase D1in Their DistributionJuan C. Fraire,† M. Lujan Masseroni,‡ Ignacio Jausoro,‡ Eduardo M. Perassi,† Alberto M. Diaz A~nel,‡ and
Eduardo A. Coronado†,*
†INFIQC, Centro Laser de Ciencias Moleculares, Departamento de Fisicoquímica, Facultad de Ciencias Químicas, and ‡INIMEC, Laboratorio de Neurobiología,Universidad Nacional de Córdoba, Córdoba, 5000, Argentina. J. C. Fraire and M. L. Masseroni contributed equally to this work.
Noble metal nanoparticle (NP) aggre-gates have long been recognizedfor their unique optical properties,
particularly their capability to couple toeach other through near- and far-field inter-actions. This feature gives rise to a variety ofinteresting optical phenomena extensivelyused in ultrasensitive spectroscopy and inthe emerging field of biospectroscopy.1 In
addition, their surface properties alloweddeveloping several functionalization strate-gies involving biomolecules, which have thecapability of being specific linkers and alsobiorecognition agents able to preferentiallyinteract with target molecules. In this re-spect, some proteins are an excellent choiceto functionalize metal NPs since they arestable in aqueous solutions, can be readily
* Address correspondence [email protected].
Received for review March 20, 2014and accepted August 19, 2014.
Published online10.1021/nn501575c
ABSTRACT Detecting, imaging, and being able to localize the distribution of
several cell membrane receptors on a single neuron are very important topics in
neuroscience research. In the present work, the distribution of metabotropic
glutamate receptor 1a (mGluR1a) density on neuron cells on subcellular length
scales is determined by evaluating the role played by protein kinase D1 (PKD1) in
the trafficking of membrane proteins, comparing the distribution of mGluR1a in
experiments performed in endogenous PKD1 expression with those in the presence
of kinase-inactive protein kinase D1 (PKD1-kd). The localization, distribution, and
density of cell surface mGluR1a were evaluated using 90 nm diameter Au
nanoparticle (NP) probes specifically functionalized with a high-affinity and multivalent labeling function, which allows not only imaging NPs where
this receptor is present but also quantifying by optical means the NP density. This is so because the NP generates a density (F)-dependent SERS response
that facilitated a spatial mapping of the mGluR1a density distribution on subcellular length scales (dendrites and axons) in an optical microscope. The
measured F values were found to be significantly higher on dendrites than on axons for endogenous PKD1, while an increase of F on axons was observed
when PKD1 is altered. The spatial distribution of the NP immunolabels through scanning electron microscopy (SEM) confirmed the results obtained by
fluorescence bright-field analysis and dark-field spectroscopy and provided additional structural details. In addition, it is shown using electrodynamic
simulations that SERS spectroscopy could be a very sensitive tool for the spatial mapping of cell membrane receptors on subcellular length scales, as SERS
signals are almost linearly dependent on NP density and therefore give indirect information on the distribution of cell membrane proteins. This result is
important since the calibration of the F-dependent near-field enhancement of the Au immunolabels through correlation of SERS and SEM paves the way
toward quantitative immunolabeling studies of cell membrane proteins involved in neuron polarity. From the molecular biology point of view, this study
shows that in cultured hippocampal pyramidal cells mGluR1a is predominantly transported to dendrites and excluded from axons. Expression of kinase-
inactive protein kinase D1 (PKD1-kd) dramatically and selectively alters the intracellular trafficking and membrane delivery of mGluR1a-containing vesicles.
KEYWORDS: plasmonics . nanoparticles . bioconjugation . immunolabels . sensing . neurons . PKD1 . sorting .neurotransmitter receptors
ARTIC
LE

FRAIRE ET AL . VOL. XXX ’ NO. XX ’ 000–000 ’ XXXX
www.acsnano.org
B
manipulated and further functionalized, and can alsoserve as linkers to construct nanoscale architectureswith precisely controlled gaps between NPs.2 As aresult, they have the advantage that the distance andstrength of the interaction between the nanocompo-nents in the resulting nanostructures can be preciselycontrolled using biomolecule-directed strategies.3 Themost exciting feature of using these kinds of nano-structures (biomolecule-functionalized NPs) in theemerging areas of biotechnology and biospectroscopyis the possibility to detect events and processes inbiological systems with unprecedented levels of sensi-tivity and localization.4,5
One of the most interesting applications of func-tionalized plasmonic NPs is the characterization, detec-tion, and quantification of cell membrane receptors.This information requires approaches that can probethe spatial organization of cell surface receptors onsubdiffraction limit length scales,6�16 which is a cap-ability that is beyond those of the classical biomarkerdetection methods (e.g., flow cytometry). In that sense,based on immunolabeling and immunoassay techniques,which provide information on a single biomoleculewithin a cell, the optical plasmonic properties of goldand silver nanoparticles can be used to obtain informa-tion on receptor expressions in cell membranes throughRaman and Rayleigh spectroscopy.7,16�18 These tech-niques, surface-enhanced Raman spectroscopy (SERS)and Rayleigh spectroscopy, are one of the most excitingareas in biospectroscopy today. One example that hasbeen used for several decades with applications inimmunohistochemistry, immunoblotting, and immu-noassay techniques is the use of immunological anti-bodies conjugated to colloidal gold particles for thedetection of specific epitopes.19�22 This antibody�Aunanospheres (NS) system allows the direct visualizationof the gold nanoparticles through electron and dark-field microscopy, giving rise to new strategies besidesthe commonly used immunolabeling technique to in-vestigate receptor density distributions in an electronmicroscope and in a common light microscope witha dark-field condensor.23�26 In these techniques, thespatial distribution of the NP labels is used to obtaininformation about the local concentration of the tar-geted receptor.The optical properties of plasmonic NPs are deter-
mined by coherent collective electron oscillations, theso-called localized surface plasmon resonances (LSPRs),which induce an enhanced electromagnetic field sur-rounding the metallic nanostructure with a spatial dis-tribution that depends on its geometry, its orientationwith respect to the incident polarization, illuminationwavelength, anddielectric environment. In addition, theLSPR frequencies can be tuned by changing geomet-rical parameters, such as nanoparticle size,27 shape,27,28
crystal face,29 surface roughness,30 and interparticlespacing.31�36 In that sense, if two ormore NPs approach
each other to within approximately one particle di-ameter on the cell surface, the oscillating E-fields sur-rounding theNPs interfere and induce a hybridizationofthe plasmon modes of the individual NPs.37,38 Accord-ing to this, the degree of enhancement in SERS spectraand the peak frequencies in the scattering spectraobtained with dark-field techniques are also deter-mined by the shape, size, density, and proximity ofthe nanoparticles. Due to the distance-dependent elec-tromagnetic interactions between Au NPs, the lightscattered and the electromagnetic field enhancementsachieved have been proposed to give indirect infor-mation about the local two-dimensional NP density(under optimum conditions, the signal amplification inSERS spectra and the frequency of the scattering spectracan be related directly to clustering of cell surfacereceptors). In this respect, the Reinhard group hasrecently shown that thedensity-dependent spectral res-ponse of 40 nmAu nanoparticle immunolabels targetedat specific receptors provides an alternative, nonfluores-cence-based, optical approach for mapping the spatialdistribution of receptor densities on cellular surfaces.7,16
In some cases, however, it is not possible to obtain thescattering spectra of the NPs on the cell surface withoutinterference of the scattering signal of the cell itself.In this work we propose a functionalization strategy
that allows evaluating the distribution of cell mem-brane receptors using simultaneously different tech-niques that allow obtaining qualitative and quantitativeinformation on parameters of paramount importancein cell biology. The immunolabeling method was de-signed in order to achieve different kinds of infor-mation using the same plasmonic probe. The probeconsist of 90 nm Au NSs functionalized by the addi-tion of biotin simultaneously with the protein strepta-vidin (STV) (molar ratio biotin/STV 1:1). The biotin�STVcomplexes get chemisorbed onto the surface of theNSs and were added in a concentration ratio highenough to guarantee the presence of several STVmolecules per NS. The three left unoccupied sites ofthe STV molecules can interact with specific bio-tinylated antibodies as in common immunolabelingtechniques. Particularly, the STV molecules used inthis work are conjugated with Alexa Fluor 488 dyemolecules (STV488), which allows one to perform ina simultaneous way also fluorescent imaging tech-niques such as fluorescence brightness analysis tomap the spatial distribution of receptors on the cellmembrane. These biotin�STV488�bioconjugatedAu NSs were applied to study a specific biologicalsystem that will be detailed below, although themethodology can be extrapolated to other biologi-cal studies.The biological system selected in this work is neuron
cells, which are highly polarized cells typically extend-ing several short, thick, tapering dendrites and onefunctional, distinct, long, thin axon (see Scheme 1A).
ARTIC
LE

FRAIRE ET AL . VOL. XXX ’ NO. XX ’ 000–000 ’ XXXX
www.acsnano.org
C
Consistent with this, many membrane proteins (cellmembrane receptors) are preferentially distributedeither to axons or dendrites, and neurons use differentmechanisms to achieve this goal. The experimentsdescribed in this study were performed using neuronalcultures prepared from rat embryonic hippocampus,because this model system has been extensively usedfor studies of neuronal membrane protein trafficking.In particular, we have analyzed the involvement ofprotein kinase D1 (PKD1) in regulating trafficking ofdendritic membrane proteins. PKD1, formerly calledprotein kinase Cμ (PKCμ), is a member of a family ofdyacylglycerol (DAG)-binding serine/threonine kinases,39
which also includes PKD2 and PKD3 isoforms. Thesekinases can be activated by diverse stimuli throughPKC-dependent pathways40,41 and have been implicatedindiverse cellular functions.41�45During thepast decade,PKD1wasdescribedas a regulator forGolgi to cell surfacedirected trafficking.39,42,46,47 Moreover, ectopic expres-sion of PKD1 kinase-defective (PKD1-kd) mutants areshown to inhibit a specific membrane fission pathwayinvolved in the transport of cargo proteins that containbasolateral sorting signals in MDCK cells,48 suggestingthat the formation of a trans-Golgi network (TGN) of cellsurface specific transport carriers is regulated by PKD1-dependentfissionpathways. In the specific cell typeusedin the experiments of this work (embryonic rat hippo-campal pyramidal neurons), PKD1 was shown to have akey role in neuronal polarity, since the inactivation of thiskinase selectively alters the intracellular sortingof specificpostsynaptic somatodendritic membrane proteins, suchas transferrin receptor (TfR) and the low-density receptor-related protein (LRP1), which in these conditions whereretained at the axonal membrane.49 These results indi-cate that in the absence of PKD1 missorting of dendriticmembrane proteins important for regulating outgrowth(i.e., neurotrophin or neurotransmitter receptors) wouldoccur. In that sense, the target receptor chosen inthis study is the metabotropic glutamate receptor 1a
(mGluR1a), which is an excitatory G-protein-coupledneurotransmitter receptor that is mainly expressedin the postsynaptic somatodendritic region of centralnervous system neurons.50 The neurotransmitterL-glutamate acts as the physiological agonist ofmGluR1,activating mainly through this receptor a Gq/Phospho-lipase C-dependent pathway that leads to the release ofcalcium from inositol triphosphate (IP3)-dependent in-tracellular Ca2þ stores, a secondary messenger essentialfor numerous processes such as synaptic plasticity andneuronal degeneration and development.51 Deficien-cies in glutamatergic transmissionhavebeen associatedwith several neurological and neurodegenerative dis-eases such as ischemia, brain trauma, epilepsy, multiplesclerosis, amyotrophic lateral sclerosis, and Huntingtonand Parkinson diseases.52,53 The precise role of thistype of receptor in the mentioned diseases remains tobe elucidated.52 In the case of ischemia, differentialeffects of the activation of mGluR1 or mGluR5 (whichcould be affected by its inaccurate localization) mightbe responsible for the selective susceptibility to excito-toxic damage (a distinctive characteristic of ischemia)observed in the striatum.54
In this work we have evaluated the somatodendriticand axonal distribution of mGluR1a, both in normalendogenous PKD1 expression (control experiments)and PKD1-kd ectopic expression conditions (seeScheme 1B and C, respectively), through different light(fluorescence brightness analysis and SERS) and elec-tron microscopy techniques (SEM). We demonstratethat SERS signals of reporter molecules between theNPs immunolabeled on a specific cell surface receptorfacilitate a quantitative characterization not only ofits surface expression but also of its spatial organizationinto cell domains (dendrites and axons). Our approachis based on the fact that at constant ambient refrac-tive index the optical properties of NP immunolabelstargeted to specific cell surface receptors dependboth on the average separation and on the geometric
Scheme 1. Role played by PKD1 and PKD1-kd in regulating trafficking of dendritic membrane proteins in neuron cells.(A) Schematic representation of a typical neuronal cell (not in culture). Neurons are highly polarized cells typically extendingseveral short, thick, tapering dendrites and one functional, distinct, long, thin axon (these domains are highlighted in thescheme). (B) Schematic representation of the effect of endogenous PKD1 expression in the distribution ofmGluR1a receptors.The trafficking occurs mainly to somatodendritic domains. (C) Schematic representation of the effect of ectopic PKD1-kdexpression in the distribution of mGluR1a. The expression of mutant PKD1-kd induces an alteration in the mGlurR1asomatodendritic distribution, generating a homogeneous distribution among neuronal domains (dendrites and axons). Thisimage is a modification of QIAGEN's original, copyrighted image by J. C. Fraire. The original image may be found at www.QIAGEN.com.
ARTIC
LE

FRAIRE ET AL . VOL. XXX ’ NO. XX ’ 000–000 ’ XXXX
www.acsnano.org
D
arrangement of the NPs on the cell surface and, there-fore, on factors that are determined by the underlying2D spatial distribution of the targeted receptors. Pre-vious studies had demonstrated that, due to thespectral shift in the spectrum of the scattered light,the near-field interactions between NP immunolabelsat high density of immunolabeled NPs can be detectedusing conventional far-field optics,7,9,10,12,16,54,55 butto the best of our knowledge no direct relationshipbetween the SERS response of a reporter molecule andthe quantification of a cell membrane receptor hasbeen reported before.We also perform electromagnetic simulations in
order to understand the density dependence of theenhancement response of biomolecule-functionalizedNPs targeted at mGluR1a cell surface receptors.The understanding of the combined effect of averageNP density and spatial organization on the near-fieldproperties of the bound NP immunolabels facilitatesthe experimental investigation of the cell/receptorsystem. In that sense, we quantify the relationshipbetween the electromagnetic field enhancement fac-tor and the NPs' density for 90 nm diameter Au nano-sphere immunolabels targeted at mGluR1a receptorson neuron cells. We demonstrate through this relation-ship that SERS signals of reporter molecules enable aquantitative characterization of receptor densities onsubcellular length scales through optical spectroscopy.
RESULTS AND DISCUSSION
Functionalization of the Plasmonic Nanoparticle Probes.The main objective of this study is the spatial mappingof themGluR1a density on different neuronmembrane
domains (dendrites and axon). The visualization of themGluR1a density either by optical or electronic tech-niques with metal NS immunolabels requires func-tionalized noble metal NPs that are stable againstagglomeration in solution and that bind with highaffinity selectively to their receptor target. In thatsense, we designed a NS functionalization strategybased on the following points: (a) the high specificbiomolecular recognition of STV with biotin, (b) thestrong interaction energy of the STV�biotin system,and (c) the use of a rigorous stoichiometric control overthe number of biotin molecules per STV molecule(molar ratio biotin/STV 1:1). This rigorous stoichio-metric control is necessary due to the fact that STVmolecules have four biotin-recognition sites, andmorethan one biotin per STV molecule could lead to NPagglomeration.3 Therefore, we have employed an end-functionalized biotin (biotin HPDP) that facilitatesa covalent attachment to the NP surface (biotin actslike a “glue” for the STV molecules). The biotin�STVcomplexes were added in a concentration ratio highenough to guarantee the presence of several STVmolecules per NP (ratio STV/NPs 90 000:1). The threeremaining unoccupied sites of the STV molecules caninteract with specific secondary biotinylated antibo-dies, introducing an additional structural flexibility inthe attachment chemistry to the membrane receptorand also amplifying the number of binding sites.
The labeling sequence is presented in Scheme 2. Inthe first labeling step a polyclonal anti-C-Myc antibodyis attached to the Myc sequence of the mGluR1areceptors. This primary antibody is subsequently tar-geted by a biotinylated secondary antibody. In the last
Scheme 2. Synthetic scheme showing the immunolabeling strategy onto cell surface receptors and the NP functionalizationstrategy. (A) Multivalent immunolabeling strategy for the detection of cell surface mGluR1a receptors. Primary anti c-Mycantibodies are bound to the receptors (a). Biotinylated secondary antibodies are anchored to the primary antibodies (b). Thebiotinylated antibodies carry multiple biotins to amplify the binding affinity of streptavidin-functionalized Au NPs inthe last step (c). (B) NP functionalization strategy by biotin�STV. Biotin�STV�bioconjugated Au NSs are bound through theunoccupied biotin-binding sites of the STV proteins attached to the Au NSs.
ARTIC
LE
FRAIRE ET AL . VOL. XXX ’ NO. XX ’ 000–000 ’ XXXX
www.acsnano.org
E
step biotin�STV�bioconjugated Au NSs are boundthrough the unoccupied biotin-binding sites of theSTV proteins attached to the Au NSs. It is importantto note that the number of NP labels bound to thecell surface after a constant incubation time dependson the NP concentration in solution, the numberof receptors on the cell surface, and the binding affinityof the NP labels.
The strict stoichiometric control is necessary dueto the ability of STV protein to interact with amaximumof four biotin molecules, which could induce theformation of NS aggregates.3 According to this, thefunctionalization of 90 nm Au NSs was performed bythe addition of biotin simultaneously with the STVprotein in equal final concentrations (ratio STV/biotin1:1). The high kinetic and thermodynamic constantsof biotin�STV interactions guarantee the formationof biotin�STV complexes, avoiding a primary chemi-sorption of biotinmolecules onto theNS surface, whichcould lead to the formation of NS aggregates (theinteraction of the biotinylated NSs leads to the forma-tion of random aggregates through H-bonds betweenbiotins).3,56
The far-field optical and morphological character-ization of 90 nm Au NSs' and functionalized NSs'stability is shown in Figure S1 in the SupportingInformation. We monitored the UV�vis spectrum of asolution of functionalized NSs at 4.36 � 109 NSs/cm3
(7.24 � 10�12 M) concentration over a time course of2 h (Figure S1B). The extinction spectrum did notexhibit any significant spectral shift, which confirmsthat the particles were stable over time.
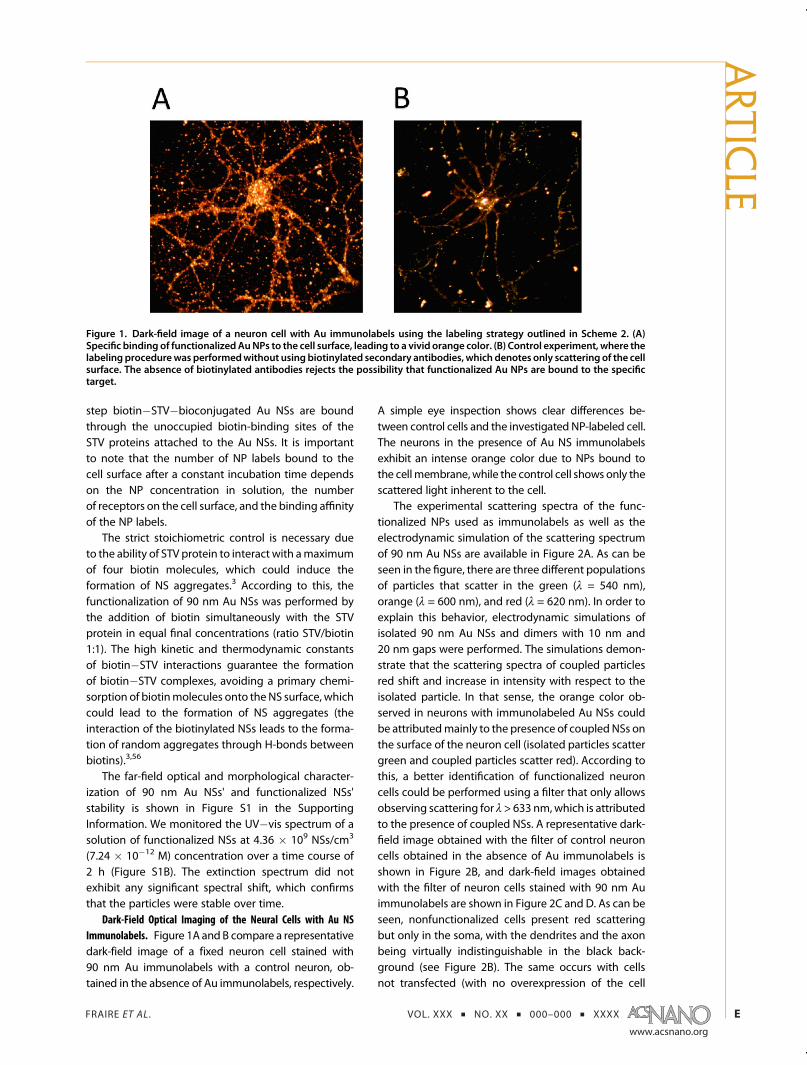
Dark-Field Optical Imaging of the Neural Cells with Au NSImmunolabels. Figure 1A and B compare a representativedark-field image of a fixed neuron cell stained with90 nm Au immunolabels with a control neuron, ob-tained in the absence of Au immunolabels, respectively.
A simple eye inspection shows clear differences be-tween control cells and the investigated NP-labeled cell.The neurons in the presence of Au NS immunolabelsexhibit an intense orange color due to NPs bound tothe cellmembrane,while the control cell shows only thescattered light inherent to the cell.
The experimental scattering spectra of the func-tionalized NPs used as immunolabels as well as theelectrodynamic simulation of the scattering spectrumof 90 nm Au NSs are available in Figure 2A. As can beseen in the figure, there are three different populationsof particles that scatter in the green (λ = 540 nm),orange (λ = 600 nm), and red (λ = 620 nm). In order toexplain this behavior, electrodynamic simulations ofisolated 90 nm Au NSs and dimers with 10 nm and20 nm gaps were performed. The simulations demon-strate that the scattering spectra of coupled particlesred shift and increase in intensity with respect to theisolated particle. In that sense, the orange color ob-served in neurons with immunolabeled Au NSs couldbe attributedmainly to the presence of coupled NSs onthe surface of the neuron cell (isolated particles scattergreen and coupled particles scatter red). According tothis, a better identification of functionalized neuroncells could be performed using a filter that only allowsobserving scattering for λ> 633 nm,which is attributedto the presence of coupled NSs. A representative dark-field image obtained with the filter of control neuroncells obtained in the absence of Au immunolabels isshown in Figure 2B, and dark-field images obtainedwith the filter of neuron cells stained with 90 nm Auimmunolabels are shown in Figure 2C and D. As can beseen, nonfunctionalized cells present red scatteringbut only in the soma, with the dendrites and the axonbeing virtually indistinguishable in the black back-ground (see Figure 2B). The same occurs with cellsnot transfected (with no overexpression of the cell
Figure 1. Dark-field image of a neuron cell with Au immunolabels using the labeling strategy outlined in Scheme 2. (A)Specific binding of functionalizedAuNPs to the cell surface, leading to a vivid orange color. (B) Control experiment, where thelabeling procedurewas performedwithout usingbiotinylated secondary antibodies,which denotes only scattering of the cellsurface. The absence of biotinylated antibodies rejects the possibility that functionalized Au NPs are bound to the specifictarget.
ARTIC
LE

FRAIRE ET AL . VOL. XXX ’ NO. XX ’ 000–000 ’ XXXX
www.acsnano.org
F
membrane receptor) with Au NS immunolabels, asthe particles are not attached to the cell membranethrough the specific immunolabeling, but only depos-ited in a nonspecific way (see Figure 2C). The fact thatthe same scattering as the nonfunctionalized cells isobserved could be associated with the presence ofisolated particles randomly distributed that scattergreen light only. In contrast, transfected cells over-express the cell membrane receptors recognized bythe functionalized Au nanoparticles. This overexpres-sion also occurs in other cell regions besides the soma(dendrites and axon), allowing visualizing dendritesand axons through the scattering of the Au nano-particles attached in those regions (see Figure 2D).
As mentioned before, due to distance-dependentelectromagnetic interactions between Au NPs, thelight scattered has been proposed to give indirectinformation about the local two-dimensional NP den-sity. This plasmon coupling microscopy has beenproved to be a very interesting tool for mapping thespatial distribution of receptor densities on cellularsurfaces.7,16 Nevertheless, it is not always possible toobtain the scattering spectra of the NPs on the cellsurface without interference of the scattering signal ofthe cell itself. This is the case for neuron cells, in whichthe cell scattering is of such magnitude that this directcorrelation cannot be performed.
Although the optical images of the NP-labeled cellsprovide a quick survey of the relative functionalizationand, therefore, of the expression of receptors oncell surfaces, it is difficult for this particular biologicalsystem to determine differences in receptor expressionbased only on the optical dark-field images.
Immunofluoresence Quantification of NS Immunolabel Den-sities. As mentioned before, the STV molecules usedin this work are conjugated with Alexa Fluor 488 dyes(STV488) that allow us to perform commonly usedfluorescent imaging techniques such as fluorescencebrightness analysis to map spatial distributions of
receptors on the cell membrane. In order to quantifythe fluorescence in axons and dendrites, several one-pixel-wide 100 μm lines were drawn on randomlyselected portions of the axon and the dendrites(6�10 lines each), and the average fluorescence fromeach region was calculated. This average fluorescencefrom dendrites and axons for each experimental con-ditionwas calculatedminimally fromeight cells from atleast three different cultures. The average values werecorrected according to an average background fluo-rescence value determined from several regions con-taining unlabeled neurites.
The evaluation of the changes in the somatoden-dritic and axonal distribution of mGluR1a (missorting),in conditions of endogenous PKD1 or overexpressionof PKD1-kd, is usually determined using a “polarityindex” (PI) defined as
PI ¼ Dendrite Signal=Axon Signal (1)
where “dendrite signal” and “axon signal” correspond,respectively, to any measurable parameter that can beused to infer the somatodendritic receptor density andthe axonal receptor density. Uniform staining gives a PIvalue close to 1, whereas dendritic enrichment gives avalue of >1, and axonal enrichment a PI value of <1.
We carried out preliminary experiments in order tocompare the results using functionalized nanoparticlesas specific probes for the cell membrane receptor withcommon immunofluorescence analysis. This controlanalysis consisted in the comparison of the averageimmunofluorescence brightness of cells using thelabeling strategy mentioned above, i.e., a solution ofAu NSs functionalized with a 1.2 � 10�7 M final con-centration of STV488 protein, with the average immu-nofluorescence brightness obtained for the incubationof cells treated with only STV488 at the same concen-tration used to functionalize the nanoparticles. Thecomparison between both techniques was performedby the determination of the PI in the conditions of
Figure 2. Distinguishing transfected neurons from nontransfected ones using dark-field microscopy. (A) Experimentalscattering intensity of functionalized Au nanoparticles deposited onto a glass substrate (noisy lines) and the electrodynamicsimulations of the scattering spectra of an isolatedparticle anddimerswith 10 nmand20nmgaps (solid lines) that showa redshift of the maximum of the scattering spectrum as a function of the agglomeration of NPs. In the inset M denotes anexperimentalmeasurement and T denotes theoretical calculations. The black solid line represents the filter used to obtain thedark-field images of (B) a nonfunctionalized neuron cell (without adding nanoparticle probes), (C) a functionalizednontransfected neuron cell (adding nanoparticle probes to neurons with no overexpression of the cell membrane receptor),and (D) a functionalized transfected neuron cell (adding nanoparticle probes to neurons with overexpression of mGluR1a).
ARTIC
LE

FRAIRE ET AL . VOL. XXX ’ NO. XX ’ 000–000 ’ XXXX
www.acsnano.org
G
normal endogenous PKD1 expression (see Figure S2 inthe Supporting Information). The results show thatusing the functionalized nanoparticle technique, thesame PI values as those obtained with common im-munofluorescence analysis can be obtained. Once thevalidity of the functionalized nanoparticles methodcompared to common inmunofluerescence tech-niques was confirmed, we proceeded to determinethe PI for the two experimental conditions of this work(i.e., normal endogenous PKD1 expression and ectopicexpression of PKD1-kd). The fluorescence imagesshown in Figure 3 reveal that in control experiments(normal endogenous PKD1 expression) the mGluR1adistribution occurs mainly on the somatodendriticdomains, while in the ectopic PKD1-kd expressionconditions mGluR1a missorting occurs, as evidencedby the PI decrease. This analysis clearly revealed thatexpression of mutant PKD1-kd induces an alterationin the mGlurR1a somatodendritic distribution, gener-ating a homogeneous distribution among neuronaldomains.
SEM Quantification of NS Immunolabel Densities. In orderto verify the finding from our fluorescence bright-ness analyses, we inspected NP-labeled cell surfacesthrough SEM for normal endogenous PKD1 expressionand ectopic PKD1-kd expression conditions, since theuse of noble metal NPs to target the cell membranereceptors allows us to infer the spatial distribution ofthis receptor through direct observation of the parti-cles in an electron microscope.
The quantification of NS immunolabel densitiesthrough inspection of the SEM images was determinedby computing the average Au NS surface density (F),which was calculated using an image-processing pro-gram (Image-J). The average NP density for the differ-ent cell domains is a quantitative value that enablesanalyses of the expression levels of cell membranereceptors. The F values from dendrites and axons foreach experimental condition were determined mini-mally from 10 cells from at least two different cultures.The average values were corrected according to anaverage background F value.
SEM micrographs of control cells are shown inFigure 4. The F values obtained were 51 NSs/μm2 fordendrites and of 2 NSs/μm2 for the axon. These valuesare clearly consistent with the SEM images of thedendrite and the axon, where a lower density oftargeted NSs in the axon segment can be observed.In contrast, an inspection of the SEM micrographs ofthe ectopic PKD1-kd expression condition evidencesan increase in the surface densities of NSs in the axon(see Figure 5). For this experimental condition the Fvalues obtained were 30 NSs/μm2 for dendrites and8 NSs/μm2 for the axon. The PI calculated accordingto the average surface densities is shown in Figure 6.The results obtained are in excellent agreement withthose obtained for fluorescence brightness analysis
Figure 3. Quantification of NS immunolabel densitiesthrough immunofluoresence. (A) Confocal image showingthe distribution of mGluR1a in a 10 d.i.v. hippocampalpyramidal neuron. Note that the distribution of mGluR1ais preferentially localized in the somatodendritic domain(the axon cannot be observed). (B) Confocal image showingthe distribution of mGluR1a in an 8 d.i.v. hippocampalpyramidal neuron coexpressing PKD1-kd. Note that aftercoexpression of PKD1-kd, mGluR1a is localized in both thedendrites and axon (see the arrows in the figure). (C) Bar plotof the PI value calculated with average fluorescence intensi-ties from neurons in the two conditions presented in thiswork: endogenous PKD1 (mGluR1a) and overexpression ofPKD1-kd (mGluR1a þ PKD1-kd). The values are the average((SD, vertical bars) obtained for three separate experiments.The * represents significant differences according to Tukey'stest (p<0.05) formGluR1aþ PKD1-kd compared tomGluR1a.
ARTIC
LE

FRAIRE ET AL . VOL. XXX ’ NO. XX ’ 000–000 ’ XXXX
www.acsnano.org
H
Figure 4. SEM images of Au NP-immunolabeled cells in conditions of endogenous PKD1 expression. (a) General view of NPdistribution. (b) NP distribution on a dendrite. (c) NP distribution on an axon. Note that the NP density (F) is higher ondendrites (b) than on the axon (c).
Figure 5. SEM images of Au NP-immunolabeled cells in conditions of ectopic expression of PKD1-kd. (a) General view of NPdistribution. (b) NP distribution on a dendrite. (c) NP distribution on an axon. Note that the difference in NP density (F) ondendrites (b) and on the axon (c) is less significant than in the case of endogenous PKD1 expression.
Figure 6. Quantification ofNS immunolabel densities throughSEM. (A) Representative SEM images of dendrites and axons forthe two conditions studied: endogenous PKD1 expression (mGluR1a) and overexpression of PKD1-kd (mGluR1aþ PKD1-kd).(B) Bar plot of the PI value calculatedwith averageNPdensities obtainedbySEM.Values in B are the average ((SD, vertical bars)obtained for three separate experiments. The * represents significant differences according to Tukey's test (p < 0.001) formGluR1a þ PKD1-kd compared to mGluR1a.
ARTIC
LE

FRAIRE ET AL . VOL. XXX ’ NO. XX ’ 000–000 ’ XXXX
www.acsnano.org
I
(i.e., ectopic expression of PKD1-kd induces missortingof the mGluR1a receptors).
It is important to note that the gold nanoparticledistribution shows that the antibody labeling is notuniform across the cell surfaces. Even this could be aneffect of preferential clustering of the targeted recep-tors, as the size of the individual receptor accountsfor less than 10% compared to the size of an individualNS, there is no direct correlation between the numberof NPs and the number of mGluR1a receptors (seeFigure S2A and B in the Supporting Information).Nevertheless, there are previous works that describea preferential distribution of mGluR1a receptors intomicrodomains along the neuron cell membrane,57
like those observed in the SEM images. Moreover,as discussed below, the preferential cluster formationof the NPs onto the cell surface has important implica-tions in the electromagnetic field (E-field) enhance-ment responsible for the SERS spectra.
SERS Quantification of NS Immunolabel Densities. Theprimary aim of this section is to demonstrate thatby using an immunolabeling protocol to attach goldnanoparticles to specific cell membrane receptors, it ispossible to measure the SERS spectra correspondingto molecules in the hot spots between particles, andthese SERS signals can be associatedwith the targeted-receptor density.
Asmentioned above, the scattering spectrumof thecell membrane with NS immunolabels is dependentupon the NS density, and this feature has proved to bea valuable tool to quantify the degree of expression ofthe cell membrane receptors. Nevertheless, the com-plexity of the local environment of the 2D nanoparticleclusters in the cell membrane makes it very difficult tocorrelate the SERS signals to the receptor density, asone has to know, in principle, which is the Raman-active reporter (cell membrane components, function-alized molecules onto the nanoparticle surface, etc.).In that sense, in order to rationalize the experimentalSERS response as a function of NSs density, carefulexperimental conditions have to be chosen (laserpower) to guarantee that the SERS signal is free ofbackground cell contributions, and also a rigorouswavenumber assignment of the vibrational modes ofthe SERS spectrum has to be performed to identify theRaman-active molecule.
The experimental SERS spectra were acquiredfrom cells at 1% laser power and from NS-free cellsat 1% (0.65 mW) and 100% (65 mW) laser power. Thislast condition (neuron cells without nanoparticles)gives rise to no discernible spectra at 1% laser power.On the contrary, a Raman cell spectrum was obtainedat 100% laser power (see Figure S3 in the SupportingInformation). Taking this into account, and to avoidspurious Raman signals coming from the cell, thelowest laser power was used. Under this condition,the presence of peaks in the SERS spectra can only be
due to the presence of hot spots generated by NSs onthe cell surface. Figure S4 of the Supporting Informa-tion shows the spectrum obtained from a dendriteof a neuron with endogenous PKD1 expression condi-tions. The wavenumber assignment was performed bydeconvoluting the SERS spectrum to obtain the fre-quencies of the normal vibrational modes. This resultwas compared with the experimental frequencies ofthe vibrational modes from STV molecules obtainedfrom ref 58. As can be observed, there is an excellentcorrelation between the reported experimental fre-quencies of the vibrational modes from the STV mole-cule and the deconvoluted frequencies of the SERSspectrum of the NS-labeled cells. This leads to theconclusion that by using this NS functionalizationstrategy the SERS spectra obtained can be directlyassociated with the functionalized molecules on theNS surface (STV protein), where signal intensity willstrongly depend on the average separation and thegeometric arrangement of the NPs on the cell surfaceand, therefore, on the underlying spatial distributionof the targeted receptors.
A quantitative determination of the mGluR1a dis-tribution in the different cell domains for the twoexperimental conditions (endogenous PKD1 expres-sion and ectopic expression of PKD1-kd) was com-puted by calculating the PI from the average SERSintensity obtained in axons and dendrites. This averagewas performed by measuring several spectra on ran-domly selected portions of the axon and the dendrites(10 points each) from 10 cells from at least twodifferent cultures. The different relative NP densitiesof dendrites and the axon, revealed by the SEM images,as well as the SERS spectra of different spots on aneuron cell are presented in Figure 7A. As clearlyobserved, themaximum intensities of the SERS spectraare achieved in the dendrites where there is a higherNP density in comparison with the axon. In addition,although the peaks of the vibrational modes of STV arepresent in all the SERS spectra measured, the relativeintensity of the vibrational modes is different from onespectrum to another. This could be due to heatingeffects associatedwith the LSPR excitation of theNSs atthe excitation wavelength. This heating could giverise to vibrational excitation of the normal modesof the protein, leading to a conformational change ofthe protein located in the hot spots (i.e., the vibra-tional excitation of the protein leads to a change of itsconformation).59 Therefore, to avoid errors inherent tothe variation of the relative intensities of the differentvibrational modes, the integral value of the SERS signalin the range 1650�1510 cm�1 was calculated (seeFigure 7B). This range of frequencies involves theamide I (absorbing near 1650 cm�1, which arisesmainly from the CdO stretching vibration with minorcontributions from the out-of-phase C�N stretch-ing vibration, the C�C�N deformation, and the N�H
ARTIC
LE

FRAIRE ET AL . VOL. XXX ’ NO. XX ’ 000–000 ’ XXXX
www.acsnano.org
J
in-plane bend) and the amide II (absorbing near1510 cm�1, which arises from the out-of-phase combi-nation of the N�H in-plane bend and the C�N stretch-ing vibration with smaller contributions from theCdO in-plane bend and the C�C and N�C stretch-ing vibrations) normal vibrational modes of theSTV protein.60 The calculated PI using these SERS-integrated signals from dendrites and axons in thetwo experimental conditions of this work is shown inFigure 7C. The results not only are in very goodagreement with those obtained through florescenceand SEM analyses but also demonstrate the usefulnessand sensitivity of SERS applied to the determination ofcell surface receptor distribution with plasmonic nano-particle probes.
Correlating the Spectral SERS Response with ElectrodynamicsSimulations (E-Field Enhancement�Density Relationship). Theconsistency between fluorescence, SEM, and SERScharacterizations of the NP densities, and therefore
the mGluR1a receptor distribution, on dendrites andaxons confirms that the SERSmapping due to plasmoncoupling enables the detection of F differences onsubcellular length scales. The elucidation of the under-lying electromagnetic interaction mechanisms be-tween the NPs on the cell surface and the NS densitywas performed by a session of calculations of theE-field enhancement increasing NP density. In thisway, we were able to indirectly correlate the measuredSERS with the immunolabel density on the cell surface.
The major contribution to the SERS signals comesfrom the electromagnetic enhancement caused byLSPR excitations. Another mechanism often arguedto explain SERS is the chemical one, but this mecha-nism has proved to have by far a lower contribution61
and alone cannot account for the 106�108 enhance-ments observed in many experiments. In addition,this mechanism is still the subject of considerableresearch work, but it is now accepted that it could
Figure 7. Quantification of NS immunolabel densities through SERS. (A) Comparative scheme showing the relative intensitychanges of the SERS spectra as well as the relative densities obtained in the SEM images associated with the spectral changesin the subcellular protrusions of the neuron cell (dendrites and axon). (B) Schematic illustration of the selected frequencyrange for integration of the SERS signals. (C) Bar plot of the PI value calculated using the average SERS intensities for the twoconditions studied: endogenous PKD1 expression (mGluR1a) and overexpression of PKD1-kd (mGluR1aþ PKD1-kd). Values inC are the average ((SD, vertical bars) obtained for three separate experiments. The * represents significant differencesaccording to Tukey's test (p < 0.01) for mGluR1a þ PKD1-kd compared to mGluR1a.
ARTIC
LE

FRAIRE ET AL . VOL. XXX ’ NO. XX ’ 000–000 ’ XXXX
www.acsnano.org
K
contribute with a factor of 10�100 to the globalenhancement.56,62
The theoretical electromagnetic SERS enhance-ment, for small Raman shifts, scales with the fourthpower of the field enhancement, while for Ramanshifts that are significantly greater than the width ofthe plasmon resonance, local electromagnetic SERSenhancement scales with the product of the fieldintensity enhancements at the incident and scatteredfrequencies.61 Considering that the fourth-power ap-proximation is valid, the electromagnetic field en-hancement factor (EFEF) is defined by
EFEF ¼ jΓ(ω)j2 (2)
jΓ(ω)j ¼�����E(ω)E0(ω)
�����0@
1A
2
(3)
where |Γ(ω)| is the square of the enhanced electric fieldgenerated at the frequency of the incident radiation (ω).
We will examine the variation of the EFEF with F, byrigorous electrodynamics modeling using generalizedmultiparticle Mie (GMM) theory. In all cases, the simula-tions were performed assuming an effective refractiveindex of nr = 1.23, which was estimated according tothe effective medium approximation63 as an averageof the refractive indices of themembrane (nr =1.45) andthe surrounding air (nr = 1.0003).
In order to evaluate the EFEF as a function of theNP density (EFEF(F)), 11 different densities (from 1 to50 NSs/μm2) and five different random configurationsfor each density were considered. In addition, the EFEFhas been computed using various lower limits of theenhancement (Γmin) to calculate the average:
ÆΓ(ω)æ ¼Z Γmin
Γmax
Γi(ω) di=Z Γmin
Γmax
di (4)
where i correspond to the ith point in the simulatedgrid. As expected, increasing the lower limit of integra-tion (Γmin), increases the value of the average EFEF.Although the regions of highest enhancement areachieved in the hot spots between closely interactingnanoparticles, the experimental SERS signals cannotbe attributed only to those generated in these gaps(i.e., strongly coupled nanoparticles with very smallgaps between them). Taking into account this feature,a suitable lower limit should be considered. As evident,the average enhancement in eq 4 will strongly dependon the lower limit of the enhancement (Γmin) used toperform the integration: the lower the limit of integra-tion (Γmin), the larger should be the value of ÆΓ(ω)æ. Asan example, Figure S5 (in the Supporting Information)maps the regions with enhancements greater than acertain minimum enhancement value (Γmin). The dif-ferent colors used in this figure correspond to the dif-ferent values of Γmin (blue for Γmin = 9, red for Γmin =100, and green for Γmin = 400). This result clearly shows
that regions with Γ g 9 overestimate the interparticleregions considering regions of very poor couplingeffects, while regions with Γ g 400 only considerextremely close nanoparticles, underestimating sev-eral active gaps. The regions with enhancementsΓg 100 suitably comprise nanoparticles close enoughto each other that could give rise to interparticle gapshaving significant enhancement factor values, com-prising close and not so close nanoparticles withinthe sample in a more realistic fashion. Therefore, theΓmin chosen for the EFEF calculations was Γ g 100.In Figure 8 we show the simulated near-field spatialdistribution for different two-dimensional NP densitiesfor selected F values (F = 10, 20, 30, 40, 50 NSs/μm2,Figure 8A�E) and EFEF(F) relationships obtained forthe random NS distribution across the entire investi-gated F range (Figure 8F). The EFEF(F) relationship ofthe randomNSdistribution shows a linear dependenceon NS density at least in the F range investigated.Nevertheless, it is expected that as the number of NSsincreases, this trendwill reach an asymptotic regime, asall available sites for NSs should be occupied, givingrise to the maximum plasmon coupling between NPs.
In order to give a quantitative correlation betweenthe simulations and the experimental SERS response,the PI was determined using the theoretical EFEF(F)relationship and the experimental F values obtainedthrough SEM. The calculated PI is shown in Figure 9together with the near-field simulation for the experi-mental F values obtained. At low F values the near-fieldresponse is dominated by individual, noninteractingNSs. Note that due to the random nature of oursimulation, even at low F values, some interactingnanoparticles are present, but by choosing a suitableaverage value (i.e., choosing an appropriate lower limitvalue of Γ to perform the average) this value is lowerthan at higher densities. As F increases, the probabilityof finding NSs at close enough distances increases aswell, generating highly localized enhanced fields in thegaps (hot spots). On the other hand, the averagenumber of hot spots between coupled NSs on the cellsurface increases aswell. As both effects go in the samedirection, the overall effect is a net increase of the SERSresponse with F (see Figure 7 and Figure 8). At thispoint, it is important to consider one important issue.As observed in the SEM images, even at low NSdensities, some degree of clustering of several NSs ispresent. This could be attributed to a heterogeneousdistribution of mGluR1a on the neuron surface(microdomain distribution). In this case the averagevalue of EFEF will depend not only on F but also on itsspatial organization. Therefore, a preferential cluster-ing of NS labels due to a heterogeneous receptordistribution into microdomains will lead to averageEFEF values significantly higher compared to a homo-geneous random NP distribution, even if the average Fvalue is identical. The dependence of EFEF on both F
ARTIC
LE

FRAIRE ET AL . VOL. XXX ’ NO. XX ’ 000–000 ’ XXXX
www.acsnano.org
L
and the heterogeneity of the NP distribution could bedirectly related to the spatial organization of the cellmembrane receptors.
As our simulations were performed in random dis-tributions but introducing microdomain distributionwith some degree of clustering, the PI determinedby our simulations reproduces very closely the onedetermined for SEM and also the PI factor obtainedby the SERS experiments. Under this condition, anincrease in F leads to an increase in the number ofstrongly coupled NPs.
The very good agreement obtained for the PIfactors using different techniques has been discussedhere. In all cases, the results indicate that in endogen-ous PKD1 expression the distribution of the mGluR1aoccurs preferentially in the somatodendritic domainsof neuron cells, while in the presence of PKD1-kdmissorting of this receptor to axonal domains occurs.A direct correlation between the results obtained bythe different techniques is presented in Figure 10,where the ratio between the PI values obtained forthe two different experimental conditions is directly
Figure 9. Quantitative correlation between NS immunolabel densities and theoretical near-field simulations. (A) Simulationof the near-field response of a random NP distribution and the experimental SEM image with almost identical NP density.(B) Bar plot of the PI value calculated using the EFEF(F) relationship and the experimental F values obtained through SEM, forthe two conditions studied: endogenous PKD1 expression (mGluR1a) and overexpression of PKD1-kd (mGluR1aþ PKD1-kd).Values in B are the average ((SD, vertical bars) obtained for three separate experiments. The * represents significantdifferences according to Tukey's test (p < 0.05) for mGluR1a þ PKD1-kd compared to mGluR1a.
Figure 8. Simulated near-field response as a function of NP density irradiating at 633 nm. (A�E) Simulated near-field spatialdistribution for different two-dimensional NP distributions for selected F values (F = 10, 20, 30, 40, 45 NSs/μm2).(F) Relationship between the electromagnetic field enhancement factor (EFEF) and F. The relationship was determined for11 different densities (from 1 to 50 NSs/μm2) and five different random configurations for each density. The average EFEF(F)'sare presented in violet-colored circles.
ARTIC
LE

FRAIRE ET AL . VOL. XXX ’ NO. XX ’ 000–000 ’ XXXX
www.acsnano.org
M
compared between each technique described in thearticle (PI ratio = PI of endogenous PKD1 expression/PIof ectopic PKD1-kd expression). As can be seen, thereis an excellent correlation between all techniques,including the theoretically determined PI, with thetheoretical values being only slightly higher. This dif-ference can be rationalized if one considers that EFEFwas calculated using several approximations wherethe substrate was only considered through the effec-tive medium approximation instead of an explicit con-sideration, the fourth power approximation of theenhanced field, and also no NPs size dispersion wasconsidered.
CONCLUSIONS
Using a multivalent labeling functionalization ofAu NPs we achieved a highly efficient and selectivelabeling of a glutamate neurotransmitter receptor(mGluR1a). We evaluated the role of PKD1 in thetrafficking of mGluR1a in neuron cells by the quantifi-cation of somatodendritic and axonal distribution, inboth endogenous PKD1 expression and ectopic PKD1-kd expression conditions. Similar analyses to thoseperformed for mGluR1a in this work will in the futurebe possible with different cell membrane receptors.Compartmentalization in different domains is crucial
to the proper functioning of neuronal cells. Bothsomatodendritic and axonal domains have their ownpool of membrane proteins, which are classified indifferent sections of the secretory pathway to reachtheir correct final destination. It was established thatalterations in dendritic or axonal protein sorting leadsto substantial changes in the development of theseneuronal compartments, as well as at the level ofsynaptic transmission, and hence to neuronal plasticityevents associated with diverse diseases such as epi-lepsy and Huntington and Parkinson diseases, amongothers.
The results presented in this article suggest thatin neurons PKD1 is involved in mGluR1a regulatingdistribution, probably at the TGN level. In that sense,it became evident that expression of PKD1-kd inducesa dramatic alteration in the intracellular distribution ofmGluR1a receptors. As expected, in control neurons(endogenous expression of PKD1) mGluR1a was pre-dominantly restricted to the somatodendritic domain.In contrast, when neuronswere transfectedwith PKD1-kd, mGluR1a was found not only in dendrites but alsowidely distributed along axons. This analysis clearlyrevealed that expression of PKD1-kd induces missort-ing. Thus, after expression of the kinase-inactive mu-tant of PKD1, selective trafficking of mGluR1a todendrites and their delivery to the dendritic plasmamembrane are completely altered. This could be ex-plained as, after PKD1 inactivation, missorting occursbecause of a defect in the biogenesis of normal vesiclesat the Golgi with cargo entering the wrong vesicle.We have demonstrated that SERS signals of reporter
molecules between the NP immunolabeled to a spe-cific cell surface receptor facilitate a quantitative char-acterization not only of its surface expression butalso of its spatial organization into cell domains(dendrites and axons). Moreover, we showed by com-bining optical spectroscopy and electron microscopy,as well as through computational electromagneticsimulations, that the distance-dependent near-fieldinteractions between NP immunolabels enable char-acterizing the averageNPdensity on the cell surface onsubcellular length scales.We have performed a detailed analysis and dis-
cussion of how the EFEF relates with the NP densityas well as on the spatial organization of the receptorson subdiffraction limit length scales. In the case of themGluR1a the immunolabels were found to cluster onthe cell surface even at low�medium NP densities,which is consistent with heterogeneous receptor dis-tributions into microdomains. It was found that near-field simulations of the experimentally observed NPdistributions as a functionofF reproducedquitewell thePI ratio determined experimentally by fluorescence,SEM, and SERS. In addition we further demonstratedthat SERS response (dominated by STV molecules lo-cated in the hot spots) could also be used to infer thedensity of the targeted receptor. In the context of thiswork, we concluded that our combined experimentaland theoretical studies confirm that the SERS responsesof NP immunolabels targeted at cell surface receptorsare able to provide information not only about relativeexpression levels but also about the preferential spatialorganization of the receptors on the cell surface intoclusters.Certainly, for detection techniques based on the
optical properties of the plasmonic nanoparticle probes,like SERS, the detection sensitivity for the quantificationof cell surface molecules will be dependent upon the
Figure 10. Bar plot showing the quantitative comparison ofthe PI ratio determined through fluorescence, SEM, SERS,and theoretical near-field simulations.
ARTIC
LE

FRAIRE ET AL . VOL. XXX ’ NO. XX ’ 000–000 ’ XXXX
www.acsnano.org
N
near-field optical properties of NP immunolabels tar-geted to specific cell surface receptors and, therefore, onfactors that are determined by the 2Dunderlying spatialdistribution of the targeted receptors (i.e., on the aver-age separation and the geometric arrangement of theNPs on the cell surface). Receptors clustered into micro-domains (i.e., mGluR1a) are expected to give rise tosmaller interparticle distances between the targetedNPs, increasing the number of hot spots and, as aconsequence, producing higher field enhancementsand therefore higher SERS intensity for a given mode.In the case of cell membrane receptors that present ahomogeneous distribution, the average distance be-tween receptors would be a crucial factor, which wouldbe taken into account in order to give a realistic compar-ison between experimental intensity of the SERS signalsand the EFEF as a function of the NP density (EFEF(F)).Nevertheless, this technique by itself cannot give enoughinformation on the spatial distribution of the cell mem-brane receptors. A more direct correlation of the 2Dunderlying spatial distribution of the targeted receptorscould be performed though SEM using nanoparticleswith a size close to the size of the membrane receptor.
In summary, in the present work we have proposeda novel functionalization strategy that allows evaluat-ing the distribution of cell membrane receptors usingsimultaneously different techniques that give not onlyqualitative but also quantitative information on param-eters of paramount importance in cell biology. More-over, we have demonstrated that the optical propertiesof NP immunolabels in combination with efficientlabeling procedures enable the differentiation of rela-tive expression levels of cell surface receptors (in thiswork mGluR1a) through different light (fluorescencebrightness analysis and SERS) and electron micro-scopy (SEM) techniques. We further quantified thedifferences in the NP labeling between the investi-gated cell/receptor systems through spectral analysisof the collective plasmon resonance wavelengthof the NP labels on the cell surface. A systematiccharacterization of the electromagnetic interactions(EFEF) between NP immunolabels confined to a two-dimensional cell surface revealed that the mea-sured SERS response depends both on the averageNP density and on the level of NP clustering on the cellsurface.
MATERIALS AND METHODS
Materials. The following materials were used as obtained:HAuCl4 (Carlo Erba); sodium citrate (Mallinckrodt); EZ-Linkbiotin-HPDP (Pierce); streptavidin (Invitrogen); polyclonal antic-Myc rabbit antibody (Santa Biotechnology, Inc., USA); anti-rabbit IgG biotin conjugate goat antibody (Molecular Probes,Inc., USA); Lipofectamine 2000 (Invitrogen, Carlsbad, CA); poly-L-lysine (Sigma, USA); neurobasal medium (Gibco); B27 (Gibco);N2 supplement (Gibco).
Au Nanosphere Synthesis. The synthesis of gold nanoparticleswas performed using the Turkevich method, which is basedon the reduction properties of boiling citrate solutions. Briefly,they were produced by reducing a 50 mL 0.2 mM chloroauricacid solution (HAuCl4) with the addition of 0.5 mL of a 0.01 Mcitrate solution (corresponding to a 1:0.5 Au/citrate molar ratio)under heat and rapid stirring for 30 min. The morphologicalcharacterization of the Au NSs was performed combiningUV�vis spectroscopy, TEM, dynamic light scattering (DLS),and electrodynamic modeling using Mie theory. The overallresults after combining all of these different techniques andmodeling indicate that the average diameter of Au NSs was90 nm with a picomolar concentration of 4.36 � 109 NSs/cm3
(7.24 � 10�12 M), estimated using the experimental extinctionintensities at the maximum wavelength, and the cross sectionwas calculated using Mie theory for spherical particles with asuitable diameter (determined by TEM).
Particle Funcionalization. EZ-Link biotin-HPDP (N-[6-(bio-tinamido)hexyl]-30-(20-pyridyldithio)propionamide) was used forsurface modification of 90 nm Au NSs. The procedure for thefunctionalization of a 1 mL NS solution consists in incubating thecolloidal dispersion using simultaneously EZ-Link biotin-HPDPand streptavidin (molar ratio NSs/biotin/STV 1 e 1:1) for around12 h at room temperature. The amount of biotin�streptavidincomplex was high enough to guarantee a complete surfacefunctionalizationof biotin. Thebiotin�streptavidin-functionalizedNSs were washed by centrifugation (4.500 rpm, 10 min) andresuspended in water.
Extinction Measurements. The characterization by UV�vis spec-troscopy was carried out by scanning in the 200�1100 nmrange. The spectra were measured using a Shimadzu UV-1700
PharmaSpec spectrophotometer with a 1 cm quartz cell at roomtemperature.
DLS Measurements. The characterization by dynamic lightscattering was performed by recording the intensity of thescattered light as a function of the particle diameter in colloidalsolutions. The samples were measured using a Delsa Nano 2.2spectrometer with a 1 cm quartz cell at room temperature.
Transmission Electron Microscopy. Transmission electron micro-scopy (TEM) images were obtained using a JEM-JEOL 1120 EXIIunder an accelerating voltage of 80 kV. Samples were preparedby adding one drop (∼50 μL) of the sample colloidal solu-tion onto a holey carbon-Formvar coated copper TEM grid(100 mesh).
Cell Culture. Neuronal cultures from embryonic rat hippo-campi were prepared as described previously.64,65 Neurons[10 days in vitro (d.i.v.)] with long axons and well-developeddendritic arbors (stage 5) were used for all experiments. Aftertransfection, neurons were fixed, blocked, and incubated withprimary antibodies.
DNA Constructs and Transfection. GST-PKD1-kd (kinase dead)was a generous gift from Yusuke Maeda (Immunology FrontierResearch Center, University of Osaka, Japan), and pJPA5-mGluR1a (FL)-Myc was a contribution from Dr. G. Banker.pJPA5-mGluR1a (FL)-Myc has amyc sequence in theNT domain;this feature is the main reason for detecting the receptor on thecell surface.
Transient transfection of cultured neurons was performedas described previously,66 and the constructs were used ata concentration of 4�10 μg/μL unless otherwise stated.
Immunolabeling and Sample Preparation for Optical Studies. Neuroncells were fixed by immersion in a 4% formaldehyde solutionin 4% sucrose containing PBS for 20 min at room temperature.The cells were then washed three times by immersion into ice-cold 1� PBS for 5 min each time. The fixed cells were thenincubated in ice-cold 1� PBS buffer containing 1%BSA for 1 h atroom temperature to block nonspecific binding. After that, thecells were washed again three times with ice-cold 1� PBS for5 min each. The cell slides were then incubated with polyclonalanti c-Myc rabbit (diluted 1:350 in 1� PBS) for 1 h at RT. The cellswere subsequently washed three times with ice-cold 1� PBS for
ARTIC
LE
FRAIRE ET AL . VOL. XXX ’ NO. XX ’ 000–000 ’ XXXX
www.acsnano.org
O
5 min each. In a subsequent step, biotin-labeled secondary IgGgoat anti-rabbit antibody (diluted 1:300 in 1� PBS) was incu-bated with the above cell slides for 1 h at RT. Then the cells wereagain washed three times with ice-cold 1� PBS for 5 min each.In the subsequent immunolabeling step, each cell slide wascovered with 100 μL of biotin�streptavidin (1:1)-functionalizedAu NPs for 3 h at RT in a water vapor saturated atmosphereand then washed with ice-cold 1� PBS three times for 5 min.The cell slides were then integrated into a montage medium(Fluorosave, Calbiochem).
Preparation of SEM Samples. The culture and immunolabelingprocedures for SEM were identical to those used for samplepreparation in the optical studies with the exception that theneuron cells were grown on silicon substrates. After immuno-labeling, the silicon substrates were washed twice with ice-cold1� PBS and then briefly immersed into ddi water to remove thesalt on the surface.
Dark-Field Microscopy. We used a dual microscope (OlympusBX51), which combines transmitted and reflected light micro-scopes. The microscope was modified in order to introducedark-field condensers.
For experiments, an Olympus air dark-field condenser (NA =0.92�0.8), an Olympus objective LPlan 100� (NA = 0.70), anOlympus objective SLMPlan 50� (NA = 0.45), an edge 633 nmfilter, and a halogen lamp of the microscope were used. AnAngstrom Sun CFM-USB-4 1280 � 1008 pixels camera, which isattached to the microscope, allows us to record images of thecells.
Rayleigh Spectroscopy. Rayleigh scattering spectra were mea-sured using a Horiba LabRaM HR800 spectrometer coupled to adark-field microscope. A 600 lines nm�1 grating and a SynapseCCD 1024 � 256 detector, which are included in the HoribaLabRaM, allow the collection of the Rayleigh scattering signals.LabSpec 5 software is used to record the Rayleigh scatteringspectra. The spectra were corrected according to backgroundand to the excitation source spectrum.
Confocal Fluorescence. Fluorescence images were obtainedusing a confocal (Zeiss Pascal) microscope fitted with a 40�,1.4 NA objective. The excitation wavelength used was 488 nm(laser line from an argon laser). Images were processed usingAdobe Photoshop.
Scanning Electron Microscopy. Scanning electron microscopy(SEM) images were obtained using a Carl Zeiss FE-SEM Σigmaunder an accelerating voltage of 5.00 kV at a facility provided bythe Laboratorio de Microscopia Electrónica y Análisis por RayosX (LAMARX), Córdoba, Argentina.
SERS Measurements. SERS measurements were performedusing a Horiba LabRaman confocal microscope with a 100�(NA = 0.70) objective in the backscattering geometry. Thespectra acquisition timewas 20 s with a 600 linesmm�1 grating,giving a resolution of 4 cm�1. The excitation wavelength usedwas 633 nm (laser line from He�Ne). All measurements wereperformed at room temperature and were calibrated to Si.
Computational Methods. The optical responses of Au NSs werecomputed using the generalized multiparticle Mie theory asdescribed elsewhere.67�69 In all near-field calculations pre-sented in this work the dielectric function tabulated by Palikfor Au was employed.70 For the GMM calculations of the clusternear-field optical properties a multipolar expansion order of 10was used. In the calculations performed in this work the NPswere excited by a plane wave with an incidence pointing vector(propagation direction) normal to the surface. The GMM code isrestricted to applications in homogeneous media; therefore wehave used an effective medium approximation63 to account forthe interface between the cell surface and the aqueous envi-ronment. We consider that particles were immersed in a di-electric environment with an effective refractive index of neff =1.23, which was calculated as the average between the refrac-tive index of the membrane (nr = 1.45) and air (nr = 1.0003).
Conflict of Interest: The authors declare no competingfinancial interest.
Acknowledgment. The authors also acknowledge finan-cial support from CONICET (PIP 112-201101-00430), FONCYT
(PICT 2012-2286), SECYT-UNC, and PME 1544-2006. J.C.F.acknowledges CONICET for a Ph.D. fellowship.
Supporting Information Available: Optical and morphologi-cal characterization of AuNSs and the functionalization process;comparison of the functionalized nanoparticles technique withcommon immunofluorescence analysis; Raman spectra fromcontrol cells; near-field optical properties of cell-targeted nano-particles. This material is available free of charge via the Internetat http://pubs.acs.org.
REFERENCES AND NOTES1. Martin, F. L.; Kelly, J. G.; Llabjani, V.; Martin-Hirsch, P. L.;
Patel, I. I.; Trevisan, J.; Fullwood, N. J.; Walsh, M. J. Distin-guishing Cell Types or Populations Based on the Compu-tational Analysis of their Infrared Spectra. Nat. Protoc.2010, 5, 1748–1760.
2. Yi, C.; Liu, D.; Yang, M. Building Nanoscale Architectures byDirected Synthesis and Self-Assembly. Curr. Nanosci.2009, 5, 75–87.
3. Fraire, J. C.; Pérez, L. A.; Coronado, E. A. Rational Design ofPlasmonic Nanostructures for Biomolecular Detection:Interplay between Theory and Experiments. ACS Nano2012, 6, 3441–3452.
4. Gregas, M. K.; Scaffidi, J. P.; Lauly, B.; Vo-Dinh, T. Surface-Enhanced Raman Scattering Detection and Tracking ofNanoprobes: Enhanced Uptake and Nuclear Targeting inSingle Cells. Appl. Spectrosc. 2010, 8, 858–866.
5. Hodges, M. D.; Kelly, j. G.; Bentley, A. J.; Fogarty, S.; Patel, I. I.;Martin, F. L.; Fullwood, N. J. Combining Immunolabelingand Surface-Enhanced Raman Spectroscopy on Cell Mem-branes. ACS Nano 2011, 5, 9535–9541.
6. Wang, H. Y.; Rong, G. X.; Yan, B.; Yang, L. L.; Reinhard, B. M.Optical Sizing of Immunolabel Clusters through Multi-spectral Plasmon Coupling Microscopy. Nano Lett. 2011,11, 498–504.
7. Wang, J.; Boriskina, S. V.; Wang, H.; Reinhard, B. M. Illumi-nating Epidermal Growth Factor Receptor Densities onFilopodia through Plasmon Coupling. ACS Nano 2011, 5,6619–6628.
8. Rong, G. X.; Wang, H. Y.; Skewis, L. R.; Reinhard, B. M.Resolving Sub-Diffraction Limit Encounters in Nanoparti-cle TrackingUsing Live Cell PlasmonCouplingMicroscopy.Nano Lett. 2008, 8, 3386–3393.
9. Crow, M. J.; Grant, G.; Provenzale, J. M.; Wax, A. MolecularImaging and Quantitative Measurement of EpidermalGrowth Factor Receptor Expression in Live Cancer CellsUsing Immunolabeled Gold Nanoparticles. Am. J. Roent-genol. 2009, 192, 1021–1028.
10. Aaron, J.; Travis, K.; Harrison, N.; Sokolov, K. DynamicImaging of Molecular Assemblies in Live Cells Based onNanoparticle Plasmon Resonance Coupling. Nano Lett.2009, 9, 3612–3618.
11. Austin, L. A.; Kang, B.; Yen, C. W.; El-Sayed, M. A. PlasmonicImaging of Human Oral Cancer Cell Communities duringProgrammed Cell Death by Nuclear-Targeting Silver Nano-particles. J. Am. Chem. Soc. 2011, 133, 17594–17597.
12. Qian, W.; Huang, X. H.; Kang, B.; El-Sayed, M. A. Dark-FieldLight Scattering Imaging of Living Cancer Cell Componentfrom Birth through Division Using Bioconjugated GoldNanoprobes. J. Biomed. Opt. 2010, 15, 046025.
13. Seekell, K.; Crow, M. J.; Marinakos, S.; Ostrander, J.; Chilkoti,A.; Wax, A. Hyperspectral Molecular Imaging of MultipleReceptors Using Immunolabeled Plasmonic Nanoparti-cles. J. Biomed. Opt. 2011, 16, 116003.
14. Crow, M. J.; Seekell, K.; Ostrander, J. H.; Wax, A. Monitoringof Receptor Dimerization Using Plasmonic Coupling ofGold Nanoparticles. ACS Nano 2011, 5, 8532–8540.
15. Kennedy, D. C.; Tay, L. L.; Lyn, R. K.; Rouleau, Y.; Hulse, J.;Pezacki, J. P. Nanoscale Aggregation of Cellularβ2-AdrenergicReceptorsMeasuredby Plasmonic Interactions of Function-alized Nanoparticles. ACS Nano 2009, 3, 2329–2339.
16. Wang, J.; Yu, X.; Boriskina, S. V.; Reinhard, B. M. Quantifica-tion of Differential ErbB1 and ErbB2 Cell Surface Expression
ARTIC
LE

FRAIRE ET AL . VOL. XXX ’ NO. XX ’ 000–000 ’ XXXX
www.acsnano.org
P
and Spatial Nanoclustering through Plasmon Coupling.Nano Lett. 2011, 5, 6619–6628.
17. Hodges,M. D.; Kelly, J. G.; Bentley, A. J.; Fogarty, S.; Patel, I. I.;Martin, F. L.; Fullwood, N. J. Combining Immunolabelingand Surface-Enhanced Raman Spectroscopy on Cell Mem-branes. ACS Nano 2011, 5, 9535–9541.
18. Ahijado-Guzmán, R.; Gomez-Puertas, P.; Alvarez-Puebla,R. A.; Rivas, G.; Liz-Marzán, L. M. Surface-Enhanced RamanScattering-Based Detection of the Interactions betweenthe Essential Cell Division FtsZ Protein and BacterialMembrane Elements. ACS Nano 2012, 6, 7514–7520.
19. Fullwood, N. J.; Davies, Y.; Nieduszynski, I. A.; Marcyniuk, B.;Ridgway, A. E.; Quantock, A. J. Cell Surface-AssociatedKeratan Sulphate on Normal and Migrating Corneal En-dothelium. Invest. Ophthalmol. Vis. Sci. 1996, 37, 1256–1270.
20. Herpers, B.; Xanthakis, D.; Rabouille, C. ISH-IEM: A SensitiveMethod to Detect Endogenous mRNAs at the Ultrastruc-tural Level. Nat. Protoc. 2010, 5, 678–687.
21. Chen, L.; Wei, H.; Guo, Y.; Cui, Z.; Zhang, Z.; Zhang, X. E. GoldNanoparticle Enhanced Immuno-PCR for Ultrasensi-tive Detection of Hantaan Virus Nucleocapsid Protein.J. Immunol. Methods 2009, 346, 64–70.
22. Potu_cková, L.; Franko, F.; Bambousková, M.; Dráber, P.Rapid and Sensitive Detection of Cytokines Using Func-tionalized Gold Nanoparticle-Based Immuno-PCR, Com-parison with Immuno-PCR and ELISA. J. Immunol. Methods2011, 371, 38–47.
23. Yang, S.; Raymond-Stintz, M. A.; Ying, W.; Zhang, J.; Lidke,D. S.; Steinberg, S. L.; Williams, L.; Oliver, J. M.; Wilson, B. S.Mapping ErbB Receptors on Breast Cancer Cell Mem-branes during Signal Transduction. J. Cell Sci. 2007, 120,2763–2773.
24. Lessard, A.; Coleman, C. G.; Pickel, V. M. Chronic Intermit-tent Hypoxia Reduces Neurokinin-1 (NK1) Receptor Den-sity in Small Dendrites of Non-catecholaminergic NeuronsinMouse Nucleus Tractus Solitarius. Exp. Neurol. 2010, 223,634–644.
25. Stump, R. F.; Pfeiffer, J. R.; Seagrave, J.; Oliver, J. M.MappingGold-Labeled IgE Receptors on Mast Cells by ScanningElectron Microscopy: Receptor Distributions Revealed bySilver Enhancement, Backscattered Electron Imaging, andDigital Image Analysis. J. Histochem. Cytochem. 1988, 36,493–503.
26. Crow, M. J.; Grant, G.; Provenzale, J. M.; Wax, A. MolecularImaging and Quantitative Measurement of EpidermalGrowth Factor Receptor Expression in Live Cancer CellsUsing Immunolabeled Gold Nanoparticles. AJR Am. J.Roentgenol. 2009, 192, 1021–1028.
27. Kelly, K. L.; Coronado, E. A.; Zhao, L. L.; Schatz, G. C. TheOptical Properties of Metal Nanoparticles: The Influence ofSize, Shape, and Dielectric Environment. J. Phys. Chem. B2003, 107, 668–677.
28. Perassi, E. M.; Hernandez-Garriddo, J. C.; Moreno, M. S.;Encina, E. R.; Coronado, E. A.; Midgley, P. A. Using HighlyAccurate 3D Nanometrology to Model the Optical Proper-ties of Highly Irregular Nanoparticles: A Powerful Tool forRational Design of Plasmonic Devices. Nano Lett. 2010, 10,2097–2104.
29. Kambhampati, P.; Child, C. M.; Foster, M. C.; Campion, A. Onthe Chemical Mechanism of Surface Enhanced RamanScattering: Experiment and Theory. J. Chem. Phys. 1998,108, 5013–5026.
30. Li, S.; Pedano, M. L.; Chang, S.-H.; Mirkin, C. A.; Schatz, G. C.Gap Structure Effects on Surface-Enhanced Raman Scat-tering Intensities for Gold Gapped Rods. Nano Lett. 2010,10, 1722–1727.
31. Su, K. H.; Wei, Q. H.; Zhang, X.; Mock, J. J.; Smith, D. R.;Schultz, S. Interparticle Coupling Effects on Plasmon Reso-nances ofNanogoldParticles.Nano Lett.2003, 3, 1087–1090.
32. Jiang, J.; Bosnick, K.; Maillard, M.; Brus, L. Single MoleculeRaman Spectroscopy at the Junctions of Large Ag Nano-crystals. J. Phys. Chem. B 2003, 107, 9964–9972.
33. Gunnarsson, L.; Bjerneld, E. J.; Xu, H.; Petronis, S.; Kasemo,B.; Kall, M. Interparticle Coupling Effects in Nanofabricated
Substrates for Surface-Enhanced Raman Scattering. Appl.Phys. Lett. 2001, 78, 802–804.
34. Jain, P. K.; El-Sayed, M. A. Surface Plasmon Coupling andIts Universal Size Scaling in Metal Nanostructures of Com-plex Geometry: Elongated Particle Pairs and NanosphereTrimers. J. Phys. Chem. C 2008, 112, 4954–4960.
35. Rechberger, W.; Hohenau, A.; Leitner, A.; Krenn, J. R.;Lamprecht, B.; Aussenegg, F. R. Optical Properties of TwoInteracting Gold Nanoparticles. Opt. Commun. 2003, 220,137–141.
36. Xu, H. X.; Aizpurua, J.; Kall, M.; Apell, P. ElectromagneticContributions to Single-Molecule Sensitivity in Surface-Enhanced Raman Scattering. Phys. Rev. E 2000, 62, 4318–4324.
37. Prodan, E.; Radloff, C.; Halas, N. J.; Nordlander, P. A Hybri-dization Model for the Plasmon Response of ComplexNanostructures. Science 2003, 302, 419–422.
38. Halas, N. J.; Lal, S.; Chang, W. S.; Link, S.; Nordlander, P.Plasmons in Strongly Coupled Metallic Nanostructures.Chem. Rev. 2011, 111, 3913–3961.
39. Rozengurt, E. J.; Sinnett-Smith, J.; Van Lint, J.; Valverde, A. M.Protein Kinase D (PKD): A Novel Target for Dyacylglyceroland Phorbol Esters. Mutat. Res. 2005, 333, 153–160.
40. Díaz A~nel, A. M.; Malhotra, V. PKCeta Is Required forBeta1gamma2/Beta3gamma2- and PKD-Mediated Trans-port to the Cell Surface and the Organization of the GolgiApparatus. J. Cell Biol. 2005, 169, 83–91.
41. Rozengurt, E. Protein Kinase D Signaling: Multiple Bio-logical Functions in Health and Disease. Physiology(Bethesda) 2011, 26, 23–33.
42. Díaz A~nel, A. M. Phospholipase C Beta3 Is a Key Com-ponent in the Gbetagamma/PKCeta/PKD-Mediated Reg-ulation of Trans-Golgi Network to Plasma MembraneTransport. Biochem. J. 2007, 406, 157–165.
43. Fu, Y.; Rubin, C. S. Protein Kinase D: Coupling ExtracellularStimuli to the Regulation of Cell Physiology. EMBO Rep.2011, 12, 785–796.
44. Olayioye, M. A.; Barisic, S.; Hausser, A. Multi-Level Controlof Actin Dynamics by Protein Kinase D. Cell Signal 2013,25, 1739–1747.
45. Ellwanger, K.; Hausser, A. Physiological Functions of Pro-tein Kinase D in Vivo. IUBMB Life 2013, 65, 98–107.
46. Bard, F.; Malhotra, V. The Formation of TGN-To-Plasma-Membrane Transport Carriers. Annu. Rev. Cell Dev. Biol.2006, 22, 439–455.
47. Malhotra, V.; Campelo, F. PKDRegulatesMembrane Fissionto Generate TGN to Cell Surface Transport Carriers. ColdSpring Harb. Perspect. Biol. 2011, 3, a005280.
48. Yeaman, C.; Ayala, M. I.; Wright, J. R.; Bard, F.; Bossard, C.;Ang, A.; Maeda, Y.; Seufferlein, T.; Mellman, I.; Nelson, W. J.;Malhotra, V. Protein Kinase D Regulates Basolateral Mem-brane Protein Exit From Trans-Golgi Network.Nat. Cell Biol.2004, 6, 106–112.
49. Bisbal, M.; Conde, C.; Donoso, M.; Bollati, F.; Sesma, J.;Quiroga, S.; Díaz A~nel, A. M.; Malhotra, V.; Marzolo, M. P.;Cáceres, A. Protein Kinase D Regulates Trafficking ofDendritic Membrane Proteins in Developing Neurons.J. Neurosci. 2008, 28, 9297–9308.
50. Masu, M.; Tanabe, Y.; Tsuchida, K.; Shigemoto, R.; Nakanishi,S. Sequence and Expression of a Metabotropic GlutamateReceptor. Nature 1991, 49, 760–765.
51. Valenti, O.; Conn, P. J.; Marino, M. J. Distinct PhysiologicalRoles of the Gq-Coupled Metabotropic Glutamate Recep-tors Co-Expressed in the Same Neuronal Populations.J. Cell Physiol. 2002, 191, 125–137.
52. Dhami, G. K.; Ferguson, S. S. G. Regulation of MetabotropicGlutamate Receptor Signaling, Desensitization and Endo-cytosis. Pharmacol. Ther. 2006, 111, 260–271.
53. Willard, S. S.; Koochekpour, S. Glutamate Signaling inBenign and Malignant Disorders: Current Status, FuturePerspectives, and Therapeutic Implications. Int. J. Biol. Sci.2013, 9, 728–742.
54. Wang, H.; Rong, G.; Yan, B.; Reinhard, B. M. Optical Sizingof Immunolabel Clusters through Multispectral PlasmonCoupling Microscopy. Nano Lett. 2011, 11, 498–504.
ARTIC
LE

FRAIRE ET AL . VOL. XXX ’ NO. XX ’ 000–000 ’ XXXX
www.acsnano.org
Q
55. Aaron, J.; Nitin, N.; Travis, K.; Kumar, S.; Collier, T.; Park,S. Y.; Jose-Yacamán, M.; Coghlan, L.; Follen, M.; Richards-Kortum, R.; et al. Plasmon Resonance Coupling of MetalNanoparticles for Molecular Imaging of Carcinogenesis inVivo. J. Biomed. Opt. 2007, 12, 034007.
56. Fraire, J. C.; Pérez, L. A.; Coronado, E. A. Cluster Size Effectsin the SERS Response of Ag and Au Nanoparticle Aggre-gates: Experimental and Theoretical Insight. J. Phys. Chem.C 2013, 117, 23090–23107.
57. Luján, R.; Roberts, J. D. B.; Shigemoto, R.; Ohishi, H.;Somogyi, P. Differential Plasma Membrane Distributionof Metabotropic Glutamate Receptors mGluR1a, mGluR2and mGluR5, Relative to Neurotransmitter Release Sites.J. Chem. Neuroanat. 1997, 13, 219–241.
58. Garraleta, B. C.; Norton, P. R.; Lagugné-Labarthet, F. SERSDetection of Streptavidin/Biotin Monolayer Assemblies.Langmuir 2011, 27, 1494–1498.
59. Ringler, M.; Klar, T. A.; Schwemer, A.; Susha, A. S.; Stehr, J.;Raschke, G.; Funk, S.; Borowski, M.; Nichtl, A.; Kulrzinger, K.;Phillips, R. T.; Feldman, J. Moving Nanoparticles withRaman Scattering. Nano Lett. 2007, 7, 2753–2757.
60. Barth, A.; Zscherp, C. What Vibrations Tell Us aboutProteins. Q. Rev. Biophys. 2002, 35, 369–430.
61. Le Ru, E.; Etchegoin, P. G. Principles of Surface EnhancedRaman Spectroscopy, Vol. 1; Elsevier: Amsterdam, 2009.
62. Moskovits, M. Persistent Misconceptions Regarding SERS.Phys. Chem. Chem. Phys. 2013, 15, 5301–5311.
63. Tamaru, H.; Kuwata, H.; Miyazaki, H. T.; Miyano, K. ResonantLight Scattering from Individual Ag Nanoparticles andParticle Pairs. Appl. Phys. Lett. 2002, 80, 1826–1828.
64. Kunda, P.; Paglini, G.; Quiroga, S.; Kosik, K.; Cáceres, A.Evidence for the Involvement of Tiam-1 in Axon Forma-tion. J. Neurosci. 2001, 21, 2361–2372.
65. Rosso, S.; Bollati, F.; Bisbal, M.; Peretti, D.; Sumi, T.;Nakamura, T.; Quiroga, S.; Ferreira, A.; Cáceres, A. LIMK1Regulates Golgi Dynamics, Traffic of Golgiderived Vesicles,and Process Extension in Primary Cultured Neurons. Mol.Biol. Cell 2004, 15, 3433–3449.
66. Jeyifous, O.; Waites, C. L.; Specht, C. G.; Fujisawa, S.;Schubert, M.; Lin, E. I.; Marshall, J.; Aoki, C.; de Silva, T.;Montgomery, J. M.; et al. SAP97 and CASK Mediate Sortingof NMDA Receptors through a Previously UnknownSecretory Pathway. Nat. Neurosci. 2009, 12, 1011–1019.
67. Encina, E. R.; Coronado, E. A. On the Far Field OpticalProperties of Ag�Au Nanosphere Pairs. J. Phys. Chem. C2010, 114, 16278–16284.
68. Encina, E. R.; Coronado, E. A. Plasmon Coupling in SilverNanosphere Pairs. J. Phys. Chem. C 2010, 114, 3918–3923.
69. Encina, E. R.; Coronado, E. A. Near Field Enhancement in AgAu Nanospheres Heterodimers. J. Phys. Chem. C 2011, 115,15908–15914.
70. Palik, E. D. Handbook of Optical Constants of Solids;Academic Press: New York, 1985.
ARTIC
LE
Copyright © 2022 FDOKUMEN