catenin and cyclin D1 expression in human
153
PO Box 2345, Beijing 100023, China World J Gastroenterol 2004;10(22):3235-3239 Fax: +86-10-85381893 World Journal of Gastroenterology E-mail: [email protected] www.wjgnet.com Copyright © 2004 by The WJG Press ISSN 1007-9327 • ESOPHAGEAL CANCER • Prognostic and clinicopathological features of E-cadherin, α-catenin, β-catenin, γ γ γ γ γ-catenin and cyclin D 1 expression in human esophageal squamous cell carcinoma Ying-Cheng Lin, Ming-Yao Wu, De-Rui Li, Xian-Ying Wu, Rui-Ming Zheng Ying-Cheng Lin, De-Rui Li, Department of Medical Oncology, Tumor Hospital, Shantou University Medical College, Shantou 515031, Guangdong Province, China Ming-Yao Wu, Xian-Ying Wu, Rui-Ming Zheng, Department of Pathology, Shantou University Medical College, Shantou 515031, Guangdong Province, China Supported by a grant of Shantou University Research & Development Fund, No. L03002 Correspondence to: Dr. Ying-Cheng Lin, Department of Medical Oncology, Tumor Hospital, Shantou University Medical College, Shantou 515031, Guangdong Province, China. [email protected] Telephone: +86-754-8555844 Ext. 4042 Fax: +86-754-8560352 Received: 2004-01-20 Accepted: 2004-04-11 Abstract AIM: To investigate the expression of E-cadherin, α-catenin, β-catenin, γ-catenin and cyclin D1 in patients with esophageal squamous cell carcinoma (ESCC), and analyze their interrelationship with clinicopathological variables and their effects on prognosis. METHODS: Expression of E-cadherin, α-catenin, β-catenin, γ-catenin and cyclin D1 was determined by EnVision or SABC immunohistochemical technique in patients with ESCC consecutively, their correlation with clinical characteristics was evaluated and analyzed by univariate analysis. RESULTS: The reduced expression rate of E-cadherin, α- catenin, β-catenin and γ-catenin was 88.7%, 69.4%, 35.5% and 53.2%, respectively. Cyclin D1 positive expression rate was 56.5%. Expression of γ-catenin was inversely correlated with the degree of tumor differentiation and lymph node metastasis (χ 2 = 4.183 and χ 2 = 5.035, respectively, P<0.05), whereas the expression of E-cadherin was correlated only with the degree of differentiation (χ 2 = 5.769, P<0.05). Reduced expression of E-cadherin and γ -catenin was associated with poor differentiation of tumor, reduced expression of γ-catenin was also associated with lymph node metastasis. There obviously existed an inverse correlation between level of E-cadherin and γ-catenin protein and survival. The 3-year survival rates were 100% and 56% in E-cadherin preserved expression group and in reduced expression one and were 78% and 48% in γ-catenin preserved expression group and in reduced expression one, respectively. The differences were both statistically significant. Correlation analysis showed the expression level of α-catenin correlated with that of E-cadherin and β-catenin (P<0.05). CONCLUSION: The reduced expression of E-cadherin and γ-catenin, but not α-catenin, β-catenin and cyclin D1, implies more aggressive malignant behaviors of esophageal carcinoma cells and predicts the poor prognosis of patients. Lin YC, Wu MY, Li DR, Wu XY, Zheng RM. Prognostic and clinicopathological features of E-cadherin, α-catenin, β-catenin, γ-catenin and cyclin D1 expression in human esophageal squamous cell carcinoma. World J Gastroenterol 2004; 10 (22): 3235-3239 http://www.wjgnet.com/1007-9327/10/3235.asp INTRODUCTION Esophageal squamous cell carcinoma (ESCC) is one of the most common malignant tumors in China [1] . In recent years, the postoperative survival of patients with esophageal carcinoma has been improved. However, the overall prognosis for esophageal cancer patients remains poor, the 5-year survival rate of post operative advanced esophageal carcinoma patients was 20-35%. Although surgical techniques and preoperative management have progressed, early diagnosis and treatment are still important [2-5] . The prognostic clinical characterization of esophageal carcinoma remains inadequate using conventional histological grading and staging systems. Recently, various attempts have been made to investigate the relationship between certain molecular markers and the clinical course of squamous cell carcinoma of esophagus. In fact, the biological factors that determine a different individual outcome (recurrent, survival) at an analogous stage of disease are obscure [3-6] . E-cadherin and catenin are important adhesion molecules in normal epithelial tissue. Catenins, including α-catenin, β- catenin, γ-catenin, play an important role in the E-cadherin mediated intercellular signal transduction and cell adhesion. Loss of normal cellular adhesion plays a critical role in many aspects of tumor biology. For instance, alterations in cell-cell adhesion in cancer cells are reflected at the microscopic level in degree of cohesiveness and pattern of tumor growth. Detachment of cancer cells is an initial step in invasion of surrounding tissues and in spread to distant organs, and altered tumor cell adhesion is important in these processes. Several studies examined the role of the E-cadherin/catenin complex in growth mediation and maintenance of cell-cell adhesion in various tumors [7-19] . The expression of adhesion molecules may reflect biological behaviors and characteristics of tumors and are conducive to predict and evaluate the risk of relapse and metastasis in patients with postoperative esophageal carcinoma, thus having practical significance in guiding individualized treatment [3,18,20-23] . Cyclin D1 encodes a cell-regulatory protein that is expressed at high level during the G1 phase of the cell cycle. Cyclin D1 binds to cyclin-dependent kinases and proliferating cell nuclear antigens. The formation of these complexes has been implicated in the control of cell proliferation [24] . Cyclin D1 is the target gene of beta-catenin, overexpression of the latter in the cytoplasm may promote malignant transformation by triggering cyclin D1 expression in a number of cancers. It was regarded by several reports that cyclin D1 could predict the prognosis in some cancers, including esophageal cancer [25-28] . In this study, the expression of E-cadherin, α-catenin, β- catenin, γ-catenin and cyclin D1 in 62 ESCC patients was
-
Upload
khangminh22 -
Category
Documents
-
view
0 -
download
0
Transcript of catenin and cyclin D1 expression in human

PO Box 2345, Beijing 100023, China World J Gastroenterol 2004;10(22):3235-3239Fax: +86-10-85381893 World Journal of GastroenterologyE-mail: [email protected] www.wjgnet.com Copyright © 2004 by The WJG Press ISSN 1007-9327
• ESOPHAGEAL CANCER •
Prognostic and clinicopathological features of E-cadherin, ααααα-catenin,
βββββ-catenin, γ γ γ γ γ-catenin and cyclin D1 expression in human esophageal
squamous cell carcinoma
Ying-Cheng Lin, Ming-Yao Wu, De-Rui Li, Xian-Ying Wu, Rui-Ming Zheng
Ying-Cheng Lin, De-Rui Li, Department of Medical Oncology,Tumor Hospital, Shantou University Medical College, Shantou 515031,Guangdong Province, ChinaMing-Yao Wu, Xian-Ying Wu, Rui-Ming Zheng, Department ofPathology, Shantou University Medical College, Shantou 515031,Guangdong Province, ChinaSupported by a grant of Shantou University Research & DevelopmentFund, No. L03002Correspondence to: Dr. Ying-Cheng Lin, Department of MedicalOncology, Tumor Hospital, Shantou University Medical College, Shantou515031, Guangdong Province, China. [email protected]: +86-754-8555844 Ext. 4042 Fax: +86-754-8560352Received: 2004-01-20 Accepted: 2004-04-11
Abstract
AIM: To investigate the expression of E-cadherin, α-catenin,β-catenin, γ-catenin and cyclin D1 in patients with esophagealsquamous cell carcinoma (ESCC), and analyze theirinterrelationship with clinicopathological variables and theireffects on prognosis.
METHODS: Expression of E-cadherin, α-catenin, β-catenin,γ-catenin and cyclin D1 was determined by EnVision or SABCimmunohistochemical technique in patients with ESCCconsecutively, their correlation with clinical characteristicswas evaluated and analyzed by univariate analysis.
RESULTS: The reduced expression rate of E-cadherin, α-catenin, β-catenin and γ-catenin was 88.7%, 69.4%, 35.5%and 53.2%, respectively. Cyclin D1 positive expression ratewas 56.5%. Expression of γ-catenin was inversely correlatedwith the degree of tumor differentiation and lymph nodemetastasis (χ2 = 4.183 and χ2 = 5.035, respectively, P<0.05),whereas the expression of E-cadherin was correlated onlywith the degree of differentiation (χ2 = 5.769, P<0.05).Reduced expression of E-cadherin and γ-catenin wasassociated with poor differentiation of tumor, reducedexpression of γ-catenin was also associated with lymphnode metastasis. There obviously existed an inversecorrelation between level of E-cadherin and γ-catenin proteinand survival. The 3-year survival rates were 100% and56% in E-cadherin preserved expression group and inreduced expression one and were 78% and 48% in γ-cateninpreserved expression group and in reduced expression one,respectively. The differences were both statisticallysignificant. Correlation analysis showed the expression levelof α-catenin correlated with that of E-cadherin and β-catenin(P<0.05).
CONCLUSION: The reduced expression of E-cadherin andγ-catenin, but not α-catenin, β-catenin and cyclin D1, impliesmore aggressive malignant behaviors of esophagealcarcinoma cells and predicts the poor prognosis of patients.
Lin YC, Wu MY, Li DR, Wu XY, Zheng RM. Prognostic and
clinicopathological features of E-cadherin, α-catenin, β-catenin,γ-catenin and cyclin D1 expression in human esophagealsquamous cell carcinoma. World J Gastroenterol 2004; 10(22): 3235-3239
http://www.wjgnet.com/1007-9327/10/3235.asp
INTRODUCTIONEsophageal squamous cell carcinoma (ESCC) is one of the mostcommon malignant tumors in China[1]. In recent years, thepostoperative survival of patients with esophageal carcinomahas been improved. However, the overall prognosis for esophagealcancer patients remains poor, the 5-year survival rate of postoperative advanced esophageal carcinoma patients was 20-35%.Although surgical techniques and preoperative managementhave progressed, early diagnosis and treatment are stillimportant[2-5]. The prognostic clinical characterization ofesophageal carcinoma remains inadequate using conventionalhistological grading and staging systems. Recently, variousattempts have been made to investigate the relationship betweencertain molecular markers and the clinical course of squamouscell carcinoma of esophagus. In fact, the biological factors thatdetermine a different individual outcome (recurrent, survival)at an analogous stage of disease are obscure[3-6]. E-cadherin and catenin are important adhesion moleculesin normal epithelial tissue. Catenins, including α-catenin, β-catenin, γ-catenin, play an important role in the E-cadherinmediated intercellular signal transduction and cell adhesion.Loss of normal cellular adhesion plays a critical role in manyaspects of tumor biology. For instance, alterations in cell-celladhesion in cancer cells are reflected at the microscopic level indegree of cohesiveness and pattern of tumor growth. Detachmentof cancer cells is an initial step in invasion of surroundingtissues and in spread to distant organs, and altered tumor celladhesion is important in these processes. Several studiesexamined the role of the E-cadherin/catenin complex in growthmediation and maintenance of cell-cell adhesion in varioustumors[7-19]. The expression of adhesion molecules may reflectbiological behaviors and characteristics of tumors and areconducive to predict and evaluate the risk of relapse andmetastasis in patients with postoperative esophageal carcinoma,thus having practical significance in guiding individualizedtreatment[3,18,20-23]. Cyclin D1 encodes a cell-regulatory protein that is expressedat high level during the G1 phase of the cell cycle. Cyclin D1binds to cyclin-dependent kinases and proliferating cell nuclearantigens. The formation of these complexes has been implicatedin the control of cell proliferation[24]. Cyclin D1 is the target geneof beta-catenin, overexpression of the latter in the cytoplasmmay promote malignant transformation by triggering cyclin D1expression in a number of cancers. It was regarded by severalreports that cyclin D1 could predict the prognosis in some cancers,including esophageal cancer[25-28]. In this study, the expression of E-cadherin, α-catenin, β-catenin, γ-catenin and cyclin D1 in 62 ESCC patients was

3236 ISSN 1007-9327 CN 14-1219/ R World J Gastroenterol November 15, 2004 Volume 10 Number 22
analyzed, concerning the histopathological and survival data,effects on progression of cancer and their prognostic value inESCC. The results may provide some suggestions for clinicaltreatments.
MATERIALS AND METHODSMaterialsSpecimens of cancer tissues were taken from 62 consecutivepatients with squamous cell carcinoma of the thoracicesophagus who had undergone esophagectomy with regionallymph node dissected from January to December of 1996 at theDepartment of Thoracic Surgery, Cancer Hospital of ShantouUniversity Medical College. None of them received irradiationor chemotherapy preoperatively. The patients included 49 menand 13 women with a mean age of 54 (range 35-79) years. Threetumors were located in the upper thorax, 36 in the middle thoraxand 23 in the lower thorax (Table 1). The removed specimenswere examined histological with hematoxylin and eosin staining,and then the clinicopathologic stage was determined accordingto TNM classification. Survival time was calculated from thedate of operation to death or the date of last follow-up. Follow-up time ranged from 6 to 54 mo with an average of 36 mo.
Table 1 Background data of patients
Term No. of cases (%)
Total 62
Age (yr) <50 22 (35.5)
50 40 (64.5)Sex
Male 49 (79.1) Female 13 (20.9)Location
Upper thoracic 3 (4.8) Middle thoracic 36 (56.5)
Lower thoracic 23 (37.1)Histological grade I 16 (25.8)
II 35 (56.5) III 11 (17.7)
Depth of invasion T1 2 (3.2)
T2 10 (16.1) T3 32 (51.6) T4 18 (29)
Lymph node metastasis Positive 35 (56.5)
Negative 27 (43.5)
Immunohistochemical stainingImmunohistochemical analysis was done retrospectively.Resected esophageal specimens, including both tumor andnormal mucosae, were fixed in a 40 g/L formaldehyde solutionand embedded in paraffin. The following antibodies were usedin this study: mouse monoclonal anti-human cyclin D1 antibody(M-0024C, Antibody Company USA, diluted 1:50 in PBS), rabbitpolyclonal anti-human E-cadherin antibody (BA0475, AntibodyCompany USA, diluted 1:100 in PBS), rabbit polyclonal anti-human α-catenin antibody (C-2081, Sigma Bioscience Company,USA, diluted 1:1 000 in PBS), rabbit polyclonal anti-human β-catenin antibody (C-2206, Sigma Chemical Company, USA,diluted 1:2 000 in PBS), goat polyclonal anti-human γ-cateninantibody (C-20 Santa Cruz Biot Co, USA, diluted 1:200 in PBS).
Four µm thick sections of formalin-fixed paraffin-embeddedtissue blocks of esophageal tumors were cut. The sections weredeparaffinized, dehydrated and blocked to remove endogenousperoxidase activated by 3 mL/L H2O2 in methanol for 30 min.The sections were treated with microwave in 0.l mol/L citratebuffer pH 6.0 at 750 W for 12 min. After incubation with 100 mL/Lnormal goat serum to block non-specific binding, they werethen incubated with the primary antibodies overnight at 4 .After antibody was washed with PBS, the sections wereincubated with the secondary antibody and immunostained bySABC method (γ-catenin, Boster Company, China) and EnVisionmethod (E-cadherin, α-catenin, β-catenin and cyclin D1;EnVision, Cat. No. D-3001, 3002, Antibody Diagnostic Inc)according to the manufacturer’s instructions, and finally DABwas visualized. Tissues were counterstained with hematoxylin.Negative control was designed by using PBS instead of primaryantibody. Adjacent normal squamous epithelium served as aninternal positive control of E-cadherin and catenin proteinexpression. Known immunostained-positive sections were usedas positive control of cyclinD1 protein expression.
Positive criterion of immunohistochemical stainingTumor sections were scored by light microscopy by 2 independentobservers without knowledge of the stage and patient profiles.The percentage of positively stained cells was calculated after100 cells were counted at more than 5 high-power (40×) fields.The following definitions were made: Cyclin D1: more than10% positive staining in nuclei was defined as positive staining;E-cadherin and catenin: more than 10% positive staining in cellmembrane was defined as positive staining; less than 50%positive staining in cell membrane was defined as reducedexpression, more than 50% positive staining in cell membranewas defined as preserved expression.
Statistical analysisχ2 test or Fisher’s exact probability test and Spearman rankcorrelation coefficient analysis were used to assess the associationbetween immunohistochemical features and clinicopathologicalcharacteristics. The cumulative survival rate was calculated bythe Kaplan-Meier method, and statistical significance wasanalyzed by the log-rank test. A P value less than 0.05 wasconsidered statistically significant. All the statistical analyseswere performed using the SPSS 10.0 V for Windows.
RESULTSExpression of E-cadherin, ααααα-catenin, βββββ-catenin, γγγγγ-catenin andcyclin D1 in esophageal squamous cell carcinomaThe positive expression rate of E-cadherin, α-catenin, β-catenin,γ-catenin and cyclin D1 in 62 esophageal cancer patients was62.9% (39/62), 79% (49/62), 95.2% (59/62), 75.8% (47/62) and56.5% (35/62), respectively. The reduced expression rate of E-cadherin, α-catenin, β-catenin and γ-catenin was 88.7%, 69.4%,35.5%, 53.2%, respectively. Cyclin D1 positive expression showedbrown stained signals in the nuclei (Figure 1), only a small numberof expressions in cytoplasm or membrane of cells. E-cadherin,α-catenin, β-catenin and γ-catenin positive expression showedbrown stained signals in membrane of cells and the intercellularjunctions (Figure 2A-C).
Relationship between expressions of E-cadherin, ααααα-catenin,βββββ-catenin , γγγγγ-catenin and cyclin D1 in esophageal squamouscell carcinomaSignificant positive correlation was found between the intensityof α-catenin and β-catenin (r = 0.274, P<0.05), E-cadherin andα-catenin (r = 0.279, P<0.05). No significant differences wereseen in other protein expressions.

Lin YC et al. Expression of E-cadherin, catenin and cyclin D1 in esophageal squamous cell carcinoma 3237
Figure l Positive expression of cyclinD1 protein in nuclei ofesophageal squamous cell carcinoma. IHC×200.
Relationship between E-cadherin, ααααα-catenin, βββββ-catenin, γγγγγ-catenin and cyclin D1 expression and clinicopathologic variablesin esophageal squamous cell carcinomaExpression of E-cadherin correlated significantly only withhistological grade. Poor differentiation was associated withreduced or loss of E-cadherin expression (P<0.05). Significantinverse correlation existed between the intensity of γ-cateninexpression and histological grade, and lymph node metastasis(P<0.05). No significant correlation was found between abnormalexpression of other proteins and histological grade, lymph nodemetastasis and depth of invasion (Table 2).
Relationship between E-cadherin, ααααα-catenin, βββββ-catenin, γγγγγ-catenin, and cyclin D1 expression and survivalAnalysis of the 3-year survival after operation showed that theoverall survival rate was 62% in 62 cases of esophageal cancer.Univariate analysis showed that the survival time was associated
with the histological grade, depth of invasion, lymph nodemetastasis, expression of E-adherine and γ-catenin. ReducedE-cadherin or γ-catenin expression was correlated with poorprognosis. The mean survival time of grades I, II, III was 41, 45and 12 mo (P<0.05), respectively. The 3-year survival rate was67.1% and 49.4% in T3 and T4 patients (P<0.05), respectively,and was 47.8% and 80.3% in patients with positive and negativelymph node metastases (P<0.05), respectively. The mediansurvival time was 54 mo and 37 mo in patients with preservedand reduced or loss of E-cadherin expression, the 3-yearsurvival rate was 100% and 56% (P<0.05), respectively. Themedian survival time was 42 and 33 mo in patients with preservedand reduced or lost expression of γ-catenin, the 3-year survivalrate was 78% and 48% (P<0.05), respectively. No difference insurvival curves was seen between reduced expression of α-and β-catenins compared with preserved expression. Similarresults were found in the positive and negative expressions ofcyclin D1. The median survival time was 39 and 38 mo in thepatients with preserved and reduced or lost expression of α-catenin, the 3-year survival rate was 65%. The median survivaltime was 36 and 39 mo in the patients with preserved and reducedor loss expression of β-catenin, the 3-year survival rate was65%. The median survival time was 40 and 34 mo in the patientswith positive and negative expressions of cyclin D1, the 3-yearsurvival rate was 68% and 58% (P>0.05), respectively.
DISCUSSIONThe main causes of treatment failure are recurrence andmetastasis in resectable esophageal cancer. Modern molecularbiology studies have demonstrated that invasion and metastasisof tumors as a continuous process, include three steps: areduced cell-cell adhesion, alterations in the interaction of tumorcells with extracellular matrix, and invasion into surrounding
Table 2 The relationship between clinicopathology and the expression of cyclin D1 E-cad and catenins
CyclinD1 E-cad α-cat β-cat γ-catType Cases P P P P P
Positive Negative Preserved Reduced Preserved Reduced Preserved Reduced Preserved Reduced
Histological grade
I 16 6 10 5 11 7 9 10 6 8 8
II 35 15 20 >0.05 5 30 <0.05 11 24 >0.05 24 11 >0.05 19 16 <0.05
III 11 6 5 0 11 1 10 6 5 3 8
Depth of invasion
T3 12 6 6 >0.05 4 8 >0.05 4 8 >0.05 6 6 >0.05 5 7 >0.05
T4 50 31 19 6 44 15 35 34 16 25 25
Lymph node metastases
Positive 35 14 21 >0.05 6 29 >0.05 9 26 >0.05 23 12 >0.05 12 23 <0.05
Negative 27 13 14 4 23 10 17 17 10 18 9
Figure 2 Positive expression of E-cadherin and γ-catenin proteins in membrane of esophageal squamous cell carcinoma. A:Positive expression of E-cadherin protein in membrane of esophageal well differentiated squamous cell carcinoma. IHC ×200; B:Positive expression of γ-catenin protein in membrane of esophageal squamous cell carcinoma. IHC×200; C: Positive expressionof γ-catenin protein in membrane of esophageal squamous cell carcinoma. IHC×400.
A B C

tissues including blood vessels and lymph duct. Thus the firstand critical step is that the tumor cells could detach from primaryfoci and re-adhere to metastatic position[12,29,30]. E-cadherin is acalcium-dependent cell-cell adhesion transmembrane glycoprotein,maintaining normal epithelial polarity, and intercellularadhesion, which are present in almost all normal epithelial cellsurfaces. It is anchored to the cytoskeleton via cytoplasmproteins, including alpha and beta catenin[13,14,31]. E-cadherin,therefore, is one of the most important adhesion moleculesexpressed by epithelial cells and is regarded as an invasionsuppressor molecule[13,14]. In this study, overall survival wasinversely corrected with E-cadherin expression. Patients withpreserved E-cadherin expressing tumor had a better prognosisthan those with reduced expression of E-cadherin. This was inagreement with previous studies on a variety of cancers, suchas cancer of head and neck[15,16], breast[17,18], stomach[19,32,33],bladder[27]. In all these studies, reduction or loss of E-cadherinexpression was significantly associated with dedifferentiation,increased invasiveness, and high incidence of lymph nodemetastasis, hematogenous recurrence and poor prognosis in anumber of human carcinomas, including esophageal cancer.But some other studies did not acquire the same results[3].There were different results of reduced E-cadherin proteinexpression in specimens from patients with ESCC in variousresearches[21,23,32-35]. While in our investigation 88.7% ofESCC showed reduced expression of E-cadherin. It waspostulated that selection of the patients entering into the study,immunohistochemical method, antibody origination, tumorheterogeneity and differences in staining evaluation mightindividually or in combination hold responsibility. As a markerassociated with squamous cell differentiation[36], the level of E-cadherin expression had an inverse correlation with histologicalgrade. Reduced or loss of E-cadherin expression was correlatedwith poor differentiation, but not with lymphatic metastasesand depth of tumor invasion, suggesting that the reduction ofE-cadherin expression is associated with loss of the ability ofadhesion and facilitate to blood vessel metastases, as previouslyreported[21]. Catenins are a family of proteins including α-(102 ku), β-(88 ku), γ-(82 ku) catenins. The cytoplasmic domain of E-cadherincould bind directly to either β-catenin or γ-catenin, whereas α-catenin could link E-cadherin- (β, γ)-catenin complex to actingcytoskeleton. The integrity of the adhesion function of E-cadherinalso depended on an intact catenin system[15]. β-catenin couldalso play a role in intracellular signaling and function as anoncogene when it bound to T-cell factor 4 (Tcf4)-binding site inthe promotor region of cyclin D1 and transactivated genesafter translocation to the nuclei[37-39]. Catenins had differentclinicopathological roles in various cancers. In many epithelialcarcinomas including carcinoma of the esophagus[3,6,20,22,23,33],head and neck[16], breast[17-19,25], stomach[19], colon[24] andbladder[27], catenins had a prognostic significance in survival.Some investigators reported that abnormal expression of α-catenin was associated with the prognosis of esophagealcancer. It also had predicative values for lymph node metastasisin esophageal carcinoma. Several reports suggested thatabnormal expression of β-catenin could indicate poor prognosisin a number of tumors, including esophageal cancer[17,20,25,33]. γ-catenin was found to be more important in nodal metastasis intongue cancer. It was also predictive of the presence of subclinicalnodal metastasis in clinically node-negative neck[16]. Theexpression of α-catenin but not β- or γ-catenin was found to becorrelated with the expression of E-cadherin in this study. Thereduction or loss of γ-catenin expression was associated withmore lymph node metastases than the preserved expression(P<0.05). There was a correlation between poor differentiationof tumor and reduction or loss of γ-catenin expression. Thereduction or loss of γ-catenin expression was in association
with shorter median survival time and lower 3-year survivalrate. All these suggested that γ-catenin might be one of theprognostic factors in esophageal cancer. Howeres, the expressionof α-catenin and β-catenin was not related to the histologicalgrade, depth of invasion, lymph node metastases and survivaltime. The clinical significance of cyclin D1 expression was differentin various tumors. It has shown that cyclin D1 gene amplificationor enhanced expression was correlated with higher histologicalgrade of tumor, lymphatic or hematogenous metastasis andpoor prognosis[40-43]. A controversial report, however, existed[6].Some investigators thought cyclin D1 was the target gene of β-catenin. Although a positive correlation between β-cateninactivation and cyclin D1 expression was reported, our studydid not show such a result. Furthermore, cyclin D1 expressionwas not associated with the extent of tumor infiltration, gradeof differentiation, lymphatic metastases and survival time. Theseinconsistencies with other authors may be associated withlocation of tumor, pathologic classification, biologic behaviors,examination methods and evaluating criteria. Our study showed that the main prognostic factors ofpostoperative survival time were histological grade, depth oftumor invasion and lymph node metastasis. The reducedexpression of E-cadherin or γ-catenin was associated with poordifferentiation of tumor cells. Reduced or loss of γ-cateninexpression also had predictive values for nodal metastasis.The reduction or loss of E-cadherin and γ-catenin expressioncould predict the shorter survival time. Therefore we suggestthat adjuvant radiation or chemotherapy should be consideredin esophageal carcinoma patients with reduced expression ofE-cadherin and γ-catenin in T4 stage, poor-differentiation inhistopathology, and lymph node metastases in order to improvethe survival rate.
REFERENCES1 Su M, Lu SM, Tina DP, Zhao H, Li XY, Li DR, Zheng ZC.
Relationship between ABO blood groups and carcinoma ofesophagus and cardia in Chaoshan inhabitants of China. WorldJ Gastroenterol 2001; 7: 657-661
2 Hofstetter W, Swisher SG, Correa AM, Hess K, Putnam JB Jr,Ajani JA, Dolormente M, Francisco R, Komaki RR, Lara A,Martin F, Rice DC, Sarabia AJ, Smythe WR, Vaporciyan AA,Walsh GL, Roth JA. Treatment outcomes of resected esoph-ageal cancer. Ann Surg 2002; 236: 376-384
3 Shiozaki H, Doki Y, Kawanishi K, Shamma A, Yano M, InoueM, Monden M. Clinical application of malignancy potentialgrading as a prognostic factor of human esophageal cancers.Surgery 2000; 127: 552-561
4 Shimada Y, Imamura M, Watanabe G, Uchida S, Harada H,Makino T, Kano M. Prognostic factors of oesophageal squa-mous cell carcinoma from the perspective of molecular biology.Br J Cancer 1999; 80: 1281-1288
5 Goldberg RM. Gastrointestinal tract cancer in: Casciato DA,Lowitz BB, eds. Manual of clinical oncology.4th ed. LippincottWilliams Wilkins Inc 2000: 172-176
6 Ikeda G, Isaji S, Chandra B, Watanabe M, Kawarada Y. Prog-nostic significance of biologic factors in squamous cell carci-noma of the esophagus. Cancer 1999; 86: 1396-1405
7 Wijnhoven BP, Dinjens WN, Pignatelli M. E-cadherin-catenincell-cell adhesion complex and human cancer. Br J Surg 2000;87: 992-1005
8 Yagi T, Takeichi M. Cadherin superfamily genes: functions,genomic organization, and neurologic diversity. Genes Dev 2000;14: 1169-1180
9 Ivanov DB, Philippova MP, Tkachuk VA. Structure and Func-tions of classical cadherin. Biochemistry 2001; 66: 1174-1186
10 Van Aken E, De Wever O, Correia da Rocha AS, Mareel M.Defective E-cadherin/catenin complexes in human cancer.Virchows Arch 2001; 439: 725-751
11 Behrens J. Cadherins and catenins: role in signal transduction
3238 ISSN 1007-9327 CN 14-1219/ R World J Gastroenterol November 15, 2004 Volume 10 Number 22

and tumor progression. Cancer Metastasis Rev 1999; 18: 15-3012 Beavon IR. The E-cadherin-catenin complex in tumour
metastasis: structure, function and regulation. Eur J Cancer2000; 36: 1607-1620
13 Hirohashi S. Inactivation of the E-cadherin-mediated celladhesion system in human cancers. Am J Pathol 1998; 153:333-339
14 Christofori G, Semb H. The role of the cell-adhesion moleculeE-cadherin as a tumour-suppressor gene. Trends Biochem Sci1999; 24: 73-76
15 Chow V, Yuen AP, Lam KY, Tsao GS, Ho WK, Wei WI. Acomparative study of the clinicopathological significance of E-cadherin and catenins (α , β, γ) expression in the surgical man-agement of oral tongue carcinoma. J Cancer Res Clin Oncol 2001;127: 59-63
16 Andrews NA, Jones AS, Helliwell TR, Kinsella AR. Expressionof the E-cadherin-catenin cell adhesion complex in primarysquamous cell carcinomas of the head and neck and their nodalmetastases. Br J Cancer 1997; 75: 1474-1480
17 Bukholm IK, Nesland JM, Borresen-Dale AL. Re-expressionof E-cadherin, α-catenin and β-catenin, but not of γ-catenin, inmetastatic tissue from breast cancer patients. J Pathol 2000;190: 15-19
18 Lim SC, Lee MS. Significance of E-cadherin/beta-catenin com-plex and cyclin D1 in breast cancer. Oncol Rep 2002; 9: 915-928
19 Jawhari A, Jordan S, Poole S, Browne P, Pignatelli M, FarthingMJ. Abnormal immunoreactivity of the E-cadherin-catenincomplex in gastric carcinoma: relationship with patient survival.Gastroenterology 1997; 112: 46-55
20 Kadowaki T, Shiozaki H, Inoue M, Tamura S, Oka H, Doki Y,Iihara K, Matsui S, Iwazawa T, Nagafuchi A. E-cadherin andα-catenin expression in human esophageal cancer. Cancer Res1994; 54: 291-296
21 Tamura S, Shiozaki H, Miyata M, Kadowaki T, Inoue M, MatsuiS, Iwazawa T, Takayama T, Takeichi M, Monden M. DecreasedE-cadherin expression is associated with haematogenous re-currence and poor prognosis in patients with squamous cellcarcinoma of the oesophagus. Br J Surg 1996; 83: 1608-1614
22 Sanders DS, Bruton R, Darnton SJ, Casson AG, Hanson I,Williams HK, Jankowski J. Sequential changes in cadherin-catenin expression associated with the progression and hetero-geneity of primary oesophageal squamous carcinoma. Int JCancer 1998; 79: 573-579
23 Nakanishi Y, Ochiai A, Akimoto S, Kato H, Watanabe H,Tachimori Y, Yamamoto S, Hirohashi S. Expression of E-cadherin, alpha-catenin, beta-catenin and plakoglobin in esoph-ageal carcinomas and its prognostic significance: immunohis-tochemical analysis of 96 lesions. Oncology 1997; 54: 158-165
24 Utsunomiya T, Doki Y, Takemoto H, Shiozaki H, Yano M,Sekimoto M, Tamura S, Yasuda T, Fujiwara Y, Monden M.Correlation of beta-catenin and cyclin D1 expression in coloncancers. Oncology 2001; 61: 226-233
25 Lin SY, Xia W, Wang JC, Kwong KY, Spohn B, Wen Y, PestellRG, Hung MC. Beta-catenin, a novel prognostic marker forbreast cancer: its roles in cyclin D1 expression and cancerprogression. Proc Natl Acad Sci U S A 2000; 97: 4262-4266
26 Itami A, Shimada Y, Watanabe G, Imamura M. Prognosticvalue of p27 (Kip1) and CyclinD1 expression in esophagealcancer. Oncology 1999; 57: 311-317
27 Shiina H, Igawa M, Shigeno K, Terashima M, Deguchi M,
Yamanaka M, Ribeiro-Filho L, Kane CJ, Dahiya R. Beta-cateninmutations correlate with over expression of C-myc and cyclinD1 genes in bladder cancer. J Urol 2002; 168: 2220-2226
28 Ueta T, Ikeguchi M, Hirooka Y, Kaibara N, Terada T. Beta-catenin and cyclin D1 expression in human hepatocellularcarcinoma. Oncol Rep 2002; 9: 1197-1203
29 Korn WM. Moving toward an understanding of the metastaticprocess in hepatocellular carcinoma. World J Gastroenterol 2001;7: 777-778
30 Stamenkovic I. Matrix metalloproteinases in tumor invasionand metastasis. Semin Cancer Biol 2000; 10: 415-433
31 Bair EL, Massey CP, Tran NL, Borchers AH, Heimark RL,Cress AE, Bowden GT. Integrin- and cadherin-mediated in-duction of the matrix metalloprotease matrilysin in coculturesof malignant oral squamous cell carcinoma cells and dermalfibroblasts. Exp Cell Res 2001; 270: 259-267
32 Debruyne P, Vermeulen S, Mareel M. The role of the E-cadherin/catenin complex in gastrointestinal cancer. Acta GastroenterolBelg 1999; 62: 393-402
33 de Castro J, Gamallo C, Palacios J, Moreno-Bueno G, RodriguezN, Feliu J, Gonzatez-Baron M. Beta-catenin expression patternin primary oesophageal squamous cell carcinoma. Relation-ship with clinicopathologic features and clinical outcome.Virchows Arch 2000; 437: 599-604
34 Jian WG, Darnton SJ, Jenner K, Billingham LJ, Matthews HR.Expression of E-cadherin in oesophageal carcinomas from theUK and China: disparities in prognostic significance. J ClinPathol 1997; 50: 640-644
35 Pomp J, Blom J, van Krimpen C, Zwinderman AH, ImmerzeelJJ. E-cadherin expression in oesophageal carcinoma treatedwith high-dose radiotherapy; correlation with pretreatmentparameters and treatment outcome. J Cancer Res Clin Oncol1999; 125: 641-645
36 Wu H, Lotan R, Menter D, Lippmar SM, Xu XC. Expression ofE-cadherin is associated with squamous differentiation in squa-mous cell carcinomas. Anticancer Res 2000; 20: 1385-1390
37 Peifer M. β-catenin as oncogene: the smoking gun. Science1997; 275: 1752-1753
38 Kolligs FT, Bommer G, Goke B. Wnt/beta-catenin/tcf signaling:a critical pathway in gastrointestinal tumorigenesis. Digestion2002; 66: 131-144
39 Gottardi CJ, Wong E, Gumbiner BM. E-cadherin suppressescellular transformation by inhibiting beta-catenin signalingin an adhesion-independent manner. J Cell Biol 2001; 153:1049-1060
40 Kagawa Y, Yoshida K, Hirai T, Toge T. Significance of theexpression of p27Kip1 in esophageal squamous cell carcinomas.Dis Esophagus 2000; 13: 179-184
41 Matsumoto M, Natsugoe S, Nakashima S, Sakamoto F,Okumura H, Sakita H, Baba M, Takao S, Aikou T. Clinicalsignificance of lymph node micrometastasis of pN0 esoph-ageal squamous cell carcinoma. Cancer Lett 2000; 153: 189-197
42 Itami A, Shimada Y, Watanabe G, Imamura M. Prognosticvalue of p27 (Kip1) and CyclinD1 expression in esophagealcancer. Oncology 1999; 57: 311-317
43 Prognostic significance of CyclinD1 and E-Cadherin in patientswith esophageal squamous cell carcinoma: multiinstitutionalretrospective analysis. Research Committee on Malignancy ofEsophageal Cancer, Japanese Society for Esophageal Diseases.J Am Coll Surg 2001; 192: 708-718
Edited by Wang XL and Zhu LH Proofread by Xu FM
Lin YC et al. Expression of E-cadherin, catenin and cyclin D1 in esophageal squamous cell carcinoma 3239

PO Box 2345, Beijing 100023, China World J Gastroenterol 2004;10(22):3240-3244Fax: +86-10-85381893 World Journal of GastroenterologyE-mail: [email protected] www.wjgnet.com Copyright © 2004 by The WJG Press ISSN 1007-9327
• GASTRIC CANCER •
Elevated level of spindle checkprotein MAD2 correlates with cellular
mitotic arrest, but not with aneuploidy and clinicopathological
characteristics in gastric cancer
Chew-Wun Wu, Chin-Wen Chi, Tze-Sing Huang
Chew-Wun Wu, Department of Surgery, Taipei-Veterans GeneralHospital, Taipei, TaiwanChin-Wen Chi, Department of Medical Research and Education,Taipei-Veterans General Hospital and Institute of Pharmacology,National Yang-Ming University, Taipei, TaiwanTze-Sing Huang, Division of Cancer Research, National HealthResearch Institutes, Taipei, TaiwanCorrespondence to: Dr. Tze-Sing Huang, Cooperative Laboratoryat VGH-Taipei, No. 201, Shih-Pai Road Sec. 2, Taipei 112,Taiwan. [email protected]: +886-2-28712121 Ext. 2641 Fax: +886-2-28748307Received: 2004-02-11 Accepted: 2004-02-26
Abstract
AIM: To study the relevance of spindle assembly checkproteinMAD2 to cellular mitotic status, aneuploidy and otherclinicopathological characteristics in gastric cancer.
METHODS: Western blot analyses were performed toanalyze the protein levels of MAD2 and cyclin B1 in thetumorous and adjacent nontumorous tissues of 34 gastriccancer patients. Cell cycle distribution and DNA ploidy ofcancer tissues were also determined by flow cytometry.Conventional statistical methods were adopted to determinethe relevance of abnormal MAD2 level to mitotic status,aneuploidy and clinicopathological parameters.
RESULTS: Out of 34 gastric cancer patients 25 (74%)exhibited elevated MAD2 levels in their tumorous tissuescompared with the corresponding nontumorous tissues.Elevation of MAD2 levels significantly correlated with theincreased levels of cyclin B1 expression and G2/M-phasedistribution (P = 0.038 and P = 0.033, respectively), butwas not relevant to aneuploidy. The gastric cancer patientswith elevated MAD2 levels showed a tendency toward betterdisease-free and overall survival (P>0.05). However, noassociation was found between elevated MAD2 levels andpatients’ clinicopathological characteristics.
CONCLUSION: Elevation of MAD2 level is present in 74%of gastric cancer patients, and correlates with increasedmitotic checkpoint activity. However, elevation of MAD2level is not associated with patients’ aneuploidy and any ofthe clinicopathological characteristics.
Wu CW, Chi CW, Huang TS. Elevated level of spindle checkproteinMAD2 correlates with cellular mitotic arrest, but not withaneuploidy and clinicopathological characteristics in gastriccancer. World J Gastroenterol 2004; 10(22): 3240-3244
http://www.wjgnet.com/1007-9327/10/3240.asp
INTRODUCTIONDuring the cell division cycle, the localization and segregation
of chromosomes are under the surveillance of one group ofproteins, called spindle assembly checkproteins[1-3]. Mitoticarrest-deficient proteins (MADs) and budding uninhibited bybenzimidazole proteins (BUBs) are the major members of spindleassembly checkproteins[4-6]. Among them, MAD2 is a keycomponent of MAD/BUB complex that can censor mis-segregationof chromosomes by monitoring the microtubule attachment andtension[4,7,8]. MAD2 is usually expressed at a high steady-statelevel and distributed at unattached kinetochores[9,10]. Re-localization of MAD2 along microtubules to the spindle polesis achieved by minus-end-directed dynein-dynactin complexonly when all kinetochores properly attach to microtubules[10].Once misaligned chromosomes or even a single unattachedkinetochore is present, sufficient MAD2 molecules are kept inkinetochores to inhibit the onset of anaphase until allchromosomes exhibit proper bipolar attachment to the spindle.The kinetochore MAD2 can associate with and thus preventthe activation of anaphase-promoting complex (APC)[7,11-14].APC is a kinetochore-localizing, CDC27-based ubiquitin ligaseresponsible for cyclin B1 degradation and in turn down-regulation of cyclin B1-associated CDC2 kinase activity, whichis required for metaphase-anaphase transition and for exit frommitosis[7,11-14]. On the other hand, the microtubule-interferingagents, such as paclitaxel and nocodazole, can also elicit thespindle assembly checkpoint activity of MAD2[4,15,16]. In paclitaxel-treated cells, MAD2 mediates inhibition of APC’s ability toubiquitinate cyclin B1, which avoids the degradation of cyclinB1 and thus leads the cyclin B1/CDC2 activity to sustain longer[15].This persistence of MAD2 and cyclin B1/CDC2 activationrenders cells unable to exit from the metaphase and ultimatelyleads cells to apoptosis[15]. As described above, the role of MAD2 in spindle checkpointmachinery has been evidenced in many cell line studies.Clinically, it was reported that MAD2 was rarely the target forgenetic alterations in digestive tract cancers[17,18]. Whateverfrom clinical investigation or animal models, the evidencedemonstrating the relevance of MAD2 to cellular mitotic statusor other histopathological characteristics is yet lacking. Inthis study, we investigated the level of MAD2 in 34 gastriccancer patients. The MAD2-related mitotic checkpoint activitywas measured by cyclin B1 expression level and cell cycleG2/M-phase fraction. Our data indicated that 25 out of 34 (74%)gastric cancer patients exhibited elevated MAD2 levels intheir tumorous tissues rather than nontumorous tissues.Elevation of MAD2 level correlated with increased mitoticcheckpoint activity but was not relevant to aneuploidy(chromosomal numerical alteration). Although the gastriccancer patients with elevated MAD2 levels exhibited atendency toward better disease-free and overall survival, nocorrelation was found between abnormal MAD2 level andpatients’ clinicopathological characteristics.
MATERIALS AND METHODSPatients and tumor specimensThirty-four primary gastric cancer tissues and their corresponding

normal mucosa were obtained from patients at Taipei VeteransGeneral Hospital. The patients consisted of 25 men and 9 women(aged 43-80 years; mean: 63.8 years). Informed consent wasobtained from each patient. All specimens were snap-frozenimmediately after resection and stored at -80 until use. Partsof the specimens were taken for protein extraction and DNAcontent determination, and the remaining tissues were fixed in40 g/L buffered formaldehyde for histologic examination.Hematoxylin and eosin staining of tissue sections was adoptedto categorize the tumors according to the classification ofLauren[19].
Tissue lysate preparation and Western blot analysisTissue lysates were prepared by the method describedpreviously[20]. Briefly, tumor and non-tumor specimens wereground down into powder in the presence of liquid nitrogen.Around 0.5 g of tissue powder was resuspended in 1.5 mL of10 mmol/L Tris-Cl, pH 7.8, 140 mmol/L NaCl, 5 g/L deoxycholate,10 mL/L NP-40, 1 mmol/L phenylmethylsulfonyl fluoride,10 µg/mL aprotinin, 10 µg/mL pepstatin A, and 10 µg/mLleupeptin. The suspension was subjected to homogenizationand further sonication on ice, and finally was ultracentrifugedat 100 000 g for 1 h at 4 . The supernatant was saved andassayed for protein concentration (Bradford method). Aliquots(30 µg protein) of tissue lysates were separated on 100 g/LSDS-polyacrylamide gels, and electrotransferred ontopolyvinylidene difluoride membranes. After blocked withPBST (phosphate-buffered saline plus 1 mL/L Tween-20) plus50 g/L fat-free milk, the membranes were incubated with anti-MAD2, cyclin B1, and β-tubulin antibodies (Santa CruzBiotechnology, Santa Cruz, CA, USA), respectively, in PBSTplus 50 g/L milk at 4 for 12 h. The membranes were thenwashed three times with PBST buffer, and incubated withhorseradish peroxidase-conjugated secondary antibodies for1 h at room temperature. After washed three times with PBSTbuffer, the protein bands were detected by enhancedchemiluminescence (Amersham Biosciences, Piscataway, NJ,USA).
Flow cytometric analysis of DNA contentThe DNA ploidy and cell-cycle phase distribution of tissuespecimens were measured by flow cytometric analysis[21].Frozen specimens were first minced into 2 to 5 mm3 pieces andfurther digested into single cell suspensions[22]. Cellsuspensions were fixed with 800 mL/L ethanol at -20 at leastfor 30 min before subsequent Triton X-100 permeabilizationand propidium iodide staining[16]. The cellular DNA contentwas analyzed using a FACStar flow cytometer with an argonlaser tuned to the 488-nm line for excitation (BD Biosciences,San Jose, CA, USA).
Statistical analysesData were analyzed by χ2 or t test. Survival rate was calculatedby the Kaplan-Meier method. Statistical comparisons weremade with Logrank test. The difference was considered to besignificant when P value was less than 0.05.
RESULTS
Elevated MAD2 level occurs in human gastric cancerWestern blot analysis was performed to analyze the MAD2expression level of the tumorous and adjacent nontumoroustissues of 34 gastric cancer patients. As shown in Figure 1, theMAD2 protein was detected in both tumorous and nontumoroustissue lysates. In most patients, MAD2 seemed labile in thenontumorous tissues rather than the tumorous tissues. Thedifferential MAD2 level was confirmed by comparison with the
levels of β-tubulin in the same-paired tissue lysates. A patientwith elevated MAD2 level was defined as one whose MAD2level in the tumorous tissue was higher than that in the adjacentnontumorous tissue, and elevated MAD2 level could be foundin 25 of 34 (74%) cases of human gastric cancer.
Elevated MAD2 level correlates with increased mitotic arrestbut not aneuploidyThe MAD2-related mitotic arrest was measured by cyclin B1level and cell cycle G2/M-phase fraction. We found that 18 of34 (53%) gastric cancer patients had elevated cyclin B1expression level in their tumorous rather than nontumoroustissues (three examples shown in Figure 1). There was astatistically significant correlation between elevated MAD2level and elevated cyclin B1 level (P = 0.038), as 16 of 25 (64%)gastric cancer patients who had elevated MAD2 levels alsomanifested higher levels of cyclin B1 in their tumorous tissues(Table 1). Moreover, the DNA contents of tumor specimens of29 patients were successfully determined by flow cytometricanalysis. The data presented by mean±SD (%) of phasefractions are shown in Table 2. We observed that the ratio ofG2/M-phase fraction in the tumor specimens exhibiting elevatedMAD2 levels was statistically higher than that in the tumoroustissues with a normal MAD2 level (10.6 ± 4.9% vs 6.4 ± 4.0%,P = 0.033). No significant difference in the ratios of G0/G1 and S-phase fractions was found between the tumors with or withoutelevated MAD2 levels (Table 2). In addition, DNA ploidy wasalso determined from the tumor specimens of 32 patients.Although 18 of 32 (56%) patients were found to have aneuploidtumor cells, no correlation was observed between the occurrenceof aneuploidy and elevated MAD2 level in cancer tissues(P = 1.000, Table 3).
Figure 1 Examples of elevation of MAD2 and cyclin B1 levelsin human gastric cancer. Western blot analyses were performedto analyze the protein levels of MAD2 and cyclin B1 in thelysates from non-tumorous tissues (N) and tumorous tissues(T) of gastric cancer patients, #195, #198, #249, #269, #214, and#274. The levels of β-tubulin in the same-paired tissue lysateswere analyzed as internal control.
Table 1 Cyclin B1 expression status of 34 gastric cancer tissueswith or without MAD2 overexpression
Cyclin B1 level
T > N T = N
MAD2 level
T > N (n = 25) 16 9
T = N (n = 9) 2 7
P = 0.038
T: tumorous tissue; N: non-tumorous tissue.
Wu CW et al. The clinical relevance of MAD2 to mitotic checkpoint 3241
MAD2 level
T > N T = N
195 198 249 269 214 274
N T N T N T N T N T N T
MAD2
cyclin B1
β-tubulin

Table 2 Cell cycle phase fractions of 29 gastric cancer tissueswith or without MAD2 overexpression (mean±SD)
Phase fraction (%)
G0/G1 S G2/M
MAD2 level
T > N (n = 20) 80.8±5.9 8.6±7.0 10.6±4.9
T = N (n = 9) 83.5±7.4 9.9±7.7 6.4±4.0
P = 0.301 P = 0.657 P = 0.033
T: tumorous tissue; N: non-tumorous tissue.
Table 3 DNA ploidy status of 32 gastric cancer tissues with orwithout MAD2 overexpression
Diploidy Aneuploidy
MAD2 level T > N (n = 23) 10 13
T = N (n = 9) 4 5 P = 1.000
T: tumorous tissue; N: non-tumorous tissue.
Elevated MAD2 level does not correlate with clinicopathologicalcharacteristicsThe relationship of elevated MAD2 level with clinicopathologicalcharacteristics was also investigated and summarized (Table 4).The evaluated parameters included age at diagnosis, tumorsite and size, cell differentiation grade, stromal reaction, invasiveand metastatic status, etc. For the 34 studied patients, age andgender did not associate with higher levels of MAD2 in cancertissues (P>0.05). There was no association between elevatedMAD2 levels and different tumor sites (upper, middle, lower orwhole stomach), tumor sizes, and other histopathologicalcharacteristics including grade of cell differentiation, Borrmanntype, stromal reaction (medullary, intermediate or schirrhoustype), infiltration type (α, β or γ), Lauren histological classification(intestinal or diffuse type), and TNM staging (I-IV), either. Inaddition, elevation of MAD2 level in cancer tissues was notcorrelated with the invasion parameters, including the lymphaticduct or vessel invasion and depth of cancer invasion (mucosa,submucosa, propria muscle, subserosa, serosa, serosa exposed),and metastatic status such as peritoneal dissemination and lymphnode or liver metastasis (Table 4). Finally, the patients withelevated MAD2 levels in tumor tissues exhibited higher five-year overall and disease-free survival rates in comparison withthose without elevated MAD2 levels (48.0% vs 20.8% and46.3% vs 11.1%, respectively), but the difference did not reacha significant level (P = 0.478 and 0.229, respectively; Table 4).
Table 4 Relationships between elevated MAD2 levels andclinicopathological characteristics (mean±SD)
MAD2 level
T>N (n = 25) T=N (n = 9) P
Age (yr) 62.8±10.3 66.4±5.0 0.325
Sex (male/female) 19/6 6/3 0.586
Site of tumor 0.828
Upper stomach 4 2
Middle stomach 6 2
Lower stomach 14 4
Whole stomach 1 1
Size of tumor (cm) 7.3±2.3 8.0±2.9 0.470
Grade of cell differentiation 0.146
Well differentiated 1 0
Moderately differentiated 13 8
Poorly differentiated 11 1
Borrmann type 0.664
0 2 0
1 + 2 6 2
3 + 4 17 7
Stromal reaction 0.739
Medullary type 6 3
Intermediate type 12 3
Schirrhous type 7 3
Infiltration type 0.475
α 4 2
β 8 1
γ 13 6
Lauren histological classification 0.448
Intestinal type 13 3
Diffuse type 12 6
Lymph node metastasis (Yes/No) 15/10 6/3 1.000
Lymphatic duct invasion (Yes/No) 18/7 7/2 1.000
Vascular invasion (Yes/No) 2/23 1/8 1.000
Liver metastasis (Yes/No) 1/24 0/9 1.000
Peritoneal dissemination (Yes/No) 2/23 1/8 1.000
Depth of cancer invasion 0.738
Mucosa, submucosa 1 0
Propria muscle, subserosa 5 1
Serosa 18 8
Serosa (infiltration) exposed 1 0
TNM stage 0.932
I 3 1
II 8 2
III 8 3
IV 6 3
Five-yr overall survival rate 48.0% 20.8% 0.478
Five-yr disease-free survival rate 46.3% 11.1% 0.229
DISCUSSIONSpindle assembly checkpoint is one of the mechanisms to guardthe fidelity of cell division cycle[1-3]. MAD2 is a key componentof spindle assembly checkprotein complex MAD/BUB that isresponsible for monitoring the localization and segregation ofchromosomes[4,7,8]. MAD2 could induce mitotic arrest byassociating with and thus inhibiting APC when microtubule-interfering agents were present in cancer cell cultures[4,15].However, the evidence demonstrating the clinical relevance ofMAD2 to cancer cell mitotic status is yet lacking. In this study,we provided the clinical data to support the mitotic checkpointrole of MAD2 in cancer tissues. We found that 74% of ourgastric cancer patients had elevated levels of MAD2 in theirtumorous tissues. These patients also exhibited more cyclin B1expression and G2/M-phase distribution in their cancer cells.Because MAD2 can interfere with APC and APC is an ubiquitinligase responsible for cyclin B1 degradation, elevation of bothcyclin B1 expression and cellular G2/M-phase ratio may beresulted from a higher mitotic checkpoint activity that is expectedof elevated MAD2 level. Noteworthily, these patients had atendency toward longer disease-free and overall survival. Wespeculate that the checkpoint activity of MAD2 exerted in thesepatients monitors the interaction of chromosomes with spindlefibers, which is finally linked with better disease-free and overallsurvival. Elevated level of MAD2 seems to be a possible target
3242 ISSN 1007-9327 CN 14-1219/ R World J Gastroenterol November 15, 2004 Volume 10 Number 22

for potential development of novel therapeutic or prognosticmodalities in the future. Our data indicate that elevated MAD2 levels did not preventthe occurrence of aneuploidy in gastric cancer. Aneuploidy isone of the hallmarks of cancer cells[23-25]. Considering spindleassembly checkproteins function as a monitor for the fidelityof chromosomal segregation, impairment of spindle assemblycheckpoint is expected to associate with the development ofcancer cell aneuploidy. However thus far, many aneuploidcancer cell lines did undergo mitotic arrest in response to spindledamage, indicating that not all cancer cells with aneuploidy hadan impaired spindle checkpoint[26-28]. Moreover, accumulatingstudies have demonstrated that the BUBs (BUB1, BUBR1 andBUB3) and MADs (MAD1 and MAD2) were rarely the targetsfor genetic alterations in a variety of human cancer typesincluding head-and-neck squamous cell carcinoma[29], non-small cell lung cancer[29,30], thyroid follicular neoplasms[28],hepatocellular carcinoma[27], and digestive tract cancers[17,18,30].These data suggest that cancer cell aneuploidy may arise fromthe alternative defects yet to be discovered. Despite of the lowfrequency of gene mutation, a research of 43 gastric cancerpatients concluded that overexpression of BUB1, BUBR1 or/and BUB3 was observed in >60% of cases[31]. There was nostatistically positive correlation between overexpression ofBUBs and cancer aneuploidy. Instead, the overexpression wassignificantly correlated with Ki-67 expression of tumor cells,suggesting that BUBs are proliferation-associated proteinsother than spindle checkproteins in gastric cancer[31]. The gastric cancer patients with different molecularalterations were shown to have distinct histopathologicalfeatures. For example, simultaneous overexpression ofhepatocyte growth factor receptor (c-Met), autocrine motilityfactor receptor (AMFR) and urokinase-type plasminogenactivator receptor (uPAR) was correlated with positive lymphaticvessel invasion and infiltration[32]. Estrogen receptor (ER) wasmore expressed in diffuse-type patients with regional lymphnode metastasis[33]. Additionally, positive expression of nm23was detected in as high as 74% of gastric cancer patients andwas related to patients’ age, tumor size, Borrmann type, Laurenclassification, and TNM stage[34]. COX-2 overexpressionsignificantly correlated with TNM staging; while abnormalexpression of E-cadherin/β-catenin complex occurred moresignificantly in Borrmann types III/IV than in types I/II. In ourpresent study, no histopathological parameter was found to beassociated with elevated MAD2 level in gastric cancer patients.It was reported consistently that MAD2 was significantlyoverexpressed in colorectal adenocarcinoma, but was notrelated to differentiation or other clinical parameters. In conclusion, an elevation of spindle checkprotein MAD2level was observed in 74% of our gastric cancer patients, andwas significantly correlated with the increased levels of cyclinB1 expression and G2/M-phase distribution in cancer tissues.However, an elevated MAD2 level was not associated withaneuploidy and other clinical factors, including demographicfeatures and histopathological characteristics.
REFERENCES1 Sorger PK, Dobles M, Tournebize R, Hyman AA. Coupling
cell division and cell death to microtubule dynamics. Curr OpinCell Biol 1997; 9: 807-814
2 Cleveland DW , Mao Y, Sullivan KF. Centromeres andkinetochores: from epigenetics to mitotic checkpoint signaling.Cell 2003; 112: 407-421
3 Mollinedo F, Gajate C. Microtubules, microtubule-interferingagents and apoptosis. Apoptosis 2003; 8: 413-450
4 Li Y, Benezra R. Identification of a human mitotic checkpointgene: hsMAD2. Science 1996; 274: 246-248
5 Taylor SS, Ha E, McKeon F. The human homologue of Bub3 is
required for kinetochore localization of Bub1 and a Mad3/bub1-related protein kinase. J Cell Biol 1998; 142: 1-11
6 Skoufias DA, Andreassen PR, Lacroix FB, Wilson L, MargolisRL. Mammalian mad2 and bub1/bubR1 recognize distinctspindle-attachment and kinetochore-tension checkpoints. ProcNatl Acad Sci U S A 2001; 98: 4492-4497
7 Li Y, Gorbea C, Mahaffey D, Rechsteiner M, Benezra R. MAD2associates with the cyclosome/anaphase-promoting complexand inhibits its activity. Proc Natl Acad Sci U S A 1997; 94:12431-12436
8 Dobles M, Liberal V, Scott ML, Benezra R, Sorger PK. Chromo-somal missegregation and apoptosis in mice lacking the mi-totic checkpoint protein Mad2. Cell 2000; 101: 635-645
9 Howell BJ, Hoffman DB, Fang G, Murray AW, Salmon ED.Visualization of Mad2 dynamics at kinetochores, along spindlefibers, and at spindle poles in living cells. J Cell Biol 2000; 150:1233-1250
10 Howell BJ, McEwen BF, Canman JC, Hoffman DB, Farrar EM,Rieder CL, Salmon ED. Cytoplasmic dynein/dynactin driveskinetochore protein transport to the spindle poles and has arole in mitotic spindle checkpoint inactivation. J Cell Biol 2001;155: 1159-1172
11 Fang G, Yu H, Kirschner MW. The checkpoint protein MAD2and the mitotic regulator CDC20 form a ternary complex withthe anaphase-promoting complex to control anaphase initiation.Genes Dev 1998; 12: 1871-1883
12 Gorbsky GJ, Chen RH, Murray AW. Microinjection of anti-body to Mad2 protein into mammalian cells in mitosis inducespremature anaphase. J Cell Biol 1998; 141: 1193-1205
13 Kallio M, Weinstein J, Daum JR, Burke DJ, Gorbsky GJ. Mam-malian p55CDC mediates association of the spindle check-point protein Mad2 with the cyclosome/anaphase-promotingcomplex, and is involved in regulating anaphase onset and latemitotic events. J Cell Biol 1998; 141: 1393-1406
14 Wassmann K, Benezra R. Mad2 transiently associates with anAPC/p55Cdc complex during mitosis. Proc Natl Acad Sci U SA 1998; 95: 11193-11198
15 Huang TS, Shu CH, Chao Y, Chen SN, Chen LL. Activation ofMAD 2 checkprotein and persistence of cyclin B1/CDC 2 ac-tivity associate with paclitaxel-induced apoptosis in humannasopharyngeal carcinoma cells. Apoptosis 2000; 5: 235-241
16 Huang TS, Shu CH, Chao Y, Chen LT. Evaluation of GL331 incombination with paclitaxel: GL331’s interference withpaclitaxel-induced cell cycle perturbation and apoptosis. Anti-Cancer Drug 2001; 12: 259-266
17 Imai Y, Shiratori Y, Kato N, Inoue T, Omata M. Mutationalinactivation of mitotic checkpoint genes, hsMAD2 and hBUB1,is rare in sporadic digestive tract cancers. Jpn J Cancer Res 1999;90: 837-840
18 Cahill DP, da Costa LT, Carson-Walter EB, Kinzler KW,Vogelstein B, Lengauer C. Characterization of MAD2B andother mitotic spindle checkpoint genes. Genomics 1999; 58:181-187
19 Lauren P. The two histological main types of gastric carcinoma.Diffuse and so-called intestinal type carcinoma: an attempt ata histoclinical classification. Acta Pathol Microbiol Scand 1965;64: 31-49
20 Chao Y, Shih YL, Chiu JH, Chau GY, Lui WY, Yang WK, LeeSD, Huang TS. Overexpression of cyclin A but not Skp 2 corre-lates with the tumor relapse of human hepatocellular carcinoma.Cancer Res 1998; 58: 985-990
21 Chiu JH, Kao HL, Wu LH, Chang HM, Lui WY. Prediction ofrelapse or survival after resection in human hepatomas byDNA flow cytometry. J Clin Invest 1992; 89: 539-545
22 Chen MH, Yang WK, Whang-Peng J, Lee LS, Huang TS. Dif-ferential inducibilities of GFAP expression, cytostasis andapoptosis in primary cultures of human astrocytic tumors.Apoptosis 1998; 3: 171-182
23 Andreassen PR, Martineau SN, Margolis RL. Chemical induc-tion of mitotic checkpoint override in mammalian cells resultsin aneuploidy following a transient tetraploid state. MutationRes 1996; 372: 181-194
24 Cahill DP, Lengauer C, Yu J, Riggins GJ, Willson JK, MarkowitzSD, Kinzler KW, Vogelstein B. Mutations of mitotic checkpointgenes in human cancers. Nature 1998; 392: 300-303
Wu CW et al. The clinical relevance of MAD2 to mitotic checkpoint 3243

25 Masuda A, Takahashi T. Chromosome instability in humanlung cancers: possible underlying mechanisms and poten-tial consequences in the pathogenesis. Oncogene 2002; 21:6884-6897
26 Tighe A, Johnson VL, Albertella M, Taylor SS. Aneuploid co-lon cancer cells have a robust spindle checkpoint. EMBO Rep2001; 2: 609-614
27 Saeki A, Tamura S, Ito N, Kiso S, Matsuda Y, Yabuuchi I,Kawata S, Matsuzawa Y. Frequent impairment of the spindleassembly checkpoint in hepatocellular carcinoma. Cancer 2002,94: 2047-2054
28 Ouyang B, Knauf JA, Ain K, Nacev B, Fagin JA. Mechanismsof aneuploidy in thyroid cancer cell lines and tissues: evidencefor mitotic checkpoint dysfunction without mutations in BUB1and BUBR1. Clin Endocrinol 2002; 56: 341-350
29 Yamaguchi K, Okami K, Hibi K, Wehage SL, Jen J, SidranskyD. Mutation analysis of hBUB1 in aneuploid HNSCC and lungcancer cell lines. Cancer Lett 1999; 139: 183-187
30 Jaffrey RG, Pritchard SC, Clark C, Murray GI, Cassidy J, KerrKM, Nicolson MC, McLeod HL. Genomic instability at the BUB1
locus in colorectal cancer, but not in non-small cell lung cancer.Cancer Res 2000; 60: 4349-4352
31 Grabsch H, Takeno S, Parsons WJ, Pomjanski N, BoeckingA, Gabbert HE, Mueller W. Overexpression of the mitoticcheckpoint genes BUB1, BUBR1, and BUB3 in gastric can-cer-association with tumor cell proliferation. J Pathol 2003;200: 16-22
32 Taniguchi K, Yonemura Y, Nojima N, Hirono Y, Fushida S,Fujimura T, Miwa K, Endo Y, Yamamoto H, Watanabe H. Therelation between the growth patterns of gastric carcinoma andthe expression of hepatocyte growth factor receptor (c-met),autocrine motility factor receptor, and urokinase-type plasmi-nogen activator receptor. Cancer 1998; 82: 2112-2122
33 Zhao XH, Gu SZ, Liu SX, Pan BR. Expression of estrogen recep-tor and estrogen receptor messenger RNA in gastric carcinomatissues. World J Gastroenterol 2003; 9: 665-669
34 Lee KE, Lee HJ, Kim YH, Yu HJ, Yang HK, Kim WH, LeeKU, Choe KJ, Kim JP. Prognostic significance of p53, nm23,PCNA and c-erbB-2 in gastric cancer. Jpn J Clin Oncol 2003;33: 173-179
Edited by Zhu LH and Xu FM
3244 ISSN 1007-9327 CN 14-1219/ R World J Gastroenterol November 15, 2004 Volume 10 Number 22

PO Box 2345, Beijing 100023, China World J Gastroenterol 2004;10(22):3245-3250Fax: +86-10-85381893 World Journal of GastroenterologyE-mail: [email protected] www.wjgnet.com Copyright © 2004 by The WJG Press ISSN 1007-9327
• GASTRIC CANCER •
Expression level of wild-type survivin in gastric cancer is an
independent predictor of survival
Hua Meng, Cai-De Lu, Yu-Lei Sun, De-Jian Dai, Sang-Wong Lee, Nobuhiko Tanigawa
Hua Meng, Department of General Surgery, First Affiliated Hoppitalof Dalian Medical University, Dalian 116011, Liaoning Province, ChinaDe-Jian Dai, Department of Surgery, Second Affiliated Hospital ofZhejiang University School of Medicine, Hangzhou 310009, ZhejiangProvince, ChinaCai-De Lu, Department of Surgery, Lihuili Hospital of NingboUniversity Medical School, Ningbo 315040, Zhejiang Province, ChinaYu-Lei Sun, Department of Anaesthesiology, First Affiliated Hospitalof Dalian Medical University, Dalian 116011, Liaoning Province, ChinaSang-Wong Lee, Nobuhiko Tanigawa, Department of General andGastroenterological Surgery, Osaka Medical College, 2-7 Daigaku-machi, Takatsuki, Osaka 569-8686, JapanSupported by the National Natural Science Foundation of China, No.30271483 and Grant-in-Aid from the Japanese Ministry of Education,Culture, Sports, Science, and Technology of Japan, No.13470262Correspondence to: Cai-De Lu, M.D., Department of Surgery, LihuiliHospital of Ningbo University Medical School, Ningbo 315040,Zhejiang Province, China. [email protected]: +86-574-87392290 Ext.7707 Fax: +86-574-87392232Received: 2003-10-30 Accepted: 2003-12-16
Abstract
AIM: Survivin is a novel antiapoptotic gene in which threesplicing variants have been recently cloned and characterized.Survivin has been found to be abundantly expressed in awide variety of human malignancies, whereas it is undetectablein normal adult tissues. We aimed to study the expressionof three survivin splicing variants in gastric cancer, and toevaluate the prognostic significance of the expression ofsurvivin variants in gastric cancer.
METHODS: Real time quantitative RT-PCR was performedto analyze the expression of survivin variants in 79 pairedtumors and normal gastric mucosa samples at the mRNAlevel. Proliferative and apoptotic activity was measuredusing Ki-67 immunohistochemical analysis and the TUNELmethod, respectively.
RESULTS: All the cases tested expressed wild-type survivinmRNA, which was not only the dominant transcript, butalso a poor prognostic biomarker (P = 0.003). Non-antiapoptostic survivin-2B mRNA was correlated with tumorstage (P = 0.001), histological type (P = 0.004), and depthof tumor invasion (P = 0.041), while survivin- Ex3 mRNAshowed a significant association with apoptosis (P = 0.02).
CONCLUSION: Wild-type survivin mRNA expression levelsare of important prognostic value and significant participationof survivin-2B and survivin- Ex3 is suggested in gastriccancer development.
Meng H, Lu CD, Sun YL, Dai DJ, Lee SW, Tanigawa N. Expressionlevel of wild-type survivin in gastric cancer is an independentpredictor of survival. World J Gastroenterol 2004; 10(22):3245-3250
http://www.wjgnet.com/1007-9327/10/3245.asp
INTRODUCTIONApoptosis, also called programmed cell death, plays an important
role in the development and homeostasis of tissues. Deregulationof apoptosis is involved in carcinogenesis by abnormallyprolonged cell survival, facilitating the accumulation of transformingmutations and promoting resistance to immunosurveillance[1].Several studies have consistently shown that survivin couldmediate suppression of apoptosis. Surprisingly, in a single copyof survivin gene, three alternatively splicing transcripts havebeen identified. In addition to wild-type survivin, two novelsurvivin variants (survivin-2B, survivin- Ex3), which havedifferent antiapoptotic properties, have been generated.Survivin-2B has lost its anti-apoptotic potential, whereas itsanti-apoptotic potential is preserved in survivin- Ex3[2,3]. Theirdifferent functions in carcinogenesis are largely unknown. Gastric carcinoma is one of the most frequent humanmalignancies[4]. As shown by our group[5], 34.5% of gastriccancers expressed survivin protein and a positive correlationbetween accumulated p53 and survivin expression in neoplasiawas found. In this study, we investigated the distribution ofsurvivin variants in paired tumors and normal gastric mucosasamples at the mRNA level and assessed the potential relationshipbetween the expression of survivin variants and proliferativeactivity, apoptosis or prognostic significance.
MATERIALS AND METHODS
Patients and specimensMatched pairs of tumors and normal gastric mucosa sampleswere obtained from 76 patients with gastric cancer and 1 patientwith malignant lymphoma at the Department of General andGastroenterological Surgery, Osaka Medical College Hospitalduring 2000-2002. The specimens resected at surgery wereimmediately frozen in liquid nitrogen and stored at -80 untiltotal RNA extraction. Clinicopathological parameters were assignedaccording to the principles outlined by Japanese Classificationof Gastric Carcinoma[6]. Samples included stage I cases (n = 22),stage II cases (n = 11), stages III cases (n = 20), stage IV cases(n = 26). There were 62 (78.5%) males and 17 (22.5%) females,and the mean age of the patients was 65.2 years (SD, 9.6 years;range, 40-87 years). No Patients received chemotherapy or radiationtherapy either before or after surgery. The mean follow-up periodwas 19.7 mo (SD, 14.9 mo; range, 1.5-87 mo). Formalin-fixedparaffin-embedded blocks of primary tumors were taken frompathological archives. Two to four µm thick serial sections of2-4 thicken were prepared from the cut surface of the blocks atthe maximum cross-section of the tumors.
Total RNA extractionTotal RNA was extracted by an acid guanidinium-phenol-chloroform method using ISOGEN (Nippon Gene, Toyama, Japan)according to the manufacturer’s instructions. Afterwards thetotal RNA was purified using DNase 1 (GIBCO-BRL, Gaithersburg,MD, USA). Extracted total RNA pellets were dissolved with RNasefree diethyl pyrocarbonate (DEPC)-treated water.
Reverse transcriptionComplementary DNA (cDNA) was synthesized with 5 µg oftotal RNA and 20 pmoL oligo (dT)18 primer using an Advantage
?

RNA-for-PCR kit (CLONTECH, Inc., Palo Alto, USA), withthe exception of 200 U SurperScriptTM II RNase H- reversetranscriptase (Invitrogen, Inc., Carlsbad, USA) in a final 20 µLreaction volume. RT reactions were performed at 50 for 120 min.Finally, cDNA solution was diluted to a total volume 100 µL.
Quantitative real time RT-PCRQuantitative real time RT-PCR was performed with a LightCycler(Roche Diagnostics, Mannheim, Germany). As an internal control,housekeeping gene G6PDH mRNA expression was measuredat the same time. DEPC-treated H2O was used as a negativecontrol and MKN-74 was used as a positive control. Then, 1µLof cDNA mixture was subjected to amplification in 10 µL reactionmixture. The PCR conditions were initial denaturation at 95 for 10 min, followed by 40 cycles of denaturation at 95 for 10 s,annealing at 62 for 10 s for survivin, survivin-2B andsurvivin- Ex3 (or at 63 for G6PDH), extension at 72 for10 s, respectively. A standard curve using fluorescent data wasgenerated from serial tenfold dilution of specific plasmids from107 to 102 copies, respectively. The number of gene copies wascalculated by the LightCycler Software Version3.5.3 accordingto the Fit Points Above Threshold method. Primer pairs andhybridization probes for survivin, survivin-2B, survivin- Ex3and G6PDH mRNA were as follows. The sequence of the commonforward primer for survivin variants was 5’-CCACCGCATCTCTACATTCA-3’. To distinguish the 3 splice variants of survivin,the sequences of reverse primers for survivin variants weredesigned to correspond to exon/exon borders of the complementarystrand (5’-TATGTTCCTCTATGGGGTCG-3’ for survivin, 5’-AGTGCTGGTATTACAGGCGT-3’ for survivin-2B, 5’-TTTCCTTTGCATGGGGTC-3’ for survivin- Ex3). The sequences ofcommon hybridization probes for survivin variants were 5’-CAAGTCTGGCTCGTTCTCAGTGGG-3’-FITC and LC Red640-5’-CAGTGGATGAAGCCAGCCTCG-3’. The sequence of theforward primer for G6PDH was 5’-TGGACCTGACCTACGGCAACAGATA-3’. The sequence of the reverse primer for G6PDHwas 5’-GCCCTCATACTGGAAACCC-3’. The sequences ofhybridization probes for G6PDH were 5’- TTTTCACCCCACTGCTGCACC-3’-FITC and LC Red640 -5’-GATTGAGCTGGAGAAGCCCAAGC-3. PCR products were additionally checked by electrophoresison 30 g/L agarose gels (BIO-RAD, Inc., Hercules, USA) containingethidium bromide and visualized under UV transillumination.
Sequence analysisTo confirm the identity of the PCR products, their bands wereexcised from agarose gels and isolated by a QIAquick gel extractionkit (Qiagen, Tokyo, Japan), ligated into a pGEM-T-cloning vector(Promega), and cloned according to standard protocols. PlasmidDNA was recovered using a Plasmid Mini kit (Qiagen, Tokyo,Japan). Cycle was sequenced and analyzed in an ABI-PRISM310(Applied Biosystems) using T7 or SP6-site specific primers. Thesequences of the PCR products were compared with those inGenBank, which were found to be identical (Data not shown).
Ki-67 immunohistochemical staining and assessment ofproliferative indexImmunohistochemical staining was performed by the standardavidin-biotin-peroxidase complex technique using L.V. DakoLSAB kit (DAKO, Copenhagen, Denmark) as describedpreviously[5,7,8]. The antibodies used were monoclonal mouseantibody Ki-67 (MIB-1, diluted 1:50; Immunotech, Marseilles,France). The labeling index (LI) of Ki-67 was determined in thosetumor areas with positive stained nuclei. Five random areas withina section were chosen and counted under 200-fold magnificationusing a point counting technique. The average percentage ofpositivity was recorded as the Ki-67 LI for each case[7].
Histochemical detection of apoptosis and determination of AIApoptotic cells in tissue sections were detected by terminaldeoxynucleotidyl transferase-mediated dUTP-biotin nick endlabeling (TUNEL), using an Apop Tag in situ detection kit (Oncor,Gaithersburg, MD). The staining procedures were based on amethod described previously[5,6,8]. The apoptotic index (AI) wasexpressed as the ratio of positively stained tumor cells and bodiesto all tumor cells according to the criteria described elsewhere[5,7].Five areas were randomly selected for counting under 400-foldmagnification.
Statistical methodsAll statistical analyses were performed by the SPSS11.0 softwarepackage for Windows (SPSS Inc., Chicago, IL). Differences inthe numerical data between the two groups were evaluatedusing the Mann-Whitney U test. The χ2 test was further usedto compare the distribution of individual variables and anycorrelation between AI or Ki-67 index and expression of survivinvariants. The correlation between AI and expression of survivinvariants for each case was also analyzed by Spearman’s rankcorrelation test. Survival curves were calculated using the Kaplan-Meier method and analyzed by the log rank test. A two-tailed Pvalue less than 0.05 was considered statistically significant.
RESULTSExpression of survivin variants in clinical materials and cell linesAmong the 79 tumor samples, survivin expression was detectedin all tumor samples (79/79), survivin-2B expression wasdemonstrated in 78.5% (62/79) of the samples and survivin- Ex3expression was detected in 64.6% (51/79) of the samples(Figure 1). In contrast, survivin expression was detectable in46 (58.2%) of the normal mucosa samples, while survivin2Bexpression and survivin- Ex3 were detected in 23 (29.1%) and12 (15.2%) of the mucosa samples respectively.
Figure 1 Amplification, separation and visualization of survivin(185 bp), survivin-2B (214 bp) survivin- Ex3 (184 bp), andG6PDH (256 bp) mRNA (40 cycles) in a typical case.
The relative amounts of survivin variant mRNA weredetermined by dividing the amount of survivin variant mRNAby that of G6PDH mRNA for each sample. In tumor samples, therelative levels of survivin-2B and survivin- Ex3 was furthernormalized by matched survivin. Because three alternativelyspliced variants are derived from a common hnRNA precursorpool, these ratios seemed to be independent of any possiblebias imposed by variations in housekeeping gene expressionlevels[9,10]. Although there was a significant difference in G6PDHexpression between normal tissues and cancer samples at thesame amount of total RNA used (P<0.0001, Mann-Whitney Utest, Figure 2A), the survivin variant/G6PDH ratio in our cancertissues were significantly higher than that in non-neoplastictissues (P<0.0001, Mann-Whitney U test, Figure 2B).
3246 ISSN 1007-9327 CN 14-1219/ R World J Gastroenterol November 15, 2004 Volume 10 Number 22
DN
A m
ark
er
Surv
ivin
Surv
ivin
-2B
Surv
ivin
-Ex3
G6PD
H
bp
100
200

Figure 2 A: RT-PCR amplification of G6PDH in paired samplesof normal gastric mucosa and gastric carcinoma. B: Relative(G6PDH-normalised) mRNA levels of survivin variants in pairedsamples of normal gastric mucosa and gastric carcinoma. Two-tailed P values were calculated by the Mann-Whitney U test.
Relationship between expression levels of survivin variants andclinicopathological parametersThe expression level of survivin-2B was significantly (P = 0.001,Table 1, P<0.0001, χ2 test, Figure 3A) decreased in advanced(III+IV) stage compared with early (I+II) tumor stage. Furthermore,the level of survivin-2B was inversely correlated with the gradeof tumor differentiation (P = 0.004, Table 1, P = 0.023, χ2 test,Figure 3B) and depth of tumor invasion (P = 0.042, Table 1, P = 0.021,
χ2 test). A stage-dependent decrease of survivin-2B was alsoconfirmed by the ratio of survivin-2B/survivin (P = 0.018, Table 1,P = 0.022, χ2 test, Figure 3C). None of the investigated clinicopathological parametersshowed a statistically significant correlation with the expressionof other types of survivin variants besides survivin-2B.
Correlation between expression levels of survivin variants and AIApoptotic cells and bodies were detected in all cases of gastriccarcinoma tested (Table 1, Figure 4A). The mean AI was 1.07%(SD, 0.41%; range, 0.38-2.38%) with a median of 0.95%. Themean AI in survivin- Ex3-low expression samples was significantlyhigher than that in survivin- Ex3-high expression samples(P = 0.02, Table 1, P = 0.028, χ2 test, Table 1). There was nocorrelation between apoptotic index and clinicopathologicalparameters described. Spearman’s rank correlation test demonstrateda significant negative correlation between apoptotic index andexpression level of survivin- Ex3 ( = -0.257, P = 0.022).
Association of expression levels of survivin variants with PIProliferative cells were detected by intense nuclear immunoreactivityto the Ki-67 antigen, as illustrated in Figure 4B. The meanproliferative index (PI) in gastric tumors tested was 48.46%(SD, 9.54%; range, 28.49-82.98%) with a median of 46.87%. Nosignificant relationship was identified between PI of tumor cellsand clinicopathological parameters, as demonstrated in Table1.In addition, no significant association was found between PIand any type of survivin variants.
Prognostic value of survivin mRNA expressionPostoperative survival of the 79 gastric cancer patients wasanalyzed according to the expression level of survivin variants.Results are shown in Figure 5. Each survivin variant value wasdivided by the median value. The survival curve of patients withhigh-survivin expression was significantly lower than that ofthose with low-survivin expression (P = 0.003, log-rank test).No prognostic significance for either survivin-2B or survivin-
Ex3, however, was found in the current study.
Meng H et al. Survivin splicing variants in gastric cancer 3247
Table 1 Relationship among expression levels of survivin variants and clinicopathologic parameters, proliferative activity orapoptosis
Parameters No. of patients (%) Sur/G6PDH Sur-2B/G6PDH Sur- Ex3/G6PDH Sur-2B/sur Sur- Ex3/sur
Gender (median) Male 62 (78.5) P = 0.445 P = 0.598 P = 0.079 P = 0.125 P = 0.408 Female 17 (22.5)Age yr (median) <64 39 P = 0.462 P = 0.108 P = 0.177 P = 0.129 P = 0.262 >64 40Histological type Differentiated 47 P = 0.976 P = 0.004 P = 0.151 P = 0.053 P = 0.231 Undifferentiated 32Depth of invade Not invasion 27 P = 0.336 P = 0.042 P = 0.266 P = 0.354 P = 0.555 Invasion 40Clinical stage Stage I+II (22+11) P = 0.075 P = 0.001 P = 0.139 P = 0.018 P = 0.863 Stage III+IV (20+26)Ki67 (median) Low 39 P = 0.791 P = 0.197 P = 0.567 P = 0.401 P = 0.512 High 40Apop Tag (median) Low 39 P = 0.421 P = 0.070 P = 0.0020 P = 0.408 P = 0.099 High 40
Two-tailed P values were calculated by the Mann-Whitney U test. Differentiated type: Papillary type, Tubular type. Undifferen-tiated type: Poorly differentiated type, Signet ring cell type, Mucinous type. Not invasion: No invasion of the serosa. Invasion:invasion of the serosa.
mRN
A levels
G6PDH (N) G6PDH (T)
20 000
10 000
0
-10 000
P<0.0001
P<0.0001 P<0.0001 P<0.0001
P<0.0001 P<0.0001
Rela
tive m
RN
A levels
Survivin/ Survivin-2B/ Survivin-
G6PDH G6PDH Ex3/G6PDH
0.4
0.3
0.2
0.1
0.0
-0.1
A
B

DISCUSSIONIn this study, the prognostic significance of the expression ofthree survivin splicing variants in gastric carcinoma wasexamined for the first time. Interestingly, only increased wild-typesurvivin mRNA expression was prominently correlated withreduced survival time, whereas neither survivin-2B nor survivin-
Ex3 showed an association with prognosis. In accordancewith recent studies, we did not find a correlation between mRNAexpression levels of anti-apoptotic variants (survivin or survivin-
Ex3) and the investigated clinicopathological parameters[9,10].There is no doubt, however, survivin plays a role in enhancingthe malignant behavior of tumors. In cell culture systems, over-
expression of survivin was consistently associated with inhibitionof cell death[2]. Strong survivin mRNA expression showed chemo-radio resistance[11-13] and a correlation with recurrence inpatients[14]. In retrospective trials, increased survivin mRNA orprotein expression was reported to be a prognostic indicator oftumor progression in different types of human cancer[15-19]. Ourobservations further confirmed that survivin mRNA was a poorprognostic biomarker. This suggests that a relatively straightforwarddetection of survivin protein or mRNA in clinical patients mayprovide an initial marker of aggressive diseases, potentiallyrequiring in-depth follow-up protocols or alternative treatmentregimens in the future.
Figure 3 Relative mRNA levels of survivin variants. A: Significant decrease of relative (G6PDH-normalised) mRNA levels ofsurvivin-2B in advanced stages (P = 0.001, Mann-Whitney U test). B: Significant decrease of relative (G6PDH-normalised) mRNAlevels of survivin-2B in undifferentiated type (P = 0.004, Mann-Whitney U test). C: Significantly lower ratio of survivin-2B/survivinin advanced stages than that in early stages (P = 0.018, Mann-Whitney U test).
Figure 4 Histochemical staining for Ki-67 and apoptotic tumor cells. A: TUNEL in situ labeling for detecting apoptotic cells andbodies (arrows, magnification ×400) in adenocarcinoma. B: Ki-67 nuclear immunohistochemical staining revealing proliferatingtumor cells in adenocarcinoma (magnification ×400).
Figure 5 postoperative survivals of 79 gastric carcinoma patients. A: Shorter survival time of patients with high expression ofwild-type survivin mRNA compared to patients with low expression of wild-type survivin expression (P = 0.003, log-rank test).B: No significance in expression of survivin-2B mRNA (P = 0.166, log-rank test). C: No significance in expression of survivin-Ex3 mRNA (P = 0.441, log-rank test).
P = 0.075 P = 0.001 P=0.39Rela
tive m
RN
A level
Survivin/ Survivin-2B/ Survivin-
G6PDH G6PDH Ex3/G6PDH
0.4
0.3
0.2
0.1
0.0
-0.1
(early) (early) (early)
(advanced) (advanced) (advanced)
P = 0.004 P=0.151
Rela
tive m
RN
A level
Survivin/ Survivin-2B/ Survivin-
G6PDH G6PDH Ex3/G6PDH
0.4
0.3
0.2
0.1
0.0
-0.1
(differ) (differ) (differ)
(undiffer) (undiffer) (undiffer)
P = 0.01 P = 0.863
Rela
tive m
RN
A level
Survivin-2B/ Survivin-
svv Ex3/svv
3
2
1
0
-1
(early) (advanced) (early) (advanced)
A B C
A B
0 20 40 60 80 100
1.2
1.0
0.8
0.6
0.4
0.2
0.0
-0.2
After operation (mo)
Survivin-2B/G6PDH Survivin- Ex3/G6PDH
Cum
ula
tive s
urv
ival
0 20 40 60 80 100
1.2
1.0
0.8
0.6
0.4
0.2
0.0
-0.2
After operation (mo)
P = 0.166
Cum
ula
tive s
urv
ival
0 20 40 60 80 100
1.2
1.0
0.8
0.6
0.4
0.2
0.0
-0.2
After operation (mo)
P = 0.441
B C
3248 ISSN 1007-9327 CN 14-1219/ R World J Gastroenterol November 15, 2004 Volume 10 Number 22
Cum
ula
tive s
urv
ival
Survivin/G6PDH
P = 0.003
A

The notion that survivin inhibits apoptosis has beenestablished, but the mechanism (s) by which this occurs hasnot been conclusively determined. The actual molecular interactionpartners of survivin variants, however, have remained elusive[2].Although there is a good agreement that deregulation of celldeath/survival pathways contributes to malignant transformation,the potential predictive/prognostic impact of apoptosis regulatorymolecules and AI has remained controversial[8]. This studyfailed to show the relationship between apoptotic index andsurvivin expression in gastric carcinoma although it was shownin previous[5,20] studies showed in gastric cancer that survivinexpression was inversely correlated with apoptosis. Thesecontroversial findings were attributed in part to the dual functionby which survivin regulates cell death and cell division. In recentstudies, frameshift carboxyl terminus of survivin- Ex3 wasfound to contain a bipartite localization signal, which mediatesits strong nuclear accumulation and might interfere withdegradation of survivin- Ex3 protein by ubiquitin tagging.Survivin- Ex3, therefore, could evade cell cycle-specificdegradation by the ubiquitin-proteasome pathway, known forsurvivin. In contrast, cytoplasm has been found to be the mostprobable location of both survivin and survivin-2B[21,22]. Otherunique features in survivin- Ex3 were also identified, includinga mitochondrial localization signal and a BH2 domain, whichmight inhibit apoptosis by association with bcl-2, and suppressCaspase-3 activity by BIR-dependent pathway[23]. Consequently,survivin- Ex3 may play a more crucial role in the regulation ofapoptosis. Although mRNA levels of survivin-2B and survivin- Ex3have been found in different tumors[3,10,24,25], little is knownabout the protein levels of endogenous survivin-2B andsurvivin- Ex3, due to the lack of survivin variant-specificantibodies. Our results showed that a low mRNA expressionlevel of survivin-2B was inversely correlated to the advanced(III+IV) stage, undifferentiated tumor histology and deep tumorinvasion. There are at least two reasonable explanations forthis finding. After losing its antiapoptotic potential, survivin-2B was hypothesized to be a naturally occurring antagonist ofsurvivin from competitive binding to heterologous interactionpartners, or from the formation of inactive survivin: survivin-2B heterodimers with respect to recently observed dimerformation of survivin[21]. Downregulation of survivin-2B mightweaken its functional antagonism, and moreover, could permitthe generation of more survivin or survivin- Ex3 because threesurvivin variants come from the same pool of a hnRNA precursor.Thus, the decrease in survivin-2B may result in the development,invasion and anaplasia of carcinomas. In addition, our data showed that all gastric carcinomasamples expressed wild-type survivin at a significant levelcompared to the matched normal gastric mucosa samples.Similarly, the expression of survivin-2B or survivin- Ex3 wassignificantly elevated in carcinoma tissue. Among three survivinvariants, survivin was the dominant transcript. In this regard,our results were consistent with those of two recent TR-PCRstudies[10,26] on gastric cancer in which a few gastric mucosasamples (17-23%) of the first-degree relatives also expressedsurvivin mRNA, but the normal control subjects did not. Allthese findings may help explain why survivin variants playedimportant roles in the early stage of carcinogenesis of gastriccancer. In summary, survivin mRNA is a poor prognostic biomarkerand that non-antiapoptotic survivin-2B was correlated totumor stage, histological type and depth of tumor invasion.Even more striking is the observation for the first time thatneither survivin nor survivin-2B show a close associationwith the apoptosis index, as observed in survivin- Ex3,although further experimental work is necessary to elucidate
the functional properties of different splicing variants inmore detail.
ACKNOWLEDGEMENTSWe thank Ms. Akiko Miyamoto and Drs. Takaharu Suga andYoshiaki Tatsumi, Department of General and GastroenterologicalSurgery, or Dr. Noda Naohiro, First Department of Pathology,Osaka Medical College for their excellent assistance throughoutthis investigation.
REFERENCES1 Rudin CM, Thompson CB. Apoptosis and disease: regulation
and clinical relevance of programmed cell death. Annu RevMed 1997; 48: 267-281
2 Altieri DC. Validating survivin as a cancer therapeutic target.Nat Rev Cancer 2003; 3: 46-54
3 Mahotka C, Wenzel M, Springer E, Gabbert HE, Gerharz CD.Survivin-deltaEx3 and survivin-2B: two novel splice variantsof the apoptosis inhibitor survivin with different antiapoptoticproperties. Cancer Res 1999; 59: 6097-6102
4 Liu HF, Liu WW, Fang DC, Men RP. Expression and signifi-cance of proapoptotic gene Bax in gastric carcinoma. World JGastroenterol 1999; 5: 15-17
5 Lu CD, Altieri DC, Tanigawa N. Expression of a novelantiapoptosis gene, survivin, correlated with tumor cellapoptosis and p53 accumulation in gastric carcinomas. CancerRes 1998; 58: 1808-1812
6 Nishi M, Omori Y, Miwa K. Japanese Classification of GastricCarcinoma, First English edition. TOKYO: KANEHARA & CO.,LTD 1995
7 Kawasaki H, Toyoda M, Shinohara H, Okuda J, Watanabe I,Yamamoto T, Tanaka K, Tenjo T, Tanigawa N. Expression ofsurvivin correlates with apoptosis, proliferation, and angio-genesis during human colorectal tumorigenesis. Cancer 2001;91: 2026-2032
8 Kawasaki H, Altieri DC, Lu CD, Toyoda M, Tenjo T, TanigawaN. Inhibition of apoptosis by survivin predicts shorter survivalrates in colorectal cancer. Cancer Res 1998; 58: 5071-5074
9 Mahotka C, Krieg T, Krieg A, Wenzel M, Suschek CV,Heydthausen M, Gabbert HE, Gerharz CD. Distinct in vivoexpression patterns of survivin splice variants in renal cellcarcinomas. Int J Cancer 2002; 100: 30-36
10 Krieg A, Mahotka C, Krieg T, Grabsch H, Muller W, Takeno S,Suschek CV, Heydthausen M, Gabbert HE, Gerharz CD. Ex-pression of different survivin variants in gastric carcinomas:first clues to a role of survivin-2B in tumour progression. Br JCancer 2002; 86: 737-743
11 Asanuma K, Moriai R, Yajima T, Yagihashi A, Yamada M,Kobayashi D, Watanabe N. Survivin as a radioresistance fac-tor in pancreatic cancer. Jpn J Cancer Res 2000; 91: 1204-1209
12 Ikeguchi M, Kaibara N. Changes in survivin messenger RNAlevel during cisplatin treatment in gastric cancer. Int J Mol Med2001; 8: 661-666
13 Kato J, Kuwabara Y, Mitani M, Shinoda N, Sato A, ToyamaT, Mitsui A, Nishiwaki T, Moriyama S, Kudo J, Fujii Y. Ex-pression of survivin in esophageal cancer: correlation with theprognosis and response to chemotherapy. Int J Cancer 2001;95 : 92-95
14 Azuhata T, Scott D, Takamizawa S, Wen J, Davidoff A,Fukuzawa M, Sandler A. The inhibitor of apoptosis proteinsurvivin is associated with high-risk behavior of neuroblastoma.J Pediatr Surg 2001; 36: 1785-1791
15 Ikeguchi M, Kaibara N. Survivin messenger RNA expressionis a good prognostic biomarker for oesophageal carcinoma. BrJ Cancer 2002; 87: 883-887
16 Adida C, Berrebi D, Peuchmaur M, Reyes-Mugica M, AltieriDC. Anti-apoptosis gene, survivin, and prognosis of neuroblastoma.Lancet 1998; 351: 882-883
17 Adida C, Haioun C, Gaulard P, Lepage E, Morel P, Briere J,Dombret H, Reyes F, Diebold J, Gisselbrecht C, Salles G,Altieri DC, Molina TJ. Prognostic significance of survivin
Meng H et al. Survivin splicing variants in gastric cancer 3249

expression in diffuse large B-cell lymphomas. Blood 2000;96 : 1921-1925
18 Chakravarti A, Noll E, Black PM, Finkelstein DF, FinkelsteinDM, Dyson NJ, Loeffler JS. Quantitatively determined survivinexpression levels are of prognostic value in human gliomas. JClin Oncol 2002; 20: 1063-1068
19 Kamihira S, Yamada Y, Hirakata Y, Tomonaga M, SugaharaK, Hayashi T, Dateki N, Harasawa H, Nakayama K. Aberrantexpression of caspase cascade regulatory genes in adult T-cellleukaemia: survivin is an important determinant for prognosis.Br J Haematol 2001; 114: 63-69
20 Wakana Y, Kasuya K, Katayanagi S, Tsuchida A, Aoki T,Koyanagi Y, Ishii H, Ebihara Y. Effect of survivin on cell prolif-eration and apoptosis in gastric cancer. Oncol Rep 2002; 9:1213-1218
21 Mahotka C, Liebmann J, Wenzel M, Suschek CV, Schmitt M,Gabbert HE, Gerharz CD. Differential subcellular localizationof functionally divergent survivin splice variants. Cell DeathDiffer 2002; 9: 1334-1342
22 Rodriguez JA, Span SW, Ferreira CG, Kruyt FA, Giaccone G.CRM1-mediated nuclear export determines the cytoplasmic
localization of the antiapoptotic protein Survivin. Exp Cell Res2002; 275: 44-53
23 Wang HW, Sharp TV, Koumi A, Koentges G, Boshoff C.Characterization of an anti-apoptotic glycoprotein encodedby Kaposi’s sarcoma-associated herpesvirus which resemblesa spliced variant of human survivin. EMBO J 2002; 21: 2602-2615
24 Hirohashi Y, Torigoe T, Maeda A, Nabeta Y, Kamiguchi K,Sato T, Yoda J, Ikeda H, Hirata K, Yamanaka N, Sato N. AnHLA-A24-restricted cytotoxic T lymphocyte epitope of atumor-associated protein, survivin. Clin Cancer Res 2002; 8:1731-1739
25 Kappler M,,Kohler T, Kampf C, Diestelkotter P, Wurl P,Schmitz M, Bartel F, Lautenschlager C, Rieber EP, Schmidt H,Bache M, Taubert H, Meye A. Increased survivin transcriptlevels: an independent negative predictor of survival in softtissue sarcoma patients. Int J Cancer 2001; 95: 360-363
26 Yu J, Leung WK, Ebert MP, Ng EK, Go MY, Wang HB, ChungSC, Malfertheiner P, Sung JJ. Increased expression of survivinin gastric cancer patients and in first degree relatives. Br JCancer 2002; 87: 91-97
Edited by Wang XL Proofread by Xu FM
3250 ISSN 1007-9327 CN 14-1219/ R World J Gastroenterol November 15, 2004 Volume 10 Number 22

PO Box 2345, Beijing 100023, China World J Gastroenterol 2004;10(22):3251-3254Fax: +86-10-85381893 World Journal of GastroenterologyE-mail: [email protected] www.wjgnet.com Copyright © 2004 by The WJG Press ISSN 1007-9327
• LIVER CANCER •
Detection of bcl-2 and bax expression and bcl-2/JH fusion gene in
intrahepatic cholangiocarcinoma
Lin-Lang Guo, Sha Xiao, Ying Guo
Lin-Lang Guo, Sha Xiao, Ying Guo, Department of Pathology,Zhujiang Hospital, Guangzhou 510282, Guangdong Province, ChinaCorrespondence to: Dr. Lin-Lang Guo, Department of Pathology,Zhujiang Hospital, Guangzhou 510282, Guangdong Province,China. [email protected]: +86-20-61643495 Fax: +86-20-84311872Received: 2003-05-10 Accepted: 2003-06-04
Abstract
AIM: To investigate the relationship between bcl-2 geneand its related protein bax and intrahepatic cholangiocellularcarcinoma (CCC).
METHODS: Semi-nested in situ PCR (SNISPCR) and imm-unohistochemistry were performed to detect bcl-2/JH fusiongene and bcl-2, bax protein expression in 29 cases of CCC.
RESULTS: No bcl-2/JH fusion gene was found in all casesof CCC, 72.4% of 29 cases expressed bcl-2 protein. Bcl-2protein expression was related to histopathological grades(P<0.05). There was no corresponding relationship betweenbcl-2/JH fusion gene formation and bcl-2 protein expressionin CCC (P <0.05). Bax was expressed in 10.3% of 29 cases.The ratio of bcl-2 to bax in normal liver tissues (3.5 to 1) wasdifferent from that in tumor tissues (7.0 to 1).
CONCLUSION: It is suggested that bcl-2/JH fusion geneformation is not a frequent event and may not play an importantrole in the pathogenesis of CCC. However, aberrant ratio ofbcl-2 to bax protein expression may be involved in the courseof tumorigenesis of CCC. Abnormal bcl-2 protein expressionmay not be solely resulted from bcl-2/JH fusion gene.
Guo LL, Xiao S, Guo Y. Detection of bcl-2 and bax expressionand bcl-2/JH fusion gene in intrahepatic cholangiocarcinoma.World J Gastroenterol 2004; 10(22): 3251-3254
http://www.wjgnet.com/1007-9327/10/3251.asp
INTRODUCTIONBcl-2 gene was first identified in B-cell leukemia and follicularlymphoma which confered a survival advantage on B-cells byinhibiting apoptosis. Bcl-2 gene at chromosome 18 is juxtaposedwith the immunoglobulin heavy chain gene (JH) on chromosome14[1]. The t (14; 18) chromosome translocation was present in70% to 85% of follicular lymphoma and in 20% to 30% of diffuselarge-cell lymphomas[1-4]. While aberrant expression of bcl-2protein was also found in follicular lymphoma. In the earlystudy, bcl-2 gene was mainly investigated in lymphoid tissues.Recently, bcl-2 gene aberrant expression has been observed ina variety of tumors, such as adenocarcinoma of the prostate,bladder carcinoma, squamous cell carcinoma of the lung,nasopharyngeal carcinoma, breast carcinoma and cholangioc-arcinoma[5-17]. However, bcl-2/JH fusion gene and its relationshipwith bcl-2 protein expression have not been detected in
cholangiocellular carcinoma (CCC). Bax, an important homologue of bcl-2, is a promoter ofapoptosis. It has been proposed that the sensitivity of cells toapoptosis stimuli be closely related to the ratio of bcl-2/bax andother bcl-2 homology. When bcl-2 is in excess, cells are protected.However, when bax is in excess and bax homodimers dominate,cells are susceptible to apoptosis[18]. Whether bcl-2/bax expressionratio is involved in the course of tumorigenesis of CCC remainsunknown. In this study, we demonstrated that bcl-2/JH fusion gene,bcl-2 and its related protein bax expression with semi-nestedin situ PCR (SNISPCR) and immunohistochemistry in 29 casesof CCC to understand the relationship between bcl-2 gene andits related protein bax in CCC.
MATERIALS AND METHODSTissue preparationA total of 29 samples were obtained by surgical resection inour department from 1995-06-01 to 1998-02-28. All samples wereindependently reviewed by two pathologists and graded asrecommended by WHO. The cases of CCC were classified asfollows: 6 cases of well differentiated, 14 cases of moderatelydifferentiated and 9 cases of poorly differentiated carcinomas.Undamaged liver tissues from surgical resection specimens ofyoung adults with minor liver injury who underwent partialhepatectomy were used as normal controls. All tissues werefixed in 40 g/L formaldehyde (pH 7.0) for 12-24 h and embeddedin paraffin and then 4 µm thick serial sections were cut andmounted on poly-l-lysine coated slides.
Immunohistochemical stainingThe sections were deparaffinized and rehydrated routinely.Antigens were retrieved by heating the sections in a microwaveoven at 700 W in 10 mmol/L citrate buffer (pH 6.0) for 10 min.After blocked with 3 mL/L H2O2 and swine serum, specimenswere then incubated with the primary antibodies, directedagainst bcl-2 (Maxim Biotech Co., China) and bax (Senta Cruz).The staining was performed by streptavidin peroxidase enzymeconjugate method using a S-P kit (Zymed). Reaction productswere visualized by DAB. Brown-yellow granules in cytoplasmwere recognized as positive staining.
Semi-nested in situ PCRPretreatment: Sections were deparaffinized and dehydratedroutinely, then washed in 0.1 mol/L HCI and PBS, digested withproteinase K (10 mg/L), and placed on the platform in a DNAthermal cycler at 98 for 2 min. Amplification in situ: The final volume of 20 µL (200 µmol/Leach of dATP, dCTP, dGTP and dTTP, 1.5 U Taq polymerase,10×buffer). Two and half sets of primers specific for the two hotbreakpoint regions on bcl-2 gene were synthesized accordingto the DNA sequences published by Gribben[19]. The followingoligonucleotides were used as primer pairs: A, 5’-CAGCCTTGAAACATTGATGG-3’ for the mbr (in major breakpoint region);B, 5’-CGTGCTGGTACCACTCCTG-3’ for the mcr (in minorbreakpoint region); C, 5’-TATGGTGGTTTGACCTTTAG-3’ forthe mbr (in major breakpoint region); D, 5’-GGACCTTCCTTGG

TGTGTTG-3’ for mcr (in minor breakpoint region); Immunoglobulinheavy chain (JH), 5’-ACCTGAGGAGACGGTGACC-3’. At first,mbr-JH fusion gene was amplified by primer A and JH, and mcr-JH fusion gene was amplified by primer B and JH. The slideswere covered after adding reaction mixture. The samples weresubjected to 25 amplification cycles, each cycle consisiting ofdenaturation at 94 for 1 min, annealing at 55 for 1 min andextension at 72 for 1 min. The final extension period wasextended to 10 min. Reamplification was performed for 30 cyclesusing primer C, JH for mbr-JH fusion gene and D, JH for mcr-JHfusion gene. The conditions were the same as stated above.
In situ hybridizationThe covers were removed and dehydrated routinely. The slideswere incubated in 40 g/L poly formeldehyde for 10 min. Forty µLhybridization solution (probe concentration 50 pmol/L) wasadded on slides overnight at 37 in a wet box. The oligonucleotideprobe was labeled with biotin. Sequences of the probes were5’-CCCTCCTGCCCTCCTTCCG-3’ for mbr and 5’-GGACCTTCCTTGGTGTGTTG-3’ for mcr. Non-specific antigen was blocked with 20 mL/L bovine serumand 3 g/L Triton X-100, followed by incubation with anti-biotinantibody alkaline phosphates mixture for 1 h. Slides were thenvisualized with BCIP/NBT. Purple-blue granules in nuclei wereregarded as positive.
ControlsFollicular lymphoma was used as positive control. Negativecontrols included blank control with no primers, dNTP or Taqpolymerase omission in PCR reaction solution, and probeomission in hybridization solution. To exclude false positive ornegative results, each sample was analyzed at least twice. Non-corresponding tissues such as normal skin tissue were alsotreated to exclude the false positive possibility.
Statistical analysisStatistical significance was calculated by χ2 test, which wasused to analyze the relation between bcl-2 and bax proteinstaining and positive bcl-2/JH fusion gene and histopathologicalgrades. P<0.05 was considered as statistically significant.
RESULTSExpression of bcl-2 protein in CCCTwenty-one of 29 cases expressed bcl-2 protein, induding 5 welldifferentiated, 13 moderately differentiated and 3 poorlydifferentiated carcinomas. There was a statistically significantdifference between moderately differentiated and poorlydifferentiated carcinomas in Bcl-2 expression (P<0.05, χ2 = 5.58).Bcl-2 was also expressed in 87.5% (14/16) in normal liver tissuesof small bile ducts (Figures 1, 3).
Detection of bcl-2/JH fusion gene in CCCBcl-2/JH fusion gene was not detected in any case of CCC andnormal liver tissues.
Relationship between bcl-2 protein expression and bcl-2/JHfusion geneNo bcl-2/JH fusion gene was detected in bcl-2 protein positiveand negative groups. There was no correlation between bcl-2protein expression and bcl-2/JH fusion gene.
Expression of bax protein in CCCBax was expressed in 3 (10.3%) of 29 cases , in which 1/6 waswell differentiated carcinoma, 2/14 were moderately differentiatedcarcinomas and none was poorly differentiated carcinoma. Therewas no statistically significant difference between bax expression
and histological grades. Four (25%) of 16 normal liver tissuesamples expressed bax protein (Figures 2, 4).
Figure 1 Primary hepatic cholangiocarcinoma. Brown-yel-low staining in cytoplasm of carcinoma cells for bcl-2 protein(arrowhead) Immunohistochemistry staining ×200.
Figure 2 Primary hepatic cholangiocarcinoma. Brown-yellowstaining in cytoplasm of carcinoma cells for bax protein (arrowhead)Immunohistochemistry staining ×200.
Figure 3 Normal liver. Brown-yellow staining in cytoplasmof small bile duct epithelial cells for bcl-2 protein (arrowhead)Immunohistochemistry staining ×200.
Figure 4 Normal liver. Brown-yellow staining in cytoplasmof small bile duct epithelial cells for bax protein (arrowhead)Immunohistochemistry staining ×200.
Ratio of bcl-2 to bax in normal liver and CCCIn normal liver tissues, the expression rates of bcl-2 and bax
3252 ISSN 1007-9327 CN 14-1219/ R World J Gastroenterol November 15, 2004 Volume 10 Number 22

were 87.5% and 25%, while positive rates of bcl-2 and bax were72.4% and 10.3% in CCC respectively. The ratio of bcl-2 to baxwas 3.5 to 1 in normal liver tissues and 7.0 to 1 in CCC (Figure 5).
Figure 5 Non-Hodgkin‘s lymphoma. Purple-blue depositionin nuclear of lympoma cells (positive for mbr, arrowhead). Insitu PCR ×400.
DISCUSSIONVarying results of bcl-2 protein expression in CCC were reported.Bcl-2 protein expression in normal and pathological human liverhas been reported by Charlotte et al.[11]. In the report, Charlotteet al. described that bcl-2 protein was expressed by small bileduct epithelia in normal liver, but not by hepatocytes or largebile duct epithelia. Eight of 11 CCCs were stained positively forbcl-2, whereas all 15 hepatocellular carcinomas were bcl-2negative. So the authors suggested that bcl-2 protein appearedto be a diagnostic marker in distinguishing CCC from hepatocellularcarcinoma[11]. Skopelitou et al. found all ten samples of CCCwere positive for bcl-2 protein staining[12]. Ito et al. reported 31.7%(13/41) of CCCs were positive for bcl-2 protein[13]. However,Terada et al. showed low or negative expression of bcl-2 proteinin bile duct epithelia and CCC[14-17]. In our report, 21 of 29 CCCsexpressed bcl-2 protein (72.4%), which was similar to thatreported by Charlotte et al. Significant differences of bcl-2expression in CCC have not been known yet, probably becauseof the different methods used, and the difference of intrahepaticcholangiocarcinoma specimens from the liver[13,16]. To clarify the role of bcl-2/JH in the pathogenesis of CCC,mbr-JH and mcr-JH which have been shown to be the importantmolecular event in the genesis of follicular lymphoma, werealso studied in 29 cases of CCC. This is the first study to examinebcl-2/JH fusion gene in CCC by in situ PCR. Mbr-JH or mcr-JHwas negative in all cases of CCC. It is suggested that bcl-2/JHfusion gene formation was not a common event and might notplay an important role in the pathogenesis of CCC. In the present study, bcl-2 protein expression did not correlatewith bcl-2/JH in CCC. Similar results were also found in mucosa-associated lymphoma, large cell lymphoma, Hodgkin’s diseaseand nasopharyngeal carcinoma[20-25]. These findings suggestedthat abnormal bcl-2 protein expression might not be solelyresulted from bcl-2/JH fusion sequences. Whether other typesof bcl-2 gene aberrance such as mutation or methylationcorresponding to bcl-2 protein expression are existed in CCCrequires further investigation. Compared to a high expression rate of bcl-2 in CCC (72.4%),only 10.3% (3/29) samples expressed bax. To understand thesignificance of the ratio of bcl-2 to bax in the regulation ofapoptosis, Oltvai et al.[18] found that over-expressed bcl-2 intwo cell lines with high levels of bax and in cells with the lowestbcl-2 to bax ratio (0.55) was 73% viable at 24 h, but lost viability byd 7. When cells with high bcl-2 to bax ratios (2.04 and 1.65), theypossessed viable cells over 2 wk following IL-3 deprivation.These data suggested a model in which the ratio of bcl-2 to baxcould determine survival or death following an apoptotic stimulus.Similar results were also found by Lilling et al. and others[26-29].
The alteration of Bcl-2 and Bax might be an important mechanismin the pathogenesis and progression of some tumors[30-32]. Yueet al.[30] showed that Bcl-2/Bax in acute myelogenous leukemiawas significantly higher than that in normal control (P<0.001).Madewell et al.[31] found that the bax:bcl-2 ratio was lower inskin tumors than that in normal skin. But a lowered bcl-2/baxratio and increased apoptosis were observed in oral squamouscell carcinomas, compared with normal oral epithelium[32]. Inthis study, the ratio of bcl-2 to bax (7.0 to 1) in CCC was differentfrom that in normal small bile ducts (3.5 to 1). We suppose thatthe changes of the ratio between bcl-2 and bax protein mayinfluence the susceptibility of bile duct cells to apoptosis andwould be involved in the tumorigenesis of CCC. Further evidencewould be obtained from further investigations.
REFERENCES1 Tsujimoto Y, Finger LR, Yunis J, Nowell PC, Croce CM. Clon-
ing of the chromosome breakpoint of neoplastic B cells with the t(14; 18) chromosome translocation. Science 1984; 226: 1097-1099
2 Weiss LM, Warnke RA, Sklar J, Cleary ML. Molecular analysisof the t (14; 18) chromosomal translocation in malignantlymphomas. N Engl J Med 1987; 317: 1185-1189
3 Bskhshi A, Jensen JP, Goldman P, Wright JJ, McBride OW,Epstein AL, Korsmeyer SJ. Cloning the chromosomal breakpointof t (14; 18) human lymphomas: clustering around JH on chro-mosome 14 and near a transcriptional unit on 18. Cell 1985; 41:899-906
4 Aisenberg AC, Wilkes BM, Jacobson JO. The bcl-2 gene isrearranged in many diffuse B-cell lymphomas. Blood 1988; 71:969-972
5 Mcdonnell TJ, Troncoso P, Brisbay SM, Logothetis C, ChungLW, Hsieh JT, Tu SM, Campbell ML. Expression of theprotooncogene bcl-2 in the prostate and its association withemergence of androgen-independent prostate cancer. CancerRes 1992; 52: 6940-6944
6 Nakopoulou L, Vourlakou C, Zervas A, Tzonou A, GakiopoulouH, Dimopoulos MA. The prevalence of bcl-2, p53, and Ki-67immunoreactivity in transitional cell bladder carcinomas andtheir clinicopathologic correlates. Hum Pathol 1998; 29: 146-154
7 Lu QL, Elia G, Lucas S, Thomas JA. Bcl-2 proto-oncogeneexpression in Epstein-Barr-virus-associated nasopharyngealcarcinoma. Int J Cancer 1993; 53: 29-35
8 Pezzella F, Turley H, Kuzu I, Tungekar MF, Dunnill MS, PierceCB, Harris A, Gatter KC, Mason DY. Bcl-2 protein in non-small-cell lung carcinoma. N Engl J Med 1993; 329: 690–694
9 Papadimitriou CS, Costopoulos JS, Christoforidou BP,Kotsianti AJ, Karkavelas GS, Hytiroglou PM, KoufogiannisDJ, Nenopoulou HE. Expression of Bcl-2 protein in humanprimary breast carcinomas and its correlation with multifocality,histopathological types and prognosis. Eur J Cancer 1997; 33:1275-1280
10 Tjalma W, De Cuyper E, Weyler J, Van Marck E, De Pooter C,Albertyn G, van Dam P. Expression of bcl-2 in invasive and insitu carcinoma of the uterine cervix. Am J Obstet Gynecol 1998;178(1 Pt 1): 113-117
11 Charlotte F, L‘Hermine A, Martin N, Geleyn Y, Nollet M,Gaulard P, Zafrani ES. Immunohistochemical detection of bcl-2 and protein in normal and pathological human liver. Am JPathol 1994; 144: 460-465
12 Skopelitou A, Hadjiyannakis M, Alexopoulou V, Krikoni O,Kamina S, Agnantis N. Topographical immunohistochemicalexpression of bcl-2 protein in human liver lesions. AnticancerRes 1996; 16: 975-978
13 Ito Y, Takeda T, Sasaki Y, Sakon M, Monden M, Yamada T,Ishiguro S, Imaoka S, Tsujimoto M, Matsuura N. Bcl-2 expres-sion in cholangiocellular carcinoma is inversely correlated withbiologically aggressive phenotypes. Oncology 2000; 59: 63-67
14 Terada T, Nakanuma Y. Utility of pancreatic digestive enzymeimmunohistochemistry in the differential diagnosis of hepato-cellular carcinoma, cholangiocarcinoma and metastatic adeno-carcinoma of the liver. Pathol Int 1996; 46: 183-188
15 Okaro AC, Deery AR, Hutchins RR, Davidson BR. The expres-
Guo LL et al. Bcl-2 , bax and bcl-2/JH in cholangiocarcinoma 3253

sion of antiapoptotic proteins Bcl-2, Bcl-X(L), and Mcl-1 inbenign, dysplastic, and malignant biliary epithelium. J ClinPathol 2001;54: 927-932
16 Arora DS, Ramsdale J, Lodge JP, Wyatt JI. p53 but not bcl-2is expressed by most cholangiocarcinomas: a study of 28 cases.Histopathology 1999; 34: 497-501
17 Fiorentino M, D’Errico A, Altimari A, Barozzi C, Grigioni WF.High levels of BCL-2 messenger RNA detected by in situ hy-bridization in human hepatocellular and cholangiocellularcarcinomas. Diagn Mol Pathol 1999; 8: 189-194
18 Oltvai ZN, Milliman CL, Korsmeyer SJ. Bcl-2 heterodimerizes invivo with a conserved homolog, Bax, that accelerates pro-grammed cell death. Cell 1993; 74: 609-619
19 Gribben JG, Freedman A, Woo SD, Blake K, Shu RS, FreemanG, Longtine JA, Pinkus GS, Nadler LM. All advanced stagenon-Hodgkin‘s lymphomas with a polymerase chain reactionamplifiable breakpoint of bcl-2 have residual cells containingthe bcl-2 rearrangement at evaluation and after treatment. Blood1991; 78: 3275-3280
20 Tang SC, Visser L, Hepperle B, Hanson J, Poppema S. Clinicalsignificance of bcl-2-MBR gene rearrangement and protein ex-pression in diffuse large-cell non-Hodgkin‘s lymphoma: ananalysis of 83 cases. J Clin Oncol 1994; 12: 149-154
21 Isaacson PG, Wotherspoon AC, Diss TC, Pan LX. Bcl-2 ex-pression in lymphomas. Lancet 1991; 337: 175-176
22 Huebner-Chan D, Fernandes B, Yang G, Lim MS. Animmunophenotypic and molecular study of primary large B-cell lymphoma of bone. Mod Pathol 2001; 14: 1000-1007
23 Kneba M, Eick S, Herbst H, Pott C, Bolz I, Dallenbach F,Hiddemann W, Stein H. Low incidence of mbr bcl-2/JH fusiongenes in Hodgkin’s disease. J Pathol 1995; 175: 381-389
24 Nolte M, Werner M, Spann W, Schnabel B, von Wasielewski R,Wilkens L, Hubner K, Fischer R, Georgii A. The bcl-2/JH generearrangement is undetectable in Hodgkin’s lymphomas: re-
sults from the German Hodgkin trial. Virchows Arch 1995; 426:37-41
25 Harn HJ, HO LI, Liu CA, Liu GC, Lin FG, Lin JJ, Chang JY, LeeWH. Down regulation of bcl-2 by p53 in nasopharyngeal carci-noma and lack of detection of its specific t(14; 18) chromo-somal translocation in fixed tissues. Histopathology 1996; 28:317-323
26 Lilling G, Hacohen H, Nordenberg J, Livnat T, Rotter V, Sidi Y.Differential sensitivity of MCF-7 and LCC2 cells, to multiplegrowth inhibitory agents: possible relation to high bcl-2/baxratio? Cancer Lett 2000; 161: 27-34
27 Chresta CM, Masters JR, Hickman JA. Hypersensitivity ofhuman testicular tumors to etoposide-induced apoptosis isassociated with functional p53 and a high Bax: Bcl-2 ratio.Cancer Res 1996; 56: 1834-1841
28 Perlman H, Zhang X, Chen MW, Walsh K, Buttyan R. Anelevated bax/bcl-2 ratio corresponds with the onset of pros-tate epithelial cell apoptosis. Cell Death Differ 1999; 6: 48-54
29 Raisova M, Hossini AM, Eberle J, Riebeling C, Wieder T, SturmI, Daniel PT, Orfanos CE, Geilen CC. The Bax/Bcl-2 ratio de-termines the susceptibility of human melanoma cells to CD95/fas-mediated apoptosis. J Invest Dermatol 2001; 117: 333-340
30 Yue B, Chen Y, Yu D, Xiang Z. Study on the relationship be-tween the Bcl-2/Bax ratio and the growth types of leukemiccells and drug resistance in acute myelogenous leukemia. JTongji Med Univ 1998; 18: 101-104
31 Madewell BR, Gandour-Edwards R, Edwards BF, MatthewsKR, Griffey SM. Bax/bcl-2: cellular modulator of apoptosis infeline skin and basal cell tumours. J Comp Pathol 2001; 124:115-121
32 Loro LL, Vintermyr OK, Liavaag PG, Jonsson R, JohannessenAC. Oral squamous cell carcinoma is associated with decreasedbcl-2/bax expression ratio and increased apoptosis. Hum Pathol1999; 30: 1097-1105
Edited by Zhang JZ and Wang XL Proofread by Xu FM
3254 ISSN 1007-9327 CN 14-1219/ R World J Gastroenterol November 15, 2004 Volume 10 Number 22

PO Box 2345, Beijing 100023, China World J Gastroenterol 2004;10(22):3255-3260Fax: +86-10-85381893 World Journal of GastroenterologyE-mail: [email protected] www.wjgnet.com Copyright © 2004 by The WJG Press ISSN 1007-9327
• COLORECTAL CANCER •
Nuclear factor-κB p65 (RelA) transcription factor is constitutively
activated in human colorectal carcinoma tissue
Liang-Liang Yu, Hong-Gang Yu, Jie-Ping Yu, He-Sheng Luo, Xi-Ming Xu, Jun-Hua Li
Liang-Liang Yu, Jie-Ping Yu, He-Sheng Luo, Xi-Ming Xu, Jun-Hua Li, Department of Gastroenterology, Renmin Hospital, WuhanUniversity, Wuhan 430060, Hubei Province, ChinaHong-Gang Yu, Laboratory for Experimental Gastroenterology,Department of Medicine I, St. Joseph Hospital, Ruhr-UniversityBochum, Bochum, GermanySupported by Grants Grom National Natural Science Foundation ofChina No.39470330, and Natural Science Foundation of HubeiProvince, China (SJ-97J083)Correspondence to: Dr. Liang-Liang Yu, Department of Gastroenterology,Renmin Hospital, Wuhan University, Wuhan 430060, Hubei Province,China. [email protected]: +86-27-88077184Received: 2003-11-12 Accepted: 2003-12-16
Abstract
AIM: Activation of transcription factor nuclear factor-κB(NF-κB) has been shown to play a role in cell proliferation,apoptosis, cytokine production, and oncogenesis. The purposeof this study was to determine whether NF-κB was constitutivelyactivated in human colorectal tumor tissues and, if so, todetermine the role of NF-κB in colorectal tumorigenesis, andfurthermore, to determine the association of RelA expressionwith tumor cell apoptosis and the expression of Bcl-2 andBcl-xL.
METHODS: Paraffin sections of normal epithelial, adenomatousand adenocarcinoma tissues were analysed immunohisto-chemically for expression of RelA, Bcl-2 and Bcl-xL proteins.Electrophoretic mobility shift assay (EMSA) was used toconfirm the increased nuclear translocation of RelA in colorectaltumor tissues. The mRNA expressions of Bcl-2 and Bcl-xLwere determined by reverse transcription polymerase chainreaction (RT-PCR) analysis. Apoptotic cells were detectedby terminal deoxynucleotidyl transferase-mediated deoxyuridinetriphosphate fluorescence nick end labeling (TUNEL) method.
RESULTS: The activity of NF-κB was significantly higher inadenocarcinoma tissue in comparison with that in adenomatousand normal epithelial tissues. The apoptotic index (AI)significantly decreased in the transition from adenoma toadenocarcinoma. Meanwhile, the expressions of Bcl-2 andBcl-xL protein and their mRNAs were significantly higher inadenocarcinoma tissues than that in adenomatous andnormal epithelial tissues.
CONCLUSION: NF-κB may inhibit apoptosis via enhancingthe expression of the apoptosis genes Bcl-2 and Bcl-xL. Andthe increased expression of RelA/nuclear factor-κB playsan important role in the pathogenesis of colorectal carcinoma.
Yu LL, Yu HG, Yu JP, Luo HS, Xu XM, Li JH. Nuclear factor-κBp65 (RelA) transcription factor is constitutively activated inhuman colorectal carcinoma tissue. World J Gastroenterol
2004; 10(22): 3255-3260
http://www.wjgnet.com/1007-9327/10/3255.asp
INTRODUCTIONRel/NF-κB is a family of dimeric transcription factors that controlthe expression of numerous genes involved in cell growth,differentiation, regulation of apoptosis, cytokine production,and neoplastic transformation[1,2]. The Rel/NF-κB familycomprises NF-κB1 (p50), NF-κB2 (p52), and the Rel proteins,RelA (p65), RelB, and c-Rel, which have a high level of sequencehomology within their NH2-terminal 300 amino acids, the Relhomology domain[3]. The p50 and p52 can interact with theRelA proteins to form all possible homo- and heterodimercombinations. The most common dimer is the RelA (p65) /NF-κB1 (p50) heterodimer, i.e., NF-κB. In most unstimulated cells,Rel/NF-κB proteins are sequestered in the cytoplasm and arecomplexed with specific inhibitor proteins called IκB thatrender the Rel/NF-κB proteins inactive[3]. Stimulation of cellsleads to phosphorylation and degradation of IκB and allowstranslocation of Rel/NF-κB to the nucleus, resulting inexpression of target genes[4]. A surprising variety of inducershave been found to activate Rel/NF-κB[3]. These pathways areinvolved in innate immune responses that involve cytokinessuch as tumor necrosis factor (TNF) -α and IL-1, responsesto physical stresses such as UV light and ionizing radiation(χ and γ), and responses to oxidative stresses such ashydrogen peroxide and butyl peroxide[5]. Several investigators have reported constitutive activationof NF-κB in various types of human tumor cell lines, includingthose of lymphoid origin such as Hodgkin/Reed Sternberg cells[6],T-cell lymphoma Hut 78 cells[7], and multiple myeloma cells[8].In addition, nonlymphoid cell lines including ovarian cancercells[9], lung carcinoma cells[10], breast cancer cells[11], thyroidcarcinoma cells[12], melanomas[13], and bladder cancer cells[14]
exhibited enhanced NF-κB activity. Recent studies also indicated that NF-κB was constitutivelyactivated in tumors such as pancreatic cancer and breastcancer[15,16]. However, little information is available concerningNF-κB activation in colorectal carcinoma, which is one of themost aggressive forms of cancer. The major objective of thisstudy was to determine whether NF-κB was constitutively activatedin colorectal carcinoma tissues, to examine whether the expressionof Bcl-2 and Bcl-xL was regulated by NF-κB activation, and toevaluate the correlation between NF-κB activity and apoptosisin colorectal carcinoma.
MATERIALS AND METHODSMaterialsTen normal colorectal mucosa, thirty colorectal adenoma (averageage of the patients: 56.8 years), and thirty colorectal carcinoma(average age of the patients: 58 years) patients who gave informedconsent before surgical treatment were entered into the presentstudy. Specimens were obtained from the Department of Pathology,Renmin Hospital, Wuhan University (Wuhan, China). The patientshad received neither chemotherapy nor radiation therapy beforetumor resection. To justify comparisons, we excluded lesionsfrom patients with familial colon carcinoma syndrome andsuspected de novo cancers. Tissues were fixed with 40 g/Lformaldehyde and embedded in paraffin for H & E staining and

immunohistochemistry. Tissue specimens were snap-frozenimmediately in liquid N2 and stored at -80 for EMSA assaysand RT-PCR analysis. The study was approved by the InstitutionalBoard of the Ethics Committee of Wuhan University under fullconsideration of the declaration on human rights of Helsinki.
ImmunohistochemistryFormalin-fixed, paraffin-embedded tissue blocks were cut into5 µm thick and mounted onto glass slides. After that, they werekept in an oven at 4 overnight. Immunostaining was performedas previously described with a slight modification[17]. Sectionswere deparaffinized in xylene and rehydrated. Endogenousperoxidase activity was blocked with 1% hydrogen peroxidefor 20 min. To improve the quality of staining, microwaveoven-based antigen retrieval was performed. Slides wereprobed with either anti-RelA (1:50, mouse monoclonal, SantaCruz Biotechnology), anti-Bcl-2 (1:100, mouse monoclonal,Santa Cruz Biotechnology) or anti-Bcl-xL (1:100, mousemonoclonal, Santa Cruz Biotechnology). Sections were washedthree times with PBS for 10 min each and incubated withbiotin-labeled anti-mouse IgG for 1 h at room temperature.After three washes with PBS for 10 min each, sections werestained with a streptavidin-peroxidase detection system.Incubation with PBS instead of the primary antibody servedas a negative control. In specimens containing positive cells,the positive cells were counted in ten randomly selectedfields under high power microscope (200-fold or 400-foldmagnification) for each sample, and the average was expressedas the density of positive cells.
Determination of apoptosisThe TUNEL assay, originally described by Gavrieli et al.[18],was used with minor modifications. Briefly, tissue sections of5 µm were mounted onto glass slides, deparaffinized, hydrated,and treated for 15-30 min at 37 with proteinase-K (RocheCo.; 20 µg/mL in 10 mmol/L Tris-HCl buffer, pH 7.4). Slides wererinsed twice with PBS. Then, 50 µL of TUNEL reaction mixture(450 µL nucleotide mixture containing fluoresceinated dUTP inreaction buffer plus 50 µL enzyme TdT from calf thymus, RocheCo.) were added to the samples. To ensure homogeneousdistribution of the TUNEL reaction mixture on tissue sectionsand to avoid evaporative loss, slides were covered with coverslipsduring incubation. Slides were incubated in a humidifiedchamber for 60 min at 37 . After rinsed, slides were incubatedwith anti-fluorescein antibody, with Fab fragment from sheep,conjugated with horse-radish peroxidase for 30 min at 37 .Slides were rinsed twice with PBS. Then, 50-100 µL of DABsubstrate was added and incubated for 10 min at room temperature.Samples can be counterstained prior to analysis by lightmicroscope. Positive signals were defined as presence of adistinct brown color nuclear staining of the neoplastic cells ormorphologically defined apoptotic bodies. The apoptotic index(AI) was determined by counting a total of at least 1 000neoplastic nuclei in 10 randomly chosen fields at 400-foldmagnification. Apoptotic cells were identified using a TUNELassay in conjunction with characteristic morphological changessuch as cell shrinkage, membrane blebbing, and chromatincondensation, to distinguish apoptotic cells and apoptoticbodies from necrotic cells.
EMSANuclear extracts were harvested according to protocols describedpreviously.[19] In brief, fresh samples were minced andhomogenized in 400 µL of hypotonic lysis buffer A (10 mmol/LHEPES pH 7.9, 10 mmol/L KCl, 0.1 mmol/L EDTA, 0.1 mmol/LEGTA,1 mmol/L DTT, and 1 mmol/L PMSF). Homogenizedtissues were incubated on ice for 5 min, NP-40 was added to a
final concentration of 5 g/L, and samples were vigorously mixedand centrifuged. The cytoplasmic proteins were removed andthe pellet nuclei were resuspended in 50 µL buffer C (20 mmol/LHEPES pH 7.9, 0.4 mol/L NaCl, 1 mmol/L EDTA, 1 mmol/LEGTA, 1 mmol/L DTT, and 1 mmol/L PMSF). After 30 minagitation at 4 , the samples were centrifuged and supernatants,containing nuclear proteins, were transferred to a fresh vial.The protein concentrations of nuclear extracts were determinedby Bio-Rad protein assay. The nuclear extracts were stored at -80 until use. Nuclear protein extracts of carcinomas, adenomas,and normal tissues were analyzed by EMSA for NF-κB nucleartranslocation as previously described[20-22]. EMSA bindingreaction mixture contained 8 µg protein of nuclear extracts, 2 µgof poly (deoxyinosinic- deoxycytidylic acid) (Sigma Co.), and[32P]-labeled double-stranded oligonucleotide containing thebinding motif of NF-κB probe (4 000 cpm) in binding buffer(10 mmol/L HEPES pH 7.9, 50 mmol/L NaCl, 1 mmol/L EDTA,1 mmol/L DTT, 100 mL/L glycerol, and 0.2 g/L albumin). Thesequence of the double-stranded oligomer used for EMSA was5’-AGTTGAGGGGACTTTCCCAGGC-3’. The reaction wasincubated for 30 min at room temperature before separation ona 50 g/L acrylamide gel, followed by autoradiography. Forsupershift experiments, 2 µg of mouse monoclonal antibodiesagainst the p65 subunit (Santa Cruz Biotechnology) of NF-κBwas incubated with the nuclear extracts 10 min before the additionof the [32P]-labeled probe and then analyzed as described.
RT-PCRThe mRNA expressions of Bcl-2 and Bcl-xL were assessed usingRT-PCR standardized by coamplifying housekeeping gene β-actin,which served as an internal control. Total RNA was isolatedfrom the normal epithelial, adenomatous and adenocarcinomatissues by the single-step method[23]. Total RNA was reverselytranscribed into cDNA and used for PCR with human specificprimers for Bcl-2, Bcl-xL and β-actin. Sequences of Bcl-2 primerswere 5’-CAGCTGCACCTGACGCCCTT -3’ (forward primer) and5’-GCCTCCGTTATCCTGGATCC-3’ (reverse primer), generatinga 199 bp PCR product; for Bcl-xL , the forward primer was 5’-AAGGATACAGCTGGAGTCAG-3’ and the reverse primer was5’-ATCAATGGCAACCCATCCTG-3’, generating a 316 bp PCRproduct; for β-actin, the forward primer was 5’-AGCGGGAAATCGTGCGTGAC-3’ and the reverse primer was 5’-ACTCCTGCTTGCTGATCCACATC-3’, producing a 471 bp PCR product[24,25].Briefly, the PCR was amplified by 32 repeat denaturation cyclesat 95 for 30 s, annealing at 60 for 30 s, and extension at 72 for 30 s. During the first cycle, the denaturation was extendedto 2 min, and in the final cycle the extension step was extendedto 5 min. PCR products were separated on 15 g/L agarose gelscontaining 0.5 g/L of ethidium bromide and visualized by UVtransillumination.
Statistical analysisAll statistical analyses were performed with SPSS10.0 statisticalpackage for Microsoft Windows. Student’s t test and one-wayanalysis of variance (ANOVA) were used to compare continuousvariables among groups. Correlation coefficients betweencontinuous variables were calculated by the method of Pearson’scorrelation coefficient. The χ2 test was used to compare binomialproportions. A P value of <0.05 was considered significant.
RESULTSRelA/NF-κκκκκB expression in colorectal carcinoma tissuesTo investigate whether RelA/NF-κB-DNA binding activitieswere altered in human colorectal carcinoma tissues, we firstcarried out immunohistochemical analyses. The monoclonalantibodies used in this study detected only activated RelA
3256 ISSN 1007-9327 CN 14-1219/ R World J Gastroenterol November 15, 2004 Volume 10 Number 22

proteins[17]. RelA staining was shown as brown color anddetected in normal colorectal mucosa, colorectal adenoma andcolorectal adenocarcinoma specimens. In colorectal adenomaand adenocarcinoma, positive staining of RelA was mainlyobserved in the cytoplasm, and nuclear staining for RelA was alsodetected (Figure 1). Tissues of colorectal adenocarcinoma showedmore cells with nuclear staining for RelA than those in colorectaladenoma tissues. No nuclear staining for RelA was found in normalcolorectal mucosa. As shown in Table 1, the density of RelA-positive cells was significantly increased (P<0.01) in the transitionfrom normal mucosa to adenoma and adenocarcinoma.
EMSATo confirm the finding that RelA/NF-κB-DNA binding activitieswere activated in human colorectal carcinoma tissues, we carriedout EMSA analyses. Figure 2 shows increased NF-κB DNAbinding activity in adenocarcinoma tissues compared with thatin adenoma and normal tissues. HPIAS-1000 SOFTWAREANALYSIS took the image of electrophoresis. The absorbanceof EMSA brands showed that the RelA/NF-κB complexes werenot presented in normal colorectal epithelium, 0.6587±0.0021 inadenocarcinoma, and 0.2153±0.0013 in adenoma. The RelAexpressions were significantly increased (P<0.05) in the transitionfrom normal colorectal epithelium to colon tumor tissues. Toconfirm the specificity of NF-κB DNA binding, we performedsupershift analysis with antibodies specific for RelA (p65)and a competitive study with a 50-fold excess of unlabeledoligonucleotide. An antibody specific for RelA which recognizesRelA/NF-κB heterodimer, unlabeled oligonucleotide diminishedthe intensity of RelA/NF-κB complexes, indicating that complexwas the NF-κB binding-specific band. Our results showed thatRelA was frequently activated in human colorectal tumor tissuesbut not in normal colon tissue.
Figure 2 Electrophoretic mobility shift assay demonstratingincreased nuclear translocation and DNA binding of NF-κB.A: lane 1, positive control (using Hela nuclear extract); lane 2,normal; lanes 3-6, adenocarcinoma; lanes 7-10, adenoma. B:lane 1, positive control (using Hela nuclear extract); lanes 2-3,specific competitor (using excess of unlabeled oligonucleotide);
lanes 4-5, adenoma; lanes 6-7, adenocarcinoma; lane 4 and 6,supershift (addition of p65 antibodies to the nuclear extracts).
Bcl-2 and Bcl-xL protein expression in colorectal carcinomatissuesIn the present study, the expressions of Bcl-2 and Bcl-xL werealso investigated using immunohistochemistry. Immunostainingspecific for Bcl-2 and Bcl-xL was cytoplasmic and shown asbrown color (Figures 3, 4). The expressions of Bcl-2 and Bcl-xL
were significantly increased (P<0.01) from normal mucosa totumor tissue (Table 1). Expressions of Bcl-2 and Bcl-xL wereboth significantly associated (r = 0.95,0.88; P<0.05) with RelAexpression in adenoma and adenocarcinoma.
Table 1 Changes in expression of RelA, Bcl-2, Bcl-xL and AI intransition from normal mucosa to tumor tissues
Group n RelA Bcl-2 Bcl-xL AI
Normal 10 9.31±0.56 15.62±0.75 11.35±0.71 13.09±0.78Adenoma 30 54.01±4.53 55.64±6.51 56.43±6.14 105.91±6.11
Adenocarcinoma 30 70.92±7.23 78.23±8.33 77.32±6.51 31.53±3.71
Figure 3 Immunohistochemical staining of Bcl-2 in tissuesections of colorectal adenoma (A) and adenocarcinoma(B). Bcl-2 expression is restricted to the cytoplasm of cancercells. ×200.
Yu LL et al. NF-κB in colorectal cancer 3257
Figure 1 Immunohistochemical staining of RelA in tissue sections of colorectal adenoma (A) and adenocarcinoma (B, C). RelAprotein is mainly expressed in the cytoplasm of tumor cells and nuclear accumulation of RelA is also detected. ×200.
A B C
1 2 3 4 5 6 7 8 9 10 1 2 3 4 5 6 7
Supershift
A B
A
B

Figure 4 Immunohistochemical staining of Bcl-xL in tissue sections of colorectal adenoma (A) and adenocarcinoma (B). Bcl-xL
expression is restricted to the cytoplasm of cancer cells.×200.
Figure 5 The mRNA expressions of Bcl-2 and Bcl-xL were assessed using RT-PCR standardized by coamplifying the housekeep-ing gene β-actin. A: the mRNA expression of Bcl-2. lanes 1-3, adenocarcinoma; lanes 4-6, adenoma; lane 7, normal; lane 8, marker.B: the mRNA expression of Bcl-2. lane 1, marker; lane 2, normal; lanes 3-5, adenoma; lanes 6-8, adenocarcinoma.
Figure 6 TUNEL staining in tissue sections of colorectal adenoma (A) and adenocarcinoma (B). TUNEL staining is restricted tothe nucleus of apoptotic cells.×200.
Bcl-2 and Bcl-xL mRNA expression in colorectal carcinoma tissuesRT-PCR analysis of mRNA expressions of Bcl-2 and Bcl-xL wasstandardized by co-amplifying these genes with the housekeepinggene β-actin. HPIAS-1000 SOFTWARE ANALYSIS took theimage of electrophoresis with β-action as internal standard. Therelative absorbance of mRNA expression for Bcl-2: 2.43±0.27%in normal tissues, 17.96±1.51% in adenoma, and 36.71±2.17% inadenocarcinoma; for Bcl-xL: 3.54±0.33% in normal tissues,23.02±2.11% in adenoma, and 39.71±2.49% in adenocarcinoma(Figure 5). Our results showed that colon tumor tissue constitutivelyexpressed Bcl-2 and Bcl-xL. The mRNA expressions of Bcl-2 andBcl-xL were significantly increased (P<0.05) in the transitionfrom normal colorectal epithelium to colon tumor tissue.
Cell apoptosisIn this study, TUNEL staining was restricted to the nucleus ofapoptotic cells. TUNEL-positive staining cells were detectedin normal colorectal mucosa, adenoma, and adenocarcinoma.The AI was significantly increased (P<0.01) in the transition
from normal colorectal mucosa to adenoma, but decreased fromadenoma to adenocarcinoma (Figure 6). There was noassociation between the AI and the histological classificationof adenoma and adenocarcinoma. The density of RelA-positivecells inversely correlated with the AI in the transition fromadenoma to adenocarcinoma (r = -0.89; P<0.001).
DISCUSSIONWe have demonstrated that RelA-DNA binding activity wasconstitutively activated in the majority of human colorectalcarcinomas. Whereas the role for RelA/NF-κB in tumorigenesishas not firmly established, recent work has suggested that itmay play a role in this process. RelA/NF-κB activation hasbeen shown to be necessary for tumor formation in Hodgkinlymphoma cells[26,27]. More recently, the inhibition of RelA/NF-κB activity through the use of specific NF-κB inhibitors (gliotoxinand MG132) resulted in spontaneous caspase-independentapoptosis in Hodgkin and Reed-Sternberg cells[28]. Also, anincrease in RelA/NF-κB levels was identified in breast cancer
A B
500400
200
bp
500400
200
bp
A B
A B
3258 ISSN 1007-9327 CN 14-1219/ R World J Gastroenterol November 15, 2004 Volume 10 Number 22

cell lines, primary human breast cancer, hepatocellular carcinoma,pancreatic adenocarcinoma, and gastric carcinoma whencompared with nontransformed controls or normal tissues[29-32].In addition, NF-κB transcriptional activity was required foroncogenic Ras-induced cellular transformation[33], which likelyoccurred through the inhibition of transformation-associatedapoptosis[34]. However, the role of NF-κB in colorectal tumorigenesisis unknown and currently under investigation. We primarily used immunohistochemistry to detect NF-κBactivation in human colorectal carcinoma tissues. Its expressionwas significantly increased in the transition from normalcolorectal mucosa to adenoma and adenocarcinoma. In ourimmunohistochemical analyses, we used monoclonal antibodiesto detect RelA/NF-κB-DNA binding activities, and theirsensitivity and specificity have been characterized previously.They were useful in differentiating between activated andinactivated forms of RelA and facilitated the detection of theactivated RelA proteins. In the current investigation, only 10-20%of RelA/NF-κB protein was detectable in the nucleus, whichwas consistent with previous reports[32]. And 80-90% of RelAstill remained in the cytoplasm when RelA proteins wereactivated. It is unclear why the majority of RelA/ NF-κB proteinsthat were freed from IκB remained in the cytoplasm. Possibleexplanations for this[32] are: (1) IκB was mutated and thereforecould not bind to RelA and masked the nuclear translocationsignal in RelA; (2) mutations in RelA prohibited IκB binding toRelA, and (3) the RelA upstream signal transduction cascadeswere constitutively activated. The Bcl-2 proto-oncogene is an apoptosis inhibitor originallydescribed in association with the t (14; 18) (q32; q21) translocationin follicular B cell lymphoma, which places the Bcl-2 gene underthe stimulatory control of the IgH promoter-enhancer at 14q32,resulting in increased Bcl-2 mRNA and protein[35] and inhibitionof apoptosis. The Bcl-xL proto-oncogene, a member of Bcl-2family, is a homologue of Bcl-2 and is an apoptosis inhibitor.The Bcl-2 and Bcl-xL oncoproteins have been described innormal colonic mucosa[35], where these were restricted to theepithelial regenerative compartment and the intestinal cryptbases. In our study, the expression of Bcl-2 and Bcl-xL wasincreased in the transition from normal mucosa to adenomaand adenocarcinoma. These results also show that the increasedRelA/NF-κB expression occurred concomitantly with an increasedexpression of Bcl-2 and Bcl-xL. To date, a number of gene productsthat inhibit apoptosis have been identified. These include Bcl-2and Bcl-xL genes. Indeed, Bcl-2 and Bcl-xL have been identifiedas NF-κB target gene[36], but the exact role NF-κB plays in itsregulation remains controversial. In recent years, increasing evidence indicates that activationof NF-κB plays an important role in coordinating the control ofapoptotic cell death. NF-κB has been shown to prevent Fas-induced death in B cells through the upregulation of Bcl-2 andBcl-xL expression[36], but has also been demonstrated to promoteapoptosis in thymocytes by downregulating Bcl-2 and Bcl-xL
gene expression[37]. However, the exact mechanism of NF-κB inthe regulation of apoptosis is not entirely clear. There are at leasttwo distinct mechanisms by which NF-κB blocks apoptosis[38]:(1) induction of antiapoptosis factors including IEX-1L, TRAF1,TRAF2, c-IAP-1, c-IAP-2 etc; (2) interference of apoptoticpathway by protein-protein interaction. However, these twodistinct mechanisms are not mutually exclusive since eithermechanism alone cannot fully explain the antiapoptotic actionof NF-κB. In our study, apoptosis was significantly decreasedin the transition from adenoma to adenocarcinoma, which wasin contrast to the expressions of RelA, Bcl-2, and Bcl-xL. Wealso observed an inverse relation between AI and the expressionof RelA in the transition from adenoma to adenocarcinoma,implying that increased RelA protein expression to a certainlevel might be anti-apoptotic and thus promote tumorigenic
cell behavior. The anti-apoptotic role of NF-κB has been wellcharacterized and various down-stream targets of NF-κB,including Bcl-2 and Bcl-xL have been identified. In the presentstudy, the statistical correlation between the increasedexpression of RelA, elevated Bcl-2 and Bcl-xL expression impliesthat in colorectal tissue, activation of RelA might exhibit anti-apoptotic effects at least in part through upregulation of Bcl-2and Bcl-xL expression. This has been shown to decreasemitochondrial permeability changes and cytochrome C releaseand thus to block apoptosis[39]. To date, NF-κB has been believed to play an important rolein coordinating the control of apoptotic cell death. However,the mechanism by which NF-κB blocks apoptosis is stillcontroversial. Some laboratories have reported that activationof NF-κB is able to either promote or prevent apoptosis, dependingon different stimuli and different cell types[40-42]. For example,Grimm et al.[43] reported that serum starvation activated NF-κBand induced human embryonic kidney cells into apoptosis.Qin et al.[44] found that NF-κB activation contributed to theexcitotoxin-induced death of striatal neurons. However,somewhat inconsistent results have also been presented byBeg and Baltimore[45] that NF-κB activation generally inhibitedapoptosis in embryonic fibroblasts. A question arises: who isright on earth? We think the answer is expected by further studies. In conclusion, our results demonstrate that the RelA/NF-κB pathway is activated constitutively in colorectal carcinomatissues, suggesting that activation of RelA/NF-κB might playan important role in colorectal tumorigenesis. Further studiesare required to elucidate the mechanisms of NF-κB activationand to determine whether NF-κB might serve as a therapeutictarget in the anti-neoplastic treatment of colorectal cancer.
REFERENCES1 Zhu JW, Yu BM, Ji YB, Zheng MH, Li DH. Upregulation of
vascular endothelial growth factor by hydrogen peroxide inhuman colon cancer. World J Gastroenterol 2002; 8: 153-157
2 Loncar MB, Al-Azzeh ED, Sommer PS, Marinovic M, SchmehlK, Kruschewski M, Blin N, Stohwasser R, Gott P, Kayademir T.Tumour necrosis factor alpha and nuclear factor kappaB in-hibit transcription of human TFF3 encoding a gastrointestinalhealing peptide. Gut 2003; 52: 1297-1303
3 Ghosh S, May MJ, Kopp EB. NF-κB and Rel proteins: evolu-tionarily conserved mediators of immune responses. Annu RevImmunol 1998; 16: 225-260
4 Micheau O, Tschopp J. Induction of TNF receptor I-mediatedapoptosis via two sequential signaling complexes. Cell 2003;114: 181-190
5 Siebenlist U, Franzoso G, Brown K. Structure, regulation andfunction of NF-κB. Annu Rev Cell Biol 1994; 10: 405-455
6 Bargou RC, Leng C, Krappmann D, Emmerich F, Mapara MY,Bommert K, Royer HD, Scheidereit C, Dorken B. High-levelnuclear NF-κB and Oct-2 is a common feature of culturedHodgkin/Reed-Sternberg cells. Blood 1996; 87: 4340-4347
7 Giri D K, Aggarwal BB. Constitutive activation of NF-κB causesresistance to apoptosis in human cutaneous T cell lymphomaHuT-78 cells. Autocrine role of tumor necrosis factor and reac-tive oxygen intermediates. J Biol Chem 1998; 273: 14008-14014
8 Feinman R, Koury J, Thames M, Barlogie B, Epstein J, Siegel DS.Role of NF-κB in the rescue of multiple myeloma cells from gluco-corticoid-induced apoptosis by bcl-2. Blood 1999; 93: 3044–3052
9 Xiao CW, Yan X, Li Y, Reddy SA, Tsang BK. Resistance ofhuman ovarian cancer cells to tumor necrosis factor alpha is aconsequence of nuclear factor kappaB-mediated induction ofFas-associated death domain-like interleukin-1beta-convert-ing enzyme-like inhibitory protein. Endocrinology 2003; 144:623-630
10 Mukhopadhyay T, Roth JA, Maxwell SA. Altered expressionof the p50 subunit of the NF-κB transcription factor complex innon-small cell lung carcinoma. Oncogene 1995; 11: 999-1003
11 Nakshatri H, Bhat-Nakshatri P, Martin DA, Goulet RJ Jr,
Yu LL et al. NF-κB in colorectal cancer 3259

Sledge GW Jr. Constitutive activation of NF-κB during pro-gression of breast cancer to hormone-independent growth. MolCell Biol 1997; 17: 3629–3639
12 Visconti R, Cerutti J, Battista S, Fedele M, Trapasso F, Zeki K,Miano MP, de Nigris F, Casalino L, Curcio F, Santoro M, FuscoA. Expression of the neoplastic phenotype by human thyroidcarcinoma cell lines requires NF-κB p65 protein expression.Oncogene 1997; 15: 1987-1994
13 Ivanov VN, Bhoumik A, Ronai Z. Death receptors and mela-noma resistance to apoptosis. Oncogene 2003; 22: 3152-3161
14 Sumitomo M, Tachibana M, Ozu C, Asakura H, Murai M,Hayakawa M, Nakamura H, Takayanagi A, Shimizu N. In-duction of apoptosis of cytokine-producing bladder cancercells by adenovirus-mediated IκB overexpression. Hum GeneTher 1999; 10: 37-47
15 Zelvyte I, Ohlsson B, Axelson J, Janciauskiene S. Diverse re-sponses between human pancreatic cancer cell lines to nativealpha 1-antitrypsin and its C-terminal fragment. Anticancer Res2003; 23: 2267-2273
16 Sovak MA, Arsura M, Zanieski G, Kavanagh KT, SonensheinGE. The inhibitory effects of transforming growth factor beta1on breast cancer cell proliferation are mediated through regula-tion of aberrant nuclear factor-kappaB/Rel expression. CellGrowth Differ 1999; 10: 537-544
17 Zabel U, Henkel T, Silva MS, Baeuerle PA. Nuclear uptakecontrol of NF-κB by MAD-3, an IkB protein present in thenucleus. EMBO J 1993; 12: 201–211
18 Gavrieli Y, Sherman Y, Ben-Sasson SA. Identification of pro-grammed cell death in situ via specific labeling of nuclear DNAfragmentation. J Cell Biol 1992; 119: 493–501
19 Huang Y, Johnson KR, Norris JS, Fan W. Nuclear factor-κB/IκB signaling pathway may contribute to the mediation ofpaclitaxel induced apoptosis in solid tumor cells. Cancer Res2000; 60: 4426-4432
20 Wong BC, Jiang X, Fan XM, Lin MC, Jiang SH, Lam SK, KungHF. Suppression of RelA/p65 nuclear translocation indepen-dent of IκBa degradation by cyclooxygenase-2 inhibitor in gas-tric cancer. Oncogene 2003; 22: 1189-1197
21 Li-Weber M, Laur O, Dern K, Krammer PH. T cell activation-induced and HIV tat-enhanced CD95(APO-1/Fas) ligand tran-scription involves NF-κB. Eur J Immunol 2000; 30: 661-670
22 Sosic D, Richardson JA, Yu K, Ornitz DM, Olson EN. Twistregulates cytokine gene expression through a negative feedbackloop that represses NF-κB activity. Cell 2003; 112: 169-180
23 Chomczynski P, Sacchi N. Single-step method of RNA isola-tion by acid guanidine isothiocyanate-phenolchloroformextraction. Anal Biochem 1987; 162: 156-159
24 Kitamura S, Kondo S, Shinomura Y, Kanayama S, MiyazakiY, Kiyohara T, Hiraoka S, Matsuzawa Y. Met/HGF receptormodulates bcl-w expression and inhibits apoptosis in humancolorectal cancers. Br J Cancer 2000; 83: 668-673
25 Nakajima-Iijima S, Hamada H, Reddy P, Kakunaga T. Mo-lecular structure of the human cytoplasmic β-actin gene:Interspecies homology of sequences in the introns. Proc NatlAcad Sci U S A 1985; 82: 6133-6137
26 Bargou RC, Emmerich F, Krappmann D, Bommert K, MaparaMY, Arnold W, Royer HD, Grinstein E, Greiner A, ScheidereitC, Dorken B. Constitutive nuclear factor-kappaB-RelA activa-tion is required for proliferation and survival of Hodgkin'sdisease tumor cells. J Clin Invest 1997; 100: 2961-2969
27 Schenkein D. Proteasome inhibitors in the treatment of B-cellmalignancies. Clin Lymphoma 2002; 3: 49-55
28 Izban KF, Ergin M, Huang Q, Qin JZ, Martinez RL, Schnitzer B,Ni H, Nickoloff BJ, Alkan S. Characterization of NF-kappaB
expression in Hodgkin’s disease: Inhibition of constitutivelyexpressed NF-kappaB results in spontaneous caspase-inde-pendent apoptosis in Hodgkin and Reed-Sternberg cells. ModPathol 2001; 14: 297-310
29 Sovak MA, Bellas RE, Kin DW, Zanieski DJ, Rogers AE, TraishAM, Sonenshein GE. Aberrant nuclear factor-kappa B/Rel ex-pression and the pathogenesis of breast cancer. J Clin Invest1997; 100: 2952–2960
30 Tai DI, Tsai SL, Chang YH, Huang SN, Chen TC, Chang KS,Liaw YF. Constitutive activation of nuclear factor kappaB inhepatocellular carcinoma. Cancer 2000; 89: 2274-2281
31 Sasaki N, Morisaki T, Hashizume K, Yao T, Tsuneyoshi M,Noshiro H, Nakamura K, Yamanaka T, Uchiyama A, TanakaM, Katano M. Nuclear factor-kappaB p65 (RelA) transcriptionfactor is constitutively activated in human gastric carcinomatissue. Clin Cancer Res 2001; 7: 4136-4142
32 Wang WX, Abbruzzese JL, Evans DB, Larry L, Cleary KR,Chiao PJ. The nuclear factor-κB relA transcription factor isconstitutively activated in human pancreatic adenocarcinomacells. Clin Cancer Res 1999; 5: 119–127
33 Finco TS, Westwick JK, Norris JL, Beg AA, Der CJ, BaldwinAS Jr. Oncogenic Ha-Rasinduced signaling activates NF-κBtranscriptional activity, which is required for cellulartransformation. J Biol Chem 1997; 272: 24113-24116
34 Mayo MW, Wang CY, Cogswell PC, Rogers-Graham KS, LoweSW, Der CJ, Baldwin AS Jr. Requirement for NF-κB activationto suppress p53-independent apoptosis induced by oncogenicras. Science 1997; 278: 1812-1815
35 Popescu RA, Lohri A, de Kant E, Thiede C, Reuter J, HerrmannR, Rochlitz CF. Bcl-2 expression is reciprocal to p53 and c-mycexpression in metastatic human colorectal cancer. Eur J Cancer1998; 34: 1268-1273
36 Lee HH, Dadgostar H, Cheng Q, Shu J, Cheng G. NF-κB medi-ated up-regulation of Bcl-x and Bfl-1/A1 is required for CD40survival signaling in B lymphocytes. Proc Natl Acad Sci U S A1999; 96: 9136-9141
37 Hettmann T, DiDonato J, Karin M, Leiden JM. An essentialrole for nuclear factor κB in promoting double positive thy-mocyte apoptosis. J Exp Med 1999; 189: 145-158
38 Kajino S, Suganuma M, Teranishi F, Takahashi N, Tetsuka T,Ohara H, Itoh M, Okamoto T. Evidence that de novo proteinsynthesis is dispensable for anti-apoptotic effects of NF-κB.Oncogene 2000; 19: 2233-2239
39 Aams J, Cory S. The Bcl-2 protein family arbiters of cell survival.Science 1998; 281: 1322-1326
40 Glasgow JN, Wood T, Perez-Polo JR. Identification and char-acterization of nuclear factor-κB binding sites in the murineBcl-x promoter. J Neurochem 2000; 75: 1377-1389
41 O’Connor L, Huang DC, O’Reilly LA, Strasser A. Apoptosisand cell division. Currt Opin Cell Biol 2000; 12: 257-263
42 Yoneda T, Imaizumi K, Maeda M, Yui D, Manabe T, KatayamaT, Sato N, Gomi F, Morihara T, Mori Y, Miyoshi K, Hitomi J,Ugawa S, Yamada S, Okabe M, Tohyama M. Regulatory mecha-nisms of TRAF2-mediated signal transduction by Bcl-10, aMALT lymphoma-associated protein. J Biol Chem 2000; 275:11114-11120
43 Grimm S, Bauer MK, Baeuerle PA, Schulze-Osthoff K. Bcl-2down-regulates the activity of transcription factor NF-κB in-duced upon apoptosis. J Cell Biol 1996; 134: 13-23
44 Qin ZH, Wang Y, Nakai M, Chase TN. Nuclear Factor-κBcontributes to excitotoxin-induced apoptosis in rat striatum.Mol Pharmacol 1998; 53: 33-42
45 Beg AA, Baltimore D. An essential role for NF-κB in preventingTNF-α-induced cell death. Science 1996; 274: 782-784
Edited by Zhang JZ and Zhu LH Proofread by Xu FM
3260 ISSN 1007-9327 CN 14-1219/ R World J Gastroenterol November 15, 2004 Volume 10 Number 22

PO Box 2345, Beijing 100023, China World J Gastroenterol 2004;10(22):3261-3263Fax: +86-10-85381893 World Journal of GastroenterologyE-mail: [email protected] www.wjgnet.com Copyright © 2004 by The WJG Press ISSN 1007-9327
• COLORECTAL CANCER •
Expression of vascular endothelial growth factor-C and the
relationship between lymphangiogenesis and lymphatic metastasis
in colorectal cancer
Yi-Tao Jia, Zhong-Xin Li, Yu-Tong He, Wei Liang, Hui-Chai Yang, Hong-Jun Ma
Yi-Tao Jia, Wei Liang, Department of Oncology, the People’sHospital of Hebei Province, Shijiazhuang 050051, Hebei Province, ChinaZhong-Xin Li, Yu-Tong He, Hui-Chai Yang, Department ofSurgery, the Forth Hospital of Hebei Medical University, Shijiazhuang050011,Hebei Province, ChinaHong-Jun Ma, Experimental Centre of Electron Microscopy of HebeiMedical University, Shijiazhuang 050011, Hebei Province, ChinaCorrespondence to: Dr. Zhong-Xin Li, Department of Surgery, theForth Hospital of Hebei Medical University, Shijiazhuang 050011,Hebei Province, ChinaTelephone: +311-6033941-347Received: 2003-12-23 Accepted: 2004-03-02
Abstract
AIM: To investigate the expression of vascular endothelialgrowth factor-C (VEGF-C) and the relationship between VEGF-C and lymphangiogenesis, lymph node metastasis in colorectalcancer.
METHODS: Fifty six cases of colorectal cancer were selectedrandomly. Expression of VEGF-C was detected by immuno-histochemistry, and lymphatic vessels were stained by enzymehistochemical method.
RESULTS: VEGF-C expression was found in 66.7% (37/56)patients. In VEGF-C positive and negative patients, thelymphatic vessel density was 25.16±7.52 and 17.14±7.22,respectively (P<0.05). The rate of lymph node metastasisin VEGF-C positive patients (81.1%) was significantly higherthan that in the negative group (42.1%).
CONCLUSION: VEGF-C expression may induce lymphangi-ogenesis in colorectal cancer, as a result, tumor cells canentry the lymphatic vessels easily. VEGF-C may serve as auseful prognotic factor in colorectal carcinoma.
Jia YT, Li ZX, He YT, Liang W, Yang HC, Ma HJ. Expressionof vascular endothelial growth factor-C and the relationshipbetween lymphangiogenesis and lymphatic metastasis incolorectal cancer. World J Gastroenterol 2004; 10(22):3261-3263
http://www.wjgnet.com/1007-9327/10/3261.asp
INTRODUCTIONColorectal cancer is a common cause of death throughout theworld including China. The lymphatic system is the primarypathway of metastasis for gastrointestinal tract malignancies,and the extent of lymph node involvement is a key prognosticfactor for the outcome of patients. However, the mechanism oflymphatic metastasis remains unclear. Lymphangiogenesis, the development of new lymph vessels,is a relatively new area of clinical investigations. Recently,vascular endothelial growth factor C (VEGF-C) has beenidentified as a new member of the VEGF family[1,2], and is belived
to be the only lymphangiogenic factor in the VEGF family. Itactivates both vascular endothelial growth factor receptor 2(VEGFR-2) and VEGFR-3[3,4]. VEGF-C induces the proliferationof lymphatic vessels in the stroma of gastric carcinoma byactivating VEGFR-3 in lymphatic endothelial cells[5]. But theprecise role of VEGF-C in colorectal cancer has not been clearlyunderstood. Therefore, in the current study, we used an enzyme-histochemical method for 5’-nucleotidase (5’-Nase) to distinguishlymph vessels in colorectal carcinoma, and immunohistochemistryto examine the correlation between the expression of VEGF-C,lymphangiogenesis and the clinicopathologic features.
MATERIALS AND METHODSPatientsFifty-six Chinese colorectal carcinoma patients were surgicallytreated in the Department of Surgery, the Forth Hospital ofHebei Medical University, China from 2001 to 2002. The patientsincluded 34 males and 22 females, and ranged in age from 33 to75 years (average age 58.5 years). The lesions included 13 coloncancers and 43 rectal cancers, two patients with stage I, 17patients with stage II, 34 patients with stage III and threepatients with stage IV.
ImmunohistochemistryImmunohistochemical staining for VEGF-C was performed usingthe streptavidin-peroxidase technique. Formalin fixed andparaffin embeded tissues were cut into 4 µm thick sections andplaced on saline coated slides. After deparaffinization in xyleneand rehydration, endogeneous peroxidase activity was blockedafter incubated with 30 mL/L hydrogen peroxidase for 20 min.Tissue sections were then autoclaved at 121 in 10 mmol/Lcitrate buffer (pH 6.0) for 10 min for antigen retrieval and cooledat room temperature for 30 min, them incubated for 3 h with a1:40 dilution of anti-VEGF-C rabbit polyclonal antibody (SantaCruz Biotech, USA). Bound peroxidase was visualized using asolution of diaminobezidine as chromogen, and nuclei werecounterstained with hematoxylin. Scoring was carried out bytwo independent observers who were blinded to the patient’sstatus. Positive staining was defined as the presence of VEGF-C immunoreactivity in at least 10% of tumor cells.
Enzyme-histochemistryCryosections (7 µm thick) of tissue were processed for 5’-nucleotide-alkaline phosphatase (5’-Nase-ALPase) double stainingaccording to Ji et al.’s report[6]. After rinsed in 0.1 mol/L cacodylatebuffer (pH 7.2), specimens were incubated in the reaction mediumfor 5’-Nase for 50 min at 37 with 5’-adenosine monophosphate(AMP) (Sigma chemical, St. Louis, MO, USA ) as a substrate,lead nitrate (Sigma, USA) as a capture agent, and 2 mmol/L L-tetramisole (Sigma, USA) as an inhibitor of nonspecific alkalinephosphatase. After washed with distilled water, the tissues weretreated with 10 mg/L ammonium sulfide solution for 1 min atroom temperature. Then, the sections were incubated in the reactionmedium for ALPase for 30 min at 4 with fast blue BB, N,N-
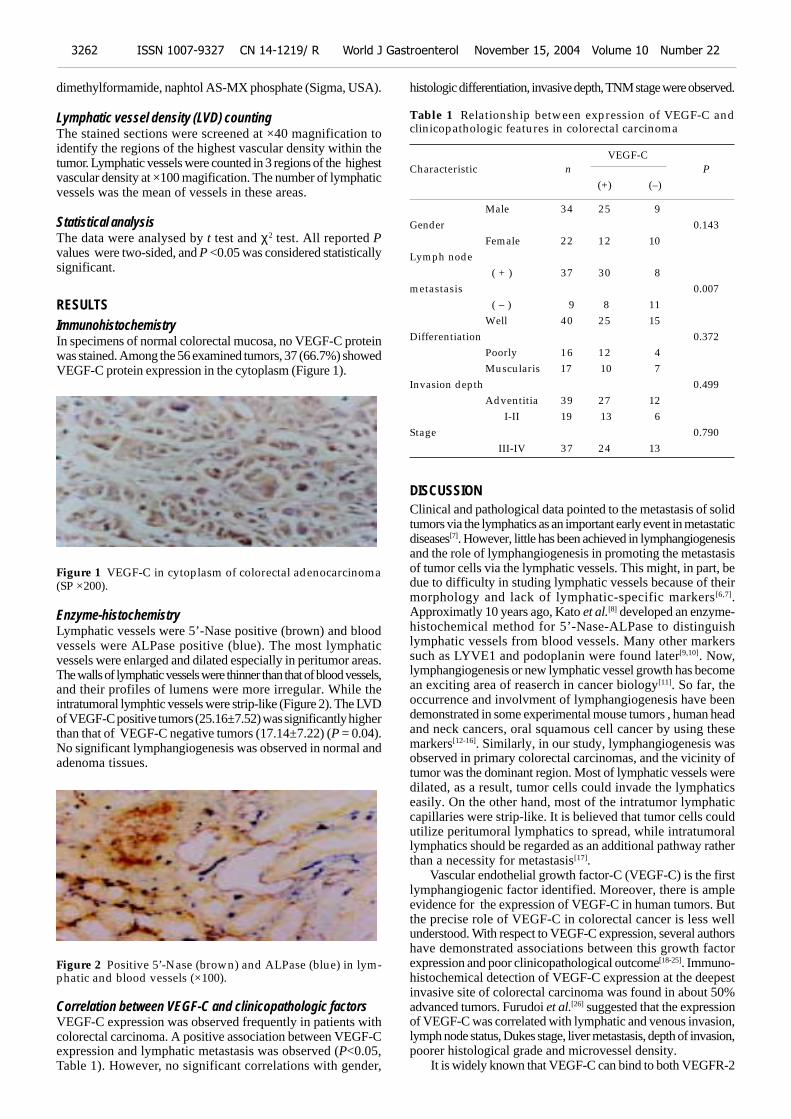
3262 ISSN 1007-9327 CN 14-1219/ R World J Gastroenterol November 15, 2004 Volume 10 Number 22
dimethylformamide, naphtol AS-MX phosphate (Sigma, USA).
Lymphatic vessel density (LVD) countingThe stained sections were screened at ×40 magnification toidentify the regions of the highest vascular density within thetumor. Lymphatic vessels were counted in 3 regions of the highestvascular density at ×100 magification. The number of lymphaticvessels was the mean of vessels in these areas.
Statistical analysisThe data were analysed by t test and χ2 test. All reported Pvalues were two-sided, and P <0.05 was considered statisticallysignificant.
RESULTSImmunohistochemistryIn specimens of normal colorectal mucosa, no VEGF-C proteinwas stained. Among the 56 examined tumors, 37 (66.7%) showedVEGF-C protein expression in the cytoplasm (Figure 1).
Figure 1 VEGF-C in cytoplasm of colorectal adenocarcinoma(SP ×200).
Enzyme-histochemistryLymphatic vessels were 5’-Nase positive (brown) and bloodvessels were ALPase positive (blue). The most lymphaticvessels were enlarged and dilated especially in peritumor areas.The walls of lymphatic vessels were thinner than that of blood vessels,and their profiles of lumens were more irregular. While theintratumoral lymphtic vessels were strip-like (Figure 2). The LVDof VEGF-C positive tumors (25.16±7.52) was significantly higherthan that of VEGF-C negative tumors (17.14±7.22) (P = 0.04).No significant lymphangiogenesis was observed in normal andadenoma tissues.
Figure 2 Positive 5’-Nase (brown) and ALPase (blue) in lym-phatic and blood vessels (×100).
Correlation between VEGF-C and clinicopathologic factorsVEGF-C expression was observed frequently in patients withcolorectal carcinoma. A positive association between VEGF-Cexpression and lymphatic metastasis was observed (P<0.05,Table 1). However, no significant correlations with gender,
histologic differentiation, invasive depth, TNM stage were observed.
Table 1 Relationship between expression of VEGF-C andclinicopathologic features in colorectal carcinoma
VEGF-CCharacteristic n P
(+) (–)
Male 34 25 9Gender 0.143
Female 22 12 10Lymph node
( + ) 37 30 8metastasis 0.007
( – ) 9 8 11Well 40 25 15
Differentiation 0.372Poorly 16 12 4Muscularis 17 10 7
Invasion depth 0.499Adventitia 39 27 12 I-II 19 13 6
Stage 0.790 III-IV 37 24 13
DISCUSSIONClinical and pathological data pointed to the metastasis of solidtumors via the lymphatics as an important early event in metastaticdiseases[7]. However, little has been achieved in lymphangiogenesisand the role of lymphangiogenesis in promoting the metastasisof tumor cells via the lymphatic vessels. This might, in part, bedue to difficulty in studing lymphatic vessels because of theirmorphology and lack of lymphatic-specific markers[6,7].Approximatly 10 years ago, Kato et al.[8] developed an enzyme-histochemical method for 5’-Nase-ALPase to distinguishlymphatic vessels from blood vessels. Many other markerssuch as LYVE1 and podoplanin were found later[9,10]. Now,lymphangiogenesis or new lymphatic vessel growth has becomean exciting area of reaserch in cancer biology[11]. So far, theoccurrence and involvment of lymphangiogenesis have beendemonstrated in some experimental mouse tumors , human headand neck cancers, oral squamous cell cancer by using thesemarkers[12-16]. Similarly, in our study, lymphangiogenesis wasobserved in primary colorectal carcinomas, and the vicinity oftumor was the dominant region. Most of lymphatic vessels weredilated, as a result, tumor cells could invade the lymphaticseasily. On the other hand, most of the intratumor lymphaticcapillaries were strip-like. It is believed that tumor cells couldutilize peritumoral lymphatics to spread, while intratumorallymphatics should be regarded as an additional pathway ratherthan a necessity for metastasis[17]. Vascular endothelial growth factor-C (VEGF-C) is the firstlymphangiogenic factor identified. Moreover, there is ampleevidence for the expression of VEGF-C in human tumors. Butthe precise role of VEGF-C in colorectal cancer is less wellunderstood. With respect to VEGF-C expression, several authorshave demonstrated associations between this growth factorexpression and poor clinicopathological outcome[18-25]. Immuno-histochemical detection of VEGF-C expression at the deepestinvasive site of colorectal carcinoma was found in about 50%advanced tumors. Furudoi et al.[26] suggested that the expressionof VEGF-C was correlated with lymphatic and venous invasion,lymph node status, Dukes stage, liver metastasis, depth of invasion,poorer histological grade and microvessel density. It is widely known that VEGF-C can bind to both VEGFR-2

and VEGFR-3. Activation of VEGFR-2 results in the mitogenesisof vascular endothelial cells. In contrast, VEGFR-3 activationby VEGF-C is considered to induce proliferation of lymphaticendothelial cells. Thus, angiogenic versus lymphangiogenicresponses to VEGF-C have been found to depend on theexpression of its receptors in blood versus lymphatic endothelialcells of the target tissue[27]. In addition, the activation of lymphaticsby VEGF-C is considered to induce secretion of chemokinesand similar factors by the lymphatic endothelium, thus attractingtumor cells and facilitating their entry into lymphatics[28].Besides VEGF-C, another new member of VEGF family, VEGF-D,could also stimulate lymphangiogenesis by activating VEGFR-3in human tumors[29-32]. But the relationship between VEGF-Cand VEGF-D expressions, as well as the role of VEGF-D inhuman tumors is still unclear. In summary, our findings demonstrate a causal role oflymphangiogenesis in tumor metastasis, suggesting VEGF-Cexpression is related to the high incidence of metastasis incolorectal carcinoma. However, the mechanism of lymphangiogenesisis extremely complex, which is a subject of ongoing investigation.
REFERENCES1 Pepper MS. Lymphangiogenesis and tumor metastasis: myth
or reality? Clin Cancer Res 2001; 7: 462-4682 Stacker SA, Achen MG, Jussila L, Baldwin ME, Alitalo K.
Lymphangiogenesis and cancer metastasis. Nat Rev Cancer 2002;2: 573-583
3 Jussila L, Alitalo K. Vascular growth factors and lymphangiogenesis.Physiol Rev 2002; 82: 673-700
4 Baldwin ME, Stacker SA, Achen MG. Molecular control oflymphangiogenesis. Bioessays 2002; 24: 1030-1040
5 Yonemura Y, Fushido S, Bando E, Kinoshita K, Miwa K, EndoY, Sugiyama K, Partanen T, Yamamoto H, Sasaki T.Lymphangiogenesis and the vascular endothelial growth fac-tor receptor (VEGFR)-3 in gastric cancer. Eur J Cancer 2001; 37:918-923
6 Ji RC, Kato S. Lymphatic network and lymphangiogenesis inthe gastric wall. J Histochem Cytochem 2003; 51: 331-338
7 Stacker SA, Baldwin ME, Achen MG. The role of tumorlymphangiogenesis in metastatic spread. FASEB J 2002; 16:922-934
8 Kato S. Introlobular lymphatic vessels and their relationshipto blood vessels in the mouse thymus. Light- and electron-mircroscopic study. Cell Tissue Res 1988; 253: 181-187
9 Jackson DG. The lymphatics Revisited New perspectives fromthe Hyaluronan Receptor LYVE-1. Trends Cardiovasc Med 2003;13: 1-7
10 Reis-Filho JS, Schmitt FC. Lymphangiogenesis in tumors: whatdo we know? Microsc Res Tech 2003; 60: 171-180
11 Duff SE, Li C, Jeziorska M, Kumar S, Saunders MP, SherlockD, O’Dwyer ST, Jayson GC. Vascular endothelial growth fac-tors C and D and lymphangiogenesis in gastrointestinal tractmalignancy. Br J Cancer 2003; 89: 426-430
12 Mattila MM, Ruohola JK, Karpanen T, Jackson DG, Alitalo K,Harkonen PL.VEGF-C induced lymphangiogenesis is associ-ated with lymph node metastasis in orthotopic MCF-7 tumors.Int J Cancer 2002; 98: 946-951
13 Krishnan J, Kirkin V, Steffen A, Hegen M, Weih D, Tomarev S,Wilting J, Sleeman JP. Differential in vivo and in vitro expres-sion of vascular endothelial growth factor (VEGF) -C and VEGF-D in tumors and its relationship to lymphatic metastasis inimmunocompetent rats. Cancer Res 2003; 63: 713-722
14 He Y, Kozaki K, Karpanen T, Koshikawa K, Yla-Herttuala S,Takahashi T, Alitalo K. Suppression of tumor lymphangiogenesisand lymph node metastasis by blocking vascular endothelialgrowth factor receptor 3 signaling. J Natl Cancer Inst 2002; 94:819-825
15 Beasley NJ, Prevo R, Banerji S, Leek RD, Moore J, van TrappenP, Cox G, Harris AL, Jackson DG. Intratumoral lymphangiogenesisand lymph node metastasis in head and neck cancer. Cancer Res2002; 62: 1315-1320
16 Sedivy R, Beck-Mannagetta J, Haverkampf C, Battistutti W,Honigschnabl S. Expression of vascular endothelial growth fac-tor-C correlates with the lymphatic microvessel density andthe nodal status in oral squamous cell cancer. J Oral Pathol Med2003; 32: 455-460
17 Cassella M, Skobe M. Lymphatic vessel activation in cancer.Ann N Y Acad Sci 2002; 979: 120-130
18 Tanaka K, Sonoo H, Kurebayashi J, Nomura T, Ohkubo S,Yamamoto Y, Yamamoto S. Inhibition of infiltration and an-giogenesis by thrombospondin-1 in papillary thyroid carcinoma.Clin Cancer Res 2002; 8: 1125-1131
19 Takahashi A, Kono K, Itakura J, Amemiya H, Feng Tang R,Iizuka H, Fujii H, Matsumoto Y. Correlation of vascular en-dothelial growth factor-C expression with tumor-infiltratingdendritic cells in gastric cancer. Oncology 2002; 62: 121-127
20 Ichikura T, Tomimatsu S, Ohkura E, Mochizuki H. Prognosticsignificance of the expression of vascular endothelial growthfactor (VEGF) and VEGF-C in gastric carcinoma. J Surg Oncol2001; 78: 132-137
21 Masood R, Kundra A, Zhu S, Xia G, Scalia P, Smith DL, GillPS. Malignant mesothelioma growth inhibition by agents thattarget the VEGF and VEGF-C autocrine loops. Int J Cancer2003; 104: 603-610
22 Arinaga M, Noguchi T, Takeno S, Chujo M, Miura T, UchidaY. Clinical significance of vascular endothelial growth factor Cand vascular endothelial growth factor receptor 3 in patientswith non small cell lung carcinoma. Cancer 2003; 97: 457-464
23 Kaio E, Tanaka S, Kitadai Y, Sumii M, Yoshihara M, HarumaK, Chayama K. Clinical significance of angiogenic factor ex-pression at the deepest invasive site of advanced colorectalcarcinoma. Oncology 2003; 64: 61-73
24 Tang RF, Itakura J, Aikawa T, Matsuda K, Fuji H, Korc M,Matsumoto Y. Overexpression of lymphangiogenic growth fac-tor VEGF-C in human pancreatic cancer. Pancreas 2001; 22:285-292
25 Liu XE, Sun XD, Wu JM. Expression and significance of VEGF-C and FLT-4 in gastric cancer. World J Gastroenterol 2004; 10:352-355
26 Furudoi A, Tanaka S, Haruma K, Kitadai Y, Yoshihara M,Chayama K, Shimamoto F. Clinical significance of vascular en-dothelial growth factor C expression and angiogenesis at the deep-est invasive site of advanced colorectal carcinoma. Oncology 2002;62: 157-166
27 Nisato RE, Tille JC, Pepper MS. Lymphangiogenesis and tu-mor metastasis. Thromb Haemost 2003; 90: 591-597
28 Mandriota SJ, Jussila L, Jeltsch M, Compagni A, Baetens D,Prevo R, Banerji S, Huarte J, Montesano R, Jackson DG, Orci L,Alitalo K, Christofori G, Pepper MS. Vascular endothelial growthfactor-C-mediated lymphangiogenesis promotes tumourmetastasis. EMBO J 2002; 20: 672-682
29 Nakamura Y, Yasuoka H, Tsujimoto M, Yang Q, Imabun S,Nakahara M, Nakao K, Nakamura M, Mori I, Kakudo K. Flt-4-positive vessel density correlates with vascular endothelial growthfactor-d expression, nodal status, and prognosis in breast cancer.Clin Cancer Res 2003; 9: 5313-5317
30 Stacker SA, Hughes RA, Achen MG. Molecular targeting oflymphatics for therapy. Curr Pharm Des 2004; 10: 65-74
31 Onogawa S, Kitadai Y, Tanaka S, Kuwai T, Kimura S, ChayamaK. Expression of VEGF-C and VEGF-D at the invasive edgecorrelates with lymph node metastasis and prognosis ofpatients with colorectal carcinoma. Cancer Sci 2004; 95: 32-39
32 Koyama Y, Kaneko K, Akazawa K, Kanbayashi C, Kanda T,Hatakeyama K. Vascular endothelial growth factor-C and vas-cular endothelial growth factor-d messenger RNA expressionin breast cancer: association with lymph node metastasis. ClinBreast Cancer 2003; 4: 354-360
Edited by Kumar M and Wang XL Proofread by Xu FM
Jia YT et al. Expression of VEGF-C in colorectal cancer 3263

PO Box 2345, Beijing 100023, China World J Gastroenterol 2004;10(22):3264-3268Fax: +86-10-85381893 World Journal of GastroenterologyE-mail: [email protected] www.wjgnet.com Copyright © 2004 by The WJG Press ISSN 1007-9327
• VIRAL HEPATITIS •
Hepatitis B virus genotypes, phylogeny and occult infection in a
region with a high incidence of hepatocellular carcinoma in China
Zhong-Liao Fang, Hui Zhuang, Xue-Yan Wang, Xian-Min Ge, Tim J Harrison
Zhong-Liao Fang, Hui Zhuang, Department of Microbiology, Schoolof Basic Medicine, Peking University Health Science Center, Beijing100083, ChinaXue-Yan Wang, Center for Disease Prevention and Control of GuangxiZhuang Autonomous Region, Nanning 530021, Guangxi ZhuangAutonomous Region, ChinaXian-Min Ge, Guangxi Worker Hospital, Nanning 530021, GuangxiZhuang Autonomous Region, ChinaTim J Harrison, Centre for Hepatology, Royal Free and UniversityCollege Medical School, University College London, London, UnitedKingdomSupported by Beijing Municipal Committee of Science and Technology,No. H020920020190Correspondence to: Professor Hui Zhuang, Department of Microbiology,School of Basic Medicine, Peking University Health Science Center,Beijing 100083, China. [email protected]: +86-10-82802221 Fax: +86-10-82801617Received: 2003-12-19 Accepted: 2004-03-02
Abstract
AIM: To determine the genotypes and phylogeny of hepatitisB viruses (HBVs) in asymptomatic HBV carriers, and theprevalence of occult HBV infection in Long An County, GuangxiZhuang Autonomous Region, an area with a high incidenceof hepatocellular carcinoma.
METHODS: A nested polymerase chain reaction (nPCR)was used for detection of HBV DNA in serum samples from36 blood donors with asympmatic HBV infection, and inserum samples from 52 HBsAg negative family membersof the children who did not receive hepatitis B vaccinationin Long An County. PCR products were sequenced, andthe genotype of each HBV sequence was determined bycomparison with sequences of known genotypes in theGenBank and EMBL nucleotide databases using the BLASTprogramme. Phylogenetic trees were constructed by thequartet maximum likelihood analysis using the TreePuzzlesoftware.
RESULTS: Twenty (55.56%) of 36 HBV asymptomaticcarriers were positive for HBV DNA. They were all genotypeC by comparison with sequences of known genotypes inthe GenBank and EMBL nucleotide databases. The full-lengthHBV DNA sequence isolated from the sample No. 624contained 3 215 bases. No interesting mutations werefound in this isolate. The homology analysis showed thatthis strain was closer to the Vietnamese HBV genotype Cstrain, with a homology of 97%, compared its relation tothe same genotype of HBV isolated in Shanghai. Six (11.5%)of the 52 HBsAg negative family members were positivefor HBV DNA. A point mutation was found in the sampleNo. 37, resulting in the substitution of amino acid glycineto arginine in the “a” determinant. Other samples withpositive HBV DNA did not have any unusual amino acidsubstitutions in or around the “a” determinant, and wereattributed to the wild-type HBV.
CONCLUSION: The HBVs isolated from asymptomatic
carriers of Long An County were all identified as genotypeC, and the prevalence of occult HBV infection in thepopulation of the county is as high as 11.5%. It is suggestedthat genotype C and persistent occult HBV infection mayplay an important role in the development of HCC in thecounty.
Fang ZL, Zhuang H, Wang XY, Ge XM, Harrison TJ. HepatitisB virus genotypes, phylogeny and occult infection in a regionwith a high incidence of hepatocellular carcinoma in China.World J Gastroenterol 2004; 10(22): 3264-3268
http://www.wjgnet.com/1007-9327/10/3264.asp
INTRODUCTIONInfection with hepatitis B virus (HBV) may lead to a widespectrum of liver diseases ranging from mild, self-limited tofulminant hepatitis in acute infection, and from an asymptomaticcarrier state to severe chronic hepatitis, cirrhosis, and hepatocellularcarcinoma (HCC) in chronic infection. Human HBV, a prototypemember of the family hepadnaviridae, is a circular, partiallydouble-stranded DNA virus of approximately 3200 nt[1].Traditionally, HBV was classified into 4 subtypes or serotypes(adr, adw, ayr, and ayw) based on antigenic determinants ofhepatitis B surface antigen (HBsAg)[2]. Epidemiological studiesfound that the prevalence of these serotypes varied in differentparts of the world. In addition, antibody to the commondeterminant “a” confers protection against all serotypes.Advances in molecular biology techniques revealed significantdiversities in sequences of HBV isolates, accounting for allelicdifferences among the 4 major HBV serotypes. Based on anintergroup divergence of 8% or more in the complete nucleotidesequence, HBV has been classified into eight genotypes,designated as A to H[3-5]. Recent reports suggested thatinfections with HBV genotype C were associated with moresevere liver diseases, including HCC, than infections withgenotype B[6-8]. However, HBV genotype B was suggested tobe associated with the development of HCC in Taiwanese belowthe age of 50 years[9]. Occult HBV infection is characterized by the presence ofHBV infection with undetectable HBsAg. Undoubtedly, carriersof occult HBV may transmit the virus through blood transfusionor organ transplantation. Epidemiological and molecular studiesperformed since the 1980s indicate that persistent HBV infectionmight play a critical role in the development of HCC and inHBsAg-negative patients[10,11]. The incidence rate of HCC in Long An County, southernGuangxi, China, is about 49.9/100 000, the highest in the world,and over 90% of HCC cases in the county are individuals withpositive HBsAg in serum[12,13]. In this study, HBV preC andbasic core promoter from 36 HBV asymptomatic carriers in LongAn County were amplified and sequenced. The whole genomeof a strain from one of the carriers, and genotypes and phylogenyof all the isolates were also analyzed to clarify the differenceamong HBV strains from different areas. In addition, 52 serumsamples from family members of children without hepatitis Bvaccination, with negative HBsAg, from the county were

detected for HBV DNA to determine the prevalence of occultHBV infection in the population.
MATERIALS AND METHODSSerum samplesA total of 36 sera were obtained from asymptomatic blooddonors who were infected persistently with HBV in Long AnCounty, southern Guangxi, China. Another 52 serum sampleswere collected from family members of children failed to havehepatitis B vaccination from the county. Sera were tested forHBsAg, anti-HBc, anti-HBs, HBeAg, and anti-HBe using HBVMarker ELISA kits (produced by Xiamen Xinchuang ScientificTechnology Company, Limited, Fujian, China) (Tables 1, 2).
Table 1 Serological markers of 20 asymptomatic carriers withpositive HBV DNA
No. Age (yr) Sex HBsAg Anti-HBs Anti-HBc HBeAg Anti-HBe
601 18 Male + - + + -
602 18 Male + - + + -
603 28 Female + - + + -
604 20 Male + - + + -
605 27 Male + - + + -
606 18 Male + - + + -
607 31 Female + - + + -
609 22 Female + - + + -
610 19 Male + - + + -
615 38 Male + - + + -
618 22 Male + - + - -
619 20 Male + - + + -
621 24 Male + - + + -
622 28 Male + - + + -
623 30 Male + - + + -
624 25 Male + - + + -
629 28 Female + - + + -
630 28 Female + - + + -
633 18 Male + - + + -
634 19 Male + - + + -
Table 2 Serological markers of HBsAg-negative asymptom-atic carriers with positive HBV DNA
Sample No. HBsAg Anti-HBs Anti-HBs HBeAg Anti-HBe Anti-HBc Titre (mIU/mL)
1 - + 5.1 - + +
14 - + 108.0 - + -
16 - + 18.2 - + +
23 - + 13.9 - - -
25 - - - - + +
37 - - - - - +
PCR amplification and sequence analysisDNA was extracted from 85 µL serum by phenol/chloroformextraction following digestion by pronase. For preC and basiccore promoter amplification: the first round of PCR 35 cycleswas carried out using primers B935 (nt 1240-1260, 5’GCGCTGCAG AAGGTTTGTGGCTCCTCTG-3’) and MDC1(nt 2 304-2 324, 5’-TTGATAAGA TAGGGGCATTTG-3’). Foreach cycle, the samples was amplified at 94 for 30 s, at 50 for 30 s, and at 72 for 90 s in a 50 µL reaction. The second
round of 30 PCR cycles was carried out on 5 µL of the firstround product using primers CPRF1 (nt 1 678-1 695, 5’-CAATGTCAACGACCG ACC-3’) and CPRR1 (nt 1 928-1 948,5’-GAGTAACTCCACAG TAGCTCC-3’) and the same reactionconditions of the first round. For the surface gene amplification: the first round of 35ycles PCR was carried out using primers MD14(5’-GCGCTGCAGCTATGCCTCATCTTC-3’, nt 418-433) and HCO2 (5’-GCGAAGCTTGCTGTACAGACTTGG-3’, nt 761-776). For eachcycle,the samples was amplified at 94 for s, at 45 for 45 s,and at 72 for 2 min in a 50 µL reaction. The second round of30 PCR cycles was carried out on 5 µL of the first round productusing primers ME15 (5’-GCGCTGCAGCAAGGTATGTTGCCCG-3’, nt 455-470) and HDO3 (5’-GCGAAGCTTCATCATCCATATAGC-3’, nt 734-748) and the same reaction conditionsof the first round. PCR products from the second round wereconfirmed by 15 g/L agarose gels electrophoresis and thenpurified using the Wizard (PCR Preps DNA purification system(Promega, Madison, WI) according to the manufacturer’sinstructions. Cycle sequencing was carried out directly on 2mL purified DNA using primers CPRF1 and 33P-dATP by thethermo sequenase radiolabeled terminator cycle sequencingkit (USB Corporation, Cleveland, OH) according to themanufacturer’s instructions. Sample NO. 624 was selected for whole genome sequencing.Its DNA was extracted from 170 µL serum by phenol/chloroformextraction following digestion by pronase. The whole HBVgenome was amplified in three fragments. Primers for fragment1 for the first and second round PCR were LSOB1, BPOLEO1and LSBI1, and POLSEQ2. Primers for fragment 2 for the firstand second round PCR were MDN5, BPOLEO1, BPOLBO2 andPSISEQ2. Primers for fragment 3 for the first and second roundPCR were POLSEQ1, MDD2, POLSEQ6 and MDC1. Theconditions of 30 PCR cycles were at 94 for 30 s, at 50 for30 s, and at 72 for 90 s in a 50 µL reaction. PCR products fromthe second round PCR for each fragment were cloned into thevector pCR2.1 (Invitrogen, Leek, The Netherlands) and minipreparations of DNA made from 1.5 mL of 15 mL cultures ofindividual colonies by phenol extraction and ethanol precipitationof the cell pellet. Plasmids with inserts were identified bydigestion with EcoRI and remainder of the cultures used forextraction of DNA using a QIAprep spin kit (Qiagen, Crawley,UK). The purified DNA was sequenced as above. Sequencingprimers for fragment 1 were LSB1, PSISEQ2, ds 2, ds, ADELN,MD14, ADELP, POLSEQ8, POLSEQ9, POLSEQ6, POLSEQ2.Primers for fragment 2 were BPOLBO2, POLSEQ4, LSOB1,POLSEQ5 and PSISEQ2. Primers for fragment 3 were POLSEQ6,B935, BPOLEO1, MDN5, B936 and MDC1 (Tables 3, 4).
Table 3 PCR Primers
Primers Sequence Position (nt)
LSOB1 5’-GGCATTATTTGCATACCCTTTGG-3’ 2739-2762
BPOLEO1 5’-CTGAGAGTCCAAGAGTCCTCT-3’ 1657-1677
LSBI1 5’-TTGTGGGTCACCATATTCTT-3’ 2809-2829
POLSEQ2 5’-AGCAAACACTTGGCATAGGC-3’ 1168-1188
MDN5 5’-AGGAGGCTGTAGGCATAAAT-3’ 1774-1794
BPOLEO1 5’-CTGAGAGTCCAAGAGTCCTCT-3’ 1657-1677
BPOLBO2 5’-TCTTGTCTTACTTTTGGAAGA-3’ 2216-2236
PSISEQ2 5’-GCTGTTCCGGAATTGGAGCC-3’ 65-84
POLSEQ1 5’-ACCAAGCGTTGGGGCTACTC-3’ 847-866
MDD2 5’-GAAGAATAAAGCCCAGTAAA-3’ 2481-2500
POLSEQ6 5’-TTTCACTTTCTCGCCAACTTA-3’ 1089-1109
MDC1 5’-TTGATAAGATAGGGGCATTTG-3’ 2304-2324
Fang ZL et al. Hepatitis B virus genotypes and phylogeny 3265
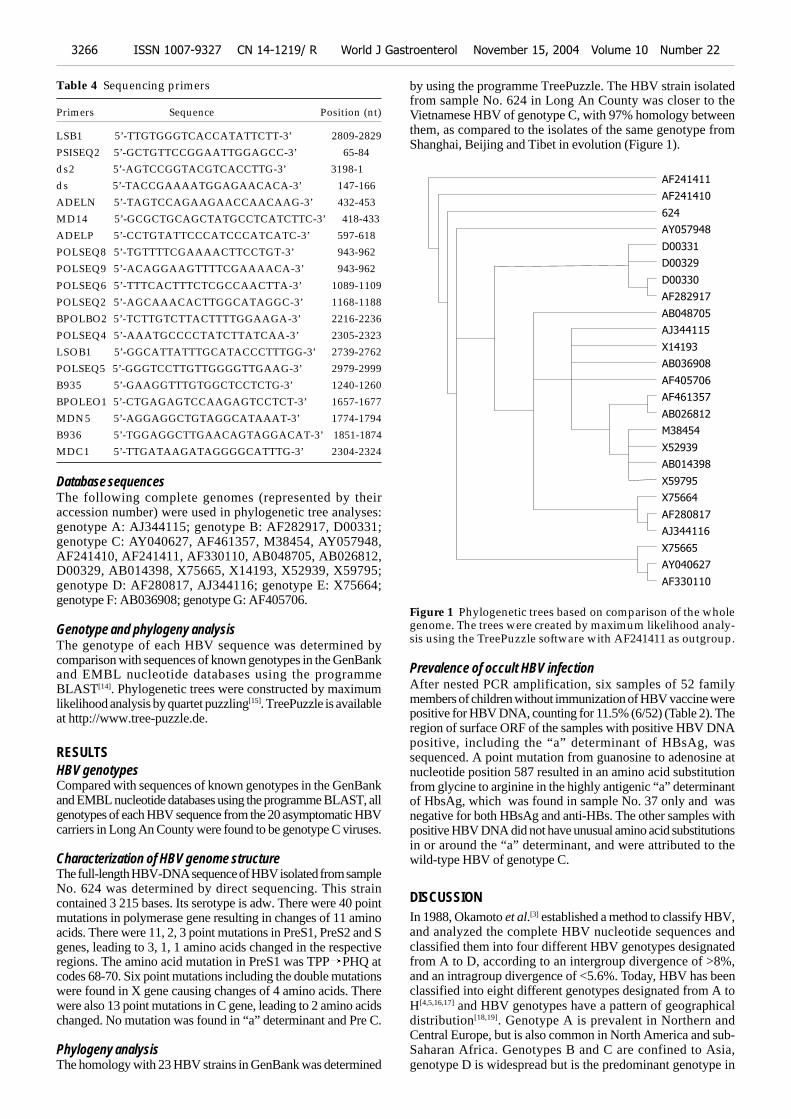
Table 4 Sequencing primers
Primers Sequence Position (nt)
LSB1 5’-TTGTGGGTCACCATATTCTT-3’ 2809-2829
PSISEQ2 5’-GCTGTTCCGGAATTGGAGCC-3’ 65-84
ds2 5’-AGTCCGGTACGTCACCTTG-3’ 3198-1
ds 5’-TACCGAAAATGGAGAACACA-3’ 147-166
ADELN 5’-TAGTCCAGAAGAACCAACAAG-3’ 432-453
MD14 5’-GCGCTGCAGCTATGCCTCATCTTC-3’ 418-433
ADELP 5’-CCTGTATTCCCATCCCATCATC-3’ 597-618
POLSEQ8 5’-TGTTTTCGAAAACTTCCTGT-3’ 943-962
POLSEQ9 5’-ACAGGAAGTTTTCGAAAACA-3’ 943-962
POLSEQ6 5’-TTTCACTTTCTCGCCAACTTA-3’ 1089-1109
POLSEQ2 5’-AGCAAACACTTGGCATAGGC-3’ 1168-1188
BPOLBO2 5’-TCTTGTCTTACTTTTGGAAGA-3’ 2216-2236
POLSEQ4 5’-AAATGCCCCTATCTTATCAA-3’ 2305-2323
LSOB1 5’-GGCATTATTTGCATACCCTTTGG-3’ 2739-2762
POLSEQ5 5’-GGGTCCTTGTTGGGGTTGAAG-3’ 2979-2999
B935 5’-GAAGGTTTGTGGCTCCTCTG-3’ 1240-1260
BPOLEO1 5’-CTGAGAGTCCAAGAGTCCTCT-3’ 1657-1677
MDN5 5’-AGGAGGCTGTAGGCATAAAT-3’ 1774-1794
B936 5’-TGGAGGCTTGAACAGTAGGACAT-3’ 1851-1874
MDC1 5’-TTGATAAGATAGGGGCATTTG-3’ 2304-2324
Database sequencesThe following complete genomes (represented by theiraccession number) were used in phylogenetic tree analyses:genotype A: AJ344115; genotype B: AF282917, D00331;genotype C: AY040627, AF461357, M38454, AY057948,AF241410, AF241411, AF330110, AB048705, AB026812,D00329, AB014398, X75665, X14193, X52939, X59795;genotype D: AF280817, AJ344116; genotype E: X75664;genotype F: AB036908; genotype G: AF405706.
Genotype and phylogeny analysisThe genotype of each HBV sequence was determined bycomparison with sequences of known genotypes in the GenBankand EMBL nucleotide databases using the programmeBLAST[14]. Phylogenetic trees were constructed by maximumlikelihood analysis by quartet puzzling[15]. TreePuzzle is availableat http://www.tree-puzzle.de.
RESULTSHBV genotypesCompared with sequences of known genotypes in the GenBankand EMBL nucleotide databases using the programme BLAST, allgenotypes of each HBV sequence from the 20 asymptomatic HBVcarriers in Long An County were found to be genotype C viruses.
Characterization of HBV genome structureThe full-length HBV-DNA sequence of HBV isolated from sampleNo. 624 was determined by direct sequencing. This straincontained 3 215 bases. Its serotype is adw. There were 40 pointmutations in polymerase gene resulting in changes of 11 aminoacids. There were 11, 2, 3 point mutations in PreS1, PreS2 and Sgenes, leading to 3, 1, 1 amino acids changed in the respectiveregions. The amino acid mutation in PreS1 was TPP PHQ atcodes 68-70. Six point mutations including the double mutationswere found in X gene causing changes of 4 amino acids. Therewere also 13 point mutations in C gene, leading to 2 amino acidschanged. No mutation was found in “a” determinant and Pre C.
Phylogeny analysisThe homology with 23 HBV strains in GenBank was determined
by using the programme TreePuzzle. The HBV strain isolatedfrom sample No. 624 in Long An County was closer to theVietnamese HBV of genotype C, with 97% homology betweenthem, as compared to the isolates of the same genotype fromShanghai, Beijing and Tibet in evolution (Figure 1).
Figure 1 Phylogenetic trees based on comparison of the wholegenome. The trees were created by maximum likelihood analy-sis using the TreePuzzle software with AF241411 as outgroup.
Prevalence of occult HBV infectionAfter nested PCR amplification, six samples of 52 familymembers of children without immunization of HBV vaccine werepositive for HBV DNA, counting for 11.5% (6/52) (Table 2). Theregion of surface ORF of the samples with positive HBV DNApositive, including the “a” determinant of HBsAg, wassequenced. A point mutation from guanosine to adenosine atnucleotide position 587 resulted in an amino acid substitutionfrom glycine to arginine in the highly antigenic “a” determinantof HbsAg, which was found in sample No. 37 only and wasnegative for both HBsAg and anti-HBs. The other samples withpositive HBV DNA did not have unusual amino acid substitutionsin or around the “a” determinant, and were attributed to thewild-type HBV of genotype C.
DISCUSSIONIn 1988, Okamoto et al.[3] established a method to classify HBV,and analyzed the complete HBV nucleotide sequences andclassified them into four different HBV genotypes designatedfrom A to D, according to an intergroup divergence of >8%,and an intragroup divergence of <5.6%. Today, HBV has beenclassified into eight different genotypes designated from A toH[4,5,16,17] and HBV genotypes have a pattern of geographicaldistribution[18,19]. Genotype A is prevalent in Northern andCentral Europe, but is also common in North America and sub-Saharan Africa. Genotypes B and C are confined to Asia,genotype D is widespread but is the predominant genotype in
AF241411
AF241410
624
AY057948
D00331
D00329
D00330
AF282917
AB048705
AJ344115
X14193
AB036908
AF405706
AF461357
AB026812
M38454
X52939
AB014398
X59795
X75664
AF280817
AJ344116
X75665
AY040627
AF330110
3266 ISSN 1007-9327 CN 14-1219/ R World J Gastroenterol November 15, 2004 Volume 10 Number 22

the Mediterranean region, while genotype E is found mainly inWest Africa. Genotype F shows the highest divergence amongthe genotypes and is indigenous to aboriginal populations ofthe Americas[20]. Genotype G was found in USA and France[4],genotype H in the Central America[5], and genotypes A, B, Cand D in China. The predominant genotype in China is genotypesB and C[21,22]. The incidence of HCC in Long An County is about 49.9/100 000and the prevalence of HBsAg in the county is 16%[13,23] andmore than 90% of hepatocellular carcinoma (HCC) cases areindividuals positive for HBsAg in serum[12]. In Japan, HBVgenotype C was found to be closely associated with severeliver diseases and the development of HCC[7,24], although youngHCC patients were found to be HBV genotype C in Taiwan[25]. HBV infection is usually diagnosed when the circulatingHBsAg is detected. However, advances in molecular biologytechniques revealed that a low level of HBV DNA could bedetected in serum and liver tissue in some individuals whowere negative for HBsAg[26,27]. Although there are some studieson occult HBV infection, the precise prevalence of this clinicalentity is still unknown. Luo et al.[28] found that the prevalencerate of occult HBV infection in Guangdong and HainanProvinces was 2.0% (6/294) and 3.4% (68/1 995), respectively inthe general population. Bower et al.[29] reported that the prevalencewas 4.3% (11/258) in subjects without liver disease in USA. Inthis study, we found that the prevalence of occult HBV infectionin Long An County was higher (11.5%, 6/52). The mechanismsthat HBV carriers have a low, but stable level of viral replicationremain to be defined. HBV strains might have mutations in Sregion resulting in occult HBV infection[30,31]. This kind ofmutations was found in one of our samples. In addition, thistype of carriers should be added to the typical HBsAg-positivecarriers constituting about 16% of the general population, toestimate more precisely the propotion of asymptomatic HBVcarriers in Long An County. It is clear that the prevalence ofHBV infection in Long An County is in correspondence withits high incidence of HCC. To extend the knowledge of molecular features of naturalHBV isolates, sample No. 624 in this study was selected forwhole genome sequencing. This strain contained 3 215 bases.HBsAg region sequence showed that it belonged to serotypeadw. No special mutation which could change the expressionfunction of viral proteins was found in the sequence of thisisolate. By homology analysis with 23 HBV strains in GenBank,this isolate was found to be closer to the Vietnamese HBVgenotype C strain[32] than to the genotype C isolates fromShanghai in evolution[33], with 97% homology with the Vietnameseisolate. At present, the only explanation about this is that LongAn County is geographically close to Vietnam. In summary, HBV infections in Long An County areattributable to HBV genotypes C. The prevalence of occult HBVinfection in Long An County is higher.
ACKNOWLEDGMENTSWe are very grateful to the Beijing Municipal Committee ofScience and Technology for the financial support in part andthe Center for Disease Prevention and Control of Long AnCounty for their help in collecting samples.
REFERENCES1 Magnius LO, Norder H. Subtypes, genotypes and molecular
epidemiology of the hepatitis B virus as reacted by sequencevariability of the S-gene. Intervirology 1995; 38: 24-34
2 Le Bouvier GL, McCollum RW, Hierholzer WJ Jr, Irwin GR,Krug-man S, Giles JP. Subtypes of Australia antigen and hepa-titis-B virus. JAMA 1972; 222: 928-930
3 Okamoto H, Tsuda F, Sakugawa H, Sastrosoewignjo RI, Imai
M, Miyakawa Y, Mayumi M. Typing hepatitis B virus by ho-mology in nucleotide sequence: comparison of surface antigensubtypes. J Gen Virol 1988; 69: 2575-2583
4 Stuyver L, DeGendt S, VanGeyt C, Zoulim F, Fried M, SchinaziRF, Rossau R. A new genotype of hepatitis B virus: completegenome and phylogenetic relatedness. J Gen Virol 2000; 81:67-74
5 Arauz-Ruiz P, Norder H, Robertson BH, Magnius LO. Geno-type H: a new Amerindian genotype of hepatitis B virus re-vealed in Central America. J Gen Virol 2002; 83: 2059-2073
6 Ding X, Mizokami M, Yao GB, Xu B, Orito E, Ueda R,Nakanishi M. Hepatitis B virus genotype distribution amongchronic hepatitis B virus carriers in Shanghai, China. Intervirology2001; 44 : 43–47
7 Fujie H, Moriya K, Shintani Y, Yotsuyanagi H, Iino S, KimuraS, Koike K. Hepatitis B virus genotypes and hepatocellularcarcinoma in Japan. Gastroenterology 2001; 120: 1564–1565
8 Orito E, Ichida T, Sakugawa H, Sata M, Horiike N, Hino K,Okita K, Okanoue T, Iino S, Tanaka E, Suzuki K, Watanabe H,Hige S, Mizokami M. Geographic distribution of hepatitis Bvirus (HBV) genotype in patients with chronic HBV infection inJapan. Hepatology 2001; 34: 590–594
9 Kao JH, Chen PJ, Lai MY, Chen DS. Hepatitis B genotypescorrelate with clinical outcomes in patients with chronic hepa-titis B. Gastroenterology 2000; 118: 554–559
10 Paterlini P, Gerken G, Nakajima E, Terre S, D’Errico A, GrigioniW. Polymerase chain reaction to detect hepatitis B virus DNAand RNA sequences in primary liver cancers from patientsnegative for hepatitis B surface antigen. N Engl J Med 1990;323: 80-85
11 Paterlini P, Poussin K, Kew M, Franco D, Brechot C. Selectiveaccumulation of the X transcript of hepatitis B virus in patientsnegative for hepatitis B surface antigen with hepatocellularcarcinoma. Hepatology 1995; 21: 313-321
12 Yeh FS, Yu MC, Mo CC, Luo S, Tong MJ, Henderson BE.Hepatitis B virus, aflatoxins, and hepatocellular carcinoma insouthern Guangxi, China. Cancer Research 1989; 49: 2506–2509
13 Ding ZG. Epidemiological study on relationship between hepa-titis B and liver cancer: a prospective study on development ofliver cancer and distribution of HBsAg carriers and liver dam-age persons in Guangxi. Zhonghua Liuxingbingxue Zazhi 1988;9: 220–223
14 Altschul SF, Gish W, Miller W, Myers EW, Lipman DJ. Basiclocal alignment search tool. J Mol Biol 1990; 215: 403–410
15 Strimmer K, Haeseler A. Quartet puzzling: a quartet maxi-mum-likelihood method for reconstructing tree topologies. MolBiol Evolution 1996; 13: 964-969
16 Norder H, Hammas B, Logfdahl S, Courouce AM, MagniusLO. Comparison of the amino acid sequences of nine differentserotypes of hepatitis B surface antigen and genomic classifi-cation of the corresponding hepatitis B virus strains. J Gen Virol1992; 73: 1201-1208
17 Norder H, Courouce AM, Magnius LO. Complete genomes,phylogenetic relatedness, and structural proteins of six strainsof the hepatitis B virus, four of which represent two newgenotypes. Virology 1994; 198: 489-503
18 Nakano T, Lu L, Hu X, Mizokami M, Orito E, Shapiro C,Hadler S, Robertson B. Characterization of hepatitis B virusgenotype among Yuipa Indians in Venezuela. J Gen Virol 2001;82: 359–365
19 Naumann H, Schaefer S, Yoshida CF, Gaspar AM, Repp R,Gerlich WH. Identification of a new hepatitis B virus genotypefrom Brazil that expresses HBV surface antigen subtype adw4. J Gen Virol 1993; 74: 1627-1632
20 Norder H, Hammas B, Lee SD, Bile K, Courouce AM,Mushahwar IK, Magnius LO. Genetic relatedness of hepatitisB viral strains of diverse geographical origin and natural varia-tions in the primary structure of the surface antigen. J Gen Virol1993; 74: 1341-1348
21 Ding X, Mizokami M, Ge XM, Orito E, Iino S, Ueda R, NakanishiM. Different hepatitis B virus genotype distributions amongasymptomatic carriers and patients with liver diseases inNanning, southern China. Hepatology Research 2002; 22: 37-44
22 Xia G, Nainan OV, Jia Z. Characterization and distribution ofhepatitis B virus genotypes and subtypes in 4 provinces of
Fang ZL et al. Hepatitis B virus genotypes and phylogeny 3267

China. Zhonghua Liuxingbingxue Zazhi 2001; 22: 348-35123 Wang SS, Xu ZY, Maynard JE, Prince AM, Beasley RP, Yang
JY, Li YC, Nong YZ. Evaluation of the hepatitis B model immu-nization program in Long An county, China. Guangxi YufangYixue Zazhi 1995; 1: 1-4
24 Orito E, Mizokami M, Sakugawa H, Michitaka K, Ishikawa K,Ichida T, Okanoue T, Yotsuyanagi H, Iino S. A case-controlstudy for clinical and molecular biological differences betweenhepatitis B viruses of genotypes B and C. Hepatology 2001; 33:218–223
25 Kao JH, Chen DS. Hepatitis B virus genotypes and hepatocellu-lar carcinoma in Japan: reply. Gastroenterology 2001; 120: 1565
26 Wang JT, Wang TH, Sheu JC, Shih LN, Lin JT, Chen DS. Detec-tion of hepatitis B virus DNA by polymerase chain reaction inplasma of volunteer blood donors negative for hepatitis B sur-face antigen. J Infect Dis 1991; 163: 397-399
27 Zhang YY, Hansson BG, Kuo LS, Widell A, Nordenfelt E. Hepa-titis B virus DNA in serum and liver is commonly found inChinese patients with chronic liver disease despite the presenceof antibodies to HBsAg. Hepatology 1993; 17: 538-544
28 Luo KX, Zhou R, He C, Liang ZS, Jiang SB. Hepatitis B virusDNA in sera of virus carriers positive exclusively for antibod-ies to the hepatitis B core antigen. J Med Virol 1991; 35: 55–59
29 Bower WA, Xia GL, Gao FX, Nainan OV, Kruszon-Moran D,Margolis HS. Isolated hepatitis B core antibody. Antiviral Ther2000; 5(Suppl 1): B22
30 Blackberg J, Kidd-Ljunggren K. Occult hepatitis B virus afteracute self-limited infection persisting for 30 years without se-quence variation. J Hepatol 2000; 33: 992-997
31 Yamamoto K, Horikita M, Tsuda M, Itoh K, Akahane Y,Yotsumoto S, Okamoto H, Miyakawa Y, Mayumi M. Natu-rally occurring escape mutants of hepatitis B virus with vari-ous mutations in the S gene in carriers seropositive for antibod-ies to hepatitis B surface antigen. J Virol 1994; 68: 2671-2676
32 Hannoun C, Norder H, Lindh M. An aberrant genotype re-vealed in recombinant hepatitis B virus strains from Vietnam.J Gen Virol 2000; 81: 2267–2272
33 Gan RB, Chu MJ, Shen LP, Qian SW, Li ZP. The completenucleotide sequence of the cloned DNA of hepatitis B virussubtype adr in pADR-1. Sci Sin 1987: 507-521
Edited by Ren SY and Wang XL Proofread by Xu FM
3268 ISSN 1007-9327 CN 14-1219/ R World J Gastroenterol November 15, 2004 Volume 10 Number 22

PO Box 2345, Beijing 100023, China World J Gastroenterol 2004;10(22):3269-3273Fax: +86-10-85381893 World Journal of GastroenterologyE-mail: [email protected] www.wjgnet.com Copyright © 2004 by The WJG Press ISSN 1007-9327
• VIRAL HEPATITIS •
Capsule oxymatrine in treatment of hepatic fibrosis due to chronic
viral hepatitis: A randomized, double blind, placebo-controlled,
multicenter clinical study
Yi-Min Mao, Min-De Zeng, Lun-Gen Lu, Mo-Bin Wan, Cheng-Zhong Li, Cheng-Wei Chen, Qing-Chuen Fu, Ji-Yao Wang,Wei-Min She, Xiong Cai, Jun Ye, Xia-Qiu Zhou, Hui Wang, Shan-Ming Wu, Mei-Fang Tang, Jin-Shui Zhu, Wei-Xiong Chen,Hui-Quan Zhang
Yi-Min Mao, Min-De Zeng, Lun-Gen Lu, Shanghai Institute ofDigestive Disease, Renji Hospital, Shanghai Second MedicalUniversity, Shanghai 200001, ChinaMo-Bin Wan, Cheng-Zhong Li, Changhai Hospital, Second MilitaryMedical University, Shanghai 200433, ChinaCheng-Wei Chen, Qing-Chuen Fu, Nanjing Military CommandLiver Disease Research Center, Shanghai 200233, ChinaJi-Yao Wang, Wei-Min She, Zhongshan Hospital, Fudan University,Shanghai 200032, ChinaXiong Cai, Changzheng Hospital, Second Military Medical University,Shanghai 200003, ChinaJun Ye, Shanghai Putuo District Central Hospital, Shanghai 200333,ChinaXia-Qiu Zhou, Hui Wang, Ruijin Hospital, Shanghai Second MedicalUniversity, Shanghai 200025, ChinaShan-Ming Wu, Mei-Fang Tang, Shanghai General Hospital ofInfectious Diseases, Shanghai 200083, ChinaJin-Shui Zhu, Wei-Xiong Chen, Shanghai No.6 People’s Hospital,Shanghai 200230, ChinaHui-Quan Zhang, Shanghai Shibei Hospital, Shanghai 200073, ChinaSupported by Grants From the Key Project of Shanghai MedicalDevelopment Foundation, NO:99ZDI001 and Grants From 1999 YouthLiver Diseases Foundation of Chinese Liver Diseases AssociationCorrespondence to: Yi-Min Mao, M.D., Shanghai Institute ofDigestive Disease, Renji Hospital, Shanghai Second MedicalUniversity, Shanghai 200001, China. [email protected]: +86-21-33070834 Fax:+86-21-63364118Received: 2003-12-17 Accepted: 2004-02-24
Abstract
AIM: To evaluate the efficacy and safety of oxymatrine capsulein treatment of hepatic fibrosis in patients with chronic viralhepatitis.
METHODS: It was a randomized, double blind, placebo-controlled, multicenter clinical study. One hundred and forty-four patients were divided into oxymatrine capsule group(group A) and placebo group (group B).The course was52 wk. Patients were visited once every 12 wk and the lastvisit was at 12 wk after cessation of the treatment. All patientshad liver biopsy before treatment. part of them had a secondbiopsy at the end of therapy. Clinical symptoms, liver functiontest, serum markers of hepatic fibrosis were tested. Ultrasoundevaluation was performed before, during and at the end oftherapy.
RESULTS: One hundred and forty-four patients enrolled inthe study. Of them 132 patients completed the study accordingto the protocol,49 patients had liver biopsy twice (25 patientsin group A and 24 in group B). At the end of therapy, significantimprovements in hepatic fibrosis and inflammatory activitybased on Semi-quantitative scoring system (SSS) wereachieved in group A. The total effective rate of the treatmentwas 48.00%, much higher than that of 4.17% in group B(P<0.05). Significant improvement in serum markers of hepaticfibrosis such as hyaluronic acid (HA) and type III procollagenic
peptide (P III P) in group A was seen (P<0.05). The totaleffective rate of serum markers at the end of therapy in groupA was 68.19%, much higher than that of 34.85% in groupB (P<0.05). The total effective rate of noninvasive markersat the end of therapy in group A was 66.67%, much higherthan that of 30.30% in group B (P<0.05). The rate of adverseevents was similar in two groups.
CONCLUSION: Oxymatrine capsule is effective and safe intreatment of hepatic fibrosis due to chronic viral hepatitis.
Mao YM, Zeng MD, Lu LG , Wan MB, Li CZ, Chen CW, Fu QC,Wang JY, She WM, Cai X, Ye J, Zhou XQ, Wang H, Wu SM,Tang MF, Zhu JS, Chen WX, Zhang HQ. Capsule oxymatrinein treatment of hepatic fibrosis due to chronic viral hepatitis:A randomized, double blind, placebo-controlled, multicenterclinical study. World J Gastroenterol 2004; 10(22): 3269-3273
http://www.wjgnet.com/1007-9327/10/3269.asp
INTRODUCTIONHepatic fibrosis is a kind of compensating and healing responsein the liver to liver injury induced by a variety of causes andalso a common pathological process of many chronic liver diseasescharacterized by hyperplasia and deposition of fibro-connectivetissues. It is essential to block the genesis and progress of hepaticfibrosis[1-5,30,31]. Oxymatrine is a kind of alkaloid extracted from aChinese herb Sophora alopecuraides L. which has been provedto have antihepatic fibrosis effect[6,7,18-20]. In this paper, wereported the clinical study data of oxymatrine capsule in treatmentof hepatic fibrosis in patients with chronic viral hepatitis.
MATERIALS AND METHODSResarch designThis study was a clinical trial characterized by multicentre,randomization, double blinding, and placebo-control. Enrolledpatients were randomly assigned into oxymatrine capsule group(group A) or vacant placebo control group (group B), with 72cases in each group and a treatment course of 52 wk. Thisstudy was conformed to the Good Clinical Practice (GCP) ofChina. The research protocol was discussed and approved bythe Ethic Committee of National Clinical Research Base of Drugsin the Institute of Digestive Disease of Renji Hospital. Informedconsent was obtained from each patient.
Selection of subjectsEnrolled criteria were age: 18-65 years regardless of sex; positiveserum markers of hepatitis B virus (HBV) and hepatitis C virus(HCV) for at least 6 mo before enrollment; abnormal serum valueof alanine transaminase (ALT) twice or more within 6 mo beforeenrollment; liver biopsy examination during 1 mo beforeenrollment indicating the stage of hepatic fibrosis from 1 to 4according to National Criteria of Grading and Staging for chronic

viral hepatitis amended in 1995 and the scores of stage equal ormore than 1 assessed by the semi-quantitative scoring system(SSS) of hepatic fibrosis; total serum bilirubin level less than orequal to 85.5 µmol/L; no history of administrating followingdrugs: antiviral drugs, immunoregulating drugs and otherantifibrotic agents; promising not to receive other systemicantiviral agents, cytotoxic agents, immunoregulators, drugs capableof reducing serum enzyme activity and bilirubin level, andChinese traditional medicines, etc. Following situations shouldbe excluded: patients with positive laboratory test of HIV;uncompensable liver diseases; suggestive of autoimmunediseases with antinuclear antibody (ANA) titer greater than a1:160 dilution; bone marrow inhibition; abnormality of serumcreatinine with a value 1.5 times greater than normal; concurrenceof other associated diseases which might affect the presenttreatment such as unstable diabetes, renal insufficiency, unstableangina pectoris, alcoholic liver disease, epilepsy, obviousmanifestations of neurosis, drug abuser, psychosis, pancreatitis,disability of absorption and malignant disease, and so on; Havingtaken other drugs in clinical trial within 30 d before the firstmedication; hypersensitive to oxymatrine capsule; pregnancyand during breast-feeding period; female conceptive patientsnot adopting any contraceptives.
Treatment procedures and drugsAfter completion of selection and assessment, qualified subjectswere allocated into group A or B randomly. The patients ingroup A took 300 mg oxymatrine capsules orally 3 times a day,and 2 tablets of complex vitamins B and C at the same time for52 wk. The patients in group B took 3 tablets of vacant capsulesinstead of oxymatrine capsules and complex vitamins B and Cat the same frequency as described above for 52 wk. All patientsreceived follow-up once every 12 wk during treatment and werefollowed up at out-patient department 12 wk after treatment.Oxymatrine capsule, vacant placebo capsule, complex vitaminsB and C tablets were manufactured and provided by NingxiaPharmaceutic Institute and Shanghai Green Valley EcologicalEngineering Co.LTD.
Observation of indexes and assessmentClinical manifestations Clinical symptoms and signs weredivided into grades from 0 to 3 according to the symptomaticgrading criteria , evaluated at each follow-up visit, and examined24 and 52 wk after treatment and 12 wk after drug withdrawal.Analysis of blood and urine routines and related liver functionindexes These indexes were evaluated at each follow-up visitand examined 52 wk after treatment and 12 wk after drugwithdrawal.Analysis of serum markers of hepatic fibrosis Tests of serumhyaluronic acid (HA), laminin (LN), type III procollagenicpeptide (p III p), type IV collagen-7S (IV-7S) were fulfilled byMilitary Clinical Immunologic Research Centre of ChangzhengHospital, Second Military Medical University. The above markerswere evaluated before treatment, 24 and 52 wk after treatment,12 wk after drug withdrawal respectively, and examined 24 and52 wk after treatment,12 wk after drug withdrawal, respectively.Imaging examination (type B ultrasound) The detectionincluded 5 indexes: maximal oblique radius of right liver lobe,main trunk diameter of portal vein and its blood flow parametersper minute; width of spleen at the hilus and the diameter of spleenicvein. Ultrasound examination was performed on fixed machinesand by fixed operators and the data were recorded and input incomputers which were read by experts. All the indexes wereevaluated before treatment and 52 wk after therapy, examined52 wk after drug withdrawal.Histopathological detection Histopathological specimens wereindependently observed and assessed based on National Criteriaof Grading and Staging for chronic viral hepatitis amended in
1995 and SSS by 3 pathologists from Department of Pathology,Medical College, Fudan University. The observed results werechecked by another 3 pathologists who did not anticipate inthe study by Kappa test. The reciprocal consistence amongthe above pathologists was satisfactory. The observed results inall patients were evaluated before therapy and part of them wereevaluated 52 wk after therapy. All data were examined 52 wkafter therapy. During treatment and after therapy was terminated, thefollowing events were recorded: combined medication, adversereactions and the compliance of patients.
Assessment of therapeutic effectsIndexes of histopathology The curative effect was evaluatedbased on SSS. Distinctly effective: the scores of hepatic fibrosisbased on SSS from liver biopsy decreased at least 6 scorescompared with that before treatment. Effective: the above scoresdecreased at least 2 scores. Ineffective: the effect did not meetthe effective criteria.Assessment of indexes of noninvasive tests These indexes wereevaluated comprehensively in terms of clinical manifestations,serum liver fibrotic markers and ultrasound detection data.Distinctly effective: any two values among serum liver fibroticindexes decreased by at least 80% compared with that beforetreatment, at least the main trunk diameter of portal vein andsplenic width returned to normal after treatment, clinicalsymptoms and signs disappeared or their total scores decreasedby at least 75% compared with that before treatment. Effective:any two values among serum liver fibrotic indexes decreasedby at least 40% compared with that before treatment, the maintrunk diameter of portal vein and splenic width reduced aftertreatment, clinical symptoms and signs disappeared basicallyor their total scores decreased by at least 25% compared withthat before treatment. Ineffective: the effect did not meet theeffective criteria.
Assessment of safetyAny abnormal clinical manifestations and laboratory testsoccurred during treatment were recorded and divided into 4grades according to the criteria published by WHO and theMinistry of Public Health of China in 1994.
Statistical analysisStatistical analyses were performed by professor Su BH andHe QB from Department of Statistics, Shanghai Second MedicalUniversity, and SAS 6.12 software kit was used.
RESULTSSelected patientsA total of 144 patients satisfied the selection criteria. Of them,12 cases withdrew or were excluded during treatment, 132 casesfulfilled the treatment course according to the required protocol(66 cases in group A and 66 cases in group B). Before treatment,the following general data between two groups were similar(P>0.05, respectively): sex, age, drinking history, duration ofhepatitis, duration of abnormality of liver function and a morethan 2-fold normal elevation of serum ALT, etc. Each qualifiedpatient received liver biopsy before treatment. A total of 49 caseshad a second liver biopsy (25 cases in group A and 24 cases ingroup B).
Analysis of observed indexesClinical symptoms and signs Clinical manifestations in groupA were obviously improved 52 wk after therapy (P<0.05), exceptfor epistaxis (P = 1.0000). Heptomegaly was also improvedsignificantly after therapy (P = 0.0313), symptoms of gum bleeding
3270 ISSN 1007-9327 CN 14-1219/ R World J Gastroenterol November 15, 2004 Volume 10 Number 22

and epistaxis were not improved obviously in group B (P>0.05).Signs of hepatomegaly, splenomegaly and liver palm weresignificantly improved in group B (P<0.05), improvement ofanorexia in group A was greater than that in group B (P = 0.0263).Liver function Indexes of liver function in group A weresignificantly improved 52 wk after treatment (P<0.05) except forserum gamma glutamino transpeptidase (GGT) and TB (P>0.05).In group B, indexes such as serum ALT, AST, TB and alkalinephosphatase (ALP) had no obvious difference before and aftertherapy (P>0.05). Compared with group B, the improvement ofALT and AST in group A was much greater (P = 0.0007 and0.0025). Fifty-two wk after therapy, the normalization rate ofALT in group A was 70.77%, much higher than 39.68% in groupB (P = 0.0003). In groups A and B, 14 out of 46 cases (30.43%)and 12 out of 25 cases (48.00%) had their serum ALT levelsreturned to normal 52 wk after treatment ,and their serum ALTlevels became abnormal again after drug withdrawal.Liver histologic examination Evaluation of hepatic fibrosisbased on SSS: In group A, the scores of hepatic fibrosis aftertherapy were 4.72±5.63, much smaller than 6.76±6.67 beforetherapy (P = 0.0001), while the scores in group B after therapyincreased significantly (P = 0.0009). There was an obviousdifference between two groups (P = 0) (Table 1). Evaluation ofhistolgic inflammatory activity based on SSS: In group A, thescores of histologic activity decreased from 46.08±3.84 beforetreatment to 4.00±2.97 after therapy (P = 0.0002), while the scoresin group B after therapy did not decrease obviously (P = 0.2344).There was an obvious difference between two groups (P = 0008)(Table 2).Evaluation of serum markers of hepatic fibrosis In group A,serum levels of HA, LN, p III p and IV-7S decreased significantly24 and 52 wk after treatment (P<0.05). In group B, serum levelsof LN, p III p and IV-7S also decreased obviously after treatment(P<0.05). However, degrees of improvement in HA and p III p
between two groups were distinctly different (P<0.05). In groupA, except for LN (P = 0.1493), the other 3 liver fibrotic markersincreased significantly 12 wk after drug withdrawal comparedwith that 52 wk after treatment (P<0.05). In group B, except forHA (P = 0.4212), the other markers also increased obviously 12 wkafter drug withdrawal compared with that 52 wk after treatment(P<0.05). The increase of HA in group A was more than that ingroup B (P = 0.0002) and the increase of IV-7S in group B wasmore than that in group A (P = 0.0048).Imaging examination After treatment, the average values ofmain trunk diameters of portal vein and splenic width in groupA obviously decreased (P<0.05). However, in group B, theabove two parameters and the parameters of blood flow volumeper minute of portal vein and diameters of splenic vein all increasedsignificantly compared with those before therapy (P<0.05).The changes in main trunk diameters of portal vein and splenicwidth between two groups were statistically significant (P<0.05).
Analysis of therapeutic effectAssessment of histopathology based on SSS After treatment,the rates of distinct effectiveness and effectiveness in group Awere both 24.00%, and the total effective rate was 48.00%. In groupB, none achieved distinct effectiveness and the effective ratewas only 4.17%; Comparison of the rates of distinct effectivenessand effectiveness between two groups had a significant difference(P = 0.004) (Table 3).Assessment of serum markers of hepatic fibrosis The totaleffective rate of group A 24 and 52 wk after therapy was 57.43%and 68.19%, more than 24.24% and 34.85% of group B (P = 0.0002and 0.0004, respectively). Twelve weeks after treatment, thetotal effective rate of group A was 50.00%, more than 15.16% ofgroup B (P=0.00).Assessment of noninvasive indexes of hepatic fibrosis Aftertreatment, the rates of distinct effectiveness and effectiveness
Mao YM et al. Capsule oxymatrine in treatment of hepatic fibrosis 3271
Table 1 Liver fibrotic scores before and after therapy based on Semi-quantitative Scoring System
Comparison before Comparison within Comparison between therapy group groups
Group Before After Before-after Statistics P Statistics P Statistics P
A(n = 25) 6.76±6.67 4.72±5.63 2.04±2.59 96.0 0.0001B 1.4098 0.1586 4.8834 0(n = 24) 4.13±2.82 6.33±4.04 -2.21±3.72 83.0 0.0009
Table 2 Liver histologic activity scores before and after therapy based on Semi-quantitative Scoring System
Comparison before Comparison within Comparison between therapy group groups
Group Before After Before-after Statistics P Statistics P Statistics P
A(n = 25) 6.08±3.84 4.00±2.97 2.08±2.71 69.5 0.0002B 0.0407 0.9675 3.3543 0.0008(n = 24) 6.08±4.06 6.92±4.17 -0.83±3.38 21.5 0.2344
Table 3 Comparison of histopathology of hepatic fibrosis
Comparison between 2 groupsGroup Distinctly effective Effective Ineffect-ive
Statitics χ2 P
A 6 6 13(n = 25) (24.00%) (24.00%) (52.00%)B 0 1 23 12.6970 0.0004(n = 24) (0.00%) (4.17%) (95.83%)
in group A were respectively 3.03% and 63.64%, and the totaleffective rate was 66.67%. In group B, the rates of distincteffectiveness and effectiveness were respectively 0% and 30.30%,and the total effective rate was 30.30%.The comparison of theabove statistics between two groups had a significant difference(P = 0.0001) (Table 4).
Adverse effectsIn group A, there were 5 patients who suffered from adversedrug reactions and the incidence was 6.94%. The adverse drugreactions mainly included nausea, rash, chest discomfort, fever,epigastric comfort, diarrhea and poor taste, and most of themwere mild or moderate. None of the patients withdrew becauseof adverse drug reactions. In group B, adverse effects occurredin 7 patients and the incidence was 9.72%. The manifestationswere similar to those in group A and 1 patient withdrew becauseof weakness, anorexia, epigastric discomfort after taking drugs.
DISCUSSIONHepatic fibrosis, a precuror of cirrhosis, is a consequence ofsever liver damage that occurred in many patients with chronicliver disease, and involves the abnormal accumulation ofextracellular matrix[3,4,11,12]. Liver fibrosis represents a majorworldwide healthcare burden. Current therapy is limited toremoving the causal agent. This approach has been successfulin some diseases, particularly in haemochromatosis and chronicviral hepatitis[9,10,17,28]. However, for many patients treatmentwas not possible, while other patients presenting to medicalattention were at an advanced stage of fibrosis[8,9]. There istherefore a great need for novel therapies for liver fibrosis.Tremendous insights into the understanding of hepatic fibrosishave taken place over the past ten years. Foremost among theseis the recognition that hepatic stellate cells (formerly known aslipocytes, Ito cells, or fat-storing cells) play a central role basedon their ability to undergo activation following liver injury ofany cause[11,15,16,29]. Hepatic stellate cells have been recognisedto be responsible for most of the excess extracellular matrixobserved in chronic liver fibrosis. The detailed understandingof hepatic stellate cell biology has allowed the rational designof novel antifibrotic therapies[29]. Effective therapy for hepaticfibrogenesis would probably also be multifactorial, based on thebasic mechanisms underlying the fibrogenic process[13,14,21-23]. At present, it is considered that treatment of hepatic fibrosisand antihepatic fibrosis are two different concepts and antifibroticdrugs should act on various parts of the genesis and developmentof hepatic fibrosis. Firstly, as for etiological treatment, oxymatrinecould effectively treat chronic viral hepatitis and promote theserum markers of hepatitis B virus (HBV) and hepatitis C virus(HCV) in chronic hepatitis B and C to convert to negative andreduce serum level of ALT[6,7]. Secondly, oxymatrine could inhibitthe proliferation of hepatic stellate cells (HSC) at the concentrationsof 0.5-16 µg/mL in vitro. In addition, oxygen stress and lipidperoxidation are important mechanisms responsible for hepaticinjury and hepatic stellate cell activation. Therefore, inhibitionof lipid peroxidation is an essential strategy of antihepaticfibrosis[12-16]. By establishing D-galactosamine-induced rat liver
fibrosis model, we observed the effect of oxymatrine on serumand tissue biochemical indexes, content of liver hydroxyline,expression of TGFβ1 mRNA and changes of tissue pathology,the results showed oxymatrine had prophylactic and therapeuticeffects on D-galactosamine induced rat liver fibrosis. This waspartly by protecting hepatocytes and suppressing fibrosisaccumulation through anti-lipoperoxidation[10]. In present study,We found that the scores of hepatic fibrosis after therapy ingroup A were 4.72±5.63, much smaller than 6.76±6.67 beforetherapy, and the scores in group B after therapy increasedsignificantly. There was an obvious difference between two groups.The scores of histological inflammatory activity in group Adecreased from 46.08±3.84 before treatment to 4.00±2.97 aftertherapy, and the scores in group B after therapy did not decreaseobviously. There was an obvious difference between two groupsboth in improvement of histopathology and in improvement ofnoninvasive indexes such as clinical manifestations, serummarkers of hepatic fibrosis[24-27]. Associated indexes of liverfunction and imaging detection indicated that oxymatrine wasan ideal drug of antihepatic fibrosis. It is valuable to pay moreattentions to the basic and clinical research of oxymatrine inorder to explore the accurate mechanisms of its effect on antihepaticfibrosis.
REFERENCES1 Arthur MJ. Pathogenesis, experimental manipulation and treat-
ment of liver fibrosis. Exp Nephrol 1995; 3: 90-952 Brenner DA, Waterboer T, Choi SK, Lindquist JN, Stefanovic
B, Burchardt E, Yamauchi M, Gillan A, Rippe RA. New aspectsof hepatic fibrosis. J Hepatol 2000; 32(Suppl): 32-38
3 Albanis E, Friedman SL. Hepatic fibrosis. Pathogenesis andprinciples of therapy. Clin Liver Dis 2001; 5: 315-334
4 Friedman SL. Molecular mechanisms of hepatic fibrosis andprinciples of therapy. J Gastroenterol 1997; 32: 424-430
5 Rockey DC. The cell and molecular biology of hepaticfibrogenesis. Clinical and therapeutic implications. Clin LiverDis 2000; 4: 319-355
6 Li J, Li C, Zeng M. Preliminary study on therapeutic effect ofoxymatrine in treating patients with chronic hepatitis C.Zhongguo Zhongxiyi Jiehe Zazhi 1998; 18: 227-229
7 Yu YY, Wang QH, Zhu LM, Zhang QB, Xu DZ, Guo YB, WangCQ, Guo SH, Zhou XQ, Zhang LX. A clinical research onoxymatrine for the treatment of chronic hepatitis B. ZhonghuaGanzangbing Zazhi 2002; 10: 280-281
8 Chen Y, Li J, Zeng M, Lu L, Qu D, Mao Y, Fan Z, Hua J. Theinhibitory effect of oxymatrine on hepatitis C virus in vitro.Zhonghua Ganzangbing Zazhi 2001; 9(Suppl): 12-14
9 Yang W, Zeng M, Fan Z, Mao Y, Song Y, Jia Y, Lu L, Chen CW,Peng YS, Zhu HY. Prophylactic and therapeutic effect ofoxymatrine on D-galactosamine-induced rat liver fibrosis.Zhonghua Ganzangbing Zazhi 2002; 10: 193-196
10 Schuppan D, Porov Y. Hepatic fibrosis: From bench to bedside.J Gastroenterol Hepatol 2002; 17(Suppl 3): S300-S305
11 Li D, Friedman SL. Liver fibrogenesis and the role of hepaticstellate cells: new insights and prospects for therapy. JGastroenterol Hepatol 1999; 14: 618-633
12 Poli G. Pathogenesis of liver fibrosis: role of oxidative stress.Mol Aspects Med 2000; 21: 49-98
Table 4 Comparison of noninvasive markers of hepatic fibrosis
Comparison between 2 groupsGroup Distinctly effective Effective Ineffect-ive
Statitics χ2 P
A 2 42 22(n = 66) (3.03%) (63.64%) (33.33%)B 0 20 46 16.2494 0.0001(n = 66) (0.00%) (30.30%) (69.70%)
3272 ISSN 1007-9327 CN 14-1219/ R World J Gastroenterol November 15, 2004 Volume 10 Number 22

13 Poli G, Parola M. Oxidative damage and fibrogenesis. FreeRadic Biol Med 1997; 22: 287-305
14 Bjorneboe A, Bjorneboe GE. Antioxidant status and alcohol-related diseases. Alcohol Alcohol 1993; 28: 111-116
15 Tsukamoto H, Rippe R, Niemela O, Lin M. Roles of oxidativestress in activation of Kupffer and Ito cells in liver fibrogenesis.J Gastroenterol Hepatol 1995; 10(Suppl 1): S50-53
16 Kim KY, Choi I, Kim SS. Progression of hepatic stellate cellactivation is associated with the level of oxidative stress ratherthan cytokines during CCl4-induced fibrogenesis. Mol Cells 2000;10: 289-300
17 Dong Y, Xi H, Yu Y, Wang Q, Jiang K, Li L. Effects of oxymatrineon the serum levels of T helper cell 1 and 2 cytokines and theexpression of the S gene in hepatitis B virus S gene transgenicmice: a study on the anti-hepatitis B virus mechanism ofoxymatrine. J Gastroenterol Hepatol 2002; 17: 1299-1306
18 Xiang X, Wang G, Cai X, Li Y. Effect of oxymatrine on murinefulminant hepatitis and hepatocyte apoptosis. Chin Med J 2002;115: 593-596
19 Song J, Wang LL, Zhu L, Zhong HM, Yao P. Effects ofoxymatrine on procollagen metabolism and its gene expressionin experimental fibrotic rats. Zhonghua Ganzangbing Zazhi 2003;11: 697
20 Liu J, Manheimer E, Tsutani K, Gluud C. Medicinal herbs forhepatitis C virus infection: a Cochrane hepatobiliary system-atic review of randomized trials. Am J Gastroenterol 2003; 98:538-544
21 Coutinho EM, Barros AF, Barbosa A Jr, Oliveira SA, Silva LM,Araujo RE, Andrade ZA. Host nutritional status as a contribu-tory factor to the remodeling of schistosomal hepatic fibrosis.Mem Inst Oswaldo Cruz 2003; 98: 919-925
22 Hui JM, Sud A, Farrell GC, Bandara P, Byth K, Kench JG,McCaughan GW, George J. Insulin resistance is associated with
chronic hepatitis C and virus infection fibrosis progression.Gastroenterology 2003; 125: 1695-1704
23 Perrillo RP. Management of the patient with hepatitis B virus-related cirrhosis. J Hepatol 2003; 39(Suppl 1): S177-180
24 Kim CW, Yoon SK, Jo BS, Shin JY, Jang JW, Choi JY, Han NI,Lee CD, Chung KW, Sun HS. Prediction of hepatic fibrosisusing serum hyaluronic acid in patients with chronic liverdisease. Korean J Gastroenterol 2003; 42: 510-518
25 Tang M, Potter JJ, Mezey E. Activation of the human alpha1(I) collagen promoter by leptin is not mediated by transform-ing growth factor beta responsive elements. Biochem BiophysRes Commun 2003; 312: 629-633
26 Xu GG, Luo CY, Wu SM, Wang CL. The relationship betweenstaging of hepatic fibrosis and the levels of serum biochemistry.Hepatobiliary Pancreat Dis Int 2002; 1: 246-248
27 Xie SB, Yao JL, Zheng SS, Yao CL, Zheng RQ. The levels ofserum fibrosis marks and morphometric quantitative mea-surement of hepatic fibrosis. Hepatobiliary Pancreat Dis Int 2002;1: 202-206
28 Xie Y, Zhao H, Dai WS, Xu DZ. HBV DNA level and antigenconcentration in evaluating liver damage of patients with chronichepatitisB. Hepatobiliary Pancreat Dis Int 2003; 2: 418-422
29 Oakley F, Trim N, Constandinou CM, Ye W, Gray AM, FrantzG, Hillan K, Kendall T, Benyon RC, Mann DA, Iredale JP. Hepa-tocytes express nerve growth factor during liver injury: evi-dence for paracrine regulation of hepatic stellate cell apoptosis.Am J Pathol 2003; 163: 1849-1858
30 Kondou H, Mushiake S, Etani Y, Miyoshi Y, Michigami T,Ozono K. A blocking peptide for transforming growth factor-beta1 activation prevents hepatic fibrosis in vivo. J Hepatol2003; 39: 742-748
31 Dodig M, Mullen KD. New mechanism of selective killing ofactivated hepatic stellate cells. Hepatology 2003; 38: 1051-1053
Edited by Wang XL and Xu FM
Mao YM et al. Capsule oxymatrine in treatment of hepatic fibrosis 3273

PO Box 2345, Beijing 100023, China World J Gastroenterol 2004;10(22):3274-3277Fax: +86-10-85381893 World Journal of GastroenterologyE-mail: [email protected] www.wjgnet.com Copyright © 2004 by The WJG Press ISSN 1007-9327
• H pylori •
Neither gastric topological distribution nor principle virulence genes
of Helicobacter pylori contributes to clinical outcomes
Yan Wing Ho, Khek Yu Ho, Felipe Ascencio, Bow Ho
Yan Wing Ho, Bow Ho, Department of Microbiology, Faculty ofMedicine, National University of Singapore, SingaporeKhek Yu Ho, Department of Medicine, Faculty of Medicine, NationalUniversity of Singapore, SingaporeFelipe Ascencio, Departamento de Patologia Marina, Centro deInvestigaciones Biologicas del Noroeste (CIBNOR), La Paz, MexicoYan Wing Ho, is a National University of Singapore Research ScholarSupported by NMRC Grant , No. 0415/2000, R-182-000-037-213Correspondence to: Bow Ho, Department of Microbiology, Facultyof Medicine, National University of Singapore, 5 Science Drive 2,Singapore 117597, Republic of Singapore. [email protected]: +65-68743672 Fax: +65-67766872Received: 2004-02-27 Accepted: 2004-04-29
Abstract
AIM: Studies on Helicobacter pylori (H pylori) and gastrodu-odenal diseases have focused mainly on the distal sites ofthe stomach, but relationship with the gastric cardia islacking. The aim of this study is to determine if the gastrictopology and genotypic distribution of H pylori were associatedwith different upper gastrointestinal pathologies in a multi-ethnic Asian population.
METHODS: Gastric biopsies from the cardia, body/corpusand antrum were endoscoped from a total of 155 patientswith dyspepsia and/or reflux symptoms, with informedconsent. H pylori isolates obtained were tested for thepresence of 26kDa, ureC, cagA, vacA, iceA1, iceA2 andbabA2 genes using PCR while DNA fingerprints weregenerated using random amplification polymorphic DNA(RAPD).
RESULTS: H pylori was present in 51/155 (33%) of patientsstudied. Of these, 16, 15 and 20 were isolated from patientswith peptic ulcer diseases, gastroesophageal reflux diseasesand non-ulcer dyspepsia, respectively. Of the H pylori positivepatients, 75% (38/51) had H pylori in all three gastric sites.The prevalence of various genes in the H pylori isolateswas shown to be similar irrespective of their colonizationsites as well as among the same site of different patients.The RAPD profiles of H pylori isolates from different gastricsites were highly similar among intra-patients but variedgreatly between different patients.
CONCLUSION: Topographic colonization of H pylori andthe virulence genes harboured by these isolates have nodirect bearing to the clinical state of the patients. In multi-ethnic Singapore, the stomach of each patient is colonizedby a predominant strain of H pylori, irrespective of the clinicaldiagnosis.
Ho YW, Ho KY, Ascencio F, Ho B. Neither gastric topologicaldistribution nor principle virulence genes of Helicobacter pylori
contributes to clinical outcomes. World J Gastroenterol 2004;10(22): 3274-3277
http://www.wjgnet.com/1007-9327/10/3274.asp
INTRODUCTIONHelicobacter pylori (H pylori) is a common gastric pathogenthat has infected more than 50% of the world’s population[1]. Itis the major aetiological agent of chronic active gastritis and isgenerally accepted as being the primary cause of peptic ulcerdisease and a carcinogenic factor for gastric cancer (GC)[2].However, only a minority of H pylori infected subjects developsthese diseases. This has led to the suggestion that clinicalsequelae that develop may be dependent upon differentiallyexpressed bacterial determinants, e.g., bacterial virulence genes:cagA, vacA, iceA1, iceA2, babA2[3-5]. In many parts of Asia,the prevalence of cagA and vacA strains is high regardless of thepresence or absence of disease states[6]. This limits the usefulnessof using these genes as markers to predict clinical outcome.Instead, other factors like host susceptibility as well as specificinteractions between a particular strain and its host that occurduring decades of coexistence might have contributed to anincreased risk of developing certain clinical manifestations[7]. Our current knowledge on the epidemiology of the organismis predominantly based on data obtained from serologic studies.It has also been reported that a single strain of H pylori predominatesthe gastric antrum and corpus of infected patients in Singapore[8].However, there is a need to study whether the topographicdistribution of H pylori genotypes in various gastric sites inpatients of different ethnic origins affects the disease state. Beingan Asian country with a multi-ethnic population, Singapore issuitable for this investigation.
MATERIALS AND METHODSPatientsConsecutive patients with dyspepsia and/or reflux symptomspresenting for upper gastrointestinal endoscopic examinationto one of the authors (KYH) and who have not been exposed toantibiotics, proton pump inhibitors (PPI) or bismuth compoundswithin the past four week were invited to participate in the study.Patients who previously had been treated for H pylori infection,patients who refused gastric biopsies, patients who were unableto give consent because of age or mental illness and patients inwhom gastric and oesophageal biopsies were contraindicated(e.g., coagulopathy, oesophageal varices and severe co-morbidity),subjects who were pregnant and those who were <18 years old,were excluded. Informed consent was obtained from each patient. A total of 155 patients were included in the study. The patientpopulation comprised 122 (79%) Chinese, 17 (11%) Indians, 8(5%) Malays and 8 (5%) subjects of other ethnicities. Of these,95 (61%) were males and 60 (39%) females. The mean age was48.4±15.5 (range, 24-88) years. Based on clinical history andendoscopic examination, patients were classified into the followinggroups: gastroesophageal reflux disease (GERD) (n = 50), pepticulcer disease (PUD) (n = 36) and non-ulcer dyspepsia (NUD)(n = 69). GERD was defined as the presence of predominantsymptoms of reflux, e.g., heartburn, acid regurgitation and/orthe presence of any length of mucosal break in the oesophagusdue to gastroesophageal reflux. NUD was defined as patientswith neither a history of GERD nor endoscopic evidence oforganic pathologies. PUD refers to patients who were either

diagnosed upon endoscopy as suffering from gastric ulcers(ulcers at the corpus) or duodenal ulcers (ulcers at the antrum). Atotal of 465 biopsy specimens were obtained from the 155 patients.
EndoscopyAfter an overnight or six hour fast, upper gastrointestinalendoscopy was performed according to standard technique.From each patient, one biopsy specimens was obtained usingsterilized standard biopsy forceps from each of the three sitesof the stomach: the cardia just below the z-line, the middlegastric corpus and the antrum within 2 cm of the pylorus, inthat order. The biopsy forceps were thoroughly cleaned withalcohol swaps between biopsies to avoid contamination betweenspecimens. The biopsies were transported in 0.85% sterile salineto the microbiological laboratory for processing within 6 h.
H pylori cultureEach biopsy specimen was homogenised aseptically in 500 µLof Brain Heart Infusion Broth (BHI, Oxoid Ltd., Basingstoke,UK) enriched with 4 g/L yeast extract (Oxoid Ltd., Basingstoke,UK). Approximately 100 µL homogenised specimens in BHIbroth were inoculated onto H pylori selective chocolate bloodagar plates and non-selective chocolate blood agar platesrespectively. The selective blood chocolate agar was supplementedwith 3 mg/mL vancomycin, 5 mg/mL trimethoprim, 10 mg/mLnalidixic acid and 2 mg/mL amphotericin B. All the antibioticswere from Sigma-Aldrich Chemie, Steinheim, Germany. Theplates were incubated at 37 for up to 14 d in an incubator(Forma Scientific, USA) containing 50 mL/L CO2. Aliquots of 50 µL of BHI-biospy suspension were eachinoculated into catalase reagent, oxidase reagent and 20 g/Lurea solution for their respective testing. An isolate wasidentified as H pylori if minute (-1 mm in diameter) roundedtranslucent colonies with gram-negative S-shaped motile cellsthat exhibited positive catalase, oxidase and urease activities.For this study, a patient was considered positive for H pylori ifthe organism was isolated from any of the three gastric sites.
Genotyping of H pyloriThe DNA of each 3-d old H pylori culture was extractedaccording to the method as described by Hua et al.[8]. A 50 ngworking stock of DNA was used to amplify 26kDa[9], ureC[10],cagA[11], vacA[12], iceA1[5], iceA2[5] and babA2[4] genes accordingto the protocol as described by Zheng et al.[6] using the specific
forward and reverse primers for each of the corresponding genes(Table 1). The DNA fingerprint of the H pylori was obtained byPCR using the universal primer, 5’- AACGCGCAAC-3’ andamplified according to protocol as described by Hua et al.[13].The PCR products obtained were electrophoresed and the ethidiumbromide stained gels[13] were then photographed with filteredUV illumination on Chemi Genius2 (SynGene, Cambridge, UK).
Statistical CalculationThe significance of the results obtained was calculated usingSPSS v.10 for Windows (SPSS, Chicago IL) to determine thePearson chi-square whereby a P value <0.05 was considered toindicate statistical significance.
RESULTSH pylori isolates in various clinical groupsOf the 155 patients studied, 51 (33%) were found to harbourH pylori in at least one of the 3 gastric biopsy sites. In all, 43, 47and 44 isolates were obtained from gastric antrum, corpus andcardia respectively, giving a total of 134 isolates. H pylori waspresent in 16/36 (44%) PUD patients as compared with 15/50(30%) GERD patients (P = 0.169) and 20/69 (29%) NUD patients(P = 0.113) (Table 2).
Table 2 Relationship between H pylori status and disease states
Groups No. of No. of No. of P patients biopsies H pylori (+)
PUD 36 108 16 (44%) -GERD 50 150 15 (30%) 0.169NUD 69 207 20 (29%) 0.113
PUD, peptic ulcer disease; GERD, gastroesophageal refluxdisease; NUD, non-ulcer dyspepsia. All test values were cal-culated with respect to PUD; P<0.05 indicates statisticalsignificance.
Relationship between topographic distribution of H pyloriisolates and clinical outcomesOf the 51 H pylori positive patients, 38 (75%) showed thepresence of H pylori in all the three gastric sites while 1 (1%), 2(4%) and 4 (8%) had H pylori isolated from antrum & corpus,antrum & cardia, and corpus & cardia, respectively. H pylori
Table 1 Primer sequences of genes of interest
Region Primer Nucleotide sequence (5’ 3’) PCR product (bp) Reference
26kDa 26kDa-F TGGCGTGTCTATTGACAGCGAGC 298 926kDa-R CCTGCTGGGCATACTTCACCAAG
ureC ureC-F AAGCTTTTAGGGGTGTTAGGGGTTT 294 10ureC-R AAGCTTACTTTCTAACACTAACGC
cagA cagA-F AATACACCAACGCCTCCAAG 400 11cagA-R TTGTTGCCGCTTTTGCTCTC
vacA vacA-F GCTTCTCTTACCACCAATGC 1160 12vacA-R TGTCAGGGTTGTTCACCATGm2-R CATAACTAGCGCCTTGCAC
iceA1 iceA1-F GTGTTTTTAACCAAAGTATC 246 5iceA1-R CTATAGCCAGTCTCTTTGCA 5
iceA2 iceA2-F GTTGGGTDTDTCACAATTTAT 229/334 5iceA2-R TTGCCCTATTTTCTAGTAGGT 5
babA2 babA2-F AATCCAAAAAGGAGAAAAAGTATGAAA 831 4babA2-R TGTTAGTGATTTCGGTGTAGGACA 4
F: forward primer R: reverse primer.
Ho YW et al. Gastric topology and genotype of H pylori 3275

was isolated from a single site of the stomach in 6 (12%) patients,among which 2 isolates were from the antrum and 4 were fromthe corpus. This topographical pattern of H pylori colonizationwas observed in all the patients irrespective of the underlyingclinical diagnosis.
Relationship between topographic distribution of H pylori genesof interest and clinical outcomesAll the H pylori isolates possessed the 26kDa gene and theureC genes. The prevalence of virulence genes of interest werepresent in equal ratios in all the H pylori isolates obtained fromall the 3 different gastric biopsy sites: 74-81% for cagA and 80-86% for vacA; 53-59% for iceA1 and 36-42% for babA2regardless of the underlying clinical diagnosis. However, theiceA2 gene was present less frequently, at 20-26% of the H pyloriisolates. It is noted that the difference in gene frequency betweenthe various sites was also not statistically significant (Table 3). Similar observation was noted with respect to the distributionof virulence genes of H pylori isolated from the same site amongthe different disease groups. The prevalence for each virulencegene within the same site was highly similar. No significantassociation of the virulence gene was found to be associatedwith a particular biopsied site, regardless of the disease state,with the exception of cagA in isolates from the corpus of thestomach of GERD patients (Table 4).
Table 3 Anatomical location of the 134 H pylori isolates andtheir virulence genes
Antrum (%) Body/Corpus (%) Cardia(%) n = 43 n = 47 n = 44
Clinical Diagnosis PUD 12 (33) 15 (42) 12 (33) GERD 13 (26) 15 (30) 14 (28) NUD 18 (25) 17 (24) 18 (26)Genotype 26kDa 43 (100) 47 (100) 44 (100) ureC 43 (100) 47 (100) 44 (100) cagA 35 (81) 35 (74) 33 (75) vacA 37 (86) 38 (81) 35 (80) iceA1 25 (58) 25 (53) 26 (59) iceA2 10 (23) 12 (26) 9 (20) babA2 18 (42) 20 (38) 16 (36)
PUD, peptic ulcer disease; GERD, gastroesophageal refluxdisease; NUD, non-ulcer dyspepsia. All test values were calcu-lated with respect to gastric antrum and none were significant.
Relationship between topographic distribution of H pylori strainbased on RAPD fingerprinting and clinical outcomesFor comparison, differences in 2 or more bands of the RAPDprofile are considered different while variations in band intensitywere not taken into account. On this basis, the RAPD profilesof all the H pylori strains isolated showed an overall similarityin profiles within individual patients, with minor differences suchas the presence or absence of a single band. However, distinctdifferences in the DNA profiles were observed between patients(Figure 1). In this study, no comparison could be made in 6patients since H pylori was isolated from only one site of thestomach in these patients.
Figure 1 PCR-based RAPD patterns of H pylori isolated from 3gastric sites of 4 individual patients. Lane1: λHindIII M marker,Lane 14: 1 kb M marker; Lane 2-4, 5-7, 8-10, 11-13 for patients 1,2, 3 and 4 respectively. A: antrum; B: body; C: cardia.
DISCUSSIONIt is noted that 50% of the world’s population are infected withH pylori but only a small proportion manifest differentgastroduodenal diseases[14]. One of the factors contributing tothis phenomenon could be the patchy distribution of H pyloriin different gastric sites of the stomach As most of the earlierstudies focused on H pylori isolated from the distal sites ofthe stomach[8,15], the present study shows that H pylori isolatesobtained from all the 3 gastric sites, namely cardia, corpus andantrum, in 38/51 (75%) H pylori patients were similar genotypically.Care was taken in cleaning and disinfecting the biopsy forcepsbetween biopsies to avoid contamination between specimens.The results imply that H pylori colonises the entire stomachinstead of a predominant site in three quarters of our H pyloripositive patients, irrespective of the underlying clinical diagnosis.The finding suggests that the site of H pylori colonization ortopographic distribution does not contribute significantly tothe outcome of the infection.
Table 4 Distribution of virulence genes of 134 H pylori isolates from the same anatomical site of different patient groups
Isolates 26kDa (%) ureC (%) cagA (%) vacA (%) iceA1(%) iceA2(%) babA2(%)
Antrum PUD 12 12 (100) 12 (100) 9 (75) 10 (83) 6 (50) 4 (33) 6 (50) GERD 13 13 (100) 13 (100) 11 (85) 11 (85) 7 (54) 2 (15) 6 (46) NUD 18 18 (100) 18 (100) 15 (83) 16 (89) 12 (67) 4 (22) 6 (33)Body/Corpus PUD 15 15 (100) 15 (100) 9 (60) 10 (67) 6 (40) 5 (33) 7 (47) GERD 15 15 (100) 15 (100) 14 (93)1 14 (93) 8 (53) 3 (20) 8 (53) NUD 17 17 (100) 17 (100) 12 (71) 14 (82) 11 (65) 4 (24) 5 (29)Cardia PUD 12 12 (100) 12 (100) 9 (75) 11 (92) 5 (42) 2 (17) 3 (25) GERD 14 14 (100) 14 (100) 12 (86) 11 (79) 8 (57) 2 (14) 7 (50) NUD 18 18 (100) 18 (100) 12 (67) 13 (72) 13 (72) 5 (28) 7 (39)
PUD, peptic ulcer disease; GERD, gastroesophageal reflux disease; NUD, non-ulcer dyspepsia. All test values were calculated withrespect to PUD. 1Indicates statistical significance (P = 0.031).
3276 ISSN 1007-9327 CN 14-1219/ R World J Gastroenterol November 15, 2004 Volume 10 Number 22
1 2 3 4 5 6 7 8 9 10 11 12 13 14

While studies in Europe suggested that virulence genes, e.g.,cagA and vacA affect the clinical outcome of H pylori infection[3,5],the present study confirms previous studies carried out in Asiancountries[6,15] that showed a high prevalence of cagA and vacAgenes regardless of the clinical outcome. This study comprisedSingapore patients of various ethnicities (Chinese, Malays,Indians and other races), also shows that each of the virulencegenes, i.e., cagA, vacA, iceA1, iceA2 and babA2 were equallydistributed in H pylori isolates obtained from all the threeanatomical sites studied regardless of the disease states. Similarly,comparisons of these genes from the same anatomical site ofdifferent patients showed no significant presence, except forcagA in the corpus of GERD isolates. However, it is importantto point out that the number of isolates obtained from each isrelatively low (n 18), regardless of the disease state. Assuch, the significant presence of cagA in the corpus of GERDpatients needs further analysis with a larger pool of samplesto confirm conclusively its contribution to the onset of GERD.The data therefore suggest that virulence genes and theirtopographic distribution do not contribute to the clinicalstatus, at least in the Singapore population. This studysupports the earlier reports[15-17] that identifying such virulencegenes in order to predict clinical outcome may be of limitedvalue in Asian H pylori isolates. The finding that RAPD profiles of the H pylori isolates weresimilar from 3 different anatomical sites (antrum, corpus &cardia) of each patient further strengthens our earlier study[9]
where isolates from 2 sites (antrum & corpus) were identical.This finding is complemented by the similar status of presenceof various virulence genes in these isolates obtained from therespective patients. As such, the isolation of a strain from anygastric site in a single patient could be taken as representativeof H pylori infection present in the H pylori infected gastricenvironment. This study, which included consecutive patients withdyspepsia and/or reflux symptoms showed a lower frequencyof PUD as compared with that of GERD. H pylori was found inonly 44% of patients with PUD. This seems to run counter tothe generally held view that H pylori occurs frequently inAsians patients with PUD[13]. However, this finding is supportedby an earlier study from the same unit[18] showing the frequencyof reflux oesophagitis was increasing while that of duodenalulceration was decreasing in Singapore. The high frequency ofpatients with GERD in this study also relates to the fact that theendoscopist (KYH) sees most of the GERD patients in thehospital. The decreasing frequency of H pylori associatedpeptic ulcers was reported to be attributed to the increasingproportion of ulcers due to NSAID use[19]. In summary, the present study shows that in Singapore, thetopographic colonization of H pylori and their virulence geneswithin the host stomach do not play a significant role in theclinical manifestations of H pylori infection. This study alsodemonstrates that in Singapore, which has a multiethnic Asianpopulation, the stomach of each patient with dyspeptic and/orreflux symptoms is colonized by a single predominant strain ofH pylori, irrespective of the site of isolation and the clinicaldiagnosis of the patient. We suggest that the pathogenesis ofH pylori induced gastroduodenal diseases is due to a morecomplex mechanism possibly involving host-pathogen interaction,environmental and dietary factors.
REFERENCES1 Everhart JE. Recent developments in the epidemiology of
Helicobacter pylori. Gastroenterol Clin North Am 2000; 29: 559-5782 Go MF. Review article: natural history and epidemiology of Helicobacter
pylori infection. Aliment Pharmacol Ther 2002; 16(Suppl 1): 3-153 Arents NLA, Van Zwet AA, Thijs JC, Kooistra-Samid AMD,
van Slochteren R, Degener JE, Kleibeuker JH, van Doorn LJ. Theimportance of vacA, cagA and iceA genotypes of Helicobacterpylori infection in peptic ulcer disease and gastro-esophagealreflux disease. Am J Gastroenterol 2001; 96: 2603-2608
4 Gerhard M, Lehn N, Neumayer N, Boren T, Rad R, Schepp W,Miehlke S, Classen M, Prinz C. Clinical relevance of theHelicobacter pylori gene for blood-group antigen-binding adhesin.Proc Natl Acad Sci U S A 1999; 96: 12778-12783
5 van Doorn LJ, Figueiredo C, Sanna R, Plaiser A, SchneebergerP, DeBoer W, Quint W. Clinical relevance of the cagA, vacA andiceA status of Helicobacter pylori. Gastroenterology 1998; 115: 58-66
6 Zheng PY, Hua J, Yeoh KG, Ho B. Association of peptic ulcerwith increased expression of Lewis antigen but not cagA, iceAand vacA in Helicobacter pylori isolates in an Asian population.Gut 2000; 47: 18-22
7 Peek RM Jr. The biological impact of Helicobacter pyloricolonization. Semin Gastreointest Dis 2001; 12: 151-166
8 Hua J, Ling KL, Ng HS, Ho B. Isolation of a single strain ofHelicobacter pylori from the antrum and body of individualpatients. Eur J Gastroenterol Hepatol 2000; 12: 1129-1134
9 Hammar M, Tyszkiewicz T, Wadstrom T, O’Toole PW. Rapiddetection of Helicobacter pylori in gastric biopsy material bypolymerase chain reaction. J Clin Microbiol 1992; 30: 54-58
10 Labigne A, Cussac V, Courcoux P. Shuttle cloning and nucle-otide sequence of Helicobacter pylori genes responsible for ure-ase activity. J Bacteriol 1991; 173: 1920-1931
11 Lage AP, Godfroid E, Fauconnier A, Burette A, Butzler JP,Bollen A, Glupczynski Y. Diagnosis of Helicobacter pylori infec-tion by PCR: comparison with other invasive techniques anddetection of cagA found in gastric biopsy specimens. J ClinMicrobiol 1995; 33: 2752-2756
12 Xiang Z, Censini S, Bayeli PF, Telford JL, Figura N, RappuoliR, Covacci A. Analysis of expression of CagA and VacA viru-lence factors in 43 strains of Helicobacter pylori reveals thatclinical isolates can be divided into 2 major types and thatCagA is not necessary for expression of the vacuolatingcytotoxin. Infect Immun 1995; 63: 94-98
13 Hua J, Ho B. Is the coccoid form of Helicobacter pylori viable?Microbios 1996; 87: 103-112
14 Hocker M, Hohenberger P. Helicobacter pylori virulence fac-tors-1 part of a big picture. Lancet 2003; 362: 1231-1233
15 Kim SY, Woo CW, Lee YM, Son BR, Kim JW, Chae HB, Youn SJ,Park SM. Genotyping cagA, vacA subtype, iceA1, babA of Helicobacterpylori isolates from Korean patients, and their association withgastroduodenal diseases. J Korean Med Sci 2001; 16: 579-584
16 Kim JM, Kim JS, Jung HC, Song IS, Kim CY. Virulence factorsof Helicobacter pylori in Korean isolates do not influenceproinflammatory cytokine gene expression and apoptosis inhuman gastric epithelial cells, nor do these factors influence theclinical outcome. J Gastroenterol 2000; 35: 898-906
17 Park SM, Park J, Kim JG, Cho HD, Cho JH, Lee DH, Cha YJ.Infection with Helicobacter pylori expressing the cagA gene is notassocatied with an increase risk of developing peptic ulcer dis-ease in Korean patients. Scand J Gastroenterol 1998; 33: 923-927
18 Ho KY, Gwee KA, Yeoh KG, Lim SG, Kang JY. Increasing fre-quency of reflux esophagitis in Asian patients. Gastroenterology2000; 118: A1246
19 Ong TZ, Ho KY. The increasing frequency of non-Helicobacterpylori peptic ulcer disease in an Asian country is related toNSAID use. Gastrointestinal Endoscopy 2003; 57: AB153
Edited by Pan BR and Zhang JZ Proofread by Xu FM
Ho YW et al. Gastric topology and genotype of H pylori 3277

PO Box 2345, Beijing 100023, China World J Gastroenterol 2004;10(22):3278-3283Fax: +86-10-85381893 World Journal of GastroenterologyE-mail: [email protected] www.wjgnet.com Copyright © 2004 by The WJG Press ISSN 1007-9327
• H pylori •
A novel genetic polymorphism of inducible nitric oxide synthase is
associated with an increased risk of gastric cancer
Jing Shen, Run-Tian Wang, Li-Wei Wang, Yao-Chu Xu, Xin-Ru Wang
Jing Shen, Yao-Chu Xu, Xin-Ru Wang, Department of Epidemiology& Biostatistics, School of Public Health, Nanjing Medical University,Nanjing 210029, Jiangsu Province, ChinaRun-Tian Wang, Health Science Center, Peking University, Beijing100083, ChinaLi-Wei Wang, Yangzhong Cancer Research Institute, Yangzhong212200, Jiangsu Province, ChinaSupported by Grants From the National Natural Science Foundationof China (30170827 to Jing. Shen and 30070671 to Run-Tian Wang)Correspondence to: Jing Shen, Department of Environmental HealthSciences, Mailman School of Public Health, Columbia University,701 West 168th St (Room 505), New York, NY 10032,USA. [email protected]: +212-305-8158 Fax: +212-305-5328Received: 2003-07-12 Accepted: 2003-10-12
Abstract
AIM: Inducible nitric oxide synthase (iNOS) plays a centralrole in the pathway of reactive oxygen and nitrogen speciesmetabolism when Helicobacter pylori (H pylori) infectionoccurs in humans. iNOS Ser608Leu allele, a novel geneticpolymorphism (C/T) occurring within exon 16 of the iNOSreductase domain, may have a dramatic effect on theenzymatic activity. The aim of this study was to determinewhether iNOS C/T polymorphism was associated withincreased susceptibility to gastric cancer.
METHODS: We conducted a population based case-controlstudy in a high gastric cancer incidence area, Yangzhong,China. Questionnaires from 93 patients with intestinal typegastric cancer (IGC), 50 with gastric cardia cancer (GCC)and 246 healthy controls were obtained between 1997 and1998, and iNOS genotyping was carried out. Odds ratios(ORs), interaction index (γ), and 95% confidence intervalsfor the combined effects of iNOS genotype and H pylori
infection, cigarette smoking or alcohol drinking were estimated.
RESULTS: The frequency of (CT+TT) genotypes was higherin cases than in control group (24.48% vs 23.17%), but thedifference was not statistically significant. After adjustingfor age and gender, past cigarette smokers with (CT+TT)genotypes had a significantly increased risk of IGC (OR = 3.62,95% CI: 1.23-10.64), while past alcohol drinkers with(CT+TT) genotypes had a significantly increased risk ofGCC (OR = 3.33, 95% CI: 1.14-9.67). H pylori CagA negativesubjects with (CT+TT) genotypes had a significantly increasedrisk of both IGC and GCC (OR = 2.19 and 3.52, respectively).
CONCLUSION: iNOS Ser608Leu allele may be a potentialdeterminant of susceptibility to cigarette -alcohol inducedgastric cancer, but larger studies are needed to confirm theobservations.
Shen J, Wang RT, Wang LW, Xu YC, Wang XR. A novel geneticpolymorphism of inducible nitric oxide synthase is associatedwith an increased risk of gastric cancer. World J Gastroenterol
2004; 10(22): 3278-3283
http://www.wjgnet.com/1007-9327/10/3278.asp
INTRODUCTIONOn a global scale, gastric cancer remains the world’s secondmost common malignancy. There is a substantial internationalvariation in gastric cancer incidence with the highest rates reportedfrom China, Japan and other Eastern Asian countries[1]. Thediscovery of Helicobacter pylori (H pylori) in the early 1980 shas been proven to be a turning point in understanding thepathogenesis of this malignancy. A major advance in this fieldcame with the recognition that chronic H pylori infection couldinduce physiologic and morphologic changes within the gastricmilieu, which increase the risk of neoplastic transformation[2].It has been widely accepted that chronic H pylori infectioninduces hypochlorhydria and gastric atrophy, both of whichare precursors of gastric cancer[2]. Epidemiological studies havealso indicated that infection with H pylori is considered as arisk factor for gastric cancer[3,4] and the WHO IARC has classifiedthis bacterium as a definite biological carcinogen[5]. However,while the majority of infected individuals develop no significantclinical disease, others develop two kinds of divergent clinicaloutcomes-peptic ulcer disease and gastric cancer[2]. The reasonsfor developing these two extreme phenotypes, especiallyimportant in gastric cancer, have remained poorly understood,and are not explained by bacterial virulence factors alone[2].This highlights the need to explore potential candidate genesof the host in the pathways involved in the natural history ofH pylori infection and its interactions with other risk factors inthe development of gastric cancer in a high-risk population. The inducible form of nitric oxide (NO) synthase (iNOS) isone of the most important enzymes involved in the pathway ofreactive oxygen and nitrogen species metabolism in thepresence of H pylori infection in humans. iNOS is a major sourceof NO production that is produced during inflammation bymacrophages[6,7]. Expression of iNOS in response to cytokinesis part of the inflammatory response and contributes to tissuedamage, suggesting its possible role in the processing ofcarcinogens[7]. iNOS contains many sites for prosthetic groupsand substrate binding[8], which are all potentially important forthe function of the enzyme. Furthermore, studies have indicatedthat even single amino acid changes may have dramatic effectson enzymatic activity[8,9]. The human iNOS gene comprises 27exons with the transcription start site in exon 2 (E2) and thestop codon in E27[10]. E1-13 code for the oxygenase domain,and E14–27 encode for the reductase domain of the protein.Both of the domains represent different functional parts of theenzyme[9]. Increased iNOS activities have been observed in patientswith chronic gastritis caused by H pylori infection, and gastriccancer[11,12]. A 13-21 years follow-up study showed that amongthe H pylori positive group, the expression of iNOS and nitro-tyrosine was significantly higher in the group that developedgastric cancer than the one that showed no evidence of gastriccancer, suggesting that H pylori positive subjects with highlevels of reactive nitrogen species in gastric mucosa may be ahigh-risk group for gastric cancer[13]. Furthermore, recentstudies have revealed that H pylori infection may lead to asustained production of reactive nitrogen species and theformation of nitro-tyrosine contributes to DNA damage andapoptosis in gastric mucosa[12]. Infection with H pylori strains

possessing cytotoxin-associated gene (Cag) A, a molecularmarker of H pylori virulence[14,15], is particularly associated withan increased risk of developing adenocarcinoma of the stomach.It is suggested that iNOS may be a susceptible gene involvedin the metabolic pathway of nitrogen and oxygen species offree radicals, and thus may be associated with both gastriccancer risk and H pylori infection. Yangzhong city is one of the areas in China with the highestgastric cancer mortality and incidence rate. The crude mortality rateof gastric cancer was from 96.9 to 110.9/100 000 during 1991 and1997, and the average adjusted incidence rate in the same periodwas over 115/100 000 (unadjusted rate was 155.46/100 000),which is over ten times higher than that in the United States[16].Based on the understanding of the physiology and pathogenesisof gastric cancer, and the genetic pathway related to H pyloriinfection, we hypothesized that higher frequency of iNOSSer608Leu allele (i.e. C/T polymorphism)[9,17] was responsiblefor the higher gastric cancer incidence in this area. We wereespecially interested in knowing whether the associationbetween the polymorphism and gastric cancer was modified byinfection with H pylori CagA strains and cigarette smokingreflecting high exposure to nitrogen and oxygen species of freeradicals. Therefore, the aim of this study was to determinewhether iNOS C/T polymorphism was associated with increasedsusceptibility to gastric cancer, and the effects of H pylori infection.
MATERIALS AND METHODSStudy subjectsAll gastric cancer patients and “healthy” controls in this studywere Han ethnic Chinese living in Yangzhong city for at least25 years. Gastric cancer was diagnosed according to the InternationalClassification of Diseases for Oncology IX, code = 151, and thecriteria of Laurén[18]. Because most diagnosed gastric cancercases in Yangzhong were intestinal type gastric cancer (IGC)and gastric cardia cancer (GCC), we focused on these two kindsof cancers in the present study. A population based case-controldesign was used, and 165 gastric cancer cases (108 IGC, 57 GCC)and 295 controls were enrolled. The finally analyzed cases andcontrols were 143 (93 IGC, 50 GCC) and 246 cases, respectively,because of missing genotype data for some subjects. There wereno significant differences comparing the finally analyzedsubjects and those with missing data by age and sex. All caseswere identified by endoscopic and pathological diagnosis inYangzhong City Municipal Hospital from January 1997 to December1998. To reduce misclassification of the histological types, twopathologists reviewed and confirmed all diagnosed cases.Controls were selected from cancer-free subjects living in thesame community, who were either cases’ siblings or their non-blood relatives (spouses and spouses’ siblings with the samegender as cases). Both types of controls differed slightly indemographic features[19]. Their results were combined toincrease the sample size and to decrease type I error. This studywas approved by the regional ethics committee, and all participantswere given an explanation of the nature of the study, andinformed consents both written and oral, were obtained. Studysubjects completed a questionnaire administered by trainedinterviewers. The questionnaire was designed to obtain detailed informationon cigarette smoking, alcohol drinking, family history of cancers,and occupational and hazard exposures. Cigarette smokers weredefined as subjects who reported ever smoking at least onecigarette per day for 12 mo or more, or whose accumulatedcigarette consumption was over 18 packs per year. Past smokerswere those who had stopped smoking 1 or more years beforethe interview. Alcohol drinkers were defined as subjects whoreported to have an average of one drink or more per week for oneor more yeaes. Past alcohol drinkers were also defined as those
who had stopped drinking for 1 or more years before the interview.
Laboratory analysisBlood was drawn from each participant by the designatedcoordinator according to the Guidelines of the National Heart,Lung, and Blood Institute Working Group on Blood Drawing,Processing, and Storage for Genetic Studies. Twenty millilitersof forearm venous blood was collected from each subject viavenipuncture into two 10-mL vacutainer tubes containing EDTA.Puragene DNA isolation kits (Gentra Systems, MinneapolisMN) were used to isolate genomic DNA for genotyping. Allblood samples were separated, and plasma was collected assoon as possible. The plasma was then stored at -20 in six1.5-mL tubes for the detection of IgG antibody to H pylori CagA. Denaturing high performance liquid chromatography(DHPLC) was used to scan the potential single nucleotidepolymorphisms (SNPs) in all exons of iNOS, and then sequencingwas performed to confirm the possible mutations. Finally, a newC/T polymorphism, which changes the coding amino acid fromserine (TCG) to leucine (TTG), was identified[17]. PCR-RFLPwas carried out to identify the genotype of iNOS according tothe features of SNP, which created a restriction enzymerecognition site of Tsp 509 I. Genomic DNA was amplified withprimers F: 5’-TGTAAACCAACTTCC GTGGTG-3’ (Tm = 60.82 )and R: 5’-GTCTCTGCGGGTCTGAGAAG-3’ (Tm = 60.14 ).PCR was performed in a MJRESEARCH PCR system (PTC-225,USA), and in a 10 µL reaction volume containing 1µL 10×PCRbuffer, 1.6 µL dNTPs (1.25 µmol/L), 0.2 µL MgCl2 (25 mmol/L),primers (20 µmol/L, Resgen Corp.) at 0.15 µL each, DMSO 0.5 µL,6.34 µL dH2O, 50 ng genomic DNA dried on the plate, and HotStart Taq DNA polymerase 0.06 µL (5 U/µL, Promega Corp.). Touchdown PCR procedure was used to amplify the target fragment.After an initial denaturation at 94 for 15 min, amplificationwas carried out for 10 cycles at 94 for 30 s, at 61 for 45 s,at 72 for 45 s and decreasing 0.5 per cycle. Then amplificationwas again carried out for 35 cycles at 94 for 30 s, at 56 for45 s, and at 72 for 45 s, followed by a final elongation at 72 for 7 min. Then, 10 µL PCR products was digested with 0.2 µLTsp 509 I (10 U/µL, NEB Corp.) in a 15 µL volume including 2 µL10×buffer 1 (NEB Corp.), 0.15 µL BSA (100×) and 2.65 µL dH2O.Digestion was performed for 15 h at 65 . The products werethen electrophoresed on a 30 g/L agarose gel to allowunambiguous detection with ethidium bromide staining.Homozygous wide-type individuals (CC) showed 113 bp and175 bp fragments, heterozygous individuals (CT) showed threebands: 113 bp, 142 bp and 175 bp, and homozygous rare alleleindividuals (TT) showed two bands: 113 bp and 142 bp[17]. H pylori CagA IgG antibody in plasma was measured by anenzyme-linked immunosorbent assay (ELISA) kit offered byJingying Biotech Limited Company, Shanghai, China (batchnumber 0052). The Absorbency at 450 nm was determined afterterminating the enzyme reaction. The cutoff value equaled tothe average A of the negative controls provided by themanufacturer plus 0.3 A units. A values of samples equaled toor higher than the cutoff point were considered positive.
Statistical analysisAll data were input double blinded into EPI-6 program by twopersons separately. After modifying all errors and non-logicaldata, the differences in the relative associations between casesand controls were assessed by calculating crude odds ratios(OR) from contingency tables. The corresponding chi-squaretest on the cancer patients and controls was carried out, and95% confidence intervals (95% CI) were determined using theFisher exact test. A P-value <0.05 was considered statisticallysignificant. Unconditional logistic regression analysis wasperformed in both univariate and multivariate models to assessthe association between iNOS functional polymorphism and
Shen J et al. Correlation of nitric oxide synthase with gastric cancer 3279

gastric cancer susceptibility after adjusting for importantconfounding factors such as age and sex. Test of trend andinteraction index (γ) that was determined by coefficient (β) in amultiple logistic regression model were calculated throughlogistic models based on dummy variables to examine the potentialgene-environment interaction[20]. All analyses were performedwith the SAS package Genmod (SAS Institute, Cary, NC).
RESULTSTable 1 compares the characteristics of study subjects. Themean age of cases was significantly greater than the controls(59.36 vs 51.89, P<0.01). There was no significant difference inthe male/female ratio between cases and controls. The proportionsof past smokers and alcohol drinkers was significantly greaterin the cancer group (36.97% and 30.30%) than in the controlgroup (12.54% and 14.92%). However, there were more currentsmokers and drinkers in the control (47.12% and 30.85%) thanin the case group (26.67% and 10.91%). Compared with controls,cases were significantly less likely to be positive for H pyloriCagA antibody. The frequency of iNOS genotypes in gastric cancer andcontrol subjects showed no significant difference, although the
frequency of (CT+TT ) genotypes was slightly higher in casesthan in controls (24.48% versus 23.17%). A gene dose-responseeffect was not observed, i.e. the effect of heterozygote (CT)genotypes did not lie at or between the homozygotes (CC and TT). For (CT+TT) the genotype frequency of iNOS in the pastsmoking subgroup, there were significant differences betweenthe total cases and the controls and between GCC group andcontrols with an OR of 3.62 (95% CI: 1.23-10.64) and 4.63 (95%CI: 1.15-18.58), respectively. No significant difference was foundbetween IGC cases and controls (Table 2). Although no genedose-response effect was observed in heterozygote (CT) andhomozygote (TT) individuals because of the small number ineach cell, there was still a possible interaction between C/Tpolymorphism and past cigarette smoking in increasing therisk of GCC. In the past alcohol drinkers, there were significantdifferences in the C/T polymorphism between total cases andcontrols and between IGC group and controls with an OR of3.33 (95% CI: 1.14-9.67) and 3.42 (95% CI: 1.03-11.35),respectively. No significant difference between GCC group andcontrol group was found (Table 3). In H pylori CagA negativegroup, subjects with (CT+TT) genotypes had significantlyincreased risk of both IGC and GCC, with an OR of 2.19 (95% CI:1.01-4.76) and 3.52 (95% CI: 1.44-8.61), respectively. H pylori
Table 1 Covariate distribution among study subjects and ORs for gastric cancer
Characteristics No Cases (%) (n = 165) No. Controls (%) (n = 295) OR (95% CI)
Age (yr)Mean (yr±SD) 59.36±9.29a 51.89±10.24Min. (yr) 34.72 30.77Max. (yr) 81.95 78.21
GenderMale (%) 110 (66.67) 190 (64.41)Female (%) 55 (33.33) 105 (35.59)Ratio 2.00:1 1.81:1
Smoking habitNever 60 (36.36) 119 (40.34) 1.00Current 44 (26.67) 139 (47.12) 0.26 (0.15–0.46)b
Past 61 (36.97) 37 (12.54) 3.15 (1.77–5.61)b
Alcohol habitsNever 97 (58.79) 160 (54.24) 1.00Current 18 (10.91) 91 (30.85) 0.18 (0.10–0.35)b
Past 50 (30.30) 44 (14.92) 1.80 (1.06–3.08)Plasma H Pylori CagA antibody
Negative 136 (82.42) 107 (49.31) 1.00Positive 29 (17.58) 110 (50.69) 0.18 (0.11–0.31)b
iNOS genotypingCC 108 (75.52) 189 (76.83) 1.00CT 33 (23.08) 49 (19.92) 1.15 (0.68–1.96)TT 2 (1.40) 8 (3.25) 0.42 (0.08–2.16)CT+TT 35 (24.48) 57 (23.17) 1.03 (0.59–1.79)
aP<0.05 vs control group after adjusted for age and gender, bP<0.01 vs control.
Table 2 Interaction between C/T polymorphism and past cigarette smoking for the risk of gastric cancer
C/T Past Total cases Controls OR1 95%CI IGC OR2 95%CI GCC OR3 95%CIpolymorphism smoking (n = 143) (n = 246) (n = 93) (n = 50)
CC No 67 162 1.00 46 1.00 21 1.00CT+TT No 22 51 0.98 0.55-1.78 12 0.75 0.36-1.54 10 1.44 0.63-3.27CC Yes 41 27 2.92 1.53-5.57 27 2.47 1.19-5.09 14 3.65 1.42-9.38CT+TT Yes 13 6 3.62 1.23-10.64 8 3.06 0.91-10.35 5 4.63 1.15-18.58
1Adjusted for age and gender, χ2trend = 26.26, df = 1, P = 0.00, γ = 1.29/1.07 = 1.21 2Adjusted for age and gender, χ2
trend = 18.40, df = 1,P = 0.00, γ = 1.12/0.90 = 1.24 3Adjusted for age and gender, χ2 trend = 17.53, df = 1, P = 0.00, γ = 1.53/1.29 = 1.19.
3280 ISSN 1007-9327 CN 14-1219/ R World J Gastroenterol November 15, 2004 Volume 10 Number 22

CagA positivity showed significant protective effects in IGCgroup in both on CC and CT+TT iNOS genotypes, with an ORof 0.24 (95% CI: 0.07-0.89) and 0.34 (95% CI: 0.17-0.70),respectively. However, no significant association was observedbetween iNOS genotypes and GCC (Table 4).
DISCUSSIONH pylori infection could produce a state of chronic immuno-stimulation in gastric epithelium[21]. It could lead to changes inmany factors that are important in the pathogenesis of gastriccancer, including reactive oxygen and nitrogen oxide species [22].NO, a potentially toxic gas with free radical properties is one ofthe most important bio-regulatory and signaling moleculesproduced in the process. It has been recently reported that NO,acting as a messenger molecule mediating various physiologicalfunctions[23,24], may also play a role in the process of carcinogenesis. It has been found that NO is synthesized enzymaticallyfrom L-arginine by NO synthase[23,25]. Chronic infection andimmuno-stimulation elevate endogenous synthesis of NO. Highconcentration of NO generated by macrophages after iNOSinduction contributed to their cytotoxic and carcinogenicactivity[26]. There is now increasing evidence that NO producedby activated phagocytes may play a role in multistage carcinogenesisby mediating DNA damage[27,28]. A to T substitution in the iNOSgene, leads to more activated iNOS expression in the targetcells, and finally elevates NO to a high level. Hence, it is reasonableto assume that human iNOS gene may be another important candidategene for the development of gastric cancer by elevating NOproduction in target cells when functional polymorphismsoccur. Nevertheless its genomic localization at chromosome17q11.2[29] was not the same as other gastric cancer susceptiblegenes related to the inflammatory response pathway, such asinterleukin 1β and interleukin 1RN, located at 2q14[30]. The keyquestion for gastric cancer agents is how H pylori infectioncould be associated with such totally divergent clinicaloutcomes as gastric cancer and peptic ulcer disease. A largenumber of previous studies have focused on the role of thebacterial virulence factors that contribute to the degree of tissuedamage in the pathogenesis of these diseases. But these resultsstill could not explain the different outcomes[2,22,31]. With thedevelopment of a key concept about the interaction between
acid secretion and H pylori-induced gastritis during 1990 s, El-Omar proposed the idea for the first time that host geneticfactors relevant to pro-inflammatory responses might be relevantto the development of gastric cancer. They explored a candidateIL-1β gene in the context of H pylori related disease[32,33]. BecauseIL-1β can also induce the expression of many other genes,including pro-inflammatory mediator iNOS, by either regulatingat the transcriptional level or initiating their mRNA[8,9,34], it iseasy to consider that functional polymorphisms occurring inthe iNOS gene might also contribute to the increased risk ofH pylori related gastric cancer. We have previously reported a newly discovered C/Tpolymorphism in a Chinese population[17] that had a high mutatedallele frequency (24.4%). A report by Johannesen also showedthat C/T polymorphism was one of the most frequent SNPsamong 10 polymorphisms of human iNOS gene identified in aDanish population. They suggested that the amino acid changein exon 16 might be of functional interest[9]. Our results showedno significant difference in the frequency of (CT+TT) genotypesbetween cases and controls, and no apparent gene dose-responseeffect was found. However, in past cigarette smokers and pastalcohol drinkers, C/T polymorphism significantly increased therisk of gastric cancer despite the histological subtypes differed,i.e. past cigarette smokers with (CT+TT) genotypes had anincreased risk of IGC, while past alcohol drinkers with (CT+TT)genotypes had increased risk of GCC. These findings suggestthat C/T polymorphism in iNOS gene alone is not sufficient toshow the increasing risk of gastric cancer. The importance ofthe interaction between C/T polymorphism and cigarette smokingor alcohol drinking varied depending on different histologicalsubtypes of gastric cancer. Similar results were found by Machadofor IL-1 genetic markers[35]. Although these findings were notthe major hypothesis we proposed, it is biologically plausiblethat oxidative stress due to carcinogenesis in cigarette mightattribute to the increase of gastric cancer risk through interactionswith iNOS C/T polymorphism. Larger and independent studiesare needed to confirm these findings. In the H pylori CagA positive group, regardless of whethersubjects had CC or (CT+TT) genotypes, we always observed asignificant protective effect when comparing IGC cases withcontrols. This suggests that plasma positive for H pylori CagAantibody in a highly infected area plays a protective role. This
Table 3 Interaction between C/T polymorphism and past alcohol drinking for the risk of gastric cancer
C/T Past alcohol Total cases Controls OR1 95%CI IGC OR2 95%CI GCC OR3 95%CIpolymorphism drinking (n = 143) (n = 246) (n = 93) (n = 50)
CC No 76 157 1.00 53 1.00 23 1.00
CT+TT No 24 51 0.83 0.46-1.50 13 0.62 0.30-1.28 11 1.22 0.55-2.70
CC Yes 32 32 1.34 0.72-2.52 20 1.36 0.67-2.75 12 1.27 0.50-3.19
CT+TT Yes 11 6 3.33 1.14-9.67 7 3.42 1.03-11.35 4 3.25 0.80-13.13
1Adjusted for age and gender, χ2trend = 10.29, df = 1, P = 0.001, γ = 1.20/0.30 = 4.00 2Adjusted for age and gender, χ2
trend = 5.65, df = 1,P = 0.017, γ = 1.23/0.31 = 3.97 3Adjusted for age and gender, χ2
trend = 8.95, df = 1, P = 0.003, γ = 1.18/0.24 = 4.9.
Table 4 Interaction between C/T polymorphism and H pylori CagA status for the risk of gastric cancer
C/T CagA Total cases Controls OR1 95%CI IGC OR2 95%CI GCC OR3 95%CIpolymorphism antibody (n = 143) (n = 178) (n = 93) (n = 50)
CC No 87 64 1.00 61 1.00 26 1.00
CT+TT No 28 19 2.53 1.29-4.98 17 2.19 1.01-4.76 11 3.52 1.44–8.61
CC Yes 21 73 0.45 0.25-0.81 12 0.34 0.17-0.70 9 0.76 0.33-1.73
CT+TT Yes 7 22 0.43 0.17-1.10 3 0.24 0.07-0.89 4 0.86 0.27-2.79
1Adjusted for age and gender, χ2trend = 33.40, df = 1, P = 0.00, γ = -0.84/-0.79 = 1.06 2Adjusted for age and gender, χ2
trend = 28.53, df = 1,P = 0.00, γ = -1.41/-1.08 = 1.31 3Adjusted for age and gender, χ2 trend = 12.42, df = 1, P = 0.0004, γ = -0.15/-0.27 = 0.56.
Shen J et al. Correlation of nitric oxide synthase with gastric cancer 3281

is in concordance with the finding that H pylori density becameprogressively lower with progression from mild gastritis tosevere gastritis, atrophy, intestinal metaplasia and finally gastriccancer[29]. In H pylori CagA negative subjects with (CT+TT)genotypes, a high risk was found for gastric cancer group(OR = 2.53, 95% CI: 1.29-4.98) and both subgroups (IGC andGCC). No interaction was found between iNOS genotype andinfection with H pylori CagA strains. iNOS protein is a catalytic enzyme with two domains. Interms of functional importance, the deletion mutants retainedmaximal NO activity at lower concentrations of free Ca2+
compared with the wild-type[36]. Identified C/T polymorphismin E16 of iNOS was located at the N-terminal of six amino acidsfrom the deletion reported by Daff et al., and the amino acidchange in E16 might be of functional interest[9]. To our knowledge,this study was the first one to examine the significance of iNOSpolymorphism in gastric cancer. A research on other type ofdisease might support our observation[9]. Gastric cancer patientshaving allele T polymorphism could have an increased expressionof iNOS, resulting in higher levels of NO in gastric mucosa,mediating many pathological changes and finally leading tocarcinogenesis in these patients. But specific functional testsof C/T shift need to be performed to substantiate the putativeimportance of the Ser608Leu locus in gastric cancer development. Potential weaknesses in our study include possiblerecruitment bias in the selection of controls including cases’siblings. This kind of selection might create overmatching.Siblings were more likely to have the same genotypes as thecases than the non-blood related controls, thereby leading tosome loss of statistical efficiency, i.e., larger sample sizes wererequired to attain the same statistical precision[37]. Thus, ourdata may be more likely to underestimate the true effect of iNOST alleles on the risk of gastric cancer. But others considered thatthe use of sibling controls could generally improve efficiency forgene-environment interactions[38,39]. We could not rule out thepotential influence of systematic differences between participantsand non-participants. In conclusion, the risk of gastric cancer is increast amongpast cigarette smoking or alcohol drinking individuals with a C/Tpolymorphism in E16 of iNOS gene in a Chinese population. Butthe findings need to be confirmed in other ethnic populations.
ACKNOWLEDGEMENTSWe thank Zhao-Xi Wang for his excellent technical assistance;and Professor Regina M. Santella and Dr. Yu-Jing Zhang forediting the manuscript. We also thank all the doctors for theirkind help in collecting the biological samples and epidemiologicaldata. We thank all participatants for their co-operation.
REFERENCES1 Parkin DM, Pisani P, Ferlay J. Estimates of the worldwide
incidence of 25 major cancers in 1990. Int J Cancer 1999; 80:827-841
2 El-Omar EM, Chow WH, Rabkin CS. Gastric cancer and H pylori:Host genetics open the way. Gastroenterology 2001; 121:1002-1004
3 Correa P. Human gastric carcinogenesis: a multistep and mul-tifactorial process-first american cancer society award lectureon cancer epidemiology and prevention. Cancer Res 1992; 52:6735-6740
4 Komoto K, Haruma K, Kamada T, Tanaka S, Yoshihara M,Sumii K, Kajiyama G, Talley NJ. Helicobacter pylori infectionand gastric neoplasia: correlations with histological gastritisand tumor histology. Am J Gastroenterol 1998; 93: 1271-1276
5 Schistosomes, liver flukes and Helicobacter pylori. IARC Work-ing Group on the Evaluation of Carcinogenic Risks to Humans.Lyon, 7-14 June 1994. IARC Monogr Eval Carcinog Risks Hum1994; 61: 1-241
6 Felley CP, Pignatelli B, Van Melle GD, Crabtree JE, Stolte M,Diezi J, Corthesy-Theulaz I, Michetti P, Bancel B, Patricot LM,Ohshima H, Felley-Bosco E. Oxidative stress in gastric mucosaof asymptomatic humans infected with Helicobacter pylori: ef-fect of bacterial eradication. Helicobacter 2002; 7: 342-348
7 Vallance P, Collier J. Biology and clinical relevance of nitricoxide. Br Med J 1994; 309: 453-457
8 Stuehr DJ. Mammalian nitric oxide synthases. Biochim BiophysActa 1999; 1411: 217-230
9 Johannesen J, Pie A, Paiot F, Kristiansen OP, Karlsen AE, NerupJ. Linkage of the human inducible nitric oxide synthase gene totype 1 diabetes. J Clin Endocrinol Metab 2001; 86: 2792-2796
10 Xu W, Charles IG, Liu L, Moncada S, Emson P. Molecularcloning and structural organization of the human induciblenitric oxide synthase gene (NOS2). Biochem Biophys Res Commun1996; 219: 784-788
11 Mannick EE, Bravo LE, Zarama G, Realpe JL, Zhang XJ, RuizB, Fontham ET, Mera R, Miller MJ, Correa P. Inducible nitricoxide synthase, nitrotyrosine, and apoptosis in Helicobacter py-lori gastritis: effect of antibiotics and antioxidants. Cancer Res1996; 56: 3238-3243
12 Wee A, Kang JY, Teh M. Helicobacter pylori and gastric cancer:correlation with gastritis, intestinal metaplasia, and tumourhistology. Gut 1992; 33: 1029-1032
13 Rajnakova A, Goh PM, Chan ST, Ngoi SS, Alponat A,Moochhala S. Expression of differential nitric oxide synthaseisoforms in human normal gastric mucosa and gastric cancertissue. Carcinogenesis 1997; 18: 1841-1845
14 Blaser MJ, Perez-Perez GI, Kleanthous H, Cover TL, Peek RM,Chyou PH, Stemmermann GN, Nomura A. Infection withHelicobacter pylori strains possessing CagA is associated withan increased risk of developing adenocarcinoma of the stomach.Cancer Res 1995; 55: 2111-2115
15 Goto T, Haruma K, Kitadai Y, Ito M, Yoshihara M, Sumii K,Hayakawa N, Kajiyama G. Enhanced expression of induciblenitric oxide synthase and nitrotyrosine in gastric mucosa ofgastric cancer patients. Clin Cancer Res 1999; 5: 1411-1415
16 Stadtlander CT, Waterbor JW. Molecular epidemiology, patho-genesis and prevention of gastric cancer. Carcinogenesis 1999;20: 2195-2208
17 Shen J, Wang RT, Wand LW, Wang ZX, Xing HX, Wang BY,Guo CH, Wang XR, Xu XP. Ser/Leu polymorphism of iNOSgene was found and identified in Chinese by denaturing highperformance liquid chromatography. Peking Daxue Xuebao 2001;33: 486-492
18 Laurén P. The two histological main types of gastric carcinoma:diffuse and so-called intestinal-type carcinoma. An attempt ata histo-clinical classification. Acta Pathol Microbiol Scand 1965;64: 31-49
19 Shen J, Wang R, Wang Z, Xing H, Wang L, Wang B, Li M, HuaZ, Wang J, Guo C, Wang X, Xu X. The distributive features ofthree kinds of metabolic genes polymorphisms in populationof Han nationality in south area of China. Zhonghua YixueYichuanxue Zazhi 2002; 19: 302-307
20 Taioli E, Zocchetti C, Garte S. Models of interaction betweenmetabolic genes and environmental exposure in cancersusceptibility. Environ Health Perspect 1998; 106: 67-70
21 Shapiro KB, Hotchkiss JH. Induction of nitric oxide synthesisin murine macrophages by Helicobacter pylori. Cancer Lett 1996;102: 49-56
22 El-Omar EM. The importance of interleukin 1 beta in Helicobacterpylori associated disease. Gut 2001; 48: 743-747
23 Moncada S, Palmer RM, Higgs EA. Nitric oxide: physiology,pathophysiology, and pharmacology. Pharmacol Rev 1991; 43:109-142
24 Son HJ, Rhee JC, Park DI, Kim YH, Rhee PL, Koh KC, Paik SW,Choi KW, Kim JJ. Inducible nitric oxide synthase expression ingastroduodenal diseases infected with Helicobacter pylori.Helicobacter 2001; 6: 37-43
25 Forstermann U, Schmidt HH, Pollock JS, Sheng H, MitchellJA, Warner TD, Nakane M, Murad F. Isoforms of nitric oxidesynthase. Characterization and purification from different celltypes. Biochem Pharmacol 1991; 42: 1849-1857
26 Grisham MB, Ware K, Gilleland HE Jr, Gilleland LB, Abell CL,Yamada T. Neutrophil-mediated nitrosamine formation: role
3282 ISSN 1007-9327 CN 14-1219/ R World J Gastroenterol November 15, 2004 Volume 10 Number 22

of nitric oxide in rats. Gastroenterology 1992; 103: 1260-126627 Esumi H, Tannenbaum SR. US-Japan Cooperative Cancer Re-
search Program: seminar on nitric oxide synthase andcarcinogenesis. Cancer Res 1994; 54: 297-301
28 Ohshima H, Bartsch H. Chronic infections and inflammatoryprocesses as cancer risk factors: possible role of nitric oxide incarcinogenesis. Mutat Res 1994; 305: 253-264
29 Marsden PA, Heng HH, Duff CL, Shi XM, Tsui LC, Hall AV.Localization of the human gene for inducible nitric oxide synthase(NOS2) to chromosome 17q11.2-q12. Genomics 1994; 19: 183-185
30 Patterson D, Jones C, Hart I, Bleskan J, Berger R, Geyer D,Eisenberg SP, Smith MF Jr, Arend WP. The human interleukin-1 receptor antagonist (IL1RN) gene is located in the chromo-some 2q14 region. Genomics 1993; 15: 173-176
31 Graham DY, Yamaoka Y. Disease-specific Helicobacter pylorivirulence factors: the unfulfilled promise. Helicobacter 2000; 5(Suppl 1): S3-S9
32 El-Omar EM, Carrington M, Chow WH, McColl KE, BreamJH, Young HA, Herrera J, Lissowska J, Yuan CC, Rothman N,Lanyon G, Martin M, Fraumeni JF Jr, Rabkin CS. Interleukin-1polymorphisms associated with increased risk of gastric cancer.Nature 2000; 404: 398-402
33 El-Omar EM, Carrington M, Chow WH, McColl KE, BreamJH, Young HA, Herrera J, Lissowska J, Yuan CC, Rothman N,
Lanyon G, Martin M, Fraumeni JF Jr, Rabkin CS. The role ofinterleukin-1 polymorphisms in the pathogenesis of gastriccancer. Nature 2001; 412: 99
34 Cho HJ, Xie QW, Calaycay J, Mumford RA, Swiderek KM, LeeTD, Nathan C. Calmodulin is a subunit of nitric oxide syn-thase from macrophages. J Exp Med 1992; 176: 599-604
35 Machado JC, Pharoah P, Sousa S, Carvalho R, Oliveira C,Figueiredo C, Amorim A, Seruca R, Caldas C, Carneiro F,Sobrinho-Simoes M. Interleukin 1B and interleukin 1RN poly-morphisms are associated with increased risk of gastriccarcinoma. Gastroenterology 2001; 121: 823-829
36 Daff S, Sagami I, Shimizu T. The 42-amino acid insert in theFMN domain of neuronal nitric-oxide synthase exerts controlover Ca(2+)/calmodulin-dependent electron transfer. J BiolChem 1999; 274: 30589-30595
37 Thomas DC, Witte JS. Point: population stratification: a prob-lem for case-control studies of candidate-gene associations?Cancer Epidemiol Biomark Prev 2002; 11: 505-512
38 Gauderman WJ, Witte JS, Thomas DC. Family-based associa-tion studies. J Natl Cancer Inst Monogr 1999; 26: 31-37
39 Witte JS, Gauderman WJ, Thomas DC. Asymptotic bias andefficiency in case-control studies of candidate genes and gene-environment interactions: basic family designs. Am J Epidemiol1999; 149: 693-705
Edited by Xia HHX and Wang XL Proofread by Xu FM
Shen J et al. Correlation of nitric oxide synthase with gastric cancer 3283

PO Box 2345, Beijing 100023, China World J Gastroenterol 2004;10(22):3284-3288Fax: +86-10-85381893 World Journal of GastroenterologyE-mail: [email protected] www.wjgnet.com Copyright © 2004 by The WJG Press ISSN 1007-9327
• H pylori •
A new subtype of 3’ region of cagA gene in Helicobacter pylori strains
isolated from Zhejiang Province in China
Ran Tao, Ping-Chu Fang, Hai-Yan Liu, Yun-Shui Jiang, Jing Chen
Ran Tao, Ping-Chu Fang, Hai-Yan Liu, Yun-Shui Jiang, Jing Chen,Department of Medical Microbiology and Parasitology, ZhejiangUniversity School of Medicine, Hangzhou 310006, Zhejiang Province,ChinaSupported by China Medical Board, No. 96-628, and Natural ScienceFund of Zhejiang Province, No. 302023Correspondence to: Professor Ping-Chu Fang, Department of MedicalMicrobiology and Parasitology, Zhejiang University School ofMedicine, 353 Yan’an Road, Hangzhou 310006, Zhejiang Province,China. [email protected]: +86-571-87217403Received: 2004-04-15 Accepted: 2004-05-09
Abstract
AIM: To isolate the subtypes of 3’ region of cagA gene inHelicobacter pylori (H pylori) strains from Zhejiang Provincein China and to investigate their relations to H pylori-associatedgastroduodenal diseases.
METHODS: One hundred and thirty-seven H pylori clinicalstrains were isolated from the gastric mucosa specimensof 74 patients with chronic gastritis, 61 with peptic ulceration,and 2 with gastric cancer. Bacterial genomic DNA wasextracted and 3’ region of cagA gene was amplified bypolymerase chain reaction (PCR). Subtypes of 3’ region ofcagA gene were determined by the size of PCR amplifiedsegments. The sequences of the subtypes were analyzedby PCR-based sequencing.
RESULTS: Of the 137 H pylori isolates from Zhejiang Province,132 (96.4%) yielded PCR products that could be classifiedinto three groups of subtypes, named as subtypes I, II,and III according to their sizes. The sizes of subtypes I, II,and III were 648-650 bp, 705-707 bp, and 815 bp, respectively.Among the 132 cagA-positive H pylori strains, 123 (93.2%)belonged to the group of subtype I, 6 (4.5%) presentedsubtype II, 1 (0.8%) was subtype III, and 2 (1.5%) presentedsubtypes I and III both. The primary structure of subtype Iwas composed of 3 repeats of R1, 1 repeat of R2 and 1repeat of R3. Subtype II possessing 4 repeats of R1, 2repeats of R2 and 1 repeat of R3 was a newly found typeof 3’ region of cagA gene which had not been reportedbefore. The primary structure of subtype III consisted of 4repeats of R1, 1 repeat of R2 and 2 repeats of R3. Comparisonof the sequences of subtype I strains with the correspondingsequences deposited in GenBank, showed a similarity of95.0% (94.0-96.1%) for nucleotide sequences and 95.9%(94.9-97.4%) for deduced amino acid sequences.Comparison of the sequences of subtype III strains withthe corresponding sequences deposited in GenBank,showed a similarity of 93.9% (90.8-96.9%) for nucleotidesequences and 93.2% (90.2-96.2%) for deduced aminoacid sequences. Among subtype II strains, the nucleotideand deduced amino acid sequences showed a similarityof 95.2% (94.1-96.5%) and 96.4% (93.8-97.9%),respectively. There were no statistical differences in the
distribution of subtypes of 3’ region of cagA gene amongdifferent H pylori-associated gastroduodenal diseases(χ2 = 11.544, P >0.05).
CONCLUSION: There are three subtypes (I, II, and III) of3’ region of cagA gene in H pylori strains isolated fromZhejiang Province, and subtypeIis predominant. SubtypeII is a newly found subtype of 3’ region of cagA gene. Theresult of this study does not support the view that thesubtypes of 3’ region of cagA gene in H pylori isolatedfrom Zhejiang Province are correlated with the clinicaloutcomes of H pylori infection.
Tao R, Fang PC, Liu HY, Jiang YS, Chen J. A new subtype of3’ region of cagA gene in Helicobacter pylori strains isolatedfrom Zhejiang Province in China. World J Gastroenterol 2004;10(22): 3284-3288
http://www.wjgnet.com/1007-9327/10/3284.asp
INTRODUCTIONAlthough Helicobacter pylori (H pylori) is present in stomachsof at least half of the world’s population[1], only a smallproportion of the carriers develop symptomatic diseases[2]. Theclinical spectrum of H pylori infection ranges from asymptomaticgastritis to peptic ulcer and gastric cancer[3]. The causes of differentoutcomes of H pylori infection may include the virulence ofinfectious strains, the susceptibility of hosts, and environmentalcofactors[4-8]. The cytotoxin-associated gene A (cagA) islocated at one end of a 40-kilobase DNA segment called cagpathogenicity island (cag PAI), which contains open readingframes encoding for a putative H pylori secretion system thatmay be associated with export of virulence factors to theextracellular compartment[9,10]. The presence of cagA genecan be considered as a marker for cag PAI and is associatedwith more virulent H pylori strains[11]. The structure of cagAgene contains a 5’ highly conserved region and a variable 3’region, in which the presence of a variable number of repeatsequences results in a protein (CagA) with a molecular massof 120 to 140 ku[12]. Yamaoka et al.[13] from Japan found thatthe structural organization of 3’ region of cagA gene in JapaneseH pylori isolates could be divided into four types (types A toD), and type C was associated with gastric atrophy andcarcinoma. However, the genetic structure of 3’ region ofcagA gene in Chinese H pylori strains has been little exploited.In this study, we attempted to investigate the subtypes of 3’region of cagA gene in H pylori strains isolated from ZhejiangProvince in China and their relations to H pylori-associatedgastroduodenal diseases.
MATERIALS AND METHODSH pylori isolatesA total of 137 H pylori isolates were obtained from H pylori-infected patients at the Second Affiliated Hospital of ZhejiangUniversity and the Renmin Hospital of Daishan County inZhejiang Province. The patients, consisting of 95 men and 42

women with a mean age of 42.6 years (ranging from 16 to 71years), were classified into 3 groups including chronic gastritis(n = 74), peptic ulcer (n = 61), and gastric cancer (n = 2), accordingto the results of endoscopic and histological examination.
H pylori cultureBacteria isolated from biopsy specimens were cultured on ECYselective solid medium[14] at 37 for 5 d, under 100% humidityand microaerophilic conditions (50 mL/L O2, 100 mL/L CO2, and850 mL/L N2). H pylori strains were identified by the followingcriteria: Gram staining, colony morphology, rapid urease test,and catalase test. The cultured bacteria were defined to beH pylori if they formed typical colonies on the medium, werenegative Gram stain with curved or spiral shape, and positivefor urease and catalase production[15].
Preparation of H pylori genomic DNAThe bacteria were harvested from the agar plates, then genomicDNA was extracted and purified from each H pylori isolateusing cetyltrimethyl ammonium bromide (CTAB), phenol-chloroform-isoamyl alcohol, and ethanol precipitation[16].
Amplification of 3’ region of cagA gene by PCRThe primers 5’-ACCCTAGTCGGTAATGGGTTA-3’ (CAG1)and 5’-GTAATTGTCTAGTTTCGC -3’ (CAG2) described byYamaoka et al.[13] were used to amplify 3’ region of cagA genein this study. PCR was performed in a volume of 25 µLcontaining 2.5 µL of 10×PCR buffer, 2 µL of 25 mmol/L MgCl2,
2.5 µL of 2 mmol/L dNTPs, 0.5 µL of 20 µmol/L primer sets,0.2 µL of Taq DNA polymerase, 1 µL of bacterial genomicDNA, and 15.8 µL of H2O. PCR amplification was performedas following: an initial denaturation at 95 for 3 min, followedby 30 cycles, each consisting of denaturation at 94 for 30 s,annealing at 56 for 30 s, and extension at 72 for 45 s. Thefinal cycle included a further extension at 72 for 7 min toensure the full extension of PCR products. PCR products wereanalyzed by 20 g/L agarose gel electrophoresis with ethidiumbromide staining.
Sequences analysisPCR products were purified with the DNA purification kit(Shanghai Shenyou Biotechnology Co., Ltd.) according to themanufacturer’s instructions. Purified PCR products wereconsigned to Shanghai BioAsia Biotechnology Co., Ltd. forsequencing. Biological software DNAssist (version 1.0) wasused to analyze the sequences of 3’ region of cagA gene and tocompare them with the corresponding sequences deposited inGenBank.
Statistical analysisThe categorical data were analyzed using Chi-square (χ2) test,and P<0.05 was considered statistically significance.
RESULTS
PCR products of 3’ region of cagA genePCR products of 3’ region of cagA gene were electrophoresedon 20 g/L agarose gel (containing 0.5 µg/mL ethidium bromide).Of the 137 H pylori strains isolated from Zhejiang Province,132 (96.4%) strains yielded PCR products of three differentsizes. The three different-size PCR-amplified segments wererespectively named as subtype I (648-650 bp), subtype II(705-707 bp), and subtype III (815 bp) (Figure 1). Among the132 cagA-positive strains, 123 (93.2%) presented subtype I,6 (4.5%) presented subtype II, 1 (0.8%) presented subtype III,and 2 (1.5%) presented both subtypes I and III.
Figure 1 Amplified products of 3’ region of cagA gene by PCR(20 g/L agarose gel electrophoresis) Lane 1: 100 bp DNA ladder;Lane 2: subtype I (648 bp); Lane 3: subtype II (705 bp); Lane 4:subtype III (815 bp); Lane 5: from a patient with both subtypesI and III.
Sequence analysis of subtypes of 3’ region of cagA geneThe primary structure of 3’ region of cagA gene was composedof a variable number of repeat regions, including R1 (15 bp), R2(42 bp) and R3 (147 bp). The primary structures of the subtypesof 3’ region of cagA gene in this study are illustrated in Figure 2.The primary structure of subtype I was composed of 3 repeatsof R1, 1 repeat of R2 and 1 repeat of R3, so subtype I was equalto type A in Japanese H pylori strains reported by Yamaokaet al.[13]. The primary structure of subtype III consisting of 4repeats of R1, 1 repeat of R2 and 2 repeats of R3 was similar tothat of type C reported by Yamaoka et al.[13]. Subtype IIpossessing 4 repeats of R1, 2 repeats of R2 and 1 repeat of R3had the primary structure not similar to any types reported byYamaoka et al[13] and was regarded as a newly found subtypeof 3’ region of cagA gene in H pylori. Comparison of thesequences of 5 H pylori strains presented subtype I with thecorresponding sequences of a Japanese type A strain JK25deposited in GenBank (GenBank accession number AF043487),showed a similarity of 95.0% (94.0-96.1%) for nucleotidesequences and 95.9% (94.9-97.4%) for deduced amino acidsequences. Comparison of the sequences of 2 H pylori strainspresented subtype III (including a strain presented bothsubtypes I and III) with the corresponding sequences of aJapanese type C strain Jk269 deposited in GenBank (GenBankaccession number AF043489), showed a similarity of 93.9%(90.8-96.9%) for nucleotide sequences and 93.2% (90.2-96.2%)for deduced amino acid sequences. Among the 6 H pyloristrains presented subtype II in this study, the nucleotide anddeduced amino acid sequences showed a similarity of 95.2%(94.1-96.5%) and 96.4% (93.8-97.9%), respectively. Alignmentsof the deduced amino acid sequences of 5 strains presentedsubtype I and 2 strains presented subtype III with thecorresponding sequences deposited in GenBank are illustratedin Figure 3 A, B. Alignments of the deduced amino acidsequences of 6 strains presented subtype II are also illustratedin Figure 3 C.
Figure 2 Primary structures of three subtypes of 3’ region ofcagA gene R1: 15 bp repeat region; R2: 42 bp repeat region; R3:147 bp repeat region.
Subtype I
Subtype II
Subtype III
R1R2R1 R3 R1
Tao R et al. Subtype of 3’ region of cagA gene in H pylori 3285
1 2 3 4 5
900
800
700
600
bp

Relationship between subtypes of 3’ region of cagA gene andgastroduodenal diseasesThe distributions of the subtypes of 3’ region of cagA gene indifferent groups of gastroduodenal diseases are demonstratedin Table 1. Statistical analysis showed that there were nosignificant differences among the subtypes of 3’ region of cagAgene in different groups of gastroduodenal diseases (χ2 = 11.544).
Table 1 Relationship between subtypes of 3’ region of cagAgene and different group of gastroduodenal diseases (n, %)
Group of Subtype I Subtype II Subtype III Subtypes Totaldiseases I and III
Chronic gastritis 69 (95.8) 2 (2.8) 0 (0) 1 (1.4) 72Peptic ulcer 53 (91.4) 3 (5.2) 1 (1.7) 1 (1.7) 58Gastric cancer 1 (50.0) 1 (50.0) 0 (0) 0 (0) 2Total 123 (93.2) 6 (4.5) 1 (0.8) 2 (1.5) 132
χ2 = 11.544, P = 0.17>0.05.
DISCUSSIONH pylori, a spiral shaped gastric organism, is the cause of chronicgastritis, and plays an important role in the pathogenesis ofpeptic ulceration, mucosa associated lymphoid tissuelymphoma, and gastric adenocarcinoma[17-20]. It has beenreported that 50-60% of H pylori strains contain cagA geneand consequently produce CagA protein[21]. The CagA is ahighly immunogenic outer membrane protein with a molecularweight of 120 to 140 ku. Variation in size of the protein has beencorrelated with the presence of a variable number of repeatsequences located in 3’ region of the gene[22,23]. The biologicalimportance of the repeat sequences in 3’ region of cagA generemains unknown. Because CagA is strongly immunogenic, theserepeat sequences have been supposed to alter immunogenicity
of the protein[24]. This alteration in the gene and its proteinseems to correlate with clinical outcomes in vivo. The proportionof cagA-positive H pylori isolates varies from one geographicregion to another. Studies from Japan, Korea, and Chinahave shown that more than 90% of H pylori strains are cagA-positive[25-28], while in the United States of America, Canada,and Europe, these percentages are lower[24,29,30]. Therefore, cagAgene cannot be used as a marker for the presence of severegastroduodenal diseases in those regions where the prevalenceof cagA-positive H pylori strains is uniformly high. Since allelicvariation in cagA exists and distinct H pylori subtypes maycirculate in different regions, differences in cagA subtype mightprovide a marker for differences in virulence among cagA-positive H pylori strains[12]. Yamaoka et al.[13] reported that 3’ region of cagA gene inH pylori isolated from Japanese patients could be classifiedinto four types (types A, B, C, and D) depending on the typesand number of repeat regions including R1 (15 bp), R2 (42 bp)and R3 (147 bp). The PCR products of type A ranged from 642to 651 bp, and possessed 1 repeat of R2 and 1 repeat of R3. ThePCR products of type B and type D were all 756 bp, but type Bpossessed 3 repeats of R2 and 1 repeat of R3, while type D had2 repeats of R3 and no repeat of R2. Type C having 1 repeat ofR2 and 2 repeats of R3 yielded PCR products of 813-815 bp andwas associated with high levels of CagA antibody and severedegrees of atrophy. The same authors have also found that thesequences of the second repeat regions of 3’ region of cagAgene in H pylori strains from East Asia are completely differentfrom those in strains from non-Asian countries[31]. Non-Asianstrains possess 102 bp second repeat regions, and East Asianstrains possess 162 bp second repeat regions[31,32]. In the present study, we used the same PCR primers asthose described by Yamaoka et al.[13] and found 132 (96.4%) of137 strains yielded amplified products. The high prevalence ofcagA-positive strains in Zhejiang Province was in accordance
Figure 3 Alignment of amino acid sequences of subtypes of 3’ region of cagA gene. A: Alignment of the deduced amino acidsequences of subtype I strains with the sequence of the corresponding region of a Japanese type A strain JK25 (GenBank accessionnumber AF043487). Strain D2-173 was from a patient with chronic gastritis, and the remaining four strains were from patientswith peptic ulcer. B: Alignment of the deduced amino acid sequences of subtype III strains with the sequence of the correspond-ing region of a Japanese type C strain JK269 (GenBank accession number AF043489). Strain D1-200 was from a patient withchronic gastritis, and strain D2-123 was from a patient with gastric ulcer. C: Alignment of the deduced amino acid sequences ofsix subtype II strains. Strain HZ65 and HZ71 were from patients with chronic gastritis, strain D2-40 was from a patient withgastric cancer, and the remaining three strains were from patients with peptic ulcer.
A
B
C
3286 ISSN 1007-9327 CN 14-1219/ R World J Gastroenterol November 15, 2004 Volume 10 Number 22

with the result of our previous study[33] and the findings inother Chinese areas[11,27]. The PCR products could be classifiedinto three subtypes according to their sizes and were named assubtype I, subtype II, and subtype III, respectively. The PCRproducts of subtype I ranged from 648 to 650 bp and possessed1 repeat of R2 and 1 repeat of R3, so subtype I was equal totype A reported by Yamaoka et al.[13]. The predominance ofsubtype I strains (93.2%) in this study was in agreement withthat of type A strains (93.5%) in Japanese patients[13]. The sizeand genetic structure of subtype III indicated that subtype IIIin this study was equal to type C in Japanese strains[13]. Three(including 2 multiple subtypes strains) of 132 cagA-positivestrains presented subtype III, and the prevalence of this subtype(2.3%) was close to that of type C (4.5%). In contradiction tothe two above-mentioned subtypes, subtype II having the sizeof PCR product of 705-707 bp and the structure of 2 repeats ofR2 and 1 repeat of R3 has not been reported before. Becausesequence analysis showed that the structure of subtype II stillaccorded with the characteristics of 3’ region of cagA gene inAsian strains, subtype II in this study was regarded as a newsubtype of 3’ region of cagA gene in Asian H pylori strains.The fact that we did not find type B and type D reported byYamaoka et al.[13], but discovered a new subtype revealed thediversity and randomicity of the assembling mode of repeatregions located at 3’ region of cagA gene and the possibilitythat this assembling mode varied in H pylori strains isolatedfrom different areas. In addition, 2 strains presenting more thanone subtype were observed in this study and thought to befrom the patients with multiple H pylori infection. Sequenceanalysis revealed high similarities between the sequences of 3’region of cagA gene in H pylori isolated from Zhejiang Provinceand those in H pylori strains from Japanese patients and highsimilarities among the 6 subtype II strains, so we could draw aconclusion that despite of the genetic diversity of 3’ region ofcagA gene in H pylori strains isolated from Zhejiang Province,the sequences of the same subtype were still conservative.There were no significant differences among the subtypes of3’ region of cagA gene in different groups of gastroduodenaldiseases, so the subtypes of 3’ region of cagA gene in H pyloriisolated from Zhejiang Province seemed not to be correlatedwith the clinical outcomes of H pylori infection. In conclusion, there are three subtypes of 3’ region of cagAgene in H pylori strains isolated from Zhejiang Province.Subtype I is a predominant one and subtype II is a newly foundsubtype of Asian H pylori strains. The result of this studydoes not support the view that the subtypes of 3’ region ofcagA gene in H pylori isolated from Zhejiang Province arecorrelated with the clinical outcomes of H pylori infection.
REFERENCES1 Blaser MJ. Ecology of Helicobacter pylori in the human stomach.
J Clin Invest 1997; 100: 759-7622 Perng CL, Lin HJ, Lo WC, Tseng GY, Sun IC, Ou YH. Geno-
types of Helicobacter pylori in patients with peptic ulcer bleeding.World J Gastroenterol 2004; 10: 602-605
3 Dunn BE, Cohen H, Blaser MJ. Helicobacter pylori. Clin MicrobiolRev 1997; 10: 720-741
4 Kidd M, Lastovica AJ, Atherton JC, Louw JA. Heterogene-ity in the Helicobacter pylori vacA and cagA genes: associationwith gastroduodenal disease in South Africa? Gut 1999; 45:499-502
5 Gunn MC, Stephens JC, Stewart JA, Rathbone BJ, West KP.The significance of cagA and vacA subtypes of Helicobacter py-lori in the pathogenesis of inflammation and peptic ulceration.J Clin Pathol 1998; 51: 761-764
6 Henriksson AE, Edman AC, Nilsson I, Bergqvist D, WadstromT. Helicobacter pylori and the relation to other risk factors inpatients with acute bleeding peptic ulcer. Scand J Gastroenterol1998; 33: 1030-1033
7 Olbe L, Fandriks L, Hamlet A, Svennerholm AM. Conceivablemechanisms by which Helicobacter pylori provokes duodenalulcer disease. Baillieres Best Pract Res Clin Gastroenterol 2000;14: 1-12
8 Dore MP, Graham DY. Pathogenesis of duodenal ulcer disease:the rest of the story. Baillieres Best Pract Res Clin Gastroenterol2000; 14: 97-107
9 Censini S, Lange C, Xiang Z, Crabtree JE, Ghiara P, BorodovskyM, Rappuoli R, Covacci A. Cag, a pathogenicity island ofHelicobacter pylori, encodes type I-specific and disease-associ-ated virulence factors. Proc Natl Acad Sci U S A 1996; 93:14648-14653
10 Akopyants NS, Clifton SW, Kersulyte D, Crabtree JE, YoureeBE, Reece CA, Bukanov NO, Drazek ES, Roe BA, Berg DE.Analyses of the cag pathogenicity island of Helicobacter pylori.Mol Microbiol 1998; 28: 37-53
11 Qiao W, Hu JL, Xiao B, Wu KC, Peng DR, Atherton JC, Xue H.cagA and vacA genotype of Helicobacter pylori associated withgastric diseases in Xi’an area. World J Gastroenterol 2003; 9:1762-1766
12 Rota CA, Pereira-Lima JC, Blaya C, Nardi NB. Consensus andvariable region PCR analysis of Helicobacter pylori 3' region ofcagA gene in isolates from individuals with or without pepticulcer. J Clin Microbiol 2001; 39: 606-612
13 Yamaoka Y, Kodama T, Kashima K, Graham DY, SepulvedaAR. Variants of the 3' region of the cagA gene in Helicobacterpylori isolates from patients with different H pylori-associateddiseases. J Clin Microbiol 1998; 36: 2258-2263
14 Fang PC, Zhu YL, Yin X, Wu QD, Lan MG, Wu PJ. Study onECY blood-free medium for the isolation of Helicobacter pylori.Zhonghua Yixue Jianyan Zazhi 1993; 16: 131-133
15 Dore MP, Sepulveda AR, El-Zimaity H, Yamaoka Y, OsatoMS, Mototsugu K, Nieddu AM, Realdi G, Graham DY. Isola-tion of Helicobacter pylori from sheep-implications for trans-mission to humans. Am J Gastroenterol 2001; 96: 1396-1401
16 Xu C, Li ZS, Tu ZX, Xu GM, Gong YF, Man XH. Distributionof cagG gene in Helicobacter pylori isolates from Chinese pa-tients with different gastroduodenal diseases and its clinicaland pathological significance. World J Gastroenterol 2003; 9:2258-2260
17 Danesh J. Helicobacter pylori infection and gastric cancer: sys-tematic review of the epidemiological studies. Aliment PharmacolTher 1999; 13: 851-856
18 Higashi H, Tsutsumi R, Fujita A, Yamazaki S, Asaka M,Azuma T, Hatakeyama M. Biological activity of the Helicobacterpylori virulence factor cagA is determined by variation in thetyrosine phosphorylation sites. Proc Natl Acad Sci U S A 2002;99: 14428-14433
19 Watanabe T, Tada M, Nagai H, Sasaki S, Nakao M. Helicobacterpylori infection induces gastric cancer in mongolian gerbils.Gastroenterology 1998; 115: 642-648
20 Uemura N, Okamoto S, Yamamoto S, Matsumura N,Yamaguchi S, Yamakido M, Taniyama K, Sasaki N, SchlemperRJ. Helicobacter pylori infection and the development of gastriccancer. N Engl J Med 2001; 345: 784-789
21 Abasiyanik MF, Sander E, Salih BA. Helicobacter pylori anti-CagA antibodies: prevalence in symptomatic and asymp-tomatic subjects in Turkey. Can J Gastroenterol 2002; 16:527-532
22 Covacci A, Censini S, Bugnoli M, Petracca R, Burroni D,Macchia G, Massone A, Papini E, Xiang Z, Figura N, RappuoliR. Molecular characterization of the 128-kDa immunodominantantigen of Helicobacter pylori associated with cytotoxicity andduodenal ulcer. Proc Natl Acad Sci U S A 1993; 90: 5791-5795
23 Tummuru MK, Cover TL, Blaser MJ. Cloning and expressionof a high-molecular-mass major antigen of Helicobacter pylori:evidence of linkage to cytotoxin production. Infect Immun 1993;61: 1799-1809
24 Rudi J, Kolb C, Maiwald M, Kuck D, Sieg A, Galle PR, StremmelW. Diversity of Helicobacter pylori vacA and cagA genes andrelationship to VacA and cagA protein expression, cytotoxinproduction, and associated diseases. J Clin Microbiol 1998; 36:944-948
25 Maeda S, Ogura K, Yoshida H, Kanai F, Ikenoue T, Kato N,
Tao R et al. Subtype of 3’ region of cagA gene in H pylori 3287

Shiratori Y, Omata M. Major virulence factors, VacA and cagA,are commonly positive in Helicobacter pylori isolates in Japan.Gut 1998; 42: 338-343
26 Miehlke S, Kibler K, Kim JG, Figura N, Small SM, GrahamDY, Go MF. Allelic variation in the cagA gene of Helicobacterpylori obtained from Korea compared to the United States. AmJ Gastroenterol 1996; 91: 1322-1325
27 Pan ZJ, van der Hulst RW, Feller M, Xiao SD, Tytgat GN,Dankert J, van der Ende A. Equally high prevalences of infec-tion with cagA-positive Helicobacter pylori in Chinese patientswith peptic ulcer disease and those with chronic gastritis-asso-ciated dyspepsia. J Clin Microbiol 1997; 35: 1344-1347
28 Shimoyama T, Fukuda S, Tanaka M, Mikami T, Saito Y,Munakata A. High prevalence of the cagA-positive Helicobacterpylori strains in Japanese asymptomatic patients and gastriccancer patients. Scand J Gastroenterol 1997; 32: 465-468
29 Peek RM Jr, Miller GG, Tham KT, Perez-Perez GI, Cover TL,Atherton JC, Dunn GD, Blaser MJ. Detection of Helicobacter
pylori gene expression in human gastric mucosa. J Clin Microbiol1995; 33: 28-32
30 Perez-Perez GI, Bhat N, Gaensbauer J, Fraser A, Taylor DN,Kuipers EJ, Zhang L, You WC, Blaser MJ. Country-specificconstancy by age in cagA+ proportion of Helicobacter pyloriinfections. Int J Cancer 1997; 72: 453-456
31 Yamaoka Y, Osato MS, Sepulveda AR, Gutierrez O, FiguraN, Kim JG, Kodama T, Kashima K, Graham DY. Molecularepidemiology of Helicobacter pylori: separation of H pylori fromEast Asian and non-Asian countries. Epidemiol Infect 2000;124: 91-96
32 Yamaoka Y, Graham DY. Clarifications regarding the 3’ repeatregion of the cagA gene in Helicobacter pylori and clinical outcome.J Clin Microbiol 2001; 39: 2369-2370
33 You JF, Fang PC, Ye SJ, Mao HY, Zhou LF, Qiu X. Helicobacterpylori cagA, vacA and iceA status of Zhejiang province andrelationship to clinical outcomes. Zhonghua Weishengwuxue HeMianyixue Zazhi 2003; 23: 111-112
Edited by Kumar M and Wang XL Proofread by Xu FM
3288 ISSN 1007-9327 CN 14-1219/ R World J Gastroenterol November 15, 2004 Volume 10 Number 22

PO Box 2345, Beijing 100023, China World J Gastroenterol 2004;10(22):3289-3291Fax: +86-10-85381893 World Journal of GastroenterologyE-mail: [email protected] www.wjgnet.com Copyright © 2004 by The WJG Press ISSN 1007-9327
• H pylori •
Pathogenicty and immune prophylaxis of cag pathogenicity island
gene knockout homogenic mutants
Huan-Jian Lin, Jing Xue, Yang Bai, Ji-De Wang, Ya-Li Zhang, Dian-Yuan Zhou
Huan-Jian Lin, Jing Xue, Yang Bai, Ji-De Wang, Ya-Li Zhang,Dian-Yuan Zhou, PLA Institute of Digestive Medicine, Nan FangHospital, the First Military Medical University, Guangzhou 510515,Guangdong Province, ChinaCorrespondence to: Dr. Huan-Jian Lin, Institute for DigestiveMedicine, Nan Fang Hospital, the First Military Medical University,Guangzhou 510515, Guangdong Province, China. [email protected]: 2003-06-16 Accepted: 2003-08-25
Abstract
AIM: To clarify the role of cag pathogenicity island (cagPAI)of Helicobacter pylori (H pylori ) in the pathogenicity andimmune prophylaxis of H pylori infection.
METHODS: Three pairs of H pylori including 3 strains ofcagPAI positive wildtype bacteria and their cagPAI knockouthomogenic mutants were utilized. H pylori binding to thegastric epithelial cells was analyzed by flow cytometry assays.Apoptosis of gastric epithelial cells induced by H pylori wasdetermined by ELISA assay. Prophylaxis effect of thewildtype and mutant strains was compared by immunizationwith the sonicate of the bacteria into mice model.
RESULTS: No difference was found in the apoptasis betweencagPAI positive and knockout H pylori strains in respectiveof the ability in the binding to gastric epithelial cells as well asthe induction of apoptosis. Both types of the bacteria wereable to protect the mice from the infection of H pylori afterimmunization, with no difference between them regarding tothe protection rate as well as the stimulation of the proliferationof splenocytes of the mice.
CONCLUSION: The role of cagPAI in the pathogenicityand prophylaxis of H pylori infection remains to be cleared.
Lin HJ, Xue J, Bai Y, Wang JD, Zhang YL, Zhou DY. Pathogenictyand immune prophylaxis of cag pathogenicity island geneknockout homogenic mutants. World J Gastroenterol 2004;10(22): 3289-3291
http://www.wjgnet.com/1007-9327/10/3289.asp
INTRODUCTIONHelicobacter pylori (H pylori) infected over half of human adultsin the world, especially in Asian-Pacific countries. Only a smallportion of patients display clinical symptoms such as pepticulcer and gastric cancer[1-14]. The difference between the infectionand the outcomes is determined by both bacterial factors andhost responses. Among the bacterial factors, cag pathogenicityisland (PAI) had been studied widely, while the immuneresponse to the infection is the overwhelming host factor thataffects the outcome of infection. In respect of the bacterialfactors, cytotoxin associated gene A (cag A) protein is usuallyconsidered as a toxic marker of the bacterium. A related genecluster, PAI encodes several proteins with the similar biologicalactivities. To define the relationship bwteen cagPAI and thepathogenicity of H pylori, three pairs of H pylori haboured
cagPAI and their isogenic PAI knockout mutants were utilized.Their roles in the binding and apoptosis inducing activities as wellas the immune protection were compared in vivo and in vitro.
MATERIALS AND METHODSMaterialsCT, PKH26, PMA and Ionomycin were obtained from SigmaCo. U.S.A; granulocyte-macrophage-colony-stimulating-faction(GM-CSF) enzyme linked immunosorbent assay (ELISA) kit wasbought from Boehringer-Mannheim Co. German; Three pairs of Hpylori habouring cagPAI and their isogenic PAI knockout mutantswere provided kindly by Professor Peter B Ernst from DyKesasUniversity USA; H pylori strains and gastric epithelial cells(Kato-III) were from the Research Institute of Digestive Disease,Nanfang Hospital, First Military Medical University inGuanzhou , China. H pylori strains are showed in Table 1.
Table 1 cagA positive wildtype bacteria and their cagA knock-out homogenic mutants
H pylori cagPAI
LC11 + wildtypeAH244 knockou cagPAI knockout of LC1184183 + wildtype2-1 knockou cagPAI knockout of 8418326695 + wildtype8-1 knockou cagPAI knockout of 26695
MethodsH pylori culture and H pylori sonicate (SON) preparationwere performed by standard procedures There was no differencebetween the groups of wildtype and knockout bacteria in therate of growing (Figure 1).
Figure 1 Eqivalent growth of wildtype and knockout strainsafter 2 d culture.
Flow cytometry was used to detect adhesion of H pylori bindingto gastric epithelial cells H pylori strain (ATCC26695) wasmarked by 10 mL/L PKH-26 and washed three times. The liqiudafter the third washing was used in the control groups, thenbound to gastric epithelial cells (KatoIII) (bactria/cells = 300:1),and incubated at 37 for 60 min. After washed, the sample wasdetected by FACs.
CFU
×108
LC11 AH244 84183 2-1 26695 8-1
6
5
4
3
2
1
0
cagPAI+
cagPAI-

3290 ISSN 1007-9327 CN 14-1219/ R World J Gastroenterol November 15, 2004 Volume 10 Number 22
ELISA was used to detect apoptosis of gastric epithelial cellsinduced by H pylori The basic mechanism was to detect therelease of DNA combined histone. Accroding to the recommendedprocedures, cracked Kato-III cells with anti-histone monoclonalantibody were incubated and color was developed after addingsubstrate. Absorbency at the 405 nm level was measured in theenzyme-tagging instrument. Then, the apoptotic index (AI) wascalculated in comparison with control group. Mice were divided into 4 groups, five mice each group,exceptfor the natural death. PBS Group: 200 µL PBS /one mouse wasfed once via mouth as negative control; CT Group: CT (10 µg)200 µL/per mouse was fed once via mouth as adjuvant controlGroup; CagPAI positive Group: ultrasonic smashed H pylori26695 (100 µL)and CT (10 µg) was fed at a time via mouth;CagPAI negative Group: ultrasonic smashed H pylori 8-1 (100 µL)and CT (10 µg) were fed once via mouth.
Immunity proceduresBefore immunization and inoculation of H pylori, the mice wereprohibited from water and food for over 12 h. Thirty min beforeinoculation, the mouse was fed with 200 µL (0.01 mol/L) NaHCO3
solution to neutralize gastric acid. The experimental group andthe control group were inoculated with antigens and adjuvants,immunized on d 0, 7, and 14. They were allowed to drink water1 h after immunization. Each group was attacked with H pylori108CFU once every other day, 3 wk after the latest immunization.The mice were killed 8 wk after the latest attack.
Evaluation of bacterial implantationThe spleen and stomach were removed immediately after themouse neck was broke. The spleen was kept in the axenic cellculture media temporarily and dealt with it for 4 h. The stomachwas cut along the greater curvature, washed with axenic fluid,then some tissues were sampled for rapid urea enzyme test andhistological examination. Histological examination was gradedsemi-quantitatively according to the standard as follows: 0 point:no H pylori; 1 point: 1-2 H pylori in some gastric pits; 2 points:3-10 H pylori in majority of gastric pits and 3 points: over 10H pylori in majority of gastric pits.
Spleen cell proliferation textSpleen tissue was triturated into homogenates at asepsisenvironment. The spleen cells were counted and implanted inthe 96 well plate (2×10⁵ cells/well) containing 500 ng/mL PMAand 10 ng/mlionomycin RPMI1640 (including cow blood serum,mycillin, Hepes ect), H pylori ultrasonic smashed antigen wasadded into them in terms of 2.5, 5, 10 mg/mL, cultured for 24 h,then H3-thymidine was added, and cultured for 8 h, then thecelt were collected and degraded. Each control group wascompared with the blank control group in the count, and theproliferation quotiety was calculated. Differential proliferationquotiety epuals each group’s proliferation quotiety/PBSgroup’s proliferation quotiety ×100%.
Statistical analysisData and their variance were analyzed using EXCEL software.P<0.05 was considered statistically significant.
RESULTSAdherence of CagPAI and H pyloriCagPAI positive culture and mutant strains showed a differentbacteria/cell ratio, and were, marked with PKH26, then theywere incubated with stomach cell Kato-III, the adherence abilitywas measured with flow cytometry positive cells and meanfluorescence intensity (MFI) were calculated. No differencewas found between wild strain and mutant strain. The resultwas displayed in Figure 2.
Figure 2 Binding of cag PAI wildtype H pylori and their mutantto gastric epithelial cell Kato-III.
Apoptosis-induced ability of cagPAI and H pyloriCagPAI and mutant strain were cultured with gastric epitheliacells at the ratio 300:1 for 24 h. The cells were degeaded, thecell apoptosis was detected by ELISA. We found that theapoptosis-induced ability of 26 695 was slighty higher thanthat of 8-1 strain, and no diffirence was found in other couples.The result is displayed in Figure 3.
Figure 3 Apotosis of gastric epithelial cells induced by positivecagPAI and knockout H pylori strains (determined by ELISAaP<0.05 vs the control).
Immune prevention to the cagPAI and H pyloriThe protection rate of groups PBS ,CT, 26695 and 8-1 was 0%,0%, 40%. 60% (Table 2). CagPAI positive strain ATCC26695and mutant strain 8-1 companied with mucous membraneadjuvant choleratoxin prevented H pylori from growing in thestomach of mice. There was no difference between the CagPAIpositive strain and CagPAI negative strain. We found that full-protect rate of the two H pylori immune group was only 20% orso. It was found that immune was apparently decrease in semi-quantitative counting. No obvious difference was foundbetween groups, and CT grouphad no prevention effect. Theresult is displayed in Figure 4.
Table 2 Ultrasonic smashed substance’s protection againstmice H pylori (result of urease test)
Immune project Urease test (+)/number Protecting ratio (%) of animals (piece)
PBS 5/5 0
CT 5/5 0
26695 SON+CT 3/5 40a
8-1 SON+CT 2/5 60
aP<0.05, vs control groups.
LC11
84-183
26695
AH244
2-1
8-1
Control
H pylori binding cells
Apopto
tic
index
Control LC11 84-183 26695
AH244 2-1 8-1
3
2
1
0
Control
Cag PAI+
Cag PAI-
a a a a
a
a

Figure 4 Semi-quantatative results of bacteria by histologicalexamination. aP<0.05 vs PBS control.
cagPAI and cell Immune of mice H pyloriComparing with PBS control, the CT control number of spleen cellswas slightly increased, but that of two H pylori antigen-immunegroups was greatly increased. The number of CagPAI mutantstrains was more obvious. Compared with the two groups, nodifference was found, (P<0.05, Figure 5).
Figure 5 Specific proliferation index of immunized mice(compared to PBS group).
DISCUSSIONCagA is cytotoxin correlative protein, which is one of H pylorinosogenetic factors. The PAI is regarded as one of the signs ofH pylori infection. Early researches found that this positivesign was higher in peptic ulcer and gastric carcinoma than ingastritis. For example, foreign reseachers found that anti-CagPAIin serum was positive in 93% of the gastric carcinoma patients[2],it is different in Asian-Pacitic area, the positive ratio of the bacterialstrain was much higher. A large number of reports approved thatthe pathogenicity of CagA (+) was stronger than that of CagA (-),inducing the production of IL-8 and GRO-α, ENA78 could produceand activated related nucleic transcription factors[3]. Few reportsabout comparson of wildtype strain isogenic mutant strain invitro were available. We studied three pairs of cagPAI wildtypestrain and cagPAI gene-knockout mutant strain constructedby Dr. Bery. No difference was found between the growingspeed and activity of the two strains. Therer were many gene produces concerned with H pyloriadherence, including NLBH, porins, BabA etc[4-9]. Our studyshowed that there was no difference in adherence to the epitheliaof stomach between cagPAI (+) strain and cagPAI (-) strain. CagPAI (+) strain could cause apoposis and proliferation instomach epithelia[10]. However, it was proved by ELISA in ourresearch that in vitro cagPAI was not concerned with apoptosis-induced ability, which did agree with the result of Le’Negrate.They found that cagE in cagPAI participated in the prosess ofFas-induced H pylori causing stomach epithelial apoptosisdue to different the strain. we chose two stains in three pairs ofstrains, so the result was probably accurate. In the immune prevention of H pylori infection, it was reportedthat cagA could prevent infection of the cagPAI (+). In our research,
Lin HJ et al. Cag Pathogenicity island 3291
SS1 strain which was used to infect animals was cag (+) strain,but we found that there was no difference in preventive effectbetween cagPAI (+) strain and mutant strain. Although therewas no statistical difference, mutant stain had a higher protectivetrend. It showed that the immune prevention was not causedby protein coded by cagPAI. We do not support regardingcagPAI gene product is immune antigen of H pylori bacterin. Cellular immunity, especially CD4+T cellular immunity is avery important mechanism , which can help B cells produce sIgA.We selected the spleen cell proliferation test as the target in immune.Because B cells could not live in vitro, the proliferation cells weremainly T cells. Both cagPAI (+) and cagPAI (-) strain were stimulatedto proliferate T cells, indicating that some special T cells clones areexisted in spleen cells. The number of cagPAI mutant strains ismore than that of cagPAI (+) strains, agreeing with the histology. The effect of cagPAI on H pylori immune and pathogenesisis very complex and needs further study.
REFERENCES1 Bai Y, Zhang YL, Wang JD, Zhang ZS, Zhou DY. Construction
of the non-resistant attenuated Salmonella typhimurium strainexpressing Helicobacter pylori catalase. Diyi Junyi Daxue Xuebao2003; 23: 101-105
2 Vandenplas Y. Helicobacter pylori infection. World J Gastroenterol2000; 6: 20-31
3 Blaser MJ. Hypothesis: the changing relationships of Helicobacterpylori and humans: implications for health and disease. J InfectDis 1999; 179: 1523-1530
4 Covacci A, Censini S, Bugnoli M, Petracca R, Burroni D, MacchiaG, Massone A, Papini E, Xiang Z, Figura N, Rappuoli R. Mo-lecular characterization of the 128-kDa immunodominant an-tigen of Helicobacter pylori associated with cytotoxicity andduodenal ulcer. Proc Natl Acad Sci U S A 1993; 90: 5791-5795
5 Blaser MJ, Perez-Perez GI, Kleanthous H, Cover TL, Peek RM,Chyou PH, Stemmermann GN, Nomura A. Infection withHelicobacter pylori strains possessing CagA is associated withan increased risk of developing adenocarcinoma of the stomach.Cancer Res 1995; 55: 2111-2115
6 Odenbreit S, Puls J, Sedlmaier B, Gerland E, Fischer W, HaasR. Translocation of Helicobacter pylori CagA into gastric epithe-lial cells by type IV secretion. Science 2000; 287: 1497-1500
7 Bai Y, Dan HL,Wang JD, Zhang ZS, Odenbreit S, Zhou DY,Zhang YL. Cloning, expression, purification and identificationof conservative region of four Helicobacter pylori adhesin genesin AlpA gene. Prog Biochem Biophys 2002; 29: 922-926
8 Bai Y, Zhany YL, Chen Y, Wang JD, Zhou DY. Study of Immu-nogenicity and safety and adherence of conservative region offour Helicobacter pylori adhesin in vitro. Prog Biochem Biophys2003; 30: 422-426
9 Bai Y, Zhang YL, Wang JD, Zhang ZS, Zhou DY. Cloning andimmunogenicity of conservative region of adhesin gene ofHelicobacter pylori. Zhonghua Yixue Zazhi 2003; 83: 736-739
10 Bai Y, Wang JD, Zhang ZS, Zhang YL. Construction of theAttenuated Salmonella typhimurium strain expressingHelicobacter pylori conservative region of adhesin antigen. ChinJ Biotech 2003; 19: 77-82
11 Bai Y, Chang SH, Wang JD, Chen Y, Zhang ZS, Zhang YL.Construction of the E.coli clone expressing adhesin BabA ofHelicobacter pylori and evaluation of the adherence activity ofBabA. Diyi Junyi Daxue Xuebao 2003; 23: 293-295
12 Bai Y, Zhang YL, Wang JD, Lin HJ, Zhang ZS, Zhou DY. Con-servative region of the genes encoding four adhesins ofHelicobacter pylori: cloning, sequence analysis and biological in-formation analysis. Diyi Junyi Daxue Xuebao 2002; 22: 869-871
13 Rudnicka W, Covacci A, Wadstrom T, Chmiela M. A recom-binant fragment of Helicobacter pylori CagA affects prolifera-tion of human cells. J Physiol Pharmacol 1998; 49: 111-119
14 Wang RX, Zhang LY, Yin DL, Mufson RA, Shi Y. Protein kinaseC regulates fas (CD95/APO-1) expression. J Immunol 1998;161: 2201-2207
Edited by Wang XL and Zhang JZ Proofread by Xu FM
PBS CT 26695 SON 8-1 SON
5
4
3
2
1
0
aa3.25
4.00
0.500.25
2.5 5 10
250
200
150
100
50
0
H pylori antigen concentration (mg/mL)
CT
26695
8-1
Speci
fic
pro
lifera
tion inder
(%)

PO Box 2345, Beijing 100023, China World J Gastroenterol 2004;10(22):3292-3298Fax: +86-10-85381893 World Journal of GastroenterologyE-mail: [email protected] www.wjgnet.com Copyright © 2004 by The WJG Press ISSN 1007-9327
• BASIC RESEARCH •
Mechanisms mediating cholinergic antral circular smooth muscle
contraction in rats
Helena F Wrzos, Tarun Tandon, Ann Ouyang
Helena F Wrzos, Tarun Tandon, Ann Ouyang, Division ofGastroenterology and Hepatology, Department of Medicine, Collegeof Medicine, Pennsylvania State University, USASupported by NIH grant RO1-DK-34148Correspondence to: Ann Ouyang, Division of Gastroenterology andHepatology, Department of Medicine, College of Medicine,Pennsylvania State University, PO Box 850, Hershey, PA 17033,USA. [email protected]: +717-531-8741 Fax: +717-531-6770Received: 2004-01-15 Accepted: 2004-02-13
Abstract
AIM: To investigate the pathway (s) mediating rat antral circularsmooth muscle contractile responses to the cholinomimeticagent, bethanechol and the subtypes of muscarinic receptorsmediating the cholinergic contraction.
METHODS: Circular smooth muscle strips from the antrumof Sprague-Dawley rats were mounted in muscle baths inKrebs buffer. Isometric tension was recorded. Cumulativeconcentration-response curves were obtained for (+)-cis-dioxolane (cD), a nonspecific muscarinic agonist, at 10-8-10-4 mol/L, in the presence of tetrodotoxin (TTX, 10-7 mol/L).Results were normalized to cross sectional area. A repeatconcentration-response curve was obtained after incubationof the muscle for 90 min with antagonists for M1 (pirenzepine),M2 (methoctramine) and M3 (darifenacin) muscarinic receptorsubtypes. The sensitivity to PTX was tested by the ip injectionof 100 mg/kg of PTX 5 d before the experiment. The antralcircular smooth muscles were removed from PTX-treatedand non-treated rats as strips and dispersed smooth musclecells to identify whether PTX-linked pathway mediated thecontractility to bethanechol.
RESULTS: A dose-dependent contractile response observedwith bethanechol, was not affected by TTX. The pretreatmentof rats with pertussis toxin decreased the contraction inducedby bethanechol. Lack of calcium as well as the presence ofthe L-type calcium channel blocker, nifedipine, also inhibitedthe cholinergic contraction, with a reduction in responsefrom 2.5±0.4 g/mm2 to 1.2±0.4 g/mm2 (P<0.05). The dose-response curves were shifted to the right by muscarinicantagonists in the following order of affinity: darifenacin(M3)>methocramine (M2)>pirenzepine (M1).
CONCLUSION: The muscarinic receptors-dependentcontraction of rat antral circular smooth muscles was linkedto the signal transduction pathway(s) involving pertussis-toxinsensitive GTP-binding proteins and to extracellular calciumvia L-type voltage gated calcium channels. The presence ofthe residual contractile response after the treatment withnifedipine, suggests that an additional pathway could mediatethe cholinergic contraction. The involvement of more thanone muscarinic receptor (functionally predominant type 3 overtype 2) also suggests more than one pathway mediatingthe cholinergic contraction in rat antrum.
Wrzos HF, Tandon T, Ouyang A. Mechanisms mediating
cholinergic antral circular smooth muscle contraction in rats.World J Gastroenterol 2004; 10(22): 3292-3298
http://www.wjgnet.com/1007-9327/10/3292.asp
INTRODUCTIONThe mechanisms involved in the regulation of cholinergiccontraction of intestinal smooth muscle are complex and notfully understood, despite the important role of the cholinergicsystem in the physiology of gastric emptying, and pathophysiologyof several motility disorders. Cholinergic agonists activatemuscarinic receptors which transduce cholinergic signals byactivating G proteins[1,2]. Different signal transduction pathwaysin different species, as well as different pathways for the circularand longitudinal layers of intestinal smooth muscle have beenreported[3-15]. Specific muscarinic receptors are abundantly present in thesmooth muscles of gastrointestinal tract[16-22]. Muscarinicreceptor subtypes have shown a G-protein coupling specificity,however the published data are inconsistent. In some studiesM1, M3, M5 receptor subtypes were preferentially coupled tothe Gq/11 protein class, the M2 and M4 receptors were linked tothe PTX-sensitive Gi/Go proteins[23-25], Whereas in other studiesmuscarinic M2 receptors were insensitive to pertussis toxin[26]. Relatively few references are published characterizing ratstomach muscarinic receptor subtypes, again with conflictingresults. Prevalence of M3
[13,22,27], or of M1[28], or M2 receptors[29-33]
has been reported. Which muscarinic receptor is more functionallyimportant in the cholinergic contraction of antral circular musclehas not been determined. The aim of this study was to examine the signal transductionpathway (s) mediating rat antral smooth muscle cholinergiccontraction to fill the existing knowledge gaps: (1) what type ofcalcium channel was involved and was there a dependence onextracellular Ca2+ influx; (2) whether PTX-sensitive- or PTX-insensitive-G proteins coupled to muscarinic receptors wereinvolved; and (3) what subtypes of specific muscarinic receptorswere functionally involved. Determining the physiology of thepathway (s) mediating cholinergic contraction of the antrumshould be helpful in understanding the functional motilitychanges described in models of disease conditions, such asdiabetes[34-36]. Preliminary accounts of some of these observationshave been published in abstract form[37,38].
MATERIALS AND METHODSAnimalsYoung adult male Sprague-Dawley rats (Charles River BreedingLaboratories), weighing 200-450 g were used. Animalswere anesthetized by ip injection of sodium pentobarbital(30-65 mg/kg). Anesthesia was given immediately before thetissue removal to avoid the effect of anesthesia on the contractileproperties of the tissue. The abdomen was explored throughmidline incision and the stomach was removed. After the tissuewas removed, animals were euthanized by injection of anoverdose of pentobarbital. All our studies were approved bythe Institutional Animal Care and Use Committee of the PSUCollege of Medicine.

Smooth muscle strip bath preparation[39]
The antrum tissue was pinned in a dissecting dish in oxygenatedKrebs solution, mucosa was gently removed by scraping, andstrips were cut in the circular muscle orientation. The musclewas oxygenated in Krebs physiological buffer containing(in mmol/L) 130 Na, 4.7 K, 2.5 Ca, 1.0 Mg2, 140.7 Cl, 19 HCO3, 1.0PO4
and 10 glucose at 37 . The strips were sutured at one endto a glass rod and at the other end to an inelastic wire. The tissue,the rod and a wire were placed in a 10-mL double walled glasschamber with a constant temperature 37 . Glass surfaceswere silicone coated with Sigmacote to prevent binding of thepeptides. The chambers were filled with 5 mL of Krebs bufferand gassed with 95:5 mixture of O2/CO2. The free end of wirewas attached to an isometric force transducer (Grass InstrumentCo) and recordings were made on a multichannel rectilineardynograph recorder (Beckman Instruments). The strips wereallowed to equilibrate for 1 h. Tissues were stretched to aninitial length (Li) from which any additional stretch resulted inan increase in tension. The isometric tension response tobethanechol (10-4 mol/L) was noted. The strips were rinsed andthe length increased by 1 mm increment until the maximumresponse to bethanechol (10-4 mol/L) was recorded. This lengthwas labeled Lo. All subsequent studies were conducted at thislength. Drugs were added to the tissue bath and the peak responsewithin 8 min was compared with the maximum tension recordedduring 5 min before addition of drugs. Antagonists were added1 min before the addition of agonist. The peptidase inhibitorsbestatin and phosphoramidon (both at 10-6 mol/L) were added atleast 5 min before the agonist addition. The response was calculatedas the change in the maximal force of contraction in g of tensionnormalized to the cross sectional area which was calculated as:cross section (mm2) = weight (g)/specific density×length (mm),where the specific density of muscle tissue = 1.056 (g/mm3).
Dispersed single muscle cell preparation[40,41]
Smooth muscle cells were isolated from the circular musclelayer of the antrum. The mucosa was removed by dissectionand the longitudinal muscle layer (with enteric plexus ganglia)was removed in strips using a Stadie-Riggs tissue slicer (ThomasTM). The circular muscle layer was minced and incubated for45 min twice in Hepes buffer containing collagenase (CLS typeII, Worthington) and 0.1 g/L soybean trypsin inhibitor at 31 .Partially digested strips were washed with enzyme-free Hanks'medium. Muscle cells were allowed to disperse spontaneouslyunder the gentle force of bubbling 950 mL/L O2+50 mL/L CO2 for30 min (no agitation), and then filtered through 500 µmol/L Nitinolmesh, to the culture media. Viability was checked by trypan blueexclusion test. Aliquots of cells were added to solutions containingthe agonists at room temperature. The reaction was stoppedafter 30 min, by addition of acrolein to the final concentration of1%. Aliquots were sealed under coverslips. Computerized imageanalysis (NIH Image 1.62) was used for quantification. A scaleslide was used for reference. The length of single muscle cellswas measured (at least 50 cells per concentration).
Contractile response of antrum smooth muscle strips to cholinergicagonistTo determine the effect of bethanechol on antrum circularsmooth muscle contraction, muscle strips were exposed to theincreasing doses of muscarinic agonist, bethanechol, at theconcentrations of 10-4 to10-7 mol/L in an organ bath.
Characteristics of effect of extracellular Ca2+ and type of calciumchannel involvedTo determine whether cholinergic contraction depended on theinflux of extracellular Ca2+, the response to bethanechol chloridein the physiological Krebs buffer was tested, then the bufferwas changed into Ca-free buffer (in mmol/L: NaCl 132.5; KCl 4.
7; MgCl2 1.0; NaH2PO4 1.2; NaHCO3 20.0; D-glucose 10; EGTA(50 µmol/L), and contraction was subsequently recorded after5 and 10 min. To characterize the type of calcium channel involved in thecholinergic contraction, nifedipine (an L-type calcium channelantagonist) was used. Nifedipine was dissolved in ethanol andadded to the physiological Krebs buffer at the concentrationof 10-5 mol/L[42] and contraction was recorded. Statisticalsignificance of the difference between contraction in the presenceand absence of nifedipine was calculated by paired t-test, theresults were considered statistically significant at P 0.05.
Treatment with pertussis toxin (PTX)In order to determine whether PTX-sensitive pathway wasinvolved in cholinergic contraction, strips and dispersed musclecells (myocytes) isolated from the antrum of PTX-pretreatedand non-pretreated animals were compared. Rats were injected with 100 mg/kg of PTX (dissolved insaline) intraperitoneally 5 d before the study[43]. Muscle stripsfrom PTX-treated and control rats in the tissue bath were exposedto cholinergic agonist, bethanechol, at the concentration of 10-4
to 10-6 mol/L. Statistical significance of the difference betweenthe contraction of the muscle from PTX-pretreated and non-treated rats was defined by non-paired t-test, the results wereconsidered statistically significant at P 0.05. The changes in the pattern of contraction of muscle cells indispersed cell suspension were also measured (detailed descriptionin the “dispersed muscle cell preparation” section of Materials& Methods). Two concentrations of bethanechol (10-7 and10-8 mol/L) were added to the cell suspensions in the tubes inthe physiological buffer. Their contractions were measured asthe percentage of the control cell diastolic length[44]. The meanlengths of cells from control rats were compared to those of thecells from PTX-treated animals. Results were presented asmean±SE. Statistical significance of the difference wascalculated by the paired t-test, the results were consideredstatistically significant at P 0.05.
Characterization of muscarinic receptor subtypes involvedFor the characterization of muscarinic receptor subtypesinvolved in cholinergic contraction we used a non-selectivemuscarinic agonist, (+)-cis-Dioxolane[45,46] and relatively specificreceptor subtype antagonists. The conditions of organ bath were described above in the“Smooth muscle strip bath preparation” section of Materialsand Methods. At the start of the experimental protocol, theviability of each tissue was assessed by determining the contractileresponse to bethanechol (10-4 mol/L). After washed, tissueswere re-equilibrated for 10 min and allowed to regain baselinetension. Cumulative concentration-effect curves of (+)-cis-Dioxolane, (10-8 to 3×10⁻⁵ mol/L) were constructed for eachtissue. Tissues were then equilibrated in either the absence(control) or presence of the antagonist for 90 min. Subsequently, asecond concentration-effect curve to (+)-cis-Dioxolane wasconstructed. Smooth muscle strips were incubated with increasingconcentrations of antagonists demonstrating a relative specificityfor M1, M2 or M3 muscarinic receptor subtypes (pirenzepine,methoctramine and darifenacin, respectively). Each antral smoothmuscle strip was exposed to only one concentration of antagonistsand incubated for 90 min at 37 , with a fresh antagonist addedto the medium every 30 min[47,48]. The EC50 values for muscarinic antagonists were obtained(i.e. antagonist concentration resulting in 50% of inhibition ofthe contraction induced by cholinergic agonist, (+)-cis-Dioxolane (10-6 mol/L).
DrugsTetrodotoxin (TTX), sigmacote, neurokinin A (NKA), nifedipine,
Wrzos HF et al. Cholinergic antral circular smooth muscle contraction in rats 3293

papain, peptidase inhibitors bestatin and phosphoramidon, soybeantrypsin inhibitor, acrolein and pirenzepine (predominantly M1
muscarinic receptor antagonist), were from Sigma, St. Louis, MO. (+)-cis-dioxolane (cholinergic agonist) and methocramine(predominantly M2 muscarinic receptor antagonist) werepurchased from RBI Inc., Natick, MA. PTX was purchasedfrom List Biological Labs, Inc., Campbell, CA. Bethanechol chloridewas purchased from Merck, West Point, PA and collagenase (CLStype II) from Worthington, PA. Darifenacin (predominantly M3
muscarinic receptor antagonist) was a generous gift from PfizerLtd, Sandwich, Kent, GB.
RESULTSDose-response curve to cholinergic agonistA contractile dose-response was observed, when the antralcircular smooth muscle strips were exposed to the increasingdoses of muscarinic agonist, bethanechol, at the concentrationsof 10-4 to 10-7 mol/L in an organ bath. A significant increase ofthe tension over the baseline was observed at the bethanecholconcentrations of 10-4 to 10-6 mol/L (Figure 1, n = 4).
Figure 1 Effect of bethanechol on smooth muscle contraction.Antrum circular smooth muscle strips were incubated with increas-ing concentrations of bethanechol (10-4 mol/L to 10-7 mol/L).The vertical axis represents the developed tension (in gramsper mm2). Bethanechol significantly increased circular muscletension (P<0.05; paired t- test). Each data point representsmean±SE, n = 4.
Effect of tetrodotoxin (TTX)Antrum circular smooth muscle strips were exposed to bethanecholat the concentration of 10-5 mol/L, in a buffer containingtetrodotoxin (10-5 mol/L), added prior to bethanechol to the organbath. The cholinergic contraction was not affected by tetrodotoxin,neuronal toxin, with the contraction at 94.9±3.2% of control. The lack of inhibition of the contraction by TTX confirmedthat a cholinergic agonist could induce contraction via muscarinicreceptors present at the smooth muscle, without participationof neuronal factor.
Effect of calcium depletion on cholinergic contraction andcharacterization of a calcium channel subtype involvedCalcium-free buffer Incubation in calcium-free buffer diminishedthe antral contractile response to bethanechol (10-4 mol/L), witha reduction in response from 2.5±0.4 g/mm2 to 1.2±0.4 g/mm2
(P<0.05) after 5 min of incubation in calcium-free buffer. After10 min of incubation in Ca2+ -free buffer contractile activity wasalmost abolished (Figure 2). Full recovery of the contraction was seen after return of theCa2+ to the tissue bath medium, indicating that there was nodamage to the cell resulting in a decreased contraction. Theseresults showed that cholinergic contraction was dependent onthe presence of extracellular calcium, a receptor-operated Ca2+
or voltage-sensitive Ca2+ channels.
Effect of calcium channel blocker The L-type calcium channelblocker, nifedipine at a concentration of 10-5 mol/L inhibited thecholinergic contraction response of antrum to the bethanechol, atthe concentration of 10-4 mol/L from 4.02±0.9 to 0.49±0.18 g/mm2
(P<0.05), indicating that the L-calcium channel could mediatethis contraction.
Figure 2 Effect of depletion of Ca2+ from medium on the con-traction of antral circular smooth muscle strips to bethanechol(10-4 mol/L). Ca2+ depletion caused a significant decrease in themuscle tension; after 5 min incubation (P<0.06, paired t-test);and after 10 min incubation (P<0.005, paired t-test) comparedto the base contraction induced by bethanechol before Ca2+
depletion. Each data point represents mean±SE, n = 3.
Identification of G-protein-linked signal transduction pathwayby PTXThe response to bethanechol of antral circular muscle stripsand dispersed smooth muscle cells from PTX-pretreated andcontrol rats was compared (see Methods).Smooth muscle strips The contractile response to bethanecholof the muscle strips from the PTX-pretreated animals wassignificantly lower than that of the muscle strip from the non-treated control rats at all concentrations, 10-6 to 10-4 mol/L(Figure 3, P 0.01).
Figure 3 Effect of PTX on antrum circular smooth musclestrips contraction to bethanechol (10-4 mol/L to 10-6 mol/L).PTX significantly inhibited the contractile activity of the smoothmuscle (P 0.01; paired t-test) compared to control rats. Eachpoint represents mean±SE, n = 7; dotted bars represent controlanimals; solid bars-PTX-pretreated animals.
The inhibiting effect of PTX on the contraction implied thatcholinergic agonist was activating a PTX-sensitive pathway. A low level of residual contractile activity was observed inthe contraction of PTX-treated muscle strips suggesting eitherthat there was a small PTX-insensitive fraction involved, orthat the dose of PTX used was insufficient to completely inhibitPTX-sensitive pathways.Dispersed antral smooth muscle cells When dispersed myocytesfrom PTX-treated rats and controls were compared, cells fromPTX-pretreated rats showed significantly less contraction to
3294 ISSN 1007-9327 CN 14-1219/ R World J Gastroenterol November 15, 2004 Volume 10 Number 22
Tension (g/m
m2)
-10 -9 -8 -7 -6 -5 -4 -3
8
6
4
2
0
Log bethanechol (m)
Tension (g/m
m2)
Control 5 min 10 min
3
2
1
0
Contraction by bethanechol (10-4 mol/L) in Ca 2+ free medium
P<0.005
P = 0.06
Control
PTX-pretreated
Tension (g/m
m2)
-6 -5 -4
10.0
7.5
5.0
2.5
0.0
Log bethanechol (m)
P = 0.01P<0.01
P = 0.01

bethanechol than the cells isolated from the rats non-treated withPTX, at both bethanechol concentrations, 10-8 and 10-7 mol/L(Figure 4, P 0.005). The inhibiting effect of PTX on thedispersed myocytes contraction, confirmed the smooth musclestrip data and suggested that the cholinergic agonist involvedan occupation of specific muscarinic receptors coupled to PTX-sensitive mediated pathway.
Figure 4 Effect of PTX on dispersed antral circular smoothmuscle myocytes from PTX-pretreated rats contraction tobethanechol (10-7 mol/L and 10-8 mol/L). Myocytes from PTX-treated rats contracted less than myocytes from control rats.Each point represents mean±SE; of the percentage of the con-trol cells diastolic length (no bethanechol). At least 50 myocytesper point were calculated, P<0.005; n = 7 and 11. Dotted barsrepresent control animals; solid bars PTX-pretreated animals.
Characterization of the type of muscarinic receptor subtypesinvolved in contraction to cholinergic agonist To definepharmacologically the muscarinic receptors involved in thecholinergic contraction, specific muscarinic receptor antagonistswere used in the presence of tetrodotoxin (10-7 mol/L). For this functional muscarinic receptor study we chose anon-selective cholinergic agonist, (+)-cis-Dioxolane (seeMethods), instead of bethanechol, which has been reported toselectively stimulate M3 receptor[45,46,49].Pirenzepine, the M1 muscarinic receptor antagonist, was usedat the concentrations from 3×10⁻⁵ to 10-8 mol/L. Pirenzepine causeda significant inhibition of the of the contractile muscle responseto the (+)-cis-dioxolane (Figure 5).
Figure 5 Concentration-response curves for the contractileeffect of (+)-cis-Dioxolane alone and in combination with differ-ent concentrations of M1 antagonist, pirenzepine (10-8 mol/Lto 10-5 mol/L) on the rat antral circular smooth muscle strips.Each point represents the mean±SE, n = 6, 6, 7 and 8 strips.Cumulative concentration-effect curve was constructed for eachstrip for (+)-cis-Dioxolane, (10-8 to 3×10⁻⁵ mol/L). After washing,strips were equilibrated in either the absence (control) or pres-ence of pirenzepine for 90 min. Subsequently, the second con-centration-effect curve for (+)-cis-Dioxolane was constructedfor each strip. Pirenzepine caused a significant inhibition of thecontractile muscle response to (+)-cis-dioxolane.
Methocramine-M2 muscarinic receptor antagonist was usedat the concentration range between 3×10⁻⁵ and 10-8 mol/L.Methocramine caused a significant inhibition of the of thecontractile muscle response to the (+)-cis-dioxolane (Figure 6). Darifenacin was used at the concentration range from 3×10⁻⁵
to 10-9 mol/L (Figure 7). Darifenacin caused a significant inhibitionof the contractile muscle response to the (+)-cis-dioxolane.
Figure 6 Concentration-response curves for the contractileeffect of (+)-cis-Dioxolane alone and in combination with dif-ferent concentrations of M2 antagonist, methocramine (from10-8 mol/L to 10-5 mol/L) on the rat antral circular smoothmuscle strips. Each point represents the mean±SE; n = 4, 9, 10and 11 strips. First, cumulative concentration-effect curve wasconstructed for each strip for (+)-cis-Dioxolane, (10-8 to 3×10⁻⁵
mol/L). After washing, tissues were equilibrated in either theabsence (control) or presence of methocramine for a 90 min.Subsequently, the second concentration-effect curve for (+)-cis-Dioxolane was constructed for each strip. Methocraminecaused a significant inhibition of the contractile muscle responseto (+)-cis-Dioxolane.
Figure 7 Concentration-response curves for the contractileeffect of (+)-cis-Dioxolane alone and in combination withdifferent concentrations of M3 antagonist, darifenacin (from10-10 mol/L to 10-6 mol/L) on the rat antral circular smoothmuscle strips. Each point represents the mean±SE; n = 4, 7, 11,10 strips. First, cumulative concentration-effect curve was con-structed for each strip for (+)-cis-Dioxolane, (10-8 to 3×10⁻⁵ mol/L).After wash, tissues were equilibrated in either the absence(control) or presence of darifenacin for a 90 min. Subsequently,the second concentration-effect curve for (+)-cis-Dioxolane wasconstructed for each strip. Darifenacin caused a significant inhi-bition of the contractile muscle response to (+)-cis-Dioxolane.
Comparison the muscarinic M1, M2 and M3 receptor antagonistsmediating the rat antral circular smooth muscle contractionAll three receptors (M1, M2 and M3) subtype antagonists inhibitedthe antral circular muscle contraction to cholinergic agonist(+)-cis-dioxolane. Darifenacin (M3) was most potent in inhibitingrat antral smooth muscle cholinergic contraction. The dose-response curves were shifted to the right by muscarinicantagonists in the following order of affinity: darifenacin (M3)
Control
PTX treated
Wrzos HF et al. Cholinergic antral circular smooth muscle contraction in rats 3295
% c
hange o
fdia
stolic
cell
length
-8 -7
150
100
50
0
Log bethanechol (m)
P<0.005
P<0.005
% o
f co
ntr
ol
-9 -8 -7 -6 -5
125
100
75
50
25
0
Log (+)-cis dioxolane (m)
Control
Pirenzepine 10-9 mol/L
Pirenzepine 10-8 mol/L
Pirenzepine 10-7 mol/L
Pirenzepine 10-6 mol/L
Pirenzepine 10-5 mol/L
% o
f co
ntr
ol
-9 -8 -7 -6 -5
125
100
75
50
25
0
Log (+)-cis dioxolane (m)
ControlMethocramine 10-9 mol/LMethocramine 10-8 mol/LMethocramine 10-7 mol/LMethocramine 10-6 mol/LMethocramine 10-5 mol/L
% o
f co
ntr
ol
-9 -8 -7 -6 -5
125
100
75
50
25
0
Log (+)-cis dioxolane (m)
Control
Darifenacin 10-10 mol/L
Darifenacin 10-9 mol/L
Darifenacin 10-8 mol/L
Darifenacin 10-7 mol/L
Darifenacin 10-6 mol/L

>methocramine (M2) >pirenzepine (M1). The EC50 for eachantagonist was as follows: darifenacin 7.9, methacramine 7.2and pirenzepine 6.8 (Figure 8).
Figure 8 Comparison of the inhibition of the contractile re-sponse to cis-Dioxolane by 3 muscarinic receptor antagonists:M3- darifenacin, M2- methocramine, and M1- pirenzepine. TheM3 antagonist, darifenacin, was the most potent inhibitor ofthe contraction induced by (+)-cis Dioxolane (10-6 mol/L). TheEC50 values for each were: for darifenacin (M3) -7.9; formethocramine (M2) -7.2; and for pirenzepine (M1) -6.8.
DISCUSSIONIt is well established that cholinergic agonists are of majorimportance for the stimulation of antral smooth muscle contractionand that their effect is mediated by muscarinic receptors. Invarious smooth muscle cells, the action of cholinergic agonistsinvolved the occupation of specific receptors, activation ofreceptor-coupled G-proteins and subsequent activation of thesecond messenger systems, which would lead to the mobilizationof Ca2+ from intracellular storage pools[10]. Certain steps of thesignaling pathway (s) for the cholinergic contraction of antralcircular smooth muscle in rats are still not understood, forexample, the second messenger system or the functionalcharacteristics of the muscarinic receptor subtypes involved.In our study the cholinergic rat antral circular muscle contractionin vitro was sensitive to the depletion from the extracellularCa2+ that significantly diminished the cholinergic contraction.This finding along with the inhibitory effect of nifedipineindicated a dependence on extracellular Ca2+ influx via L-typecalcium channels[50]. It is still not clear whether cholinergic contractile pathwaysof antral circular smooth muscle are mediated by PTX-sensitiveGTP-binding protein through an increased inflow of extracellularcalcium, or mediated via PTX-insensitive, inositol triphosphate(IP3)-dependent pathway. The circular muscle of cat esophagusand the lower esophageal sphincter (LES) were reported to belinked to different pathways. LES circular muscle cholinergiccontraction was shown to be linked to the PTX-insensitive pathway,whereas esophageal circular muscle cholinergic contraction hasbeen reported to be linked to the PTX-sensitive pathway[11-14]. In the present study, pretreatment with PTX significantlyinhibited the contractile response to bethanechol of the antralsmooth muscle strips in the organ bath and of the dissociatedmyocytes. More than one muscarinic receptor may be responsible forcholinergically mediated contractility at a particular area[6,22,51-56].A major role for M3 and a minor role for M2 receptors in cholinergic-induced smooth muscle contraction have been shown at thetissue of various species and organs[57-59], but it is still not clearhow different receptors may interact to mediate a specificfunction. For example, M2 receptor might serve as an inhibitorypresynaptic autoreceptor[60], or M2 receptor could act by gatingcation channels that were subsequently modulated by M3
receptors[61].
The functional characteristics of muscarinic receptor subtypesregulating antrum circular muscle cholinergic contraction havenot been previously reported. In our functional studies, cholinergiccontraction in response to cis-dioxolane in rat antral circularmuscles was mediated mostly through M3, less by M2, and theleast by M1 muscarinic receptor subtypes. The involvement of PTX-sensitive GTP-binding proteins inmediating the contractile response to muscarinic agonists hasbeen reported to be linked to muscarinic M2 receptor in manystudies, such as in cat esophageal circular muscle[11,12]. In contrast,our experiments in rat antral circular muscles indicated that theM3 muscarinic receptor was functionally prevalent, and yet,PTX-sensitive pathways were shown to be activated in theprocess of antral cholinergic contraction. A few publishedreports were in agreement with our results[13,22,26]. Possible explanations of the reported differences include:(1) Different experimental systems were used to compare thehomogenous suspension of smooth muscle cells was comparedwith smooth muscle strips. (2) M3 and M2 receptors were expressedtogether at the shared site of the signaling pathways[22,54,57,60,62].(3) The cholinergic agonist (+/- cis-Dioxolane) was used in ourstudies. Although, it has been reported to be non-selective[46,48,52],+/- cis-Dioxolane might be more selective for M3 muscarinicreceptor than it was originally described[63]. (4) It has beensuggested that seven transmembrane spanning receptorsincluding muscarinic are promiscuous in that they could forminteractions with multiple G-proteins[64] or activate many differenttransduction pathways at the same time[65]. (5) M2 receptormight be masked by M3 receptor, thus detectable when M3receptor was inhibited. Separating out these possibilities wouldrequire more specific antagonists than the currently available. In conclusion, the rat antral circular smooth muscle contractsto cholinergic agonists (bethanechol chloride and (+)-cis-Dioxolane) in a dose-dependent fashion through activation ofmuscarinic receptors at the smooth muscle. The contractileresponses to cholinergic agonists are dependent on the increasein intracellular calcium induced by the influx of extracellularcalcium via L-type voltage gated calcium channels. Bethanecholactivates M3 and M2 muscarinic receptors coupled to pertussis-toxin sensitive GTP-binding protein (s). The presence of aresidual contractile cholinergic response after 5 and 10 min incalcium-free buffer, as well as a residual contractile responseafter the treatment with nifedipine, suggests a role for an additionalpathway (s). M3 receptor is predominant out of three functionallytested M1, M2, and M3 muscarinic receptors regulating cholinergiccontraction. The involvement of more than one muscarinicreceptor indicates more than one pathway (s) regulating thecholinergic contraction of rat antrum circular smooth muscle. The results of these studies have important clinical implicationsfor possible treatment of gastric dysfunction with muscarinicsubtype-selective agents.
ACKNOWLEDGEMENTSAuthors would like to thank John Ellis, Ph.D, for helpfuldiscussions. An excellent technical assistance of RohiniPolavarapu is acknowledged.
REFERENCES1 Berridge MJ. Inositol trisphosphate and calcium signaling.
Nature 1993; 361: 315-3252 Bygrave FL, Roberts HR. Regulation of cellular calcium through
signaling cross talk involves an intricate interplay between theactions of receptors, G-proteins, and second messengers. FASEBJ 1995; 9: 1297-1303
3 Akbulut H, Goren Z, Iskender E, Eraslan A, Ozdemir O, OktayS. Subtypes of muscarinic receptors in rat duodenum: a com-parison with rabbit vas deferens, rat atria, guinea-pig ileum
3296 ISSN 1007-9327 CN 14-1219/ R World J Gastroenterol November 15, 2004 Volume 10 Number 22
-11 -10 -9 -8 -7 -6 -5 -4Log (+)-cis dioxolane (m)
Darifenacin
Methocramine
Pirenzepine
% o
f co
ntr
ol
125
100
75
50
25
0

and gallbladder by using imperialine. Gen Pharmacol 1999; 32:505-511
4 Grider JR, Makhlouf GM. Contraction mediated by Ca++ re-lease in circular and Ca++ influx in longitudinal muscles cells.J Pharmacol Exper Ther 1988; 244: 432-437
5 Murthy KS, Grider JR, Makhlouf GM. InsP3-dependent Ca2+mobilization in circular but not longitudinal muscle cells ofintestine. Am J Physiol 1991; 261(6 Pt 1): G937-G944
6 Li Z, Ruan Y, Guo ZD, Cong H, Zhang KY, Takemura H.Function and localization of high and low affinity binding sitesto muscarinic receptors in longitudinal and circular smoothmuscles of human stomach. Res Comm Chem Pathol Pharmacol1990; 67: 31-42
7 Kerr PM, Hillier K, Wallis RM, Garland CJ. Characterizationof muscarinic receptors mediating contractions of circular andlongitudinal muscle of human isolated colon. Br J Pharmacol1995; 115: 1518-1524
8 Lucchesi PA, Romano FD, Scheid CR, Yamaguchi H, HoneymanTW. Interaction of agonists and selective antagonists with gas-tric smooth muscle muscarinic receptors. Naunyn SchmiedebergsArch Pharmacol 1989; 339: 145-151
9 Miyazaki H, Koyama I, Nakamura H, Taneike T, Ohga A.Regional differences in cholinergic innervation and drug sensi-tivity in the smooth muscles of pig stomach. J AutonomicPharmacol 1991; 11: 255-265
10 Makhlouf GM, Murthy KS. Signal transduction in gastrointes-tinal smooth muscle. Cell Signal 1997; 9: 269-276
11 Sohn UD, Harnett KM, De Petris G, Behar J, Biancani P. Dis-tinct muscarinic receptors G proteins, and phospholipases inesophageal and lower esophageal sphincter (LES) circularmuscle. J Pharmacol Exp Ther 1993; 267: 1205-1214
12 Sohn UD, Han B, Tashjian AH, Behar J, Biancani P. Agonist-dependent, muscle-type-specific signal transduction pathwaysin cat esophageal and lower esophageal sphincter circularsmooth muscle. J Pharmacol Exp Ther 1995; 273: 482-491
13 Lin S, Kajimura M, Takeuchi K, Kodaira M, Hanai H, KanekoE. Expression of muscarinic receptor subtypes in rat gastricsmooth muscle: effect of M3 selective antagonist on gastricmotility and emptying. Dig Dis Sci 1997; 42: 907-914
14 Cao W, Chen Q, Sohn UD, Kim N, Kirber MT, Harnett KM,Behar J, Biancani P. Ca2+-induced contraction of cat esoph-ageal circular smooth muscle cells. Am J Physiol 2001; 280:C980-C992
15 Bitar KN, Saffouri B, Makhlouf GM. Cholinergic and peptidergicreceptors on isolated human antral smooth muscle cells. Gas-troenterology 1982; 82: 832-837
16 Konturek SJ, Jaworek J, Tasler J, Cieszkowski M, Yanaihara N.Subtypes of muscarinic receptors in canine pancreatic secre-tion in vivo and in vitro. Int J Pancreatol 1987; 2: 11-22
17 Liebmann C, Nawrath S, Schnittler M, Schubert H, Jakobs KH.Binding characteristics and functional G protein coupling ofmuscarinic acetylcholine receptors in rat duodenum smoothmuscle membranes. Naunyn Schmiedebergs Arch Pharmacol 1992;345: 7-15
18 Brann MR, Ellis J, Jorgensen H, Hill-Eubanks H, Jones SVP.Muscarinic acetylcholine receptor subtypes: localization andstructure/function. Prog Brain Res 1993; 98: 121-127
19 Preiksaitis HG, Krysiak PS, Chrones T, Rajgopal V, LaurierLG. Pharmacological and molecular characterization of mus-carinic receptor subtypes in human esophageal smooth muscle.J Pharmacol Exp Ther 2000; 295: 879-888
20 Eglen RM. Muscarinic receptors and gastrointestinal tractsmooth muscle function. Life Sci 2001; 68: 2573-2578
21 Li M, Bullock CM, Knauer DJ, Ehlert FJ, Zhou QY. Identifica-tion of Two Prokineticin cDNAs: Recombinant Proteins Po-tently contract gastrointestinal smooth muscle. Mol Pharmacol2001; 59: 692-698
22 Stengel PW, Yamada M, Wess J, Cohen ML. M(3)-receptor knock-out mice: muscarinic receptor function in atria, stomachfundus, urinary bladder, and trachea. Am J Physiol 2002; 282:R1443-R1449
23 Migeon JC, Thomas SL, Nathanson NM. Differential couplingof m2 and m4 muscarinic receptors to inhibition of adenylylcyclase by Gi alpha and G (o) alpha subunits. J Biol Chem 1995;270: 16070-16074
24 Murthy KS, Makhlouf GM. Differential coupling of muscar-inic m2 and m3 receptors to adenylyl cyclases V/VI in smoothmuscle. Concurrent M2 - mediated inhibition via Galphai3 andm3-mediated stimulation via Gbetagammaq. J Biol Chem 1997;272: 21317-21324
25 Kostenis E, Zeng FY, Wess J. Structure-function analysis ofmuscarinic receptors and their associated G proteins. Life Sci1999; 64: 355-362
26 Yokotani K, Osumi Y. Cholinergic M2 muscarinic receptor-mediated inhibition of endogenous noradrenaline release fromthe isolated vascularly perfused rat stomach. J Pharmacol ExpTher 1993; 264: 54-60
27 Milovanovic DR, Jankovic SM. Pharmacologic characteriza-tion of muscarine receptor subtypes in rat gastric fundus medi-ating contractile responses. Indian J Med Res 1997; 105: 239-245
28 Nelson DK, Pieramico O, Dahmen G, Dominguez-Munoz JE,Malfertheiner P, Alder G. M1-muscarinic mechanisms regulateinterdigestive cycling of motor and secretory activity in humanupper gut. Dig Dis Sci 1996; 41: 206-215
29 Hammer R. Muscarinic receptors in the stomach. ScandinavianJ Gastroenterol Suppl 1980; 66: 5–11
30 Herawi M, Lambrecht G, Mutschler E, Moser U, Pfeiffer A.Different binding properties of muscarinic M2-receptor sub-types for agonists and antagonists in porcine gastric smoothmuscle and mucosa. Gastroenterology 1988; 94: 630-637
31 Moummi C, Magous R, Strosberg D, Bali JP. Muscarinic recep-tors in isolated smooth muscle cells from gastric antrum. BiochPharmacol 1988; 37: 1363-1369
32 Hasler WL, Heldsinger A, Owyang C. Cisapride acts on mus-carinic (glandular M2) receptors to induce contraction of iso-lated gastric myocytes: mediation via a calcium-phosphoinositidepathway. J Pharmacol Exp Ther 1991; 259: 1294-1300
33 Rhee JC, Rhee PL, Park MK, So I, Uhm DY, Kim KW, KangTM. Muscarinic receptors controlling the carbachol-activatednonselective cationic current in guinea pig gastric smoothmuscle cells. Jap J Pharmacol 2000; 82: 331-337
34 Takahashi T, Kojima Y, Tsunoda Y, Beyer LA, Kamijo M,Sima AA, Owyang C. Impaired intracellular signal transduc-tion in gastric smooth muscle of diabetic BB/W rats. Am J Physiol1996; 270(3 Pt 1): G411-G417
35 Xue L, Suzuki H. Electrical responses of gastric smooth musclesin streptozotocin-induced diabetic rats. Am J Physiol 1997; 272(1 Pt 1): G77-G83
36 Maruyama Y, Sakai Y, Nobe K, Momose K. Subcellular dis-tribution of protein kinase C isoforms in gastric antrum smoothmuscle of STZ-induced diabetic rats. Life Sci 1999; 64: 1933-1940
37 Wrzos HF, Polavarapu R, Ouyang A. The signal transductionpathway involved in rat antral and colonic circular muscleresponse to muscarinic and neurokinin receptor agonists.Abstract. Gastroenterology 1997; 112: A853
38 Wrzos HF, Tandon T, Ouyang A. Functional significance ofmuscarinic receptor subtypes on rat antral circular muscle.Abstract. Neurogastroenterol Motil 1998
39 Bertiger G, Reynolds JC, Ouyang A, Cohen S. Properties of thefeline pyloric sphincter in vitro. Gastroenterology 1987; 92:1965-1972
40 Bitar KN, Makhlouf GM. Receptors on smooth muscle cells:characterization by contraction and specific antagonists. Am JPhysiol 1982; 242: G400-G407
41 Biancani P, Hillemeier C, Bitar KN, Makhlouf GM. Contrac-tion mediated by Ca2+ influx in esophageal muscle and by Ca2+
release in LES. Am J Physiol 1987; 253(6 Pt 1): G760-G76642 Maggi CA, Zagorodnyuk V, Giuliani S. Specialization of
tachykinin NK1 and NK2 receptors in producing fast and slowatropine resistant neurotransmission to the circular muscle ofthe guinea-pig colon. Neuroscience 1994; 63: 1137-1152
43 Thomas EA, Ehlert FJ. Pertussis toxin blocks M2 muscarinicreceptor-mediated effects on contraction and cyclic AMP in theguinea pig ileum, but not M3-mediated contractions andphosphoinositide hydrolysis. J Pharmacol Exp Ther 1994; 271:1042-1050
44 von Schrenck T, Mackensen B, Mende U, Schmitz W, Sievers J,Mirau S, Raedler A, Greten H. Signal transduction pathway ofthe muscarinic receptors mediating gallbladder contraction.
Wrzos HF et al. Cholinergic antral circular smooth muscle contraction in rats 3297

Naunyn Schmiedebergs Arch Pharmacol 1994; 349: 346-35445 Choppin A, Eglen RM. Pharmacological characterization of
muscarinic receptors in dog isolated ciliary and urinary blad-der smooth muscle. Br J Pharmacol 2001; 132: 835-842
46 Hegde SS, Choppin A, Bonhaus D, Briaud S, Loeb M, MoyTM, Loury D, Eglen RM. Functional role of M2 and M3 musca-rinic receptors in the urinary bladder of rats in vitro and in vivo.Br J Pharmacol 1997; 120: 1409-1418
47 Smith CM, Wallis RM. Characterisation of [3H]-darifenacinas a novel radioligand for the study of muscarinic M3 receptors.J Rec Sign Transduction Res 1997; 17: 177-184
48 Choppin A, Eglen RM, Hegde SS. Pharmacological character-ization of muscarinic receptors in rabbit isolated iris sphinctermuscle and urinary bladder smooth muscle. Br J Pharmacol1998; 124: 883-888
49 Barocelli E, Morini G, Ballabeni V, Lavezzo A, Impicciatore M.Effects of two new pirenzepine analogs on the contractile re-sponse of the guinea-pig oesophageal muscularis mucosae toacetylcholine, bethanechol, histamine and high potassium.European J Pharmacol 1990; 179: 89-96
50 Okamoto H, Inoue K, Kamisaki T, Takahashi K, Sato M. Re-gional differences in calcium sensitivity in the guinea-pigintestine. J Pharm Pharmacol 1997; 49: 981-984
51 Dietrich C, Kilbinger H. Prejunctional M1 and postjunctional M3
muscarinic receptors in the circular muscle of the guinea-pigileum. Naunyn Schmiedebergs Arch Pharmacol 1995; 351: 237-243
52 Eglen RM, Harris GC. Selective inactivation of muscarinic M2
and M3 receptors in guinea-pig ileum and atria in vitro. Br JPharmacol 1993; 109: 946-952
53 Ehlert FJ, Sawyer GW, Esqueda EE. Contractile role of M2 andM3 muscarinic receptors in gastrointestinal smooth muscle. LifeSci 1999; 64: 387-394
54 Sawyer GW, Ehlert FJ. Muscarinic M3 Receptor inactivationreveals a pertussis toxin-sensitive contractile response in theguinea pig colon: evidence for M2/M3 receptor interactions. JPharmacol Exp Ther 1999; 289: 464-467
55 Wang J, Krysiak PS, Laurier LG, Sims SM, Preiksaitis HG.Human esophageal smooth muscle cells express muscarinicreceptor subtypes M1 through M5. Am J Physiol 2000; 279:G1059-G1069
56 Ren J, Harty RF. Presynaptic muscarinic receptors modulateacetylcholine release from rat antral mucosal/submucosalnerves. Dig Dis Sci 1994; 39: 1099-1106
57 Chen Q, Yu P, de Petris G, Biancani P, Behar J. Distinct mus-carinic receptors and signal transduction pathways in gall-bladder muscle. J Pharmacol Exp Ther 1995; 273: 650-655
58 Bellido I, Fernandez JL, Gomez A, Sanchez de la Cuesta F.Otenzepad shows two populations of binding sites in humangastric smooth muscle. Can J Physiol Pharmacol 1995; 73: 124-129
59 Hanack C, Pfeiffer A. Upper gastrointestinal porcine smoothmuscle expresses M2- and M3- receptors. Digestion 1990; 45:196-201
60 Parkman HP, Pagano AP, Ryan JP. Subtypes of muscarinicreceptors regulating gallbladder cholinergic contractions. Am JPhysiol 1999; 276(5 Pt 1): G1243-G1250
61 Bolton TB, Zholos AV. Activation of M2 muscarinic receptorsin guinea-pig ileum opens cationic channels modulated by M3
muscarinic receptors. Life Sci 1997; 60: 1121-112862 Braverman AS, Tallarida RJ, Ruggieri MR Jr. Interaction be-
tween muscarinic receptor subtype signal transduction path-ways mediating bladder contraction. Am J Physiol Regul IntegrComp Physion 2002; 283: R663- R668
63 Lanzafame A, Christopoulos A, Mitchelson F. Interactions ofagonists with an allosteric antagonist at muscarinic acetylcho-line M2 receptors. Eur J Pharmacol 1996; 316: 27-32
64 Nahorski SR, Tobin AB, Willars GB. Muscarinic M3 receptorcoupling and regulation. Life Sci 1997; 60: 1039-1045
65 Parekh AB, Brading AF. The M3 muscarinic receptor links tothree different transduction mechanisms with different effica-cies in circular muscle of guinea-pig stomach. Br J Pharmacol1992; 106: 639-643
Edited by Chen WW and Wang XL Proofread by Xu FM
3298 ISSN 1007-9327 CN 14-1219/ R World J Gastroenterol November 15, 2004 Volume 10 Number 22

PO Box 2345, Beijing 100023, China World J Gastroenterol 2004;10(22):3299-3302Fax: +86-10-85381893 World Journal of GastroenterologyE-mail: [email protected] www.wjgnet.com Copyright © 2004 by The WJG Press ISSN 1007-9327
• BASIC RESEARCH •
Coxsackievirus B3 infection and its mutation in Keshan disease
Li-Qun Ren, Xiang-Jun Li, Guang-Sheng Li, Zhi-Tao Zhao, Bo Sun, Fei Sun
Li-Qun Ren, Xiang-Jun Li, Guang-Sheng Li, Zhi-Tao Zhao, BoSun, Department of Pathology, Institute of Frontier Medical Science,Jilin University, Changchun 130021, Jilin Province, ChinaFei Sun, Department of Cellular Biology, Institute of Frontier MedicalScience, Jilin University, Changchun 130021, Jilin Province, ChinaSupported by National Natural Science Foundation of China, No.39870668Correspondence to: to Professor Guang-Sheng Li, Department ofPathology, Institute of Frontier Medical Science, Jilin University,Changchun 130021, Jilin Province, China. [email protected]: +86-431-5619287Received: 2003-12-28 Accepted: 2004-02-10
Abstract
AIM: To investigate coxsackievirus B3 infection and its genemutation in Keshan disease.
METHODS: The expression of Coxsackievirus B3 RNA wasdetected in autopsy specimens of acute (12 cases), sub-acute(27 cases) and chronic (15 cases) Keshan disease by in situ
hybridization. In sub-acute Keshan disease specimens, 3 caseswith positive result by in situ hybridization were selectedRT-PCR analysis. The DNA segments were then sequenced.
RESULTS: Coxsackievirus B3 RNA was detected in thecytoplasm of myocardiocyte. The positive rate was 83% inacute, 67% in sub-acute and 80% in chronic Keshan disease.In the conservative region of Coxsackievirus B3 genome,there was a mutation in 234 (C-T) compared to the non-cardiovirulent strain, CVB3/0.
CONCLUSION: Coxsackievirus B3 RNA can survive andreplicate in heart muscle of Keshan disease, which may playan important role in the occurrence of Keshan disease. Thepossible mechanism of occurrence of Keshan disease isassociated with point a mutation in Coxsackievirus B3 genome.
Ren LQ, Li XJ, Li GS, Zhao ZT, Sun B, Sun F. Coxsackievirus B3infection and its mutation in Keshan disease. World J
Gastroenterol 2004; 10(22): 3299-3302
http://www.wjgnet.com/1007-9327/10/3299.asp
INTRODUCTIONEnteroviruses, particularly Coxsackie B viruses (CVB), are themost common cause of human viral myocarditis and are associatedwith dilated cardiomyopathy (DCM)[1-3]. In general, neonatesand children suffer more severe clinical syndromes due to CVBinfection, often severe or life threatening, because of inflammationand necrosis of heart muscle[4]. Many diseases are consideredto have relationship with CVB3 infect, but the mechanism is stillnot well understood. Although the immune response of the hostundoubtedly plays an important role in the pathogenesis ofviral heart disease[5], direct viral cytotoxicity has been found tobe crucial for organ pathology both during acute and persistentheart muscle infection. Coxsackievirus B3 (CVB3), one of six CVBserotypes, is a member of the genus enterovirus within thefamily Picornaviridae and its structure is well understood[6,7].
Some studies suggest that the 5’NTR of enteroviruses maybeplay an important role in producing or sustaining the myocardialvirulence[8-14]. Keshan disease is endemic exclusively in selenium-deficientrural areas of China, including 14 provinces and autonomousregions[15]. Its clinical features are low body selenium contentand acute or chronic episodes of heart disorder characterized bycardiogenic shock, arrhythmia, ECG changes (for example, rightbranch block), and/or congestive heart failure, with an enlargedheart. Four types of the disease are seen: acute, subacute, chronic,and latent or compensated. The basic pathological change ismultifocal myocardial necrosis and fibrous replacement throughoutthe myocardium, with various degrees of cellular infiltrationand calcification, depending upon the type of disease[16,17].Research suggests that not a single but several more factorsmay have a relationship with the occurrence of Keshan disease.The reasons are often considered as global, biological chemicalfactors (selenium deficiency), dietary nutritional factors (vitaminE deficiency) and infection (virus, especially enteroviruses).This hypothesis can explain both endemic and seasonal featuresof Keshan disease. Recent studies have also demonstrated apossible etiological role of enterovirus infection in a particularform of heart muscle disease, selenium deficiency-related endemiccardiomyopathy (Keshan disease), seen in China[18,19]. Presently,patients of Keshan disease are rare and there is no ideal animalmodel, research of viral etiology of Keshan disease is relativelyfew. In this study, we detected all the four types of Keshandisease using in situ hybridization and sequenced the 5’NTRof CVB3 from subacute Keshan disease in order to investigatethe relationship between Keshan disease and CVB3 infection.
MATERIALS AND METHODSCase selectedAll the samples were cardiac tissue isolated at post mortem andfixed in formaldehyde and embedded in paraffin wax and preservedin Institute of Keshan Disease, Jilin University from 1959-1985.The samples included 12 acute patients (7 males, 5 females,average age 16.3 years), 27 subacute patients (12 males, 15females, average age 4.3 years) and 15 chronic patients (9 males,6 females, average age 23.8 years). We used three non-Keshandisease patients as controls, including two normal and oneperinatal period cardiomyopathy. The cultured human amnioticcell containing a cardiovirulent strain of CVB3 served as positivecontrol and by RT-PCR.
In situ HybridizationAn obligonucleotide probe was purchased from Shanghai SangonBiological Engineering Company. This probe, labeled with biotin,was designed to detect coxsackievirus B3, whose sequencewas 5’-GTC CGC AAT GGC GGG CGG TGG TGG TGT CTC-3’. All slides were treated by APES solution (1:50 acetone) inorder to prevent the section slipping from the slide. The 5 µmthick section was baked 3-4 h at 80 and overnight at 60 . The paraffin wax was removed by immersing the slide inxylene. The slides were then rehydrated, treated with 0.1 g/LTriton X-100 for 2 min, digested with proteinase K (0.25 mg/mL)in PBS for 5 min at room temperature, then sealed with histidine(2 mg/mL) for 2 min, and then dehydrated in graded concentrated
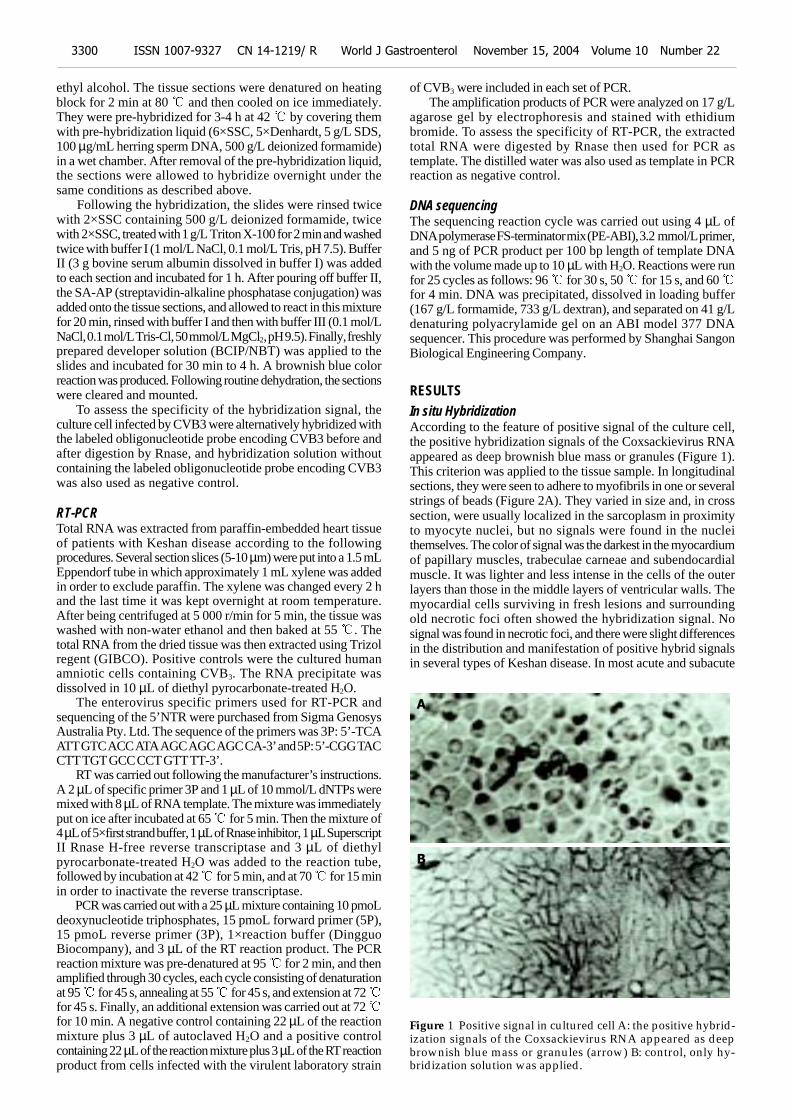
ethyl alcohol. The tissue sections were denatured on heatingblock for 2 min at 80 and then cooled on ice immediately.They were pre-hybridized for 3-4 h at 42 by covering themwith pre-hybridization liquid (6×SSC, 5×Denhardt, 5 g/L SDS,100 µg/mL herring sperm DNA, 500 g/L deionized formamide)in a wet chamber. After removal of the pre-hybridization liquid,the sections were allowed to hybridize overnight under thesame conditions as described above. Following the hybridization, the slides were rinsed twicewith 2×SSC containing 500 g/L deionized formamide, twicewith 2×SSC, treated with 1 g/L Triton X-100 for 2 min and washedtwice with buffer I (1 mol/L NaCl, 0.1 mol/L Tris, pH 7.5). BufferII (3 g bovine serum albumin dissolved in buffer I) was addedto each section and incubated for 1 h. After pouring off buffer II,the SA-AP (streptavidin-alkaline phosphatase conjugation) wasadded onto the tissue sections, and allowed to react in this mixturefor 20 min, rinsed with buffer I and then with buffer III (0.1 mol/LNaCl, 0.1 mol/L Tris-Cl, 50 mmol/L MgCl2, pH 9.5). Finally, freshlyprepared developer solution (BCIP/NBT) was applied to theslides and incubated for 30 min to 4 h. A brownish blue colorreaction was produced. Following routine dehydration, the sectionswere cleared and mounted. To assess the specificity of the hybridization signal, theculture cell infected by CVB3 were alternatively hybridized withthe labeled obligonucleotide probe encoding CVB3 before andafter digestion by Rnase, and hybridization solution withoutcontaining the labeled obligonucleotide probe encoding CVB3was also used as negative control.
RT-PCRTotal RNA was extracted from paraffin-embedded heart tissueof patients with Keshan disease according to the followingprocedures. Several section slices (5-10 µm) were put into a 1.5 mLEppendorf tube in which approximately 1 mL xylene was addedin order to exclude paraffin. The xylene was changed every 2 hand the last time it was kept overnight at room temperature.After being centrifuged at 5 000 r/min for 5 min, the tissue waswashed with non-water ethanol and then baked at 55 . Thetotal RNA from the dried tissue was then extracted using Trizolregent (GIBCO). Positive controls were the cultured humanamniotic cells containing CVB3. The RNA precipitate wasdissolved in 10 µL of diethyl pyrocarbonate-treated H2O. The enterovirus specific primers used for RT-PCR andsequencing of the 5’NTR were purchased from Sigma GenosysAustralia Pty. Ltd. The sequence of the primers was 3P: 5’-TCAATT GTC ACC ATA AGC AGC AGC CA-3’ and 5P: 5’-CGG TACCTT TGT GCC CCT GTT TT-3’. RT was carried out following the manufacturer’s instructions.A 2 µL of specific primer 3P and 1 µL of 10 mmol/L dNTPs weremixed with 8 µL of RNA template. The mixture was immediatelyput on ice after incubated at 65 for 5 min. Then the mixture of4 µL of 5×first strand buffer, 1 µL of Rnase inhibitor, 1 µL SuperscriptII Rnase H-free reverse transcriptase and 3 µL of diethylpyrocarbonate-treated H2O was added to the reaction tube,followed by incubation at 42 for 5 min, and at 70 for 15 minin order to inactivate the reverse transcriptase. PCR was carried out with a 25 µL mixture containing 10 pmoLdeoxynucleotide triphosphates, 15 pmoL forward primer (5P),15 pmoL reverse primer (3P), 1×reaction buffer (DingguoBiocompany), and 3 µL of the RT reaction product. The PCRreaction mixture was pre-denatured at 95 for 2 min, and thenamplified through 30 cycles, each cycle consisting of denaturationat 95 for 45 s, annealing at 55 for 45 s, and extension at 72 for 45 s. Finally, an additional extension was carried out at 72 for 10 min. A negative control containing 22 µL of the reactionmixture plus 3 µL of autoclaved H2O and a positive controlcontaining 22 µL of the reaction mixture plus 3 µL of the RT reactionproduct from cells infected with the virulent laboratory strain
of CVB3 were included in each set of PCR. The amplification products of PCR were analyzed on 17 g/Lagarose gel by electrophoresis and stained with ethidiumbromide. To assess the specificity of RT-PCR, the extractedtotal RNA were digested by Rnase then used for PCR astemplate. The distilled water was also used as template in PCRreaction as negative control.
DNA sequencingThe sequencing reaction cycle was carried out using 4 µL ofDNA polymerase FS-terminator mix (PE-ABI), 3.2 mmol/L primer,and 5 ng of PCR product per 100 bp length of template DNAwith the volume made up to 10 µL with H2O. Reactions were runfor 25 cycles as follows: 96 for 30 s, 50 for 15 s, and 60 for 4 min. DNA was precipitated, dissolved in loading buffer(167 g/L formamide, 733 g/L dextran), and separated on 41 g/Ldenaturing polyacrylamide gel on an ABI model 377 DNAsequencer. This procedure was performed by Shanghai SangonBiological Engineering Company.
RESULTSIn situ HybridizationAccording to the feature of positive signal of the culture cell,the positive hybridization signals of the Coxsackievirus RNAappeared as deep brownish blue mass or granules (Figure 1).This criterion was applied to the tissue sample. In longitudinalsections, they were seen to adhere to myofibrils in one or severalstrings of beads (Figure 2A). They varied in size and, in crosssection, were usually localized in the sarcoplasm in proximityto myocyte nuclei, but no signals were found in the nucleithemselves. The color of signal was the darkest in the myocardiumof papillary muscles, trabeculae carneae and subendocardialmuscle. It was lighter and less intense in the cells of the outerlayers than those in the middle layers of ventricular walls. Themyocardial cells surviving in fresh lesions and surroundingold necrotic foci often showed the hybridization signal. Nosignal was found in necrotic foci, and there were slight differencesin the distribution and manifestation of positive hybrid signalsin several types of Keshan disease. In most acute and subacute
3300 ISSN 1007-9327 CN 14-1219/ R World J Gastroenterol November 15, 2004 Volume 10 Number 22
A
B
Figure 1 Positive signal in cultured cell A: the positive hybrid-ization signals of the Coxsackievirus RNA appeared as deepbrownish blue mass or granules (arrow) B: control, only hy-bridization solution was applied.

cases, the signal appeared predominantly in the myocytesurrounding foci and surviving in fresh foci as well as cellsbeneath the endocardium and of papillary muscles. Thehybridization-positive granules were thick, and had clear border.The sarcoplasm appeared dark, and sometimes, homogeneouslyblue (Figure 2B). In most of the chronic cases, the granuleswere usually distributed in all parts of the myocardium, andwere small and without clear borders, like dirt. The detectionrate in subacute specimens was the highest, and the rate inacute specimens was higher than that in chronic specimens,but there were no significant differences among the three typesof Keshan disease. The positive rate of hybridization in the three type of Keshandisease was 83% (10/12) in acute, 67% (18/27) in sub-acute and80% (12/15) in chronic Keshan disease. No positive signalswere found in any negative controls. Results of 3 myocardial control specimens investigated within situ hybridization were negative.
RT-PCRRT-PCR revealed that the RNA extracted from the myocardialtissue with positive control of in situ hybridization amplifieda DNA fragment about 541 bp, while the three negative controlsdid not amplify (Figure 3). The RNA extracted from culturedcell infected by CVB3 were also amplified the DNA fragmentabout 541 bp.
Sequence analysisThe DNA segments from RT-PCR were sequenced and comparedto the non-cardiovirulent control, CVB3/0, and the cardiovirulentstrain, CVB3/Nancy and CVB3/20. We found that the sequence of theamplified segment had one nucleotide different compared tothat of CVB3/0. The 234th nucleotide in the genome of CVB3/0
was C while ours was T. But the sequence of our segment wassimilar that of CVB3/Nancy, CVB3/20 and the positive control (Figure 4).
DISCUSSIONKeshan disease has been studied for over 60 years in China.One of the key issues is the complex etiology of this endemicdisease, with a focus on environmental nutritional factors andinfectious agents. Selenium deficiency in the food chain has beenrecognized as a major but not exclusive environmental-nutritionalfactor, and increasing evidence supports an etiological role ofenteroviruses in Keshan disease. Recently, Peng et al.[20]
determined the sequences of the 5’NTR and the 3’ end of the VP1coding region from six enteroviruses isolate from cases of Keshandisease or outbreak myocarditis. From their results, they drew aconclusion that the sequence data confirm that coxsackievirusgroup B serotypes are predominant in the region where Keshandisease is endemic, and may be the etiological factors in outbreaksof myocarditis, and VP1 genotyping of enteroviruses is accurateand reliable. Animal experiments indicate that isolates may differ inpathogenicity. Virus infection combined with selenium deficiencyin environments and vitamin E deficiency in dietary can illustrateboth endemic and seasonal features of Keshan disease. Thehypothesis of virus infection was accepted once it appeared, butthe methods used in virology limited the development of a virusinfection hypothesis of Keshan disease. The rapid developmentin molecular biology brings vitality to virology. In situ hybridization is a method to detect the nucleic acidsin a tissue or cell using a labeled obligonucleotide chain as probe.This technique has already been widely used in biology andmedicine because of its high specificity, sensitivity and locationprecision. Using a cloned cDNA probe obtained from CVB4
infected cells and labeled by biotin-11-dUTP, Easton et al.[21]
found that 46% (6/13) patients who had been diagnosedcoxsackievirus myocarditis can be found enterovirus infectionin their myocardial tissue. Archard et al.[22] examined enteroviruses
Ren LQ et al. Coxsackievirus B3 infection and its mutation 3301
Figure 4 Sequence of segment of RT-PCR Compared to the nonvirulent strain of CVB3/0, there was one nucleotide different(arrow). The nonvirulent strain of CVB3/0 was C while ours was T.
150 160 170 180 190 200 210 220 230 240
1 2 3 4 5 6 7 8
bp
750500
Figure 3 Agarose gel electrophoresis results Lanes 1, 2, 3:negative control; Lanes 4-6: subacute Keshan disease; Lanes 7:positive control; Lane 8: DL-2000 DNA Marker. A 541 bp DNAsegment can be seen in lanes 4-7.
A
B
Figure 2 Positive signal of in situ hybridization in subacutemyocardial tissue A: Feature positive signal of in situ hybrid-ization with cardiac tissue is seen as deep brownish blue andseems to adhere onto myofibril, linked together in one or sev-eral strings of beads, when observed longitudinally (×400). B:The granules of positive signal were thick and with clear bor-der in varying size and localized in the sarcoplasm.
infection in human myocardial tissue using an enterovirusspecific probe, and found that the rate of enterovirus infectionwas 45% (21/47) in myocarditis patients and 43% (35/82) incured myocarditis and DMC patients. In our research, thespecific obligonucleotide probe of CVB3 was labeled by biotinon 5’ end, and the specimen was paraffin-embedded myocardialtissue from autopsy patients of Keshan disease. The objectwas to detect the coxsackievirus B3 RNA by in situ hybridization.Among the three types of Keshan disease patients, we found thepositive rate was 83%, 67%, and 80% in acute, sub-acute andchronic Keshan disease patients, respectively. Our results providea new support to the hypothesis that enterovirus, especially CVB3,might play an important role in pathogenesis of Keshan disease.Moreover, the area, range and the distribution of the positivesignal of CVB3 were associated with the development of Keshandisease. The positive signals in acute and sub-acute Keshandisease were located in the surviving myocardiocyte in or aroundthe necrosis foci while they were dispersed in almost all themyocardiocyte in chronic Keshan disease. The results of in situhybridization suggested that enterovirus could lead to heart musclelesion when they involved in the myocardial tissue, and they candispersed to the normal heart muscle with increase of time. Though there was a high enterovirus infection rate inmyocardial tissue of Keshan disease patients[23,24], it is well knownthat the enterovirus could also be detected in many patients whohad no heart muscle lesion. The change of viral cardiovirulencecan undoubtedly play an important role. Some research hasdemonstrated that under some conditions, such as seleniumdeficiency, vitamin deficiency, the phenotype of enterovirus canbe changed, that is, a non-cardiovirulent strain can change into acardiovirulent strain, or the cardiovirulence can be increased inthese conditions[25-27]. Beck et al.[28] sequenced the mutated strain,CVB3/0se-, which was extracted from the heart muscle of seleniumdeficient mice, and found that there were six mutation points inCVB3/0se- and compared to the two-cardiovirulent strains, CVB3/20,CVB3/M1, all mutated points were turned into that of a cardiovirulentstrain. Can the same episodes also happen in Keshan diseasepatients? In our research, we found an about 541 bp DNA segmentby RT-PCR. Compared to CVB3/0, a non-cardiovirulent strain, thesequence of our segment had only one nucleotide different, whichwas 234 T. But the segment had the same sequence as that ofCVB3/Nancy and CVB3/20, cardiovirulent strain. This result cangive us some indications that the mutation of virus genome mightplay an important role in the pathogeny of Keshan disease. Butthis needs to further investigation. As we know that RNA is degraded easily, so its detection isdifficult, especially in paraffin-embedded tissue[29,30]. But theparaffin-embedded myocardial tissue we select have been kept inour institute for a long time (10-50 years), and are generally thoughtnot to be optimal for RNA research, but our results displayed thatresults of both in situ hybridization and RT-PCR were satisfactory.
REFERENCES1 Woodruff JF. Viral myocarditis. A review. Am J Pathol 1980;
101: 425-4842 Bowles NE, Richardson PJ, Olsen EG, Archard LC. Detection
of Coxsackie-B-virus-specific RNA sequences in myocardialbiopsy samples from patients with myocarditis and dilatedcardiomyopathy. Lancet 1986; 1: 1120-1123
3 Martino TA, Liu P, Sole MJ. Viral infection and the pathogen-esis of dilated cardiomyopathy. Circ Res 1994; 74: 182-188
4 Kaplan MH, Klein SW, McPhee J, Harper RG. Group B.coxsackievirus infections in infants younger than three months ofage: a serious childhood illness. Rev Infect Dis 1983; 5: 1019-1032
5 Knowlton KU, Badorff C. The immune system in viralmyocarditis: maintaining the balance. Circ Res 1999; 85: 559-561
6 Muckelbauer JK, Kremer M, Minor I, Diana G, Dutko FJ,Groarke J, Pevear DC, Rossmann MG. The structure of
coxsackievirus B3 at 3.5 A resolution. Structure 1995; 3: 653-6677 Wimmer E, Hellen CU, Cao X. Genetics of poliovirus. Annu
Rev Genet 1993; 27: 353-4368 Agol VI. The 5’-untranslated region of picornaviral genomes.
Adv Virus Res 1991; 40: 103-1809 Minor PD. The molecular biology of poliovaccines. J Gen Virol
1992; 73(Pt 12): 3065-307710 Rohll JB, Percy N, Ley R, Evans DJ, Almond JW, Barclay WS.
The 5’-untranslated regions of picornavirus RNAs contain in-dependent functional domains essential for RNA replicationand translation. J Virol 1994; 68: 4384-4391
11 Le SY, Siddiqui A, Maizel JV Jr. A common structural core inthe internal ribosome entry sites of picornavirus, hepatitis Cvirus, and pestivirus. Virus Genes 1996; 12: 135-147
12 Rinehart JE, Gomez RM, Roos RP. Molecular determinants forvirulence in coxsackievirus B1 infection. J Virol 1997; 71: 3986-3991
13 Dunn JJ, Chapman NM, Tracy S, Romero JR. Genomic determi-nants of cardiovirulence in coxsackievirus B3 clinical isolates: lo-calization to the 5’ non translated region. J Virol 2000; 74: 4787-4794
14 Tu Z, Chapman NM, Hufnagel G, Tracy S, Romero JR, BarryWH, Zhao L, Currey K, Shapiro B. The cardiovirulent pheno-type of coxsackievirus B3 is determined at a single site in thegenomic 5’ non translated region. J Virol 1995; 69: 4607-4618
15 Ge K, Yang G. The epidemiology of selenium deficiency in theetiological study of endemic diseases in China. Am J Clin Nutr1993; 57(2 Suppl): 259S–263S
16 Li GS, Wang F, Kang D, Li C. Keshan disease: an endemiccardiomyopathy in China. Hum Pathol 1985; 16: 602-609
17 Gu BQ. Pathology of Keshan disease. A comprehensive review.Chin Med J 1983; 96::251-261
18 Li Y, Peng T, Yang Y, Niu C, Archard LC, Zhang H. Highprevalence of enteroviral genomic sequences in myocardiumfrom cases of endemic cardiomyopathy (Keshan disease) inChina. Heart 2000; 83: 696-701
19 Li Y, Yang Y, Chen H. Detection of enteroviral RNA in paraffin-embedded myocardial tissue from patients with Keshan bynested PCR. Zhonghua Yixue Zazhi 1995; 75: 344-345
20 Peng T, Li Y, Yang Y, Niu C, Morgan-Capner P, Archard LC,Zhang H. Characterization of enterovirus isolates from pa-tients with heart muscle disease in a selenium-deficient area ofchina. J Clin Microbiol 2000; 38: 3538-3543
21 Easton AJ, Eglin RP. The detection of coxsackievirus RNA in cardiactissue by in situ hybridization. J Gen Virol 1988; 69(Pt 21): 285-291
22 Archard LC, Bowles NE, Cunningham L, Freeke CA, Olsen EG,Rose ML, Meany B, Why HJ, Richardson PJ. Molecular probesfor detection of persisting enterovirus infection of human heartand their prognostic value. Eur Heart J 1991; 12(Suppl D): 56-59
23 Huang Z, Xia Y, Jin Q, Wu H. Coxsackievirus B3 infection andKeshan disease. Weisheng Yanjiu 2002; 31: 261-263
24 Guanqing H. On the etiology of Keshan disease: twohypotheses. Chin Med J 1979; 92: 416-422
25 Levander OA, Beck MA. Interacting nutritional and infectiousetiologies of Keshan disease. Insights from coxsackie virus B-induced myocarditis in mice deficient in selenium or vitamin E.Biol Trace Elem Res 1997; 56: 5-21
26 Beck MA, Kolbeck PC, Rohr LH, Shi Q, Morris VC, LevanderOA. Benign human enterovirus becomes virulent in selenium-deficient mice. J Med Virol 1994; 43: 166-170
27 Beck MA, Kolbeck PC, Rohr LH, Shi Q, Morris VC, LevanderOA. Vitamin E deficiency intensifies the myocardial injury ofcoxsackievirus B3 infection of mice. J Nutr 1994; 124: 345-358
28 Beck MA, Shi Q, Morris VC, Levander OA. Rapid genomicevolution of a non-virulent coxsackievirus B3 in selenium-defi-cient mice results in selection of identical virulent isolates. NatMed 1995; 1: 433-436
29 Jackson DP, Quirke P, Lewis F, Boylston AW, Sloan JM,Robertson D, Taylor GR. Detection of measles virus RNA inparaffin-embedded tissue. Lancet 1989; 1: 1391
30 Sariol CA, Pelegrino JL, Martinez A, Arteaga E, Kouri G,Guzman MG. Detection and genetic relationship of denguevirus sequences in seventeen-year-old paraffin-embeddedsamples from Cuba. Am J Trop Med Hyg 1999; 61: 994-1000
Edited by Kumar M Proofread by Xu FM
3302 ISSN 1007-9327 CN 14-1219/ R World J Gastroenterol November 15, 2004 Volume 10 Number 22

PO Box 2345, Beijing 100023, China World J Gastroenterol 2004;10(22):3303-3307Fax: +86-10-85381893 World Journal of GastroenterologyE-mail: [email protected] www.wjgnet.com Copyright © 2004 by The WJG Press ISSN 1007-9327
• BASIC RESEARCH •
Effect of actin microfilament on potassium current in guinea pig
gastric myocytes
Xiang-Lan Li, Hai-Feng Zheng, Zheng-Yuan Jin, Meng Yang, Zai-Liu Li, Wen-Xie Xu
Xiang-Lan Li, Hai-Feng Zheng, Zheng-Yuan Jin, Meng Yang,Zai-Liu Li, Department of Physiology, Yanbian University Collegeof Medicine, Yanji 133000, Jilin Province, ChinaWen-Xie Xu, Department of Physiology, Shanghai Jiaotong UniversitySchool of Medicine, 1954 Huashan Rd, Shanghai 200030, ChinaSupported by the National Natural Science Foundation of China, No.30160028Correspondence to: Professor Wen-Xie Xu, Department of Physiology,Shanghai Jiaotong University School of Medicine, 1954 Huashan Rd,Shanghai 200030, China. [email protected]: +86-21-62932910 Fax: +86-21-62932528Received: 2004-02-11 Accepted: 2004-03-18
Abstract
AIM: To investigate the effect of actin microfilament onpotassium current and hyposmotic membrane stretch-inducedincrease of potassium current in gastric antral circular myocytesof guinea pig.
METHODS: Whole-cell patch clamp technique was usedto record potassium current in isolated gastric myocyes.
RESULTS: When the membrane potential was clamped at-60 mV, an actin microfilament disruptor, cytochanlasin-B(Cyt-B, 20 µmol/L in pipette) increased calcium-activatedpotassium current (IK(Ca)) and delayed rectifier potassiumcurrent (I K(V)) to 138.4±14.3% and 142.1±13.1%respectively at +60 mV. In the same condition, an actinmicrofilament stabilizer phalloidin(20 µmol/L in pipette)inhibited IK(Ca) and IK(V) to 74.2±7.1% and 75.4±9.9%respectively. At the holding potential of -60 mV, hyposmoticmembrane stretch increased IK(Ca) and IK(V) by 50.6±9.7%and 24.9±3.3% at +60 mV respectively. In the presence ofcytochalasin-B and phalloidin (20 µmol/L, in the pipette)condition, hyposmotic membrane stretch also increased IK(Ca)
by 44.5±7.9% and 55.7±9.8% at +60 mV respectively. In thesame condition, cytochalasin-B and phalloidin also increasedIK(V) by 23.0±5.5% and 30.3±4.5% respectively. However,Cyt-B and phalloidin did not affect the amplitude of hyposmoticmembrane stretch-induced increase of IK(Ca) and IK(V).
CONCLUSION: Actin microfilaments regulate the activitiesof potassium channels, but they are not involved in theprocess of hyposmotic membrane stretch-induced increaseof potassium currents in gastric antral circular myocytes ofguinea pig.
Li XL, Zheng HF, Jin ZY, Yang M, Li ZL, Xu WX. Effect of actinmicrofilament on potassium current in guinea pig gastricmyocytes. World J Gastroenterol 2004; 10(22): 3303-3307
http://www.wjgnet.com/1007-9327/10/3303.asp
INTRODUCTIONCytoskeleton is an intracellular superstructure that consists ofmicrofilaments of actin and associated proteins, microtubules,
and intermediate filaments. Actin microfilaments of thecytoskeleton form a complex network, providing the structuralbasis for simultaneous interactions between multiple cellularstructures. It is well established that many ion channels andtransporters are anchored in the membrane by either direct orindirect association with the cytoskeleton. In addition, there isgrowing evidence that altering the integrity of cytoskeletalelements, in particular actin microfilaments, could modulate theactivity of a variety of ion channels[1] and receptors[2]. Manyprevious studies have demonstrated that actin microfilamentcould mediate different types of potassium channels of a varietyof cells such as those in rat collecting duct[3], smooth musclecell line DDT1 MF-2[4], cardiac myocytes of guinea pig[5], humanmeningioma cells[6], rat hippocampal CA1 pyramidal neurons[7],rat ventricular myocytes[8] and xenopus oocytes[9]. Wanget al.[10] reported that neither the microfilaments nor themicrotubules were involved in the enhancement of IK(V) inducedby cell distension in ventricular muscle cells of guinea pig.However, Ribeiro et al.[11] showed that microtubule was involvedin the cell volume-induced changes in K+ transport across therat colon epithelial cells. Our previous study demonstrated thatmain outward current was carried by calcium-activated potassiumchannel and delayed rectifier potassium channel in gastric antralcircular myocytes of guinea pig and hyposmotic cell swellingenhanced the activity of that two kinds of potassium channel[12,13].In order to investigate the mechanism of hyposmotic membranestretch-induced increase of potassium current, in the present study,the effect of actin microfilament on potassium currents wasobserved and the possibility whether acin microfilament wasinvolved in the process of hyposmotic membrane stretch-inducedincrease of potassium currents was examined.
MATERIALS AND METHODSSingle cell preparation and electrophysiological recordingFresh, single smooth muscle cells (SMCs) were isolatedenzymatically from the circular layer of guinea pig antrum aspreviously described[14]. Isolated SMCs were stored at 4 KBSuntil the time of use. All experiments were performed within 12 hafter cell dispersion. The isolated cells were transferred to asmall chamber (0.1 mL) on the stage of an inverted microscope(IX-70 Olympus, Japan) for 10-15 min to settle down. Solutionwas perfused at a speed of 0.9-1.0 mL/min through the chamberby gravity from the 8-channel perfusion system (L/M-sps-8;list electronics, Germany). Glass pipette with a resistance of3-5 M was used to make a giga seal of 5-10 G the whole-cell currents were recorded with an Axopatch 1-D patch-clampamplifier (Axon Instrument, USA).
Drugs and solutionTyrode solution containing (mmol /L) NaCl 147, KCl 4, MgCl2
.
6H2O 1.05, CaCl2. 2H2O 0.42, Na2PO4. 2H2O 1.81, and 5.5 mmol/L
glucose was used. Ca2+-free PSS containing (mmol/L) NaCl 134.8,KCl 4.5, glucose 5, and N-[2-hydroxyethyl] piperazine- N-[2-ethanesulphonic acid] (HEPES) 10 was adjusted to pH 7.4 withTris [hydroxymethyl] aminomethane (TRIZMA). Modified K-Bsolution containing (mmol/L) L-glutamate 50, KCl 50, taurine20, KH2PO4 20, MgCl2
. 6H2O 3, glucose 10, HEPES 10 and egtazic

acid 0.5 was adjusted to pH 7.40 with KOH. Isosmotic solution(290 mOsmol/L) containing (mmol/L) NaCl 80, KCl 4.5, HEPES10, MgCl2
.6H2O 1, CaCl2.2H2O 2, Glucose 5, Sucrose 110, was
adjusted to pH 7.4 with Tris. Hypoosmotic solution (200mOsmol/L) contained (in mmol/L) sucrose 30, and otheringredients was the same as the isosmotic solution. Pipettesolution recording IK(ca) contained (mmol/L) potassium-asparticacid 110, Mg-ATP 5, HEPES 5, MgCl2
.6H2O 1.0, KCl 20, egtazicacid 0.1, di-tris-creatine phoshate 2.5, disodium-creatinephosphate 2.5 and its pH was adjusted to 7.3 with KOH. Pipettesolution recording IK(V) contained (mmol/L) EGTA 10, and otheringredients was the same as the pipette solution recording IK(ca).Cytochalasin-B was dissolved in dimethyl sulphoxide (DMSO,20 mmol/L) and phalloidin was dissolved in alcohol (1 mmol/L).The same amount of DMSO or alcohol as the final experimentalsolution was added to the pipette solution. All the chemicals inthis experiment were purchased from Sigma (USA).
Data analysisAll data were expressed as mean±SD. Statistical significancewas evaluated by a t-test. Differences were considered to be
significant when P value was less than 0.05.
RESULTSEffect of Cyt-B and phalloidin on IK(Ca)
Under the whole cell configuration, the membrane potential wasclamped at -60 mV, IK(ca) was elicited by step voltage commandpulse from -40 mV to +100 mV for 440 ms with a 20 mV incrementat 10 s intervals. An actin microfilament disruptor, Cyt-B(20 µmol/L in pipette) markedly increased IK(Ca) to 138.4±14.3%at +60 mV (n = 15, Figures 1B, C). In the same condition, anactin microfilament stabilizer, phalloidin (20 µmol/L in pipette)inhibited IK(Ca) to 74.2±7.1% at +60 mV (n = 15, Figures 2B, C).
Effect of Cyt-B and phalloidin on IK(V)
Under the whole cell configuration, the membrane potentialwas clamped at -60 mV, IK(V) was elicited by step voltagecommand pulse from -40 mV to +80 mV for 440 ms with a 20 mVincrement at 10 s intervals. Cyt-B (20 µmol/L in pipette) markedlyincreased IK(V) to 142.1±13.1% at +60 mV (n = 12, Figures 3B,C). In the same condition, phalloidin (20 µmol/L in pipette)inhibited IK(V) to 75.4±9.9% at +60 mV (n = 12, Figures 4B, C).
Figure 1 Effect of Cyt-B on IK(Ca). A: Representative current trace of IK(Ca). B: I/V relationship of IK(Ca). C: Cyt-B enhanced IK(Ca). Inisosmotic condition. (n = 15, aP<0.05, bP<0.01 vs control).
Figure 2 Effect of phalloidin on IK(Ca). A: Representative current trace of IK(Ca). B: I/V relationship of IK(Ca). C: Phalloidin inhibited IK(Ca)
in isosmotic condition. (n = 15, aP<0.05, bP<0.01 vs control).
Figure 3 Effect of Cyt-B on IK(V). A: Representative current trace of IK(V). B: I/V relationship of IK(V). C: Cyt-B enhanced IK(V) inisosmoticcondition.(n = 15, aP<0.05, bP<0.01 vs control).
-40 -20 0 20 40 60 80 100
140
120
100
80
60
40
20
0
C
Rela
tive c
urr
ent
(%)
Control Cyt-B
140
120
100
80
60
40
20
0
Control (290 mOsm)
Cyt-B (290 mOsm)
I/Im
ax (
%)
Membrane potential (mV)
Control
Cyt-B
2 nA
200 mS
-60 mV
100 mV-40 mV
A B b
Control
Phalloidin
2 nA
200 mS
-60 mV
100 mV
-40 mV
-40 -20 0 20 40 60 80 100
100
80
60
40
20
0
Control (290 mOsm)
Phalloidin (290 mOsm)
I/Im
ax (
%)
a
a
b
b
b
aa
b
b
b
100
80
60
40
20
0
Rela
tive c
urr
ent
(%)
Control Phalloidin
b
A B C
Control
Cyt-B
2 nA
200 mS
-60 mV
80 mV-40 mV
-40 -20 0 20 40 60 80
140
120
100
80
60
40
20
0
Control (290 mOsm)
Cyt-B (290 mOsm)
I/Im
ax (
%)
Membrane potential (mV)
140
120
100
80
60
40
20
0
Rela
tive c
urr
ent
(%)
Control Cyt-B
b
a
a
b
bBA C
3304 ISSN 1007-9327 CN 14-1219/ R World J Gastroenterol November 15, 2004 Volume 10 Number 22
Membrane potential (mV)

Li XL et al. Effect of actin microfilament on potassium current 3305
Figure 4 Effect of phalloidin on IK(Ca). A: Representative current trace of IK(Ca). B: I/V relationship of IK(Ca). C: Phalloidin inhibited IK(Ca)
in isosmotic condition. (n = 15, aP<0.05, bP<0.01 vs control).
Figure 5 Effect of hyposmotic membrane stretch on IK(Ca). A: Representative current trace of IK(Ca). B: I/V relationship of IK(Ca). C:Hyposmotic membrane strech increased IK(Ca). (n = 15, aP<0.05, bP<0.01 vs control).
Figure 6 Effect of hyposmotic membrane stretch on IK(V). A: Representative current trace of IK(V). B: I/V relationship of IK(V). C:Hyposmotic membrane strech increased IK(V). (n = 15, aP<0.05, bP<0.01 vs control).
Figure 7 Effect of Cyt-B and phalloidin on hyposmotic membrane stretch-increase of I(KCa). A, B and C: I/V relationship of I(KCa).(n = 15, aP<0.05, bP<0.01 vs 290 mOsm). D: No effect of Cyt-B and phalloidin on the increased of IK(Ca) induced by hyposmoticmembrane stretch (n = 15).
Control
Phalloidin
2 nA
200 mS
-60 mV
80 mV
-40 mV
-40 -20 0 20 40 60 80
100
80
60
40
20
0
Control (290 mOsm)
Phalloidin (290 mOsm)
I/Im
ax (
%)
Membrane potential (mV)
a
b
b
b
a
100
80
60
40
20
0
Rela
tive c
urr
ent
(%)
Control Phalloidin
b
B CA
Control
200 mOsm
2 nA
200 mS
-60 mV
100 mV
-40 mV
-40 -20 0 20 40 60 80 100
150
100
50
0
Control
200 mOsm
I/Im
ax (
%)
Membrane potential (mV)
ab
b
b
b
b
150
100
50
0
200 mOsm
Control
Rela
tive c
urr
ent
(%)
bA CB
Control
200 mOsm
2 nA
200 mS
-60 mV
80 mV-40 mV
-40 -20 0 20 40 60 80
140
120
100
80
60
40
20
0
Control
200 mOsm
I/Im
ax (
%)
Membrane potential (mV)
a
b
b
120
100
80
60
40
20
0
200 mOsm
Control
Rela
tive c
urr
ent
(%)
bA CB
-40 -20 0 20 40 60 80 100
150
100
50
0
Control (290 mOsm)
200 mOsm
I/Im
ax (
%)
Membrane potential (mV)
ab
b
b
b
b
-40 -20 0 20 40 60 80 100
150
100
50
0
Cyt-B (290 mOsm)
Cyt-B (200 mOsm)
I/Im
ax (
%)
Membrane potential (mV)
bab
bb
b
b
b
-40 -20 0 20 40 60 80 100
150
100
50
0
Phalloidin (290 mOsm)
Phalloidin (200 mOsm)
I/Im
ax (
%)
Membrane potential (mV)
bb
b
b
b
160140120100806040200
200 mOsm
290 mOsm
Rela
tive c
urr
ent
(%)
Control Cyt-B Phalloidin
A B
DC

Effect of hyposmotic membrane stretch on IK(Ca) and IK(V)
Using the same pulse protocol, the effect of hyposmotic membranestretch on IK(Ca) and IK(V) was observed. When the cells weresuperfused with hyposmotic solution (200 mOsmol/L), stepcommand pulse-induced IK(Ca) increased from 0mV (Figure 5B)and the increasing amplitude was 50.6±9.7% at +60 mV (n = 15,Figure 5C). In the same condition, hyposmotic superfusingincreased step command pulse-induced IK(V) from +40 mV(Figure 6B) and the increasing amplitude was 24.9±3.3% at+60 mV (n = 12, Figure 6C).
Effect of Cyt-B and phalloidin on hyposmotic membrane stretch-induced increase of IK(Ca)
To determine the possibility of actin microfilament involved inhyposmotic membrane stretch-induced increase of IK(Ca), theeffects of Cyt-B and phalloidin on IK(Ca) in which cells wereperfused with isosmotic and hypoosmotic solutions wereobserved respectively. Hyposmotic membrane stretch increasedIK(Ca) from 0 mV (Figure 7A) and the increasing amplitude was50.6±9.7% at 60 mV in the control group (n = 15, Figures 7A, 8D).In the presence of Cyt-B and phalloidin (20 µmol/L in pipette)hyposmotic membrane stretch also increased IK(Ca) by 44.5±7.9%(n = 15, Figures 7B, D) and 55.7±9.8% (n = 15, Figures 7C, D) at+60 mV respectively. There was no significant difference betweencontrol group and Cyt-B group or phalloidin group.
Effect of Cyt-B and phalloidin on hyposmotic membrane stretch-induced increase of IK(V)
Hyposmotic membrane stretch increased IK(V) by 24.9±3.3% at+60 mV in the control group (n = 12, Figures 8A, D). In the presenceof Cyt-B and phalloidin (20 µmol/L in pipette) hyposmoticmembrane stretch also increased IK(V) by 22.9±5.5% (n = 12,Figures 8B, D) and 30.3±4.5% (n = 12, Figures 8C, D) at +60 mVrespectively. There was no significant difference betweencontrol group and Cyt-B group or phalloidin group.
DISCUSSIONCytoskeleton is an intracellular superstructure that consists of
microfilaments of actin and associated proteins, microtubules,and intermediate filaments. Actin microfilament, in particular,are involved in structural support and a functional role in cellmotility[15]. Recent evidence indicated, however, actin-basedcytosleleton was involved in the control of ion channel activityacross the plasma membranes of different cell types. For example,actin microfilaments were implicated in the regulation of soldiumchannels in human jejunal circular smooth muscle cells[16] andATP-sensitive potassium channel in ventricular myocytes[5, 17].Actin microfilaments could also regulate voltage-dependentchannels, for example, actin microfilaments could mediatevoltage-dependent epithelial soldium channels in neuron cells[18]. It was proposed that cell surface proteins and extra cellularmatrix were linked to the cytoskeleton by transmembrane proteinsand modulate ion channels and enzymes by mechanicaldeformation under physiological conditions. In the presentstudy, we observed that an actin microfilament disruptor,Cyt-B increased IK(Ca) and IK(V) significantly (Figures 1B, C,Figures 3B, C). However, an actin microfilament stabilizer,phalloidin inhibited IK(Ca) and IK(V) markedly (Figures 2B, C,Figures 4B, C) in gastric myocytes. These results suggestedthat when actin microfilaments were disrupted, IK(Ca) or IK(V)
could be activated; while, when actin microfilaments werestabilized, IK(Ca) or IK(V) could be inhibited in gastric myocytes.Many previous studies also supported our experiment. Forexample, Cyt-D activated calcium-activated potassium channelin human meningioma cells[6], Cyt-B activated K (ATP) channelsin cardiac[5]. Stretch is a physiological stimulation in gut smooth mucles.There are two kinds of potassium current, calcium-activatedpotassium current and delayed rectifier potassium current. Inthe present study, the two kinds of potassium current wereactivated by hyposmotic swelling in gastric antral smoothmuscle cells of guinea pigs (Figures 5-6). In order to investigatethe mechanism of hyposmotic membrane stretch-inducedincrease of IK(Ca) and IK(V), the relationship between potassiumchannel activity and actin microfilaments was observed. Whenactin microfilaments were disrupted by Cyt-B or stabilized byphalloidin, hyposmotic membrane stretch-induced increase of
Figure 8 Effect of Cyt-B and phalloidin on hyposmotic membrane stretch-increase of IK(V). A, B and C: I/V relationship of IK(V).(n = 12, aP<0.05, bP<0.01 vs 290 mOsm). D: No effect of Cyt-B and phalloidin on the increased of IK(V) induced by hyposmoticmembrane stretch (n = 12).
Membrane potential (mV)
-40 -20 0 20 40 60 80Membrane potential (mV)
140
120
100
80
60
40
20
0
b
Phalloidin (290 mOsm)
Phalloidin (200 mOsm)
I/Im
ax (
%)
b
a
A B
C
3306 ISSN 1007-9327 CN 14-1219/ R World J Gastroenterol November 15, 2004 Volume 10 Number 22
-40 -20 0 20 40 60 80
140
120
100
80
60
40
20
0
Rela
tive c
urr
ent
(%) Control (290 mOsm)
Control (200 mOsm)a
b
b
-40 -20 0 20 40 60 80
I/Im
ax (
%)
Membrane potential (mV)
140
120
100
80
60
40
20
0
a
bCyt-B (290 mOsm)
Cyt-B (200 mOsm)
b
Control Cyt-B Phalloidin
140
120
100
80
60
40
20
0Rela
tive c
urr
ent
(%)
200 mOsm
290 mOsm
D

IK(Ca) and IK(V) was not affected (Figures 7-8). These resultsindicated that actin microfilaments were not involved in theincrease of potassium current induced by hyposmotic cellswelling in gastric circular myocytes of guinea pig. Previousstudies supported our results. For example, Wang et al.[10]
observed that neither the microfilaments nor the microtubuleswere involved in the enhancement of IK(V) induced by celldistension in ventricular myocytes of guinea pig. We alsoobserved that unsaturated fatty acids, exogenous andendogenous, were involved in the increase of calcium-activatedpotassium current induced by hyposmotic membrane stretch(data not shown). So that hyposmotic membrane stretch-induced increase of potassium currents may be related tounsaturated fatty acids in cell membranes. Our previous study demonstrated that actin microfilamentsplayed an important role in the modulation of membrane stretch-induced calcium influx and hyposmotic membrane stretch-induced increase of muscarinic current in guinea-pig gastricmyocytes[19,20]. It is obvious that cytoskeleton plays a differentrole in different types of cells and different kinds of ion channels.In gastric smooth muscle actin microfilaments may be involvedin the process of hyposmotic membrane stretch-induceddepolarization of membrane potential. However, actinmicrofilaments would not be involved in the process of cellswelling-induced hyperpolarization of membrane potential. In summary, actin microfilaments regulate potassium channelactivities in normal condition. However, actin microfilamentsare not involved in hyposmotic cell swelling-induced increaseof potassium currents.
REFERENCES1 Janmey PA. The cytoskeleton and cell signaling: component
localization and mechanical coupling. Physiol Rev 1998; 78:763-781
2 Wang H, Bedford FK, Brandon NJ, Moss SJ, Olsen RW. GABAA-receptor-associated proteins link GABAA receptors and thecytoskeleton. Nature 1999; 397: 69-72
3 Wang WH, Cassola A, Giebisch G. Involvement of actin cy-toskeleton in modulation of apical K channel activity in ratcollecting duct. Am J Physiol 1994; 267(4 Pt 2): F592-598
4 Ehrhardt AG, Frankish N, Isenberg G. A large-conduc-tance K+ channel that is inhibited by the cytoskeleton in thesmooth muscle cell line DDT1 MF-2. J Physiol 1996; 496(Pt 3):663-676
5 Jovanovic S, Jovanovic A. Diadenosine tetraphosphate-gatingof cardiac K (ATP) channels requires intact actin cytoskeleton.Naunyn Schmiedebergs Arch Pharmacol 2001; 364: 276-280
6 Kraft R, Benndorf K, Patt S. Large conductance Ca2+-activatedK+ channels in human meningioma cells. J Membr Biol 2000;175: 25-33
7 Huang H, Rao Y, Sun P, Gong LW. Involvement of actin cy-toskeleton in modulation of Ca (2+)-activated K (+) channelsfrom rat hippocampal CA1 pyramidal neurons. Neurosci Lett2002; 332: 141-145
8 Shimoni Y, Ewart HS, Severson D. Insulin stimulation of ratventricular K+ currents depends on the integrity of thecytoskeleton. J Physiol 1999; 514(Pt 3): 735-745
9 Song DK, Ashcroft FM. ATP modulation of ATP-sensitivepotassium channel ATP sensitivity varies with the type of SURsubunit. J Biol Chem 2001; 276: 7143-7149
10 Wang Z, Mitsuiye T, Noma A. Cell distension-induced in-crease of the delayed rectifier K+ current in guinea pig ventricu-lar myocytes. Circ Res 1996; 78: 466-474
11 Ribeiro R, Heinke B, Diener M. Cell volume-induced changesin K+ transport across the rat colon. Acta Physiol Scand 2001;171: 445-458
12 Li Y, Xu WX, Li ZL. Effects of nitroprusside, 3-morpholino-sydnonimine, and spermine on calcium-sensitive potassiumcurrents in gastric antral circular myocytes of guinea pig. ActaPharmacol Sin 2000; 21: 571-576
13 Piao L, Li Y, Li L, Xu WX. Increment of calcium-activated anddelayed rectifier potassium current by hyposmotic swelling ingastric antral circular myocytes of guinea pig. Acta PharmacolSin 2001; 22: 566-572
14 Yu YC, Guo HS, Li Y, Piao L, Li L, Li ZL, Xu WX. Role of calciummobilization in sodium nitroprusside-induced increase of cal-cium-activated potassium currents in gastric antral circularmyocytes of guinea pig. Acta Pharmacol Sin 2003; 24: 819-825
15 Stossel TP. On the crawling of animal cells. Science 1993; 260:1086-1094
16 Strege PR, Holm AN, Rich A, Miller SM, Ou Y, Sarr MG,Farrugia G. Cytoskeletal modulation of sodium current in hu-man jejunal circular smooth muscle cells. Am J Physiol CellPhysiol 2003; 284: C60-66
17 Terzic A, Kurachi Y. Actin microfilament disrupters enhanceK (ATP) channel opening in patches from guinea-pigcardiomyocytes. J Physiol 1996; 492(Pt 2): 395-404
18 Srinivasan Y, Elmer L, Davis J, Bennett V, Angelides K. Ankyrinand spectrin associate with voltage-dependent sodium chan-nels in brain. Nature 1988; 333: 177-180
19 Xu WX, Kim SJ, So I, Kim KW. Role of actin microfilament inosmotic stretch-induced increase of voltage-operated calciumchannel current in guinea-pig gastric myocytes. Pflugers Arch1997; 434: 502-504
20 Wang ZY, Yu YC, Cui YF, Li L, Guo HS, Li ZL, Xu WX. Role ofactin microfilament in hyposmotic membrane stretch-inducedincrease in muscarinic current of guinea-pig gastric myocytes.Shengli Xuebao 2003; 55: 77-182
Edited by Wang XL Proofread by Xu FM
Li XL et al. Effect of actin microfilament on potassium current 3307

PO Box 2345, Beijing 100023, China World J Gastroenterol 2004;10(22):3308-3312Fax: +86-10-85381893 World Journal of GastroenterologyE-mail: [email protected] www.wjgnet.com Copyright © 2004 by The WJG Press ISSN 1007-9327
• BASIC RESEARCH •
Selection, proliferation and differentiation of bone marrow-derived
liver stem cells with a culture system containing cholestatic serum
in vitro
Yun-Feng Cai, Zuo-Jun Zhen, Jun Min, Tian-Ling Fang, Zhong-Hua Chu, Ji-Sheng Chen
Yun-Feng Cai, Department of Liver-biliary Surgery, the First Hospitalof Foshan City, Foshan 528000, and Department of Hepatic-biliarySurgery, the 2nd Affiliated Hospital of Sun Yat-Sen University,Guangzhou 510120, Guangdong Province, ChinaZuo-Jun Zhen, Department of Liver-biliary Surgery, the First Hospitalof Foshan City, Foshan 528000, Guangdong Province, ChinaJun Min, Department of Hepatic-biliary Surgery, Stem Cell ResearchCenter, Research Center of Medicine, the 2nd Affiliated Hospital ofSun Yat-Sen University, Guangzhou 510120, Guangdong Province,ChinaTian-Ling Fang, Zhong-Hua Chu, Ji-Sheng Chen, Departmentof Hepatic-biliary Surgery, the 2nd Affiliated Hospital of Sun Yat-SenUniversity, Guangzhou 510120, Guangdong Province, ChinaSupported by the National Natural Science Foundation of China, No.30271277 and Natural Science Foundation of Guangdong Province,No.021851Correspondence to: Dr. Yun-Feng Cai, Department of Liver-biliarySurgery, the First Hospital of Foshan City, 1 Dafu Nanlu, Foshan528000, Guangdong Province, China. [email protected]: +86-757-83833633-1119 Fax: +86-757-83835218Received: 2003-10-20 Accepted: 2003-12-16
Abstract
AIM: To explore the feasibility of direct separation, selectiveproliferation and differentiation of the bone marrow-derivedliver stem cells (BDLSC) from bone marrow cells with a culturesystem containing cholestatic serum in vitro.
METHODS: Whole bone marrow cells of rats cultured inroutine medium were replaced with conditioning selectionmedia containing 20 mL/L, 50 mL/L, 70 mL/L, and 100 mL/Lcholestatic sera, respectively, after they attached to the plates.The optimal concentration of cholestatic serum was determinedaccording to the outcome of the selected cultures. Then theselected BDLSC were induced to proliferate and differentiatewith the addition of hepatocyte growth factor (HGF). Themorphology and phenotypic markers of BDLSC werecharacterized using immunohistochemistry, RT-PCR andelectron microscopy. The metabolic functions of differentiatedcells were also determined by glycogen staining and urea assay.
RESULTS: Bone marrow cells formed fibroblast-like but nothepatocyte-like colonies in the presence of 20 mL/L cholestaticserum. In 70 mL/L cholestatic serum, BDLSC colonies couldbe selected but could not maintain good growth status. In100 mL/L cholestatic serum, all of the bone marrow cellswere unable to survive. A 50 mL/L cholestatic serum was theoptimal concentration for the selection of BDLSC at whichBDLSC could survive while the other populations of the bonemarrow cells could not. The selected BDLSC proliferatedand differentiated after HGF was added. Hepatocyte-likecolony-forming units (H-CFU) then were formed. H-CFUexpressed markers of embryonic hepatocytes (AFP, albuminand cytokeratin 8/18), biliary cells (cytokeratin 19), hepatocytefunctional proteins (transthyretin and cytochrome P450-2b1),and hepatocyte nuclear factors (HNF-1α and HNF-3β). They
also had glycogen storage and urea synthesis functions,two of the critical features of hepatocytes.
CONCLUSION: The selected medium containing cholestaticserum can select BDLSC from whole bone marrow cells. Itwill be a new way to provide a readily available alternatesource of cells for clinical hepatocyte therapy.
Cai YF, Zhen ZJ, Min J, Fang TL, Chu ZH, Chen JS. Selection,proliferation and differentiation of bone marrow-derived liverstem cells with a culture system containing cholestatic serumin vitro. World J Gastroenterol 2004; 10(22): 3308-3312
http://www.wjgnet.com/1007-9327/10/3308.asp
INTRODUCTIONSeveral recent reports have highlighted the broad developmentalpotential of bone marrow-derived stem cells and the term “stemcell plasticity” has been coined [1]. Bone marrow-derived stemcells have been reported to produce not only all of the bloodlineages, but also skeletal muscle[2,3], neurons[4,5], cardiacmuscle[6,7], pulmonary epithelium[8], and liver epithelium[9]. Thetransdifferention of bone marrow-derived cells into hepatic cellswas described in rats[9], mice[10] and humans[11,12]. This has broughta new hope for cell therapy using autologous bone marrow cellswhich have few ethical problems and applied to severe liverdisease[13]. However, bone marrow contains hematopoietic[14,15],mesenchymal stem cells[16,17] and multipotent adult progenitorcells[18]. The characteristic surface markers of these specific bonemarrow-derived liver stem cells (BDLSC) are still obscure. It isdifficult to identify and sort these particular cells by immunologicalmethods, such as fluorescent activated cell sorting (FACS)[14]
and magnetic activated cell sorting (MACS)[19]. Although variousbone marrow stem cells were found to proliferate injured livercells, previous attempts at isolation of liver stem cells resultedin a mixture of hemotopoietic cells and potential hepatocyteprogenitors because they all shared common cell surface receptorsand antigens, including hematopoietic stem cell markers CD34,Thy-1, c-Kit, and flt-3[20-22]. It is necessary to find a new way toisolate and purify BDLSC. According to the principle that cellsin culture can survive only when they accommodate to the existingenvironment, we assumed to develop a culture system that canselect BDLSC from whole bone marrow cells directly. Withinsuch a system, only BDLSC can survive while the other bonemarrow cells cannot. This particular culture system must containfactors that can activate the proliferation of liver stem cells andingredients inhibiting the growth of other cells. Studies of therelative mechanisms of liver regeneration and liver stem cellscorresponding to liver injury[23-26] indicated that the pathologicalserum after severe liver injury might provide the above conditions.We developed the culture system using cholestatic serumobtained after ligation of common bile duct to induce liverlesions, to select and proliferate BDLSC from whole bone marrowcells in vitro. We named this medium system as “pathologicalmicroenvironment” selecting medium.

MATERIALS AND METHODSPreparation of conditional selection mediumPreparation of cholestatic serum Sprague-Dawley (SD) ratsweighing 200-250 g were performed common bile duct ligationand transection under general (ether) anesthesia to inducecholestasis. After 10 d, whole blood of each rat was collectedand serum was separated. The serum was then subjected to liverfunction test, and inactivated and asepticized for culture use.Ingredients of conditional selection medium Twenty mL/L,50 mL/L, 70 mL/L, and 100 mL/L cholestatic serum were addedinto DMEM (Gibco) containing 20 mmol/L HEPES (Sigma),10-7 mol/L dexamethasone (Sigma), and antibiotics to act as theconditional selection medium.
Selection, proliferation and differentiation of BDLSCCulture of whole bone marrow cells Rat bone marrow cellswere obtained by flushing femurs. The femurs were accessedthrough laparotomy to avoid contamination and to increasethe cell yield. Bone marrow cells were suspended in DMEMand plated at the density of 1×10⁹ cells/L onto culture dishes.DMEM enriched with 100 mL/L fetal bovine serum (FBS,Hyclone), 20 mmol/L HEPES, 10-7 mol/L dexamethasone, andantibiotics was used. Dishes were placed in a humidified incubatorcontaining 50 mL/L CO2-950 mL/L O2 at 37 .Selection, proliferation and differentiation of liver stem cellsThree days after the culture, the medium and suspended cellswere discarded and replaced by conditional selection mediumwith various concentrations of cholestatic serum. Cells culturedin medium containing FBS were used as control. After 4 d, themedia were enriched with 25 µg/L hepatocyte growth factor(HGF, Peprotech EC). Medium was replaced every 3 d and thecultures were maintained for about 2 wk.
Morphological and phenotypic markers of differentiated cellsImmunohistochemistry Bone marrow cells were cultured andselected with the conditional selection medium on 6-well disheswith cover glasses. Twelve days after replacement of the conditionalselection medium, cover glasses and the above differentiatedBDLSC were taken out and fixed with 40 g/L paraformaldehyde(Sigma) for 30 min at room temperature. The primary antibodies weregoat anti-rat albumin, alpha-fetoprotein (AFP), and cytokeratin-8/18 (CK8/18) polyclonal antibodies. The slides were incubatedwith various primary antibodies at room temperature for 2 h ina humidified chamber. Blocking serum and biotinylated
secondary antibody were matched with the primary antibody.Immunoperoxidase was stained and counterstained with DABand Gill-I hematoxylin.Electron microscopy Culture dishes were washed with PBS(pH 7.4), and fixed in cold 25 g/L glutaraldehyde in 0.1 mol/Lsodium cacodylate buffer (pH 7.4) for 48 h. After fixation, cellswere curetted and centrifuged to form aggregates. After postfixedin 10 g/L osmium tetroxide in 0.1 mol/L sodium cacodylate (pH7.4),cells were dehydrated in graded alcohols and embedded in lowviscosity epoxy resin. Ultrathin sections were stained with uranylacetate and lead citrate and viewed under electron microscope.Total RNA isolation and reverse transcriptase-polymerasechain reaction (RT-PCR) Total RNA was extracted from 1×10⁶
differentiated cells by using Trizol (Promega). cDNA was preparedfrom 2 µg of total RNA in a buffer containing MMLV reversetranscriptase (Promega) and 0.5 µg random primer (Takara).The RNA was incubated at 70 for 5 min, at 37 for 1 h, andat 95 for 5 min. Samples of cDNA corresponding to the inputRNA were amplified in PCR reaction buffers containing primersand LA Taq DNA polymerase (Takara). Primers used foramplification were hepatocyte nuclear factor-1α (HNF-1α),hepatocyte nuclear factor-3β (HNF-3β), CK18, CK19, albumin,AFP, transthyretin (TTR), and cytochrome P450-2b1 (CYP2b1).The sequences are listed in Table 1. After initial denaturation(at 94 for 5 min), 30 cycles of PCR were performed (at 94 for 30 s, annealing at the optimal temperature for each pair ofprimers for 30 s, at 72 for 30 s), and extension at 72 for7 min. Amplified products were subjected to electrophoresis in20 g/L agarose gels and stained with ethidium bromide. All theprocedures were performed according to the manufacturer’sinstructions.
Function tests of differentiated cellsPeriodic acid-Schiff staining for glycogen Differentiated cellswere fixed in 950 mL/L ethanol for 10min, rinsed in dH2O.Afterwards, cells were oxidized in 10 g/L periodic acid for 15 minand rinsed three times in dH2O, then treated with Schiff’s reagentfor 30 min and rinsed in dH2O for 10 min, stained with Mayer’shematoxylin for 1 min and rinsed in dH2O.Urea assay Urea concentrations were determined by colorimetricassay (640-A, Sigma). Differentiated cells were plated on 6-welldishes. Each well contained 1×10⁶ cells. Urea concentrationswere detected every day for 4 d according to the manufacture’sinstructions. Culture medium and blank tube were used as negativecontrols.
Table 1 Sequence of primers and length of fragments
Gene Primer Fragment (bp)
HNF-1α S:5’-AGCTGCTCCTCCATCATCAGA-3’ 138
A:5’-TGTTCCAAGCATTAAGTTTTCTATTCTAA-3’
HNF-3β S:5’-CCTACTCGTACATCTCGCTCATCA-3’ 68
A:5’-CGCTCAGCGTCAGCATCTT-3’
CK-18 S:5’-GCCCTGGACTCCAGCAACT-3’ 70
A:5’-ACTTTGCCATCCACGACCTT-3’
CK-19 S:5’-ACCATGCAGAACCTGAACGAT-3’ 83
A:5’-CACCTCCAGCTCGCCATTAG-3’
Albumin S:5’-CTGGGAGTGTGCAGATATCAGAGT-3’ 141
A:5’-GAGAAGGTCACCAAGTGCTGTAGT-3’
AFP S:5’-GTCCTTTCTTCCTCCTGGAGAT-3’ 145
A:5’-CTGTCACTGCTGATTTCTCTGG-3’
TTR S:5’-CAGCAGTGGTGCTGTAGGAGTA-3’ 152
A:5’-GGGTAGAACTGGACACCAAATC-3’
CYP2b1 S:5’-ACTTTCCTGGTGCCCACA-3’ 157
A:5’-TCCTTCTCCATGCGCAGA-3’
Cai YF et al. Selection of bone marrow-derived liver stem cells 3309

RESULTSPreparation of the conditioning selection mediumTen days after the ligation of common bile duct, TBIL of thecholestatic rats was 107±48.2 µmol/L. The conditional selectionmedia containing 20 mL/L, 50 mL/L, 70 mL/L, and 10 mL/L cholestaticsera had TBIL concentrations of 2.1 µmol/L, 5.3 µmol/L, 7.4 µmol/Land 10.8 µmol/L accordingly.
Bone marrow cells cultured in different concentrations ofcholestatic serumIn routine culture condition, part of the bone marrow cells attachedto the plate in about 3 d, and then became elongated andfibroblast-like, conforming to the mesodermal characteristics oftheir origin. After replaced by the conditional selection mediumcontaining 20 mL/L cholestatic serum, the attached cells stillsurvived while the rapid growth was hindered. Seven daysafter cultured in the medium, colonies were mainly composed offibroblast-like cells. Only a few colonies acquired hepatocyte-like morphology, although HGF was added. In the presence of50 mL/L cholestatic serum, a large number of the attached cellsexfoliated within 3 d, while many small colonies appeared(Figure 1). These colonies were composed of small, undifferentiatedcells in the center, and epithelioid cells at the periphery. Thecells enriched with HGF proliferated rapidly. In 70 mL/Lcholestatic serum condition, most of the cells exfoliated, fewercolonies appeared, and HGF could not stimulate theirproliferation. When the concentration increased to 100 mL/L,all of the cells exfoliated and became apoptosis.
Figure 1 Cell colonies 3 d after selection. Polygonal surroundingcells could be seen.
Morphological evidence of BDLSC differentiationDuring the first 3 d many colonies appeared in conditionalselection culture containing 50 mL/L cholestatic serum. Afterenriched with HGF, the colonies enlarged, and the cells proliferatedrapidly. Large hepatocyte-like colony-forming units (H-CFU)came into being in about 12 d. The H-CFU were composed ofsmall, undifferentiated cells in the center, and large cells with regularmultilateral contours, low nuclear-to-cytoplasmic ratio, andsingle round nuclei at the periphery. The differentiated cells formedcords or trabeculae resembling the hepatocyte cords in hepaticlobules (Figure 2). The largest colonies contained 1×10⁶ cellsand could be observed macroscopically, whereas the smallcolonies were about 30-50 cells. The central undifferentiatedcells could still form H-CFU when they were picked out and culturedin the selection medium containing 50 mL/L cholestatic serumand HGF in about 1 wk. Ultrastructurally, the differentiated cells were rich inendoplasmic reticulum and ribosomes and contained abundantellipsoid mitochondria (Figure 3), which were different to the controlcells. These ultrastructural features are typical of adult hepatocytes.
Phenotypic markers of differentiated cellsThe identification of hepatocyte-like cells in 12-day-old selection
medium cultures prompted us to analyze these cells for biochemicalevidence of hepatocytic differentiation. Immunohistochemistrywas performed in cells grew on the cover glasses for the existenceof albumin (Figure 4), AFP and CK8/18, the characteristic proteinsexpressed during hepatocyte development. Immunoperoxidasestaining for these proteins revealed diffuse cytoplasmic stainingof hepatocte-like cells. In contrast, the fibroblast-like cells grewin the routine cultures did not express these proteins. RT-PCRfurther convinced the hepatocytic characteristics of differentiatedcells as the results showed that there were mRNA transcriptsof HNF-1α, HNF-3β, albumin, AFP, CK-18, CK-19, TTR, andCYP2b1, all of which were hepatic specific (Figure 5).
Figure 2 Appearance of hepatocyte-like colony forming units(H-CFU) 12 d after selection A: H-CFU, undifferentiated roundcells in the center, surrounded by polygonal hepatocyte-likecells B: Regular arrangement of surrounding hepatocyte-likecells similar to the cords of hepatocytes.
Figure 3 Ultrastructure of hepatocyte-like cells. 9 000×.
Figure 4 Positive staining of albumin immunohistochemis-try 12 d after selection. ABC staining 200×.
A
B
3310 ISSN 1007-9327 CN 14-1219/ R World J Gastroenterol November 15, 2004 Volume 10 Number 22

Figure 5 RT-PCR results M: marker, 1: AFP, 2: CK-18, 3:CYP2b1, 4: HNF-3β, 5: Albumin, 6: TTR, 7: CK-19, 8: HNF-1α.
Function tests of differentiated cellsWe analyzed the levels of glycogen storage by periodic acid-Schiff (PAS) staining. Glycogen storage was seen as accumulationof magenta staining in the cytoplasms of hepatocyte-likedifferentiated cells (Figure 6). The control cells did not show similarstaining. Urea production and secretion by hepatocyte-like cellswere measured at various time points after the differentiatedmorphology appeared. Bone marrow cells and fibroblast-likecells did not produce urea. Urea assay revealed that ureaconcentration in the medium increased in a time-dependentmanner (Figure 7).
Figure 6 PAS staining of hepatocyte-like differentiated cells.The cells were positive in the cytoplasm (A) 200×, (B) 400×.
Figure 7 Urea synthetic function of bone marrow-derived liverstem cells (mean±SD, n = 4).
DISCUSSIONSince the results of cross-sex and cross-strain bone marrowand whole liver transplantation experiments indicated that thebone marrow might be a source of hepatocyte progenitors, greatinterests have been aroused in identification and isolation ofliver stem cells from bone marrow cells. Until recently, severalsubsets of bone marrow cells have been found to have thepotential to differentiate into hepatocytes, such as KTLS cells(c-kithighThylowLin-Sca-1+)[20], β2-m-Thy-1+ cells[27,28], multipotentadult progenitor cells (MAPC, CD44–CD45–HLA–c-kit–)[18], andC1qRp
+ Lin-CD45+CD38-CD34+/- cells[29]. These stem cells couldexpress different surface markers, and might represent differentstages or different branches along the differentiation anddevelopmental processes of bone marrow stem cells. So far,the characteristic surface markers of BDLSC and their pedigreesin the derivation of bone marrow stem cells remain obscure.Any subset sorting methods based on phenotypes would certainlylose other stem cells that have the ability to differentiate intohepatocytes. Furthermore, the sorting manipulations of the abovestem cells with complicated surface markers are very difficult. Studies on liver regeneration showed that liver stem cellscould correspond to and repair liver injury only under certainsevere pathological circumstances such as extensive liver necrosisdue to chemical injury or hepatocytes treated with chemicals thatcould block their proliferation[24]. Based on this mechanism, weassumed to imitate the in vivo pathological microenvironmentof liver injury in culture of whole bone marrow cells, in order toprovide specific proliferation signals for BDLSC, and to avoidresource loss of liver stem cells and complicated manipulationdue to subset sorting. The key of this method is to develop anoptimal “pathological microenvironment”. Olynyk et al.demonstrated that in the cholestatic model of common bile ductligation, intrahepatic liver stem cells showed great proliferation[25].Avital et al. recently reported that β2-m-Thy-1+ cells in bonemarrow could differentiate into cells with hepatocyte-likephenotypes when co-cultured with adult hepatocyes in a mediumcontaining cholestatic serum[27], suggesting that there arestimulating factors in cholestatic serum. In our experiments, weused pathologically conditional selection medium containingcholestaic serum to culture whole bone marrow cells. Resultsshowed that in the selection medium, a large number of the bonemarrow cells exfoliated, only part of the remaining cells presentedcolonal growth during the first 3 d. When enriched with HGF ond 4, rapid proliferation and differentiation emerged, and H-CFUwith various size appeared in 2 wk. The morphology andphenotypic markers manifested that the cells of H-CFU weresimilar to embryonic hepatoblasts. They expressed markers ofembryonic hepatocytes (AFP, albumin and CK18), biliary cells(CK19), hepatocyte functional proteins (TTR and CYP2b1), andhepatocyte nuclear factors (HNF-1α and HNF-3β). HNF-1α is atranscription factor required for subsequent hepatocytedifferentiation, and transcription factor HNF-3β was known tobe important in endoderm specification. These results provedthat H-CFU were colonies of liver stem cells. In the culture system containing cholestatic serum, theconcentration of “pathological microenvironment” needs tobe considered. We found that 100 mL/L cholestatic serum wasfatal to all of the bone marrow cells, 70 mL/L cholestatic serumprevented the colonies from growth and proliferation, 20 mL/Lcholestatic serum could not inhibit the growth of other cells,while only 50 mL/L cholestatic serum acquired pure H-CFU.The differences can be explained by the toxic contents of cholestaticserum, which are the metabolic products cumulated under thecircumstances of common bile duct obstruction and hepaticinsufficiency, including bilirubin, bile acid, endotoxin, and ammonia,etc. When cholestatic serum was confined to the optimalconcentration, BDLSC, possessing functions of bilirubinconjugation and detoxification[30], could metabolize these toxic
400
300
200
100
0
Ure
a (
µg/1
06 c
ells
)
1 2 3 4Time (d)
A
B
Cai YF et al. Selection of bone marrow-derived liver stem cells 3311
400300200100
M 1 2 3 4 M 5 6 7 8
bp
products and survive, and selectively proliferate respondingto the signal of liver injury. On the other hand, non-BDLSCcould not adapt to the environment and resulted in apoptosis.To confirm that if the H-CFU had functional characteristics ofhepatocytes, we tested the glycogen and urea synthesis functionsof the cells and proved that the selected cells possessed hepatocyte-like functions. Therefore, the “pathological microenvironment”selecting medium based on cholestatic serum can select BDLSCin two ways, providing selective proliferation signals for BDLSCand eliminating non-BDLSC, so as to purify BDLSC. We demonstrated that a “pathological microenvironment”selecting medium could select, proliferate and differentiateBDLSC from whole bone marrow cells in vitro. This methodcan not only provide a new and effective way for the isolationand purification of extrahepatic liver stem cells, but also supplya clue to obtain a readily available alternate source of cells forclinical hepatocyte therapy.
ACKNOWLEDGEMENTSThe authors thank Xiao-Dong Zhou, Jing Wei, Yu-Ru Fu, andYu-Shen Lin, Clinical Research Center of Medicine, the 2ndAffiliated Hospital and the Center of Electron Microscopy, SunYat-Sen University for their technical support.
REFERENCES1 Krause DS. Plasticity of marrow-derived stem cells. Gene Ther
2002; 9: 754-7582 Ferrari G, Cusella-De Angelis G, Coletta M, Paolucci E,
Stornaiuolo A, Cossu G, Mavilio F. Muscle regeneration bybone marrow-derived myogenic progenitors. Science 1998; 279:1528-1530
3 Gussoni E, Soneoka Y, Strickland CD, Buzney EA, Khan MK,Flint AF, Kunkel LM, Mulligan RC. Dystrophin expression inthe mdx mouse restored by stem cell transplantation. Nature1999; 401: 390-394
4 Brazelton TR, Rossi FM, Keshet GI, Blau HM. From marrow tobrain: expression of neuronal phenotypes in adult mice. Science2000; 290: 1775-1779
5 Mezey E, Chandross KJ, Harta G, Maki RA, McKercher SR.Turning blood into brain: cells bearing neuronal antigens gener-ated in vivo from bone marrow. Science 2000; 290: 1779-1782
6 Orlic D, Kajstura J, Chimenti S, Limana F, Jakoniuk I, QuainiF, Nadal-Ginard B, Bodine DM, Leri A, Anversa P. Mobi-lized bone marrow cells repair the infarcted heart, improv-ing function and survival. Proc Natl Acad Sci U S A 2001; 98:10344-10349
7 Orlic D, Kajstura J, Chimenti S, Jakoniuk I, Anderson SM, LiB, Pickel J, McKay R, Nadal-Ginard B, Bodine DM, Leri A,Anversa P. Bone marrow cells regenerate infarcted myocardium.Nature 2001; 410: 701-705
8 Krause DS, Theise ND, Collector MI, Henegariu O, Hwang S,Gardner R, Neutzel S, Sharkis SJ. Multi-organ, multi-lineageengraftment by a single bone marrow-derived stem cell. Cell2001; 105: 369-377
9 Petersen BE, Bowen WC, Patrene KD, Mars WM, Sullivan AK,Murase N, Boggs SS, Greenberger JS, Goff JP. Bone marrow as apotential source of hepatic oval cells. Science 1999; 284: 1168-1170
10 Theise ND, Badve S, Saxena R, Henegariu O, Sell S, CrawfordJM, Krause DS. Derivation of hepatocytes from bone marrowcells in mice after radiation-induced myeloablation. Hepatology2000; 31: 235-240
11 Alison MR, Poulsom R, Jeffery R, Dhillon AP, Quaglia A,
Jacob J, Novelli M, Prentice G, Williamson J, Wright NA. Hepa-tocytes from non-hepatic adult stem cells. Nature 2000; 406: 257
12 Theise ND, Nimmakayalu M, Gardner R, Illei PB, Morgan G,Teperman L, Henegariu O, Krause DS. Liver from bone mar-row in humans. Hepatology 2000; 32: 11-16
13 Zhang Y, Bai XF, Huang CX. Hepatic stem cells: Existence andorigin. World J Gastroenterol 2003; 9: 201-204
14 Spangrude GJ, Heimfeld S, Weissman IL. Purification andcharacterization of mouse hematopoietic stem cells. Science 1988;241: 58-62
15 Baum CM, Weissman IL, Tsukamoto AS, Buckle AM, Peault B.Isolation of a candidate human hematopoietic stem-cellpopulation. Proc Natl Acad Sci U S A 1992; 89: 2804-2808
16 Pereira RF, Halford KW, O’Hara MD, Leeper DB, Sokolov BP,Pollard MD, Bagasra O, Prockop DJ. Cultured adherent cellsfrom marrow can serve as long-lasting precursor cells for bone,cartilage, and lung in irradiated mice. Proc Natl Acad Sci U S A1995; 92: 4857-4861
17 Prockop DJ. Marrow stromal cells as stem cells for nonhematopoietictissues. Science 1997; 276: 71-74
18 Schwartz RE, Reyes M, Koodie L, Jiang Y, Blackstad M, Lund T,Lenvik T, Johnson S, Hu WS, Verfaillie CM. Multipotent adultprogenitor cells from bone marrow differentiate into functionalhepatocyte-like cells. J Clin Invest 2002; 109: 1291-1302
19 Wong LS, Bateman WJ, Morris AG, Fraser IA. Detection ofcirculating tumour cells with the magnetic activated cell sorter.Br J Surg 1995; 82: 1333-1337
20 Lagasse E, Connors H, Al-Dhalimy M, Reitsma M, Dohse M,Osborne L, Wang X, Finegold M, Weissman IL, Grompe M.Purified hematopoietic stem cells can differentiate into hepa-tocytes in vivo. Nat Med 2000; 6: 1229-1234
21 Petersen BE, Goff JP, Greenberger JS, Michalopoulos GK.Hepatic oval cells express the hematopoietic stem cell markerThy-1 in the rat. Hepatology 1998; 27: 433-445
22 Omori M, Omori N, Evarts RP, Teramoto T, Thorgeirsson SS.Coexpression of flt-3 ligand/flt-3 and SCF/c-kit signal trans-duction system in bile-duct-ligated SI and W mice. Am J Pathol1997; 150: 1179-1187
23 Hoffman AL, Rosen HR, Ljubimova JU, Sher L, Podesta LG,Demetriou AA, Makowka L. Hepatic regeneration: current con-cepts and clinical implication. Semin Liver Dis 1994; 14: 190-210
24 Sell S. Heterogeneity and plasticity of hepatocyte lineage cells.Hepatology 2001; 33: 738-750
25 Olynyk JK, Yeoh GC, Ramm GA, Clarke SL, Hall PM, BrittonRS, Bacon BR, Tracy TF. Gadolinium chloride suppresses he-patic oval cell proliferation in rats with biliary obstruction. AmJ Pathol 1998; 152: 347-352
26 Fausto N. Liver regeneration: from laboratory to clinic. LiverTranspl 2001; 7: 835-844
27 Avital I, Inderbitzin D, Aoki T, Tyan DB, Cohen AH, FerraressoC, Rozga J, Arnaout WS, Demetriou AA. Isolation, characterization,and transplantation of bone marrow-derived hepatocyte stemcells. Biochem Biophys Res Commun 2001; 288: 156-164
28 Avital I, Feraresso C, Aoki T, Hui T, Rozga J, Demetriou A,Muraca M. Bone marrow-derived liver stem cell and maturehepatocyte engraftment in livers undergoing rejection. Surgery2002; 132: 384-390
29 Danet GH, Luongo JL, Butler G, Lu MM, Tenner AJ, SimonMC, Bonnet DA. C1qRp defines a new human stem cell popu-lation with hematopoietic and hepatic potential. Proc Natl AcadSci U S A 2002; 99: 10441-10445
30 Vilei MT, Granato A, Ferraresso C, Neri D, Carraro P, GerundaG, Muraca M. Comparison of pig, human and rat hepatocytesas a source of liver specific metabolic functions in culture sys-tems-implications for use in bioartificial liver devices. Int JArtif Organs 2001; 24: 392-396
Edited by Wang XL and Zhang JZ Proofread by Xu FM
3312 ISSN 1007-9327 CN 14-1219/ R World J Gastroenterol November 15, 2004 Volume 10 Number 22

PO Box 2345, Beijing 100023, China World J Gastroenterol 2004;10(22):3313-3317Fax: +86-10-85381893 World Journal of GastroenterologyE-mail: [email protected] www.wjgnet.com Copyright © 2004 by The WJG Press ISSN 1007-9327
• CLINICAL RESEARCH •
Upper gastrointestinal endoscopy: Are preparatory interventions
or conscious sedation effective? A randomized trial
Lucio Trevisani, Sergio Sartori, Piergiorgio Gaudenzi, Giuseppe Gilli, Giancarlo Matarese, Sergio Gullini, Vincenzo Abbasciano
Lucio Trevisani, Sergio Sartori, Piergiorgio Gaudenzi, GiancarloMatarese, Sergio Gullini, Vincenzo Abbasciano, Digestive EndoscopyService, Department of Internal Medicine, S. Anna Hospital, Ferrara,ItalyGiuseppe Gilli, Health Physics Department, S. Anna Hospital,Ferrara, ItalyCorrespondence to: Dr. Lucio Trevisani, Centro di Endoscopia Digestiva,Azienda Ospedaliera “Arcispedale S. Anna”, C.so Giovecca 203,44100 Ferrara, Italy. [email protected]: +1139-532-237558 Fax: +1139-532-236932Received: 2004-02-20 Accepted: 2004-04-09
Abstract
AIM: The fears and concerns are associated with gastroscopy(EGD) decrease patient compliance. Conscious sedation(CS) and non-pharmacological interventions have beenproposed to reduce anxiety and allow better execution ofEGD. The aim of this study was to assess whether CS,supplementary information with a videotape, or presence ofa relative during the examination could improve the toleranceto EGD.
METHODS: Two hundred and twenty-six outpatients (pts),scheduled for a first-time non-emergency EGD were randomlyassigned to 4 groups: Co-group (62 pts): throat anaesthesiaonly; Mi-group (52 pts): CS with i.v. midazolam; Re-group(58 pts): presence of a relative throughout the procedure;Vi-group (54 pts): additional information with a videotape.Anxiety was measured using the “Spielberger State andTrait Anxiety Scales”. The patients assessed the overalldiscomfort during the procedure on an 100-mm visual analoguescale, and their tolerance to EGD answering a questionnaire.The endoscopist evaluated the technical difficulty of theexamination and the tolerance of the patients on an 100-mmvisual analogue scale and answering a questionnaire.
RESULTS: Pre-endoscopy anxiety levels were higher in theMi-group than in the other groups (P<0.001). On the basisof the patients’ evaluation, EGD was well tolerated by 80.7%of patients in Mi-group, 43.5% in Co-group, 58.6% in Re-group, and 50% in Vi-group (P<0.01). The discomfort causedby EGD, evaluated by either the endoscopist or the patients,was lower in Mi-group than in the other groups. The discomfortwas correlated with “age” (P<0.001) and “groups of patients”(P<0.05) in the patients’ evaluation, and with “gender”(females tolerated better than males, P<0.001) and “groupsof patients” (P<0.05) in the endoscopist’s evaluation.
CONCLUSION: Conscious sedation can improve the toleranceto EGD. Male gender and young age are predictive factors ofbad tolerance to the procedure.
Trevisani L, Sartori S, Gaudenzi P, Gilli G, Matarese G, Gullini S,Abbasciano V. Upper gastrointestinal endoscopy: Are preparatoryinterventions or conscious sedation effective? A randomizedtrial. World J Gastroenterol 2004; 10(22): 3313-3317
http://www.wjgnet.com/1007-9327/10/3313.asp
INTRODUCTIONEsophagogastroduodenoscopy (EGD) is a safe and quickprocedure, and can be carried out without sedation[1]. However,it can evoke anxiety, feelings of vulnerability, embarrassmentand discomfort[2], and the fears and concerns associated withendoscopic procedure decrease patient compliance[2-4]. Indeed,anxiety, discomfort, and pain are interrelated, and each mayincrease the others[5], making EGD execution more difficult.Several methods can be used to reduce patient pre-proceduralworries, such as psychological interventions using relaxationand coping techniques[6,7], hypnosis[8], relaxation music[9],acupuncture[10], educational materials including videotapes[11],and presence of a family member during EGD[12]. However,conscious sedation with benzodiazepines is the method mostwidely employed[5]. Although usually safe, such medicationsare not free of adverse effects[13-15], and the likelihood of sedative-related complications increases in the presence of high anxietylevels, requiring higher doses of drugs[2]. It follows that therole of conscious sedation is not well defined, and its use variesfrom country to country: up to 98% in USA, less frequently inEuropean countries, and quite rarely in Asia and South America[16].The use of conscious sedation is also declining in the UnitedKingdom[17], and many patients who receive detailed informationabout the advantages and risks of sedation choose to undergoEGD with pharyngeal anesthesia alone[18,19]. In our endoscopyservice, a standardized information sheet about EGD is givento all patients, and the examination is routinely performed withpharyngeal anesthesia alone. This randomized prospective study was to evaluate ifconscious sedation, additional information with a videotape,or the presence of a family member during the procedure couldimprove the tolerance to EGD and make the execution of EGDeasier. In addition, particular emphasis was put on psychologicand procedure-related factors having a potential impact on thepatient perception of tolerance.
MATERIALS AND METHODSStudy populationFor six consecutive months, the first two outpatients dailyreferred for diagnostic EGD, fulfilling the eligibility criteria, wereasked to enter the study. Inclusion criteria were age between18 and 65 years, no prior experience of endoscopic examinations,and capability (evaluated by the endoscopist) of fully understandingand filling up the questionnaires of the study. Exclusion criteriawere prior gastrectomy, psychiatric diseases or long-termpsychiatric drug addiction, presence of neoplastic or other seriousconcomitant diseases, history of intolerance to benzodiazepines.On the whole, two hundred and eighty patients were asked toenter the study, and 228 of them were accepted. The patientswere randomly assigned to four groups by a computer procedure.In the control group (Co-group), EGD was performed withtopical pharyngeal anesthesia alone (100 g/L lidocaine spray).In the other three groups the following methods were used inaddition to pharyngeal anesthesia: conscious sedation with i.v.midazolam 35 µg/kg (Mi-group); presence of a relative in theendoscopy room throughout the procedure (Re-group); additionalinformation about the procedure using a videotape lasting for

about 10 min (Vi-group). The study protocol was approved by the ethical committeeof our hospital, and all patients gave their written consent toparticipate in the study.
Patients’ assessmentsAnxiety Since the anxiety experienced by patients undergoingEGD was hypothesized to be a factor related to potentialdiscomfort, anxiety was measured by the Spielberger State-Trait Anxiety Inventory (STAI)[20] in the validated Italianlanguage version[21]. Patients were asked to complete STAIbefore EGD. STAI is a 40-item questionnaire designed to measurestate anxiety and trait anxiety. State anxiety is a temporary andsituational anxiety, and trait anxiety is the tendency to awakenstate anxiety under stress. Both kinds of anxiety were scored inthe range of 20 to 80 points, a higher score indicated a greateranxiety. Before EGD, the patients had also to specify what theydreaded more about endoscopic examination, choosing amongfive items: fear of pain, fear of stifling, fear of complications,fear of endoscopic findings, and other.
TolerancePatients’ assessment of tolerance to EGD was carried out atleast 2 h after the end of the procedure. This interval was chosento minimize the risk of persisting anterograde amnesia, whichcould potentially influence patient judgment. Patients assessedtheir tolerance answering the question: “how did you tolerateEGD?” (“well”, “rather badly”, “badly”), and rated the overalldiscomfort during EGD on an 100-mm visual analogue scale (0:no discomfort; 100: unbearable).
Endoscopist’s assessmentAll EGDs were carried out by the same endoscopist, using videoendoscopes with a diameter of 9.8 mm (Fujinon video endoscopicsystem-Fujinon, Tokyo, Japan). Immediately after endoscopy,the operator recorded if EGD was completed, or it had to beinterrupted, or it could be completed only after administrationof sedatives (for Mi-group, after further sedatives in additionto midazolam previously administered). Moreover, he evaluatedthe ease of introduction of the instrument (“easy”: no failedattempt of introduction; or “difficult”: one or more failed attemptsof introduction). Finally, he rated the discomfort caused topatients during EGD on an 100-mm visual analogue scale (0: nodiscomfort; 100: unbearable), and assessed the tolerance of the
patients grading it into three steps: “good”, “poor”, “very bad”.
Parameters monitoredBlood oxygen saturation (SaO2) and heart rate were continuouslymonitored during EGD. Desaturation was defined as a decreasein oxygen saturation below 90% for over 30 s. The occurrenceof complications was recorded after each procedure. The durationof endoscopic examination was timed in all groups of patients.In Mi-group, the degree of sedation was evaluated using theRamsay’s scale[22].
Statistical analysisCharacteristics of patients in the four groups were analyzedusing one-way ANOVA and chi-square test. Endoscopic findings,tachycardia, motives of fear, answers of patients to the questionsabout their tolerance to EGD, ease of introduction of the instrument,and endoscopist’s evaluation of tolerance of patients to EGD werecompared in the four groups by using chi-square-test. State and trait pre-endoscopic anxiety levels, and thediscomfort rated by the patients and endoscopist on the 100-mmvisual analogue scale were analyzed using one-way and two-way ANOVA. Two-way ANOVA was also used to evaluate theinfluence of sex, age, and anxiety levels on the discomfort causedby EGD. Linear-regression analysis was used to assess therelationship between the state and trait anxiety scores, as wellas the correlation between patients’ and endoscopist’s evaluationof the discomfort caused by EGD. A general linear model (GLM)procedure was used to analyze the influence of sex, age, groupsof patients, state anxiety, duration of EGD, and endoscopicfindings on the degree of discomfort caused by EGD, assessedby either the endoscopist or the patients. Results were considered statistically significant if P valueswere <0.05 (two-tailed test).
RESULTSTwo patients (1 in Co-group and 1 in Mi-group) were excluded fromthe study, as EGD was not completed. Two hundred and twenty-sixpatients (90 males and 136 females, mean age 38±10.62 years,range 19-63 years) could be evaluated. The four groups did notdiffer in age, endoscopic findings, and duration of the examination.The male: female ratio was lower in Mi-group than in the othergroups (P<0.05) (Table 1). Fourteen point five percent of patients in Co-group (6/62),21.1% in Mi-group (11/52), 20.6% in Re-group (12/58), 16.6% in
Table 1 Demographic and clinical data of the patients
Co-group Mi-group Re-group Vi-group
Patients (n) 62 52 58 54
Gender (m/f) 25/37 9/43a 28/30 28/26
Age (yr; mean±SD) 37.85±10.44 40.13±10.55 35.20±10.57 39.24±10.57
State anxiety (mean±SD) 46.66±10.73 54.19±10.89b 46.03±11.42 39.62±9.05
Trait anxiety (mean±SD) 38.30±7.16 44.26±9.43b 37.22±8.21 38.05±9.63
Duration of EGD (seconds; mean ± SD) 145.88±45.18 157.40±48.09 140.60±35.56 142.96±39.11
Endoscopic findings (No cases):
Normal findings 30 25 26 22
Esophagitis 1 3 6 10
Hiatus Ernia 3 1 2 3
Gastritis or Duodenitis 24 19 19 14
Gastric or duodenal ulcer 2 2 3 3
Cancer - - - 1
Other findings 2 2 2 1
aP<0.05, bP<0.001 vs the other three groups.
3314 ISSN 1007-9327 CN 14-1219/ R World J Gastroenterol November 15, 2004 Volume 10 Number 22

Vi-group (9/54) had a heart rate higher than 100 beats/min beforestarting EGD. During EGD, the heart rate exceeded 130 beats/minfor at least 30 seconds in 5, 2, 3, and 2 patients in the four groups,respectively. No complication occurred, and no case of oxygendesaturation was observed. According to Ramsay’s scale, inMi-group grade 2 sedation was reached in 50 patients, and grade3 in 2 patients. State anxiety scores before EGD were significantly higherin Mi-group than in the other groups (P<0.001), as well as traitanxiety scores (P<0.001) (Table 1). State and trait anxiety scoreswere strongly correlated (P<0.001). In all groups the most frequent cause of fear before EGDwas the fear of stifling (70 cases on the whole). The ease ofintroduction of gastroscope did not differ among the fourgroups, and the introduction resulted in difficulty just in onepatient of Co-group and in 3 of Vi-group. On the basis of patients’ assessment, the tolerance to EGDwas more frequently good when sedation was given: 80.7% ofpatients in Mi-group tolerated well gastroscopy, vs 43.5% inCo-group, 58.6% in Re-group, and 50% in Vi-group (P<0.01)(Table 2). Conversely, no significant difference among the fourgroups was observed in the evaluation of the endoscopist, whonevertheless found that the discomfort caused by EGD waslower in Mi-group than in Co-group (P<0.05) (Table 3). The degreeof discomfort was lower in patients of Mi-group than in thoseof Co-group, but the difference was just close to threshold ofsignificance, but did not reach it (P = 0.059) (Table 3). The othercomparisons among the groups did not show any difference inthe degree of discomfort caused by EGD. The evaluations ofthe patients and those of the endoscopist were stronglycorrelated (P<0.001, m = 0.45), even though the endoscopistunderestimated the degree of discomfort (Figure 1). Two-way ANOVA performed on the degree of discomfortassessed by the patients, evaluated for factors “gender” and
“groups of patients” corrected for age, trait anxiety and stateanxiety, showed an inverse influence of the age (i.e. bettertolerance for older individuals, P<0.001) and the factor “groupsof patients” (P<0.05). Conversely, the degree of discomfortassessed by the endoscopist was significantly influencedby the factors “gender” and “groups of patients” (P<0.001 andP<0.05, respectively). The factors “gender” and “groups ofpatients” showed a true and constant interaction (interactionfactor P<0.01), reflecting behaviors significantly differentbetween males and females within the four groups, in particularin Co-group (Figures 2A, B). Also the GLM procedure showed that age exerted the greatestinfluence on the discomfort caused by EGD in opinion of thepatients (inverse correlation, P<0.001), whereas in opinion ofthe endoscopist the discomfort was mainly influenced by thegender (females tolerated EGD better than males, P<0.001)(Table 4).
Figure 1 Linear regression of discomfort assessed by patientsand endoscopist.
Table 2 Tolerance to EGD and patients’ and endoscopist’s assessment
Patients’ assesmentb Endoscopist’s assessment
Co-G Mi-G Re-G Vi-G Co-G Mi-G Re-G Vi-G(n) (n) (n) (n) (n) (n) (n) (n)
Good 27 42b 34 27 45 44b 54 42
Poor 31 10b 23 23 12 7b 4 7
Very bad 4 0b 1 4 5 1b 0 5
Mi-G: bP<0.01 vs the other three groups.
Table 3 Discomfort caused to patients during EGD and patients’ and endoscopist’s assessment (visual analogue scale)
Co-G Mi-G Re-G Vi-G (mean±SD) (mean±SD) (mean±SD) (mean±SD)
Patient evaluation 33.01±22.12 21.98±21.60 29.17±22.95 26.12±21.94
Endoscopist evaluation 23.51±22.99 14.17±18.07a 16.43±14.42 20.81±24.04
aP<0.05 vs Co-G.
Table 4 Influence of some parameters on degree of discomfort caused by EGD (GLM procedure)
Patient’s assessment Endoscopist’s assessment
Parameter Coefficient SE P Coefficient SE P
Gender -0.251 3.153 0.937 -10.094 2.901 0.001
Age (yr) -0.621 0.140 0.000 -0.159 0.129 0.219
Groups of patients -1.138 1.325 0.391 -1.012 1.219 0.407
State anxiety 0.104 0.136 0.445 0.237 0.126 0.060
Time for EGD 0.046 0.039 0.237 -0.057 0.036 0.112
Endoscopic findings -0.813 1.774 0.647 3.158 1.632 0.054
Trevisani L et al. Are preparatory interventions or conscious sedation effective for gastroscopy? 3315
100
80
60
40
20
0
0 20 40 60 80 100
Patient
evalu
ation
Physician evaluation
P<0.001
m = 0.45

Figure 2 Discomfort assessed by patients and andoscopist,and mean values for factors “groups of patients” and “gen-der” with 95% c.l. Thick lines: m = males; f = females. Co-G:control group Mi-G: midazolam group Re-G: relatives groupVi-G: video group A: Discomfort assessed by patients B: Dis-comfort assessed by endoscopist.
DISCUSSIONAlthough conscious sedation is the method most widely usedto reduce anxiety in patients undergoing EGD, its actual role isstill an unresolved problem. Very large differences in sedationpractice existed among different countries, and sometimes amongdifferent units within the same country[5]. To our knowledge, thisis the first randomized trial comparing the efficacy in improvingthe tolerance to EGD of conscious sedation, the presence of arelative in the endoscopy room throughout the procedure, andadditional information by using a videotape. Abuksis et al.demonstrated that previous endoscopy experience could reduceanxiety level and influence patients’ compliance[23], and otherauthors identified endoscope size as a significant variable indetermining tolerance to the procedure[24,25]. For these reasons,in our study all patients enrolled had no prior endoscopyexperience, and all EGDs were carried out using gastroscopeswith the same diameter. Our results suggested that low-dose conscious sedationwith midazolam could improve the tolerance to EGD, accordingto a previous trial reporting a lower discomfort in sedated patientsthan in controls[26]. Conversely, the presence of a relative attendingthe procedure and the use of informative videotape did notseem to give the patients significant advantages over the controls.However, better tolerance and lower discomfort were found inRe-group and Vi-group than in Co-group by either the patientsor the endoscopist. Although these findings did not reach thesignificance level, in our opinion they suggested that the methodused in controls (pharyngeal anesthesia only) was the worstapproach to perform EGD. Indeed, the multivariate analysisshowed constant differences among the groups of patients inconcern of the discomfort caused by endoscopy, highlightingthe usefulness of preparatory interventions in improving thetolerance to EGD. The presence of relatives has been proved helpful in severalmedical fields, such as to children during hospitalization and towomen during childbirth[27], but it is not a standard procedurein digestive endoscopy. At present, just one randomized studywas published on this topic, and the results suggested that the
presence of a family member throughout endoscopy couldrepresent a promising approach[12]. Conversely, the usefulnessof additional information to reduce the anxiety and to improvethe compliance of patients has been widely investigated, butwith conflicting results. Detailed information before endoscopyhas been reported to reduce anxiety levels[11,28], but other studiesfailed in demonstrating any usefulness of this approach[29],and some authors found that the over-information about endoscopycould even increase anxiety levels[30,31]. The evaluation of the discomfort expressed by the patientsand the endoscopist showed a strong correlation in our study(Figure 1). However, the endoscopist rated the patient degreeof discomfort as lower than the patients themselves. Accordingto the observation of Watson et al. that both endoscopistsand nurses underestimated the discomfort felt by the patients[32]. Besides anxiety, in our experience age and gender alsoinfluenced significantly the tolerance to endoscopy. Indeed,high levels of discomfort during EGD have been recentlyreported to be associated with younger age and high levels ofpre-endoscopic anxiety[24]. Older patients were likely to tolerateendoscopy better than their younger counterparts as they hada decreased pharyngeal sensitivity[33,34]. Unlike several studiesreporting better tolerance in men[26,35], we found that femalegender was associated with better tolerance. However, thisgender-specific finding has been disputed by other authors[3,
24,33]. Despite the effectiveness of conscious sedation shown inour study, we think it should be avoided whenever possible inclinical practice. The extensive use of sedation would requireseveral extra-charges, including the cost of drugs, prolongationof the procedure time, need of monitoring cardiopulmonaryfunctions, need of recovery room for post-procedure observation,and the impossibility for patients to return to work immediatelyafter endoscopic examination[36]. Furthermore, sedative drugsare not free of adverse effects. In our series, no complications andoxygen desaturation were observed, and low-dose midazolaminduced just rarely significant alterations in cardiorespiratoryparameters[26]. Nevertheless, conscious sedation could causehypoxemia, which may induce cardiopulmonary complications,and most complications associated with endoscopy were attributableto the medications given for the procedure rather than the procedureitself[13-15]. For these reasons, we think that further studiesincorporating cut-off points are necessary to identify the patientswho are likely to tolerate diagnostic gastroscopy without sedation.Some other preparatory interventions might also be effectiveto reduce endoscopy-related anxiety[37]. The interventiontechniques we used might be incorporated into our endoscopicpractice, as they are simple, quick, easy to reproduce, and theirextensive use doesa not require additional extra-charges, andexpose the patients to the risk of complications.
REFERENCES1 Al-Atrakchi HA. Upper gastrointestinal endoscopy without
sedation: a prospective study of 2000 examinations. GastrointestEndosc 1989; 35: 79-81
2 Brandt LJ. Patients’ attitudes and apprehensions aboutendoscopy: how to calm trobled waters. Am J Gastroenterol2001; 96: 280-284
3 Campo R, Brullet E, Montserrat A, Calvet X, Moix J, Rue M,Roque Donoso L, Bordas JM. Identification of factors that in-fluence tolerance of upper gastrointestinal endoscopy. Eur JGastroenterol Hepatol 1999; 11: 201-204
4 Dominitz JA, Provenzale D. Patient preferences and quality oflife associated with colorectal cancer screening. Am J Gastroenterol1997; 92: 2171-2178
5 Bell GD. Premedication, preparation, and surveillance. Endo-scopy 2002; 34: 2-12
6 Gattuso SM, Litt MD, Fitzgerald TE. Coping with gastrointes-tinal endoscopy: self-efficacy enhancement and coping style. J
3316 ISSN 1007-9327 CN 14-1219/ R World J Gastroenterol November 15, 2004 Volume 10 Number 22
Co-G Mi-G Re-G Vi-G Sex
50454035302520151050
504540353025201510 5 0
m
f
m
f
mf
m f m
f
Co-G Mi-G Re-G Vi-G Sex
50454035302520151050
-5-10
m
f
50454035302520151050
-5-10
mf m
f
m f m f
A
B

Consult Clin Psychol 1992; 60: 133-1397 Woloshynowych M, Oakley DA, Saunders BP, Williams CB.
Psychological aspects of gastrointestinal endoscopy: a review.Endoscopy 1996; 28: 763-767
8 Conlong P, Rees W. The use of hypnosis in gastroscopy: acomparison with intravenous sedation. Postgrad Med J 1999;75: 223-225
9 Bampton P, Draper B. Effect of relaxation music on patienttolerance of gastrointestinal endoscopic procedures. J ClinGastroenterol 1997; 25: 343-345
10 Li CK, Nauck M, Loser C, Folsch UR, Creutzfeldt W. Acu-puncture to alleviate pain during colonoscopy. Dtsch MedWochenschr 1991; 116: 367-370
11 Luck A, Pearson S, Maddem G, Hewett P. Effects of videoinformation on precolonoscopy anxiety and knowledge: arandomised trial. Lancet 1999; 354: 2032-2035
12 Shapira M, Tamir A. Presence of family member during up-per endoscopy: what do patients and escorts think? J ClinGastroenterol 1996; 22: 272-274
13 Herman LL, Kurtz RC, McKee KJ, Sun M, Thaler HT, WinawerSJ. Risk factors associated with vasovagal reactions duringcolonoscopy. Gastrointest Endosc 1993; 39: 388-391
14 Iber FL, Sutberry M, Gupta R, Kruss D. Evaluation of compli-cations during and after conscious sedation for endoscopyusing pulse oximetry. Gastrointest Endosc 1993; 39: 620-625
15 Mokhashi MS, Hawes RH. Struggling toward easierendoscopy. Gastrointest Endosc 1998; 48: 432-440
16 Lazzaroni M, Bianchi Porro G. Preparation, premedicationand surveillance. Endoscopy 1998; 30: 53-60
17 Mulcahy HE, Hennessy E, Connor P, Rhodes B, Patchett SE,Farthing MJ, Fairclough PD. Changing patterns of sedation usefor routine out-patient diagnostic gastroscopy between 1989and 1998. Aliment Pharmacol Ther 2001; 15: 217-220
18 Hedenbro JL, Lindblom A. Patient attitudes to sedation fordiagnostic upper endoscopy. Scand J Gastroenterol 1991; 26:1115-1120
19 Pereira S, Hussaini SH, Hanson PJ, Wilkinson ML, Sladen GE.Endoscopy: throat spray or sedation? J R Coll Physicians Lond1994; 28: 411-414
20 Spielberger CD, Gorsuch RL, Lushene RE. Manual for theState-Trait Anxiety Inventory. Palo-Alto: Consulting Psycholo-gists Press 1970
21 Spielberger CD, Gorsuch RL, Lushene RE. Questionario diautovalutazione per l’ansia di stato e di tratto. Manuale diistruzioni. Traduzione di Lazzari R, Pancheri P. Firenze:Organizzazioni Speciali 1989
22 Ramsay MA, Savege TM, Simpson BR, Goodwin R. Controlledsedation with alphaxalone-alphadolone. Br Med J 1974; 2: 656-659
23 Abuksis G, Mor M, Segal N, Shemesh I, Morad I, Plaut S,Weiss E, Sulkes J, Fraser G, Niv Y. A patient education pro-gram is cost-effective for preventing failure of endoscopic pro-cedures in a gastroenterology department. Am J Gastroenterol2001; 96: 1786-1790
24 Mulcahy HE, Kelly P, Banks MR, Connor P, Patchet SE, Far-thing MJ, Fairclough PD, Kumar PJ. Factors associated withtolerance to, and discomfort with, unsedated diagnosticgastroscopy. Scand J Gastroenterol 2001; 36: 1352-1357
25 Mulcahy HE, Riches A, Kiely M, Farthing MJ, Fairclough PD.A Prospective controlled trial of an ultrathin versus a conven-tional endoscope in unsedated upper gastrointestinalendoscopy. Endoscopy 2001; 33: 311-316
26 Froehlich F, Schwizer W, Thorens J, Kohler M, Gonvers JJ, FriedM. Conscious sedation for gastroscopy: patient tolerance andcardiorespiratory parameters. Gastroenterology 1995; 108: 697-704
27 Gjerdingen DK, Froberg DG, Fontaine P. The effects of socialsupport of women’s health during pregnancy, labor and delivery,and the postpartum period. Fam Med 1991; 23: 370-375
28 Lembo T, Fitzgerald L, Matin K, Woo K, Mayer EA, NalidoffBD. Audio and visual stimulation reduces patient discomfortduring screening flexible sigmoidoscopy. Am J Gastroenterol1998; 93: 1113-1116
29 Levy N, Landmann L, Stermer E, Erdreich M, Beny A, MeiselsR. Does a detailed explanation prior to gastroscopy reduce thepatient’s anxiety? Endoscopy 1989; 21: 263-265
30 Dawes PJ, Davison P. Informed consent: what do patientswant to know? J R Soc Med 1994; 87: 149-152
31 Tobias JS, Souhami RL. Fully informed consent can be need-lessly cruel. B M J 1993; 307: 1199-1201
32 Watson JP, Goss C, Phelps G. Audit of sedated versusunsedated gastroscopy: do patients notice a difference? J QualClin Pract 2001; 21: 26-29
33 Abraham N, Barkun A, Larocque M, Fallone C, Mayrand S,Baffis V, Cohen A, Daly D, Daoud H, Joseph L. Predictingwhich patients can undergo upper endoscopy comfortably with-out consious sedation. Gastrointest Endosc 2002; 56: 180-189
34 Davies AE, Kidd D, Stone SP, MacMahon J. Pharyngeal sensa-tion and gag reflex in healthy subjects. Lancet 1995; 345: 487-488
35 Tan CC, Freeman JG. Throat spray for upper gastrointestinalendoscopy is quite acceptable to patients. Endoscopy 1996; 28:277-282
36 Schmitt CM. Preparation for upper gastrointestinalendoscopy: opportunity or inconvenience? Gastrointest Endosc1998; 48: 430-432
37 Hackett ML, Lane MR, McCarthy DC. Upper gastrointestinalendoscopy: are preparatory interventions effective? GastrointestEndosc 1998; 48: 341-347
Edited by Wang XL Proofread by Xu FM
Trevisani L et al. Are preparatory interventions or conscious sedation effective for gastroscopy? 3317

PO Box 2345, Beijing 100023, China World J Gastroenterol 2004;10(22):3318-3321Fax: +86-10-85381893 World Journal of GastroenterologyE-mail: [email protected] www.wjgnet.com Copyright © 2004 by The WJG Press ISSN 1007-9327
• CLINICAL RESEARCH •
Opisthorchiasis-associated biliary stones: Light and scanning
electron microscopic study
Banchob Sripa, Pipatphong Kanla, Poonsiri Sinawat, Melissa R. Haswell-Elkins
Banchob Sripa, Department of Pathology, Faculty of Medicine,Khon Kaen University, Khon Kaen 40002, ThailandPipatphong Kanla, Department of Anatomy, Faculty of Medicine,Khon Kaen University, Khon Kaen 40002, ThailandPoonsiri Sinawat, Division of Anatomical Pathology, Khon KaenRegional Hospital, Khon Kaen, Thailand and Department ofPathology, Faculty of Medicine, Khon Kaen University, Khon Kaen40002, ThailandMelissa R. Haswell-Elkins, Australia Centre for International andTropical Health and Nutrition, University of Queensland, Brisbane,AustraliaSupported by in part by the Tropical Health Program and NHMRC,Commonwealth Government, AustraliaCorrespondence to: Dr. Banchob Sripa, Department of Pathology,Faculty of Medicine, Khon Kaen University, Khon Kaen, 40002,Thailand. [email protected]: +66-43-202024 Fax: +66-43-348375Received: 2004-04-07 Accepted: 2004-05-25
Abstract
AIM: Biliary stones are frequently encountered in areas endemicfor opisthorchiasis in Thailand. The present study was todescribe the prevalence and pathogenesis of these stones.
METHODS: Gallstones and/or common bile duct stonesand bile specimens from 113 consecutive cholecystectomieswere included. Bile samples, including sludge and/ormicrocalculi, were examined for Opisthorchis viverrini eggs,calcium and bilirubin. The stones were also processed forscanning electron microscopic (SEM) study.
RESULTS: Of the 113 cases, 82 had pigment stones, whileone had cholesterol stones. The other 30 cases had nostones. Most of the stone cases (76%, 63/83) had multiplestones, while the remainder had a single stone. Stoneswere more frequently observed in females. Bile examinationwas positive for O. viverrini eggs in 50% of the casesstudied. Aggregates of calcium bilirubinate precipitateswere observed in all cases with sludge. Deposition ofcalcium bilirubinate on the eggshell was visualized byspecial staining. A SEM study demonstrated the presenceof the parasite eggs in the stones. Numerous crystals,morphologically consistent with calcium derivatives andcholesterol precipitates, were seen.
CONCLUSION: Northeast Thailand has a high prevalence ofpigment stones, as observed at the cholecystectomy, andliver fluke infestation seems involved in the pathogenesisof stone formation.
Sripa B, Kanla P, Sinawat P, Haswell-Elkins MR. Opisthorchiasis-associated biliary stones: Light and scanning electron microscopicstudy. World J Gastroenterol 2004; 10(22): 3318-3321
http://www.wjgnet.com/1007-9327/10/3318.asp
INTRODUCTIONLiver fluke infestation caused by Opisthorchis viverrini remains
a major public health concern in Southeast Asia[1], particularlyin Thailand where an estimated 6 million people are infected[2].This infection is associated with a number of benign hepatobiliarydiseases, including cholangitis, obstructive jaundice, hepatomegaly,cholecystitis and biliary lithiasis[3]. Both experimental andepidemiological evidence implicate liver fluke infestation in theetiology of bile duct cancer, i.e. cholangiocarcinoma[1,4,5]. An association between liver fluke infection and biliarylithiasis is well-recognized. Opisthorchis worm and/or eggshave been observed in the stones of infected or previouslytreated individuals[6], just as Clonorchis sinensis eggs werefound in the stones of those with Chinese liver fluke infection[7,8].Several community-based studies in Northeast Thailand haveshown a significant increase in the frequency of biliary sludgein people with a heavy infection[9-11]. Since biliary sludge is aprecursor of stone formation[12-14], opisthorchiasis likely playsa role in the development of biliary stones in certain individuals.However, the mechanism of liver-fluke-associated stonedevelopment is unclear. We report the incidence of stone types, its relationship withO. viverrini infection and bile/stone examinations. The potentialpathogenesis of opisthorchiasis-associated stones, in patientsfrom endemic areas of Thailand, is proposed.
MATERIALS AND METHODSPatientsThis study was carried out in Northeast Thailand, an areaendemic for opisthorchiasis. The study population included113 consecutive patients scheduled for cholecystectomy atKhon Kaen Regional Hospital from whom bile was obtainedbetween 1990 and 1991. The gallbladder diseases associatedwith the cholecystectomies included cholelithiasis (n = 71),cholecystitis with cholangiocarcinoma (n = 29) and cholecystitiswith other miscellaneous diseases (n = 13). None of the patientshad any history of hemolytic anemia or severe thalassemia. Patients ranged between 17 and 94 years of age (mean,54.97±14.65) (45 females, 68 males). The study was carried outin accordance with the principles embodied in the 1975 HelsinkiDeclaration. A signed informed consent was obtained from eachpatient.
Specimen collection and laboratory investigationsGallstones and/or common bile duct stones and bile specimenswere collected from each individual. Bile samples aspirated fromthe gallbladder were centrifuged at 3 000 r/min for 10 min, thenexamined for the presence of O. viverrini eggs. At least fourpellet-smears per individual were examined before the specimenwas considered negative for eggs. For a demonstration of calcium and bilirubin, the bile smearswere air-dried and fixed in 40 g/L formaldehyde. Calcium and bilirubinstaining were performed using histochemical methods[15].Calcium was stained black, bilirubin deep green. Five stones from each group with Opisthorchis egg-negativeand -positive bile underwent scanning electron microscopic(SEM) study. Briefly, the stones were thoroughly washed indistilled water and dried. After mechanical breaking, the stones

were sputter-coated with gold (agar aids-PS3, UK) and observedunder a Hitachi (Model S-3200N, Japan) scanning electronmicroscope and photographed.
Statistical analysisThe χ2-test was used to analyze the association between thefrequency of gallstones and sex, disease association, parasiteegg status and age groups. A P value <0.05 was consideredstatistically significant.
RESULTSCholesterol or pigment stones were classified by visual inspection.Cholesterol stones were white or yellow and crystalline incomposition, pigment stones were black or black-brown andamorphous. Of the 113 cases, 83 had stones while 30 had none. Most ofthe stone cases (98.8%, 82/83) had pigment stones, while onlyone had cholesterol stone(s). In addition, 63 of the 83 cases(75.9%) contained multiple stones, while the remainder had asingle stone. Of the 29 cases with cholangiocarcinoma, 9 (31.0%)contained stones while the others with miscellaneous diseaseshad stones in 3 out of 13 (23.1%) cases. The prevalence of
stones in all of the sample groups was significantly higher infemales (χ2-test, P = 0.028). No association between stonesand age groups (stratified as < 40, 40-49, 50-59 and > 60 years)was found (χ2-test, P = >0.05). Bile examination was positive for O. viverrini eggs in 57 ofthe 113 cases (49.6%) studied. The presence of parasite eggswas not associated with the frequency of stones or diseaseassociation (χ2-test, P = >0.05). Most of the eggs wereembedded in mucous gel. Aggregates of calcium bilirubinateprecipitates were observed in all cases with sludge. Three caseshad clear deposits of calcium bilirubinate on the eggshell, seenby special staining. Specifically, calcium was stained immediatelyadjacent to the eggshell, while bilirubin was observed in theouter layer (Figure 1 A, B). Examples of parasite egg-associatedmicrocalculi aggregation and stone development are shown inFigures 2A-D. A SEM study demonstrated the presence of parasite eggsin the center of stones from all of the Opisthorchis egg-positivecases. Interestingly, 3 of the 5 egg-negative cases contained theparasite eggs in the stones. Numerous crystals, morphologicallyconsistent with calcium derivatives and cholesterol precipitates,were observed. Typical SEM pictures of the stones are shownin Figures 3A, B.
Figure 1 Histochemical staining of biliary sludge for bilirubin (A) and calcium (B). Calcium appears as dark deposits on theOpisthorchis eggshell (arrow) and bilirubin precipitates are demonstrated in the outer layer (arrowhead). Normal parasite eggswithout deposition are shown in the same field. (A = Fouchet stain, B = von Kossa stain).
Figure 2 Typical pictures showing the cascades of Opisthorchis egg-associated stone formation starting from aggregation of theeggs admixed with mucin (A), deposition of calcium bilirubinate on the eggshells (B), and formation of tiny stones (C & D). Originalmagnification, x100 (A & C) and x200 (B & D).
A B
A B
C D
Sripa B et al. Opisthorchiasis-associated biliary stones 3319

Figure 4 Diagram showing the proposed pathogenesis ofOpisthorchis-associated biliary stone.
DISCUSSIONBiliary lithiasis is a common indication for cholecystectomy inmost parts of the world. However, the prevalence and types ofstones differ geographically[16-18]. Pigment stones, mostlycontaining calcium bilirubinate, generally constitute 10 to 27percent of all gallstones in America and Europe, the predominanttype was cholesterol stones[19-21]. In contrast, the prevalenceof pigment stones is high in Asia, accounting for 90% of allstones in some parts of China[22]. In our study, almost all thecases (98.8%) of biliary lithiasis involved pigment stones. Thisis probably the highest reported relative frequency of pigmentstones found during cholecystectomy. It exceeds a report fromBangkok, Central Thailand, where pure cholesterol stonesrepresent 32% of stones[23]. Stones in our study of NortheastThailand, however, occurred more frequently in females thanin males as in other countries[19-20]. The association between certain parasitic infections andbiliary stone formation is well documented[7,24-27]. Our studydemonstrated Opisthorchis eggs in the sludge from thegallbladder bile confirmed the sludge seen in other ultrasoundstudies performed in Northeast Thailand[12-14]. However, ourstudy failed to demonstrate the association between O. viverriniinfection and the presence of stones, perhaps because ofprevious self-treatment with praziquatel, an anthelminthic widelyused in Northeast Thailand[2]. We collected the treatment data,
but they were not reliable as patients did not record when or howmany times they took the medication before cholecystectomy.Moreover, re-infection is common in people in endemic areas. SEM data from egg-negative patients revealed parasite eggsin the nidi of the stones, indicating these patients werepreviously infected. Budget constraints meant that only a limitednumber of cases were confirmed by SEM. More stones shouldbe studied to test the validity of the findings. The mechanism by which parasite infection enhancespigment stone formation is not clearly understood. The presentstudy demonstrated O. viverrini eggs in the biliary sludge andgallstones in both bile smears and the SEM, while Rigantiet al.[6] observed both adult worms and eggs in the nidi ofgallstones from two patients. Riganti et al. also demonstratedcalcium bilirubinate in pigment stones, as previously reportedin stones associated with C. sinensis[7,8] and ascariasis[8,27,28].These observations have led investigators to conclude thatparasite eggs and/or worms may directly stimulate stoneformation[6,8]. Our histochemical findings on the calcium andbilirubin coatings on the O. viverrini eggs support thishypothesis. The presence of calcium coating on the outersurface of the parasite eggshell suggests that the eggs may actas a nucleus for stone formation. This may be similar toperipheral calcification of existing cholesterol stones[29]. Sincecalcium is an active element, and can precipitate several bileconstituents including bilirubin, carbonate and phosphate -major components of pigment stones[30]. The parasite eggsprecipitated with calcium bilirubinate and admixed with mucin,which is abundant in a liver fluke infection[3,25]. Mucin secretedby biliary epithelial cells has been recognized as an importantlocal factor in gallstone pathogenesis[31]. This orchestratedprocess can eventually produce mature pigment stones asgenerally described[32]. Additionally, liver flukes that inhabit the bile ducts canpartially obstruct the lumen leading to bile stasis and ascendingcholangitis[3]. E. coli, a common bacterial species infecting thebiliary system[23,33], releases β-glucuronidases, which canhydrolyze the glucuronic acid from the conjugated bilirubin[34-36].The resulting unconjugated bilirubin precipitates as calciumsalts, which is the first step in pigment stone formation[32,34].Bile stasis is not only a condition for ascending infection butalso induces stagnation of the bile components leading to stoneformation[37]. Heavy Opisthorchis infection can induce pooremptying of the gallbladder[9-11]. In addition, our recent reporthas shown that severe fibrosis of the gallbladder wall is themain histopathology of chronic opisthorchiasis[38]. Thesealtogether support the role of this liver fluke in gallbladderstasis, ascending cholangitis and enhanced stone formation.From previous data and our own observations, a proposedpathogenesis of Opisthorchis-associated pigment stone formation
Figure 3 SEM micrographs of gallstones showing Opisthorchis eggs with typical musk-melon-eggshell surface in the nidi of thestones. Several crystalline structures consistent with calcium (Ca), bilirubin derivatives (Bi) and cholesterol (Ch) could be noted(AB). Higher magnification with highlighting calcium bilirubinate deposition on Opisthorchis eggshell and mucus is shown inFigure 3B.
A B
Opisthorchis infection
eggs
Mechanical irritationInflammationGoblet cell metaplasia& hyperplasia
Partial bile duct obstruction
Ascending cholangitis(E. coli, Beta-Glucuronidase)
Calcium-bilirubindeposition
Other factors?
eggs
Mucus hypersecretion
eggs
eggseggs
Aggregation
Mature stone
Ch
Bi
Ca
3320 ISSN 1007-9327 CN 14-1219/ R World J Gastroenterol November 15, 2004 Volume 10 Number 22

is presented in Figure 4. In conclusion, Northeast Thailand has a high incidence ofpigment stones compared to cholesterol stones at cholecystectomy.Our study clearly demonstrates that calcium bilirubinateprecipitates on parasite eggshells both in light and SEM studies.This supports the role of O. viverrini infection in the pathogenesisof pigment stone formation.
ACKNOWLEDGMENTSThe authors thank Mr. Bryan Roderick Hamman for helpingwith the English-language presentation.
REFERENCES1 Infection with liver flukes (Opisthorchis viverrini, Opisthorchis
felineus and Clonorchis sinensis). IARC Monogr Eval Carcinog RisksHum 1994; 61: 121-175
2 Jongsuksuntigul P, Imsomboon T. Opisthorchiasis control inThailand. Acta Trop 2003; 88: 229-321
3 Harinasuta T, Riganti M, Bunnag D. Opisthorchis viverriniinfection: pathogenesis and clinical features. Arzneimittelforschung1984; 34: 1167-1169
4 Sithithaworn P, Haswell-Elkins MR, Mairiang P, Satarug S,Mairiang E, Vatanasapt V, Elkins DB. Parasite-associatedmorbidity: liver fluke infection and bile duct cancer in north-east Thailand. Int J Parasitol 1994; 24: 833-843
5 Vatanasapt V, Sripa B, Sithithaworn P, Mairiang P. Liver flukesand liver cancer. Cancer Surv 1999; 33: 313-343
6 Riganti M, Pungpak S, Sachakul V, Bunnag D, Harinasuta T.Opisthorchis viverrini eggs and adult flukes as nidus and com-position of gallstones. Southeast Asian J Trop Med Public Health1988; 19: 633-636
7 Teoh TB. A study of gall-stones and included worms in recur-rent pyogenic cholangitis. J Pathol Bacteriol 1963; 86: 123-129
8 Ker CG, Huang TJ, Sheen PC, Chen ER. A study of structureand pathogenesis of Ascaris and Clonorchis stones. Kaohsiung JMed Sci 1988; 4: 231-237
9 Elkins DB, Haswell-Elkins MR, Mairiang E, Mairiang P,Sithithaworn P, Kaewkes S, Bhudhisawasdi V, UttaravichienT. A high f requency of hepatobi l iary disease andcholangiocarcinoma associated with heavy Opisthorchis viverriniinfection in a small community in Northeast Thailand. Trans RSoc Trop Med Hyg 1990; 84: 715-719
10 Mairiang E, Elkins DB, Mairiang P, Chaiyakum J, ChamadolN, Loapaiboon V, Posri S, Sithithaworn P, Haswell-Elkins MR.Relationship between intensity of Opisthorchis viverrini infec-tion and hepatobiliary disease detected by ultrasonography. JGastroenterol Hepatol 1992; 7: 17-21
11 Mairiang E, Haswell-Elkins MR, Mairiang P, Sithithaworn P,Elkins DB. Reversal of biliary tract abnormalities associatedwith Opisthorchis viverrini infection following praziquanteltreatment. Trans R Soc Trop Med Hyg 1993; 87: 194-197
12 Lee SP, Nicholls JF. Nature and composition of biliary sludge.Gastroenterology 1986; 90: 677-686
13 Lee SP, Maher K, Nicholls JF. Origin and fate of biliary sludge.Gastroenterology 1988; 94: 170-176
14 Terada T, Nakanuma Y, Saito K, Kono N. Biliary sludge andmicrocalculi in intrahepatic bile ducts: Morphologic and X-raymicroanalytical observations in 18 among 1 179 consecutivelyautopsied livers. Acta Pathol Jpn 1990; 40: 894-901
15 Luna LG. Manual of histologic staining methods of the ArmedForces Institute of Pathology. 3rd ed. New York: McGraw-Hill1968: 258
16 Weedon D. Pathology of the Gallbladder. New York: Masson1984: 290
17 Kim WR, Brown RS Jr, Terrault NA, El-Serag H. Burden ofliver disease in the United States: summary of a workshop.Hepatology 2002; 36: 227-242
18 Shi JS, Ma JY, Zhu LH, Pan BR, Wang ZR, Ma LS. Studies ongallstone in China. World J Gastroenterol 2001; 7: 593-596
19 Friedman GD, Kannel WB, Dawler TR. The epidemiology ofgallstone disease: observation in the Framingham study. JChronic Dis 1966; 19: 273-292
20 Trotman BW, Soloway RD. Pigment vs cholesterol cholelithiasis:clinical and epidemiological aspects. Am J Dig Dis 1975; 20:735-740
21 Johnston DE, Kaplan MM. Pathogenesis and treatment ofgallstones. New Eng J Med 1993; 11: 411-421
22 Crowther RS, Soloway RD. Pigment gallstone pathogenesis:from man to molecules. Semin Liver Dis 1990; 10: 171-180
23 Teparut V, Limsuvan B, Pitchayangura C, Vatanachote D,Banchuin C, Jenvatanavit T, Athiphanumpai A, PokawatanaC, Tancharoen S. Correlation among biliary stones, gallbladderpathology and aerobic biliary infections. Bull Dept Med Serv1986; 11: 523-532
24 Cook J, Hou PC, Ho HC, McFadzean AJS. Recurrent pyogeniccholangitis. Br J Surg 1954; 42: 188-203
25 Hou PC. The pathology of Clonorchis sinensis infestation of theliver. J Pathol Bacteriol 1955; 70: 53-64
26 Cobo A, Hall RC, Torres E, Cuello CJ. Intrahepatic calculi. ArchSurg 1964; 89: 936-941
27 Yellin AE, Donovan AJ. Biliary lithiasis and helminthiasis. AmJ Surg 1981; 142: 128-136
28 Maki T. Cholelithiasis in Japanese. Arch Surg 1961; 82: 599-61229 Moore EW. Biliary calcium and gallstone formation. Hepatology
1990; 12(3 Pt 2): 206S-214S30 Rege RV. The role of biliary calcium in gallstone pathogenesis.
Front Biosci 2002 7: E315-32531 Ko CW, Lee SP. Gallstone formation. Local factors. Gastroenterol
Clin North Am 1999; 28: 99-11532 Cahalane MJ, Neubrand MW, Carey MC. Physical-chemical
pathogenesis of pigment gallstones. Semin Liver Dis 1988; 8:317-328
33 Truedson H, Elmros T, Holm S. The incidence of bacteria ingallbladder bile at acute and elective cholecystectomy. ActaChir Scand 1983; 149: 307-313
34 Maki T. Pathogenesis of calcium bilirubinate gallstone: Role ofE. coli-β-glucuronidase and coagulation by inorganic ions, poly-electrolytes and agitation. Ann Surg 1966; 164: 90-100
35 Swidsinski A , Lee SP. The role of bacteria in gallstonepathogenesis. Front Biosci 2001; 6: E93-103
36 Nakai K, Tazuma S, Nishioka T, Chayama K. Inhibition ofcholesterol crystallization under bilirubin deconjugation: par-tial characterization of mechanisms whereby infected bile ac-celerates pigment stone formation. Biochim Biophys Acta 2003;1632: 48-54
37 Pauletzki J, Paumgartner G. Review article: defects in gall-bladder motor function-role in gallstone formation andrecurrence. Aliment Pharmacol Ther 2000; 14(Suppl 2): 32-34
38 Sripa B, Hawell-Elkins MR, Sinawat P. Histological analysisof cholecystitis in relation to opisthorchiasis in endemic areasof Thailand. Acta Trop 2003; 88: 239-246
Edited by Wang XL Proofread by Zhu LH and Xu FM
Sripa B et al. Opisthorchiasis-associated biliary stones 3321

PO Box 2345, Beijing 100023, China World J Gastroenterol 2004;10(22):3322-3327Fax: +86-10-85381893 World Journal of GastroenterologyE-mail: [email protected] www.wjgnet.com Copyright © 2004 by The WJG Press ISSN 1007-9327
• CLINICAL RESEARCH •
Long-term results of graded pneumatic dilatation under endoscopic
guidance in patients with primary esophageal achalasia
Ahmet Dobrucali, Yusuf Erzin, Murat Tuncer, Ahmet Dirican
Ahmet Dobrucali, Yusuf Erzin, Murat Tuncer, Department ofGastroenterology, Cerrahpasa Medical Faculty, Istanbul University,Istanbul, TurkeyAhmet Dirican, Department of Bioistatistics, Cerrahpasa MedicalFaculty, Istanbul University, Istanbul, TurkeyCorrespondence to: Dr. Ahmet Dobrucali, Istanbul Universitesi,Cerrahpasa Tip Fakultesi, Ic Hastaliklari A.B.D., Gastroenteroloji B.D., Kocamustafapasa - Fatih, 34 300 Istanbul-Turkey. [email protected]: +90-532-4425551 Fax: +90-212-5307440Received: 2004-02-27 Accepted: 2004-04-20
Abstract
AIM: Achalasia is the best known primary motor disorderof the esophagus in which the lower esophageal sphincter(LES) has abnormally high resting pressure and incompleterelaxation with swallowing. Pneumatic dilatation remainsthe first choice of treatment. The aims of this study wereto determine the long term clinical outcome of treatingachalasia initially with pneumatic dilatation and usefulnessof pneumatic dilatation technique under endoscopicobservation without fluoroscopy.
METHODS: A total of 65 dilatations were performed in 43patients with achalasia [23 males and 20 females, the meanage was 43 years (range, 19-73)]. All patients underwentan initial dilatation by inflating a 30 mm balloon to 15 psiunder endoscopic control. The need for subsequent dilatationwas based on symptom assessment. A 3.5 cm balloon wasused for repeat procedures.
RESULTS: The 30 mm balloon achieved a satisfactory resultin 24 patients (54%) and the 35 mm ballon in 78% of theremainder (14/18). Esophageal perforation as a short-termcomplication was observed in one patient (2.3%). The onlylate complication encountered was gastroesophageal refluxin 2 (4%) patients with a good response to dilatation. Themean follow-up period was 2.4 years (6 mo - 5 years). Ofthe patients studied, 38 (88%) were relieved of their symptomsafter only one or two sessions. Five patients were referredfor surgery (one for esophageal perforation and four forpersistent or recurrent symptoms). Among the patientswhose follow up information was available, the percentageof patients in remission was 79% (19/24) at 1 year and54% (7/13) at 5 years.
CONCLUSION: Performing balloon dilatation under endoscopicobservation as an outpatient procedure is simple, safe andefficacious for treating patients with achalasia and referralof surgical myotomy should be considered for patients whodo not respond to medical therapy or individuals that donot desire pneumatic dilatations.
Dobrucali A, Erzin Y, Tuncer M, Dirican A. Long-term results ofgraded pneumatic dilatation under endoscopic guidance inpatients with primary esophageal achalasia. World J Gastroenterol
2004; 10(22): 3322-3327
http://www.wjgnet.com/1007-9327/10/3322.asp
INTRODUCTIONAchalasia is an uncommon disorder of the esophagus characterizedby clinical, radiologic and manometric findings. Dysphagia,regurgitation, weight loss and chest pain are among the mostrecognized clinical features of the disease. Manometrically it isdistinguished by esophageal aperistalsis and incompleterelaxation of the lower esophageal sphincter (LES). Esophagealdilatation and a tapered deformity of the distal esophagus arepresumably late radiological manifestations of the disease[1,2].The pathogenesis of achalasia remains unknown. Available datasuggest hereditary, degenerative, autoimmune and infectiousfactors as possible causes for achalasia, the latter two are themost commonly accepted possible etiologies. The mean age ofonset varies between 30 and 60 years with a peak incidence inthe fifth decade. The incidence is 1.1 per 100 000 with aprevalence of 7.9 to 12.6 per 100 000[2,3]. Although there is no definite cure for achalasia, the goals oftreatment should be: 1) relieving the patient’s symptoms, 2)improving esophageal emptying and 3) preventingdevelopment of a megaesophagus. The optimal treatment ofachalasia includes several options and presents a challengefor most gastroenterologists. It can be treated by botulinumtoxin injection, pneumatic dilatation or esophagomyotomy, butthe most effective treatment options are graded pneumaticdilatation and surgical myotomy. All of these therapeuticmodalities are aimed at removing the functional barrier at thelower esophageal sphincter level. Although high success rateshave been reported for these therapeutic modalities, the factremains that the esophageal propulsive force is not usuallyrestored and therefore it is conceivable that a normal esophagealfunction can never be expected among these patients[2,4,5]. The aim of our study was to evaluate the safety and efficacyof graded pneumatic dilation using two different size (3.0 and3.5 cm) balloon dilators (Rigiflex) in patients with primaryesophageal achalasia. We hereby report our experience, whichindicates that pneumatic dilatation can be safely performedunder direct endoscopic observation without fluoroscopicguidance and with only a short-term clinical monitoring in anoutpatient setting prior to discharge.
MATERIALS AND METHODS
PatientsForty-three consecutive patients (23 males and 20 females) wereevaluated. The ages ranged from 19 to 73 years with a meanage of 43 years. All patients were referred because of typicalsymptoms of achalasia. All had dysphagia, but some also hadregurgitation or pulmonary aspiration (Table 1). The diagnosisof achalasia was made on the basis of clinical, radiologic andmanometric criteria. Barium esophagogram showed a distalnarrowing of the esophagus (bird beak deformity) and variabledegrees of dilation of the esophagus in most patients (93%).Mean esophagus diameter was 3.8 cm (range, 2-6.3 cm). Upperendoscopy was done in all patients to exclude secondary causesof achalasia. Computerized tomography of the chest was donein 12 patients over age 40 with significant weight loss over ashort period (six months or less) to exclude mediastinal malignancy

causing pseudoachalasia. Eligibility criteria for entry into the study required: a diagnosisof achalasia by manometry as defined above, absence ofobstructive intrinsic or extrinsic esophageal lesions by X-rayand endoscopy, and Absence of esophageal or gastric carcinoma,a peptic stricture or a prior surgical fundoplication. Symptoms of the patients were scored using a questionnairerequesting information regarding the presence and severity oftheir difficulty in swallowing solids and liquids on a 5 pointsubjective visual scale: 0 = no symptoms, 1 = mild, 2 = moderate,3 = severe, 4 = very severe.
Table 1 Clinical characteristics and demographic data of pa-tients [mean±SD, (min-max)]
Age (yr) 44±16 (19-73)Gender (M/F) 23/20Dysphagia 43 (100%)Chest pain 5 (11%)Regurgitation 34 (79%)Pulmonary aspiration 9 (21%)Mean duration of symptoms (mo) 35±21 (6-72)Mean weight loss (kg) 7.7±2 (4-11)LES pressure (mmHg) Before dilation 38.6±12 (19-66) After dilation 11.8±8 (0-16)Vigorous achalasia 1 (2.3%)Esophagus diameter (cm) 3.8 (2-6.5)
Esophageal manometryEsophageal manometry was performed in all patients with afour lumen polyvinyl catheter with Dent sleeve working with apneumohydraulic capillary perfusion system (Synectic PCpolygraph- Gastrosoft Inc.Upper GI edition, version 6.0).Manometric examinations were performed by the same author.LES was localised using the station pull-through technique.Other three orifices, located 5 cm apart and also oriented at 90ºangles, for determination of the peristalsis and pressures, byplacing the distal orifice 5 cm above the LES. The peristalsiswas measured with 10 wet swallows of 5 mL of water, each atintervals of 60 s or more. Aperistalsis was the absolutemanometric criteriron required for the diagnosis of achalasiawith increased LES pressure and incomplete/absent relaxationwere the complementary findings[7]. Incomplete relaxation wasdefined as the failure of LES pressure to drop to gastric baselineduring a dry and /or wet swallow (Figure 1).
Technique of pneumatic dilationAll dilations were performed on outpatients. Dilations were
done by the same authors using the Rigiflex achalasia balloondilators (Microvasive) in a graded manner. A 3.0 cm dilator wasalways used first. If there was still no symptomatic response, a3.5 cm dilator was used after 6-8 wk. After clear liquid diet for24 h and an overnight fast, an endoscope (Pentax EG-2940)was passed after application of a local anesthetic to the pharynxunder conscious sedation (Midazolam 0.04 mg/kg iv) to evacuatethe residual liquid from the esophagus and to insert a guidewire. The guide wire was placed into the duodenum viastomach under endoscopic guidance and endoscope wasremoved. A Rigiflex balloon dilator, which was marked with athick coloured marker at the mid section of the balloon waspassed over the guidewire to stomach and slightly inflated(less than 5 psi) to get a soft tube shaped form. Endoscope wasreinserted and positioned proximally to adjust and control theposition of the balloon in the esophagus. Balloon was withdrawnto esophagus and marked part of the balloon was locatedwithin the gastroesophageal junction under endoscopiccontrol (Figure 2). The balloon was then inflated until 15 psi.and inflation was maintained for 60 s. Ischemic ring at thelower esophageal sphincter level was seen during dilatationthrough the transparent balloon. After repeating of the sameinflation procedure one more time at the same sessionendoscopic dilatation was terminated and endoscope, balloonand guidewire were removed. Balloon dilator surface waschecked to see if there was blood on it. The procedure was welltolerated by all patients.
Figure 2 Technique for pneumatic dilatation under endo-scopic control without fluoroscopy. The balloon was posi-tioned so that its midsection was at the high pressure level(A). The balloon was inflated and the endoscopist observeswith endoscope proximally to balloon (B). With successfuldilatation the ischemic ring of dilated segment was dimin-ished or disappeared (C).
Figure 1 Manometric samples from a normal individual (A) and a patient with achalasia (B). Figure A illustrates the normalperistaltic activity forwarding at cranio-caudal direction whereas figure B shows typical manometric findings of achalasia. Note theaperistalsis, weak and simultaneous contractions (mirror sign), and incomplete LES relaxation after swallow. Basal LES pressure ishigh (40 mmHg).
AChannel 1SwallowSW.Scale: 10.0Channel 2PressuremmHgSoale: 20.0Channer 3PressuremmHgSoale: 20.0Channer 4PressuremmHgSoale: 20.0Channer 5PressuremmHgSoale: 20.0Channer 6PressuremmHgSoale: 20.0Channer 7PressuremmHgSoale: 20.0
Channel 1SwallowSW.Scale: 10.0Channel 2PressuremmHgSoale: 20.0Channer 3PressuremmHgSoale: 20.0Channer 4PressuremmHgSoale: 20.0Channer 5PressuremmHgSoale: 20.0Channer 6PressuremmHgSoale: 20.0Channer 7PressuremmHgSoale: 20.0
403020100806040200806040200806040200806040200806040200806040200
403020100806040200806040200806040200806040200806040200806040200
Swallow
LES
Swallow
LES
Bs
s
s
s
s
s
s
s
s
s
s
s
s
s
A B C
Endoscop
Balloon
LOS
Guide wire Stomach
Esophagus
Markedarea on
theballoon
Dobrucali A et al. Long-term results of graded pneumatic dilatation 3323

The severity of chest pain in patients was scored after theballoon dilation on a scale of 0-10 (0, absence of pain; 10 severestpain). Gastrograffin swallow was done few hours after dilationto exclude esophageal perforation. After an observation periodof 6 h, patients were discharged and permitted to eat the nextmorning. Second esophageal manometry and symptom scoring wereperformed in all patients with therapeutic response six weeksafter pneumatic dilation to evaluate the efficacy of endoscopicballoon dilation. The response to balloon dilation was considered excellentif there was no or very rare mild dysphagia, good if there wasintermittent mild dysphagia, or poor if there was persistentdaily mealtime dysphagia. The balloon therapy was consideredsuccessful if the patients had a good or excellent response.
Statistical analysisResults were expressed as either percentages or mean±SD.Statistical analysis was performed using Chi-square test,Kendall’s tau-b coefficient and Mann-Whitney U test asappropriate. P<0.05 was considered statistically significant. Thecumulative remission rates of the patients treated with balloondilation were estimated by the Kaplan-Meier method and thedifference between treatment groups was tested by the logrank test.
RESULTSThe clinical characteristics and demographic data of patientsare shown in Table 1. The mean LES pressure was 37.6±12 mmHg.Relaxation failure of LES and aperistalsis with low amplitudesimultaneous uniformed waves were present in all patients.Only one of the 5 patients with retrosternal pain was diagnosedas a vigorous achalasia (2.3%) at esophageal manometry. TheLES pressures and symptom scores of successfully dilatedpatients were decreased significantly one month after dilation,(37.6±12 vs 9.5±3) and (2.9±0.6 vs 0.8±0.6) respectively (P<0.01)(Figure 3). There was no significant correlation between theparameters of age, sex, initial LES pressure, symptom score andbarium study findings. Chest pain was reported by all patients during the initialdilation, with a mean pain score of 7.2±2.3 (range, 4-10). Chestpain score was 8.1±1.8 in patients who were successfully dilatedat the first session although score was 4.8±2.1 in patients witha poor response to initial balloon dilation (P<0.05). Chest painafter the procedure usually lasted for 30-60 min and wassubsternal in nature, diminishing gradually over time andresolved completely within 2 to 6 h. The results of balloon dilation are summarized in Table 2. Atotal of 65 dilatations were performed in 43 patients for anaverage of 1.7 dilations per patient. The 3 cm balloon was alwaysused first. Twenty-four patients (56%) were successfully dilated
with a 3 cm balloon only. Fourteen patients had an excellentresponse (32.5%) and 10 patients had a good response (23%)to 3.0 cm balloon dilation. Old age at the time of initial pneumaticdilatation was significantly associated with a better clinicalresponse to treatment as assessed by the need for subsequenttreatments (Kendall’s tau-b = 0.414, P = 0.016) (Table 3).
Table 2 Results of rigiflex balloon dilation under endoscopiccontrol
Inflation pressure (psi) 15
Dilation time per session (s) 2×60
Success with 3.0 cm balloon 24/42(56%)
Success with 3.5 cm balloon 14/18(78%)
Overall success rate at first year1 19/24(80%)
Overall success rate at 5 years1 7/13(54%)
Complications
Perforation 1(2.3%)
Bleeding -
Mortality -
1Among the patients whose long term follow up informationwas available.
Table 3 Effect of age, LES pressure and esophageal diameteron the clinical benefit of the initial pneumatic dilation. 1With3 cm balloon
Patients with Patients with successful initial successful initial P pneumatic dilation pneumatic dilation
(n = 24) (%)
Age (yr)
<35 4/14 28 <0.01 35-55 11/17 65
>55 9/11 82LES pressure (mmHg) <30 6/12 50
30-45 13/21 62 NS >45 5/9 55
Esophageal diameter (cm) <3 4/7 57
3-4 11/21 52 NS >4 9/14 64
NS: Non significant.
Eighteen patients (42%) with a poor response to 3.0 cmballoon were dilated with a 3.5 cm balloon at intervals of 6-8 wk.Nine patients had excellent, five had good and four patientshad poor response to the second dilation with a 3.5 cm balloon.
Figure 3 Lower esophageal sphincter pressures (LESP) (A) and symptom scores (B) of patients with therapeutic response initiallyand at one month after pneumatic dilatation.
70
60
50
40
30
20
10
0
Initial After dilatation
LESP (m
mH
g)
36.7±12
P<0.01
9.5±3
A 5
4
3
2
1
0 Initial After dilatation
Sym
pto
m s
core
2.9±0.6P<0.01
0.8±0.6
B
3324 ISSN 1007-9327 CN 14-1219/ R World J Gastroenterol November 15, 2004 Volume 10 Number 22

Patients with a poor response to the second dilation with a3.5 cm balloon were dilated with a 3.5 cm balloon at the thirdtime but all of them were symptomatic after a while and thesepatients were no longer treated with a larger balloon (4 cm),instead, surgical treatment was suggested. One patient whorefused surgery had repeated dilation every 6 to 12 mo with a3.5 cm balloon due to symptom recurrence. The mean follow-up period in the entire group was 2.4 years(range, 6 mo -5 years). Among the 38 patients whose long termfollow up information was available, 33 (87%) at six monthswere asymptomatic [Among them 23 (70%) required onceand 10 (30%) required twice dilation]. At the end of the firstyear, 16 of 24 patients (66%) whose follow up information wasavailable were asymptomatic. Among the 24 patients, 3 (12.5%)complained of mild intermittent dysphagia and 5 (21%) hadintermittent severe dysphagia. The total number of asymptomaticpatients and patients with mild dysphagia was 19 (79%) at theend of the first year. Among these, 10 patients (52%) requireda second dilation. Among patients whose follow up information was availableat 3 years the 19, 13 were in remission (68%) (5 asymptomaticand 8 with intermittent mild dysphagia). Among patients whosefollow up information was available at 5 years the 13, 7 were inremission (54%) (3 were asymptomatic and 4 with mildintermittent dysphagia). Among the total, 3 patients (44%)required once and 4 (56%) required twice dilation (Figure 4).Figure 5 shows the Kaplan-Meier plot for the two treatmentgroups of patients who were dilated once or twice. Thecumulative one, three and five year remission rates were higherin patients dilated twice but this difference was not statisticallysignificant (Log rank χ2 = 2.10, P = 0.1471).
Figure 4 Percentage of patients with excellent and good re-sponse to dilatation at 6 mo, 1, 3 and 5 years.
Figure 5 Kaplan-Meier plot for the two treatment groups ofpatients who were dilated once2 or twice1. The cumulative one,three and five year remission rates were higher in patientsdilated twice but this difference was not statistically significant(Log rank χ2 = 2.10, P = 0.1471).
Gastrograffin swallow done immediately after balloon dilationrevealed esophageal perforation in one patient (2.3%) (a 60years old female) with persistent chest pain and surgical therapywas required. There were no other immediate complications.Reflux esophagitis as a late complication was observed in twoof the patients who had a good response to dilatation duringthe follow up period (4%). Blood on the balloon after dilatation was a common finding.There was no statistically significant correlation betweenbloody dilator and dilatation success (P>0.05).
DISCUSSIONThis study analysed the effectiveness of pneumatic balloondilation and the clinical outcome in patients with achalasia. Ourresults showed that once or twice pneumatic dilatation providedgood results in the majority of patients with achalasia and longterm results were 79% at 1 year and 54% at 5 years. Of thepatients studied, 38 (88%) were relieved of their symptomsafter one or two sessions. An initial pneumatic dilation was aneffective single treatment with no further treatment needed in57% of patients in a short term period. The remaining 43% ofpatients treated initially with pneumatic dilation neededadditional treatments due to persistent or recurrent symptomsand only 11% of patients failing pneumatic dilatation werereferred for surgery (4 with poor response to repeated dilationsand 1 with perforation due to dilation). Four patients with apoor response to the second dilation with a 3.5 cm balloonwere dilated with a 3.5 cm balloon the third time but all of themwere symptomatic after a while and these patients were nottreated with a larger balloon. Some studies have reported usinga 3.5 cm balloon instead of a 3 cm balloons one as the initialballoon but others have used 3 cm for the initial dilatation[8,9,11].In our series application of the second pneumatic dilationincreased the long term clinical benefit of pneumatic dilationfrom 30% at six months to 57% at 5 years, but this differencewas not statistically significant (P>0.05) (Figure 4). To someextent, our results about the clinical benefit of a singlepneumatic dilatation and the use of the second dilatation forpatients with persistent symptoms are in agreement with otherstudies. It has been shown that the overall efficacy ofendoscopic balloon dilation was approximately 85%, with anexcellent to good response for 3, 3.5 and 4 cm dilators being70%, 87% and 93% respectively (9 studies; four prospective,five retrospective, 261 patients, a mean follow up of 1.9 years(range; 0.3 to 6 years)[10-17] (Table 4). Approximately 50% (range,17% to 75%) of all patients required repeat dilations, equalingto 1.2 to 2 dilations per patient. About one half of patientsresponded to a repeat dilation, with the remainder eitherproceeding to surgical management or deciding to live withtheir persistent symptoms. The reported overall long-termefficacy of pneumatic dilatation was 50-90% at 1 year and 60%at 5 years[1]. The major adverse event with pneumatic dilatationwas esophageal perforation with a 2% cumulative rate. TheAmerican Society for Gastrointestinal Endoscopy hasrecommended that if a single dilation session (size of the balloondilator unspecified) does not produce satisfactory relief, asecond attempt may be warranted and if this fails, surgeryusually is indicated[15]. The patient population undergoing initial dilation in thisstudy was not large enough to compare the effect of age on thedilation success, but our results indicate that initial pneumaticdilation was more effective in older patients (χ2 value: 8.215a,P = 0.016, Kendall’s tau-b 0.414, P = 0.001). This increasedclinical benefit of pneumatic dilation in old patients has alsobeen described by other investigators[19,21,22]. There was nosignificant difference between the mean ages of the patientswith and without remission at the end of 1 and 5 years although
Dobrucali A et al. Long-term results of graded pneumatic dilatation 3325
6 mo 1 yr 3 yr 5 yr
120
100
80
60
40
20
0
87%n = 33/38
Duration after balloon dilatation
Perc
enta
ge o
f patients
with
exce
llent
and g
ood r
esp
onse
to d
ilation
30%n = 10
70%n = 23
79%n = 19/24
52%n = 10
48%n = 9
68%
n = 13/19
61%
n = 8
39%
n = 5
54%
n = 7/13
57%n = 4
43%n = 3
Patients who have required second dilation with 3.5 cm ballon
Patients who have successfully dilated with 3 cm balloon only
0 1 2 3 4 5 6
1.00.90.80.70.60.50.40.30.20.10.0
Time
12

the patients in remission at 5 years were older, [43±16 (n = 19)vs 48±16 (n = 5) (P>0.05) at 1 year and 53±17 (n = 7) vs 37±14(n = 6) (P>0.05), at 5 years respectively]. The efficacy ofpneumatic dilatation was not influenced by initial LES pressureand esophageal diameter (Table 3). After balloon dilation, the mean LES pressure was 11.8±4mmHg (range, 0-16 mmHg) and it represented 75% decrease ofbasal LES pressure. It has been shown that basal LES pressuredecreased from 39% to 68% after dilation but these changesdid not allways indicate a dilation success. In general, adecrement in LES pressure of more than 50% or an absoluteend-expiratory LES pressure of less than 10 mmHg were moreindicative of clinical success[2]. Timed barium esophagogramor scintigraphy may correlate with symptomatic improvement inup to 72% of patients. In spite of this similarity, approximatelyone third of patients who noted complete relief showed lessthan 50% improvement in barium column height and esophagealdiameter[21]. Only one of 43 patients in our series had an esophagealperforation during treatment with pneumatic dilatation (2.3%).This complication rate is similar to those reported by otherexperienced groups[9,19,20]. Gradual increase in dilator size basedon symptomatic response and the use of inflation pressurebetween 10 to 15 psi can minimize the risk of perforation.Esophageal perforation may occur in up to 5% of all reportedcases, with a possible increased risk if hiatal hernia is present.In our study gastrograffin swallow was performed in all patients.Using immediate contrast studies to exclude perforation becameroutine in the late 1970’s, and using this approach has beenrecommended in several studies and text books. Some authorssuggested that contrast studies were indicated only whenthere was clinical suspicion of perforation. It has been reportedthat an immediate contrast study may not always exclude aperforation which may become clinically evident several hourslater[5]. Less commonly, intramural hematoma, diverticula at gastriccardia, mucosal tears, reflux esophagitis, prolonged post-procedure chest pain, fever, hematemesis without changes inhematocrit and angina may occur after pneumatic dilatation.Objective assessment of gastroesophageal reflux after pneumaticdilation rarely has been studied. Abnormal 24 h pH scores havebeen documented in approximately 20% to 33% of patientsafter dilation. In spite of these abnormal scores, very few ofthese patients were symptomatic or developed endoscopic orclinical evidence of GERD related complications. It has beenshown that postdilatation LES pressures and gastric emptyingwere similar between reflux and non-reflux groups[2]. Since GERDrelated symptoms correlated poorly in achalasia patients, 24 hpH monitoring has been recommended for patients that developedfrequent heartburn, reflux or chest pain in spite of an otherwisegood clinical response to dilation. One of the important pointsof this study was the dilatation technique which did not requirefluoroscopic control (see materials and methods). Our experience
shows that Rigiflex balloon can be successfully positionedacross the gastroesophageal junction and inflated under directendoscopic observation. This technique is as effective asconventional fluoroscopic technique and has an advantage toprevent patients and endoscopists from an additional X-ray.Furthermore we have seen that patient tolerability was verygood and success rates were reasonable and comparable withothers. Safety and efficacy of pneumatic dilation for achalasiawithout fluoroscopic control also have been shown by Lambrozaand Levine[16,18]. In a recently published interesting study, Cheng et al.evaluated the usefulness of temporariy placing of coveredstents for 3-7 d versus pneumatic dilatation and found that theearly and late (at one and three years respectively) relapserates were quite low in the stent treated group versus thepneumatic dilatation treated one[23]. The success of this methodwas suggested to be due to chronic tearing of the cardiamuscularis which resulted in a diminished amount of fibrosisand so restenosis after the stent was withdrawn. The results of our study suggest that pneumatic dilatationfor achalasia without fluoroscopic guidance is a safe andeffective treatment modality. A graduatl increase in dilator sizebased on symptomatic response minimizes complications.Symptomatic patients with achalasia who are good surgicalcandidates should be given an option of graded pneumaticdilatation before surgery. Although surgical myotomy, oncewith a high mortality and long hospital stay, can now beperformed laparoscopically with a similar efficacy to the opensurgical approach, reduced morbidity and hospitalization time,referral of myotomy should be considered for patients who donot respond to medical therapy or individuals that do not desirepneumatic dilatations. The advantages of pneumatic dilatationover surgical myotomy are a brief period of discomfort, a veryshort hospital stay and consequently low exposure.
REFERENCES1 Clouse RE, Diamant NE. Esophageal motor and sensory func-
tion and motor disorders of the esophagus. In: Sleisenger MH,Friedman LS, Feldman M. Eds: Gastrointestinal and LiverDisease. Philadelphia Saunders 2002: 561-598
2 Dunaway PM, Wong RK. Achalasia. Curr Treat Opt Gastroenterol2001; 4: 89-100
3 Howard PJ, Maher L, Pryde A, Cameron EW, Heading RC. Fiveyear prospective study of the incidence, clinical features anddiagnosis of achalasia in Edinburgh. Gut 1992; 33: 1011-1015
4 Csendes A, Braghetto I, Henriquez A, Cortes C. Late results ofa prospective randomised study comparing forceful dilatationand oesophagomyotomy in patients with achalasia. Gut 1989;30: 299-304
5 Ciarolla DA, Traube M. Achalasia. Short-term clinical moni-toring after pneumatic dilation. Dig Dis Sci 1993; 38: 1905-1908
6 Prakash C, Clouse RE. Esophageal motor disorders. Curr OpGastroenterol 1999; 15: 339-346
7 Nair LA, Reynolds JC, Parkman HP, Ouyang A, Strom BL,
Table 4 Cumulative effectiveness of graded pneumatic dilators for achalasia
Author Pt. Study Dilator % Decrease % Improvement Follow-up (yr) Perforation # design (size/cm) of LESP Excellent/Good Mean (range) (%)
Barkin(11) 50 Prospec. 3.5 - 90 1.3 (1–3.4) 0Levine(12) 62 Retrosp. 3-3.5 - 85-88 - 0Wehrmann(15) 40 Retrosp. 3–3.5 42 89 2–5 2.5Lee(9) 28 Prospec. 3–3.5-4 - - - 7Gelfand(10) 24 Prospec. 3–4 60-68 70–93 - 0Kadakia(13) 29 Prospec. 3–3.5–4 67 62–79–93 4 (3–6) 0Abid(14) 36 Retrosp. 3.5–4 - 88–89 2.3 (1–4) 6.6Lambroza(16) 27 Retrosp. 3 - 67 1.8 (0.1–4.8) 0Bhatnagar(17) 15 Prospec. 3–3.5 - 73-93 1.2 (0.3–3) 0
3326 ISSN 1007-9327 CN 14-1219/ R World J Gastroenterol November 15, 2004 Volume 10 Number 22

Rosato I, Cohen S. Complications during pneumatic dilationfor achalasia or diffuse esophageal spasm. Analysis of riskfactors, early dinical characteristics, and outcome. Dig Dis Sci1993; 38: 1893-1904
8 Stark GA, Castell DO, Richter JE, Wu WC. Prospective ran-domized comparison of Brown-McHardy and microvasiveballoon dilators in treatment of achalasia. Am J Gastroenterol1990; 85: 1322-1326
9 Richter JE, Lightdale CJ. Management of achalasia. AGA Post-graduate Course, May 19-20. 2001: 303-308
10 Gelfand MD, Kozarek RA. An experience with polyethyleneballoons for pneumatic dilation in achalasia. Am J Gastroenterol1989; 84: 924-927
11 Barkin JS, Guelrud M, Reiner DK, Goldberg RI, Phillips RS.Forceful balloon dilation: an outpatient procedure for achalasia.Gastrointest Endosc 1990; 36: 123-126
12 Levine ML, Moskowitz GW, Dorf BS, Bank S. Pneumatic dila-tion in patients with achalasia with a modified Gruntzing dila-tor (Levine) under direct endoscopic control: results after 5years. Am J Gastroenterol 1991; 86: 1581-1584
13 Kadakia SC, Wong RK. Graded pneumatic dilation usingRigiflex achalasia dilators in patients with primary esophagealachalasia. Am J Gastroenterol 1993; 88: 34-38
14 Abid S, Champion G, Richter JE, McElvein R, Slaughter RL,Koehler RE. Treatment of achalasia: the best of both worlds.Am J Gastroenterol 1994; 89: 979-985
15 Wehrmann T, Jacobi V, Jung M, Lembcke B, Caspary WF.Pneumatic dilation in achalasia with a low-compliance balloon:
results of a 5-year prospective evaluation. Gastrointest Endosc1995; 42: 31-36
16 Lambroza A, Schuman RW. Pneumatic dilation for achalasiawithout fluoroscopic guidance: safety and efficacy. Am JGastroenterol 1995; 90: 1226-1229
17 Bhatnagar MS, Nanivadekar SA, Sawant P, Rathi PM. Acha-lasia cardia dilatation using polyethylene balloon (rigiflex)dilators. Indian J Gastroenterol 1996; 15: 49-51
18 Levine ML, Dorf BS, Moskowitz G, Bank S. Pneumatic dilata-tion in achalasia under endoscopic guidence: correlation pre-and postdilatation by radionuclide scintiscan. Am J Gastroenterol1987; 82: 311-314
19 Parkman HP, Reynolds JC, Ouyang A, Rosato EF, EisenbergJM, Cohen S. Pneumatic dilatation or esophagomyotomy treat-ment for idiopathic achalasia: clinical outcomes and costanalysis. Dig Dis Sci 1993; 38: 75-85
20 Robertson CS, Fellows IW, Mayberry JF, Atkinson M. Choice oftherapy for achalasia in relation to age. Digestion 1988; 40: 244-250
21 Vaezi MF, Richter JE, Wilcox CM, Schroeder PL, Birgisson S,Slaug RL, Koehler RE, Baker ME. Botulinum toxin versus pneu-matic dilatation in the treatment of achalasia: a randomisedtrial. Gut 1999; 44: 231-239
22 Fellows IW, Ogilvie AL, Atkinson M. Pneumatic dilatation inachalasia. Gut 1983; 24: 1020-1023
23 Cheng YS, Li MH, Chen WX, Chen NW, Zhuang QX, ShangKZ. Selection and evaluation of three interventional proceduresfor achalasia based on long-term follow-up. World J Gastroenterol2003; 9: 2370-2373
Edited by Zhu LH and Wang XL Proofread by Xu FM
Dobrucali A et al. Long-term results of graded pneumatic dilatation 3327

PO Box 2345, Beijing 100023, China World J Gastroenterol 2004;10(22):3328-3331Fax: +86-10-85381893 World Journal of GastroenterologyE-mail: [email protected] www.wjgnet.com Copyright © 2004 by The WJG Press ISSN 1007-9327
• CLINICAL RESEARCH •
Seasonal variation in the onset of acute pancreatitis
Massimo Gallerani, Benedetta Boari, Raffaella Salmi, Roberto Manfredini
Massimo Gallerani, Benedetta Boari, Roberto Manfredini,Section of Internal Medicine, Department of Clinical and ExperimentalMedicine, University of Ferrara, via Savonarola 9, I-44100 Ferrara,ItalyRaffaella Salmi, Department of Internal Medicine, St Anna Hospital,corso Giovecca 203, I-44100 Ferrara, ItalySupported by a Research Grant “ex-60%” From the University of FerraraCorrespondence to: Roberto Manfredini, Section of Internal Medicine,Department of Clinical and Experimental Medicine, University ofFerrara, via Savonarola 9, I-44100 Ferrara, Italy. [email protected]: +39-532-236817 Fax: +39-532-210884Received: 2003-11-12 Accepted: 2004-02-24
Abstract
AIM: A circannual variation in the onset of several acute diseases,mostly dealing with cardiovascular system, has been reported.The present study was to verify the possible existence of aseasonal variability in the onset of acute pancreatitis.
METHODS: All patients consecutively admitted to the Hospitalof Ferrara, Italy, between January 1998 to December 2002,whose discharge diagnosis was acute pancreatitis, wereconsidered. According to the time of admission, cases werecategorized into twelve 1-mo intervals and in four periodsby season. χ2 test for goodness of fit and partial Fourierseries were used for statistical analysis.
RESULTS: During the study period, 549 cases of acutepancreatitis were observed. A significant peak of higherincidence was found in March-May, both for total population,males and subgroups with and without cholelithiasis oralcoholism. Fourier analysis showed the existence of acircannual rhythmic pattern with its main peak in March (95%C.L.: February-April, P = 0.005), and a secondary one inSeptember. Death occurred more frequently in December-February, compared to the other periods (P = 0.029), andchronobiologic analysis yielded a seasonal peak in November-December (P<0.001).
CONCLUSION: This study shows the existence of a circannualvariation in the onset of acute pancreatitis, with a significantlyhigher frequency of events in the spring, especially for patientswith cholelithiasis or alcoholism. Moreover, events occurringduring the colder months seem to be characterized by ahigher mortality rate.
Gallerani M, Boari B, Salmi R, Manfredini R. Seasonal variationin the onset of acute pancreatitis. World J Gastroenterol
2004; 10(22): 3328-3331
http://www.wjgnet.com/1007-9327/10/3328.asp
INTRODUCTIONMany studies have shown a circannual variation in the onsetof several diseases mostly dealing with cardiovascular system,characterized by an abrupt onset, e.g., fatal pulmonary embolism[1,2],ischemic and hemorrhagic stroke[3,4] and rupture of aorticaneurysms[5,6]. Seasonal specific patterns have also been reported
for a series of miscellaneous diseases characterized by an acuteonset, treated by the Emergency Department, including paralysisof cranial nerves[7], microcristalline arthritis[8], herpes zosterinfection[9], epistaxis[10], urinary retention[11]. In the last few yearsseveral studies have investigated gastroenterologic diseases,and seasonal etiological patterns have been reported for theonset of peptic ulcer[12-15] and exhacerbation of inflammatorybowel diseases[16-18]. The aim of the present study was to determineby means of a validated chronobiological analysis, whether acutepancreatitis, a common but potentially harmful entity, mightshow a rhythmic seasonal variation as well.
MATERIALS AND METHODSAll cases of acute pancreatis (International Classification ofDiseases, 9th Revision, Clinical Modification, ICD9-CM code:577.0-8) consecutively observed from 1 January 1998 to 31December 2002 at the St. Anna Hospital of Ferrara, Italy, wereconsidered for the study. Ferrara is a small town in northernItaly particularly well suited for epidemiological studies. It hasa stable population of approximately 150 000 inhabitants, almostexclusively white. The only available hospital in this communityis St Anna Hospital, which also serves as the sole teachingcenter for the School of Medicine. The day and month of eachevent were categorized both into four 3-mo periods (accordingto seasons) and into twelve 1-mo intervals. Diagnosis wasalways made on the basis of clinical features, physical examination,laboratory data (serum amylase, isoamylase, lipase, and urinaryamylase), and instrumental examinations, when necessary. Forall subjects with acute pancreatitis the presence or absence ofthe two leading specific risk factors (alcoholism and biliarytract disease), was carefully investigated. For statistical analysis, two different methods were used:χ2 test for goodness of fit and partial Fourier series. Toinvestigate possible differences in frequency peaks, χ2 test forgoodness of fit was applied to the total sample population andsubgroups by gender, comparing observed against expectedevents during the four intervals season[19]. On the other hand,to verify the possible existence of a reproducible rhythmicpattern, cosinor analysis and partial Fourier series were appliedto the time series, using specific commercially available softwarewritten for the Apple Macintosh computer[20]. The programallows, among all the possible combinations of the periods chosenby the user, the selection of the harmonic or the combination ofharmonics that best explain the variance of data. The percentageof rhythms (PR: percentage of overall variability of data aboutthe arithmetic mean attributable to the fitted rhythmic function)and the probability value resulting from the F statistic used totest the hypothesis of zero amplitude, were chosen to be reportedin the results as representative parameters of goodness of fitand statistical significance of each fitted function, respectively.The program was used to calculate the midline estimatingstatistic of rhythm (MESOR: the rhythm-adjusted mean overthe time period analyzed) and the amplitude (half the distancebetween the absolute maximum and minimum of the function)of the best-fitting-curve. The program was also used to calculatepeak (ortophase) and trough (bathyphase) times of the fittedcurves (times of occurrence of the absolute maximum andminimum) and the acrophase of each single harmonic change,together with the 95% confidence limits (CL). Significance

levels were always assumed for P<0.05. Conventional statisticalanalysis was performed using Student’s t test for unpaireddata. Significance levels were always set at P<0.05.
RESULTSFrom January 1998 to December 2002, 549 consecutive cases of
acute pancreatitis were observed, 285 cases were males (51.9%)and 264 were females (48.1%), their mean age was 65±17 years(difference between sexes t = 2.7, P = 0.007). Two hundred andeighty-six had cholelithiasis (52.1%) and 48 had chronicalcoholism (8.7%). Deaths from acute pancreatitis were 18 (14 males and 5females), accounting for 3.2%. Their mean age was 56±16 years,
Table 1 Monthly distribution of acute pancreatitis by gender and risk factors
Month Total Males Females Biliary tract disease No bil. tract disease Alcoholism Fatal cases (n = 549) (n = 285) (n = 264) (n = 286, 52.1%) (n = 263, 48.9%) (n = 48, 8.7%) (n = 18, 3.2%)
January 34 18 16 17 17 1 3February 46 19 27 22 24 2 2March 62 35 27 28 34 8 1April 61 33 28 31 30 7 0May 56 32 24 35 21 5 0June 44 23 21 19 25 3 0July 40 20 20 23 17 2 1August 45 25 20 30 15 4 1September 39 20 19 22 17 4 1October 40 20 20 19 21 2 2November 46 25 21 22 24 6 3December 36 15 21 17 19 3 4
Table 2 Seasonal distribution of acute pancreatitis (χ2 test for goodness of fit)
n (%) December-February March-May June-August September-November χ2 P n (%) n (%) n (%) n (%)
Total 549 116 (21.1) 179 (32.6) 129 (23.5) 125 (22.8) 17.5 0.001Males 285 (51.9) 52 (18.2) 100 (35.1) 68 (23.9) 65 (22.8) 17.05 0.001Females 264 (48.1) 64 (24.2) 79 (29.9) 61 (23.1) 60 (22.7) 3.55 0.316Biliary tract disease 286 (52.1) 56 (19.5) 94 (32.8) 73 (25.4) 64 (22.3) 11.02 0.011No bil. tract disease 263 (47.9) 60 (22.9) 85 (32.4) 56 (21.4) 61 (23.3) 7.93 0.049Chronic alcoholism 48 (8.7) 6 (12.5) 20 (41.7) 10 (20.8) 12 (25) 8.67 0.035Fatal cases 18 (3.2) 9 (50) 1 (5.6) 2 (11.1) 6 (33.3) 9.11 0.029
Table 3 Seasonal variation of acute pancreatitis (chronobiologic parameters by Fourier analysis)
n Period (h) PR (%) MESOR Amplitude Peak 95% CL P
Total 549 8766 51.1 March February-April 0.0064383 33.7 September August-October 0.017Overall 84.8 45.68 3.28 March February-April 0.005
Males 285 8766 42.6 March February-April 0.0304383 32.7 September NS 0.052Overall 75.4 23.71 9.06 March February-April 0.027
Females 264 8766 50.9 March February-April 0.0244383 22.3 September NS 0.121Overall 73.3 21.97 4.52 March February-April 0.035
Biliary tract disease 286 8766 42.2 March NS 0.0744383 19.5 August NS 0.234Overall 61.8 23.72 7.60 March NS 0.108
No bil. tract disease 263 8766 44.8 March February-April 0.0414383 25.1 October NS 0.119Overall 69.9 21.96 7.66 March NS 0.052
Chronic alcoholism 48 8766 13.2 March NS 0.4154383 40.7 September NS 0.109Overall 53.9 3.91 2.51 March NS 0.192
Fatal cases 18 8766 86.2 November November-December <0.0014383 10.9 June May-July 0.004Overall 97.1 1.50 1.90 November November-December <0.001
PR = percentage of rhythm (percentage of overall variability of data about arithmetic mean attributable to the rhythmic fittedfunction MESOR = midline estimated statistics of rhythm, the rhythm-adjusted mean over the time period analysed amplitude: halfthe distance between the absolute maximum and minimum of the function of the best-fitting curve 95% CL = 95% confidence limitsNS = not significant, (when acrophase did not reach the significance level, 95% CL could not be given).
Gallerani M et al. Seasonal variation of acute pancreatitis 3329

significantly lower than that of survived subjects (65±17 years,t = 2.20, P = 0.028). Among the subgroups of fatal events, 3 hadgallstones (16.6%, χ2 = 1.91 P = 0.178), and 4 had chronicalcoholism (22.2%, χ2 = 3.78 P = 0.075). Table 1 shows themonthly distribution by gender, and subgroups by risk factors.A peak of higher frequency of events was found in the periodMarch-May for the total samples and in particular for malesand subgroups of subjects with and without gallstones andchronic alcoholism (Table 2). The percentage of fatal eventswas significantly higher in December-February (n = 9, 17.3% ofacute pancreatitis observed in that period, 50% of total deaths,χ2 = 9.11, P = 0.029, compared to the other periods). Chronobiologic analysis (Table 3) showed the existence ofa circannual rhythmic variation characterized by a main peak inMarch (PR 84.8, 95% CL: February-April, P = 0.005), and asecondary peak in September. This pattern was confirmed alsofor subgroups by gender (men: PR 75.4, 95% CL: February-April, P = 0.027), and (women: PR 73.3, 95% CL: February-April,P = 0.035). Moreover, a highly significant peak was noticed forfatal cases in late November (PR 97.1, 95% CL: October-December, P<0.001). NO statistically significant trend for a peakin March was found for subgroups of subjects with or withoutcholelithiasis (respectively: PR 61.8, 95% CL: February-April,P = 0.109; and PR 69.9, 95% CL: February-April, P = 0.052).
DISCUSSIONIdentification of patients with acute pancreatitis is importantdue to the increased risk of death. To our knowledge, there was only one recent study inmedical literature, which aimed to evaluate the seasonalvariation in the onset of acute pancreatitis[20]. In a total of 263cases observed for a period of 9 years in a German hospital, nocorrelation between admissions and a specific month or seasonwas found, other earlier reports were mostly hypotheses[21,22].Our study instead showed a clear seasonal variation in theonset of acute pancreatitis characterized by a higher frequencyin the spring, with a maximum in March-May. This pattern wasparticularly evident for patients with cholelithiasis and chronicalcoholism. It is difficult to give an exhaustive explanation for sucha temporal pattern. Seasonal and circannual patterns have beenreported for the prevalence of Helicobacter pylori infection[14],or for relapses of inflammatory bowel disease for hospitaladmissions[15,23]. As for circadian aspects, some acute dramatic clinicalevents, e.g., variceal and gastrointestinal bleeding[24-26] showedobvious circadian patterns. Daily variations of some biologicfunctions have also been found as possible co-factors in severalgastrointestinal diseases, e.g., fibrinolysis in liver cirrhosis andesophageal varices[27], electrical uncoupling and ectopic pacemakeractivity in intestinal motor dysfunction[28], melatonin andduodenal ulcer[29,30], colonic motility in diverticular disease[31]
and rectal motor activity in constipation[32]. At present we do not know enough about seasonal biologicalchanges potentially affecting onset of acute pancreatitis, e.g.,secretion of pancreatic enzymes, biliary acids. However, it ispossible that variations in physiological functions with seasonalchange may be associated with an increased risk of pancreatitis.Oxygen free radicals, for example, were known to be a meaningfulindex for the severity of pancreatitis[33], but possible variationsin free radical generation have not been investigated yet. Ourresults seemed to be able to identify a higher mortality forcolder months (November-December). This is particularlyinteresting when considering that both the mean age of subjectsand the incidence of risk factors (gallstones, alcoholism) in thesubgroup of fatal cases were significantly lower compared withthose in the subgroup of non fatal events. Thus, it seems thatacute events of pancreatitis occurring in the colder months
may be more at risk in terms of severity and mortality. Furtherstudies conducted on larger samples and addressed to othercountries of different latitudes would be needed.
ACKNOWLEDGEMENTSThe authors thank Mr. Franco Guerzoni, from the StatisticalService of Ferrara St Anna Hospital, for his helpful assistancein collection of cases and analysis of data.
REFERENCES1 Gallerani M, Manfredini R, Ricci L, Grandi E, Cappato R,
Calo G, Pareschi PL, Fersini C. Sudden death from pulmonarythromboembolism: chronobiological aspects. Eur Heart J 1992;13: 661-665
2 Manfredini R, Gallerani M, Salmi R, Zamboni P, Fersini C.Fatal pulmonary embolism in hospitalized patien: evidence fora winter peak. J Int Med Res 1994; 22: 85-89
3 Gallerani M, Trappella G, Manfredini R, Pasin M, NapolitanoM, Migliore A. Acute intracerebral haemorrhage: circadianand circannual patterns of onset. Acta Neurol Scand 1994; 89:280-286
4 Gallerani M, Portaluppi F, Maida G, Chieregato A, Calzolari F,Trapella G, Manfredini R. Circadian and circannual rhythmic-ity in the occurrence of subarachnoid hemorrhage. Stroke 1996;27: 1793-1797
5 Manfredini R, Portaluppi F, Salmi R, Zamboni P, la Cecilia O,Kuwornu Afi H, Regoli F, Bigoni M, Gallerani M. Seasonalvariation in the occurrence of nontraumatic rupture of thoracicaorta. Am J Emerg Med 1999; 17: 672-674
6 Mehta HR, Manfredini R, Hassan F, Sechtem U, Bossone E, Oh JK,Cooper JV, Smith DE, Portaluppi F, Penn M, Hutchison S,Nienaber CA, Isselbacher EM, Eagle KA. Chronobiological pat-terns of acute aortic dissection. Circulation 2002; 106: 1110-1115
7 Gallerani M, Delli Gatti C, Salmi R, Kuwornu Afi H, la CeciliaO, Manfredini R. Seasonal variations in the incidence of cranialnerve paralysis. J Int Med Res 1999; 27: 130-133
8 Gallerani M, Govoni M, Mucinelli M, Bigoni M, Trotta F,Manfredini R. Seasonal variation in the onset of acute micro-crystalline arthritis. Rheumatology 1999; 38: 1003-1006
9 Gallerani M, Manfredini R. Seasonal variation in herpes zosterinfection. Br J Dermatol 2000; 142: 588-589
10 Manfredini R, Gallerani M, Portaluppi F. Seasonal variationin the occurrence of epistaxis. Am J Med 2000; 108: 759-760
11 Braverman DZ, Morali GA, Patz JK, Jacobsohn WZ. Is duode-nal ulcer a seasonal disease? A retrospective endoscopic studyof 3105 patients. Am J Gastroenterol 1992; 87: 1591-1593
12 Tivon K, Cohen P. Seasonality in duodenal ulcer disease: pos-sible relationship with circannually cycling neurons enclosed inthe biological clock. Am J Gastroenterol 1995; 90: 1189-1190
13 Thomopoulos KC, Katsakoulis EC, Margaritis VG, MimidisKP, Vagianos CE, Nikolopoulou VN. Seasonality in the preva-lence of acute upper gastrointestinal bleeding. J Clin Gastroenterol1997; 25: 576-579
14 Raschka C, Schorr W, Koch HJ. Is there seasonal periodicity inthe prevalence of Helicobacter pylori? Chronobiol Int 1999; 16:811-819
15 Sonnenberg A, Jacobsen SJ, Wasserman IH. Periodicity ofhospital admissions for inflammatory bowel disease. Am JGastroenterol 1994; 89: 847-851
16 Moum B, Aadland E, Ekbom A, Vatn MH. Seasonal variationsin the onset of ulcerative colitis. Gut 1996; 38: 376-378
17 Zeng L, Anderson FH. Seasonal change in the exacerbations ofCrohn’s disease. Scand J Gastroenterol 1996; 31: 79-82
18 Ott L, Memdenhall W, Larson R. Statistical test of hypotheses:the one sample case. In: Statistics. Boston , MA: Duxbury Press1978: 242-246
19 Mojon A, Fernandez JR, Hermida RC. Chronolab: an interactivesoftware package for chronobiologic time series analysis writtenfor the Macintosh computer. Chronobiol Int 1992; 9: 403-412
20 Lankisch PG, Assmus C, Pflichthofer D. The calendar andacute pancreatitis. Pancreas 1998; 16: 465-467
21 Poikolainen K. Seasonality of alcohol-related hospital admis-
3330 ISSN 1007-9327 CN 14-1219/ R World J Gastroenterol November 15, 2004 Volume 10 Number 22

sions has implications for prevention. Drug Alcohol Depend1982; 10: 65-69
22 Reimann HA. Letter: Three periodic diseases as causes ofrecurrent abdominal pain in childhood. Arch Dis Child 1976;51: 244
23 Minoli G, Imperiali G, Colombo E, De Franchis R, Mortara G,Prada A, Rocca F. Biphasic annual periodicity in relapses ofinflammatory bowel diseases. Gruppo di studio per le malattieinfiammatorie intestinale. J Clin Gastroenterol 1995; 21: 27-29
24 Manfredini R, Gallerani M, Salmi R, Calo G, Pasin M, BigoniM, Fersini C. Circadian variation in the time of onset of acutegastrointestinal bleeding. J Emerg Med 1994; 12: 5-9
25 Siringo S, Bolondi L, Sofia S, Hermida RC, Gramantieri L,Gaiani S, Piscaglia F, Carbone C, Misitano B, Corinaldesi R.Circadian occurrence of variceal bleeding in patients with livercirrhosis. J Gastroenterol Hepatol 1996; 11: 1115-1120
26 Mann NS, Hillis A, Mann SK, Buerk CA, Prasad VM. In cir-rhotic patients variceal bleeding is more frequent in the eveningand correlates with severity of liver disease. Hepatogastroenterology1999; 46: 391-394
27 Piscaglia F, Siringo S, Hermida RC, Legnani C, Valgimigli M,Donati G, Palareti G, Gramantieri L, Gaiani S, Burroughs AK,Bolondi L. Diurnal changes of fibrinolysis in patients with liver
cirrhosis and esophageal varices. Hepatology 2000; 31: 349-35728 Der T, Bercik P, Donnelly G, Jackson T, Berezin I, Collins SM,
Huizinga JD. Interstitial cells of cajal and inflammation-in-duced motor dysfunction in the mouse small intestine. Gastro-enterology 2000; 119: 1590-1599
29 Malinovskaya N, Komarov FI, Rapoport SI, VoznesenskayaLA, Wetterberg L. Melatonin production in patients with duode-nal ulcer. Neuroendocrinol Lett 2001; 22: 109-117
30 Kato K, Murai I, Asai S, Takahashi Y, Nagata T, Komuro S,Mizuno S, Iwasaki A, Ishikawa K, Arakawa Y. Circadianrhythm of melatonin and prostaglandin in modulation of stress-induced gastric mucosal lesions in rats. Aliment Pharmacol Ther2002; 16(Suppl 2): 29-34
31 Bassotti G, Battaglia E, Spinozzi F, Pelli MA, Tonini M. Twenty-four hour recordings of colonic motility in patients with diver-ticular disease: evidence for abnormal motility and propulsiveactivity. Dis Colon Rectum 2001; 44: 1814-1820
32 Rao SS, Sadeghi P, Batterson K, Beaty J. Altered periodic rec-tal motor activity: a mechanism for slow transit constipation.Neurogastroenterol Motil 2001; 13: 591-598
33 Park BK, Chung JB, Lee JH, Suh JH, Park SW, Song SY, Kim H,Kim KH, Kang JK. Role of oxygen free radicals in patients withacute pancreatitis. World J Gastroenterol 2003; 9: 2266-2269
Edited by Wang XL Proofread by Xu FM
Gallerani M et al. Seasonal variation of acute pancreatitis 3331

PO Box 2345, Beijing 100023, China World J Gastroenterol 2004;10(22):3332-3335Fax: +86-10-85381893 World Journal of GastroenterologyE-mail: [email protected] www.wjgnet.com Copyright © 2004 by The WJG Press ISSN 1007-9327
• CLINICAL RESEARCH •
Composite score of reflux symptoms in diagnosis of gastroesophageal
reflux disease
Jin-Hai Wang, Jin-Yan Luo, Lei Dong, Jun Gong, Ai-Li Zuo
Jin-Hai Wang, Jin-Yan Luo, Lei Dong, Jun Gong, Ai-Li Zuo,Department of Gastroenterology, Second Hospital of Xi’an JiaotongUniversity, Xi’an 710004, Shaanxi Province, ChinaSupported by Janssen Research Foundation of China (2001)Correspondence to: Dr. Jin-Hai Wang, Department of Gastroenterology,Second Hospital of Xi’an Jiaotong University, 710004, ShaanxiProvince, China. [email protected]: +86-29-7679290 Fax: +86-29-7231758Received: 2003-12-19 Accepted: 2004-02-01
Abstract
AIM: To evaluate the significance of the composite scoreof reflux symptoms in the diagnosis of gastroesophagealreflux disease (GERD), and to determine the relationshipof the composite score with reflux esophagitis (RE) andpathological gastroesophageal reflux (PGER).
METHODS: Upper digestive endoscopy and /or 24-hesophageal pH monitoring were performed in 244 subjects.Of these, 54 were consecutive patients attending our clinicwith symptoms suggestive of GERD, and 190 were randomlyselected from 2532 respondents who participated in ourprevious general population-based study on GERD. Astandardized questionnaire was used to classify both thefrequency and severity of typical symptoms of GERD(heartburn, acid and food regurgitation) using a 4-scorescale, and the composite score of main reflux symptoms(score index: SI, range from 0 to 18) were calculated forevery subject. RE was diagnosed according to the Savary-Miller criteria. Subjects with abnormal pH-metry (DeMeesterscore more than 14.7) were considered to have PGER.GERD patients were defined as the subjects with RE and/orPGER.
RESULTS: The sensitivity of SI in the diagnosis of GERDwas inversely associated with SI, but the specificity tendedto increase with increased SI. With the cut-off of 8, the SIachieved the highest accuracy of 70.0%, with a sensitivityof 78.6% and a specificity of 69.2% in diagnosing GERD,followed by the cut-off of 3, which had an accuracy of 62.1%,a sensitivity of 96.4% and a specificity of 34.6%. Theprevalence of RE, PGER and GERD was strongly associatedwith increased SI (P<0.01), but there was no significantassociation between the severity of RE and SI (P>0.05).Among patients with RE, 69.2% had PGER, and 30.8%were confirmed to have negative findings of pH monitoring.Among patients with PGER, 52.9% were identified to haveRE and 47.1% had negative endscopic findings inesophagus.
CONCLUSION: According to the composite score of mainreflux symptoms, the diagnosis of GERD can be made withoutfurther tests in most cases. However, 24-h esophageal pHmonitoring and upper digestive endoscopy are still indicatedin patients with mild and atypical symptoms.
Wang JH, Luo JY, Dong L, Gong J, Zuo AL. Composite score
of reflux symptoms in diagnosis of gastroesophageal refluxdisease. World J Gastroenterol 2004; 10(22): 3332-3335
http://www.wjgnet.com/1007-9327/10/3332.asp
INTRODUCTIONGastroesophageal reflux disease (GERD) is a very commondisorder both in China[1-2] and Western countries[3-8]. Thedisease results from the abnormal reflux of gastric contentsinto the distal esophagus causing symptoms in most patientsand subsequent mucosal damage in some patients. It has beenproved that chronic GERD tends to develop to Barrett’sesophagus associated with an increased risk of esophagealadenocarcinoma[9-13]. Heartburn and regurgitation are the typicalsymptoms of GERD, and 24-h esophagus pH monitoring andupper digestive endoscopy are the main methods to confirmthe diagnosis. These examinations, however, are inconvenientand not universal in many hospitals of China, especially 24-hesophagus pH monitoring. Although the relationship betweenreflux symptoms and GRED were evaluated by some clinicalstudies, the results varied considerably because the symptomswere quantified by different criteria and methods[3,14-16]. As far aswe know, data about the relationship between the combinationof main reflux symptoms and proven GERD are lacking. The aimof this study was to establish a standard system to quantifythe severity and frequency of typical reflux symptoms, and toevaluate the role of the composite score of main reflux symptomsin the diagnosis of GERD, and to determine the associationbetween the composite score and reflux esophagitis (RE),pathological gastroesophageal reflux (PGER), and GERD.
MATERIALS AND METHODSSubjectsTwo hundred and forty-four subjects were included in thisstudy. Among these, 54 were consecutive patients (32 men and22 women; mean age, 45.3±13.2 years) who attended our clinicwith symptoms suggestive of GERD and underwent both 24-hesophageal pH monitoring and upper digestive endoscopy.The remaining 190 subjects were randomly selected from 2532respondents who were previously enrolled in our generalpopulation-based study on GERD, according to the compositescore (score index, SI) of main reflux symptoms (Table 1), andwho underwent 24-h esophageal pH monitoring (50 subjects)or/and upper digestive endoscopy (140 subjects). Patients withprevious foregut surgery and other systemic disorders affectingthe gastrointestinal motility were excluded. Five selectedrespondents (3 in the normal group and 1 in the mild symptomgroup) refused to participate in this study, 1 (normal group)had intolerance to pH monitoring, and 1(normal group) did notcomplete the evaluation. All of the 7 incomplete respondentswere replaced by our clinic patients with same gender, SI, andsimilar age (±5 years). There were no appreciable differences inage or gender among these groups (P>0.05).
QuestionnaireA standardized questionnaire based on our previous work was

used to classify both the frequency and severity of typicalsymptoms of GERD (heartburn, acid regurgitation and foodregurgitation) for all subjects before pH monitoring and upperdigestive endoscopy. Personal interviews were carried out inour clinic with patients and respondents.
EndoscopyGeneral upper digestive endoscopy was performed using aPentax videoendoscope, and the same two gastrointestinalphysicians made the diagnosis according to VHS videocassettesrecorded.
Twenty-four hour esophageal pH monitoringTwenty-four hour ambulatory esophageal pH monitoring wasperformed using a Synectic device. The pH electrode shouldbe positioned 5 cm above the lower esophageal sphincter.Subjects were instructed to fill in diary cards regarding the timeof meals, supine position and the time of symptoms experiencedduring the 24-h period. In addition, they were asked to press abutton on the digital data logger at the beginning of eachsymptom episode. No restrictions were imposed on food andbeverage intake or smoking.
DefinitionsThe following definitions for symptom categories and diseaseswere used. Only symptoms occurring in the past year beforethe interview were considered. Heartburn was defined as aburning pain or burning sensation behind the breastbone inthe chest, acid regurgitation as a bitter or sour-tasting fluidcoming into throat or mouth, food regurgitation as eaten foodscoming into mouth. Heartburn, acid regurgitation and foodregurgitation were considered to be the typical symptoms ofGERD. Each of these symptoms was estimated according to itsseverity and frequency measured on a 4-score scale. Severitywas assessed as follows: 0, none; 1, mild (could be ignored); 2,moderate (could not be ignored but did not affect lifestyle); 3,severe (affected lifestyle). The score of symptom frequencywas estimated as follows: 0, none or less than one occasion permonth on average; 1, several occasions (once to three times) amonth; 2, several occasions (once to six times) a week; 3, oneor more daily occasions. Based on the scores of severity andfrequency of the main GERD symptoms, the composite score(SI: ranged from 0 to 18) of every subject was calculated. Allsubjects were grouped as follows: SI = 0-2, normal; SI = 3-7,
mild; SI = 8-12, moderate; SI R13, severe. Patients withsymptomatic gastroesophageal reflux disease(SGERD) weredefined as subjects with SI R3. Those with RE were definedas subjects whose endoscopic findings met Savary-Millercriteria, those with PGER as subjects with abnormal pH-metry(DeMeester score more than 14.7), those with GERD as subjectswith RE and/or PGER.
Statistical analysisData were analyzed with descriptive statistics and expressedas mean±SD. Median values and ranges were used fornonparametric variables. Relative proportions were calculatedfor the analysis of prevalence and relative frequencies. Thecomparison between groups was performed by means ofparametric tests such as the Student’s t test for dimensionalvariables and χ2 test for non-dimensional variables. The criticaltwo-tailed value of alpha was set at 0.05.
RESULTS
Relationship between SI and its diagnostic accuracy for GERDAmong the 54 outpatients with symptoms suggestive of GERD,28 patients (51.9%) were identified as GERD (16 patients withRE, 12 patients with PGER, 10 patients with RE and PGER), and26 patients (48.1%) were normal, based on the findings of upperdigestive endoscopy and 24-h esophageal pH monitoring.Figure1 summarizes the relationship between criteria and itsdiagnostic accuracy for GERD compared with the diagnosis ofendoscopy and pH monitoring. The sensitivity was inverselyassociated with increased SI, but the specificity tended to behigher with increased SI. The SI 8 had the highest accuracy(70.0%) for diagnosing GERD with a sensitivity of 78.6% and aspecificity of 69.2%, followed by SI 3 with a accuracy of62.1%, a sensitivity of 96.4% and a specificity of 34.6%.
Relationship between SI and RE, PGER, GERDAs shown in Table 2, the rate of RE was the highest in the severegroup, followed by moderate, mild and normal groups, and theresults were similar to both PGER and GERD. The rate of RE,PGER and GERD was strongly associated with increased SI. Inthe severe and moderate groups, the frequency of RE, PGERand GERD was significantly higher than that of the normalgroup (P<0.05 or P<0.01).
Table 1 Gender and age distribution of 190 subjects in symptom severity groups
Severity of Responders Upper digestive endoscopy 24-h pH monitoringsymptoms
Subjects Men/Women Mean age (yr) Subjects Men/Women Mean age (yr)
Normal 2 102 40 17/23 45.5±9.9 15 8/7 45.3±10.4Mild 332 40 20/20 46.1±14.4 15 6/9 46.5±13.3Moderate 74 40 18/22 47.4±9.6 10 5/5 47.4±10.6Severe 24 20 11/9 49.1±10.2 10 4/6 49.7±11.5Total 2 532 140 66/74 47.0±11.0 50 23 /27 47.2±11.5
Table 2 Relationship between SI and RE, PGER, GERD
Endoscopic examination pH monitoring Endoscopic or/and pH examinationCriteria of SI
Subjects RE (%) Subjects PGER (%) Subjects GERD (%)
Normal (SI = 0-2) 40 0 (0.0) 15 0 (0.0) 55 0 (0.0)Mild (SI = 3-7) 40 3 (7.5) 15 2 (13.3) 52 4 (7.69)Moderate (SI = 8-12) 40 11 (27.5)b 10 4 (40.0)a 45 12 (26.7)b
Severe (SI 13) 20 13 (66.5)b 10 6 (60.0)b 24 13 (54.2)b
aP<0.05 and bP<0.01 vs normal group.
Wang JH et al. Composite score of reflux symptoms in diagnosing GERD 3333

Figure 1 Relationship between SI and its diagnostic accuracy.
Figure 3 The relationship between RE and PGER.
Relationship between SI and degree of RERE was diagnosed in a total of 43 patients on the basis ofendoscopic findings (16 cases were outpatients and 27 casescame from general subjects). Thirty patients were males and 13were females. The mean age was 55.3±6.8 years. Table 3 showsthe relationship between SI and the severity of RE. The SI wassimilar among all groups (from grade I to grade IV, P>0.05). Figure 2illustrates endoscopic photographs of some patients with RE.
Table 3 Relationship between severity of symptoms and gradeof RE
Severity of RE Patients SI (mean±SD)
Grade I 19 10.63±4.74 Grade II 13 11.32±5.26 Grade III 7 11.85±5.11 Grade IV 4 12.00±4.12
Relationship between RE and PGEROf the 43 patients with RE, 26 patients underwent 24-hesophageal pH monitoring. Eighteen patients with RE (69.2%)complicated by PGER and 8 patients (30.8%) were confirmed to
have negative pH monitoring. Upper gastrointestinal tractendoscopy was performed in 34 patients with PGER, of them,18 (52.9%) were identified to have RE, but the remaining 16 (47.1%)patients were proven to have a negative endoscopic finding inthe esophagus. The results are summarized in Figure 3.
DISCUSSIONGastroesophageal reflux disease is a common disease with manytypical and atypical symptoms. A low pressure exerted by thelower esophageal sphincter (LES) and an increased frequencyof transient LES relaxation might contribute to the developmentof GERD[17-19]. Esophageal testing, particularly 24-h pHmonitoring has become the key to make the diagnosis and toensure adequate acid suppression or prior to surgical therapy[20].Although the test could yield accurate and reliable information,it is inconvenient for patients. The problem is whether allpatients require 24-h esophageal pH monitoring to establishthe diagnosis of GERD. If so, its use, however, is not popularand many hospitals in China are unable to perform this specialtesting. For these reasons, we are trying to develop a standardsystem to quantify the symptoms and to evaluate the accuracyof the combination of typical reflux symptoms in the diagnosisof GERD with the hope of eliminating the need for the monitoring. Laboratory studies have demonstrated that there is a closerelationship between classic reflux symptoms and esophagealacid exposure, but some clinical studies revealed that thesesymptoms were neither specific nor sensitive to the diagnosisof GERD[15,21-23]. For example, Tefera and his colleagues[21]
reported that moderate or severe heartburn could be used todiagnose GERD with a sensitivity of 68.42% and a specificity of62.96%, and moderate or severe regurgitation with a sensitivityof 56.76% and a specificity of 65.08%. There were some commongrounds in these clinical studies. These symptoms were evaluatedseparately. The frequency of each symptom was quantified but theseverity was not considered. In our study, every typical symptomwas estimated by quantifying both the frequency and the severity,and a combination score (SI) of all symptoms was calculated forevery subject to exclude those subjects with trivial symptomsand to improve the accuracy of SI in the diagnosis of GERD. We found that the sensitivity of the composite score of mainreflux symptoms in the diagnosis of GERD was inverselyassociated with increased SI, but the specificity tended to behigher with increased SI. SI 8 had the highest accuracy of70.0% for diagnosing GERD with a sensitivity of 78.6% and aspecificity of 69.2%, followed by SI 3 with an accuracy of62.1%, a sensitivity of 96.4%, and a specificity of 34.6%.Because SI 3 had the highest sensitivity, this criterion is thecommon choice in epidemiological studies. With the highestaccuracy, SI 8 is very useful for diagnosing GERD in clinicalwork. We, therefore, prompted to develop a criterion based on themain reflux symptoms. The standardized symptom questionnaireand the scoring techniques (system) are important for
Figure 2 Endoscopic photographs of some patients with RE. A: Female, 46 years old, SI = 12, grade I RE; B: Male, 50 years old,SI = 16, grade II RE; C: Male, 42 years old, SI = 12, grade III RE; D: Male, 51 years old, SI = 13, grade IV RE.
120
100
80
60
40
20
01 3 8 12
Sensitivity
Specifity
Accuracy
120
100
80
60
40
20
0
RE without PGER or
PGRE without RE
RE with PGER or
PGRE with RE
RE (n = 26) PGER (n = 34)
%A B C D
3334 ISSN 1007-9327 CN 14-1219/ R World J Gastroenterol November 15, 2004 Volume 10 Number 22

gastroenterological doctors to estimate the patients with typicalreflux symptoms, especially in hospitals or clinics without objectivetests. We suggest that patients with SI 8 may be treatedpharmaceutically combined with life style counseling. If thesymptoms have not improved after 6 to 12 wk, 24-h pH monitoringand/or endoscopical examination should be performed, and ifnecessary, barium radiographing and manometry should be done. Our study showed that the prevalence of RE, PGER andGERD was strongly associated with increased SI, but nosignificant association was found between the severity of REand SI, indicating that patients with more severe reflux symptomstend to have GERD, but the grade of esophagitis could not beevaluated on the basis of the severity of typical symptoms. The present study also revealed that almost one third ofpatients with RE (30.8%) were confirmed to have negative pHmonitoring and half of patients with PGER (47.1%) had negativeendoscopic findings in the esophagus, the results were similarto previous studies[24-26]. Excessive bile exposure of esophagealmucosa was the main cause of RE with normal acid exposure[27-29].We suggest that endoscopy-negative reflux disease (ENRD)should be treated as endoscopy positive GERD because longtermacid exposure would rapidly damage esophageal mucosa. Patients with atypical symptoms such as cough, asthma,hoarseness, chest pain, and ear, nose and throat symptomswere not included in this study because they always had theirfirst visit at specialized services. According to some studiesthe prevalence of GERD in patients with atypical symptomsranged from 25% to 80%. We suggest that diagnostic testssuch as upper digestive endoscopy and 24-h pH monitoringare a necessity for patients with atypical symptoms. In conclusion, developing a criterion based on the compositescore of typical reflux symptoms is useful to the diagnosis ofGERD. Symptom questionnaire and scoring techniques are animportant step in this analysis. For patients with a moderate orsevere composite score, the diagnosis of GERD can be madewithout further tests in most situations. However, 24-h esophagealpH monitoring is still needed in patients with mild and atypicalsymptoms.
REFERENCES1 Lim LG, Ho KY. Gastroesophageal reflux disease at the turn of
millennium. World J Gastroenterol 2003; 9: 2135-21362 Pan GZ, Xu GM, Ke MY, Han SM, Guo HP, Li ZS, Fang XC,
Zou DW, Lu SC, Liu J. Epidemiological study of symptomaticgastroesophageal reflux disease in China: Beijing and Shanghai.Chin J Dig Dis 2000; 1: 2-8
3 Kennedy T, Jones R. The prevalence of gastro-oesophagealreflux symptoms in a UK population and the consultationbehaviour of patients with these symptoms. Aliment PharmacolTher 2000; 14: 1589-1594
4 Locke GR III, Talley NJ, Fett SL, Zinsmeister AR, Melton LJ III.Prevalence and clinical spectrum of gastroesophageal reflux: apopulation based study in Olmsted County. Gastroenterology1997; 112: 1448-1456
5 Talley NJ, Zinsmeister AR, Schleck CD, Melton LJ III. Dyspep-sia and dyspepsia subgroups: a population-based study. Gas-troenterology 1992; 102: 1259-1268
6 Talley NJ, Boyce P, Jones M. Identification of distinct upperand lower gastrointestinal symptom groupings in an urbanpopulation. Gut 1998; 42: 690-695
7 Isolauri J, Laippala P. Prevalence of symptoms suggestive ofgastro-oesophageal reflux disease in an adult population. AnnMed 1995; 27: 67-70
8 Louis E, DeLooze D, Deprez P, Hiele M, Urbain D, PelckmansP, Deviere J, Deltenre M. Heartburn in Belgium: prevalence,impact on daily life, and utilization of medical resources. Eur JGastroenterol Hepatol 2002; 14: 279-284
9 Bytzer P, Christensen PB, Damkier P, Vinding K, Seersholm N.
Adenocarcinoma of the esophagus and Barrett’s esophagus: apopulation-based study. Am J Gastroenterol 1999; 94: 86-91
10 Falk GW. Barrett’s esophagus. Gastroenterology 2002; 122:1569-1591
11 Buttar NS, Wang KK, Leontovich O, Westcott JY, Pacifico RJ,Anderson MA, Krishnadath KK, Lutzke LS, Burgart LJ.Chemoprevention of esophageal adenocarcinoma by COX-2inhibitors in an animal model of Barrett’s esophagus. Gastroen-terology 2002; 122: 1101-1112
12 Shirvani VN , Ouatu-Lascar R, Kaur BS, Omary MB,Triadafilopoulos G. Cyclooxygenase 2 expression in Barrett’sesophagus and adenocarcinoma: Ex vivo induction by bile saltsand acid exposure. Gastroenterology 2000; 118: 487-496
13 Sampliner RE. Practice guidelines on the diagnosis, surveillance,and therapy of Barrett’s esophagus. Am J Gastroenterol 1998; 93:1028-1033
1 4 Klauser AG, Schindlbeck NE, Muller-Lissner SA. Symptoms ingastro-oesophageal reflux disease. Lancet 1990; 335: 205-208
15 Costantini M, Crookes PF, Bremner RM, Hoeft SF, Ehsan A,Peters JH, Bremner CG, DeMeester TR, Calif LA. Value ofphysiologic assessment of foregut symptoms in a surgicalpractice. Surgery 1993; 114: 780-787
16 Ho KY, Kang JY, Seow A. Prevalence of gastrointestinal symp-toms in a multiracial Asian population, with particular referenceto reflux-type symptoms. Am J Gastroenterol 1998; 93: 1816-1822
17 Grossi L, Ciccaglione AF, Travaglini N, Marzio L. Transientlower esophageal sphincter relaxations and gastroesophagealreflux episodes in healthy subjects and GERD patients during24 hours. Dig Dis Sci 2001; 46: 815-821
18 Kahrilas PJ, Shi G, Manka M, Joehl RJ. Increased frequency oftransient lower esophageal sphincter relaxation induced bygastric distention in reflux patients with hiatal hernia. Gastro-enterology 2000; 118: 688-695
19 Cadiot G, Bruhat A, Rigaud D, Coste T, Vuagnat A, BenyedderY, Vallot T, Le Guludec D, Mignon M. Multivariate analysis ofpathophysiological factors in reflux oesophagitis. Gut 1997;40: 167-174
20 Ueno M, Hongo M. Clinical significance of 24-hour intraesophagealpH monitoring in GERD patients. Nippon Rinsho 2000; 58:1818-1822
21 Tefera L, Fein M, Ritter MP, Bremner CG, Crookes PF, PetersJH, Hagen JA, DeMeester TR. Can the combination of symp-toms and endoscopy confirm the presence of gastroesophagealreflux disease? Am Surg 1997; 63: 933-936
22 Colas-Atger E, Bonaz B, Papillon E, Gueddah N, Rolachon A,Bost R, Fournet J. Relationship between acid reflux episodesand gastroesophageal reflux symptoms is very inconstant. DigDis Sci 2002; 47: 645-651
23 Ott DJ, McManus CM, Ledbetter MS, Chen MY, Gelfand DW.Heartburn correlated to 24-hour pH monitoring and radio-graphic examination of the esophagus. Am J Gastroenterol 1997;92: 1827-1830
24 Arango L, Angel A, Molina RI, Marquez JR. Comparison betweendigestive endoscopy and 24-hour esophageal pH monitoring forthe diagnosis of gastroesophageal reflux esophagitis: “presenta-tion of 100 cases”. Hepatogastroenterology 2000; 47: 174-180
25 Chan CC, Lee CL, Wu CH. Twenty-four-hour ambulatoryesophageal pH monitoring in patients with symptoms of gas-troesophageal reflux. J Formos Med Assoc 1997; 96: 874-878
26 Quigley EM. Non-erosive reflux disease: part of the spec-trum of gastro-oesophageal reflux disease, a component offunctional dyspepsia, or both? Eur J Gastroenterol Hepatol2001; 13(Suppl 1): S13-18
2 7 Kauer WK, Peters JH, DeMeester TR, Ireland AP, Bremner CG,Hagen JA. Mixed reflux of gastric and duodenal juices is moreharmful to the esophagus than gastric juice alone. The need forsurgical therapy re-emphasized. Ann Surg 1995; 222: 525-531
28 Lin KM, Ueda RK, Hinder RA, Stein HJ, DeMeester TR. Etiol-ogy and importance of alkaline esophageal reflux. Am J Surg1991; 162: 553-557
29 Vaezi MF, Richter JE. Role of acid and duodenogastroesophagealreflux in gastroesophaeal reflux disease. Gastroenterology 1996;111: 1192-1199
Edited by Wang XL Proofread by Zhu LH and Xu FM
Wang JH et al. Composite score of reflux symptoms in diagnosing GERD 3335

PO Box 2345, Beijing 100023, China World J Gastroenterol 2004;10(22):3336-3338Fax: +86-10-85381893 World Journal of GastroenterologyE-mail: [email protected] www.wjgnet.com Copyright © 2004 by The WJG Press ISSN 1007-9327
• CLINICAL RESEARCH •
Clinical characteristics and prognostic factors of severe acute
pancreatitis
Lei Kong, Nn Santiago, Tian-Quan Han, Sheng-Dao Zhang
Lei Kong, Nn Santiago, Tian-Quan Han, Sheng-Dao Zhang,Shanghai Institute of Digestive Surgery, Department of Surgery, RuijinHospital, Shanghai Second Medical University, Shanghai 200025,ChinaCorrespondence to: Dr. Tian-Quan Han, Department of Surgery,Ruijin Hospital, Shanghai Second Medical University, ShanghaiInstitute of Digestive Surgery, 197 Ruijin II Road, Shanghai 200025,China. [email protected]: +86-21-64373909 Fax: +86-21-64373909Received: 2004-04-22 Accepted: 2004-04-29
Abstract
AIM: To investigate the clinical characteristics and prognosticfactors of a consecutive series of patients with severe acutepancreatitis (SAP).
METHODS: Clinical data of SAP patients admitted to ourhospital from January 2003 to January 2004 were retrospectivelyreviewed. Collected data included the age, gender, etiology,length of hospitalization, APACHE II score at admission,local and organ/systemic complications of the patients.
RESULTS: Of the 268 acute pancreatitis patients, 94 developedSAP. The mean age of SAP patients was 52 years, thecommonest etiology was cholelithiasis (45.7%), the meanlength of hospitalization was 70 d, the mean score ofAPACHE II was 7.7. Fifty-four percent of the patients developednecrosis, 25% abscess, 58% organ/systemic failure. A totalof 23.4% (22/94) of the SAP patients died. Respiratory failurewas the most common organ dysfunction (90.9%) in deceasedSAP patients, followed by cardiovascular failure (86.4%),renal failure (50.0%). In the SAP patients, 90.9% (20/22)developed multiple organ/systemic failures. There weresignificant differences in age, length of hospitalization,APACHE II score and incidences of respiratory failure, renalfailure, cardiovascular failure and hematological failurebetween deceased SAP patients and survived SAP patients.By multivariate logistic regression analysis, independentprognostic factors for mortality were respiratory failure,cardiovascular failure and renal failure.
CONCLUSION: SAP patients are characterized by advancedage, high APACHE II score, organ failure and their death ismainly due to multiple organ/systemic failures. In patientswith SAP, respiratory, cardiovascular and renal failures canpredict the fatal outcome and more attention should be paidto their clinical evaluation.
Kong L, Santiago N, Han TQ, Zhang SD. Clinical characteristicsand prognostic factors of severe acute pancreatitis. World J
Gastroenterol 2004; 10(22): 3336-3338
http://www.wjgnet.com/1007-9327/10/3336.asp
INTRODUCTIONAcute pancreatitis, as a relatively common pancreatic disease,
can be found in every part of the world with an incidence of35-80 cases per 100 000 inhabitants per year[1,2]. According toAtlanta Classification, acute pancreatitis is clinically classifiedinto a mild or severe type depending on the presence of localand systemic complications[3]. Severe acute pancreatitis (SAP)is characterized by high morbidity and mortality. The mortalityof SAP patients varies from 7% to 47%[4]. The factors mostclosely linked to a poor prognosis are pancreatic necrosis,infection and multiple organ/systemic failures, which areassociated with a mortality of 50%[4-7]; although in recent yearsthis mortality rate has tended to decrease[8]. Many attempts havebeen made to achieve an early prognosis of SAP. However,none seems to be reliable enough to justify its routine use. In view of the high mortality associated with SAP, it isimportant to identify the cases that require close monitoringand aggressive resuscitation. The aim of this study was thereforeto investigate the clinical characteristics and factors which couldpredict the outcome of patients with organ/systemic failureadmitted to our hospital.
MATERIALS AND METHODSClinical dataFrom January 2003 to January 2004, the clinical histories ofpatients with acute pancreatitis (AP), admitted to the Departmentof Surgery, Ruijin Hospital of Shanghai Second Medical University,were retrospectively reviewed. The diagnosis of AP was establishedin cases with clinical presentations and biochemical findingswhen other causes were excluded. The severities of AP were assessedaccording to the Atlanta classification system[3]. Etiology wasdivided into two groups: cholelithiasis and non-cholelithiasis.A biliary etiology was confirmed by ultrasonography, CT scan,ERCP, MRCP and operation. Pancreatic necrosis and abscesswere defined by the findings on contrast-enhanced CT scan orin operation. The local and organ/systemic complications weredefined according to the Atlanta classification system[3, 9]. The patients with SAP were divided according to theiroutcomes into two groups: deceased group and survived group.The data recorded for each patient included age, gender, etiology,length of hospitalization, APACHE II score at admission andthe presence and type of local and organ/systemic complications.The relationship between clinical characteristics, specific singleor multiple organ/systemic failures with mortality was evaluatedin above-mentioned two groups.
Statistical analysisResults were expressed as mean±SD. Statistical studies weremade using SAS 6.12. Continuous data were evaluated by t rest,and categorized data were analyzed by Chi-square test or Fisher’sexact test. To identify the risk factors for SAP, multiple logisticregression analysis with backward elimination was used. P<0.05was considered statistically significant.
RESULTSOf the 268 patients with AP, 35.1% (94/268) developed SAP. Ofthe 94 SAP patients, 23.4% (22/94) died. The patients in thedeceased group were significantly older and had a higher

APACHE II score than those in the survived group. The lengthof hospitalization was significantly shorter in those with a fataloutcome. There was no difference in etiology or gender (Table 1). Regarding the local complications, the incidences of necrosisand abscess were significantly higher in the survived group thanthose in the deceased group. No patient in the deceased groupdeveloped pseudocysts (Table 2).
Table 1 Comparison of clinical characteristics (mean±SD)
Characteristics Survival Deceased Total (n = 72) (n = 22) (n = 94)
Mean age (yr) 49.7±14.9b 62.8±14.4 52.7±15.8(range) (15-82) (42-83) (15-83)Gender(male/female) 45/27 10/12 55/39Etiology(biliary/non-biliary) 31/41 12/10 43/51Hospitalization (d) 84.4±65.3b 26.2±28.2 70.8±63.7(range) (8-253) (1-94) 1-253)APACHE II score 6.3±3.5b 12.5±6.8 7.72±5.2(range) (0-14) (1-33) (0-33)
bP<0.01 vs deceased group.
Table 2 Comparison of local complications
Local complications Survival Deceased Total(n=72) (n=22) (n=94)
Necrosis, n (%) 47 (5.3)b 7 (31.8) 54 (57.4)Abscess, n (%) 23 (31.4)a 2 (9.1) 25 (26.6)Pseudocyst, n (%) 11 (15.3) 0 (0) 11 (11.7)
aP<0.05, bP<0.01 vs deceased group.
A total of 61.7% (58/94) patients with SAP developed organ/systemic failures. In the deceased group, 90.9% (20/22) patientsshowed multiple organ/systemic failures (maximum 5 organ/systemicfailures), only 18.1% (13/94) patients showed multiple organ/systemicfailures in the survived group (Tables 3, 4). With regard to theorgan/systemic complications, we found that the deceased groupexperienced a significantly greater incidence of episodes ofrespiratory failure, acute renal failure, cardiovascular failureand hematological failure than the survived group (Table 4).
Table 3 Comparison of the number of organ/systemic failure
Number of organ/ Survival Deceased Totalsystemic failure (n=72) (n=22) (n=94)
1, n (%) 23 (31.9)a 2 (9.1) 25 (26.6)2, n (%) 10 (13.9) 6 (4.5) 16 (17.0)3, n (%) 3 (4.2)a 4 (18.2) 7 (7.4)4, n (%) 0 (0)b 7 (31.8) 7 (7.4)5, n (%) 0 (0)a 3 (13.6) 3 (3.2)Total, n (%) 36 (50.0)b 22 (100.0) 58 (61.7)
aP<0.05, bP<0.01 vs deceased group.
As for the frequency of different specific single organfailures, pulmonary failure occurred in 35.1% (33/94) patients,cardiovascular failure in 22.3% (21/94) patients, gastrointestinalfailure in 19.1% (18/94) patients, hepatic failure in 15.9% (15/94)and renal failure in 14.9% (14/94) patients. The incidences ofneurologic and hematological failures were relatively lower,only in 8.5% (8/94) patients respectively (Table 5). Logistic regression analysis was carried out for the independentprognostic factors including all the variables studied. Respiratoryfailure, cardiovascular failure and renal failure were found to beindependent prognostic factors of the mortality in SAP patients(Table 6).
Table 4 Comparison of the features of organ/systemic failure
Organ/systemic failure Survival Deceased Total (n=72) (n=22) (n=94)
Multiple organ/systemic 13 (18.1)b 20 (90.9) 33 (35.1)failures n (%)Respiratory n (%) 13 (18.1)b 20 (90.9) 33 (35.1)Renal n (%) 3 (4.2)b 11 (50.0) 14 (14.9)Gastrointestinal n (%) 11 (15.3) 7 (31.8) 18 (19.1)Hepatic n (%) 12 (16.7) 3 (13.6) 15 (15.9)Neurologic n (%) 6 (8.3) 2 (9.1) 8 (8.5)Cardiovascular n (%) 2 (2.8)b 19 (86.4) 21 (22.3)Hematological n (%) 2 (2.8)b 6 (27.3) 8 (8.5)
bP <0.01 vs deceased group.
Table 5 Frequency of organ/systemic failure
Organ/systemic Number of Frequency (%)organ/systemic failure
Respiratory 33 35.1Renal 14 14.9Gastrointestinal 18 19.1Hepatic 15 15.9Neurologic 8 8.5Cardiovascular 21 22.3Hematological 8 8.5
Table 6 Independent factors of the logistic regression model
Variable OR OR 95% confidence P interval
Respiratory failure 186.5 9.942-999.0 0.006Cardiovascular failure 29.9 2.243-999.0 0.021Renal failure 118.7 3.784-999.0 0.029Hospitalization, days 0.957 0.908-0.989 0.037
DISCUSSIONMost deaths of SAP patients were mainly related to multipleorgan/systemic failures[10]. Regarding the survival time, patientsdied more often of multiple organ/systemic failures in the first fewdays after admission[5,11]. In the early phase of SAP, multipleorgan/systemic failures seemed to be caused by cytokine andinflammatory mediators released due to systemic inflammatoryresponse syndrome, and sterile pancreatic necrosis might evenoccur[12]. Early deaths of SAP patients were commonly associatedwith multiple organ/systemic failure, accounting for 40-60% ofmortality, and over the past decade this proportion has notdeclined[13]. The present study showed that in the deceased group90.9% (20/22) patients developed multiple organ/systemicfailure and 50% (11/22) patients died within 2 wk after admission. Previous studies[14-16] showed that in SAP patients, organ/systemic failure occurred in 72-90.3%, single organ failure in24.7-37%, multiple organ failure in 35-65.6%. Among the singleorgan failures, respiratory failure was the most common organ/systemic complications (39.1-63%), followed by cardiovascularfailure (23-37.7%), hepatic failure (20.7%) and renal failure(8.5-13%). The present data showed that organ failure occurredin 61.7% (58/94) patients, single organ failure in 26.6% (25/94)patients, and multiple organ failure in 38.3% (36/94) patients.Respiratory failure was the most common single organ failure(35.1%, 33/94), followed by cardiovascular failure (22.3%, 21/94),gastrointestinal failure (19.1%, 18/94), hepatic failure (15.9%,15/94) and renal failure (14.9%, 14/94). In a recent study, fiveindependent prognostic factors for hospital mortality in SAPpatients were the age and chronic health situation of the patientsand organ failures (renal, respiratory and cardiovascular)[4]. Inour study, respiratory failure, cardiovascular failure and renalfailure were shown to be the independent prognostic factors of
Kong L et al. Characteristics and prognostic factors of pancreatitis 3337

mortality by multivariate logistic analysis, which are consistentwith the reports by Fernandez-Cruz et al. and Halonen et al.[6, 17].Apparently, the development of one of the above-mentionedcomplications is by far the worst prognostic factor in SAP, closelyrelated to mortality. Up to now, the development of pancreatic necrosis andinfection has been considered as an important factor in theoccurrence of multiple organ/systemic failure and subsequentdeath[6,18,19]. There are even studies relating the site and extentof necrosis to the outcome and development of multiple organfailures[18,20]. In other studies, infected pancreatic necrosis andcombined of organ/systemic failures were the most significantcauses for hospital mortality of SAP patients[1,21]. The mortalityrate of SAP patients was 7-47% (that of sterile necrotizingpancreatitis patients was 6-13% and SAP patients with infectednecrosis was 14-80%)[4,22-26]. Conversely, there was a higherproportion of patients with necrosis and abscess in the survivedgroup in our study. Using logistic regression analysis failed toidentify necrosis and abscess as independent prognosticfactors for mortality, although statistically significant differencewas found between survived and deceased groups. Thissuggested that, rather than the development of necrosis or abscessitself, necrosis and abscess were not correlated with an increasedmortality. The main factor indicating a poor prognosis in SAP wasthe development of multiple organ/systemic failures[27,28]. Although there was a higher incidence of pseudocysts inthe survived group, no statistically significant difference wasfound compared with the deceased group. This observation mustbe made cautiously, because 50% (11/22) of the patients indeceased group died within 2 wk, which might be too short todevelop a pseudocyst. In addition, in many patients the onlycomplication was a pseudocyst, so they were classified as havingSAP according to the Atlanta Criteria, although their clinicalrecovery was excellent[3]. Patients with pseudocysts may developcomplications, but since it takes at least 4 wk to develop apseudocyst, it has no effect on early mortality. Our results did not show that age was an independent poorprognosis factor in mortality, which was consistent with previousstudies, but in contradiction to other investigators[4,6,]. Whendeaths due to complications of acute pancreatitis were analyzed,the mortality rate was not significantly different between theyoung and elderly groups. Moreover, the complication rate andthe proportion of patients with SAP (judged by the number ofprognostic signs) were not higher in the elderly. Thus theseverity of acute pancreatitis was not intrinsically due toadvanced age when the influence of other secondary factorswas not taken into consideration. In conclusion, SAP patients are characterized by advancedage, high APACHE II score at admission, development oforgan/systemic failure, and their death is mainly due to multipleorgan/systemic failures. In SAP patients, respiratory, cardiovascularand renal failures can predict their fatal outcome and moreattention should be paid to their clinical evaluation.
REFERENCES1 Steinberg W, Tenner S. Acute pancreatitis. N Engl J Med 1994;
330: 1198-12102 Company L, Saez J, Martinez J, Aparicio JR, Laveda R, Grino
P, Perez-Mateo M. Factors predicting mortality in severe acutepancreatitis. Pancreatology 2003; 3: 144-148
3 Bradley EL. A clinically based classification system for acutepancreatitis, 3rd. Summary of the international symposium onacute pancreatitis, Atlanta, Ga, September 11 through 13, 1992.Arch Surg 1993; 128: 586-590
4 Halonen KI, Leppaniemi AK, Puolakkainen PA, Lundin JE,Kemppainen EA, Hietaranta AJ, Haapiainen RK. Severe acute
pancreatitis: prognostic factors in 270 consecutive patients.Pancreas 2000; 21: 266-271
5 Baron TH, Morgan DE. Acute necrotizing pancreatitis. N EnglJ Med 1999; 340: 1412-1417
6 Fernandez-Cruz L, Navarro S, Valderrama R, Saenz A,Guarner L, Aparisi L, Espi A, Jaurietta E, Marruecos L, GenerJ, De Las Heras G, Perez-Mateo M, Garcia Sabrido JL, Roig J,Carballo F. Acute necrotizing pancreatitis: a multicenter study.Hepatogastroenterology 1994; 41: 185-189
7 Banks PA. Predictors of severity in acute pancreatitis. Pancreas1991; 6: S7-12
8 Talamini G, Bassi C, Falconi M, Sartori N, Frulloni L, DiFrancesco V, Vesentini S, Pederzoli P, Cavallini G. Risk of deathfrom acute pancreatitis. Role of early, simple “routine” data.Int J Pancreatol 1996; 19: 15-24
9 Gotzinger P, Wamser P, Exner R, Schwanzer E, Jakesz R, FuggerR, Sautner T. Surgical treatment of severe acute pancreatitis: tim-ing of operation is crucial for survival. Surg Infect 2003; 4: 205-211
10 Miskovitz P. Acute pancreatitis: further insight intomechanisms. Crit Care Med 1998; 26: 816-817
11 Isenmann R, Rau B, Beger HG. Early severe acute pancreatitis:characteristics of a new subgroup. Pancreas 2001; 22: 274-278
12 Wilson PG, Manji M, Neoptolemos JP. Acute pancreatitis as amodel of sepsis. J Antimicrob Chemother 1998; 41: 51-63
13 McKay CJ, Evans S, Sinclair M, Carter CR, Imrie CW. Highearly mortality rate from acute pancreatitis in Scotland, 1984-1995. Br J Surg 1999; 86: 1302-1305
14 Buchler MW, Gloor B, Muller CA, Friess H, Seiler CA, Uhl W.Acute necrotizing pancreatitis: treatment strategy accordingto the status of infection. Ann Surg 2000; 232: 619-626
15 Gotzinger P, Sautner T, Kriwanek S, Beckerhinn P, Barlan M,Armbruster C, Wamser P, Fugger R. Surgical treatment forsevere acute pancreatitis: extent and surgical control of necro-sis determine outcome. World J Surg 2002; 26: 474-478
16 Zhu AJ, Shi JS, Sun XJ. Organ failure associated with severeacute pancreatitis. World J Gastroenterol 2003; 9: 2570-2573
17 Halonen KI, Pettila V, Leppaniemi AK, Kemppainen EA,Puolakkainen PA, Haapiainen RK. Multiple organ dysfunctionassociated with severe acute pancreatitis. Crit Care Med 2002;30: 1274-1279
18 Isenmann R, Rau B, Beger HG. Bacterial infection and extentof necrosis are determinants of organ failure in patients withacute necrotizing pancreatitis. Br J Surg 1999; 86: 1020-1024
19 Raty S, Sand J, Nordback I. Difference in microbes contami-nating pancreatic necrosis in biliary and alcoholic pancreatitis.Int J Pancreatol 1998; 24: 187-191
20 Kemppainen E, Sainio V, Haapiainen R, Kivisaari L, KivilaaksoE, Puolakkainen P. Early localization of necrosis by contrast-enhanced computed tomography can predict outcome in se-vere acute pancreatitis. Br J Surg 1996; 83: 924-929
21 McFadden DW. Organ failure and multiple organ system fail-ure in pancreatitis. Pancreas 1991; 6(Suppl 1): S37-43
22 de Beaux AC, Palmer KR, Carter DC. Factors influencing mor-bidity and mortality in acute pancreatitis; an analysis of 279cases. Gut 1995; 37: 121-126
23 Karimgani I, Porter KA, Langevin RE, Banks PA. Prognosticfactors in sterile pancreatic necrosis. Gastroenterology 1992; 103:1636-1640
24 Uomo G, Visconti M, Manes G, Calise F, Laccetti M, RabittiPG. Nonsurgical treatment of acute necrotizing pancreatitis.Pancreas 1996; 12: 142-148
25 de Beaux AC, Goldie AS, Ross JA, Carter DC, Fearon KC. Serumconcentrations of inflammatory mediators related to organ fail-ure in patients with acute pancreatitis. Br J Surg 1996; 83: 349-353
26 Widdison AL, Karanjia ND. Pancreatic infection complicatingacute pancreatitis. Br J Surg 1993; 8: 148-154
27 Tenner S, Sica G, Hughes M, Noordhoek E, Feng S, Zinner M,Banks PA. Relationship of necrosis to organ failure in severeacute pancreatitis. Gastroenterology 1997; 113: 899-903
28 Lankisch PG, Pflichthofer D, Lehnick D. No strict correlationbetween necrosis and organ failure in acute pancreatitis. Pan-creas 2000; 20: 319-322
Edited by Wang XL and Chen WW Proofread by Xu FM
3338 ISSN 1007-9327 CN 14-1219/ R World J Gastroenterol November 15, 2004 Volume 10 Number 22

PO Box 2345, Beijing 100023, China World J Gastroenterol 2004;10(22):3339-3341Fax: +86-10-85381893 World Journal of GastroenterologyE-mail: [email protected] www.wjgnet.com Copyright © 2004 by The WJG Press ISSN 1007-9327
• BRIEF REPORTS •
A double stapled technique for oesophago-enteric anastomosis
A Kotru, A K John, E P Dewar
A Kotru, A K John, E P Dewar, Department of Surgery, AiredaleGeneral Hospital, Keighly BD20 6TD, UKCorrespondence to: A Kotru, 273-Spen Lane, West Park, LeedsLS16 5EJ, UK. [email protected]: +44-1132288911Received: 2004-02-11 Accepted: 2004-04-07
Abstract
AIM: Leakage from oesophageal anastomosis is associatedwith substantial morbidity and mortality. This study presenteda novel, safe and effective double stapled technique foroesophago-enteric anastomosis.
METHODS: The data were obtained prospectively fromhospital held clinical database. Thirty nine patients (26males, 13 females) underwent upper-gastrointestinalresection between 1996 and 2000 for carcinoma (n = 36),gastric lymphoma (n = 1), and benign pathology (n = 2).Double stapled oesophago-enteric anastomosis wasperformed in all cases.
RESULTS: No anastomotic leak was reported. In cases ofmalignancy, the resected margins were free of neoplasm.Three deaths occurred, which were not related to anastomoticcomplications.
CONCLUSION: Even though the reported study is anuncontrolled one, the technique described is reliable, andeffective for oesophago-enteric anastomosis.
Kotru A, John AK, Dewar EP. A double stapled technique foroesophago-enteric anastomosis. World J Gastroenterol 2004;10(22): 3339-3341
http://www.wjgnet.com/1007-9327/10/3339.asp
INTRODUCTIONLeakage is a major problem associated with oesophago-entericanastomosis. The anastomosis may be hand sewn or stapled[1-4].Even though there is no proven advantage between eithertechniques, basic principles of anastomosis surgery- tensionfree, good vascularity, and good mucosal apposition apply toboth. A technique of double stapled anastomosis avoids stretchat oesophageal side of anastomosis and circumvents damageto vascularity.
MATERIALS AND METHODSThe double stapled oesophago-enteric reconstruction wasperformed as follows. The oesophagus was mobilized in thestandard way to above the proposed level of division. Atransverse incision was made in the anterior wall of theoesophagus at least 3 cm above the proximal extent of thetumour in those cases undergoing surgery for malignancy(Figure 1). An appropriately sized circular stapler (CA Ethicon)was selected based on the oesophageal diameter. A 2-0polypropylene suture was placed through the ‘eye-hole’ situatedin the plastic spike that fits the head of the circular stapler. The
polypropylene suture should be tied such that around 5 cm ofsuture with the attached needle remained attached to the spikeattached to the circular stapler head. The transverse anterioroesophagotomy should be of sufficient size to allow insertion ofthe stapler head with attached spike - see step 7 (Figure 2). Thecircular stapler head with spike and attached needle were placedthrough the oesophagotomy into the proximal oesophagus(Figure 3). The suture needle was brought out through the anterioroesophageal wall 2 cm proximal to the oesophagotomy. Theoesophagus was then cross-stapled and divided transverselybelow the site of needle puncture but above the oesophagotomy.The suture attached to the spike was used to pull the spike andaxis of the circular stapler head through the anterior wall of theoesophagus, around 2 cm proximal to the transverse staple line(Figure 4). The spike was then removed from the stapler head.Resection of the gastric or oesophago-gastric specimen wasthen completed. The distal conduit (either distal stomach or jejunallimb) was prepared and mobilized to allow a tension freeanastomosis. The body of the circular stapler was introducedinto the lumen of the efferent conduit through an appropriatelyplaced enterotomy (Figure 5). The circular stapler head wasengaged with the body of the circular stapler gun. The gun wasclosed and fired creating a double stapled oesophago-entericanastomosis (Figure 5). A naso-gastric tube was fed across theoesophago-enterostomy after completion of the anastomosis.
Figure 1 Transverse incision in anterior wall of oesophagus.
Figure 2 Transverse anterior oesophagotomy. Stapler headspike with attached needle inserted through oesophagotomyinto proximal oesophagus.
Oesophageal enterotomyabove tumour
Tumour at gastrooesophageal junction
Stapler head with attachedspike connected to suture

3340 ISSN 1007-9327 CN 14-1219/ R World J Gastroenterol November 15, 2004 Volume 10 Number 22
Figure 3 Placement of a circular stapler head with spike andattached needle. Needle was used to puncture anterior oe-sophagus -2 cm above the oesophagotomy. The oesophaguswas then cross- stapled between the needle puncture site &the oesophagotomy.
Figure 4 Suture used to drive head spike through oesoph-ageal wall above transverse suture line.
Figure 5 Introduction of the circular stapler body into thelumen of efferent conduit.
RESULTSAll patients were operated on by or under the direct supervisionof a consultant surgeon with an upper gastrointestinal interest.Patients with malignancy underwent pre-operative staging withthoraco-abdominal computed tomography scan. Laparoscopywas used in selected instances. In elective cases, mechanicalbowel preparation was employed. Thoracic epidural anaesthesiawas employed for post-operative pain relief. Patients were keptnil by mouth for 5 d post-operatively. If the post-operativecourse was uneventful, fluids were introduced on d 5. Water
soluble contrast studies were not routinely used to assessanastomotic integrity unless there was clinical indication. Data were obtained prospectively from the hospital-heldclinical database. Thirty-nine patients (26 males, 13 females) underwent uppergastrointestinal resection (total gastrectomy n = 24, Ivor -Lewisoesophago-gastrectomy n = 15) between 1996 and 2000. Indicationfor surgery was carcinoma (n = 36), gastric non-Hodgkin’slymphoma (n = 1), revision of a neo-gastric jejunal pouch (n = 1),gastric infarction secondary to volvulus (n = 1). The median agewas 67 (36-82) years. Patient ASA grades were: ASA-1 n = 12,ASA- 2 n = 14, ASA- 3 n = 9, ASA- 4 n = 3, ASA- 5 n = 1. Themedian operative time for total gastrectomy was 175 (120-240) minand was 240 (180-360) min for Ivor-Lewis oesophago-gastrectomy.The median transfusion requirements were 2 (0-7) units forboth procedures. The resection margins were free of tumour onhistopathological examination in all cases of malignancy. Morbidity and mortality rates are shown below (Tables 1-3).Risk adjusted morbidity and mortality rates were calculatedusing the physiological and operative scoring system forenumeration of morbidity and mortality (POSSUM) andPortsmouth POSSUM (P-POSSUM) models[5,6].
Table 1 Morbidity and mortality of oesophago-gastrectomy(n, %)
Total patients POSSUM P-POSSUM (n = 15) prediction prediction
Morbidity 5 (33) 63 -Mortality 2 (14) 18 6
Table 2 Morbidity and mortality of total gastrectomy (n, %)
Total patients POSSUM P-POSSUM (n = 15) prediction prediction
Morbidity 6 (25) 48 -Mortality 1 (4) 16 9
Table 3 Analysis of morbidity
Oesophagogastrectomy (n) Total gastrectomy (n)
Chest infection 2 5Chylothorax 1 -DVT/PE 1 1Anastomotic leak - -Wound sepsis 1 -
Three deaths occurred, two post oesophago-gastrectomyand one post total gastrectomy. The deaths after oesophago-gastrectomy were shown at post-mortem to be due to leftventricular failure and myocardial infarction respectively. Thepatient who died after total gastrectomy deteriorated suddenlyon the 10th post-operative day tolerated diet for three days.Symptoms, blood gases and electrocardiogram were compatiblewith a pulmonary embolus. Permission for a post-mortem wasrefused. No anastomotic leaks occurred on clinical grounds.
DISCUSSIONAnastomotic leakage following oesophago-enteric reconstructionmay result in significant morbidity and mortality. The standardprinciples governing any gastro-intestinal anastomosis applyin dealing with the oesophagus. The anastomosis should betension-free, well vascularized and there should be accuratemucosal apposition. Oesophageal anastomoses may be handsewn (in one, two or even three layers) or stapled[1-4]. There isno proven advantage to either the hand sewn or stapled technique.
Circular stapler head in proximal oesophagus
Circular stapler introduced into roux limb of jejunum
Roux limb ofjejunum

Kotru A et al. Double stapled oesophago-enteric anastomosis 3341
Stapled anastomoses might be associated with a higher rate ofsubsequent benign stricture formation[7]. The stapled techniquethat is commonly used requires a purse string suture in the cutend of the proximal oesophagus to retain the head of the circularstapler. The anastomosis is completed by a single firing of thecircular stapler. It is the authors’ contention that the oesophageal pursestring may be a contributory factor to subsequent anastomoticrelated complications (leak and stricture). This is based on theobservation that the distal oesophagus is stretched over thehead of the circular stapler, and therefore possibly devascularizedby the purse string suture. To avoid the use of a purse string, adouble stapled oesophago-enteric anastomotic technique hasbeen devised. This paper described a novel technique of oesophago-entericanastomosis using a double stapled technique. Whilst thiswas an uncontrolled study, the technique has proved reliableand to date has not resulted in any anastomotic leaks. Whilstthis study cannot implicate the use of a proximal oesophagealpurse string suture as a factor in anastomotic leakage, it isinteresting to speculate whether the double stapled anastomosisdoes allow improved anastomotic healing through omission of
a purse string suture. The technique described merits furtherevaluation either in the setting of a larger uncontrolled studyor more preferably in the context of a randomised trial.
REFERENCES1 Skinner DB. Oesophageal reconstruction. Am J Surg 1980;
139: 810-8142 Akiyama H. Surgery for cancer of the oesophagus. Baltimore:
Williams Wilkins 1990: 74-753 Sweep RH . Thoracic surgery. Philadelphia, London: WB
Saunders 1950: 256-2944 Griffin SM, Raimes SA. Upper gastrointestinal surgery.
London, Philadelphia, Toronto, Sydney, Tokyo: WB Saunders1997: 111-144
5 Copeland GP, Jones D, Walters M. POSSUM: A scoring systemfor surgical audit. Br J Surg 1991; 78: 355- 360
6 Prytherch DR, Whiteley MS, Higgins B, Weaver PC, Prout WG,Powell SJ. POSSUM and Portsmouth POSSUM for predicitngmortality. Physiological and Operative Severity Score for theenUmeration of Mortality and Morbidity. Br J Surg 1998; 85:1217-1220
7 Bardini R , Asolati M, Ruol A, Bonavina L, Baseggio S,Peracchia A. Anastomosis. World J Surg 1994; 18: 373- 378
Edited by Wang XL Proofread by Xu FM

PO Box 2345, Beijing 100023, China World J Gastroenterol 2004;10(22):3342-3344Fax: +86-10-85381893 World Journal of GastroenterologyE-mail: [email protected] www.wjgnet.com Copyright © 2004 by The WJG Press ISSN 1007-9327
• BRIEF REPORTS •
Helicobacter pylori seroprevalence in patients with lung cancer
Nikiphoros Philippou, Panagiotis Koursarakos, Evgenia Anastasakou, Vasiliki Krietsepi, Stavroula Mavrea,
Anastasios Roussos, Dionissia Alepopoulou, Irineos Iliopoulos
Nikiphoros Philippou, Panagiotis Koursarakos, Vasiliki Krietsepi,Anastasios Roussos, Irineos Iliopoulos, 9th Department of PulmonaryMedicine, “SOTIRIA” Chest Diseases Hospital, Athens, GreeceEvgenia Anastasakou, Stavroula Mavrea, Dionissia Alepopoulou,Section of Immunology and Infectious Diseases, “SOTIRIA” ChestDiseases Hospital, Athens, GreeceCorrespondence to: Dr. Nikiphoros Philippou, 9th Department ofPulmonary Medicine, “SOTIRIA” Chest Diseases Hospital, 152Mesogion Street, PO Box 11527, Athens,Greece. [email protected]: +301-210-8646215 Fax: +301-210-8646215Received: 2003-08-02 Accepted: 2003-09-12
Abstract
AIM: To assess Helicobacter pylori (H pylori) seroprevalencein a cohort of Greek patients with lung cancer.
METHODS: Seventy-two lung cancer patients (55 malesand 17 females, aged 58.2±11.7 years) and 68, age andgender-matched, control subjects were enrolled. All subjectsunderwent an enzyme-linked immunosorbent assay IgGserologic test for H pylori diagnosis.
RESULTS: A correlation between age and H pylori IgGlevel was detected for both lung cancer patients (r = 0.42,P = 0.004) and controls (r = 0.44, P = 0.004). Seropositivityfor H pylori did not differ significantly between patientswith lung cancer and controls (61.1% vs 55.9%, P>0.05).Concerning the mean serum concentration of IgG antibodiesagainst H pylori, no significant difference between thetwo groups was detected (32.6±19.1 vs 27.4±18.3 U/mL,P>0.05).
CONCLUSION: No significant association between H pylori
infection and lung cancer was found.
Philippou N, Koursarakos P, Anastasakou E, Krietsepi V, MavreaS, Roussos A, Alepopoulou D, Iliopoulos I. Helicobacter pylori
seroprevalence in patients with lung cancer. World J Gastroenterol
2004; 10(22): 3342-3344
http://www.wjgnet.com/1007-9327/10/3342.asp
INTRODUCTIONHelicobacter pylori (H pylori) infection of the gastric mucosaaffects approximately 50% of the world’s population[1]. It seemsto be the main cause of chronic antral gastritis[2] and is stronglyassociated with peptic ulcer disease[3], gastric cancer[4], andgastric MALT-lymphoma[5]. In the past few years, a variety ofextradigestive disorders, including cardiovascular, skin, rheumaticand liver diseases, have also been associated with H pyloriinfection[6,7]. As regards respiratory diseases, an increased H pyloriseroprevalence has been found in active bronchiectasis[8],chronic bronchitis[9,10] and active pulmonary tuberculosis[11].The activation of inflammatory mediators by H pylori seems tobe the common pathogenetic mechanism underlying theobserved associations[12].
It is well known that the prevalence of lung cancer in pepticulcer patients is increased 2 to 3 fold compared with findingsin ulcer-free controls[13-18]. The major factor underlying thisassociation seems to be the impact of cigarette smoking onboth diseases. However, a recent pilot study, in a small numberof patients, showed that H pylori infection, per se, might beimplicated in lung cancerogenesis[19]. It suggested that theprolonged release of gastrin and cyclooxygenase (COX)-2 inH pylori infected patients might account for the stimulation oflung cancer growth and tumor neoangiogenesis[19]. However,insufficient information is available on the prevalence of H pyloriinfection in lung cancer patients. Therefore, in order to further investigate the relationshipbetween H pylori infection and lung cancer, we assessed H pyloriseroprevalence in a cohort of Greek patients with lung cancerand control subjects.
MATERIALS AND METHODSStudy subjectsThe present study was conducted at the 9th Department ofPulmonary Medicine, “Sotiria” Chest Diseases Hospital(Athens, Greece). The local ethics committee approved the studyand written informed consent was obtained from each participant.Following a predefined protocol, between March 1, 2002 andApril 30, 2001, 104 consecutive patients with, histologicallyverified, primary lung cancer were recruited from our department.Exclusion criteria were: (1) prior Helicobacter eradicationtherapy, (2) consumption of acid suppressive drugs or antibioticsin the preceding 6 mo and (3) a history of vagotomy oroperations of the upper gastrointestinal tract. A total of 32patients were excluded. Therefore, 72 patients were eligiblefor analysis. Controls were selected randomly from subjects who attendedcourses designed for public health education during the periodof the study. Exclusion criteria for controls were: (1) a knownhistory of lung cancer and (2) a known history of gastrointestinaltract pathology. Finally, we selected 68 controls out of 99healthy subjects and we matched them with the patients forsex, age (within 2 years) and socioeconomic status.
MethodsAll subjects enrolled (lung cancer patients and controls)underwent an enzyme-linked immunosorbent assay (ELISA)IgG serologic test for H pylori diagnosis (HEL-P test, Park Co,Athens, Greece), in accordance with the manufacturer’sguidelines. A positive, borderline or negative result was assignedwhen the concentration of IgG antibodies against H pylori wasgreater than 25, between 20 and 25 and less than 20 U/mLrespectively. The specificity and sensitivity of the serologytest, validated in our local population, were 95% and 85%respectively.
Statistical analysisResults are expressed as mean±SD. Significance of differencebetween groups was assessed by unpaired Student’s t-test forcontinuous variables and χ2-test for proportions. Correlationcoefficients between variables were determined using conventional

Pearson’s correlation analysis. Statistical analysis was performedusing SPSS program (SPSS Inc, IL, USA) and P-values weretwo-tailed analyzed. P less than 0.05 was considered statisticallysignificant.
RESULTSThe demographic data of both patients and controls are shownin Table 1. There was no statistical difference in age or genderbetween the two groups. The majority of lung cancer patientswere current cigarette smokers (60 patients, 83.3%) or ex-smokers(10 patients, 13.9%) and only 2 patients (2.8%) had neversmoked. On the other hand, 40 out of 68 control subjects (58.8%)were never-smokers, 20 (29,4%) were current and 8 (11.8%)were previous smokers. A correlation between age and H pylori IgG level wasdetected for both lung cancer patients (r = 0.42, P = 0.004) andcontrols (r = 0.44, P = 0.004). Among the lung cancer patients,44 (61.1%) were anti-H pylori IgG positive, 2 (2.8%) hadborderline values and 26 (36.1%) were seronegatives. Of thecontrol subjects 38 (55.9%) were anti-H pylori IgG positive,2 (2.9%) were borderline and 28 (41.2%) were seronegatives. H pylori seropositivity did not differ significantly betweenpatients with lung cancer and controls (P>0.05) (Table 1).Concerning the mean serum concentration of IgG antibodiesagainst H pylori no significant difference between the twogroups was detected (P>0.05).
Table 1 Demographic data and H pylori serologic parameters
Parameter Control Lung cancer P (n = 68) (n = 72)
Age (yr) 54.8±12.1 58.2±11.7 0.79Male gender (%) 73.5 76.3 0.88H pylori IgG level (U/mL) 27.4±18.3 32.6±19.1 0.18H pylori IgG seropositivity (%) 55.9 61.1 0.23
DISCUSSIONData in literature on the relationship between H pylori infectionand lung cancer are poor. Recently, Gocyk et al. carried out apilot study in a sample of 50 Polish patients with lung cancerand showed an increased H pylori seroprevalence (89%).Moreover, they proposed that the seropositive patients mightbe considered for H pylori eradication in order to reduce thehypergastrinemia and COX-2 expression[19], provoked by thisbacterium. As both overexpression of COX-2 in lung tissue[20-22]
and increased serum levels of gastrin[23] have been reported inlung cancer patients, a pathogenetic link between H pyloriinfection and lung cancer seems to exist. Our study is the first one focusing on seroprevalence ofH pylori, in a relatively large population of Greek patients withlung cancer. According to our results, H pylori seroprevalencein lung cancer patients did not differ significantly from that ofthe control subjects. The age-related pattern of infection, whichin our study was detected for both lung cancer patients andcontrols, was common in developed countries and explainedby the cohort effect[24]. The socioeconomic status, which wasrelated with both H pylori infection and risk of lung cancer,was similar between the two groups. Tobacco use could beanother confounding factor. Cigarette smoking was the mostimportant etiologic factor of lung cancer and seemed to fullyaccount for the, observed in previous studies, associationbetween peptic ulcer and lung cancer[13-18]. However, data onthe relationship between H pylori infection and smoking habitsare controversial. The prevalence of H pylori infection insmokers has been variously reported as low[25], normal[26], andhigh[27]. In the present study, we did not match patients with
control subjects in smoking habits. As the relation betweensmoking and H pylori infection has not been clarified yet, thepossible impact of cigarette smoking on both lung cancer andH pylori infection should be regarded as a potential studylimitation. The present study did not focus on the potential pathogeneticmechanisms underlying a possible association between H pyloriinfection and chronic bronchitis. This association might reflecteither susceptibility induced by common factors or a kind ofcausal relationship between these diseases. As far as we know,there are no common factors implicated in the susceptibility toboth lung cancer and H pylori infection. However, we can notrule out this possibility, as the predisposing conditions toH pylori infection have not been clarified yet. With regard tothe aetio-pathogenetic role of H pylori infection in lung cancerdevelopment, it has been suggested that the prolonged releaseof gastrin and cyclooxygenase (COX)-2 in H pylori infectedpatients might stimulate lung cancer growth and lead to tumorneoangiogenesis[19]. The spilling or inhalation of H pylori orits exotoxins into the respiratory tract might also lead to theiraccumulation in lung tissue. However, as far as we know, neitheridentification of H pylori species in human bronchial tissue,nor isolation of H pylori from bronchoalveolar lavage (BAL)fluid has been achieved yet[24]. Studies estimating the relativerisk of developing lung cancer for H pylori infected patientsand the effect of H pylori eradication on the natural history ofchronic bronchitis are also needed to further investigate thesehypotheses. In conclusion, the present study suggests that H pyloriseroprevalence in lung cancer patients did not differ significantlyfrom that of control subjects. Our results should be confirmedin a larger number of patients. Further studies are needed toclarify the pathogenetic mechanisms, if those exist, underlyinga possible association between these two diseases.
REFERENCES1 Mitchell H, Megraud F. Epidemiology and diagnosis of
Helicobacter pylori infection. Helicobacter 2002; 7(Suppl 1): 8-162 Cave DR. Chronic gastritis and Helicobacter pylori. Semin Gas-
trointestinal Dis 2001; 12: 196-2023 Cohen H. Peptic ulcer and Helicobacter pylori. Gastroenterol Clin
North Am 2000; 29: 775-7894 Eslick GD, Lim LL, Byles JE, Xia HH, Taley NJ. Association of
Helicobacter pylori infection with gastric carcinoma: a meta-analysis. Am J Gastroenterol 1999; 13: 1295-1302
5 Parsonnet J, Hansen S, Rodriguez L, Gelb AB, Warnke RA,Jellum E, Orentreich N, Vogelman JH, Friedman GD.Helicobacter pylori and gastric lymphoma. N Engl J Med 1994;330: 1267–1271
6 Realdi G, Dore MP, Fastame L. Extradigestive manifestationsof Helicobacter pylori infection. Fact and fiction. Dig Dis Sci1999; 44: 229-236
7 Gasbarrini A, Franceschi F, Armuzzi A, Ojetti V, Candelli M,Sanz Torre E, Lorenzo AD, Anti M, Pretolani S, Gasbarinni G.Extradigestive manifestations of Helicobacter pylori gastricinfection. Gut 1999; 45(Suppl 1): 9-12
8 Tsang KW, Lam SK, Lam WK, Karlberg J, Wong BC, YewWW, Ip MS. High seroprevalence of Helicobacter pylori inactive bronchiectasis. Am J Resp Crit Care Med 1998; 158:1047-1051
9 Gaselli M, Zaffoni E, Ruina M, Sartori S, Trevisani L, CiacciaA, Alvisi V, Fabbri L, Papi A. Helicobacter pylori and chronicbronchitis. Scand J Gastroenterol 1999; 34: 828-830
10 Roussos A, Tsimpoukas F, Anastasakou E, Alepopoulou D,Paizis I, Philippou N. Helicobacter pylori seroprevalence in pa-tients with chronic bronchitis. J Gastroenterol 2002; 37: 332-335
11 Filippou N, Roussos A, Tsimboukas F, Tsimogianni A,Anastasakou E, Mavrea S. Helicobacter pylori seroprevalence inpatients with pulmonary tuberculosis. J Clin Gastroenterol 2002;34: 189
Philippou N et al. Helicobacter pylori and lung cancer 3343

12 Roussos A, Philippou N, Gourgoulianis KI. Helicobacter pyloriinfection and respiratory diseases: a review. World J Gastroenterol2003; 9: 5-8
13 Viskum K. Peptic ulcer and pulmonary disease. Scand J RespirDis 1974; 55: 284-290
14 Bonnevie O. Causes of death in duodenal and gastric ulcer.Gastroenterology 1977; 73: 1000-1004
15 Hole DJ, Quigley EM, Gillis CR, Watkinson G. Peptic ulcer andcancer. Scand J Gastroenterol 1987; 22: 17-23
16 Moller H, Toftgaard C. Cancer occurrence in a cohort of pa-tients surgically treated for peptic ulcer. Gut 1991; 32: 740-744
17 Caygill CP, Knowles RL, Hall R. Increased risk of cancer mor-tality after vagotomy for peptic ulcer: a preliminary analysis.Eur J Cancer Prev 1991; 1: 35-37
18 Svanes C, Lie SA, Lie RT, Soreide O, Svanes K. Causes ofdeath in patients with peptic ulcer perforation: a long-termfollow-up study. Scand J Gastroenterol 1999; 34: 18-24
19 Gocyk W, Niklinski T, Olechnowicz H, Duda A, Bielanski W,Konturek PC, Konturek SJ. Helicobacter pylori, gastrin andcyclooxygenase-2 in lung cancer. Med Sci Monit 2000; 6: 1085-1092
20 Koki A, Khan NK, Woerner BM. Cyclooxygenase-2 in humanpathological disease. Adv Exp Med Biol 2002; 507: 177-184
21 Ermert L, Dierkes C, Ermert M. Immunohistochemical expres-sion of cyclooxygenase isoenzymes and downstream enzymesin human lung tumors. Clin Cancer Res 2003; 9: 1604-1610
22 Fang HY, Lin TS, Lin JP, Wu YC, Chow KC, Wang LS.Cyclooxygenase-2 in human non-small cell lung cancer. Eur JSurg Oncol 2003; 29: 171-177
23 Zhou Q, Zhang H, Pang X, Yang J, Tain Z, Wu Z, Yang Z. Pre-and postoperative sequential study on the serum gastrin levelin patients with lung cancer. J Surg Oncol 1992; 51: 22-25
24 Peterson WL, Graham DY. Helicobacter pylori. In: Feldman M,Scharschmidt BF, Sleisenger MH, eds. Gastrointestinal and liverDisease. Pathophysiology, Diagnosis, Management. 6th ed.Philadelphia: WB Saunders 1998: 604–619
25 Ogihara A, Kikuchi S, Hasegawa A, Kurosawa M, Miki K,Kaneko E. Relationship between Helicobacter pylori infection andsmoking and drinking habits. J Gastroenterol Hepatol 2000; 15:271-276
26 Brenner H, Rothenbacher D, Bode G, Adler G. Relation ofsmoking and alcohol and coffee consumption to activeHelicobacter pylori infection: cross sectional study. BMJ 1997;315: 1489-1492
27 Parasher G, Eastwood GL. Smoking and peptic ulcer in theHelicobacter pylori era. Eur J Gastroenterol Hepatol 2000; 12: 843-853
Edited by Chen WW and Zhu LH Proofread by Xu FM
3344 ISSN 1007-9327 CN 14-1219/ R World J Gastroenterol November 15, 2004 Volume 10 Number 22

PO Box 2345, Beijing 100023, China World J Gastroenterol 2004;10(22):3345-3348Fax: +86-10-85381893 World Journal of GastroenterologyE-mail: [email protected] www.wjgnet.com Copyright © 2004 by The WJG Press ISSN 1007-9327
• BRIEF REPORTS •
Patients with brain metastases from gastrointestinal tract cancer
treated with whole brain radiation therapy: Prognostic factors and
survival
Susanne Bartelt, Felix Momm, Christian Weissenberger, Johannes Lutterbach
Susanne Bartelt, Department of Radiation Oncology, University ofFreiburg, Freiburg i. Br., GermanyFelix Momm, Department of Radiation Oncology, University ofFreiburg, Freiburg i. Br., GermanyChristian Weissenberger, Department of Radiation Oncology,University of Freiburg, Freiburg i. Br., GermanyJohannes Lutterbach, Department of Radiation Oncology, Universityof Freiburg, Freiburg i. Br., GermanyCorrespondence to: Susanne Bartelt, M.D., RadiologischeUniversitätsklinik, Abteilung Strahlenheilkunde, Robert-Koch Strasse3, 79106 Freiburg, Germany. [email protected]: +49-761-270-9462 Fax: +49-761-270-9582Received: 2004-02-27 Accepted: 2004-04-14
Abstract
AIM: To identify the prognostic factors with regard to survivalfor patients with brain metastasis from primary tumors of thegastrointestinal tract.
METHODS: Nine hundred and sixteen patients with brainmetastases, treated with whole brain radiation therapy(WBRT) between January 1985 and December 2000 at theDepartment of Radiation Oncology, University HospitalFreiburg, were analyzed retrospectively.
RESULTS: Fifty-seven patients presented with a primarytumor of the gastrointestinal tract (esophagus: n = 0, stomach:n = 10, colorectal: n = 47). Twenty-six patients had a solitarybrain metastasis, 31 patients presented with multiple brainmetastases. Surgical resection was performed in 25 patients.WBRT was applied with daily fractions of 2 Gray (Gy) or 3 Gyto a total dose of 50 Gy or 30 Gy, respectively. The intervalbetween diagnoses of the primary tumors and brainmetastases was 22.6 mo vs 8.0 mo for patients with primarytumors of the colon/rectum vs other primary tumors,respectively (P<0.01, log-rank). Median overall survival forall patients with brain metastases (n = 916) was 3.4 moand 3.2 mo for patients with gastrointestinal neoplasms.Patients with gastrointestinal primary tumors presentedsignificantly more often with a solitary brain metastasis thanpatients with other primary tumors (P<0.05, log-rank). Inpatients with gastrointestinal neoplasms (n = 57), themedian overall survival was 5.8 mo for patients with solitarybrain metastasis vs 2.7 mo for patients with multiple brainmetastases (P<0.01, log-rank). The median overall survivalfor patients with a Karnofsky performance status (KPS) 70was 5.5 mo vs 2.1 mo for patients with KPS <70 (P<0.01,log-rank). At multivariate analysis (Cox Model) the performancestatus and the number of brain metastases were identifiedas independent prognostic factors for overall survival.
CONCLUSION: Brain metastases occur late in the courseof gastrointestinal tumors. Pretherapeutic variables like KPSand the number of brain metastases have a profound influenceon treatment outcome.
Bartelt S, Momm F, Weissenberger C, Lutterbach J. Patientswith brain metastases from gastrointestinal tract cancertreated with whole brain radiation therapy: Prognostic factorsand survival. World J Gastroenterol 2004; 10(22): 3345-3348
http://www.wjgnet.com/1007-9327/10/3345.asp
INTRODUCTIONThe metastatic dissemination of a solid tumor to the brain isgenerally associated with a poor prognosis[1]. The most commonprimary tumors metastasizing to the brain are breast and lungcancer, whereas patients with other primary tumors, e.g. tumors ofthe gastrointestinal tract, rarely present with brain metastases[2-4].Furthermore, within the group of gastrointestinal tumors, theincidence of brain metastases shows notable differences. Theyare extremely rare in esophageal tumors[5,6], but more commonin rectal cancer. Few literatures concerning this group of patientsare available and therefore prognosis and hence treatmentstrategies remain controversial. We retrospectively evaluated patient-, tumor- and treatment-related variables in patients with brain metastases of primarytumors of the gastrointestinal tract (i.e. epithelial tumors of theesophagus, stomach, colon, sigma, and rectum) who were treatedwith whole brain radiation therapy (WBRT) at our institution.The aim of the study was to identify the prognostic factorswith regard to the endpoint survival.
MATERIALS AND METHODSThe records of all patients with brain metastases, who weretreated with WBRT at our institution between January 1985 andDecember 2000, were analyzed retrospectively. Brain metastaseswere detected by contrast-enhanced cerebral computed tomography(CT) (n = 43) or magnetic resonance imaging (MRI) (n = 14). WBRT was performed in 16 patients with cobalt60 gammarays, and in 41 patients with 6 MV photons of a linear accelerator.During the study period two fractionation schemes were used:conventional fractionation with daily fractions of 2 Gray (Gy),five days per week to a planned total dose of 50 Gy (n = 42) andsince 1997 hypofractionation with daily fractions of 3 Gy, fivedays per wk to a planned total dose of 30 Gy (n = 15). None ofthe patients underwent a chemotherapy during WBRT. The recursive partitioning analysis (RPA) was used toclassify the patients with brain metastases[7]. Class I containedall patients with a Karnofsky performance status (KPS 70,age < 65 years, a controlled primary tumor and no extracerebralmetastases), Class III contained all patients with a KPS <70,and Class II contained all other patients. All patients alive at the time of analysis were censored withthe date of last follow-up. The endpoint of the study was overallsurvival. Survival was calculated from the first day of radiotherapyusing the method of Kaplan and Meier. Survival curves werecompared using the log-rank test. All factors with a P-value 0.1at univariate analysis were entered into a multivariate analysisusing the proportional hazards model.

RESULTSPatient characteristicsFifty-seven (6.2%) of the 916 patients presented with brainmetastases from a cancer of the gastrointestinal tract. The exactlocalization of the primary tumor is shown in Table 1. None ofthe patients had an esophageal tumor, the most common primarysite was rectum (n = 24) and colon/sigma (n = 23). In all patients,histology obtained either from the primary tumor, brain metastasesor from extracerebral metastases, was adenocarcinoma.
Table 1 Site of primary tumor within gastrointestinal tract1
Site of primary tumor n (%)
Esophagus 0 (0)Stomach 10 (17.5)Colon 17 (30)Sigma 6 (10.5)Rectum 24 (42)
1Esophagus, stomach, colon, sigma, rectum.
Thirty patients were males, 27 females. Their median age atdiagnosis was 65 years (range: 30-80 years). Twenty-ninepatients (51%) had a KPS 70. Twenty-six patients (46%) hada solitary brain metastasis, 31 (54%) had multiple lesions.Location of the metastases is shown in Table 2. Gross totalresection was performed in 25 patients (19 patients with singlemetastasis, six patients with multiple metastases).
Table 2 Location of brain metastases
Location n (%)
Single lesion 26 (100)Frontal 4 (15)Temporal 1 (4)Parietal 6 (23)Occipital 1 (4)Cerebellum 14 (54)Brainstem 0 (0)Multiple lesions 31(100)Supratentorial 20 (64)Infratentorial 3 (10)Both 5 (16)Unknown 3 (10)
All patients presented with extracerebral metastases, mostlyof the lung and/or the liver. Grouped according to the RPAclasses, none of the patients met the criteria for class I. Twenty-nine patients (51%) met the criteria for class II. Twenty-eightpatients (49%) presented with a KPS <70, and thereforebelonged to RPA class III. Patients with a primary tumor of the gastrointestinal tractpresented with a solitary brain metastasis significantly more often(46%) than patients with other primary tumors (30%) (P < 0.05, χ2 ).In patients with a primary tumor of the gastrointestinal tract,25% (14 of 43 patients) had a solitary metastasis localized in thecerebellum, whereas the localization of solitary metastases inthe cerebellum in patients with other primary tumors was 5%(42 of 805 patients). This difference was statistically significant(P<0.01). Other locations of brain metastases were not significantlydifferent between these two groups. The time from the diagnosis of primary tumors to the diagnosisof brain metastases was 16.3 mo, 27 mo, and 20 mo in patientswith gastric carcinoma, colon carcinoma , and rectum carcinoma,respectively, and showed no statistically significant difference.Compared with patients with other primary tumors, patients
with primary tumors of the colon/rectum had a significant longerinterval between the diagnoses of primary tumors and brainmetastases (22.6 mo vs 8.0 mo, respectively, P<0.01).
Survival data The median overall survival (OS) time for patients with a primarytumor of the gastrointestinal system was 3.2 mo and showedno significant difference compared to the overall survival timeof 3.5 mo for patients with brain metastases and other primarytumors (Figure 1). OS rate for patients with gastrointestinaltumors was 49%, 30%, and 7%, at 3, 6, and 12 mo, respectively.Within the group of gastrointestinal tumors, patients with aprimary tumor of the stomach, colon/sigma, and rectum had amedian OS time of 2.7, 5.2, and 3.2 mo, respectively. This wasnot a statistically significant difference.
Prognostic factorsThe potential prognostic factors tested for significance inunivariate analysis were sex, age ( /< 65 years), pretherapeuticperformance status (KPS /< 70), number (single vs multiple)and distribution of brain metastases (Table 2), extracerebraltumor activity (yes vs no), resection status (operation yes vs no),and fractionation scheme (conventional fractionation vshypofractionation). The fractionation scheme (2 Gy daily, 50 Gytotal dose vs 3 Gy daily, 30 Gy total dose) showed no statisticalsignificance for OS. Three factors had a P-value 0.1 in univariate analysisand were entered into multivariate analysis: pretherapeuticperformance status, number of brain metastases, and resectionstatus. Concerning the OS, patients with a KPS 70 had amedian OS time of 5.5 mo vs 2.1 mo for patients with a KPS < 70(P<0.01) (Figure 2). The same values were found by comparingthe patients in RPA class II vs RPA class III. The median OS timefor patients with a solitary metastasis was 5.8 mo and 2.7 mo forpatients with multiple metastases (P<0.01) (Figure 3). Themedian OS time for patients with resection of brain metastasiswas 6.6 mo and 2.7 mo for patients without resection (P<0.01).
Figure 1 Overall survival according to primary tumor.
Figure 2 Overall survival according to KPS ( 70 vs <70).
Overa
ll su
rviv
al
0 6 12 18 24
1.0
0.8
0.6
0.4
0.2
0.0
Time of after radiotherapy (mo)
Gastrointestinal tumors (n = 57)
All others (n = 859)
Overa
ll su
rviv
al
0 6 12 18 24
1.0
0.8
0.6
0.4
0.2
0.0
Time of after radiotherapy (mo)
KPS >/= 70 (n = 29)
KPS <70 (n = 28)
P<0.01
3346 ISSN 1007-9327 CN 14-1219/ R World J Gastroenterol November 15, 2004 Volume 10 Number 22

Figure 3 Overall survival according to the number of brainmetastases (solitary vs multiple).
In the first multivariate model limited to pretherapeuticvariables, the number of brain metastases (single vs multiple,relative risk [RR] 0.63, 95% confidence interval [KI] 0.45-0.88)and the KPS ( 70 vs <70, RR 0.59, 95% KI 0.42-0.82) turned out tobe independent prognostic factors. In the second multivariateanalysis we added the therapeutic variable ‘resection’. The KPSand the number of brain metastases were still independentprognostic factors (RR 0.59, 95% KI 0.43-0.79, P<0.01 and RR 0.65,95% KI 0.45-0.90, P<0.05 respectively), whereas resection statuswas not a prognostic factor.
DISCUSSIONIn our series, 6.2 % of the patients treated with WBRT presentedwith a primary tumor located in the gastrointestinal tract. Noneof the 916 patients had a primary esophageal carcinoma. Brainmetastases from esophageal carcinoma were extremely rare,with a reported incidences of approximately 1-5% in autopsyseries[8,9], and approximately 1-4% in clinical series[5,6,10,11]. In ten patients the primary tumor was a gastric carcinoma. Themajority of publications on brain metastases from gastric carcinomawere case reports[12]. Two large studies found 0.7% of 3 320patients, and 0.16% of 8 080 patients with gastric carcinoma tohave brain metastases[13,14]. In an autopsy series by Poser andChernik, 5 of 46 patients (10.8%) with gastric carcinoma hadbrain metastases[2]. The rarity of brain metastases both fromesophageal and gastric cancer might result from the grim prognosisof these tumor entities[15]. In esophageal cancer, brain metastasestended to occur in patients with large primary tumors[5], usuallyimplicating a short overall OS time. The low incidence in clinicaltrials might further result from an inadequate diagnosticevaluation, and symptoms indicating brain pressure like nauseaand vomiting might be attributed to the primary tumor[14]. Thereason for the relatively high incidence of brain metastasesfrom gastric cancer in our group is not clear. Gastric carcinomais rare in Europe compared to Asian countries. In half of ourpatients gastric carcinoma was a gastric cardia carcinoma,and recent studies suggested, that they were distinct fromadenocarcinomas of the esophagus and stomach regardingepidemiological and biological factors[16-18]. These differencescould possibly be associated with other pathways of metastaticspread, resulting in a relatively higher incidence of brain metastases. Forty-seven patients had a primary colorectal carcinoma.The incidence of brain metastases in colorectal cancer ranged2-10% in clinical studies[19-21]. As observed in other studies[14,21,22],the majority of primary tumors in our patients were located inthe distal parts of the colon, i.e. sigma and rectum (64%).Significantly more patients with colorectal primary tumorspresented with cerebellar metastases compared to patients withother primary tumors (25% vs 5%, respectively, P<0.01). Studiesby Wronski and Alden confirmed this finding, with a frequencyfor infratentorial location of 35% and 55%, respectively[21,23].The relative over-representation of cerebellar metastases in
colorectal carcinoma might be due to tumor spread by way of thevertebral system (i.e. Batson’s plexus), bypassing the lungs[24].The two other possible routes of hematogeneous disseminationof colorectal cancer to the brain were via the rectal vein plexusto the inferior vena cava, bypassing the liver, or via the portalveins to the liver and lung and then to the brain[20,25]. Theincidence of pulmonary metastases in our patients withcolorectal cancer was 50% (23/46 patients), which was clearlyhigher than the approximatley 30% for patients with metastaticcolorectal cancer[26], an observation also made in others[19-21].Presumably the rectal plexus of veins, draining into the inferiorvena cava and subsequently the lung are also an importantroute for tumor spread to the brain. The interval between the diagnosis of primary tumor andbrain metastases in our study group for patients with gastricand colorectal carcinoma was significantly longer (22.6 mo)than that for patients with other primary tumors (8.0 mo).Although only few larger studies on patients with colorectalcarcinoma and brain metastases are available to date, all reporteda late onset of brain metastases, with a period ranging 21-36 mobetween detection of primary tumors and diagnosis of brainmetastases[19-21,23,27-29] (the larger studies on gastric cancer didnot give detailed information on this topic[13,14,30]). Correspondingto the late onset of brain metastases in the clinical course of gastricand colorectal tumors, all of our patients had further extracerebralmetastases (consequently none of our patients was qualifiedfor RPA-class I). The high rate of extracerebral metastases wasconfirmed by most authors[19-23,28,31,32] and even represented themost important prognostic factor in the study of Nieder et al.[31]. Although the onset of brain metastases in our patients withgastrointestinal tumors was late, and the systemic disease wasadvanced, its median OS time was not statistically differentfrom the median OS time of patients with brain metastases ofother primary tumors (3.2 vs 3.5 mo, respectively). It wascomparable to the median OS time for patients with brainmetastases and colorectal carcinoma or gastric carcinoma treatedwith WBRT seen by others, which ranged from 2.0 to 3.6 mo forcolorectal carcinoma[20,22,23,32] and approximately 2 mo for gastriccarcinoma[13,14]. Hasegawa, in contrary, found a shortersurvival time in a radiosurgically treated series of patients withgastrointestinal tumors compared to patients with other primarytumors[27]. Several authors described a longer median OS timeof approximately 9 mo for patients who underwent surgicalresection of brain metastases as a sole treatment or followedby radiotherapy[21,22,27,32,33]. Whereas resection of brain metastasesseemed to be a favorable prognostic factor in our patients inunivariate analysis, it was not statistically significant inmultivariate analysis. The independent factors correlated with a better prognosisin our multivariate analysis were a KPS 70, and the presenceof a solitary brain metastasis. It has been widely accepted thatthe pretherapeutic performance status is one of the mostpowerful predictive factors for the survival of patients withbrain metastases[7,34-38] which could be validated for patientswith brain metastases from gastrointestinal tumors in our studygroup. The more favourable prognosis for patients with primarytumors of the gastrointestinal system presenting with a solitarybrain metastasis was also found by Farnell et al.[32], whereasothers only found the surgical resection of brain metastases tobe associated with a better survival[19,23,27]. In our second multivariateanalysis, including the therapeutic variable ‘resection’ statuscould not be identified as an independent prognostic factor, asmentioned above. In order to diagnose brain metastases in anearly phase, in which a resection could still be possible, discretesymptoms hinting cerebral tumor spread should be taken seriously. A basic problem concerning treatment recommendationsfor patients with brain metastases of gastrointestinal tumors isthat to date only few retrospective studies with a relatively small
Bartelt S et al. Brain metastases and GI-tumors 3347
Overa
ll su
rviv
al
0 6 12 18 24
1.0
0.8
0.6
0.4
0.2
0.0
Months after start of radiotherapy
Solitary brain metastasis (n = 26)
Multiple brain metastases (n = 31)
P<0.01

number of patients are available. Therefore, the results concerningthe prognostic factors should be regarded with caution. Thedifferent prognostic factors from each study should be kept in mindwhen considering a therapeutic concept for individual patients. In conclusion, brain metastasis is a late event in the courseof gastrointestinal tumors, and it occurs later as in patientswith other primary tumors. However, the overall survival timeis comparable to patients with brain metastases from otherprimary tumors. Independent prognostic factors in our groupwere KPS and the number of brain metastases.
REFERENCES1 Nussbaum E, Djalilian H, Cho K, Hall W. Brain metastases.
histology, multiplicity, surgery, and survival. Cancer 1996; 78:1781-1788
2 Posner J, Chernik N. Intracranial metastases from systemiccancer. Adv Neurol 1978; 19: 579-592
3 Sadahiro S, Suzuki T, Ishikawa K, Nakamura T, Tanaka Y,Masuda T, Mukoyama S, Yasuda S, Tajima T, Makuuchi H,Murayama C. Recurrence patterns after curative resection ofcolorectal cancer in patients followed for a minimum of tenyears. Hepatogastroenterology 2003; 50: 1362-1366
4 Weiss L, Grundmann E, Torhorst J, Hartveit F, Moberg I, EderM, Fenoglio-Preiser C, Napier J, Horne C, Lopez M. Hematog-enous metastatic patterns in colonic carcinoma: an analysis of1 541 necropsies. J Pathol 1986; 150: 195-203
5 Ogawa K, Takafumi T, Sueyama H, Nobukazu F, Kakinohana Y,Kamata M, Adachi G, Saito A, Yoshii Y, Murayama S. Brain me-tastases from esophageal carcinoma. Cancer 2002; 94: 759-764
6 Quint L, Hepburn L, Francis I, Whyte R, Orringer M. Incidenceand distribution of distant metastases from newly diagnosedesophageal carcinoma. Cancer 1995; 76: 1120-1125
7 Gaspar L, Scott C, Rotman M, Asbell S, Phillips T, WassermanT, McKenna W, Byhardt R. Recursive partitioning analysis (RPA)of prognostic factors in three radiation therapy oncology group(RTOG) brain metastases trails. Int J Radiat Oncol Biol Phys1997; 37: 745-751
8 Mandard A, Chasle J, Marnay J, Villedieu B, Bianco C, RousselA, Elie H, Vernhes J. Autopsy findings in 111 cases of esoph-ageal cancer. Cancer 1981; 48: 329-335
9 Bosch A, Frias Z, Caldwell W, Jaeschke W. Autopsy findingsin carcinoma of the esophagus. Acta Radiol Oncol Radiat PhysBiol 1979; 18: 103-112
10 Gabrielsen T, Eldevik O, Orringer M, Marshall B. Esophagealcarcinoma metastatic to the brain: clinical value and cost-effec-tiveness of routine enhanced head CT before esophagectomy.Am J Neuroradiol 1995; 16: 1915-1921
11 Weinberg J, Suki D, Hanbali F, Cohen Z, Lenzi R, Sawaya R.Metastasis of esophageal carcinoma to the brain. Cancer 2003;98: 1925-1933
12 Perri F, Bisceglia M, Giannatempo G, Andriulli A. CerebellarMetastasis as a unique presenting feature of gastric cancer. JClin Gastroenterol 2001; 33: 80-81
13 York J, Stringer J, Ajani J, Wildrick D, Gokaslan Z. Gastric cancerand metastasis to the brain. Ann Surg Oncol 1999; 6: 771-776
14 Kim M. Intracranial invol vement by metastatic advanced gas-tric carcinoma. J Neuroncol 1999; 43: 59-62
15 Brenner H. Long-term survival rates of cancer patients achievedby the end of the 20th century: a period analysis. Lancet 2002;360: 1131-1135
16 Wang LD, Zheng S, Zheng ZY, Casson AG. Primary adenocar-
cinomas of lower esophagus, esophagogastric junction andgastric cardia: in special reference to China. World J Gastroenterol2003; 9: 1156-1164
17 Powell J, McConkey C. Increasing incidence of adenocarci-noma of the gastric cardia and adjacent sites. Br J Cancer 1990;62: 440-443
18 Blot W, Devesa S, Kneller R, Fraumeni F. Rising increase ofadenocarcinoma of the esophagus and gastric cardia. JAMA1991; 265: 1287-1289
19 Ko F, Lui J, Chen W, Chiang J, Lin T, Lin J. Risk and patterns ofbrain metastases in colorectal cancer: 27-year experience. DisColon Rectum 1999; 42: 1467-1471
20 Cascino T, Leavengood J, Kemeny N, Posner J. Brain metastasesfrom colon cancer. J Neuroncol 1983; 1: 203-209
21 Wronski M, Arbit E. Resection of brain metastases fromcolorectal carcinoma in 73 patients. Cancer 1999; 85: 1677-1685
22 Hammoud M, McCutcheon I, Elsouki R, Schoppa D, Patt Y.Colorectal carcinoma and brain metastasis: distribution,treatment, and survival. Ann Surg Oncol 1996; 3: 453-463
23 Alden T, Gianino J, Saclarides T. Brain Metastases fromcolorectal cancer. Dis Colon Rectum 1996; 39: 541-545
24 Batson O. The role of the vertebral veins in metastatic processes.Ann Intern Med 1942; 16: 38-45
25 Burns F, Pfaff JJ. Vascular invasion in carcinoma of the colonand rectum. Am J Surg 1956; 92: 704-710
26 Copeland E, Miller L, Jones R. Prognostic factors in carcinomaof the rectum and colon. Am J Surg 1968; 116: 875-881
27 Hasegawa T, Kondziolka D, Flickinger J, Lunsford L. Stereo-tactic Radiosurgery for brain metastases from gastrointestinaltract cancer. Surg Neurol 2003; 60: 506-515
28 Zorrilla M, Alonso V, Herrero A, Corral M, Puertolas T, TruferoJ, Artal A, Anton A. Brain metastases from colorectal carcinoma.Tumori 2001; 87: 332-334
29 Zulkowski K, Kath R, Liesenfeld S, Patt S, Hochstetter A,Behrendt W, Höffken K. Zerebrale metastasen bei kolorektalenkarzinomen. Med Klin 2002; 97: 327-334
30 Kasakura Y, Fujii M, Mochizuki F, Suzuki T, Takahashi T.Clinicopathological study of brain metastasis in gastric cancerpatients. Surg Today 2000; 30: 485-490
31 Nieder C, Niewald M, Schnabel K. Brain metastases of colon andrectum carcinomas. Wien Klin Wochenschr 1997; 109: 239-243
32 Farnell G, Buckner J, Cascino T, O’Connell M, Schomberg P,Suman V. Brain metastases from colorectal carcinoma. Thelong term survivors. Cancer 1996; 78: 711-716
33 D’Andrea G, Isidori A, Caroli E, Orlando E, Salvati M. Singlecerebral metastasis from colorectal adenocarcinoma. NeurosurgRev 2004; 27: 55-57
34 Lutterbach J, Bartelt S, Ostertag C. Long-term survival in pa-tients with brain metastases. J Cancer Res Clin Oncol 2002; 128:417-425
35 Lutterbach J, Cyron D, Henne K, Ostertag C. Radiosurgeryfollowed by planned observation in patients with one to threebrain metastases. Neurosurgery 2003; 52: 1066-1073
36 Nieder C, Nestle U, Motaref B, Walter K, Niewald M, SchnabelK. Prognostic factors in brain metastases: should patients beselected for aggressive treatment according to recursive parti-tioning analysis (RPA) classes ? Int J Radiat Oncol Biol Phys2000; 46: 297-302
37 Lohr F, Pirzkall A, Hof H, Fleckenstein K, Debus J. Adjuvanttreatment of brain metastases. Semin Surg Oncol 2001; 20: 50-56
38 Schoeggl A, Kitz K, Reddy M, Zauner C. Stereotactic radio-surgery for brain metastases from colorectal cancer. Int JColorectal Dis 2002; 17: 150-155
Edited by Wang XL and Xu FM
3348 ISSN 1007-9327 CN 14-1219/ R World J Gastroenterol November 15, 2004 Volume 10 Number 22
PO Box 2345, Beijing 100023, China World J Gastroenterol 2004;10(22):3349-3352Fax: +86-10-85381893 World Journal of GastroenterologyE-mail: [email protected] www.wjgnet.com Copyright © 2004 by The WJG Press ISSN 1007-9327
• BRIEF REPORTS •
Development and distribution of mast cells and neuropeptides in
human fetus duodenum
Xiao-Yu Chen, Xue-Mei Jia, You-Su Jia, Xiao-Rong Chen, Hui-Zhu Wang, Wei-Qin Qi
Xiao-Yu Chen, Xue-Mei Jia, You-Su Jia, Xiao-Rong Chen, Hui-Zhu Wang, Wei-Qin Qi, Department of Histology and Embryology,Anhui Medical University, Hefei 230032, Anhui Province, ChinaSupported by Youth Teacher Science and Technology EducationalFoundation of Anhui Province, No. 2003jql24; National NaturalScience Foundation of Anhui Province, No. 2003kj187Correspondence to: Dr. Xiao-Yu Chen, Department of Histologyand Embryology, Anhui Medical University, Hefei 230032, AnhuiProvince, China. [email protected]: +86-551-5161135Received: 2003-06-04 Accepted: 2003-11-06
Abstract
AIM: To study the developmental regularities andheterogeneity of mast cells (MC) in human fetus duodenumand the distribution and developmental regularities ofsubstance P(SP), calcitonin gene-related peptide (CGRP)-immunoreactive (IR) peptidergic nerves in fetus duodenum,as well as the relationship between MC, SP and CGRP- IRpeptidergic nerves.
METHODS: Duodena from 21 cases of human fetus andone term infant were stained by hematoxylin-eosin (HE),toluidine blue (TB) and immunohistochemical avidin-biotinylatedperoxidase complex (ABC) method.
RESULTS: Lobe-shape intestinal villi in duodenum werealready developed at the twelfth week. At the 21st wk,muscular mucosa appeared gradually, and four layers wereobserved in the wall of duodenum. TB staining showedthat the granules in the immature MC were pale violet,while the mature MC were strong violet in color by TBstaining. Connective tissue MC (CTMC) appeared occasionallyin submucosa and muscular layer of duodenum at the16th wk. While the mucosa MC (MMC) appeared at the18th wk. At the 22nd wk, both CTMC and MMC wereactivated, and distributed in the surrounding blood vesselsand ganglions. The verge of some MC were unclear, andshowed degranular phenomena. At the 14th wk, SP andCGRP-IR nerve fibers and cells appeared in the myentericand submucous plexuses in small intestine, and theresponses were turn strongly. Neurons were light to deepbrown, and nerve fibers were present as varicose and linerprofiles. On the corresponding site of serial sections, SPand CGRP immunohistochemical reactions were coexistedin one nerve fiber or cell. Some of MC showed SP andCGRP-IR positive staining.
CONCLUSION: There are two heterogeneous kinds of MCin duodenum, MMC and CTMC. MC might play an importantrole in regulating blood circulation and sensation.
Chen XY, Jia XM, Jia YS, Chen XR, Wang HZ, Qi WQ.Development and distribution of mast cells and neuropeptidesin human fetus duodenum. World J Gastroenterol 2004; 10(22): 3349-3352
http://www.wjgnet.com/1007-9327/10/3349.asp
INTRODUCTIONPrevious microscopic anatomy studies have shown that somaticand visceral nerves are both widely approached to MC. MCand nerve cells interact with each other by connecting witha lemma or degranular style, so that they could regulatemicroenvironments. As far as organizations are concerned, theanatomic relation means interaction with function, but nostudies are available about the development and distributionof MC and developmental regularities of SP, CGRP-IR nervesand cells in human fetus duodenum. BY investigating therelationship between MC and nerve- endocrine- immunologicalnetwork[1-3], we observed the histological changes in humanfetus duodenum with HE staining, the developmentalregularities and heterogeneity of MC with TB specialstaining, neuropeptide SP, CGRP by ABC methods, therelations between neuropeptide and MC. The study providedmorphology data of the functional significance of mast cellsin human fetus duodenum.
MATERIALS AND METHODSTissue specimensTwenty-one fetuses of 3-9 mo old and one dead term infantwere randomly collected within 1-5 h after birth, in which10 were males and 11 were females. Duodena were taken out(near to bulbs), and fixed in 40 g/L formaldehyde for 12 h, cutinto 10 mm×5 mm×3 mm, then embedded in paraffin and cutinto 5µm thick serial section.
TB special stainingThe paraffin embedded sections were deparaffined in serialxylene, dehydrated by alcohol solvents and mounted by xylenetransparent neutral gum, then examined by microscopy andphotographed.
ImmunohistochemistryThe reactions were carried out according to the ABC methodas previously reported[4]. Briefly, the paraffin sections weredeparaffined in xylene and graded alcohol. Sections wereincubated at room temperature for 10 min with 30 mL/L H2O2
solution to block endogenous peroxidase activity. After washedwith phosphate buffered saline (PBS) 3 times for 5 min each,slides were digested with trypsin, treated with 3 g/L TritonX-100, followed by incubation with antibodies SP (1:2 000,Sigma) or CGRP (1:1 000, Sigma) at 37 for 2 h and at 4 for 24 h. The sections were then incubated with biotin-conjugated IgG (diluted in PBS, 1:100) for 2.5 h at roomtemperature and washed with PBS 3 times for 5 min each,followed by incubation with the streptavidin-peroxidasecomplex for 1 h. At last, chromogen 3,3’-diaminobenzidinetetrahydrochloride (DAB) (1:50, Wuhan Boster) was addedto visualize the reaction products of peroxidase. The specific neuropeptide antibodies were replaced byPBS or normal rabbit serum for the negative controls. Adultduodenum tissue sections were used as positive controls, whichshowed immunoreactivity for SP and CGRP. The results were judged as follows. Pale-yellow was

negative (-), shallow brown was weak positive (+), brownwas moderately positive (++), and deep brown was stronglypositive (+++).
RESULTSHE stainingThe histological differentiations were found in lobe-shapeintestinal villi in duodenum at the 12nd wk. At the 15th wk,duodenal glands of mucous cells were formed in thesubmucosa. At the 21st wk, muscular mucosa appeared with4 layers in the wall of duodenum gradually.
TB special stainingThe experiments showed that CTMC in submucosa andmuscular layer appeared by staining with 5 g/L toluidine bluewith 500 mL/L alcohol dyeing for 5 min, but MMC in mucouslayer appeared by staining with 5 g/L toluidine blue with oneequivalent hydrochloric acid for 5 d. At the 16th wk, CTMCappeared occasionally in submoucosa. But the time of MMCappearance was at the 18th wk. The granules in immature MCwere pale violet, and strong violet in the mature MC as detectedby TB special staining. CTMC in intermuscular appearedfusiform and cell bodies were small. MC in mucosa andsubmucosa layer were round or oval in shape and cell bodieswere large (Figure 1A). With the increase of gestational age,the number of MC in duodenal wall increased gradually. Atthe 22nd wk, the two types of MC were activated anddistributed in the surrounding blood vessels and ganglions.The verge of some MC was unclear, which might be a degranularphenomenon (Figure 1B). MC were closed together withconnective tissue cells and there existed lemma connection infetus duodenal mucous and submucous layer connective tissues.
Figure 1 MC in submucous layer at the 21st wk (A) and inmucous layer at the 27th wk (B) of duodenum (TB×400).
Immune phenotypeThe degree of positive SP-immunoreactivity (SP-IR) andCGRP-immunoreactivity (CGRP-IR) and their distribution inneurons and nerve fibers (NF) in fetus duodenum had no sexdifference. At the 14th wk, SP-IR positive neurons appearedoccasionally in the myenteric plexuses of duodenum andneuron cell bodies showed fusiform, few SP-IR-NF appeared
in submucosal layer. But nerve plexuses of CGRP-IR appearedat the 16th wk. Diffused SP and CGRP-IR neurons wereappeared in submucous at the 21st wk, pale-brown neuron cellbodies were round or oval in shape and nuclei were negative(Figure 2B). SP-IR-NF response to reinforcement (+ to ++)was found in myenteric connective tissue, showing stringpearls in shape. A few CGRP-IR-NF appeared in submucous(+), were showing point line in shape. With the growth ofgestational age, nerve fibers were mainly distributed inconnective tissue of mucous, submucous and myenteric layers.Nerve plexus density increased, and staining turned deepgradually. The dark black positive nerve plexuses wereidentified (+++) in fetus duodenum after 34th wk, showingnetwork structures and obvious varicosity (Figure 2B). On thecorresponding site of serial sections, SP-IR and CGRP-IRmaterials were partially coexisted in nerve fibers andneurons. In serial sections of TB histochemistry and ABCimmunohistochemistry staining, about 10% MC were SP-IRpositive, and less MC were CGRP-IR positive. Some of SP,CGRP-IR-NF positive cells were coexisted with MC, whilesome were closely contacted.
Figure 2 CGRP-IR (+) nerve fiber in duodenum submucouslayer at the 21st wk (A) (ABC×100) and SP-IR (++) neuron induodenum submucous layer and myenteric nerve plexuses atthe 28th wk (B) (ABC×200).
DISCUSSIONThe results of our experiment showed that there were two kindsof MC in connective tissue of fetus duodenum, namely MMCand CTMC, which possessed heterogeneity. our results areconsistent with Wang et al.[5]. It might be related to manyfactors such as local microenvironment. The activated MCwere localized around cells, small vessels and ganglions insubmucosa, showing that MC were related with those cellsand tissues. Surface of some MC boundary was not clear. MCshowed degranulation, which means that the cells werereleasing active media and affecting peripheral environmentsand cells, so we considered that MC might take part in allergicand other physiological activities during fetus developmentand maturation of its surrounding tissues and organs. Withelectron microscope, Li et al.[6] observed MC cytoplasm inintestinal mucosa lamina propria had electron dense roundgranules and electron-lucent inequality of size vesicles, which
A
B
A
B
3350 ISSN 1007-9327 CN 14-1219/ R World J Gastroenterol November 15, 2004 Volume 10 Number 22

were phenotype of activated MC. MC were important effectorcells. It conducted the signal of inflammation cells, and inducethe occurrence of mucosa correlated diseases[7-9]. Previousstudies have shown the severity of gastrointestinal allergicdiseases, such as Hp infection, stomach reflow in duodenum,neuro-psychical factor leading gastro-intestinal functionaldyspepsia related with MC, and the more serious the disease,the more obviously increased the numbers of MC[10,11]. MCcould release inflammatory medium, secretory cytokines(IL-2, TNF-α), biologically active molecules throughphospholipase A2 pathway in earlier period of various kindsof enteritis, which could evoke physiological injuries in theintestinal[12-14]. With the growth of gestational age, the numberof MC in bowel wall connective tissue increases gradually,suggesting that MC play an important regulatory role indeveloping tissue cells in duodenum. Our experiment showed that the SP-IR and CGRP-IRpeptidergic nerves plexus appeared at different time. Owingto the difference of local microenvironments in gastrointestinaltract, various kinds of peptidergic nerves appeared in differenttime. This difference was decided by local microenvironmentsof neural crest cells on the way of migration or after itspresence. The occurrence of peptidergic nerves was determinedby interaction of microenvironmental factors and crest cells.Since different investigators used different specimen source,they adopted different methods and techniques, the detectionrate of positive nerve fibers and neurons was different. forexample, Larsson et al.[15] reported that CGRP-IR-NF was notobserved in fetus duodenum mucosa membrane. But Yanget al.[16] reported that developing fetus from the 13th weekshowed mild CGRP-IR-NF in myenteric nerve plexus ofduodenum. There were differences in the distribution of SPand CGRP peptidergic nerve plexus at the same gestationalage. We found that the distribution and response of SP-IR-NFwas slightly higher than those of CGRP-IR-NF in myentericnerve plexus, but CGRP-IR-NF mainly existed in connectivetissue of mucosa and submucosa layers, showing that therewas a difference in distribution of peptidergic nerve fibers inthe same individual organ. They were closely connected withthe presence of digestive tract peptidergic nerve. SP peptidergicnerves exist mainly in duodenum myenteric connective tissue.It could activate cholinergic nerve of gastrointestinal tract,cause neurilemma depolarization in myentenic nerve plexusand increase the effect of acetylcholine, resulting in contractionof digestive tract smooth muscle and secretion of glands[17].CGRP peptidergic nerves exit mainly in mucous and submucouslayers. It is probably related to differentiation of duodenalepithelium and excretion of duodenal gland. CGRP couldexpand blood vessels of gastrointestinal tract and increasecapillary permeability. CGRP could inhibit smooth musclesof gastrointestinal tract and cause relaxation of circular andlongitudinal muscles and decrease duodenum vermiculation[18].Previous studies have reported that decrease of the level ofserum CGRP might be related to Hp infection, leading tooccurrence of duodenal ampulla ulcer[19]. By observing adjacentsections, we found there was partial concordance in localizationof SP-IR and CGRP-IR positive neurons. Therefore it is possiblethat SP and CGRP neurotransmitters coexist in peptidergicnerves. In previous studies, besides the coexistence of CGRP,cells of SP, somatostatin, vasoactive intestinal peptide (VIP)and neuropeptide Y were also coexisted in thymus, sensoryganglion and other organs[18,20,21]. Because SP, CGRP peptidergicnerve fibers project very extensive in central nervous system,it is possible that these neuropeptides together with nervoussystem produce an important effect on sensation, movement,endocrine and other aspects. Gastrointestine SP,CGRP couldregulate stability of MC, which might play an important rolein keeping homeostasis the occurrence and development of
many pathologic alternations. There are a lot of MC in connective tissue of humanduodenum. Meanwhile, there also existed a huge nervoussystem, including rich peptidergic neurotransmitters[22,23].Those made it possible to connect adequate informationbetween MC and nervous system. Gastrointestinal mucous MCare next to gastrointestinal nervous system. It provides doubledirections of channel between center nervous system andintestinal tract. Thus nervous system can influence physiologicalfunctions of gastrointestinal tract. MC could also stimulateintestinal neurons and smooth muscle cells by releasing variouskinds of media[24,25]. By electron microscopy some researchersfound lemma connection was existed between MC plasmalemmaand axon of nonmyelinated nerve fibers in enteron mucosa,form “plywood structure” and synaptic connection[6,26]. As faras organ is concerned, that MC closely contacted with nervesin anatomy means interaction of function by releasing certainactive substances, such as histamine, nitrogen monoxide etc,as transmitters; On the other hand, nerves could affect MCgrowth and development. Animal experiments confirmed thatthe number of MMC and CTMC could be increased by nervegrowth factor (NGF), moreover, NGF receptors have beendiscovered on the surface of MC in rat belly[27]. It has beenconfirmed that SP and VIP are coexisted in MC[28]. Jia et al.[29-31]
observed MC in mouse submandibular glands or tongue, andfound that most of the MC were SP-IR positive, and 14% MCwere CGRP-IR positive. In our studies, we observed that about10% MC in the wall of fetus duodenum were SP-IR positive,but fewer MC were CGRP-IR positive, indicating that MC indifferent species and organs contain different peptidergic activitysubstances. Thus, MC in fetus duodenum possess heterogeneity,whose physiological significance needs further research.
REFERENCES1 Delgado M, Martinez C, Leceta J, Garrido E, Gomariz RP. Dif-
ferential VIP and VIP1 receptor gene expression in rat thymocytesubsets. Peptides 1996; 17: 803-807
2 Wang ZH, Chang XT, Fu XB. Relationship of small intestinal stemcells proliferation differentiation and development. Shijie HuarenXiaohua Zazhi 2001; 9: 1445-1448
3 Ward SM, Ordog T, Bayguinov JR, Horowitz B, Epperson A, ShenL, Westphal H, Sanders KM. Development of interstitial cellsof Cajal and pacemaking in mice lacking enteric nerves. Gastro-enterology 1999; 117: 584-594
4 Nakajima S, Krishnan B, Ota H, Segura AM, Hattori T, GrahamDY, Genta RM. Mast cell involvement in gastritis with or withoutHelicobacter pylori infection. Gastroenterology 1997; 113: 746-754
5 Wang JX, Li JY, Zhang FJ, Zhang HW, Su JQ. Distribution ofmast cells in adult porcine colon. Zhongguo Shouyi Zazhi 2001;37: 5-7
6 Li ZS, Dong WS, Zou DW, Zou XP, Zhang WJ. Enteromucosalmast cells in patients with irritable bowel syndrome. JiefangjunYixue Zazhi 2002; 27: 628-630
7 Metcalfe DD, Baram D, Mekori YA. Mast cells. Physiol Rev 1997;77: 1033-1079
8 Drake-Lee AB, Price J. Ultrastructure of nasal mast cells in nor-mal subjects and patients with perennial allergic rhinitis. JLaryngol Otol 1991; 105: 1006-1013
9 Zhu LR, Li QX, Hou XH. Increase in the number of gastric mu-cosal mast cells in patients with functional dyspepsia.Weichangbingxue 2002; 7: 27-29
10 Gu CM, Ke MY, Zhang SQ, Jiang YX, Liu YP. An tropyloroduodenaldyscoordination in functional dyspepsia studied by color Dop-pler flow imaging. Zhonghua Neike Zazhi 1998; 37: 511-514
11 Li W, Zheng TZ, Qu SY. Effect of cholecystokinin and secretinon contractile activity of isolated gastric muscle strips in guinea pigs. World J Gastroenterol 2000; 6: 93-95
12 Beil WJ, Schulz M, McEuen AR, Buckley MG, Walls AF. Number,fixation properties, dye-binding and protease expression ofduodenal mast cells: comparisons between healthy subjects and
Chen XY et al. Mast cells and neuropeptides in human fetus duodenum 3351
patients with gastritis or Crohn’s disease. Histochem J 1997; 29:759-773
13 Pool V, Braun MM, Kelso JM, Mootrey G, Chen RT, YungingerJW, Jacobson RW, Gargiullo PM. Prevalence of anti-gelatin IgEantibodies in people with anaphylaxis after measles-mumps ru-bella vaccine in the United States. Pediatrics 2002; 110: E71
14 Gu CM. Progress of study on gastrointestinal motility. Shijie YixueZazhi 1999; 3: 82-85
15 Larsson LT, Helm G, Malmfors G, Sundler F. Ontogeny of pep-tide-containing neurons in human gut-an immunocytochemicalstudy. Regul Pept 1987; 17: 243-256
16 Yang T, Cai WQ. Ontogeny of 6 types of peptidergic nerves ofsmall intestine in human fetuses. Jiepou Xuebao 1994; 25: 84-87
17 Lu CL, Substance P. reference: Lu Changlin ed, Basic and clinicalof neuropeptide. 1st ed. Shanghai: Secondary Military MedicineUniversity Press 2000: 138-141
18 Wang XQ. Calcitonin gene related peptide. reference: LuChanglin ed, Basic and clinical of neuropeptide. 1st ed. Shanghai:Secondary Military Medicine University Press 2000: 195-196
19 Liu CQ, Pu J, Li ZX. Changes of duodenal ulcer with peptidehormone in plasma. Shijie Yixue Zazhi 2000; 8: 10-12
20 Pan XF, Sun PW, Zhu XH. An immunohistochemical study onneuropeptides in the thymus of adult BALB/c mice. Beijing YikeDaxue Xuebao 1998; 30: 508-514
21 Huang XQ. Somatostatin—Probably the most widely effectivegastrointestinal hormone in human body. Huaren Xiaohua Zazhi1998; 6: 93-96
22 Ke MY. Study on diseases of gastrointestinal motility. 1st ed.
Beijing: The Publishing Company of Science 1996: 3-3723 Pan XZ, Cai LM. Study on gastrointestinal hormones at the
present stage. Shijie Yixue Zazhi 1999; 7: 464-46624 Ruhl A, Berezin I, Collins SM. Involvement of eicosanoids and
macrophage-like cells in cytokine –mediated changes in rat my-enteric nerves. Gastroenterology 1995; 109: 1852-1862
25 Suzuki R, Furuno T, McKay DM, Wolvers D, Teshima R,Nakanishi M, Bienenstock J. Direct neurite-mast cell communi-cation in vitro occurs via the neuropeptide substance P. J Immunol1999; 163: 2410-2415
26 Zhai LP, An W, Yan ML, Qiao CJ, Zhang Z. Ultrastructural fea-tures of human fetal mast cells in gastrointestinal tract. JiepouxueZazhi 1997; 20: 57-60
27 Lan W, Tang CW. Effects of gut peptides on the activation ofmast cells from rat intestinal mucosa in vitro. Zhongguo MingyixueZazhi 2002; 18: 847-851
28 Feng Y, Wu JL, Wang YN. Histochemical and immunohis-tochemical observations on heterogeneity in mast cells of rat.Jiepou Xuebao 1999; 20: 90-94
29 Jia XM, Jia YS, Qi WQ, Wang HZ. The heterogeneity Of mastcells in mouse submandibular gland. Jiepouxue Zazhi 1996; 19:344-347
30 Jia XM, Jia YS, Wang DB, Qi WQ. Localization study on sub-stance P, vasoactive intestinal peptide and neuropeptide Y in rattongue mast cells. Jiepouxue Zazhi 1998; 21: 242-245
31 Jia YS, Jiang Y, Qi WQ, Wang HZ. Study on distribution ofFVIP- and SP- immunoreactive nerves in human duodenum.Zhangguo Zuzhi Huaxue Yu Xibao Huaxue Zazhi 1999; 8: 282-285
Edited by Kumar M and Wang XL Proofread by Xu FM
3352 ISSN 1007-9327 CN 14-1219/ R World J Gastroenterol November 15, 2004 Volume 10 Number 22

PO Box 2345, Beijing 100023, China World J Gastroenterol 2004;10(22):3353-3355Fax: +86-10-85381893 World Journal of GastroenterologyE-mail: [email protected] www.wjgnet.com Copyright © 2004 by The WJG Press ISSN 1007-9327
• BRIEF REPORTS •
Protective effect of rhIL-1βββββ on pancreatic islets of alloxan-induced
diabetic rats
Li-Ping Wu, Li-Hua Chen, Jin-Shan Zhang, Lan Sun, Yuan-Qiang Zhang
Li-Ping Wu, the Second Department of Geriatrics and Gerontology,Xijing Hospital, Fourth Military Medical University, Xi’an 710032,Shaanxi Province, ChinaLi-Hua Chen, Department of Immunology, the Fourth MilitaryMedical University, Xi’an 710032, Shaanxi Province, ChinaJin-Shan Zhang, Lan Sun, Yuan-Qiang Zhang, Department ofHistology and Embryology, the Fourth Military Medical University,Xi’an 710032, Shaanxi Province, ChinaSupported by the National Natural Science Foundation of China, No.39870109Co-correspondents: Li-Hua ChenCorrespondence to: Professor Yuan-Qiang Zhang, Department ofHistology and Embryology, the Fourth Military Medical University,169 Changle West Road, Xi’an 710032, Shaanxi Province,China. [email protected]: +86-29-83374508 Fax: +86-29-83374508Received: 2003-11-04 Accepted: 2003-12-08
Abstract
AIM: To observe the protective effect of rhIL-1β on pancreaticislets of alloxan-induced diabetic rats.
METHODS: Protection of rhIL-1β on pancreatic islets ofalloxan-induced diabetic rats (n = 5) was demonstrated withmethods of immunohistochemistry and stereology. Theconcentration of serum glucose was measured by GODmethod and that of serum insulin by RIA.
RESULTS: The concentration of serum glucose increasedbut that of insulin decreased after administration of alloxan(150 mg/kg), and the volume density and numerical densityof the islets were zero. In rhIL-1β pretreated rats,although the concentration of serum insulin decreased (from11.9±3.0 mIU/L to 6.1±1.6 mIU/L, P<0.05), that of glucosewas at normal level compared with the control group.As compared with alloxan group, the concentration ofserum glucose in rhIL-1β pretreated rats decreased (from19.4±8.9 mmol/L to 12.0±4.0 mmol/L, P<0.05) and thevolume density increased(0/L to. 1/L, P<0.05).
CONCLUSION: rhIL-1β pretreatment may have protectiveeffect on the islets of alloxan-induced diabetic rats.
Wu LP, Chen LH, Zhang JS, Sun L, Zhang YQ. Protective effectof rhIL-1β on pancreatic islets of alloxan-induced diabetic rats.World J Gastroenterol 2004; 10(22): 3353-3355
http://www.wjgnet.com/1007-9327/10/3353.asp
INTRODUCTIONThe cytokine interleukin-1β (IL-1β) can not only promoteimmunological reaction but also regulate neuro-endocrinesystem[1]. Previous studies found that IL-1β could stimulatethe central adrenalin system, promote production of PG, anddownregulate glucose metabolism[2]. Diabetes mellitus implicates many organs and tissues. It hasbeen found that IL-1β decreases serum glucose in experimental
animals and may potentially be therapeutic for diabetesmellitus[3,4]. In this experiment, we observed changes in serumglucose and insulin in alloxan induced diabetic rats treated withIL-1β. In addition, we detected the variation of volume densityand numerical density of insulin positive pancreatic islets byABC immunohistochemistry and stereology.
MATERIALS AND METHODSAnimalsTwenty male Sprague-Dawley rats weighing 200 to 300 g werehoused in a temperature-controlled room (24±1 ) with a 12-hlight-dark cycle. The rats were provided with ordinary rat chowand water and divided into 4 groups (n = 5, every group): (1)Control group, each rat was injected with 2 mL saline every otherday for 3 times, then injected with 2 mL saline on the 7th d; (2)rhIL-1β group, each rat was injected with 1×10⁴ U rhIL-1β in2 mL saline every other day for 3 times, then injected with 2 mLsaline on the 7th d; (3) rhIL-1β pretreated group, each rat wasinjected with 1×10⁴ U rhIL-1β in 2 mL saline every other day for3 times, then was injected with 150 mg/kg alloxan in 2 mL salineon the 7th d; (4) Alloxan group, each rat was injected with 2 mLsaline every other day for 3 times, then injected with 150 mg/kgalloxan in 2 mL saline on the 7th d.
ReagentsGuinea pig anti-rat insulin antibody and SPA-HRP were preparedby Professor Yun-Long Zhu (Department of Physiology) andProfessor Cai-Fang Xue (Department of Parasitology) of ouruniversity respectively. DAB was purchased from Sigma.
Tissue preparationForty-eight hours after last injection of alloxan or saline, ratswere anesthetized with ether and sacrificed by cervical dislocation.The blood was collected into heparinised tubes (50 kU/L) andcentrifuged (3 000 g, 10 min, at room temperature). Plasma wasaspirated and stored at -70 until assayed as described below.The pancreas was also removed and fixed in Bouin’s solutionovernight. Each piece was embedded in paraffin and 4-µmsections were prepared.
ImmunohistochemistryFour-micrometer sections from rat pancreas were employed forimmunohistochemical analysis. Several dilutions of the antibodywere tested to find the optimal staining concentration before theentire series was processed. The staining procedure was carriedout as previously reported, but without protease treatment.Briefly, (1) the sections were deparaffinized in xylene, hydratedin ethanol, and blocked with 3 mL/L H2O2 in methanol for 30 minto remove endogenous peroxides, then treated with 30 mL/Lnormal goat serum for 40 min and rinsed in 0.01 mol/L PBS. (2)The sections were incubated at 4 for 24 h with primaryantibody, guinea pig anti-rat insulin antibody (1:1 000 dilution,final concentration 5 mg/L); (3) then with secondary antibody,SPA-HRP (1:200 dilution), at room temperature for 1 h. (4)Peroxidative reaction was performed using DAB as chromogen.The sections were washed three times for 10 min after incubation.

3354 ISSN 1007-9327 CN 14-1219/ R World J Gastroenterol November 15, 2004 Volume 10 Number 22
All slides were stained at the same time and under identicalconditions. Primary antibodies were replaced by irrelevantantibodies and normal guinea pig serum as specific antibodycontrol. Primary antibody was replaced by PBS as negativecontrol. Primary antibody was omitted as blank control.
Detection of serum glucose and insulinThe concentration of serum glucose was measured by routineGOD method[5] and the concentration of serum insulin wasmeasured by RIA[6,7]. Every sample was measured three timesand the results were displayed as mean±SD.
MorphometryFive specimens from each group were used for morphometricanalysis of slides processed for light microscopy. Two sectionsfrom each specimen were then selected and five different regionsof each section were chosen for the measurement of volumedensity and number density by double blind method.
Statistical analysisThe results were calculated by the following formula; Nv =2/3×π×NA×U (AT×A); Vv = A/AT. Data were analyzed by χ2
test. A P value of less than 0.05 was considered statisticallysignificant.
RESULTSInsulin expression in rat pancreasThere were more insulin immunoreactive cells in pancreas ofcontrol group and rhIL-1β group than in alloxan group.Immunoreactive cells were mainly located in the central region
of the pancreas. Insulin immunopositive cells had dark-brownreaction products in the cytoplasm mostly and nuclei were notstained (Figure 1A, B). The number of insulin immunopositivecells in alloxan group decreased remarkably and there wereonly a few positive cells in each pancreatic islet (Figure 1C).The number of insulin immunopositive cells in rat pancreas ofrhIL-1β pretreated group decreased slightly compared with thatof control group and rhIL-1β group, whereas, the number ofinsulin immunopositive cells in rat pancreas of rhIL-1β pretreatedgroup increased remarkably compared with that of alloxan group(Figure 1D).
Destructive effect of alloxan on rat pancreatic B cellsThe concentration of serum glucose increased significantlybut that of insulin decreased remarkably after administration ofalloxan (150 mg/kg) for 48 h compared with those of controlrats. At the same time, the volume density and numerical densityof the islets were zero (Table 1).
Stimulatory effect of rhIL-1β β β β β on insulin secretionCompared with control group rats, the concentration of seruminsulin in rhIL-1β group rats increased significantly whereasthat of glucose was at normal level. Immunohistochemistry andstereology data showed that there were no significant differencesin the number density and volume density of the pancreaticislets between rhIL-1β group rats and control rats (Table 1).
Protective effect of rhIL-1βββββ on pancreatic islets of alloxan-induced diabetic ratsIn rhIL-1β pretreated group, when the rats were injected with
Table 1 Protective effect of rhIL-1β on pancreatic islets of alloxan-induced diabetic rats
Group Serum glucose Serum insulin Volume density Number density (mmol/L, n = 5) (mIU/L, n = 5) (/L, n = 50) (/µm2, n = 50)
Control 8.4±0.3 11.9±3.0 0.6±0.7 5.2±4.1Alloxan 19.4±8.9a 4.7±1.0a 0a 0a
rhIL-1β 8.0±1.3 20.0±6.6a 0.6±0.5 5.6±5.3rhIL-1β pretreated 12.0±4.0 6.1±1.6a 0.1±0.1a 5.0±5.7
aP<0.05 vs control.
Figure 1 Insulin immunoreactive cells in pancreas. ABC method ×264 A: control group. B: rhIL-1β pretreated rat. C: alloxan-induced diabetic rat. D: rhIL-1β pretreated alloxan-induced diabetic rat.
A B
C D

alloxan for 48 h, although the concentration of serum insulindecreased significantly, that of glucose was at normal levelcompared with control group rats. Immunohistochemistry andstereology data showed that there were no significant differencesin the number density of the pancreatic islets between rhIL-1βpretreated rats and control rats, whereas the volume densitydecreased markedly in rhIL-1β pretreated group (Table 1).
DISCUSSIONInterleukin 1β (IL-1β) is a multi-functional cytokine synthesizedmainly by mononuclear/mo cells and is a key factor in the cytokinenetwork[8,9]. IL-1β has many biological functions[9-21]. Previousstudy showed that IL-1β could decrease the serum glucose leveland might be potentially a new drug for diabetes therapy[2-4].In our experiment, when the rats were injected with alloxan(150 mg/kg) for 48 h, the concentration of serum glucoseincreased significantly, and that of insulin decreased remarkably.At the same time immunohistochemistry and stereology datashowed that the value of number density and volume density ofthe pancreatic islets were zero. In rhIL-1β pretreated group,when the rats were injected with alloxan for 48 h, although theconcentration of serum insulin decreased significantly, that ofglucose was at normal level compared with control group rats.Immunohistochemistry and stereology data showed that therewere no significant differences in the number density of thepancreatic islets between rhIL-1β pretreated rats and controlrats, whereas the volume density decreased remarkably inrhIL-1β pretreated rats. Our results suggest that rhIL-1β hasprotective effect on pancreatic islets of alloxan-induced diabeticrats and provide the experimental evidence that rhIL-1β may bea new therapeutic drug for diabetes.
REFERENCES1 Song Y, Shi Y, Ao LH, Harken AH, Meng XZ. TLR4 mediates
LPS-induced HO-1 expression in mouse liver: Role of TNF-alpha and IL-1beta. World J Gastroenterol 2003; 9: 1799-1803
2 Lee SH, Woo HG, Baik EJ, Moon CH. High glucose enhancesIL-1beta-induced cyclooxygenase-2 expression in rat vascularsmooth muscle cells. Life Sci 2000; 68: 57-67
3 Ikeda U, Shimpo M, Murakami Y, Shimada K. Peroxisomeproliferator-activated receptor-gamma ligands inhibit nitricoxide synthesis in vascular smooth muscle cells. Hypertension2000; 35: 1232-1236
4 Doxey DL, Cutler CW, Iacopino AM. Diabetes prevents peri-odontitis-induced increases in gingival platelet derived growthfactor-B and interleukin 1-beta in a rat model. J Periodontol1998; 69: 113-119
5 Nakashima E, Nakamura J, Hamada Y, Koh N, Sakakibara F,Hotta N. Interference by gliclazide in the glucose oxidase/peroxidase method for glucose assay. Diabetes Res Clin Pract1995; 30: 149-152
6 Li C, Chen P, Vaughan J, Blount A, Chen A, Jamieson PM,Rivier J, Smith MS, Vale W. Urocortin III is expressed in pan-creatic beta-cells and stimulates insulin and glucagon secretion.Endocrinology 2003; 144: 3216-3224
Wu LP et al. rhIL-1β on pancreatic islets of alloxan-induced diabetic rats 3355
7 Durant S, Alves V, Coulaud J, Homo-Delarche F. Nonobesediabetic (NOD) mouse dendritic cells stimulate insulin secre-tion by prediabetic islets. Autoimmunity 2002; 35: 449-455
8 Amel Kashipaz MR, Swinden D, Todd I, Powell RJ. Normalproduction of inflammatory cytokines in chronic fatigue andfibromyalgia syndromes determined by intracellular cytokinestaining in short-term cultured blood mononuclear cells. ClinExp Immunol 2003; 132: 360-365
9 Musabak U, Bolu E, Ozata M, Oktenli C, Sengul A, Inal A,Yesilova Z, Kilciler G, Ozdemir IC, Kocar IH. Gonadotropintreatment restores in vitro interleukin-1beta and tumour necro-sis factor-alpha production by stimulated peripheral bloodmononuclear cells from patients with idiopathic hypogonadotropichypogonadism. Clin Exp Immunol 2003; 132: 265-270
10 Hasegawa K, Ichiyama T, Isumi H, Nakata M, Sase M,Furukawa S. NF-kappaB activation in peripheral blood mono-nuclear cells in neonatal asphyxia. Clin Exp Immunol 2003; 132:261-264
11 Tsirpanlis G, Chatzipanagiotou S, Ioannidis A, Ifanti K, BagosP, Lagouranis A, Poulopoulou C, Nicolaou C. The effect ofviable Chlamydia pneumoniae on serum cytokines and adhe-sion molecules in hemodialysis patients. Kidney Int Suppl 2003;84: S72-75
12 Li L, Jacinto R, Yoza B, McCall CE. Distinct post-receptoralterations generate gene- and signal-selective adaptation andcross-adaptation of TLR4 and TLR2 in human leukocytes. JEndotoxin Res 2003; 9: 39-44
13 Allan SM, Pinteaux E. The interleukin-1 system: an attractiveand viable therapeutic target in neurodegenerative disease. CurrDrug Target CNS Neurol Disord 2003; 2: 293-302
14 Boche D, Cunningham C, Gauldie J, Perry VH. Transforminggrowth factor-beta 1-mediated neuroprotection against excitotoxicinjury in vivo. J Cereb Blood Flow Metab 2003; 23: 1174-1182
15 Abe T, Sugano E, Saigo Y, Tamai M. Interleukin-1beta andbarrier function of retinal pigment epithelial cells (ARPE-19):aberrant expression of junctional complex molecules. InvestOphthalmol Vis Sci 2003; 44: 4097-4104
16 Molina-Holgado F, Pinteaux E, Moore JD, Molina-Holgado E,Guaza C, Gibson RM, Rothwell NJ. Endogenous interleukin-1receptor antagonist mediates anti-inflammatory andneuroprotective actions of cannabinoids in neurons and glia. JNeurosci 2003; 23: 6470-6474
17 Boutin H, Kimber I, Rothwell NJ, Pinteaux E. The expandinginterleukin-1 family and its receptors: do alternative IL-1 re-ceptor/signaling pathways exist in the brain? Mol Neurobiol2003; 27: 239-248
18 Jeremy AH, Holland DB, Roberts SG, Thomson KF, CunliffeWJ. Inflammatory events are involved in acne lesion initiation.J Invest Dermatol 2003; 121: 20-27
19 Xie Z, Morgan TE, Rozovsky I, Finch CE. Aging and glial re-sponses to lipopolysaccharide in vitro: greater induction of IL-1 and IL-6, but smaller induction of neurotoxicity. Exp Neurol2003; 182: 135-141
20 Lu M, Zhang M, Kitchens RL, Fosmire S, Takashima A, MunfordRS. Stimulus-dependent deacylation of bacterial lipopolysac-charide by dendritic cells. J Exp Med 2003; 197: 1745-1754
21 Wheeler RD, Brough D, Le Feuvre RA, Takeda K, Iwakura Y,Luheshi GN, Rothwell NJ. Interleukin-18 induces expressionand release of cytokines from murine glial cells: interactionswith interleukin-1 beta. J Neurochem 2003; 85: 1412-1420
Edited by Zhu LH Proofread by Xu FM

PO Box 2345, Beijing 100023, China World J Gastroenterol 2004;10(22):3356-3360Fax: +86-10-85381893 World Journal of GastroenterologyE-mail: [email protected] www.wjgnet.com Copyright © 2004 by The WJG Press ISSN 1007-9327
• BRIEF REPORTS •
Three new alternative splicing variants of human cytochrome P450
2D6 mRNA in human extratumoral liver tissue
Jian Zhuge, Ying-Nian Yu
Jian Zhuge, Ying-Nian Yu, Department of Pathophysiology,Environmental Genomics Center, School of Medicine, ZhejiangUniversity, Hangzhou 310031, Zhejiang Province, ChinaSupported by the National Key Basic Research and DevelopmentProgram of China, No. 2002CB512901, National Natural ScienceFoundation of China, No.39770868 and Natural Science Foundationof Zhejiang Province, No.397490Correspondence to: Professor Ying-Nian Yu, Department ofPathophysiology, School of Medicine, Zhejiang University, Hangzhou310031, Zhejiang Province, China. [email protected]: +86-571-87217149 Fax: +86-571-87217149Received: 2004-01-10 Accepted: 2004-02-24
Abstract
AIM: To identify the new alternative splicing variants ofhuman CYP2D6 in human extratumoral liver tissue withRT-PCR and sequencing.
METHODS: Full length of human CYP2D6 cDNAs wasamplificated by reverse transcription-polymerase chainreaction (RT-PCR) from a human extratumoral liver tissueand cloned into pGEM-T vector. The cDNA was sequenced.Exons from 1 to 4 of human CYP2D6 cDNAs were alsoamplificated by RT-PCR from extratumoral liver tissues of17 human hepatocellular carcinomas. Some RT-PCRproducts were sequenced. Exons 1 to 4 of CYP2D6 genewere amplified by PCR from extratumoral liver tissue DNA.Two PCR products from extratumoral liver tissues expressingskipped mRNA were partially sequenced.
RESULTS: One of the CYP2D6 cDNAs had 470 nucleotidesfrom 79 to 548 (3’ portion of exons 1 to 5’ portion of exon 4),and was skipped. Exons 1 to 4 of CYP2D6 cDNA wereassayed with RT-PCR in 17 extratumoral liver tissues. Bothwild type and skipped mRNAs were expressed in 4 samples,only wild type mRNA was expressed in 5 samples, andonly skipped mRNA was expressed in 8 samples. Two morevariants were identified by sequencing the RT-PCR productsof exons 1 to 4 of CYP2D6 cDNA. The second variant skipped411 nucleotides from 175 to 585. This variant was identifiedin 4 different liver tissues by sequencing the RT-PCRproducts. We sequenced partially 2 of the PCR productsamplified of CYP2D6 exon 1 to exon 4 from extratumoralliver tissue genomic DNA that only expressed skipped mRNAby RT-PCR. No point mutations around exon 1, intron 1, andexon 4, and no deletion in CYP2D6 gene were detected. Thethird variant was the skipped exon 3 , and 153 bp was lost.
CONCLUSION: Three new alternative splicing variants ofCYP2D6 mRNA have been identified. They may not becaused by gene mutation and may lose CYP2D6 activityand act as a down-regulator of CYP2D6.
Zhuge J, Yu YN. Three new alternative splicing variants ofhuman cytochrome P450 2D6 mRNA in human extratumoralliver tissue. World J Gastroenterol 2004; 10(22): 3356-3360
http://www.wjgnet.com/1007-9327/10/3356.asp
INTRODUCTIONOver 90% medications are metabolized by cytochrome P450 (CYP)family of liver isoenzymes[1]. The most important enzymes areCYP1A2, 3A4, 2C9/19, 2D6 and 2E1. Although CYP2D6 accountsfor <2% of the total CYP liver enzyme, nevertheless it mediatesmetabolism in 25% of drugs in clinical use such as antipsychotics,antidepressants, beta-blockers, antiarrhythmic agents andopiates[2]. CYP2D6 exhibits an extensive polymorphism[3]. Over40 CYP2D6 allelic variants have been reported[4]. Pre-mRNA splicing involves precise removal of introns frompre-mRNA, such that exons are spliced together to form matureRNAs with intact translation reading frames. Splicing requiresexon recognition, followed by accurate cleavage and rejoining,which are determined by the invariant GU and AG intronicdinucleotides at the 5’ (donor) and 3’ (acceptor) exon-intronjunctions, respectively[5]. Human genes typically containmultiple introns, and in many cases the exons can be joined inmore than one way to generate multiple mRNAs, encodingdistinct protein isoforms. This process named alternativesplicing is a major mechanism for modulating the expression ofcellular and viral genes and enables a single gene to increaseits coding capacity, allowing synthesis of several structurallyand functionally distinct protein isoforms[6-9]. CYP2D subfamily comprises CYP2D6 gene and psudogenes,i.e. CYP2D7P and CYP2D8BP. Six mRNA splice variants ofCYP2D have been identified in human liver[10], breast[11], lung[12],and brain tissues[13]. Variants a and b retain intron 5 and 6,respectively; variant b’ has missed the 3’ 91 bp portion of exon6; variant c has missed exon 6; variant d retains 57 bp portion ofintron 6; variant e retains the 3’ portion of intron 6 and hasmissed the 61 bp fragment at the 3’ end of exon 6. Forms b’ andc are variants of CYP2D6, and forms d, c, b, b’ are variants ofCYP2D7P[10-13]. All of these CYP2D splice variant mRNAsdisrupt open reading frames. If they are translated, they wouldnot have CYP2D6 function. Three new pre-mRNA alternative splicing variants of humanCYP2D6 in human extratumoral liver tissue were identified byRT-PCR and sequencing.
MATERIALS AND METHODS
MaterialsMoloney murine leukemia virus (M-MuLV) reverse transcriptasewas supplied by MBI Fermentas AB, Lithuania. Randomhexamer primers, T4 DNA ligase and pGEM-T vector systemwere supplied by Promega Corp. PCR primers, DNA sequenceprimers, dNTPs and Taq DNA polymerase were synthesized orsupplied by Shanghai Sangon Biotechnology Co. DNAsequencing kit was purchased from Perkin-Elmer Corp. Diethylpyrocarbonate (DEPC) was from Sigma Chemical Co. DNA gelextraction kit was from Hangzhou V-gene Biotechnology Ltd.Other chemical reagents used were all of analytical purity fromcommercial sources. Extratumoral liver tissue samples werecollected from patients undergoing hepatocellular carcinomaresection at affiliated hospitals of Zhejiang University Schoolof Medicine and stored at -70 .

Cloning and sequencing of human CYP2D6 cDNA from a humanextratumoral liver tissueTotal RNA was extracted from a human extratumoral liver tissuefrom a Han nationality Chinese with AGPC method[14]. RT-PCRamplifications were described before[15,16]. Two specific 28 meroligonucleotide PCR primers were designed according to cDNAsequence of CYP2D6 reported by Gonzalez et al.[10] (GenBankaccession no. NM_000106). The sequence of sense primer(CYP2D6 F) corresponds to base position of -39 to -12, i.e. 5’-AGGTGTGTCTCGAGGAGCCCATTTGGTA -3’, with a restrictionsite of XhoI (underlined), and the antisense one (CYP2D6 R),corresponds to base position from 1 503 to 1 530, i.e. 5’-TGGCTAGGGATCCGGCTGGGGACTAGGT-3’, with a restrictionsite of BamH I (underlined). The anticipated PCR products were1.569 kb in length. PCR was performed at 94 for 5 min, then35 cycles, each at 94 for 60 s, at 62 for 60 s, at 72 for 2 min,and a final extension at 72 for 10 min. An aliquot (10 µL) fromPCR was subjected to electrophoresis in a 10 g/L agarose gel.The PCR products were ligated with pGEM-T vector, andtransformed into E. coli DH5α. The CYP2D6 cDNA cloned inpGEM-T was sequenced by dideoxy chain-termination methodmarked with BigDye with primers of T7 and SP6 promoters and aspecific primer of 5’-ACCTCATGAATCACGGCAGT-3’ (nt 1 069to 1 088) on Perkin-Elmer-ABI Prism 310 automated DNA sequencer.
RT-PCR and sequencing analysis of liver transcripts of CYP2D6exons 1 to 4Transcripts of CYP2D6 exons 1 to 4 were assayed with RT-PCRusing 17 extratumoral liver tissues from Han nationality Chinese,with CYP2D6 F and CYP2D6 4R primer: 5’-GCAGAAAGCCCGACTCCTCCTTCA-3’ (nt 638 to 661). Simultaneously the beta-actin (GenBank accession no. NM_001101) cDNA fragment wasamplified in the same Eppendorf tube as an internal control[17].The sequences of sense and antisense primers used for amplificationof beta-actin cDNA fragment were 5’- TCCCTGGAGAAGAGCTACGA-3’ (nt 776 to 795) and 5’-CAAGAAAGGGTGTAACGCAAC-3’ (nt 1 217 to 1 237) respectively. The anticipated PCR productsof CYP2D6 exons 1 to 4 were 700 bp in length, and those of beta-actin were 462 bp. PCR was performed at 94 for 3 min, then 35cycles, each at 94 for 30 s, at 62 for 30 s, at 72 for 45 s, anda final extension at 72 for 7 min. An aliquot (10 µL) from PCRwas subjected to electrophoresis in a 17 g/L agarose gel. SeveralRT-PCR products of CYP2D6 exons 1 to exon 4 were shorter thanthe anticipated full length of 700 bp. The shorter RT-PCR productswere separated by agarose gel electrophoresis and extracted usingDNA gel extraction kit according to the manufacturer’s instructions,and then sequenced by dideoxy chain-termination method markedwith BigDye with primer of CYP2D6 F on Perkin-Elmer-ABI Prism310 automated DNA sequencer.
Sequencing identification of exon 1 to exon 4 of CYP2D6 geneGenomic DNA of human extratumoral liver tissues expressed fulllength of CYP2D6 exons 1 to 4 only (3 samples), or only exonsskipped (2 samples) or both of full length and skipped ones (3samples) were extracted according to the methods reported byGross-Bellard et al[18]. The segment of CYP2D6 gene from exons1 to 4 was amplified with CYP2D6 F and CYP2D6 4R primers. Theanticipated PCR products were 2043 bp (from 1581 to 3623) inlength. Two PCR products from extratumoral liver tissues that onlyexpressed skipped mRNA were partially sequenced by RT-PCR.
RESULTSIdentification of a new alternative splicing variant from a cDNA cloneDuring cloning of CYP2D6 cDNA, a 1.1 kb RT-PCR productwas obtained, which was much shorter than anticipated 1.57 kb(Figure 1).
Figure 1 Electrophoresis of RT-PCR products of CYP2D6cDNA. Lane 1: 1 kb DNA marker, 2: Amplification of 1.1 kb insize, 3: Amplification of full length of 1.57 kb.
Figure 2 Partial sequences of the cloned human CYP2D6 cDNA.The upper sequence represents the sense strand and the un-derside sequence represents the sequenced anti-sense strand.
Figure 3 Representative electrophoresis of RT-PCR products ofexons 1 to 4 of CYP2D6 from human liver tissues and HepG2cells with beta-actin as internal control (464 bp). Lane 1: 100 bpmarker, lane 2: A sample having both full length of 700 bp andshorter 300 bp, lane 3: A sample having only shorter ones (300 bp),lane 4: HepG2 cells having no CYP2D6 expressed, Lane 5: A samplehaving only full length 700 bp of exons 1 to 4 of CYP2D6.
Figure 4 Partial sequences of two alternative splicing variantsof CYP2D6. A: Part of skipped exon 1, exon 2, exon 3, and partof exon 4. B: Skipped exon 3.
kb 1 2 3
1.5
1.0
0.5
EXON 4 EXON 1
3 ’ C T C C G C T A G T G C A A C C G C G - 5 ’
5 ’ G A G G C G A T C A C G T T G G C G C - 3 ’
bp 1 2 3 4 5
500300100
Exon 1 Exon 4
180 190 200 210
CACCATACTGCTTCGAGTACGACGACCCTCGC
Exon 2 Exon 4
360 370 380 390
GGGCCGCGTTCCCAAGGACGCCCCTTTCGCCCCA
Zhuge J et al. Alternative splicing variants of CYP2D6 3357
β-actin
A
B

5’-AGGTGTGTCTCGAGGAGCCCATTTGGTA-3’ CYP2D6F PrimerCYP2D6 cDNA AGGTGTGTCCAGAGGAGCCCATTTGGTAGTGAGGCAGGT -1CYP2D7 BP AGGTGTGTCCAGAGGAGCCCATTTGGTAGTGAGGCAGGTCYP2D6 variant fCYP2D6 variant gCYP2D6 variant h
Exon 1ATGGGGCTAGAAGCACTGGTGCCCCTGGCCGTGATAGTGGCCATCTTCCTGCTCCTGGTG 60ATGGGGCTAGAAGCACTGGTGCCCCTGGCCGTGATAGTGGCCATCTTCCTGCTCCTGGTGATGGGGCTAGAAGCACTGGTGCCCCTGGCCGTGATAGTGGCCATCTTCCTGCTCCTGGTGATGGGGCTAGAAGCACTGGTGCCCCTGGCCGTGATAGTGGCCATCTTCCTGCTCCTGGTGATGGGGCTAGAAGCACTGGTGCCCCTGGCCGTGATAGTGGCCATCTTCCTGCTCCTGGTG
GACCTGATGCACCGGCGCCAACGCTGGGCTGCACGCTACCCACCAGGCCCCCTGCCACTG 120GACCTGATGCACCGGCGCCAACGCTGGGCTGCACGCTACTCACCAGGCCCCCTGCCACTGGACCTGATGCACCGGCGC-----------------------------------------------------------------------------------------------------GACCTGATGCACCGGCGCCAACGCTGGGCTGCACGCTACTCACCAGGCCCCCTGCCACTGGACCTGATGCACCGGCGCCAACGCTGGGCTGCACGCTACTCACCAGGCCCCCTGCCACTG
CCCGGGCTGGGCAACCTGCTGCATGTGGACTTCCAGAACACACCATACTGCTTCGACCAG! 180CCCGGGCTGGGCAACCTGCTGCATGTGGACTTCCAGAACACACCATACTGCTTCGACCAG!-------------------------------------------------------------------------------------------------------------------------------------------------!CCCGGGCTGGGCAACCTGCTGCATGTGGACTTCCAGAACACACCATACTGCTTC---------------!CCCGGGCTGGGCAACCTGCTGCATGTGGACTTCCAGAACACACCATACTGCTTCGACCAG!
Exon 2TTGCGGCGCCGCTTCGGGGACGTGTTCAGCCTGCAGCTGGCCTGGACGCCGGTGGTCGTG 240TTGCGGCGCCGCTTCGGGGACGTGTTCAGCCTGCAGCTGGCCTGGACGCCGGTGGTCGTGTTGCGGCGCCGCTTCGGGGACGTGTTCAGCCTGCAGCTGGCCTGGACGCCGGTGGTCGTG--------------------------------------------------------------------------------------------------------------------------------------------------------------------------------------------------------------------------------------------------------------------------------------------------
CTCAATGGGCTGGCGGCCGTGCGCGAGGCGCTGGTGACCCACGGCGAGGACACCGCCGAC 300CTCAATGGGCTGGCGGCCGTGCGCGAGGCGATGGTGACCCGCGGCGAGGACACGGCCGAC----------------------------------------------------------------------------------------------------------------------------------------------------------------------------------------------------------------------------------------------------------------------------------------------------------CTCAATGGGCTGGCGGCCGTGCGCGAGGCGCTGGTGACCCACGGCGAGGACACCGCCGAC
CGCCCGCCTGTGCCCATCACCCAGATCCTGGGTTTCGGGCCGCGTTCCCAAG!GGGTGTTC 360CGCCCGCCTGCGCCCATCTACCAGGTCCTGGGCTTCGGGCCGCGTTCCCAAG!GGGTGATC-----------------------------------------------------------------------------------------------------------------------------!------------------------------------------------------------------------------------------------------------------------------------------------!-------------------CGCCCGCCTGTGCCCATCACCCAGATCCTGGGTTTTGGGCCGCGTTCCCAAG!-------------------
Exon 3CTGGCGCGCTATGGGCCCGCGTGGCGCGAGCAGAGGCGCTTCTCCGTGTCCACCTTGCGC 420CTGTCGCGCTATGGGCCCGCGTGGCGCGAGCAGAGGCGCTTCTCCGTGTCCACCTTGCGC---------------------------------------------------------------------------------------------------------------------------------------------------------------------------------------------------------------------------------------------------------------------------------------------------------------------------------------------------------------------------------------------------------------------------------------------------
AACTTGGGCCTGGGCAAGAAGTCGCTGGAGCAGTGGGTGACCGAGGAGGCCGCCTGCCTT 480AACTTGGGCCTGGGCAAGAAGTCGCTGGAGCAGTGGGTGACCGAGGAGGCCGCCTGCCTT------------------------------------------------------------------------------------------------------------------------------------------------------------------------------------------------------------------------------------------------------------------------------------------------------------------------------------------------------------------------------------------------------------------------------------------------------------
TGTGCCGCCTTCGCCAACCACTCCG!GACGCCCCTTTCGCCCCAACGGTCTCTTGGACAAA 540TGTGCCGCCTTCGCCGACCAAGCCG!GACGCCCCTTTCGCCCCAACGGTCTCTTGGACAAA------------------------------------------------------------!------------------------------------------------------------------------------------------------------------------------------------------------!--------------------------------------------------------------------------------------------------------------------------------------------!GACGCCCCTTTCGCCCCAACGGTCTCTTGGACAAA
Exon 4GCCGTGAGCAACGTGATCGCCTCCCTCACCTGCGGGCGCCGCTTCGAGTACGACGACCCT 600GCCGTGAGCAACGTGATCGCCTCCCTCACCTGCGGGCGCCGCTTCGAGTACGACGACCCT-----------------CAACGTGATCGCCTCCCTCACCTGCGGGCGCCGCTTCGAGTACGACGACCCT-------------------------------------------------------------------------------------------------------GAGTACGACGACCCTGCCGTGAGCAACGTGATCGCCTCCCTCACCTGCGGGCGCCGCTTCGAGTACGACGACCCT
CYP2D6 4R Primer 3’-CTTCCTCCTCAGCCCGAAAGACG-5’CGCTTCCTCAGGCTGCTGGACCTAGCTCAGG-AGGGACTGAAGGAGGAGTCGGGCTTTCTG 660CGCTTCCTCAGGCTGCTGGACCTAGCTCAGGGAGGGATCGAAGGAGGAGTCGGGCTTCCTGCGCTTCCTCAGGCTGCTGGGCCTAGCTCAGG-AGGGACTGAAGGAGGAGTCGGGCTTTCTGCGCTTCCTCAGGCTGCTGGACCTAGCTCAGG-AGGGACTGAAGGAGGAGTCGGGCTTTCTGCGCTTCCTCAGGCTGCTGGACCTAGCTCAGG-AGGGACTGAAGGAGGAGTCGGGCTTTCTG
CGCGAG!GTGCTGAATGCTGTCCCCGTCCTCCTGCATATCCCAGCGCTGGCTGGCAAGGTC 720CGCGAG!GTGCTGAATGCTGTCCCCGTCCTCCCGCACATCCCAGCGCTGGCTGGCAAGGTCCGCGAG!GTGCTGAATGCTGTCCCCGTCCTCCTGCATATCCCAGCGCTGGCTTGCAAGGTCC//C//
Figure 5 Comparison of sequences of CYP2D6 cDNA, CYP2D7 BP and 3 new CYP2D6 alternative splicing variants, f, g, h. Thedifferent bases compared with wild type CYP2D6 are indicated in boldface and “_”, and the border of exons is indicated by ‘!’. Theskipped parts are indicated by ‘-’.
The cDNA obtained was then inserted into pGEM-T vectorand sequenced. Compared with human wild type CYP2D6cDNA sequence reported by Kimura et al.[19] (GenBank accessionno.M33388), there were 470 nucleotides from 84 to 553, i.e., the3’ end portion 97 bp of exon 1 (180 bp), exon2, exon 3, and the5’ end portion 48 bp of exon 4 (161 bp) were skipped in the
cDNA shorter in length (Figures 2, 5). Substitution, insertionand deletion occurred in 13 base pairs, i.e. 620A G, 712G T,1196T G, 1401T G, 1405C G, 1408A G, 1410T C, 1432C
T, 1433A C, 1435G C, 1400 insG, 1442T C, 1443T A,1449C del, 1457G C. This cDNA had a premature stop codonat codon 96 and was named variant f.
3358 ISSN 1007-9327 CN 14-1219/ R World J Gastroenterol November 15, 2004 Volume 10 Number 22

RT-PCR analysis of transcripts of CYP2D6 exons 1 to 4 in 17liver extratumoral tissues and HepG2 cells, two more newalternative splicing variants were identified by sequencingIn 17 liver tissues, 4 samples expressed both wild type andskipped mRNA, 5 samples expressed only wild-type mRNA,and 8 samples expressed only skipped mRNA. Representativeelectrophoresis of RT-PCR products of exons 1 to 4 of CYP2D6from human extratumoral liver tissues and HepG2 cells withbeta-actin as internal control are shown in Figure 3. The sequencing data of RT-PCR products demonstratedthat the second variant lost 411 nucleotides (137 amino acidresidues) from 177 to 587, i.e., the 3’ end portion 4 bp of exon 1(180 bp), exon 2, exon 3, and the 5’ end portion 83 bp of exon 4(161 bp) and gained a base substitution 100 C T, resulting inone amino acid exchange P34S, as compared with the humanwild type CYP2D6 cDNA sequence reported by Kimura et al.[19]
(GenBank accession no.M33388) (Figure 4A, 5). This variantwas identified in 4 different extratumoral liver tissues bysequencing RT-PCR products and was named variant g. The third variant had skipped exon 3, losing 153 bp fromnucleotides 353 to 505 or 51 amino acid residues from 117 to 167,and had 2 base substitutions 100 C T and 336 T C, resultingin one changed amino acid P34S and a samesense mutation 112F,respectively. This variant was named variant h ( Figure 4B, 5).
Figure 6 Electrophoresis of PCR products from genomic DNAamplified using CYP2D6 F and CYP2D6 4R primers. Lane 1:λ/EcoR I and Hind III marker, lanes 2-4: PCR products fromlivers expressing full and short length RT-PCR products, Lanes5, 6: PCR products from livers expressing full length RT-PCRproducts, Lanes 7, 8: PCR products from livers expressingonly short length RT-PCR products.
No mutation events around splicing sites of exon 1 and exon 4nor gene deletion from exon 1 to exon 4 of CYP2D6 geneThe segment of CYP2D6 gene at exons 1 to 4 was amplified withCYP2D6 F and CYP2D6 4R primers by PCR. All amplified productsfrom 8 samples gave anticipated 2.04 kb in length but no 0.3 kbPCR products as predicted from the possibility that the shortercDNA was originated from deleted mutations in CYP2D6 generather than due to alternative splicing (Figure 6). Two PCR productsfrom extratumoral liver tissues expressed only skipped exon werepurified and partially sequenced. One showed 3 mutations, i.e.,1719 (nt 100) C T in exon 1, resulting in P34S, 3280 (nt 408) G Cin exon 3, and samesense mutations 136 V, 3056 G C in intron 2.Another one showed 3 mutations, i.e., 1719 (nt 100) C T in exon 1,resulting in P34S, 1958 T C in intron 1, and 3056 G C in intron 2.
DISCUSSIONThe mechanism of exon missed in cDNA may include gene deletion,alternative splicing, template sequence recombination presentin PCR amplification[20-22], and retroviral recombination[23-25].One or several exons missed entirely could ascribe to alternativesplicing. The first mechanism of formation of recombinantmolecules during PCR is mediated by premature termination ofchain synthesis. Therefore, a short extension time or increased
dissociation of polymerases from the template may promoterecombination. The optimum values to minimize recombinantmolecule formation could prolong the extension time and couldbe achieved using 30 or 34 amplification cycles respectively.The second mechanism is template switching, it implicates thata fragment elongating on one template, can continue thiselongation on another homologous template. The high templateconcentrations could facilitate template switching and de novosynthesize recombinant molecules. We performed PCR withlower template concentrations, 1 min/kb extension, and 32 to 35amplification cycles to minimize the PCR recombination. Duringsynthesis of the first DNA strand, reverse transcriptase couldswitch templates from one to other copy of RNA, a phenomenonknown as copy-choice. The term ‘template switching’ implies thatthe nascent DNA strand is transferred from one RNA (the ‘donor’)to the other (the ‘acceptor’). This process depends on a ribonuclease(RNase H) activity, carried by reverse transcriptase, which coulddegrade the RNA template once it has been copied[26]. The RNArecombination is a very rare event. In this study, MMLV withoutRNase H activity was used and skipped mRNA was found in 12out of 17 liver tissues by RT-PCR assay. Variant g was identified in4 different extratumoral liver tissues by sequencing RT-PCRproducts. These facts indicated that the exon missed variant gdid not come from PCR recombination or retroviral recombination.PCR amplification and sequencing identification of exon 1 toexon 4 of CYP2D6 gene from genomic DNA indicated that theexon missed variant g came from neither gene mutation aroundsplicing sites of exon 1 and exon 4 nor gene deletion. Burset et al.[27] analyzed canonical and non-canonical splicesites in mammalian genomes, and found that 99.24% containedcanonical dinucleotides GT and AG for donor and acceptorsites, respectively, 0.69% contained GC-AG, 0.05% containedAT-AC and only 0.02% contained other types of non-canonicalsplice sites. Some non-canonical splice sites seemed to beinvolved in immunoglobulin gene expression and the others inalternative splicing events. CYP2D6 gene has 9 exons and 8 introns. All alternativesplicing CYP2D reported are located in exon 6 to exon 7. Noalternative splicing in exon 1 to exon 4 has been reported. Weidentified 3 new alternative splicing CYP2D6 cDNA in exon 1to exon 4 in human extratumoral liver tisssues. The skippedmRNA was not an unusually phenomenon, for 12 samplesexpressed skipped mRNA in 17 human liver tissue, whereas 9samples expressed wild-type mRNA in this study. We cloned a cDNA variant of human CYP2D6, the variantf with some exons skipped. The five nt 5’-CAACG-3’, locatedat the boundary of partially skipped exons 1 and 4 (Figure 6). Itlooked as the 3’ end portion of skipped exon 1 or the 5’ end portionof exon 4. If we looked it as the 3’ end portion of the skippedexon 1, then the splicing donor and acceptor sites would beCT-CG, which were not found as splice site pairs[27]. If we lookedit as the 5’ end portion of exon 4, then there would be 470nucleotides from 79 to 548, i.e., the 3’ end portion 102 bp ofexon 1 (180 bp), exon 2, exon 3, and the 5’ end portion 43 bp ofexon 4 (161 bp) were skipped. The splicing donor and acceptorsites would be the non-canonical splice sites: CA-AG[27]. CYP2D gene exists in a number of structurally polymorphichaplotypes and also comprises several variants of CYP2D7Pand CYP2D8P pseudogenes. CYP2D6 is highly homologousto CYP2D7 and CYP2D8 pseudogenes. The characteristic basesubstitution, insertion and deletion of the variant f from 1401 to1 457 in exon 9 indicated that this exon was derived fromCYP2D7BP[28] (GenBank accession no.X58468). So this cDNAclone may be transcripted from CYP2D6*36 (Trivial name:CYP2D6Ch2 or CYP2D6*10C) gene, which has gene conversionto CYP2D7 in exon 9[29]. Johansson et al.[29] using allele-specificpolymerase chain reaction analysis of genomic DNA from 90Chinese individuals revealed that CYP2D6*10 (CYP2D6Ch1)
1 2 3 4 5 6 7 8
bp
2 027
1 904
1 584
1 375
947
831
Zhuge J et al. Alternative splicing variants of CYP2D6 3359

allele was the most common one, CYP2D6*36 was not a commonallele[30] and so we got an alternative splicing variant from thisallele only once. Another alternative splicing CYP2D6 cDNA, variant g, has7 bp 5’-GCTTCGA-3’, which locates at the boundary of partiallyskipped exons 1 and 4 (Figure 6). It can be regarded as the 3’end portion of skipped exon 1 or the 5’ end portion of exon 4.The splicing donor and acceptor sites would be CC-GA or GC-CC which have not been found as splice site pairs[27]. If weregarded it as the skipped nucleotides from 175 to 585, then 411nucleotides (137 amino acid residues), i.e., the 3’ end portion 6 bpof exon 1 (180 bp), exon 2, exon 3, and the 5’ end portion 81 bp ofexon 4 (161 bp) were skipped. The splicing donor and acceptorsites would be the non-canonical splice sites: GA-TC[27]. As thisvariant has been identified in 4 different liver tissues by RT-PCRproducts sequencing, it could not be the RT-PCR artificial ones. The third variant, variant h, having skipped the entire exon3, would use the most common non-canonical GC-AG splice sites(Figure 6). It has an amino acid change of P34S which is a commonpolymorphism occurring in CYP2D6*4, 10, 14, 36, 37. This variantmight come from CYP2D6*10, the most common allele in Chinese. The cDNA sequence of CYP2D6 is differed from that ofCYP2D7P at nucleotides 629 to 639, CYP2D6[19] was AGGAGGGACTG whereas CYP2D7P[28] was AGGGAGGGATCG(Figure 6). All sequencing data of the alternative splicing cDNAand PCR products originated from related genomic DNAshowed the characteristics of CYP2D6, so they were all derivedfrom CYP2D6 but not from CYP2D7P. Variant f has premature stop codon at codon 96, which wouldcause loss of its enzyme activity. According to the homologymodeling study of human CYP2 family enzyme reported byLewis[31], the substrate could recognize site (SRS) 1 of humanCYP2D6 located between amino acid residues 101 and 123and the SRS2 located between amino acid residues 204 to 215.Variant g which lost 137 amino acid residues from 58 to 194,would lose SRS1, and might not have CYP2D6 activity. Varianth having skipped the entire exon 3, would lose 51 amino acidresidues from 117 to 167, where part of SRS1 located. It mightnot have CYP2D6 activity. All 3 CYP2D6 splice variants might not have CYP2D6function. But the possibility of the expression of proteins withnovel function(s) could not be excluded. The splice variantsmight have a role in the posttranscriptional down-regulation ofthe expression of CYP2D6. Formation of variant mRNAs at theexpense of full-length mRNAs would ultimately result in adiminished expression of CYP2D6 protein. Three new CYP2D6 pre-mRNA alternative splicing variantsin human extratumoral liver tissues have been identified. Futherwork is needed to clarify if they are commonly existed in livertissue or only in extratumoral liver tissue, and their relationwith hepatocellular carcinoma as well.
REFERENCES1 Danielson PB. The cytochrome P450 superfamily: biochemistry,
evolution and drug metabolism in humans. Curr Drug Metab2002; 3: 561-597
2 Bertilsson L, Dahl ML, Dalen P, Al-Shurbaji A. Moleculargenetics of CYP2D6: clinical relevance with focus on psycho-tropic drugs. Br J Clin Pharmacol 2002; 53: 111-122
3 Cascorbi I. Pharmacogenetics of cytochrome p4502D6: ge-netic background and clinical implication. Eur J Clin Invest2003; 33(Suppl 2): 17-22
4 Bradford LD. CYP2D6 allele frequency in European Caucasians,Asians, Africans and their descendants. Pharmacogenomics 2002;3: 229-243
5 Nissim-Rafinia M, Kerem B. Splicing regulation as a potentialgenetic modifier. Trends Genet 2002; 18: 123-127
6 Graveley BR. Alternative splicing: increasing diversity in theproteomic world. Trends Genet 2001; 17: 100-107
7 Maniatis T, Tasic B. Alternative pre-mRNA splicing andproteome expansion in metazoans. Nature 2002; 418: 236-243
8 Kriventseva EV, Koch I, Apweiler R, Vingron M, Bork P,Gelfand MS, Sunyaev S. Increase of functional diversity byalternative splicing. Trends Genet 2003; 19: 124-128
9 Black DL. Mechanisms of alternative pre-messenger RNAsplicing. Annu Rev Biochem 2003; 72: 291-336
10 Gonzalez FJ, Skoda RC, Kimura S, Umeno M, Zanger UM,Nebert DW, Gelboin HV, Hardwick JP, Meyer UA. Character-ization of the common genetic defect in humans deficient indebrisoquine metabolism. Nature 1988; 331: 442-446
11 Huang Z, Fasco MJ, Kaminsky LS. Alternative splicing ofCYP2D mRNA in human breast tissue. Arch Biochem Biophys1997; 343: 101-108
12 Huang Z, Fasco MJ, Spivack S, Kaminsky LS. Comparisons ofCYP2D messenger RNA splice variant profiles in human lungtumors and normal tissues. Cancer Res 1997; 57: 2589-2592
13 Woo SI, Hansen LA, Yu X, Mallory M, Masliah E. Alternativesplicing patterns of CYP2D genes in human brain andneurodegenerative disorders. Neurology 1999; 53: 1570-1572
14 Chomczynski P, Sacchi N. Single-step method of RNA isola-tion by acid guanidinium thiocyanate-phenol-chloroformextraction. Anal Biochem 1987; 162: 156-159
15 Wu J, Dong H, Cai Z, Yu Y. Stable expression of human cyto-chrome CYP2B6 and CYP1A1 in Chinese hamster CHL cells: theiruse in micronucleus assays. Chin Med Sci J 1997; 12: 148-155
16 Qian Y, Yu Y, Cheng X, Luo J, Xie H, Shen B. Molecular eventsafter antisense inhibition of hMSH2 in a Hela cell line. Mutat Res1998; 418: 61-71
17 Zhuge J, Luo Y, Yu YN. Heterologous expression of humancytochrome P450 2E1 in HepG2 cell line. World J Gastroenterol2003; 9: 2732-2736
18 Gross-Bellard M, Oudet P, Chambon P. Isolation of high-molecular-weight DNA from mammalian cells. Eur J Biochem1973; 36: 32-38
19 Kimura S, Umeno M, Skoda RC, Meyer UA, Gonzalez FJ. Thehuman debrisoquine 4-hydroxylase (CYP2D) locus: sequenceand identification of the polymorphic CYP2D6 gene, a relatedgene, and a pseudogene. Am J Hum Genet 1989; 45: 889-904
20 Judo MS, Wedel AB, Wilson C. Stimulation and suppression ofPCR-mediated recombination. Nucleic Acids Res 1998; 26: 1819-1825
21 Zaphiropoulos PG. Non-homologous recombination mediatedby Thermus aquaticus DNA polymerase I. Evidence supportinga copy choice mechanism. Nucleic Acids Res 1998; 26: 2843-2848
22 Shammas FV, Heikkila R, Osland A. Fluorescence-based methodfor measuring and determining the mechanisms of recombina-tion in quantitative PCR. Clin Chim Acta 2001; 304: 19-28
23 Negroni M, Buc H. Mechanisms of retroviral recombination.Annu Rev Genet 2001; 35: 275-302
24 Negroni M, Buc H. Retroviral recombination: what drives theswitch? Nat Rev Mol Cell Biol 2001; 2: 151-155
25 Chetverin AB. The puzzle of RNA recombination. FEBS Lett1999; 460: 1-5
26 Zhu S, Li W, Cao ZJ. Does MMLV-RT lacking RNase H activityhave the capability of switching templates during reversetranscription? FEBS Lett 2002; 520: 185
27 Burset M, Seledtsov IA, Solovyev VV. Analysis of canonicaland non-canonical splice sites in mammalian genomes. NucleicAcids Res 2000; 28: 4364-4375
28 Heim MH, Meyer UA. Evolution of a highly polymorphic humancytochrome P450 gene cluster: CYP2D6. Genomics 1992; 14: 49-58
29 Johansson I, Oscarson M, Yue QY, Bertilsson L, Sjoqvist F,Ingelman-Sundberg M. Genetic analysis of the Chinese cyto-chrome P4502D locus: characterization of variant CYP2D6 genespresent in subjects with diminished capacity for debrisoquinehydroxylation. Mol Pharmacol 1994; 46: 452-459
30 Chida M, Ariyoshi N, Yokoi T, Nemoto N, Inaba M, Kinoshita M,Kamataki T. New allelic arrangement CYP2D6*36 x 2 found in aJapanese poor metabolizer of debrisoquine. Pharmacogenetics 2002;12: 659-662
Edited by Ren SY and Wang XL Proofread by Xu FM
3360 ISSN 1007-9327 CN 14-1219/ R World J Gastroenterol November 15, 2004 Volume 10 Number 22

PO Box 2345, Beijing 100023, China World J Gastroenterol 2004;10(22):3361-3364Fax: +86-10-85381893 World Journal of GastroenterologyE-mail: [email protected] www.wjgnet.com Copyright © 2004 by The WJG Press ISSN 1007-9327
• BRIEF REPORTS •
Effects of endostatin on expression of vascular endothelial growth
factor and its receptors and neovascularization in colonic carcinoma
implanted in nude mice
Yun-He Jia, Xin-Shu Dong, Xi-Shan Wang
Yun-He Jia, Xin-Shu Dong, Xi-Shan Wang, Department of AbdominalSurgery, Tumor Hospital of Harbin Medical University, Harbin150040, Heilongjiang Province, ChinaSupported by the Key Technologies Research and DevelopmentProgram of Heilongjiang Province During the 9th Five-Year Plan Period,No. G99C19-5Correspondence to: Dr. Yun-He Jia, Department of General Surgeryof Nanjing Jinling Hospital, Nanjing 210002, Jiangsu Province,China. [email protected]: +86-25-80860034Received: 2003-12-23 Accepted: 2004-02-01
Abstract
AIM: To investigate the antiangiogenic effects of endostatinon colonic carcinoma cell line implanted in nude mice andits mechanism.
METHODS: Nude mice underwent subcutaneous injectionwith LS-174t colonic carcinoma cell line to generate carcinomaand were randomly separated into two groups. Mice receivedinjection of vehicle or endostatin every day for two weeks.After the tumor was harvested, the tumor volumes weredetermined, and the expressions of CD34, VEGF and Flk-1were examined by immunohistochemical method.
RESULTS: Tumor volume was significantly inhibited in theendostatin group (84.17%) and tumor weight wassignificantly inhibited in the endostatin group (0.197±0.049)compared to the control group (1.198±0.105) (F = 22.56,P = 0.001), microvessel density (MVD) was significantlydecreased in the treated group (31.857±3.515) comparedto the control group (100.143±4.290) (F = 151.62, P<0.001).Furthermore, the expression of Flk-1 was significantlyinhibited in the treated group (34.29%) compared to thecontrol group (8.57%) (χ2 = 13.745, P = 0.001). Howeverno significant decrease was observed in the expression ofvascular endothelial growth factor (VEGF) between thesetwo groups (χ2 = 0.119,P = 0.730).
CONCLUSION: Endostatin can inhibit tumor growth andangiogenesis by blocking Vegf/Flk-1 pathway. This experimentprovides the theory basis for developing a new anti-carcinomadrug through studying the properties of anti-angiogenesisinhibitors.
Jia YH, Dong XS, Wang XS. Effects of endostatin on expressionof vascular endothelial growth factor and its receptors andneovascularization in colonic carcinoma implanted in nude mice.World J Gastroenterol 2004; 10(22): 3361-3364
http://www.wjgnet.com/1007-9327/10/3361.asp
INTRODUCTIONAngiogenesis is the process of sprouting of capillaries form
preexisting blood vessels. The overall process is a complexone that involves many biological functions and cell types.Previous researches since 1970s have demonstrated that tumorangiogenesis is required for the growth and metastasis ofprimary solid tumor. Endothelial cell activation, migration, andproliferation are major cellular events in this process. All ofthese processes are under the tight regulation of factors thateither “promote” or “inhibit” angiogenesis. When the balanceof these factors is disturbed, angiogenic factors can be releasedfrom tumor cells, such as vascular endothelial growth factor(VEGF)[1] and basic fibroblast growth factor (bFGF), and migrateto the nearby blood vessel endothelia, signal the activation of theangiogenic response. Tumor cells also produce anti-angiogenicfactors including angiostatin, endostatin. Administration ofendostatin in tumor-bear mice has been shown to keep theprimary tumor in a dormant state[2]. But the mechanisms are stillunclear. One mechanism is that endostatin incombination withthe endothelial cells to form a compound with tyrosine activityand thereby inducing apoptosis of endothelial cells. The otheris that endostatin functions as a ligand for the integrin familyof adhesion receptors on the surface of endothelial cells and isassociated with MMP family[3]. So, in order to explore themechanism of endostatin, we provided data that endostatinshowed a broad antitumor effect, which might be a result of itsinhibitory mechanism on tumor angiogenesis.
MATERIALS AND METHODSMaterialsEndostatin donated from Hefei Sunny Biology-technologyInstitute, was a 20 ku C-terminal fragment of collagen X VIII.Human endostatin was cloned and expressed in Escherichia coliand purified by gene cloning technology by Gene Med Ltd. Colon cancer cell line HL-174T was purchased from ShanghaiCellular Research Institute. The cells were cultured in 1640medium supplemented with 100 mL/L fetal bovine serum at 37 in 50 mL/L CO2 and the culture media were changed twice aweek and observed in the invert microscope to assay thereproduction situation. All reagents and media for cell culturewere obtained from GIBCO.
MethodsSubcutaneous xenograft models Tumor cells were implanted(0.5×10⁶ cells/animal) subcutaneously using a 27-gauge needlein the back region of BALB/C-nu/nu female mice of 6-8 wk old.Tumor volume was measured every 3 d using a slide gaug.Tumor volumes were measured as the product of (length×width)× /6. Mice were fed with a standard rodent diet for two weeks,and 14 of 20 mice with a similar tumor volume were selected anddivided into two groups randomly. Animals of each group weretreated once daily with a 0.1mL (2 mg/mL) ip bolus injection ofendostatin in saline or saline alone for 14 d. Upon terminationof the efficacy portion of endostatin (3 d after drug withdrawal),the animals were euthanized, and the tumor was harvested fromthe animals and the volume was weighted. The tumors weresubmitted for immunohistochemical test.
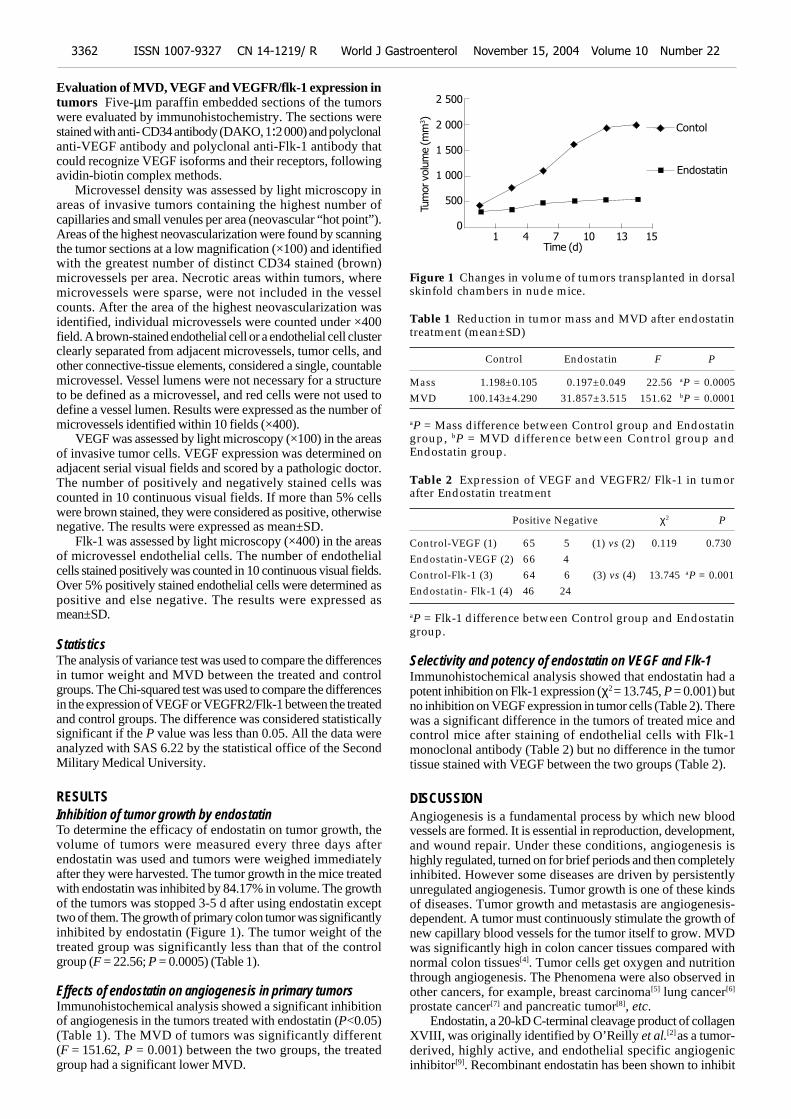
Evaluation of MVD, VEGF and VEGFR/flk-1 expression intumors Five-µm paraffin embedded sections of the tumorswere evaluated by immunohistochemistry. The sections werestained with anti- CD34 antibody (DAKO, 1:2 000) and polyclonalanti-VEGF antibody and polyclonal anti-Flk-1 antibody thatcould recognize VEGF isoforms and their receptors, followingavidin-biotin complex methods. Microvessel density was assessed by light microscopy inareas of invasive tumors containing the highest number ofcapillaries and small venules per area (neovascular “hot point”).Areas of the highest neovascularization were found by scanningthe tumor sections at a low magnification (×100) and identifiedwith the greatest number of distinct CD34 stained (brown)microvessels per area. Necrotic areas within tumors, wheremicrovessels were sparse, were not included in the vesselcounts. After the area of the highest neovascularization wasidentified, individual microvessels were counted under ×400field. A brown-stained endothelial cell or a endothelial cell clusterclearly separated from adjacent microvessels, tumor cells, andother connective-tissue elements, considered a single, countablemicrovessel. Vessel lumens were not necessary for a structureto be defined as a microvessel, and red cells were not used todefine a vessel lumen. Results were expressed as the number ofmicrovessels identified within 10 fields (×400). VEGF was assessed by light microscopy (×100) in the areasof invasive tumor cells. VEGF expression was determined onadjacent serial visual fields and scored by a pathologic doctor.The number of positively and negatively stained cells wascounted in 10 continuous visual fields. If more than 5% cellswere brown stained, they were considered as positive, otherwisenegative. The results were expressed as mean±SD. Flk-1 was assessed by light microscopy (×400) in the areasof microvessel endothelial cells. The number of endothelialcells stained positively was counted in 10 continuous visual fields.Over 5% positively stained endothelial cells were determined aspositive and else negative. The results were expressed asmean±SD.
StatisticsThe analysis of variance test was used to compare the differencesin tumor weight and MVD between the treated and controlgroups. The Chi-squared test was used to compare the differencesin the expression of VEGF or VEGFR2/Flk-1 between the treatedand control groups. The difference was considered statisticallysignificant if the P value was less than 0.05. All the data wereanalyzed with SAS 6.22 by the statistical office of the SecondMilitary Medical University.
RESULTSInhibition of tumor growth by endostatinTo determine the efficacy of endostatin on tumor growth, thevolume of tumors were measured every three days afterendostatin was used and tumors were weighed immediatelyafter they were harvested. The tumor growth in the mice treatedwith endostatin was inhibited by 84.17% in volume. The growthof the tumors was stopped 3-5 d after using endostatin excepttwo of them. The growth of primary colon tumor was significantlyinhibited by endostatin (Figure 1). The tumor weight of thetreated group was significantly less than that of the controlgroup (F = 22.56; P = 0.0005) (Table 1).
Effects of endostatin on angiogenesis in primary tumorsImmunohistochemical analysis showed a significant inhibitionof angiogenesis in the tumors treated with endostatin (P<0.05)(Table 1). The MVD of tumors was significantly different(F = 151.62, P = 0.001) between the two groups, the treatedgroup had a significant lower MVD.
Figure 1 Changes in volume of tumors transplanted in dorsalskinfold chambers in nude mice.
Table 1 Reduction in tumor mass and MVD after endostatintreatment (mean±SD)
Control Endostatin F P
Mass 1.198±0.105 0.197±0.049 22.56 aP = 0.0005MVD 100.143±4.290 31.857±3.515 151.62 bP = 0.0001
aP = Mass difference between Control group and Endostatingroup, bP = MVD difference between Control group andEndostatin group.
Table 2 Expression of VEGF and VEGFR2/Flk-1 in tumorafter Endostatin treatment
Positive Negative χ2 P
Control-VEGF (1) 65 5 (1) vs (2) 0.119 0.730Endostatin-VEGF (2) 66 4Control-Flk-1 (3) 64 6 (3) vs (4) 13.745 aP = 0.001Endostatin- Flk-1 (4) 46 24
aP = Flk-1 difference between Control group and Endostatingroup.
Selectivity and potency of endostatin on VEGF and Flk-1Immunohistochemical analysis showed that endostatin had apotent inhibition on Flk-1 expression (χ2 = 13.745, P = 0.001) butno inhibition on VEGF expression in tumor cells (Table 2). Therewas a significant difference in the tumors of treated mice andcontrol mice after staining of endothelial cells with Flk-1monoclonal antibody (Table 2) but no difference in the tumortissue stained with VEGF between the two groups (Table 2).
DISCUSSIONAngiogenesis is a fundamental process by which new bloodvessels are formed. It is essential in reproduction, development,and wound repair. Under these conditions, angiogenesis ishighly regulated, turned on for brief periods and then completelyinhibited. However some diseases are driven by persistentlyunregulated angiogenesis. Tumor growth is one of these kindsof diseases. Tumor growth and metastasis are angiogenesis-dependent. A tumor must continuously stimulate the growth ofnew capillary blood vessels for the tumor itself to grow. MVDwas significantly high in colon cancer tissues compared withnormal colon tissues[4]. Tumor cells get oxygen and nutritionthrough angiogenesis. The Phenomena were also observed inother cancers, for example, breast carcinoma[5] lung cancer[6]
prostate cancer[7] and pancreatic tumor[8], etc. Endostatin, a 20-kD C-terminal cleavage product of collagenXVIII, was originally identified by O’Reilly et al.[2] as a tumor-derived, highly active, and endothelial specific angiogenicinhibitor[9]. Recombinant endostatin has been shown to inhibit
2 500
2 000
1 500
1 000
500
0
3362 ISSN 1007-9327 CN 14-1219/ R World J Gastroenterol November 15, 2004 Volume 10 Number 22
1 4 7 10 13 15Time (d)
Tum
or volu
me (m
m3)
Contol
Endostatin

Jia YH et al. Antiangiogenic effect of endostatin 3363
the growth of a wide variety of tumors in mice, with no toxicside effects observed. Importantly, tumors treated with severalcycles of endostatin did not develop drug resistance andbecome dormant, which persisted even when the endostatintherapy was discontinued[10]. In our experiment, we found thatthe tumor growth slowed down or even stopped three daysafter usage of endostatin, but when the treatment was stoppedthe tumor began to grow rapidly. So endostatin must be usedcontinuously to prevent tumor growth. It is difficult for thepatients to accept the treatment in their whole lifetime, so furtherresearch is necessary for the usage of endostatin. At present,the molecular mechanism of endostatin action remains unknown.There are some theories which are supported by various studies. Our results showed that endostatin blocked the VEGF-VEGFR/Flk-1 pathway to inhibit the angiogenesis of colon tumorin nude mice. VEGF pathway is the only well-defined signalingpathway known to be required for the normal development ofvasculature as well as for the pathologic angiogenesis thataccompanies cancer and other disease states[1,11,12]. The VEGFfamily of growth factors comprises at least five members, i.e.,VEGF, placenta growth factor (PGF) , VEGF-B , VEGF-C[13], andVEGF-D. The VEGF pathway is initiated when VEGF binds toits receptors in endothelial cells. The three best characterizedVEGF receptors are termed VEGF receptor 1 (VEGFR1/Flt-1) andVEGF receptor 2 (VEGFR2/Flk-1/KDR) and VEGF receptor 3(VEGFR3/Flk-4). VEGFR1 and VEGFR2 are highly relatedtransmembrane tyrosine kinases that use their ectodomains tobind to VEGF[14,15]. These binding in turn, activate the intrinsictyrosine kinase activity of their cytodomains, initiating intracellularsignaling. VEGFR3 is expressed almost exclusively by thelymphatic endothelium, thus being considered as a majorregulator of lymphangiogenesis[16]. The blockade of VEGF byusing a soluble VEGFR-3 extracellular domain could inhibit tumorlymphangiogenesis[17]. While PIGF could bind selectively toVEGFR1, VEGF-C and VEGF-D could bind to both VEGFR3[18,19]
and VEGFR2. The corresponding receptor(s) for VEGF-B isVEGFR1. VEGF/VEGFR2 pathway is the most important fortumor angiogenesis, growth and metastasis. In our studies, wefound VEGFR2 was obviously down-regulated in the endostatingroup compared to the control group, but the expression ofVEGF was not changed in both groups. So we think thatendostatin can block the VEGF/VEGFR2 pathway by bindingto VEGFR2, thus inhibiting the neovascularization. Endostatin could function as a ligand for the integrin familyof adhesion receptors on the surface of endothelial cells[20].Integrins are potential targets for endostatin function and theyare important in endothelial cell biology and angiogenesis. Theendostatin-integrin interaction is of functional significancein vitro, and the immobilized endostatin supports endothelialcell survival and migration in an integrin-dependent manner.Soluble endostatin in turn could inhibit integrin-dependentendothelial cell functions, such as cell migration[20]. Matrix metalloproteinases (MMPs), a family of extracellularand membrane-associated endopeptidases, collectively digestalmost all extracellular matrix and basement membranecomponents, thus playing an important role in tumor progression.Endostatin could prevent the fragmentation of pro-MMP-2 thatis associated with reduction of catalytic activity. Endostatinhad no effect on MMP-8 as shown by collagenase activityassays[3]. Endostatin could block the activation and activitiesof certain tumor-associated pro-MMPs, such as pro-MMP-2, -9,and -13, which may explain at least in part, the antitumor effectof endostatin[3,21]. Inhibition of angiogenesis has been shown to be an effectivestrategy in cancer therapy in mice. However, its widespreadapplication has been hampered by difficulties in the large-scaleproduction of antiangiogenic proteins. This limitation may beresolved by in vivo delivery and expression of antiangiogenic
genes. A recombinant adenovirus that could expresses murineendostatin that was biologically active in vitro as determinedin endothelial cell proliferation assays, and in vivo bysuppression of angiogenesis induced by VEGF has beenconstructed[22]. Persistent high serum levels of endostatin wereachieved after systemic administration of the vector to nudemice, which resulted in a significant reduction of the growthrates and the volumes of metastatic brain tumor[23]. If the methodcan be used safely in clinic, it can effectively resolve therecurrence and overgrowth of tumors during the rest periods.Different targets have been found and effective results wereachieved in gene therapy. An adenoviral vector carrying Tie2gene, an endostatin-specific receptor tyrosine kinase, wasconstructed and tested in established primary tumor, a murinemammary carcinoma or a murine melanoma, which couldsignificantly inhibit the growth rate of both murine mammarycarcinoma and melanoma by 64% and 47%, respectively. Sothe potential of vector-mediated antiangiogenic gene therapyas a component is a very novel and effective strategy in cancertherapy[24,25]. Synergy between endostatin and chemotherapy[26] can beused to eradicate spontaneous tumor and metastases of coloncancer or other angiogenesis dependent diseases. Tumor necrosiswas demonstrated only in animals receiving the combinationtherapy, but not when each agent was applied as monotherapy.The results suggested that these synergistic treatment modalitiesmight provide a novel and effective tool for future therapies ofmetastatic cancer. Synergy between endostatin and interventionaltherapy is another way to inhibit the neovascularization.Endostatin can be sent directly to the microvessels around thetumor and destroy the tunica intima of vessels to starve thetumor to death. Other strategies also were used to block theVEGF/VEGFR pathway to inhibit the tumor growth. VEGF-trapis a potent blocker against the angiogenesis of the tumor andcould result in stunted and almost completely avascular tumors.VEGF-Trap-mediated blockade may be a hopeful way for tumortreatment[27]. More and more attention has been paid to theeffectiveness and carrier and medication methods are paid moreand more attention throughout the world. Endostatin may providea novel and effective tool for future therapies of cancer[28,29].
REFERENCES1 Potti A, Moazzam N, Tendulkar K, Javed NA, Koch M, Kargas
S. Immunohistochemical determination of vascular endothelialgrowth factor (VEGF) overexpression in malignant melanoma.Anticancer Res 2003; 23: 4023-4026
2 O’Reilly MS, Boehm T, Shing Y, Fukai N, Vasios G, Lane WS,Flynn E, Birkhead JR, Olsen BR, Folkman J. Endostatin: anendogenous inhibitor of angiogenesis and tumor growth. Cell1997; 24: 277-285
3 Nyberg P, Heikkila P, Sorsa T, Luostarinen J, Heljasvaara R,Stenman UH, Pihlajaniemi T, Salo T. Endostatin inhibits hu-man tongue carcinoma cell invasion and intravasation andblocks the activation of matrix metalloprotease-2, -9, and -13.J Biol Chem 2003; 278: 22404-22411
4 Dkhissi F, Lu H, Soria C, Opolon P, Griscelli F, Liu H, KhattarP, Mishal Z, Perricaudet M, Li H. Endostatin exhibits a directantitumor effect in addition to its antiangiogenic activity incolon cancer cells. Hum Gene Ther 2003; 14: 997-1008
5 Atiqur Rahman M, Toi M. Anti-angiogenic therapy in breastcancer. Biomed Pharmacother 2003; 57: 463-470
6 Sridhar SS, Shepherd FA. Targeting angiogenesis: a review ofangiogenesis inhibitors in the treatment of lung cancer. LungCancer 2003; 42(2 Suppl): S81-S91
7 Uehara H. Angiogenesis of prostate cancer and antiangiogenictherapy. J Med Invest 2003; 50: 146-153
8 Schuch G, Kisker O, Atala A, Soker S. Pancreatic tumor growthis regulated by the balance between positive and negative modu-lators of angiogenesis. Angiogenesis 2002; 5: 181-190
9 Sim BK. Angiostatin and endostatin: endothelial cell-specific

endogenous inhibitors of angiogenesis and tumor growth. An-giogenesis 1998; 2: 37-48
10 Kuroiwa M, Takeuchi T, Lee JH, Yoshizawa J, Hirato J, KanekoS, Choi SH, Suzuki N, Ikeda H, Tsuchida Y. Continuous ver-sus intermittent administration of human endostatin inxenografted human neuroblastoma. J Pediatr Surg 2003; 38:1499-1505
11 Zachary I. VEGF signalling: integration and multi-tasking inendothelial cell biology. Biochem Soc Trans 2003; 31(Pt 6):1171-1177
12 Qi L, Robinson WA, Brady BM, Glode LM. Migration andinvasion of human prostate cancer cells is related to expressionof VEGF and its receptors. Anticancer Res 2003; 23: 3917-3922
13 Karkkainen MJ, Haiko P, Sainio K, Partanen J, Taipale J,Petrova TV, Jeltsch M, Jackson DG, Talikka M, Rauvala H,Betsholtz C, Alitalo K. Vascular endothelial growth factor C isrequired for sprouting of the first lymphatic vessels from em-bryonic veins. Nat Immunol 2004; 5: 74-80
14 Dales JP, Garcia S, Bonnier P, Duffaud F, Carpentier S, DjemliA, Ramuz O, Andrac L, Lavaut M, Allasia C, Charpin C.Prognostic significance of VEGF receptors, VEGFR-1 (Flt-1)and VEGFR-2 (KDR/Flk-1) in breast carcinoma. Ann Pathol2003; 23: 297-305
15 Endo A, Fukuhara S, Masuda M, Ohmori T, Mochizuki N.Selective inhibition of vascular endothelial growth factor recep-tor-2 (VEGFR-2) identifies a central role for VEGFR-2 in humanaortic endothelial cell responses to VEGF. J Recept SignalTransduct Res 2003; 23: 239-254
16 Pimenta FJ, Sa AR, Gomez RS. Lymphangiogenesis in humandental pulp. Int Endod J 2003; 36: 853-856
17 Kaipainen A, Korhonen J, Mustonen T, van Hinsbergh VW,Fang GH, Dumont D, Breitman M, Alitalo K. Expression of thefms-like tyrosine kinase 4 gene becomes restricted to lymphaticendothelium during development PNAS. Proc Natl Acad SciU S A 1995; 92: 3566–3570
18 Nakamura Y, Yasuoka H, Tsujimoto M, Yang Q, Imabun S,Nakahara M, Nakao K, Nakamura M, Mori I, Kakudo K. Flt-4-positive vessel density correlates with vascular endothelialgrowth factor-d expression, nodal status, and prognosis inbreast cancer. Clin Cancer Res 2003; 9: 5313-5317
19 Van Trappen PO, Steele D, Lowe DG, Baithun S, Beasley N,Thiele W, Weich H, Krishnan J, Shepherd JH, Pepper MS, Jack-son DG, Sleeman JP, Jacobs IJ. Expression of vascular endothe-
lial growth factor (VEGF)-C and VEGF-D, and their receptorVEGFR-3, during different stages of cervical carcinogenesis. JPathol 2003; 201: 544-554
20 Rehn M, Veikkola T, Kukk-Valdre E, Nakamura H, IlmonenM, Lombardo CR, Pihlajaniemi T, Alitalo K, Vuori K. Interac-tion of endostatin with integrins implicated in angiogenesis.Proc Natl Acad Sai U S A 2001; 98: 1024-1029
21 Guan KP, Ye HY, Yan Z, Wang Y, Hou SK. Serum levels ofendostatin and matrix metalloproteinase-9 associated with highstage and grade primary transitional cell carcinoma of thebladder. Urology 2003; 61: 719-723
22 Sauter BV, Martinet O, Zhang WJ, Mandeli J, Woo SLC. Aden-ovirus-mediated gene transfer of endostatin in vivo results inhigh level of transgene expression and inhibition of tumor growthand metastases PNAS. Proc Natl Acad Sci U S A 2000; 97:4802–4807
23 Oga M, Takenaga K, Sato Y, Nakajima H, Koshikawa N, OsatoK, Sakiyama S. Inhibition of metastatic brain tumor growth byintramuscular administration of the endostatin gene. Int J Oncol2003; 23: 73-79
24 Chen W, Fu J, Liu Q, Ruan C, Xiao S. Retroviral endostatingene transfer inhibits human colon cancer cell growth in vivo.Chin Med J 2003; 116: 1582-1584
25 Sridhar SS, Shepherd FA. Targeting angiogenesis: a review ofangiogenesis inhibitors in the treatment of lung cancer. LungCancer 2003; 42(2 Suppl): S81-S91
26 Plum SM, Hanson AD, Volker KM, Vu HA, Sim BK, FoglerWE, Fortier AH. Synergistic activity of recombinant humanendostatin in combination with adriamycin: analysis of in vitroactivity on endothelial cells and in vivo tumor progression in anorthotopic murine mammary carcinoma model. Clin Cancer Res2003; 9: 4619-4626
27 Byrne AT, Ross L, Holash J, Nakanishi M, Hu L, Hofmann JI,Yancopoulos GD, Jaffe RB. Vascular endothelial growth fac-tor-trap decreases tumor burden, inhibits ascites, and causesdramatic vascular remodeling in an ovarian cancer model. ClinCancer Res 2003; 9: 5721-5728
28 Shibuya M. VEGF-receptor inhibitors for anti-angiogenesis.Nippon Yakurigaku Zasshi 2003; 122: 498-503
29 Tee D, DiStefano J 3rd. Simulation of tumor-induced angio-genesis and its response to anti-angiogenic drug treatment:mode of drug delivery and clearance rate dependencies. J Can-cer Res Clin Oncol 2004; 130: 15-24
Edited by Kumar M and Wang XL Proofread by Xu FM
3364 ISSN 1007-9327 CN 14-1219/ R World J Gastroenterol November 15, 2004 Volume 10 Number 22

PO Box 2345, Beijing 100023, China World J Gastroenterol 2004;10(22):3365-3368Fax: +86-10-85381893 World Journal of GastroenterologyE-mail: [email protected] www.wjgnet.com Copyright © 2004 by The WJG Press ISSN 1007-9327
• BRIEF REPORTS •
Proteomic analysis of blood level of proteins before and after
operation in patients with esophageal squamous cell carcinoma at
high-incidence area in Henan Province
Ji-Ye An, Zong-Min Fan, Ze-Hao Zhuang, Yan-Ru Qin, Shan-Shan Gao, Ji-Lin Li, Li-Dong Wang
Ji-Ye An, Laboratory for Cancer Research and the Third TeachingHospital, College of Medicine, Zhengzhou University, Zhengzhou450052, Henan Province, ChinaZong-Min Fan, Ze-Hao Zhuang, Yan-Ru Qin, Shan-Shan Gao,Li-Dong Wang, Laboratory for Cancer Research, College of Medicine,Zhengzhou University, Zhengzhou 450052, Henan Province, ChinaJi-Lin Li, Department of Pathology, Yaocun Esophageal CancerHospital, Linzhou 456592, Henan Province, ChinaSupported by National Science Fund for Outstanding Young Scholarsof China, No.30025016; State Basic Research Development Programof China, No.G1998051206; Foundation of Henan EducationCommittee, No.1999125 and the US NIH Grant, No.CA65871Correspondence to: Professor Li-Dong Wang, Laboratory for CancerResearch, College of Medicine, Zhengzhou University, Zhengzhou450052, Henan Province, China. [email protected]: +86-11-371-6970165 Fax: +86-11-371-6970165Received: 2004-02-02 Accepted: 2004-02-18
Abstract
AIM: To characterize the protein files in blood from samepatients with esophageal squamous cell carcinoma (ESCC)before and after operation at the high-incidence area for ESCCin Henan Province, China.
METHODS: Two-dimensional electrophoresis, silver stainingand ImageMaster 2-DE analysis software were applied tothe determination of protein files in the blood obtained fromnormal controls and ESCC patients before and after operation.
RESULTS: A total of 655, 662 and 677 protein spots wereidentified, respectively, from the normal controls and ESCCpatients before and after operation. No significant difference inthe number of protein spots was observed between the normalgroup and ESCC patients. A total of seven protein spotswere identified with a dramatic difference among the samplesbefore and after operation. Six protein spots were up-regulatedand one protein spot was down-regulated in the groupafter operation compared with those in normal and beforeoperation. Three protein spots were further characterizedby matrix-assisted laser desorption/ionization time of flyingmass spectrometry (MALDI-TOF-MS). The proteins fromthese three spots were identified as serum amyloid A(SAA), amyloid related serum protein and haptoglobin.
CONCLUSION: Serum amyloid A, amyloid related serumprotein and haptoglobin may be related with ESCC and/orsurgery. The significance of these proteins needs to be furthercharacterized. The present study provides informative data forthe establishment of serum protein profiles related with ESCC.
An JY, Fan ZM, Zhuang ZH, Qin YR, Gao SS, Li JL, Wang LD.Proteomic analysis of blood level of proteins before and afteroperation in patients with esophageal squamous cell carcinomaat high-incidence area in Henan Province. World J Gastroenterol
2004; 10(22): 3365-3368
http://www.wjgnet.com/1007-9327/10/3365.asp
INTRODUCTIONEsophageal squamous cell carcinoma (ESCC) is one of the sixmost common malignant diseases in the world with a remarkablegeographical distribution. The ratio between the high- and low-incidence areas could be as high as 500:1. The prognosis of ESCCis very poor, the five-year survival rate is only about 10% forthe patients at late or advanced stage. China is a country withthe highest incidence and mortality rate of ESCC in the world.There are about 300 000 new ESCC patients identified all overthe world each year, half of them occur in China. Linzhou City(formerly Linxian County) and its neighbouring counties in HenanProvince have been well-recognized as the highest incidencearea in the world, the average incidence ratio of males andfemales is 161 and 103 per 100 000, respectively[1]. ESCC remainsthe leading cause of cancer related-deaths in these areas.Unclear molecular mechanism, and lacking of sensitive andspecific biomarkers for early diagnosis may be the reasons forthe unchanged ESCC incidence pattern[2]. Many studies have been focused on gene level for earlydiagnosis of ESCC. However, because alterations in DNA andRNA may or may not induce similar protein changes, geneticchanges could not reflect the stage and progression of the diseasedirectly and objectively[3]. Proteomics based on two-dimensionalelectrophoresis and mass spectrometry is a new method foridentification of cancer-specific protein markers[4]. In this study,we analyzed the serum protein changes in ESCC patients beforeand after operation and compared them with normal controls byproteomic methods to find the specific ESCC-related proteins.
MATERIALS AND METHODSBlood samplesBlood samples were collected from ESCC patients in YaocunEsophageal Cancer Hospital of Linzhou, Henan Province. Ofthe ESCC patients, there were 4 males and 2 females with anaverage age of 63 years (range, 52-74 years). All the blood sampleswere collected two times from each patient, just before and oneweek after the operation. The control blood samples (10 mL/subject)were collected in our laboratory from the normal people withmatched ages as the patients. There were not any abnormalitiesidentified by physical and biochemical examinations involunteers of the control group.
ReagentsElectrophoresis reagents, including 400 g/L acrylamide solution,N, N-methylenebisacryl amide, N, N, N’, N’-tetramethylethylen-ediamine, urea, tris-base, glycine, glycerol, 3-[(3-cholannidopropyl)-dimethylammonio]-1-propanesulfonate (CHAPS), sodiumdodecyl sulfate (SDS), dithiothreitol (DTT), ammonium persulfate,bromophenol blue, immobiline drystrips, immobilized pHgradient buffer and silver nitrate were from Amersham PharmaciaBiotechnology Inc. (Uppsala, Sweden). Iodoacetamide was fromAcros (New Jersey, USA), sequence grade trypsin was fromWashington Biochemical Corporation and trifluoroacetic acid(TFA) was from Fluka (Switzerland). All other reagents were ofanalytical grade.

Serum concentration detectionSerum samples were thawed and diluted by dH2O as 1:5 (2 µLserum was added to 8 µL dH2O), 1:10 (2 µL diluent was addedto 18 µL dH2O), 1:200 (4 µL diluent was added to 796 µL dH2O)respectively, up to 1:10 000 dilution and then 800 µL 1:10 000diluent was added to 200 µL protein assay reagent andabsorbance was measured at 595 nm, finally the concentrationof protein in serum was calculated.
First dimensional electrophoresis (Isoelectric focusing, IEF)Precast IPG strips (pH 3-10 linear, 18 cm, Amersham PharmaciaBiotechnology Inc.) was used in the first dimension. A totalamount of 250 µg proteins was diluted to a total volume of 350 µLwith the buffer (8 mol/L urea, 20 g/L CHAPS, 5 g/L IPG buffer3-10, 20 mol/L DTT and a trace of bromophenol blue). After beingloaded on IPG strips, IEF was carried out according to the followingprotocol: rehydration for 6 h at 0 V, 10 h at 30 V, 1 h at 500 V, 1 h at1 000 V and 7 h at 8 000 V. The current was limited to 50 µ A per gel.
Second dimensional electrophoresis (SDS-polyacrylamide gelelectrophoresis, SDS-PAGE)After IEF separation, the strips were immediately equilibratedfor 2×15 min with equilibration solution (50 mmol/L Tris-HCl,pH 6.8, 6 mol/L urea, 300 g/L glycerol and 20 g/L SDS). Then20 mmol/L DTT was included in the first equilibration solution,and 20 g/L iodoacetamide was added in the second equilibrationstep to alkylate thiols. Thirteen percent SDS-PAGE gels werehandled to become 1 mm thick. The strips were held in placewith 5 g/L agarose dissolved in SDS/Tris running buffer andelectrophoresis was carried out at constant power (2.5 W/gelfor 40 min and 15 W/gel for 6 h) and temperature (20 ) usingEttan Dalt II system (Amersham Pharmacia Biotechnology Inc.).
Silver stainingGels were stained with silver nitrate according to the instructions ofthe silverstaining kit[5] (Amersham Pharmacia Biotechnology Inc.).
Gel scanning and image analysisProtein profiles were obtained in normal controls and ESCC patientsbefore and after operation through correcting the background todetect, match and quantify the spots by ImageMasterTM two-dimensional Elite analysis software (Amersham Biosciences).
In-gel protein digestionIndividual protein spots were excised from the gel by Ettanspot picker (Amersham Pharmacia Biotechnology Inc.), destainedwith the solution (15 mmol/L potassium ferricyanide, 50 mmol/Lsodium thiosulfate) and washed till opaque and colorless with25 mmol/L ammonium bicarbonate/500 g/L acetonitrile. Afterbeing dried with vacuum concentrator (SpeedVac Plus, USA),the gel was rehydrated with 3-10 µL of trypsin solution (10 ng/µL)at 4 for 30 min, followed by incubation at 37 overnight. Trypticpeptides were eluted and dried on SpeedVac vacuum concentrator.
Protein identification by MALDI mass spectrometryThe protein spots were analyzed by matrix-assisted laserdesorption/ionization time of flying mass spectrometry(MALDI-TOF-MS) and SWISS-PROT database[6].
RESULTSA total of 655, 662 and 677 protein spots were identified,respectively, from the normal control and ESCC patients beforeand after operation. No significant difference in number of proteinspots was observed between normal group and ESCC patients.A total of seven protein spots were identified with a dramaticdifference among the samples before and after operation. Six protein
spots were up-regulated and one protein spot was down-regulatedin the group after operation compared with those in normal andbefore operation. Of these six protein spots, three spots werefurther characterized by MALDI-TOF-MS. The proteins from thesethree spots were identified as serum amyloid A (SAA), amyloidrelated serum protein and haptoglobin (Figures 1, 2).
DISCUSSIONIn the present study, we found that serum amyloid A (SAA)and its isoform amyloid related serum protein, and haptoglobinwere significantly increased after operation in ESCC patientscompared with those in normal and pre-operation by massspectrum. It indicated that these proteins might be related withESCC and/or surgery. Although the literatures have reportedthat these acute-phase proteins are associated with tumors,such as colon cancer, the changes of these proteins may be moreconcerned with stress response, for example, the trauma byoperation. The significance for these proteins needs to be furthercharacterized. Although two-dimensional electrophoresis coupledwith mass spectrometry is a powerful tool for screening andidentification of cancer-specific protein markers, it costs timeand money. The present study provided informative data forthe establishment of serum protein profiles related with ESCC. SAA is an acute-phase protein existing as various isoforms ina molecular mass range of 11-14. It is derived mainly from two genes,SAA1 and SAA2[7], mapped at chromosome 11p15.4-15.1[8]. Innormal individuals, SAA is produced by hepatocytes in theliver. After its production, it is secreted into serum and rapidlybinds to high-density lipoproteins, 90% of the protein particlesare bound to high-density lipoprotein. A review of the literatureshowed that only a low level of SAA could be found in the seraof healthy individuals[9], but during the acute-phase response,its level in the blood could elevate 1 000-fold after various injuries,including trauma, infection, inflammation and neoplasia[10,11]. Recently, many studies have shown that high SAA proteinlevel is present in the serum of patients with disseminated cancer,reflecting the extent of malignant diseases, and inversely correlatedwith patient survival[12]. The mechanism is not clear. The modeof involvement of SAA in metastatic processes has not beenelucidated. Several proposed functions for SAA proteins arecompatible with the mechanism of tumor cell invasion andmetastasis. These include inhibition of malignant cell attachmentto extracellular matrix (ECM) proteins[13,14], induction of theexpression of enzymes degrading the ECM[15] and induction ofadhesion, migration, and tissue infiltration of cells[16-18]. Moreover,SAA contains functional arginine-glycine-aspartic acid (RGD) -like and tyrosine-isoleucine-glycine-serine-arginine (YIGSR) -likeadhesion motifs[19], and the peptides containing these motifs couldinhibit tumor cell invasion, metastasis, and angiogenesis[20,21].Cumulatively, these findings, together with our observation ofSAA alterations in blood after operation, imply that SAA mayplay a role in one or more steps of tumor progression or regression. Glojnaric et al.[22] indicated that although the presence ofcolorectal carcinoma caused an increase in serum levels of allthe acute phase reactants studied, SAA protein showed the mostpowerful reaction in pre-operative disease stage, with the meanvalue of 330 mg/L as compared to the normal values of <1.2 mg/Lobtained in 30 healthy adults. SAA protein concentration increasedto 487 mg/L after surgery and declined during the post-operativeclinical course until the sixth chemotherapy cycle, but neverreturned to the normal range. In the later chemotherapy cycles,the mean SAA protein increased to 163 mg/L, probably as aresult of the disease relapse. According to the statistical relationsamong exact confidence intervals for proportions, SAA proteinshowed the best specificity for colorectal carcinoma of all theacute phase proteins studied (83-100%) and also a sensitivityof 100%. They concluded that SAA protein seems to be a
3366 ISSN 1007-9327 CN 14-1219/ R World J Gastroenterol November 15, 2004 Volume 10 Number 22

An JY et al. Blood protein files in ESCC patients 3367
Figure 2 Representative of two-dimensional electrophoresis patterns of sera protein from the same esophageal squamous cellcarcinoma patient before (A) and after (B) operation and the normal subject (C) with different acidity from pH 3 to pH 10. A’, B’and C’ are the magnification of A, B and C, respectively, for the sera protein with marked difference.
Figure 1 Representative of two-dimensional electrophoresis profiles and three-matched protein spots (arrows) analysis of thesera from esophageal squamous cell carcinoma patients before (A) and after (B) operation with different acidity from pH 3 to pH 10.Norm: normalization, Vol: volume, BkGnd: background, Eq: equality.
pH 3 pH 10 pH 3 pH 10
Spot Volume Norm. Vol+BkGnd Peak Height Area: Pixels Background Eq. Radius Circularity Vol. Pixels
Pre-operation 218 2 411.42 0.635 2 411.42 1.816 2 830 0 30.01 0.78Post-operation 218 1 946.84 0.698 1 946.84 1.746 2 381 0 27.53 0.84Pre-operation 184 24.89 0.010 27.44 0.110 681 0 14.72 0.37Post-operation 184 462.77 0.127 478.60 0.593 1 810 0 24.00 0.84Pre-operation 172 86.42 0.024 86.42 0.359 954 0 17.43 0.74Post-operation 172 27.71 0.012 39.30 0.134 540 0 13.11 0.57
A B
reliable parameter, which could be recommended for clinicalroutine as a non-specific tumor marker for colorectal carcinoma. Haptoglobin is an acute phase protein capable of bindinghaemoglobin and may play a role in modulating many aspectsof the acute phase response[23]. The complex of haptoglobinwith haemoglobin is metabolized in the heptic reticuloendothelialsystem[24]. Biosynthesis of haptoglobin occurs not only in the
liver, but also in adipose tissue and in lung, providing antioxidantand antimicrobial activity[25]. Changes in the measuredconcentrations of haptoglobin in serum may help to assess thedisease status of patients with inflammations, infections,malignancy, etc[26]. Dynamic detection of haptoglobin in leukemiapatient plasmas showed that haptoglobin level increasedobviously in leukemia patients than that in normal persons and
pH 3 pH 10 pH 3 pH 10 pH 3 pH 10
A B C
A’ B’ C’

dropped gradually with the improvement of diseases. In conclusion, serum amyloid A, amyloid related serumprotein and haptoglobin may be related with ESCC. Thesignificance of these proteins needs to be further characterized.The present study provides informative data for the establishmentof serum protein profiles related with ESCC.
REFERENCES1 Wang LD, Zheng S. The mechanism of esophageal and gastric
cardia carcinogenesis from the subjects at high-incidence areafor esophageal cancer in henan. Zhengzhou Daxue Xuebao 2002;37: 717-729
2 Wang LD, Zhou Q, Feng CW, Liu B, Qi YJ, Zhang YR, Gao SS,Fan ZM, Zhou Y, Yang CS, Wei JP, Zheng S. Intervention andfollow-up on human esophageal precancerous lesions in Henan,northern China, a high-incidence area for esophageal cancer.Gan To Kagaku Ryoho 2002; 29(Suppl 1): 159-172
3 Hanash SM, Bobek MP, Rickman DS, Williams T, RouillardJM, Kuick R, Puravs E. Integrating cancer genomics andproteomics in the post-genome era. Proteomics 2002; 2: 69-75
4 Anderson NL, Anderson NG. The human plasma proteome:history, character, and diagnostic prospects. Mol Cell Proteomics2002; 1: 845-867
5 Simpson RJ. Proteins and Proteomics. A Laboratory Manual.1st. New York Cold Spring Harbor Laboratory Press 2003: 75-76
6 Bini L, Magi B, Marzocchi B, Arcuri F, Tripodi S, Cintorino M,Sanchez JC, Frutiger S, Hughes G, Pallini V, Hochstrasser DF,Tosi P. Protein expression profiles in human breast ductal car-cinoma and histologically normal tissue. Electrophoresis 1997;18: 2832-2841
7 Yamada T. Serum amyloid A (SAA): a concise review of biology,assay methods and clinical usefulness. Clin Chem Lab Med 1999;37: 381–388
8 Watson G, See CG, Woo P. Use of somatic cell hybrids andfluorescence in situ hybridization to localize the functional se-rum amyloid A (SAA) genes to chromosome 11p15.4-p15.1and the entire SAA superfamily to chromosome 11p15. Genomics1994; 23: 694–696
9 d’Eril GM, Anesi A, Maggiore M, Leoni V. Biological variationof serum amyloid A in healthy subjects. Clin Chem 2001; 47:1498–1499
10 Cho WC, Yip TT, Yip C, Yip V, Thulasiraman V, Ngan RK, YipTT, Lau WH, Au JS, Law SC, Cheng WW, Ma VW, Lim CK.Identification of serum amyloid a protein as a potentially usefulbiomarker to monitor relapse of nasopharyngeal cancer by serumproteomic profiling. Clin Cancer Res 2004; 10(1 Pt 1): 43-52
11 Urieli-Shoval S, Linke RP, Matzner Y. Expression and func-tion of serum amyloid A, a major acute-phase protein, in nor-mal and disease states. Curr Opin Hematol 2000; 7: 64-69
12 Kimura M, Tomita Y, Imai T, Saito T, Katagiri A, Ohara-
Mikami Y, Matsudo T, Takahashi K. Significance of serumamyloid A on the prognosis in patients with renal cellcarcinoma. Cancer 2001; 92: 2072–2075
13 Jensen LE, Whitehead AS. Regulation of serum amyloid Aprotein expression during the acute-phase response. Biochem J1998; 334(Pt 3): 489-503
14 Hershkoviz R, Preciado-Patt L, Lider O, Fridkin M, Dastych J,Metcalfe DD, Mekori YA. Extracellular matrix-anchored se-rum amyloid A preferentially induces mast cell adhesion. AmJ Physiol 1997; 273(1 Pt 1): C179-187
15 Preciado-Patt L, Levartowsky D, Prass M, Hershkoviz R, LiderO, Fridkin M. Inhibition of cell adhesion to glycoproteins of theextracellular matrix by peptides corresponding to serum amy-loid A. Toward understanding the physiological role of anenigmatic protein. Eur J Biochem 1994; 223: 35-42
16 Migita K, Kawabe Y, Tominaga M, Origuchi T, Aoyagi T,Eguchi K. Serum amyloid A protein induces production ofmatrix metalloproteinases by human synovial fibroblasts. LabInvest 1998; 78: 535–539
17 Urieli-Shoval S, Shubinsky G, Linke RP, Fridkin M, Tabi I,Matzner Y. Adhesion of human platelets to serum amyloid A.Blood 2002; 99: 1224-1229
18 Badolato R, Wang JM, Murphy WJ, Lloyd AR, Michiel DF,Bausserman LL, Kelvin DJ, Oppenheim JJ. Serum amyloid A isa chemoattractant: induction of migration, adhesion, and tissueinfiltration of monocytes and polymorphonuclear leukocytes. JExp Med 1994; 180: 203-209
19 Iwamoto Y, Nomizu M, Yamada Y, Ito Y, Tanaka K, SugiokaY. Inhibition of angiogenesis, tumour growth and experimentalmetastasis of human fibrosarcoma cells HT1080 by a multimericform of the laminin sequence Tyr-Iie-Gly-Ser-Arg (YIGSR). Br JCancer 1996; 73: 589-595
20 Ruoslahti E, Pierschbacher MD. New perspectives in celladhesion: RGD and integrins. Science 1987; 238: 491-497
21 Thorn CF, Lu ZY, Whitehead AS. Regulation of the humanacute phase serum amyloid A genes by tumour necrosis fac-tor-alpha, interleukin-6 and glucocorticoids in hepatic and epi-thelial cell lines. Scand J Immunol 2004; 59: 152-158
22 Glojnaric I, Casl MT, Simic D, Lukac J. Serum amyloid Aprotein (SAA) in colorectal carcinoma. Clin Chem Lab Med2001; 39: 129-133
23 Wassell J. Haptoglobin: function and polymorphism. Clin Lab2000; 46: 547-552
24 Kurash JK, Shen CN, Tosh D. Induction and regulation ofacute phase proteins in transdifferentiated hepatocytes. ExpCell Res 2004; 292: 342-358
25 Bernard D, Christophe A, Delanghe J, Langlois M, De BuyzereM, Comhaire F. The effect of supplementation with an antioxi-dant preparation on LDL-oxidation is determined by hapto-globin polymorphism. Redox Rep 2003; 8: 41-46
26 Dobryszycka W. Biological functions of haptoglobin-new piecesto an old puzzle. Eur J Clin Chem Clin Biochem 1997; 35: 647-654
Edited by Kumar M and Wang XL Proofread by Xu FM
3368 ISSN 1007-9327 CN 14-1219/ R World J Gastroenterol November 15, 2004 Volume 10 Number 22

PO Box 2345, Beijing 100023, China World J Gastroenterol 2004;10(22):3369-3373Fax: +86-10-85381893 World Journal of GastroenterologyE-mail: [email protected] www.wjgnet.com Copyright © 2004 by The WJG Press ISSN 1007-9327
• BRIEF REPORTS •
Tumor micrometastases in mesorectal lymph nodes and their
clinical significance in patients with rectal caner
Yang-Chun Zheng, Yu-Ying Tang, Zong-Guang Zhou, Li Li, Tian-Cai Wang, Yi-Ling Deng, Dai-Yun Chen, Wei-Ping Liu
Yang-Chun Zheng, Zong-Guang Zhou, Li Li, Tian-Cai Wang,Department of Gastroenterological Surgery, West China Hospital,Sichuan University, Chengdu 610041, Sichuan Province, ChinaYu-Ying Tang, Department of Anesthesiology, West China Hospital,Sichuan University, Chengdu 610041, Sichuan Province, ChinaYi-Ling Deng, Dai-Yun Chen, Wei-Ping Liu, Department ofPathology, West China Hospital, Sichuan University, Chengdu 610041,Sichuan Province, ChinaSupported by the National Natural Science Foundation of China, No.39925032Correspondence to: Dr. Zong-Guang Zhou, Department ofGastroenterological Surgery, West China Hospital, Sichuan University,37 Guo Xue Xiang, Chengdu 610041, Sichuan Province,China. [email protected]: +86-28-85422484 Fax: +86-28-85422484Received: 2004-03-09 Accepted: 2004-04-05
Abstract
AIM: To investigate the number, size, and status of lymphnodes within the mesorectum and to explore the prognosticsignificance of lymph node micrometastases in patients withrectal cancer.
METHODS: Thirty-one patients with rectal cancer undergonetotal mesorectal excision between October 2001 and October2002 were included. Mesorectal nodes retrieved from theresected specimens were detected with a combination ofhaematoxylin and eosin (HE) staining and immunohistoch-emistry (IHC). The relations between lymph node metastases,micrometastases and postoperative recurrence were analyzed.
RESULTS: A total of 548 lymph nodes were harvested,with 17.7±8.2 nodes per case. The average number ofmetastatic nodes in HE-positive patients and micrometastaticnodes in IHC-positive patients was 5.2±5.1 per case and2.2±1.3 per case, respectively. The mean size of all nodesand metastatic nodes was 4.1±1.8 mm and 5.2±1.7 mm indiameter, respectively. The mean size of micrometastaticnodes was 3.9±1.4 mm in diameter. The size of the majorityof mesorectal nodes (66.8%), metastatic nodes (52.6%), andmicrometastatic nodes (79.5%) was less than 5 mm in diameter.During a median follow-up period of 24.6±4.7 mo, 5 patients(16.7%) had recurrence, of them 2 died and 3 survived.Another case died of tumor unrelated cause and was excluded.All 5 recurrent cases had 3 or more nodes involved, and oneof them developed only lymph node micrometastases. Themean number of both metastatic and micrometastatic nodesper case differed significantly between the recurrent andnon-recurrent groups (P<0.01 and P = 0.01, respectively).
CONCLUSION: The majority of lymph nodes, metastatic,and micrometastatic lymph nodes within the mesorectumare smaller than 5 mm in diameter. The nodal status andthe number of lymph nodes involved with tumor metastasesand micrometastases are related to the rapid postoperativerecurrence.
Zheng YC, Tang YY, Zhou ZG, Li L, Wang TC, Deng YL,
Chen DY, Liu WP. Tumor micrometastases in mesorectal lymphnodes and their clinical significance in patients with rectalcaner. World J Gastroenterol 2004; 10(22): 3369-3373
http://www.wjgnet.com/1007-9327/10/3369.asp
INTRODUCTIONLymph node involvement is one of the most important factorsin determining the prognosis of patients with rectal cancer[1-6].Patients with lymph node involvement were found to sufferfrom more advanced diseases according to the tumor-node-metastasis (TNM) classification system[6], and up to 30% of themeventually developed recurrences after a potentially curativeresection[7,8]. In contrast, some patients without positive lymphnodes also had postoperative recurrences or developed metastaticdiseases, which were reported to be associated with lymphnode micrometastases missed by conventional pathologicalexamination[9-13]. Lymph node spread of rectal cancer generally follows ananatomical route from the proximity to distance along the mainsupplying vessels of the rectum[14,15]. Lymph nodes containedin the mesorectum are thereby the earliest and most frequentones that might be involved when tumor spread occurs[14-16].Although reports have emphasized the importance of regionallymph nodes in the prognosis of rectal cancer[1,2,17-21], fewstudies available have investigated the number and size of lymphnodes within the rectal mesentery[22,23]. The clinical significanceof mesorectal lymph node metastases and micrometastasesremains to be fully acknowledged[22,23]. This study was conductedto examine the number, size, and status of lymph nodes withinthe mesorectum, and to investigate the prognostic value oflymph node metastases, especially lymph node micrometastases,in patients with rectal cancer.
MATERIALS AND METHODSPatientsFrom October 2001 to October 2002, 31 patients with rectalcancer undergone total mesorectal excision (TME) at theDepartment of Gastroenterological Surgery of West ChinaHospital were included. There were 18 males and 13 females,with an average age of 55 (32-72) years. Of them, 7 cases werepatients with high rectal cancer (above the peritoneal reflection)and 24 cases were patients with lower rectal cancer (below theperitoneal reflection). Three tumors were highly differentiated,20 moderately differentiated, and 8 poorly differentiated. All patientsreceived standard preoperative examination and the diagnosisof rectal adenocarcinoma was made by fibrocolonoscopy andconfirmed by pathological biopsy before surgery. All operationswere carefully performed by skillful surgeons following theprinciple of TME[24], and the rectal specimens resected werecollected prospectively.
Specimen processingAfter removal, the specimens were routinely processed withneutral buffered 100 mL/L formalin solution for 24 h, andimmersed in lymph node revealing solution (LNRS) for 6 h ormore[25]. Later, they were washed thoroughly with running

water. Fat tissues in the specimens were dissected carefully atintervals of 2-3 mm from upward down to the level of distanttransaction along the runway of the superior rectal artery (SRA).Lymph nodes stood out as white, and chalky nodules againstthe background of yellow fat were harvested and recorded.
Pathological examinationAfter retrieval, each lymph node was embedded separately inparaffin. The block was then sectioned serially at intervals of20-40 µm, with each section of 4 µm in thickness. Two sectionssampled randomly from 10 representative levels were subjectedto haematoxylin and eosin (HE) staining. For nodes diagnosednegatively by HE staining, another 3 sections were furthersingled out, one for HE re-examination, the other two forimmunohistochemistry (IHC). Immunohistochemistry was performed using labelledstreptavidin biotin method (LsAB). Briefly, all sections weredeparaffinized and rehydrated. Then, they were immersed in30 mL/L H2O2 for 20 min to block the endogenous peroxidaseactivity. Sections were then incubated with 100 mL/L normalgoat serum for 20 min, followed by incubation with mousemonoclonal anti-human cytokeratin (CK) 20 antibody(Neomarkers, Lab Vision Corporation, CA, USA) (1:50) at 4 overnight. After that, the sections were washed with phosphatebuffered solution (PBS) (0.01 mol/L, pH 7.2) and sequentiallyincubated with biotinylated goat anti-mouse IgG, andstreptavidin biotin horseradish peroxidase complex followingthe manufacturer’s instructions (HistostainTM-SP Kits, Zymedlaboratories Inc., San Francisco, CA, USA). Staining wasdeveloped by immersing slides in 0.5 g/L 3,3’-diaminobenzidingtetrahydrochloride (DAB) with 3.3 mol/L H2O2. All slides werecounterstained with haematoxylin, dehydrated and mounted.Yellowish staining of the tumor cell cytoplasm was taken aspositive. Previously confirmed rectal adenocarcinoma tissueserved as positive control, and substitution of the primarymonoclonal antibody with PBS was used as negative control.Tumor micrometastases were occult diseases generally missedby HE staining while detected by IHC, and were characterized assingle cell or small cluster of cells showing malignant morphology.
Follow-upAll patients were regularly followed up to now. The follow-up
interval was every 3 mo after surgery during the first year andevery 6 mo thereafter. The time of recurrence and the cause ofdeath were inquired and recorded.
Statistical analysisThe t test for difference in mean values and χ2 test for differencein frequencies were performed using SPSS 10.0 softwarepackage. P<0.05 was considered statistically significant.
RESULTSMicrometastases and number of lymph nodesA total of 548 mesorectal lymph nodes were retrieved from the31 specimens, with 17.7±8.2 lymph nodes per case. HE stainingdetected 114 lymph nodes positive in 22 patients (71.0%). Theaverage number of metastatic lymph nodes in HE-positive patientswas 5.2±5.1 per case. IHC re-examination of the remainingnegative nodes revealed 39 lymph nodes (9.0%) positive withtumor micrometastases from 18 cases (58.1%). Among them,5 cases (16.1%) with 10 nodes positive with IHC staining werepreviously assumed free of metastatic diseases. The averagenumber of micrometastatic lymph nodes in IHC-positive patientswas 2.2±1.3 per case.
Micrometastases and size of lymph nodesThe average diameter of all the 548 lymph nodes was 4.1±1.8 mm.The mean size of 114 metastatic lymph nodes (5.2±1.7 mm indiameter) was significantly larger than that of 39 micrometastaticlymph nodes (3.9±1.4 mm in diameter) (P<0.01). Of all the lymphnodes, 92 (16.8%) were 2 mm in diameter, with 4 metastatic and 3micrometastatic lymph nodes; 182 (33.2%) 5 mm, with 54metastatic and 8 micrometastatic lymph nodes; and 274 (50.0%)with a size between 2 mm and 5 mm in diameter, with 56 metastaticand 28 micrometastatic lymph nodes (Table 1). It was noted thatthe majority of lymph nodes (66.8%) were <5 mm in diameter,and 52.6% of the metastatic nodes and a higher proportion ofthe micrometastatic nodes (79.5%) were <5 mm in diameter also.
Lymph node metastases and micrometastases and prognosisAll the 31 patients were successfully followed-up. Patients withlymph node metastases received regular chemotherapy after surgery.However, during a median follow-up period of 24.6±4.7 mo, one
Table 1 Size of lymph nodes (LNs) and status of tumor metastases and micrometastases
No. of LNsSize of LNs (mm) Positive ratio (%)
Total HE-positive IHC-positive Sum of positive
2 92 4 3 7 7.6b
2-5 274 56 28 84 30.75 182 54 8 62 34.1d
Total 548 114 39 153 27.9
bP<0.01, vs 2-5; dP<0.01, vs 2.
Table 2 Clinicopathological features of five recurrent patients with lower rectal cancer
Characteristics of tumor No. of LNsCase No. Sex Age (yr) Site of recurrence Outcome
Differentiation Invasion Total M MM
1 Female 35 Well Muscle 15 3 2 Lung Surviving2 Female 65 Poor Serosa 22 22 0 Pelvis+liver Dead3 Male 50 Moderate Muscle 27 0 3 Pelvis Surviving4 Male 45 Poor Serosa 30 17 4 Pelvis Dead5 Male 32 Poor Muscle 21 5 5 Pelvis Surviving
LNs: lymph nodes; M: metastatic; MM: micrometastatic.
3370 ISSN 1007-9327 CN 14-1219/ R World J Gastroenterol November 15, 2004 Volume 10 Number 22

patient died of tumor unrelated cardiovascular disturbance 24 mopost operation and was excluded from the analysis. Among thefive cases (16.7%) with lower tumor recurrences, 3 cases werelocalized in the pelvic floor, one case spread to the lung, andone case with both pelvic and liver involvements. Two of themdied and the other three remained alive. All the recurrent patientsshared the characteristics of having 3 or more lymph nodesinvolved with tumor metastases and/or micrometastases. Of them,one case with mere lymph node micrometastases also developedlocal recurrence 17 mo after operation (Tables 2, 3). Comparisonanalysis showed that both the number of metastatic andmicrometastatic lymph nodes between the recurrent and non-recurrent groups differed significantly (P<0.01 and P = 0.01,respectively), although such a statistical difference was notfound between them in reference to the total number identifiedper case (Table 4).
DISCUSSIONThe nodal status is the single powerful predictor of survival inrectal cancer[1,2,20,21]. Both the number and location of lymph nodesinvolved have significant impacts on the outcome of patientswith rectal cancer[6,15,21,26]. However, the nodal staging accuracyis not easy to make[27-29]. Factors contributing to this dilemmainclude the mount of mesentery resected, diligence for searchof nodes paid, number of histological slices investigated, andmethods of pathological examination employed[30-33]. There arestill wide variations regarding the minimum number of lymphnodes to be examined for a reliable node-negative diagnosis,the reported recommendations were 6 to 17 lymph nodes[34-36].The non-uniform extent of lymph nodes collected for investigationmade the results incomparable between authors, and the absenceof consensus on the number of lymph nodes contained in themesentery worsened the situation further[36,37]. It was established that the lymphatic spread of rectal cancerfollowed an anatomical way along which the normal lymphaticfluid drains[14,15]. As a consequence, lymph nodes contained inthe mesorectum are the earliest and the most frequent ones thatmight be involved when the dissemination of tumor cells takesplace[14-16]. Focused examination of the mesorectal lymph nodes,thereby, could identify most metastases and micrometastasesin the first place[15], though skip metastases might exist in a fewcases[38,39]. However, available data have provided little informationon the lymph nodes enveloped within the mesorectum[22,23]. Thenumber and size of lymph nodes, and their tumor status remainto be defined. Recently, Canessa et al.[22] recovered 168 mesorectal lymphnodes from 20 cadavers and found that the mean number was8.4 per specimen. They searched the lymph nodes from the division
of the superior rectal artery which excluded the lymph nodesthat lie above it, i.e., the lymph nodes along the main trunk of it,that should otherwise be referred to ‘mesorectal’ nodes by strictdefinition[40]. Also in an another study on cadavers, an averageof 24.9 pelvic lymph nodes were identified from 7 fresh specimens,which included 13.6 mesorectal lymph nodes per case[23]. Theirstudy employed modified LNRS to facilitate the identificationof lymph nodes in the mesorectum. Therefore, the lymph nodesthey retrieved outnumbered those in previous study markedly[23].In the current study, the LNRS was also used to help identifylymph nodes embedded in the mesorectal fat. A mean numberof 17.7 lymph nodes per case were dissected. The majority ofthem (82.2%) were located along the superior rectal artery. Thesizes of 66.8% of the total lymph nodes, 59.8% of the metastaticlymph nodes and 79.5% of the micrometastatic lymph nodeswere <5 mm in diameter. The minimal size of lymph nodes foundwas 0.7 mm in diameter. These lymph nodes, especially thosewith a diameter 2 mm, were at great risk of being missed inroutine pathological sampling with only naked speculation andmanual palpitation[41-43]. By further examining the HE-negativenodes with IHC staining, we identified 39 nodes positive withtumor micrometastases from 18 cases (58.1%). Of interest, 10 nodeswith micrometastatic diseases in 5 cases (16.1%) were previouslyassumed free of tumor spread by routine pathological examination.Thus this group of patients was upstaged. The superior sensitivity of IHC to HE staining in detectingmicrometastases in colorectal cancer has been well recognized[44-47].Although its sensitivity remained ten times lower compared toreverse transcriptase polymerase chain reaction (RT-PCR)techniques, IHC is probably more specific and reliable, in that itallows examining the morphology of stained cells and differentiatingfrom that of non-specific background staining[44-46]. There arestill many controversies regarding the prognostic significanceof micrometastases in colorectal cancer[10,11,47-54]. It was arguedthat although the application of IHC technique had the addedability to identify overt diseases missed by HE staining, it offeredlittle prognostic information on the postoperative recurrenceand long year survival[10,49-52]. On the contrary, authors favoringthe detection of lymph node micrometastases stated that it wasnot only one of the major concerns for the proper staging of diseases,but also of prognostic relevance to the outcome of patients withrectal cancer, thus suggesting helpful in the early planning of amultimodality treatment protocol for indicated patients[11,53,54]. Choi et al.[50] retrospectively reviewed 1 808 lymph nodesfrom 93 Dukes’ B colorectal tumors with IHC staining and foundthat 54 lymph nodes (3.0%) from 29 cases (31.2%) harboredmicrometastatic diseases. However, the five-year survival analysisshowed no significant difference between the micrometastaticgroup and non-micrometastatic group. Yasuda et al.[11] employed
Zheng YC et al. Micrometastases in mesorectal nodes 3371
Table 3 Comparison of recurrence between patients with different nodal status
HE-positive HE-negativeVariables Total
IHC-positive IHC-negative IHC-positive IHC-negative
No. of case 13 8 5 4 30Recurrence 3 1 1 0 5Recurrence rate (%) 23.1 12.5 20 0 16.7
Table 4 Comparison of nodal status between recurrent and non-recurrent group
LNs (mean±SD)Grouping Positive ratio (%)
Total HE-positive IHC-positive Sum of positive
Recurrent group 23.0±5.8 9.4±9.6 2.8±1.9 12.2±8.9 53.0Non-recurrent group 17.0±8.2 2.6±2.5 1.0±1.2 3.6±3.0 21.4P 0.135 0.003 0.01 0.000 0.000

IHC method and examined a total of 1 013 lymph nodes from 12recurrent and 30 non-recurrent patients with histologicallydetermined Dukes’ B colorectal cancer. Micrometastases wereconfirmed in 59 lymph nodes (16%) from 11 cases (92%) in therecurrent group, and 77 lymph nodes (12%) from 21 cases (70%)in the non-recurrent group. They further demonstrated thatmicrometastases in four or more lymph nodes occurred morefrequently in the recurrent group than in the non-recurrentgroup (58% vs 20%, P<0.05), and micrometastases to N2 orhigher nodes occurred more frequently in the recurrent groupalso (92% vs 47%, P<0.01). Afterwards they concluded that thenumber and level of positive micrometastatic lymph nodes wereboth significantly correlated with postoperative recurrence ofhistologically determined Dukes’ B colorectal cancer[11]. In the present study, 5 patients with rectal cancer developedrecurrences. The rate of recurrence was 16.7% within two yearsafter curative operation. All patients suffering from recurrentdiseases had three or more mesorectal nodes involved withtumor metastases and/or micrometastases, one patient withlymph node micrometastases developed recurrence also. It wasnoted that both the number of metastatic and micrometastaticlymph nodes differed significantly between the recurrent andnon-recurrent groups (P<0.01 and P = 0.01, respectively),implying that lymph node micrometastases and the number oflymph nodes involved might also correlate with the outcome ofpatients with rectal cancer, while the prognostic value of lymphnode metastases was confirmed. In summary, by using the LNRS to facilitate identifyinglymph nodes, and with a combination of HE and IHC to detecttumor metastases and micrometastases, we have provided adetailed description of both the number and size of lymph nodesenveloped in the mesorectum, as well as their tumor status withmetastases and micrometastases in rectal cancer. The rapidrecurrence of tumor after a cure-intended surgery is related tothe tumor status of mesorectal lymph nodes. The presence oflymph node micrometastases and the number of lymph nodesinvolved might have some value for the prediction of tumorrecurrence in rectal cancer[11,47,48,53,54], now that the importance oflymph node metastases has been widely acknowledged[1-6,19,21].However, it is too cursory to draw a convincing conclusion,concerning the small samples included and only short-termoutcome investigated in the current study. Future multi-centrallarge-sample controlled studies are needed to clearly define therole of lymph node micrometastases in the prognosis of patientswith rectal cancer.
REFERENCES1 Fujita S, Shimoda T, Yoshimura K, Yamamoto S, Akasu T,
Moriya Y. Prospective evaluation of prognostic factors in pa-tients with colorectal cancer undergoing curative resection. JSurg Oncol 2003; 84: 127-131
2 Bannura G, Cumsille MA, Contreras J, Melo C, Barrera A,Reinero M, Pardo L. Prognostic factors in colorectal neoplasm.Multivariate analysis in 224 patients. Rev Med Chil 2001; 129:237-246
3 Bernick PE, Wong WD. Staging: what makes sense? Can thepathologist help? Surg Oncol Clin N Am 2000; 9: 703-720
4 Gennari L, Doci R, Rossetti C. Prognostic factors in colorectalcancer. Hepatogastroenterology 2000; 47: 310-314
5 Sobin LH. TNM: evolution and relation to other prognosticfactors. Semin Surg Oncol 2003; 21: 3-7
6 Compton C, Fenoglio-Preiser CM, Pettigrew N, Fielding LP.American joint committee on cancer prognostic factors consensusconference: Colorectal working group. Cancer 2000; 88: 1739-1757
7 Demols A, Van Laethem JL. Adjuvant chemotherapy forcolorectal cancer. Curr Gastroenterol Rep 2002; 4: 420-426
8 Frizelle FA, Emanuel JC, Keating JP, Dobbs BR. A multicentreretrospective audit of outcome of patients undergoing cura-tive resection for rectal cancer. N Z Med J 2002; 115: 284-286
9 Shimoyama M, Yamazaki T, Suda T, Hatakeyama K. Prog-nostic significance of lateral lymph node micrometastases inlower rectal cancer: an immunohistochemical study withCAM5.2. Dis Colon Rectum 2003; 46: 333-339
10 Noura S, Yamamoto H, Ohnishi T, Masuda N, Matsumoto T,Takayama O, Fukunaga H, Miyake Y, Ikenaga M, Ikeda M,Sekimoto M, Matsuura N, Monden M. Comparative detectionof lymph node micrometastases of stage II colorectal cancer byreverse transcriptase polymerase chain reaction andimmunohistochemistry. J Clin Oncol 2002; 20: 4232-4241
11 Yasuda K, Adachi Y, Shiraishi N, Yamaguchi K, HirabayashiY, Kitano S. Pattern of lymph node micrometastasis and prog-nosis of patients with colorectal cancer. Ann Surg Oncol 2001;8: 300-304
12 Liefers GJ, Cleton-Jansen AM, van de Velde CJ, Hermans J,van Krieken JH, Cornelisse CJ, Tollenaar RA. Micrometastasesand survival in stage II colorectal cancer. N Engl J Med 1998;339: 223-228
13 Isaka N, Nozue M, Doy M, Fukao K. Prognostic significance ofperirectal lymph node micrometastases in Dukes’ B rectalcarcinoma: an immunohistochemical study by CAM5.2. ClinCancer Res 1999; 5: 2065-2068
14 Bartholdson L, Hultborn A, Hulten L, Roos B, Rosencrantz M,Ahren C. Lymph drainage from the upper and middle third ofthe rectum as demonstrated by 198 Au. Acta Radiol Ther PhysBiol 1977; 16: 352-360
15 Cserni G, Tarjan M, Bori R. Distance of lymph nodes from thetumor: an important feature in colorectal cancer specimens.Arch Pathol Lab Med 2001; 125: 246-249
16 Yamada H, Katoh H, Kondo S, Okushiba S, Morikawa T. Me-senteric lymph nodes status influencing survival and recur-rence pattern after hepatectomy for colorectal liver metastases.Hepatogastroenterology 2002; 49: 1265-1268
17 Mukai M, Ito I, Mukoyama S, Tajima T, Saito Y, Nakasaki H,Sato S, Makuuchi H. Improvement of 10-year survival by Japa-nese radical lymph node dissection in patients with Dukes’ Band C colorectal cancer: a 17-year retrospective study. OncolRep 2003; 10: 927-934
18 Cserni G. Nodal staging of colorectal carcinomas and sentinelnodes. J Clin Pathol 2003; 56: 327-335
19 Ueno H, Mochizuki H, Hashiguchi Y, Hase K. Prognostic de-terminants of patients with lateral nodal involvement by rectalcancer. Ann Surg 2001; 234: 190-197
20 Gervasoni JE Jr, Taneja C, Chung MA, Cady B. Biologic andclinical significance of lymphadenectomy. Surg Clin North Am2000; 80: 1631-1673
21 Takahashi K, Mori T, Yasuno M. Histologic grade of meta-static lymph node and prognosis of rectal cancer. Dis ColonRectum 2000; 43(10 Suppl): S40-S46
22 Canessa CE, Badia F, Fierro S, Fiol V, Hayek G. Anatomicstudy of the lymph nodes of the mesorectum. Dis Colon Rectum2001; 44: 1333-1336
23 Topor B, Acland R, Kolodko V, Galandiuk S. Mesorectal lymphnodes: their location and distribution within the mesorectum.Dis Colon Rectum 2003; 46: 779-785
24 Heald RJ, Husband EM, Ryall RD. The mesorectum in rectalcancer surgery-the clue to pelvic recurrence? Br J Surg 1982; 69:613-616
25 Koren R, Siegal A, Klein B, Halpern M, Kyzer S, Veltman V,Gal R. Lymph node-revealing solution: simple new method fordetecting minute lymph nodes in colon carcinoma. Dis ColonRectum 1997; 40: 407-410
26 Luna-Perez P, Rodriguez-Ramirez S, Alvarado I, Gutierrez dela Barrera M, Labastida S. Prognostic significance of retrievedlymph nodes per specimen in resected rectal adenocarcinomaafter preoperative chemoradiation therapy. Arch Med Res 2003;34: 281-286
27 Turner RR, Nora DT, Trocha SD, Bilchik AJ. Colorectal carci-noma nodal staging. Frequency and nature of cytokeratin-posi-tive cells in sentinel and nonsentinel lymph nodes. Arch PatholLab Med 2003; 127: 673-679
28 Miyake Y, Yamamoto H, Fujiwara Y, Ohue M, Sugita Y, TomitaN, Sekimoto M, Matsuura N, Shiozaki H, Monden M. Exten-sive micrometastases to lymph nodes as a marker for rapidrecurrence of colorectal cancer: a study of lymphatic mapping.
3372 ISSN 1007-9327 CN 14-1219/ R World J Gastroenterol November 15, 2004 Volume 10 Number 22

Clin Cancer Res 2001; 7: 1350-135729 Joseph NE, Sigurdson ER, Hanlon AL, Wang H, Mayer RJ,
MacDonald JS, Catalano PJ, Haller DG. Accuracy of determin-ing nodal negativity in colorectal cancer on the basis of thenumber of nodes retrieved on resection. Ann Surg Oncol 2003;10: 213-218
30 Poller DN. Method of specimen fixation and pathological dis-section of colorectal cancer influences retrieval of lymph nodesand tumour nodal stage. Eur J Surg Oncol 2000; 26: 758-762
31 Rosenberg R, Friederichs J, Gertler R, Hoos A, Mueller J, NahrigJ, Nekarda H, Siewert JR. Prognostic evaluation and review ofimmunohistochemically detected disseminated tumor cells inperitumoral lymph nodes of patients with pN0 colorectal cancer.Int J Colorectal Dis 2004; 19: 430-437
32 Johnson PM, Malatjalian D, Porter GA. Adequacy of nodalharvest in colorectal cancer: a consecutive cohort study. JGastrointest Surg 2002; 6: 883-888
33 Wong JH, Steinemann S, Tom P, Morita S, Tauchi-Nishi P.Volume of lymphatic metastases does not independently in-fluence prognosis in colorectal cancer. J Clin Oncol 2002; 20:1506-1511
34 Cserni G, Vinh-Hung V, Burzykowski T. Is there a minimumnumber of lymph nodes that should be histologically assessedfor a reliable nodal staging of T3N0M0 colorectal carcinomas?J Surg Oncol 2002; 81: 63-69
35 Leibl S, Tsybrovskyy O, Denk H. How many lymph nodes arenecessary to stage early and advanced adenocarcinoma of thesigmoid colon and upper rectum? Virchows Arch 2003; 443:133-138
36 Cianchi F, Palomba A, Boddi V, Messerini L, Pucciani F, PerigliG, Bechi P, Cortesini C. Lymph node recovery from colorectaltumor specimens: recommendation for a minimum number oflymph nodes to be examined. World J Surg 2002; 26: 384-389
37 Ratto C, Sofo L, Ippoliti M, Merico M, Bossola M, Vecchio FM,Doglietto GB, Crucitti F. Accurate lymph-node detection incolorectal specimens resected for cancer is of prognosticsignificance. Dis Colon Rectum 1999; 42: 143-154
38 Prabhudesai AG, Kumar D. The sentinel lymph node in colorectalcancer - of clinical value? Colorectal Dis 2002; 4: 162-166
39 Vekic B, Radovanovic D, Cvetanovic M, Zivanovic J, PavlovicI. Skip metastases in rectosigmoid carcinoma. Srp Arh Celok Lek2003; 131: 48-51
40 Shafik A. Mesorectal lymph nodes and their relation to thesuperior rectal artery: do they exist below or above the superiorrectal artery division? Dis Colon Rectum 2002; 45: 1122
41 Andreola S, Leo E, Belli F, Gallino G, Sirizzotti G, SampietroG. Adenocarcinoma of the lower third of the rectum: metastases
in lymph nodes smaller than 5 mm and occult micrometastases;preliminary results on early tumor recurrence. Ann Surg Oncol2001; 8: 413-417
42 Cserni G. The influence of nodal size on the staging of colorectalcarcinomas. J Clin Pathol 2002; 55: 386-390
43 Nagtegaal ID, van Krieken JH. The role of pathologists in thequality control of diagnosis and treatment of rectal cancer-anoverview. Eur J Cancer 2002; 38: 964-972
44 Nordgard O, Aloysius TA, Todnem K, Heikkila R, Ogreid D.Detection of lymph node micrometastases in colorectal cancer.Scand J Gastroenterol 2003; 38: 125-132
45 O’Dwyer ST, Haboubi NY, Johnson JS, Gardy R. Detection oflymph node metastases in colorectal carcinoma. Colorectal Dis2001; 3: 288-294
46 van Wyk Q, Hosie KB, Balsitis M. Histopathological detectionof lymph node metastases from colorectal carcinoma. J ClinPathol 2000; 53: 685-687
47 Tsavellas G, Patel H, Allen-Mersh TG. Detection and clinicalsignificance of occult tumour cells in colorectal cancer. Br JSurg 2001; 88: 1307-1320
48 Feezor RJ, Copeland EM 3rd, Hochwald SN. Significance ofmicrometastases in colorectal cancer. Ann Surg Oncol 2002; 9:944-953
49 Fisher ER, Colangelo L, Wieand S, Fisher B, Wolmark N. Lackof influence of cytokeratin-positive mini micrometastases in“Negative Node” patients with colorectal cancer: findings fromthe national surgical adjuvant breast and bowel projects pro-tocols R-01 and C-01. Dis Colon Rectum 2003; 46: 1021-1025
50 Choi HJ, Choi YY, Hong SH. Incidence and prognostic impli-cations of isolated tumor cells in lymph nodes from patientswith Dukes B colorectal carcinoma. Dis Colon Rectum 2002;45 : 750-755
51 Noura S, Yamamoto H, Miyake Y, Kim B, Takayama O,Seshimo I, Ikenaga M, Ikeda M, Sekimoto M, Matsuura N,Monden M. Immunohistochemical assessment of localizationand frequency of micrometastases in lymph nodes of colorectalcancer. Clin Cancer Res 2002; 8: 759-767
52 Tschmelitsch J, Klimstra DS, Cohen AM. Lymph nodemicrometastases do not predict relapse in stage II colon cancer.Ann Surg Oncol 2000; 7: 601-608
53 Deng H, Shu XJ, Zhen HY, Deng L, Chen Y, Liu LJ. Prognosticsignificance of lymph node micrometastasis in colorectal cancer.Aizheng 2003; 22: 762-766
54 Clarke G, Ryan E, O’Keane JC, Crowe J, MacMathuna P. Thedetection of cytokeratins in lymph nodes of Duke’s B colorectalcancer subjects predicts a poor outcome. Eur J GastroenterolHepatol 2000; 12: 549-552
Edited by Kumar M and Wang XL Proofread by Xu FM
Zheng YC et al. Micrometastases in mesorectal nodes 3373

PO Box 2345, Beijing 100023, China World J Gastroenterol 2004;10(22):3374-3376Fax: +86-10-85381893 World Journal of GastroenterologyE-mail: [email protected] www.wjgnet.com Copyright © 2004 by The WJG Press ISSN 1007-9327
• BRIEF REPORTS •
Possible stem cell origin of human cholangiocarcinoma
Chao Liu, Jie Wang, Qing-Jia Ou
Chao Liu, Jie Wang, Qing-Jia Ou, Department of General Surgery,Sun Yat-Sen Memorial Hospital, Sun Yat-Sen University, Guangzhou510120, Guangdong Province, ChinaCorrespondence to: Dr. Chao Liu, Department of General Surgeryand Transplantation, University Hospital Essen, Hufelandstr. 55,Essen D-45122, Germany. [email protected]: +49-201-7231104 Fax: +49-201-7235946Received: 2004-02-28 Accepted: 2004-04-29
Abstract
AIM: To investigate the expression of CD34 and c-kit (receptorof stem cell factor) in cholangiocarcinoma.
METHODS: Fifteen cases of intrahepatic cholangiocarcinomaand 17 cases of extrahepatic cholangiocarcinoma were studiedin this experiment. Using Envision detection system, paraffin-embedded sections of the resected cholangiocarcinomatissue were stained with antibodies against CD34 and c-kit, respectively. The sections were counterstained withhematoxylin, and the results were examined under lightmicroscope. Normal tonsil and mammary tissues were usedas positive controls for CD34 and c-kit, respectively.
RESULTS: CD34 was positive in all sections, but only in capillaryendothelial cells of tumor tissue. No cholangiocarcinomacells were positive for CD34. In one case of extrahepaticcholangiocarcinoma, a few tumor cells (about 5%) wereimmunoreactive with c-kit.
CONCLUSION: CD34 or c-kit positive cells in liver tissue mayrepresent liver stem cells, as they can differentiate intomature biliary cells in vitro. The expression of c-kit by somecholangiocarcinoma cells suggests that cholangiocarcinomamight originate from liver stem cells. However, othermechanisms of hepatocarcinogenesis, such as de-differentiationof mature cholangiocytes, may also exist.
Liu C, Wang J, Ou QJ. Possible stem cell origin of humancholangiocarcinoma. World J Gastroenterol 2004; 10(22):3374-3376
http://www.wjgnet.com/1007-9327/10/3374.asp
INTRODUCTIONTwo theories are available to explain the process of hepatocar-cinogenesis, one is de-differentiation of mature liver cells(hepatocytes and cholangiocytes), the other is maturation arrestof liver stem cells[1]. In normal liver, putative liver stem cellsmay exist at terminal bile ductules (canal of Hering) and periductulararea[2,3]. In rodent animals, when damage and loss of hepatocytesand/or cholangiocytes are combined with impaired regenerationof the mature cells, liver stem cells may be activated. Theyproliferate and differentiate towards both hepatic and biliarylineages[2,4-7]. Activation of liver stem cells has been observedin various human liver diseases, such as acute liver necrosis[8],hemochromatosis[9], chronic cholestatic diseases[10], alcoholicliver diseases[9] and chronic viral hepatitis[9,11,12]. In human liverfocal nodular hyperplasia[13], hepatic adenoma[14], hepatocellular
carcinoma[15] and hepatoblastoma[16], some tumor cells havealso been detected to express the specific markers of liver stemcells, indicating their possible stem cell origin. In animals,cholangiocarcinoma can also originate from liver stem cells[17]. CD34 and c-kit are two hemapoietic markers, but in periductulararea and occasionally within bile ducts, CD34 and c-kit positivecells were also found[18]. CD34 or c-kit positive cells in humanliver can be isolated with immunomagnetic separation techniques,and these isolated cells are able to differentiate into biliaryepithelial cells in vitro[18]. Thus, CD34 and c-kit positive cells inhuman liver may represent liver stem cells. In this study, theexpression of CD34 and c-kit in human cholangiocarcinomawas investigated.
MATERIALS AND METHODSSpecimensParaffin-embedded specimens from 32 cases of resectedcholangiocarcinoma at Sun Yat-Sen Memorial Hospital werestudied in this experiment. They included 18 male and 14 femalepatients, ranging from 24 to 80 years old (mean and medium64 years old). Fifteen cases had the tumor located in intrahepaticbile duct (IBD), 4 cases in common hepatic bile duct (CHBD)and 13 cases in common bile duct (CBD). Some clinical characteristicsof the patients are summarized in Table 1.
ImmunohistochemistryEach paraffin-embedded specimen was cut consecutively into6 sections. Three sections of CD34 and 3 sections of c-kit werestained with Envision detection system (DAKO, Denmark). CD34retrieval was performed by heating the sections in 10 mmol/Lcitrate buffer (pH 6.0). In brief, the tissue sections were incubatedwith peroxidase blocking reagent (DAKO) for 5 min, incubatedwith CD34 (monoclonal mouse anti-human, IgG1, kappa, readyto use; DAKO) for 10 min or c-kit (polyclonal rabbit anti-human,1:50; DAKO) for 30 min at room temperature. Then, the sectionswere incubated with peroxidase labelled polymer conjugatedto goat anti-rabbit or goat anti-mouse immunoglobulin for 30 minat room temperature, incubated with diaminobezidine (DAB)chromogen for 5 min, counterstained with hematoxylin andmounted with coverslip. Between each of these steps, the sectionswere rinsed gently with Tris-HCl buffer. Normal human tonsiland mammary tissues were used as positive controls for CD34and c-kit, respectively. Negative control was performed at thesame conditions by omitting incubation with the first antibody.The stained tissue sections were examined under light microscope.
RESULTSCD34 and c-kit were positive in the staining of capillary endothelialcells in tonsil and ductal cells in normal mammary tissues,respectively. Negative controls were all negative. Among thespecimens of 32 cases of cholangiocarcinoma, CD34 was stronglypositive in the staining of all capillary endothelial cells and negativein tumor cells (Figure 1). However, c-kit was positive in the stainingof tumor cells in 1 case of cholangiocarcinoma originating fromcommon bile duct (case 32, Table 1). This was an 80 years oldpatient with moderately differentiated cholangiocarcinoma, andabout 5% of the tumor cells were positively stained at cell

membrane and cytoplasm (Figure 2). The positive result wasrepeatedly identified in several sections from the same specimen.
Table 1 Clinical characteristic of the patients withcholangiocarcinoma
No. Sex Age (yr) Location of Differentiation adenocarcinoma
1 F 78 CBD moderately 2 F 68 CBD moderately 3 M 63 CBD moderately 4 M 67 IHBC moderately 5 M 58 IHBC well 6 M 49 CBD poorly 7 M 80 IHBC well 8 M 75 CBD poorly 9 M 77 IHBC well10 F 74 CBD well11 M 50 CHBD well12 F 68 CBD well13 M 62 IHBC well14 F 69 IHBC well15 F 67 IHBC well16 M 52 IHBC moderately17 M 59 IHBC moderately18 F 74 CBD poorly19 M 64 CHBD well20 F 62 IHBC moderately21 F 68 IHBC poorly22 M 61 CHBD poorly23 F 46 CBD moderately24 F 73 CBD moderately25 F 62 IHBC well26 M 59 CHBD well27 M 64 CBD poorly28 M 76 IHBC moderately29 M 24 IHBC well30 M 56 IHBC moderately31 F 60 CBD moderately32 F 80 CBD moderately
F: Female; M: Male; CBD: Common bile duct; CHBD: Com-mon hepatic bile duct; IHBC: Intrahepatic bile duct.
Liver stem-like cells are small and oval in shape with relativelylarge oval nuclei. They are immunoreactive for OV-6 (rat ovalcell marker), cytokeratin (CK) 8 and CK 18 (both are epithelialcell markers), CK 7 and CK 19 (both are biliary cell markers), CK 14,and chromogranin-A[15,19]. Liver stem-like cells are heterogeneous,and could be classified into 3 types based on their differentiationcharacteristics. Type I represents the most undifferentiatedcells, type II the progenitor cells differentiating towards biliarylineage, and type III the progenitor cells differentiating towardshepatic lineage[19]. In human liver, these liver stem-like cells havebeen found in focal nodular hyperplasia, hepatic adenoma,hepatocellular carcinoma and hepatoblastoma[13-16]. CD34 and c-kit are two markers of hemapoietic stem cells.However, recently in normal human liver, c-kit was detected incanal of Hering where the putative liver stem cells may exist[3].In patients with fulminant hepatic failure, over expression of c-kit was detected in activated liver stem-like cells[20]. CD34 wasalso identified in rat liver stem-like cells[21]. Using immunomagneticseparation method, CD34 and c-kit positive cells were isolatedfrom human liver. These cells were able to proliferate anddifferentiate into both biliary epithelial and endothelial cellsin vitro[18]. This suggested that CD34 and c-kit positive cells in
liver might represent biliary progenitor cells, biliary and endothelialcells might share the same progenitor cells. Among the 12 casesof hepatoblastoma, Ruck et al. reported that CD34 was foundto be immunoreactive with both tumor cells and endothelialcells in 1 case of small cell hepatoblastoma, and this indicatedthe possible stem cell origin of hepatoblastoma[22]. In this study, a few tumor cells in 1 of 32 cases of cholangio-carcinoma were immunoreactive with c-kit, and this suggestedtheir possible origin of biliary stem cells.
Figure 1 A: Immunohistochemical staining of cholangiocarcinomawith antibody against CD34. Arrowhead indicates stronglypositive capillary endothelial cells. B: Immunohistochemicalstaining of cholangiocarcinoma with antibody against c-kit(Envision, original magnification: ×400). Arrowhead indicatespositive tumor cells.
As putative liver stem cells possibly exist in terminal bileductules (canal of Hering), intrahepatic cholangiocarcinoma issupposed to originate from liver stem cells more likely thanextrahepatic cholangiocarcinoma. However, the cells with stemcell characteristics may not only exist in intrahepatic bile ducts,but also in extrahepatic bile ducts. In embryonic developmentof rat liver, both intra- and extrahepatic bile ducts originated fromAFP- and albumin-containing hepatoblasts[23]. The remnant ofembryo liver stem cells may also exist in extrahepatic bile ducts.In human, it was observed that hepatocellular carcinoma couldalso develop from extrahepatic bile ducts[24-26]. These tumorsmight originate from liver stem cells in extrahepatic bile ductsby maturation arrest. Thus, extrahepatic cholangiocarcinomathat was immunoreactive with c-kit in this experiment mightalso originate from putative liver stem cells. Based on animal experiments, different carcinogenic regimentsmight act on different level of cells in hepatic lineage and producehepatic carcinoma by different mechanisms[27]. Diethylnitrosamineacted on mature hepatocytes and induced hepatocellularcarcinoma by de-differentiation. Furan injured bile ductprogenitor cells and induced cholangiocarcinoma by maturationarrest. 2-acetylaminofluorene acted on ductular bipolar progenitorcells and induced hepatocellular carcinoma by maturation arrest.In choline deficiency models, the periductular stem cells couldbe activated to induce hepatocellular carcinoma by maturationarrest. The exact causes of human cholangiocarcinoma are stillunclear, and there may be more than one mechanism of itscarcinogenesis. In this study, only a few tumor cells in 1 case ofcholangiocarcinoma were c-kit immunoreactive, and we could
A
B
Liu C et al. Stem cell origin of cholangiocarcinoma 3375

not draw a sound conclusion. Tumor cells may lose their markersof stem cells during maturation arrest. Thus, further researches,such as increasing the number of cases and discovering newbiliary progenitor cell markers, are needed to answer if humancholangiocarcinoma originates from stem cells.
ACKNOWLEDGEMENTSThe authors thank Professor Andrea Frilling at Department ofGeneral Surgery and Transplantation, University HospitalEssen, Germany, for the revision of the manuscript.
REFERENCES1 Sell S. Cellular origin of cancer: dedifferentiation or stem cell matu-
ration arrest? Environ Health Perspect 1993; 101(Suppl 5): 15-262 Sell S. Is there a liver stem cell? Cancer Res 1990; 50: 3811-38153 Theise ND, Saxena R, Portmann BC, Thung SN, Yee H,
Chiriboga L, Kumar A, Crawfold JM. The canals of hering andhepatic stem cells in humans. Hepatology 1999; 30: 1425-1433
4 Zhang Y, Bai XF, Huang CX. Hepatic stem cells: existence andorigin. World J Gastroenterol 2003; 9: 201-204
5 Thorgeirsson SS. Hepatic stem cells. Am J Pathol 1993; 142:1331-1333
6 Sigal SH, Brill S, Fiorino AS, Reid LM. The liver as a stem celland lineage system. Am J Physiol 1992; 263(2 Pt 1): G139-G148
7 Alison M, Sarraf C. Hepatic stem cells. J Hepatol 1998; 29:676-682
8 Haque S, Haruna Y, Saito K, Nalesnik MA, Atillasoy E, ThungSN, Gerber MA. Identification of bipotential progenitor cells inhuman liver regeneration. Lab Invest 1996; 75: 699-705
9 Lowes KN, Brennan BA, Yeoh GC, Olynyk JK. Oval cell num-bers in human chronic liver diseases are directly related todisease severity. Am J Pathol 1999; 154: 537-541
10 Crosby HA, Hubscher S, Fabris L, Joplin R, Sell S, Kelly D,Strain AJ. Immunolocalization of putative human liver pro-genitor cells in livers from patients with end-stage primarybiliary cirrhosis and sclerosing cholangitis using the monoclonalantibody OV-6. Am J Pathol 1998; 152: 771-779
11 Hsia CC, Evarts RP, Nakatsukasa H, Marsden ER, ThorgeirssonSS. Occurrence of oval-type cells in hepatitis B virus-associatedhuman hepatocarcinogenesis. Hepatology 1992; 16: 1327-1333
12 Ma X, Qiu DK, Peng YS. Immunohistochemical study of he-patic oval cells in human chronic viral hepatitis. World JGastroenterol 2001; 7: 238-242
13 Roskams T, De Vos R, Desmet V. ‘Undifferentiated progenitorcells’ in focal nodular hyperplasia of the liver. Histopathology
1996; 28: 291-29914 Libbrecht L, De Vos R, Cassiman D, Desmet V, Aerts R,
Roskams T. Hepatic progenitor cells in hepatocellularadenomas. Am J Surg Pathol 2001; 25: 1388-1396
15 Wu PC, Lai VC, Fang JW, Gerber MA, Lai CL, Lau JY. Hepato-cellular carcinoma expressing both hepatocellular and biliarymarkers also expresses cytokeratin 14, a marker of bipotentialprogenitor cells. J Hepatol 1999; 31: 965-966
16 Ruck P, Xiao JC, Pietsch T, Von Schweinitz D, Kaiserling E.Hepatic stem-like cells in hepatoblastoma: expression ofcytokeratin 7, albumin and oval cell associated antigens de-tected by OV-1 and OV-6. Histopathology 1997; 31: 324-329
17 Lee JH, Rim HJ, Sell S. Heterogeneity of the “oval-cell” re-sponse in the hamster liver during cholangiocarcinogenesis fol-lowing clonorchis sinensis infection and dimethylnitrosaminetreatment. J Hepatol 1997; 26: 1313-1323
18 Crosby HA, Kelly DA, Strain AJ. Human hepatic stem-likecells isolated using c-kit or CD34 can differentiate into biliaryepithelium. Gastroenterology 2001; 120: 534-544
19 Roskams T, De Vos R, Van Eyken P, Myazaki H, Van DammeB, Desmet V. Hepatic OV-6 expression in human liver diseaseand rat experiments: evidence for hepatic progenitor cells inman. J Hepatol 1998; 29: 455-463
20 Baumann U, Crosby HA, Ramani P, Kelly DA, Strain AJ.Expression of the stem cell factor receptor c-kit in normal anddiseased pediatric liver: identification of a human hepatic pro-genitor cell? Hepatology 1999; 30: 112-117
21 Omori N, Omori M, Evarts RP, Teramoto T, Miller MJ, HoangTN, Thorgeirsson SS. Partial cloning of rat CD34 cDNA andexpression during stem cell- dependent liver regeneration in theadult rat. Hepatology 1997; 26: 720-727
22 Ruck P, Xiao JC, Kaiserling E. Immunoreactivity of sinusoidsin hepatoblastoma: an immunohistochemical study using lec-tin UEA-1 and antibodies against endothelium-associatedantigens, including CD34. Histopathology 1995; 26: 451-455
23 Shiojiri N, Lemire JM, Fausto N. Cell lineages and oval cell pro-genitors in rat liver development. Cancer Res 1991; 51: 2611-2620
24 Thomsen GH, Kruse A, Petersen A. Hepatocellular carcinomapresenting as a tumour of the hilar and extrahepatic bile ducts.Eur J Gastroenterol Hepatol 1998; 10: 803-804
25 Cho HG, Chung JP, Lee KS, Chon CY, Kang JK, Park IS, KimKW, Chi HS, Kim H. Extrahepatic bile duct hepatocellularcarcinoma without primary hepatic parenchymal lesions-a casereport. Korean J Intern Med 1996; 11: 169-174
26 Park CM, Cha IH, Chung KB, Suh WH, Lee CH, Choi SY, ChaeYS. Hepatocellular carcinoma in extrahepatic bile ducts. ActaRadiol 1991; 32: 34-36
27 Sell S. Cellular origin of hepatocellular carcinomas. Semin CellDev Biol 2002; 13: 419-424
Edited by Wang XL and Chen WW Proofread by Xu FM
3376 ISSN 1007-9327 CN 14-1219/ R World J Gastroenterol November 15, 2004 Volume 10 Number 22

PO Box 2345, Beijing 100023, China World J Gastroenterol 2004;10(22):3377-3379Fax: +86-10-85381893 World Journal of GastroenterologyE-mail: [email protected] www.wjgnet.com Copyright © 2004 by The WJG Press ISSN 1007-9327
• BRIEF REPORTS •
Epidemiology of peptic ulcer disease in Wuhan area of China from
1997 to 2002
Wei-Guo Dong, Chun-Sheng Cheng, Shao-Ping Liu, Jie-Ping Yu
Wei-Guo Dong, Chun-Sheng Cheng, Jie-Ping Yu, Department ofGastroenterology, Renmin Hospital of Wuhan University, Wuhan430060, Hubei Province, ChinaShao-Ping Liu, Department of Gastroenterology, Huangshi CentralHospital, Huangshi 435000, Hubei Province, ChinaCo-first-authors: Wei-Guo Dong and Chun-Sheng ChengCorrespondence to: Professor Wei-Guo Dong, Renmin Hospital ofWuhan University, 238 Jiefang Road, Wuhan 430060, Hubei Province,China. [email protected]: +86-27-88041919 Ext. 6448Received: 2004-01-15 Accepted: 2004-03-12
Abstract
AIM: To describe the epidemiological features of pepticulcer disease in Wuhan area during 1997-2002, to analyzethe sex, age and occupation characteristics, as well as thegeographic distribution of peptic ulcer disease, and todetermine the effective methods of preventing and controllingpeptic ulcer disease.
METHODS: In the early 1980s, the peptic ulcer diseaseregistry system was established to collect the data of pepticulcer disease in Wuhan area. Here we performed a statisticallydetailed analysis of 4876 cases of peptic ulcer diseaseduring 1997-2002.
RESULTS: The morbidity of peptic ulcer disease betweenmales and females was significantly different (χ2 = 337.9,P<0.001). The majority of peptic ulcer diseases were foundat the age of 20 to 50 years. Because of different occupations,the incidence of peptic ulcer disease was different in differentareas.
CONCLUSION: The incidence of peptic ulcer disease ishighly associated with sex, age, occupation and geographicenvironmental factors. By analyzing the epidemiologicalfeatures of peptic ulcer disease, we can provide the scientificdata for prevention and control of peptic ulcer disease.
Dong WG, Cheng CS, Liu SP, Yu JP. Epidemiology of pepticulcer disease in Wuhan area of China from 1997 to 2002.World J Gastroenterol 2004; 10(22): 3377-3379
http://www.wjgnet.com/1007-9327/10/3377.asp
INTRODUCTIONDuring 1997 to 2002, 21693 patients had a gastroscopy inOutpatient Department of the Renmin Hospital in WuhanUniversity, of them, 4876 were diagnosed as peptic ulcer disease.Factors that increased the risk of serious peptic ulcer diseaseincluded older age, history of peptic ulcer disease, gastrointestinalhemorrhage, dyspepsia and previous non-steroidal anti-inflammatory drug-associated (NSAID) intolerance, as well aspoor living conditions[1]. Furthermore, the epidemiologicalfactors were important reasons leading to peptic ulcer disease.To explore the epidemiological features of peptic ulcer disease in
Wuhan area, we performed a statistical analysis of the data aboutsex, age, occupation and geographic environmental distribution.
MATERIALS AND METHODSA total of 21 693 patients with gastrointestinal symptomsreceived a gastroscopy in Outpatient Department of the RenminHospital of Wuhan University, of them, 4 876 were diagnosedas peptic ulcer disease. The patients were classified accordingto gastric ulcer (GU), duodenal ulcer (DU), complex ulcer (CU),sex, age, occupation and geographic environment and a databasewas set up. All the data were checked and analyzed using theSPSS statistical software.
RESULTS AND DISCUSSIONPeptic ulcer disease mainly refers to the chronic ulcer whichoccurs in stomach and duodenum, because the formation ofulcer is linked to the digestive function of gastric acid-pepsin[2].Peptic ulcer disease is a worldwide common disease, but theincidence of peptic ulcer disease in different countries andregions is obviously different. The incidence of peptic ulcerdisease has not been exactly investigated in China. Therefore,we performed a statistically detailed analysis of the data inWuhan area from 1997 to 2002. There were 4 876 cases of peptic ulcer disease out of 21 693patients, and the incidence was 22.5%. Among the 4 876 casesdiagnosed as peptic ulcer disease by gastroscope, 3 899 males(79.9%) and 977 females (20.1%) had peptic ulcer disease. Thesex ratio (males to females) was 3.95:1. Among the patientswith peptic ulcer disease, 3 397 had duodenal ulcer disease,1066 had gastric ulcer disease and 413 had complex ulcer disease.Duodenal ulcer diseases accounted for 69.6%, gastric ulcerdiseases accounted for 21.9% and complex ulcer diseasesaccounted for 8.5%. The ratio of the three was 8.2:2.6:1. Thedata of the sex, age, occupation characteristics and geographicdistribution of peptic ulcer disease are shown in Tables 1-4.
Table 1 Sex ratio of six different age groups in 4 876 cases ofpeptic ulcer disease
Age (yr) Duodenal Gastric Complex Pepticgroup ulcer ulcer ulcer ulcer
10- 3.66 5.00 10.00 3.96 20- 5.13 4.03 6.13 4.93 30- 4.12 4.63 7.53 4.39 40- 2.65 5.82 3.04 3.26 50- 2.53 5.56 2.86 3.37 60- 3.43 5.70 6.75 4.39 Mean 3.59 5.12 6.05 4.05
Sex differenceThe incidence of peptic ulcer disease in males was always higherthan that in females in different age groups. From Table 1, wecould see that the sex ratio in duodenal ulcer disease was2.53-5.13:1, the maximum ratio was 5.13, and the average ratiowas 3.59. The sex ratio in gastric ulcer disease was 4.03-5.82:1,the maximum ratio was 2.53, and the average ratio was 5.12. Thecases of complex ulcer disease were so few that they had no

statistic significance. After analyzing the trend of the mortalityof peptic ulcer disease from 1952 to 1980 in Western Germany,we found that the general trend of mortality of males wasdescending but there was a fluctuating ascending, and thegeneral trend of mortality of females was steadily ascending[3].Since the early 1960s in America, the incidence of the pepticulcer disease in males has slightly decreased, but that of femaleshas shown the increasing trend, and the difference of sex hasgradually lessened[4]. Mortality from non- perforated ulcerdecreased markedly, while that from perforated ulcer decreasedslightly, similar trends were observed in men and women[5]. Wecarried out a statistical analysis of the data according to thedifferent age groups (χ2 = 337.9, P<0.001). From Table 2 andFigure 1, we could see that the incidence of peptic ulcer diseasebetween males and females was significantly different.
Table 2 Comparison of sex among six different age groups in4 876 cases of peptic ulcer disease
Age(yr) groupGender
10- 20- 30- 40- 50- 60-
Male 190 858 1 340 880 576 282Female 48 174 305 270 171 65
χ2 = 337.9, P<0.001.
Table 3 Age distribution in 4 876 cases of peptic ulcer disease
Duodenal ulcer Gastric ulcer Complex ulcerAge (yr)group Male Female Male Female Male Female
10- 150 41 30 6 10 1 20- 656 128 153 38 49 8 30- 932 226 295 64 113 15 40- 519 196 285 49 76 25 50- 263 104 250 45 63 22 60- 141 41 114 20 27 4 Total 2 661 736 1 127 222 338 75
Table 4 Occupation distribution in six different age groups in1 068 cases of peptic ulcer
Age (yr) Worker Farmer Cadre Studentgroup
DU GU CU DU GU CU DU GU CU DU GU CU
10- 2 1 0 0 1 0 2 0 0 24 6 620- 86 18 6 36 12 4 6 2 0 10 0 030- 168 22 8 96 44 8 32 20 240- 26 6 6 66 38 14 34 14 450- 28 10 2 32 26 8 16 16 260- 18 8 2 14 28 2 12 12 2Total 328 65 24 244 149 36 102 64 10 34 6 6
Age distributionPeople who suffered from peptic ulcer disease could be foundout at whatsoever ages, but the majority of patients with pepticulcer disease were adults. Our data indicated that the youngestpatient was 9 years old, the oldest was 73 years old, 78.7% ofthe patients were between 20 and 50 years old, the peak age ofincidence was between 30 and 40 years old in duodenal ulcerdisease patients. In gastric ulcer disease patients, the youngestwas 11 years old, and the oldest was 75 years old, 82.9% of thepatients were between 20 and 50 years old, 92.2% of the patientswere between 30 and 60 years old, and the peak age of incidencewas between 30 and 40 years old. People with gastric ulcerdisease were older than those suffering from duodenal ulcer
disease. The incidence of peptic ulcer disease in patientsbetween 40 and 60 years old was obviously higher than that inpatients between 10 and 30 years old. The actual number ofpeptic ulcers in the elderly decreased, however the percentageof elderly with peptic ulcer against total population increased[6].The age distribution of complicated ulcer disease was basicallysimilar to that of gastric ulcer disease. The incidence of pepticulcer disease was 22.5% in Wuhan area, the ratio of duodenalulcer to gastric ulcer was 3.2:1, and the ratio of different agegroups was 1.24-5.1:1. From Figure 2, we could see that theincidences of duodenal ulcer disease and gastric ulcer diseasewere not significantly different after 50 years old. Huang et al.[7]
found that peptic ulcer disease in children over 6 years old wasmainly primary ulcer, the majority of them were duodenal ulcer,and the clinical symptoms of the peptic ulcer were similar tothose in the adults. It was reported that 72-80% of peptic ulcerdisease in Hunan and Guangdong provinces in China occurredin patients between 20 and 50 years old, which was similar tothe results of the reports from India[8]. The location of duodenalulcer disease was on anterior wall and greater curvature ofbulb, but in gastric ulcer disease was on gastric angle and antrum,and the peak age of incidence was 21 to 50 years[9]. The resultsof our investigations were basically similar to them.
Figure 1 Age and sex distribution of peptic ulcer disease inWuhan area, China.
Figure 2 Age distribution of 4 876 cases of peptic ulcer diseasein Wuhan area.
Social occupation factorsThe sex difference and age distribution of peptic ulcer diseasein different occupations were basically the same. The data ofour study were divided into four parts, each from the workers,farmers, students and cadres, respectively, From Table 4, weknow that the incidence of peptic ulcer disease among farmerswas the highest, moderate in workers and the lowest in students.The incidence of duodenal ulcer disease was also very highamong these special occupations such as drivers, firefightersand so on, which was similar to the report of Sonnenbeg et al.,who found the incidence of duodenal ulcer disease was veryhigh among the firefighters, pilots and shift workers[10,11]. The
1 600
1 400
1 200
1 000
800
600
400
200
010- 20- 30- 40- 50- 60-
Cases
Age group (yr)
Incidence in males
Incidence in females
1 400
1 200
1 000
800
600
400
200
010- 20- 30- 40- 50- 60-
Cases
Age group (yr)
Duodenal ulcer
Gastric ulcer
3378 ISSN 1007-9327 CN 14-1219/ R World J Gastroenterol November 15, 2004 Volume 10 Number 22

Dong WG et al. Epidemiology of peptic ulcer disease in Wuhan 3379
study results from Western Germany indicated that theconsumption of body’s energy was a dangerous factor for thedevelopment of peptic ulcer disease[11]. This may be related tosocial factors such as busy working, heavy mental stress andso on. It was reported that the occurrence, recurrence of pepticulcer disease were closely associated with psychologicalcontradiction, emotional-hindering and defective character.Depress, anxiety, fear, emotional irritability and cognitivedisorganization were significantly increased in the integratedstress management program (ISMP) group in comparison withthe progressive muscle relaxation (PMR) group, and theincidence of peptic ulcer disease was higher in the ISMP groupthan in the PMR group[12]. In addition, irregular meal, over-eating, and fast-eating might cause injures to the digestivetract mucosa, leading to the occurrence of peptic ulcer disease[13].Peptic ulcer disease was more common in the working agegroups. To any kind of occupation, age between 20 and 50 yearswas a period in which people were widely connected withsociety and participation in assorted social activities morefrequently than ever. Heavy social psychological stress,frequent mobility and irregular working were extremely importantfactors in the formation of peptic ulcer disease. The increasingincidence of peptic ulcer disease in females was related to moreand more social activities that females participated in gradually[14].
Geographic and environment factorsEnvironmental factors played a role in peptic ulcer disease[15].The positive detectable rate of peptic ulcer disease in Hannationality was higher than that in Korea nationality at Yanbianarea[16]. Thors et al.[17] demonstrated that peptic ulcer mortalityand disease risk were particularly high in subjects born afterthe turn of the century and subsequent generations. Since1945, a very rapid economic development has been achievedwith the advent of electricity and refrigeration, clean water andfood; The condition in Iceland changed from being anti-hygienic and poor to being rich and clean, the morbidity ofpeptic ulcer disease has decreased. The rise and fall in pepticulcer during the 20th century might be caused by factors earlyin life in the generations born during these years with crowdingand poor hygiene before living conditions and socio-economicstatus were improved. The incidence of peptic ulcer disease asreported was between 16% and 33% from different regions inChina. The results from Hunan and Gansu Provinces indicatedthat the ratio of duodenal ulcer disease to peptic ulcer diseasewas 2.7-6.2:1 in the inpatient department during the same period.The peptic ulcer disease is very prevailing in all over China, butthere is an increasing trend from the north to the south inregion distribution. Furthermore, the morbidity of peptic ulcerdisease is also different in different countries, and duodenalulcer disease turns up more frequently than gastric ulcer diseasein the majority of Western countries. The study report in Japanindicated that the incidence of gastric ulcer disease was higherthan that of duodenal ulcer disease. The incidence of duodenalulcer disease and gastric ulcer disease was almost equal to thatin Norwegian. In respect to ethnicity, Bengali speaking Hindusshowed high probability for gastric ulcers in both sexes[18].The detecting rates of peptic ulcer disease in Han and Huinationalities were 13.42% and 10.66% respectively. Amongpeptic ulcer diseases 44.4% were duodenal ulcer disease, and50.63% were gastric ulcer disease, the ratio being 0.88:1. Thedetecting rate of peptic ulcer in Han nationality was higherthan that in Hui nationality, and gastric ulcer disease occurred
more often than duodenal ulcer disease in china. The regionaldifference in the type and level of peptic ulcer disease revealedthat geographic and environmental factors probably playedan important role in the development of peptic ulcer disease.Additionally, the incidence of peptic ulcer disease in thetransition period between autumn and winter or betweenwinter and spring was higher than that in other periods. Thechange of climate factors was also associated with occurrenceof peptic ulcer disease; with the change of temperature andatmosphere, patients with peptic ulcer disease would appeargastroperiodynia. In conclusion, the occurrence of peptic ulcer disease ishighly associated with sex, age, occupation, geographic andenvironmental factors. By analyzing the epidemiologicalcharacteristics of peptic ulcer disease, we can provide thescientific data for prevention and control of peptic ulcer disease.
REFERENCES1 Griffin MR. Epidemiology of Nonsteroidal Anti-inflamma-
tory Drug-Associated Gastrointestinal Injury. Am J Med 1998;104: 23S-29S
2 Xiao SD. Peptic ulcer disease In: Ye RG eds. MEDICINE fifthedition. Beijing: People Health Publishing House 2002: 398
3 Sonnenberg A, Fritsch A. Changing mortality of peptic ulcerdisease in Germany. Gastroenterology 1983; 84: 1553-1557
4 Wang YH, Wang HZ. Epidemiology In: Wang HZ, Cao SZ,eds. Xiandai Xiaohuaxing Kuiyangbingxue 1st ed. Beijing: People’sMilitary Medical Pub 1999: 64-65
5 Thors H, Svanes C, Thjodleifsson B. Trends in peptic ulcermorbidity and mortality in Iceland. J Clin Epidemiol 2002; 55:681-686
6 Kawano S, Fu HY. Epidemiology of peptic ulcer disease in theaged in Japan. Nippon Rinsho 2002; 60: 1490-1498
7 Huang QY, Cao SZ, Wang HZ. Peptic ulcer disease in childrenIn: Wang HZ, Cao SZ, eds. Xiandai Xiaohuaxing Kuiyangbingxue1st ed. Beijing: People’s Military Medical Pub 1999: 182-183
8 Khuroo MS, Mahajan R, Zargar SA, Javid G, Munshi S. Preva-lence of peptic ulcer in India: an endoscopic and epidemiologi-cal study in urban Kashmir. Gut 1989; 30: 930-934
9 Huang BX, Wang GZ. Clinical study of 2473 cases with pepticulcer. Zhonghua Xiaohua Neijing Zazhi 2001; 18: 27-29
10 Segawa K, Nakazawa S, Tsukamoto Y, Kurita Y, Goto H,Fukui A, Takano K. Peptic ulcer is prevalent among shiftworkers. Dig Dis Sci 1987; 32: 449-453
11 Sonnenberg A, Sonnenberg GS, Wirths W. Historic changes ofoccupational work load and mortality from peptic ulcer inGermany. J Occup Med 1987; 29: 756-761
12 Han KS. The effect of an integrated stress management pro-gram on the psychologic and physiologic stress reactions ofpeptic ulcer in Korea. Int J Nurs Stud 2002; 39: 539-548
13 Cai L, Zheng ZL, Zhang ZF. Risk factors for the gastric cardiacancer: a case-control study in Fujian Province. World JGastroenterol 2003; 9: 214-218
14 Chen SP. Peptic ulcer disease In: Pan GZ, Cao SZ, eds. XiandaiWeichangbingxue Beijing: Sic Pub 1998: 899-900
15 Chan FKL, Leung WK. Peptic-ulcer disease. Lancet 2002; 360:933-941
16 Pu FS, Cai HF, Jin HY, Gen M, Liang H. Gastroscopic analysisof 4348 cases of peptic ulcer disease in Yanbian area. ZhonghuaXiaohua Neijing Zazhi 2001; 18: 25-26
17 Thors H, Svanes C, Thjodleifsson B. Trends in peptic ulcermorbidity and mortality in Iceland. J Clin Epidemiol 2002; 55:681-686
18 Hazra B, Hazra J. Epidemiology of peptic ulcer in north Bengal,India. Indian J Public health 1998; 42: 100-102
Edited by Wang XL and Zhang JZ Proofread by Xu FM

PO Box 2345, Beijing 100023, China World J Gastroenterol 2004;10(22):3380-3381Fax: +86-10-85381893 World Journal of GastroenterologyE-mail: [email protected] www.wjgnet.com Copyright © 2004 by The WJG Press ISSN 1007-9327
• BRIEF REPORTS •
Effect of 2-(3-carboxy-1-oxopropyl) amino-2-deoxy-D-glucose on
human esophageal cancer cell line
Jing Wu, Hong Lu, Yun Zhou, Liang Qiao, Rui Ji, Ai-Qing Wang, Wei-Min Liu, Qun-Ji Xue
Jing Wu, Ai-Qing Wang, Wei-Min Liu, Qun-Ji Xue, LanzhouInstitute of Chemical Physics, Chinese Academy of Sciences, Lanzhou730000, Gansu Province, ChinaJing Wu, Hong Lu, Yun Zhou, Rui Ji, Department of Gastroenterologyand Hepatology, First Teaching Hospital of Lanzhou Medical College,Lanzhou 730000, Gansu Province, ChinaLiang Qiao, Storr Liver Unit, Westmead Millennium Institute,Department of Gastroenterology and Hepatology, Westmead Hospital,University of Sydney Westmead, NSW 2145, AustraliaCorrespondence to: Dr. Jing Wu, Department of Gastroenterologyand Hepatology, First Teaching Hospital of Lanzhou Medical College,Lanzhou 730000, Gansu Province, China. [email protected]: +86-931-8619605Received: 2004-04-22 Accepted: 2004-04-29
Abstract
AIM: To determine whether 2-(3-carboxy-1-oxopropy1)amino-2-deoxy-D-glucose (COPADG), a derivative of D-amino-glucose, inhibited the growth of human esophagealcancer cell line Eca-109.
METHODS: Effects of COPADG on Eca-109 cells culturedin RPMI 1640 medium were examined by a tetrazolium-based colorimetric assay (MTT assay).
RESULTS: COPADG inhibited the growth of Eca-109 cellsin a dose- and time-dependent manner; the maximuminhibition rate was 83.75%.
CONCLUSION: COPADG can directly inhibit the proliferationof Eca-109 cells, which may serve as the experimentalevidence for development of new drugs for esophagealcancer therapy.
Wu J, Lu H, Zhou Y, Qiao L, Ji R, Wang AQ, Liu WM, Xue QJ.Effect of 2-(3-carboxy-1-oxopropyl) amino-2-deoxy-D-glucoseon human esophageal cancer cell line. World J Gastroenterol
2004; 10(22): 3380-3381
http://www.wjgnet.com/1007-9327/10/3380.asp
INTRODUCTION2-(3-carboxy-1-oxopropy1) amino-2-deoxy-D-glucose (COPADG,structure is shown in Figure 1) is a derivative of D-glucose, amonose derivative of degraded chitosan. Previous researches havediscovered that some amino-D-glucose derivatives are capable ofinducing leukemia K562 cells to differentiate into macrophages[1],but their efficacy in inducing apoptosis of tumor cells remainsunclear. We conducted this study to determine whetherCOPADG could inhibit the proliferation of human esophagealcancer cell line Eca-109, to provide experimental evidence fornew drug development for esophageal cancer therapy.
MATERIALS AND METHODSMaterialsCOPADG, synthesized by the Lanzhou Institute of Chemical
Physics of Chinese Academy of Sciences, was dissolved indistilled water, filter-sterilized with 0.22 µm filter disc, and storedat 4 until use. Eca-109 cells were purchased from ShanghaiInstitute of Cell Biology of Chinese Academy of Sciences. RPMI1640 medium, agarose, trypsin and fetal bovine serum (FBS)were obtained from Gibco BRL Company, and the reagents forMTT assay were purchased from Sigma Chemical Co. Ltd.
Cell cultureEca-109 cells growing in logarithmic phase were cultured in RPMI1640 medium supplemented with 100 mL/L heat-inactivated FBS,100 µg/mL penicillin and 100 µg/mL streptomycin. The cellswere maintained in a humidified atmosphere containing 50 mL/LCO2 at 37 . The medium was replaced every 48 h.
MTT colorimetric assayMTT assay[2] was based on the enzymatic reduction of thetetrazolium salt MTT in viable and metabolically active cells.Cells at 85% to 100% confluency were harvested with themixture of 2.5 g/L trypsin and 0.2 g/L EDTA solution and seededinto a 96-well plate at a density of 4×10³ /well, followed byincubation of the cells with COPADG at varied concentrations(0.01-0.09 mol/L) for different lengths of time (24-96 h, Table 1).The control cells were treated in the same way except thatincubation was performed with sterile PBS instead of COPADG.After treatment, the medium was replaced by fresh medium andthe cells were incubated for 4 h with 5 mg/mL MTT, which wasdissolved in 150 µL of 100 g/L DMSO and kept for 1 h. Theoptical densities at 490 nm (A490nm) in the 96-well plates weredetermined using a microplate reader. Cell growth inhibitionwas estimated with the following formula: Growth inhibition(%) =1-A490nm (treated cells)/A490nm (control cells) ×100%.
Statistical analysisResults were expressed as mean±SD. Each experiment wasrepeated at least three times. Statistical differences betweeneach group were determined by single-factor analysis ofvariance and correlation analysis using SPSS 11.0 statisticalsoftware.
Figure 1 Chemical structure of 2-(3-carboxy-1-oxoprogy1)amino-2-deoxy-D-glucose.
RESULTSCOPADG could effectively inhibit the growth of Eca-109 cells,the maximum inhibition rate was 83.75%. The inhibition exhibited
HOH
H
O
OHHO
HO
H O
HNH
COOH

an obvious time-and dose-dependent manner when theCOPADG concentrations were below 0.05 mol/L, and higherconcentrations tended to induce gradually stabilized inhibition,suggesting a saturation of the effects of COPADG (Table 1,Figure 2).
Figure 2 Inhibition of Eca-109 cell growth by COPADG.
DISCUSSIONCOPADG is a derivative of D-glucose, which is a low-molecular-weight compound with multiple biological activities and amonosaccharide derived from chitosan through release of anacetyl group followed by degradation of the residual group.D-glucose is the intermediate during the synthesis of protein-polysaccharide macromolecules, and distributed in almost everyhuman tissue as a part of the structural components of cellmembrane and tissues. From the biological standpoint, D-glucosenot only is involved in hepatic and renal detoxification againsttoxic agents, but also acts to stimulate the anti-inflammatoryresponse and enhance the synthesis of protein-polysaccharides.Studies[3,4] have also shown that D-glucose could inhibit tumorcell growth, and partial derivatives of D-glucose could potentlyinduce differentiation of tumor cells. Some D-amine-glucosederivatives were able to induce leukemia K562 cells todifferentiate into macrophages[5], but this effect failed to beobserved in human hepatocellular carcinoma cell line[1].Currently, COPADG has become a new focus of interest incancer therapy. By conducting this study, we aimed to test whether COPADG,the newest derivative of D-glucose, had any effect on theproliferation of human esophageal cancer cells. MTT assayshowed that COPADG could effectively inhibit Eca-109 cell
Table 1 Inhibitory effect of COPADG on the proliferation of esophageal cancer cell line Eca-109 (mean±SD)
Concentra-tion A490nm Inhibitory rate (%) (mol/L)
24 h 48 h 72 h 24 h 48 h 72 h
0 (Control) 1.505±0.090 1.686±0.067 1.745±0.077 12.76 20.81 31.290.01 1.313±0.053b 1.336±0.057b 1.199±0.083b 12.76 20.81 31.290.03 0.958±0.028 0.966±0.086 0.900±0.056 36.35 42.68 48.420.05 0.400±0.064b,c 0.429±0.065b,a 0.384±0.050b,c 73.42 74.57 77.990.07 0.383±0.045 0.360±0.039 0.342±0.037 74.55 78.66 80.440.09 0.355±0.046c 0.362±0.053 c 0.280±0.039a 76.41 78.54 83.75
At the same time point, P<0.01 vs the control group; bP<0.01 vs 0.03 mol/L; aP<0.05, cP>0.05 vs 0.07 mol/L.
proliferation, in a marked time- and dose-dependent mannerbelow the concentration of 0.05 mol/L; the maximum inhibitionrate was 83.75%. The inhibition, however, became stable whenthe concentrations were higher than 0.05 mol/L, indicating thatthe effects of the drug might be saturated at this concentration. The development of cancer has been considered to be thecombined results of unrestricted cell proliferation and impairmentof normal cell apoptosis[6]. These concepts provide a basisfor the development of new strategies for cancer treatment.Agents with antiproliferative properties and proapoptotic effectshave been widely investigated as potential chemotherapeuticoptions[7,8]. Conclusion, COPADG has obvious time- and concentration-dependent inhibitory effects against the proliferation of humanesophageal cancer cell line Eca-109 in vitro, but whether thiseffect can be achieved in other cell lines still awaits furtherexamination, which may also be necessary to clarify themechanism underlying this effect.
REFERENCES1 Wang Z, Qiao Y, Huang GS, Wang AQ, Zhang YQ, Feng JL,
Yang GR, Guo Y, Liang R. Glucosamine and glucosaminehydrochloride induced leukemia cell line K562 differentioninto macrophage. Chin Pharmacological Bulletin 2003; 19:290-293
2 Mosmann T. Rapid colorimetric assay for cellular growth andsurvival: application to proliferation and cytotoxicity assays. JImmunol Methods 1983; 65: 55-63
3 McDonnell TJ, Meyn RE, Robertson LE. Implications ofapoptotic cell death regulation in cancer therapy. Semin CancerBiol 1995; 6: 53-60
4 Xie QL, Dai Y, Sun FY, Lin J, Chen XY, Zhang MY, Chen XJ. Themorphology of melanoma induced by glucosaminehydrochloride. Anhui Zhongyixueyuan Xuebao 2002; 21: 42-44
5 Wang Z, Qiao Y, Huang GS, Wang AQ, Zhang YQ, Feng JL,Yang GR, Guo Y, Liang R. Induction of macrophagic differen-tiation of leukemia cell line K562 by N-acetyl-D glucosamine.Disi Junyi Daxue Xuebao 2003; 24: 46-48
6 Oka Y, Naomoto Y, Yasuoka Y, Hatano H, Haisa M, TanakaN, Orita K. Apoptosis in cultured human colon cancer cellsindued by combined treatments with 5-fluorouracil tumor ne-crosis factor-alpha and interferon-alpha. Jpn J Clin Oncol 1997;27: 231-235
7 Kerr JF, Wyllie AH, Currie AR. Apoptosis: a basic biologicalphenomenon with wide-ranging implications in tissue Kinetics.Br J Cancer 1972; 26: 239-257
8 Kerr JF, Winterford CM, Harmon BV. Apoptosis. Its signifi-cance in cancer and cancer therapy. Cancer 1994; 73: 2013-2026
Edited by Chen WW and Wang XL Proofread by Xu FM
Wu J et al. D-glucose derivative and human esophageal cancer cell line 3381
90
80
70
60
50
40
30
20
10
0
Gro
wth
inhib
itio
n (
%)
0.01 0.03 0.05 0.07 0.09
Concentration (mol/L)
24
48
72
(h)

PO Box 2345, Beijing 100023, China World J Gastroenterol 2004;10(22):3382-3384Fax: +86-10-85381893 World Journal of GastroenterologyE-mail: [email protected] www.wjgnet.com Copyright © 2004 by The WJG Press ISSN 1007-9327
• CASE REPORT •
A case of atypical caudate lobe hemangioma mimicking hepatocellular
carcinoma: CT and angiographic manifestations
Hsin-Chi Chen, Chi-Ming Lee, Ching-Shyang Chen, Chih-Hsiung Wu
Hsin-Chi Chen, Chi-Ming Lee, Department of Radiology, TaipeiMedical University Hospital, Taipei, TaiwanChing-Shyang Chen, Chih-Hsiung Wu, Department of Surgery,Taipei Medical University Hospital, Taipei, TaiwanCorrespondence to: Dr. Chi-Ming Lee, Department of Radiology,Taipei Medical University Hospital, No. 252 Wu-Hsing Street, Taipei110, Taiwan. [email protected]: +886-2-27372181 Ext. 1131 Fax: +886-2-23780943Received: 2004-04-10 Accepted: 2003-05-13
Abstract
We report a case of caudate lobe hemangioma with anatypical CT enhancement pattern. In the present case,hemangioma exhibited a very subtle discontinuous peripheralrim enhancement at the post-enhanced arterial phase, andthe peripheral enhanced zone had a moderately increasedenhancement degree and with widened enhancementthickness during the portal-phase and delayed-phase. Theslow enhancement rate for this caudate lobe hemangiomawas due to sluggish perfusion by the small feeding arteriesof caudate lobe branches as demonstrated by angiography.
Chen HC, Lee CM, Chen CS, Wu CH. A case of atypical caudatelobe hemangioma mimicking hepatocellular carcinoma: CT andangiographic manifestations. World J Gastroenterol 2004; 10(22): 3382-3384
http://www.wjgnet.com/1007-9327/10/3382.asp
INTRODUCTIONCavernous hemangioma is the most common benign hepatictumor and usually presents with a typical enhancement patternwhen studied by dynamic spiral computed tomography (CT).However, there are a small number of hemangiomas thatexhibit atypical enhancement patterns due to the presence ofintralesional non-enhanced or less-enhanced components[1-4].Herein, we report a case of hepatitis B and C with an atypicalcaudate lobe hemangioma that preoperatively was misdiagnosedas a hepatocellular carcinoma because the caudate lobe masswas supplied by small caudate lobe arteries with very sluggishperfusion, resulting in a slow enhancement rate and atypicalenhancement patterns when studied by dynamic CT. CTimaging features and corresponding angiographic findings ofthe atypical caudate lobe hemangioma were provided.
CASE REPORTAn asymptomatic 58-year-old woman was found incidentallyto have a hepatic mass in the caudate lobe by ultrasound studyduring a health examination. She was a known hepatitis Bcarrier (serum positive HBsAg) for 10 years and also knownas a hepatitis C carrier (positive IgG anti-HCV) for 1 year.Laboratory evaluation demonstrated normal liver and renalfunction. The counts of red blood cells, white blood cells, andplatelets, coagulation function test, urinalysis, and serumbiochemistry profile analysis were normal. The serum alpha-
fetoprotein level was not elevated. Abdominal ultrasounddetected a 4.0 cm×4.6 cm inhomogeneous hyperechoic masssituated at the caudate lobe. Pre- and post-contrast triphasic spiral CT scans weresubsequently performed with intravenous administration of atotal of 100 mL of contrast material at an injection rate of 2 ml/svia a power injector. Hepatic arterial-phase, portal-phase anddelayed-phase were obtained 35, 75 and 180 seconds, respectively,after the injection of contrast material. Pre-contrast CT revealeda well-circumscribed, low attenuation (attenuation value of40 HU) ovoid mass (measuring approximately 4.0 cm×4.6 cmin dimension) occupying the caudate lobe. The mass exhibiteda very faint discontinuous peripheral rim enhancement(attenuation value of 76 HU) at the arterial-phase (Figure 1A),with a moderately increased enhancement degree (attenuationvalue of 110 to 114 HU) and widened enhancement thicknessfor the enhanced peripheral zone during the portal-phaseand delayed-phase (Figures 1B, C). Minimal enhancement(attenuation value of 61 HU) was also noted in the centralportion of the mass during the delayed-phase. The patient also received a conventional angiographicexamination for further evaluation of the caudate lobe mass.Selective proper hepatic angiography showed two small,slightly tortuous, but not enlarged caudate lobe arteries derivingfrom the right and left hepatic arteries and supplying the caudatelobe mass. Very faint peripheral tumor stains were detectedduring the late arterial phase (Figure 2A) and parenchymal phase.However, there were no persistent, dense tumor stains at thelate venous phase. During the angiographic study, 4 mL oflipiodol (iodized oil) was also slowly injected into the properhepatic artery and showed several foci of spotty lipiodolretention in the peripheral and central portions of the caudatelobe mass (Figure 2B). The patient underwent caudate lobe excision under thepresumptive diagnosis of hepatocellular carcinoma based onthe imaging findings. Pathological examination revealed acavernous hemangioma occupying the caudate lobe. Onlyseveral small foci of organizing thrombi within the hemangiomawere discovered.
DISCUSSIONCavernous hemangioma is the most common benign hepatictumor. The vast majority of hepatic hemangiomas present witha typically initial intense peripheral nodular enhancement withgradual central fill-in enhancement when studied by dynamicCT study, and it is easy to differentiate from other hepatictumors. However a small number of hemangiomas couldexhibit atypical enhancement patterns due to the presence ofintralesional non-enhanced thrombosis, fibrotic, degeneratedor calcified components[1,4]. In addition, variable vascularity ofhemangiomas could also influence the lesion’s enhancementrate and result in atypical enhancement patterns[2-4]. An atypicalhemangioma may mimic a malignant hepatic tumor, causingdiagnostic confusion, especially in patients at risk of malignancy. Previous investigators[2-4] have observed that atypicalenhancing hemangiomas were more common for smallerlesions than for larger lesions. Approximately 15.6% to 22.2% of

hemangiomas smaller than 2 cm in diameter might have anatypical enhancement pattern of low or iso-attenuation duringthe post-enhanced arterial and portal venous phases by dynamicCT[2-4]. However, atypical enhancement patterns of largehemangiomas were very rare. Yun et al.[2] reported that only2.2% of hemangiomas larger than 2 cm in diameter presentedwith atypical enhancement patterns. These reports werecorrelated with the concept that the presence of typicalperipheral nodular enhancement required larger bloodsupply vessels for hemangiomas and this was associatedmore with a larger lesion size. Thus, a hemangioma fed bysmall, not-enlarged supply arteries may fail to exhibit a typicalenhancement pattern. In this present case, although the caudate lobe hemangiomawas larger than 4 cm in diameter, the angiograms showed thatit was supplied by slightly tortuous, but un-enlarged feedingarteries due to its unique location on an independent hepaticsegment of the caudate lobe that only receives the smalldiameter caudate arterial branches derived from the proximalportion of right and left hepatic arteries. So, this caudate lobehemangioma failed to exhibit a typical initial peripheral nodularenhancement due to the absence of large feeding arteries.Moreover, the small caudate arteries with their sluggishperfusion also resulted in a slow enhancement rate for thecaudate lobe hemangioma. On the post-enhanced arterial-phase, a very faint discontinuous peripheral rim enhancementwas noted. During the portal-phase, there was a moderatelyincreased enhancement degree for the enhanced peripheralzone, but the degree of enhancement was not as high as intra-hepatic vessels. At the delayed-phase, complete centripedalfill-in enhancement was not present in the hemangioma,but only a subtle enhancement of the intralesional centralportion was noted. The enhancement pattern in the caudatelobe hemangioma thus simulated a well-differentiatedhepatocellular carcinoma with delayed pseudocapsule
enhancement, because a well-differentiated hepatocellularcarcinoma might usually only possess a slightly increased arterialsupplement and is not fed by markedly enlarged vessels[5].Therefore, both a well-differentiated hepatocellular carcinomaand a hemangioma with small feeding arteries may exhibit asimilar enhancement pattern on dynamic CT study. However,the thickness of pseudocapsules in a hepatocellular carcinomawas thinner than that of the enhanced peripheral rim in ahemangioma. Furthermore, the increased enhancement degreeand the increased enhancement thickness of the intra-lesionalperipheral rim also provided a diagnostic clue for the hemangiomawith a slow progressive central fill-in enhancement. In contrast,a hepatocellular carcinoma usually exhibited contrast mediumwashout during the delayed-phase. MR imaging is superior to CT study to improve diagnosticconfidence for hepatic hemangiomas. CT has a sensitivity of62-88% and a specificity of 84-100% (100% when enhancementis isoattenuating to the aorta) for detection of the typical globularenhancement in hemangiomas[6]. However, MR imaging has ahigher sensitivity of 98% and a specificity of 98% for detectionof the hemangiomas[7]. Some atypical hemangiomas can bediagnosed by MR imaging study. Nevertheless, some atypicalhemangiomas will still remain uncertain at MR study due to thepresence of intralesional thrombosis, calcified, hyalinized orcystic components that results in the loss of its characteristicappearance of markedly high signal intensity on heavy T2-weighted imaging and present with atypical enhancementpatterns on post-enhanced study[8]; and these cases will requirebiopsy and histopathologic examination. Except that hemangiomas can exhibit peripheral rimenhancement, the presence of peripheral rim enhancementcould also be observed in hepatic metastatic lesions[9]. However, the peripheral rim enhancement in a metastaticlesion often has a serrated margin and not a lobular margin asseen in a hemangioma. Thus, in the present case, the caudate
Chen HC et al. Hemangioma mimics hepatocellular carcinoma 3383
A B C
Figure 1 CT images were obtained from an asymptomatic 58-year-old woman with an atypical hepatic hemangioma. A: A4.0 cm×4.6 cm caudate lobe mass, which exhibits a subtle, discontinuous peripheral thin-rim enhancement (attenuation valueof 76 HU) shown by post-contrast triphasic CT scan at the arterial-phase. B and C: A moderately increased enhancement degreeand a widened enhancement thickness for the enhanced peripheral zone (attenuation value of 110 to 114 HU) in the caudate lobemass shown by post-contrast triphasic CT scans at the portal-phase and delayed-phase.
A B
Figure 2 Peripheral tumor stains during the late arterial phase and foci of spotty lipiodol retention in the peripheral and centralportions of the caudate lobe mass. A: Peripheral tumor stains during the late arterial phase. B: Foci of spotty lipiodol retentionin the peripheral and central portions of the caudate lobe mass.

lobe hemangioma had an enhanced peripheral rim with a lobularmargin and not a serrated margin allowing it to be differentiatedfrom a metastatic lesion. As in the present case of a hepatitis carrier at risk formalignancy, CT and MR imaging were considered ascomplementary imaging study for detection of the malignanthepatic masses. Kang et al.[10] reported that although MRimaging study had a higher sensitivity of 95% than that of CTstudy with a sensitivity of 88% for detection of the hepatocellularcarcinomas, However, there was no significant difference inthe diagnostic specificity between MR study (97%) and the CTstudy (98%). Intra-arterial lipiodol injection has also been used toincrease detection of small hepatic neoplasms. Lipiodol retentionwith a spotty and/or nodular type distribution in the peripheralor central portions of hepatic hemangiomas has been describedby Moon et al.[11]. However, the presence of spotty lipiodolretention has also been observed in other hepatic tumors, suchas focal nodular hyperplasia, metastases and hepatocellularcarcinoma. Hepatocellular carcinomas tended to exhibit aperipheral distribution of lipiodol accumulation, rather than acentral distribution of lipiodol deposition as seen in hemangiomas.In this present case, conventional angiography failed to demonstratethe typical “cotton-wool” appearance of puddling of contrastmaterial within the large vascular spaces and persisting intothe venous phase of a caudate lobe hemangioma. The absenceof persistent tumor stains in the hemangioma may be due to itsunique location in the hepatic caudate lobe where there is arapid venous drainage to the adjacent portal vein and inferiorvena cava. In such a situation, it is difficult to distinguish ahemangioma from a hepatocellular carcinoma based only onconventional angiographic imaging findings. Whereas, intra-arterial lipiodol injection demonstrated spotty lipiodol retentionat the intralesional peripheral and central portions, with a“cotton wool” appearance, and suggested a diagnosis ofhemangioma. In addition, the number of lipiodol retention fociwas also more pronounced than the number of contrast materialstains as seen on conventional angiograms, because the lipiodolmaterials could be retained in the ectatic and tortuous vascularchannels of the hemangioma, thus decreasing its venouswashout degree via the portal vein and inferior vena cava.Therefore, intra-arterial lipiodol injection is able to help in thediagnosis of a hemangioma with a rapid venous drainage. In conclusion, the presence of slow progressive peripheralrim enhancement persisting to the delayed phase, associatedwith the presence of central distributed spotty lipiodol retentionin a caudate lobe mass should give rise to a suspicion of thepossibility of hepatic hemangioma. This report emphasizes thata hepatic hemangioma in this unique caudate lobe location can
3384 ISSN 1007-9327 CN 14-1219/ R World J Gastroenterol November 15, 2004 Volume 10 Number 22
present with an atypical enhancement pattern and resembles ahepatocellular carcinoma. Thus, we recommend that whenstudying a caudate lobe lesion, a longer post-enhanced delayedtime (more than 3 min) is required on CT, in order to reflect itsactual vascularity characteristics. In addition, further evaluationby MR study with a long echo time of 150 to 180 ms is alsonecessary to confirm the diagnosis of a cavernous hemangiomain order to prevent inappropriate therapeutic decision making.
REFERENCES1 Mitsudo K, Watanabe Y, Saga T, Dohke M, Sato N, Minani K,
Shigeyasu M. Nonenhanced hepatic cavernous hemangioma withmultiple calcifications: CT and pathologic correlation. AbdomImaging 1995; 20: 459-461
2 Yun EJ, Choi BI, Han JK, Jang HJ, Kim TK, Yeon KM, Han MC.Hepatic hemangioma: contrast-enhancement pattern duringthe arterial and portal venous phases of spiral CT. AbdomImaging 1999; 24: 262-266
3 Hanafusa K, Ohashi I, Himeno Y, Suzuki S, Shibuya H. Hepatichemangioma: findings with two-phase CT. Radiology 1995;196: 465-469
4 Leeuwen MS, Noordzij J, Feldberg MAM, Hennipman AH,Doornewaard H. Focal liver lesions: characterization with tripha-sic spiral CT. Radiology 1996; 201: 327-336
5 Hwang GJ, Kim MJ, Yoo HS, Lee JT. Nodular hepatocellularcarcinomas: detection with arterial-, portal-, and delayed-phaseimages at spiral CT. Radiology 1997; 202: 383-388
6 Leslie DF, Johnson CD, Johnson CM, Ilstrup DM, Harmsen WS.Distinction between cavernous hemangiomas of the liver andhepatic metastases on CT: value of contrast enhancementpatterns. Am J Roentgenol 1995; 164: 625-629
7 Soyer P, Gueye C, Somveille E, Laissy JP, Scherrer A. MRdiagnosis of hepatic metastases from neuroendocrine tumorsverus hemangiomas: relative merits of dynamic gadoliniumchelate-enhanced gradient-recalled echo and unenhanced spin-echo images. Am J Roentgenol 1995; 165: 1407-1413
8 Vilgrain V, Boulos L, Vullierme MP, Denys A, Terris B, Menu Y.Imaging of atypical hemangiomas of the liver with pathologiccorrelation. Radiographics 2000; 20: 379-397
9 Mitchell DG, Saini S, Weinreb JW, De Lange EE, Runge VM,Kuhlman JE, Parisky Y, Johnson D, Brown JJ, Schnall M, HerfkeasR, Davis PL, Gorczyca D, Sica G, Foster GS, Bernardino ME. He-patic metastases and cavernous hemangiomas: distinction withstandard- and triple-dose gadoteridol-enhanced MR imaging.Radiology 1994; 193: 49-57
10 Kang BK, Lim JH, Kim SH, Choi D, Lim HK, Lee WJ, Lee SJ.Preoperative depiction of hepatocellular carcinoma:Ferumoxides-enhanced MR imaging versus triple-phase helicalCT. Radiology 2003; 226: 79-85
11 Moon WK, Han JK, Choi BI, Kim SH, Chung JW, Park JH, HanMC. Iodized-oil retention within hepatic hemangioma: charac-teristics on iodized-oil CT. Abdom Imaging 1996; 21: 420-426
Edited by Wang XL Proofread by Zhu LH and Xu FM

PO Box 2345, Beijing 100023, China World J Gastroenterol 2004;10(22):3385-3387Fax: +86-10-85381893 World Journal of GastroenterologyE-mail: [email protected] www.wjgnet.com Copyright © 2004 by The WJG Press ISSN 1007-9327
• CASE REPORT •
Recurrence of hepatocellular carcinoma with rapid growth after
spontaneous regression
Tomoki Nakajima, Michihisa Moriguchi, Tadashi Watanabe, Masao Noda, Nobuaki Fuji, Masahito Minami, Yoshito Itoh,Takeshi Okanoue
Tomoki Nakajima, Michihisa Moriguchi, Tadashi Watanabe, MasaoNoda, Masahito Minami, Yoshito Itoh, Takeshi Okanoue, MolecularGastroenterology and Hepatology, Kyoto Prefectural University ofMedicine Graduate School of Medical Science, Kyoto, JapanNobuaki Fuji, Department of Surgery, Kyoto Prefectural YosanoumiHospital, Kyoto, JapanCorrespondence to: Tomoki Nakajima M.D., Molecular Gastroenterologyand Hepatology, Kyoto Prefectural University of Medicine GraduateSchool of Medical Science, Kawaramachi-Hirokoji, Kamigyo-ku,Kyoto 602-8566, Japan. [email protected]: +81-75-251-5519 Fax: +81-75-251-0710Received: 2004-03-09 Accepted: 2004-04-16
Abstract
We report an 80-year-old man who presented with sponta-neous regression of hepatocellular carcinoma (HCC). Hecomplained of sudden right flank pain and low-grade fever.The level of protein induced by vitamin K antagonist (PIVKA)-II was 1 137 mAU/mL. A computed tomography scan inNovember 2000 demonstrated a low-density mass locatedin liver S4 with marginal enhancement and a cystic massof 68 mm×55 mm in liver S6, with slightly high density contentand without marginal enhancement. Angiography revealedthat the tumor in S4 with a size of 25 mm×20 mm was atypical hypervascular HCC, and transarterial chemoembolizationwas performed. However, the tumor in S6 was hypovascularand atypical of HCC, and thus no therapy was given. InDecember 2000, the cystic mass regressed spontaneouslyto 57 mm×44 mm, and aspiration cytology revealed bloodyfluid, and the mass was diagnosed cytologically as class I.The tumor in S4 was treated successfully with a 5 mm marginof safety around it. The PIVKA-II level normalized in February2001. In July 2001, the tumor regressed further but presentedwith an enhanced area at the posterior margin. In November2001, the enhanced area extended, and a biopsy revealedwell-differentiated HCC, although the previous tumor inS4 disappeared. Angiography demonstrated two tumorstains, one was in S6, which was previously hypovascular,and the other was in S8. Subsequently, the PIVKA-II levelstarted to rise with the doubling time of 2-3 wk, and thetumor grew rapidly despite repeated transarterialembolization with gel foam. In February 2003, the patientdied of bleeding into the peritoneal cavity from the tumor thatoccupied almost the entire right lobe. Considering the acuteonset of the symptoms, we speculate that local ischemiapossibly due to rapid tumor growth, resulted in intratumoralbleeding and/or hemorrhagic necrosis, and finally spontaneousregression of the initial tumor in S6.
Nakajima T, Moriguchi M, Watanabe T, Noda M, Fuji N, Minami M,Itoh Y, Okanoue T. Recurrence of hepatocellular carcinomawith rapid growth after spontaneous regression. World J
Gastroenterol 2004; 10(22): 3385-3387
http://www.wjgnet.com/1007-9327/10/3385.asp
INTRODUCTIONAccording to previous reports, spontaneous regression (SR)
of malignant tumors is estimated to occur once in 60 000-100 000cancer patients[1]. Neuroblastomas and urinary bladder cancersare well-known to regress spontaneously. However, in hepatocellularcarcinoma (HCC) only 30 cases of SR have been reported in theEnglish-language literature[2-7]. Among them, there has been only1 report of 2 cases of recurrent HCC after SR[4]. In both cases,however, the new lesion developed at a different site in theliver while the preexisting HCC was regressing, suggestingthat multicentric hepatocarcinogenesis was involved in therecurrence. In this paper, we present a case of spontaneouslyregressing HCC, which recurred locally during the course of 8 mo.Four months later, a new lesion developed at a different site inthe liver, possibly through intrahepatic metastasis from theoriginal tumor, and progressed rapidly. We discussed the possiblemechanisms of SR in HCC.
CASE REPORTAn 80-year-old man was admitted to our hospital on November14, 2000 due to right flank pain and low-grade fever, whichcontinued for a day and worsened gradually. He drank 350 mLof beer every day but had no history of the use of herbal medicines. His blood pressure was 170/104 mmHg and body temperaturewas 37.2 . There was no remarkable physical finding. Thelaboratory data on admission revealed that his white blood cellcount and C-reactive protein (CRP) were elevated to 10 600/mm3
and 6.2 mg/dL, respectively. Aspartate aminotransferase (AST) andalanine aminotransferase (ALT) also were elevated to 201 IU/Land 234 IU/L, respectively. The level of alfa-fetoprotein (AFP) waswithin the normal limit, but protein induced by vitamin K antagonist(PIVKA)-II was 1 137 mAU/mL. His serum was negative for hepatitisB surface antigen and positive for hepatitis C antibody. Enhanced computed tomography (CT) on admissiondemonstrated 2 hepatic tumors (Figure 1A). One was a low-densitymass located in liver S4 with marginal enhancement. The other wasa cystic mass of 68 mm×55 mm in S6 with slightly high densitycontent but without marginal enhancement. Angiographydemonstrated that the right hepatic lobe was supplied by the replacedright hepatic artery. A celiac arteriogram showed tumor stain in S4with a size of 25 mm×20 mm, which was diagnosed as typical HCC(Figure 2A). Transarterial chemoembolization was performedusing an emulsion of 3.2 mL Lipiodol (iodized oil manufacturedby Andre Guerbert, Aulnay-sous-Bois, France) and 32 mgepirubicin[8]. The super mesenteric arteriogram, on the other hand,demonstrated that the tumor in S6 was hypovascular (Figure 2B).Because this image was atypical of HCC, no therapy was given. Low-grade fever disappeared on the second day of admissionand the white blood cell count, CRP and transaminases becamealmost normal on the eighth day. Because the patient wanted toundergo an operation for gallbladder stones, preoperative evaluationfor cholecystectomy was carried out. In December 2000, just beforethe operation, a CT scan showed that Lipiodol was accumulatedin the tumor in S4 and that the cystic mass in S6 was decreasedin size spontaneously, down to 57 mm×44 mm (Figure 1B). Duringthe operation in December 2000, microwave coagulation wasperformed for HCC in S4. The surface of the cystic tumor in S6was dark red and needle aspiration revealed bloody fluid, which wasdiagnosed cytologically as class I. Because there was no evidenceof malignancy, we did not give any treatment for this lesion.

After the operation, the tumor in S6 continued to decreasein size (Figure 1C), whereas the tumor in S4 was treatedsuccessfully with a 5 mm margin of safety around it. The PIVKA-II level fell to the normal limit in February 2001. A CT scan inJuly 2001 revealed that the tumor was decreased further in sizebut demonstrated an enhanced area at the posterior margin ofthe tumor (Figure 1D). Furthermore, the PIVKA-II level increasedslightly. In November 2001, a CT scan demonstrated that theenhanced area extended to the surrounding area of the cystictumor (Figure 1E). Histological evaluation by tumor biopsy fromthe lesion in S6 revealed a well-differentiated HCC (Figure 1F).The celiac arteriogram in November 2001 showed that theprevious tumor stain in S4 disappeared. The super mesentericarteriogram demonstrated 2 tumor stains; one was in S6, whichwas previously hypovascular, and the other was in S8 (Figure 2D). Subsequently, transarterial embolization with gel foam(TAE) was repeated but the tumor resisted therapy, with rapidinvasion and intrahepatic metastasis. In February 2003, the
3386 ISSN 1007-9327 CN 14-1219/ R World J Gastroenterol November 15, 2004 Volume 10 Number 22
Figure 2 A: Celiac arteriogram showing tumor stain with asize of 25 mm×20 mm in S4. B: Blood supply of right hepaticlobe by the replaced right hepatic artery. C: Super mesentericarteriogram demonstrating two tumor stains.
A B C
November 2000 November 2001
Figure 3 Clinical course of the patient. TAE: transarterial embo-lization with gel foam.
patient died of bleeding into the peritoneal cavity from thetumor that occupied almost the entire right lobe (Figure 3).
DISCUSSIONTo our knowledge, there has been only 1 report of 2 cases ofrecurrence of HCCs after SR[4]. In both cases, the recurrent HCCsdeveloped at different sites in the liver before the preexistingHCC regressed completely, suggesting that multicentrichepatocarcinogenesis, rather than intrahepatic metastasis, waslikely to have been involved in the recurrence. However, in ourcase, evidence of local recurrence in the regressing tumor wasobserved by CT scan before the newly developed lesion in S8was found by angiography. In addition, when local recurrencewas detected by CT scan, the serum PIVKA-II level started torise again. This clinical course suggests that the new lesion inS8 might be due to intrahepatic metastasis from the locallyrecurrent tumor in S6, rather than multicentric hepatocarcinogenesis.
Figure 1 Enhanced computed tomography (CT). A: A low-density mass located in liver S4, with marginal enhancement and a cystic massof 68 mm×55 mm in S6. B: Lipiodol accumulation in the tumor in S4 and the cystic mass in S6. C: Microwave coagulation performed forHCC in S4 during cholecystectomy. D: Further decrease in tumor size and enhanced area at the posterior cystic lumen of the tumor. E:Extension of the enhanced area to the surrounding area of cystic tumor. F: A well-differentiated HCC shown by histological evaluation.
S4
S6
Cytology: Class I Tumor biopsy
PIVKA-II
1 137 mAU/mL
November 2000
103 mAU/mL
December 2000
26 mAU/mL
February 2001
167 mAU/mL
July 2001
2 141 mAU/mL
November 2001
A B C D E
F
Novem
ber
2000
>7 5000
45 000
40 000
35 000
30 000
25 000
20 000
15 000
10 000
5 000
0
˜̃ ˜˜TAE
PIVKA-II (mAU/mL)
TAE TAE TAE
April 2001
August
Decem
ber
April 2002
August
Febru
ary
2003
Decem
ber

In previous reports, some authors made a definitive diagnosisby histological study after tumor resection but others suspectedSR based on the following up radiological findings and the tumormarkers[2-7]. In this case, the PIVKA-II level was 1 137 mAU/mL onthe first admission and decreased dramatically to 103 in 1 mo.However, at that point we were not certain whether this was due toSR of the HCC in S6 or to transarterial chemoembolization for atypical HCC in S4. In addition, a diagnosis of class I by tumoraspiration cytology in S6 prevented us from performing S6segmentectomy, in view of evidence-based medicine. We couldnot make a definitive diagnosis of the tumor in S6 until it showedradiological signs of recurrence and was proven histologicallyto be HCC. The precise mechanism of SR of HCC remains unclear, butvarious factors have been speculated to play a role, such asalcohol withdrawal[9], androgen withdrawal[10], and intake ofherbal medicine[2,11,12]. Secondary bacterial infection in thetumor has also been supposed to cause SR through thestimulation of cytokine production[13,14] and fever[15]. Becauseof the hypervascular nature of HCC, another important factormight be an insufficient blood supply to the tumor, possiblydue to rapid natural tumor growth[16,17], spontaneous arterialthrombosis[18], or gastrointestinal bleeding[19,20]. In our case,there was no history of alcohol or androgen withdrawal or theuse of herbal medicines. The initial symptoms of right flankpain and fever suddenly appeared and lasted for only a day.Laboratory data showed that the levels of transaminases wereelevated on admission but almost normalized in about a week.In addition, angiography clarified that the tumor in S6 washypovascular. Furthermore, this tumor was cystic with slightlyhigh density content, from which bloody fluid was obtained.These clinical manifestations suggest that the acute onset ofthe symptoms was due to local ischemia, leading to intratumoralbleeding or hemorrhagic necrosis, and as a result, causing SR. In this case, the PIVKA-II level after recurrence showed alogarithmic increase throughout the entire clinical course, exceptthat it stabilized for one month after each TAE. The doubling timeof the PIVKA-II level, which is thought to reflect the tumor doublingtime, was calculated to be 2-3 wk. This indicates that the recurrenttumor grew very rapidly, compared with the average natural growthrate of HCC reported previously[21,22]. The PIVKA-II level waselevated to 1 137 mAU/mL on the first admission, decreased alongwith SR of the tumor in S6, and rose again after recurrence. It hasbeen reported that HCCs with high PIVKA-II levels during theinitial stage show aggressive behaviors and a poor prognosis.Therefore, we speculate that the initial tumor in S6 grew as fastas the recurrent tumor and this rapid growth itself might be thecause of insufficient blood supply to the tumor, finally inducingSR, as suggested in previous reports[16,17].
REFERENCES1 Cole WH. Efforts to explain spontaneous regression of cancer.
J Surg Oncol 1981; 17: 201-2092 Takeda Y, Togashi H, Shinzawa H, Miyano S, Ishii R, Karasawa
T, Takeda Y, Saito T, Saito K, Haga H, Matsuo T, Aoki M,Mitsuhashi H, Watanabe H, Takahashi T. Spontaneous regres-sion of hepatocellular carcinoma and review of literature. JGastroenterol Hepatol 2000; 15: 1079-1086
3 Izuishi K, Ryu M, Hasebe T, Kinoshita T, Konishi M, Inoue K.
Nakajima T et al. Recurrence of HCC after spontaneous regression 3387
Spontaneous total necrosis of hepatocellular carcinoma: reportof a case. Hepatogastroenterology 2000; 47: 1122-1124
4 Lee HS, Lee JS, Woo GW, Yoon JH, Kim CY. Recurrent hepato-cellular carcinoma after spontaneous regression. J Gastroenterol2000; 35: 552-556
5 Matsuo R, Ogata H, Tsuji H, Kitazono T, Shimada M, Taguchi K,Fujishima M. Spontaneous regression of hepatocellular carcinoma-a case report. Hepatogastroenterology 2001; 48: 1740-1742
6 Ikeda M, Okada S, Ueno H, Okusawa T, Kuriyama H. Sponta-neous regression of hepatocellular carcinoma with multiple lungmetastases: a case report. Jpn J Clin Oncol 2001; 31: 454-458
7 Morimoto Y, Tanaka Y, Itoh T, Yamamoto S, Mizuno H, FushimiH. Spontaneous necrosis of hepatocellular carcinoma: a casereport. Dig Surg 2002; 19: 413-418
8 Fan J, Ten GJ, He SC, Guo JH, Yang DP, Wang GY. Arterialchemoembolization for hepatocellular carcinoma. World JGastroenterol 1998; 4: 33-37
9 Gottfried EB, Steller R, Paronetto F, Lieber CS. Spontaneousregression of hepatocellular carcinoma. Gastroenterology 1982;82: 770–774
10 McCaughan GW, Bilous MJ, Gallagher ND. Long-term sur-vival with tumor regression in androgen-induced liver tumors.Cancer 1985; 56: 2622-2626
11 Chien RN, Chen TJ, Liaw YF. Spontaneous regression of hepa-tocellular carcinoma. Am J Gastroenterol 1992; 87: 903-905
12 Lam KC, Ho JC, Yeung RT. Spontaneous regression of hepato-cellular carcinoma: a case study. Cancer 1982; 50: 332-336
13 Watanabe N, Yamauchi N, Maeda M, Neda H, Tsuji Y,Okamoto T, Tsuji N, Akiyama S, Sasaki H, Niitsu Y. Recombi-nant human tumor necrosis factor causes regression in pa-tients with advanced malignancies. Oncology 1994; 51: 360-365
14 Nishimura T, Watanabe K, Yahata T, Ushaku L, Ando K,Kimura M, Saiki I, Uede T, Habu S. Application of interleukin12 to antitumor cytokine and gene therapy. Cancer ChemotherPharmacol 1996; 38: S27-34
15 Jansen PM, van der Pouw Kraan TC, de Jong IW, van MierloG, Wijdenes J, Chang AA, Aarden LA, Taylor FB Jr, Hack CE.Release of interleukin-12 in experimental Escherichia coli septicshock in baboons: relation to plasma levels of interleukin-10and interferon-gamma. Blood 1996; 87: 5144-5151
16 Suzuki M, Okazaki N, Yoshino M, Yoshida T. Spontaneousregression of a hepatocellular carcinoma: a case report.Hepatogastroenterology 1989; 36: 160-163
17 Iwasaki M, Furuse J, Yoshino M, Moriyama N, Kanemoto H,Okumura H. Spontaneous regression of hepatocellularcarcinoma: a case report. Jpn J Clin Oncol 1997; 27: 278-281
18 Imaoka S, Sasaki Y, Masutani S, Ishikawa O, Furukawa H, KabutoT, Kameyama M, Ishiguro S, Hasegawa Y, Koyama H. Necrosisof hepatocellular carcinoma caused by spontaneously arising ar-terial thrombus. Hepatogastroenterology 1994; 41: 359-362
19 Gaffey MJ, Joyce JP, Carlson GS, Esteban JM. Spontaneousregression of hepatocellular carcinoma. Cancer 1990; 65:2779-2783
20 Tocci G, Conte A, Guarascio P, Visco G. Spontaneous remis-sion of hepatocellular carcinoma after massive gastrointestinalhaemorrhage. BMJ 1990; 300: 641-642
21 Ebara M, Ohto M, Shinagawa T, Sugiura N, Kimura K,Matsutani S, Morita M, Saisho H, Tsuchiya Y, Okuda K. Natu-ral history of minute hepatocellular carcinoma smaller thanthree centimeters complicating cirrhosis. A study in 22 patients.Gastroenterology 1986; 90: 289-298
2 2 Nakajima T, Moriguchi M, Mitsumoto Y, Katagishi T, KimuraH, Shintani H, Deguchi T, Okanoue T, Kagawa K, Ashihara T.Simple tumor profile chart based on cell kinetic parameters andhistological grade is helpful for estimating the natural growthrate of hepatocellular carcinoma. Hum Pathol 2002; 33: 92-99
Edited by Wang XL Proofread by Zhu LH and Xu FM