Modeling and simulation of composite plasmonic structures ...

1
A Plasmonic Fluid with Dynamically Tunable Optical Properties
Rama Ranjan Bhattacharjee,a Ruipeng Li,
b Luis Estevez,
a
Detlef-M. Smilgies,c Aram Amassian
b and Emmanuel P. Giannelis
*a
a Materials Science & Engineering, Cornell University, Ithaca, New York 14853, USA
*EMAIL: [email protected], Fax No.: +1 607-255-2365
b King Abdullah University of Science and Technology, Materials Science and Engineering, Jeddah,
Kingdom of Saudi Arabia.
c Cornell High-Energy Synchrotron Source (CHESS), Cornell University, Ithaca, New York 14853,
USA
† Electronic supplementary information (ESI) available: (A) Thermogravimetric analysis (TGA) data
for samples 1 & 2. (B) Video of dynamic color changes observed while shearing sample 1. (C) Video of
dynamic spectral changes observed while shearing sample 1.
2
ABSTRACT
We report the first synthesis of a gold nanorod (GNR)-based nanocomposite that exhibits solid-like
plasmonic properties while behaving in a liquid-like manner. Tuning the degree of GNR clustering
controls the material’s responsiveness to external stimuli, such as mechanical shearing, due to the
sensitivity of the localized surface plasmon resonance to interparticle interactions.

3
Recently, one dimensional nanoparticles have been shown to provide building blocks for materials
applications due to their intriguing optical and electronic properties.1-3
Gold nanorods (GNRs) for
example, have interesting optical properties due to the collective oscillation of conduction electrons in
different directions within the particles upon interaction with light.2-6
The energy levels of the resulting
localized surface plasmon resonance (LSPR) bands depend on the size and average aspect ratio of the
particles3, 7
and can be tuned by controlling the interparticle separation and relative orientation of the
GNRs.8, 9
In solution, surface functionalized GNRs have been assembled into various geometries by
changing pH,10
hydrophilicity11, 12
and by recognition techniques.13, 14
These assemblies show interesting
optical properties which can be used in surface enhanced Raman scattering,15, 16
bioimaging,17
biosensor,16
and cancer therapy.15-18
In the solid state, there are reports of assembled and oriented GNRs
in polymers or porous supports that show polarization dependent optical properties.9, 19
However, GNR
fluids with tunable viscoelastic and plasmonic properties, i.e., between the liquid and solid states, have
not been reported in literature, until now. We report the first solventless GNR-based nanocomposite
fluid with tunable plasmonic and viscoelastic properties. Mechanical shearing of these fluids can
produce dynamical and reversible spectral and chromatic changes when GNRs are arranged into
clusters. These unique properties result from a combination of solid-like assembly of GNR inclusions
and a fluid-like behavior of the matrix. This novel material system based on one-dimensional metallic
nanoparticles may pave the way for new applications in the fields of biology, micro/nanofluidics,
sensing, plasmonics, and beyond.
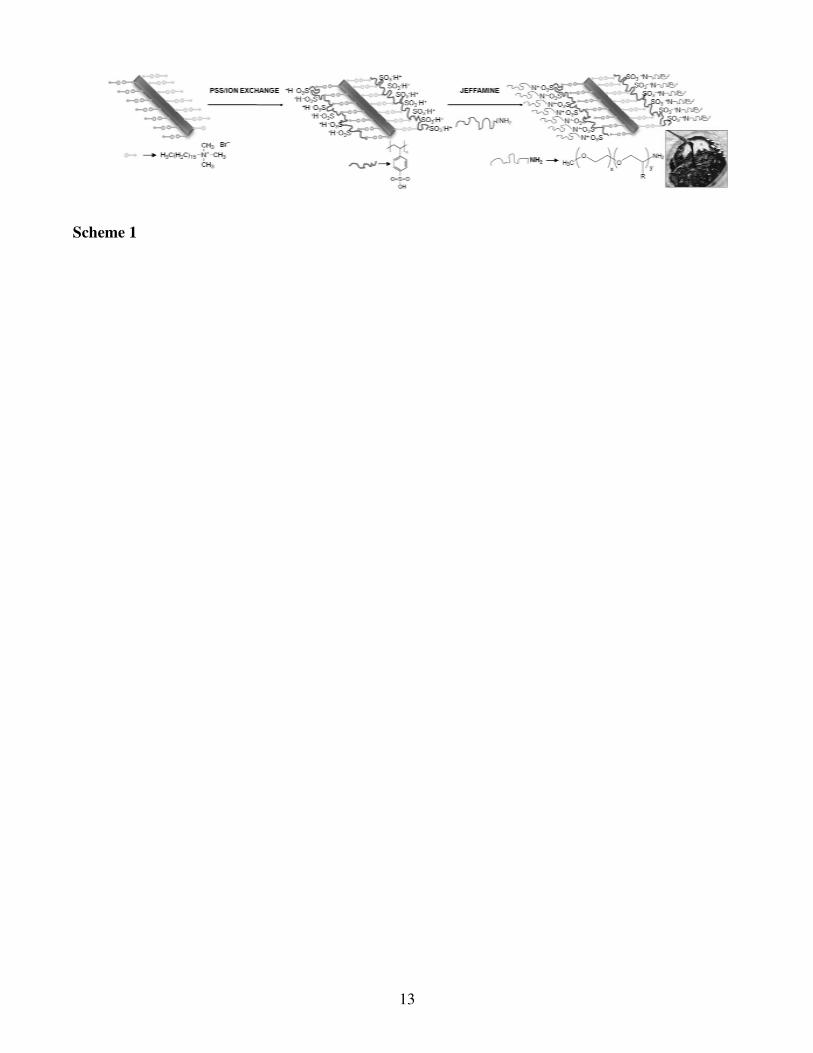
We have recently focused on a new, tunable materials platform prepared by stepwise
functionalization of nanoparticles (NP), which results in fluidities ranging from simple Newtonian
liquids to gels and solids having interesting properties.20-26
These are generically called nanoscale ionic
materials (NIMs), and are a new and unique class of hybrid organic-inorganic composites consisting of
an inorganic nanoparticle core, a charged corona, and a counterion canopy. Each NP in the composite
therefore carries its own canopy via primary ionic bonds, and so the ensemble behaves like a
viscoelastic fluid. The synthesis strategy was modified slightly for the GNR NIMs to address specific

4
challenges associated with the surface modification of GNRs. In particular, Dai et al. have shown that
the CTAB bi-layer often results in irreversible aggregation of the nanorods, if surface modification is
attempted.27
Hence, our approach towards the synthesis of the fluidic-GNRs was to consecutively build
up a layer of sulfonic acid groups (part of the corona) on the surface of the GNRs, thus keeping the
CTAB bilayer stable, and then titrating the sulfonic groups with a polyethylene glycol oligomer that is
end-terminated with an amine group (Jeffamine M2070). The entire synthetic approach is schematically
shown in Scheme 1. A layer by layer approach was adopted with polystyrene sulfonate (PSS) self-
assembled on the CTAB covered GNRs.17
Excess CTAB was washed out by centrifugation (sample 1)
or dialysis (sample 2), resulting in samples with different nanoparticle arrangements (see below). The
sulfonic groups of PSS were protonated by ion exchange using an ion-exchange resin to pH ~ 2.7 and
then titrated with the jeffamine to pH ~ 4.8 to form the canopy.24
The synthesis process can be termed
‘green’ as all reactions are done in water and do not involve any toxic or harmful chemicals. The end
product is an intensely colored fluid salt (GNR-NIMS) that is isolated by freeze drying (shown in inset
of Scheme 1).
Transmission electron micrographs (TEM) of samples 1 and 2 deposited on a TEM grid are shown
in Figure 1. Sample 1 reveals small GNR clusters whereas sample 2 consists of well-dispersed GNRs. In
both cases, TEM images reveal a relatively narrow spread of GNR diameters (lengths), with a mean
value of 12.8 nm (49.4 nm) and a standard deviation of 2.9 nm (6.8 nm). We calculate a mean aspect
ratio of ~ 4.0 with a standard deviation of 0.6. The presence and importance of interparticle interactions
can be probed via small-angle X-ray scattering (SAXS). In Figure 2(a), we compare SAXS
measurements taken in transmission mode for samples 1 and 2. Correlation peaks seen in the case of
sample 1 confirm that most GNRs in the sample are in close proximity with other GNRs, in agreement
with TEM. By contrast, GNRs in sample 2 tend to be isolated or in small clusters (e.g., dimers, trimers),
as evidenced by the absence of a correlation peak. Quantitative analysis of SAXS data for sample 1
reveals a mean interparticle spacing (center-to-center) of 20.9 nm, with a standard deviation of 2.1 nm,
indicating that GNRs are assembled predominantly in a side-by-side manner, since the mean diameter is

5
12.8 nm. In such an arrangement, the mean surface-to-surface separation between two adjacent GNRs in
a side-by-side arrangement is approximately 8.1 nm. This separation is much smaller than 2.5 times the
diameter of GNRs. This means the plasmonic response of sample 1 is expected to depend sensitively
upon interparticle interactions.8, 31-33
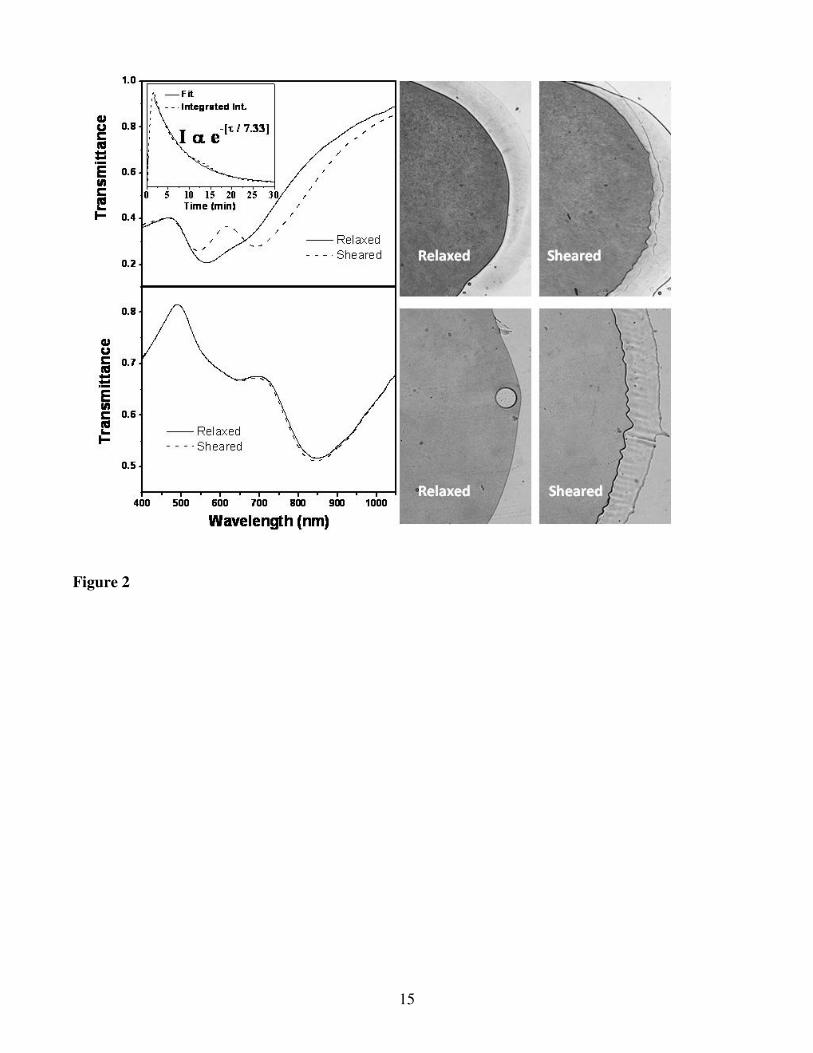
A small drop of each fluid was placed in between two microscope slides and monitored in an
unpolarized optical microscope. Using an electrical motor, the top microscope slide was translated,
resulting in mechanical shearing of the fluid film. This caused an immediate and distinctive color
change in sample 1 from violet to red (cf. Fig. 2), while no change was observed in the case of sample 2
in similar circumstances. Upon stopping the motor, sample 1 reverted to its original color. Repetitive
shearing of sample 1 yielded the same color change and the same recovery behavior, indicating a
remarkably reversible phenomenon and a lack of memory by the sample.
A more in-depth investigation of the optical response and its dynamic changes were performed
using static and time-resolved transmission spectrophotometry, respectively (cf. Fig. 2). In static mode,
sample 2 exhibits two distinct bands at λ = 650 and 850 nm, which is very much similar to reports of
GNR suspension with similarly high aspect ratio. These correspond to the oscillation of the free
electrons along (longitudinal; low energy) and perpendicular to (transverse; high energy) the long axis
of the rods.28-30
By contrast, sample 1 exhibits a single broad absorption dip at λ = 540 nm with a
shoulder at longer wavelengths, indicating the presence of a second absorption peak nearby. The optical
response of sample 1 differs from most other reports of absorption by GNR suspensions with an aspect
ratio of ~3 and above, because of the presence of only a single absorption band.
Upon shearing sample 1, we observe an instantaneous spectral shift, consisting in splitting of the
absorption bands into two distinct peaks. The low-energy peak undergoes a significant red shift up to λ
= 690 nm (see video of dynamic spectral and color changes in ESI), while the high energy peak is blue
shifted to λ = 540 nm. The spectrum of sample 1 is more familiar when it is sheared, because of the
separation of the two absorption bands. When shearing is stopped, the spectrum slowly reverts back to

6
its original state via an exponential decay with a characteristic time scale of ~440 seconds, becoming
indistinguishable from the initial spectrum of the sample after ~30 minutes. Sample 2 does not exhibit
any visible spectral changes when subjected to mechanical shearing, in agreement with optical
observations.
To explain the differences between the optical properties of samples 1 and 2 in static mode, we
first note that the mean size, aspect ratio and size distribution of GNRs are identical in both samples as
these were prepared from the same batch of GNRs; thermogravimetric measurements (see ESI) also
show that the core-to-canopy ratio is the same in both samples. Differences in the degree of clustering
and interaction between GNRs are therefore the only plausible explanation for these observations.
Localized surface plasmon resonance interactions between GNRs have been described by the plasmon
hybridization model, an electromagnetic analogue to the molecular orbital theory, whereby interactions
between the nanoparticles give rise to different energy levels and change the spectroscopic properties of
the nanocomposite.8, 34
Coupling of the GNR longitudinal modes leads to bonding (attractive) and
antibonding (repulsive) interactions when dimers are respectively arranged side-by-side or end-to-end,33,
35, 36 resulting in a decrease (red shift) or increase (blue shift) of the energy of the absorption band.
In the case of sample 1, close-packed clusters of GNRs typically contain a mixture of side-by-side
and end-to-end arrangements. The former tend to be more common; e.g., GNRs experience twice as
many side-by-side interactions than end-to-end ones in a hexagonal arrangement. It is not surprising
then to find the longitudinal band of sample 1 to be blue shifted relative to sample 2.
Upon shearing sample 1, the longitudinal band undergoes an important red shift. This behavior is
absent in sample 2, clearly pointing to interparticle interactions in the GNR clusters as the main cause.
For further insight, we have performed time-resolved SAXS measurements in transmission mode on
sample 1 in the relaxed and sheared states (figure 3). SAXS images clearly reveal a uniform ring in the
relaxed state, which corresponds to the first correlation peak and confirms the isotropy of the sample.
Upon shearing (left to right), we observe the loss of lateral correlation along the direction of shearing as
indicated by the ring becoming partial. The azimuthal intensity plot reveals an increase (decrease) of

7
scattering intensity in the in-plane direction perpendicular (parallel) to shearing. Comparison between
the relaxed and sheared states of the sample in terms of the radial position of the correlation ring and its
azimuthal intensity profile leads to four key observations: (1) the intensity of the correlation decreases
in the direction parallel to shearing; (2) the intensity of the correlation increases in the direction normal
to shearing; (3) the radial position of the ring does not appear to change; and (4) the total scattering
intensity of the sample remains unchanged.
These observations demonstrate that shearing leads to a net change in the orientation of GNR
clusters, whereby the long axis of GNRs becomes parallel to the direction of shearing. However, this
occurs without a noticeable change in the size of the clusters or in the mean side-by-side interparticle
spacing. In Figure 3, we also show cross-polarized microscopy images of sample 1 during shearing.
Here, a dark image indicates an isotropic sample with randomly oriented GNRs and GNR clusters; a
bright image reveals an optically – and by extension a structurally – anisotropic material. All samples
are dark before shearing and only sample 1 changes color to bright red during shearing. The sample
returns to its initial state after shearing (not shown). The color change observed in cross-polarized
microscopy during shearing is consistent with the increased transmittance in the red part of the
spectrum; it proves that the macroscopic color of the sample and its spectral changes are somehow
related to the anisotropic alignment of the GNRs along the direction of mechanical shearing.
However, these results do not directly explain the red shift in the position of the longitudinal peak.
In fact, Perez-Juste et al. have previously shown that aligning isolated GNRs in a polymer matrix does
not result in a shift of the spectral position of the longitudinal peak, only in a change in its intensity.19
Instead, evidence points decisively toward GNR clustering as the cause of differences between samples
1 and 2. Indeed, clustering makes the optical properties of sample 1 hypersensitive to small changes in
the localized surface plasmon resonance, especially due to perturbations to interparticle interactions.
This may be the key reason for (i) spectral differences between samples 1 and 2 in the static mode and
(ii) to the sensitivity of sample 1 to shearing. The shearing-induced rotation and alignment of the
anisotropic GNR clusters along the direction of shearing – as seen by SAXS measurements – can cause

8
relative sliding of GNRs, as well as stretching and/or compression along the long axis (end-to-end
bonds) – which are not easy to detect by SAXS measurements. These have been shown to dramatically
influence the LSPR interactions,8 and may be playing a key role in dictating changes in the optical
properties of sample 1. Further insight into the mechanisms responsible for the color change will require
additional experiments and computer simulations which are beyond the scope of this report.
In summary, we have successfully synthesized for the first time a new class of functional GNR
nanocomposites, which combine flow behavior with the well-known surface plasmon resonance
properties of GNRs. The new nanocomposite fluids are synthesized by a layer-by-layer deposition of
sulfonated polystyrene on CTAB GNRs followed by neutralization using an amine terminated
oligomeric ethylene glycol. The response of the plasmonic solventless fluid can be tuned by engineering
the interparticle interactions via assembly of GNRs within the fluid. The unique liquid-like properties of
the nanocomposite allows it to flow at room temperature and make it responsive to external stimuli,
such as mechanical shearing. The plasmonic response is fully reversible and is due to the formation of
large GNR clusters in the nanocomposite fluid. This new class of material might pave new applications
in plasmonics, micro/nanofluidics, sensing, and biology,
Acknowledgements
We would like to acknowledge Prof. Lynden Archer for helpful discussions. This work was made
possible by Award No. KUS-C1-018-02 made by King Abdullah University of Science and Technology
(KAUST). We acknowledge use of facilities at the Cornell Center for Materials Research, a National
Science Foundation Materials Research Science and Engineering Center (NSF DMR-0520404), and the
Cornell High Energy Synchrotron Source, also supported by the National Science Foundation and NIH-
NIGMS (NSF DMR-0225180).

9
Figures and Legends
Scheme 1. Synthesis of a gold nanorod-based solventless fluid by step-wise surface modification. Inset
shows an image of the sample after freeze-drying.
Figure 1. TEM and SAXS data of samples 1 (left) & 2 (right). Scale bar = 500 nm. Top right insets
show enlarged views of the GNRs. Scale bar = 200 nm. Overlays show the corresponding transmission
SAXS spectra.
Figure 2. Dynamic spectral changes observed in the relaxed state and while shearing samples 1 (top-
left) & 2 (bottom-left). Inset shows time-evolution of the integrated transmittance (660 nm ≤ λ ≤ 750
nm) from the moment immediately before shearing, until the sample is returns to its relaxed state.
Images shown on top-right and bottom-right represent non-polarized optical microscopy snapshots
taken in the relaxed and sheared states of samples 1 & 2 respectively. Videos showing the dynamic
changes of transmission spectrum and color upon shearing are shown in ESI.
Figure 3. SAXS images of the sample 1 in the relaxed state (A) and while shearing (B). SAXS data
showing the variation of intensity along the azimuthal angle before and during shearing (bottom left).
Cross polarization image of sample 1 taken while shearing (bottom right) and after relaxing (Inset).

10
Notes and References
1. L. C. Palmer and S. I. Stupp, Acc. Chem. Res., 2008, 41, 1674-1684.
2. M. A. El-Sayed, Acc. Chem. Res., 2001, 34, 257-264.
3. C. Burda, X. B. Chen, R. Narayanan and M. A. El-Sayed, Chem. Rev., 2005, 105, 1025-1102.
4. M. C. Daniel and D. Astruc, Chem. Rev., 2004, 104, 293-346.
5. K. L. Kelly, E. Coronado, L. L. Zhao and G. C. Schatz, J. Phys. Chem. B, 2003, 107, 668-677.
6. Y. N. Xia and N. J. Halas, MRS Bull., 2005, 30, 338-344.
7. M. B. Mohamed, V. Volkov, S. Link and M. A. El-Sayed, Chem. Phys. Lett., 2000, 317, 517-
523.
8. A. M. Funston, C. Novo, T. J. Davis and P. Mulvaney, Nano Lett., 2009, 9, 1651-1658.
9. G. A. Wurtz, W. Dickson, D. O'Connor, R. Atkinson, W. Hendren, P. Evans, R. Pollard and A.
V. Zayats, Opt. Express, 2008, 16, 7460-7470.
10. Z. H. Sun, W. H. Ni, Z. Yang, X. S. Kou, L. Li and J. F. Wang, Small, 2008, 4, 1287-1292.
11. W. S. Chang, L. S. Slaughter, B. P. Khanal, P. Manna, E. R. Zubarev and S. Link, Nano Lett.,
2009, 9, 1152-1157.
12. Z. H. Nie, D. Fava, E. Kumacheva, S. Zou, G. C. Walker and M. Rubinstein, Nat. Mater., 2007,
6, 609-614.
13. H. Nakashima, K. Furukawa, Y. Kashimura and K. Torimitsu, Chem. Commun., 2007, 1080-
1082.
14. K. K. Caswell, J. N. Wilson, U. H. F. Bunz and C. J. Murphy, J. Am. Chem. Soc., 2003, 125,
13914-13915.
15. X. G. Hu, W. L. Cheng, T. Wang, Y. L. Wang, E. K. Wang and S. J. Dong, J. Phys. Chem. B,
2005, 109, 19385-19389.

11
16. R. A. Tripp, R. A. Dluhy and Y. P. Zhao, Nano Today, 2008, 3, 31-37.
17. P. N. Sisco, C. G. Wilson, E. Mironova, S. C. Baxter, C. J. Murphy and E. C. Goldsmith, Nano
Lett., 2008, 8, 3409-3412.
18. T. S. Hauck, T. L. Jennings, T. Yatsenko, J. C. Kumaradas and W. C. W. Chan, Adv. Mater.,
2008, 20, 3832-3838.
19. J. Perez-Juste, B. Rodriguez-Gonzalez, P. Mulvaney and L. M. Liz-Marzan, Adv. Func. Mater.,
2005, 15, 1065-1071.
20. A. B. Bourlinos, E. P. Giannelis, Q. Zhang, L. A. Archer, G. Floudas and G. Fytas, Eur. Phys. J.
E, 2006, 20, 109-117.
21. A. B. Bourlinos, A. Stassinopoulos, D. Anglos, R. Herrera, S. H. Anastasiadis, D. Petridis and E.
P. Giannelis, Small, 2006, 2, 513-516.
22. A. B. Bourlinos, V. Georgakilas, V. Tzitzios, N. Boukos, R. Herrera and E. R. Giannelis, Small,
2006, 2, 1188-1191.
23. A. B. Bourlinos, R. Herrera, N. Chalkias, D. D. Jiang, Q. Zhang, L. A. Archer and E. P.
Giannelis, Adv. Mater., 2005, 17, 234-237.
24. R. Rodriguez, R. Herrera, L. A. Archer and E. P. Giannelis, Adv. Mater., 2008, 20, 4353-4358.
25. A. A. Voevodin, R. A. Vaia, S. T. Patton, S. Diamanti, M. Pender, M. Yoonessi, J. Brubaker, J.
J. Hu, J. H. Sanders, B. S. Phillips and R. I. MacCuspie, Small, 2007, 3, 1957-1963.
26. S. T. Patton, A. A. Voevodin, R. A. Vaia, M. Pender, S. J. Dianianti and B. Phillips, J.
Microelectromech. Sys., 2008, 17, 741-746.
27. Q. Dai, J. Coutts, J. H. Zou and Q. Huo, Chem. Commun., 2008, 2858-2860.
28. M. B. Mohamed, K. Z. Ismail, S. Link and M. A. El-Sayed, J. Phys. Chem. B, 1998, 102, 9370-
9374.
29. Y. Y. Yu, S. S. Chang, C. L. Lee and C. R. C. Wang, J. Phys. Chem. B, 1997, 101, 6661-6664.
30. G. C. Papavassiliou, Prog. Solid State Chem., 1979, 12, 185-271.

12
31. C. Sonnichsen, B. M. Reinhard, J. Liphardt and A. P. Alivisatos, Nat. Biotechnol., 2005, 23,
741-745.
32. B. M. Reinhard, S. Sheikholeslami, A. Mastroianni, A. P. Alivisatos and J. Liphardt, PNAS,
2007, 104, 2667-2672.
33. B. M. Reinhard, M. Siu, H. Agarwal, A. P. Alivisatos and J. Liphardt, Nano Lett., 2005, 5, 2246-
2252.
34. S. Eustis and M. El-Sayed, J. Phys. Chem. B, 2005, 109, 16350-16356.
35. E. Prodan, C. Radloff, N. J. Halas and P. Nordlander, Science, 2003, 302, 419-422.
36. P. Nordlander, C. Oubre, E. Prodan, K. Li and M. I. Stockman, Nano Lett., 2004, 4, 899-903.
Scheme 1
13

Figure 1
14
15
Figure 2

Figure 3
16

17
Supplementary Information
Solventless Gold Nanorods with Unique Optical Properties
(A) Thermogravimetric analysis (TGA) data for samples 1 & 2. (B) Video of dynamic color changes
observed while shearing sample 1. (C) Video of dynamic spectral changes observed while shearing
sample 1. (The video ‘color change - 5x optical microscope.avi’ of the dynamic color change observed
on a non-polarized optical microscope and the video ‘spectral change.avi’ is not included in the
manuscript and has been sent to the editorial office as separate attachments.)
TGA data of sample 1.
TGA data of sample 2.
0
20
40
60
80
100
Weig
ht (%
)
0 100 200 300 400 500 600
Temperature (°C) Universal V4.5A TA Instruments
0
20
40
60
80
100
We
igh
t (%
)
0 100 200 300 400 500 600
Temperature (°C) Universal V4.5A TA Instruments

18
Rela
xed
Sh
eare
d
400 500 600 700 8000.2
0.4
0.6
R e l a x e d
S h e a r e d
Wavelength (nm)
Tra
ns
mit
tan
ce
TOC graphic use only
Copyright © 2022 FDOKUMEN