PNEUMATIC TESTING OF EXISTING SUB-SLAB PROBES ...
535
3250 Bloor Street West, Suite 600 Toronto, Ontario M8X 2X9 PH: 416.637.0784 www.geosyntec.com Geosyntec Tech Memo Pneumatic Testing and Field Screening Technical Memorandum Date: 22 March 2016 To: John McGahren, Morgan, Lewis & Bocklus LLP Copies to: Rachel Vocaire, Sherwin Williams From: Todd McAlary, Geosyntec Subject: Pneumatic Testing of Existing Sub-Slab Probes (SSPs) at 2-4 Foster Avenue and 3 US Avenue, Gibbsboro, NJ Geosyntec Project: TR0641 This technical memorandum (Tech Memo) was prepared by Geosyntec Consultants, Inc. (Geosyntec) for review and approval by Region 2 of the United States Environmental Protection Agency (EPA), at the request of Morgan, Lewis & Bocklus LLP on behalf of Sherwin-Williams. This Tech Memo describes the planned scope and methods of pneumatic testing and field screening of sub-slab probes (SSPs) at 2-4 Foster Avenue and 3 US Avenue, which are located at the Former Manufacturing Plant (FMP) area of the Sherwin-Williams/Hilliard’s Creek Superfund Site (Site ID NJD980417976) in Gibbsboro, New Jersey. The data collected under this Work Plan will be used to estimate the pneumatic permeability and distribution of sub- surface vapors, which will be used to make a go/no go decision regarding a pilot-scale testing program for a sub-slab ventilation (SSV) system. The monitoring will include static pressure, flow and vacuum, oxygen, carbon dioxide, methane and total ionizable VOCs. A Health and Safety Plan (HASP) is provided in Appendix A using the devices described in the paragraphs below (See Appendix B for field meter specifications). Curricula Vitae describing team member’s experience and qualifications for Geosyntec team members are provided in Appendix C along with a Statement of Qualifications for vapor intrusion services in Appendix D. SCOPE The planned scope of work includes: 1. Test the seals on existing EPA SSPs. A water dam (ring sealed to floor around probe with water added to about 1 cm above floor level) will be used to test the seals. If the water drains or if bubbles are observed, the seal will be deemed to be
-
Upload
khangminh22 -
Category
Documents
-
view
0 -
download
0
Transcript of PNEUMATIC TESTING OF EXISTING SUB-SLAB PROBES ...

3250 Bloor Street West, Suite 600 Toronto, Ontario M8X 2X9
PH: 416.637.0784 www.geosyntec.com
Geosyntec Tech Memo Pneumatic Testing and Field Screening
Techn ica l Memorandum
Date: 22 March 2016
To: John McGahren, Morgan, Lewis & Bocklus LLP
Copies to: Rachel Vocaire, Sherwin Williams
From: Todd McAlary, Geosyntec
Subject: Pneumatic Testing of Existing Sub-Slab Probes (SSPs) at 2-4 Foster Avenue and 3 US Avenue, Gibbsboro, NJ Geosyntec Project: TR0641
This technical memorandum (Tech Memo) was prepared by Geosyntec Consultants, Inc. (Geosyntec) for review and approval by Region 2 of the United States Environmental Protection Agency (EPA), at the request of Morgan, Lewis & Bocklus LLP on behalf of Sherwin-Williams. This Tech Memo describes the planned scope and methods of pneumatic testing and field screening of sub-slab probes (SSPs) at 2-4 Foster Avenue and 3 US Avenue, which are located at the Former Manufacturing Plant (FMP) area of the Sherwin-Williams/Hilliard’s Creek Superfund Site (Site ID NJD980417976) in Gibbsboro, New Jersey. The data collected under this Work Plan will be used to estimate the pneumatic permeability and distribution of sub-surface vapors, which will be used to make a go/no go decision regarding a pilot-scale testing program for a sub-slab ventilation (SSV) system. The monitoring will include static pressure, flow and vacuum, oxygen, carbon dioxide, methane and total ionizable VOCs. A Health and Safety Plan (HASP) is provided in Appendix A using the devices described in the paragraphs below (See Appendix B for field meter specifications). Curricula Vitae describing team member’s experience and qualifications for Geosyntec team members are provided in Appendix C along with a Statement of Qualifications for vapor intrusion services in Appendix D.
SCOPE
The planned scope of work includes:
1. Test the seals on existing EPA SSPs. A water dam (ring sealed to floor around probe with water added to about 1 cm above floor level) will be used to test the seals. If the water drains or if bubbles are observed, the seal will be deemed to be

21 March 2016 Page 2
Geosyntec Tech Memo Pneumatic Testing and Field Screening
leaking and a new probe will be installed using a hammer drill with wet drilling methods and a Vapor Pin at a distance of about 3 feet from the existing probes.
2. Measure the static vacuum or pressure at each SSP.
3. Measure the sustainable flow and corresponding applied vacuum in each of the existing SSPs;
4. Fill a Tedlar bag with the gas removed during the pneumatic testing for field screening of methane, oxygen, carbon dioxide and ionizable volatile organic compounds (VOCs) below the floor slab;
5. Monitor cross-slab pressure differential over time (preferably one calendar week following the flow and vacuum testing) in one location in each building to assess the ambient range and variability in the potential driving force for vapor intrusion; and,
6. Document the findings in a report to EPA.
METHODS
Testing of existing sub-slab probes will be completed using the water dam method. The water dam consists of a cylinder (e.g., a 2-inch diameter polyvinylchloride (PVC) coupling) sealed to the floor using “Dap Blue Stick™” reusable adhesive putty. The region inside the cylinder will be partially-filled with water (1 to 2 cm height of water above the floor slab is sufficient). If the seal is not effective, the water will drain; therefore, visual inspection of the water level is sufficient to verify the integrity of the seal. Two leak tests will be completed:
• Prior to removal of the sub-slab probe cap the water dam will be placed around the top cap of the probe and filled with water. The level of water in the cap will be visually observed for at least one minute to evaluate the integrity of the existing seal. If the water level remains constant the probe will be tested a second time as described below. If the seal integrity fails, a new probe will be installed.
• The second test will consist of removing the water and water dam and removing the cap of the existing probe. Monitoring tubing will be firmly threaded into the probe, a water dam will be employed during flow and vacuum testing to ensure that the seal is air tight,

21 March 2016 Page 3
Geosyntec Tech Memo Pneumatic Testing and Field Screening
by visual observation of the level of water in the water dam. If the seal integrity fails, a new probe will be installed before proceeding with the flow and vacuum testing.
A TEC DG-700 digital micromanometer meter (or similar) will be used to measure static pressure or vacuum in the sub-slab probes.
Flow and vacuum measurements will be performed by drawing soil gas from the probe using a vacuum chamber. The flow rate from the probe will be controlled at levels of 100, 200 and 300 mL/min using a Dwyer rotameter and the corresponding steady vacuum levels will be measured by a Magnehelic vacuum gauge.
A Tedlar bag and vacuum chamber will be used to collect a 1L gas sample and a GEM 2000 plus landfill gas meter (LGM) will be used to measure oxygen, carbon dioxide, methane and hydrogen sulfide (H2S)and a field-calibrated TVA-1000B combined flame ionization detector (FID) and photoionization detector (PID) equipped with a 10.6 eV lamp will be used to measure total VOCs.
In selected locations (one per building, centrally located) the TEC DG-700 digital micromanometer will be left to record the cross-slab pressure differential for a period of about a week. Locations will be selected based on instantaneous pressure observed during probe sampling and the results of flow and vacuum testing. During the building pressure monitoring, it is important that the HVAC system run as normally operated so that the survey is representative of typical operating conditions.
The FID/PID and GEM 2000 Plus field screening devices will be calibrated in accordance with manufacturers specifications as provided in Appendix B. The FID/PID will be calibrated on-site daily prior to field activities and an end of day calibration check will be completed and recorded. The GEM 2000 plus will be calibrated by the rental agency prior to shipment to the site.
DATA ANALYSIS
The static pressure measurements will be used to assess the cross-slab pressure gradient at each point. This may indicate areas of highest methane production (greatest pressure) if the flow and vacuum measurements are all similar and none of the probes leak.
21 March 2016 Page 4
Geosyntec Tech Memo Pneumatic Testing and Field Screening
Flow and vacuum data will be used to calculate the spatial distribution of gas permeability below the floor. If the sub-slab material all has a low or very low permeability, SSV pilot scale testing may be deferred pending consideration of other alternatives.
The methane, oxygen and carbon dioxide data will be used to select locations for respirometry testing and SSV pilot testing.
The long term (one week) building pressure monitoring data will provide cross-slab pressure data that will allow for the assessment of the overall impact of changes in weather and HVAC operation on building pressurization.
REPORTING AND SCHEDULE
Based upon current access agreements with tenants, the proposed scope of work is anticipated to occur after normal business hours (potentially during night-time hours) and weekends. It is anticipated that 2-3 days of effort is required to complete the scope of work. Once Geosyntec received authorization we will work with Sherwin Williams to schedule work with the building tenants and notify the EPA of planned dates.
Geosyntec will prepare a data summary report suitable for submission to EPA within ten (10) business days of completion of the collection of site data. The data summary report will include recommendations whether to proceed with respirometry and SSV pilot testing.
* * * * *
TR0641 March 2016
APPENDIX A
Health and Safety Plan
Sherwin Williams Gibbsboro HASP Revised EPA comment.docx Revised March 22 2016
Morgan, Lewis & Bocklus LLP
502 Carnegie Center
Princeton, NJ 08540-6241
HEALTH AND SAFETY PLAN
FORMER SHERWIN WILLIAMS MANUFACTURING FACILITY PILOT TESTING OF SUB-SLAB
VENTILATION Gibbsboro, New Jersey
Prepared by
130 Stone Road West
Guelph, Ontario N1G 3Z2
Project Number: TR0641
March 2016
Sherwin Williams Gibbsboro HASP Revised EPA comment.docx ii
TABLE OF CONTENTS H&S Incident Response Procedures ………………………………………………….. iv Route to Hospital ……………………………………………………………………… v Route to Urgent Care ………………………………………………………………….. vi Site Map ……………………………………………………………………………….vii 1. KEY Site Specific Hazards and Mitigating Items .................................................... 1 2. EMERGENCY RESPONSE PROCEDURES .......................................................... 3 3. EMERGENCY RESPONSE CONTACT INFORMATION .................................... 4 4. SIGNATURES .......................................................................................................... 5
4.1 Preparers and Reviewers ............................................................................... 5
4.2 Site Workers .................................................................................................. 6
5. DISCLAIMER .......................................................................................................... 7 6. HASP AMENDMENTS ........................................................................................... 7 7. SITE DESCRIPTION AND SCOPE OF WORK ..................................................... 8
7.1 Task Descriptions: ......................................................................................... 9
8. EXPECTED HAZARDS ........................................................................................ 14 8.1 Physical Hazards ......................................................................................... 14
8.2 Biological Hazards ...................................................................................... 14
8.3 Chemical Hazards ........................................................................................ 14
9. GENERAL SAFE WORK PRACTICES ............................................................... 16 10. CONTROLLED WORK ZONES ........................................................................... 18
10.1 Soil Gas Sampling ....................................................................................... 18
10.2 Drilling Through Floor Slab ........................................................................ 20
10.3 Site Access .................................................................................................. 21
10.4 Visitors ........................................................................................................ 21
10.5 Safe Work Practices .................................................................................... 21
10.6 Inspections ................................................................................................... 21
11. PERSONAL PROTECTIVE EQUIPMENT .......................................................... 22 12. WORKER TRAINING ........................................................................................... 22
12.1 Tailgate Meetings and HASP Review ......................................................... 22
13. EMERGENCY PREPAREDNESS AND RESPONSE .......................................... 23 14. CONFINED SPACE ENTRY ................................................................................. 25 15. SPILL CONTAINMENT ........................................................................................ 26 16. CHEMICAL HAZARD COMMUNICATION LABELING ................................. 26

Sherwin Williams Gibbsboro HASP Revised EPA comment.docx iii
LIST OF TABLES Table 1: Applicable Methane Breathing Zone Action Levels Table 2: Key Personnel and Health Safety Responsibilities Table 3: Training Completion Dates
LIST OF APPENDICES Appendix A: HASP Amendments Appendix B: Health and Safety Inspection Checklist Appendix C: Personal Protective Equipment Per Task Appendix D: Safety Data Sheets Appendix E: HS118 Confined Space Entry Program
Sherwin Williams Gibbsboro HASP Revised EPA comment.docx iv

Sherwin Williams Gibbsboro HASP Revised EPA comment.docx v
ROUTE TO HOSPITAL
COOPER UNIVERSITY HOSPITAL 856-342-2000 1 Cooper Plaza, Camden, NJ 08103
Written Directions to Hospital from Site:
1. Depart Foster Ave toward E Clementon Rd / CR-686 – 0.1 mi
2. Turn right onto E Clementon Rd / CR-686 – 0.5 mi
3. Road name changes to Centennial Blvd – 1.6 mi
4. Turn right onto Kresson Rd / CR-671 – 1.3 mi
5. Arrive at Main St – 105 ft
Approximate Distance: 2.2 mi
Approximate Travel Time: 7 minutes
HOSPITAL
SITE

Sherwin Williams Gibbsboro HASP Revised EPA comment.docx vi
ROUTE TO URGENT CARE FACILITY
VIRTUA EXPRESS URGENT CARE CENTER 856-247-7230 158 NJ-73, Voorhees Township, NJ 08043
Written Directions to Urgent Care Facility from Site:
1. Depart Foster Ave toward E Clementon Rd /CR-686 – 0.1 mi
2. Turn right onto E Clementon Rd / CR-686 – 0.5 mi
3. Road name changes to Centennial Blvd – 1.1 mi
4. Turn right onto Cooper Rd / CR-675 – 2.1 mi
5. Turn left onto Lakeside Ave – 0.3 mi
6. Turn left onto RT-73 N – 0.5 mi
7. Arrive at RT-73 N (If you reach William Feather Dry, you've gone too far)
Approximate Distance: 4.6 miles, Approximate Travel Time: 12 minutes
SITE
URGENT CARE
Sherwin Williams Gibbsboro HASP Revised EPA comment.docx vii
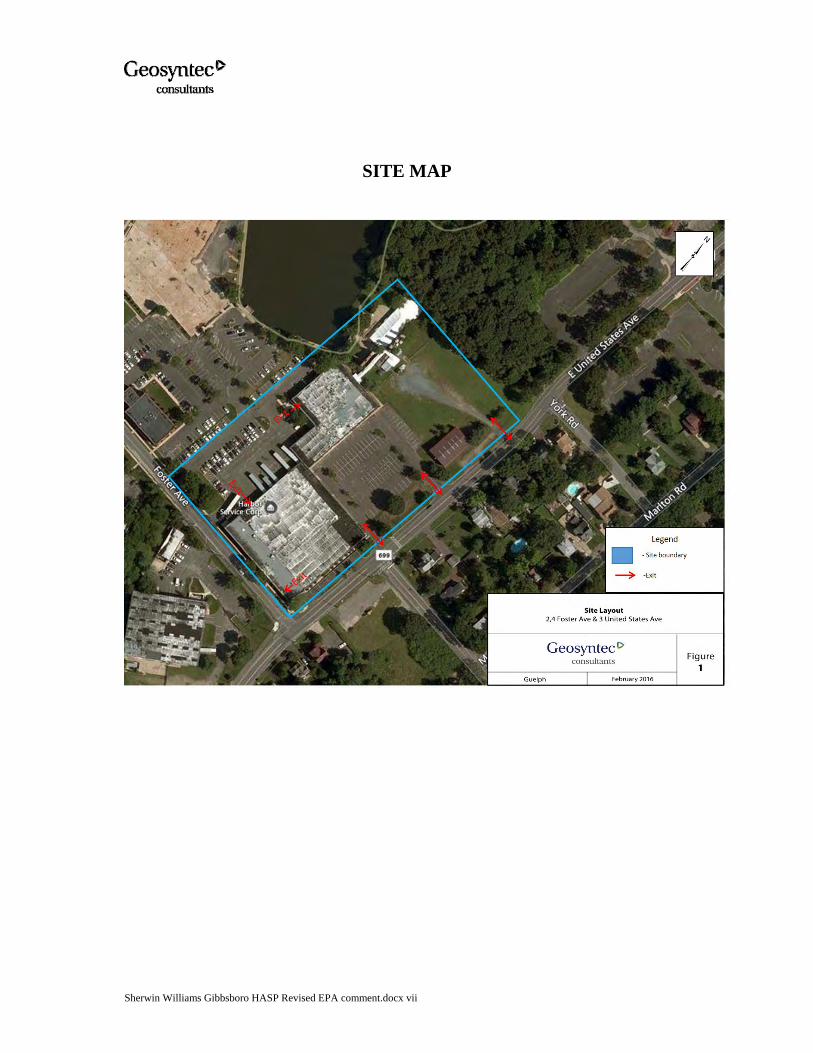
SITE MAP

Sherwin Williams Gibbsboro HASP Revised EPA comment.docx 1
1. KEY SITE SPECIFIC HAZARDS AND MITIGATING ITEMS
Sub-slab contains elevated concentrations of methane.
Exclusion zone (as detailed in Section 10) must be setup around sampling location or drilling location.
A high rate of ventilation is required prior to opening existing probes, drilling new probes or coring SSV Pilot Test holes. Ventilation will continue throughout the conduct of the work. Venting will be done using a large box fan to blow air across the working area. In addition, existing warehouse ventilation fans may be used to supplement ventilation as required. If any methane concentrations are measured above 0.5% v/v in the work zone, a gas removal system will be added to discharge gas from the workspace to the outdoors through the nearest accessible external door, which will be powered by an explosion-proof Obar fan.
Wet drilling methods will be used for all drilling and coring to suppress sparks. Coring will be done using a diamond bit coring machine which uses water to cool the bit and the water flow rate will be set to maintain a head of water visible above the floor. Drilling will be done using a water dam around the penetration point with a head of water at least 1 cm above the floor level and the bit will be raised and lowered regularly to allow water to flow down to the working face. If the powdered concrete drill cuttings soak up the water, additional water will be added before continuing with the drilling.
During drilling and coring activities a second watch person will be on standby with a CO2 fire extinguisher in the unlikely event of any ignition. CO2 will extinguish any flame by removing the oxidant (O2).
Air monitoring will be completed using a GEM2000 Plus™ or similar direct reading instrument to monitor breathing zone concentrations and working face concentrations on a regular basis during work activities.

Sherwin Williams Gibbsboro HASP Revised EPA comment.docx 2
All slab penetrations will be sealed as quickly as practical when not
actively sampling to prevent vapors from entering indoor air.
All on-site staff that will participate in soil gas sampling or slab penetration activities will have completed HAZWOPER 40-hour training and applicable 8-Hour refresher courses (additional training details are provided in Section 12).

Sherwin Williams Gibbsboro HASP Revised EPA comment.docx 3
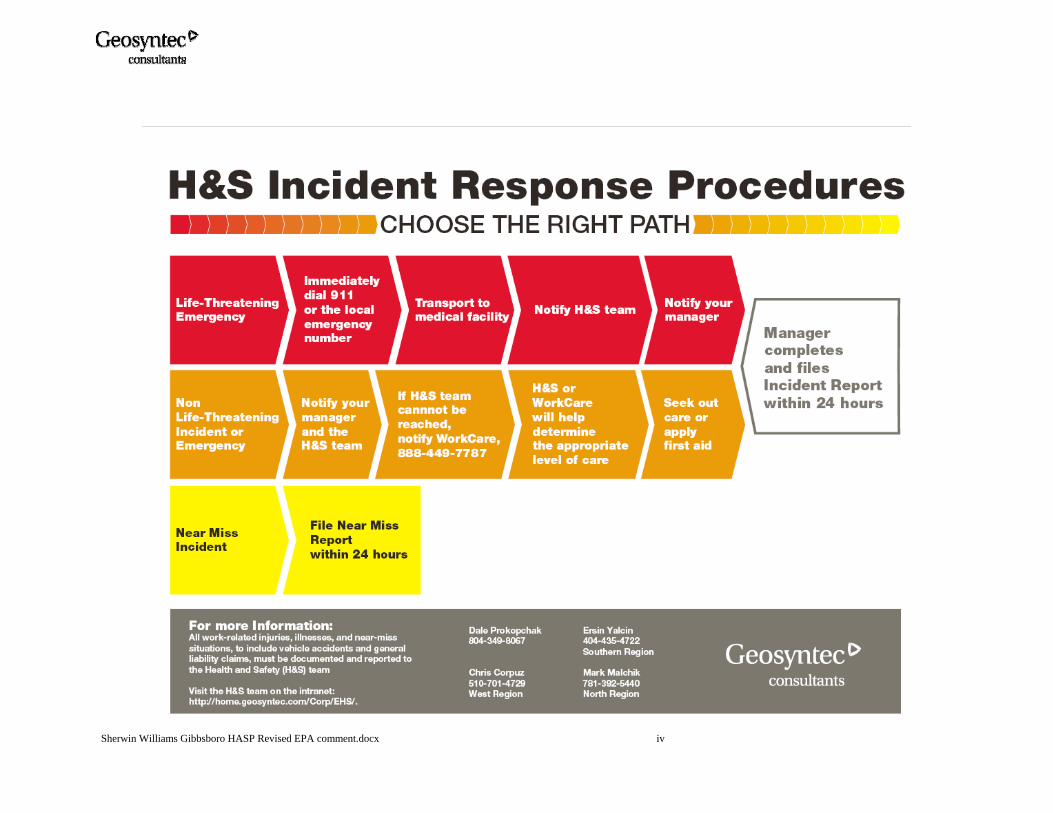
2. EMERGENCY RESPONSE PROCEDURES
The Site Health and Safety Officer (SHSO), or designated alternate, should be immediately notified via the on-site communication system. The SHSO assumes control of the emergency response.
If applicable, the SHSO must immediately notify off-site emergency
responders (i.e., fire department, hospital, police department, etc.) and must inform the response team of the nature and location of the emergency on site.
If applicable, the SHSO calls for evacuation of the site. Site workers
should move to their respective refuge stations using the evacuation routes provided on the Site Map (Figure 2).
Any small flames should be extinguished using the CO2 fire
extinguisher, if safe to do so. In the unlikely event of fire that cannot be readily extinguished, call the Gibbsboro Fire Co. at 131 Hilliards Road, Gibbsboro, NJ 08026, United States (+1 856-435-9626), sound the fire alarm and evacuate the building.
If a worker is injured, the procedures presented in “Instructions for
Injury Response”, located in the front of this HASP, must be implemented immediately.
After an incident has stabilized, the procedures presented in
“Instructions for Incident Reporting”, located in the front of this HASP, must be followed.
Sherwin Williams Gibbsboro HASP Revised EPA comment.docx 4
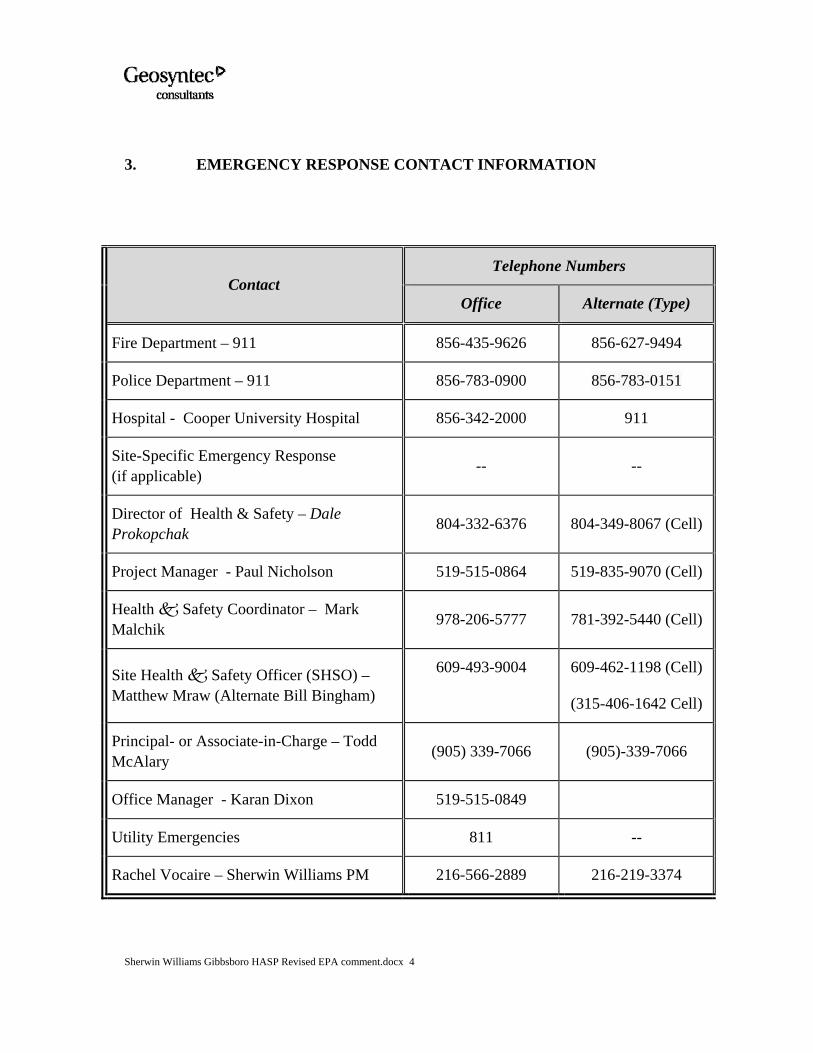
3. EMERGENCY RESPONSE CONTACT INFORMATION
Contact Telephone Numbers
Office Alternate (Type)
Fire Department – 911 856-435-9626 856-627-9494
Police Department – 911 856-783-0900 856-783-0151
Hospital - Cooper University Hospital 856-342-2000 911
Site-Specific Emergency Response (if applicable)
-- --
Director of Health & Safety – Dale Prokopchak
804-332-6376 804-349-8067 (Cell)
Project Manager - Paul Nicholson 519-515-0864 519-835-9070 (Cell)
Health Safety Coordinator – Mark Malchik 978-206-5777 781-392-5440 (Cell)
Site Health Safety Officer (SHSO) – Matthew Mraw (Alternate Bill Bingham)
609-493-9004
609-462-1198 (Cell)
(315-406-1642 Cell)
Principal- or Associate-in-Charge – Todd McAlary (905) 339-7066 (905)-339-7066
Office Manager - Karan Dixon 519-515-0849
Utility Emergencies 811 --
Rachel Vocaire – Sherwin Williams PM 216-566-2889 216-219-3374
Sherwin Williams Gibbsboro HASP Revised EPA comment.docx 5
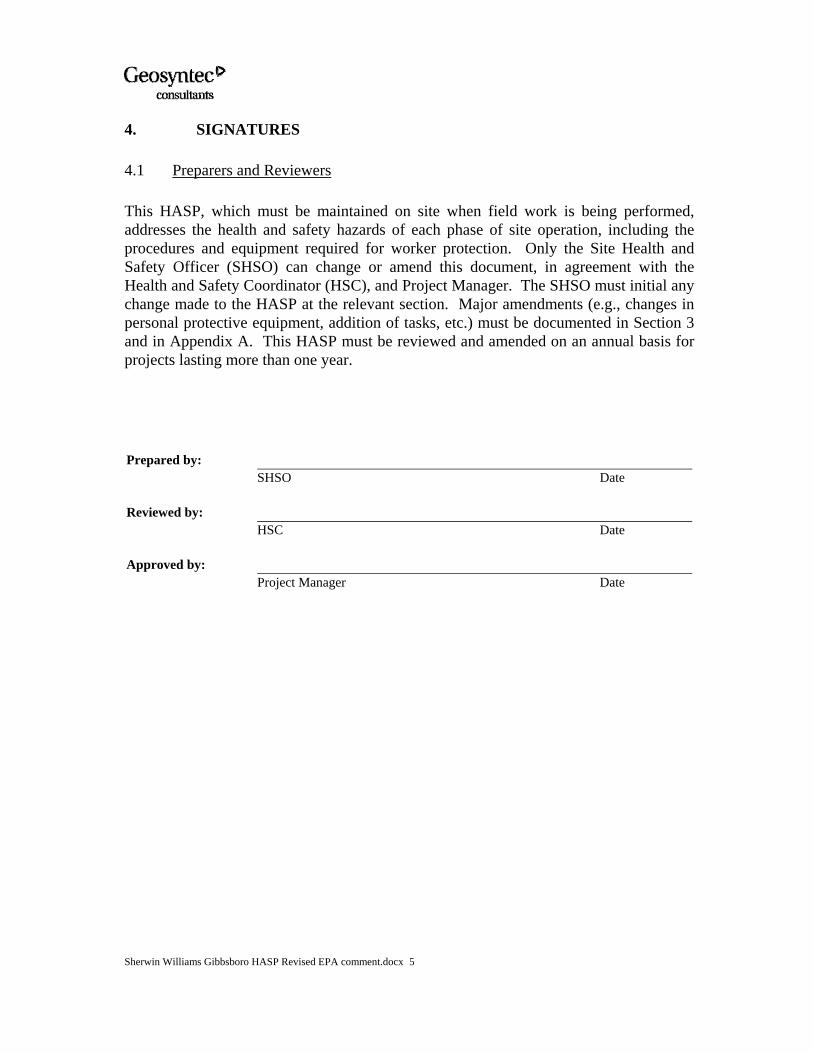
4. SIGNATURES 4.1 Preparers and Reviewers This HASP, which must be maintained on site when field work is being performed, addresses the health and safety hazards of each phase of site operation, including the procedures and equipment required for worker protection. Only the Site Health and Safety Officer (SHSO) can change or amend this document, in agreement with the Health and Safety Coordinator (HSC), and Project Manager. The SHSO must initial any change made to the HASP at the relevant section. Major amendments (e.g., changes in personal protective equipment, addition of tasks, etc.) must be documented in Section 3 and in Appendix A. This HASP must be reviewed and amended on an annual basis for projects lasting more than one year.
Prepared by:
Reviewed by:
SHSO
Date
Approved by:
HSC
Date
Project Manager Date
Sherwin Williams Gibbsboro HASP Revised EPA comment.docx 6
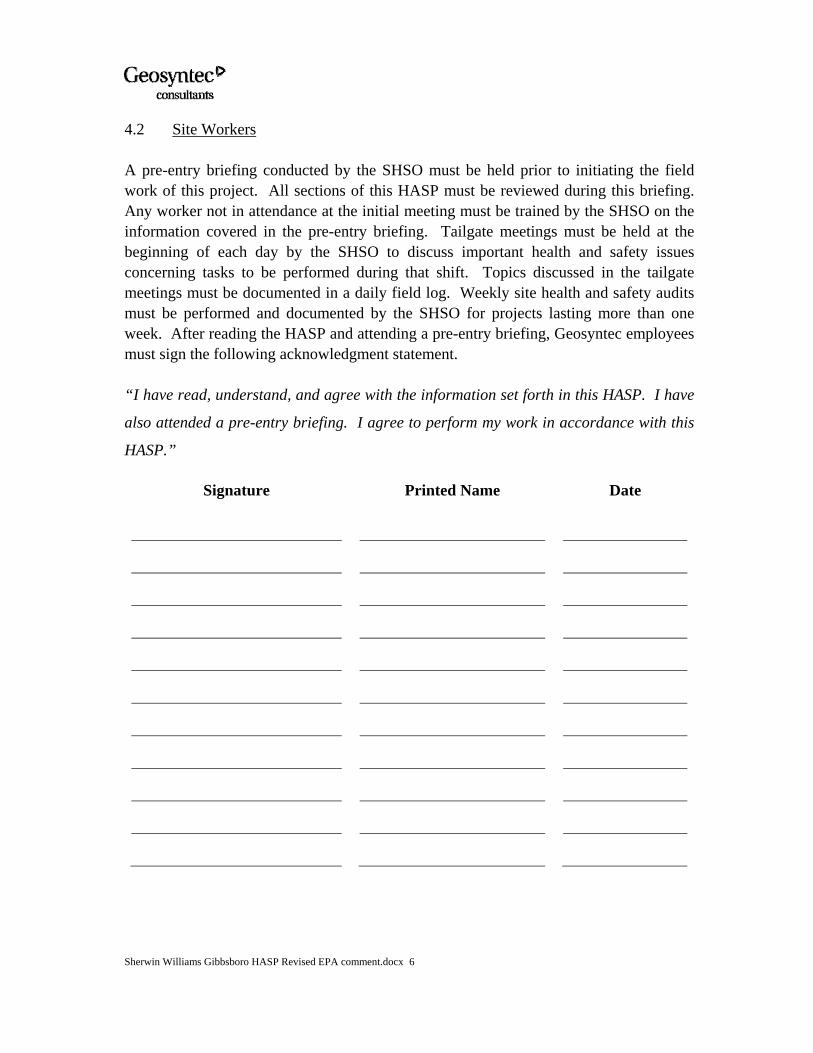
4.2 Site Workers A pre-entry briefing conducted by the SHSO must be held prior to initiating the field work of this project. All sections of this HASP must be reviewed during this briefing. Any worker not in attendance at the initial meeting must be trained by the SHSO on the information covered in the pre-entry briefing. Tailgate meetings must be held at the beginning of each day by the SHSO to discuss important health and safety issues concerning tasks to be performed during that shift. Topics discussed in the tailgate meetings must be documented in a daily field log. Weekly site health and safety audits must be performed and documented by the SHSO for projects lasting more than one week. After reading the HASP and attending a pre-entry briefing, Geosyntec employees must sign the following acknowledgment statement. “I have read, understand, and agree with the information set forth in this HASP. I have
also attended a pre-entry briefing. I agree to perform my work in accordance with this
HASP.”
Signature Printed Name Date

Sherwin Williams Gibbsboro HASP Revised EPA comment.docx 7
5. DISCLAIMER This HASP was prepared in accordance with Geosyntec Consultants’ Health and Safety Procedures for use by Geosyntec project staff. This plan complies with Geosyntec internal review procedures. Geosyntec does not endorse the use of this HASP by others. This document and its contents should not be used by firms other than Geosyntec or by persons other than Geosyntec employees without a thorough peer review by their health and safety managers. Should the work outlined in this HASP be executed by contractors other than Geosyntec, the HASP should be modified and reviewed to comply with such company’s corporate health and safety procedures. In the event that a contractor other than Geosyntec executes this work, the contractor should complete independent analyses of hazards and mitigation measures, and should update all HASP tables, text, figures, and appendices prior to commencing work. Geosyntec assumes no responsibility for the accuracy, content, or health and safety of non-Geosyntec personnel during the implementation of the work in this HASP by other parties. 6. HASP AMENDMENTS Over the course of this project, it is possible that the project-specific details and working conditions will change. This HASP shall be reviewed and amended as necessary to effectively describe the changing working conditions and to mitigate the potential health and safety issues that may arise during the project. Amendments to the HASP should be briefly described in the following spaces provided. The full text of the amendments should be provided in Appendix A. AMENDMENT 1: Date: __________ Project Manager: ____________ HSC: ___________________ Brief description of amendment: ______________________________________________________________________________________________________________________________________________
AMENDMENT 2: Date: __________ Project Manager: ____________ HSC: ___________________ Brief description of amendment: ______________________________________________________________________________________________________________________________________________
Sherwin Williams Gibbsboro HASP Revised EPA comment.docx 8
7. SITE DESCRIPTION AND SCOPE OF WORK The following is a brief description of the site, including information as to the location, approximate size, previous usage, and current usage. A description of the tasks to be performed is also presented.
• Site Location: 2-4 Foster Avenue, Gibbsboro, New Jersey
• Approximate Size of Site: 52,000 ft2
• Previous Site Usage: Former Manufacturing Plant
• Current Site Usage: Tenant offices
• Description of Surrounding Property/Population:
North Residential neighborhoods East Commercial properties
South Residential neighborhoods West Commercial properties
• Summary of previous site investigations (if available/applicable):
Previous sampling of the sub-slab soil vapor at the structures revealed the presence of weathered mineral spirits in the subsurface at the FMP area. Mineral spirits are a highly refined form of paint thinner for oil-based paints and contain a mixture of petroleum hydrocarbons. Petroleum hydrocarbons are readily degradable by soil micro-organisms either in the presence of oxygen (which produces carbon dioxide, CO2) or absence of oxygen (which produces methane, CH4). The USEPA has installed and sampled a series of sub-slab monitoring probes at the subject buildings and identified elevated methane and suppressed oxygen levels below the floor (USEPA 2015). Methane gas is produced during the anaerobic degradation of petroleum hydrocarbons. Methane could pose a risk of explosion if the concentration is within the range of 5 to 15% by volume, oxygen is present at sufficient levels and there is an ignition source or spark. Elevated concentrations of chlorinated compounds have also been detected below the building slabs in certain locations. An SSV system would increase the rate of oxygen migration through the sub-surface below the building, which would allow aerobic microbes to degrade the methane and would suppress future methane production
Sherwin Williams Gibbsboro HASP Revised EPA comment.docx 9
7.1 Task Descriptions:
IMPORTANT – READ THIS FIRST: For all tasks involving any opening across the floor slab (opening existing sub-slab probes, drilling or coring the floor etc.), a large fan will be used to create a high rate of air flow past the working area, to maximize the dilution of any methane that may flow up into the building from the subsurface. An Obar explosion proof fan will also be used to discharge air from the working space to the outdoors if any methane concentrations above 0.5% v/v are detected above the floor slab. All drilling or coring will be done using wet methods to minimize any sparks. The wet method will involve maintaining a head of water at the cutting surface. For coring, this is routine. For hammer-drilling, put a water dam around the drill-hole and maintain a head of at least 1 cm (~0.5-inch) of water inside the dam. Field monitoring of methane in the working area must be conducted regularly in close proximity to any opening in the floor and additional dilution or sealing of the floor will be performed to maintain methane levels < 0.5% (10-fold below the lower explosive limit).
Task 1: Site Reconnaissance
The testing program will begin with a building walk-through with Geosyntec and appropriate personnel from the facility, in sufficient time prior to SSV testing that testlocations can be checked for buried utilities, examine possible pathways including sumps, floor drains, perimeter drains and cracks in the slab. The survey will be necessary to identifyand mark out SSV extraction points and nearby communication test points (CTP). Geosyntecwill collect a photographic log of marked locations and distance measurements between sample points and distinct building features to aid in relocating sample points in the eventthat markings are removed before test-holes are completed. If utilities are expected in theimmediate vicinity of a proposed sample point, an alternative neighboring location will be assigned. Geosyntec will retain contractors to clear areas for utilities before drilling or coringthrough the concrete. The Site survey will include a brief meeting with the maintenancesupervisor of the building to confirm the current building ventilation system design andoperation in the areas where pilot testing will be conducted, including an estimate of thecurrent air exchange rate and information on any seasonal changes in heating, ventilating andair conditioning (HVAC) schedules.
Hazards for this task include; slip, trip, falls, use a of fixed ladder to reach the roof, walk through at an active warehousing facility, and elevated methane levels below facility foundation and possible elevated indoor levels. Control measures for these hazards include; pay close attention to foot placement, do not talk on the phone and walk at the same
Sherwin Williams Gibbsboro HASP Revised EPA comment.docx 10
time, keep walking paths clear of debris or equipment. Ladder safety measures include,ensure three points of contact at all times and maintain awareness of surrounding individualsand objects. Walk through safety includes continued awareness of surroundings andoperational machinery in working areas, and use of routine PPE in facility including but notlimited to (as required by tenant spaces) steel toe boots and safety glasses.
Task 2: Existing Sub-Slab Probe Monitoring and Respirometry Testing
The existing probes will be used to monitor static pressure, flow and vacuum, oxygen, carbon dioxide, methane and total ionizable VOCs using the devices described in theparagraphs below. A water dam will be employed during testing to ensure that the seal is airtight. The water dam consists of a cylinder (e.g., a 2-inch diameter PVC coupling) sealed to the floor using “Dap Blue Stick™” reusable adhesive putty. The region inside the cylinder ispartially-filled with water (1 to 2 cm height of water above the floor slab is sufficient) prior to opening the probe and again during sampling or monitoring activities. If the seal is noteffective, the water will drain; therefore, visual inspection of the water level is sufficient toverify the integrity of the seal.
A TEC DG-700 digital micromanometer meter (or similar)will be used to measurestatic pressure, and in selected locations (one per building, centrally located) the meter willbe left to record the cross-slab pressure differential for a period of about a week. During thebuilding pressure survey it is important that the HVAC system run as normally operated sothat the survey is representative of typical operating conditions.
Flow and vacuum measurements will be performed by drawing soil gas from theprobe using a vacuum chamber. The flow rate from the probe will be controlled at levels of100, 200 and 300 mL/min by a rotameter and the corresponding steady vacuum levels will bemeasured by a Magnehelic vacuum gauge. A Tedlar bag and vacuum chamber will be usedto collect a 1L gas sample and a GEM 2000 plus landfill gas meter (LGM) will be used to measure oxygen, carbon dioxide, methane (% v/v and % LEL) and hydrogen sulfide (H2S) and a field-calibrated TVA-1000B combined flame ionization detector (FID) andphotoionization detector (PID) equipped with a 10.6 ev lamp will be used to measure totalVOCs. One respirometry test will be conducted in each building at the sub-slab probe locations with highest methane concentrations recorded in the initial screening to provide anindication of the rate of oxygen consumption by the biomass below the slab. This is contingent on the flow and vacuum data showing adequate permeability below the floor. Approximately 100 liters (L) of a helium/air mixture will be injected into the subsurfacethrough the sub-slab probe. After approximately 10 minutes, a vacuum chamber will beconnected to the sub-slab probe and a 1L sample will be drawn into a Tedlar bag. The bagwill be screened with at MGD-2002 meter for helium and a GEM 2000 landfill gas meter for
Sherwin Williams Gibbsboro HASP Revised EPA comment.docx 11
oxygen. This will be repeated approximately every 10 minutes until the oxygen concentrationdrops below 5%.
Hazards for this task include: methane may be under pressure below the building and flow up into the workspace when the sub-slab probes are opened, driving and using an unfamiliar vehicle, slip trip falls, hand safety, hand tools and pinch points, compressed cylinders for instrument calibration, dehydration, extension cords, and heavy lifting. Controlmeasures for these hazards include: use a box-fan to blow air at the location of each sub-slab probe before they are opened and until after they are re-sealed in order to provide ample dilution of any methane that may enter the workspace, methane monitoring in breathing zones with MultiRAE multi-gas meter. Inspect vehicle before operation and adjust mirrorsand review route to the Site prior to departing on trip. Use defensive driving techniques whileoperating vehicle. Pay close attention to foot placement, do not talk on the phone and walk at the same time and keep walking paths clear of debris or equipment. Wear work gloves asneeded when using hand tools to prevent risk of pinch points. Disconnect and connectcompressed gas regulars carefully, do not transport compressed cylinders with regulators attached. Keep hydrated by drinking plenty of fluids and use the buddy system to notice signsof heat stress of fellow employees. Inspect extension cords prior to use for any damage toexterior protective wire coating. Do not use any extension cords which appear damaged. Use proper lifting techniques, lift with your legs not your back and all equipment and suppliesover 49 pounds require a two man lift.
Task 3: Sub-Slab Ventilation (SSV) Pilot Test
One SSV Pilot Test Point will be installed in each building, at a central location. At least two temporary communication test points (CTPs) will be installed at different radialdistances from each SSV Pilot Test Point: 1) proximal (about 3 ft) and 2) distal (10 to 30 ft,depending on the results of the initial permeability testing). The sub-slab probes will also be used for vacuum response testing and additional CTPs may be installed at each SSV locationto help evaluate anisotropy in the vacuum field that develops during testing, which would beindicated by vacuum readings recorded during each pilot test. The final locations of theproposed SSV test points will be selected based on owner and occupant preferences and theresults of the testing of the sub-slab probes.
SSV extraction points will be constructed as a 3-inch PVC pipe cemented into a 4-inch diameter cored hole in the concrete slab. The hole will penetrate the floor slab and enterthe underlying granular fill materials. Material below the slab will also be removed by handtools to the largest radius practical and a hand auger will be used to create a hole below theslab that will reach down to the water table to create a sump that extends horizontally andvertically under the slab to provide the maximum amount of gas flow practical. The 3-inch PVC pipe will be set in the drilled hole to the base of the concrete, and sealed to the floor
Sherwin Williams Gibbsboro HASP Revised EPA comment.docx 12
using backer-rod and fast-setting anchor cement, which will be allowed to set (typically lessthan 15 minutes) before sampling. A water dam will be used to verify that the seal between the PVC pipe and the concrete does not leak. A concrete coring contractor will be retained to core the holes in the concrete forthe SSV locations and drill the holes for the CTPs. Prior to drilling activities a licensed geophysical contractor will be retained to clear for subsurface utilities and rebar at each proposed SSV pilot test location and CTP location. An exclusion zone will be setup as described in Section 10, around the floor penetrations area. During drilling activities,methane levels will be monitored with use of a MultiRAE. Water will be added during coring to suppress sparks and mechanical fan will be used during all activities to dilute the concentration of methane above the floor slab. A manifold will be connected to each suction point, which will consist of a sampleport for sample collection, a vacuum gauge for monitoring the applied vacuum and a lengthof 2-inch diameter PVC pipe to provide a linear segment in which to measure the flow rate(Figure ). Samples will be collected with a Tedlar bag and vacuum chamber. Vacuum will bemeasured with Magnehelic gauges. Flow velocity will be measured with a Dwyer Pitot tubeanemometer. PVC pipe will run from the point of suction to the nearest exterior door of the building. Outside the building, the PVC piping will be connected to a bleed valve that will belocated in front of the intake of an explosion-proof OBAR GBR fan (or equivalent). The test will begin with the dilution valve completely open so that there is little to no vacuum being applied to the suction point, which will result in a high level of dilution of the methaneconcentrations (below the lower explosive level of 5% v/v). The exhaust of the fan will becontinuously monitored with the GEM 2000 landfill gas meter (LGM) for methane and the bleed air valve will be kept open to the degree needed to maintain sufficient dilution that themethane concentrations in the exhaust will remain below the LEL. Adjustments to the bleedair valve will change the applied vacuum and flow at the extraction point, which will bemonitored periodically for the duration of each test. Hazards for this task include: Explosion Risk (methane may be under pressure below the building and flow up into the workspace when the sub-slab probes are opened), Drilling Hazards, Powdered Cement, methane monitoring, driving and using an unfamiliarvehicle, slip trip falls, hand safety, hand tools and pinch points, compressed cylinders for instrument calibration, dehydration, extension cords, and heavy lifting. Control measures for these hazards include: use a box-fan to blow air at the location of each sub-slab probe before they are opened and until after they are re-sealed in order to provide ample dilution of any methane that may enter the workspace. A water cooled coring device will be used to drillSSV suction points. Engineering controls will be used to reduce methane levels near drillingpoints. A mechanic fan will be used to dilute concentrations of methane in the vicinity of drilling activities. Monitor methane in breathing zones with MultiRAE multi-gas meter. Inspect vehicles before operation and adjust mirrors and review route to the Site prior to departing on trip. Use defensive driving techniques while operating vehicle. Pay close

Sherwin Williams Gibbsboro HASP Revised EPA comment.docx 13
attention to foot placement, do not talk on the phone and walk at the same time and keepwalking paths clear of debris or equipment. Wear work gloves as needed when using hand tools to prevent risk of pinch points. Disconnect and connect compressed gas regularscarefully, do not transport compressed cylinders with regulators attached. Keep hydrated bydrinking plenty of fluids and use the buddy system to notice signs of heat stress of fellow employees. Inspect extension cords prior to use for any damage to exterior protective wirecoating. Do not use any extension cords which appear damaged. Use proper lifting techniques, lift with your legs (not your back) and all equipment and supplies over 49 pounds require a two man lift.
Sherwin Williams Gibbsboro HASP Revised EPA comment.docx 14
8. EXPECTED HAZARDS 8.1 Physical Hazards The following physical hazards have been identified associated with the work to be performed and the site conditions. Controls for these hazards are provided in the general safe work practices below.
• Methane fires or explosions • Compressed Gases • Electrocution • Eye Injury • Fall Protection • Hand/Foot Injury • Heat Stress • Heavy Equipment • Knives / Blades • Lifting Heavy Loads • Loud Noise/Vibration • Portable Power/Hand Tool • Slips, Trips, and Falls • Utility Protection
8.2 Biological Hazards No biological hazards have been identified associated with the work to be performed and the site conditions. 8.3 Chemical Hazards Previous sampling of the sub-slab soil vapor at the onsite structures revealed the presence of weathered mineral spirits in the subsurface at the former manufacturing plant area. Mineral spirits are a highly refined form of paint thinner for oil-based paints and contain a mixture of petroleum hydrocarbons. Petroleum hydrocarbons are readily degradable by soil micro-organisms either in the presence of oxygen (which produces carbon dioxide, CO2) or absence of oxygen (which produces methane, CH4). The USEPA has installed and sampled a series of sub-slab monitoring probes at the subject buildings and identified elevated methane and suppressed oxygen levels below the floor
Sherwin Williams Gibbsboro HASP Revised EPA comment.docx 15
(USEPA 2015). Methane gas is produced during the anaerobic degradation of petroleum hydrocarbons. Methane could pose a risk of explosion if the concentration is within the range of 5% [Lower Explosive Limit (LEL)] to 15% [Upper Explosive Limit (UEL)] by volume, oxygen is present at sufficient levels and there is an ignition source or spark. Other VOC compounds have been identified in indoor air and the subsurface (such as naphthalene and benzene) but at concentrations below applicable on-site worker permissible exposure levels and are therefore not considered a hazard. Hydrogen sulfide (H2S) has not been detected in indoor air samples collected to date, however data is not available on current sub-slab H2S concentrations. Therefore, H2S will be considered a potential hazard until data can be collected to exclude it. H2S levels will be monitored to ensure workers are not exposed to a concentration greater than 1 ppm in the breathing zone.
Table 1: Applicable Methane Breathing Zone Action Levels Methane (%) Methane (ppmv) % LEL
LEL 5 50,000 100 UEL 15 150,000 300 TLV (NIOSH) 0.1 1,000 2 Exclusion Zone 0.25 2,500 5 Action Level 0.5 5,000 10 Evacuation Level 1.25 12,500 25 In addition to methane, elevated concentrations of both chlorinated and petroleum compounds have been identified below the slab. The following list provides LEL values for these additional compounds.
• Methylcyclohexane – LEL 1.2% (12,000 ppmv) • Heptane – LEL 1.05% (10,500 ppmv) • Benzene – LEL 1.2% (12,000 ppmv)
Air monitoring will be conducted using a GEM2000 Plus or similar direct reading instrument to provide oxygen, methane and H2S concentrations during work activities. The GEM 2000 plus can be equipped with tubing to allow the monitoring of the area directly above the floor penetration during drilling activities (see Section 5). The TVA1000B FID/PID will also be used to screen the indoor air and if readings on either the FID or PID are noted approaching the action level (5,000 ppmv), work will cease and the floor will be resealed and increased ventilation will be provided before work
Sherwin Williams Gibbsboro HASP Revised EPA comment.docx 16
proceeds again. This will provide a margin of safety even if a compound other than methane is present at concentrations approaching the LEL. 9. GENERAL SAFE WORK PRACTICES The following general safe work practices must be adhered to while performing site work:
• An exclusion zone (minimum 15 ft depending on surrounding access) will be setup in an area work area where:
o methane concentrations are greater than 2,500 ppmv or
o an area where the building slab will be penetrated;
• Clearly mark out an extended exclusion zone around the area where work will be conducted; minimum of 15 ft (depending on work space access).
• Post hazard and warning information at all entry points, and communicate all health and safety information and hazards related to methane to personnel on site;
• Use a box-fan (or more than one fan) to blow air at the location of each sub-slab probe or drilling or coring location before they are opened and until after they are re-sealed in order to provide ample dilution of any methane that may enter the workspace. If non-explosion proof box fans are used, then need to be setup on the perimeter of the exclusion zone and pointed at the sub-slab location.
• Use calibrated (GEM 2000 plus, or similar) to monitor methane concentrations from the sub-surface and alert when vapor detection reaches exclusion zone level of 2,500 ppm. Stop work if methane reaches 5,000 ppmv (Action level) which is 0.5% v/v which is 10% of the LEL. At the Action level all work must stop, any penetrations through the floor should be sealed, workers should withdraw from the exclusion zone to the support zone and implement additional engineering controls to increase ventilation rates (See Section 5).
• Work within the exclusion zone will be a spark free environment with continuous air monitoring using a GEM 2000 plus or similar direct reading instrument for methane and H2S;
• Minimize number of field staff in the active work zone;
• No smoking;
• Non-sparking tools required in exclusion zone;
Sherwin Williams Gibbsboro HASP Revised EPA comment.docx 17
• Any piece of instrument/tool/drill bit that may be involved in coring or cutting the concrete floor will be wetted/lubricated to eliminate sparking; wetting of bit must continue throughout drilling or coring procedure to suppress sparking (see Section 9 for detailed procedure);
• No cell phones in exclusion zone;
• Record all air monitoring results during work activities.
• Basic PPE shall be worn, including hard hats, safety glasses, hard-toed boots, and high-visibility vests. Cotton clothing to reduce static charge is required in exclusion zone. If conditions allow, the requirement for hard hats and hard-toed boots may be reduced with approval of the SHSO and Project Manager.
• Minimize contact with impacted materials. Do not place equipment on the ground. Do not sit or kneel on potentially contaminated surfaces.
• Smoking, eating, or drinking after entering the work zone and before personal decontamination is not allowed. Employees who are suspected of being under the influence of illegal drugs or alcohol will be removed from the site. Workers taking prescribed medication that may cause drowsiness shall not operate heavy equipment and are prohibited from performing tasks where Level C or B personal protective equipment is required.
• Practice good housekeeping, be cautious of rough terrain or steep slopes.
• Use of contact lenses is not allowed under certain hazardous working conditions.
• The following conditions must be observed when operating a motor vehicle: o Wearing of seat belts is mandatory o The use of headlights is mandatory during periods of rain, fog, or other
adverse weather or low-light conditions o A backup warning system or use of vehicle horn is mandatory when the
vehicle is engaged in a backward motion o Posted traffic signs and directions from flagmen must be observed o Equipment and/or samples transported in vehicles must be secured from
movement o The use of vehicles acquired by Geosyntec by non-Geosyntec personnel
is prohibited • In an unknown situation, always assume the worst reasonable conditions. • Be observant of your immediate surroundings and the surroundings of others. It
is a team effort to notice and warn of dangerous situations. Withdrawal from a hazardous situation to reassess procedures is the preferred course of action.

Sherwin Williams Gibbsboro HASP Revised EPA comment.docx 18
• Conflicting situations may arise concerning safety requirements and working conditions. These must be addressed and resolved rapidly by the SHSO and PM to relieve motivations or pressures to circumvent established safety policies.
• Unauthorized breaches of specified safety protocol are not allowed. Workers unwilling or unable to comply with established procedures will be asked to leave the work site.
• Knives, cutting tools - Utility/folding/collapsible knives and fixed open-bladed knives/cutting tools are not permitted, unless specifically authorized. Cutting tools with automatically-retracting blades, or with enclosed/guarded blades are permitted.
• Manual hand tools - proper tool for the job, maintain in good condition, use vise/clamp to hold work piece, proper follow through, and stay clear of “line of fire.”
• Inspect tools to ensure safe operating condition before each use and use tool in accordance with manufacturer’s specifications. Ensure guards are in place and no hazardous equipment modifications.
• Store compressed gas cylinders vertically and are secured. Keep safety cap on at all times when gas is not in use.
10. CONTROLLED WORK ZONES APPLIES TO TASK: Not Applicable
The area(s) where work is to be performed shall be called the Work Zone. The boundaries of Work Zone shall be marked using the following methods:
Warning tape Traffic cones Signs Fence Other:
The exclusion zone around the work area will be based on indoor air monitoring of methane, but will be a minimum of 15 ft (depending on work space access) from the sub-slab monitoring point. 10.1 Soil Gas Sampling
• The electric lungbox should not be used if methane concentrations are greater than the exclusion zone level of 2,500 ppmv (one twentieth of the lower explosive limit) as it is not explosion proof; readings should be confirmed prior
Sherwin Williams Gibbsboro HASP Revised EPA comment.docx 19
to operation of the lungbox. An intrinsically safe lungbox will be used for sampling soil gas probes, however it is strongly preferred to maintain engineering controls (fans and ventilation) to maintain levels of methane well below the LEL.
• The sub-slab probe is connected to the sample tubing and a Tedlar bag with an air tight fitting inside the chamber of the lungbox. The intrinsically safe lungbox will then be used to purge soil gas from the probe. During this process a box fan will be used to ventilate the area and methane readings recorded confirm concentrations <0.1 x LEL (0.5% v/v);
• Sampling of soil gas may result in the collection of vapors with elevated methane concentrations into the Tedlar bag. Screening of soil gas contained in Tedlar bag will be completed using field instruments to measure methane concentrations. If methane concentrations are above the LEL, discharge the Tedlar bag contents in front of the face of the box fan to maximize dilution.

Sherwin Williams Gibbsboro HASP Revised EPA comment.docx 20
10.2 Drilling Through Floor Slab
• An exclusion zone will be setup in the work area where building slab will be penetrated (minimum 15 ft) and will be expanded as necessary to include any area where methane concentrations are greater than 2,500 ppmv (based on measured readings);
• A second person will standby with a CO2 fire extinguisher ready to deploy in the unlikely event of an ignition during drilling activities.
• Sub-slab utilities and re-bar will be located by a utility locating service using a magnetometer or ground-penetrating radar or similar prior to drilling activities;
• Box fan ventilation will be implemented in the area; • Spark free drill bits are not available for concrete, therefore a water dam will be
used to suppress sparks and a box fan will be used to create high ventilation rates to reduce potential methane indoor air concentrations.
• If the hole needs to be reamed to a larger diameter, such as during the installation of a sub-slab probe, this reamed section should be completed prior to drilling the smaller diameter hole to penetrate the slab.
• Wet drilling methods will be employed as follows : o A water dam will be setup around the planned drilling location and
sealed to the floor with putty. o 0.5-inch of water will be added to the water dam and drilling will
commence to a depth of about 3 inches. If the water drains from the water dam, add water to maintain 0.5-inches of water in the dam. Stop drilling while water is added.
o Continue this process until the slab is penetrated. o The drill bit should be regularly raised from the drill hole to allow water
to fill the hole since concrete dust twill tend to soak up the water as drilling progresses
• If the box fan is not sufficient to maintain methane concentrations below 0.05 % v/v, a gas extraction system will be setup and operated to vent the work area in addition to the ventilation fan system. The gas extraction system will consist of a PVC conduit connected through segments of rigid pipe and vacuum hose (as needed to accommodate corners) to an explosion proof Obar fan located outside the building to evacuate vapors directly from the area of the floor penetration. Discharge concentrations will be monitored for methane, if vapors are noted at the wellhead during drilling.
• Within a safe distance (2 to 3 cm) from the hammer drill, air immediately above the floor penetration will be monitored for methane concentrations.
• Upon penetration of the slab, the hole will be plugged immediately to prevent the release of sub-surface vapors using a rubber stopper. Ventilation and vapor
Sherwin Williams Gibbsboro HASP Revised EPA comment.docx 21
extraction will continue to operate until the seal is set and confirmed integral with a water dam that does not lose water or bubble.
10.3 Site Access Access to the site must be controlled using the following method:
Sign in/Sign out log Guard Identification badges Check in with SHSO Other: Sherwin Williams Visitor ID Badges are required.
10.4 Visitors Visitors to the site may need to be continually escorted for safety purposes. Geosyntec employees must not be allowed into the Work Zone until they have received the proper personal protective equipment (PPE) and they have read, understand, and meet the requirements outlined in this HASP. Other visitors under Geosyntec’s direction (subcontractors, etc.) may review this HASP for site familiarity, but they are ultimately responsible for their own health and safety (see disclaimer in Section 1). 10.5 Safe Work Practices General Safe Work Practices that must be implemented during work activities at this site are listed in Table 3. 10.6 Inspections For projects with field components lasting longer than one week, the SHSO must conduct periodic health and safety inspections. The inspections must be documented using the Health and Safety Inspection Checklist, presented in Appendix B. The Health and Safety Inspection Checklist records should be kept on file at the project site. The requirement for periodic inspections is:
Not Applicable Applicable and required: During Task 3 field implantation
Weekly Bi-Weekly Monthly

Sherwin Williams Gibbsboro HASP Revised EPA comment.docx 22
11. PERSONAL PROTECTIVE EQUIPMENT The PPE required for each task is presented in Appendix C. Required equipment and types of protective clothing materials, as well as an indication of the initial level of protection to be utilized, are listed. The level of protection for this project is not expected to increase above level D. The level of protection may be upgraded or downgraded by the SHSO according to onsite conditions and after stopping work and reviewing required increases in PPE with the Project Manager or EHS Director. 12. WORKER TRAINING Personnel involved in field activities will have completed HAZWOPER 40-hour training and applicable 8-hour refreshers. Table 3 provides a list of potential field staff and applicable training dates. Table 3: Training Completion Dates
8 Hour OSHA
HAZWOPER Supervisor
8HR OSHA HAZWOPER
Refresher
Driver Safety First Aid /CPR/AED
5/15/1997 3/25/2016 12/15/2011 11/1/2015 4/8/2015 11/1/2013 11/1/2015
1/26/2005 2/18/2016 1/12/2009 10/9/2013 2/12/2015 2/6/2015 3/18/2015
10/30/2015 5/8/2015 3/18/20156/28/2012 5/29/2015 12/13/2011 3/18/2015
3/1/20163/25/2016Lukas GillhamMatthew Mraw 10/28/2011Jared Brisman 5/22/2009
6/12/2012Courtney ThomasPaul Nicholson 11/26/2001Darius Mali 11/15/2013Bill Bingham 6/15/1990
40HR OSHA HAZWOPER
Employee Name
Sherwin Williams Gibbsboro HASP Revised EPA comment.docx 23
12.1 Tailgate Meetings and HASP Review
In addition to meeting training requirements, site personnel will attend a daily tailgate safety meeting where the HASP and building specific evacuation and safety procedures will be reviewed prior to initiating field activities. Tailgate meetings must be held daily prior to starting work to discuss important health and safety issues concerning tasks to be performed during that shift. Non-Geosyntec site workers should also communicate health and safety concerns associated with the tasks they will be performing. Topics discussed in the tailgate meetings must be documented. Tailgate meeting will include the following:
• Understanding the lines of authority regarding health and safety and site personnel roles and responsibilities;
• Methane hazards and applicable mitigation measures based on planned field activities including tools, and equipment;
• Training in the proper use, maintenance, and decon protocol of PPE and Level(s) of Protection;
• Personnel will be informed of means for normal site and emergency communication(s);
• Air monitoring strategies will be discussed to include the frequency/types, action levels, sampling techniques, pre/post calibration techniques;
• Understanding site control measures, work zones, and proper decontamination procedures for personnel/tools/vehicles, etc. to reduce the potential for both on/off site contamination;
• Personnel will be trained to respond quickly and properly in the event of an emergency; and
• Personnel involved in specific hazardous activities, such as confined space entry, sampling or drilling activities will receive specialized training in the appropriate techniques to employ prior to commencing these operations.
13. EMERGENCY PREPAREDNESS AND RESPONSE Sherwin Williams has developed a Methane Monitoring Program Plan for the site to establish interim procedures by which methane is monitored at the Site. As part of this plan, Section 3 provides an Emergency Response Plan for methane at the site. Geosyntec personnel will be provided a copy of the emergency response procedures and section of the Plan are included below. A table presenting a list of contacts and

Sherwin Williams Gibbsboro HASP Revised EPA comment.docx 24
telephone numbers for the applicable local off-site emergency responders is provided inside the front cover of this HASP (after figures). In the event that indoor air methane concentrations exceed 5,000 ppmv at sustained levels in breathing zone above background levels, the exclusion zone area will be evacuated. If possible and safe to do so, any slab penetrations should be plugged and ventilation increased in the exclusion zone. Air monitoring will continue in the safe work area. Upon increased ventilation of the exclusion zone, and confirming that the safe work area remains below the action level, two people will return to measure the methane concentrations in the exclusion zone. One will stand as safety watch; the other will measure methane concentrations. If concentrations have decreased, an event debrief will occur to discuss if engineering controls are sufficient to re-start work. Consistent with the Site Emergency Response Plan, in the event that indoor air concentrations outside of the exclusion zone increase to greater than 5,000 ppmv (10% LEL) at sustained levels in breathing zone above background levels the building Sherwin Williams and the EPA will be contacted immediately. In the event that indoor air concentrations exceed 12,500 ppmv (25% LEL), the building will be evacuated. Evacuation will be directed by the SHSO, or their alternate. Gibbsboro Fire Department will be notified immediately. The current building evacuation plan will be followed by building occupants. The following are building contact numbers (provided by Methane Monitoring Plan – Emergency Response Plan ):
Name Organization Office Cell EPA Contact EPA 732-906-6927 *Patrick Austin WESTON 856-782-4935 Ext 2 917-295-8849 Robert Barone Brandywine 856-533-2837 NA John Szramiak Brandywine NA 609-743-2240 Jim Otten Brandywine NA 609-827-3337 Ron Brozo Harbor Linen 856-435-2000 Ext 4215 NA Local Fire Department Gibbsboro 856-435-9626 Local Police Department Gibbsboro 856-783-0900
All staff must be briefed on the existing building evacuation plan and closest exit points, prior to the start of intrusive work. The following emergency response equipment is required for this project: First Aid Kit Fire Extinguisher (Type ABC)

Sherwin Williams Gibbsboro HASP Revised EPA comment.docx 25
Eyewash bottle Other: In the event of an injury to an employee, the Instructions for Injury Response, located in the front of this HASP, must be implemented immediately. ‘Tear-out’ forms are located after the Instructions for Injury Response. If professional medical attention is required, these forms must be provided to the medical provider at the time the medical attention is administered. Injury reporting is required per the procedures presented on the Instructions for Incident Reporting, also located in the front of this HASP. Note that an emergency does not necessarily include an injury. After the emergency is resolved, post-incident reporting is required per the procedures presented on the Instructions for Incident Reporting, located after the tear-out forms. 14. CONFINED SPACE ENTRY
APPLICABLE NOT APPLICABLE The task(s) for this project involve confined-space entry. Workers must abide by the company’s Confined Space Entry Program (29 CFR § 1910 Subpart J, Standard Number 1910.146.). A crawlspace area is located within the southeast corner of the building and existing sub-slab probes are located in this area. The raised floor is supported by wood framed walls - 2” x 4” studs on 16” centers and several cinder block columns. The floor is approximately 4’ above the original concrete slab. There are no windows located in the space. There are two air handlers located in the space as well as associated ducting. Unsure of fresh air/outside air replenishment in the space. The space is illuminated with fluorescent shop lights. The access hatch is approximately 30” x 30”. Sanitary drain piping is located in the space from two bathrooms located on the raised floor. The dimensions of the space is approximately 125’ x 100’. The area is equipped with permanent methane air monitoring devices. For the purposes of this HASP, this area will be considered a non-permit confined space because of the following reasons:
• Real-time monitoring will be performed using a GEM2000 Plus and a photoionization detector before any entry to verify methane, lack of oxygen or VOCs do not pose a hazardous atmosphere;
• It does not contain a material that has the potential for engulfing an entrant;
Sherwin Williams Gibbsboro HASP Revised EPA comment.docx 26
• It does not have an internal configuration such that an entrant could be trapped and/or asphyxiated by inwardly converging walls or by a floor which slopes downward and tapers to a smaller cross-section;
• It does not contain any other recognized serious safety and/or health hazard. Air monitoring readings must comply with the following levels prior to crawlspace entry:
• Oxygen 19.5 to -23.5% • Carbon Dioxide <0.25% • Methane <0.5% • H2S < 1.5 ppm • FID/PID < 5 ppm
These conditions need to be documented for each entry into the confined space and air monitoring should continue during work in the space. A fan will be used to supplement the ventilation below the floor during periods of occupancy. Any potential hazards that may deplete oxygen content will not be used in the space (i.e. no volatile chemicals, no welding/cutting, etc.). Two personnel will be needed, one entrant and one supporter. Geosyntec’s 118 Confined space entry program (Appendix E) should be followed for confined space identification and entry.
15. SPILL CONTAINMENT
APPLICABLE NOT APPLICABLE This is not applicable to the current site tasks. 16. CHEMICAL HAZARD COMMUNICATION LABELING
APPLICABLE NOT APPLICABLE The following procedures must be followed for chemicals brought onto the site by Geosyntec personnel (i.e., decontamination solution, sampling preservatives, calibration gases, etc.) while performing the tasks of this project:
• Labels on primary chemical containers must not be defaced.
• Chemical containers must be stored in appropriate storage containers.

Sherwin Williams Gibbsboro HASP Revised EPA comment.docx 27
• Secondary containers and storage cabinets must be correctly and clearly labeled using the Hazardous Materials Identification System (HMIS).
• Chemicals incompatible with each other must not be stored together.
• Workers must receive training on the chemical hazards.
• Safety Data Sheets (SDSs) for the chemical must be added to Appendix D.
When chemicals are used on site, workers must abide by Geosyntec’s Hazard Communication Program.
Sherwin Williams Gibbsboro HASP Revised EPA comment.docx 28 3/22/2016
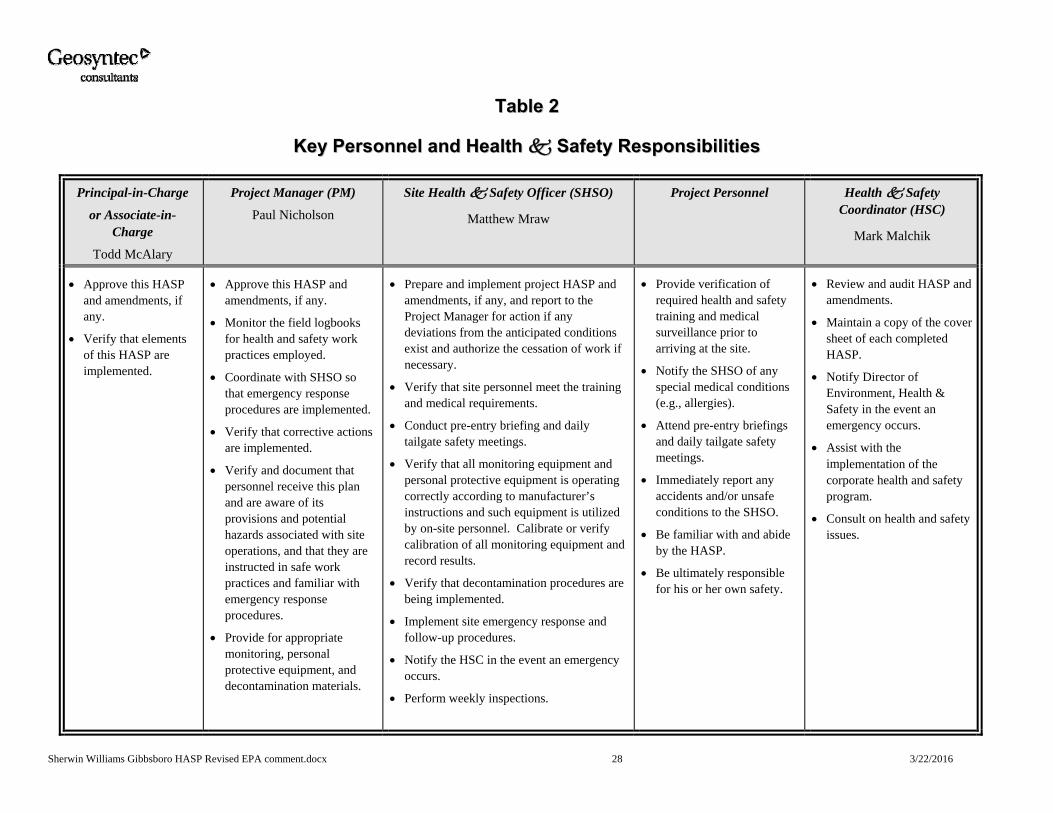
TTaabbllee 22
KKeeyy PPeerrssoonnnneell aanndd HHeeaalltthh SSaaffeettyy RReessppoonnssiibbiilliittiieess
Principal-in-Charge
or Associate-in-Charge
Todd McAlary
Project Manager (PM) Paul Nicholson
Site Health Safety Officer (SHSO)
Matthew Mraw
Project Personnel Health Safety Coordinator (HSC)
Mark Malchik
• Approve this HASP and amendments, if any.
• Verify that elements of this HASP are implemented.
• Approve this HASP and amendments, if any.
• Monitor the field logbooks for health and safety work practices employed.
• Coordinate with SHSO so that emergency response procedures are implemented.
• Verify that corrective actions are implemented.
• Verify and document that personnel receive this plan and are aware of its provisions and potential hazards associated with site operations, and that they are instructed in safe work practices and familiar with emergency response procedures.
• Provide for appropriate monitoring, personal protective equipment, and decontamination materials.
• Prepare and implement project HASP and amendments, if any, and report to the Project Manager for action if any deviations from the anticipated conditions exist and authorize the cessation of work if necessary.
• Verify that site personnel meet the training and medical requirements.
• Conduct pre-entry briefing and daily tailgate safety meetings.
• Verify that all monitoring equipment and personal protective equipment is operating correctly according to manufacturer’s instructions and such equipment is utilized by on-site personnel. Calibrate or verify calibration of all monitoring equipment and record results.
• Verify that decontamination procedures are being implemented.
• Implement site emergency response and follow-up procedures.
• Notify the HSC in the event an emergency occurs.
• Perform weekly inspections.
• Provide verification of required health and safety training and medical surveillance prior to arriving at the site.
• Notify the SHSO of any special medical conditions (e.g., allergies).
• Attend pre-entry briefings and daily tailgate safety meetings.
• Immediately report any accidents and/or unsafe conditions to the SHSO.
• Be familiar with and abide by the HASP.
• Be ultimately responsible for his or her own safety.
• Review and audit HASP and amendments.
• Maintain a copy of the cover sheet of each completed HASP.
• Notify Director of Environment, Health & Safety in the event an emergency occurs.
• Assist with the implementation of the corporate health and safety program.
• Consult on health and safety issues.

Appendix B 3/22/2016
Appendix A HASP Amendments
Discuss details of amendments to this HASP here. Include amendment number, date, and details of amendments.
______________________________________________________________________________
______________________________________________________________________________
______________________________________________________________________________
______________________________________________________________________________
______________________________________________________________________________
______________________________________________________________________________
______________________________________________________________________________
______________________________________________________________________________
______________________________________________________________________________
______________________________________________________________________________
______________________________________________________________________________
______________________________________________________________________________
______________________________________________________________________________
______________________________________________________________________________
______________________________________________________________________________
______________________________________________________________________________
______________________________________________________________________________
______________________________________________________________________________
______________________________________________________________________________
______________________________________________________________________________
______________________________________________________________________________
______________________________________________________________________________
______________________________________________________________________________
______________________________________________________________________________
______________________________________________________________________________
Appendix B 3/22/2016
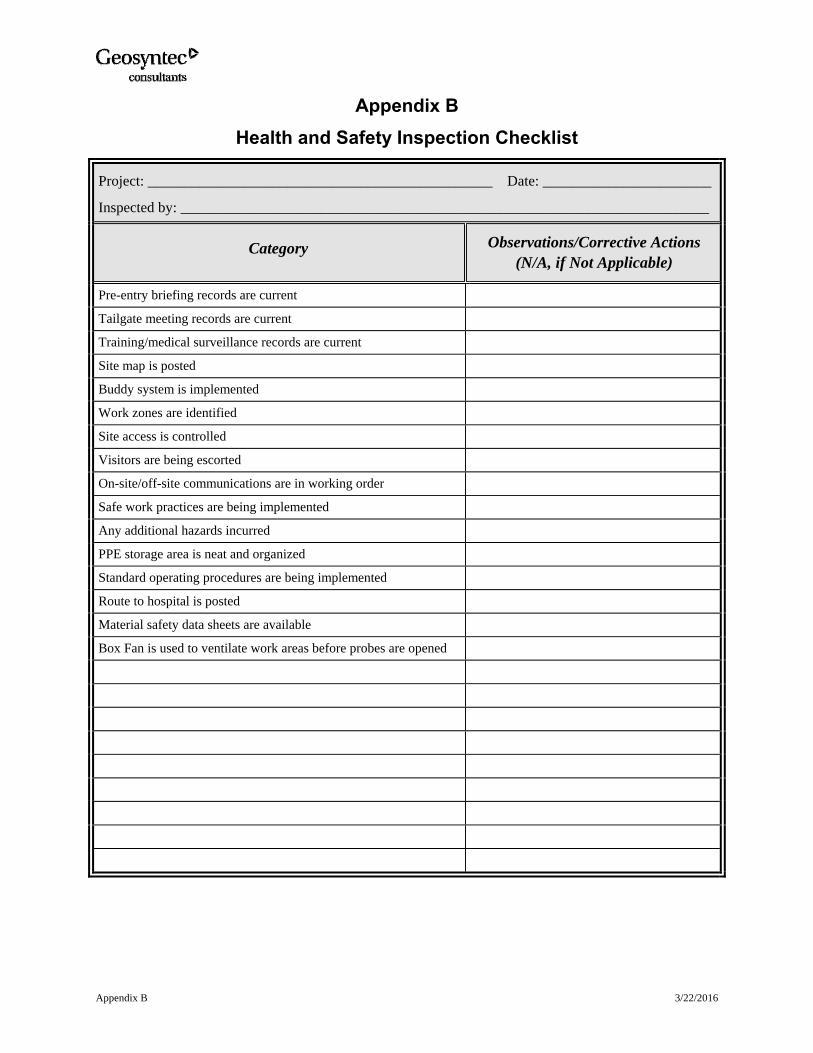
Appendix B Health and Safety Inspection Checklist
Project: _______________________________________________ Date: _______________________
Inspected by: ________________________________________________________________________
Category Observations/Corrective Actions (N/A, if Not Applicable)
Pre-entry briefing records are current
Tailgate meeting records are current
Training/medical surveillance records are current
Site map is posted
Buddy system is implemented
Work zones are identified
Site access is controlled
Visitors are being escorted
On-site/off-site communications are in working order
Safe work practices are being implemented
Any additional hazards incurred
PPE storage area is neat and organized
Standard operating procedures are being implemented
Route to hospital is posted
Material safety data sheets are available
Box Fan is used to ventilate work areas before probes are opened
Appendix C
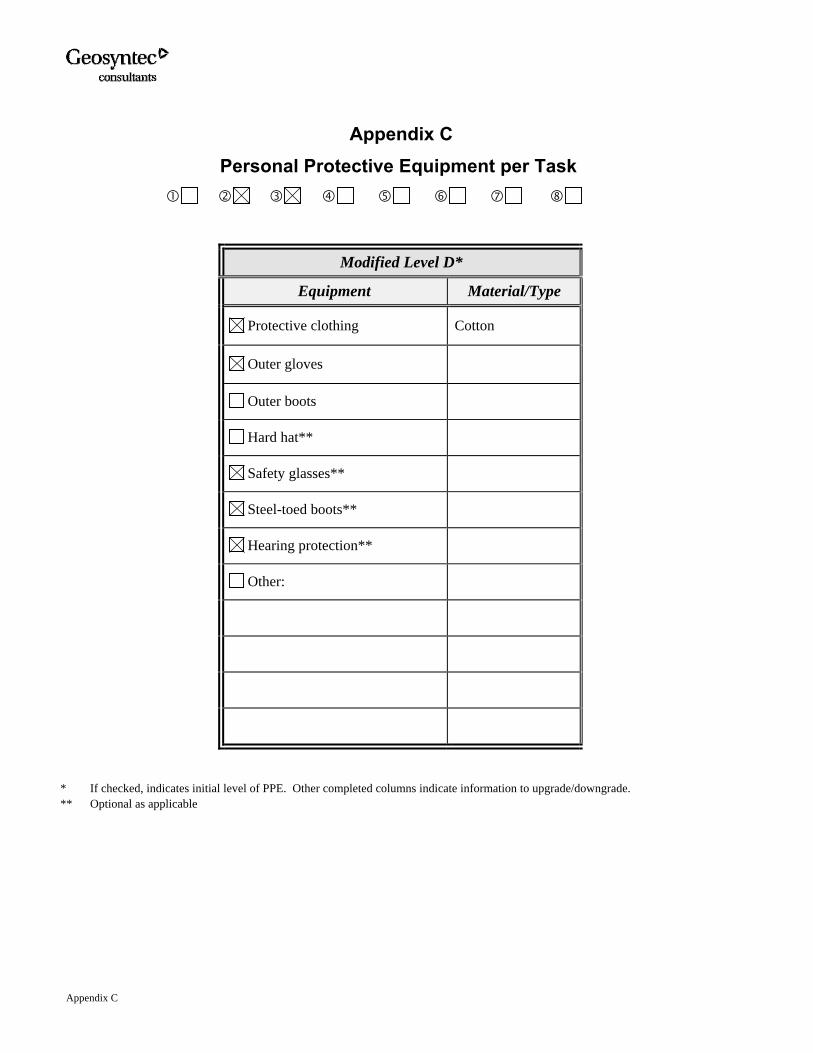
Appendix C Personal Protective Equipment per Task
Modified Level D*
Equipment Material/Type
Protective clothing Cotton
Outer gloves
Outer boots
Hard hat**
Safety glasses**
Steel-toed boots**
Hearing protection**
Other:
* If checked, indicates initial level of PPE. Other completed columns indicate information to upgrade/downgrade. ** Optional as applicable

Appendix E
Appendix D Safety Data Sheets
Included in HASP Chemical
Acetone
Alconox
Ammonia
Bentonite
Diesel Fuel Oil No. 2-D
Gasoline
n-Hexane
Hydrochloric Acid
Hydrogen
Isopropyl Alcohol
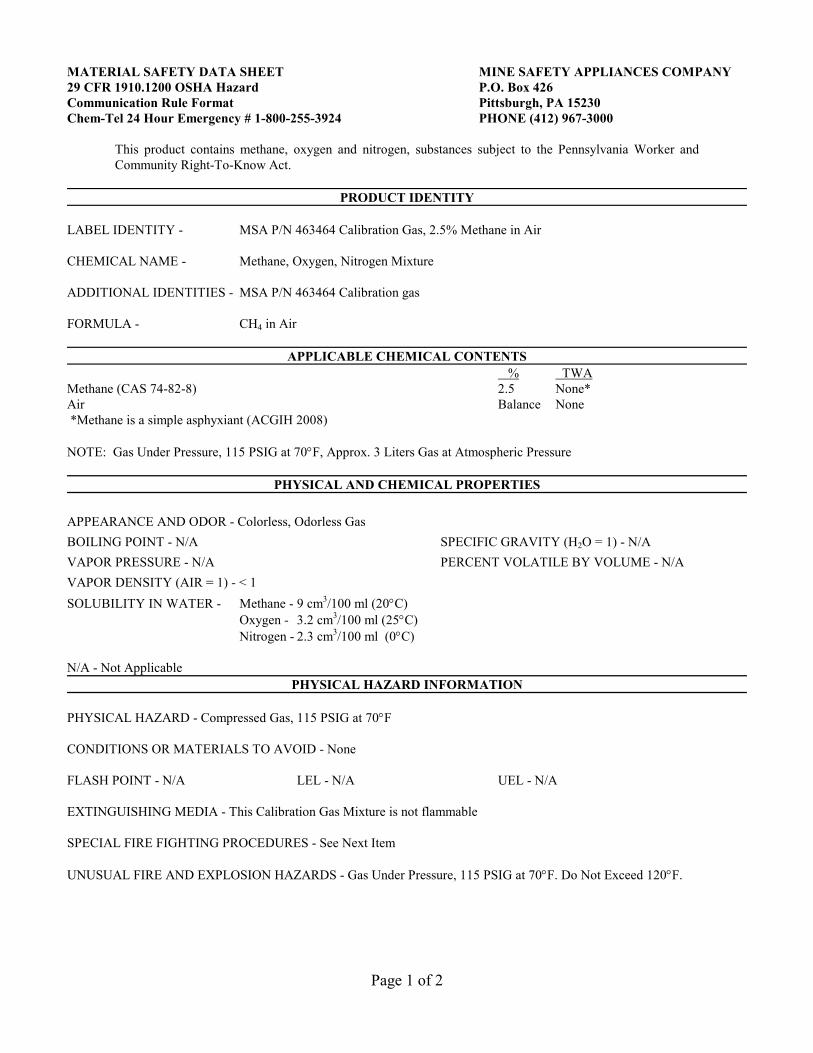
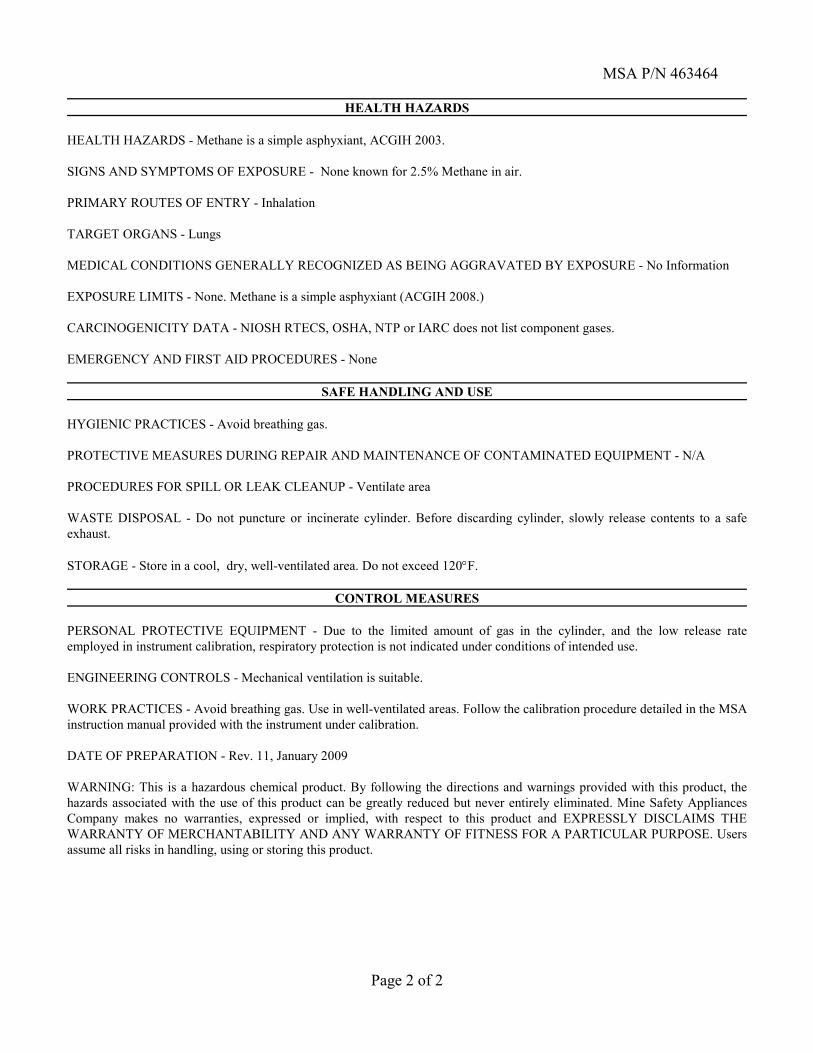
Methane Calibration Gas
Portland Cement
Other: Isobutylene Calibration Gas
Other: Helium Gas
Other:
Other:
Other:
Other:
Page 1 of 2
MATERIAL SAFETY DATA SHEET MINE SAFETY APPLIANCES COMPANY
29 CFR 1910.1200 OSHA Hazard P.O. Box 426
Communication Rule Format Pittsburgh, PA 15230
Chem-Tel 24 Hour Emergency # 1-800-255-3924 PHONE (412) 967-3000
This product contains methane, oxygen and nitrogen, substances subject to the Pennsylvania Worker and
Community Right-To-Know Act.
PRODUCT IDENTITY
LABEL IDENTITY - MSA P/N 463464 Calibration Gas, 2.5% Methane in Air
CHEMICAL NAME - Methane, Oxygen, Nitrogen Mixture
ADDITIONAL IDENTITIES - MSA P/N 463464 Calibration gas
FORMULA - CH4 in Air
APPLICABLE CHEMICAL CONTENTS
% TWA
Methane (CAS 74-82-8) 2.5 None*
Air Balance None
*Methane is a simple asphyxiant (ACGIH 2008)
NOTE: Gas Under Pressure, 115 PSIG at 70°F, Approx. 3 Liters Gas at Atmospheric Pressure PHYSICAL AND CHEMICAL PROPERTIES
APPEARANCE AND ODOR - Colorless, Odorless Gas
BOILING POINT - N/A SPECIFIC GRAVITY (H2O = 1) - N/A
VAPOR PRESSURE - N/A PERCENT VOLATILE BY VOLUME - N/A
VAPOR DENSITY (AIR = 1) - < 1
SOLUBILITY IN WATER - Methane - 9 cm3/100 ml (20°C)
Oxygen - 3.2 cm3/100 ml (25°C)
Nitrogen - 2.3 cm3/100 ml (0°C)
N/A - Not Applicable PHYSICAL HAZARD INFORMATION
PHYSICAL HAZARD - Compressed Gas, 115 PSIG at 70°F
CONDITIONS OR MATERIALS TO AVOID - None
FLASH POINT - N/A LEL - N/A UEL - N/A
EXTINGUISHING MEDIA - This Calibration Gas Mixture is not flammable
SPECIAL FIRE FIGHTING PROCEDURES - See Next Item
UNUSUAL FIRE AND EXPLOSION HAZARDS - Gas Under Pressure, 115 PSIG at 70°F. Do Not Exceed 120°F.
MSA P/N 463464
Page 2 of 2
HEALTH HAZARDS
HEALTH HAZARDS - Methane is a simple asphyxiant, ACGIH 2003.
SIGNS AND SYMPTOMS OF EXPOSURE - None known for 2.5% Methane in air.
PRIMARY ROUTES OF ENTRY - Inhalation
TARGET ORGANS - Lungs
MEDICAL CONDITIONS GENERALLY RECOGNIZED AS BEING AGGRAVATED BY EXPOSURE - No Information
EXPOSURE LIMITS - None. Methane is a simple asphyxiant (ACGIH 2008.)
CARCINOGENICITY DATA - NIOSH RTECS, OSHA, NTP or IARC does not list component gases.
EMERGENCY AND FIRST AID PROCEDURES - None
SAFE HANDLING AND USE
HYGIENIC PRACTICES - Avoid breathing gas.
PROTECTIVE MEASURES DURING REPAIR AND MAINTENANCE OF CONTAMINATED EQUIPMENT - N/A
PROCEDURES FOR SPILL OR LEAK CLEANUP - Ventilate area
WASTE DISPOSAL - Do not puncture or incinerate cylinder. Before discarding cylinder, slowly release contents to a safe
exhaust.
STORAGE - Store in a cool, dry, well-ventilated area. Do not exceed 120°F. CONTROL MEASURES
PERSONAL PROTECTIVE EQUIPMENT - Due to the limited amount of gas in the cylinder, and the low release rate
employed in instrument calibration, respiratory protection is not indicated under conditions of intended use.
ENGINEERING CONTROLS - Mechanical ventilation is suitable.
WORK PRACTICES - Avoid breathing gas. Use in well-ventilated areas. Follow the calibration procedure detailed in the MSA
instruction manual provided with the instrument under calibration.
DATE OF PREPARATION - Rev. 11, January 2009
WARNING: This is a hazardous chemical product. By following the directions and warnings provided with this product, the
hazards associated with the use of this product can be greatly reduced but never entirely eliminated. Mine Safety Appliances
Company makes no warranties, expressed or implied, with respect to this product and EXPRESSLY DISCLAIMS THE
WARRANTY OF MERCHANTABILITY AND ANY WARRANTY OF FITNESS FOR A PARTICULAR PURPOSE. Users
assume all risks in handling, using or storing this product.

Page 1 of 2
MATERIAL SAFETY DATA SHEET MINE SAFETY APPLIANCES COMPANY
29 CFR 1910.1200 OSHA Hazard P.O. Box 426
Communication Rule Format Pittsburgh, PA 15230
Chem-Tel 24 Hour Emergency # 1-800-255-3924 PHONE (412) 967-3000
This product contains isobutylene, oxygen and nitrogen, substances subject to the Pennsylvania Worker and
Community Right-To-Know Act.
PRODUCT IDENTITY
LABEL IDENTITY - MSA P/N 10028038 Calibration Check Gas, 100 ppm Isobutylene in Air
CHEMICAL NAME - Isobutylene, Oxygen, Nitrogen Mixture
ADDITIONAL IDENTITIES - MSA P/N 10028038 Calibration Gas
FORMULA - C4H8 in Air
APPLICABLE CHEMICAL CONTENTS
ppm TWA
Isobutylene (CAS 115-11-7) 100 None
Air Balance None
NOTE: Gas under pressure, 1000 PSIG at 70°F, Approx. 100 Liters gas at atmospheric pressure PHYSICAL AND CHEMICAL PROPERTIES
APPEARANCE AND ODOR - Colorless odorless gas.
BOILING POINT - N/A SPECIFIC GRAVITY (H2O = 1) - N/A
VAPOR PRESSURE - N/A PERCENT VOLATILE BY VOLUME - N/A
VAPOR DENSITY (AIR = 1) - > 1
SOLUBILITY IN WATER - Isobutylene - Insoluble
Oxygen - 3.2 cm3/100 ml (25°C)
Nitrogen - 2.3 cm3/100 ml (0°C)
N/A - Not Applicable PHYSICAL HAZARD INFORMATION
PHYSICAL HAZARD - Compressed gas, 1000 PSIG at 70°F
CONDITIONS OR MATERIALS TO AVOID - None
FLASH POINT - N/A LEL - N/A UEL - N/A
EXTINGUISHING MEDIA - This calibration gas mixture is not flammable. Use extinguishing media appropriate to
surrounding fire.
SPECIAL FIRE FIGHTING PROCEDURES - See Next Item
UNUSUAL FIRE AND EXPLOSION HAZARDS - Gas under pressure, 1000 PSIG at 70°F. Do not exceed 120°F.

MSA P/N 10028038
Page 2 of 2
HEALTH HAZARDS
HEALTH HAZARDS - None Known for 100 ppm Isobutylene in Air. Isobutylene Inhalation Rat LC50: 620 Gm/M3/4H.
Isobutylene Inhalation Mouse LC50: 415 gm/M3/2H.
SIGNS AND SYMPTOMS OF EXPOSURE - N/A to this gas mixture.
PRIMARY ROUTES OF ENTRY - Inhalation
TARGET ORGANS - Isobutylene is an asphyxiant, which displaces oxygen in the environment..
MEDICAL CONDITIONS GENERALLY RECOGNIZED AS BEING AGGRAVATED BY EXPOSURE - No information
EXPOSURE LIMITS - None (ACGIH 2009)
CARCINOGENICITY DATA - Component gases are not listed by NIOSH RTECS, OSHA, NTP or IARC.
EMERGENCY AND FIRST AID PROCEDURES - None
SAFE HANDLING AND USE
HYGIENIC PRACTICES - Avoid breathing gas.
PROTECTIVE MEASURES DURING REPAIR AND MAINTENANCE OF CONTAMINATED EQUIPMENT - N/A
PROCEDURES FOR SPILL OR LEAK CLEANUP - Ventilate area
WASTE DISPOSAL - Do not puncture or incinerate cylinder. Before discarding cylinder, slowly release contents to a safe
exhaust. Dispose of cylinder in accordance with local, state and federal regulations
STORAGE - Store in a cool, dry, well-ventilated area. Do not exceed 120°F. CONTROL MEASURES
PERSONAL PROTECTIVE EQUIPMENT - Due to the limited amount of gas in the cylinder, and the low release rate
employed in instrument calibration, respiratory protection is not indicated under conditions of intended use.
ENGINEERING CONTROLS - Mechanical ventilation is suitable.
WORK PRACTICES - Avoid breathing gas. Use in well-ventilated areas. Follow the calibration procedure detailed in the MSA
instruction manual provided with the instrument under calibration.
DATE OF PREPARATION - Rev. 2, April 2009
WARNING: This is a hazardous chemical product. By following the directions and warnings provided with this product, the hazards
associated with the use of this product can be greatly reduced but never entirely eliminated. Mine Safety Appliances Company makes no
warranties, expressed or implied, with respect to this product and EXPRESSLY DISCLAIMS THE WARRANTY OF
MERCHANTABILITY AND ANY WARRANTY OF FITNESS FOR A PARTICULAR PURPOSE. Users assume all risks in handling,
using or storing this product.
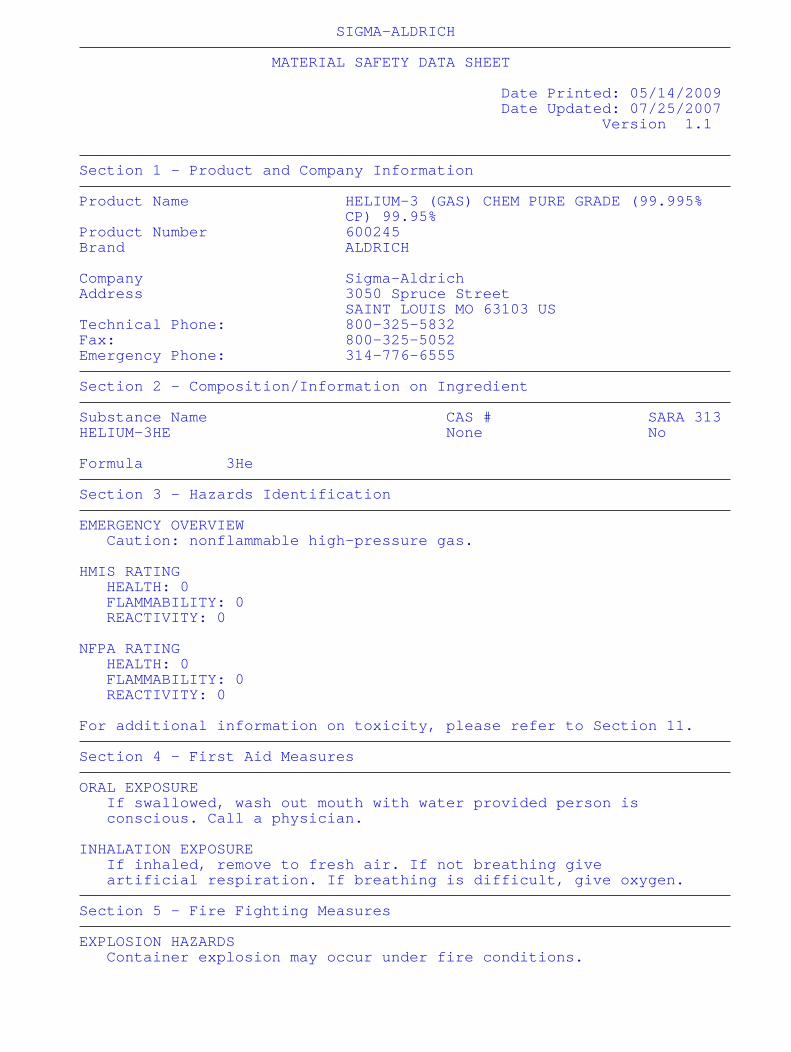
SIGMA-ALDRICH MATERIAL SAFETY DATA SHEET Date Printed: 05/14/2009 Date Updated: 07/25/2007 Version 1.1 Section 1 - Product and Company Information Product Name HELIUM-3 (GAS) CHEM PURE GRADE (99.995% CP) 99.95% Product Number 600245 Brand ALDRICH Company Sigma-Aldrich Address 3050 Spruce Street SAINT LOUIS MO 63103 US Technical Phone: 800-325-5832 Fax: 800-325-5052 Emergency Phone: 314-776-6555 Section 2 - Composition/Information on Ingredient Substance Name CAS # SARA 313 HELIUM-3HE None No Formula 3He Section 3 - Hazards Identification EMERGENCY OVERVIEW Caution: nonflammable high-pressure gas. HMIS RATING HEALTH: 0 FLAMMABILITY: 0 REACTIVITY: 0 NFPA RATING HEALTH: 0 FLAMMABILITY: 0 REACTIVITY: 0 For additional information on toxicity, please refer to Section 11. Section 4 - First Aid Measures ORAL EXPOSURE If swallowed, wash out mouth with water provided person is conscious. Call a physician. INHALATION EXPOSURE If inhaled, remove to fresh air. If not breathing give artificial respiration. If breathing is difficult, give oxygen. Section 5 - Fire Fighting Measures EXPLOSION HAZARDS Container explosion may occur under fire conditions.
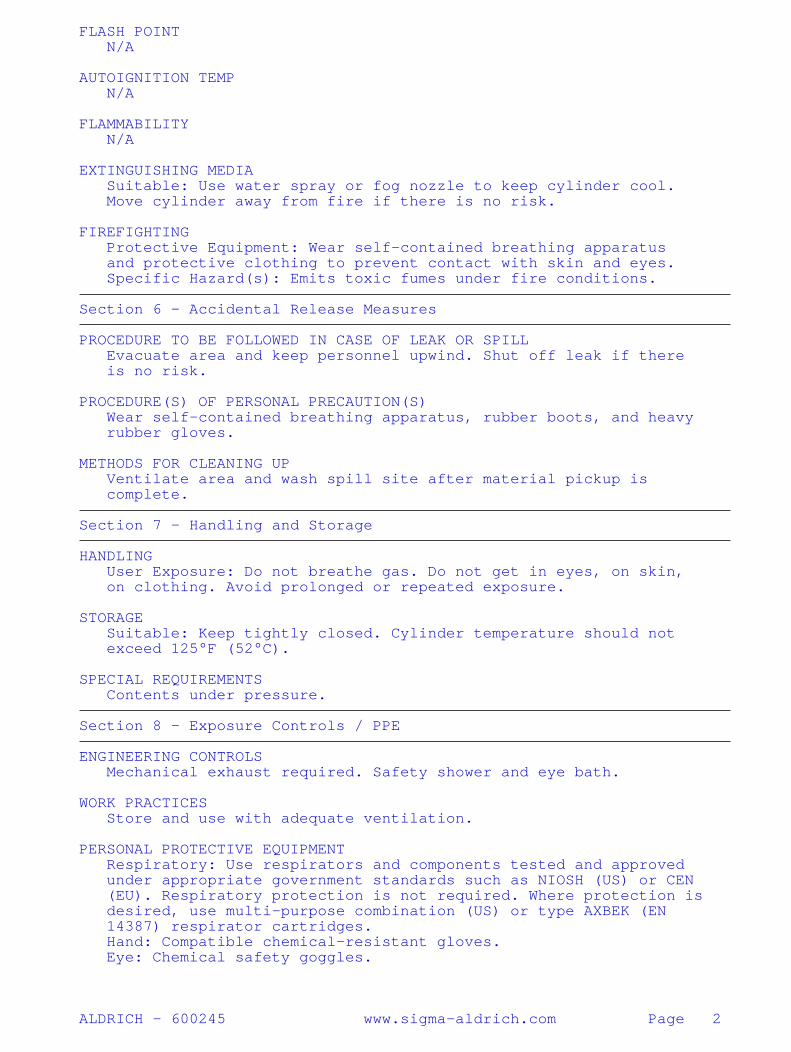
FLASH POINT N/A AUTOIGNITION TEMP N/A FLAMMABILITY N/A EXTINGUISHING MEDIA Suitable: Use water spray or fog nozzle to keep cylinder cool. Move cylinder away from fire if there is no risk. FIREFIGHTING Protective Equipment: Wear self-contained breathing apparatus and protective clothing to prevent contact with skin and eyes. Specific Hazard(s): Emits toxic fumes under fire conditions. Section 6 - Accidental Release Measures PROCEDURE TO BE FOLLOWED IN CASE OF LEAK OR SPILL Evacuate area and keep personnel upwind. Shut off leak if there is no risk. PROCEDURE(S) OF PERSONAL PRECAUTION(S) Wear self-contained breathing apparatus, rubber boots, and heavy rubber gloves. METHODS FOR CLEANING UP Ventilate area and wash spill site after material pickup is complete. Section 7 - Handling and Storage HANDLING User Exposure: Do not breathe gas. Do not get in eyes, on skin, on clothing. Avoid prolonged or repeated exposure. STORAGE Suitable: Keep tightly closed. Cylinder temperature should not exceed 125°F (52°C). SPECIAL REQUIREMENTS Contents under pressure. Section 8 - Exposure Controls / PPE ENGINEERING CONTROLS Mechanical exhaust required. Safety shower and eye bath. WORK PRACTICES Store and use with adequate ventilation. PERSONAL PROTECTIVE EQUIPMENT Respiratory: Use respirators and components tested and approved under appropriate government standards such as NIOSH (US) or CEN (EU). Respiratory protection is not required. Where protection is desired, use multi-purpose combination (US) or type AXBEK (EN 14387) respirator cartridges. Hand: Compatible chemical-resistant gloves. Eye: Chemical safety goggles. ALDRICH - 600245 www.sigma-aldrich.com Page 2
GENERAL HYGIENE MEASURES Wash thoroughly after handling. Section 9 - Physical/Chemical Properties Appearance Physical State: Compressed gas Color: Colorless Odor: Odorless Property Value At Temperature or Pressure pH N/A BP/BP Range N/A MP/MP Range N/A Freezing Point N/A Vapor Pressure N/A Vapor Density N/A Saturated Vapor Conc. N/A Bulk Density N/A Odor Threshold N/A Volatile% N/A VOC Content N/A Water Content N/A Solvent Content N/A Evaporation Rate N/A Viscosity N/A Surface Tension N/A Partition Coefficient N/A Decomposition Temp. N/A Flash Point N/A Explosion Limits N/A Flammability N/A Autoignition Temp N/A Refractive Index N/A Optical Rotation N/A Miscellaneous Data N/A Solubility N/A N/A = not available Section 10 - Stability and Reactivity STABILITY Stable: Stable. HAZARDOUS DECOMPOSITION PRODUCTS Hazardous Decomposition Products: Nature of decomposition products not known. Section 11 - Toxicological Information ROUTE OF EXPOSURE Skin Contact: May cause skin irritation. Skin Absorption: May be harmful if absorbed through the skin. Eye Contact: May cause eye irritation. Inhalation: May be harmful if inhaled. Can cause rapid suffocation. Ingestion: May be harmful if swallowed. SIGNS AND SYMPTOMS OF EXPOSURE Nausea, dizziness, and headache. Exposure can cause: ALDRICH - 600245 www.sigma-aldrich.com Page 3
CONDITIONS AGGRAVATED BY EXPOSURE At high concentrations helium functions as a simple asphyxiant by displacing air. Section 12 - Ecological Information No data available. Section 13 - Disposal Considerations APPROPRIATE METHOD OF DISPOSAL OF SUBSTANCE OR PREPARATION Observe all federal, state, and local environmental regulations. APPROPRIATE METHOD OF DISPOSAL OF CONTAMINATED PACKAGING Caution: no-return cylinder. Do not reuse. Empty cylinder will contain hazardous residue. Follow proper disposal techniques. Section 14 - Transport Information DOT Proper Shipping Name: Helium, compressed UN#: 1046 Class: 2.2 Packing Group: None Hazard Label: Non-Flammable gas PIH: Not PIH IATA Proper Shipping Name: Helium, compressed IATA UN Number: 1046 Hazard Class: 2.2 Section 15 - Regulatory Information EU ADDITIONAL CLASSIFICATION S: 9 Safety Statements: Keep container in a well-ventilated place. US CLASSIFICATION AND LABEL TEXT Safety Statements: In case of insufficient ventilation, wear suitable respiratory equipment. US Statements: Caution: nonflammable high-pressure gas. UNITED STATES REGULATORY INFORMATION SARA LISTED: No CANADA REGULATORY INFORMATION WHMIS Classification: This product has been classified in accordance with the hazard criteria of the CPR, and the MSDS contains all the information required by the CPR. DSL: No NDSL: No Section 16 - Other Information DISCLAIMER For R&D use only. Not for drug, household or other uses. WARRANTY The above information is believed to be correct but does not purport to be all inclusive and shall be used only as a guide. The information in this document is based on the present state of our knowledge and is applicable to the product with regard to ALDRICH - 600245 www.sigma-aldrich.com Page 4

appropriate safety precautions. It does not represent any guarantee of the properties of the product. Sigma-Aldrich Inc., shall not be held liable for any damage resulting from handling or from contact with the above product. See reverse side of invoice or packing slip for additional terms and conditions of sale. Copyright 2009 Sigma-Aldrich Co. License granted to make unlimited paper copies for internal use only. ALDRICH - 600245 www.sigma-aldrich.com Page 5

Prepared for Counsel – Subject to Attorney Client Work Product Privilege – Confidential
Appendix E
Appendix E HS118 – Confined Space Entry Program
Procedure: HS 118 US Date: February 2009 Revised: March 2014
US Health & Safety Procedures Confined Space Entry Program
HS 118 US- Confined Space Entry Program Page 1 of 16
1.0 PURPOSE Geosyntec personnel will not enter any confined space until it has been evaluated, classified, and (if necessary) has had a specific entry procedure developed. Personnel performing such entries will meet the training and program requirements specified below and in 29CFR1910.146. This procedure applies to all Geosyntec confined space entry projects in the US.
2.0 DEFINITIONS Confined Space - is a space which:
• Is large enough and so configured that an employee can physically enter and perform assigned work; and
• Has limited or restricted means for entry or exit; and • Is not designed for continuous human occupancy.
There are two types of confined spaces: Permit-Required Confined Space (PRCS) – a confined space that exhibits one or more of the following properties:
• Contains or has a potential to contain a hazardous atmosphere; • Contains a material that has the potential for engulfing an entrant; • Has an internal configuration such that an entrant could be trapped or asphyxiated by
inwardly converging walls or by a floor which slopes downward and tapers to a smaller cross-section; or
• Contains any other recognized serious safety or health hazard. Non-Permit Required Confined Spaces (NPRCS) - Spaces that do not contain or, with respect to atmospheric hazards, have the potential to contain any hazard capable of causing death or serious physical harm. These spaces do not require specific entry procedures. Non-permit-required confined spaces can be designated only by a Certified Industrial Hygienist, Certified Safety Professional, Geosyntec Director of H&S or designee, or Professional Engineer after review of the space(s), historical monitoring data, and other factors (e.g., injuries that have occurred). Therefore, all confined spaces will be considered permit-required unless specifically designated as a non-permit space, in writing, on the approved confined space inventory listing.
Entry – The action by which a person passes through an opening into a confined space. Entry is considered to have occurred as soon as any part of the body breaks the opening of a confined space.
3.0 CLASSIFICATION OF CONFINED SPACES
3.1 Identification of Confined Spaces
HS 118 US- Confined Space Entry Program Page 2 of 16
All confined spaces under the control of Geosyntec that may be entered will be identified, evaluated and classified on a Confined Space Inventory Listing (Attachment 1 or equivalent). The inventory listing shall be updated as required, at a minimum annually. 3.2 Labeling 1. All permit-required confined spaces will be labeled so that employees are adequately warned
of the potential for hazardous conditions/atmospheres. Labeling is not required under the following circumstance:
a. The spaces are easily recognizable, numerous, and widely spaced (e.g., storm sewer
manholes). Employees will be instructed that these constitute confined spaces during required training. However, these locations will be included on the inventory.
b. A complete inventory has been developed, all personnel have been trained in the use of the inventory, and the workers consult the inventory prior to performance of any work that may require entry into a confined space.
2. When non-permit-required confined spaces require the implementation of confined space
entry procedures because of specific work operations (e.g., painting, welding), all entry points will be labeled so as to alert all employees of the existence of the hazardous conditions. These signs will be removed only when the hazard no longer exists (e.g., complete curing of the paint).
3.3 Classification of Confined Spaces For each identified confined space, an evaluation to determine the nature and extent of all possible hazards to entrants must be conducted. Consideration will be given to the following types of hazards:
• The presence of possible airborne contaminants at concentrations exceeding established occupational exposure limits (OELs).
• The presence of any physical hazards (e.g., electrical shock, mechanical injury, etc.). • The presence of flammable or explosive conditions. • The presence of any potential for rapid flooding or engulfment. • Configurations/positioning that may cause an entrant to become trapped. • Initial classification as either a PRCS or NPRCS.
The evaluation will be documented using the Confined Space Hazard Assessment form found in Attachment 2. Wherever the confined space is controlled by a client or third-party, the controlling entity should be contacted to provide the information necessary to complete the evaluation. However, if Geosyntec personnel are required to enter a confined space owned or controlled by others, the final evaluation will remain the responsibility of responsible Geosyntec Project Manager. 4.0 CONFINED SPACE ENTRY DUTIES 4.1 Entry Supervisor 1. Understand the hazards that may be faced during entry, including information on the mode,
signs or symptoms, and consequences of the exposure.
2. Verify following before signing the permit and allowing entry to begin.
a. Appropriate entries have been made on the entry permit.

HS 118 US- Confined Space Entry Program Page 3 of 16
b. All tests specified by the permit have been conducted.
c. All procedures and equipment specified by the permit are in place.
d. Means of communication are available and have been tested.
Terminate the entry and cancel the permit when entry operations are complete or when a prohibited condition arises.
Verify rescue services, when required, are available and the means for summoning them are operable.
Remove unauthorized individuals who enter or who attempt to enter the permit space during entry operations.
Ensure that entry operations remain consistent with terms of the entry permit and that acceptable entry conditions are maintained.
Withdraw the entry permit and stop all entries if unsafe conditions are reported during any confined space entry. He/she will not permit same or any other entry until cause of unsafe conditions is thoroughly investigated and Confined Space Program is reviewed to prevent reoccurrence.
4.2 Attendant 1. Understand the hazards that may be faced during entry, including information on the mode,
signs or symptoms, and consequences of the exposure.
2. Be aware of the possible behavioral effects of hazard exposure in the Authorized Entrants.
3. Maintain an accurate count of Authorized Entrants in the permit space and ensure the means used to identify Authorized Entrants accurately tracks who is in the permit space.
4. Remain outside the permit space during entry procedures until relieved by another Authorized Attendant.
5. Communicate with Authorized Entrants as necessary to monitor entrant status and to alert Entrants of the need to evacuate the space.
6. Monitor activities inside and outside the space to determine if it is safe for Entrants to remain in the space. Orders the Authorized Entrants to evacuate the permit space under any of the following conditions:
a. The Attendant detects a problem.
b. The Attendant detects the behavioral effect of hazard exposure in an Entrant.
c. The Attendant detects a situation outside the space that could endanger the Entrant.
d. If the Attendant cannot effectively and safely perform all of his/her assigned duties.
7. Summon rescue and other emergency services as soon as the Attendant determines that
Entrants may need assistance to escape from permit space hazards; 8. Take the following actions when unauthorized persons approach or enter a permit space
while entry is underway: a. Warn the unauthorized persons they must stay away from the permit space; b. Advise unauthorized persons they must exit immediately if they have entered the permit space; and c. Inform the Authorized Entrants and the Entry Supervisor if unauthorized entrants have entered the permit space.
9. Perform non-entry rescues as specified within this program; and
HS 118 US- Confined Space Entry Program Page 4 of 16
10. Perform no other duties that might interfere with the Attendant’s primary duty to monitor and protect the Authorized Entrants.
4.3 Authorized Entrant 1. Understand the hazards that may be faced during entry, including information on the mode,
signs or symptoms, and consequences of the exposure.
2. Properly use personal and facility equipment as required by the entry permit.
3. Communicate with the Attendant as necessary to enable the Attendant to monitor Entrant status and to enable the Attendant to alert Entrants of the need to evacuate the space.
4. Alert the Attendant whenever a recognized warning sign or symptom of exposure to a dangerous situation or a prohibited condition exists.
5. Exit from the permit space as quickly as possible whenever:
a. An order to evacuate is given by the Attendant or the Entry Supervisor; or
b. When the Entrant recognizes any warning sign or symptom of exposure to a dangerous situation; or
c. When the Entrant detects a prohibited condition; or
d. When an evacuation alarm is activated.
4.4 Rescue Service (if designating an outside service)
Prior to authorizing entry into any confined space, Site (Project) Manager should:
1. Evaluate a prospective rescuer's ability to respond to a rescue summons in a timely manner (within 3 minutes for life threatening situations or 15 minutes for non-life threatening injuries), considering the hazard(s) identified;
2. Evaluate a prospective rescue service's ability.
3. Select a rescue team or service from those evaluated that:
a. Has the capability to reach the victim(s) within a time frame that is appropriate for the permit space hazard(s) identified [as defined in 4.4 (1) above].
b. Is equipped for and proficient in performing the needed rescue services.
c. Inform each rescue team or service of the hazards they may confront when called on to perform rescue at the site; and
d. Provide the rescue team or service selected with access to all permit spaces from which rescue may be necessary so that the rescue service can develop appropriate rescue plans and practice rescue operations.
4.5 Rescue Service (if designating internal rescue team)
Prior to authorizing entry into any confined space, Site (Project) Manager should:
1. Provide affected employees the required personal protective equipment (PPE) and train them in its use.
2. Train affected employees to perform assigned rescue duties.
3. Train affected employees in basic first-aid and cardiopulmonary resuscitation (CPR) (at least one member shall hold a current certification in first aid and CPR); and
4. Ensure that affected employees practice making permit space rescues at least once every 12 months.
HS 118 US- Confined Space Entry Program Page 5 of 16
4.6 Facilitating Non-Entry Rescue
1. Retrieval systems or methods shall be used whenever an authorized entrant enters a permit space (unless the retrieval equipment would increase the overall risk of entry).
2. Retrieval systems shall meet the following requirements:
a. Each authorized entrant shall use a chest or full body harness with a retrieval line attached at the center of the entrant's back near shoulder level or other suitable locations as appropriate.
b. The other end of the retrieval line shall be attached to a mechanical device (mandatory for more than 5 feet deep rescue) or fixed point outside the permit space.
5.0 PRCS-Specific Entry Procedures To protect employees during PRCS entries, and to meet the requirements of 29 CFR 1910.146, Geosyntec-specific PRCS entry procedures will be developed for each PRCS to be entered. Each entry procedure will detail:
• The identity of the PRCS(s) to which the procedure applies.
• Details concerning the potential hazards associated with the entry operation/PRCS.
• Pre-entry preparation: ▪ Required air monitoring equipment. ▪ PPE. ▪ Required emergency response/extraction equipment. ▪ Required ventilation procedures (as applicable). ▪ Required isolation procedures (as applicable). ▪ Rescue agency notification requirements (as applicable).
• Required pre-entry monitoring procedures and applicable at-entry re-classification criteria.
• Air monitoring procedures during entry (if re-classification has not occurred).
• PPE requirements during entry (if re-classification has not occurred).
Specific entry procedures can be documented by following the procedures in sections 5.1 through 5.4 of this procedure and by completing a health and safety plan (HASP), Task Hazard Analysis (THA)/Job Safety Analysis (JSA) in combination with a completed Confined Space Hazard Analysis and Confined Space Permit.
5.1 PRCS Pre-Entry Procedure: Prior to the start of the entry operation the Entry Supervisor will assign individuals on the entry team to the following jobs:
• Entrant – the person entering the PRCS.
• Primary Attendant1 - the person dedicated only to assisting the entrant, observing the entry operation and maintaining communications with the entrant throughout the entry procedure.
1 Note: The Entry Supervisor can serve as the Primary or Secondary Attendant, but cannot perform work as the PRCS Entrant.

HS 118 US- Confined Space Entry Program Page 6 of 16
• Secondary Attendant for Rescue Procedures - an employee assigned either to specific support of the entry operation or working nearby who can assist with rescue operations in the event of an accident. This person can perform other duties unrelated to observing the entry.
The Entry Supervisor is responsible for ensuring that the individuals assigned to each job fully understand their duties and responsibilities prior to initiating the entry operation. The Entry Supervisor will review the complete entry procedure with all team members prior to the work. The Entry Supervisor will also verify the availability of rescue services. Additional requirements for Pre-Entry Planning include the following:
• Select the appropriate equipment to measure the potential hazards. Select a multi-gas meter capable of measuring oxygen, combustible gas (%LEL), and other Hazardous Gases.
• Determine the acceptable values for the hazardous conditions being measured, based
on the equipment in use and the field calibration method. The action levels are determined as follows:
▪ Oxygen 19.5% - 23.5% ▪ Lower explosion limit 10% ▪ Hydrogen sulfide 5 ppm ▪ Carbon monoxide 15 ppm ▪ Other toxic chemicals Contact H&S Department
• Ensure all the equipment selected is calibrated, and calibration is still valid.
Personnel trained in accordance with this procedure shall perform field verification of equipment as follows:
1. Calibrate combustible gas meters using appropriate span gas for the detectors to be used.
(This span gas calibration shall be performed each time the instrument is turned on). 2. Check detector tube pumps for leakage using the manufacturer’s procedures. 3. Calibrate Photo Ionization Detectors (PID) using isobutylene, or other material, in accordance
with the manufacturer’s directions. 4. Calibrate any other instrumentation to be used in accordance with manufacturer’s directions.
Set up barricades around the space being entered as required.
Set up required rescue or retrieval systems.
Institute required lockout/tagout procedures (i.e. electrical, steam, liquid flow-pipe blanking) Ensure that a second person (trained as entry attendant) is available, and assists in the set up procedures. Agree upon a means of communication between the entrant and the attendant. (The attendant is not authorized to perform rescue involving entry into the space, unless he/she is trained for rescue and another entry attendant replaces him/her prior to the attempt to rescue). Attendant must have a means to contact emergency rescue services for further assistance. Complete Confined Space Entry Permit:
HS 118 US- Confined Space Entry Program Page 7 of 16
1. Have the attendant verify the completion of the required actions; 2. Entry supervisor shall sign the Permit upon verification of completed actions; 3. Maintain the Permit at all authorized entry sites until completion of the entry; 5.2 PRCS Entry Permits A PRCS Entry Permit is required to be completed for each individual PRCS entry operation (Exception: Multiple entries of an individual PRCS during a single work shift can be covered by a single Permit). The Permit provides the means for documenting:
• The identities and roles of all individuals involved in the entry operation.
• Equipment used for performance of the entry (monitoring instruments, extraction equipment, etc.).
• Pre-entry and operational monitoring results.
• Other relevant workplace conditions or events related to the entry operation (e.g., vault isolation procedures).
The Permit also provides the documented basis for re-classification of any PRCS as non-permit required (for purposes of the particular entry operation) based upon pre-entry monitoring procedures. Each Permit will be signed and authorized by the Entry Supervisor. At the completion of the entry operation, the Permit will be filed as part of the project records. A copy of Geosyntec’s PRCS Entry Permit form is provided in Attachment 3 and an example of Geosyntec’s Confined Space Entry Classification Guidance is provided in Attachment 4. 5.3 PRCS Entry Procedure
• Don any required PPE.
• Check the area around the seal to ensure that no flammable situations exist prior to door or cover removal. Note: Always check for oxygen levels first if the meter does not measure simultaneously. Low oxygen levels can cause LEL readings to be incorrect.
• Carefully remove any access doors or covers.
• Upon removal of the access cover/door, check the immediate atmosphere using remote
testing procedures to ensure the immediate atmosphere is safe. If any of the parameters being tested are outside the action level, do not enter.
• If necessary, use exhaust ventilation to either remove the contaminant(s) or to correct
the oxygen-deficient atmosphere.
• If the initial test(s) are within allowable ranges, slowly enter the space, continually testing the atmosphere in front and to the sides.
• In stratified atmospheres (i.e., vertical entries), testing will be done 4 feet in advance of
the direction of travel. Travel speed will allow for adequate instrument response time.
• The entire area where work is to be performed will be tested prior to performance of any work.

HS 118 US- Confined Space Entry Program Page 8 of 16
• While performing the work, place the direct read instruments in a location that will not interfere with the work, allow for continual monitoring, and allow for noting any alarms that may be activated.
• Upon work completion, pick up all equipment and leave the space.
5.4 PRCS Exit Procedure
• Replace all access covers.
• Ensure all signs are visible and legible.
• Remove all lockout/tagout equipment.
• Note on the Permit any problems encountered while in the space.
• Finish the Permit and turn it in to the Entrant Supervisor.
• The Entrant Supervisor will inspect the Permit for completion and investigate any noted problems. Actions taken to correct noted problems will be discussed with all authorized entrants and attendants for future implementation.
• The completed Permit will be maintained on file as required in this section. 6.0 NON-PERMIT REQUIRED CONFINED SPACE ENTRY PROCEDURE DEFINITION: NON – PERMIT CONFINED SPACE (NPCS) is a confined space that:
1. Does not contain any hazard capable of causing death or serious physical harm. 2. With respect to atmospheric hazards, does not have the potential to contain any hazard
capable of causing death or serious physical harm.
Persons entering this type of space only need to complete a confined space entry permit and remain vigilant about conditions in the space and remember that if any condition changes or if hazards are introduced into the space (e.g. welding/cutting operations), the classification and entry procedures in the space may change. 6.1 NPCS Entry Procedure
1. Check the atmosphere with the gas detector for Oxygen, LEL and other Hazardous gases
(e.g. CH4, H2S, and CO) in the same order prior to entry into the space. 2. Record the measured conditions on the permit and do not allow entry if detected levels are
above action levels. 3. When entrance covers are removed, guard the opening to prevent an accidental fall through
the opening and to protect each employee working in the space from foreign objects entering the space.
4. Proceed with entry and work with caution. 6.2 NPCS Post-Entry Procedures The following post-entry procedures must be followed after the completion of a non-permit required confined space entry:

HS 118 US- Confined Space Entry Program Page 9 of 16
1. Replace all access covers.
2. Ensure all signs are visible and legible.
3. Remove all lockout/tagout equipment, if applicable.
4. Note any problems encountered while in the space on the Permit.
5. Finish the permit, and turn in to the entrant supervisor.
6. The entrant supervisor shall inspect the Permit for completion, and investigate any noted problems. Actions taken to correct noted problems shall be discussed with all authorized entrants and attendants for future implementation.
7. The completed Permit shall be maintained in record for annual review.
7.0 MULTI-EMPLOYER ENTRY RESPONSIBILITIES Geosyntec’s Requirements- When using a subcontractor to perform work involving confined spaces, Geosyntec personnel must:
1. Inform the subcontractor that the workplace contains permit spaces and that permit space entry is allowed only through compliance with a permit space program meeting the requirements of CFR 1910.146.
2. Appraise the subcontractor of the elements, including the hazards identified and all past experiences with the space, that make the space in question a permit space.
3. Appraise the subcontractor of any precautions or procedures that have been implemented for the protection of employees in or near permit spaces where Contractor personnel will be working.
4. Coordinate entry operations with the subcontractor, when both Geosyntec employees and subcontractor employees will be working in or near permit spaces so that Geosyntec employees and the subcontractor do not endanger each other; and
5. Debrief the subcontractor at the conclusion of the entry operations regarding the permit space program followed and regarding any hazards confronted or created in permit spaces during entry operations.
Subcontractor Requirements - In addition to complying with the permit space requirements that apply to all employers, each subcontractor who is retained to perform permit space entry operations must:
1. Obtain any available information regarding permit space hazards and entry operations from the Geosyntec Project Manager;
2. Coordinate entry operations with the Project Manager when both Geosyntec personnel and subcontractor personnel will be jointly working in or near permit spaces; and
3. Inform Project Manager of the permit space program that the contractor will be using and of any hazards confronted or created in permit spaces, either through debriefing or during entry operations.
8.0 CONFINED SPACE ENTRY TRAINING
HS 118 US- Confined Space Entry Program Page 10 of 16
Personnel participating in the entry of any confined space must first complete initial confined space entry training equivalent to their assigned duties. In addition, personnel will receive site-specific training covering confined space entry procedures associated with the work site. 8.1 Initial Training Personnel will not be permitted to perform entry of any confined space prior to completing this training. The training will be administered or approved by the H&S Department, and will consist of the following elements:
• Orientation regarding the differences between a confined space and a permit-required confined space (PRCS).
• Review of applicable regulatory requirements (29 CFR 1910.146).
• Review of this procedure.
• Air monitoring instrumentation calibration and monitoring methods.
• Use of respiratory protection and PPE during PRCS operations.
• Entrant duties during NPRCS and PRCS entries.
• Attendant duties during PRCS entries:
Includes the entire above plus:
▪ Emergency notification requirements.
▪ Emergency response procedures.
▪ Maintaining the list of Authorized Entrants.
▪ Applicable state requirements for Attendants.
• Entry Supervisor duties during PRCS entries:
Includes the entire above plus:
▪ Accident and problem investigation techniques
▪ Recordkeeping requirements Initial training is intended only to qualify personnel to perform the duties of general confined space entry. This training must be supplemented by site/procedure-specific training prior to any new entry operation. Refresher training is required any time there is a change in the overall program or procedures or when, based on observation or incident, a substantial non-compliance with this procedure is noted. 8.2 Site/Procedure-Specific Training Because entry procedures will be specifically developed for individual PRCSs, personnel will require training in the specific procedure(s) prior to on site implementation. Training must be conducted by an authorized supervisor, member of the H&S Department, or an approved alternate and must be documented. 8.3 Annual Program Review At least annually, (or whenever any incident or serious near miss occurs due to confined space entry an independent authorized employee who is not involved in the procedure being inspected must conduct and document a review and inspection of the confined space entry program specific to the
HS 118 US- Confined Space Entry Program Page 11 of 16
identified facility. The inspection should include a meeting with authorized employees and any other affected employees. The inspection procedure must include the following elements.
• Discuss the entry supervisors, entry attendant, entrant, and rescuers (where applicable) responsibilities under the confined space entry program.
• Where confined space permit is used, discuss the entry attendant and entrant employee’s responsibilities under the confined space entry program and the limitations of the program.
• If deficiencies are noted during the inspection, corrective actions and retraining of employees, as necessary, must be performed immediately.
• Review of all confined space permits filed during last 12 months. Review should be focused on any deficiencies recorded on the permit, with appropriate root-cause analysis and preventive and corrective actions.
• The inspector shall provide a copy of all inspection documentation to the applicable Geosyntec Project Manager for review and filing.
These inspections shall provide for a demonstration of the procedures and may be implemented through random audits and planned visual observations. These inspections are intended to ensure that the confined space program is being properly and consistently implemented. 9.0 RECORDKEEPING
• Inventories of confined spaces will be maintained until one year past project completion.
• Cancelled and completed Confined Space Entry Permits will be maintained for a minimum of one year.
• Any airborne measurements that represent employee exposure will be maintained in Geosyntec Employee Exposure files.
• All Entry Permits will be reviewed annually by a trained entry supervisor to determine if procedures are being followed and are adequate to protect employees. If necessary, the entry procedures will be modified to ensure personnel are protected when entering locations.
10.0 ATTACHMENTS Attachment 1 – Facility-Specific Confined Space Identification Log Attachment 2 – Confined Space Hazard Assessment Form Attachment 3 – Geosyntec PRCS Space Entry Permit Form Attachment 4 – Confined Space Entry Classification Guidance
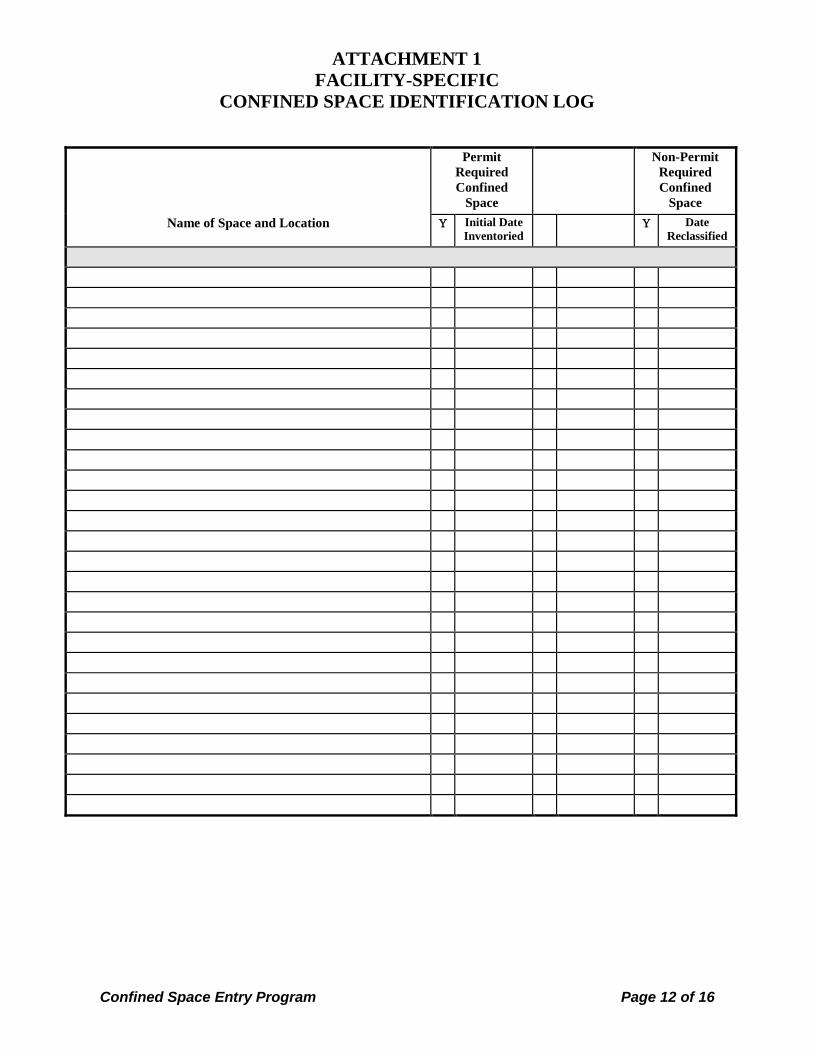
ATTACHMENT 1 FACILITY-SPECIFIC
CONFINED SPACE IDENTIFICATION LOG
Confined Space Entry Program Page 12 of 16
Permit Required Confined
Space
Non-Permit Required Confined
Space Name of Space and Location Υ Initial Date
Inventoried Υ Date
Reclassified
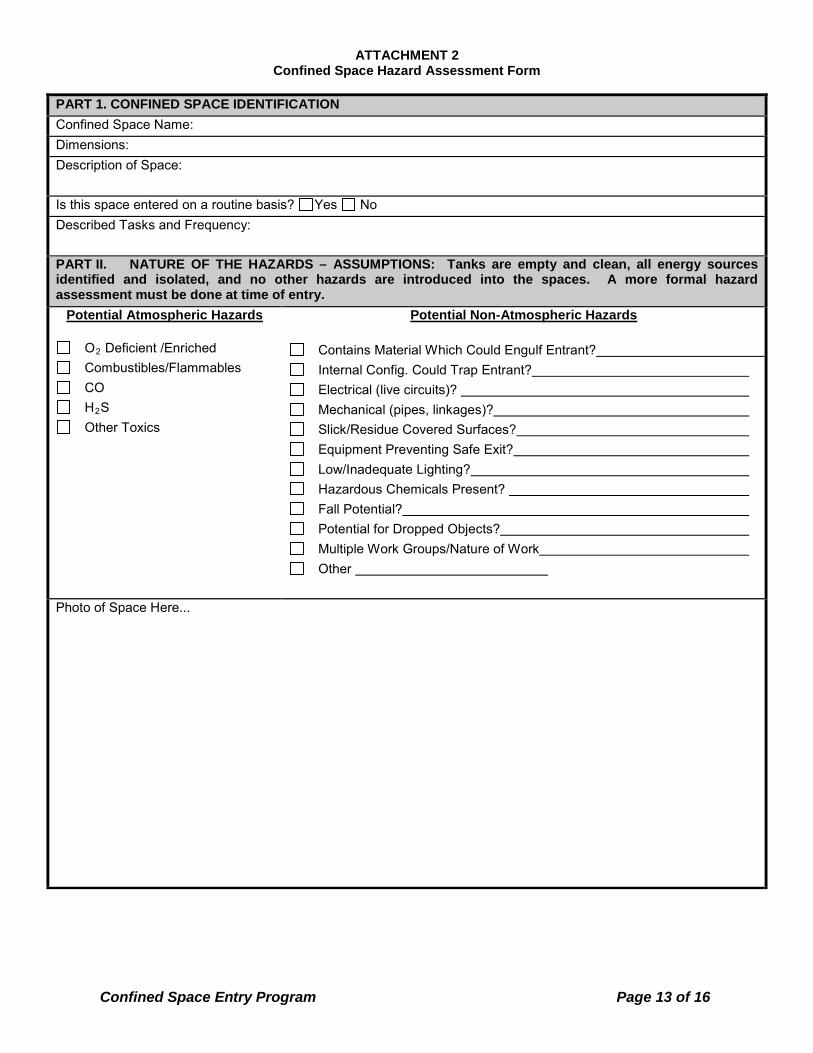
ATTACHMENT 2 Confined Space Hazard Assessment Form
Confined Space Entry Program Page 13 of 16
PART 1. CONFINED SPACE IDENTIFICATION Confined Space Name: Dimensions: Description of Space: Is this space entered on a routine basis? Yes No Described Tasks and Frequency: PART II. NATURE OF THE HAZARDS – ASSUMPTIONS: Tanks are empty and clean, all energy sources identified and isolated, and no other hazards are introduced into the spaces. A more formal hazard assessment must be done at time of entry.
Potential Atmospheric Hazards
O2 Deficient /Enriched Combustibles/Flammables CO H2S Other Toxics
Potential Non-Atmospheric Hazards
Contains Material Which Could Engulf Entrant? Internal Config. Could Trap Entrant? Electrical (live circuits)? Mechanical (pipes, linkages)? Slick/Residue Covered Surfaces? Equipment Preventing Safe Exit? Low/Inadequate Lighting? Hazardous Chemicals Present? Fall Potential? Potential for Dropped Objects? Multiple Work Groups/Nature of Work Other
Photo of Space Here...
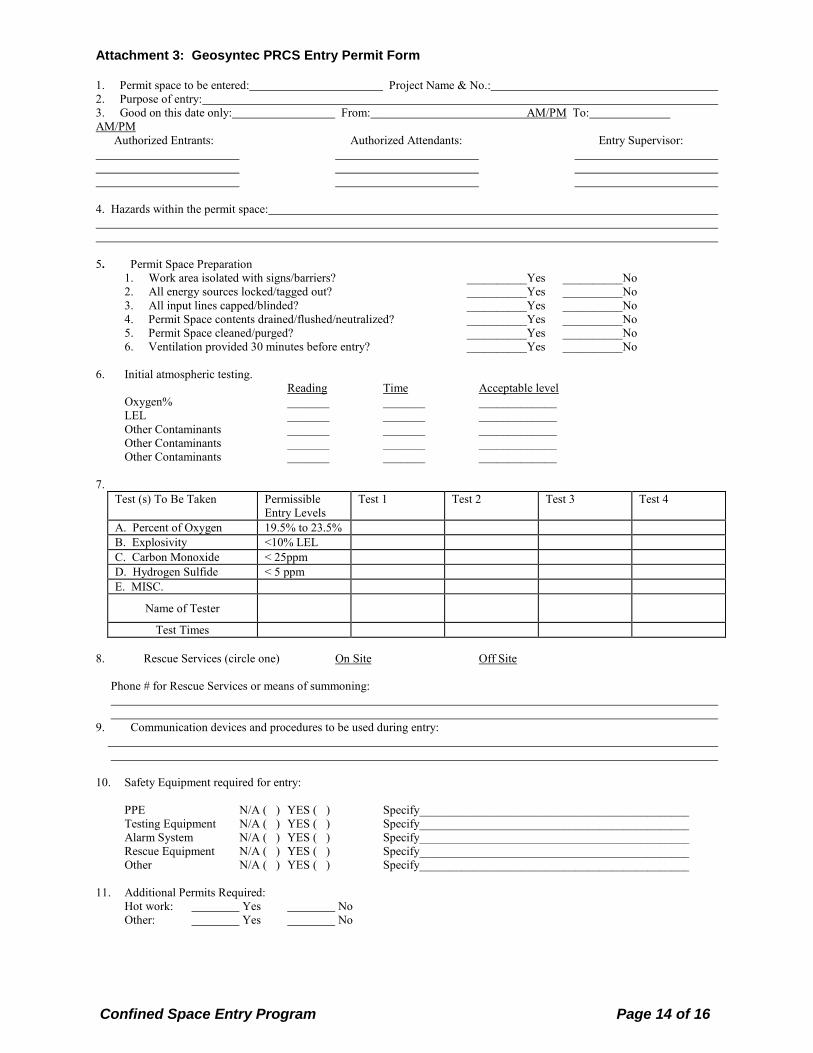
Attachment 3: Geosyntec PRCS Entry Permit Form
Confined Space Entry Program Page 14 of 16
1. Permit space to be entered: Project Name & No.: 2. Purpose of entry: 3. Good on this date only: From: AM/PM To: AM/PM Authorized Entrants: Authorized Attendants: Entry Supervisor: 4. Hazards within the permit space: 5. Permit Space Preparation 1. Work area isolated with signs/barriers? __________Yes __________No 2. All energy sources locked/tagged out? __________Yes __________No 3. All input lines capped/blinded? __________Yes __________No 4. Permit Space contents drained/flushed/neutralized? __________Yes __________No 5. Permit Space cleaned/purged? __________Yes __________No 6. Ventilation provided 30 minutes before entry? __________Yes __________No
6. Initial atmospheric testing. Reading Time Acceptable level Oxygen% _______ _______ _____________ LEL _______ _______ _____________ Other Contaminants _______ _______ _____________ Other Contaminants _______ _______ _____________ Other Contaminants _______ _______ _____________ 7.
Test (s) To Be Taken Permissible Entry Levels
Test 1 Test 2 Test 3 Test 4
A. Percent of Oxygen 19.5% to 23.5% B. Explosivity <10% LEL C. Carbon Monoxide < 25ppm D. Hydrogen Sulfide < 5 ppm E. MISC.
Name of Tester
Test Times 8. Rescue Services (circle one) On Site Off Site Phone # for Rescue Services or means of summoning: 9. Communication devices and procedures to be used during entry: 10. Safety Equipment required for entry: PPE N/A ( ) YES ( ) Specify_____________________________________________ Testing Equipment N/A ( ) YES ( ) Specify_____________________________________________ Alarm System N/A ( ) YES ( ) Specify_____________________________________________ Rescue Equipment N/A ( ) YES ( ) Specify_____________________________________________ Other N/A ( ) YES ( ) Specify_____________________________________________ 11. Additional Permits Required: Hot work: Yes No Other: Yes No

HS 118 US- Confined Space Entry Program Page 15 of 16
12. Permit Authorization I certify that I have inspected the work area for safety and reviewed all safety precautions recorded on this permit.
Permit Authorization by entry Supervisor (Signature): Date/Time_______________ 13. Permit Conditions Verification:
Physical conditions at confined space checked and verified to be in accordance with the permit Yes No If no; please record the deviation observed and corrective action taken: ________________________________________________________________________________________________________________________________________________________________________________________________________ Verified by : _________________________ _______________ ________________ (Entry Supervisor) Date Time
14. Review & Close-out:
Please list problems encountered during entry: ________________________________________________________________________________________________________________________________________________________________________________________________________ Corrective / Preventive Action Taken: ______________________________________________________________________________________________________________________________________________________________________________________________________
Additional Precautions / Recommendation for Future Entry: ______________________________________________________________________________________________________________________________________________________________________________________________________
Based on this review, this confined space shall be considered: - Permit Required Confined Space Yes No - Non-Permit Required Confined Space Yes No
Reviewed By: _________________________ _______________ ________________ (Entry Supervisor) Date Time
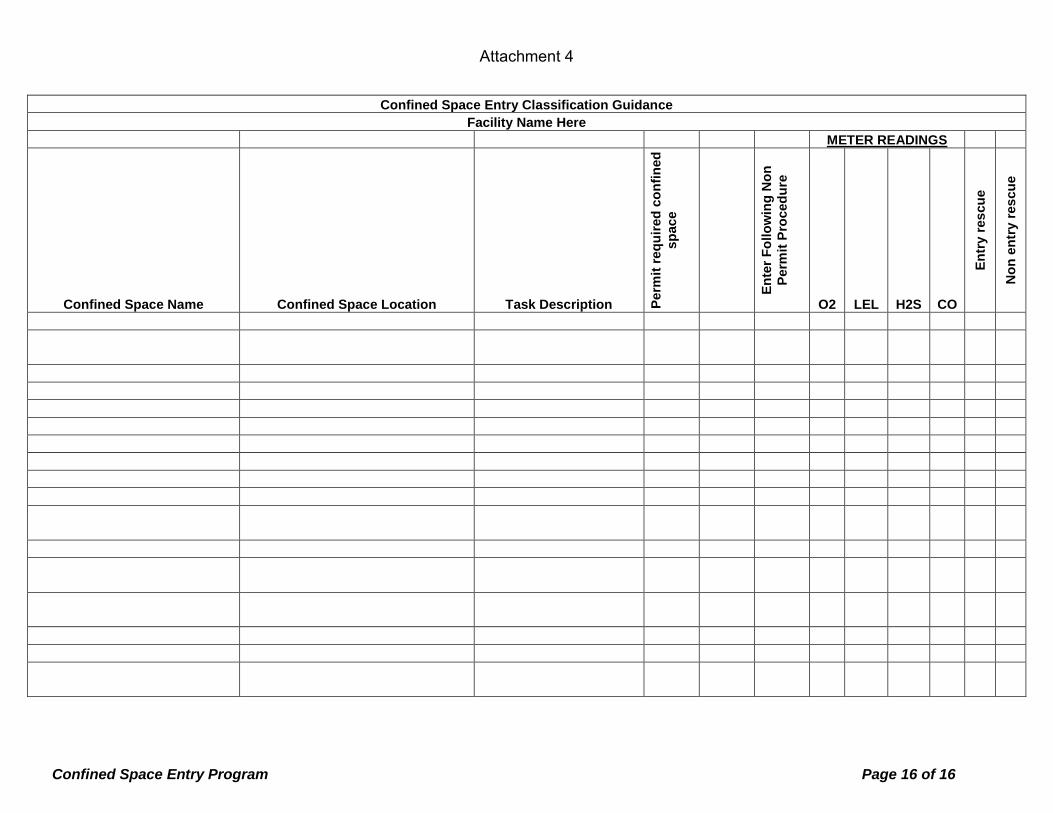
Attachment 4
Confined Space Entry Program Page 16 of 16
Confined Space Entry Classification Guidance Facility Name Here
METER READINGS
Confined Space Name Confined Space Location Task Description Perm
it re
quire
d co
nfin
ed
spac
e
Ente
r Fol
low
ing
Non
Pe
rmit
Proc
edur
e
O2 LEL H2S CO
Entr
y re
scue
Non
ent
ry re
scue
TR0641 March 2016
APPENDIX B
Equipment Specifications

TEC software to conduct automated Blower Door tests and for data logging of pressure measurements from both channels.• Cruise 75 50, 25 or 0 Pa building pressure without connection to a computer. The Cruise Control feature automatically adjusts the speed of the Blower Door and Duct Blaster® fan to maintain a constant test pressure while you perform additional diagnostics or air-sealing procedures.
Automated Blower Door Tests and Data LoggingThe DG-700 can conduct automated Blower Door tests using TECTITE software. Connect your DG-700 and Blower Door fan speed controller with fan control port to your computer using the fan control cable, and serial (M to F), USB cable or WiFi Link. Data logging of pressure measurements from both channels is easily done using our TECLOG data logging software.
Go wireless without buying a new gauge. Now you can wirelessly monitor and control your DG-700 gauge by attaching it to our new TEC WiFi Link device. Our software (available online) lets you create a wireless network that can be picked up by any computer or mobile
device with WiFi capability. And the best part is, you do NOT have to buy a new gauge to add this wireless technology to your system. For more information on TEC WiFi, download the free brochure on our website.
™
BUILDING PERFORMANCETESTING TOOLS
DG-700 Digital Pressure and Flow GaugeThe DG-700 Digital Pressure and Flow Gauge is a hand-held, high-resolution differential pressure gauge with 2 measurement channels. It works with all Energy Conservatory test devices to provide airflow measurements during building performance test procedures. Its dual pressure channels and air velocity flow measurement features make it ideally suited for a wide range of building performance testing applications, including:• Blower Door and Duct Blaster® airtightness testing• Exhaust fan and air handler flow measurements• Building depressurization and combustion safety testing• Static pressure and velocity measurements using a Pitot tube
DG-700 Gauge Features• Industry best accuracy, ± 1% of reading from –1,250 to +1,250 Pascals, or -5 to +5 inches of water.• Calculates and displays air flow reading with these devices: • Model 3 Minneapolis Blower Door™ fans • Model 4 Minneapolis Blower Door™ fan (220V) • Series A and B Minneapolis Duct Blaster® fans • Exhaust Fan Flow Meter • TrueFlow® Air Handler Flow Meter• Velocity units on Channel B when used with a Pitot Tube.• HOLD button temporarily freezes the most recent display readings.• Two year calibration
The DG-700 Gauge offers these advanced measurement capabilities:• “Baseline” feature on Channel A lets you measure and record a baseline pressure reading, then display the baseline adjusted reading.• Specialized @50 and @25 Leakage Measurement Modes to conduct single-point airtightness tests of building and duct systems. Estimated leakage rates displayed on Channel B are continuously adjusted to a test pressure of either 50 Pascals or 25 Pascals. Choice of leakage units (cfm @, m3/hr @, l/s @, sq. inches @, sq. centimeters @).• Air Handler Flow Measurement Mode lets you measure air handler flow rates using a TrueFlow Air Handler Flow Meter or a Duct Blaster® fan.• Connect the DG-700 gauge to a computer with easy-to-use

All of our products come with a full two-year warranty on parts and labor, and access to the most knowledgeable customer service staff in the industry. If you have questions on the use of our products or how to handle unusual situations, you can count on us to give dependable answers. We always stock a complete line of replacement parts and can respond quickly to any service or equipment problem.
Our nearly 30 years of expertise goes beyond simply knowing about equipment. The Energy Conservatory’s on-going research, active participation with technical associations, and close working relationships with the world’s leading building scientists keeps us involved in the development and field testing of many of the performance testing industry’s techniques. This means you always have the most up-to-date information and testing procedures.
DG-700 Digital Pressure Gauge Specifications
Complete service and technical support is built in.
2801 21st Avenue South, Suite 160Minneapolis, Minnesota 55407phone: (612) 827-1117fax: (612) 827-1051e-mail: [email protected]: www.energyconservatory.com
To order, or for more information contact:
© 2013 The Energy Conservatory
Specifications subject to change without notice.
The DG-700 Digital Gauge Kit includes: DG-700 Digital Pressure Gauge; protective carrying case; static pressureprobe; 10 ft (3 m) red hose; 15 ft (5 m) green hose; 16 ft (5 m) USB cable A to B mini; instruction manual and 2 year warranty.
Number of Independent Pressure Channels
Pressure Range
Display Resolution
Accuracy
Units of Measure
Auto-Zero
Time Averaging
Operating Temperature Range
Storage Temperature Range
LCD Display
Display Backlight
Power
Battery Life (Alkaline)
Auto-Off
Modes
Data Logging
Dimensions
Weight
2
–1,250 to +1,250 Pascals (-5 to +5 inches of water)
0.1 Pascals (0.0001 inches of water)
1% of pressure reading or 0.15 Pascals, which ever is greater.
Channel A—Pascals, inches of waterChannel B—Pascals, inches of water, CFM, CFM@50, CFM@25, m3/h, m3/h@50, m3/h@25, l/s, l/s@50, in2@25, cm2@50, cm2@25, fpm, m/s
On start up and then once every 10 seconds
1, 5, 10 seconds and Long-Term (continuous update)
32° F to 120° F (0° C to 48° C)
-4° F to 160° F (-20° C to 71° C)
3.193 x 1.16 inches (8.11 x 2.946 cm)
Manually operated, timed off after 10 minutes
6 - AA alkaline batteries supplied. AC power adapter optional.
Over 100 hours continuous use
After 2 hours from last keyed entry, unless disabled by user
Pressure/Pressure (Cruise available at 50, 25 and 0 Pa)Pressure/Flow* (Cruise available at 50, 25 and 0 Pa)Pressure/Flow @50* (Cruise available at 50 Pa)Pressure/Flow @25* (Cruise available at 25 Pa)Pressure/Air Handler Flow*Pressure/Velocity
Data logging of pressure measurements from both channels requires TECLOG for Windows® (available free at www.energyconservatory.com) and a USB cable (included) to connect the DG-700 to a computer
7.5 x 4 x 1.25 inches (19.5 x 10.16 x 3.175 cm)
16.5 oz. (0.468 kg)
Calibration Meets ASTM Standard E779-03, E1554-07, CGSB-149.10-M86,EN 13829, ATTMA Technical Standard 1 and NFPA 2001, RESNET andUS ACE. Recommended calibration interval is 2 years.
™
Minneapolis Blower Door™ and TECTITE™ are trademarks of The Energy Conservatory. Duct Blaster® and TrueFlow® are registered trademarks of The Energy Conservatory.
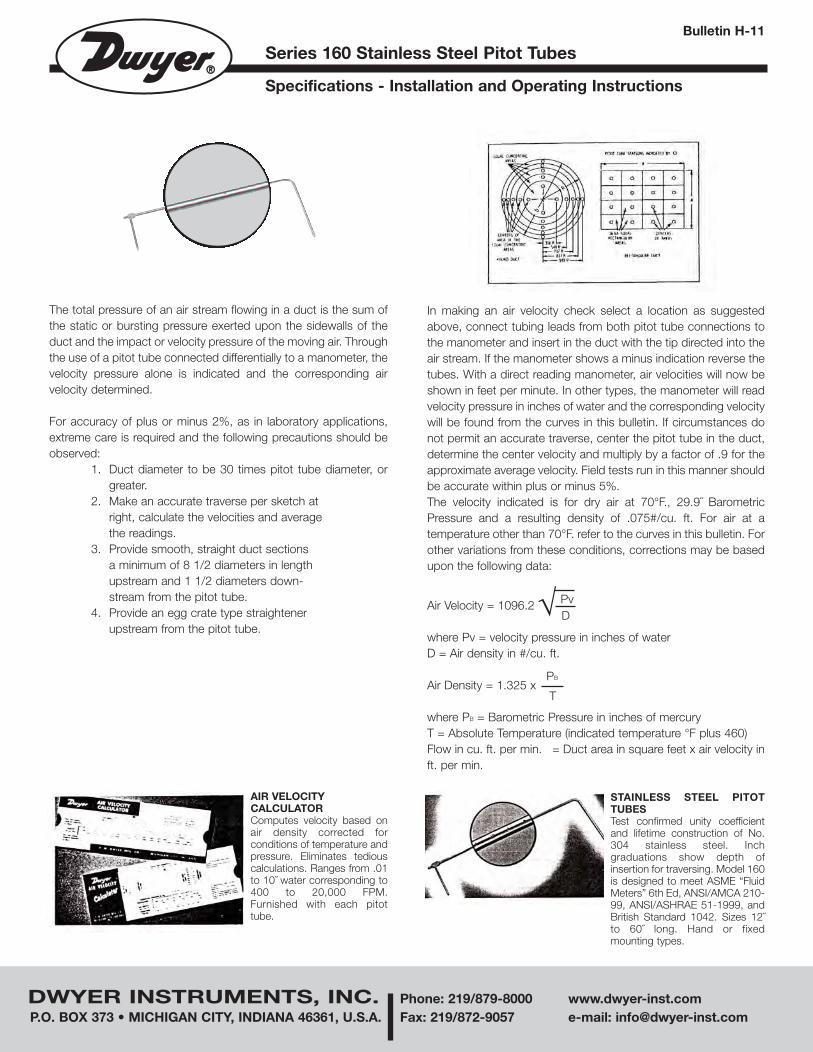
Series 160 Stainless Steel Pitot Tubes
Specifications - Installation and Operating Instructions
Bulletin H-11
DWYER INSTRUMENTS, INC. Phone: 219/879-8000 www.dwyer-inst.comP.O. BOX 373 • MICHIGAN CITY, INDIANA 46361, U.S.A. Fax: 219/872-9057 e-mail: [email protected]
The total pressure of an air stream flowing in a duct is the sum ofthe static or bursting pressure exerted upon the sidewalls of theduct and the impact or velocity pressure of the moving air. Throughthe use of a pitot tube connected differentially to a manometer, thevelocity pressure alone is indicated and the corresponding airvelocity determined.
For accuracy of plus or minus 2%, as in laboratory applications,extreme care is required and the following precautions should beobserved:
1. Duct diameter to be 30 times pitot tube diameter, orgreater.
2. Make an accurate traverse per sketch atright, calculate the velocities and averagethe readings.
3. Provide smooth, straight duct sectionsa minimum of 8 1/2 diameters in lengthupstream and 1 1/2 diameters down-stream from the pitot tube.
4. Provide an egg crate type straightenerupstream from the pitot tube.
Air Velocity = 1096.2
where Pv = velocity pressure in inches of waterD = Air density in #/cu. ft.
Air Density = 1.325 x
where PB = Barometric Pressure in inches of mercuryT = Absolute Temperature (indicated temperature °F plus 460)Flow in cu. ft. per min. = Duct area in square feet x air velocity inft. per min.
√ PvD
PB
T
AIR VELOCITYCALCULATORComputes velocity based onair density corrected forconditions of temperature andpressure. Eliminates tediouscalculations. Ranges from .01to 10˝ water corresponding to400 to 20,000 FPM.Furnished with each pitottube.
STAINLESS STEEL PITOTTUBESTest confirmed unity coefficientand lifetime construction of No.304 stainless steel. Inchgraduations show depth ofinsertion for traversing. Model 160is designed to meet ASME “FluidMeters” 6th Ed, ANSI/AMCA 210-99, ANSI/ASHRAE 51-1999, andBritish Standard 1042. Sizes 12˝to 60˝ long. Hand or fixedmounting types.
In making an air velocity check select a location as suggestedabove, connect tubing leads from both pitot tube connections tothe manometer and insert in the duct with the tip directed into theair stream. If the manometer shows a minus indication reverse thetubes. With a direct reading manometer, air velocities will now beshown in feet per minute. In other types, the manometer will readvelocity pressure in inches of water and the corresponding velocitywill be found from the curves in this bulletin. If circumstances donot permit an accurate traverse, center the pitot tube in the duct,determine the center velocity and multiply by a factor of .9 for theapproximate average velocity. Field tests run in this manner shouldbe accurate within plus or minus 5%.The velocity indicated is for dry air at 70°F., 29.9˝ BarometricPressure and a resulting density of .075#/cu. ft. For air at atemperature other than 70°F. refer to the curves in this bulletin. Forother variations from these conditions, corrections may be basedupon the following data:
H-11 8/30/05 3:33 PM Page 1

DWYER INSTRUMENTS, INC. Phone: 219/879-8000 www.dwyer-inst.comP.O. BOX 373 • MICHIGAN CITY, INDIANA 46361, U.S.A. Fax: 219/872-9057 e-mail: [email protected]
©Copyright 2005 Dwyer Instruments, Inc. Printed in U.S.A. 8/05 FR# 440226-00 Rev. 8
AIR
VE
LOC
ITY
IN
FE
ET
PE
R M
INU
TE
GAGE READING WITH PITOT TUBE (VELOCITY PRESSURE) IN INCHES OF WATER
GAGE READING WITH PITOT TUBE (VELOCITY PRESSURE) IN INCHES OF WATER
AIR
VE
LOC
ITY
IN
FE
ET
PE
R M
INU
TE
H-11 8/30/05 3:33 PM Page 2
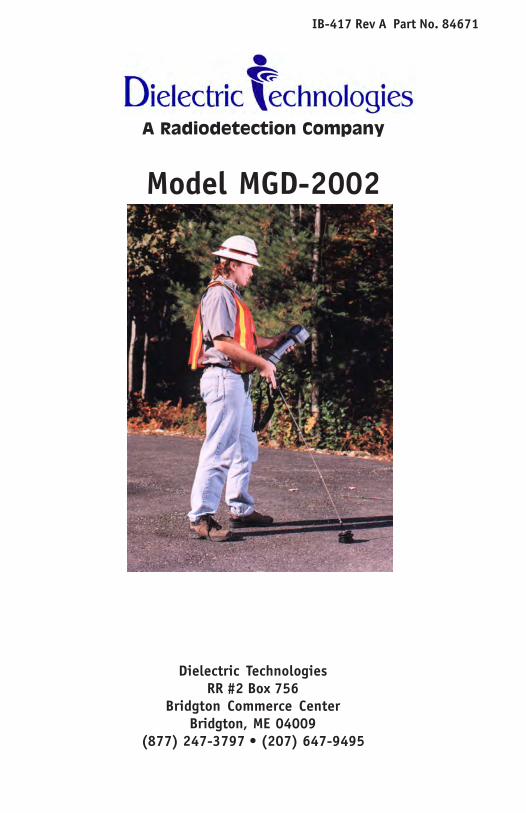
���������������� ����
Model MGD-2002
IB-417 Rev A Part No. 84671
Dielectric TechnologiesRR #2 Box 756
Bridgton Commerce CenterBridgton, ME 04009
(877) 247-3797 • (207) 647-9495
Service Information
Should a question, comment or problem arise, the informationbelow is provided as a guide. The number to call is (207) 647-9495or toll free at (877) 247-3797 with the appropriate extension givenbelow. When returning a unit for factory service or calibration, call thecustomer service department at ext. 116 for a material returnauthorization number (MRA). The device should be boxed securelyand contain information as to the person to contact, with telephonenumber, billing information, and return shipping information. Ifthe device is being sent to the factory for service, a written statementof the problem or symptoms should then be included. The MRAnumber must be on the outside of the package or indicated on theshipping label.
Dielectric TechnologiesRR #2 Box 756
Bridgton Commerce CenterBridgton, ME 04009
i
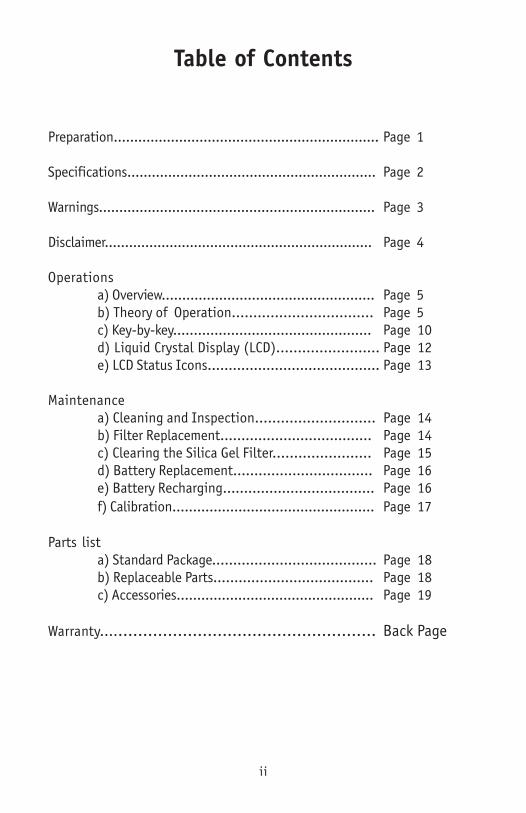
Table of Contents
Preparation................................................................. Page 1
Specifications............................................................. Page 2
Warnings.................................................................... Page 3
Disclaimer.................................................................. Page 4
Operationsa) Overview.................................................... Page 5b) Theory of Operation................................. Page 5c) Key-by-key................................................ Page 10d) Liquid Crystal Display (LCD)........................ Page 12e) LCD Status Icons......................................... Page 13
Maintenancea) Cleaning and Inspection............................ Page 14b) Filter Replacement.................................... Page 14c) Clearing the Silica Gel Filter....................... Page 15d) Battery Replacement................................. Page 16e) Battery Recharging.................................... Page 16f) Calibration................................................. Page 17
Parts lista) Standard Package....................................... Page 18b) Replaceable Parts...................................... Page 18c) Accessories................................................ Page 19
Warranty........................................................ Back Page
ii

PREPARATION
UPON DELIVERY
1) Immediately inspect the MGD-2002 for any physical damage thatmay have been caused during shipping. NOTE: The Manufacturer’swarranty does not cover damage caused in transit. You must notify yourcarrier immediately for any damage claims.
2) Turn the device over and open the battery compartment door.Remove the battery to expose the device information placard. Writethe unit serial number on the warranty information card.
3) Connect the battery plug to the main logic board. Close thebattery compartment door and secure with the quarter turn fastener.
4) Plug the Universal power supply into a convenient AC wall outlet(First), then plug the other end into the device (Second).
NOTE:Charge battery for 2 hours before operating the
Multi- gas detector for the first time!!
5) Complete the warranty information card supplied with theinstrument, and return it for your warranty registration.
6) Check the silica gel filter. Ensure the color is blue. Refer to page#14 for filter changing instructions, or page #15 for filter clearinginstructions.
7) Before turning the device on, connect either the needle probe orone of the extension rods to the probe assembly. Then connect theprobe assembly to the detector. The probe assembly has check valvesthat keep the ambient air from deteriorating the effectivenesss of thesilica gel filter.
1

Specifications
Dimensions: (LxWxD) 33.7cm x 12.3cm x 8.3cm(13.3in x 4.9in x 3.3in)
Weight: (MGD-2002 only) 1400 grams ( 3.1 lbs)(Shipping) 6800 grams (15.0 lbs)
Temperature Range : -10c to +45c(+14F to +113F)
Humidity Range : 20% RH to 50% RH
Sensitivity: (Min) 25 PPM(Max) 1,000,000PPM (100%)(Increment) 25 PPM
Selectivity : Hydrogen(H2) / Helium (He)
Resolution: (Low range) +/- 25 PPM(High Range) +/- 0.2 %
Response Time: 2 Seconds (approx.)
Audio Out : Pulse Width Modulation
LCD: 128 Bit X 64 Bit Dot MatrixWith long life backlight
Processor: (Type) Infineon (16 Bit)(Speed) 20 MHZ(ROM) 512 KBytes
Battery: (Voltage) 7.2 VDC(Type) Nickel Metal Hydride(Weight) 383.0 grams(Run Time) 6-8 Hours Continuous(Charging Cycles) 300 - 500(Charging Volts) 9.5 - 14 VDC @ 2A
2
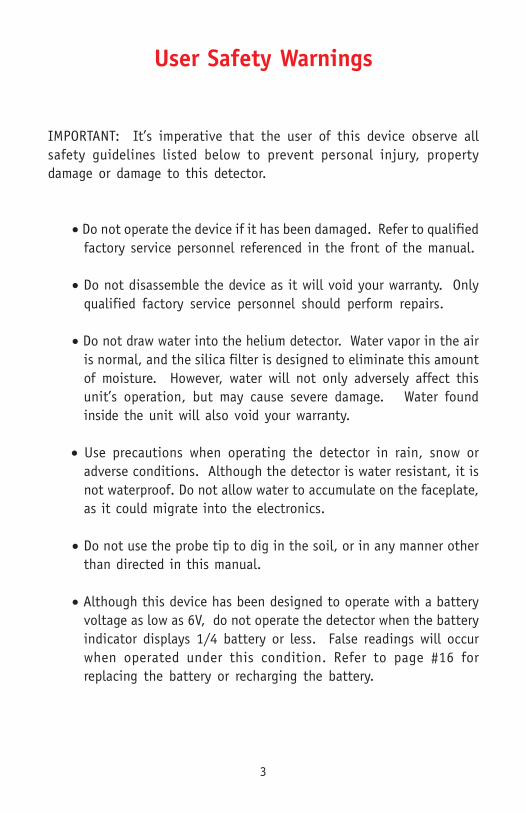
User Safety Warnings
IMPORTANT: It’s imperative that the user of this device observe allsafety guidelines listed below to prevent personal injury, propertydamage or damage to this detector.
• Do not operate the device if it has been damaged. Refer to qualifiedfactory service personnel referenced in the front of the manual.
• Do not disassemble the device as it will void your warranty. Onlyqualified factory service personnel should perform repairs.
• Do not draw water into the helium detector. Water vapor in the airis normal, and the silica filter is designed to eliminate this amountof moisture. However, water will not only adversely affect thisunit’s operation, but may cause severe damage. Water foundinside the unit will also void your warranty.
• Use precautions when operating the detector in rain, snow oradverse conditions. Although the detector is water resistant, it isnot waterproof. Do not allow water to accumulate on the faceplate,as it could migrate into the electronics.
• Do not use the probe tip to dig in the soil, or in any manner otherthan directed in this manual.
• Although this device has been designed to operate with a batteryvoltage as low as 6V, do not operate the detector when the batteryindicator displays 1/4 battery or less. False readings will occurwhen operated under this condition. Refer to page #16 forreplacing the battery or recharging the battery.
3

Disclaimer
The Occupational Safety and Health Administration(OSHA) states that the lower explosive limit for hydrogen(H2) gas is under 5%. Any concentration above thislevel, whether intentionally mixed or accidentally trappedin a confined space is highly explosive and unstable.
Since the MGD-2002 is capable of detecting bothHydrogen (H2) and Helium (He) gas without any operatorintervention, we recommend that if you do use Hydrogen(H2) gas, mix the remaining 96% with Helium (He) gasfor 100% usability and added safety.
4
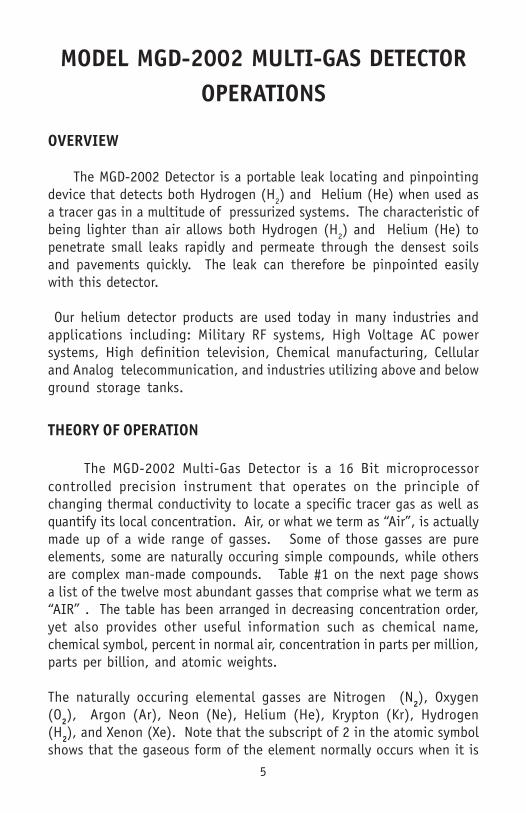
MODEL MGD-2002 MULTI-GAS DETECTOROPERATIONS
OVERVIEW
The MGD-2002 Detector is a portable leak locating and pinpointingdevice that detects both Hydrogen (H2) and Helium (He) when used asa tracer gas in a multitude of pressurized systems. The characteristic ofbeing lighter than air allows both Hydrogen (H2) and Helium (He) topenetrate small leaks rapidly and permeate through the densest soilsand pavements quickly. The leak can therefore be pinpointed easilywith this detector.
Our helium detector products are used today in many industries andapplications including: Military RF systems, High Voltage AC powersystems, High definition television, Chemical manufacturing, Cellularand Analog telecommunication, and industries utilizing above and belowground storage tanks.
THEORY OF OPERATION
The MGD-2002 Multi-Gas Detector is a 16 Bit microprocessorcontrolled precision instrument that operates on the principle ofchanging thermal conductivity to locate a specific tracer gas as well asquantify its local concentration. Air, or what we term as “Air”, is actuallymade up of a wide range of gasses. Some of those gasses are pureelements, some are naturally occuring simple compounds, while othersare complex man-made compounds. Table #1 on the next page showsa list of the twelve most abundant gasses that comprise what we term as“AIR” . The table has been arranged in decreasing concentration order,yet also provides other useful information such as chemical name,chemical symbol, percent in normal air, concentration in parts per million,parts per billion, and atomic weights.
The naturally occuring elemental gasses are Nitrogen (N2), Oxygen(O2), Argon (Ar), Neon (Ne), Helium (He), Krypton (Kr), Hydrogen(H2), and Xenon (Xe). Note that the subscript of 2 in the atomic symbolshows that the gaseous form of the element normally occurs when it is
5
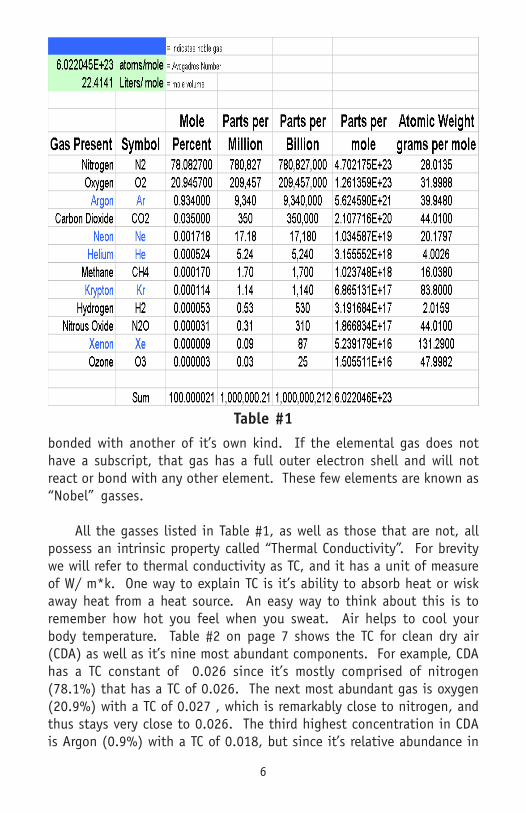
Table #1bonded with another of it’s own kind. If the elemental gas does nothave a subscript, that gas has a full outer electron shell and will notreact or bond with any other element. These few elements are known as“Nobel” gasses.
All the gasses listed in Table #1, as well as those that are not, allpossess an intrinsic property called “Thermal Conductivity”. For brevitywe will refer to thermal conductivity as TC, and it has a unit of measureof W/ m*k. One way to explain TC is it’s ability to absorb heat or wiskaway heat from a heat source. An easy way to think about this is toremember how hot you feel when you sweat. Air helps to cool yourbody temperature. Table #2 on page 7 shows the TC for clean dry air(CDA) as well as it’s nine most abundant components. For example, CDAhas a TC constant of 0.026 since it’s mostly comprised of nitrogen(78.1%) that has a TC of 0.026. The next most abundant gas is oxygen(20.9%) with a TC of 0.027 , which is remarkably close to nitrogen, andthus stays very close to 0.026. The third highest concentration in CDAis Argon (0.9%) with a TC of 0.018, but since it’s relative abundance in
6
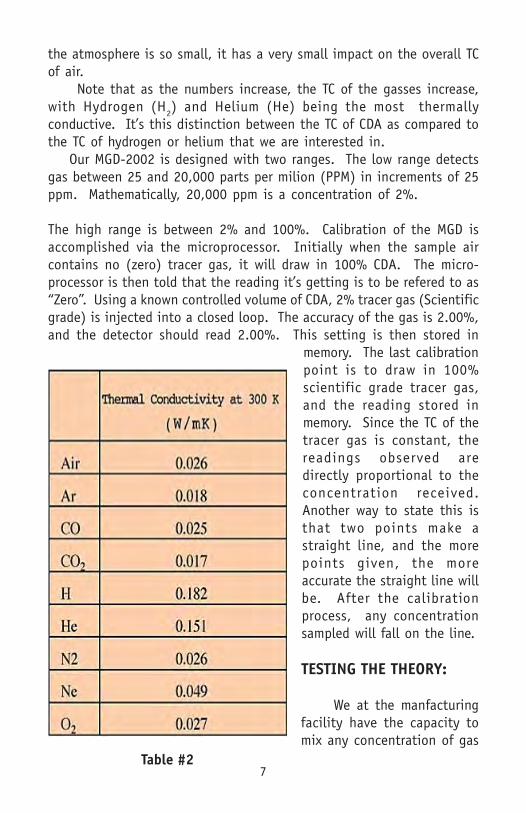
Table #2
the atmosphere is so small, it has a very small impact on the overall TCof air. Note that as the numbers increase, the TC of the gasses increase,with Hydrogen (H2) and Helium (He) being the most thermallyconductive. It’s this distinction between the TC of CDA as compared tothe TC of hydrogen or helium that we are interested in. Our MGD-2002 is designed with two ranges. The low range detectsgas between 25 and 20,000 parts per milion (PPM) in increments of 25ppm. Mathematically, 20,000 ppm is a concentration of 2%.
The high range is between 2% and 100%. Calibration of the MGD isaccomplished via the microprocessor. Initially when the sample aircontains no (zero) tracer gas, it will draw in 100% CDA. The micro-processor is then told that the reading it’s getting is to be refered to as“Zero”. Using a known controlled volume of CDA, 2% tracer gas (Scientificgrade) is injected into a closed loop. The accuracy of the gas is 2.00%,and the detector should read 2.00%. This setting is then stored in
memory. The last calibrationpoint is to draw in 100%scientific grade tracer gas,and the reading stored inmemory. Since the TC of thetracer gas is constant, thereadings observed aredirectly proportional to theconcentration received.Another way to state this isthat two points make astraight line, and the morepoints given, the moreaccurate the straight line willbe. After the calibrationprocess, any concentrationsampled will fall on the line.
TESTING THE THEORY:
We at the manfacturingfacility have the capacity tomix any concentration of gas
7
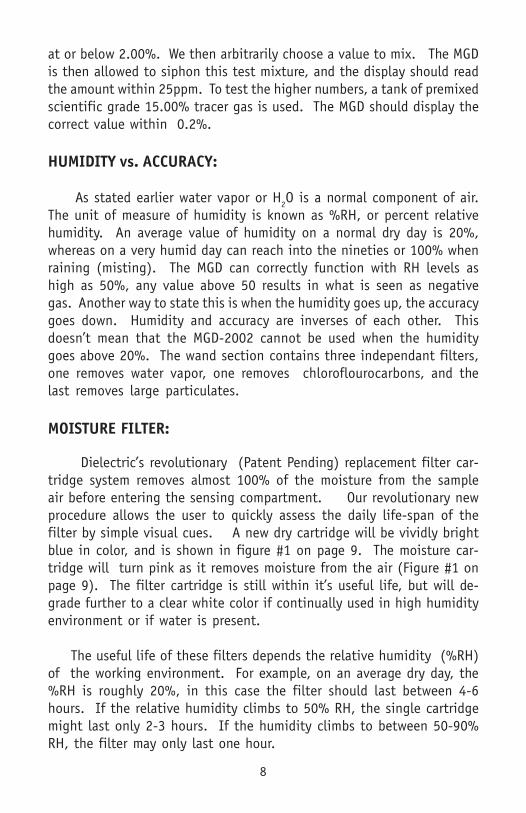
at or below 2.00%. We then arbitrarily choose a value to mix. The MGDis then allowed to siphon this test mixture, and the display should readthe amount within 25ppm. To test the higher numbers, a tank of premixedscientific grade 15.00% tracer gas is used. The MGD should display thecorrect value within 0.2%.
HUMIDITY vs. ACCURACY:
As stated earlier water vapor or H2O is a normal component of air.The unit of measure of humidity is known as %RH, or percent relativehumidity. An average value of humidity on a normal dry day is 20%,whereas on a very humid day can reach into the nineties or 100% whenraining (misting). The MGD can correctly function with RH levels ashigh as 50%, any value above 50 results in what is seen as negativegas. Another way to state this is when the humidity goes up, the accuracygoes down. Humidity and accuracy are inverses of each other. Thisdoesn’t mean that the MGD-2002 cannot be used when the humiditygoes above 20%. The wand section contains three independant filters,one removes water vapor, one removes chloroflourocarbons, and thelast removes large particulates.
MOISTURE FILTER:
Dielectric’s revolutionary (Patent Pending) replacement filter car-tridge system removes almost 100% of the moisture from the sampleair before entering the sensing compartment. Our revolutionary newprocedure allows the user to quickly assess the daily life-span of thefilter by simple visual cues. A new dry cartridge will be vividly brightblue in color, and is shown in figure #1 on page 9. The moisture car-tridge will turn pink as it removes moisture from the air (Figure #1 onpage 9). The filter cartridge is still within it’s useful life, but will de-grade further to a clear white color if continually used in high humidityenvironment or if water is present.
The useful life of these filters depends the relative humidity (%RH)of the working environment. For example, on an average dry day, the%RH is roughly 20%, in this case the filter should last between 4-6hours. If the relative humidity climbs to 50% RH, the single cartridgemight last only 2-3 hours. If the humidity climbs to between 50-90%RH, the filter may only last one hour.
8
Figure #1Spent Cartridge Dry Cartridge
What makes our filters so revolutionary is that even on the mosthumid of days, these filters can be replaced within seconds, or clearedand reused within minutes. Please refer to page #15 for instructionson how to clear these filters.
METHANE vs. ACCURACY:
There are certain gasses that the MGD-2002 cannot eliminate, andmethane (CH4) is the most abundant and troublesome of them all. Justlike humidity, methane has a warming effect. Referring back to table#2 on page #7, the higher the TC number the greater the cooling effect.Methane’s number is so small, it acts like a negative tracer gas. Thus ithas a warming thermoconductivy or -TC. What makes methane so trouble-some is that it’s very small and can thus pass through most filters with-out detection or elimination. Even in today’s high tech environment,the only way to eliminate methane is to burn it off. Unfortunately, in ahand held device, burning off stray gasses is not an option.
Other gasses such as Propane (C3H8), Pentane (C5H12), and Ethane(C2H6), Carbon Dioxide (CO2), Carbon Monoxide (CO), Nitrous Oxide(N2O), and Ozone (O3), and most other CFC’s also have a negative TC (-TC), but are easily eliminated by the second filter in the wand section.Unfortunately the crushed activated charcoal has a limited useful lifewhen used in an environment of high organic compounds such as thosementioned. It’s for this reason we at Dielectric strongly suggest return-ing the MGD-2002 at a minimum of once a year to recalibrate. Duringfactory recalibration, the silica gel filters are cleared, and the other twofilters are replaced. Refer to page #17 for all the value added benefitsthat are included in a factory recalibration.
9
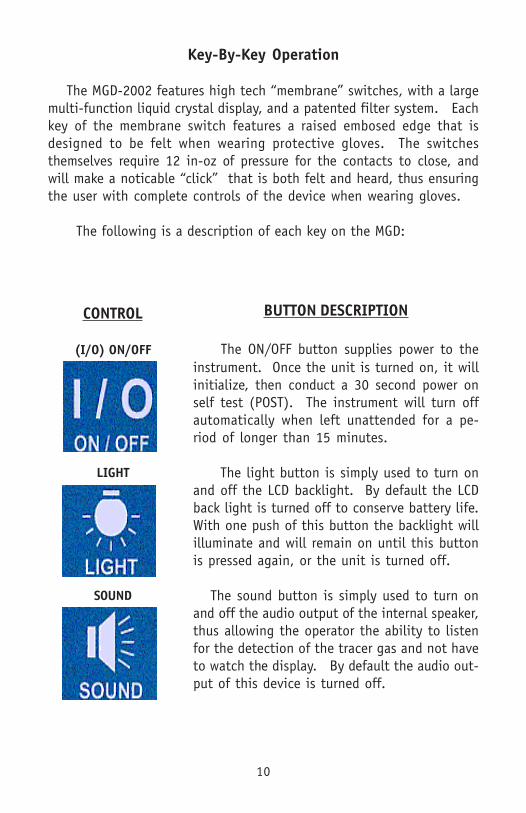
Key-By-Key Operation
The MGD-2002 features high tech “membrane” switches, with a largemulti-function liquid crystal display, and a patented filter system. Eachkey of the membrane switch features a raised embosed edge that isdesigned to be felt when wearing protective gloves. The switchesthemselves require 12 in-oz of pressure for the contacts to close, andwill make a noticable “click” that is both felt and heard, thus ensuringthe user with complete controls of the device when wearing gloves.
The following is a description of each key on the MGD:
CONTROL
(I/O) ON/OFF
LIGHT
SOUND
BUTTON DESCRIPTION
The ON/OFF button supplies power to theinstrument. Once the unit is turned on, it willinitialize, then conduct a 30 second power onself test (POST). The instrument will turn offautomatically when left unattended for a pe-riod of longer than 15 minutes.
The light button is simply used to turn onand off the LCD backlight. By default the LCDback light is turned off to conserve battery life.With one push of this button the backlight willilluminate and will remain on until this buttonis pressed again, or the unit is turned off.
The sound button is simply used to turn onand off the audio output of the internal speaker,thus allowing the operator the ability to listenfor the detection of the tracer gas and not haveto watch the display. By default the audio out-put of this device is turned off.
10

PROBE
RESET
A/M
SAMPLE
The Probe button is only used in the manualmode, and tells the microprosessor how many physi-cal lengths of probe are attached to the unit. Thisis done to mathematically calculate how long it willtake to get a sample from the boot to the sensingelements.
The Reset button allows the unit to remain pow-ered but clears all the internal logic circuitry. Thedevice goes through its zeroing routine to deter-mine a new baseline. This button is preferred toturning the device off and back on in that it main-tains power to the sensing elements, thus main-taining sensor stability. Only press this button in azero tracer gas environment.
MODE: this button controls what is being dis-played on the LCD. By default the unit is in auto-matic mode and will constantly show what the sens-ing elements have detected in both concentrationas well as time. If the unit is placed in the manualmode, the device will continue to draw in samplesas normal. However, when the sample button ispressed, the LCD no longer shows time, but will onlyshow what the sensors are detecting at that oneparticular moment of time.
The sample button tells the microprocessor totake one reading. Upon pressing this button, themicroprocessor looks at the probe length selectedand calculates how long it should take for the sampleto get to the detector, takes the sample, then dis-plays the result.This is a one shot button, meaning that for everysample needed, the sample button must be re-pressed.
11
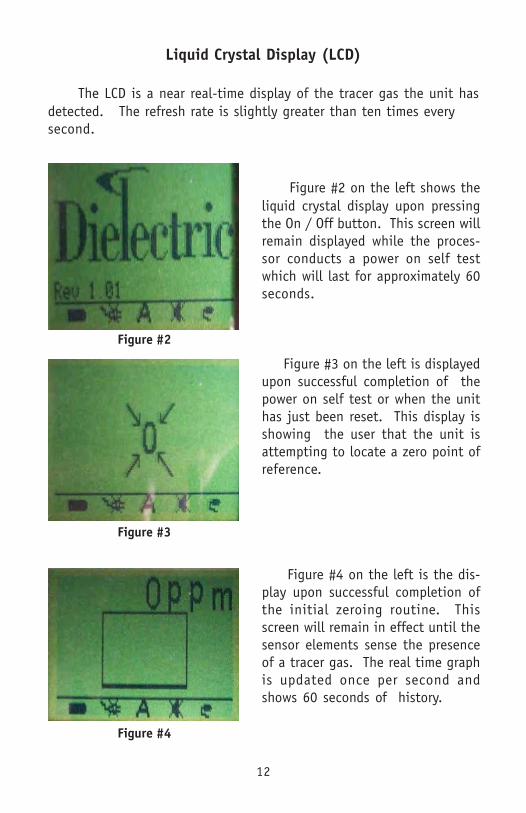
Liquid Crystal Display (LCD)
The LCD is a near real-time display of the tracer gas the unit hasdetected. The refresh rate is slightly greater than ten times everysecond.
Figure #2
Figure #3
Figure #4
Figure #2 on the left shows theliquid crystal display upon pressingthe On / Off button. This screen willremain displayed while the proces-sor conducts a power on self testwhich will last for approximately 60seconds.
Figure #3 on the left is displayedupon successful completion of thepower on self test or when the unithas just been reset. This display isshowing the user that the unit isattempting to locate a zero point ofreference.
Figure #4 on the left is the dis-play upon successful completion ofthe initial zeroing routine. Thisscreen will remain in effect until thesensor elements sense the presenceof a tracer gas. The real time graphis updated once per second andshows 60 seconds of history.
12

LCD STATUS ICONS There are five small icons shown at the bottom of the LCD screen.The icon as well as it’s function is displayed below listed in the order inwhich they are displayed on the LCD from left to right.
NOTE:A function that has been turned off, will have an X through it’s icon
BATTERY STATUS This icon gives the user a visual indicator of the rela-tive life-span remaining on the battery. When the bat-tery drops below 1/4, a warning beep will sound. Theunit will automatically shut off when an empty batteryis shown
RECHARGE STATUS This icon is either displayed, or crossed out. If theunit is recharging, the icon will change to a lighteningbolt and back to a plug when complete.
MODE There are two possible modes of operation for thisdevice, either automatic (A) or manual (M), thus thisfield will show and A or an M.
SOUND STATUS By default the MDG-2002 has the speaker disabledto conserve battery power. Thus the speaker symbolwill initially have an X through it. Pressing the speakerbutton once will remove the X and enable the audio outcircuitry.
PROBE LENGTH This icon is only used in the manual (M) mode.When the sample button is pressed, the microprocessortakes a reading based on how many lengths of probethat are being used. This icon shows how many lengths,and the timing is based on the lengths used as well aslengths displayed.
ICON
13
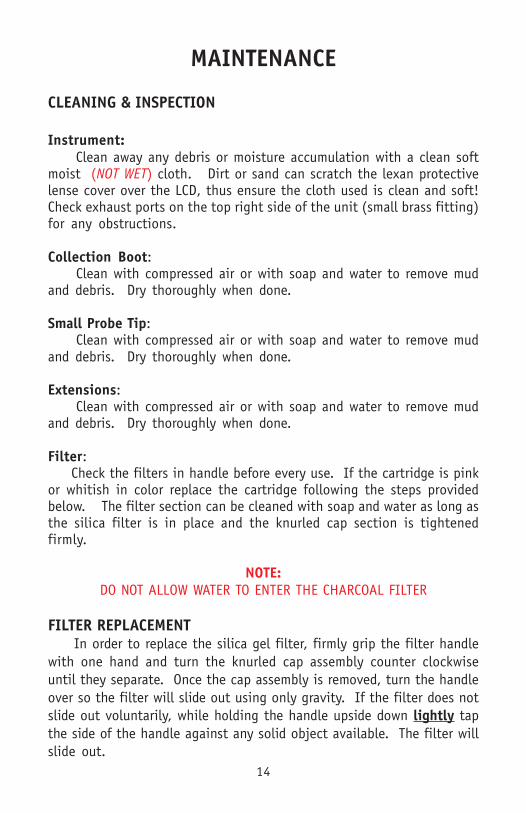
MAINTENANCE
CLEANING & INSPECTION
Instrument: Clean away any debris or moisture accumulation with a clean softmoist (NOT WET) cloth. Dirt or sand can scratch the lexan protectivelense cover over the LCD, thus ensure the cloth used is clean and soft!Check exhaust ports on the top right side of the unit (small brass fitting)for any obstructions.
Collection Boot: Clean with compressed air or with soap and water to remove mudand debris. Dry thoroughly when done.
Small Probe Tip: Clean with compressed air or with soap and water to remove mudand debris. Dry thoroughly when done.
Extensions: Clean with compressed air or with soap and water to remove mudand debris. Dry thoroughly when done.
Filter: Check the filters in handle before every use. If the cartridge is pinkor whitish in color replace the cartridge following the steps providedbelow. The filter section can be cleaned with soap and water as long asthe silica filter is in place and the knurled cap section is tightenedfirmly.
NOTE:DO NOT ALLOW WATER TO ENTER THE CHARCOAL FILTER
FILTER REPLACEMENT In order to replace the silica gel filter, firmly grip the filter handlewith one hand and turn the knurled cap assembly counter clockwiseuntil they separate. Once the cap assembly is removed, turn the handleover so the filter will slide out using only gravity. If the filter does notslide out voluntarily, while holding the handle upside down lightly tapthe side of the handle against any solid object available. The filter willslide out.
14
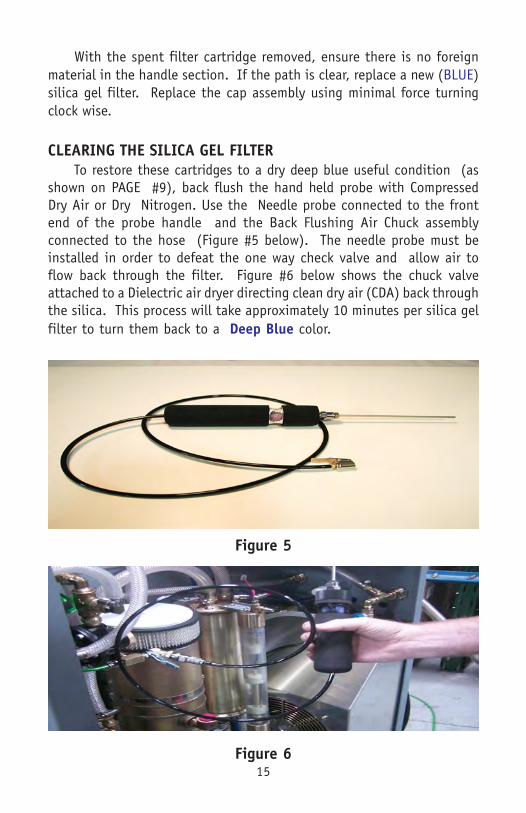
With the spent filter cartridge removed, ensure there is no foreignmaterial in the handle section. If the path is clear, replace a new (BLUE)silica gel filter. Replace the cap assembly using minimal force turningclock wise.
CLEARING THE SILICA GEL FILTER To restore these cartridges to a dry deep blue useful condition (asshown on PAGE #9), back flush the hand held probe with CompressedDry Air or Dry Nitrogen. Use the Needle probe connected to the frontend of the probe handle and the Back Flushing Air Chuck assemblyconnected to the hose (Figure #5 below). The needle probe must beinstalled in order to defeat the one way check valve and allow air toflow back through the filter. Figure #6 below shows the chuck valveattached to a Dielectric air dryer directing clean dry air (CDA) back throughthe silica. This process will take approximately 10 minutes per silica gelfilter to turn them back to a Deep Blue color.
Figure 5
Figure 615
BATTERY REPLACEMENT
����Turn the device over and remove the battery compartment cover us-ing a flat tip screwdriver. The fastener requires only minimal pressureand 1/4 turn counter clockwise. Remove the battery and pull up on thethree pin connector. This connector is keyed to ensure one way instal-lation.
Before installing the new battery, ensure the power connector is at-tached to the circuit board. Once the battery jack is connected, lay thebattery in it’s berth, then replace the battery compartment cover. Againthe screw requires minimal pressure and only 1/4 turn clockwise.
BATTERY RECHARGING
The MGD-2002 comes equipped with the jacks and adapters neces-sary to recharge your unit either back at the office or while working inthe field. Refer to page #18 for a list of items that comes standard withthis device.
To charge this device using the universal power supply, simply plugin the universal AC power supply to any standard wall outlet (first) andthen plug in the DC output plug to the device (Second). The internalsoftware will detect the presence of the charger and will turn off thedetection capability while the unit is in charge.
To charge this device using the standard 12VDC auto adapter, simplyplug the auto adapter into the cigarette lighter jack (first) and then theoutput jack into the device (Second). Again, the internal software willdetect the presence of the charger and will turn off the detection capa-bility while the unit is in charge.
The Nickel Metal Hydride (NiMh) battery is equipped with a tempera-ture sensing element to ensure the battery will not over heat and ex-plode during the charge cycle. Should the ambient temperature be toohot, the sensor may cause the recharge circuitry to shut off prema-turely. As such, it’s highly recommended that this unit be charged awayfrom any heat sources.
Although NiMh batteries are some of the best rechargeable batterieson the market today, there are still some inherent draw backs with theiruse. One such issue is that even if the device is unused for an extendedperiod of time, these batteries lose 40% of their charge during the firstmonth and 20% every month after that. Thus it’s highly recommendedthat the unit be recharged before use.
16
Calibration:
The MGD-2002 is a precision measuring device that requires factorycalibration in order to ensure continued and sustained optimum oper-ating performance. Periodicity between calibration cycles is dependanton the environment in which the device is to be used, the end user’scriteria for the equipment, and the amount of time the equipment isused throughout the year. For example, decision criteria for choosing acalibration periodicity includes items such as the environment, is thedevice going to be used in a harsh environment or in a clean room?How frequently is this device going to be used (once a month, every sixmonths or daily)? Is the highest accuracy strictly required or is the enduser just identifying the area with the highest concentration of hydro-gen or helium?
We at Dielectric recommend that if you frequently use this device orthe accuracy is strictly required, the calibration should be a minimum ofonce per year. If however the device is used infrequently or the accu-racy is not as critical, factory recalibration can be delayed to as much asevery two years.
Sending the unit back for calibration is not limited to the yearly orbiannual calibration cycle chosen. For example, the user may suspectinaccurate operation that may be the result of the filters or plumbingbeing compromised with an oil residue, oil vapors, water, dirt, petro-leum vapors, or some other foreign material including grass and in-sects.
During the factory re-calibration, the following value added stepsand procedures will be accomplished:
1) Inspection2) Light cleaning (As required)3) Silica gel filter dried (As required)4) Carbon filter replaced5) Intake and exhaust filter replaced6) Air volume checked and adjusted7) Temperature sensors checked and adjusted8) Software updates installed (As available)9) Calibration procedure completed10) ISO Calibration Certificate (Optional)
17

PARTS LISTS
A) STANDARD PACKAGE
Upon initial receipt of the MGD-2002 multi-gas detector, the following components come included as standard items. Numbers in parenthasesis indicate the quantity included.
1) MGD-2002 Multi-gas Detector PN: 79766
2) Silica gel drying adapter PN: 84972
3) Probe Assembly PN: 83325
4) 7.2V Nickle Metal Hydride Battery PN: 82492
5) Carrying Strap PN: 84923
6) 12VDC auto plug in adapter PN: 84677
7) 100-24VAC Universal AC charger PN: 84673 W / North American power cord
8) Eurpoean power cord PN: 84674
9) Boot Housing PN: 84210
10) Extension Rods (2) PN: 83325
11) Instruction Booklet (IB-417) PN: 84671
12) Warranty Card (Serialized) PN: 84973
13) Needle Probe PN: 84165
14) Moisture Cartridge (2) PN: 83220
15) Carrying Case PN: 84672
18
B) REPLACABLE PARTS
If for any reason a field replaceable unit (FRU) is required, the following list of items is provided to ease the ordering process. Note: Only user replaceable items are listed. If for any reason an item is needed that is not on this list, the device should be sent back to Dielectric Communications for repair and recalibration:
1) Moisture Cartridge PN: 83220
2) Spare Battery PN: 82492
3) Boot Housing PN: 84210
4)12VDC auto plug in adapter PN: 84677
5)100-24VAC Universal AC charger PN: 84673
6) Eurpoean power cord PN: 84674
7) Extension Rods (2) PN: 83325
8) Needle Probe PN: 84165
C) Accessories (Options)
the following is a list of items that are recommnended for use with the MGD-2002 Multi-gas detector that do not come as a standard item. Items without part numbers are still in the design phase and have not yet been assigned. (N/A)
1) Head Phones PN: 882-0007
2) Overhead Wire Boot PN: N / A
3) Non-metallic Probe Assembly PN: N / A
4) Downloadable Software Revisions PN: N / A
19
WARRANTY
The Manufacturer warrants that all goods supplied hereunder, whetheror not of its own manufacture, will be of the kind described herein or inany specification and drawing approved by the Manufacturer and ofmerchantable quality and free from defects in material or workmanshipunder normal use and prescribed maintenance for a period of one (1)year, with the exception of air dryers utilizing water sealed compressorsas well as the compressors themselves which shall be for two (1) years.Neither this warranty nor any other, expressed or implied, shall apply togoods delivered hereunder which have been damaged or subjected toalteration or negligence after delivery. The Manufacturer's only obliga-tion for breach of this warranty shall be the repair, without charge, or thefurnishing F.O.B. Bridgton, Maine, of a similar part to replace any partwhich within one (1) year, with the exception as noted above, from dateof shipment is proven to have been defective, provided that (i) thePurchaser shall have notified the Manufacturer within ten (10) days ofthe discovery of such defect and not later than ten (10) days after thelast day of this warranty, and (ii) the Manufacturer shall have the optionof requiring the return of the defective material (transportation prepaid)to establish the claim. The Manufacturer shall not in any event be liablefor the Purchaser's manufacturing costs, loss of profits, good will or anyother special, consequential, incidental, or other damages resultingfrom such defects. THERE ARE NO OTHER WARRANTIES, EXPRESSED ORIMPLIED, WHICH EXTEND BEYOND THE WARRANTY SET FORTH HEREIN.
Dielectric TechnologiesBridgton Commerce Center
Bridgton, ME 04009(877) 247-3797 • (207) 647-9495
MultiRAE User’s Guide
Rev C November 2011
P/N: M01-4003-000

© 2011 RAE Systems, Inc.
Product Registration Register your product online by visiting:
http://www.raesystems.com/support/product-registration
By registering your product, you can:
Receive notification of product upgrades or enhancements Be alerted to Training classes in your area Take advantage of RAE Systems special offers and promotions
MultiRAE User’s Guide
1
Contents 1 Standard Contents ........................................................................................................................................ 6 2 General Information ..................................................................................................................................... 7
2.1 Key Features ....................................................................................................................................... 8 3 User Interface............................................................................................................................................... 9
3.1 Display Overview ............................................................................................................................... 9 3.1.1 Status Indicator Icons ................................................................................................................... 9 3.1.2 LCD Flip .................................................................................................................................... 10 3.1.3 Keys & Interface ........................................................................................................................ 10
3.2 Screen Display For Various Numbers Of Active Sensors ................................................................ 11 3.3 Menus ............................................................................................................................................... 12
4 Battery ....................................................................................................................................................... 15 4.1 Using The Charging Cradle .............................................................................................................. 15 4.2 Using The Travel Charger ................................................................................................................ 15 4.3 Replacing A Battery ......................................................................................................................... 16 4.4 Battery States .................................................................................................................................... 16 4.5 Alkaline Battery Pack ....................................................................................................................... 16
5 Turning The MultiRAE On And Off ......................................................................................................... 18 5.1 Turning The MultiRAE On .............................................................................................................. 18 5.2 Turning The MultiRAE Off .............................................................................................................. 18 5.3 Testing Alarm Indicators .................................................................................................................. 18 5.4 Pump Status ...................................................................................................................................... 19 5.5 Calibration Status ............................................................................................................................. 19
6 Modes Of Operation .................................................................................................................................. 20 6.1 Hygiene Operation Mode ................................................................................................................. 20 6.2 Search Operation Mode .................................................................................................................... 20 6.3 Basic User Mode .............................................................................................................................. 20 6.4 Advanced User Mode ....................................................................................................................... 20
7 Programming ............................................................................................................................................. 20 7.1 Enter Programming In Advanced Mode ........................................................................................... 20 7.2 Enter Programming In Basic Mode .................................................................................................. 21 7.3 Menus And Submenus ...................................................................................................................... 22
7.3.1 Editing And Selecting Parameters And Sensors ........................................................................ 22 7.3.2 Calibration ................................................................................................................................. 23
7.3.2.1 Fresh Air ............................................................................................................................ 23 7.3.2.2 Multi Sensor Span ............................................................................................................. 23 7.3.2.3 Single Sensor Zero ............................................................................................................ 23 7.3.2.4 Single Sensor Span ............................................................................................................ 23 7.3.2.5 Cal. Reference ................................................................................................................... 23 7.3.2.6 Change Cal. Gas ................................................................................................................ 23 7.3.2.7 Multi Cal Select ................................................................................................................. 24 7.3.2.8 Change Span Value ........................................................................................................... 24 7.3.2.9 Change Span2 Value ......................................................................................................... 24
7.3.3 Measurement .............................................................................................................................. 24 7.3.3.1 Sensor On/Off .................................................................................................................... 24 7.3.3.2 Change Meas. Gas ............................................................................................................. 25 7.3.3.3 Measurement Units ............................................................................................................ 25
7.3.4 Alarms ........................................................................................................................................ 26 7.3.4.1 Alarm Limits ..................................................................................................................... 26 7.3.4.2 Alarm Mode ...................................................................................................................... 26 7.3.4.3 Alarm Settings ................................................................................................................... 26 7.3.4.4 Comfort Beep .................................................................................................................... 26 7.3.4.5 Man Down Alarm .............................................................................................................. 26
7.3.5 Datalog ....................................................................................................................................... 27 7.3.5.1 Clear Datalog ..................................................................................................................... 27 7.3.5.2 Datalog Interval ................................................................................................................. 27
MultiRAE User’s Guide
2
7.3.5.3 Sensor Selection ................................................................................................................ 28 7.3.5.4 Data Selection .................................................................................................................... 28 7.3.5.5 Datalog Type ..................................................................................................................... 28 7.3.5.6 Memory Full Action .......................................................................................................... 29
7.3.6 Wireless ..................................................................................................................................... 29 7.3.7 Monitor ...................................................................................................................................... 29
7.3.7.1 LCD Contrast .................................................................................................................... 29 7.3.7.2 Operation Mode ................................................................................................................. 29 7.3.7.3 Pump Speed ....................................................................................................................... 29 7.3.7.4 Zero At Start ...................................................................................................................... 29 7.3.7.5 Fast Startup ........................................................................................................................ 29 7.3.7.6 Temperature Units ............................................................................................................. 29 7.3.7.7 Language ........................................................................................................................... 30 7.3.7.8 Site ID................................................................................................................................ 30 7.3.7.9 User ID .............................................................................................................................. 30 7.3.7.10 Date Format ....................................................................................................................... 30 7.3.7.11 Date ................................................................................................................................... 30 7.3.7.12 Time Format ...................................................................................................................... 30 7.3.7.13 Time................................................................................................................................... 30 7.3.7.14 User Mode ......................................................................................................................... 30 7.3.7.15 Backlight ........................................................................................................................... 30 7.3.7.16 LCD Flip ............................................................................................................................ 30
8 Calibration And Testing ............................................................................................................................ 31 8.1 Bump Testing And Calibration ......................................................................................................... 31
8.1.1 Bump (Functional) Testing ........................................................................................................ 31 8.2 Zero/Fresh Air Calibration ............................................................................................................... 31
8.2.1 Zero Calibration For A CO2 Sensor ........................................................................................... 31 8.2.2 Fresh Air Calibration ................................................................................................................. 31 8.2.3 Single-Sensor Zero Calibration.................................................................................................. 32
8.3 Span Calibration ............................................................................................................................... 32 8.3.1 Multi-Sensor Span Calibration .................................................................................................. 33 8.3.2 Single-Sensor Span Calibration ................................................................................................. 34
8.4 Testing The Gamma Sensor .............................................................................................................. 34 9 Datalog Transfer, Monitor Configuration, and Firmware Upgrades Via Computer .................................. 35
9.1 Downloading Datalogs And Performing PC-Based Instrument Configuration and Firmware Upgrades ......................................................................................................................... 35
10 Maintenance ............................................................................................................................................... 36 10.1 Removing/Installing The Rubber Boot ............................................................................................. 36 10.2 Replacing The Filter ......................................................................................................................... 36 10.3 Replacing The Inlet .......................................................................................................................... 36 10.4 Removing/Cleaning/Replacing A PID (Pump Version Only) .......................................................... 37 10.5 Removing/Cleaning/Replacing Sensor Modules .............................................................................. 38 10.6 Replacing The Pump ........................................................................................................................ 39
11 Alarms Overview ....................................................................................................................................... 39 11.1 Alarm Signals ................................................................................................................................... 39 11.2 Changing The Alarm Mode .............................................................................................................. 39 11.3 Alarm Signal Summary .................................................................................................................... 40
12 Troubleshooting ......................................................................................................................................... 43 13 Diagnostic Mode ........................................................................................................................................ 44
13.1 Entering Diagnostic Mode ................................................................................................................ 44 13.2 Exiting Diagnostic Mode .................................................................................................................. 44 13.3 Navigating Diagnostic Mode ............................................................................................................ 44
14 Specifications ............................................................................................................................................. 46 15 Technical Support ...................................................................................................................................... 50 16 RAE Systems Contacts .............................................................................................................................. 51
MultiRAE User’s Guide
3
WARNINGS
Read Before Operating
This manual must be carefully read by all individuals who have or will have the responsibility of using, maintaining, or servicing this product. The product will perform as designed only if it is used, maintained, and serviced in accordance with the manufacturer’s instructions.
CAUTION! Never operate the monitor when the cover is removed. Remove the monitor rear cover or battery only in an area known to be non-hazardous.
ANY RAPID UP-SCALE READING FOLLOWED BY A DECLINING OR ERRATIC READING MAY INDICATE A GAS CONCENTRATION BEYOND UPPER SCALE LIMIT, WHICH MAY BE HAZARDOUS. TOUTE LECTURE RAPIDE ET POSITIVE, SUIVIE D’UNE BAISSE SUBITE AU ERRATIQUE DE LA VALEUR, PEUT INDIQUER UNE CONCENTRATION DE GAZ HORS GAMME DE DÉTECTION QUI PEUT ÊTRE DANGEREUSE ONLY THE COMBUSTIBLE GAS DETECTION PORTION OF THIS INSTRUMENT HAS BEEN ASSESSED FOR PERFORMANCE.
UNIQUMENT, LA PORTION POUR DÉTECTOR LES GAZ COMBUSTIBLES DE CET INSTRUMENT A ÉTÉ ÉVALUÉE.
CAUTION: BEFORE EACH DAY’S USAGE, SENSITIVITY OF THE LEL SENSOR MUST BE TESTED ON A KNOWN CONCENTRATION OF METHANE GAS EQUIVALENT TO 20 TO 50% OF FULL-SCALE CONCENTRATION. ACCURACY MUST BE WITHIN 0 AND +20% OF ACTUAL. ACCURACY MAY BE CORRECTED BY CALIBRATION PROCEDURE.
ATTENTION: AVANT CHAQUE UTILISATION JOURNALIERE, VERIFIER LA SENSIBILITE DU CAPTEUR DE LIE AVEC UNE CONCENTRATION CONNUE DE METHANE EQUIVALENTE DE 20 A 50% DE LA PLEINE ECHELLE. LA PRECISION DOIT ETRE COMPRISE ENTRE 0 ET 20% DE LA VALEUR VRAIE ET PEUT ETRE CORRIGEE PAR UNE PROCEDURE D’ETALONNAGE.
CAUTION: HIGH OFF-SCALE READINGS MAY INDICATE AN EXPLOSIVE CONCENTRATION. ATTENTION: DES LECTURES HAUTES ET HORS D’ECHELLE PEUVENT INDIQUER DES CONCENTRATIONS DE GAZ INFLAMMABLES CAUTION: SUBSTITUTION OF COMPONENTS MAY IMPAIR INTRINSIC SAFETY. Note: Users are recommended to refer to ISA-RP12.13, Part II-1987 for general information on installation, operation, and maintenance of combustible gas detection instruments.
The MultiRAE multi-gas detector must be calibrated if it does not pass a bump test, or at least once every 180 days, depending on use and sensor exposure to poisons and contaminants.

MultiRAE User’s Guide
4
SPECIAL CONDITIONS FOR SAFE USE
1. The PGM-62xx shall only be fitted with RAE Systems Battery Pack type M01-3051-000 or M01-3053-000 or Battery Adapter M01-3052-000 or M01-3054-000 fitted with Duracell MN1500 batteries.
2. The PGM62xx shall only be charged outside hazardous areas.
3. No precautions against electrostatic discharge are necessary for portable equipment that has an enclosure made of plastic, metal, or a combination of the two, except where a significant static-generating mechanism has been identified. Activities such as placing the item in a pocket or on a belt, operating a keypad or cleaning with a damp cloth, do not present a significant electrostatic risk. However, where a static-generating mechanism is identified, such as repeated brushing against clothing, then suitable precautions shall be taken, e.g., the use of anti-static footwear.
The model PGM62xx is certified according to the IECEx scheme, ATEX and cCSAus (for US and Canada). PGM62xx is intrinsically safe and may be used in hazardous locations. SUBSTITUTION OF COMPONENTS MAY IMPAIR INTRINSIC SAFETY.
MARKING The product is marked with the following information: RAE SYSTEMS 3775 N. 1st. St., San Jose CA 95134, USA Type PGM62x0, PGM 62x6, PGM 62x8 Serial No/matrix: XXX-XXXX-000 IECEx SIR 11.0069X, Ex ia IIC T4 Ga (PGM62x0/PGM62x6)
Ex ia d IIC T4 Gb (PGM62x8)
0575 SIRA 11ATEX2152X II 1G Ex ia IIC T4 Ga
(PGM62x0/PGM62x6)
II 2G Ex ia d IIC T4 Gb (PGM62x8)
Exia Cl I, Dv 1 Gr. A, B, C, D, T4 C22.2 No 152-1984 ISA-12.13.01-2000
Warnings: Understand manual first before operating. Warning: Do not change batteries in hazardous location.
Do not mix old/new or different type of batteries PGM62x0: Use only RAE Systems battery pack, PN: M01-3051-000 or M01-3052-000. PGM62x6/62x8: Use only RAE Systems battery pack, PN: M01-3053-000 or M01-3054-000. Um: 20V -20º C ≤ Tamb ≤ +50º C
MultiRAE User’s Guide
5
Operation Area and Conditions
Hazardous Areas classified by Zones PGM62x0/PGM62x6 are intended to be used in hazardous areas zone 0, zone 1 or zone 2, and PGM62x8 in hazardous areas zone 1 or zone 2 within the temperature range of -20º C to +50º C, where gases of explosion groups IIA, IIB or IIC and T4 may be present.
Hazardous Areas classified by Divisions PGM62x0/PGM62x6/PGM62x8 are intended to be used in hazardous areas classified for Class I Div. 1 or 2, within the temperature range of -20º C to +50º C, where gases of explosion groups A, B, C or D and temperature class T4 may be present. WARNINGS: 1. NDIR sensors shall not be installed in PGM62x0 or PGM 62x6 models. 2. NDIR LEL sensors shall not be installed in PGM62x8 diffusion models bearing cCSAus logo. Proper Battery Disposal This product may contain one or more sealed lead-acid, nickel-cadmium (NiCd), nickel-metal hydride (NiMH), lithium (Li), or lithium-ion batteries. Specific battery information is given in this user guide. Batteries must be recycled or disposed of properly.
This symbol (crossed-out wheeled bin) indicates separate collection of waste electrical and electronic equipment in the EU countries. Please do not throw the equipment into the domestic refuse. Please use the return and collection systems available in your country for the disposal of this product.
Proper Product Disposal At End Of Life
At the end of its life, this product must undergo separate collection and recycling from general or household waste. The black bar below the symbol indicates that the product was put on the market after August 13, 2005.
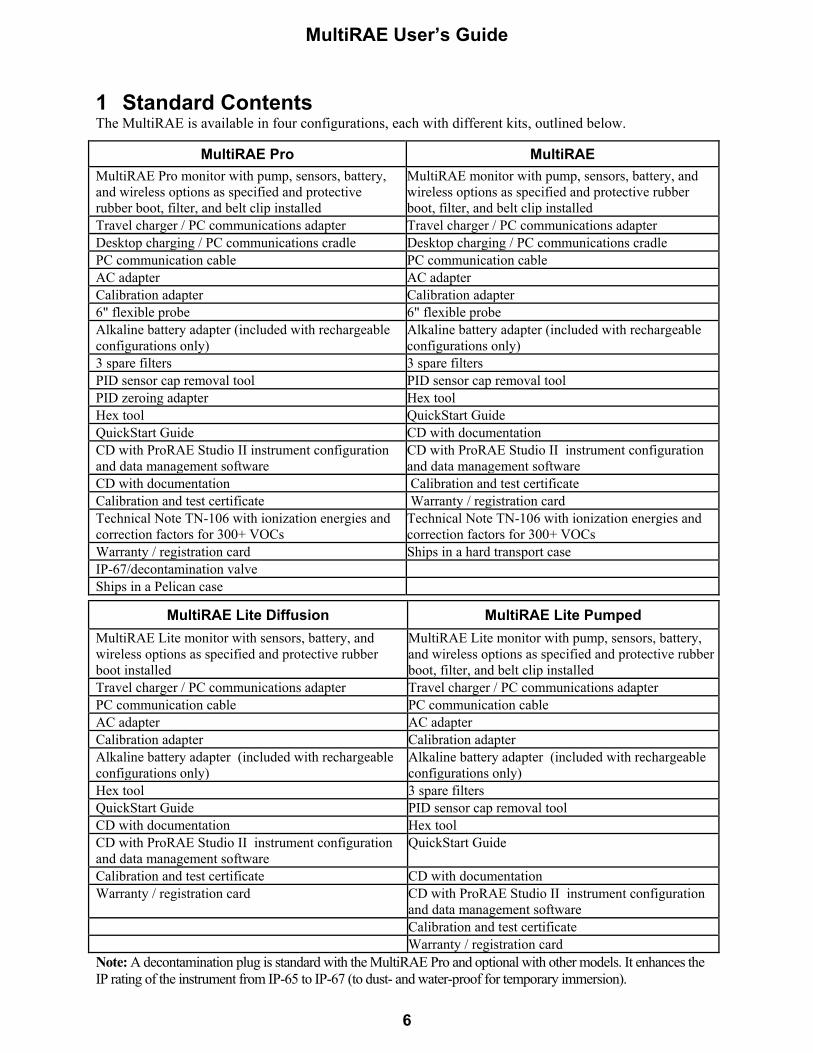
MultiRAE User’s Guide
6
1 Standard Contents The MultiRAE is available in four configurations, each with different kits, outlined below.
MultiRAE Pro MultiRAE MultiRAE Pro monitor with pump, sensors, battery, and wireless options as specified and protective rubber boot, filter, and belt clip installed
MultiRAE monitor with pump, sensors, battery, and wireless options as specified and protective rubber boot, filter, and belt clip installed
Travel charger / PC communications adapter Travel charger / PC communications adapter Desktop charging / PC communications cradle Desktop charging / PC communications cradle PC communication cable PC communication cable AC adapter AC adapter Calibration adapter Calibration adapter 6" flexible probe 6" flexible probe Alkaline battery adapter (included with rechargeable configurations only)
Alkaline battery adapter (included with rechargeable configurations only)
3 spare filters 3 spare filters PID sensor cap removal tool PID sensor cap removal tool PID zeroing adapter Hex tool Hex tool QuickStart Guide QuickStart Guide CD with documentation CD with ProRAE Studio II instrument configuration and data management software
CD with ProRAE Studio II instrument configuration and data management software
CD with documentation Calibration and test certificate Calibration and test certificate Warranty / registration card Technical Note TN-106 with ionization energies and correction factors for 300+ VOCs
Technical Note TN-106 with ionization energies and correction factors for 300+ VOCs
Warranty / registration card Ships in a hard transport case IP-67/decontamination valve Ships in a Pelican case
MultiRAE Lite Diffusion MultiRAE Lite Pumped MultiRAE Lite monitor with sensors, battery, and wireless options as specified and protective rubber boot installed
MultiRAE Lite monitor with pump, sensors, battery, and wireless options as specified and protective rubber boot, filter, and belt clip installed
Travel charger / PC communications adapter Travel charger / PC communications adapter PC communication cable PC communication cable AC adapter AC adapter Calibration adapter Calibration adapter Alkaline battery adapter (included with rechargeable configurations only)
Alkaline battery adapter (included with rechargeable configurations only)
Hex tool 3 spare filters QuickStart Guide PID sensor cap removal tool CD with documentation Hex tool CD with ProRAE Studio II instrument configuration and data management software
QuickStart Guide
Calibration and test certificate CD with documentation Warranty / registration card CD with ProRAE Studio II instrument configuration
and data management software Calibration and test certificate Warranty / registration card Note: A decontamination plug is standard with the MultiRAE Pro and optional with other models. It enhances the IP rating of the instrument from IP-65 to IP-67 (to dust- and water-proof for temporary immersion).
MultiRAE User’s Guide
7
2 General Information The MultiRAE is a family of multi-threat gas detectors that combine continuous monitoring capabilities for volatile organic compounds (VOCs), toxic and combustible gases, and radiation, with Man Down Alarm functionality in one highly portable instrument. MultiRAE monitors offer an industry-leading selection of interchangeable field-replaceable electrochemical, combustible, infrared, PID (photoionization detector), and gamma radiation sensors to fit a wide variety of applications. The MultiRAE family’s wireless capability elevates worker protection to the next level by providing safety officers real-time access to instrument readings and alarm status from any location for better visibility and faster response. Notes:
ClO2 and H2S sensors cannot be installed in the same instrument. NO and NH3 sensors cannot be installed in the same instrument. NDIR combustible sensors are not supported on the diffusion version with CSA certification. The PID sensor requires a pumped configuration. If a %Vol. NDIR sensor is installed in an instrument, a catalytic bead %LEL sensor must also be
installed in the instrument for CSA certification.
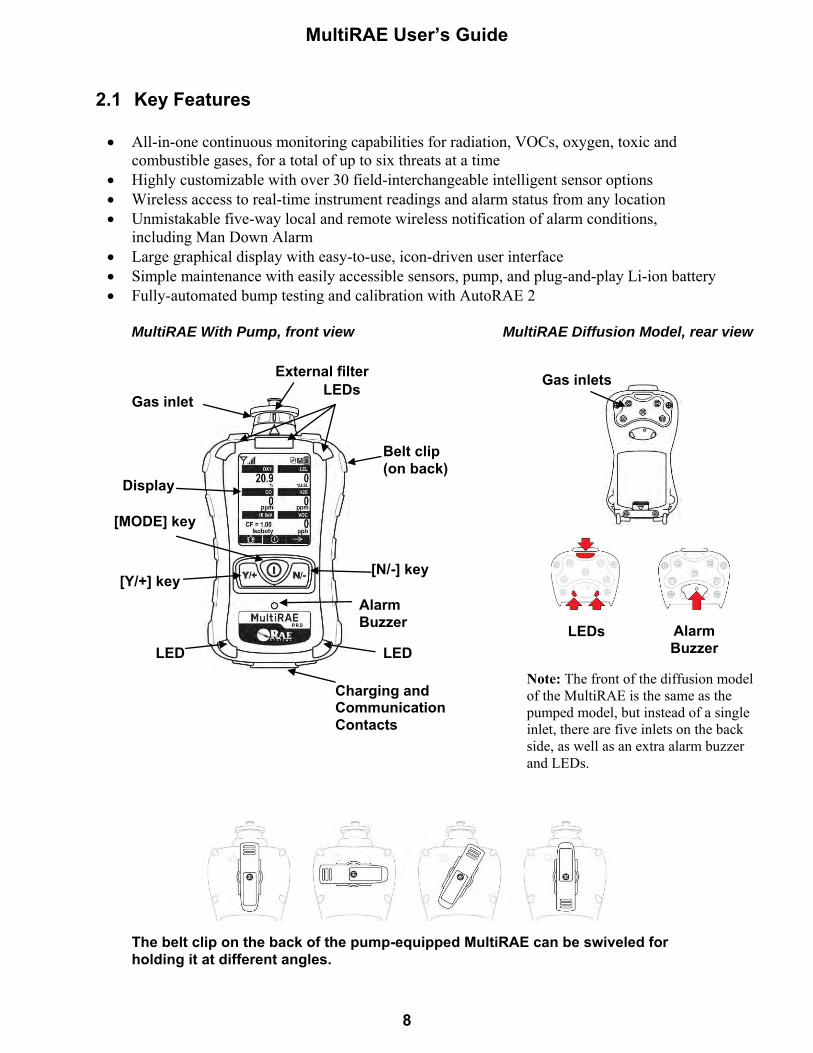
MultiRAE User’s Guide
8
2.1 Key Features All-in-one continuous monitoring capabilities for radiation, VOCs, oxygen, toxic and
combustible gases, for a total of up to six threats at a time Highly customizable with over 30 field-interchangeable intelligent sensor options Wireless access to real-time instrument readings and alarm status from any location Unmistakable five-way local and remote wireless notification of alarm conditions,
including Man Down Alarm Large graphical display with easy-to-use, icon-driven user interface Simple maintenance with easily accessible sensors, pump, and plug-and-play Li-ion battery Fully-automated bump testing and calibration with AutoRAE 2
[N/-] key
[MODE] key
Gas inlet
Display
LEDs
Alarm Buzzer
Belt clip (on back)
LED LED
[Y/+] key
External filter
Charging and Communication Contacts
The belt clip on the back of the pump-equipped MultiRAE can be swiveled for holding it at different angles.
Gas inlets
LEDs Alarm Buzzer
MultiRAE With Pump, front view MultiRAE Diffusion Model, rear view
Note: The front of the diffusion model of the MultiRAE is the same as the pumped model, but instead of a single inlet, there are five inlets on the back side, as well as an extra alarm buzzer and LEDs.

MultiRAE User’s Guide
9
3 User Interface The MultiRAE’s user interface consists of the display, LEDs, an alarm buzzer, and three keys. 3.1 Display Overview The LCD display provides visual feedback that includes the sensor types, readings, time, battery condition, and other functions.
3.1.1 Status Indicator Icons Along the top of most screens are status indicators that tell you whether a function is operating and/or its strength or level. Icon Function
Wireless status (shown when wireless is on, blank when off)
Wireless strength (0 to 5 bars)
Pump status (only on pump-equipped models)
Datalogging status (shown when datalogging is on, blank when off)
Battery status (three segments show battery charge level)
Unit of measure
Reading Sensor type
Soft keys (functions change by activity)
Status indicators
Sensor-specific additional information
Wireless radio status and signal strength
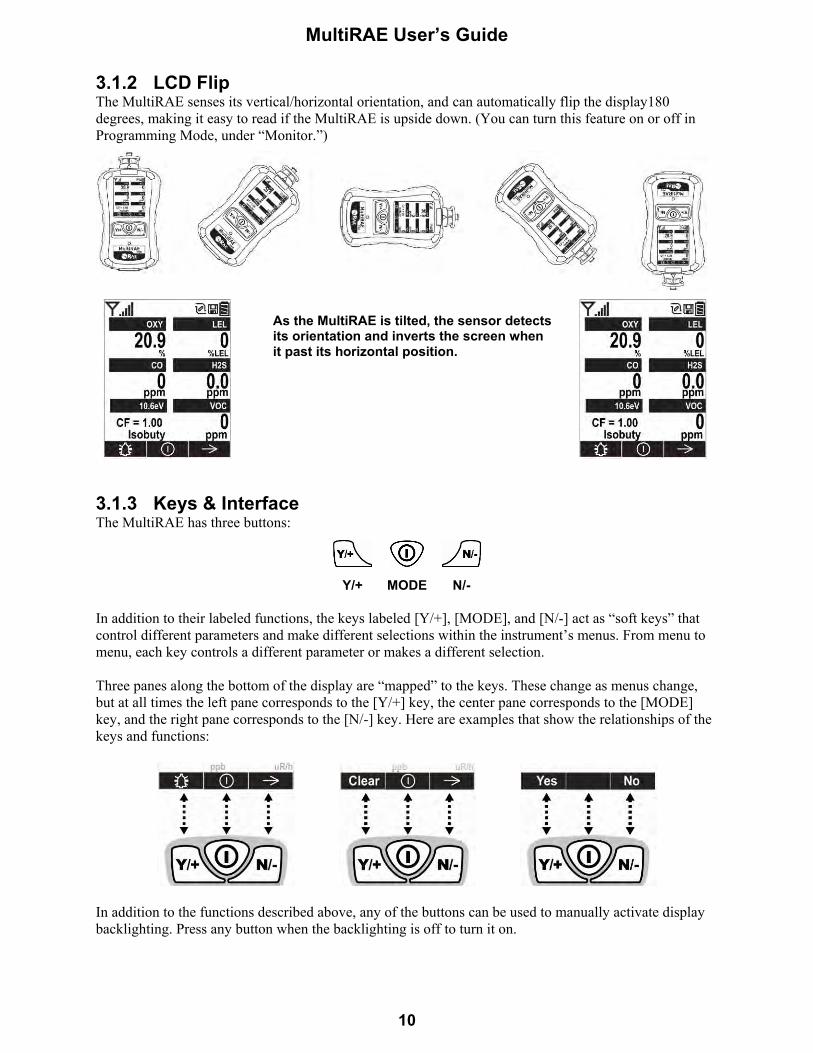
MultiRAE User’s Guide
10
3.1.2 LCD Flip The MultiRAE senses its vertical/horizontal orientation, and can automatically flip the display180 degrees, making it easy to read if the MultiRAE is upside down. (You can turn this feature on or off in Programming Mode, under “Monitor.”)
3.1.3 Keys & Interface The MultiRAE has three buttons:
Y/+ MODE N/-
In addition to their labeled functions, the keys labeled [Y/+], [MODE], and [N/-] act as “soft keys” that control different parameters and make different selections within the instrument’s menus. From menu to menu, each key controls a different parameter or makes a different selection. Three panes along the bottom of the display are “mapped” to the keys. These change as menus change, but at all times the left pane corresponds to the [Y/+] key, the center pane corresponds to the [MODE] key, and the right pane corresponds to the [N/-] key. Here are examples that show the relationships of the keys and functions:
In addition to the functions described above, any of the buttons can be used to manually activate display backlighting. Press any button when the backlighting is off to turn it on.
As the MultiRAE is tilted, the sensor detects its orientation and inverts the screen when it past its horizontal position.

MultiRAE User’s Guide
11
3.2 Screen Display For Various Numbers Of Active Sensors The MultiRAE family of instruments can accommodate from one to five sensors (some are dual sensors), depending on the configuration. In order to maximize readability and the amount of information shown, the display is automatically reconfigured, according to the number and types of sensors in the MultiRAE. If the configuration includes five sensors, and one of them is a PID, then the lamp value (9.8eV or 10.6eV) is shown, along with the currently applied correction factor (CF).
One sensor.
Two sensors. Three sensors. Four sensors.
Five sensors, including Gamma radiation sensor
Five sensors, including PID, showing lamp type and correction factor.
Six-threat configuration with CO+H2S combo sensor
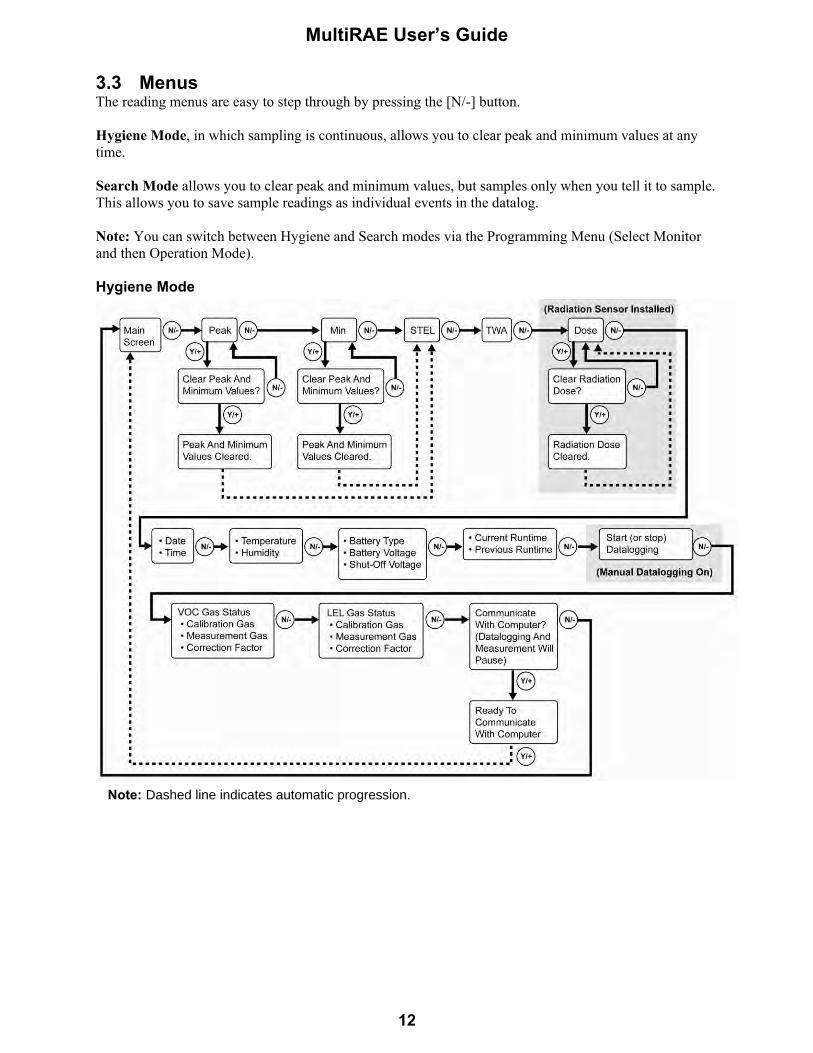
MultiRAE User’s Guide
12
3.3 Menus The reading menus are easy to step through by pressing the [N/-] button. Hygiene Mode, in which sampling is continuous, allows you to clear peak and minimum values at any time. Search Mode allows you to clear peak and minimum values, but samples only when you tell it to sample. This allows you to save sample readings as individual events in the datalog. Note: You can switch between Hygiene and Search modes via the Programming Menu (Select Monitor and then Operation Mode). Hygiene Mode
Note: Dashed line indicates automatic progression.
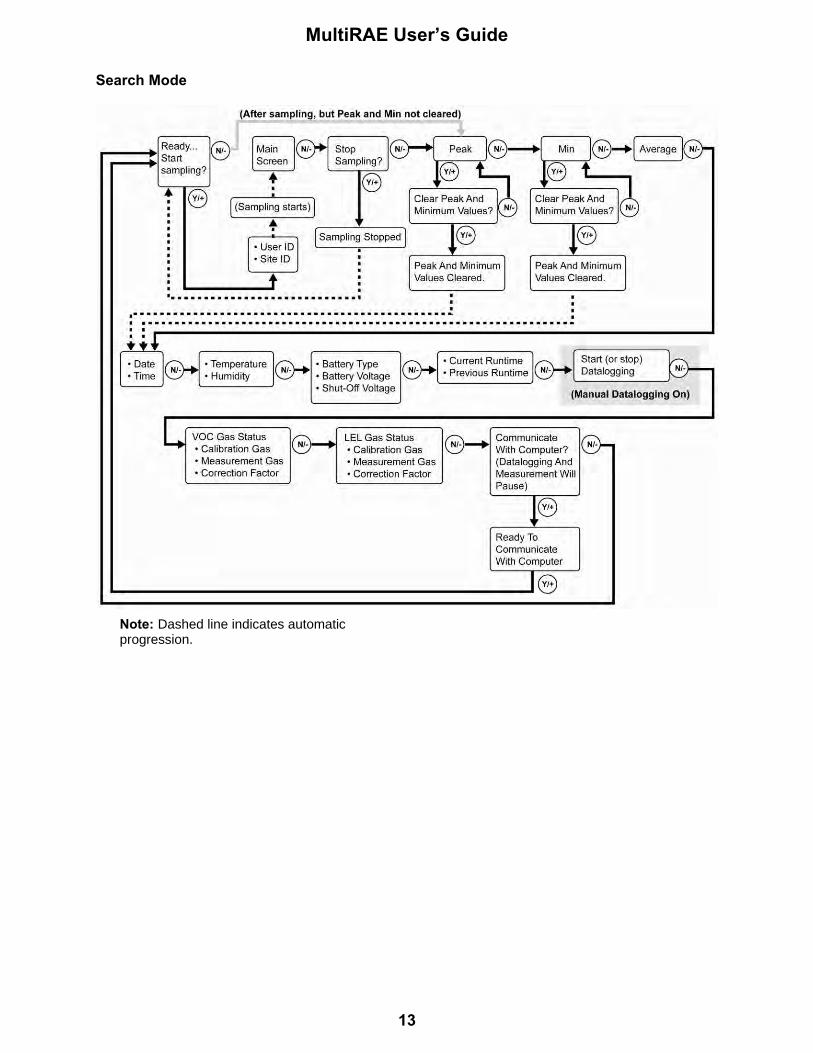
MultiRAE User’s Guide
13
Search Mode
Note: Dashed line indicates automatic
progression.

MultiRAE User’s Guide
14
Note: If the Peak or Min is cleared, the Average is also cleared. In addition, each cycle through the main screen after they are cleared will route from “Ready… Start sampling?” directly to Date and Time if you press [N/-] (see red line in diagram below), until you perform a new sample. Also, if you start sampling again and stop sampling, clear the Peak, or clear the Min, it advances to Date and Time, as well.
Note: Dashed line indicates automatic progression.

MultiRAE User’s Guide
15
4 Battery Always fully charge the battery before using the MultiRAE. Its Li-ion battery is charged by placing the MultiRAE in its cradle or using the travel charger. Contacts on the bottom of the instrument meet the cradle’s contact pins, transferring power. There are two types of output power for battery packs or adapters. Battery pack (PN: M01-3051-000) and adapter (PN: M01-3052-000) are used for MultiRAE's model number PGM-62x0. Battery pack (PN: M01-3053-000) and adapter (PN: M01-3054-000) are used for model number PGM-62x6/PGM-62x8. Note: Before setting the MultiRAE into its charging cradle or attaching its travel charger, visually inspect the contacts to make sure they are clean. If they are not, wipe them with a soft, dry cloth. Do not use solvents or cleaners.
WARNING To reduce the risk of ignition of hazardous atmospheres, recharge, remove or replace the battery only in an area known to be non-hazardous! Do not mix old and new batteries or batteries from different manufacturers.
4.1 Using The Charging Cradle Follow this procedure to charge the MultiRAE: 1. Plug the AC/DC adapter into the MultiRAE’s cradle. 2. Plug the AC/DC adapter into the wall outlet. 3. Place the MultiRAE into the cradle and press down until it is locked in place.
The MultiRAE begins charging automatically. The LED in the cradle should glow red to indicate charging. When charging is complete, the LED in the cradle glows green. 4.2 Using The Travel Charger Follow these steps to use the travel charger. Before attaching the travel charger, check that it is aligned correctly with the base of the MultiRAE. There are two alignment points on one side and one alignment point on the other side, designed to mate with matching points on the bottom of the MultiRAE:
1. Check bottom of MultiRAE Travel Charger’s alignment pins for correct orientation with the MultiRAE.
2. Align travel charger with bottom of MultiRAE.
3. Press travel charger onto bottom of MultiRAE.
4. Make sure the travel charger is firmly attached.

MultiRAE User’s Guide
16
Next, put the plug from the power supply into the jack on the side of the travel charger:
Plug the other end of the charger into a power source (AC outlet or 12VDC mobile power port, depending on the model). When power is applied and the MultiRAE’s battery is charging, the LED glows red. The LED glows green when the battery is fully charged. 4.3 Replacing A Battery The MultiRAE battery packs are plug-and-play, and can be replaced on the go without tools. To replace the MultiRAE battery:
1. Remove the battery adapter from the instrument by sliding the tab and tilting out the adapter. Note: The belt clip and rubber boot are removed in the illustration for clarity. They can be left on while replacing a battery.
2. Tilt a fully charged battery (or alkaline battery adapter) into the battery compartment and place it in the instrument.
3. Slide the tab back into place to secure the battery.
4.4 Battery States The battery icon on the display shows how much charge is in the battery and alerts you to any charging problems.
Full charge 2/3 charge 1/3 charge Low charge Battery alert
When the battery’s charge falls below a preset voltage, the instrument warns you by beeping once and flashing once every minute, and the “empty battery” icon blinks on and off once per second. The instrument automatically powers down within 10 minutes, after which you will need to either recharge the battery, or replace it with a fresh one with a full charge. 4.5 Alkaline Battery Pack An alkaline battery adapter is supplied with each instrument. The adapter (part number M01-3054-000) is installed and removed just like the rechargeable battery. It accepts four AA alkaline batteries (use only Duracell
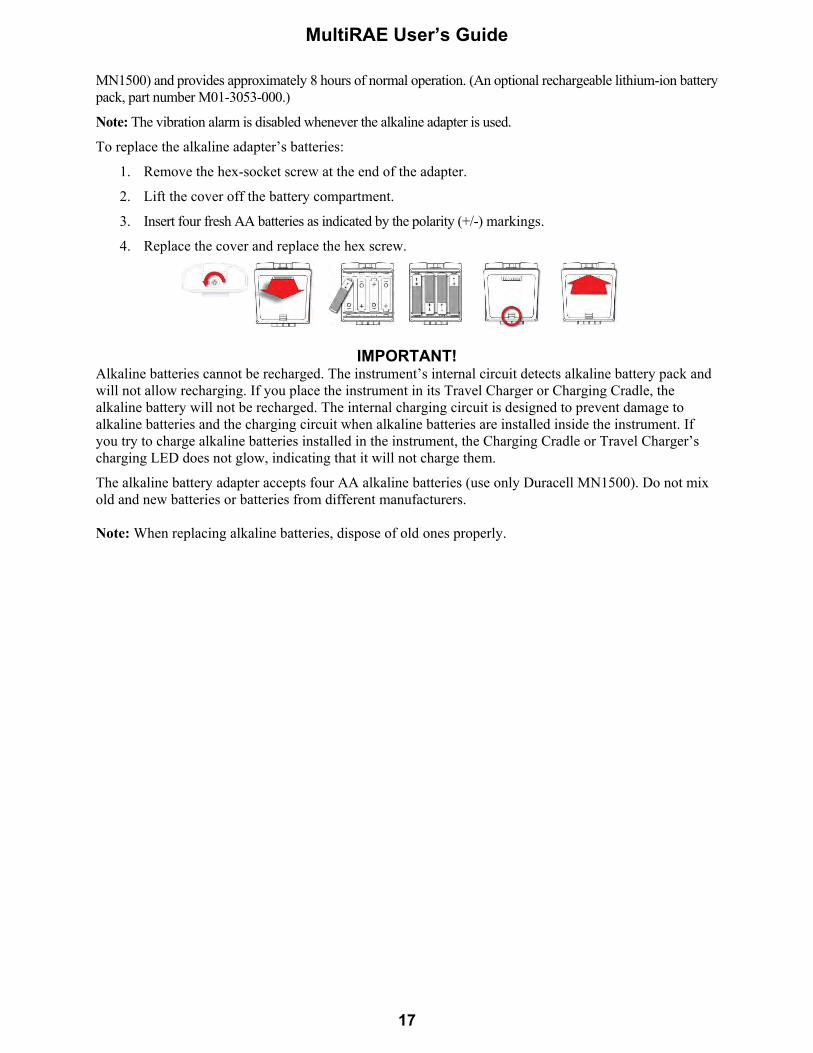
MultiRAE User’s Guide
17
MN1500) and provides approximately 8 hours of normal operation. (An optional rechargeable lithium-ion battery pack, part number M01-3053-000.)
Note: The vibration alarm is disabled whenever the alkaline adapter is used.
To replace the alkaline adapter’s batteries:
1. Remove the hex-socket screw at the end of the adapter.
2. Lift the cover off the battery compartment.
3. Insert four fresh AA batteries as indicated by the polarity (+/-) markings.
4. Replace the cover and replace the hex screw.
IMPORTANT! Alkaline batteries cannot be recharged. The instrument’s internal circuit detects alkaline battery pack and will not allow recharging. If you place the instrument in its Travel Charger or Charging Cradle, the alkaline battery will not be recharged. The internal charging circuit is designed to prevent damage to alkaline batteries and the charging circuit when alkaline batteries are installed inside the instrument. If you try to charge alkaline batteries installed in the instrument, the Charging Cradle or Travel Charger’s charging LED does not glow, indicating that it will not charge them.
The alkaline battery adapter accepts four AA alkaline batteries (use only Duracell MN1500). Do not mix old and new batteries or batteries from different manufacturers. Note: When replacing alkaline batteries, dispose of old ones properly.
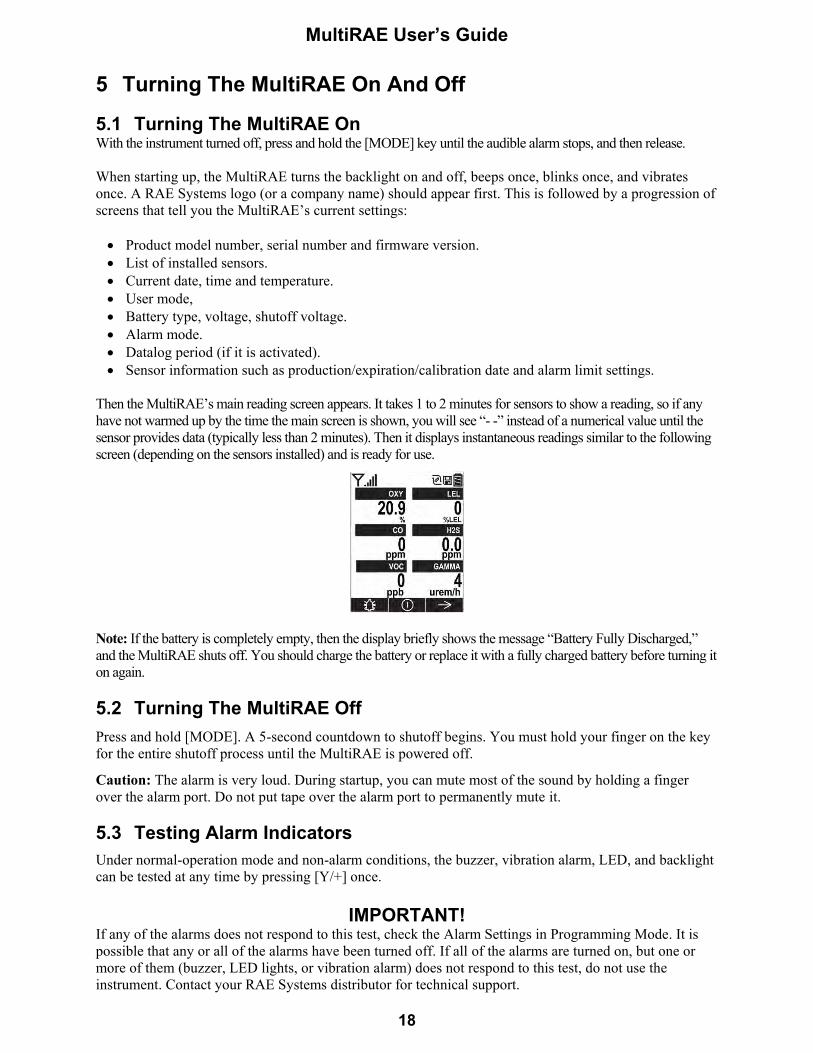
MultiRAE User’s Guide
18
5 Turning The MultiRAE On And Off 5.1 Turning The MultiRAE On With the instrument turned off, press and hold the [MODE] key until the audible alarm stops, and then release. When starting up, the MultiRAE turns the backlight on and off, beeps once, blinks once, and vibrates once. A RAE Systems logo (or a company name) should appear first. This is followed by a progression of screens that tell you the MultiRAE’s current settings: Product model number, serial number and firmware version. List of installed sensors. Current date, time and temperature. User mode, Battery type, voltage, shutoff voltage. Alarm mode. Datalog period (if it is activated). Sensor information such as production/expiration/calibration date and alarm limit settings.
Then the MultiRAE’s main reading screen appears. It takes 1 to 2 minutes for sensors to show a reading, so if any have not warmed up by the time the main screen is shown, you will see “- -” instead of a numerical value until the sensor provides data (typically less than 2 minutes). Then it displays instantaneous readings similar to the following screen (depending on the sensors installed) and is ready for use.
Note: If the battery is completely empty, then the display briefly shows the message “Battery Fully Discharged,” and the MultiRAE shuts off. You should charge the battery or replace it with a fully charged battery before turning it on again. 5.2 Turning The MultiRAE Off Press and hold [MODE]. A 5-second countdown to shutoff begins. You must hold your finger on the key for the entire shutoff process until the MultiRAE is powered off.
Caution: The alarm is very loud. During startup, you can mute most of the sound by holding a finger over the alarm port. Do not put tape over the alarm port to permanently mute it. 5.3 Testing Alarm Indicators Under normal-operation mode and non-alarm conditions, the buzzer, vibration alarm, LED, and backlight can be tested at any time by pressing [Y/+] once.
IMPORTANT! If any of the alarms does not respond to this test, check the Alarm Settings in Programming Mode. It is possible that any or all of the alarms have been turned off. If all of the alarms are turned on, but one or more of them (buzzer, LED lights, or vibration alarm) does not respond to this test, do not use the instrument. Contact your RAE Systems distributor for technical support.
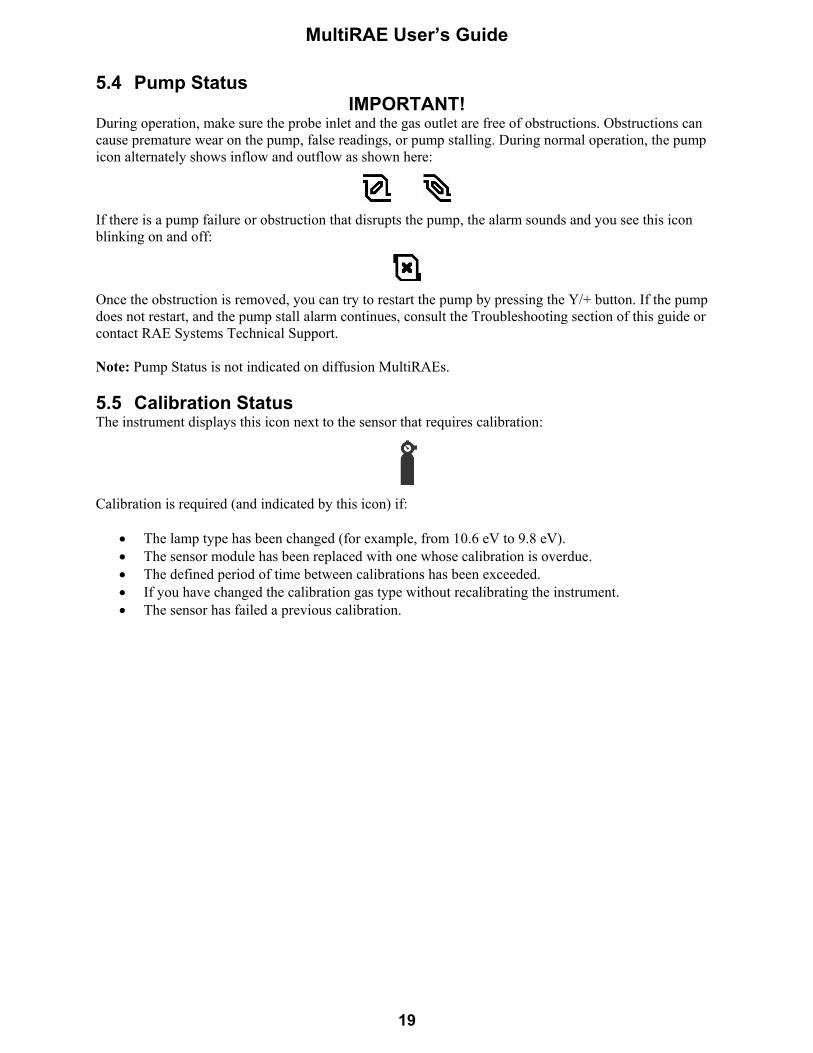
MultiRAE User’s Guide
19
5.4 Pump Status IMPORTANT!
During operation, make sure the probe inlet and the gas outlet are free of obstructions. Obstructions can cause premature wear on the pump, false readings, or pump stalling. During normal operation, the pump icon alternately shows inflow and outflow as shown here:
If there is a pump failure or obstruction that disrupts the pump, the alarm sounds and you see this icon blinking on and off:
Once the obstruction is removed, you can try to restart the pump by pressing the Y/+ button. If the pump does not restart, and the pump stall alarm continues, consult the Troubleshooting section of this guide or contact RAE Systems Technical Support. Note: Pump Status is not indicated on diffusion MultiRAEs. 5.5 Calibration Status The instrument displays this icon next to the sensor that requires calibration:
Calibration is required (and indicated by this icon) if:
The lamp type has been changed (for example, from 10.6 eV to 9.8 eV). The sensor module has been replaced with one whose calibration is overdue. The defined period of time between calibrations has been exceeded. If you have changed the calibration gas type without recalibrating the instrument. The sensor has failed a previous calibration.
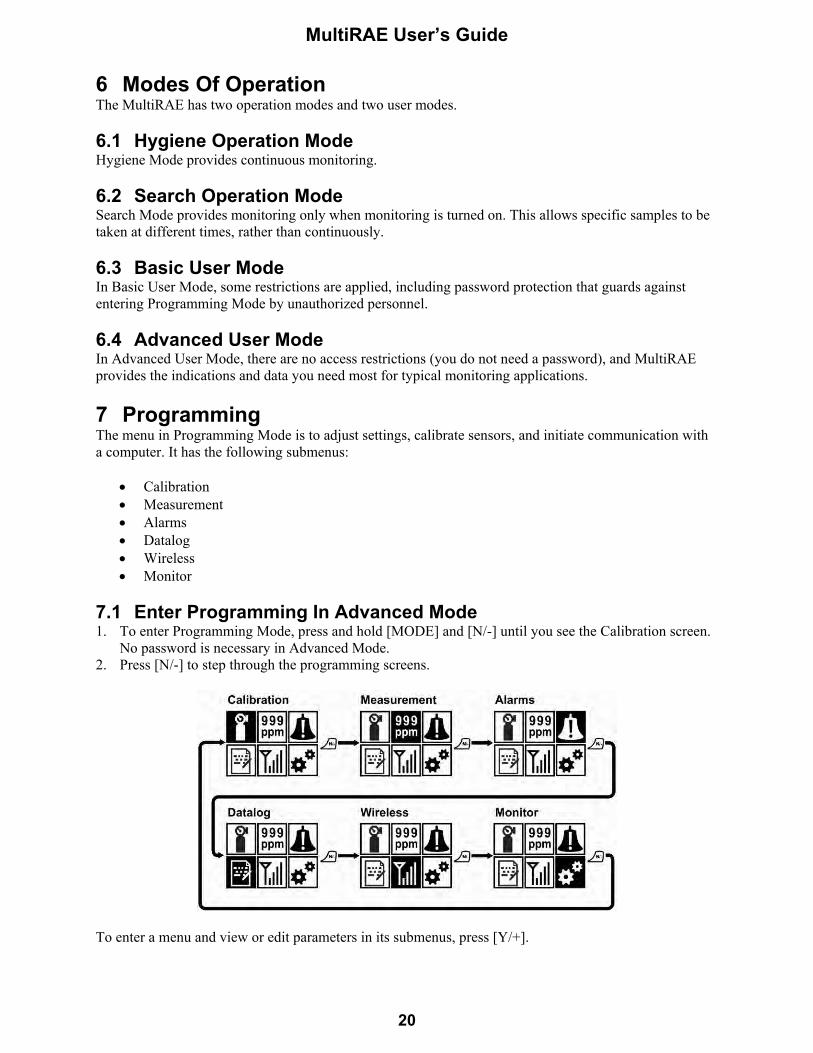
MultiRAE User’s Guide
20
6 Modes Of Operation The MultiRAE has two operation modes and two user modes.
6.1 Hygiene Operation Mode Hygiene Mode provides continuous monitoring.
6.2 Search Operation Mode Search Mode provides monitoring only when monitoring is turned on. This allows specific samples to be taken at different times, rather than continuously. 6.3 Basic User Mode In Basic User Mode, some restrictions are applied, including password protection that guards against entering Programming Mode by unauthorized personnel. 6.4 Advanced User Mode In Advanced User Mode, there are no access restrictions (you do not need a password), and MultiRAE provides the indications and data you need most for typical monitoring applications. 7 Programming The menu in Programming Mode is to adjust settings, calibrate sensors, and initiate communication with a computer. It has the following submenus:
Calibration Measurement Alarms Datalog Wireless Monitor
7.1 Enter Programming In Advanced Mode 1. To enter Programming Mode, press and hold [MODE] and [N/-] until you see the Calibration screen.
No password is necessary in Advanced Mode. 2. Press [N/-] to step through the programming screens.
To enter a menu and view or edit parameters in its submenus, press [Y/+].

MultiRAE User’s Guide
21
7.2 Enter Programming In Basic Mode 1. To enter Programming Mode, press and hold [MODE] and [N/-] until you see the Password screen.
2. Input the 4-digit password: Increase the number from 0 through 9 by pressing [Y/+]. Step from digit to digit using [N/-]. Press [MODE] when you are done.
If you make a mistake, you can cycle through the digits by pressing [N/-] and then using [Y/+] to change the number in each position. Note: The default password is 0000. Note: The password screen only appears when you enter the Programming Mode the first time after turning the instrument on in Basic Mode. If you have input the correct password, you do not have to input it again to enter Programming Mode until you turn the instrument off and on again. Once you enter Programming Mode, the Calibration screen is shown. Press [N/-] to step through the programming screens.
To enter a menu and view or edit parameters in its submenus, press [Y/+].
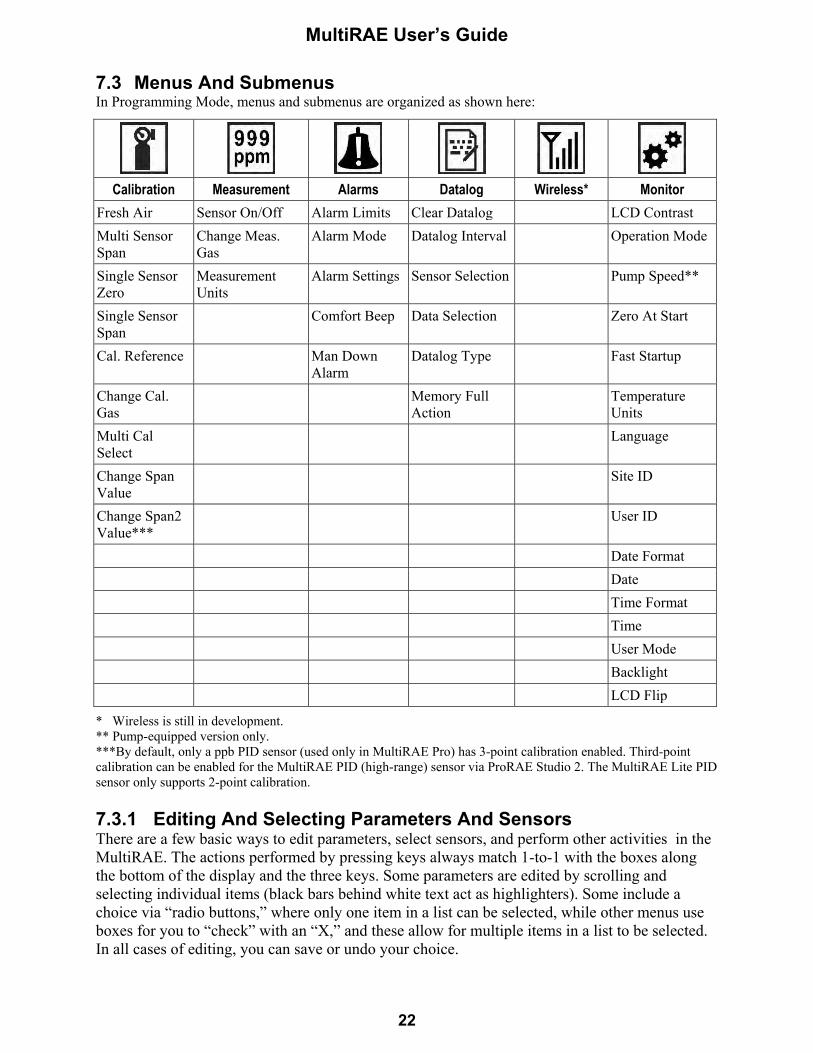
MultiRAE User’s Guide
22
7.3 Menus And Submenus In Programming Mode, menus and submenus are organized as shown here:
Calibration Measurement Alarms Datalog Wireless* Monitor
Fresh Air Sensor On/Off Alarm Limits Clear Datalog LCD Contrast Multi Sensor Span
Change Meas. Gas
Alarm Mode Datalog Interval Operation Mode
Single Sensor Zero
Measurement Units
Alarm Settings Sensor Selection Pump Speed**
Single Sensor Span
Comfort Beep Data Selection Zero At Start
Cal. Reference Man Down Alarm
Datalog Type Fast Startup
Change Cal. Gas
Memory Full Action
Temperature Units
Multi Cal Select
Language
Change Span Value
Site ID
Change Span2 Value***
User ID
Date Format Date Time Format Time User Mode Backlight LCD Flip
* Wireless is still in development. ** Pump-equipped version only. ***By default, only a ppb PID sensor (used only in MultiRAE Pro) has 3-point calibration enabled. Third-point calibration can be enabled for the MultiRAE PID (high-range) sensor via ProRAE Studio 2. The MultiRAE Lite PID sensor only supports 2-point calibration. 7.3.1 Editing And Selecting Parameters And Sensors There are a few basic ways to edit parameters, select sensors, and perform other activities in the MultiRAE. The actions performed by pressing keys always match 1-to-1 with the boxes along the bottom of the display and the three keys. Some parameters are edited by scrolling and selecting individual items (black bars behind white text act as highlighters). Some include a choice via “radio buttons,” where only one item in a list can be selected, while other menus use boxes for you to “check” with an “X,” and these allow for multiple items in a list to be selected. In all cases of editing, you can save or undo your choice.
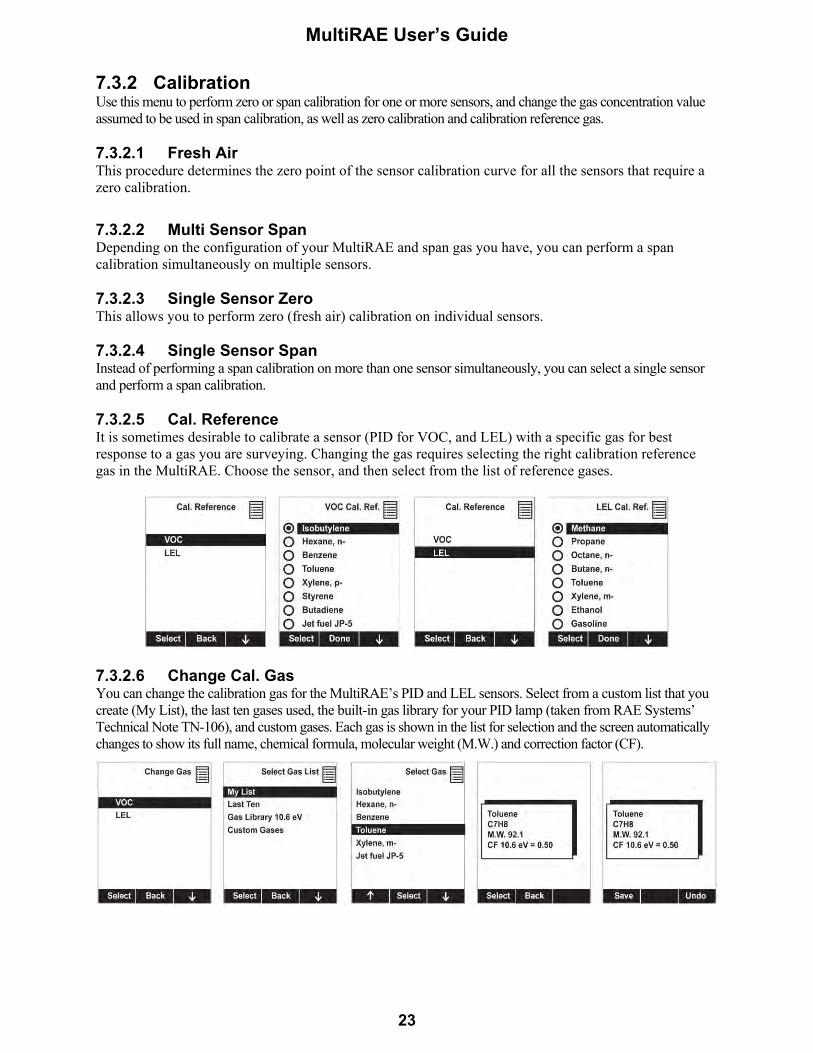
MultiRAE User’s Guide
23
7.3.2 Calibration Use this menu to perform zero or span calibration for one or more sensors, and change the gas concentration value assumed to be used in span calibration, as well as zero calibration and calibration reference gas. 7.3.2.1 Fresh Air This procedure determines the zero point of the sensor calibration curve for all the sensors that require a zero calibration.
7.3.2.2 Multi Sensor Span Depending on the configuration of your MultiRAE and span gas you have, you can perform a span calibration simultaneously on multiple sensors. 7.3.2.3 Single Sensor Zero This allows you to perform zero (fresh air) calibration on individual sensors. 7.3.2.4 Single Sensor Span Instead of performing a span calibration on more than one sensor simultaneously, you can select a single sensor and perform a span calibration. 7.3.2.5 Cal. Reference It is sometimes desirable to calibrate a sensor (PID for VOC, and LEL) with a specific gas for best response to a gas you are surveying. Changing the gas requires selecting the right calibration reference gas in the MultiRAE. Choose the sensor, and then select from the list of reference gases.
7.3.2.6 Change Cal. Gas You can change the calibration gas for the MultiRAE’s PID and LEL sensors. Select from a custom list that you create (My List), the last ten gases used, the built-in gas library for your PID lamp (taken from RAE Systems’ Technical Note TN-106), and custom gases. Each gas is shown in the list for selection and the screen automatically changes to show its full name, chemical formula, molecular weight (M.W.) and correction factor (CF).

MultiRAE User’s Guide
24
7.3.2.7 Multi Cal Select You can select one or more sensors to be calibrated at a time. An “X” in a box to the left of a sensor’s name indicates it is selected.
7.3.2.8 Change Span Value You can individually set the span gas value for each sensor. The units of measure (ppm, %LEL, etc.) are shown on the display.
7.3.2.9 Change Span2 Value If your MultiRAE is equipped with a PID sensor, you can set the span gas value for a third calibration point (Span2). The unit of measure is shown on the display.
Note: By default, only a ppb PID sensor (used only in MultiRAE Pro) has 3-point calibration enabled. Third-point calibration can be enabled for the MultiRAE PID (high-range) sensor via ProRAE Studio 2. The MultiRAE Lite PID sensor only supports 2-point calibration. 7.3.3 Measurement The submenus for Measurement include Sensor On/Off, Change Measurement Gas, and VOC and Gamma (if equipped) Measurement Units. 7.3.3.1 Sensor On/Off You can turn sensors on or off via this set of submenus. An “X” in a box to the left of a sensor’s name indicates it is turned on.
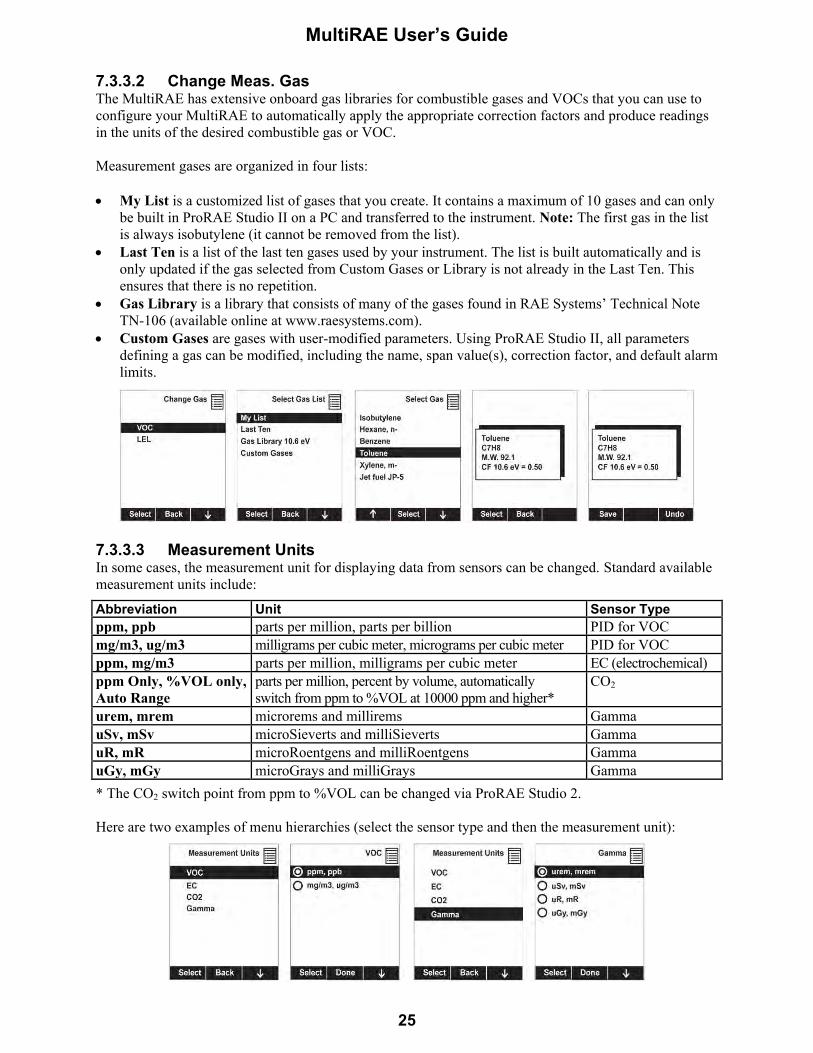
MultiRAE User’s Guide
25
7.3.3.2 Change Meas. Gas The MultiRAE has extensive onboard gas libraries for combustible gases and VOCs that you can use to configure your MultiRAE to automatically apply the appropriate correction factors and produce readings in the units of the desired combustible gas or VOC. Measurement gases are organized in four lists: My List is a customized list of gases that you create. It contains a maximum of 10 gases and can only
be built in ProRAE Studio II on a PC and transferred to the instrument. Note: The first gas in the list is always isobutylene (it cannot be removed from the list).
Last Ten is a list of the last ten gases used by your instrument. The list is built automatically and is only updated if the gas selected from Custom Gases or Library is not already in the Last Ten. This ensures that there is no repetition.
Gas Library is a library that consists of many of the gases found in RAE Systems’ Technical Note TN-106 (available online at www.raesystems.com).
Custom Gases are gases with user-modified parameters. Using ProRAE Studio II, all parameters defining a gas can be modified, including the name, span value(s), correction factor, and default alarm limits.
7.3.3.3 Measurement Units In some cases, the measurement unit for displaying data from sensors can be changed. Standard available measurement units include:
Abbreviation Unit Sensor Type ppm, ppb parts per million, parts per billion PID for VOC mg/m3, ug/m3 milligrams per cubic meter, micrograms per cubic meter PID for VOC ppm, mg/m3 parts per million, milligrams per cubic meter EC (electrochemical) ppm Only, %VOL only, Auto Range
parts per million, percent by volume, automatically switch from ppm to %VOL at 10000 ppm and higher*
CO2
urem, mrem microrems and millirems Gamma uSv, mSv microSieverts and milliSieverts Gamma uR, mR microRoentgens and milliRoentgens Gamma uGy, mGy microGrays and milliGrays Gamma
* The CO2 switch point from ppm to %VOL can be changed via ProRAE Studio 2. Here are two examples of menu hierarchies (select the sensor type and then the measurement unit):

MultiRAE User’s Guide
26
7.3.4 Alarms Use this menu to change high, low, STEL, and TWA alarm limits - the points at which alarms are triggered. It can also change alarm mode (latched or automatic reset) and alarm output methods (combinations of light, buzzer, and vibration alarm indications). 7.3.4.1 Alarm Limits There are four groups of alarm settings that you can adjust for each individual sensor for which a particular alarm type is available. Settings:
High Alarm Low Alarm STEL Alarm TWA Alarm
Note: Some alarm settings are not applicable to all sensors. If a setting is irrelevant to a sensor (for example, STEL for a gamma radiation sensor), then that sensor does not appear in the list. 7.3.4.2 Alarm Mode You can program the MultiRAE so that there are two ways to shut off an alarm: Auto Reset When the alarm condition is no longer present, the alarm stops and resets itself. Latch You can manually stop the alarm when one is triggered. The latched setting only
controls alarms for High Alarm, Low Alarm, STEL Alarm, and TWA alarm. 7.3.4.3 Alarm Settings You can enable/disable any combination of light (LEDs), buzzer, and vibration alarms. Settings:
All Enabled Light Vibration Buzzer Buzzer & Light Buzzer & Vibration Vibration & Light All Disabled
7.3.4.4 Comfort Beep A Comfort Beep is a single beep of the audible alarm at 60-second intervals that reminds the person using the MultiRAE that it is functioning. It can be turned on or off. 7.3.4.5 Man Down Alarm The Man Down Alarm is a critical and potentially lifesaving safety feature of every MultiRAE. The Man Down Alarm is based on the premise that if the instrument is motionless when it is not supposed to be, something wrong may be happening to its user. If that is the case, the MultiRAE blasts the alarm not only locally on the instrument, but also remotely, over the RAE Systems Dedicated Wireless Network to notify people in the vicinity, as well as remote safety officers at the command center, that a person is down, so that help can get on the way quickly.

MultiRAE User’s Guide
27
When the Man Down feature is on and there is no gas or radiation alarm, the MultiRAE senses that it is motionless for the amount of time set in the “Motionless Time” parameter. If the instrument is not moved during that time, then a pre-alarm is activated to alert the user, and shows the “Are You OK?” screen. Pressing [Y/+] clears the alarm and returns the MultiRAE to its normal operation. Pressing [N/-] sets it into Man Down Alarm (and if wireless connectivity is enabled, a Man Down message is sent in real time to remote observers). If neither key is pressed, then after the countdown, it goes into Man Down Alarm (again sending a message to remote observers if wirelessly enabled).
Settings are available for:
Off/On Motionless Time (time the instrument is motionless before initiating a pre-alarm) Motion Sensitivity (set to low, medium, or high to compensate for ambient vibration or motion) Warning Time (countdown, in seconds, from pre-alarm to Man Down alarm)
When the Man Down alarm is activated, the buzzer sounds and LEDs flash continuously, and a countdown begins.
If the MultiRAE’s user presses [Y/+] for “Yes” in response to the “Are You OK?” question on the screen before the countdown reaches zero, the Man Down alarm stops and the main reading screen is displayed.
If the person does not press [Y/+] for “Yes” in response to the “Are You OK?” question on the screen before the countdown reaches zero, the Man Down alarm is sounded and LEDs flash continuously.
If the person presses [N/-] during the countdown, answering the “Are You OK?” question with “No,” the Man Down alarm starts.
If wireless connectivity is enabled, a Man Down message is also sent to remote observers. 7.3.5 Datalog The instrument displays a floppy disk icon to indicate that a datalog is being recorded. The instrument stores the measured gas concentration for each sensor, date and time for each measurement, Site ID, User ID, and other parameters. The MultiRAE memory is sufficient to record six months’ worth of data for five sensors at one-minute intervals. All data are retained (even after the unit is turned off) in non-volatile memory so that they can be downloaded at a later time to a PC.
7.3.5.1 Clear Datalog This operation erases all data stored in the datalog. Note: Once the datalog is cleared, the data cannot be recovered. 7.3.5.2 Datalog Interval Intervals are shown in seconds. The default value is 60 seconds. The maximum interval is 3600 seconds, and the minimum is 1 second.
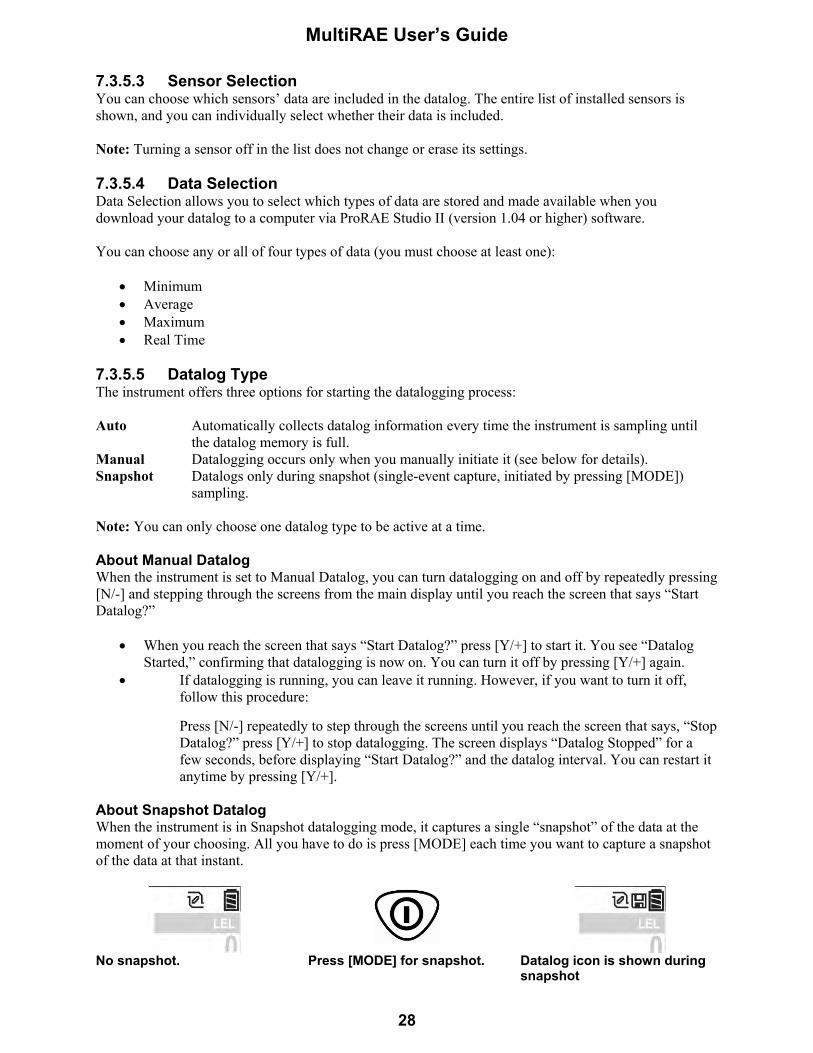
MultiRAE User’s Guide
28
7.3.5.3 Sensor Selection You can choose which sensors’ data are included in the datalog. The entire list of installed sensors is shown, and you can individually select whether their data is included. Note: Turning a sensor off in the list does not change or erase its settings. 7.3.5.4 Data Selection Data Selection allows you to select which types of data are stored and made available when you download your datalog to a computer via ProRAE Studio II (version 1.04 or higher) software. You can choose any or all of four types of data (you must choose at least one):
Minimum Average Maximum Real Time
7.3.5.5 Datalog Type The instrument offers three options for starting the datalogging process: Auto Automatically collects datalog information every time the instrument is sampling until
the datalog memory is full. Manual Datalogging occurs only when you manually initiate it (see below for details). Snapshot Datalogs only during snapshot (single-event capture, initiated by pressing [MODE])
sampling. Note: You can only choose one datalog type to be active at a time. About Manual Datalog When the instrument is set to Manual Datalog, you can turn datalogging on and off by repeatedly pressing [N/-] and stepping through the screens from the main display until you reach the screen that says “Start Datalog?”
When you reach the screen that says “Start Datalog?” press [Y/+] to start it. You see “Datalog Started,” confirming that datalogging is now on. You can turn it off by pressing [Y/+] again.
If datalogging is running, you can leave it running. However, if you want to turn it off, follow this procedure: Press [N/-] repeatedly to step through the screens until you reach the screen that says, “Stop Datalog?” press [Y/+] to stop datalogging. The screen displays “Datalog Stopped” for a few seconds, before displaying “Start Datalog?” and the datalog interval. You can restart it anytime by pressing [Y/+].
About Snapshot Datalog When the instrument is in Snapshot datalogging mode, it captures a single “snapshot” of the data at the moment of your choosing. All you have to do is press [MODE] each time you want to capture a snapshot of the data at that instant.
No snapshot. Press [MODE] for snapshot. Datalog icon is shown during snapshot
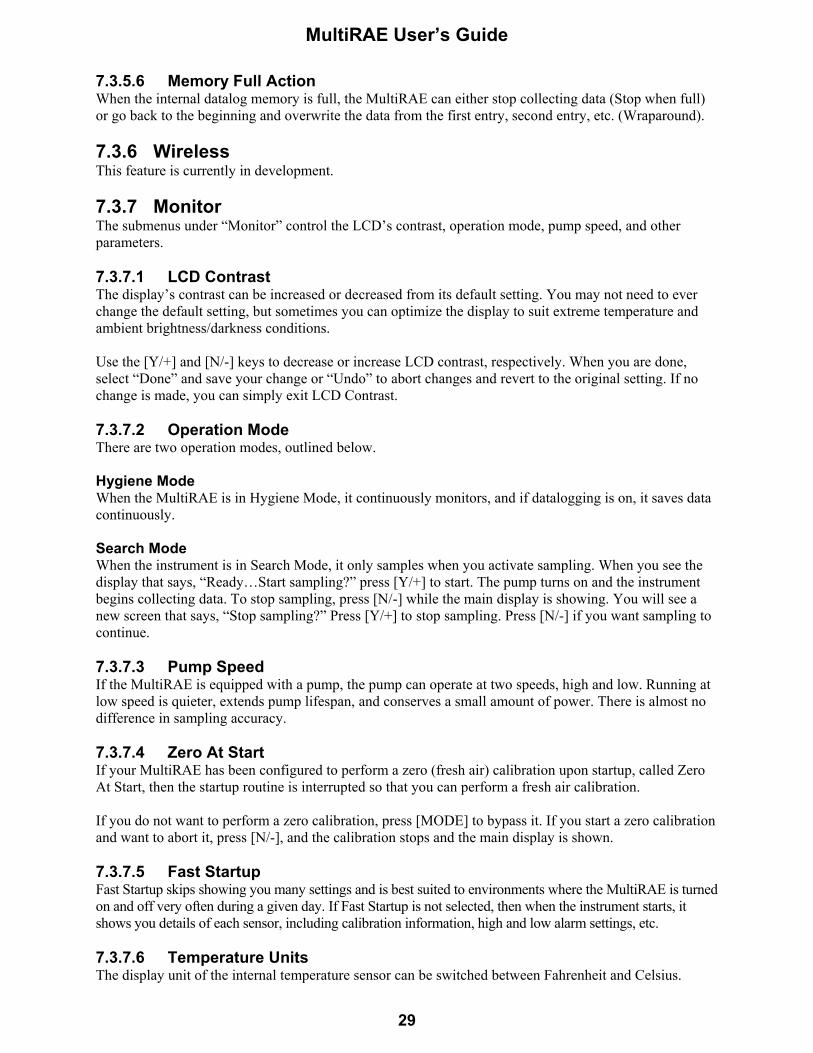
MultiRAE User’s Guide
29
7.3.5.6 Memory Full Action When the internal datalog memory is full, the MultiRAE can either stop collecting data (Stop when full) or go back to the beginning and overwrite the data from the first entry, second entry, etc. (Wraparound). 7.3.6 Wireless This feature is currently in development. 7.3.7 Monitor The submenus under “Monitor” control the LCD’s contrast, operation mode, pump speed, and other parameters. 7.3.7.1 LCD Contrast The display’s contrast can be increased or decreased from its default setting. You may not need to ever change the default setting, but sometimes you can optimize the display to suit extreme temperature and ambient brightness/darkness conditions. Use the [Y/+] and [N/-] keys to decrease or increase LCD contrast, respectively. When you are done, select “Done” and save your change or “Undo” to abort changes and revert to the original setting. If no change is made, you can simply exit LCD Contrast. 7.3.7.2 Operation Mode There are two operation modes, outlined below. Hygiene Mode When the MultiRAE is in Hygiene Mode, it continuously monitors, and if datalogging is on, it saves data continuously. Search Mode When the instrument is in Search Mode, it only samples when you activate sampling. When you see the display that says, “Ready…Start sampling?” press [Y/+] to start. The pump turns on and the instrument begins collecting data. To stop sampling, press [N/-] while the main display is showing. You will see a new screen that says, “Stop sampling?” Press [Y/+] to stop sampling. Press [N/-] if you want sampling to continue. 7.3.7.3 Pump Speed If the MultiRAE is equipped with a pump, the pump can operate at two speeds, high and low. Running at low speed is quieter, extends pump lifespan, and conserves a small amount of power. There is almost no difference in sampling accuracy. 7.3.7.4 Zero At Start If your MultiRAE has been configured to perform a zero (fresh air) calibration upon startup, called Zero At Start, then the startup routine is interrupted so that you can perform a fresh air calibration. If you do not want to perform a zero calibration, press [MODE] to bypass it. If you start a zero calibration and want to abort it, press [N/-], and the calibration stops and the main display is shown. 7.3.7.5 Fast Startup Fast Startup skips showing you many settings and is best suited to environments where the MultiRAE is turned on and off very often during a given day. If Fast Startup is not selected, then when the instrument starts, it shows you details of each sensor, including calibration information, high and low alarm settings, etc. 7.3.7.6 Temperature Units The display unit of the internal temperature sensor can be switched between Fahrenheit and Celsius.
MultiRAE User’s Guide
30
7.3.7.7 Language English is the default language, but other languages can also be selected for the instrument. 7.3.7.8 Site ID Choose and enter an 8-digit Site ID to uniquely identify the particular site where the instrument is to be used. The first four digits can be an alphabet letter or number, while the last four digits can only be numbers. This Site ID is included in the datalog report. Note: Advance through the alphabet and numbers (0 through 9) by one with each press of the [Y/+] key. To scroll quickly, hold down the [Y/+] key for as long as you want it to scroll rapidly. 7.3.7.9 User ID Enter an 8-digit alphanumeric User ID to uniquely identify a user. This User ID is included in the datalog report. Note: Advance through the alphabet and numbers (0 through 9) by one with each press of the [Y/+] key. To scroll quickly, hold down the [Y/+] key for as long as you want it to scroll rapidly. 7.3.7.10 Date Format Month (MM) and Day (DD) have two digits each, while the year (YYYY) uses four digits. The Date can be expressed in three different formats:
MM/DD/YYYY DD/MM/YYYY YYYY/MM/DD
7.3.7.11 Date Set the date according to the format selected in Date Format. 7.3.7.12 Time Format The time format can be either of these two options:
12 Hour (AM/PM) 24 Hour
7.3.7.13 Time Regardless of the Time Format you select, the MultiRAE’s time must be set using the 24-hour format, following hours, minutes, and seconds (HH:MM:SS). 7.3.7.14 User Mode Two User Modes are available: Advanced and Basic. The Advanced User Mode allows a greater number of parameters to be changed than Basic User Mode. It can be used with either of the Operation Modes, Hygiene or Search. No password is required to enter the Programming Menu when in Advanced User Mode. 7.3.7.15 Backlight The display’s backlight can be set to illuminate either automatically, based on ambient light conditions, or manually, or it can be shut off. 7.3.7.16 LCD Flip The display can be configured to flip 180° automatically when the MultiRAE is turned upside-down. The LCD Flip feature can be set to On or Off.

MultiRAE User’s Guide
31
8 Calibration And Testing 8.1 Bump Testing And Calibration RAE Systems recommends a bump test be performed periodically on the MultiRAE. A bump test is defined as a brief exposure of the monitor to the calibration gas to show response and trigger the lowest alarm set point for each sensor.
The MultiRAE multi-gas detector must be calibrated if it does not pass a bump test, or at least once every 180 days, depending on use and sensor exposure to poisons and contaminants.
Calibration intervals and bump test procedures may vary due to national legislation. 8.1.1 Bump (Functional) Testing
1. Connect the calibration gas cylinder, flow regulator, and calibration adapter to the MultiRAE and start the gas flow.
2. Make sure the unit goes into at least a low alarm for each of the tested sensors and that the buzzer produces at least two beeps per second, the LED lights flash on and off, and the vibration alarm functions. The display backlight should illuminate and an alarm message should be shown in the display.
3. Turn off the gas flow. 4. Remove the calibration adapter.
8.2 Zero/Fresh Air Calibration This operation sets the zero point of the sensor calibration curve for clean air. It should be performed before other calibrations. Note: If you use a zero air cylinder, you must use the MultiRAE Calibration Adapter. Using a calibration adapter is not necessary for calibration in fresh air. 8.2.1 Zero Calibration For A CO2 Sensor Important! If your MultiRAE is equipped with a CO2 sensor, it must be zero calibrated using 100% Nitrogen (N2), which is inert, instead of fresh air or zero air. You can also use CO2-free isobutylene, which is convenient to use for zeroing the CO2 sensor and span calibrating a VOC sensor. 8.2.2 Fresh Air Calibration This procedure determines zero points of most sensors. The MultiRAE should be zero-calibrated in clean air with 20.9% oxygen or with a cylinder of clean zero air.
At the Calibration menu, select “Fresh Air” by pressing [Y/+] once to enter fresh air calibration.
RAE Systems recommends periodic bump testing to confirm that the sensors and alarms are functional. Test each sensor with an appropriate test gas in a concentration not less than the sensor’s low alarm setting. To pass, each sensor should go at least to a low alarm. With the MultiRAE in Normal Mode:

MultiRAE User’s Guide
32
After a timer countdown, the zero calibration is done. The LCD displays the sensor names and tells you whether each calibration passed or failed, followed by the sensor readings.
Note: You can abort the calibration at any time during the countdown by pressing [N/-]. 8.2.3 Single-Sensor Zero Calibration Select the sensor and then start the calibration by pressing [Y/+]. You can abort the procedure anytime by pressing [N/-].
8.3 Span Calibration This procedure determines the second point of the sensor calibration curve for the sensor. MultiRAE Equipped With A Pump With its pump speed setting of low or high, a MultiRAE normally draws in air at a flow rate of between 200 cc/min and 300 cc/min. RAE Systems recommends that a calibration cap to be used with calibration gas flow rates from 500 cc/min to 1000 cc/min. WARNING: Make sure the calibration cap clips on and stays in the correct position during calibration, as illustrated below. Otherwise, the calibration cap must be manually held in the correct position.
Wrong Wrong Wrong Correct
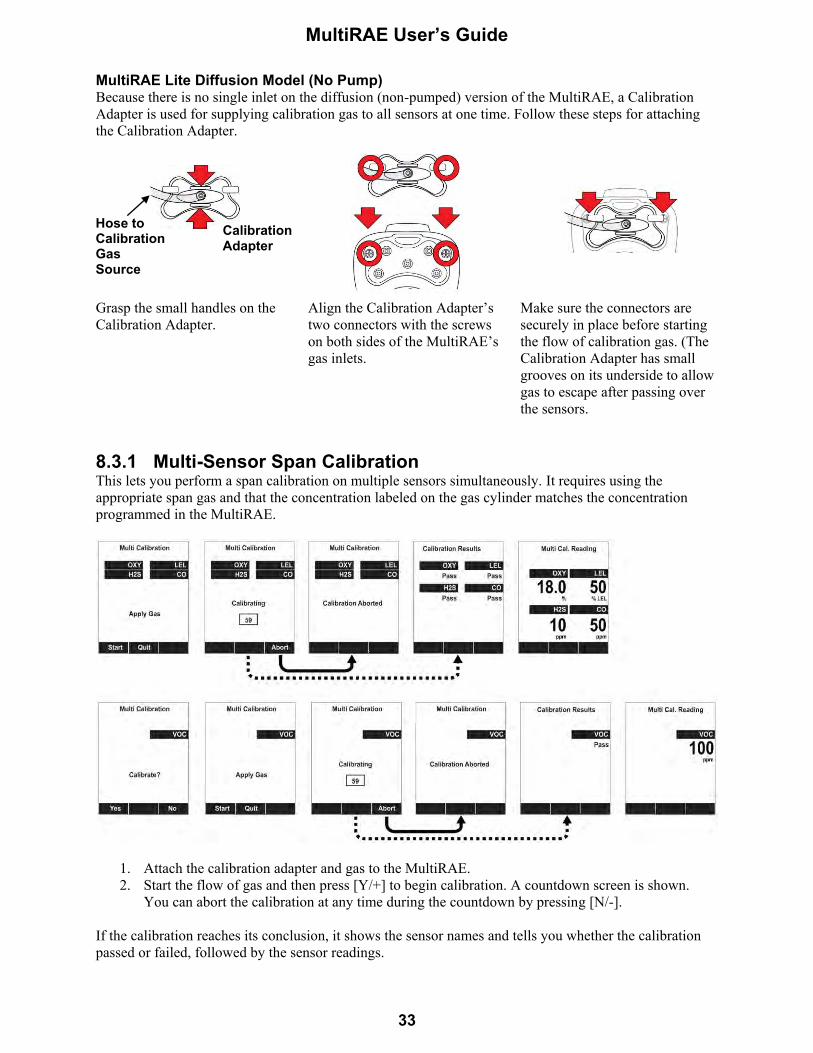
MultiRAE User’s Guide
33
MultiRAE Lite Diffusion Model (No Pump) Because there is no single inlet on the diffusion (non-pumped) version of the MultiRAE, a Calibration Adapter is used for supplying calibration gas to all sensors at one time. Follow these steps for attaching the Calibration Adapter.
Grasp the small handles on the Calibration Adapter.
Align the Calibration Adapter’s two connectors with the screws on both sides of the MultiRAE’s gas inlets.
Make sure the connectors are securely in place before starting the flow of calibration gas. (The Calibration Adapter has small grooves on its underside to allow gas to escape after passing over the sensors.
8.3.1 Multi-Sensor Span Calibration This lets you perform a span calibration on multiple sensors simultaneously. It requires using the appropriate span gas and that the concentration labeled on the gas cylinder matches the concentration programmed in the MultiRAE.
1. Attach the calibration adapter and gas to the MultiRAE. 2. Start the flow of gas and then press [Y/+] to begin calibration. A countdown screen is shown.
You can abort the calibration at any time during the countdown by pressing [N/-]. If the calibration reaches its conclusion, it shows the sensor names and tells you whether the calibration passed or failed, followed by the sensor readings.
Calibration Adapter
Hose to Calibration Gas Source
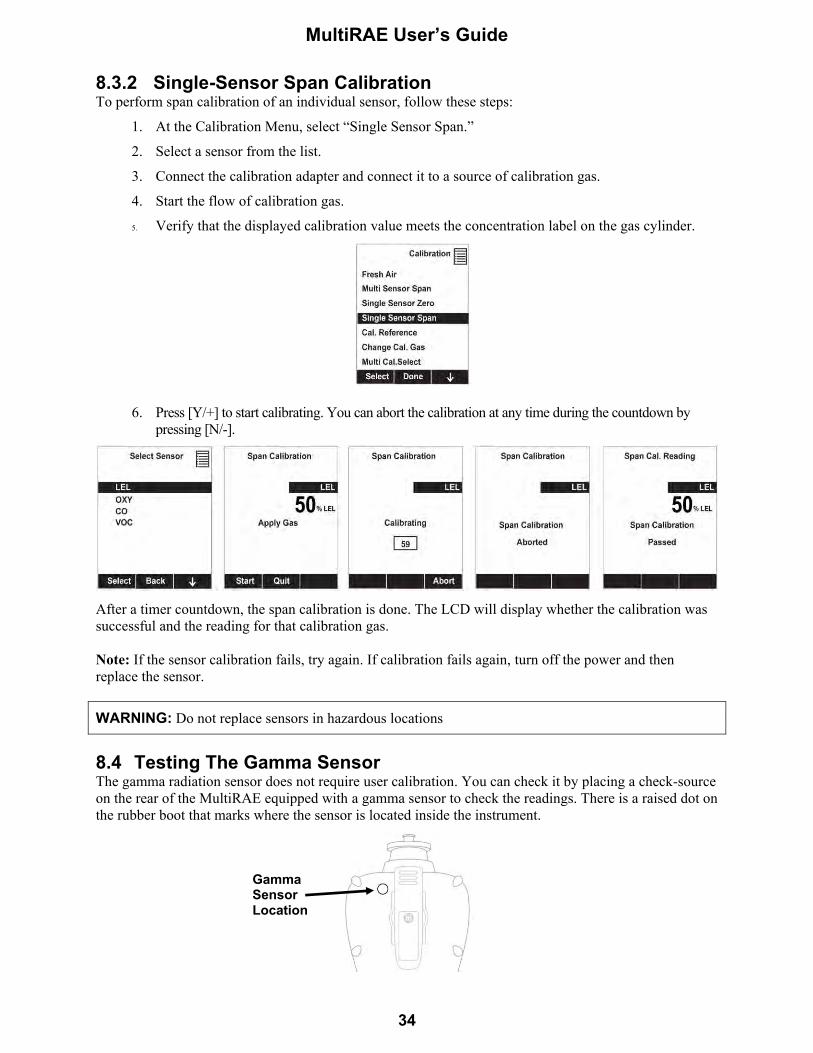
MultiRAE User’s Guide
34
8.3.2 Single-Sensor Span Calibration To perform span calibration of an individual sensor, follow these steps:
1. At the Calibration Menu, select “Single Sensor Span.”
2. Select a sensor from the list.
3. Connect the calibration adapter and connect it to a source of calibration gas.
4. Start the flow of calibration gas.
5. Verify that the displayed calibration value meets the concentration label on the gas cylinder.
6. Press [Y/+] to start calibrating. You can abort the calibration at any time during the countdown by pressing [N/-].
After a timer countdown, the span calibration is done. The LCD will display whether the calibration was successful and the reading for that calibration gas. Note: If the sensor calibration fails, try again. If calibration fails again, turn off the power and then replace the sensor.
WARNING: Do not replace sensors in hazardous locations
8.4 Testing The Gamma Sensor The gamma radiation sensor does not require user calibration. You can check it by placing a check-source on the rear of the MultiRAE equipped with a gamma sensor to check the readings. There is a raised dot on the rubber boot that marks where the sensor is located inside the instrument.
Gamma Sensor Location
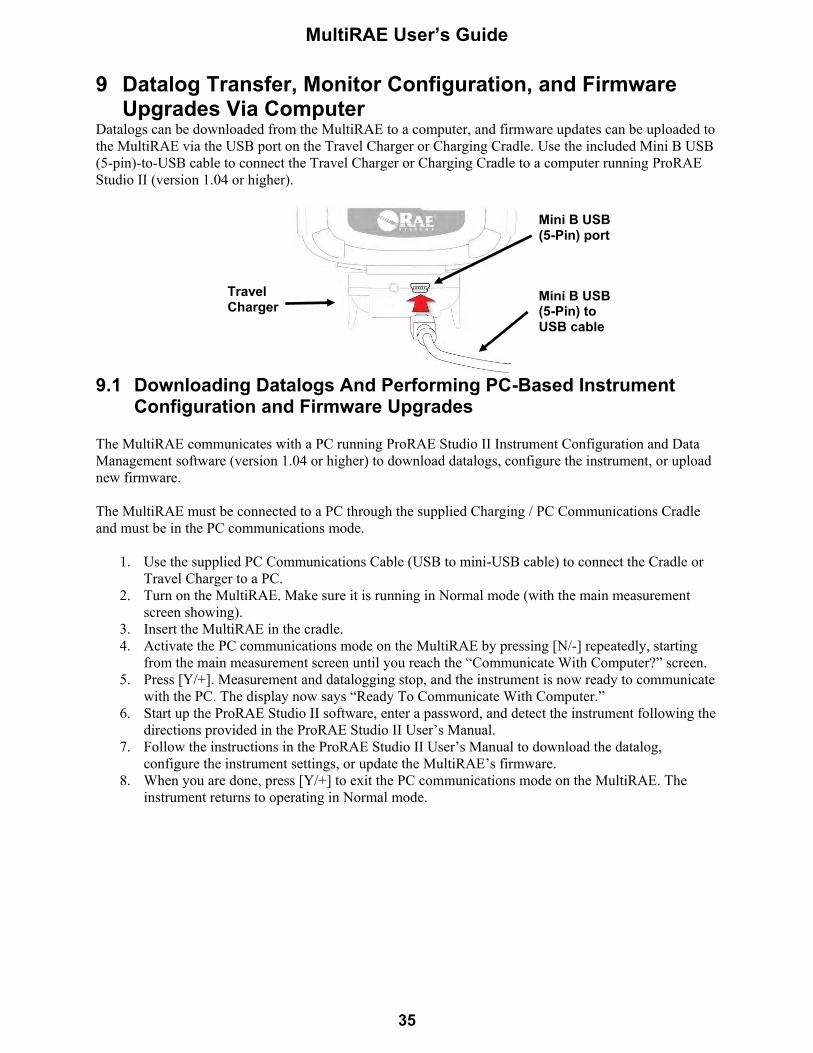
MultiRAE User’s Guide
35
9 Datalog Transfer, Monitor Configuration, and Firmware Upgrades Via Computer
Datalogs can be downloaded from the MultiRAE to a computer, and firmware updates can be uploaded to the MultiRAE via the USB port on the Travel Charger or Charging Cradle. Use the included Mini B USB (5-pin)-to-USB cable to connect the Travel Charger or Charging Cradle to a computer running ProRAE Studio II (version 1.04 or higher).
9.1 Downloading Datalogs And Performing PC-Based Instrument
Configuration and Firmware Upgrades The MultiRAE communicates with a PC running ProRAE Studio II Instrument Configuration and Data Management software (version 1.04 or higher) to download datalogs, configure the instrument, or upload new firmware. The MultiRAE must be connected to a PC through the supplied Charging / PC Communications Cradle and must be in the PC communications mode.
1. Use the supplied PC Communications Cable (USB to mini-USB cable) to connect the Cradle or Travel Charger to a PC.
2. Turn on the MultiRAE. Make sure it is running in Normal mode (with the main measurement screen showing).
3. Insert the MultiRAE in the cradle. 4. Activate the PC communications mode on the MultiRAE by pressing [N/-] repeatedly, starting
from the main measurement screen until you reach the “Communicate With Computer?” screen. 5. Press [Y/+]. Measurement and datalogging stop, and the instrument is now ready to communicate
with the PC. The display now says “Ready To Communicate With Computer.” 6. Start up the ProRAE Studio II software, enter a password, and detect the instrument following the
directions provided in the ProRAE Studio II User’s Manual. 7. Follow the instructions in the ProRAE Studio II User’s Manual to download the datalog,
configure the instrument settings, or update the MultiRAE’s firmware. 8. When you are done, press [Y/+] to exit the PC communications mode on the MultiRAE. The
instrument returns to operating in Normal mode.
Mini B USB (5-Pin) to USB cable
Mini B USB (5-Pin) port
Travel Charger
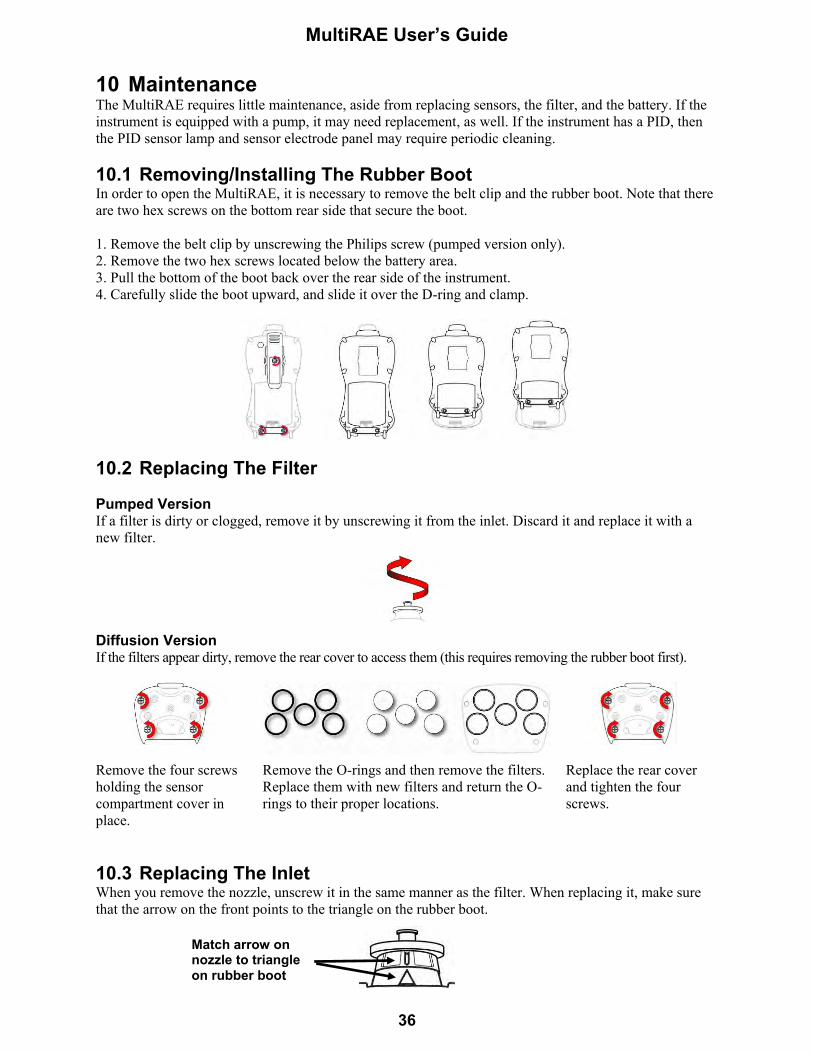
MultiRAE User’s Guide
36
10 Maintenance The MultiRAE requires little maintenance, aside from replacing sensors, the filter, and the battery. If the instrument is equipped with a pump, it may need replacement, as well. If the instrument has a PID, then the PID sensor lamp and sensor electrode panel may require periodic cleaning.
10.1 Removing/Installing The Rubber Boot In order to open the MultiRAE, it is necessary to remove the belt clip and the rubber boot. Note that there are two hex screws on the bottom rear side that secure the boot. 1. Remove the belt clip by unscrewing the Philips screw (pumped version only). 2. Remove the two hex screws located below the battery area. 3. Pull the bottom of the boot back over the rear side of the instrument. 4. Carefully slide the boot upward, and slide it over the D-ring and clamp.
10.2 Replacing The Filter Pumped Version If a filter is dirty or clogged, remove it by unscrewing it from the inlet. Discard it and replace it with a new filter.
Diffusion Version If the filters appear dirty, remove the rear cover to access them (this requires removing the rubber boot first).
Remove the four screws holding the sensor compartment cover in place.
Remove the O-rings and then remove the filters. Replace them with new filters and return the O-rings to their proper locations.
Replace the rear cover and tighten the four screws.
10.3 Replacing The Inlet When you remove the nozzle, unscrew it in the same manner as the filter. When replacing it, make sure that the arrow on the front points to the triangle on the rubber boot.
Match arrow on nozzle to triangle on rubber boot

MultiRAE User’s Guide
37
10.4 Removing/Cleaning/Replacing A PID (Pump Version Only) Note: If you need to access a PID for cleaning or replacement, you must remove the rubber boot and belt clip first.
1. Turn off the instrument. 2. Remove the four screws in holding the MultiRAE sensor compartment cover in place. 3. Remove the cover to expose the sensors.
4. Gently lift out the PID module with your fingers. 5. If the module requires replacement (for example, because the lamp does not illuminate, or the
module has been used past its expiration date), place a new module into the slot, being careful to match the indexing keys. The sensor can only go into its slot one way.
6. If you want to open the sensor module to inspect and clean the lamp and sensor electrode panel, you must use the special tool (part number G02-0306-003, package of three). Its “C”-shaped end has small “teeth” inside. Slide the tool so that the teeth slip into the notch between the module’s cap and body:
7. Gently pry up the cap using a rocking motion:
8. Once the cap is removed, set it aside.
9. Now lift the sensor electrode panel from the module:
10. Clean the sensor electrode panel in a solution of methanol lamp cleaner (included, along with cleaning swabs, in a PID Lamp Cleaning Kit, part number 081-0002-000), and allow it to dry.

MultiRAE User’s Guide
38
11. Clean the lamp’s window with a cleaning swab dipped in methanol lamp cleaner, and allow it to dry. Do not touch the lamp window with your fingers, as the residual oils will shorten its life.
12. Inspect the electrical contacts. Clean them with a swab dipped in lamp cleaner if they appear to need cleaning:
13. Reassemble the sensor module by placing the sensor electrode panel back in place and firmly pressing the cap back onto the top.
14. Place the sensor module back into the MultiRAE. Make sure the index points are aligned (it can only go in one way).
15. Reinstall the rear cover. 16. Tighten all four screws.
Note: Always calibrate the MultiRAE after replacing the sensor module. 10.5 Removing/Cleaning/Replacing Sensor Modules
WARNING! Do not replace sensors in hazardous locations.
All sensors are located inside the sensor compartment in the upper half of the MultiRAE. They are accessed by removing the cover that is held on by four screws.
1. Turn off the instrument. 2. Remove the four screws holding the sensor compartment. 3. Remove the cover. The sensors are plugged into the slots. 4. Gently lift out the desired sensor module with your fingers. 5. Install the replacement sensor. It can only go into its slot one way. The connector inside the
MultiRAE and the indexing guides are good visual indicators of how to set the sensor into position. Make sure the indexing keys are aligned and that the sensor is seated firmly.
Match index keys on sensor module with socket
Sensor indexing key
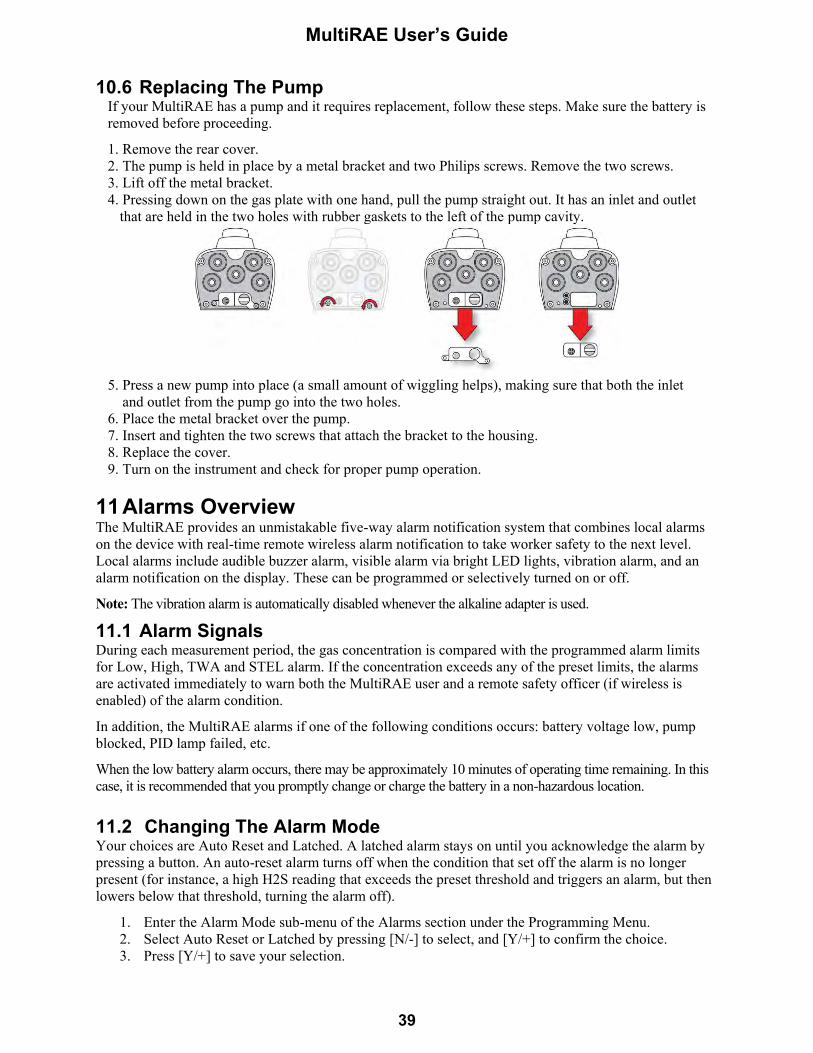
MultiRAE User’s Guide
39
10.6 Replacing The Pump If your MultiRAE has a pump and it requires replacement, follow these steps. Make sure the battery is removed before proceeding.
1. Remove the rear cover. 2. The pump is held in place by a metal bracket and two Philips screws. Remove the two screws. 3. Lift off the metal bracket. 4. Pressing down on the gas plate with one hand, pull the pump straight out. It has an inlet and outlet
that are held in the two holes with rubber gaskets to the left of the pump cavity.
5. Press a new pump into place (a small amount of wiggling helps), making sure that both the inlet and outlet from the pump go into the two holes. 6. Place the metal bracket over the pump. 7. Insert and tighten the two screws that attach the bracket to the housing. 8. Replace the cover. 9. Turn on the instrument and check for proper pump operation.
11 Alarms Overview The MultiRAE provides an unmistakable five-way alarm notification system that combines local alarms on the device with real-time remote wireless alarm notification to take worker safety to the next level. Local alarms include audible buzzer alarm, visible alarm via bright LED lights, vibration alarm, and an alarm notification on the display. These can be programmed or selectively turned on or off.
Note: The vibration alarm is automatically disabled whenever the alkaline adapter is used.
11.1 Alarm Signals During each measurement period, the gas concentration is compared with the programmed alarm limits for Low, High, TWA and STEL alarm. If the concentration exceeds any of the preset limits, the alarms are activated immediately to warn both the MultiRAE user and a remote safety officer (if wireless is enabled) of the alarm condition.
In addition, the MultiRAE alarms if one of the following conditions occurs: battery voltage low, pump blocked, PID lamp failed, etc.
When the low battery alarm occurs, there may be approximately 10 minutes of operating time remaining. In this case, it is recommended that you promptly change or charge the battery in a non-hazardous location. 11.2 Changing The Alarm Mode Your choices are Auto Reset and Latched. A latched alarm stays on until you acknowledge the alarm by pressing a button. An auto-reset alarm turns off when the condition that set off the alarm is no longer present (for instance, a high H2S reading that exceeds the preset threshold and triggers an alarm, but then lowers below that threshold, turning the alarm off).
1. Enter the Alarm Mode sub-menu of the Alarms section under the Programming Menu. 2. Select Auto Reset or Latched by pressing [N/-] to select, and [Y/+] to confirm the choice. 3. Press [Y/+] to save your selection.
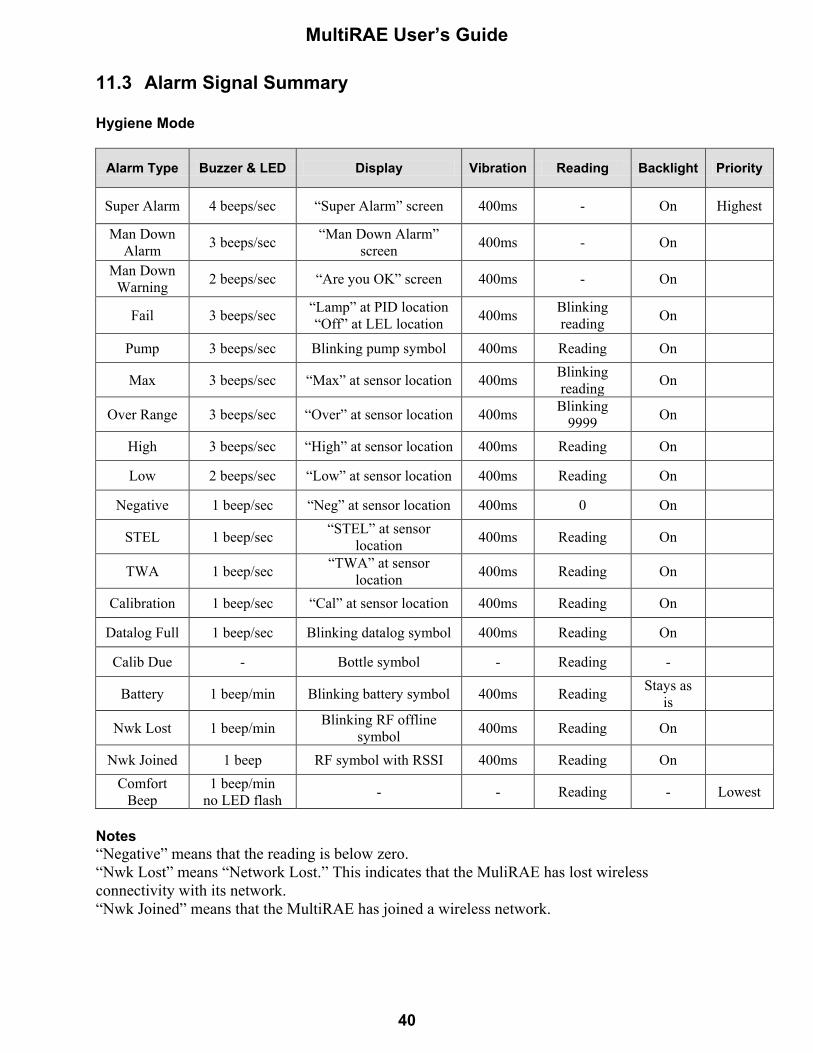
MultiRAE User’s Guide
40
11.3 Alarm Signal Summary Hygiene Mode
Alarm Type Buzzer & LED Display Vibration Reading Backlight Priority
Super Alarm 4 beeps/sec “Super Alarm” screen 400ms - On Highest
Man Down Alarm 3 beeps/sec “Man Down Alarm”
screen 400ms - On
Man Down Warning 2 beeps/sec “Are you OK” screen 400ms - On
Fail 3 beeps/sec “Lamp” at PID location “Off” at LEL location 400ms Blinking
reading On
Pump 3 beeps/sec Blinking pump symbol 400ms Reading On
Max 3 beeps/sec “Max” at sensor location 400ms Blinking reading On
Over Range 3 beeps/sec “Over” at sensor location 400ms Blinking 9999 On
High 3 beeps/sec “High” at sensor location 400ms Reading On
Low 2 beeps/sec “Low” at sensor location 400ms Reading On
Negative 1 beep/sec “Neg” at sensor location 400ms 0 On
STEL 1 beep/sec “STEL” at sensor location 400ms Reading On
TWA 1 beep/sec “TWA” at sensor location 400ms Reading On
Calibration 1 beep/sec “Cal” at sensor location 400ms Reading On
Datalog Full 1 beep/sec Blinking datalog symbol 400ms Reading On
Calib Due - Bottle symbol - Reading -
Battery 1 beep/min Blinking battery symbol 400ms Reading Stays as is
Nwk Lost 1 beep/min Blinking RF offline symbol 400ms Reading On
Nwk Joined 1 beep RF symbol with RSSI 400ms Reading On Comfort
Beep 1 beep/min
no LED flash - - Reading - Lowest
Notes “Negative” means that the reading is below zero. “Nwk Lost” means “Network Lost.” This indicates that the MuliRAE has lost wireless connectivity with its network. “Nwk Joined” means that the MultiRAE has joined a wireless network.
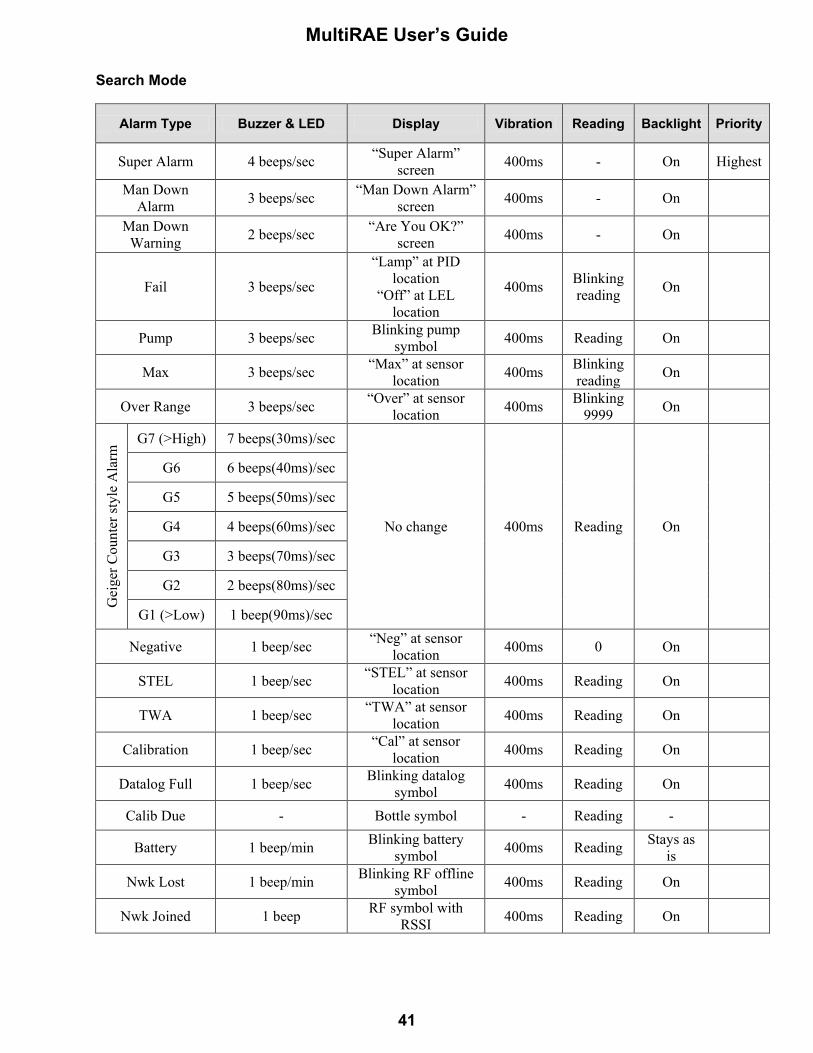
MultiRAE User’s Guide
41
Search Mode
Alarm Type Buzzer & LED Display Vibration Reading Backlight Priority
Super Alarm 4 beeps/sec “Super Alarm” screen 400ms - On Highest
Man Down Alarm 3 beeps/sec “Man Down Alarm”
screen 400ms - On
Man Down Warning 2 beeps/sec “Are You OK?”
screen 400ms - On
Fail 3 beeps/sec
“Lamp” at PID location
“Off” at LEL location
400ms Blinking reading On
Pump 3 beeps/sec Blinking pump symbol 400ms Reading On
Max 3 beeps/sec “Max” at sensor location 400ms Blinking
reading On
Over Range 3 beeps/sec “Over” at sensor location 400ms Blinking
9999 On
Gei
ger C
ount
er st
yle
Ala
rm G7 (>High) 7 beeps(30ms)/sec
No change 400ms Reading On
G6 6 beeps(40ms)/sec
G5 5 beeps(50ms)/sec
G4 4 beeps(60ms)/sec
G3 3 beeps(70ms)/sec
G2 2 beeps(80ms)/sec
G1 (>Low) 1 beep(90ms)/sec
Negative 1 beep/sec “Neg” at sensor location 400ms 0 On
STEL 1 beep/sec “STEL” at sensor location 400ms Reading On
TWA 1 beep/sec “TWA” at sensor location 400ms Reading On
Calibration 1 beep/sec “Cal” at sensor location 400ms Reading On
Datalog Full 1 beep/sec Blinking datalog symbol 400ms Reading On
Calib Due - Bottle symbol - Reading -
Battery 1 beep/min Blinking battery symbol 400ms Reading Stays as
is
Nwk Lost 1 beep/min Blinking RF offline symbol 400ms Reading On
Nwk Joined 1 beep RF symbol with RSSI 400ms Reading On

MultiRAE User’s Guide
42
General Alarms Message Condition Alarm Indications
HIGH Gas exceeds “High Alarm” limit 3 beeps/flashes per second
OVR Gas exceeds sensor’s measurement range 3 beeps/flashes per second
MAX Gas exceeds electronic circuit’s maximum range
3 beeps/flashes per second
LOW Gas exceeds “Low Alarm” limit* 2 beeps/flashes per second
TWA Gas exceeds “TWA” limit 1 Beep/flash per second
STEL Gas exceeds “STEL” limit 1 Beep/flash per second
Crossed pump icon flashes
Inlet blocked or pump failure 3 beeps/flashes per second
“Lamp” flashes
PID lamp failure 3 beeps/flashes per second
Empty battery icon flashes
Low battery 1 flash, 1 beep per minute
CAL Calibration failed, or needs calibration 1 beep/flash per second
NEG Zero gas reading measures less than number stored in calibration
1 beep/flash per second
* For oxygen, “low alarm limit” means a concentration is lower than the low alarm limit.
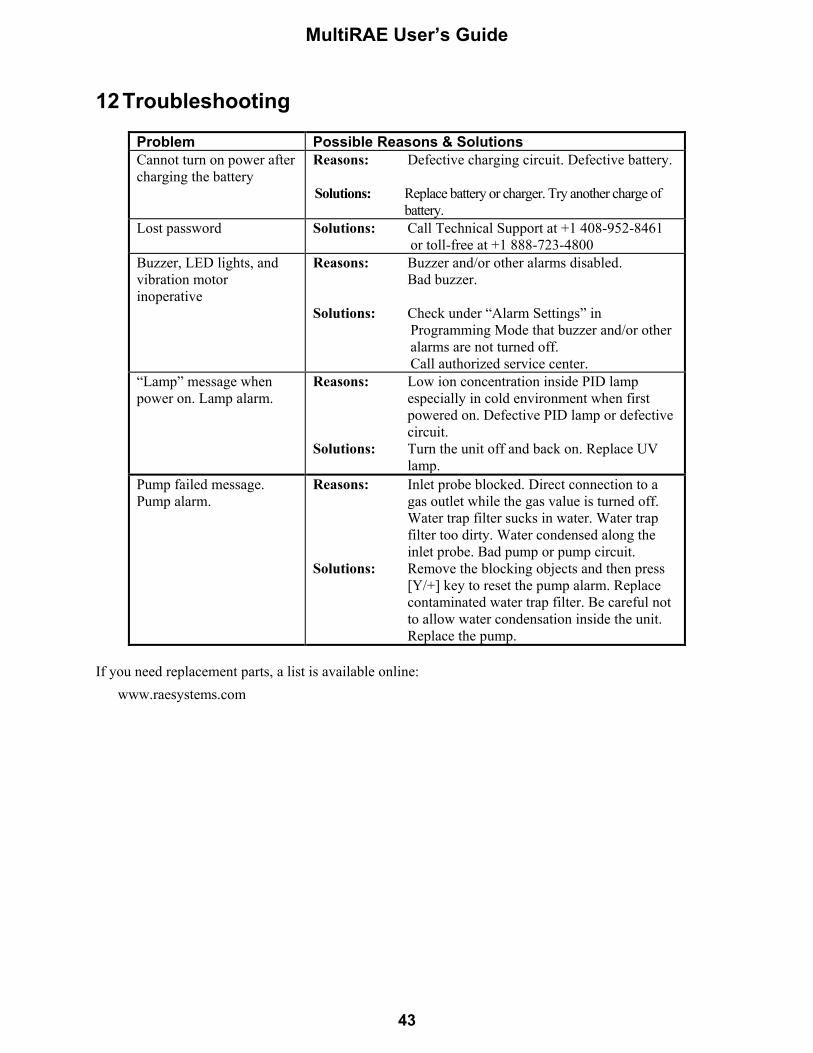
MultiRAE User’s Guide
43
12 Troubleshooting
Problem Possible Reasons & Solutions Cannot turn on power after charging the battery
Reasons: Defective charging circuit. Defective battery. Solutions: Replace battery or charger. Try another charge of
battery. Lost password Solutions: Call Technical Support at +1 408-952-8461
or toll-free at +1 888-723-4800 Buzzer, LED lights, and vibration motor inoperative
Reasons: Buzzer and/or other alarms disabled. Bad buzzer.
Solutions: Check under “Alarm Settings” in
Programming Mode that buzzer and/or other alarms are not turned off. Call authorized service center.
“Lamp” message when power on. Lamp alarm.
Reasons: Low ion concentration inside PID lamp especially in cold environment when first powered on. Defective PID lamp or defective circuit.
Solutions: Turn the unit off and back on. Replace UV lamp.
Pump failed message. Pump alarm.
Reasons: Inlet probe blocked. Direct connection to a gas outlet while the gas value is turned off. Water trap filter sucks in water. Water trap filter too dirty. Water condensed along the inlet probe. Bad pump or pump circuit.
Solutions: Remove the blocking objects and then press [Y/+] key to reset the pump alarm. Replace contaminated water trap filter. Be careful not to allow water condensation inside the unit. Replace the pump.
If you need replacement parts, a list is available online:
www.raesystems.com
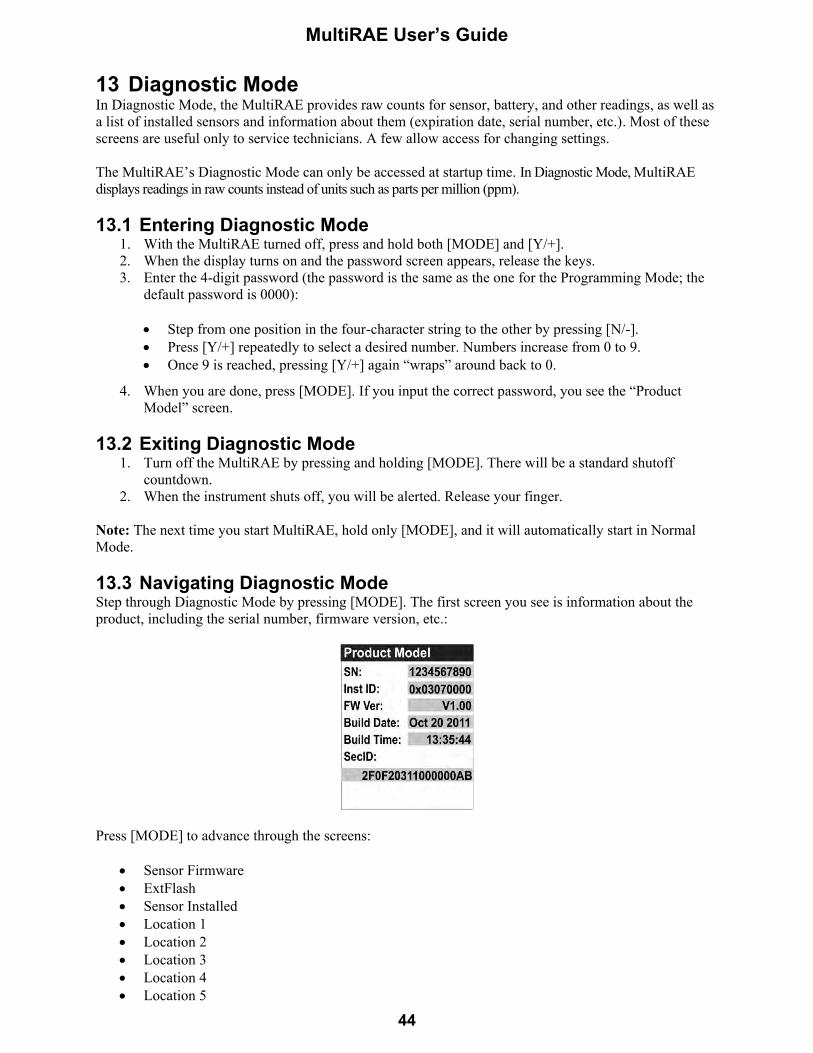
MultiRAE User’s Guide
44
13 Diagnostic Mode In Diagnostic Mode, the MultiRAE provides raw counts for sensor, battery, and other readings, as well as a list of installed sensors and information about them (expiration date, serial number, etc.). Most of these screens are useful only to service technicians. A few allow access for changing settings. The MultiRAE’s Diagnostic Mode can only be accessed at startup time. In Diagnostic Mode, MultiRAE displays readings in raw counts instead of units such as parts per million (ppm). 13.1 Entering Diagnostic Mode
1. With the MultiRAE turned off, press and hold both [MODE] and [Y/+]. 2. When the display turns on and the password screen appears, release the keys. 3. Enter the 4-digit password (the password is the same as the one for the Programming Mode; the
default password is 0000): Step from one position in the four-character string to the other by pressing [N/-]. Press [Y/+] repeatedly to select a desired number. Numbers increase from 0 to 9. Once 9 is reached, pressing [Y/+] again “wraps” around back to 0.
4. When you are done, press [MODE]. If you input the correct password, you see the “Product Model” screen.
13.2 Exiting Diagnostic Mode
1. Turn off the MultiRAE by pressing and holding [MODE]. There will be a standard shutoff countdown.
2. When the instrument shuts off, you will be alerted. Release your finger. Note: The next time you start MultiRAE, hold only [MODE], and it will automatically start in Normal Mode. 13.3 Navigating Diagnostic Mode Step through Diagnostic Mode by pressing [MODE]. The first screen you see is information about the product, including the serial number, firmware version, etc.:
Press [MODE] to advance through the screens:
Sensor Firmware ExtFlash Sensor Installed Location 1 Location 2 Location 3 Location 4 Location 5
MultiRAE User’s Guide
45
Socket Raw Count Calibration Data Buzzer Pump Battery RTC (real-time clock) Lights/Vibrator T.H. (temperature and humidity) LCD Contrast Position Sensor Communicate With Computer? (Datalogging And Measurement Will Pause)

MultiRAE User’s Guide
46
14 Specifications
Instrument Specifications Size 7.6" H x 3.8" W x 2.6" D (193 x 96.5 x 66 mm)
Weight Pumped models: 31 oz. (880 g) Diffusion models: 26.8 oz. (760 g)
Sensor
Over 30 intelligent interchangeable field-replaceable sensors, including Gamma radiation, ppb and ppm PIDs, electrochemicals for toxics and oxygen, combustible LEL and NDIR, and CO2 NDIR
Battery Options
• Rechargeable Li-ion (~12 hours runtime, pumped/18 hours, diffusion; < 6 hours recharge time) • Alkaline adapter for 4 x AA batteries (~ 6 hours runtime, pumped/8 hours, diffusion)
Display
• Monochrome graphical LCD display (128 x 160) with backlighting (activated automatically in dim ambient lighting conditions, when monitor is in alarm, or with a button press) • Automatic screen flipping.
Display Readout
• Real-time reading of gas concentrations; PID measurement gas and correction factor; battery status; datalogging on/off; wireless on/off and reception quality. • STEL, TWA, peak, and minimum values
Keypad 1 operation and 2 programming keys (MODE, Y/+, and N/-)
Sampling Built-in pump or diffusion. Average flow rate, pumped: 250 cc/min. Auto shutoff in low-flow conditions
Calibration Automatic with AutoRAE 2 Test and Calibration Station or manual
Alarms
• Wireless remote alarm notification; multi-tone audible (95 dB @ 30 cm), vibration, visible (flashing bright red LEDs), and on-screen indication of alarm conditions • Man Down Alarm with pre-alarm and real-time remote wireless notification
Datalogging
• Continuous datalogging (six months for 5 sensors at 1-minute intervals, 24/7) • User-configurable datalogging interval (from 1 to 3,600 seconds)
Communication and Data Download
• Data download and instrument set-up and upgrades on PC via charging and PC communication cradle, travel charger, or AutoRAE 2 Automated Test and Calibration Station1 • Wireless data and status transmission via built-in RF modem (optional)
Wireless Network
RAE Systems Dedicated Wireless Network
Wireless Frequency
ISM license-free bands
Wireless Range (Typical)
656 feet (200 meters)
EM Immunity No effect when exposed to 0.43mW/cm2 RF interference (5-watt transmitter at 12")
Operating Temperature
-4° to 122° F (-20° to 50° C)
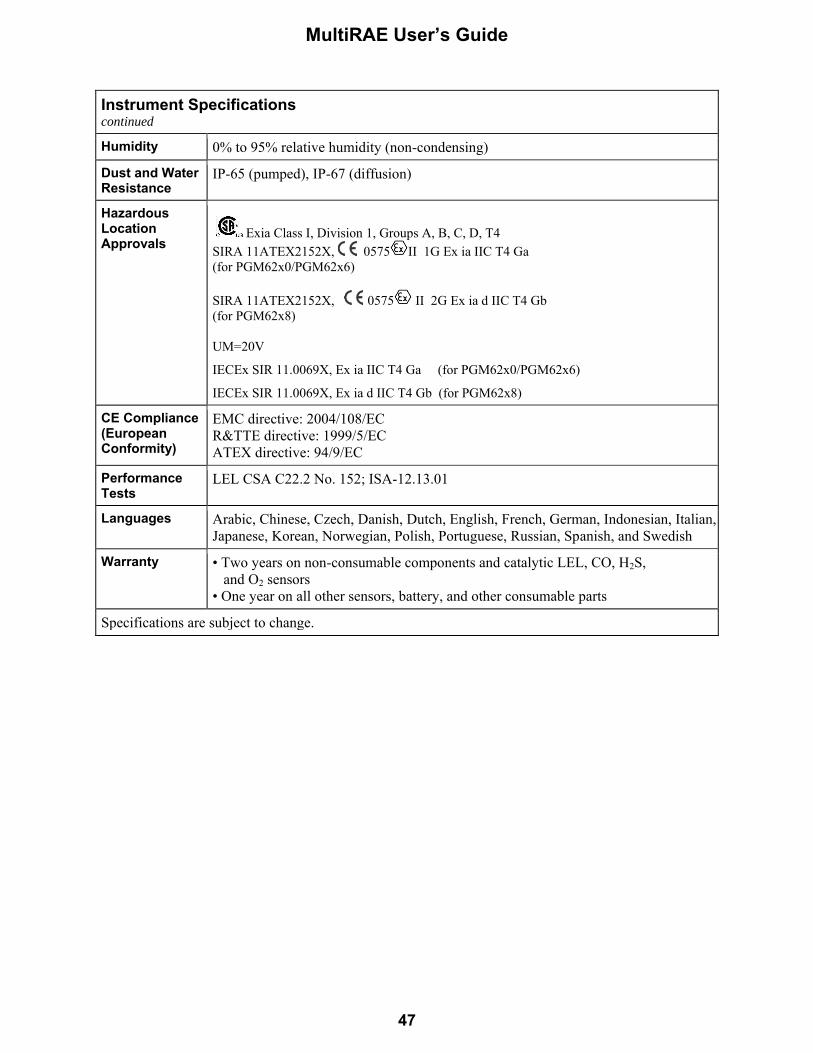
MultiRAE User’s Guide
47
Instrument Specifications continued
Humidity 0% to 95% relative humidity (non-condensing)
Dust and Water Resistance
IP-65 (pumped), IP-67 (diffusion)
Hazardous Location Approvals
Exia Class I, Division 1, Groups A, B, C, D, T4 SIRA 11ATEX2152X, 0575 II 1G Ex ia IIC T4 Ga (for PGM62x0/PGM62x6) SIRA 11ATEX2152X, 0575 II 2G Ex ia d IIC T4 Gb (for PGM62x8) UM=20V
IECEx SIR 11.0069X, Ex ia IIC T4 Ga (for PGM62x0/PGM62x6)
IECEx SIR 11.0069X, Ex ia d IIC T4 Gb (for PGM62x8)
CE Compliance (European Conformity)
EMC directive: 2004/108/EC R&TTE directive: 1999/5/EC ATEX directive: 94/9/EC
Performance Tests
LEL CSA C22.2 No. 152; ISA-12.13.01
Languages Arabic, Chinese, Czech, Danish, Dutch, English, French, German, Indonesian, Italian, Japanese, Korean, Norwegian, Polish, Portuguese, Russian, Spanish, and Swedish
Warranty • Two years on non-consumable components and catalytic LEL, CO, H2S, and O2 sensors • One year on all other sensors, battery, and other consumable parts
Specifications are subject to change.
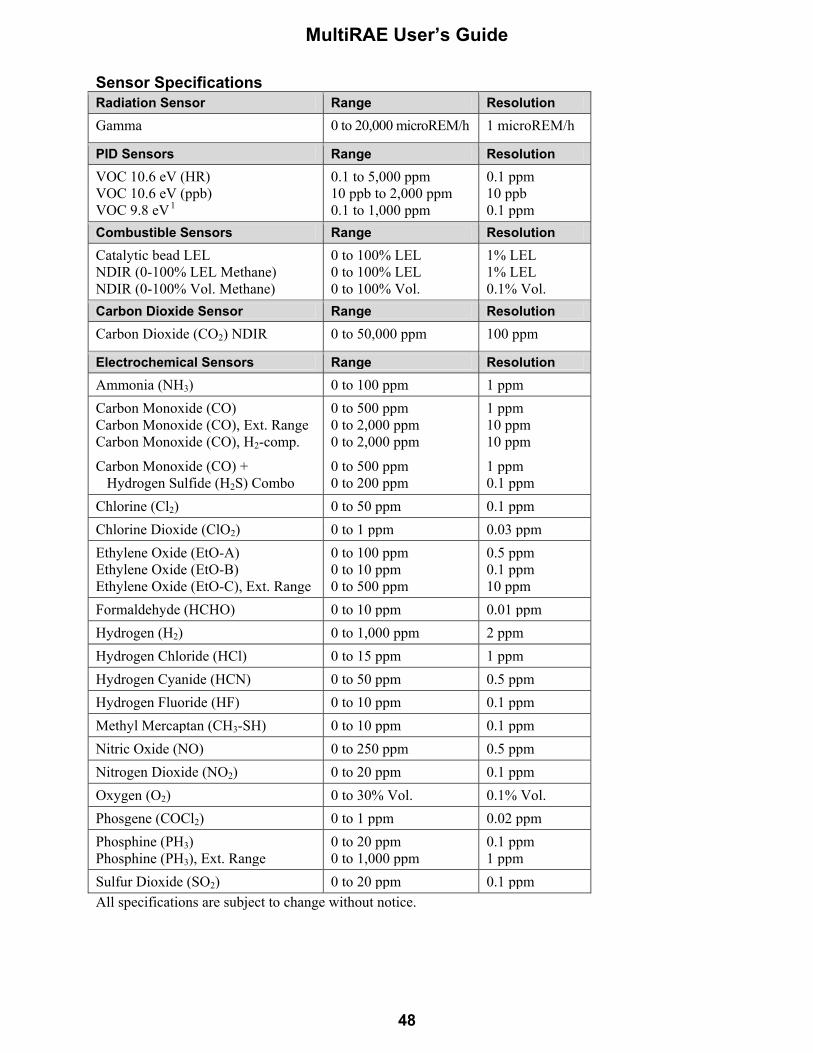
MultiRAE User’s Guide
48
Sensor Specifications Radiation Sensor Range Resolution Gamma 0 to 20,000 microREM/h 1 microREM/h
PID Sensors Range Resolution VOC 10.6 eV (HR) VOC 10.6 eV (ppb) VOC 9.8 eV
1
0.1 to 5,000 ppm 10 ppb to 2,000 ppm 0.1 to 1,000 ppm
0.1 ppm 10 ppb 0.1 ppm
Combustible Sensors Range Resolution Catalytic bead LEL NDIR (0-100% LEL Methane) NDIR (0-100% Vol. Methane)
0 to 100% LEL 0 to 100% LEL 0 to 100% Vol.
1% LEL 1% LEL 0.1% Vol.
Carbon Dioxide Sensor Range Resolution Carbon Dioxide (CO2) NDIR 0 to 50,000 ppm 100 ppm
Electrochemical Sensors Range Resolution Ammonia (NH3) 0 to 100 ppm 1 ppm Carbon Monoxide (CO) Carbon Monoxide (CO), Ext. Range Carbon Monoxide (CO), H2-comp.
Carbon Monoxide (CO) + Hydrogen Sulfide (H2S) Combo
0 to 500 ppm 0 to 2,000 ppm 0 to 2,000 ppm
0 to 500 ppm 0 to 200 ppm
1 ppm 10 ppm 10 ppm
1 ppm 0.1 ppm
Chlorine (Cl2) 0 to 50 ppm 0.1 ppm Chlorine Dioxide (ClO2) 0 to 1 ppm 0.03 ppm Ethylene Oxide (EtO-A) Ethylene Oxide (EtO-B) Ethylene Oxide (EtO-C), Ext. Range
0 to 100 ppm 0 to 10 ppm 0 to 500 ppm
0.5 ppm 0.1 ppm 10 ppm
Formaldehyde (HCHO) 0 to 10 ppm 0.01 ppm Hydrogen (H2) 0 to 1,000 ppm 2 ppm Hydrogen Chloride (HCl) 0 to 15 ppm 1 ppm Hydrogen Cyanide (HCN) 0 to 50 ppm 0.5 ppm Hydrogen Fluoride (HF) 0 to 10 ppm 0.1 ppm Methyl Mercaptan (CH3-SH) 0 to 10 ppm 0.1 ppm Nitric Oxide (NO) 0 to 250 ppm 0.5 ppm Nitrogen Dioxide (NO2) 0 to 20 ppm 0.1 ppm Oxygen (O2) 0 to 30% Vol. 0.1% Vol. Phosgene (COCl2) 0 to 1 ppm 0.02 ppm Phosphine (PH3) Phosphine (PH3), Ext. Range
0 to 20 ppm 0 to 1,000 ppm
0.1 ppm 1 ppm
Sulfur Dioxide (SO2) 0 to 20 ppm 0.1 ppm All specifications are subject to change without notice.
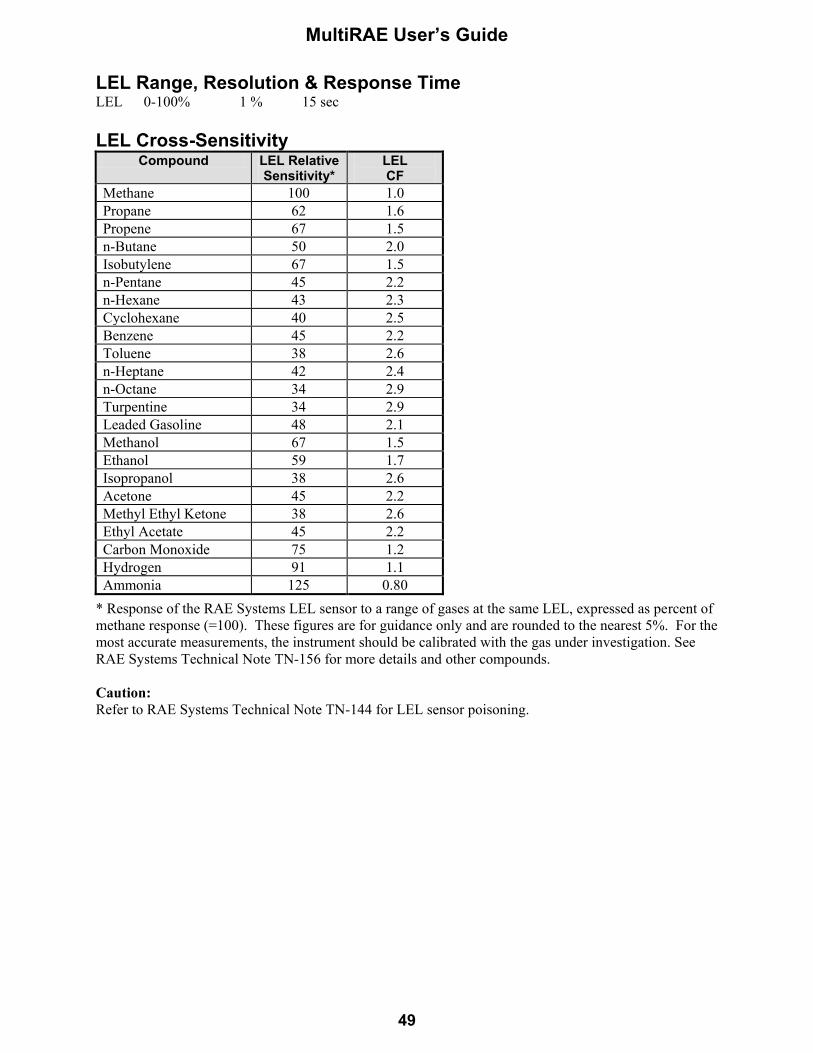
MultiRAE User’s Guide
49
LEL Range, Resolution & Response Time LEL 0-100% 1 % 15 sec LEL Cross-Sensitivity
Compound LEL Relative Sensitivity*
LEL CF
Methane 100 1.0 Propane 62 1.6 Propene 67 1.5 n-Butane 50 2.0 Isobutylene 67 1.5 n-Pentane 45 2.2 n-Hexane 43 2.3 Cyclohexane 40 2.5 Benzene 45 2.2 Toluene 38 2.6 n-Heptane 42 2.4 n-Octane 34 2.9 Turpentine 34 2.9 Leaded Gasoline 48 2.1 Methanol 67 1.5 Ethanol 59 1.7 Isopropanol 38 2.6 Acetone 45 2.2 Methyl Ethyl Ketone 38 2.6 Ethyl Acetate 45 2.2 Carbon Monoxide 75 1.2 Hydrogen 91 1.1 Ammonia 125 0.80
* Response of the RAE Systems LEL sensor to a range of gases at the same LEL, expressed as percent of methane response (=100). These figures are for guidance only and are rounded to the nearest 5%. For the most accurate measurements, the instrument should be calibrated with the gas under investigation. See RAE Systems Technical Note TN-156 for more details and other compounds. Caution: Refer to RAE Systems Technical Note TN-144 for LEL sensor poisoning.

MultiRAE User’s Guide
50
Year Of Manufacture To identify the year of manufacture, refer to the serial number of the instrument.
The second to last digit in the serial number indicates the year of manufacture. For example, “M” indicates the manufacturing year is 2010. First digit Year J 2008 K 2009 M 2010 N 2011 P 2012 Q 2013 R 2014 S 2015 T 2016 U 2017 V 2018 W 2019 15 Technical Support To contact RAE Systems Technical Support Team: Monday through Friday, 7:00AM to 5:00PM Pacific (US) Time Phone (toll-free): +1 888-723-4800 Phone: +1 408-952-8461 Email: [email protected] Critical after-hours support is available: +1 408-952-8200 select option 9
MultiRAE User’s Guide
51
16 RAE Systems Contacts RAE Systems World Headquarters 3775 N. First St. San Jose, CA 95134-1708 USA Phone: +1 408.952.8200 Fax: +1 408.952.8480 E-mail: [email protected] Web Site: www.raesystems.com RAE Systems Technical Support Monday through Friday, 7:00AM to 5:00PM Pacific Time Phone: +1.408.952.8461 Email: [email protected] Critical after-hours support is available +1.408.952.8200 select option 9 RAE Systems Europe ApS Kirstinehøj 23 A DK-2770 Kastrup Denmark Phone: +45 86 52 51 55 Fax: +45 86 52 51 77 [email protected] [email protected] [email protected] Web: www.raesystems.eu RAE Systems UK Ltd D5 Culham Innovation Centre Culham Science Centre Abingdon, Oxon OX14 3DB United Kingdom Phone: +44 1865408368 Fax: +44 1235531119 Mobile: +44 7841362693 Email: [email protected] RAE Systems France 336, rue de la fée des eaux 69390 Vernaison France Phone: +33 4 78 46 16 65 Fax: +33 4 78 46 25 98 Email: [email protected] Web: www.raesystems.fr
MultiRAE User’s Guide
52
RAE BeNeLux BV Hoofdweg 34C 2908 LC Capelle a/d IJssel The Netherlands Phone: +31 10 4426149 Fax: +31 10 4426148 Email: [email protected] Web: www.rae.nl RAE Systems Spain, s.l. Av. Remolar, 31 08820 El Prat de Llobregat Spain Phone: +34 933 788 352 Fax: +34 933 788 353 Mobile: +34 687 491 106 Email: [email protected] Web: www.raespain.com RAE Middle East LOB 7, Ground Floor, Office 19 Jebel Ali Free Zone Dubai, United Arab Emirates Phone: +971.4.887.5562 Email: [email protected]
RAE Systems (Hong Kong) Ltd. Room 8, 6/F, Hong Leong Plaza 33 Lok Yip Road Fanling, N.T, Hong Kong Phone: +852.2669.0828 Fax: +852.2669.0803 Email: [email protected] RAE Systems Japan 403 Plaza Ochanomizu Bldg. 2-1 Surugadai Kanda Chiyoda-Ku Tokyo, Japan Phone: 81-3-5283-3268 Fax: 81-3-5283-3275 Email: [email protected] RAE Systems Korea #1010, DaeMyungAnsVill First, Sang-Dong 412-2, Wonmi-Gu, Bucheon, Kyungki-Do, Korea Phone: 82-32-328-7123 Fax: 82-32-328-7127 Email: [email protected]


RAE Systems World Headquarters
3775 N. First St. San Jose, CA 95134-1708 USA
Phone: 408.952.8200 Fax: 408.952.8480
E-mail: [email protected]
Web Site: www.raesystems.com
Rev C November 2011
P/N: M01-4003-000

TVA-1000B
TOXIC VAPOR ANALYZER
INSTRUCTION MANUAL P/N BK3500
THERMO ENVIRONMENTAL INSTRUMENTS INC. 8 WEST FORGE PARKWAY
FRANKLIN, MASSACHUSETTS 02038
TELEPHONE: (508) 520-0430 FACSIMILE: (508) 520-1460
5-15-01

Other brands and product names mentioned in this instruction manual are trademarks of their respective owners.
Copyright 2001 Thermo Environmental Instruments, Inc.
Franklin, Massachusetts �This manual is a work protected under Copyright law. Copying or other reproduction of any of its contents without the prior written consent of Thermo Environmental Instruments is expressly prohibited.�

Publications Comments Form
Document Part Number BK3500 Fax 508-520-1460 Title Model TVA-1000B Instruction Manual
We continually seek to improve the content and usability of our technical documents. You can help us by answering the questions below and mailing this form to us.
How do you use this document? Introduction to the product Advanced programming techniques Classroom resource Operating instructions Self-study Reference Programming procedures Other
How did you get this document? Received with equipment Ordered from TEI
Do not know Received from Sales or Customer Service Representative Other
Please rate this document. Excellent Good Poor Technical Accuracy
Does the system work as described in the manual?
Readability Is the manual easy to read and understand?
Clarity Are the instructions easy to follow?
Examples Are the examples helpful and realistic? Are there enough examples?
Organization Is the organization of the manual logical? Is it easy to find what you are looking for?
Illustrations Are the illustrations clear and useful? Appearance What do you think of the layout, printing, binding, etc.?
Yes NoAre there any terms or concepts that are not defined clearly? If so, what are they? ____________________________________________________________________________________
Yes NoAfter reading this manual, are you able to use the equipment?
What errors did you find in the manual? Please include page numbers. Attach extra sheets if necessary. ____________________________________________________________________________________
Do you have any comments or suggestions? ____________________________________________________________________________________ ____________________________________________________________________________________
Name: _____________________________________ Street: ____________________________________ Title: ______________________________________ City: ____________________________________ Dept./Mail Stop ____________________________ State/Country: _____________________________ Company: _________________________________ Zip Code: _________ Telephone: ______________
Thank you for your help.
Sent by __________________________ __________________________ _______________________
Thermo Environmental Instruments, Inc. 8 West Forge Parkway Franklin, MA. 02038-3136
Attn: Technical Publications
PLACESTAMPHERE
TVA 1000BToxic Vapor Analyzer
July 28, 2000
Overall Table of Contents For Manual P/N BK3500
DOCUMENT DESCRIPTION
MI 611-185 TVA-1000B Toxic Vapor Analyzer, Operation, Configuration, andMaintenance
MI 611-187 TVA-1000 Toxic Vapor Analyzer PC Software
Ml 611-186 PC Interface Program (PCIP) Software for Interfacing a PC and aTVA-I000B Toxic Vapor Analyzer
Ml 611-183 CENTURY TVA-1000 ToxicVaporAnalyzer 11.8 eV PID LampCapsules (Part No. CR01 IYZ)
Ml 611-182 WATERTRAP Probe (Part No. CRO13EA)
PL 611-139 TVA-1000B Toxic Vapor Analyzer - Parts List
Addendum Importing TVA-1000B Files into Microcoft Excel via the PCIPSoftware


ix
General Instructions
TEI designs, manufactures, and tests its products to meet many national and international standards. However, for these products to operate within their normal specifications, you must properly install, use, and maintain these products. The following instructions must be adhered to and integrated with your safety program when installing, using, and maintaining Foxboro products.
♦ Read and save all instructions prior to installing, operating, and servicing the product.
♦ If you do not understand any of the instructions, contact your Foxboro representa-tive for clarification.
♦ Follow all warnings, cautions, and instructions marked on and supplied with the product.
♦ Inform and educate your personnel in the proper installation, operation, and maintenance of the product.
♦ To ensure proper performance, use qualified personnel to operate, update, pro-gram, and maintain the product.
♦ When replacement parts are required, ensure that the qualified service technician uses replacement parts specified by Foxboro. Unauthorized substitutions may result in fire, electrical shock, other hazards, or improper operation of equipment.
♦ Except when maintenance is being performed by qualified personnel, ensure that all equipment doors are closed and protective covers are in place, to prevent electri-cal shock and personal injury.

MI 611-185 – June 1996 General Instructions
x
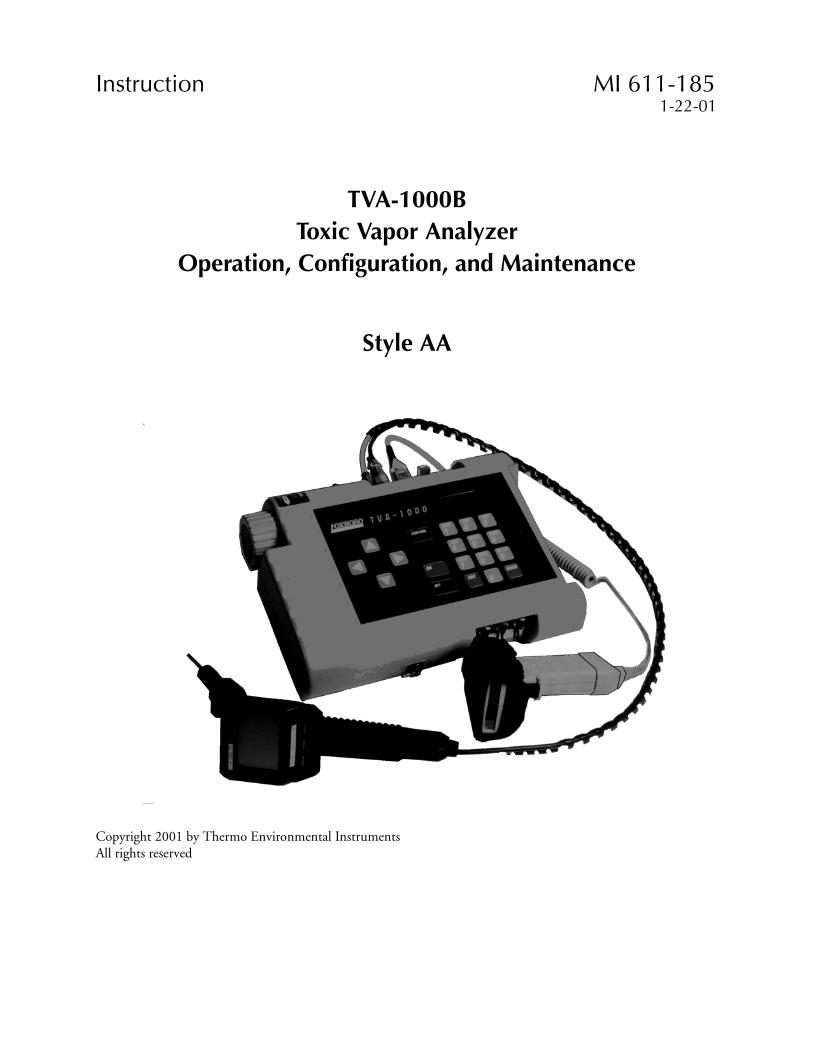
Instruction MI 611-1851-22-01
TVA-1000BToxic Vapor Analyzer
Operation, Configuration, and Maintenance
Style AA
Copyright 2001 by Thermo Environmental InstrumentsAll rights reserved

MI 611-185 – January 2001
iii
Contents
Figures............................................................................................................................. vii
Tables............................................................................................................................. viii
General Instructions ......................................................................................................... ix
Introduction ..................................................................................................................... 1Overview ............................................................................................................................. 1
Instrument Functions .......................................................................................................... 2
Using the Instrument .......................................................................................................... 2
Standard Specifications ....................................................................................................... 3
External Influences .............................................................................................................. 5
Product Safety Specifications ............................................................................................... 6
Theory of Operation ........................................................................................................ 7Flame Ionization Detection (FID) ....................................................................................... 7
Benefits of Flame Ionization Detection ........................................................................... 8
Photoionization Detection .................................................................................................. 8Benefits of Photoionization Detection ............................................................................ 8
Dual Detectors .................................................................................................................... 9Benefits of Dual Detectors .............................................................................................. 9
Concentration Calculation and Calibration ....................................................................... 10
Hardware ....................................................................................................................... 11Instrument Connections ................................................................................................... 11
Analog Outputs ................................................................................................................ 12
Instrument Sidepack Display ............................................................................................ 12Instrument Sidepack Keypad ............................................................................................. 13
Probe Connections ............................................................................................................ 15
BASIC Probe Display ........................................................................................................ 15
BASIC Probe Keys ............................................................................................................ 16
Enhanced Probe Display ................................................................................................... 17
Enhanced Probe Keys ........................................................................................................ 17
Startup and Familiarization ............................................................................................ 19Quick Start Procedure ....................................................................................................... 19
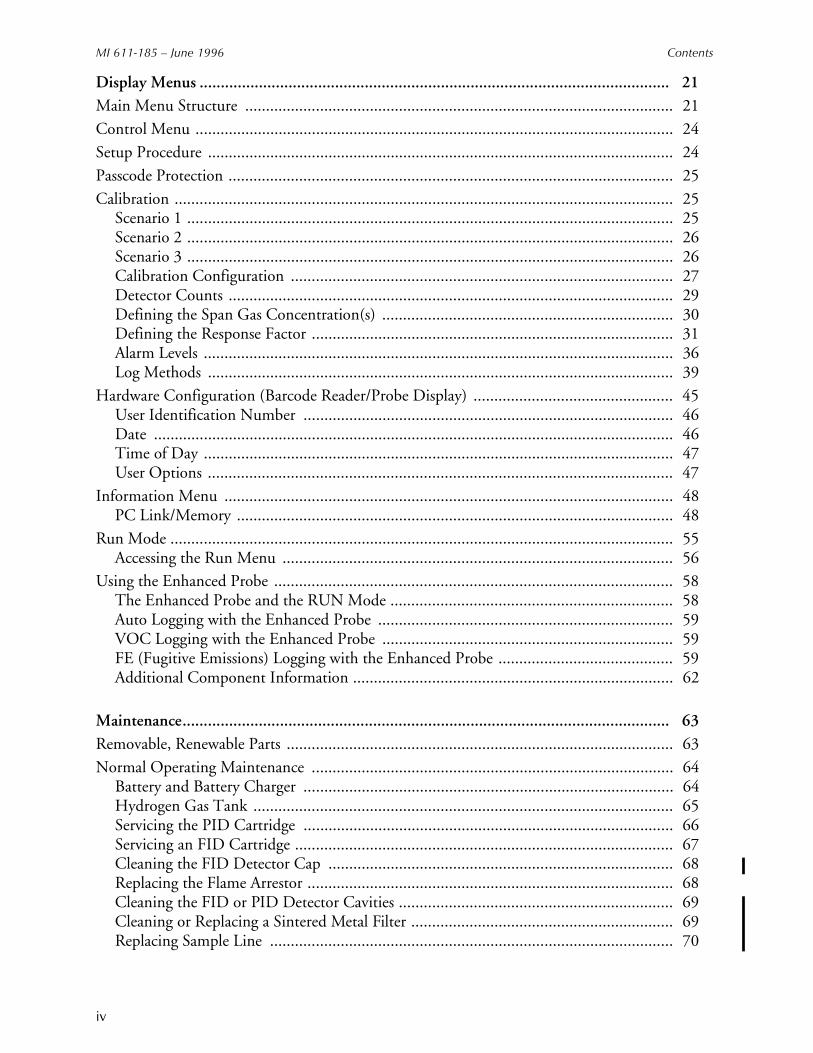
MI 611-185 – June 1996 Contents
iv
Display Menus ............................................................................................................... 21Main Menu Structure ....................................................................................................... 21
Control Menu ................................................................................................................... 24
Setup Procedure ................................................................................................................ 24
Passcode Protection ........................................................................................................... 25
Calibration ........................................................................................................................ 25Scenario 1 ..................................................................................................................... 25Scenario 2 ..................................................................................................................... 26Scenario 3 ..................................................................................................................... 26Calibration Configuration ............................................................................................ 27Detector Counts ........................................................................................................... 29Defining the Span Gas Concentration(s) ...................................................................... 30Defining the Response Factor ....................................................................................... 31Alarm Levels ................................................................................................................. 36Log Methods ................................................................................................................ 39
Hardware Configuration (Barcode Reader/Probe Display) ................................................ 45User Identification Number ......................................................................................... 46Date ............................................................................................................................. 46Time of Day ................................................................................................................. 47User Options ................................................................................................................ 47
Information Menu ............................................................................................................ 48PC Link/Memory ......................................................................................................... 48
Run Mode ......................................................................................................................... 55Accessing the Run Menu .............................................................................................. 56
Using the Enhanced Probe ................................................................................................ 58The Enhanced Probe and the RUN Mode .................................................................... 58Auto Logging with the Enhanced Probe ....................................................................... 59VOC Logging with the Enhanced Probe ...................................................................... 59FE (Fugitive Emissions) Logging with the Enhanced Probe .......................................... 59Additional Component Information ............................................................................. 62
Maintenance................................................................................................................... 63Removable, Renewable Parts ............................................................................................. 63
Normal Operating Maintenance ....................................................................................... 64Battery and Battery Charger ......................................................................................... 64Hydrogen Gas Tank ..................................................................................................... 65Servicing the PID Cartridge ......................................................................................... 66Servicing an FID Cartridge ........................................................................................... 67Cleaning the FID Detector Cap ................................................................................... 68Replacing the Flame Arrestor ........................................................................................ 68Cleaning the FID or PID Detector Cavities .................................................................. 69Cleaning or Replacing a Sintered Metal Filter ............................................................... 69Replacing Sample Line ................................................................................................. 70
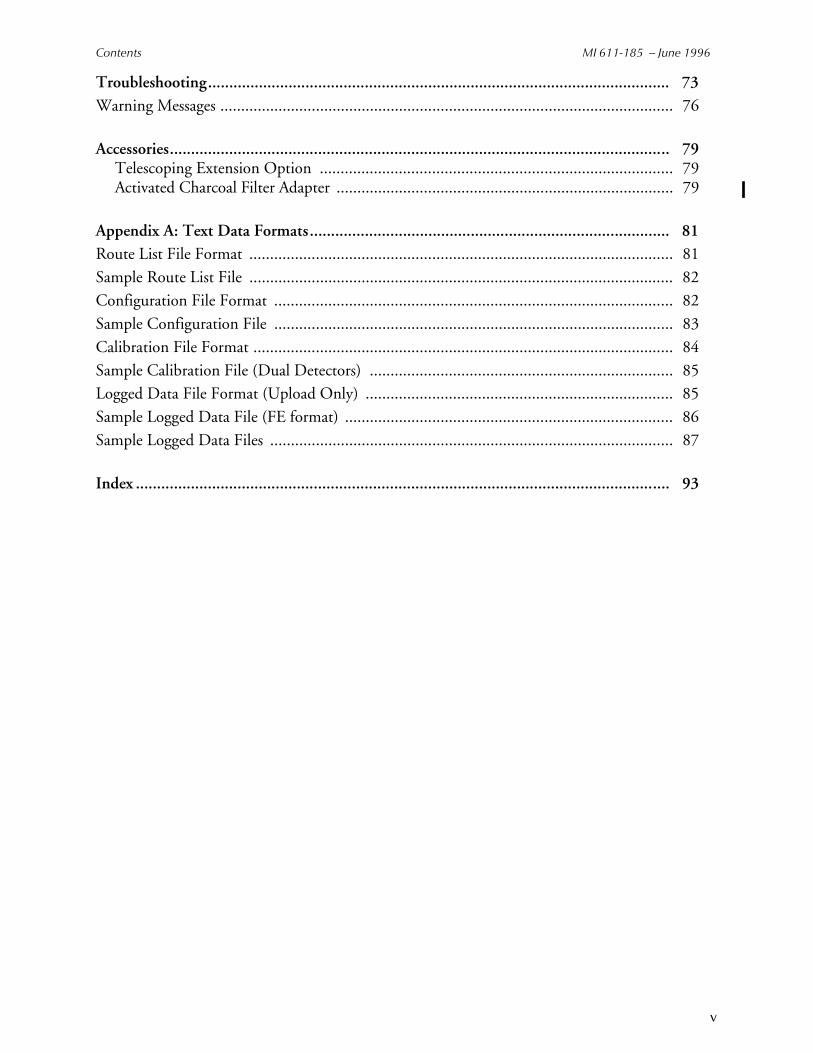
Contents MI 611-185 – June 1996
v
Troubleshooting............................................................................................................. 73Warning Messages ............................................................................................................. 76
Accessories...................................................................................................................... 79Telescoping Extension Option ..................................................................................... 79Activated Charcoal Filter Adapter ................................................................................. 79
Appendix A: Text Data Formats..................................................................................... 81Route List File Format ...................................................................................................... 81
Sample Route List File ...................................................................................................... 82
Configuration File Format ................................................................................................ 82
Sample Configuration File ................................................................................................ 83
Calibration File Format ..................................................................................................... 84
Sample Calibration File (Dual Detectors) ......................................................................... 85Logged Data File Format (Upload Only) .......................................................................... 85
Sample Logged Data File (FE format) ............................................................................... 86
Sample Logged Data Files ................................................................................................. 87
Index .............................................................................................................................. 93

MI 611-185 – June 1996 Contents
vi

vii
Figures
1 Analyzer Sidepack ........................................................................................................ 12 Typical Flame Ionization Detector ............................................................................... 73 Typical Photoionization Detector ................................................................................ 94 TVA-1000B Dual Detector Configuration ................................................................ 105 TVA-1000B Instrument Connections ........................................................................ 116 Keypad ....................................................................................................................... 147 Sample Probe Assembly .............................................................................................. 158 TVA-1000B BASIC Probe Display ............................................................................ 169 TVA-1000B Enhanced Probe Display - Menu Mode ................................................. 17
10 PID Lamp Cleaning Kit ............................................................................................. 6711 Sintered Metal Filter - Cleaning or Replacing ............................................................ 7012 Replacing Sample Line ............................................................................................... 7113 Telescoping Extension Option ................................................................................... 7914 Activated Charcoal Filter Adapter .............................................................................. 80

MI 611-185 – June 1996 Tables
viii
Tables
1 Specifications ............................................................................................................... 32 External Influences ....................................................................................................... 63 Product Safety Specifications ........................................................................................ 6

1
Introduction
NOTE: References in this manual to BASIC and enhanced probes do not apply to Leak Tracker users.
OverviewThe TVA-1000B Toxic Vapor Analyzer, illustrated in the figure below, is an advanced-design, portable, organic/inorganic vapor monitor for the gas survey industry. This analyzer uses either a flame ionization detector (FID), or a photoionization detector (PID), or both types of detectors to sample and measure concentration of gases.
The vapor concentration may be read immediately on either of two displays — one mounted directly on the hand-held sample probe and the other on the instrument sidepack itself. Vapor concentration can be displayed on both displays in parts per million (ppm), parts per billion (ppb), or percent concentration (%). The data displayed may also be collected and saved in analyzer memory and downloaded to a personal computer for analysis.
Through the sidepack keyboard, you can choose the mode of operation, select concentration units for the display, set alarm thresholds, select data collection mode, and change setup (con-figuration) parameters.
This unit is shipped with the battery installed. The unit is ready for operation upon comple-tion of setup, calibration, and charging.
Figure 1. Analyzer Sidepack
TVA-1000B
ABC
1ABC
1ABC
1ABC
1ABC
1ABC
1
ABC
1ABC
1ABC
1
ABC
1ABC
1ABC
1
ABC
1
ABC
1
ABC
1
ABC
1
ABC
1
ABC
1
ABC
1

MI 611-185 – June 1996 Introduction
2
Instrument FunctionsThis analyzer functions in any of four modes:
♦ RUN
♦ SETUP
♦ INFO
♦ PC LINK/MEMORY
In the RUN mode, the instrument automatically displays its measured values in units of ppm, ppb, or %. The RUN mode may be operated either as survey only, in which the instrument displays measured values but does not store any data, or survey and log, in which the instru-ment displays measured values and also stores the information in memory.
In SETUP mode, you can enter or select operational parameters, such as calibration values, alarm levels, operator ID, datalogging method and interval, date, and time. This may be per-formed locally by using the analyzer keypad or remotely by using the RS-232 connection to a personal computer (PC).
In INFO mode, you can review operational parameters entered or selected in SETUP mode as well as instrument serial number, battery status, etc.
In PC LINK/MEMORY mode, you can download data stored within the TVA-1000B to a PC for analysis and printing, upload route list, calibration, and configuration parameters from a PC to the TVA-1000B, or clear data memory.
Each of the four modes is explained in detail later in this document.
Using the InstrumentWhile operating this instrument in the field, you normally carry the TVA-1000B at your side, using the shoulder strap. With the pump on, detector(s) on, and the unit warmed up, you monitor the area of concern. As soon as the instrument analyzes a sample, the probe displays concentration of the vapor. The display on the sidepack duplicates the vapor concentration on the probe display. Using the BASIC probe, you can toggle the display between detector types by pressing the DET button on the probe, log the survey data by pressing the LOG button, and backlight the LCD display by pressing the lamp button. An optional enhanced probe for Fugitive Emissions (FE) monitoring applications allows you to select options from special menus. These probe types will be detailed later in this document.
WARNING: Do not connect/disconnect any electrical device (such as battery charger, analog output, personal computer, or auxiliary port device) to the instrument in an area classified as hazardous due to the presence of flammable vapors.
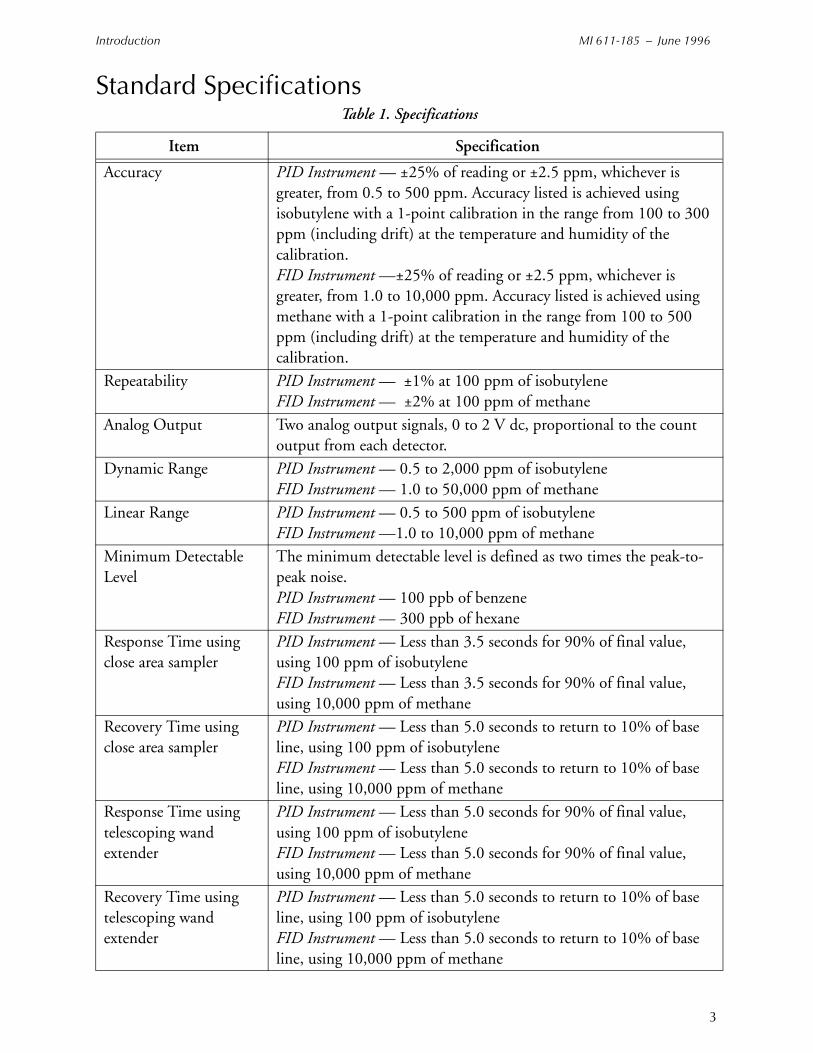
Introduction MI 611-185 – June 1996
3
Standard SpecificationsTable 1. Specifications
Item Specification
Accuracy PID Instrument — ±25% of reading or ±2.5 ppm, whichever is greater, from 0.5 to 500 ppm. Accuracy listed is achieved using isobutylene with a 1-point calibration in the range from 100 to 300 ppm (including drift) at the temperature and humidity of the calibration.FID Instrument —±25% of reading or ±2.5 ppm, whichever is greater, from 1.0 to 10,000 ppm. Accuracy listed is achieved using methane with a 1-point calibration in the range from 100 to 500 ppm (including drift) at the temperature and humidity of the calibration.
Repeatability PID Instrument — ±1% at 100 ppm of isobutyleneFID Instrument — ±2% at 100 ppm of methane
Analog Output Two analog output signals, 0 to 2 V dc, proportional to the count output from each detector.
Dynamic Range PID Instrument — 0.5 to 2,000 ppm of isobutyleneFID Instrument — 1.0 to 50,000 ppm of methane
Linear Range PID Instrument — 0.5 to 500 ppm of isobutyleneFID Instrument —1.0 to 10,000 ppm of methane
Minimum Detectable Level
The minimum detectable level is defined as two times the peak-to-peak noise.PID Instrument — 100 ppb of benzeneFID Instrument — 300 ppb of hexane
Response Time using close area sampler
PID Instrument — Less than 3.5 seconds for 90% of final value, using 100 ppm of isobutyleneFID Instrument — Less than 3.5 seconds for 90% of final value, using 10,000 ppm of methane
Recovery Time using close area sampler
PID Instrument — Less than 5.0 seconds to return to 10% of base line, using 100 ppm of isobutyleneFID Instrument — Less than 5.0 seconds to return to 10% of base line, using 10,000 ppm of methane
Response Time using telescoping wand extender
PID Instrument — Less than 5.0 seconds for 90% of final value, using 100 ppm of isobutyleneFID Instrument — Less than 5.0 seconds for 90% of final value, using 10,000 ppm of methane
Recovery Time using telescoping wand extender
PID Instrument — Less than 5.0 seconds to return to 10% of base line, using 100 ppm of isobutyleneFID Instrument — Less than 5.0 seconds to return to 10% of base line, using 10,000 ppm of methane
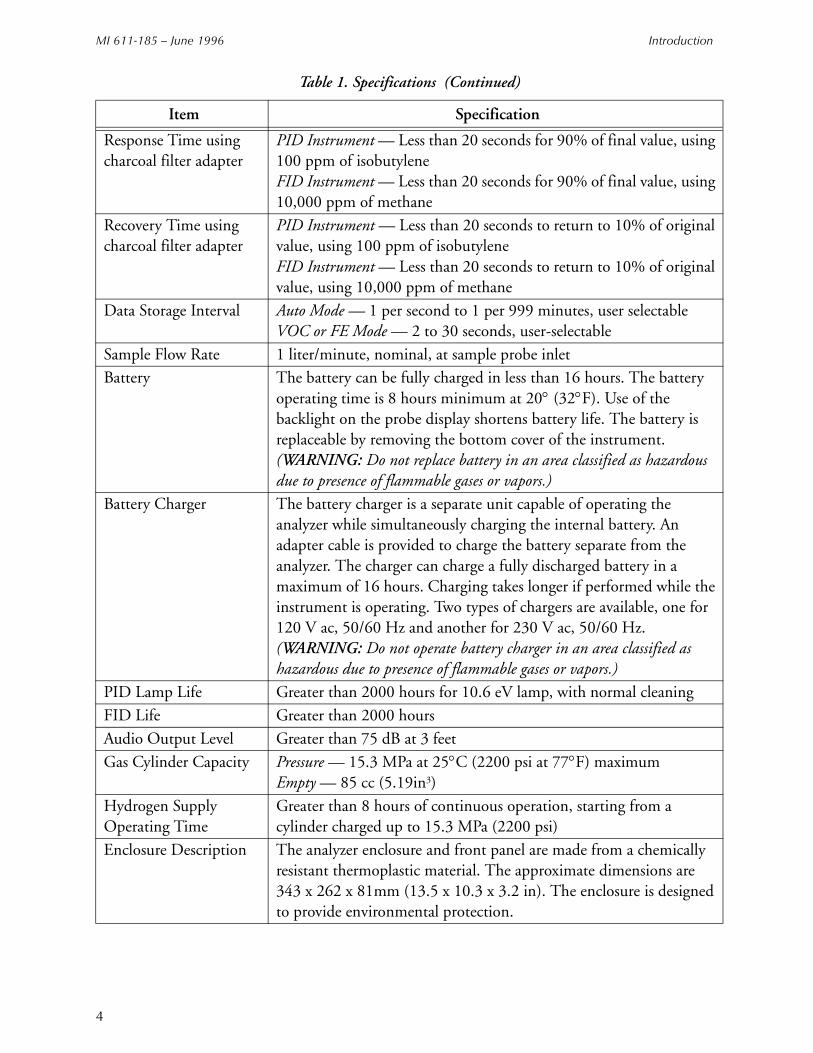
MI 611-185 – June 1996 Introduction
4
Response Time using charcoal filter adapter
PID Instrument — Less than 20 seconds for 90% of final value, using 100 ppm of isobutyleneFID Instrument — Less than 20 seconds for 90% of final value, using 10,000 ppm of methane
Recovery Time using charcoal filter adapter
PID Instrument — Less than 20 seconds to return to 10% of original value, using 100 ppm of isobutyleneFID Instrument — Less than 20 seconds to return to 10% of original value, using 10,000 ppm of methane
Data Storage Interval Auto Mode — 1 per second to 1 per 999 minutes, user selectableVOC or FE Mode — 2 to 30 seconds, user-selectable
Sample Flow Rate 1 liter/minute, nominal, at sample probe inletBattery The battery can be fully charged in less than 16 hours. The battery
operating time is 8 hours minimum at 20° (32°F). Use of the backlight on the probe display shortens battery life. The battery is replaceable by removing the bottom cover of the instrument. (WARNING: Do not replace battery in an area classified as hazardous due to presence of flammable gases or vapors.)
Battery Charger The battery charger is a separate unit capable of operating the analyzer while simultaneously charging the internal battery. An adapter cable is provided to charge the battery separate from the analyzer. The charger can charge a fully discharged battery in a maximum of 16 hours. Charging takes longer if performed while the instrument is operating. Two types of chargers are available, one for 120 V ac, 50/60 Hz and another for 230 V ac, 50/60 Hz.(WARNING: Do not operate battery charger in an area classified as hazardous due to presence of flammable gases or vapors.)
PID Lamp Life Greater than 2000 hours for 10.6 eV lamp, with normal cleaning
FID Life Greater than 2000 hours
Audio Output Level Greater than 75 dB at 3 feet
Gas Cylinder Capacity Pressure — 15.3 MPa at 25°C (2200 psi at 77°F) maximumEmpty — 85 cc (5.19in3)
Hydrogen Supply Operating Time
Greater than 8 hours of continuous operation, starting from a cylinder charged up to 15.3 MPa (2200 psi)
Enclosure Description The analyzer enclosure and front panel are made from a chemically resistant thermoplastic material. The approximate dimensions are 343 x 262 x 81mm (13.5 x 10.3 x 3.2 in). The enclosure is designed to provide environmental protection.
Table 1. Specifications (Continued)
Item Specification
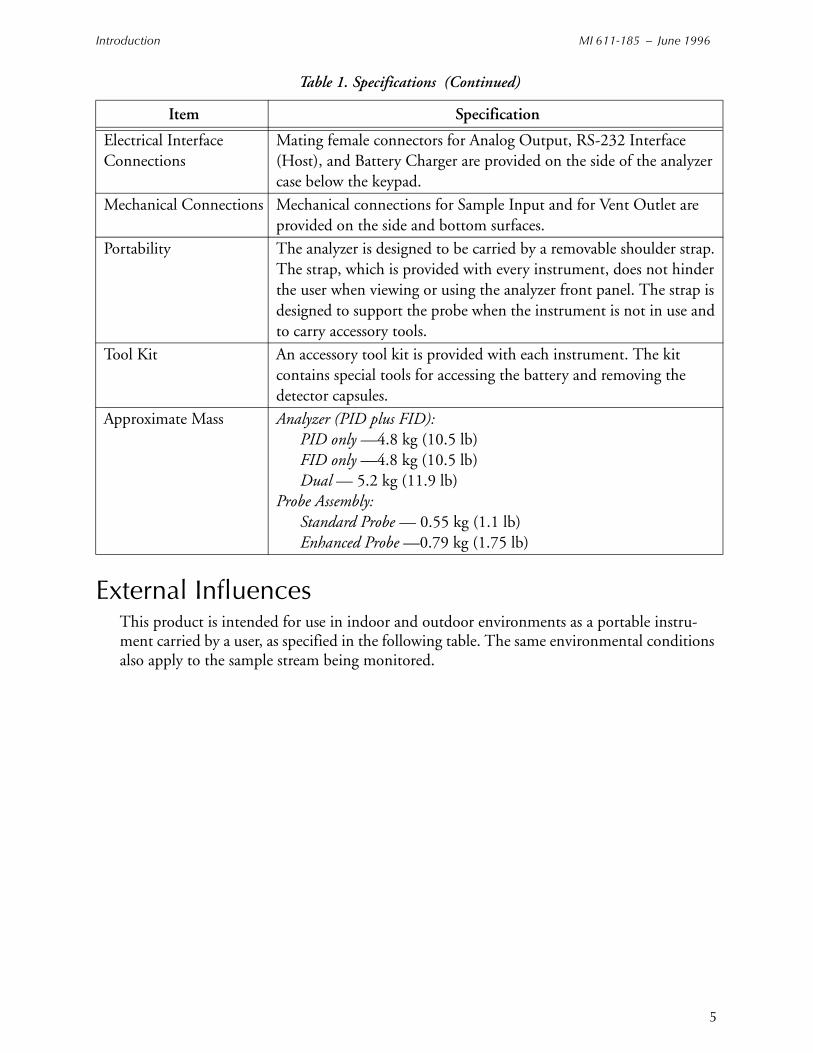
Introduction MI 611-185 – June 1996
5
External InfluencesThis product is intended for use in indoor and outdoor environments as a portable instru-ment carried by a user, as specified in the following table. The same environmental conditions also apply to the sample stream being monitored.
Electrical Interface Connections
Mating female connectors for Analog Output, RS-232 Interface (Host), and Battery Charger are provided on the side of the analyzer case below the keypad.
Mechanical Connections Mechanical connections for Sample Input and for Vent Outlet are provided on the side and bottom surfaces.
Portability The analyzer is designed to be carried by a removable shoulder strap. The strap, which is provided with every instrument, does not hinder the user when viewing or using the analyzer front panel. The strap is designed to support the probe when the instrument is not in use and to carry accessory tools.
Tool Kit An accessory tool kit is provided with each instrument. The kit contains special tools for accessing the battery and removing the detector capsules.
Approximate Mass Analyzer (PID plus FID): PID only —4.8 kg (10.5 lb)FID only —4.8 kg (10.5 lb)Dual — 5.2 kg (11.9 lb)
Probe Assembly: Standard Probe — 0.55 kg (1.1 lb)Enhanced Probe —0.79 kg (1.75 lb)
Table 1. Specifications (Continued)
Item Specification
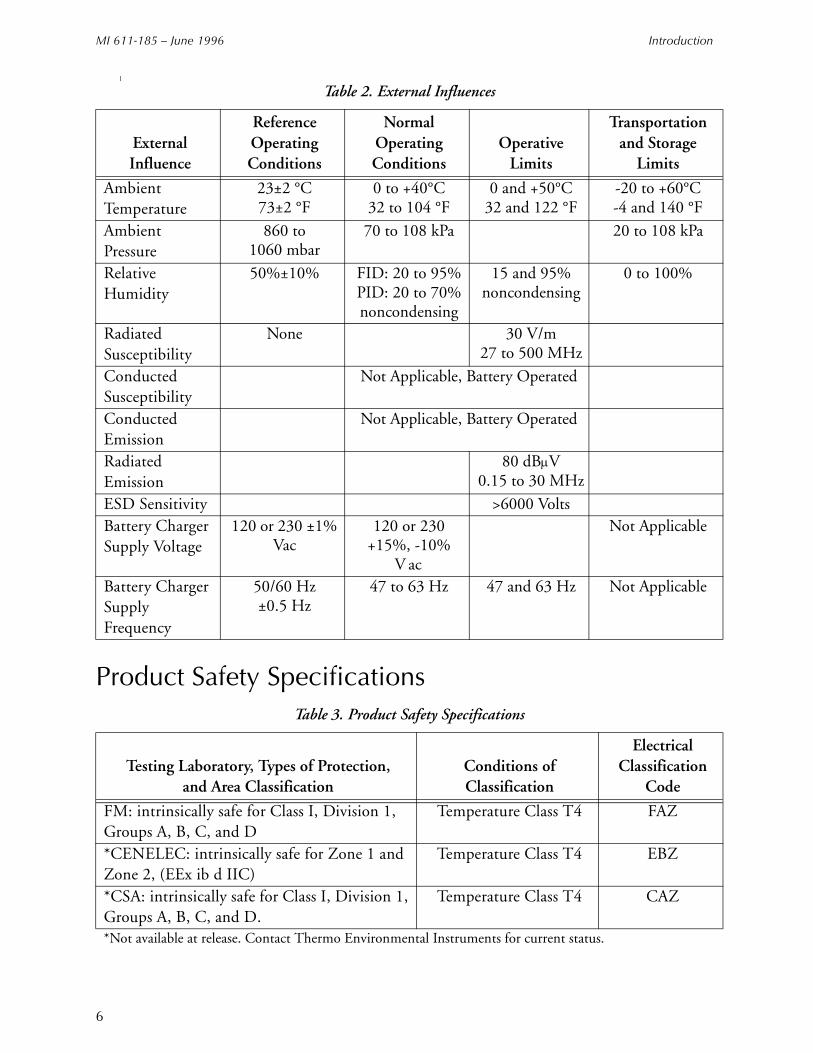
MI 611-185 – June 1996 Introduction
6
l
Product Safety Specifications
Table 2. External Influences
External Influence
Reference Operating Conditions
Normal Operating Conditions
Operative Limits
Transportation and Storage
Limits
Ambient Temperature
23±2 °C73±2 °F
0 to +40°C32 to 104 °F
0 and +50°C32 and 122 °F
-20 to +60°C-4 and 140 °F
Ambient Pressure
860 to 1060 mbar
70 to 108 kPa 20 to 108 kPa
RelativeHumidity
50%±10% FID: 20 to 95%PID: 20 to 70%noncondensing
15 and 95% noncondensing
0 to 100%
Radiated Susceptibility
None 30 V/m27 to 500 MHz
ConductedSusceptibility
Not Applicable, Battery Operated
Conducted Emission
Not Applicable, Battery Operated
RadiatedEmission
80 dBµV0.15 to 30 MHz
ESD Sensitivity >6000 VoltsBattery Charger Supply Voltage
120 or 230 ±1% Vac
120 or 230 +15%, -10%
V ac
Not Applicable
Battery Charger Supply Frequency
50/60 Hz ±0.5 Hz
47 to 63 Hz 47 and 63 Hz Not Applicable
Table 3. Product Safety Specifications
Testing Laboratory, Types of Protection, and Area Classification
Conditions of Classification
Electrical Classification
Code
FM: intrinsically safe for Class I, Division 1, Groups A, B, C, and D
Temperature Class T4 FAZ
*CENELEC: intrinsically safe for Zone 1 and Zone 2, (EEx ib d IIC)
Temperature Class T4 EBZ
*CSA: intrinsically safe for Class I, Division 1, Groups A, B, C, and D.
Temperature Class T4 CAZ
*Not available at release. Contact Thermo Environmental Instruments for current status.
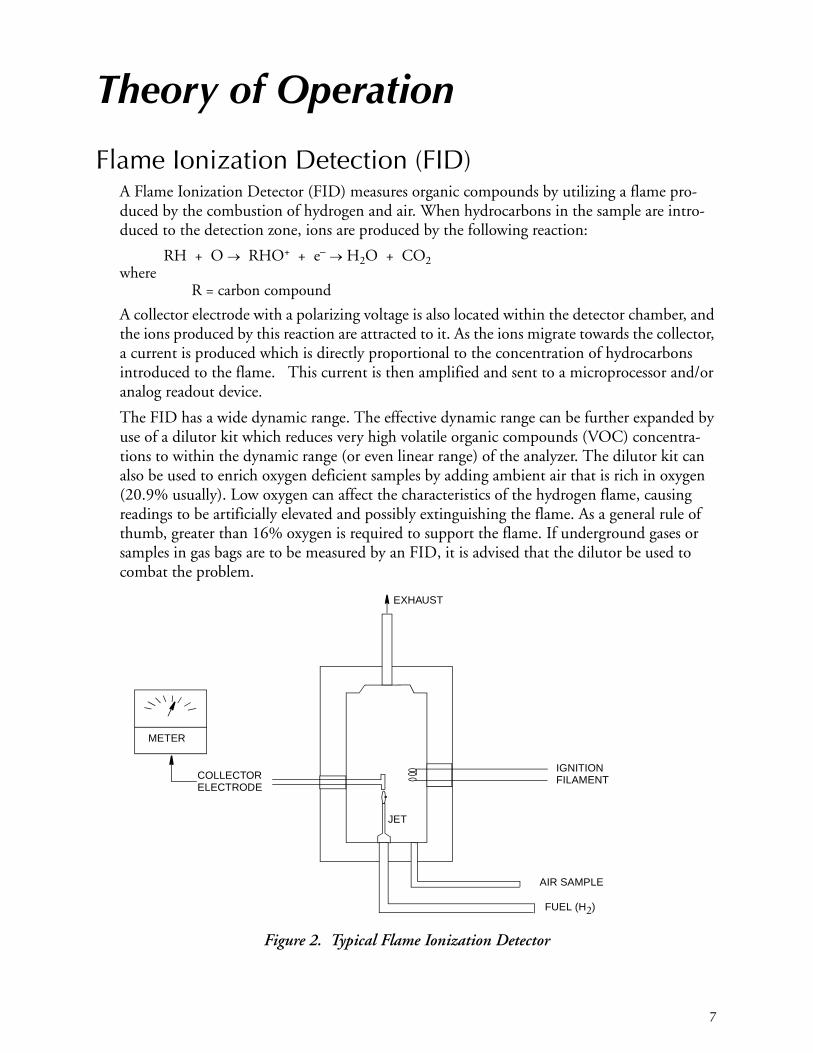
7
Theory of Operation
Flame Ionization Detection (FID)A Flame Ionization Detector (FID) measures organic compounds by utilizing a flame pro-duced by the combustion of hydrogen and air. When hydrocarbons in the sample are intro-duced to the detection zone, ions are produced by the following reaction:
RH + O → RHO+ + e– → H2O + CO2where
R = carbon compound
A collector electrode with a polarizing voltage is also located within the detector chamber, and the ions produced by this reaction are attracted to it. As the ions migrate towards the collector, a current is produced which is directly proportional to the concentration of hydrocarbons introduced to the flame. This current is then amplified and sent to a microprocessor and/or analog readout device.
The FID has a wide dynamic range. The effective dynamic range can be further expanded by use of a dilutor kit which reduces very high volatile organic compounds (VOC) concentra-tions to within the dynamic range (or even linear range) of the analyzer. The dilutor kit can also be used to enrich oxygen deficient samples by adding ambient air that is rich in oxygen (20.9% usually). Low oxygen can affect the characteristics of the hydrogen flame, causing readings to be artificially elevated and possibly extinguishing the flame. As a general rule of thumb, greater than 16% oxygen is required to support the flame. If underground gases or samples in gas bags are to be measured by an FID, it is advised that the dilutor be used to combat the problem.
Figure 2. Typical Flame Ionization Detector
COLLECTOR ELECTRODE
METER
IGNITION FILAMENT
EXHAUST
AIR SAMPLE
JET
FUEL (H2)

MI 611-185 – June 1996 Theory of Operation
8
Benefits of Flame Ionization Detection♦ Wide dynamic and linear range
♦ High sensitivity to hydrocarbon vapors (including methane)
♦ Very stable and repeatable response
♦ Virtually unaffected by ambient levels of CO, CO2, and water vapor
Photoionization Detection A Photoionization Detector (PID) consists of an ultraviolet (UV) lamp of a specific energy and an ionization chamber. Compounds passing through the chamber are excited by photons of UV energy and ionized according to the following equation:
R + hυ → R+ + e–
whereR = most organic/inorganic compounds
These ions are attracted to a collecting electrode, producing a current proportional to the con-centration of the compound.
Whether or not a compound can be detected by a PID depends upon the energy required to remove an electron from the compound (its ionization potential). If the lamp energy is greater than the compound’s ionization potential, the PID will detect it. The standard lamp in the TVA-1000B is 10.6 eV. Other lamps (9.6 and 11.8 eV) are also available. The 11.8 eV lamp permits detection of many compounds not ionized by the standard lamp. The lower energy (10 eV) lamps, however, allow more selectivity by not responding to undesired compounds with a higher ionization potential.
NOTE: Refer to MI 611-183 for information and guidance on proper use of the 11.8 eV lamp.
Because of its smaller dynamic range (0-2000 ppm), the PID is not the detector of choice for measuring high concentrations of vapors. A PID is also more susceptible to interference from water vapor than a FID. However, as a PID does not require hydrogen or oxygen, it is the detector of choice when fuel is limited or unavailable, or when ambient oxygen concentra-tions are low. The PID is also very sensitive to aromatic and chlorinated compounds, and can even measure some inorganic compounds that the FID does not detect at all (ammonia, car-bon disulfide, carbon tetrachloride, chloroform, ethylamine, formaldehyde, and hydrogen sulfide, to name a few).
Benefits of Photoionization Detection♦ High sensitivity to aromatics, unsaturated hydrocarbons and chlorinated
hydrocarbons
♦ Ability to measure some inorganic gases♦ Very simple operation
♦ No support gases required
♦ Non-destructive detector allows sample to be recovered
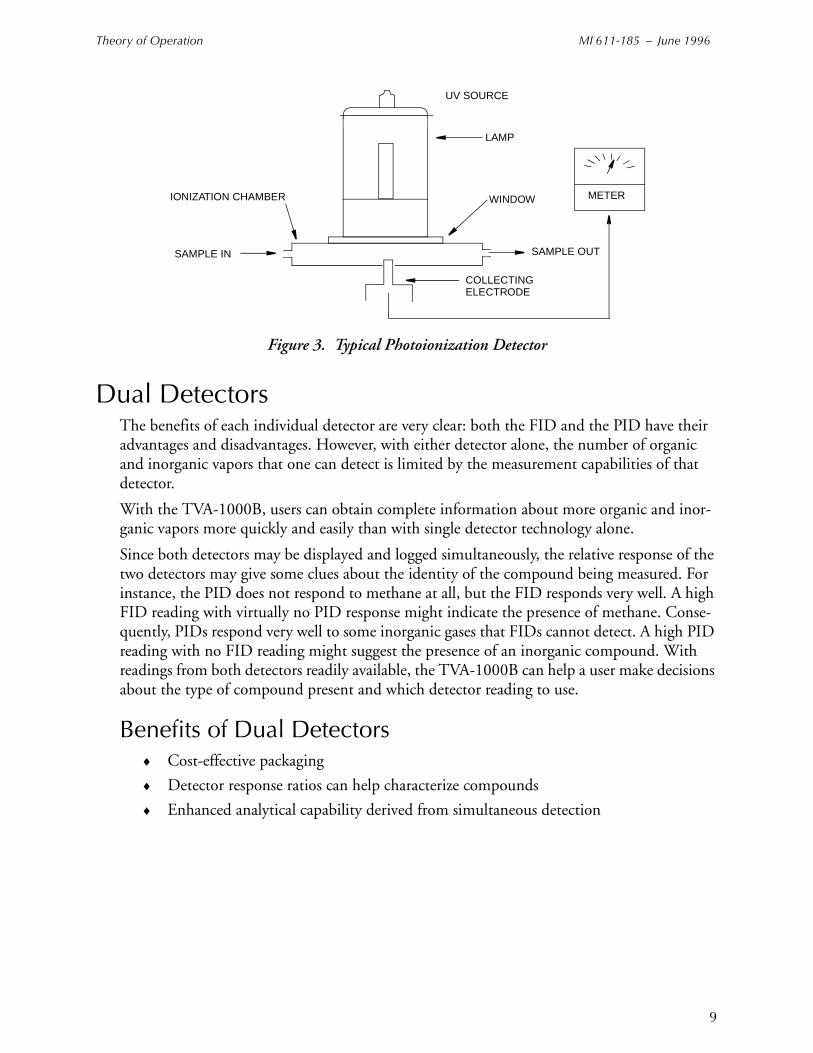
Theory of Operation MI 611-185 – June 1996
9
Figure 3. Typical Photoionization Detector
Dual DetectorsThe benefits of each individual detector are very clear: both the FID and the PID have their advantages and disadvantages. However, with either detector alone, the number of organic and inorganic vapors that one can detect is limited by the measurement capabilities of that detector.
With the TVA-1000B, users can obtain complete information about more organic and inor-ganic vapors more quickly and easily than with single detector technology alone.
Since both detectors may be displayed and logged simultaneously, the relative response of the two detectors may give some clues about the identity of the compound being measured. For instance, the PID does not respond to methane at all, but the FID responds very well. A high FID reading with virtually no PID response might indicate the presence of methane. Conse-quently, PIDs respond very well to some inorganic gases that FIDs cannot detect. A high PID reading with no FID reading might suggest the presence of an inorganic compound. With readings from both detectors readily available, the TVA-1000B can help a user make decisions about the type of compound present and which detector reading to use.
Benefits of Dual Detectors♦ Cost-effective packaging
♦ Detector response ratios can help characterize compounds
♦ Enhanced analytical capability derived from simultaneous detection
METER
SAMPLE OUT
IONIZATION CHAMBER
SAMPLE IN
UV SOURCE
LAMP
WINDOW
COLLECTING ELECTRODE

MI 611-185 – June 1996 Theory of Operation
10
Figure 4. TVA-1000B Dual Detector Configuration
Concentration Calculation and CalibrationThe concentration calculation is defined as the process that transforms a detector count into a displayed final concentration. The process is as follows:
JET
IGNITION FILAMENT
EXHAUST
METERAMPLIFIER
TVA-1000B
PID
LAMP
VENT AIR SAMPLE OUT
COLLECTOR ELECTRODE
COLLECTOR ELECTRODE
PID 00000 PPMFID 00000 PPM %
AIR SAMPLE IN AIR SAMPLE IN
FLAME ARRESTORFID
HYDROGEN SUPPLY
DETECTOR COUNT TRANSLATED INTO A STANDARD DETECTOR CONCENTRATION USING A DETECTOR COUNT VS. DETECTOR CONCENTRATION CALIBRATION CURVE.
STANDARD DETECTOR CONCENTRATION IS CORRECTED TO A SPECIFIC GAS USING THE INSTRUMENT RESPONSE FACTOR.
SPECIFIC GAS CONCENTRATION IS BACKGROUND CORRECTED (IF ENABLED)
INSTRUMENT RESPONSE FACTOR AND BACKGROUND CORRECTED CONCENTRA-TION IS RF CORRECTED USING THE CURRENT ROUTE ENTRY RF (IF ANY)
FINAL CONCENTRATION READING
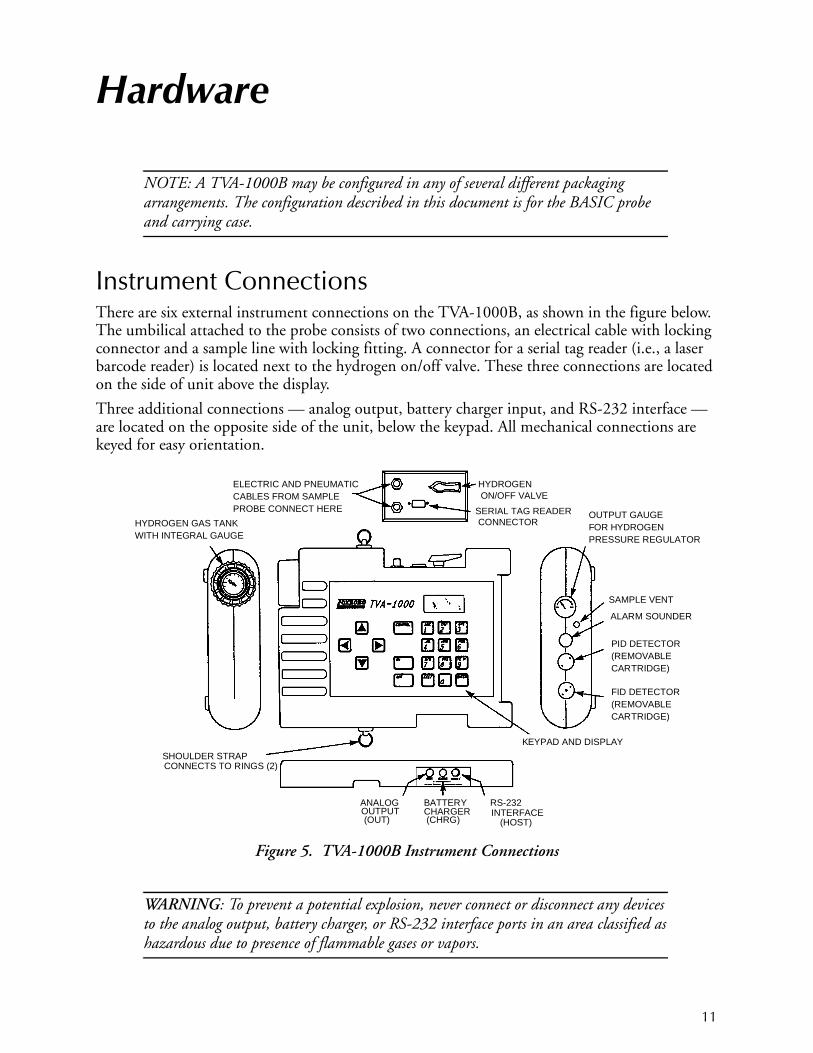
11
Hardware
NOTE: A TVA-1000B may be configured in any of several different packaging arrangements. The configuration described in this document is for the BASIC probe and carrying case.
Instrument ConnectionsThere are six external instrument connections on the TVA-1000B, as shown in the figure below. The umbilical attached to the probe consists of two connections, an electrical cable with locking connector and a sample line with locking fitting. A connector for a serial tag reader (i.e., a laser barcode reader) is located next to the hydrogen on/off valve. These three connections are located on the side of unit above the display.
Three additional connections — analog output, battery charger input, and RS-232 interface — are located on the opposite side of the unit, below the keypad. All mechanical connections are keyed for easy orientation.
Figure 5. TVA-1000B Instrument Connections
WARNING: To prevent a potential explosion, never connect or disconnect any devices to the analog output, battery charger, or RS-232 interface ports in an area classified as hazardous due to presence of flammable gases or vapors.
HYDROGENON/OFF VALVE
SERIAL TAG READERCONNECTOR
OUTPUT GAUGEFOR HYDROGENPRESSURE REGULATOR
SAMPLE VENT
ALARM SOUNDER
PID DETECTOR(REMOVABLECARTRIDGE)
FID DETECTOR(REMOVABLECARTRIDGE)
KEYPAD AND DISPLAY
ANALOGOUTPUT
BATTERYCHARGER
RS-232INTERFACE
HYDROGEN GAS TANKWITH INTEGRAL GAUGE
SHOULDER STRAPCONNECTS TO RINGS (2)
ELECTRIC AND PNEUMATICCABLES FROM SAMPLEPROBE CONNECT HERE
(OUT) (CHRG) (HOST)

MI 611-185 – June 1996 Hardware
12
WARNING: To prevent a potential explosion, do not operate the instrument with the PID or FID detector caps removed.
Analog OutputsThe TVA-1000B has two analog output signals, one for each detector (FID and PID). The analog output cable has a single plug at the instrument end and four individual banana plugs at the out-put end. The orange plug is the FID output, the blue plug is the PID output. The two black plugs are connected to a common ground.
It is important to note that these outputs are non-calibrated outputs which are proportional to the raw count output signal from each detector. The outputs are not proportional to the PID and FID dynamic ranges of 0-2000 and 0-50000 ppm.
To calibrate these outputs, it is necessary to measure the output voltage at the time of gas calibra-tion. When zero gas is introduced to the unit, measure the output voltage for each detector (this is the zero output voltage). When the span gas is introduced to the unit, measure the output volt-age for each detector (this is the span output voltage).
The output voltage for any other concentration can be calculated with the following formula:
Vx = Vo + Cx [(Vs -Vo)/(Cs)]
where:
Vx = Output voltage at the concentration of interest
Cx = Concentration of interest
Vs = Span output voltage
Cs = Span concentration
Vo = Zero output voltage
Instrument Sidepack DisplayThe liquid crystal display (LCD), in the instrument sidepack, as shown in the figure that follows, has four 16-character lines for three types of displays (MENU, ENTRY, and RUN). In menu dis-plays, the whole screen is normally dedicated to the menu. In entry displays, the screen provides prompts and instructions for inputting new data. The normal run display consists of the live mea-surement data on lines 1 and 2 and menu items on lines 3 and 4. Other display information appears as you page through various menus.
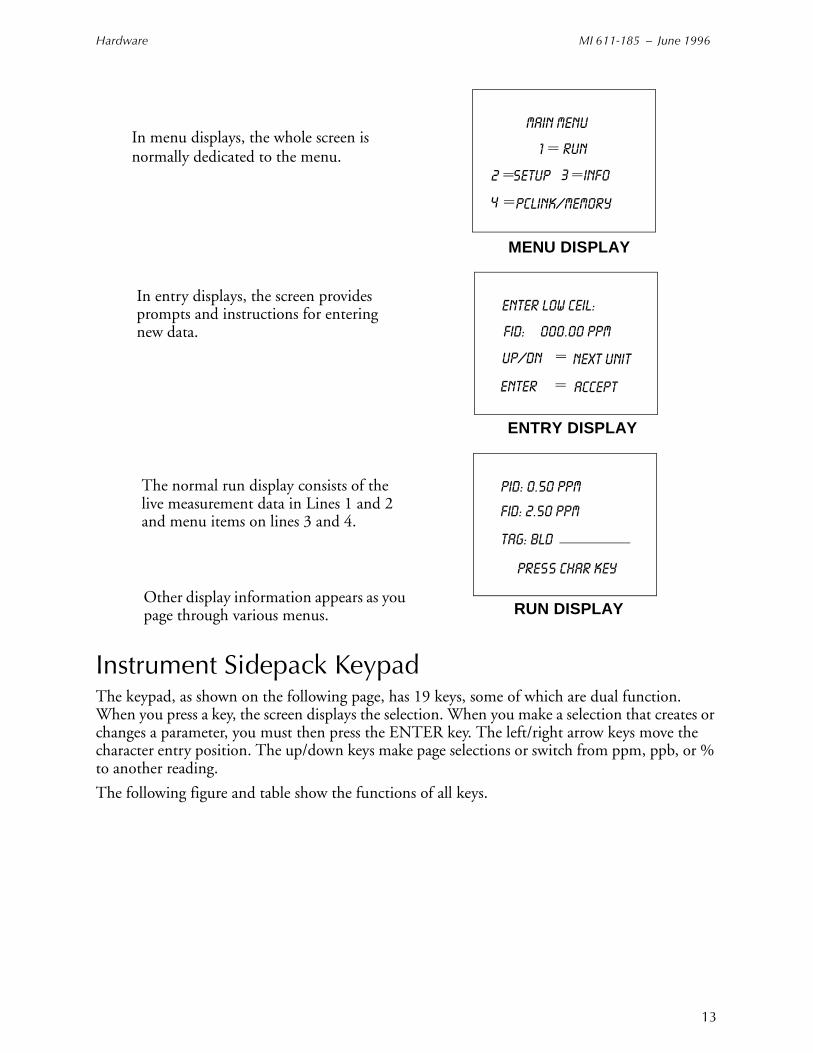
Hardware MI 611-185 – June 1996
13
Instrument Sidepack KeypadThe keypad, as shown on the following page, has 19 keys, some of which are dual function. When you press a key, the screen displays the selection. When you make a selection that creates or changes a parameter, you must then press the ENTER key. The left/right arrow keys move the character entry position. The up/down keys make page selections or switch from ppm, ppb, or % to another reading.
The following figure and table show the functions of all keys.
FID: == 000.00 PPM
UP/DN
ENTER
ENTER LOW CEIL:
==
TAG: BLD ___ _ _ _ _ _ _
PRESS CHAR KEY
PID: 0.50 PPM
RUN==
SETUP
PCLINK/MEMORY
MAIN MENU
1
2 3
4
INFO
NEXT UNIT
ACCEPT
FID: 2.50 PPM
ENTRY DISPLAY
MENU DISPLAY
RUN DISPLAY
In menu displays, the whole screen is normally dedicated to the menu.
In entry displays, the screen provides prompts and instructions for entering new data.
The normal run display consists of the live measurement data in Lines 1 and 2 and menu items on lines 3 and 4.
Other display information appears as you page through various menus.

MI 611-185 – June 1996 Hardware
14
Figure 6. Keypad
NOTE: To activate OFF, CONTROL, EXIT, and ENTER functions, press and HOLD the key for approximately 1/2 second.
Key Function
ON The ON key enables power from the battery to the instrument.OFF The OFF key disables power from the battery to the instrument.CONTROL The CONTROL key is multi-function and is used to turn the pump, PID, and
FID on or off, and to ignite the FID.EXIT The EXIT key clears any entry made in error or bypasses information that you do
not want to change, and clears error or warning screens.ENTER The ENTER key has three functions:
1. Press ENTER if you have typed one or more characters and wish to keep that information.
2. Press ENTER to respond to a menu question.
3. Press ENTER instead of the LOG key on the standard probe to initiate logging.
Left/Right Arrows
The left and right arrow keys move character entry positions.
Up/Down Arrows
The up and down arrow keys make page selections or scroll through options in SETUP entry screens.
TVA-10008888888888888888
ABC DEF GHI
JKL MNO PQR
STU VWX YZ SP
EXIT ENTER
1 2 3
4 5 6
7 8 9
0
ON
CONTROL
OFF
888888888888888888888888888888888888888888888888
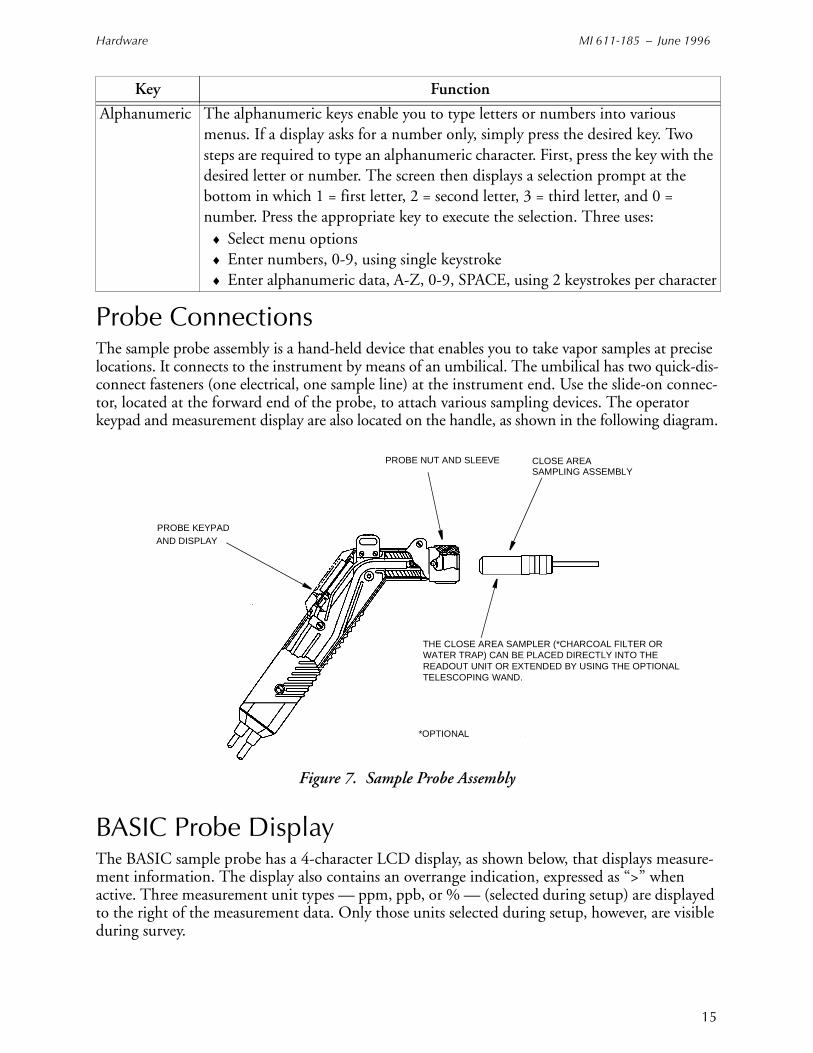
Hardware MI 611-185 – June 1996
15
Probe ConnectionsThe sample probe assembly is a hand-held device that enables you to take vapor samples at precise locations. It connects to the instrument by means of an umbilical. The umbilical has two quick-dis-connect fasteners (one electrical, one sample line) at the instrument end. Use the slide-on connec-tor, located at the forward end of the probe, to attach various sampling devices. The operator keypad and measurement display are also located on the handle, as shown in the following diagram.
Figure 7. Sample Probe Assembly
BASIC Probe DisplayThe BASIC sample probe has a 4-character LCD display, as shown below, that displays measure-ment information. The display also contains an overrange indication, expressed as “>” when active. Three measurement unit types — ppm, ppb, or % — (selected during setup) are displayed to the right of the measurement data. Only those units selected during setup, however, are visible during survey.
Alphanumeric The alphanumeric keys enable you to type letters or numbers into various menus. If a display asks for a number only, simply press the desired key. Two steps are required to type an alphanumeric character. First, press the key with the desired letter or number. The screen then displays a selection prompt at the bottom in which 1 = first letter, 2 = second letter, 3 = third letter, and 0 = number. Press the appropriate key to execute the selection. Three uses:
♦ Select menu options♦ Enter numbers, 0-9, using single keystroke♦ Enter alphanumeric data, A-Z, 0-9, SPACE, using 2 keystrokes per character
Key Function
PROBE KEYPADAND DISPLAY
PROBE NUT AND SLEEVE CLOSE AREASAMPLING ASSEMBLY
*OPTIONAL
THE CLOSE AREA SAMPLER (*CHARCOAL FILTER ORWATER TRAP) CAN BE PLACED DIRECTLY INTO THEREADOUT UNIT OR EXTENDED BY USING THE OPTIONAL
WAND.TELESCOPING
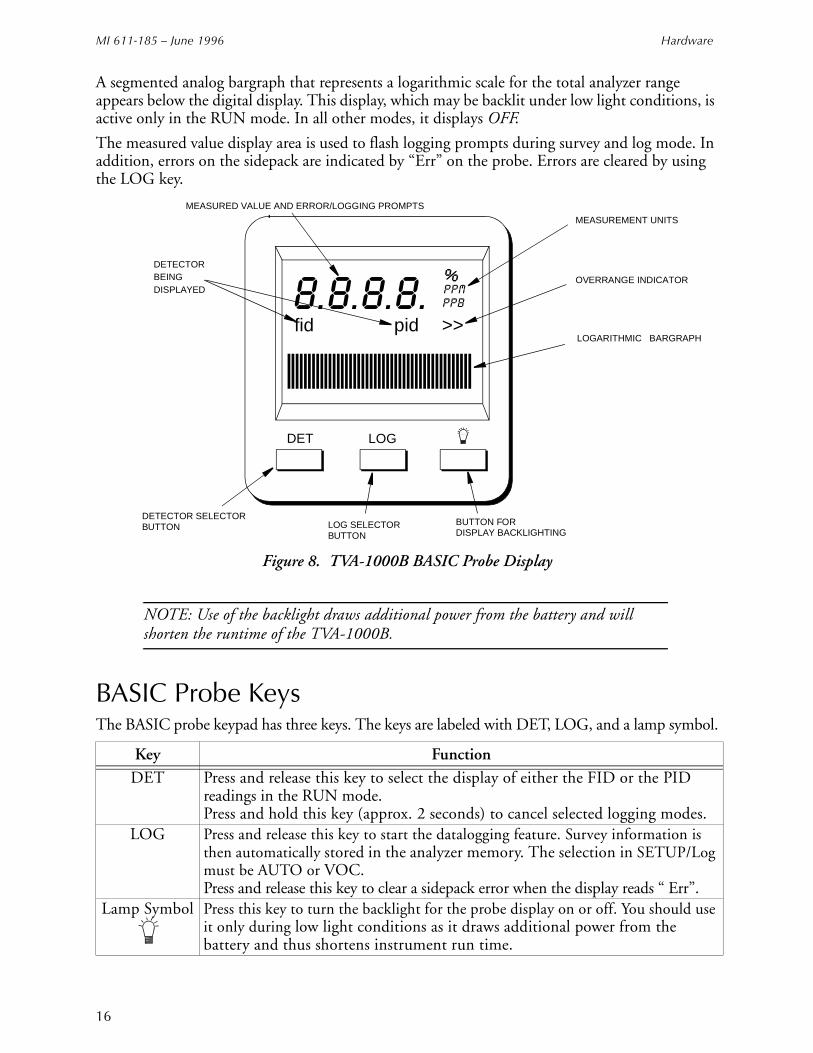
MI 611-185 – June 1996 Hardware
16
A segmented analog bargraph that represents a logarithmic scale for the total analyzer range appears below the digital display. This display, which may be backlit under low light conditions, is active only in the RUN mode. In all other modes, it displays OFF.
The measured value display area is used to flash logging prompts during survey and log mode. In addition, errors on the sidepack are indicated by “Err” on the probe. Errors are cleared by using the LOG key.
Figure 8. TVA-1000B BASIC Probe Display
NOTE: Use of the backlight draws additional power from the battery and will shorten the runtime of the TVA-1000B.
BASIC Probe KeysThe BASIC probe keypad has three keys. The keys are labeled with DET, LOG, and a lamp symbol.
Key FunctionDET Press and release this key to select the display of either the FID or the PID
readings in the RUN mode.Press and hold this key (approx. 2 seconds) to cancel selected logging modes.
LOG Press and release this key to start the datalogging feature. Survey information is then automatically stored in the analyzer memory. The selection in SETUP/Log must be AUTO or VOC.Press and release this key to clear a sidepack error when the display reads “ Err”.
Lamp Symbol
Press this key to turn the backlight for the probe display on or off. You should use it only during low light conditions as it draws additional power from the battery and thus shortens instrument run time.
8.8.8.8.%ppmppb>>>>>fid pid
DET LOG
MEASUREMENT UNITS
OVERRANGE INDICATOR
LOGARITHMIC BARGRAPH
MEASURED VALUE AND ERROR/LOGGING PROMPTS
DETECTORBEING
DETECTOR SELECTORBUTTON LOG SELECTOR
BUTTON
BUTTON FORDISPLAY BACKLIGHTING
DISPLAYED
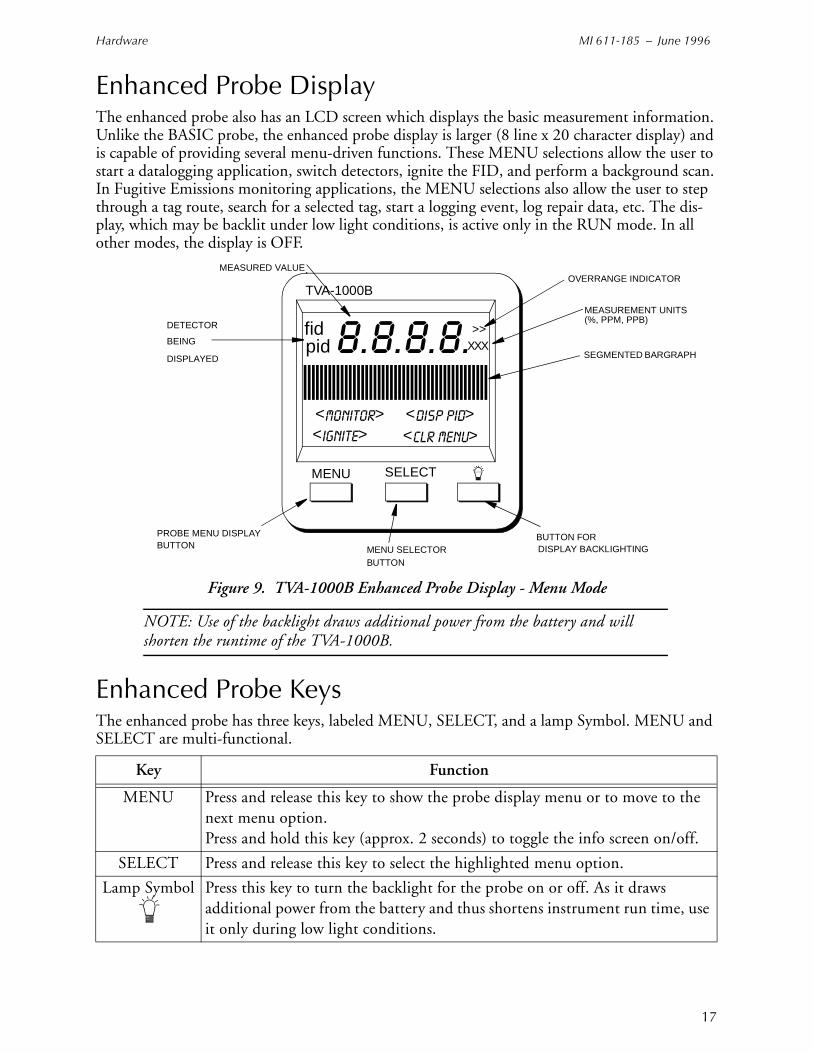
Hardware MI 611-185 – June 1996
17
Enhanced Probe DisplayThe enhanced probe also has an LCD screen which displays the basic measurement information. Unlike the BASIC probe, the enhanced probe display is larger (8 line x 20 character display) and is capable of providing several menu-driven functions. These MENU selections allow the user to start a datalogging application, switch detectors, ignite the FID, and perform a background scan. In Fugitive Emissions monitoring applications, the MENU selections also allow the user to step through a tag route, search for a selected tag, start a logging event, log repair data, etc. The dis-play, which may be backlit under low light conditions, is active only in the RUN mode. In all other modes, the display is OFF.
Figure 9. TVA-1000B Enhanced Probe Display - Menu Mode
NOTE: Use of the backlight draws additional power from the battery and will shorten the runtime of the TVA-1000B.
Enhanced Probe KeysThe enhanced probe has three keys, labeled MENU, SELECT, and a lamp Symbol. MENU and SELECT are multi-functional.
Key Function
MENU Press and release this key to show the probe display menu or to move to the next menu option.Press and hold this key (approx. 2 seconds) to toggle the info screen on/off.
SELECT Press and release this key to select the highlighted menu option.
Lamp Symbol
Press this key to turn the backlight for the probe on or off. As it draws additional power from the battery and thus shortens instrument run time, use it only during low light conditions.
8.8.8.8.>>>
MENU SELECT
MEASUREMENT UNITS
OVERRANGE INDICATORMEASURED VALUE
DETECTOR
BEING
PROBE MENU DISPLAYBUTTON MENU SELECTOR
BUTTON
BUTTON FORDISPLAY BACKLIGHTING
DISPLAYED
TVA-1000B
>< <<IGNITE>> > <
<MONITOR> > < <DISP PID>>
<<CLR MENU> >
pidfid >>
XXX
(%, PPM, PPB)
SEGMENTED BARGRAPH

MI 611-185 – June 1996 Hardware
18
19
Startup and Familiarization
This section shows you how to start the instrument and become familiar with the keypad and display by demonstrating the top level menu structure.
To begin, connect the sample probe (electrical and sample line connections) to the appropri-ate receptacles on the TVA-1000B, calibrate the instrument per the procedure beginning on page 25, and then follow the procedure described on the next page.
NOTE: If the unit is on but not yet set up/configured, it uses factory default values. To make the instrument function with your specific parameters, follow the setup pro-cedures described under Display Menus in this manual.
The procedure below is a quick start guide for starting up your unit. We strongly recommend that you read the entire manual before using the analyzer for its intended operations.
Quick Start ProcedureBefore starting the unit, perform the following steps:
1. Charge battery.
2. Connect sample probe.
3. Fill/install hydrogen tank (FID versions).
4. Open the hydrogen valve (FID versions).
To start the unit, execute the following procedure:
1. Press ON.
2. Press CONTROL.
3. Press 3 to ignite.
4. Press 2 = Setup.
5. Press 1 = Calibrate
6. Press 2 = Span Concentration.
7. Enter Span Concentration for calibration gas being used.
NOTE: If PID only, enter concentration of isobutylene. If FID only, enter concentra-tion of methane. If dual, enter concentration of both gases.
8. Press 3 = Zero.
9. Press 1 = Both.
10. Challenge analyzer with zero gas sample.
11. Press ENTER = start.
MI 611-185 – June 1996 Startup and Familiarization
20
12. Wait to stabilize.
13. Press ENTER = start.
14. Press 4 = Span
15. (PID 1st) Press 2 = PID.
16. Press ENTER = start.
17. Challenge analyzer with isobutylene span gas and wait for readings to stabilize.
18. Press ENTER to accept.
19. Press 4 = Span.
20. Press 3 = FID.
21. Press ENTER = Start.
22. Challenge analyzer with methane span gas and wait for readings to stabilize.
23. Press ENTER = Accept.
24. Press 5 = Response Factor.
25. Confirm that Response Factor says “RF0:DEFAULT”
26. Press EXIT 2 times to main menu.
27. Press 1 = Run.
You are now in the survey mode.
NOTE: To perform more sophisticated operations, you will need to read the rest of the manual .
To power down this instrument, simply press and hold the OFF key. With FID versions, you must also shut off the gas valve to avoid depleting the tank supply.
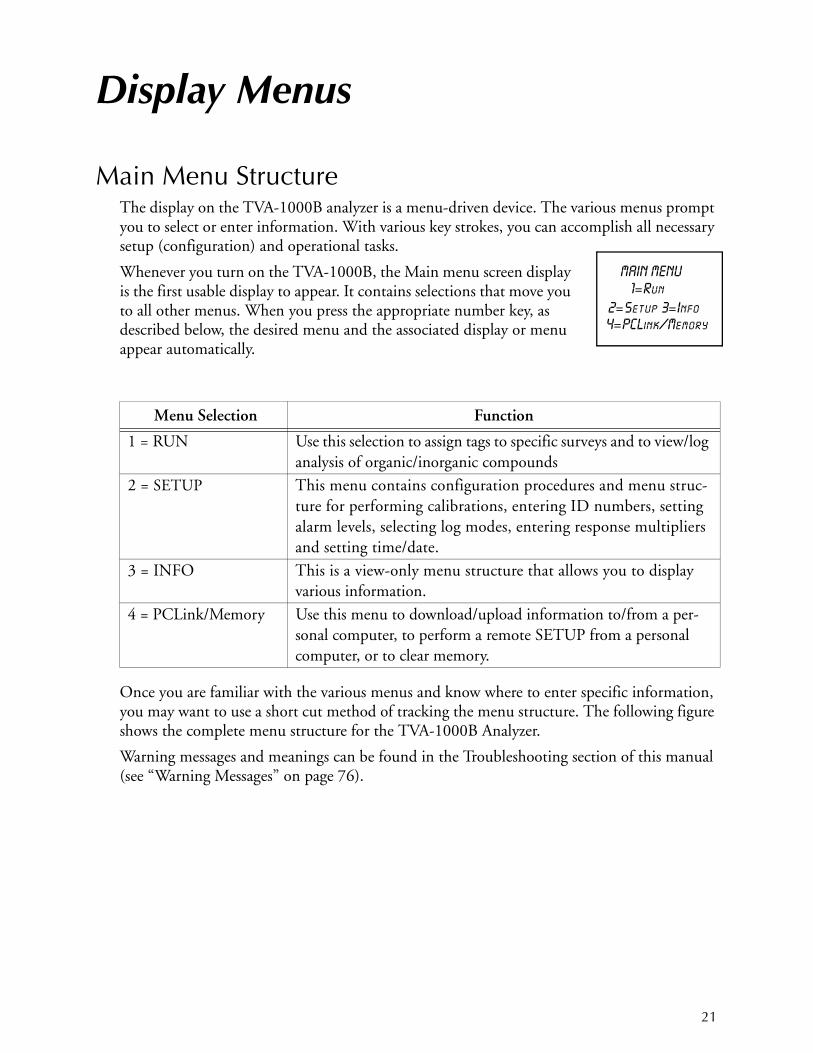
21
Display Menus
Main Menu StructureThe display on the TVA-1000B analyzer is a menu-driven device. The various menus prompt you to select or enter information. With various key strokes, you can accomplish all necessary setup (configuration) and operational tasks.
Whenever you turn on the TVA-1000B, the Main menu screen display is the first usable display to appear. It contains selections that move you to all other menus. When you press the appropriate number key, as described below, the desired menu and the associated display or menu appear automatically.
Once you are familiar with the various menus and know where to enter specific information, you may want to use a short cut method of tracking the menu structure. The following figure shows the complete menu structure for the TVA-1000B Analyzer.
Warning messages and meanings can be found in the Troubleshooting section of this manual (see “Warning Messages” on page 76).
Menu Selection Function
1 = RUN Use this selection to assign tags to specific surveys and to view/log analysis of organic/inorganic compounds
2 = SETUP This menu contains configuration procedures and menu struc-ture for performing calibrations, entering ID numbers, setting alarm levels, selecting log modes, entering response multipliers and setting time/date.
3 = INFO This is a view-only menu structure that allows you to display various information.
4 = PCLink/Memory Use this menu to download/upload information to/from a per-sonal computer, to perform a remote SETUP from a personal computer, or to clear memory.
MAIN MENU 1=Run
2=Setup 3=Info4=PCLink/Memory
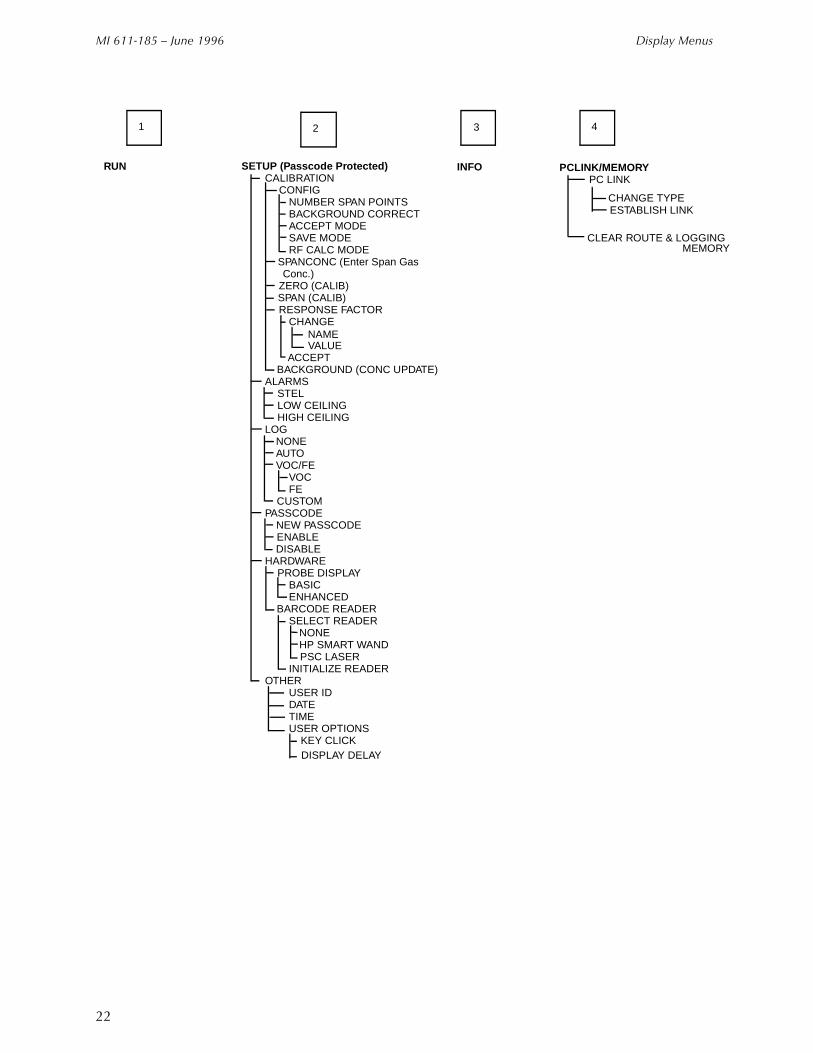
MI 611-185 – June 1996 Display Menus
22
RUN INFO PCLINK/MEMORY
1 2 3 4
PC LINK
CLEAR ROUTE & LOGGING
ESTABLISH LINK CHANGE TYPE
SETUP (Passcode Protected)CALIBRATION
CONFIGNUMBER SPAN POINTSBACKGROUND CORRECTACCEPT MODESAVE MODERF CALC MODE
SPANCONC (Enter Span Gas Conc.)
ZERO (CALIB)SPAN (CALIB)RESPONSE FACTOR
CHANGE
VALUEACCEPT
BACKGROUND (CONC UPDATE)ALARMS
STEL LOW CEILING HIGH CEILING
LOGNONEAUTO VOC/FE
VOC FE
CUSTOMPASSCODE
NEW PASSCODE ENABLEDISABLE
HARDWAREPROBE DISPLAY
BASICENHANCED
BARCODE READERSELECT READER
NONEHP SMART WANDPSC LASER
INITIALIZE READEROTHER
USER IDDATETIMEUSER OPTIONS
KEY CLICK
MEMORY
NAME
DISPLAY DELAY
Display Menus MI 611-185 – June 1996
23
Control MenuThe Control menu is used for turning the sampling pump on and off, turning the PID lamp and FID on and off, and for initiating gas ignition of FID. The menu has four options:
1 = Turn Pump ON/OFF2 = Turn FID ON/OFF3 = Ignite FID4 = Turn PID OFF/ON
Selecting Option 1 toggles the pump on or off.
Selecting Option 2 toggles the FID on or off. In the RUN mode, when the FID is off, dashes will appear instead of a reading and all FID alarms are overridden.
Selecting Option 3 initiates the FID flame ignition sequence, which momentarily turns on the ignite coil and simultaneously turns off the pump.
Selecting Option 4 toggles the PID on or off. In the RUN mode, when the PID is off, dashes will appear instead of a reading, and all PID alarms are overridden.
After running the initial startup diagnostic, the Control menu can be accessed at any time.
Setup ProcedureSetup (configuration) of the TVA-1000B is the most important step in obtaining accurate gas samples. During setup, you must set four parameters, as follows:
1. Calibration Settings
2. Alarm Levels
3. Date (year/month/day) (Set once only.)
4. Time of Day (Set once only.)
NOTE: Time may be set only if the date is within the valid range of 1980 to 2037.
You may also set the following parameters:
1. Log Methods
2. Type of Probe Display or Barcode Reader
3. Compound Names and Response Factors
4. Reader Type and Port Initialization (if used)
5. User Identification Number
6. Optional Settings (Calibration Passcode, Key Click, Display Delay, Calibration Mode)
Each parameter is explained in detail in the following.

MI 611-185 – June 1996 Display Menus
24
Passcode ProtectionThe TVA-1000B Setup Menu can be passcode protected. This option allows you to protect the setup parameters from anyone who is not familiar with your 6-digit passcode. If this fea-ture is enabled, you need to enter your passcode each time you choose to display the SETUP menu.
A selection in the SETUP menu entitled “Passcode” allows you to administer the passcode protection feature. From the SETUP menu, choose option #4 (Passcode). The TVA-1000B will give you three choices:
1. New Passcode
This selection allows you to enter and/or change the 6-digit calibration passcode. You may use any characters from the alphanumeric keypad in your passcode. You must then verify the passcode to make sure you have entered it properly.
2. Enable
This selection allows you to activate the passcode protection feature. Once this feature is activated, you must enter your passcode whenever you request access to the SETUP menu. Once passcode protection has been enabled and you exit the SETUP menu, the option can only be disabled by entering the passcode to gain access to the SETUP menu again. REMEMBER YOUR PASSCODE!
3. Disable
This selection allows you to deactivate the passcode protection feature. Once this fea-ture is deactivated, you have unlimited access to the SETUP menu without entering a passcode.
NOTE: In the event you inadvertently forget your passcode, contact TEI for assis-tance.
CalibrationThe use of multipoint calibration and multiple response factors/curves with the TVA-1000B must be fully understood before employing these features. To help explain these TVA-1000B capabilities, three scenarios follow:
Scenario 1To maximize standard accuracy, it is highly recommended that you calibrate with methane for the flame ionization detector and isobutylene for the photoionization detector. Almost all published response factors for FIDs and PIDs are based upon methane and isobutylene, respectively. By employing a multipoint calibration for these compounds, you will improve the accuracy of each detector over the entire dynamic range. Response factors/curves can then be employed for correcting the detector’s response to different compounds. However, once a multipoint calibration has been employed, any response curve must characterize only the rela-tive response at each concentration, excluding curvature of the calibrated compound. Thus , use of both multipoint calibration and response curves at the same time is difficult, and is not recommended.

Display Menus MI 611-185 – June 1996
25
Scenario 2 If, for example, you want to measure several different compounds over wide concentration ranges, it is best to use a single-point calibration and then enter response curves for each specific compound (up to 9 response factors/curves can be entered into the analyzer).
Scenario 3 If, instead, you want to measure in direct readings (response factor = 1) for one specific com-pound with maximum accuracy over a wide range of concentrations, perform a multipoint cal-ibration with the specific compound. Up to 9 span points (plus zero) can be entered for each detector. The use of a response curve is thus unnecessary as the detector is already reading the direct PPM for that specific compound.
CAUTION: If you use multipoint calibration or a gas other than methane or isobu-tylene and then apply response factors/curves (that have been generated with reference to a single point methane/isobutylene calibration), the resulting measurements will probably be incorrect.
To provide the specified accuracy, the instrument must be calibrated at the beginning of each workday. To reach the CALIBRATION menu from the MAIN MENU, choose 2 = Setup and 1 = Calib. When you reach the CALIBRATION menu, you will see the following selections:
The steps involved in calibrating the TVA-1000B are as follows:
1. Configure the calibration variables (Cfg).
2. Define the span concentrations to be used (SpanConc).
3. Zero the instrument using either a zero gas or clean ambient air (Zero).
4. Calibrate the reference point(s) using known span gases. The TVA-1000B can be configured for as many as nine (9) different span gas values (Span).
5. Optional: Set instrument response factors if necessary (RF).
6. Optional: Take background reading (Backgnd).
NOTE: Prior to performing calibration, the instrument must be on and warmed up for approximately 30 minutes. The pump must be ON, the PID lamp must be ON, and the FID must be ignited throughout the warm-up period.
Calibration MENU 1=Cfg
5=RF
2=SpanConc 3=Zero 4=Span
6=Backgnd
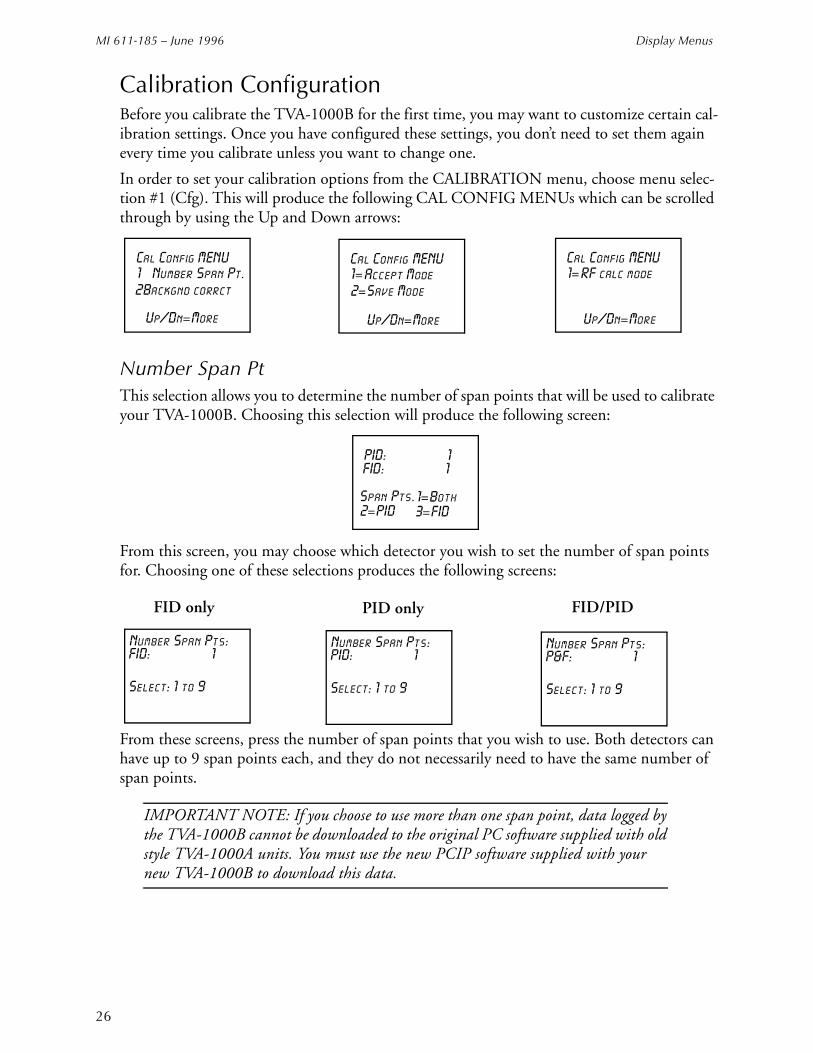
MI 611-185 – June 1996 Display Menus
26
Calibration ConfigurationBefore you calibrate the TVA-1000B for the first time, you may want to customize certain cal-ibration settings. Once you have configured these settings, you don’t need to set them again every time you calibrate unless you want to change one.
In order to set your calibration options from the CALIBRATION menu, choose menu selec-tion #1 (Cfg). This will produce the following CAL CONFIG MENUs which can be scrolled through by using the Up and Down arrows:
Number Span PtThis selection allows you to determine the number of span points that will be used to calibrate your TVA-1000B. Choosing this selection will produce the following screen:
From this screen, you may choose which detector you wish to set the number of span points for. Choosing one of these selections produces the following screens:
From these screens, press the number of span points that you wish to use. Both detectors can have up to 9 span points each, and they do not necessarily need to have the same number of span points.
IMPORTANT NOTE: If you choose to use more than one span point, data logged by the TVA-1000B cannot be downloaded to the original PC software supplied with old style TVA-1000A units. You must use the new PCIP software supplied with your new TVA-1000B to download this data.
Cal Config MENU 1= Number Span Pt.
2=Backgnd corrct
Up/Dn=More
Cal Config MENU 1=
Up/Dn=More
Accept Mode 2=Save Mode
Cal Config MENU 1=RF calc mode
Up/Dn=More
PID: 1
2=PID
1=Both
FID: 1
3=FIDSpan Pts.
Number Span Pts:
FID: 1
Select: 1 to 9
Number Span Pts:
P&F: 1
Select: 1 to 9
Number Span Pts:
PID: 1
Select: 1 to 9
FID only PID only FID/PID

Display Menus MI 611-185 – June 1996
27
Background CorrectThis selection allows you to choose whether or not to apply background correction to the detector readings displayed and logged in memory. If you choose to apply background correc-tion, the last background reading stored in memory will be subtracted from the measured reading. This corrected reading will be the value displayed and the value logged. Choosing this selection from the CAL CONFIG MENU produces the following display:
The second line of the display shows what option is currently selected. You can change this option by choosing any one of the menu selections. You may choose to apply correction to FID, PID or both detectors.
NOTE: A default background value of 0 is stored in memory until a background reading is taken.
Cal Accept ModeThis selection allows you to choose whether or not calibrations will be automatically accepted. Choosing this selection from the CAL CONFIG MENU produces the following display:
The second line of the display shows what option is currently selected. If “Manual” is chosen, the instrument will display the detector count during calibration and prompt the user to decide when to accept the calibration value:. If “Auto” is chosen, the instrument will automat-ically determine the value to be stored and when to do it.
Cal Save ModeThis selection allows you to choose whether or not the TVA-1000B will automatically save an accepted calibration. Choosing this selection from the CAL CONFIG MENU produces the following display:
Backgrnd Correct:
2=None
1=Both
Off
3=PID 3=FID
Cal Accept Mode:
2=Auto
1=Manual
Auto
Cal Save Mode:
2=Auto
1=Manual
Auto
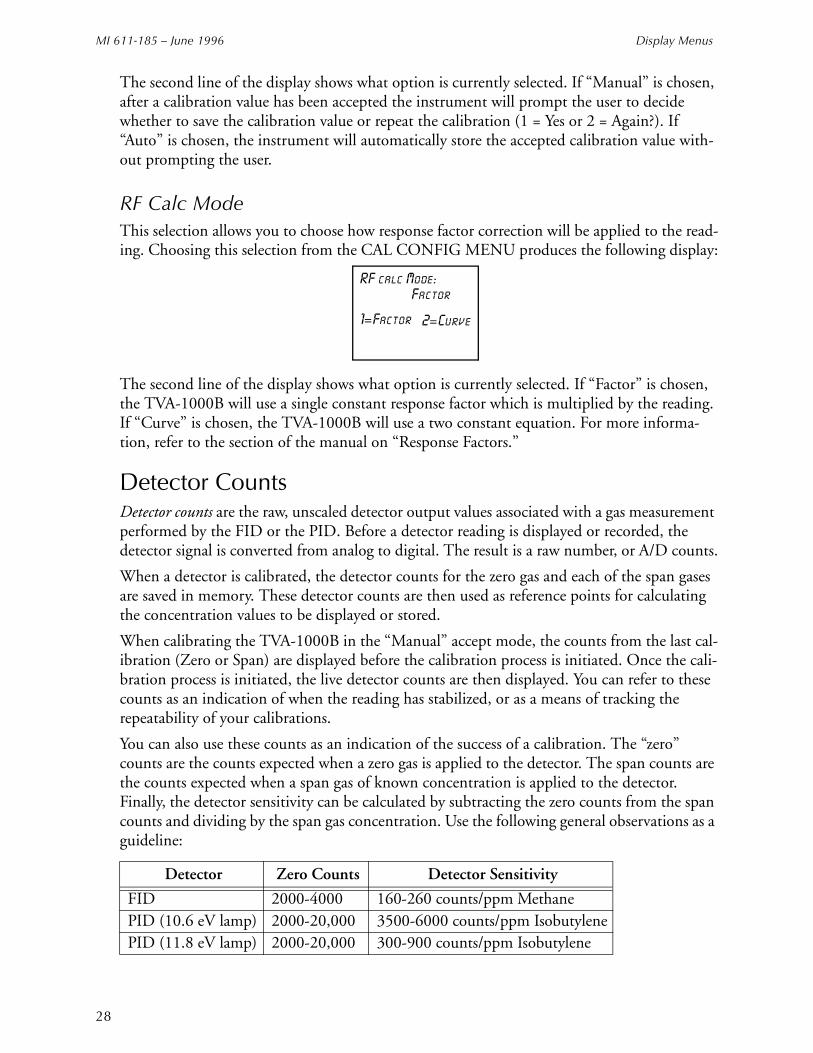
MI 611-185 – June 1996 Display Menus
28
The second line of the display shows what option is currently selected. If “Manual” is chosen, after a calibration value has been accepted the instrument will prompt the user to decide whether to save the calibration value or repeat the calibration (1 = Yes or 2 = Again?). If “Auto” is chosen, the instrument will automatically store the accepted calibration value with-out prompting the user.
RF Calc ModeThis selection allows you to choose how response factor correction will be applied to the read-ing. Choosing this selection from the CAL CONFIG MENU produces the following display:
The second line of the display shows what option is currently selected. If “Factor” is chosen, the TVA-1000B will use a single constant response factor which is multiplied by the reading. If “Curve” is chosen, the TVA-1000B will use a two constant equation. For more informa-tion, refer to the section of the manual on “Response Factors.”
Detector CountsDetector counts are the raw, unscaled detector output values associated with a gas measurement performed by the FID or the PID. Before a detector reading is displayed or recorded, the detector signal is converted from analog to digital. The result is a raw number, or A/D counts.
When a detector is calibrated, the detector counts for the zero gas and each of the span gases are saved in memory. These detector counts are then used as reference points for calculating the concentration values to be displayed or stored.
When calibrating the TVA-1000B in the “Manual” accept mode, the counts from the last cal-ibration (Zero or Span) are displayed before the calibration process is initiated. Once the cali-bration process is initiated, the live detector counts are then displayed. You can refer to these counts as an indication of when the reading has stabilized, or as a means of tracking the repeatability of your calibrations.
You can also use these counts as an indication of the success of a calibration. The “zero” counts are the counts expected when a zero gas is applied to the detector. The span counts are the counts expected when a span gas of known concentration is applied to the detector. Finally, the detector sensitivity can be calculated by subtracting the zero counts from the span counts and dividing by the span gas concentration. Use the following general observations as a guideline:
Detector Zero Counts Detector Sensitivity
FID 2000-4000 160-260 counts/ppm MethanePID (10.6 eV lamp) 2000-20,000 3500-6000 counts/ppm IsobutylenePID (11.8 eV lamp) 2000-20,000 300-900 counts/ppm Isobutylene
RF calc Mode:
2=Curve
1=Factor
Factor

Display Menus MI 611-185 – June 1996
29
Example: A TVA-1000B FID is calibrated with zero air and a 100 ppm Methane in air span gas. The counts observed for the zero are 2895 and the counts observed for the span are 27395. The span sensitivity is thus 245 counts/ppm [(27395-2750)/100 ppm]. Since both of these values (2895 zero counts and 245 detector sensitivity) are within the acceptable range, the calibration is a good calibration. Examples of a bad calibration include unusually high zero counts, or unusually low detector sensitivity. These problems can often be attributed to poor calibration gases, contaminated sampling accessories, a faulty detector capsule, or failure to follow the proper calibration procedure. For more information, consult the “Troubleshoot-ing” guide in this manual or contact TEI for assistance.
Defining the Span Gas Concentration(s)
NOTES: 1. The span gas concentration is the known concentration of the gas standards used to calibrate your TVA. Methane in air is the recommended calibration standard for the FID, and Isobutylene in air is the recommended calibration standard for the PID. Other gases may be used if desired.2. If your instrument is equipped with dual detectors, you may choose to calibrate the PID and FID separately or together. 3. If your instrument is configured for multiple span points, be sure to set the concen-tration for ALL span points.
1. From the CALIBRATION menu display, press 2=SpanConc. The upper display (or two displays if the unit is a dual detector version) will display the concentration value of your span gas (expressed as ppb, ppm, or %) as of the last calibration:
If the TVA-1000B is configured for multiple calibration points, the span gas concentration values for Point #1 will be displayed. The Up and Down arrow keys can be used to scroll through the span gas concentration values for other points:
Span Gas Concent
FID: 100 ppm
Enter=New concSpan Gas Concent
PID: 100 ppm
Enter=New conc Span Conc 1=Both
PID: 100 ppmFID: 100 ppm
2=PID 3=FID
FID only PID only FID/PID
Span Pt 1 (Up/Dn)
FID: 100 ppm
Enter=New concSpan Pt 1 (Up/Dn)
PID: 100 ppm
Enter=New conc Span Pt 1 (Up/Dn)
PID: 100 ppmFID: 100 ppm
1=Both 2PID 3FID
FID only PID only FID/PID
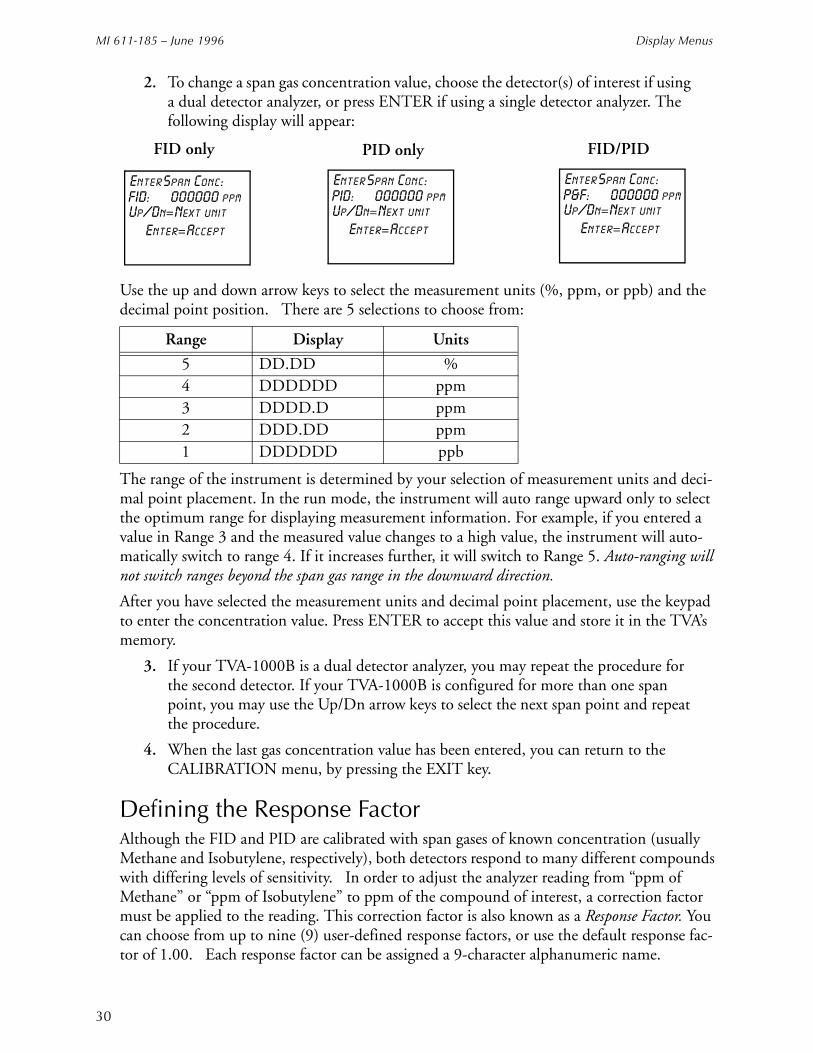
MI 611-185 – June 1996 Display Menus
30
2. To change a span gas concentration value, choose the detector(s) of interest if using a dual detector analyzer, or press ENTER if using a single detector analyzer. The following display will appear:
Use the up and down arrow keys to select the measurement units (%, ppm, or ppb) and the decimal point position. There are 5 selections to choose from:
The range of the instrument is determined by your selection of measurement units and deci-mal point placement. In the run mode, the instrument will auto range upward only to select the optimum range for displaying measurement information. For example, if you entered a value in Range 3 and the measured value changes to a high value, the instrument will auto-matically switch to range 4. If it increases further, it will switch to Range 5. Auto-ranging will not switch ranges beyond the span gas range in the downward direction.
After you have selected the measurement units and decimal point placement, use the keypad to enter the concentration value. Press ENTER to accept this value and store it in the TVA’s memory.
3. If your TVA-1000B is a dual detector analyzer, you may repeat the procedure for the second detector. If your TVA-1000B is configured for more than one span point, you may use the Up/Dn arrow keys to select the next span point and repeat the procedure.
4. When the last gas concentration value has been entered, you can return to the CALIBRATION menu, by pressing the EXIT key.
Defining the Response FactorAlthough the FID and PID are calibrated with span gases of known concentration (usually Methane and Isobutylene, respectively), both detectors respond to many different compounds with differing levels of sensitivity. In order to adjust the analyzer reading from “ppm of Methane” or “ppm of Isobutylene” to ppm of the compound of interest, a correction factor must be applied to the reading. This correction factor is also known as a Response Factor. You can choose from up to nine (9) user-defined response factors, or use the default response fac-tor of 1.00. Each response factor can be assigned a 9-character alphanumeric name.
Range Display Units
5 DD.DD %4 DDDDDD ppm3 DDDD.D ppm2 DDD.DD ppm1 DDDDDD ppb
FID: 000000 ppm
Enter=Accept
Enter Span Conc:
Up/Dn=Next unit
P&F: 000000 ppm
Enter=Accept
Enter Span Conc:
Up/Dn=Next unit
PID: 000000 ppm
Enter=Accept
Enter Span Conc:
Up/Dn=Next unit
FID only PID only FID/PID
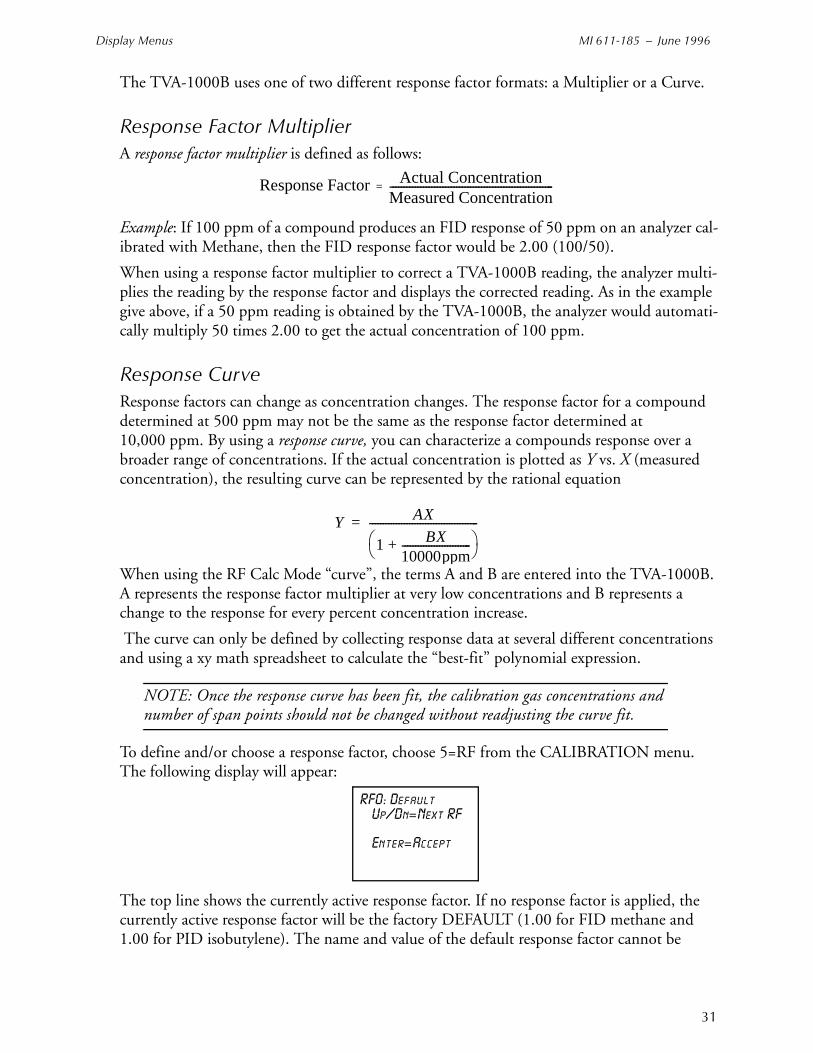
Display Menus MI 611-185 – June 1996
31
The TVA-1000B uses one of two different response factor formats: a Multiplier or a Curve.
Response Factor MultiplierA response factor multiplier is defined as follows:
Example: If 100 ppm of a compound produces an FID response of 50 ppm on an analyzer cal-ibrated with Methane, then the FID response factor would be 2.00 (100/50).
When using a response factor multiplier to correct a TVA-1000B reading, the analyzer multi-plies the reading by the response factor and displays the corrected reading. As in the example give above, if a 50 ppm reading is obtained by the TVA-1000B, the analyzer would automati-cally multiply 50 times 2.00 to get the actual concentration of 100 ppm.
Response CurveResponse factors can change as concentration changes. The response factor for a compound determined at 500 ppm may not be the same as the response factor determined at 10,000 ppm. By using a response curve, you can characterize a compounds response over a broader range of concentrations. If the actual concentration is plotted as Y vs. X (measured concentration), the resulting curve can be represented by the rational equation
When using the RF Calc Mode “curve”, the terms A and B are entered into the TVA-1000B. A represents the response factor multiplier at very low concentrations and B represents a change to the response for every percent concentration increase.
The curve can only be defined by collecting response data at several different concentrations and using a xy math spreadsheet to calculate the “best-fit” polynomial expression.
NOTE: Once the response curve has been fit, the calibration gas concentrations and number of span points should not be changed without readjusting the curve fit.
To define and/or choose a response factor, choose 5=RF from the CALIBRATION menu. The following display will appear:
The top line shows the currently active response factor. If no response factor is applied, the currently active response factor will be the factory DEFAULT (1.00 for FID methane and 1.00 for PID isobutylene). The name and value of the default response factor cannot be
Response Factor Actual ConcentrationMeasured Concentration-----------------------------------------------------------=
Y AX
1 BX10000ppm--------------------------+
-----------------------------------------=
RF0: Default
Enter=Accept
Up/Dn=Next RF
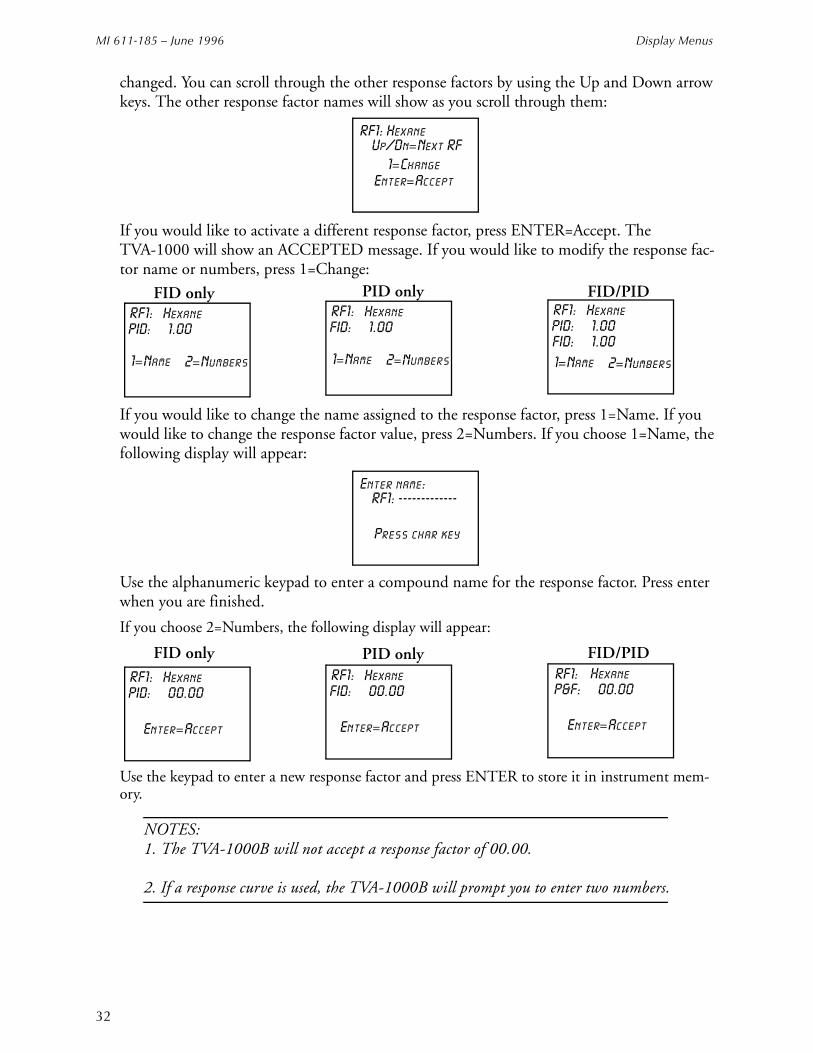
MI 611-185 – June 1996 Display Menus
32
changed. You can scroll through the other response factors by using the Up and Down arrow keys. The other response factor names will show as you scroll through them:
If you would like to activate a different response factor, press ENTER=Accept. The TVA-1000 will show an ACCEPTED message. If you would like to modify the response fac-tor name or numbers, press 1=Change:
If you would like to change the name assigned to the response factor, press 1=Name. If you would like to change the response factor value, press 2=Numbers. If you choose 1=Name, the following display will appear:
Use the alphanumeric keypad to enter a compound name for the response factor. Press enter when you are finished.
If you choose 2=Numbers, the following display will appear:
Use the keypad to enter a new response factor and press ENTER to store it in instrument mem-ory.
NOTES: 1. The TVA-1000B will not accept a response factor of 00.00.
2. If a response curve is used, the TVA-1000B will prompt you to enter two numbers.
RF1: Hexane
1=Change
Up/Dn=Next RF
Enter=Accept
PID: 1.00
1=Name
RF1: Hexane
2=Numbers
FID: 1.00
1=Name
RF1: Hexane
2=Numbers
PID: 1.00
1=Name
RF1: Hexane
2=Numbers
FID: 1.00
FID only PID only FID/PID
Enter name:
RF1: -------------
Press char key
PID: 00.00RF1: Hexane
Enter=Accept
FID: 00.00RF1: Hexane
Enter=Accept
P&F: 00.00
Enter=Accept
RF1: Hexane
FID only PID only FID/PID
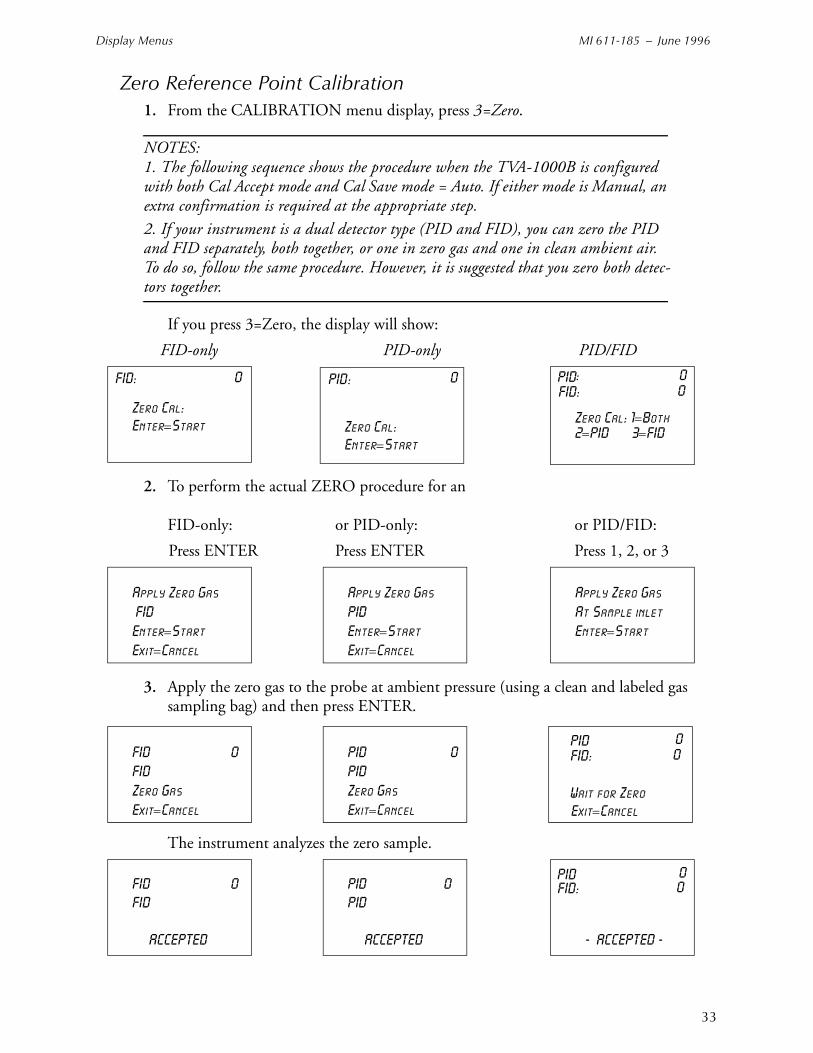
Display Menus MI 611-185 – June 1996
33
Zero Reference Point Calibration1. From the CALIBRATION menu display, press 3=Zero.
NOTES: 1. The following sequence shows the procedure when the TVA-1000B is configured with both Cal Accept mode and Cal Save mode = Auto. If either mode is Manual, an extra confirmation is required at the appropriate step. 2. If your instrument is a dual detector type (PID and FID), you can zero the PID and FID separately, both together, or one in zero gas and one in clean ambient air. To do so, follow the same procedure. However, it is suggested that you zero both detec-tors together.
If you press 3=Zero, the display will show:
FID-only PID-only PID/FID
2. To perform the actual ZERO procedure for an
FID-only: or PID-only: or PID/FID:
Press ENTER Press ENTER Press 1, 2, or 3
3. Apply the zero gas to the probe at ambient pressure (using a clean and labeled gas sampling bag) and then press ENTER.
The instrument analyzes the zero sample.
Zero Cal: Enter=Start Zero Cal:
Enter=Start
Zero Cal: 1=Both2=PID 3=FID
FID: 0 PID 0 PID 0FID: 0
: :
Apply Zero Gas
FID
Enter=Start
Exit=Cancel
Apply Zero Gas
PID
Enter=Start
Exit=Cancel
Apply Zero Gas
At Sample inlet
Enter=Start
FID 0
FID
Zero Gas
Exit=Cancel
PID 0
PID
Zero Gas
Exit=Cancel
FID: 0 PID 0
==Exit=Cancel+Wait for Zero
FID 0 FID
ACCEPTED
PID 0PID
ACCEPTED
- ACCEPTED -
FID: 0PID 0
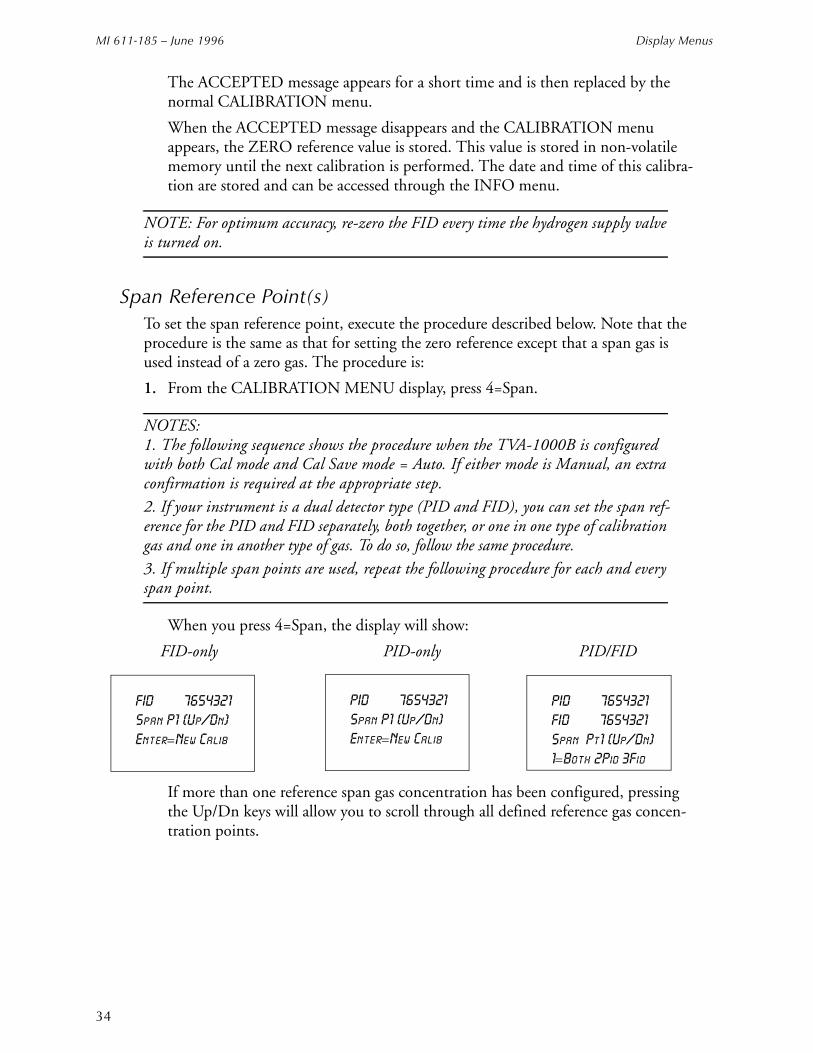
MI 611-185 – June 1996 Display Menus
34
The ACCEPTED message appears for a short time and is then replaced by the normal CALIBRATION menu.
When the ACCEPTED message disappears and the CALIBRATION menu appears, the ZERO reference value is stored. This value is stored in non-volatile memory until the next calibration is performed. The date and time of this calibra-tion are stored and can be accessed through the INFO menu.
NOTE: For optimum accuracy, re-zero the FID every time the hydrogen supply valve is turned on.
Span Reference Point(s)To set the span reference point, execute the procedure described below. Note that the procedure is the same as that for setting the zero reference except that a span gas is used instead of a zero gas. The procedure is:
1. From the CALIBRATION MENU display, press 4=Span.
NOTES:1. The following sequence shows the procedure when the TVA-1000B is configured with both Cal mode and Cal Save mode = Auto. If either mode is Manual, an extra confirmation is required at the appropriate step. 2. If your instrument is a dual detector type (PID and FID), you can set the span ref-erence for the PID and FID separately, both together, or one in one type of calibration gas and one in another type of gas. To do so, follow the same procedure. 3. If multiple span points are used, repeat the following procedure for each and every span point.
When you press 4=Span, the display will show:
FID-only PID-only PID/FID
If more than one reference span gas concentration has been configured, pressing the Up/Dn keys will allow you to scroll through all defined reference gas concen-tration points.
FID 7654321
Span P+1 (Up/Dn)
Enter=New Calib
PID 7654321
Span P+1 (Up/Dn)
Enter=New Calib
PID 7654321
FID 7654321
Span Pt1 (Up/Dn)
1==Both 2Pid 3Fid
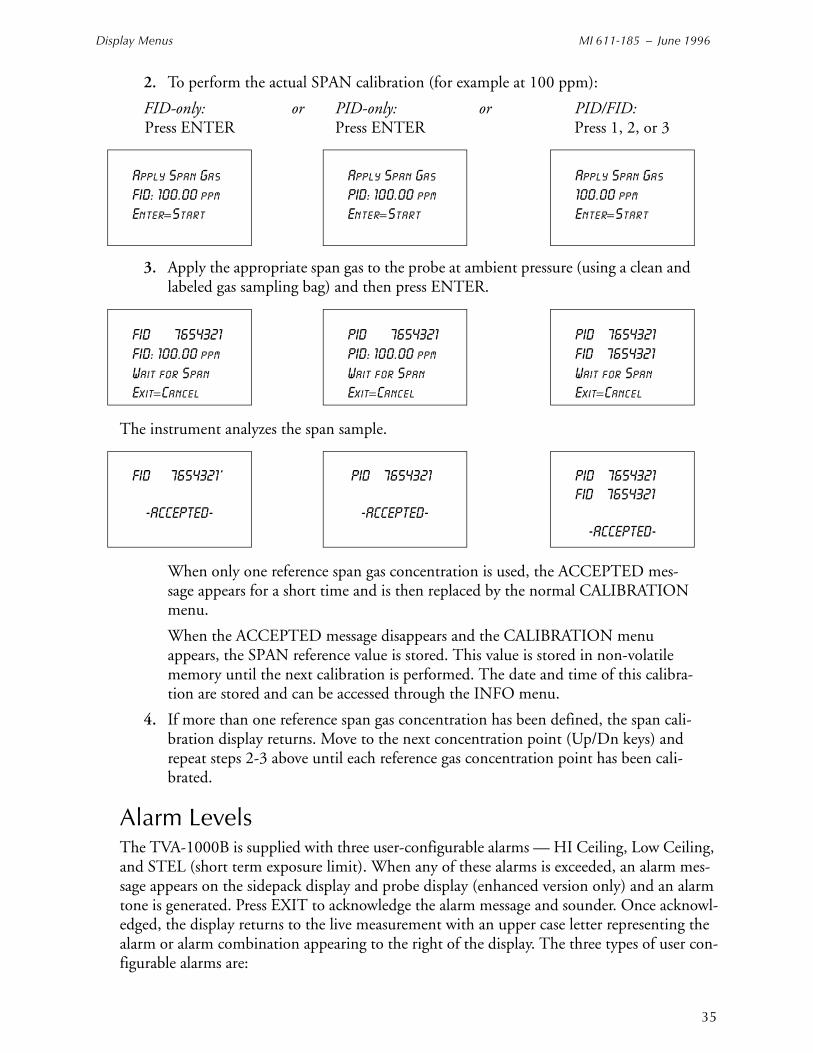
Display Menus MI 611-185 – June 1996
35
2. To perform the actual SPAN calibration (for example at 100 ppm):
FID-only: or PID-only: or PID/FID: Press ENTER Press ENTER Press 1, 2, or 3
3. Apply the appropriate span gas to the probe at ambient pressure (using a clean and labeled gas sampling bag) and then press ENTER.
The instrument analyzes the span sample.
When only one reference span gas concentration is used, the ACCEPTED mes-sage appears for a short time and is then replaced by the normal CALIBRATION menu.
When the ACCEPTED message disappears and the CALIBRATION menu appears, the SPAN reference value is stored. This value is stored in non-volatile memory until the next calibration is performed. The date and time of this calibra-tion are stored and can be accessed through the INFO menu.
4. If more than one reference span gas concentration has been defined, the span cali-bration display returns. Move to the next concentration point (Up/Dn keys) and repeat steps 2-3 above until each reference gas concentration point has been cali-brated.
Alarm LevelsThe TVA-1000B is supplied with three user-configurable alarms — HI Ceiling, Low Ceiling, and STEL (short term exposure limit). When any of these alarms is exceeded, an alarm mes-sage appears on the sidepack display and probe display (enhanced version only) and an alarm tone is generated. Press EXIT to acknowledge the alarm message and sounder. Once acknowl-edged, the display returns to the live measurement with an upper case letter representing the alarm or alarm combination appearing to the right of the display. The three types of user con-figurable alarms are:
Apply Span Gas
FID: 100.00 ppm
Enter=Start
Apply Span Gas
PID: 100.00 ppm
Enter=Start
Apply Span Gas
100.00 ppm
Enter=Start
FID 7654321
FID: 100.00 ppm
Wait for Span
Exit=Cancel
PID 7654321
PID: 100.00 ppm
Wait for Span
Exit=Cancel
PID 7654321
FID 7654321
Wait for Span
Exit=Cancel
FID 7654321‘
-ACCEPTED-
PID 7654321
-ACCEPTED-
PID 7654321FID 7654321
-ACCEPTED-
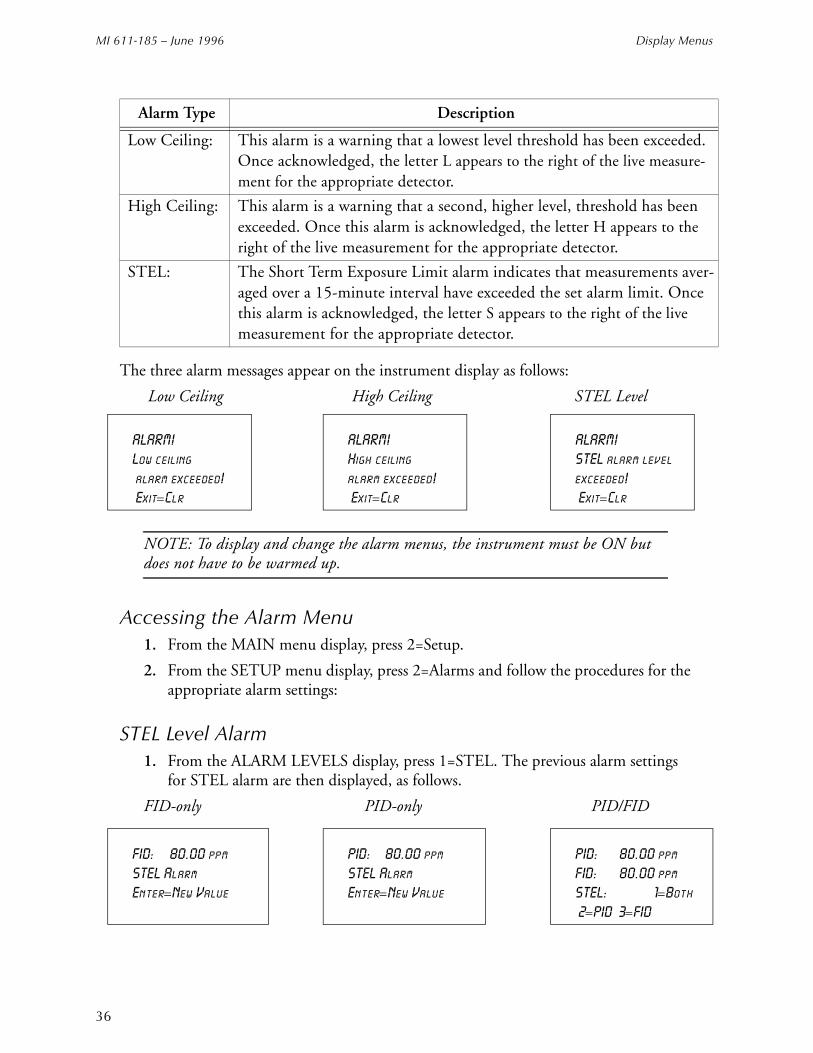
MI 611-185 – June 1996 Display Menus
36
The three alarm messages appear on the instrument display as follows:
Low Ceiling High Ceiling STEL Level
NOTE: To display and change the alarm menus, the instrument must be ON but does not have to be warmed up.
Accessing the Alarm Menu1. From the MAIN menu display, press 2=Setup.
2. From the SETUP menu display, press 2=Alarms and follow the procedures for the appropriate alarm settings:
STEL Level Alarm1. From the ALARM LEVELS display, press 1=STEL. The previous alarm settings
for STEL alarm are then displayed, as follows.
FID-only PID-only PID/FID
Alarm Type Description
Low Ceiling: This alarm is a warning that a lowest level threshold has been exceeded. Once acknowledged, the letter L appears to the right of the live measure-ment for the appropriate detector.
High Ceiling: This alarm is a warning that a second, higher level, threshold has been exceeded. Once this alarm is acknowledged, the letter H appears to the right of the live measurement for the appropriate detector.
STEL: The Short Term Exposure Limit alarm indicates that measurements aver-aged over a 15-minute interval have exceeded the set alarm limit. Once this alarm is acknowledged, the letter S appears to the right of the live measurement for the appropriate detector.
ALARM!=== =
Low ceiling
alarm exceeded!
Exit=Clr
ALARM!=== =
High ceiling
alarm exceeded!
Exit=Clr
=ALARM!=== =
STEL alarm level
exceeded!
Exit=Clr
FID: 80.00 ppm
STEL Alarm
Enter=New Value
PID: 80.00 ppm
STEL Alarm
Enter=New Value
PID: 80.00 ppm
FID: 80.00 ppm
STEL: 1=Both
2=PID 3=FID

Display Menus MI 611-185 – June 1996
37
2. To change the alarm level to a new value, press ENTER on a single detector instru-ment or 1, 2, or 3 on a dual detector instrument and see:
FID-only PID-only PID/FID
Use the up and down arrow keys to select %, PPM, PPB, and decimal point position, then type the numeric value for the alarm level desired.
3. Press ENTER to store new values into instrument memory.
4. Press EXIT to return to the ALARM LEVELS without making a change.
Low Ceiling Alarm1. From the ALARM LEVELS display, press 2=Low Ceiling. The previous alarm set-
tings for the Low Ceiling alarm are then displayed, as follows.
FID-only PID-only PID/FID
2. To change the alarm level to a new value on a single detector instrument, press ENTER; on a dual detector instrument, press 1, 2, or 3, and see:
Use the up and down arrow keys to select %, PPM, PPB, and decimal point posi-tion, and then type the numeric value for the alarm level desired.
3. Press ENTER to store the new values into instrument memory.
4. Press EXIT to return to the ALARM LEVELS.
Enter STEL:
FID: 000.00 ppm
Up/Dn=Next Unit
Enter=Accept
Enter STEL:
PID:000.00 ppm
Up/Dn=Next Unit
Enter=Accept
Enter STEL:
P&F:000.00 ppm
Up/Dn=Next Unit
Enter=Accept
FID: 80.00 ppm
Low Ceiling Alarm
Enter=New Value
PID: 80.00 ppm
Low Ceiling Alarm
Enter=New Value
PID: 80.00 ppm
FID: 80.00 ppm
Low Ceiling: 1=Both
2=PID 3=FID
Enter low ceil:
FID: 000.00 ppm
Up/Dn=Next Unit
Enter=Accept
Enter low ceil:
PID:000.00 ppm
Up/Dn=Next Unit
Enter=Accept
Enter low ceil:
P&F:000.00 ppm
Up/Dn=Next Unit
Enter=Accept
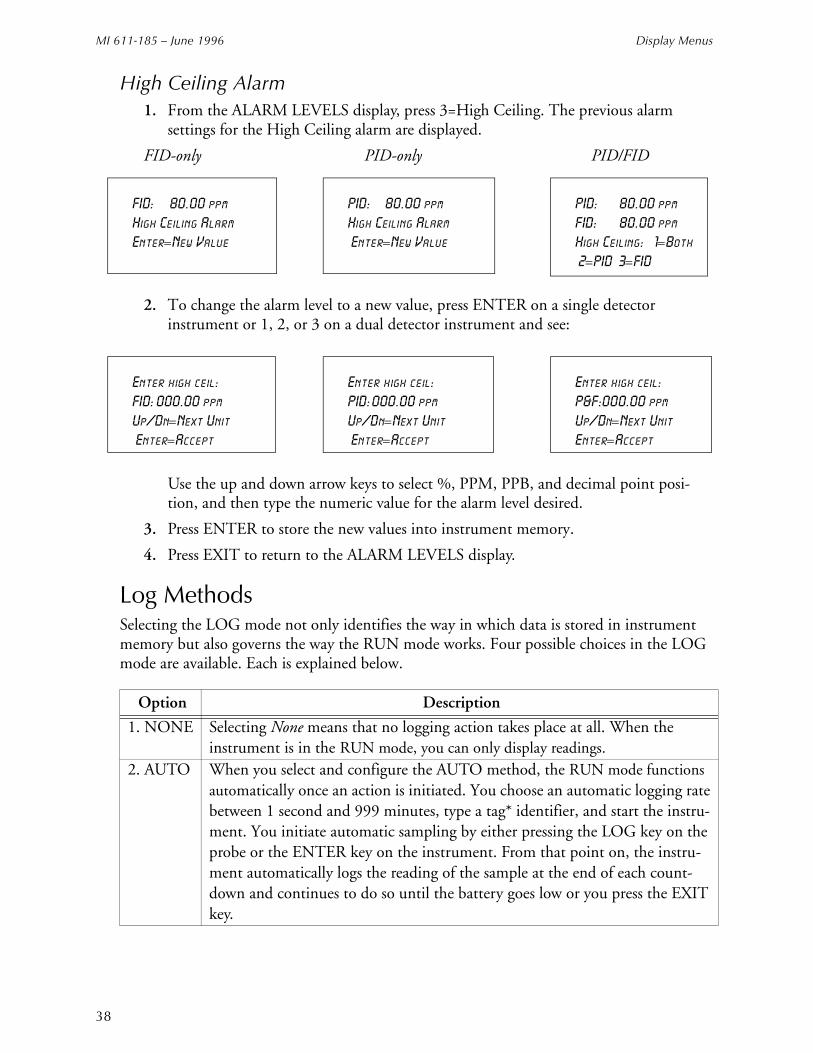
MI 611-185 – June 1996 Display Menus
38
High Ceiling Alarm1. From the ALARM LEVELS display, press 3=High Ceiling. The previous alarm
settings for the High Ceiling alarm are displayed.
FID-only PID-only PID/FID
2. To change the alarm level to a new value, press ENTER on a single detector instrument or 1, 2, or 3 on a dual detector instrument and see:
Use the up and down arrow keys to select %, PPM, PPB, and decimal point posi-tion, and then type the numeric value for the alarm level desired.
3. Press ENTER to store the new values into instrument memory.
4. Press EXIT to return to the ALARM LEVELS display.
Log MethodsSelecting the LOG mode not only identifies the way in which data is stored in instrument memory but also governs the way the RUN mode works. Four possible choices in the LOG mode are available. Each is explained below.
Option Description
1. NONE Selecting None means that no logging action takes place at all. When the instrument is in the RUN mode, you can only display readings.
2. AUTO When you select and configure the AUTO method, the RUN mode functions automatically once an action is initiated. You choose an automatic logging rate between 1 second and 999 minutes, type a tag* identifier, and start the instru-ment. You initiate automatic sampling by either pressing the LOG key on the probe or the ENTER key on the instrument. From that point on, the instru-ment automatically logs the reading of the sample at the end of each count-down and continues to do so until the battery goes low or you press the EXIT key.
FID: 80.00 ppm
High Ceiling Alarm
Enter=New Value
PID: 80.00 ppm
High Ceiling Alarm
Enter=New Value
PID: 80.00 ppm
FID: 80.00 ppm
High Ceiling: 1=Both
2=PID 3=FID
Enter high ceil:
FID: 000.00 ppm
Up/Dn=Next Unit
Enter=Accept
Enter high ceil:
PID:000.00 ppm
Up/Dn=Next Unit
Enter=Accept
Enter high ceil:
P&F:000.00 ppm
Up/Dn=Next Unit
Enter=Accept
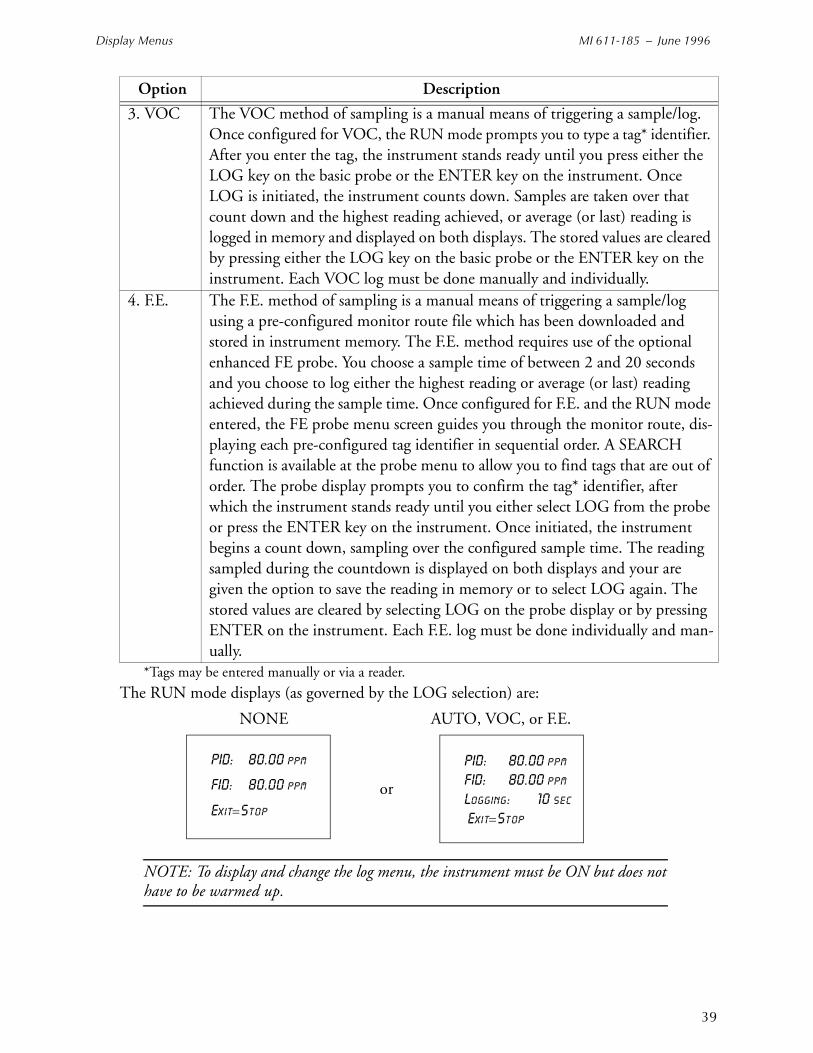
Display Menus MI 611-185 – June 1996
39
*Tags may be entered manually or via a reader.
The RUN mode displays (as governed by the LOG selection) are:
NONE AUTO, VOC, or F.E.
NOTE: To display and change the log menu, the instrument must be ON but does not have to be warmed up.
3. VOC The VOC method of sampling is a manual means of triggering a sample/log. Once configured for VOC, the RUN mode prompts you to type a tag* identifier. After you enter the tag, the instrument stands ready until you press either the LOG key on the basic probe or the ENTER key on the instrument. Once LOG is initiated, the instrument counts down. Samples are taken over that count down and the highest reading achieved, or average (or last) reading is logged in memory and displayed on both displays. The stored values are cleared by pressing either the LOG key on the basic probe or the ENTER key on the instrument. Each VOC log must be done manually and individually.
4. F.E. The F.E. method of sampling is a manual means of triggering a sample/log using a pre-configured monitor route file which has been downloaded and stored in instrument memory. The F.E. method requires use of the optional enhanced FE probe. You choose a sample time of between 2 and 20 seconds and you choose to log either the highest reading or average (or last) reading achieved during the sample time. Once configured for F.E. and the RUN mode entered, the FE probe menu screen guides you through the monitor route, dis-playing each pre-configured tag identifier in sequential order. A SEARCH function is available at the probe menu to allow you to find tags that are out of order. The probe display prompts you to confirm the tag* identifier, after which the instrument stands ready until you either select LOG from the probe or press the ENTER key on the instrument. Once initiated, the instrument begins a count down, sampling over the configured sample time. The reading sampled during the countdown is displayed on both displays and your are given the option to save the reading in memory or to select LOG again. The stored values are cleared by selecting LOG on the probe display or by pressing ENTER on the instrument. Each F.E. log must be done individually and man-ually.
Option Description
PID: 80.00 ppm
FID: 80.00 ppm
Exit=Stop
PID: 80.00 ppm
FID: 80.00 ppm
Logging: 10 sec
Exit=Stop
or
MI 611-185 – June 1996 Display Menus
40
Accessing the LOG Menu1. From the MAIN MENU display, press 2=Setup.
2. From the SETUP MENU display, press 3=Log. The following display will appear:
The previous log selection is displayed on the second line. Follow the procedure below to set the log mode.
Log None
1. From the LOG MODE Menu, press 1=None.
Log Auto
From the LOG MODE Menu, press 2=Auto. The previous log selection is then displayed on the second line of the screen.
2. Use the up and down arrow to select minutes (min) or seconds (sec). Then, type the appropriate time interval desired for the automatic sampling.
3. Press ENTER and, after a brief message of acceptance, the automatic sampling is ready to be used in the RUN Mode.
NOTE: To allow for STEL calculations in the personal computer utility, the log rate value must be less than 90 seconds. If a log rate greater than 90 seconds is selected, a warning message will appear. Press EXIT to bypass this message and proceed.
Log Mode
1=None 2=Auto
3=VOC/FE 4=Custom
None
LOG MODE
Auto, rate=5 sec
1=None 2=Auto
3=VOC/FE 4=Custom
= None
-ACCEPTED-
Press 1=None to display this message briefly. The screen then returns to the SETUP menu.
Enter log rate:
Auto, rate=000sec
Up/Dn=Sec↔Min
Enter=Accept
Press 2=Auto to display this message. LOG MODE
None
1=None 2=Auto
3=VOC/FE 4=Custom
Display Menus MI 611-185 – June 1996
41
In the LOG AUTO mode, data is logged in the format described below:
1. Every time RUN mode is entered a new header is created.
2. Data is logged periodically, at the user-entered log rate, in the following format:
Approximately 9500 data samples may be taken with a single header.
Log VOC
1. From the LOG MODE Menu, press 3=VOC/FE, then 1=VOC.
2. Press the Up/Dn arrow keys to choose the type of sampling to be used (Max, Avg, Smp).
a. Max=the maximum reading obtained during the log interval.
b. Avg=the average reading obtained during the log interval.
c. Smp=the last reading obtained during the log interval.
3. Type the appropriate time interval desired for VOC sampling.
4. Press ENTER, and, after a brief message of acceptance, the VOC method of log-ging is now ready to be used in the RUN Mode.
NOTE: The allowable Sample Time range is 2-30 seconds. If a Sample Time of less than 2 seconds or greater than 30 seconds is selected, a warning message will appear and you will be required to re-enter the Sample Time.
Date Time PID (PPM)Alarms FID (PPM) Alarms
7/28/93 11:20:57:00 187.1 L 157.1 L7/28/93 11:21:29:00 436.6 H 519.6 L7/28/93 11:21:54:00 708.4 LH 847.0 LH7/28/93 11:22:19:00 300.7 L 381.9 L7/28/93 11:22:36:00 223.8 265.1
LOG MODE
Auto,rate=12 sec
1=None 2=Auto
3=VOC 4=FE
Enter Sampling:
Voc, Time=00s, Max
Up/Dn=Next type
Enter=ACCEPT
Press 3, then 1 to display this message.
MI 611-185 – June 1996 Display Menus
42
In the LOG VOC mode, data is logged in the format described below:
1. Every time RUN mode is entered a new header is created.
2. Data is logged in the following format whenever you press the LOG button:
Approximately 4500 data samples may be taken.
Log F.E.
1. From the LOG MODE menu, press 3=VOC/FE, then 2=FE The previous log selection is then displayed on the second line of the screen.
2. Press the Up/Dn arrow keys to choose the type of sampling to be used (Max, Avg, Smp).
a. Max = the maximum reading obtained during the log interval.
b. Avg = the average reading obtained during the log interval.
c. Smp = the last reading obtained during the log interval.
3. Type the appropriate time interval desired for F.E. sampling.
4. Press Enter, and, after a brief message of acceptance, the F.E. method of logging is now ready to be used in the RUN mode.
NOTE: The allowable Sample Time range is 2-30 seconds. If a Sample Time of less than 2 seconds or greater than 30 seconds is selected, a warning message will appear and you will be require to re-enter the Sample Time.
Log Custom
The TVA-1000B has several pre-designed logging methods. However, if you find that you would prefer to log data in a different fashion, you can use Custom logging to create your own log type. The TVA-1000B will prompt you through a series of questions which will assist you in setting the various logging options. The end result is a logging method which collects data the way you want it to.
Date Time PID (PPM) Alarms FID (PPM) Alarms Tag
7/28/93 11:20:57:00 187.1 L 157.1 L TAG17/28/93 11:21:29:00 436.6 H 519.6 L TAG27/28/93 11:21:54:00 708.4 LH 847.0 LH TAG37/28/93 11:22:19:00 300.7 L 381.9 L TAG47/28/93 11:22:36:00 223.8 265.1 TAG5
LOG MODE
Logging=VOC, Time=05s,
Max
1=None 2=Auto
3=VOC/FE 4=Custom
Enter Sampling:
FE,Time=00s, Max
Up/Dn=Next Type Enter=ACCEPT
Press 3=VOC/FE, then 2=FE to display this message.
Display Menus MI 611-185 – June 1996
43
The following variable settings can be configured when designing a Custom log method:
1. Log data type
This setting allows you to choose the format in which data will be saved. The choices are as follows:
a. None.
b. Auto – Data stored in a fashion similar to Auto logging for download to the TEI datalogging software only (tag, calibration information, Detector Counts, time/date, alarms).
c. VOC – Data stored in a fashion similar to VOC logging for download to the TEI datalogging software only (Tag, Calibration Information, Detector Counts, time/date, alarms).
d. FE – Data stored in a fashion similar to FE logging for download to FEMS or via the Text protocol.
2. Sample time
This setting allows you to adjust the sampling interval.
3. Log time units
This setting allows you to choose the units for the sample interval (seconds or min-utes).
4. Log sample type
This setting allows you to choose the way in which sample readings are collected over the sample rate or interval. The choices are as follows:
a. Last sample — the last reading obtained within the sample interval is stored
b. Max — the maximum reading obtained within the sample interval is stored
c. Avg — the average reading obtained over the sample interval is stored
5. Log unit lock
This setting allows you to decide whether to enable auto-ranging or lock the TVA-1000 units to one of three choices: ppb, ppm, or %.
6. Log auto repeat
This setting allows you to determine whether the TVA-1000B should automatically cycle through logging events (auto repeat ON) or pause for a user command before logging (auto repeat OFF).
7. Log save accept
This setting determines whether the TVA-1000B prompts the user before saving a logged reading (Manual) or automatically saves the reading without a user prompt (Auto).
8. Tag active
This setting determines whether or not you want to assign tags to logged readings. If you wish to assign tags, choose ON. If you wish to skip tagging, choose OFF.
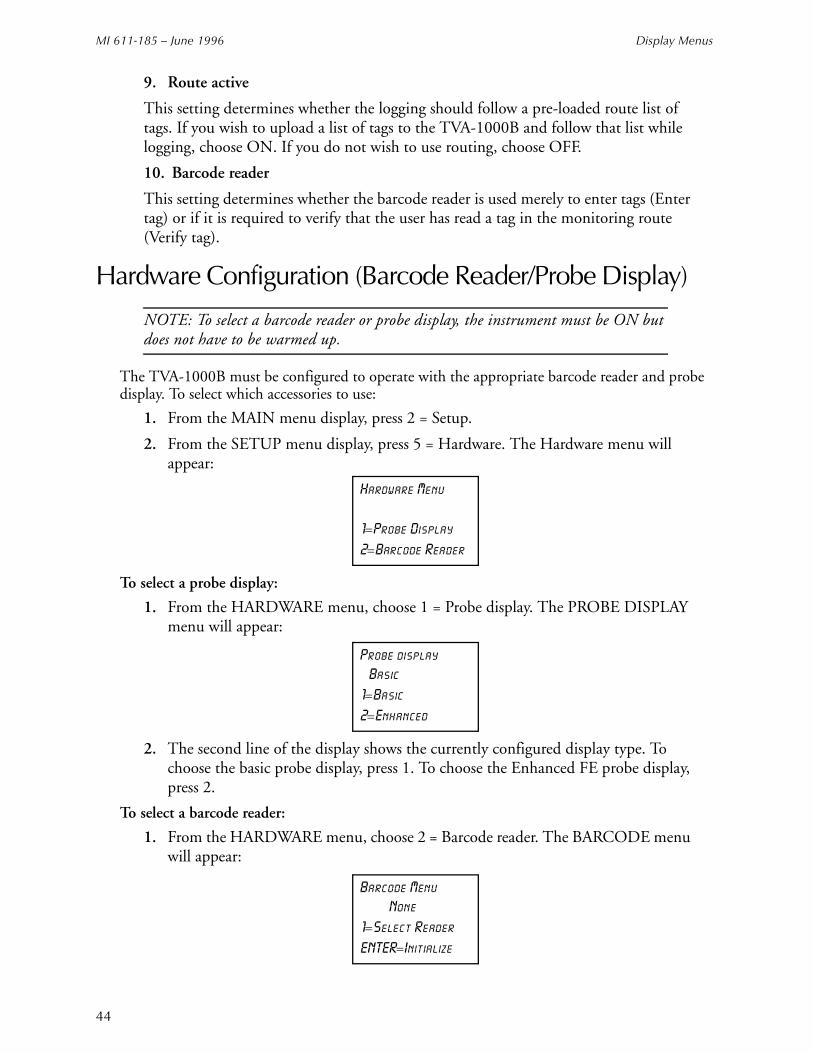
MI 611-185 – June 1996 Display Menus
44
9. Route active
This setting determines whether the logging should follow a pre-loaded route list of tags. If you wish to upload a list of tags to the TVA-1000B and follow that list while logging, choose ON. If you do not wish to use routing, choose OFF.
10. Barcode reader
This setting determines whether the barcode reader is used merely to enter tags (Enter tag) or if it is required to verify that the user has read a tag in the monitoring route (Verify tag).
Hardware Configuration (Barcode Reader/Probe Display)
NOTE: To select a barcode reader or probe display, the instrument must be ON but does not have to be warmed up.
The TVA-1000B must be configured to operate with the appropriate barcode reader and probe display. To select which accessories to use:
1. From the MAIN menu display, press 2 = Setup.
2. From the SETUP menu display, press 5 = Hardware. The Hardware menu will appear:
To select a probe display:
1. From the HARDWARE menu, choose 1 = Probe display. The PROBE DISPLAY menu will appear:
2. The second line of the display shows the currently configured display type. To choose the basic probe display, press 1. To choose the Enhanced FE probe display, press 2.
To select a barcode reader:
1. From the HARDWARE menu, choose 2 = Barcode reader. The BARCODE menu will appear:
Hardware Menu
1=Probe Display
2=Barcode Reader
Probe display
1=Basic
2=Enhanced
Basic
Barcode Menu
1=Select Reader
ENTER=Initialize
None
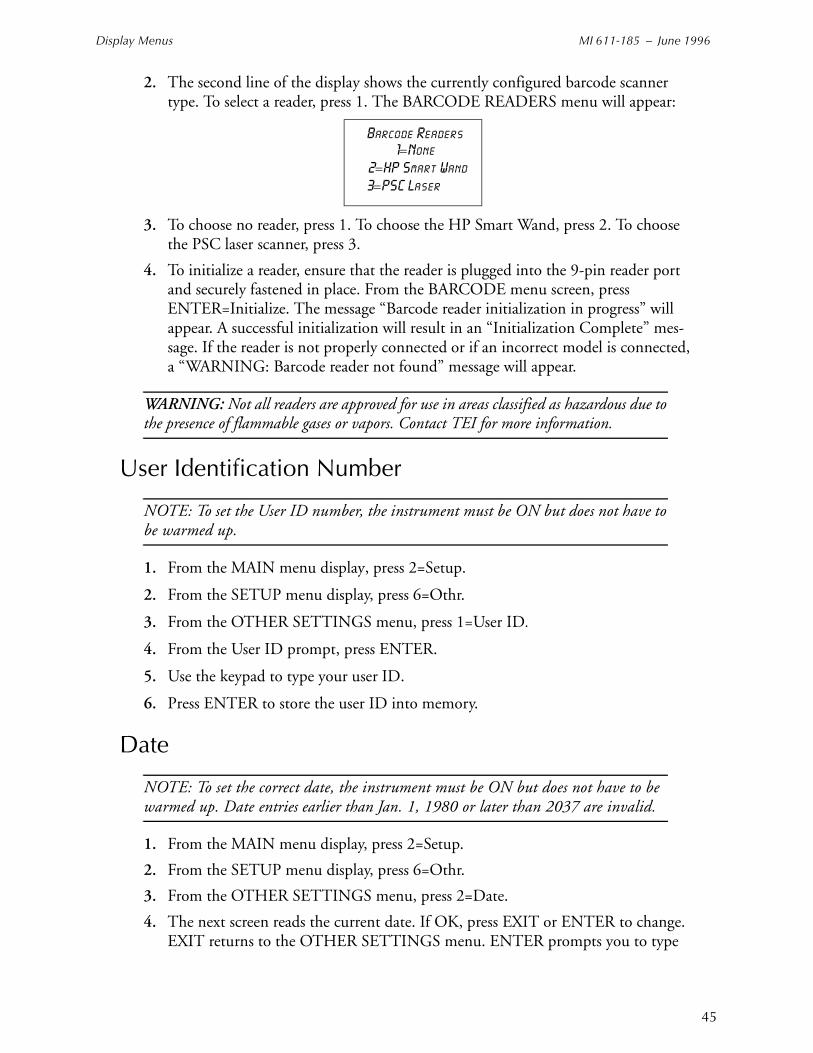
Display Menus MI 611-185 – June 1996
45
2. The second line of the display shows the currently configured barcode scanner type. To select a reader, press 1. The BARCODE READERS menu will appear:
3. To choose no reader, press 1. To choose the HP Smart Wand, press 2. To choose the PSC laser scanner, press 3.
4. To initialize a reader, ensure that the reader is plugged into the 9-pin reader port and securely fastened in place. From the BARCODE menu screen, press ENTER=Initialize. The message “Barcode reader initialization in progress” will appear. A successful initialization will result in an “Initialization Complete” mes-sage. If the reader is not properly connected or if an incorrect model is connected, a “WARNING: Barcode reader not found” message will appear.
WARNING: Not all readers are approved for use in areas classified as hazardous due to the presence of flammable gases or vapors. Contact TEI for more information.
User Identification Number
NOTE: To set the User ID number, the instrument must be ON but does not have to be warmed up.
1. From the MAIN menu display, press 2=Setup.
2. From the SETUP menu display, press 6=Othr.
3. From the OTHER SETTINGS menu, press 1=User ID.
4. From the User ID prompt, press ENTER.
5. Use the keypad to type your user ID.
6. Press ENTER to store the user ID into memory.
Date
NOTE: To set the correct date, the instrument must be ON but does not have to be warmed up. Date entries earlier than Jan. 1, 1980 or later than 2037 are invalid.
1. From the MAIN menu display, press 2=Setup.
2. From the SETUP menu display, press 6=Othr.
3. From the OTHER SETTINGS menu, press 2=Date.
4. The next screen reads the current date. If OK, press EXIT or ENTER to change. EXIT returns to the OTHER SETTINGS menu. ENTER prompts you to type
Barcode Readers
2=HP Smart Wand3=PSC Laser
1=None
MI 611-185 – June 1996 Display Menus
46
the correct date. Do so by typing month/day/year, and then press ENTER to store the date in memory. The display then returns to OTHER SETTINGS.
Time of Day
NOTE: To set the correct time, the instrument must be ON but does not have to be warmed up. The date must be within the valid range of 1980 to 2037.
1. From the MAIN menu display, press 2=Setup.
2. From the SETUP menu display, press 6=Othr.
3. From the OTHER SETTINGS menu, press 3=Time.
4. The next screen reads the current time. If it is OK, press EXIT or ENTER to change. EXIT returns to the OTHER SETTING Menu, ENTER prompts you to type the correct time. Do so by typing hour/minute/second. Then press ENTER to store the time in memory. The display then returns to OTHER SETTINGS.
User Options
Key ClickIf the key click is on, a chirp is heard every time a key is pressed.
NOTE: To select key click on/off, the instrument must be ON but does not have to be warmed up.
1. From the MAIN MENU display, press 2=Setup.
2. From the SETUP MENU display, press 6=Othr.
3. From the OTHER SETTINGS Menu, press 4=User Options.
4. From the USER OPTION Menu, press 1=Key Click.
5. From the Key click Menu, press 1=On or 2=Off. The screen displays the previous selection. When a new selection is made, the display returns to USER OPTIONS.
Display DelayThis function determines the length of time that temporary messages remain on the screen.
NOTE: To select the display delay, the instrument must be ON but does not have to be warmed up.
1. From the MAIN menu display, press 2=Setup.
2. From the SETUP menu display, press 6=Othr.
3. From the OTHER SETTINGS menu, press 4=User Options.
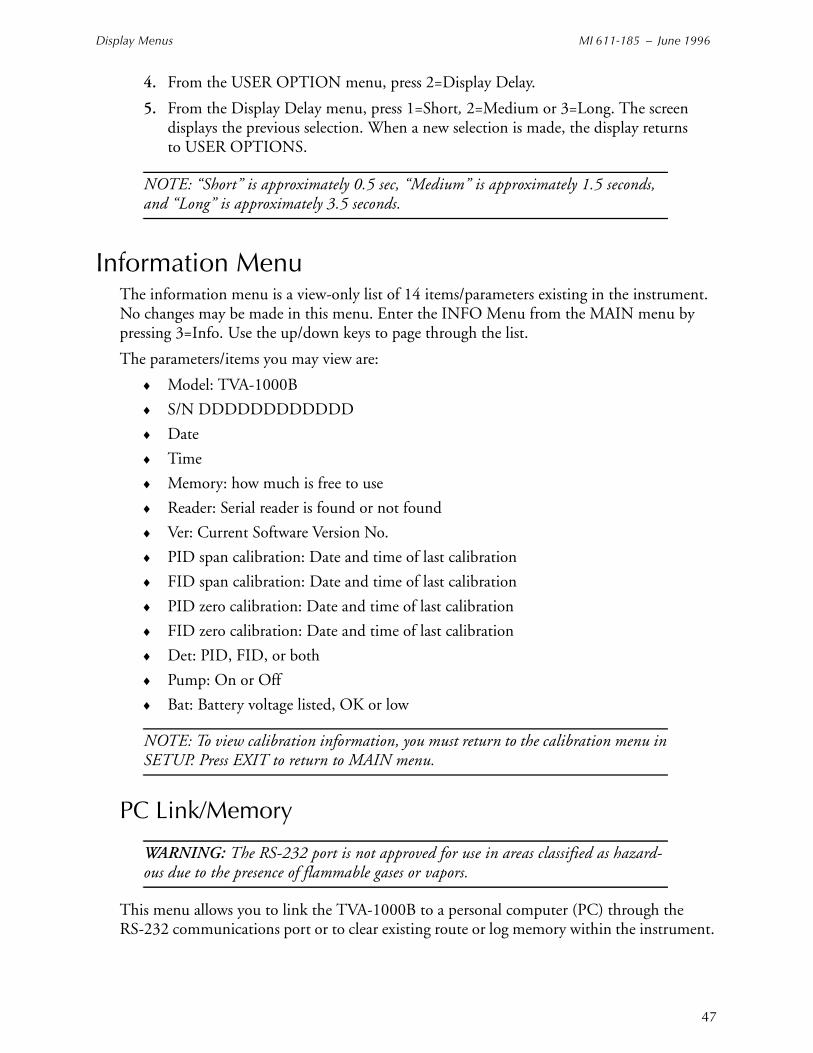
Display Menus MI 611-185 – June 1996
47
4. From the USER OPTION menu, press 2=Display Delay.
5. From the Display Delay menu, press 1=Short, 2=Medium or 3=Long. The screen displays the previous selection. When a new selection is made, the display returns to USER OPTIONS.
NOTE: “Short” is approximately 0.5 sec, “Medium” is approximately 1.5 seconds, and “Long” is approximately 3.5 seconds.
Information MenuThe information menu is a view-only list of 14 items/parameters existing in the instrument. No changes may be made in this menu. Enter the INFO Menu from the MAIN menu by pressing 3=Info. Use the up/down keys to page through the list.
The parameters/items you may view are:
♦ Model: TVA-1000B
♦ S/N DDDDDDDDDDDD
♦ Date
♦ Time
♦ Memory: how much is free to use
♦ Reader: Serial reader is found or not found
♦ Ver: Current Software Version No.
♦ PID span calibration: Date and time of last calibration
♦ FID span calibration: Date and time of last calibration
♦ PID zero calibration: Date and time of last calibration
♦ FID zero calibration: Date and time of last calibration
♦ Det: PID, FID, or both
♦ Pump: On or Off
♦ Bat: Battery voltage listed, OK or low
NOTE: To view calibration information, you must return to the calibration menu in SETUP. Press EXIT to return to MAIN menu.
PC Link/Memory
WARNING: The RS-232 port is not approved for use in areas classified as hazard-ous due to the presence of flammable gases or vapors.
This menu allows you to link the TVA-1000B to a personal computer (PC) through the RS-232 communications port or to clear existing route or log memory within the instrument.
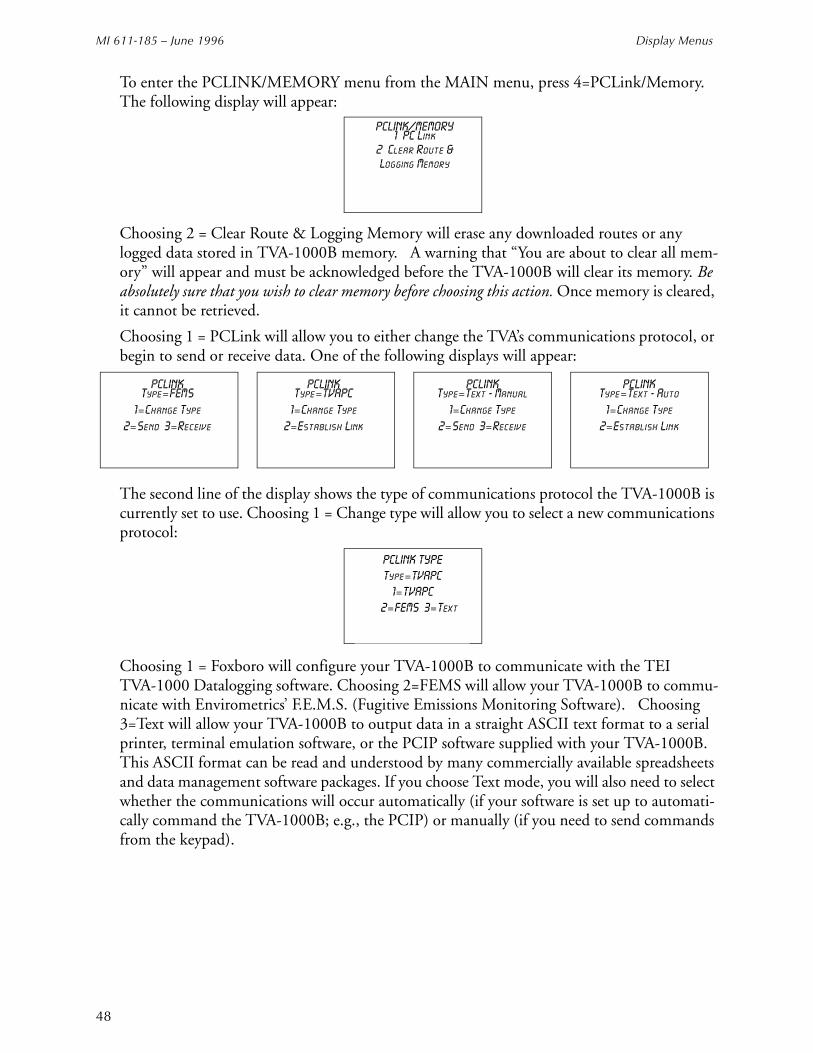
MI 611-185 – June 1996 Display Menus
48
To enter the PCLINK/MEMORY menu from the MAIN menu, press 4=PCLink/Memory. The following display will appear:
Choosing 2 = Clear Route & Logging Memory will erase any downloaded routes or any logged data stored in TVA-1000B memory. A warning that “You are about to clear all mem-ory” will appear and must be acknowledged before the TVA-1000B will clear its memory. Be absolutely sure that you wish to clear memory before choosing this action. Once memory is cleared, it cannot be retrieved.
Choosing 1 = PCLink will allow you to either change the TVA’s communications protocol, or begin to send or receive data. One of the following displays will appear:
The second line of the display shows the type of communications protocol the TVA-1000B is currently set to use. Choosing 1 = Change type will allow you to select a new communications protocol:
Choosing 1 = Foxboro will configure your TVA-1000B to communicate with the TEI TVA-1000 Datalogging software. Choosing 2=FEMS will allow your TVA-1000B to commu-nicate with Envirometrics’ F.E.M.S. (Fugitive Emissions Monitoring Software). Choosing 3=Text will allow your TVA-1000B to output data in a straight ASCII text format to a serial printer, terminal emulation software, or the PCIP software supplied with your TVA-1000B. This ASCII format can be read and understood by many commercially available spreadsheets and data management software packages. If you choose Text mode, you will also need to select whether the communications will occur automatically (if your software is set up to automati-cally command the TVA-1000B; e.g., the PCIP) or manually (if you need to send commands from the keypad).
PCLINK/MEMORY1 = PC Link
2 = Clear Route &Logging Memory
PCLINKType=FEMS
1=Change Type
2=Send 3=Receive
PCLINKType=TVAPC
1=Change Type
2=Establish Link
PCLINKType=Text - Manual
1=Change Type
2=Send 3=Receive
PCLINKType=Text - Auto
1=Change Type
2=Establish Link
PCLINK TYPE
Type=TVAPC
1=TVAPC
2=FEMS 3=Text

Display Menus MI 611-185 – June 1996
49
TEI TVA-1000B Software Link
NOTE: If you are using a mulitpoint calibration curve, you cannot download your data to the PC via the TEI TVA-1000 software. Use the text transfer mode to down-load to an ASCII file.
1. Connect the cable between the PC serial port and the RS-232 port of the TVA-1000B (marked HOST).
2. Enter the PC LINK menu and change the link type (1 = Change type) to Foxboro. If the link type is already set to Foxboro, proceed to the next step.
3. From the PC LINK menu, choose 2 = Establish link. The following display will appear:
For more information about the TVA-1000A Datalogging software, refer to MI 611-187, PC Software.
F.E.M.S. Software Link
Receive
Before the TVA-1000B can be used in FE logging mode, a previously configured route file must be created in F.E.M.S. and downloaded to the instrument’s memory. Use the following instructions to download a route to the TVA-1000B from F.E.M.S.:
1. Connect the cable between the PC serial port and the RS-232 port of the TVA-1000B (marked HOST).
2. Enter the PC LINK menu and change the link type (1 = Change type) to F.E.M.S. If the link type is already set to F.E.M.S., proceed to the next step.
3. Before attempting to download, be sure that F.E.M.S. is configured to operate with the TVA-1000B:
File/Preferences Window: Datalogger set to “Foxboro TVA-1000B”
Monitor Run/Communications Window: 9600 baud, 8 data bits, 1 stop bit, no parity
If these parameters are already properly set, proceed to the next step.
4. Follow the F.E.M.S. instruction manual to create a monitoring route for down-loading to the TVA-1000B.
5. When F.E.M.S. instructs you to set the datalogger so that it is ready to accept data, choose 3=Receive from the PC LINK menu. A warning will appear informing you
PC LINK STATUSWaiting for PC
Request ...Exit=Cancel
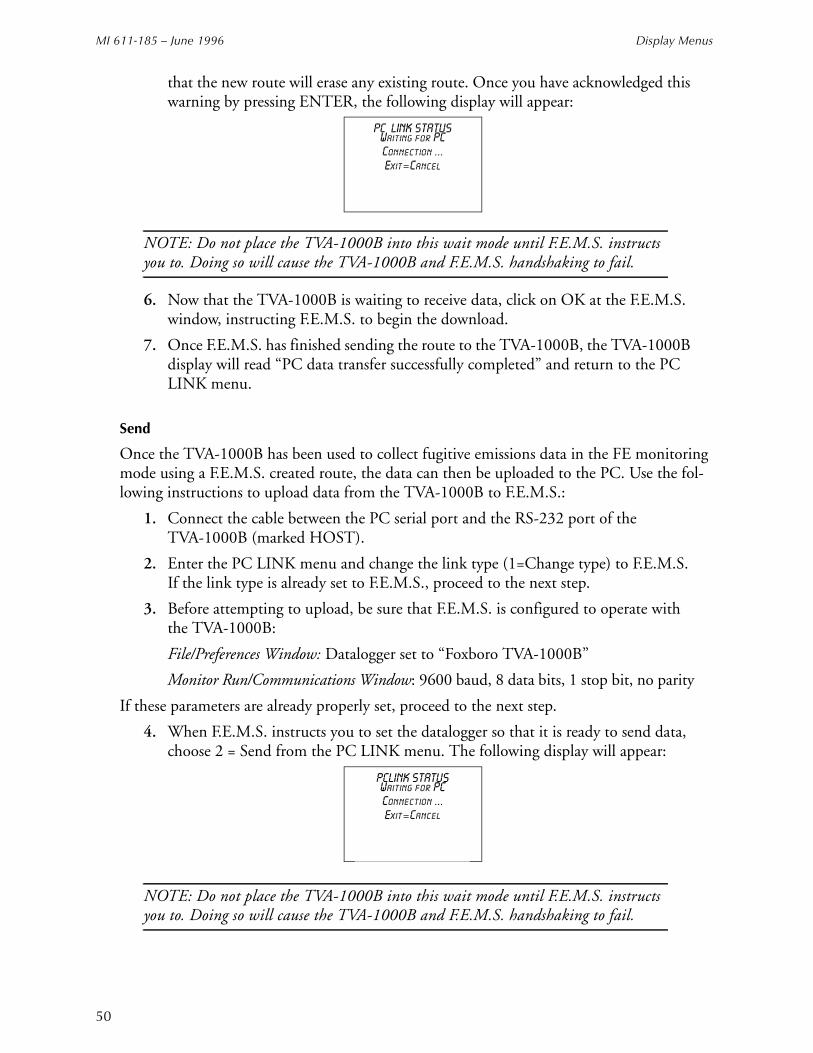
MI 611-185 – June 1996 Display Menus
50
that the new route will erase any existing route. Once you have acknowledged this warning by pressing ENTER, the following display will appear:
NOTE: Do not place the TVA-1000B into this wait mode until F.E.M.S. instructs you to. Doing so will cause the TVA-1000B and F.E.M.S. handshaking to fail.
6. Now that the TVA-1000B is waiting to receive data, click on OK at the F.E.M.S. window, instructing F.E.M.S. to begin the download.
7. Once F.E.M.S. has finished sending the route to the TVA-1000B, the TVA-1000B display will read “PC data transfer successfully completed” and return to the PC LINK menu.
Send
Once the TVA-1000B has been used to collect fugitive emissions data in the FE monitoring mode using a F.E.M.S. created route, the data can then be uploaded to the PC. Use the fol-lowing instructions to upload data from the TVA-1000B to F.E.M.S.:
1. Connect the cable between the PC serial port and the RS-232 port of the TVA-1000B (marked HOST).
2. Enter the PC LINK menu and change the link type (1=Change type) to F.E.M.S. If the link type is already set to F.E.M.S., proceed to the next step.
3. Before attempting to upload, be sure that F.E.M.S. is configured to operate with the TVA-1000B:
File/Preferences Window: Datalogger set to “Foxboro TVA-1000B”
Monitor Run/Communications Window: 9600 baud, 8 data bits, 1 stop bit, no parity
If these parameters are already properly set, proceed to the next step.
4. When F.E.M.S. instructs you to set the datalogger so that it is ready to send data, choose 2 = Send from the PC LINK menu. The following display will appear:
NOTE: Do not place the TVA-1000B into this wait mode until F.E.M.S. instructs you to. Doing so will cause the TVA-1000B and F.E.M.S. handshaking to fail.
PC LINK STATUSWaiting for PCConnection ...Exit=Cancel
PCLINK STATUSWaiting for PCConnection ...Exit=Cancel
Display Menus MI 611-185 – June 1996
51
5. Now that the TVA-1000B is waiting to send data, click on OK at the F.E.M.S. window, instructing F.E.M.S. to begin the upload.
6. Once the analyzer has finished sending the data to F.E.M.S., the TVA-1000B dis-play will read “PC data transfer successfully completed” and return to the PC LINK menu.
Text TransferThe TVA-1000B is also capable of data transfer to an IBM PC running software to emulate a terminal. The data is formatted as readable ASCII text.
The following information can be uploaded from the TVA-1000B to the PC:
a. Route List
b. TVA-1000B Configuration
c. TVA-1000B Calibration Parameters
d. Logged Data
The following information can be downloaded from a PC to the TVA:
a. Route List
b. TVA-1000B Configuration
c. TVA-1000B Calibration Parameters
Two control modes are supported:
a. Manual – the user requests a specific text upload or download at the TVA-1000.
b. Auto – the TVA-1000B performs a specific text upload or download as requested by a control character received from the IBM PC. The TVA-1000B stays in this mode until canceled by the user at the TVA-1000B or by a control code from the IBM PC.
Communications
A commercially available PC communications software package is required to establish a link with the TVA-1000B. Examples of such packages include PROCOMM PLUS and Windows Terminal. The following settings should be used:
Baud Rate: 9600Data Bits: 7Stop Bit: 1Parity: OddFlow Control: XON/XOFF
The data can be uploaded from the TVA-1000B to a file, a terminal screen or a serial printer. Data can also be downloaded to the TVA-1000B. Downloaded files must follow the format prescribed in this manual precisely to ensure proper data transmission.
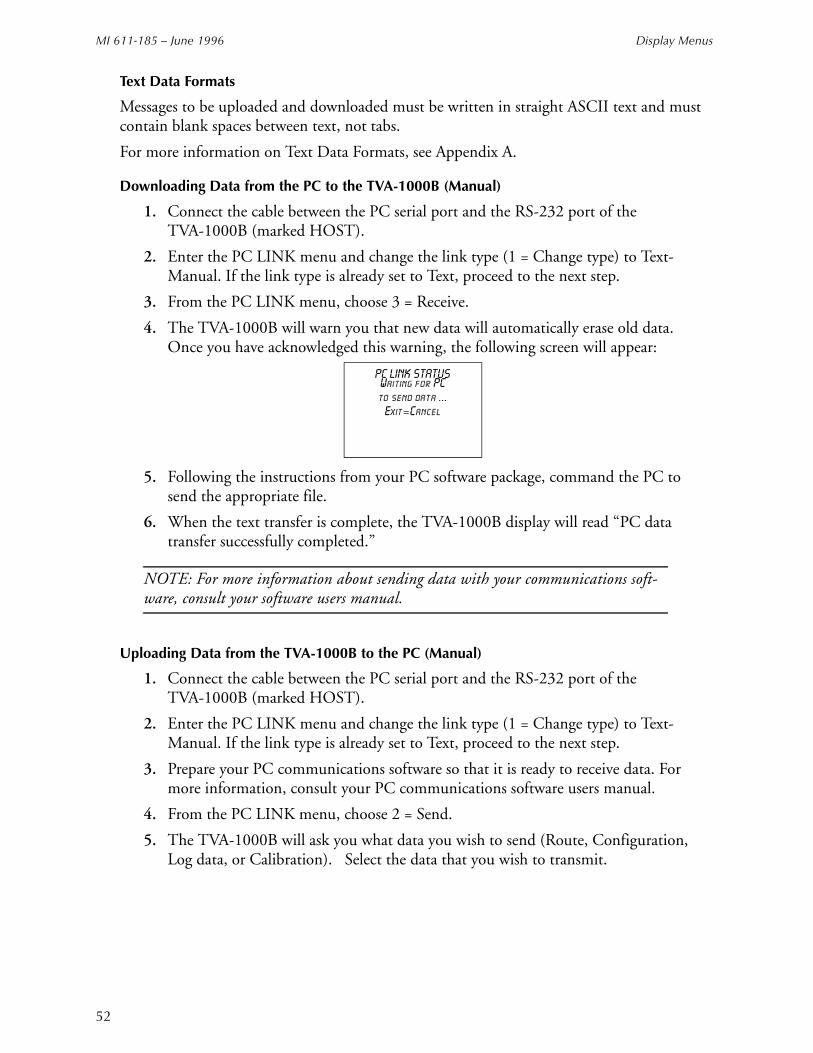
MI 611-185 – June 1996 Display Menus
52
Text Data Formats
Messages to be uploaded and downloaded must be written in straight ASCII text and must contain blank spaces between text, not tabs.
For more information on Text Data Formats, see Appendix A.
Downloading Data from the PC to the TVA-1000B (Manual)
1. Connect the cable between the PC serial port and the RS-232 port of the TVA-1000B (marked HOST).
2. Enter the PC LINK menu and change the link type (1 = Change type) to Text-Manual. If the link type is already set to Text, proceed to the next step.
3. From the PC LINK menu, choose 3 = Receive.
4. The TVA-1000B will warn you that new data will automatically erase old data. Once you have acknowledged this warning, the following screen will appear:
5. Following the instructions from your PC software package, command the PC to send the appropriate file.
6. When the text transfer is complete, the TVA-1000B display will read “PC data transfer successfully completed.”
NOTE: For more information about sending data with your communications soft-ware, consult your software users manual.
Uploading Data from the TVA-1000B to the PC (Manual)
1. Connect the cable between the PC serial port and the RS-232 port of the TVA-1000B (marked HOST).
2. Enter the PC LINK menu and change the link type (1 = Change type) to Text-Manual. If the link type is already set to Text, proceed to the next step.
3. Prepare your PC communications software so that it is ready to receive data. For more information, consult your PC communications software users manual.
4. From the PC LINK menu, choose 2 = Send.
5. The TVA-1000B will ask you what data you wish to send (Route, Configuration, Log data, or Calibration). Select the data that you wish to transmit.
PC LINK STATUSWaiting for PCto send data ...
Exit=Cancel
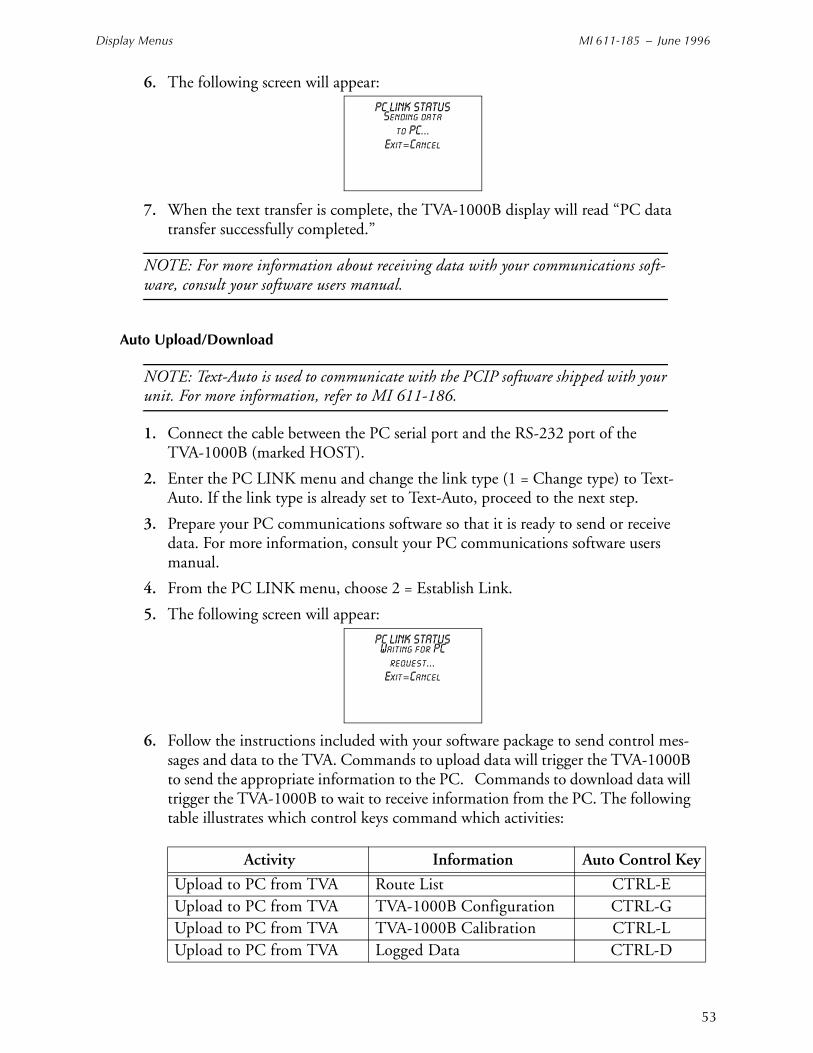
Display Menus MI 611-185 – June 1996
53
6. The following screen will appear:
7. When the text transfer is complete, the TVA-1000B display will read “PC data transfer successfully completed.”
NOTE: For more information about receiving data with your communications soft-ware, consult your software users manual.
Auto Upload/Download
NOTE: Text-Auto is used to communicate with the PCIP software shipped with your unit. For more information, refer to MI 611-186.
1. Connect the cable between the PC serial port and the RS-232 port of the TVA-1000B (marked HOST).
2. Enter the PC LINK menu and change the link type (1 = Change type) to Text-Auto. If the link type is already set to Text-Auto, proceed to the next step.
3. Prepare your PC communications software so that it is ready to send or receive data. For more information, consult your PC communications software users manual.
4. From the PC LINK menu, choose 2 = Establish Link.
5. The following screen will appear:
6. Follow the instructions included with your software package to send control mes-sages and data to the TVA. Commands to upload data will trigger the TVA-1000B to send the appropriate information to the PC. Commands to download data will trigger the TVA-1000B to wait to receive information from the PC. The following table illustrates which control keys command which activities:
Activity Information Auto Control Key
Upload to PC from TVA Route List CTRL-EUpload to PC from TVA TVA-1000B Configuration CTRL-GUpload to PC from TVA TVA-1000B Calibration CTRL-LUpload to PC from TVA Logged Data CTRL-D
PC LINK STATUSSending data
to PC...Exit=Cancel
PC LINK STATUSWaiting for PC
request...Exit=Cancel
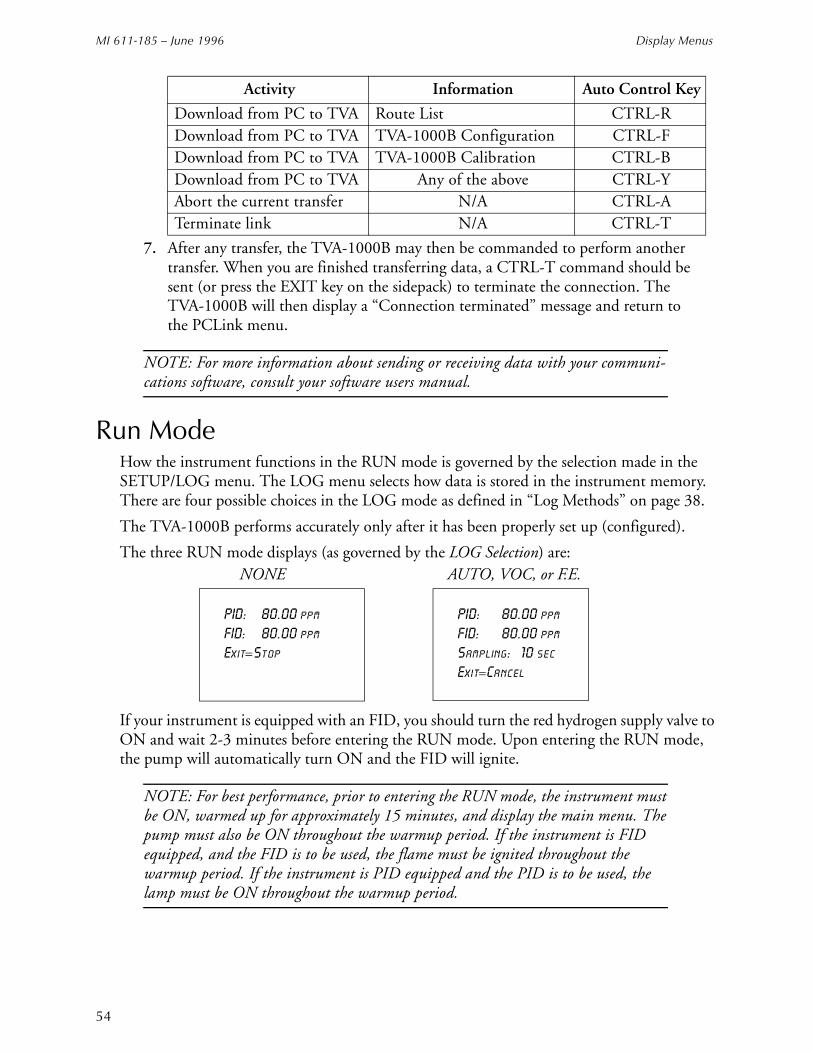
MI 611-185 – June 1996 Display Menus
54
7. After any transfer, the TVA-1000B may then be commanded to perform another transfer. When you are finished transferring data, a CTRL-T command should be sent (or press the EXIT key on the sidepack) to terminate the connection. The TVA-1000B will then display a “Connection terminated” message and return to the PCLink menu.
NOTE: For more information about sending or receiving data with your communi-cations software, consult your software users manual.
Run ModeHow the instrument functions in the RUN mode is governed by the selection made in the SETUP/LOG menu. The LOG menu selects how data is stored in the instrument memory. There are four possible choices in the LOG mode as defined in “Log Methods” on page 38.
The TVA-1000B performs accurately only after it has been properly set up (configured).
The three RUN mode displays (as governed by the LOG Selection) are: NONE AUTO, VOC, or F.E.
If your instrument is equipped with an FID, you should turn the red hydrogen supply valve to ON and wait 2-3 minutes before entering the RUN mode. Upon entering the RUN mode, the pump will automatically turn ON and the FID will ignite.
NOTE: For best performance, prior to entering the RUN mode, the instrument must be ON, warmed up for approximately 15 minutes, and display the main menu. The pump must also be ON throughout the warmup period. If the instrument is FID equipped, and the FID is to be used, the flame must be ignited throughout the warmup period. If the instrument is PID equipped and the PID is to be used, the lamp must be ON throughout the warmup period.
Download from PC to TVA Route List CTRL-RDownload from PC to TVA TVA-1000B Configuration CTRL-FDownload from PC to TVA TVA-1000B Calibration CTRL-BDownload from PC to TVA Any of the above CTRL-YAbort the current transfer N/A CTRL-ATerminate link N/A CTRL-T
Activity Information Auto Control Key
PID: 80.00 ppm
FID: 80.00 ppm
Exit=Stop
PID: 80.00 ppm
FID: 80.00 ppm
Sampling: 10 sec
Exit=Cancel
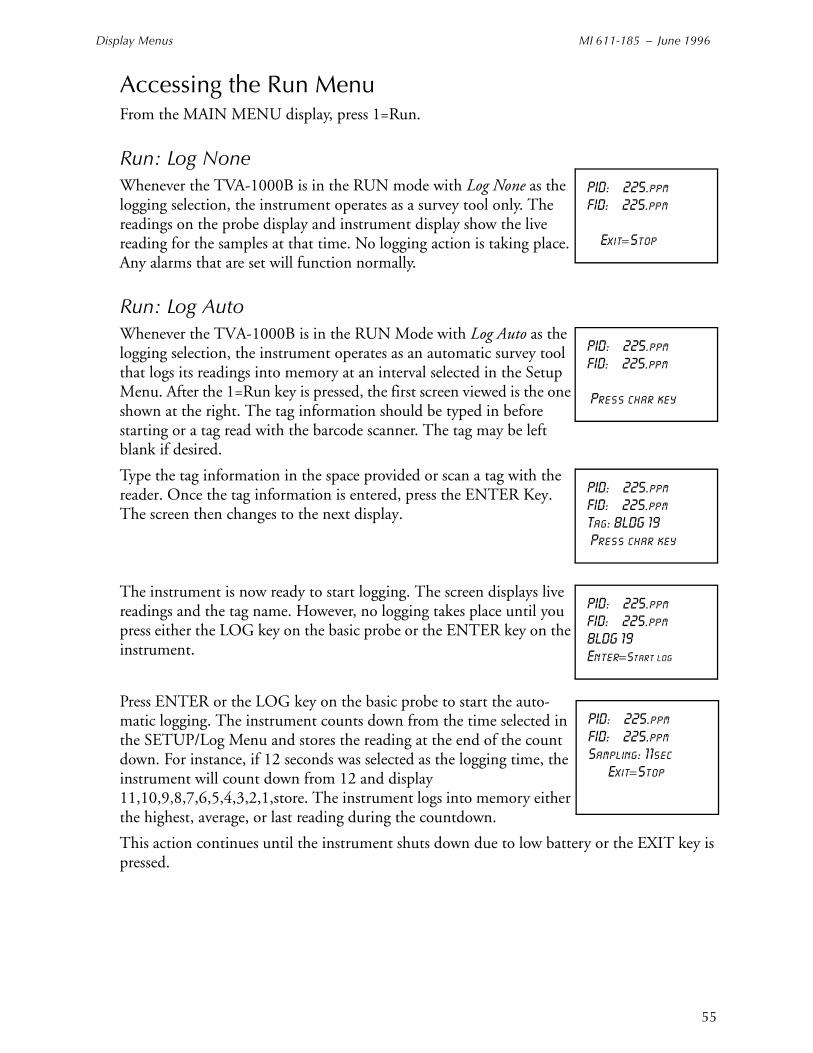
Display Menus MI 611-185 – June 1996
55
Accessing the Run MenuFrom the MAIN MENU display, press 1=Run.
Run: Log NoneWhenever the TVA-1000B is in the RUN mode with Log None as the logging selection, the instrument operates as a survey tool only. The readings on the probe display and instrument display show the live reading for the samples at that time. No logging action is taking place. Any alarms that are set will function normally.
Run: Log AutoWhenever the TVA-1000B is in the RUN Mode with Log Auto as the logging selection, the instrument operates as an automatic survey tool that logs its readings into memory at an interval selected in the Setup Menu. After the 1=Run key is pressed, the first screen viewed is the one shown at the right. The tag information should be typed in before starting or a tag read with the barcode scanner. The tag may be left blank if desired.
Type the tag information in the space provided or scan a tag with the reader. Once the tag information is entered, press the ENTER Key. The screen then changes to the next display.
The instrument is now ready to start logging. The screen displays live readings and the tag name. However, no logging takes place until you press either the LOG key on the basic probe or the ENTER key on the instrument.
Press ENTER or the LOG key on the basic probe to start the auto-matic logging. The instrument counts down from the time selected in the SETUP/Log Menu and stores the reading at the end of the count down. For instance, if 12 seconds was selected as the logging time, the instrument will count down from 12 and display 11,10,9,8,7,6,5,4,3,2,1,store. The instrument logs into memory either the highest, average, or last reading during the countdown.
This action continues until the instrument shuts down due to low battery or the EXIT key is pressed.
PID: 225.ppmFID: 225.ppm
Exit=Stop
PID: 225.ppmFID: 225.ppm ___ _ _ _ _ _ _ Press char key
PID: 225.ppmFID: 225.ppmTag: BLDG 19 Press char key
PID: 225.ppmFID: 225.ppmBLDG 19Enter=Start log
PID: 225.ppmFID: 225.ppmSampling: 11sec Exit=Stop
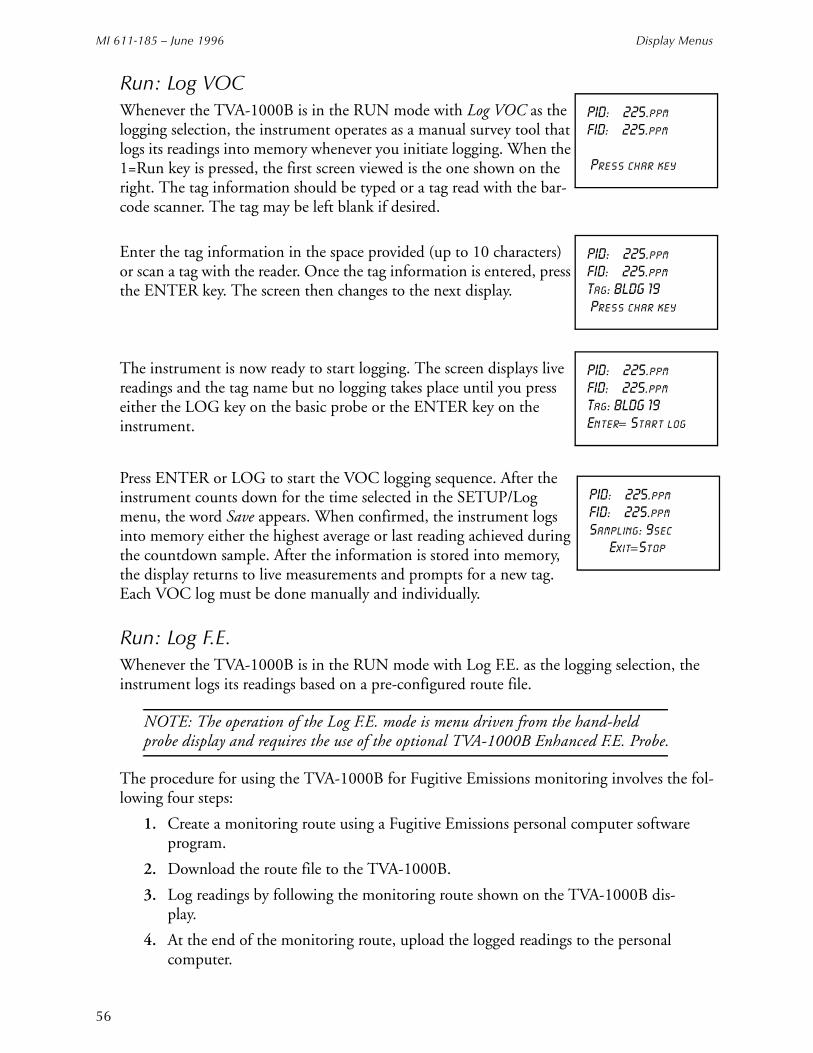
MI 611-185 – June 1996 Display Menus
56
Run: Log VOCWhenever the TVA-1000B is in the RUN mode with Log VOC as the logging selection, the instrument operates as a manual survey tool that logs its readings into memory whenever you initiate logging. When the 1=Run key is pressed, the first screen viewed is the one shown on the right. The tag information should be typed or a tag read with the bar-code scanner. The tag may be left blank if desired.
Enter the tag information in the space provided (up to 10 characters) or scan a tag with the reader. Once the tag information is entered, press the ENTER key. The screen then changes to the next display.
The instrument is now ready to start logging. The screen displays live readings and the tag name but no logging takes place until you press either the LOG key on the basic probe or the ENTER key on the instrument.
Press ENTER or LOG to start the VOC logging sequence. After the instrument counts down for the time selected in the SETUP/Log menu, the word Save appears. When confirmed, the instrument logs into memory either the highest average or last reading achieved during the countdown sample. After the information is stored into memory, the display returns to live measurements and prompts for a new tag. Each VOC log must be done manually and individually.
Run: Log F.E.Whenever the TVA-1000B is in the RUN mode with Log F.E. as the logging selection, the instrument logs its readings based on a pre-configured route file.
NOTE: The operation of the Log F.E. mode is menu driven from the hand-held probe display and requires the use of the optional TVA-1000B Enhanced F.E. Probe.
The procedure for using the TVA-1000B for Fugitive Emissions monitoring involves the fol-lowing four steps:
1. Create a monitoring route using a Fugitive Emissions personal computer software program.
2. Download the route file to the TVA-1000B.
3. Log readings by following the monitoring route shown on the TVA-1000B dis-play.
4. At the end of the monitoring route, upload the logged readings to the personal computer.
PID: 225.ppmFID: 225.ppm___ _ _ _ _ _ _ _ _ _ _ _ _ _ _ _ _ _ _ _ Press char key
PID: 225.ppmFID: 225.ppmTag: BLDG 19___ _ Press char key
PID: 225.ppmFID: 225.ppmTag: BLDG 19Enter= Start log
PID: 225.ppmFID: 225.ppmSampling: 9sec Exit=Stop
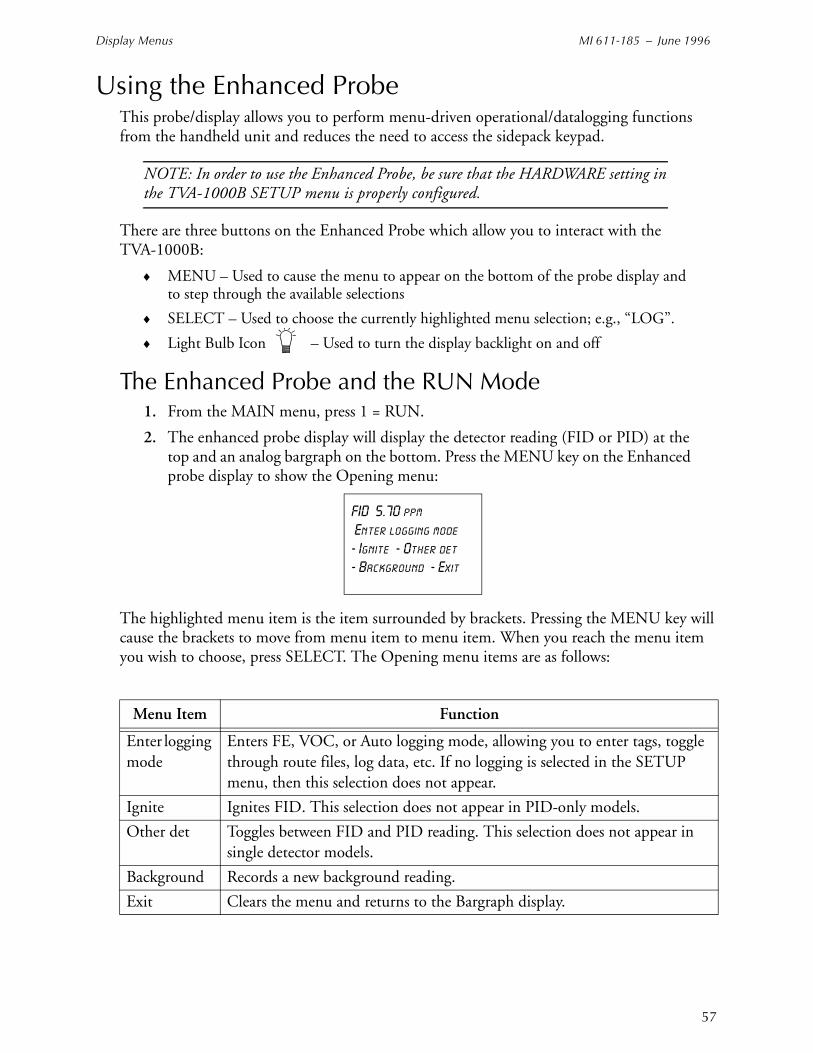
Display Menus MI 611-185 – June 1996
57
Using the Enhanced ProbeThis probe/display allows you to perform menu-driven operational/datalogging functions from the handheld unit and reduces the need to access the sidepack keypad.
NOTE: In order to use the Enhanced Probe, be sure that the HARDWARE setting in the TVA-1000B SETUP menu is properly configured.
There are three buttons on the Enhanced Probe which allow you to interact with the TVA-1000B:
♦ MENU – Used to cause the menu to appear on the bottom of the probe display and to step through the available selections
♦ SELECT – Used to choose the currently highlighted menu selection; e.g., “LOG”.
♦ Light Bulb Icon – Used to turn the display backlight on and off
The Enhanced Probe and the RUN Mode1. From the MAIN menu, press 1 = RUN.
2. The enhanced probe display will display the detector reading (FID or PID) at the top and an analog bargraph on the bottom. Press the MENU key on the Enhanced probe display to show the Opening menu:
The highlighted menu item is the item surrounded by brackets. Pressing the MENU key will cause the brackets to move from menu item to menu item. When you reach the menu item you wish to choose, press SELECT. The Opening menu items are as follows:
Menu Item Function
Enter logging mode
Enters FE, VOC, or Auto logging mode, allowing you to enter tags, toggle through route files, log data, etc. If no logging is selected in the SETUP menu, then this selection does not appear.
Ignite Ignites FID. This selection does not appear in PID-only models.
Other det Toggles between FID and PID reading. This selection does not appear in single detector models.
Background Records a new background reading.
Exit Clears the menu and returns to the Bargraph display.
FID 5.70 ppm[ Enter logging mode ]- Ignite - Other det- Background - Exit

MI 611-185 – June 1996 Display Menus
58
Auto Logging with the Enhanced Probe1. In the RUN mode, press the MENU key to cause the menu to appear. Select
“Enter logging mode.”
2. Use the sidepack or barcode reader to enter a tag, or simply select “Accept” to enter a blank tag.
3. Choose “Start log sampling” to begin Auto logging.
4. The Enhanced probe will display the countdown and continue to log until EXIT is selected at the probe or the sidepack keypad.
5. Once EXIT is selected, you may enter another tag and begin logging again or exit from the RUN mode.
VOC Logging with the Enhanced Probe1. In the RUN mode, press the MENU key to cause the menu to appear. Select
“Enter logging mode.”
2. Use the sidepack or barcode reader to enter a tag, or simply select “Accept” to enter a blank tag.
3. Choose “Start log sampling” to begin Auto logging.
4. The Enhanced probe will display the count down for the interval selected in the SETUP menu and freeze on the reading to be saved (either the Maximum, Aver-age, or Last Reading).
5. You may choose to save the reading (SAV), repeat the reading for the same tag (AGAIN), or return to the previous menu (EXIT).
6. Once you have saved a reading, you may enter another tag and begin logging again or exit from the RUN mode.
FE (Fugitive Emissions) Logging with the Enhanced ProbeIn FE logging, you follow a preconfigured route list consisting of component records for equipment to be monitored. You should first download a route to the TVA-1000B’s memory before entering the RUN mode. For more information on downloading routes, see the PCLink section of the “Display Menus” chapter.
In the RUN mode, press the MENU key to cause the menu to appear. Select “Enter logging mode.” The following display will appear on the Enhanced probe:
In addition to the concentration display at the top, the FE mode shows several fields which have been filled in by the downloaded route. The TVA-1000B starts at the first record in the
FID 5.70 ppm
Tag: 12345
Eqp: PMP Size: 2.500
Max: 1000
550 ppm LastLog
[Start log sampling]
- Next -Prev -Exit
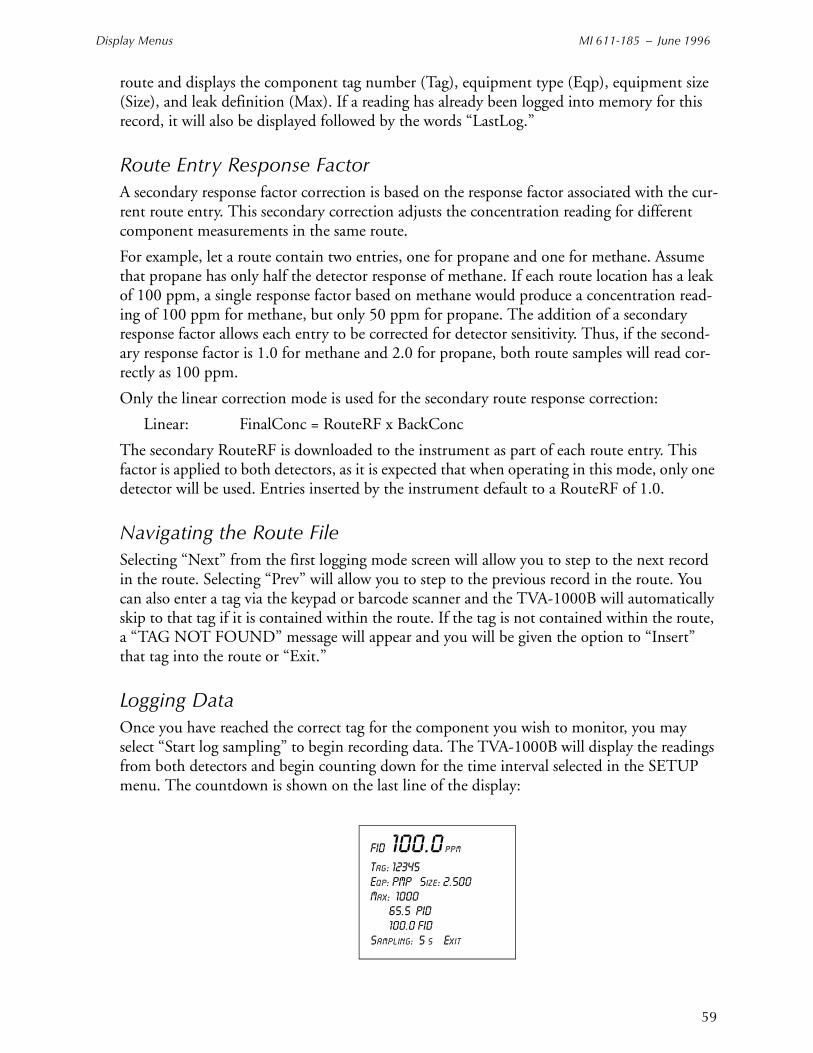
Display Menus MI 611-185 – June 1996
59
route and displays the component tag number (Tag), equipment type (Eqp), equipment size (Size), and leak definition (Max). If a reading has already been logged into memory for this record, it will also be displayed followed by the words “LastLog.”
Route Entry Response FactorA secondary response factor correction is based on the response factor associated with the cur-rent route entry. This secondary correction adjusts the concentration reading for different component measurements in the same route.
For example, let a route contain two entries, one for propane and one for methane. Assume that propane has only half the detector response of methane. If each route location has a leak of 100 ppm, a single response factor based on methane would produce a concentration read-ing of 100 ppm for methane, but only 50 ppm for propane. The addition of a secondary response factor allows each entry to be corrected for detector sensitivity. Thus, if the second-ary response factor is 1.0 for methane and 2.0 for propane, both route samples will read cor-rectly as 100 ppm.
Only the linear correction mode is used for the secondary route response correction:
Linear: FinalConc = RouteRF x BackConc
The secondary RouteRF is downloaded to the instrument as part of each route entry. This factor is applied to both detectors, as it is expected that when operating in this mode, only one detector will be used. Entries inserted by the instrument default to a RouteRF of 1.0.
Navigating the Route FileSelecting “Next” from the first logging mode screen will allow you to step to the next record in the route. Selecting “Prev” will allow you to step to the previous record in the route. You can also enter a tag via the keypad or barcode scanner and the TVA-1000B will automatically skip to that tag if it is contained within the route. If the tag is not contained within the route, a “TAG NOT FOUND” message will appear and you will be given the option to “Insert” that tag into the route or “Exit.”
Logging Data Once you have reached the correct tag for the component you wish to monitor, you may select “Start log sampling” to begin recording data. The TVA-1000B will display the readings from both detectors and begin counting down for the time interval selected in the SETUP menu. The countdown is shown on the last line of the display:
FID 100.0 ppm
Tag: 12345Eqp: PMP Size: 2.500Max: 1000 65.5 PID 100.0 FIDSampling: 5 s [Exit]
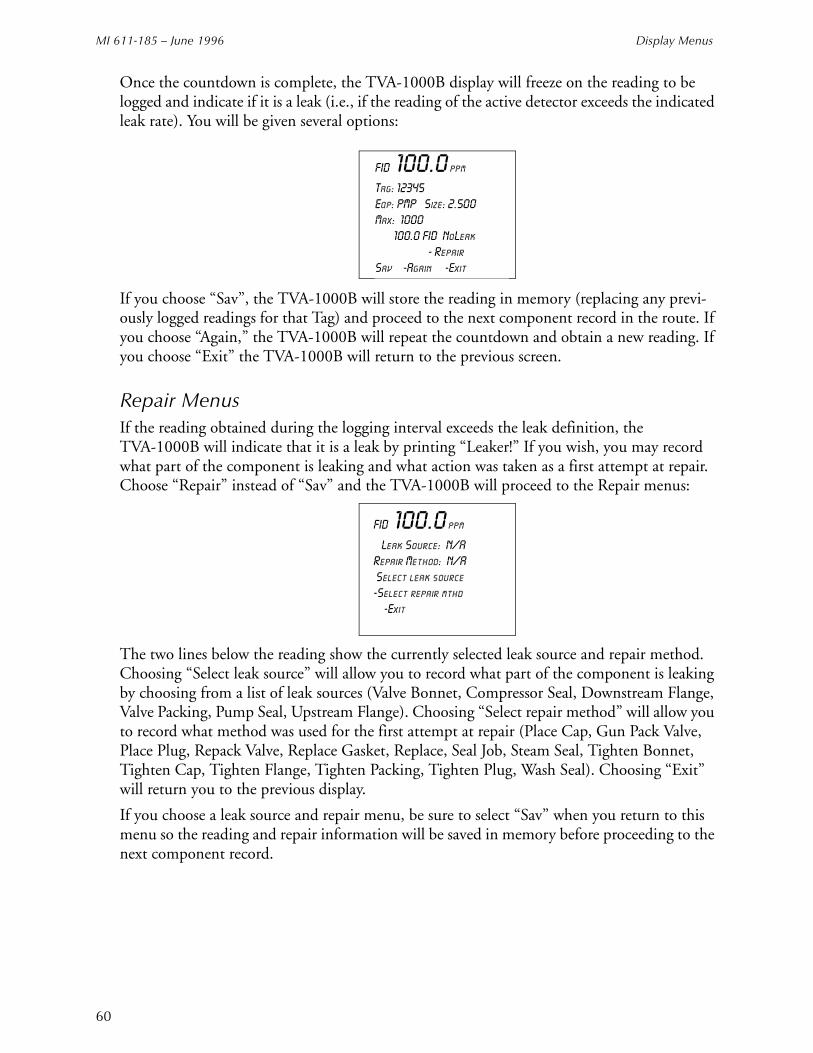
MI 611-185 – June 1996 Display Menus
60
Once the countdown is complete, the TVA-1000B display will freeze on the reading to be logged and indicate if it is a leak (i.e., if the reading of the active detector exceeds the indicated leak rate). You will be given several options:
If you choose “Sav”, the TVA-1000B will store the reading in memory (replacing any previ-ously logged readings for that Tag) and proceed to the next component record in the route. If you choose “Again,” the TVA-1000B will repeat the countdown and obtain a new reading. If you choose “Exit” the TVA-1000B will return to the previous screen.
Repair MenusIf the reading obtained during the logging interval exceeds the leak definition, the TVA-1000B will indicate that it is a leak by printing “Leaker!” If you wish, you may record what part of the component is leaking and what action was taken as a first attempt at repair. Choose “Repair” instead of “Sav” and the TVA-1000B will proceed to the Repair menus:
The two lines below the reading show the currently selected leak source and repair method. Choosing “Select leak source” will allow you to record what part of the component is leaking by choosing from a list of leak sources (Valve Bonnet, Compressor Seal, Downstream Flange, Valve Packing, Pump Seal, Upstream Flange). Choosing “Select repair method” will allow you to record what method was used for the first attempt at repair (Place Cap, Gun Pack Valve, Place Plug, Repack Valve, Replace Gasket, Replace, Seal Job, Steam Seal, Tighten Bonnet, Tighten Cap, Tighten Flange, Tighten Packing, Tighten Plug, Wash Seal). Choosing “Exit” will return you to the previous display.
If you choose a leak source and repair menu, be sure to select “Sav” when you return to this menu so the reading and repair information will be saved in memory before proceeding to the next component record.
FID 100.0 ppm
Tag: 12345
Eqp: PMP Size: 2.500
Max: 1000
100.0 FID NoLeak
- Repair
[Sav] -Again -Exit
FID 100.0 ppm
Leak Source: N/A
Repair Method: N/A
[Select leak source]
-Select repair mthd
-Exit

Display Menus MI 611-185 – June 1996
61
Additional Component InformationDisplays containing additional information about the component and the TVA-1000B status are available from the handheld unit. If you press and hold the MENU key for approximately 2 seconds, the Enhanced display will present an INFO page:
The INFO page overwrites the bottom four lines of the record with other fields such as Loca-tion (Loc) and Description (the two lines below the location). The Location field contains the Area and the Subarea where the component is located. The Description field displays up to 40 characters of additional information about the component. Selecting “Pg” at the bottom of the display will step you through other INFO pages containing information such as Run ID, Record number, number of points logged, number of leakers found, number of repairs per-formed, pump status, free memory, barcode reader status, etc. Selecting “Exit” will return you back to the normal component record.
FID 5.70 ppm
Tag: 12345
Eqp: PMP Size: 2.500
Loc: Plant1 Station2
Reagent feed pump down-
stream of vessel
17:33:51 [Pg] -Exit

MI 611-185 – June 1996 Display Menus
62
63
Maintenance
Removable, Renewable Parts
WARNING: Parts replacement and maintenance should not be performed in areas classified as hazardous due to presence of flammable gases or vapors. Opening of the analyzer is not recommended under any circumstances, due to the intrinsic safety rating of the analyzer. Violation of this policy could void the warranty of this product. (Extended Service Plans are available; contact Foxboro Authorized Service for further information.)
Foxboro suggests that you return the entire instrument to the factory or an authorized service center once a year for cleaning, testing, and calibration. Opening the TVA-1000B instrument case could void the warranty.
From time to time, you must remove and renew several components of the TVA-1000B ana-lyzer. Some components may be replaced as normal maintenance functions performed by operating personnel. Other components, however, should be replaced only by personnel thor-oughly trained and familiar with the analyzer instrument and its applications.
The components that may be maintained or replaced by operating personnel as part of nor-mal operation are:
1. Battery – you may charge the battery in or out of the instrument or replace it with a charged battery.
2. Hydrogen Tank – remove the tank to refill it.
3. PID Cartridge – remove and clean frequently. Replace when needed.
4. FID Cartridge – remove and clean frequently. Replace when needed.
5. Close Area Sampler – replace if probe tip is clogged or damaged.
6. Filter Cups (in the sampler assembly and sidepack assembly) – clean/replace fre-quently.
7. Optional Water Trap – replace membrane or membrane support if worn or dam-aged.
8. Optional Charcoal Filter Adapter – replace charcoal frequently.
9. Sample Line Tubing – replace when dirty.
10. Sample Line Fitting – replace if damaged.
11. FID End Cap and Flame Arrestor – remove and clean frequently. Replace when required.
12. FID Cavity – clean periodically.
13. PID cavity – clean periodically.
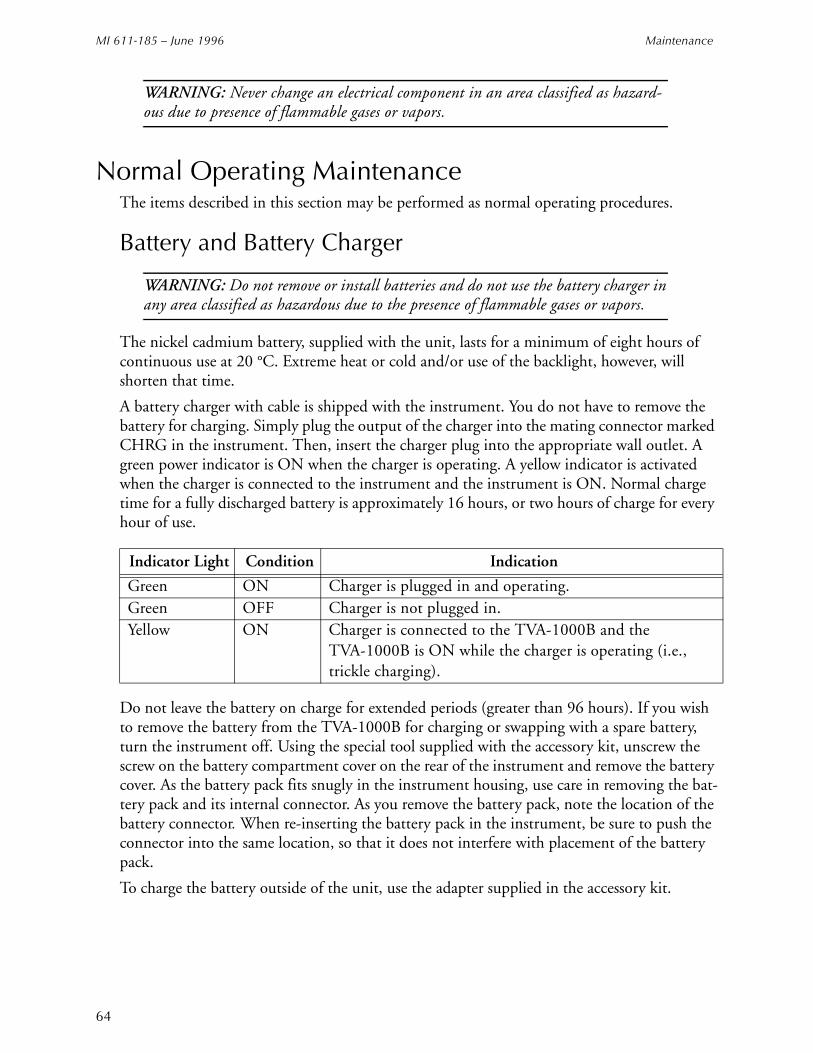
MI 611-185 – June 1996 Maintenance
64
WARNING: Never change an electrical component in an area classified as hazard-ous due to presence of flammable gases or vapors.
Normal Operating Maintenance The items described in this section may be performed as normal operating procedures.
Battery and Battery Charger
WARNING: Do not remove or install batteries and do not use the battery charger in any area classified as hazardous due to the presence of flammable gases or vapors.
The nickel cadmium battery, supplied with the unit, lasts for a minimum of eight hours of continuous use at 20 °C. Extreme heat or cold and/or use of the backlight, however, will shorten that time.
A battery charger with cable is shipped with the instrument. You do not have to remove the battery for charging. Simply plug the output of the charger into the mating connector marked CHRG in the instrument. Then, insert the charger plug into the appropriate wall outlet. A green power indicator is ON when the charger is operating. A yellow indicator is activated when the charger is connected to the instrument and the instrument is ON. Normal charge time for a fully discharged battery is approximately 16 hours, or two hours of charge for every hour of use.
Do not leave the battery on charge for extended periods (greater than 96 hours). If you wish to remove the battery from the TVA-1000B for charging or swapping with a spare battery, turn the instrument off. Using the special tool supplied with the accessory kit, unscrew the screw on the battery compartment cover on the rear of the instrument and remove the battery cover. As the battery pack fits snugly in the instrument housing, use care in removing the bat-tery pack and its internal connector. As you remove the battery pack, note the location of the battery connector. When re-inserting the battery pack in the instrument, be sure to push the connector into the same location, so that it does not interfere with placement of the battery pack.
To charge the battery outside of the unit, use the adapter supplied in the accessory kit.
Indicator Light Condition Indication
Green ON Charger is plugged in and operating.Green OFF Charger is not plugged in.Yellow ON Charger is connected to the TVA-1000B and the
TVA-1000B is ON while the charger is operating (i.e., trickle charging).
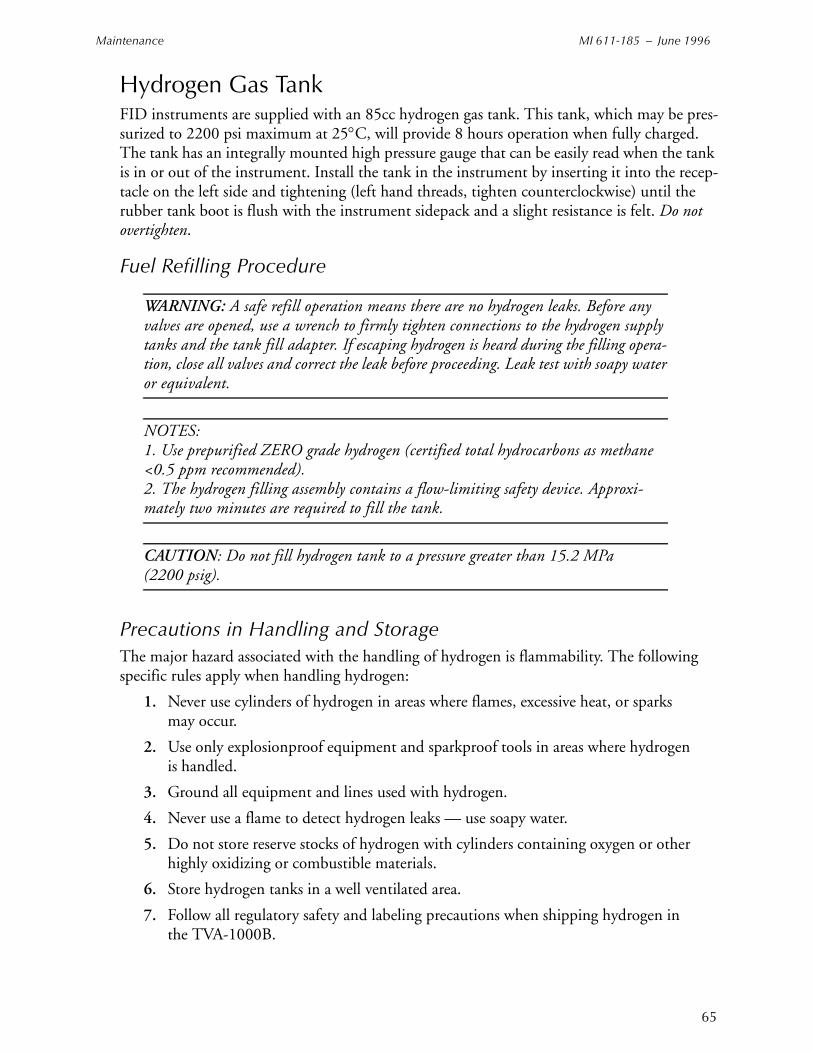
Maintenance MI 611-185 – June 1996
65
Hydrogen Gas TankFID instruments are supplied with an 85cc hydrogen gas tank. This tank, which may be pres-surized to 2200 psi maximum at 25°C, will provide 8 hours operation when fully charged. The tank has an integrally mounted high pressure gauge that can be easily read when the tank is in or out of the instrument. Install the tank in the instrument by inserting it into the recep-tacle on the left side and tightening (left hand threads, tighten counterclockwise) until the rubber tank boot is flush with the instrument sidepack and a slight resistance is felt. Do not overtighten.
Fuel Refilling Procedure
WARNING: A safe refill operation means there are no hydrogen leaks. Before any valves are opened, use a wrench to firmly tighten connections to the hydrogen supply tanks and the tank fill adapter. If escaping hydrogen is heard during the filling opera-tion, close all valves and correct the leak before proceeding. Leak test with soapy water or equivalent.
NOTES: 1. Use prepurified ZERO grade hydrogen (certified total hydrocarbons as methane <0.5 ppm recommended).2. The hydrogen filling assembly contains a flow-limiting safety device. Approxi-mately two minutes are required to fill the tank.
CAUTION: Do not fill hydrogen tank to a pressure greater than 15.2 MPa (2200 psig).
Precautions in Handling and StorageThe major hazard associated with the handling of hydrogen is flammability. The following specific rules apply when handling hydrogen:
1. Never use cylinders of hydrogen in areas where flames, excessive heat, or sparks may occur.
2. Use only explosionproof equipment and sparkproof tools in areas where hydrogen is handled.
3. Ground all equipment and lines used with hydrogen.
4. Never use a flame to detect hydrogen leaks — use soapy water.
5. Do not store reserve stocks of hydrogen with cylinders containing oxygen or other highly oxidizing or combustible materials.
6. Store hydrogen tanks in a well ventilated area.
7. Follow all regulatory safety and labeling precautions when shipping hydrogen in the TVA-1000B.
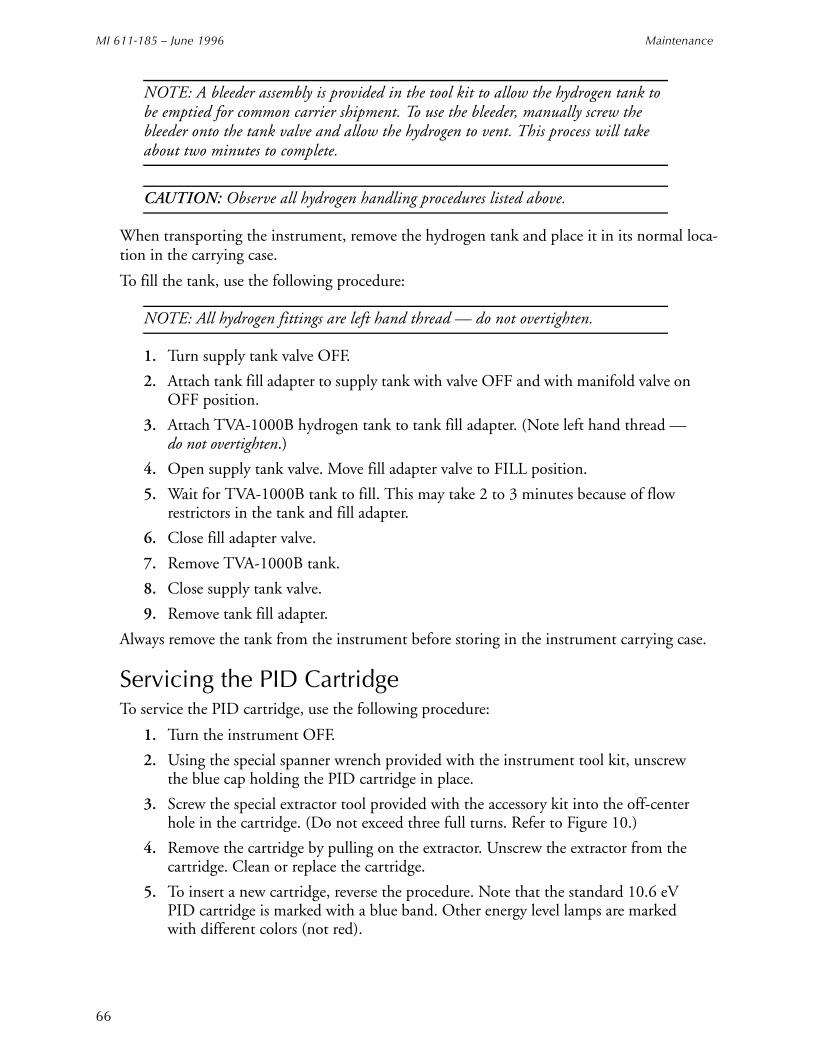
MI 611-185 – June 1996 Maintenance
66
NOTE: A bleeder assembly is provided in the tool kit to allow the hydrogen tank to be emptied for common carrier shipment. To use the bleeder, manually screw the bleeder onto the tank valve and allow the hydrogen to vent. This process will take about two minutes to complete.
CAUTION: Observe all hydrogen handling procedures listed above.
When transporting the instrument, remove the hydrogen tank and place it in its normal loca-tion in the carrying case.
To fill the tank, use the following procedure:
NOTE: All hydrogen fittings are left hand thread — do not overtighten.
1. Turn supply tank valve OFF.
2. Attach tank fill adapter to supply tank with valve OFF and with manifold valve on OFF position.
3. Attach TVA-1000B hydrogen tank to tank fill adapter. (Note left hand thread — do not overtighten.)
4. Open supply tank valve. Move fill adapter valve to FILL position.
5. Wait for TVA-1000B tank to fill. This may take 2 to 3 minutes because of flow restrictors in the tank and fill adapter.
6. Close fill adapter valve.
7. Remove TVA-1000B tank.
8. Close supply tank valve.
9. Remove tank fill adapter.
Always remove the tank from the instrument before storing in the instrument carrying case.
Servicing the PID Cartridge To service the PID cartridge, use the following procedure:
1. Turn the instrument OFF.
2. Using the special spanner wrench provided with the instrument tool kit, unscrew the blue cap holding the PID cartridge in place.
3. Screw the special extractor tool provided with the accessory kit into the off-center hole in the cartridge. (Do not exceed three full turns. Refer to Figure 10.)
4. Remove the cartridge by pulling on the extractor. Unscrew the extractor from the cartridge. Clean or replace the cartridge.
5. To insert a new cartridge, reverse the procedure. Note that the standard 10.6 eV PID cartridge is marked with a blue band. Other energy level lamps are marked with different colors (not red).
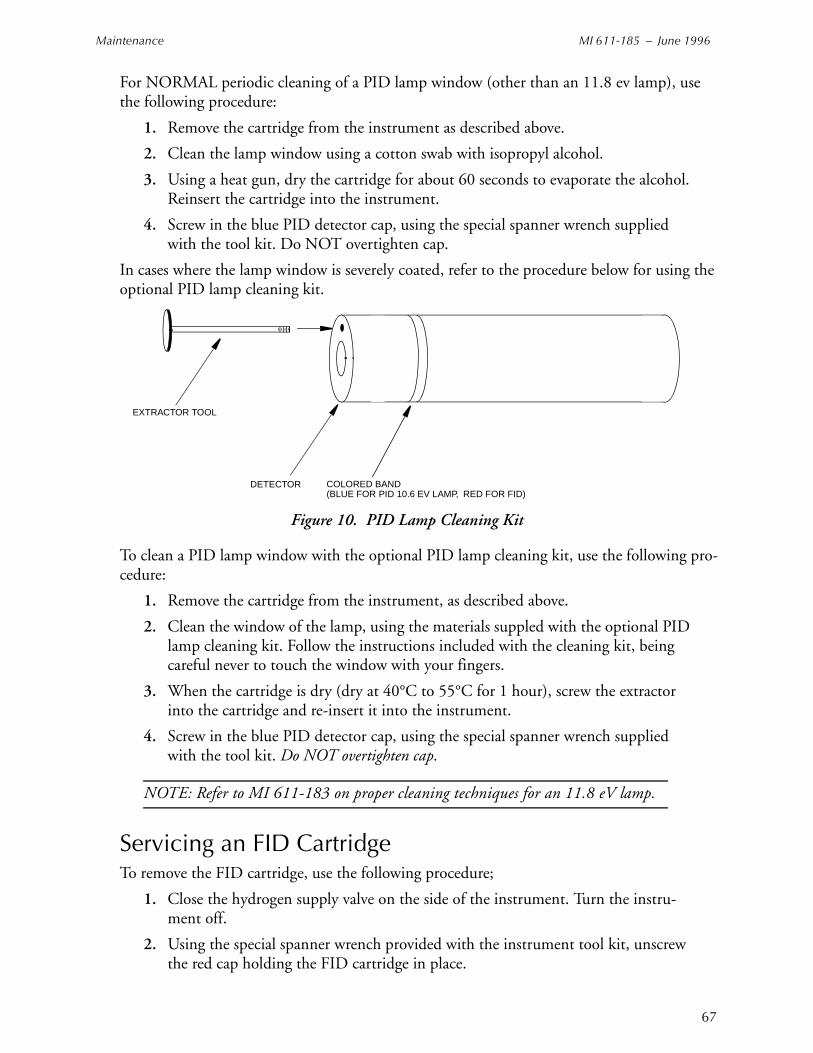
Maintenance MI 611-185 – June 1996
67
For NORMAL periodic cleaning of a PID lamp window (other than an 11.8 ev lamp), use the following procedure:
1. Remove the cartridge from the instrument as described above.
2. Clean the lamp window using a cotton swab with isopropyl alcohol.
3. Using a heat gun, dry the cartridge for about 60 seconds to evaporate the alcohol. Reinsert the cartridge into the instrument.
4. Screw in the blue PID detector cap, using the special spanner wrench supplied with the tool kit. Do NOT overtighten cap.
In cases where the lamp window is severely coated, refer to the procedure below for using the optional PID lamp cleaning kit.
Figure 10. PID Lamp Cleaning Kit
To clean a PID lamp window with the optional PID lamp cleaning kit, use the following pro-cedure:
1. Remove the cartridge from the instrument, as described above.
2. Clean the window of the lamp, using the materials suppled with the optional PID lamp cleaning kit. Follow the instructions included with the cleaning kit, being careful never to touch the window with your fingers.
3. When the cartridge is dry (dry at 40°C to 55°C for 1 hour), screw the extractor into the cartridge and re-insert it into the instrument.
4. Screw in the blue PID detector cap, using the special spanner wrench supplied with the tool kit. Do NOT overtighten cap.
NOTE: Refer to MI 611-183 on proper cleaning techniques for an 11.8 eV lamp.
Servicing an FID CartridgeTo remove the FID cartridge, use the following procedure;
1. Close the hydrogen supply valve on the side of the instrument. Turn the instru-ment off.
2. Using the special spanner wrench provided with the instrument tool kit, unscrew the red cap holding the FID cartridge in place.
EXTRACTOR TOOL
DETECTOR COLORED BANDRED FOR FID)(BLUE FOR PID 10.6 EV LAMP,
MI 611-185 – June 1996 Maintenance
68
3. Screw the special extractor tool provided with the accessory kit into the off-center hole in the cartridge (see Figure 10).
4. Remove the cartridge by pulling on the extractor. Unscrew the extractor from the cartridge. Clean or replace the cartridge.
5. To insert a new cartridge, reverse the procedure. Note that a FID cartridge is marked with a red band.
To clean an FID cartridge, you will need a cotton swab and some isopropyl alcohol. Dip the swab into the isopropyl alcohol and insert it into the center of the cartridge. Swab the surface until clean and discard the swab. Take care not to touch the igniter coil, which is located close to the end of the capsule opposite the threaded hole used to remove capsule. Then dry the car-tridge in an oven at 45°C to 55°C for one hour. When dry, re-insert the cartridge into the instrument, reversing the removal procedure. Do NOT overtighten cap.
CAUTION: Do not allow any contact with the igniter coil during cleaning.
Cleaning the FID Detector CapTo clean the FID detector end cap, use the following procedure:
1. Close the hydrogen supply valve on the side of the instrument and turn off the power.
2. Using the special spanner wrench provided with the tool kit, unscrew and remove the FID red detector cap.
3. Clean the cap using the isopropyl alcohol followed with a deionized or distilled water rinse. Blow out carefully with compressed dry air.
4. Replace the cap.
Replacing the Flame ArrestorThe flame arrestor, located in the center of the red FID end cap, can be either cleaned or replaced. To replace the flame arrestor, use the following procedure:
1. Close the hydrogen supply valve on the side of the instrument and turn off the power.
2. Using the special spanner wrench provided with the tool kit, unscrew and remove the FID red detector cap.
3. Remove spring.
4. Place the detector cap on a flat surface, face up.
5. Place a screwdriver through the center hole of the end cap, resting on the flame arrestor.
6. Strike the end of the screwdriver with a hammer to drive the old flame arrestor out of the end cap.
7. Remove the old flame arrestor.
Maintenance MI 611-185 – June 1996
69
8. Turn the end cap over so the red outer surface lies flat and the gray surface faces up.
9. Place the new flame arrestor in the center hole.
10. Place a screwdriver on the newly installed flame arrestor.
11. Strike the end of the screwdriver with a hammer to secure the new flame arrestor in place.
12. Replace the spring.
13. Replace the detector cap on the unit.
Cleaning the FID or PID Detector Cavities1. Close the hydrogen supply valve on the side of the instrument. Turn the instru-
ment off.
2. Using the special spanner wrench provided with the tool kit, unscrew the cap holding the respective detector cap.
3. Using the special extractor tool provided with the tool kit, screw the extractor into the cartridge.
4. Remove the cartridge by pulling on the extractor. Unscrew the extractor from the cartridge.
5. Carefully clean the inside of the detector cavity using a cotton swab and isopropyl alcohol. Be sure to clean the high voltage contacts along the side of the cavity. Be especially careful around the detector signal collector probe at the rear of the cavity (and the thermocouple probe in the FID).
6. Dry the inside of the cavity using a low heat gun.
7. Insert the cartridges into their respective cavities by reversing the procedure. Note that the cartridges must be rotated to properly locate the key tabs.
CAUTION: Do not intermix the detector cartridges.
Cleaning or Replacing a Sintered Metal FilterTo remove the sintered metal filter cup from the close area sampling assembly, simply unscrew the cap from the sampler and tip the assembly so that the filter falls out. The same filter cup and spring are also located behind the sample line quick connect at the sidepack assembly. To remove, unscrew the quick connect so that the filter falls out. The internal spring will not fall out. Refer to the assembly diagram below.
You may clean the filter by immersing it in isopropyl alcohol or equivalent solvent and/or swabbing the surface with a Q-tip or cotton swab. After thoroughly cleaning the surface of the filter, place the filter in an oven and dry it at 40 °C to 55 °C for one hour. You can then re-insert the filter into the sampling assembly (with the closed end of the filter in first) and screw in the cap.
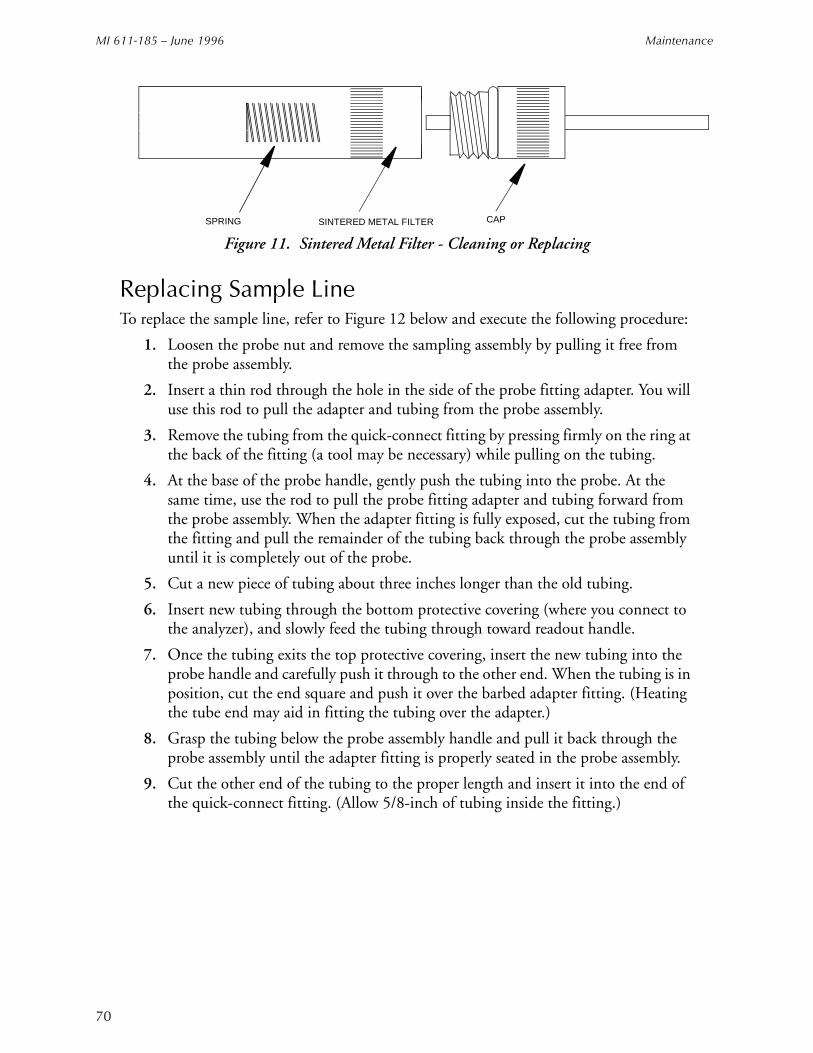
MI 611-185 – June 1996 Maintenance
70
Figure 11. Sintered Metal Filter - Cleaning or Replacing
Replacing Sample LineTo replace the sample line, refer to Figure 12 below and execute the following procedure:
1. Loosen the probe nut and remove the sampling assembly by pulling it free from the probe assembly.
2. Insert a thin rod through the hole in the side of the probe fitting adapter. You will use this rod to pull the adapter and tubing from the probe assembly.
3. Remove the tubing from the quick-connect fitting by pressing firmly on the ring at the back of the fitting (a tool may be necessary) while pulling on the tubing.
4. At the base of the probe handle, gently push the tubing into the probe. At the same time, use the rod to pull the probe fitting adapter and tubing forward from the probe assembly. When the adapter fitting is fully exposed, cut the tubing from the fitting and pull the remainder of the tubing back through the probe assembly until it is completely out of the probe.
5. Cut a new piece of tubing about three inches longer than the old tubing.
6. Insert new tubing through the bottom protective covering (where you connect to the analyzer), and slowly feed the tubing through toward readout handle.
7. Once the tubing exits the top protective covering, insert the new tubing into the probe handle and carefully push it through to the other end. When the tubing is in position, cut the end square and push it over the barbed adapter fitting. (Heating the tube end may aid in fitting the tubing over the adapter.)
8. Grasp the tubing below the probe assembly handle and pull it back through the probe assembly until the adapter fitting is properly seated in the probe assembly.
9. Cut the other end of the tubing to the proper length and insert it into the end of the quick-connect fitting. (Allow 5/8-inch of tubing inside the fitting.)
SPRING SINTERED METAL FILTER CAP
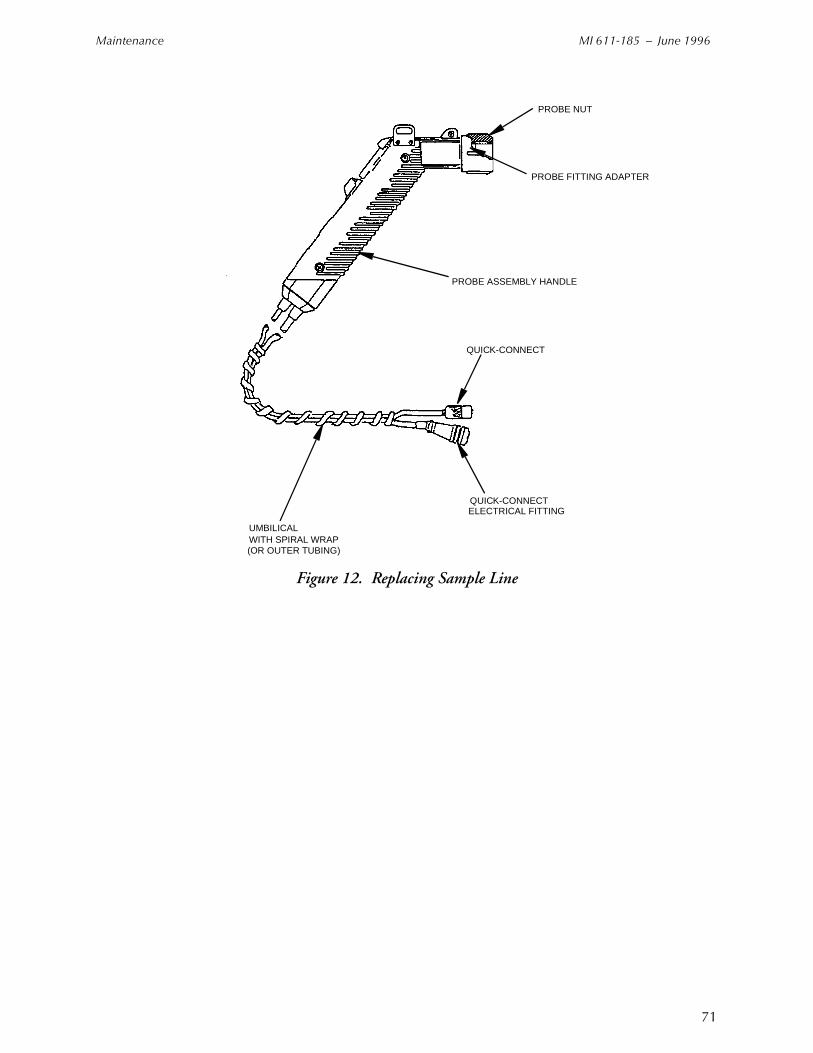
Maintenance MI 611-185 – June 1996
71
Figure 12. Replacing Sample Line
PROBE NUT
UMBILICALWITH SPIRAL WRAP
PROBE ASSEMBLY HANDLE
QUICK-CONNECT
QUICK-CONNECT ELECTRICAL FITTING
PROBE FITTING ADAPTER
(OR OUTER TUBING)

MI 611-185 – June 1996 Maintenance
72

73
Troubleshooting
Problem Possible Reason Solution/Action
Unit will not turn on Battery charge low
Bad battery connection
Bad battery
Blown fuse or faulty keypad
Charge battery.
Ensure proper battery connection.
Replace battery.
Contact TEI authorized service center.Pump won’t turn on Defective pump
Faulty keypadContact TEI authorized service center.
Low pump flow Clogged sample intake
Pump fault
Clean/replace filter cups.Clean/replace sample line.Clean/replace flame arrestor.
Contact TEI authorized service center.Keypad will not respond
Faulty keypad Contact TEI authorized service center.
Probe display blank or probe buttons will not respond
Faulty probe/display assembly Replace probe/display assembly.Contact TEI authorized service center.
FID won’t ignite Insufficient sample flow
Hydrogen valve off
Insufficient hydrogen supply (<500 psi)
Hydrogen leak
Broken igniter
Dirty igniter contacts
Battery charge low
Turn pump on.Clean/replace filter cups.Clean/replace flame arrestor.
Turn on hydrogen supply valve and allow 1-2 minutes before igniting.
Check hydrogen gauge on supply tank. Refill tank if necessary.
Check low pressure hydrogen output gauge. If <10.5 psi, contact TEI authorized service cen-ter.
Inspect igniter coil on FID capsule for break-age. If broken, replace capsule.
Inspect/clean igniter contacts (NOT igniter coils).
Charge battery pack.
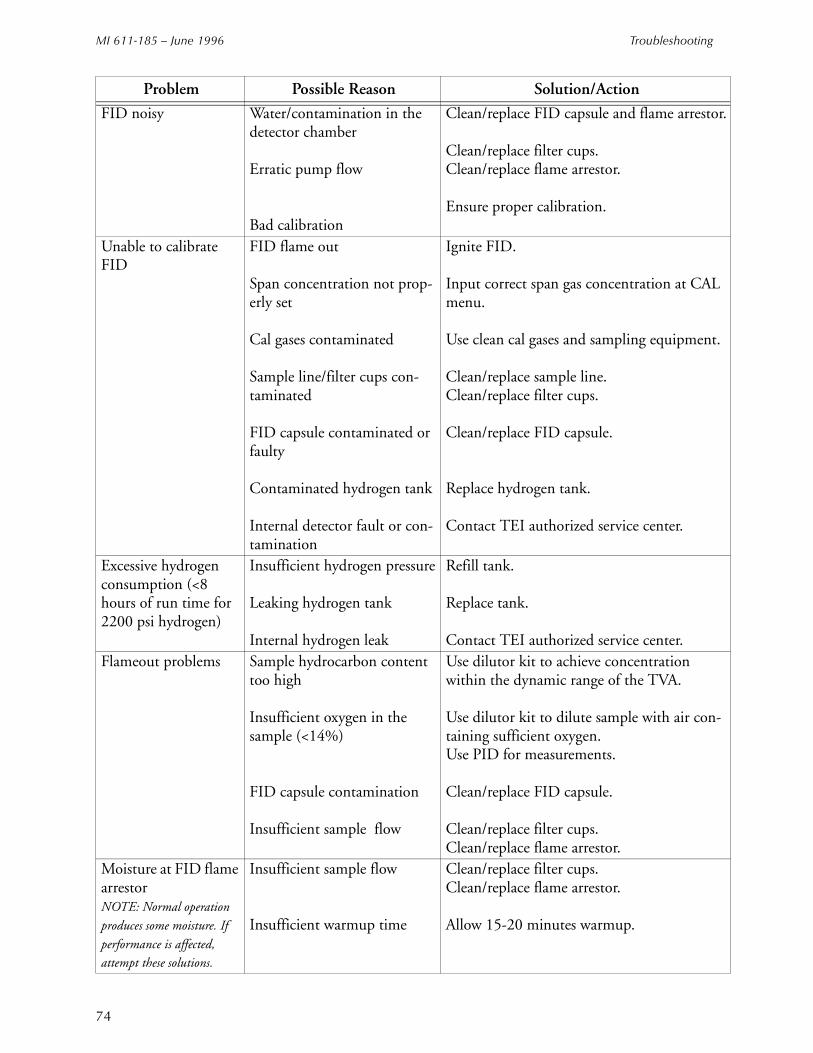
MI 611-185 – June 1996 Troubleshooting
74
FID noisy Water/contamination in the detector chamber
Erratic pump flow
Bad calibration
Clean/replace FID capsule and flame arrestor.
Clean/replace filter cups.Clean/replace flame arrestor.
Ensure proper calibration.
Unable to calibrate FID
FID flame out
Span concentration not prop-erly set
Cal gases contaminated
Sample line/filter cups con-taminated
FID capsule contaminated or faulty
Contaminated hydrogen tank
Internal detector fault or con-tamination
Ignite FID.
Input correct span gas concentration at CAL menu.
Use clean cal gases and sampling equipment.
Clean/replace sample line.Clean/replace filter cups.
Clean/replace FID capsule.
Replace hydrogen tank.
Contact TEI authorized service center.
Excessive hydrogen consumption (<8 hours of run time for 2200 psi hydrogen)
Insufficient hydrogen pressure
Leaking hydrogen tank
Internal hydrogen leak
Refill tank.
Replace tank.
Contact TEI authorized service center.Flameout problems Sample hydrocarbon content
too high
Insufficient oxygen in the sample (<14%)
FID capsule contamination
Insufficient sample flow
Use dilutor kit to achieve concentration within the dynamic range of the TVA.
Use dilutor kit to dilute sample with air con-taining sufficient oxygen.Use PID for measurements.
Clean/replace FID capsule.
Clean/replace filter cups.Clean/replace flame arrestor.
Moisture at FID flame arrestorNOTE: Normal operation produces some moisture. If performance is affected, attempt these solutions.
Insufficient sample flow
Insufficient warmup time
Clean/replace filter cups.Clean/replace flame arrestor.
Allow 15-20 minutes warmup.
Problem Possible Reason Solution/Action
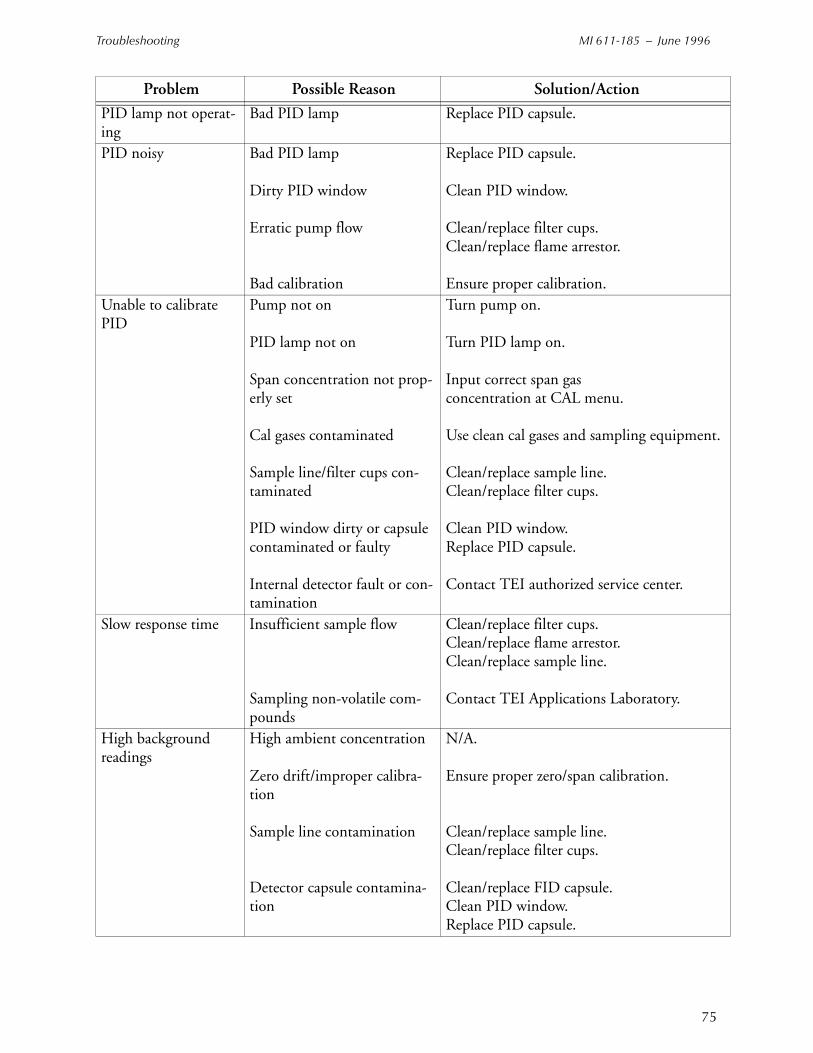
Troubleshooting MI 611-185 – June 1996
75
PID lamp not operat-ing
Bad PID lamp Replace PID capsule.
PID noisy Bad PID lamp
Dirty PID window
Erratic pump flow
Bad calibration
Replace PID capsule.
Clean PID window.
Clean/replace filter cups.Clean/replace flame arrestor.
Ensure proper calibration.Unable to calibrate PID
Pump not on
PID lamp not on
Span concentration not prop-erly set
Cal gases contaminated
Sample line/filter cups con-taminated
PID window dirty or capsule contaminated or faulty
Internal detector fault or con-tamination
Turn pump on.
Turn PID lamp on.
Input correct span gasconcentration at CAL menu.
Use clean cal gases and sampling equipment.
Clean/replace sample line.Clean/replace filter cups.
Clean PID window.Replace PID capsule.
Contact TEI authorized service center.
Slow response time Insufficient sample flow
Sampling non-volatile com-pounds
Clean/replace filter cups.Clean/replace flame arrestor.Clean/replace sample line.
Contact TEI Applications Laboratory.
High background readings
High ambient concentration
Zero drift/improper calibra-tion
Sample line contamination
Detector capsule contamina-tion
N/A.
Ensure proper zero/span calibration.
Clean/replace sample line.Clean/replace filter cups.
Clean/replace FID capsule.Clean PID window.Replace PID capsule.
Problem Possible Reason Solution/Action
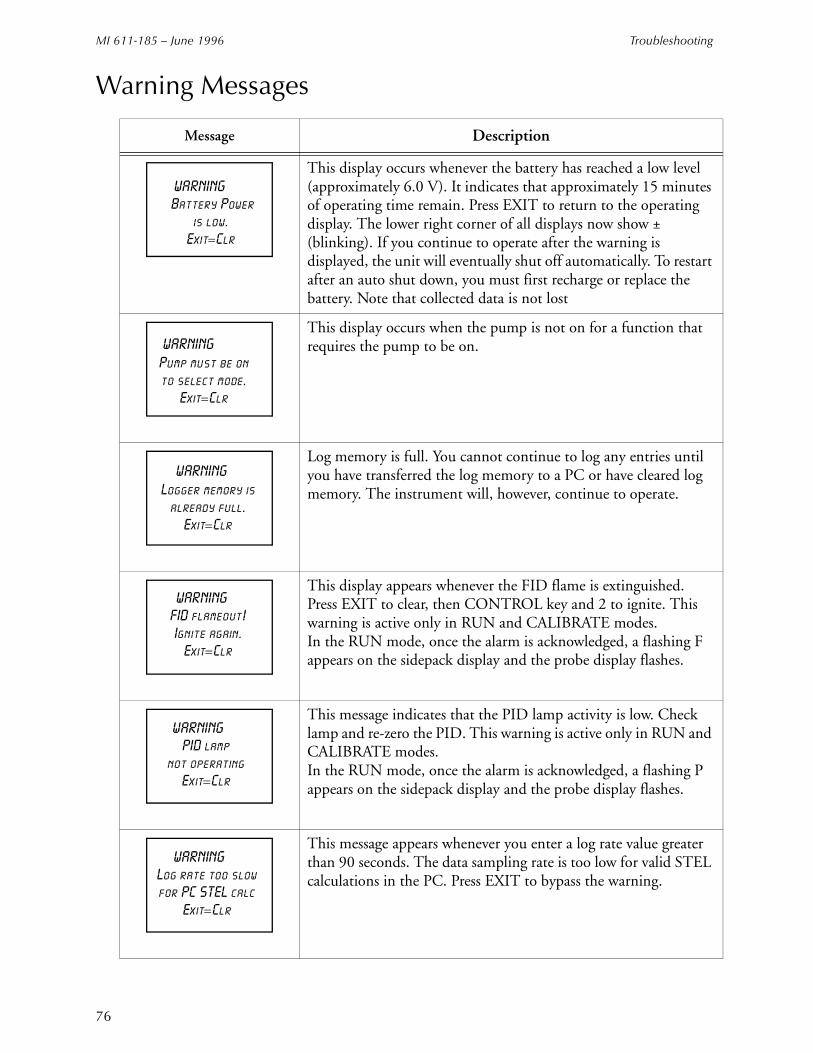
MI 611-185 – June 1996 Troubleshooting
76
Warning Messages
Message Description
This display occurs whenever the battery has reached a low level (approximately 6.0 V). It indicates that approximately 15 minutes of operating time remain. Press EXIT to return to the operating display. The lower right corner of all displays now show ± (blinking). If you continue to operate after the warning is displayed, the unit will eventually shut off automatically. To restart after an auto shut down, you must first recharge or replace the battery. Note that collected data is not lost
This display occurs when the pump is not on for a function that requires the pump to be on.
Log memory is full. You cannot continue to log any entries until you have transferred the log memory to a PC or have cleared log memory. The instrument will, however, continue to operate.
This display appears whenever the FID flame is extinguished. Press EXIT to clear, then CONTROL key and 2 to ignite. This warning is active only in RUN and CALIBRATE modes.In the RUN mode, once the alarm is acknowledged, a flashing F appears on the sidepack display and the probe display flashes.
This message indicates that the PID lamp activity is low. Check lamp and re-zero the PID. This warning is active only in RUN and CALIBRATE modes.In the RUN mode, once the alarm is acknowledged, a flashing P appears on the sidepack display and the probe display flashes.
This message appears whenever you enter a log rate value greater than 90 seconds. The data sampling rate is too low for valid STEL calculations in the PC. Press EXIT to bypass the warning.
=WARNING=== = = = = = = = = = = = Battery Power
is low.Exit=Clr
=== = = = =WARNING===Pump must be onto select mode.
Exit=Clr
=== =
=WARNING===Logger memory is
already full.Exit=Clr
=WARNING===FID flameout!Ignite again.
Exit=Clr
==WARNING===PID lamp
not operatingExit=Clr
==WARNING===Log rate too slowfor PC STEL calc
Exit=Clr

Troubleshooting MI 611-185 – June 1996
77
This message appears whenever you enter a log rate of zero. To correct the problem, enter a log rate other than zero.
This message appears whenever you enter a value equal to zero (except for alarm levels). To correct the problem, enter numbers other than zero.
This warning display appears during calibration if the current zero calibration value equals or exceeds the span calibration value. To correct the problem, perform a re-zero, a re-span, or both.
This message appears as a result of a self-test failure. Return the instrument to the factory for service.
The PID has been turned OFF. To continue, use the Control Menu to turn the PID on.
Message Description
= =WARNING===Log rateinvalid!
Exit=Clr
WARNING===Entry isinvalid!
Exit=Clr
WARNING===Bad Calibration
parameters! Exit=Clr
===Hardware Failure
WARNING===PID lamp must beON to continue
Exit=Clr

MI 611-185 – June 1996 Troubleshooting
78
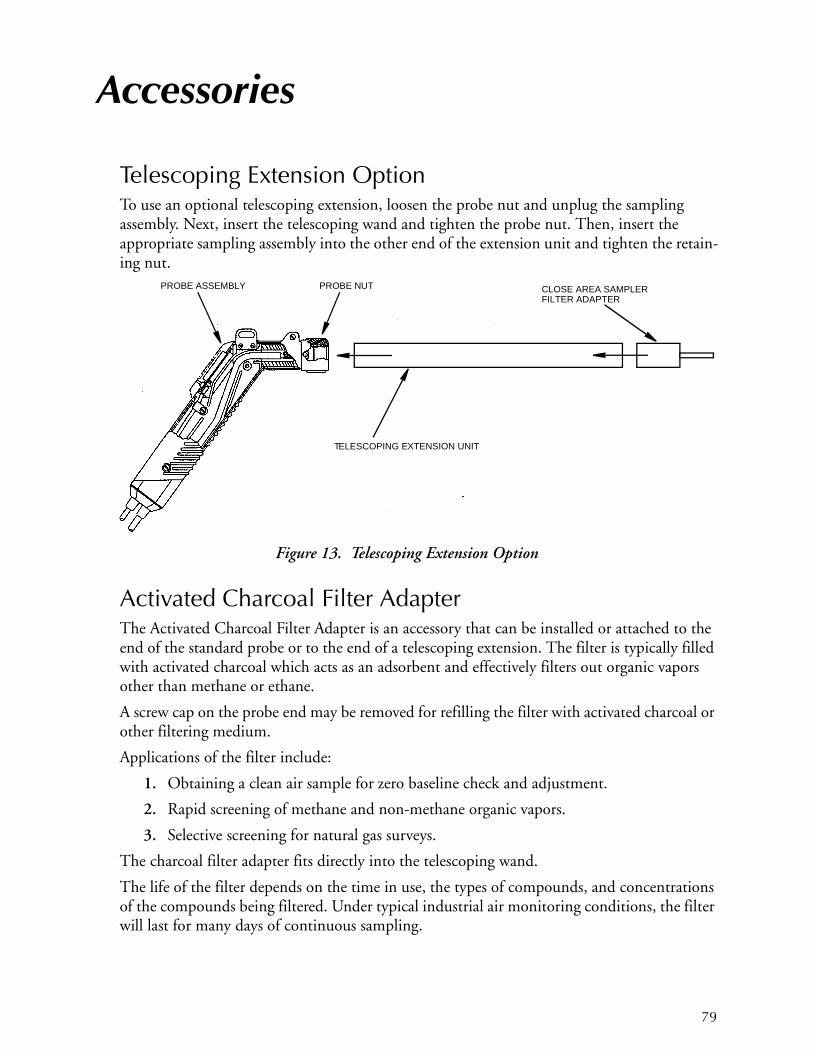
79
Accessories
Telescoping Extension OptionTo use an optional telescoping extension, loosen the probe nut and unplug the sampling assembly. Next, insert the telescoping wand and tighten the probe nut. Then, insert the appropriate sampling assembly into the other end of the extension unit and tighten the retain-ing nut.
Figure 13. Telescoping Extension Option
Activated Charcoal Filter AdapterThe Activated Charcoal Filter Adapter is an accessory that can be installed or attached to the end of the standard probe or to the end of a telescoping extension. The filter is typically filled with activated charcoal which acts as an adsorbent and effectively filters out organic vapors other than methane or ethane.
A screw cap on the probe end may be removed for refilling the filter with activated charcoal or other filtering medium.
Applications of the filter include:
1. Obtaining a clean air sample for zero baseline check and adjustment.
2. Rapid screening of methane and non-methane organic vapors.
3. Selective screening for natural gas surveys.
The charcoal filter adapter fits directly into the telescoping wand.
The life of the filter depends on the time in use, the types of compounds, and concentrations of the compounds being filtered. Under typical industrial air monitoring conditions, the filter will last for many days of continuous sampling.
TELESCOPING EXTENSION UNIT
CLOSE AREA SAMPLERFILTER ADAPTER
PROBE ASSEMBLY PROBE NUT
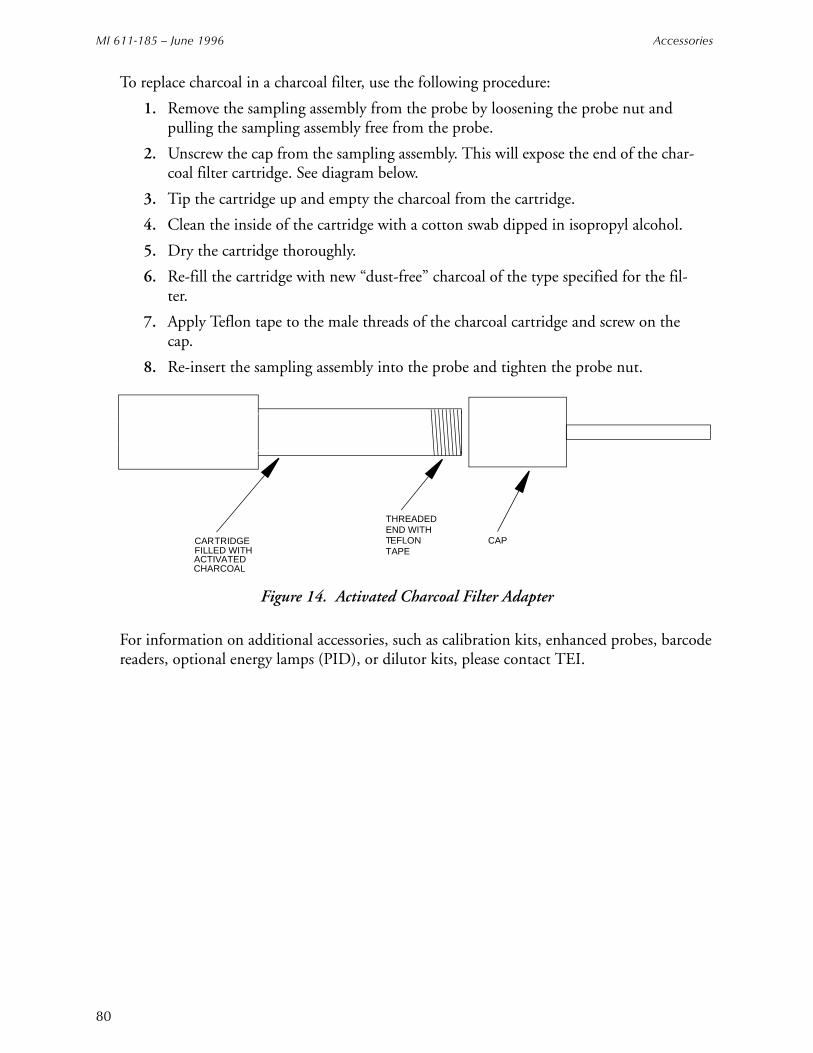
MI 611-185 – June 1996 Accessories
80
To replace charcoal in a charcoal filter, use the following procedure:
1. Remove the sampling assembly from the probe by loosening the probe nut and pulling the sampling assembly free from the probe.
2. Unscrew the cap from the sampling assembly. This will expose the end of the char-coal filter cartridge. See diagram below.
3. Tip the cartridge up and empty the charcoal from the cartridge.
4. Clean the inside of the cartridge with a cotton swab dipped in isopropyl alcohol.
5. Dry the cartridge thoroughly.
6. Re-fill the cartridge with new “dust-free” charcoal of the type specified for the fil-ter.
7. Apply Teflon tape to the male threads of the charcoal cartridge and screw on the cap.
8. Re-insert the sampling assembly into the probe and tighten the probe nut.
Figure 14. Activated Charcoal Filter Adapter
For information on additional accessories, such as calibration kits, enhanced probes, barcode readers, optional energy lamps (PID), or dilutor kits, please contact TEI.
THREADEDEND WITHTEFLONTAPE
CARTRIDGEFILLED WITHACTIVATEDCHARCOAL
CAP
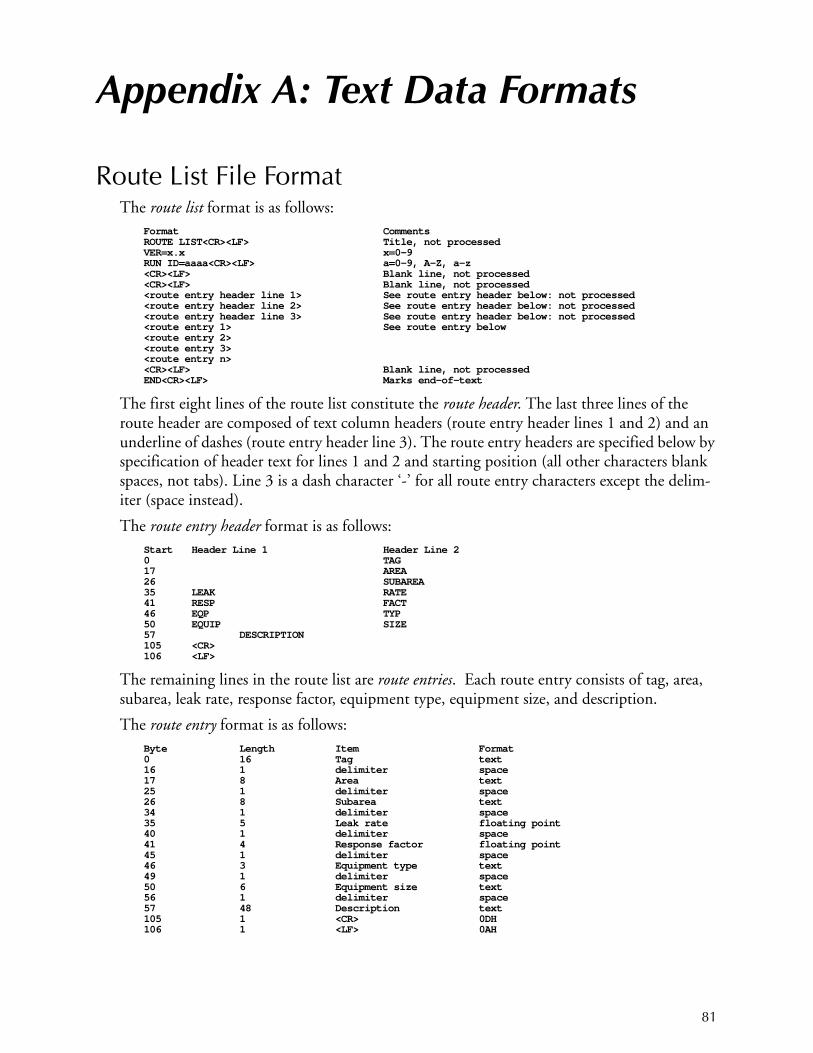
81
Appendix A: Text Data Formats
Route List File FormatThe route list format is as follows:
Format CommentsROUTE LIST<CR><LF> Title, not processedVER=x.x x=0-9RUN ID=aaaa<CR><LF> a=0-9, A-Z, a-z<CR><LF> Blank line, not processed<CR><LF> Blank line, not processed<route entry header line 1> See route entry header below: not processed<route entry header line 2> See route entry header below: not processed<route entry header line 3> See route entry header below: not processed<route entry 1> See route entry below<route entry 2><route entry 3><route entry n><CR><LF> Blank line, not processedEND<CR><LF> Marks end-of-text
The first eight lines of the route list constitute the route header. The last three lines of the route header are composed of text column headers (route entry header lines 1 and 2) and an underline of dashes (route entry header line 3). The route entry headers are specified below by specification of header text for lines 1 and 2 and starting position (all other characters blank spaces, not tabs). Line 3 is a dash character ‘-’ for all route entry characters except the delim-iter (space instead).
The route entry header format is as follows:Start Header Line 1 Header Line 20 TAG17 AREA26 SUBAREA35 LEAK RATE41 RESP FACT46 EQP TYP50 EQUIP SIZE57 DESCRIPTION105 <CR>106 <LF>
The remaining lines in the route list are route entries. Each route entry consists of tag, area, subarea, leak rate, response factor, equipment type, equipment size, and description.
The route entry format is as follows:Byte Length Item Format0 16 Tag text16 1 delimiter space17 8 Area text25 1 delimiter space26 8 Subarea text34 1 delimiter space35 5 Leak rate floating point40 1 delimiter space41 4 Response factor floating point45 1 delimiter space46 3 Equipment type text49 1 delimiter space50 6 Equipment size text56 1 delimiter space57 48 Description text105 1 <CR> 0DH106 1 <LF> 0AH
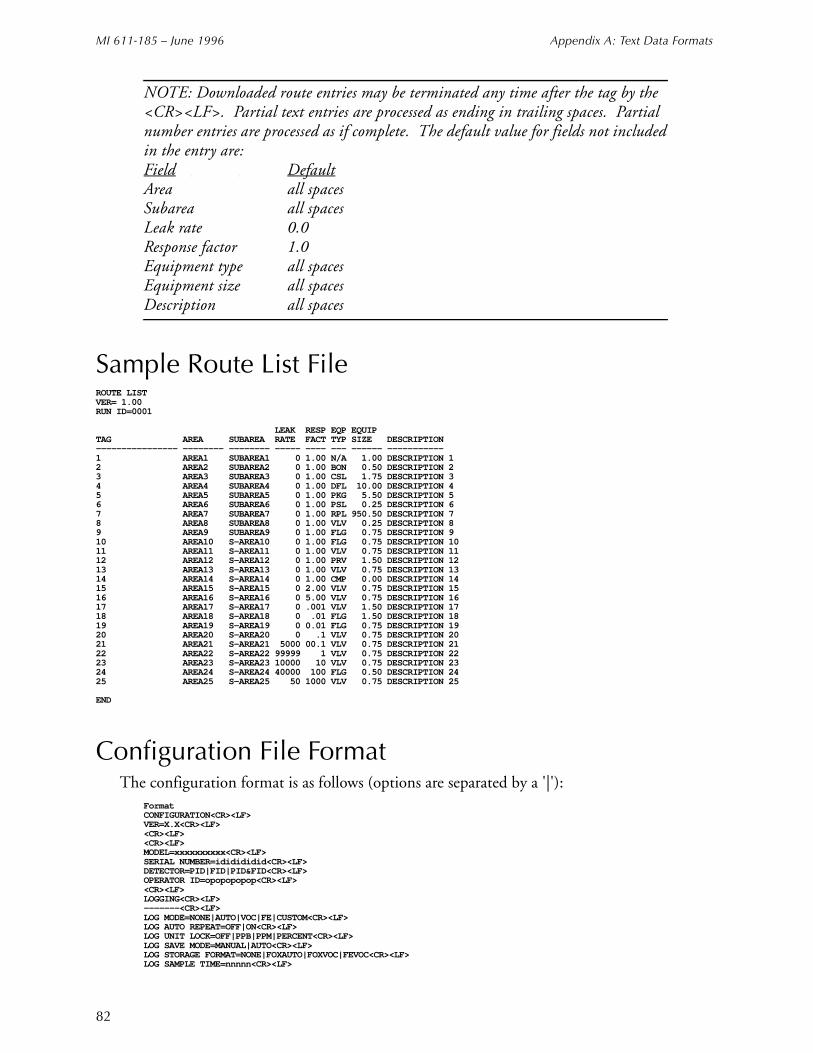
MI 611-185 – June 1996 Appendix A: Text Data Formats
82
NOTE: Downloaded route entries may be terminated any time after the tag by the <CR><LF>. Partial text entries are processed as ending in trailing spaces. Partial number entries are processed as if complete. The default value for fields not included in the entry are:Field DefaultArea all spacesSubarea all spacesLeak rate 0.0Response factor 1.0Equipment type all spacesEquipment size all spacesDescription all spaces
Sample Route List FileROUTE LISTVER= 1.00RUN ID=0001
LEAK RESP EQP EQUIPTAG AREA SUBAREA RATE FACT TYP SIZE DESCRIPTION---------------- -------- -------- ----- ---- --- ------ -----------1 AREA1 SUBAREA1 0 1.00 N/A 1.00 DESCRIPTION 1 2 AREA2 SUBAREA2 0 1.00 BON 0.50 DESCRIPTION 2 3 AREA3 SUBAREA3 0 1.00 CSL 1.75 DESCRIPTION 3 4 AREA4 SUBAREA4 0 1.00 DFL 10.00 DESCRIPTION 4 5 AREA5 SUBAREA5 0 1.00 PKG 5.50 DESCRIPTION 5 6 AREA6 SUBAREA6 0 1.00 PSL 0.25 DESCRIPTION 6 7 AREA7 SUBAREA7 0 1.00 RPL 950.50 DESCRIPTION 7 8 AREA8 SUBAREA8 0 1.00 VLV 0.25 DESCRIPTION 8 9 AREA9 SUBAREA9 0 1.00 FLG 0.75 DESCRIPTION 9 10 AREA10 S-AREA10 0 1.00 FLG 0.75 DESCRIPTION 10 11 AREA11 S-AREA11 0 1.00 VLV 0.75 DESCRIPTION 11 12 AREA12 S-AREA12 0 1.00 PRV 1.50 DESCRIPTION 12 13 AREA13 S-AREA13 0 1.00 VLV 0.75 DESCRIPTION 13 14 AREA14 S-AREA14 0 1.00 CMP 0.00 DESCRIPTION 14 15 AREA15 S-AREA15 0 2.00 VLV 0.75 DESCRIPTION 15 16 AREA16 S-AREA16 0 5.00 VLV 0.75 DESCRIPTION 16 17 AREA17 S-AREA17 0 .001 VLV 1.50 DESCRIPTION 17 18 AREA18 S-AREA18 0 .01 FLG 1.50 DESCRIPTION 18 19 AREA19 S-AREA19 0 0.01 FLG 0.75 DESCRIPTION 19 20 AREA20 S-AREA20 0 .1 VLV 0.75 DESCRIPTION 20 21 AREA21 S-AREA21 5000 00.1 VLV 0.75 DESCRIPTION 21 22 AREA22 S-AREA22 99999 1 VLV 0.75 DESCRIPTION 22 23 AREA23 S-AREA23 10000 10 VLV 0.75 DESCRIPTION 23 24 AREA24 S-AREA24 40000 100 FLG 0.50 DESCRIPTION 24 25 AREA25 S-AREA25 50 1000 VLV 0.75 DESCRIPTION 25
END
Configuration File FormatThe configuration format is as follows (options are separated by a '|'):
FormatCONFIGURATION<CR><LF>VER=X.X<CR><LF><CR><LF><CR><LF>MODEL=xxxxxxxxxx<CR><LF>SERIAL NUMBER=ididididid<CR><LF>DETECTOR=PID|FID|PID&FID<CR><LF>OPERATOR ID=opopopopop<CR><LF><CR><LF>LOGGING<CR><LF>-------<CR><LF>LOG MODE=NONE|AUTO|VOC|FE|CUSTOM<CR><LF>LOG AUTO REPEAT=OFF|ON<CR><LF>LOG UNIT LOCK=OFF|PPB|PPM|PERCENT<CR><LF>LOG SAVE MODE=MANUAL|AUTO<CR><LF>LOG STORAGE FORMAT=NONE|FOXAUTO|FOXVOC|FEVOC<CR><LF>LOG SAMPLE TIME=nnnnn<CR><LF>
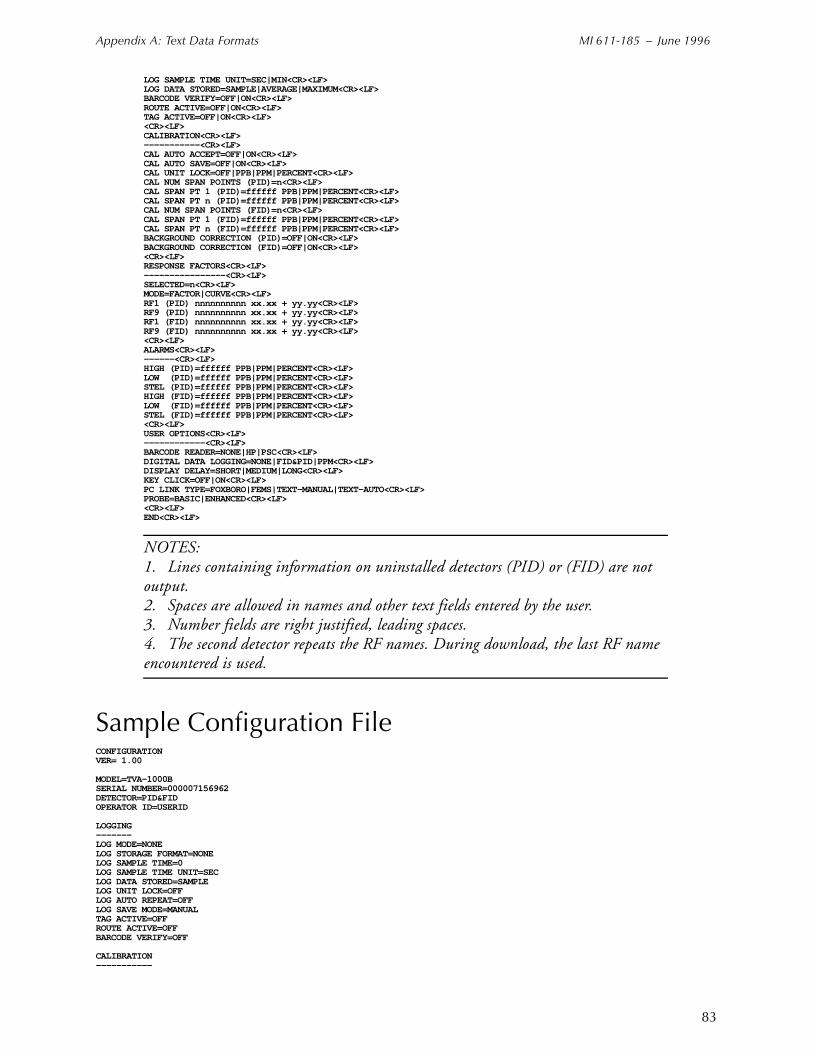
Appendix A: Text Data Formats MI 611-185 – June 1996
83
LOG SAMPLE TIME UNIT=SEC|MIN<CR><LF>LOG DATA STORED=SAMPLE|AVERAGE|MAXIMUM<CR><LF>BARCODE VERIFY=OFF|ON<CR><LF>ROUTE ACTIVE=OFF|ON<CR><LF>TAG ACTIVE=OFF|ON<CR><LF><CR><LF>CALIBRATION<CR><LF>-----------<CR><LF>CAL AUTO ACCEPT=OFF|ON<CR><LF>CAL AUTO SAVE=OFF|ON<CR><LF>CAL UNIT LOCK=OFF|PPB|PPM|PERCENT<CR><LF>CAL NUM SPAN POINTS (PID)=n<CR><LF>CAL SPAN PT 1 (PID)=ffffff PPB|PPM|PERCENT<CR><LF>CAL SPAN PT n (PID)=ffffff PPB|PPM|PERCENT<CR><LF>CAL NUM SPAN POINTS (FID)=n<CR><LF>CAL SPAN PT 1 (FID)=ffffff PPB|PPM|PERCENT<CR><LF>CAL SPAN PT n (FID)=ffffff PPB|PPM|PERCENT<CR><LF>BACKGROUND CORRECTION (PID)=OFF|ON<CR><LF>BACKGROUND CORRECTION (FID)=OFF|ON<CR><LF><CR><LF>RESPONSE FACTORS<CR><LF>----------------<CR><LF>SELECTED=n<CR><LF>MODE=FACTOR|CURVE<CR><LF>RF1 (PID) nnnnnnnnnn xx.xx + yy.yy<CR><LF>RF9 (PID) nnnnnnnnnn xx.xx + yy.yy<CR><LF>RF1 (FID) nnnnnnnnnn xx.xx + yy.yy<CR><LF>RF9 (FID) nnnnnnnnnn xx.xx + yy.yy<CR><LF><CR><LF>ALARMS<CR><LF>------<CR><LF>HIGH (PID)=ffffff PPB|PPM|PERCENT<CR><LF>LOW (PID)=ffffff PPB|PPM|PERCENT<CR><LF>STEL (PID)=ffffff PPB|PPM|PERCENT<CR><LF>HIGH (FID)=ffffff PPB|PPM|PERCENT<CR><LF>LOW (FID)=ffffff PPB|PPM|PERCENT<CR><LF>STEL (FID)=ffffff PPB|PPM|PERCENT<CR><LF><CR><LF>USER OPTIONS<CR><LF>------------<CR><LF>BARCODE READER=NONE|HP|PSC<CR><LF>DIGITAL DATA LOGGING=NONE|FID&PID|PPM<CR><LF>DISPLAY DELAY=SHORT|MEDIUM|LONG<CR><LF>KEY CLICK=OFF|ON<CR><LF>PC LINK TYPE=FOXBORO|FEMS|TEXT-MANUAL|TEXT-AUTO<CR><LF>PROBE=BASIC|ENHANCED<CR><LF><CR><LF>END<CR><LF>
NOTES: 1. Lines containing information on uninstalled detectors (PID) or (FID) are not output.2. Spaces are allowed in names and other text fields entered by the user.3. Number fields are right justified, leading spaces.4. The second detector repeats the RF names. During download, the last RF name encountered is used.
Sample Configuration FileCONFIGURATIONVER= 1.00
MODEL=TVA-1000BSERIAL NUMBER=000007156962DETECTOR=PID&FIDOPERATOR ID=USERID
LOGGING-------LOG MODE=NONELOG STORAGE FORMAT=NONELOG SAMPLE TIME=0LOG SAMPLE TIME UNIT=SECLOG DATA STORED=SAMPLELOG UNIT LOCK=OFFLOG AUTO REPEAT=OFFLOG SAVE MODE=MANUALTAG ACTIVE=OFFROUTE ACTIVE=OFFBARCODE VERIFY=OFF
CALIBRATION-----------
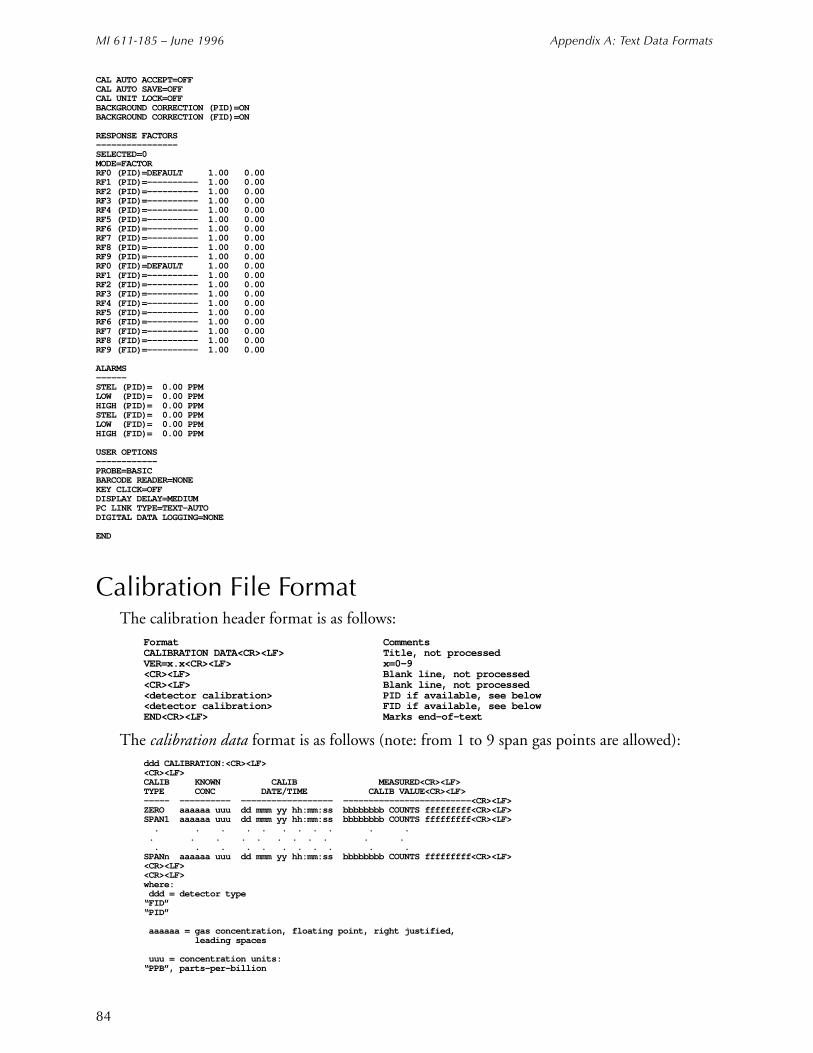
MI 611-185 – June 1996 Appendix A: Text Data Formats
84
CAL AUTO ACCEPT=OFFCAL AUTO SAVE=OFFCAL UNIT LOCK=OFFBACKGROUND CORRECTION (PID)=ONBACKGROUND CORRECTION (FID)=ON
RESPONSE FACTORS----------------SELECTED=0MODE=FACTORRF0 (PID)=DEFAULT 1.00 0.00RF1 (PID)=---------- 1.00 0.00RF2 (PID)=---------- 1.00 0.00RF3 (PID)=---------- 1.00 0.00RF4 (PID)=---------- 1.00 0.00RF5 (PID)=---------- 1.00 0.00RF6 (PID)=---------- 1.00 0.00RF7 (PID)=---------- 1.00 0.00RF8 (PID)=---------- 1.00 0.00RF9 (PID)=---------- 1.00 0.00RF0 (FID)=DEFAULT 1.00 0.00RF1 (FID)=---------- 1.00 0.00RF2 (FID)=---------- 1.00 0.00RF3 (FID)=---------- 1.00 0.00RF4 (FID)=---------- 1.00 0.00RF5 (FID)=---------- 1.00 0.00RF6 (FID)=---------- 1.00 0.00RF7 (FID)=---------- 1.00 0.00RF8 (FID)=---------- 1.00 0.00RF9 (FID)=---------- 1.00 0.00
ALARMS------STEL (PID)= 0.00 PPMLOW (PID)= 0.00 PPMHIGH (PID)= 0.00 PPMSTEL (FID)= 0.00 PPMLOW (FID)= 0.00 PPMHIGH (FID)= 0.00 PPM
USER OPTIONS------------PROBE=BASICBARCODE READER=NONEKEY CLICK=OFFDISPLAY DELAY=MEDIUMPC LINK TYPE=TEXT-AUTODIGITAL DATA LOGGING=NONE
END
Calibration File FormatThe calibration header format is as follows:
Format CommentsCALIBRATION DATA<CR><LF> Title, not processedVER=x.x<CR><LF> x=0-9<CR><LF> Blank line, not processed<CR><LF> Blank line, not processed<detector calibration> PID if available, see below<detector calibration> FID if available, see belowEND<CR><LF> Marks end-of-text
The calibration data format is as follows (note: from 1 to 9 span gas points are allowed):ddd CALIBRATION:<CR><LF><CR><LF>CALIB KNOWN CALIB MEASURED<CR><LF>TYPE CONC DATE/TIME CALIB VALUE<CR><LF>----- ---------- ------------------ -------------------------<CR><LF>ZERO aaaaaa uuu dd mmm yy hh:mm:ss bbbbbbbb COUNTS fffffffff<CR><LF>SPAN1 aaaaaa uuu dd mmm yy hh:mm:ss bbbbbbbb COUNTS fffffffff<CR><LF> . . . . . . . . . . .
. . . . . . . . . . . . . . . . . . . . . .SPANn aaaaaa uuu dd mmm yy hh:mm:ss bbbbbbbb COUNTS fffffffff<CR><LF><CR><LF><CR><LF>where: ddd = detector type“FID”“PID”
aaaaaa = gas concentration, floating point, right justified, leading spaces
uuu = concentration units:“PPB”, parts-per-billion
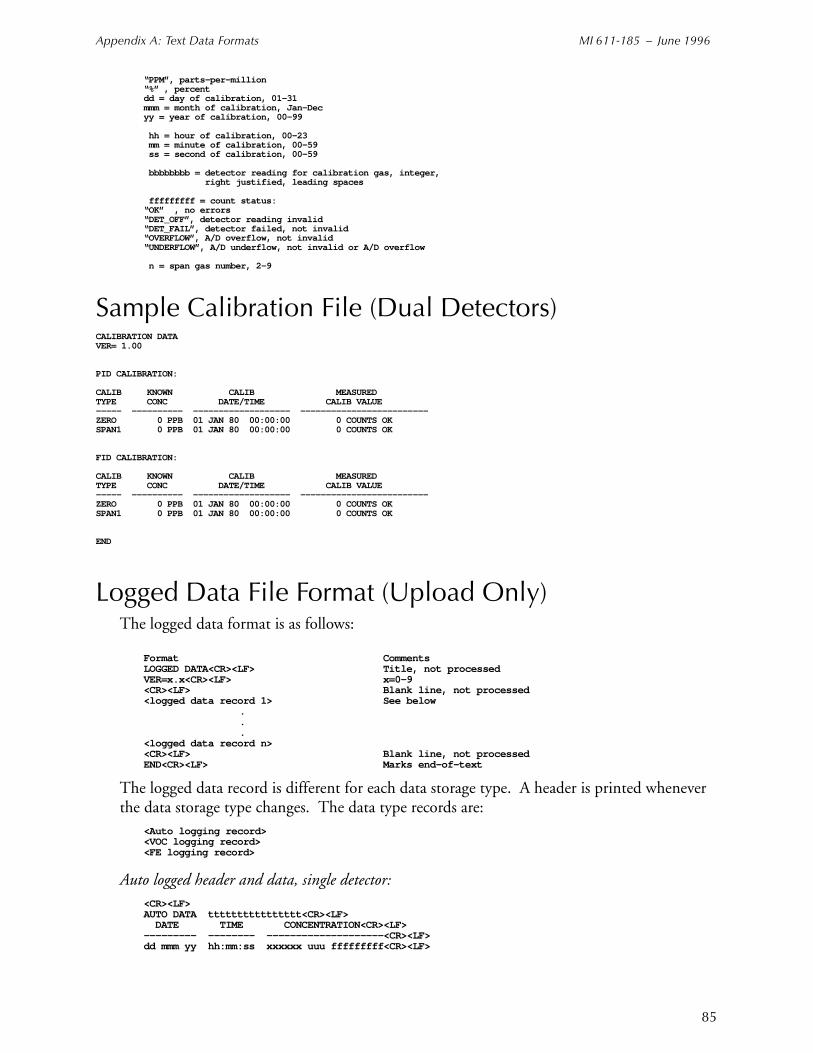
Appendix A: Text Data Formats MI 611-185 – June 1996
85
“PPM”, parts-per-million“%” , percentdd = day of calibration, 01-31mmm = month of calibration, Jan-Decyy = year of calibration, 00-99
hh = hour of calibration, 00-23 mm = minute of calibration, 00-59 ss = second of calibration, 00-59
bbbbbbbb = detector reading for calibration gas, integer, right justified, leading spaces
fffffffff = count status:“OK” , no errors“DET_OFF”, detector reading invalid“DET_FAIL”, detector failed, not invalid“OVERFLOW”, A/D overflow, not invalid“UNDERFLOW”, A/D underflow, not invalid or A/D overflow
n = span gas number, 2-9
Sample Calibration File (Dual Detectors)CALIBRATION DATAVER= 1.00
PID CALIBRATION:
CALIB KNOWN CALIB MEASUREDTYPE CONC DATE/TIME CALIB VALUE----- ---------- ------------------- -------------------------ZERO 0 PPB 01 JAN 80 00:00:00 0 COUNTS OK SPAN1 0 PPB 01 JAN 80 00:00:00 0 COUNTS OK
FID CALIBRATION:
CALIB KNOWN CALIB MEASUREDTYPE CONC DATE/TIME CALIB VALUE----- ---------- ------------------- -------------------------ZERO 0 PPB 01 JAN 80 00:00:00 0 COUNTS OK SPAN1 0 PPB 01 JAN 80 00:00:00 0 COUNTS OK
END
Logged Data File Format (Upload Only)The logged data format is as follows:
Format CommentsLOGGED DATA<CR><LF> Title, not processedVER=x.x<CR><LF> x=0-9<CR><LF> Blank line, not processed<logged data record 1> See below
.
.
.<logged data record n><CR><LF> Blank line, not processedEND<CR><LF> Marks end-of-text
The logged data record is different for each data storage type. A header is printed whenever the data storage type changes. The data type records are:
<Auto logging record><VOC logging record><FE logging record>
Auto logged header and data, single detector:<CR><LF>AUTO DATA tttttttttttttttt<CR><LF> DATE TIME CONCENTRATION<CR><LF>--------- -------- --------------------<CR><LF>dd mmm yy hh:mm:ss xxxxxx uuu fffffffff<CR><LF>

MI 611-185 – June 1996 Appendix A: Text Data Formats
86
Auto logged header, dual detector:<CR><LF>AUTO DATA tttttttttttttttt<CR><LF> DATE TIME PID CONCENTRATION FID CONCENTRATION<CR><LF>--------- -------- -------------------- --------------------<CR><LF>dd mmm yy hh:mm:ss xxxxxx uuu fffffffff xxxxxx uuu fffffffff<CR><LF>
VOC logged header and data, single detector:<CR><LF>VOC DATA<CR><LF> DATE TIME TAG CONCENTRATION<CR><LF>--------- -------- ---------------- --------------------<CR><LF>dd mmm yy hh:mm:ss tttttttttttttttt xxxxxx uuu fffffffff<CR><LF>
VOC logged header and data, dual detector:<CR><LF>VOC DATA<CR><LF> DATE TIME TAG PID CONCENTRATION FID CONCENTRATION<CR><LF>--------- -------- ---------------- -------------------- --------------------<CR><LF>dd mmm yy hh:mm:ss tttttttttttttttt xxxxxx uuu fffffffff xxxxxx uuu ffffffff<CR><LF>
FE logged header and data:<CR><LF>FE DATA LEAK REPAIR<CR><LF> DATE TIME TAG DET CONCENTRATION BACKGROUND SOURCE METHOD<CR><LF>--------- -------- ---------------- --- -------------------- -------------------- ------ --
---- <CR><LF>dd mmm yy hh:mm:ss tttttttttttttttt ddd xxxxxx uuu fffffffff xxxxxx uuu fffffffff LLL
RRRRR<CR><LF>where: ttt... = tag
xxxxxx = concentration, floating point, right justified, leading spaces
uuu = concentration unit:“PPB”“PPM”“% ”
fffffffff = data status:“OK”, no errors or alarms“DET_OFF”, detector not valid“DET_FAIL”, detector failed, not “INVALID”“OVERFLOW ”, A/D overflow, not “DET_FAIL”“UNDERFLOW”, A/D underflow, not “OVERFLOW”“HIGH_ALRM”, high alarm, no STEL, not “UNDERFLOW”“LOW_ALARM”, low alarm, no high alarm or STEL, not “UNDERFLOW”“STEL_ALRM”, STEL alarm, no low or high alarm, not “UNDERFLOW”“HIGH&STEL”, high alarm and STEL, not “UNDERFLOW”“LOW&STEL ”, low alarm and STEL, no high alarm, not “UNDERFLOW”
ddd = detector:“PID”“FID”
Sample Logged Data File (FE format)LOGGED DATAVER= 1.00
FE DATA LEAK REPAIR DATE TIME TAG DET BACKGROUND CONCENTRATION LEAK SOURCE METHOD--------- -------- ---------------- --- -------------------- -------------------- ------- ------ ------18 APR 96 08:53:42 1 PID 0.00 PPM OK 67675 PPM OK LEAKER! N/A N/A
FE DATA LEAK REPAIR DATE TIME TAG DET BACKGROUND CONCENTRATION LEAK SOURCE METHOD--------- -------- ---------------- --- -------------------- -------------------- ------- ------ ------18 APR 96 09:15:28 19 PID 1208 PPM OK 1056 PPM OK LEAKER! N/A N/A
FE DATA LEAK REPAIR DATE TIME TAG DET BACKGROUND CONCENTRATION LEAK SOURCE METHOD--------- -------- ---------------- --- -------------------- -------------------- ------- ------ ------18 APR 96 17:26:20 3 FID 0.00 PPM OK 6.33 PPM OK LEAKER! N/A N/A
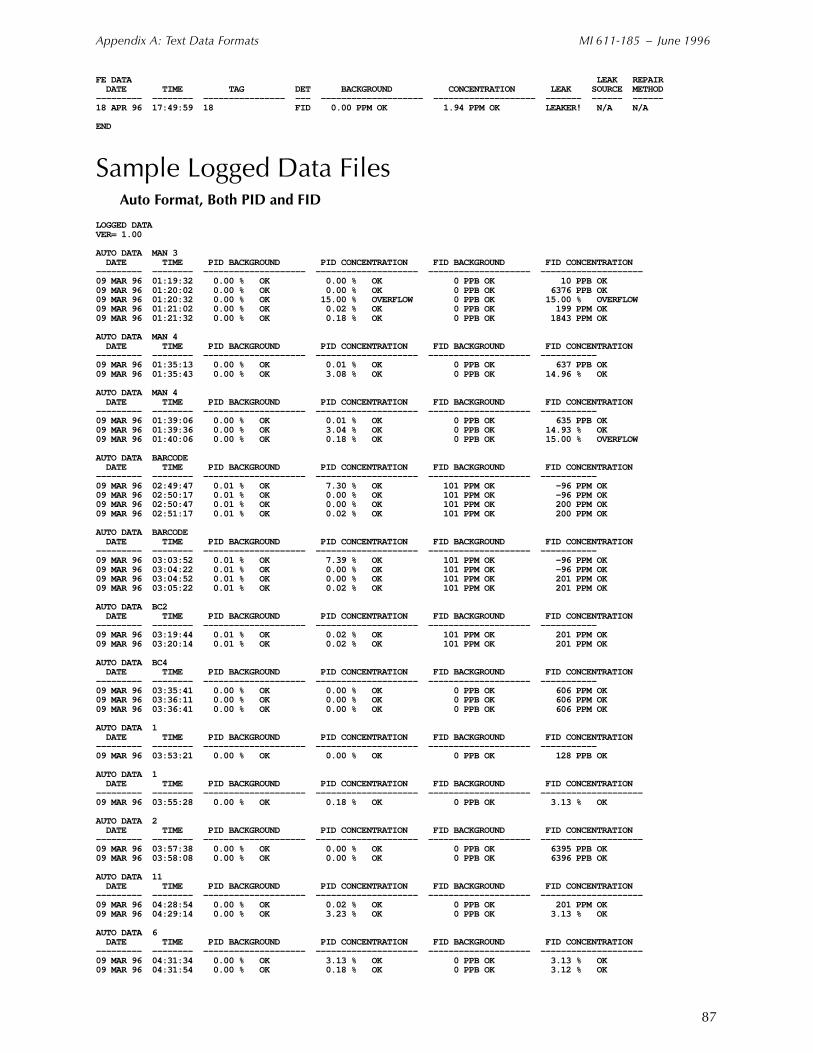
Appendix A: Text Data Formats MI 611-185 – June 1996
87
FE DATA LEAK REPAIR DATE TIME TAG DET BACKGROUND CONCENTRATION LEAK SOURCE METHOD--------- -------- ---------------- --- -------------------- -------------------- ------- ------ ------18 APR 96 17:49:59 18 FID 0.00 PPM OK 1.94 PPM OK LEAKER! N/A N/A
END
Sample Logged Data Files Auto Format, Both PID and FID
LOGGED DATAVER= 1.00
AUTO DATA MAN 3 DATE TIME PID BACKGROUND PID CONCENTRATION FID BACKGROUND FID CONCENTRATION --------- -------- -------------------- -------------------- -------------------- -------------------- 09 MAR 96 01:19:32 0.00 % OK 0.00 % OK 0 PPB OK 10 PPB OK 09 MAR 96 01:20:02 0.00 % OK 0.00 % OK 0 PPB OK 6376 PPB OK 09 MAR 96 01:20:32 0.00 % OK 15.00 % OVERFLOW 0 PPB OK 15.00 % OVERFLOW 09 MAR 96 01:21:02 0.00 % OK 0.02 % OK 0 PPB OK 199 PPM OK 09 MAR 96 01:21:32 0.00 % OK 0.18 % OK 0 PPB OK 1843 PPM OK
AUTO DATA MAN 4 DATE TIME PID BACKGROUND PID CONCENTRATION FID BACKGROUND FID CONCENTRATION --------- -------- -------------------- -------------------- -------------------- -----------09 MAR 96 01:35:13 0.00 % OK 0.01 % OK 0 PPB OK 637 PPB OK 09 MAR 96 01:35:43 0.00 % OK 3.08 % OK 0 PPB OK 14.96 % OK
AUTO DATA MAN 4 DATE TIME PID BACKGROUND PID CONCENTRATION FID BACKGROUND FID CONCENTRATION --------- -------- -------------------- -------------------- -------------------- -----------09 MAR 96 01:39:06 0.00 % OK 0.01 % OK 0 PPB OK 635 PPB OK 09 MAR 96 01:39:36 0.00 % OK 3.04 % OK 0 PPB OK 14.93 % OK 09 MAR 96 01:40:06 0.00 % OK 0.18 % OK 0 PPB OK 15.00 % OVERFLOW
AUTO DATA BARCODE DATE TIME PID BACKGROUND PID CONCENTRATION FID BACKGROUND FID CONCENTRATION --------- -------- -------------------- -------------------- -------------------- ----------- 09 MAR 96 02:49:47 0.01 % OK 7.30 % OK 101 PPM OK -96 PPM OK 09 MAR 96 02:50:17 0.01 % OK 0.00 % OK 101 PPM OK -96 PPM OK 09 MAR 96 02:50:47 0.01 % OK 0.00 % OK 101 PPM OK 200 PPM OK 09 MAR 96 02:51:17 0.01 % OK 0.02 % OK 101 PPM OK 200 PPM OK
AUTO DATA BARCODE DATE TIME PID BACKGROUND PID CONCENTRATION FID BACKGROUND FID CONCENTRATION --------- -------- -------------------- -------------------- -------------------- -----------09 MAR 96 03:03:52 0.01 % OK 7.39 % OK 101 PPM OK -96 PPM OK 09 MAR 96 03:04:22 0.01 % OK 0.00 % OK 101 PPM OK -96 PPM OK 09 MAR 96 03:04:52 0.01 % OK 0.00 % OK 101 PPM OK 201 PPM OK 09 MAR 96 03:05:22 0.01 % OK 0.02 % OK 101 PPM OK 201 PPM OK
AUTO DATA BC2 DATE TIME PID BACKGROUND PID CONCENTRATION FID BACKGROUND FID CONCENTRATION --------- -------- -------------------- -------------------- -------------------- -----------09 MAR 96 03:19:44 0.01 % OK 0.02 % OK 101 PPM OK 201 PPM OK 09 MAR 96 03:20:14 0.01 % OK 0.02 % OK 101 PPM OK 201 PPM OK
AUTO DATA BC4 DATE TIME PID BACKGROUND PID CONCENTRATION FID BACKGROUND FID CONCENTRATION --------- -------- -------------------- -------------------- -------------------- ----------- 09 MAR 96 03:35:41 0.00 % OK 0.00 % OK 0 PPB OK 606 PPM OK 09 MAR 96 03:36:11 0.00 % OK 0.00 % OK 0 PPB OK 606 PPM OK 09 MAR 96 03:36:41 0.00 % OK 0.00 % OK 0 PPB OK 606 PPM OK
AUTO DATA 1 DATE TIME PID BACKGROUND PID CONCENTRATION FID BACKGROUND FID CONCENTRATION --------- -------- -------------------- -------------------- -------------------- -----------09 MAR 96 03:53:21 0.00 % OK 0.00 % OK 0 PPB OK 128 PPB OK
AUTO DATA 1 DATE TIME PID BACKGROUND PID CONCENTRATION FID BACKGROUND FID CONCENTRATION --------- -------- -------------------- -------------------- -------------------- -------------------- 09 MAR 96 03:55:28 0.00 % OK 0.18 % OK 0 PPB OK 3.13 % OK
AUTO DATA 2 DATE TIME PID BACKGROUND PID CONCENTRATION FID BACKGROUND FID CONCENTRATION --------- -------- -------------------- -------------------- -------------------- -------------------- 09 MAR 96 03:57:38 0.00 % OK 0.00 % OK 0 PPB OK 6395 PPB OK 09 MAR 96 03:58:08 0.00 % OK 0.00 % OK 0 PPB OK 6396 PPB OK
AUTO DATA 11 DATE TIME PID BACKGROUND PID CONCENTRATION FID BACKGROUND FID CONCENTRATION --------- -------- -------------------- -------------------- -------------------- -------------------- 09 MAR 96 04:28:54 0.00 % OK 0.02 % OK 0 PPB OK 201 PPM OK 09 MAR 96 04:29:14 0.00 % OK 3.23 % OK 0 PPB OK 3.13 % OK
AUTO DATA 6 DATE TIME PID BACKGROUND PID CONCENTRATION FID BACKGROUND FID CONCENTRATION --------- -------- -------------------- -------------------- -------------------- -------------------- 09 MAR 96 04:31:34 0.00 % OK 3.13 % OK 0 PPB OK 3.13 % OK 09 MAR 96 04:31:54 0.00 % OK 0.18 % OK 0 PPB OK 3.12 % OK
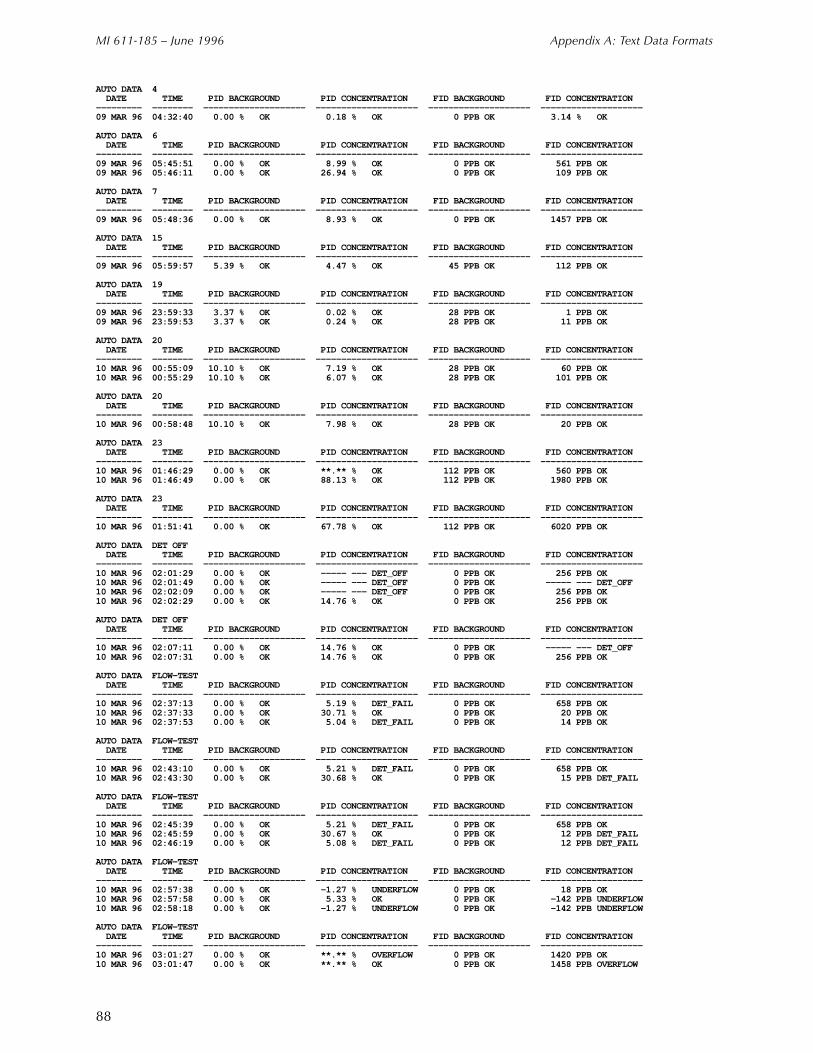
MI 611-185 – June 1996 Appendix A: Text Data Formats
88
AUTO DATA 4 DATE TIME PID BACKGROUND PID CONCENTRATION FID BACKGROUND FID CONCENTRATION --------- -------- -------------------- -------------------- -------------------- -------------------- 09 MAR 96 04:32:40 0.00 % OK 0.18 % OK 0 PPB OK 3.14 % OK
AUTO DATA 6 DATE TIME PID BACKGROUND PID CONCENTRATION FID BACKGROUND FID CONCENTRATION --------- -------- -------------------- -------------------- -------------------- -------------------- 09 MAR 96 05:45:51 0.00 % OK 8.99 % OK 0 PPB OK 561 PPB OK 09 MAR 96 05:46:11 0.00 % OK 26.94 % OK 0 PPB OK 109 PPB OK
AUTO DATA 7 DATE TIME PID BACKGROUND PID CONCENTRATION FID BACKGROUND FID CONCENTRATION --------- -------- -------------------- -------------------- -------------------- -------------------- 09 MAR 96 05:48:36 0.00 % OK 8.93 % OK 0 PPB OK 1457 PPB OK
AUTO DATA 15 DATE TIME PID BACKGROUND PID CONCENTRATION FID BACKGROUND FID CONCENTRATION --------- -------- -------------------- -------------------- -------------------- -------------------- 09 MAR 96 05:59:57 5.39 % OK 4.47 % OK 45 PPB OK 112 PPB OK
AUTO DATA 19 DATE TIME PID BACKGROUND PID CONCENTRATION FID BACKGROUND FID CONCENTRATION --------- -------- -------------------- -------------------- -------------------- -------------------- 09 MAR 96 23:59:33 3.37 % OK 0.02 % OK 28 PPB OK 1 PPB OK 09 MAR 96 23:59:53 3.37 % OK 0.24 % OK 28 PPB OK 11 PPB OK
AUTO DATA 20 DATE TIME PID BACKGROUND PID CONCENTRATION FID BACKGROUND FID CONCENTRATION --------- -------- -------------------- -------------------- -------------------- -------------------- 10 MAR 96 00:55:09 10.10 % OK 7.19 % OK 28 PPB OK 60 PPB OK 10 MAR 96 00:55:29 10.10 % OK 6.07 % OK 28 PPB OK 101 PPB OK
AUTO DATA 20 DATE TIME PID BACKGROUND PID CONCENTRATION FID BACKGROUND FID CONCENTRATION --------- -------- -------------------- -------------------- -------------------- -------------------- 10 MAR 96 00:58:48 10.10 % OK 7.98 % OK 28 PPB OK 20 PPB OK
AUTO DATA 23 DATE TIME PID BACKGROUND PID CONCENTRATION FID BACKGROUND FID CONCENTRATION --------- -------- -------------------- -------------------- -------------------- -------------------- 10 MAR 96 01:46:29 0.00 % OK **.** % OK 112 PPB OK 560 PPB OK 10 MAR 96 01:46:49 0.00 % OK 88.13 % OK 112 PPB OK 1980 PPB OK
AUTO DATA 23 DATE TIME PID BACKGROUND PID CONCENTRATION FID BACKGROUND FID CONCENTRATION --------- -------- -------------------- -------------------- -------------------- -------------------- 10 MAR 96 01:51:41 0.00 % OK 67.78 % OK 112 PPB OK 6020 PPB OK
AUTO DATA DET OFF DATE TIME PID BACKGROUND PID CONCENTRATION FID BACKGROUND FID CONCENTRATION --------- -------- -------------------- -------------------- -------------------- -------------------- 10 MAR 96 02:01:29 0.00 % OK ----- --- DET_OFF 0 PPB OK 256 PPB OK 10 MAR 96 02:01:49 0.00 % OK ----- --- DET_OFF 0 PPB OK ----- --- DET_OFF 10 MAR 96 02:02:09 0.00 % OK ----- --- DET_OFF 0 PPB OK 256 PPB OK 10 MAR 96 02:02:29 0.00 % OK 14.76 % OK 0 PPB OK 256 PPB OK
AUTO DATA DET OFF DATE TIME PID BACKGROUND PID CONCENTRATION FID BACKGROUND FID CONCENTRATION --------- -------- -------------------- -------------------- -------------------- -------------------- 10 MAR 96 02:07:11 0.00 % OK 14.76 % OK 0 PPB OK ----- --- DET_OFF 10 MAR 96 02:07:31 0.00 % OK 14.76 % OK 0 PPB OK 256 PPB OK
AUTO DATA FLOW-TEST DATE TIME PID BACKGROUND PID CONCENTRATION FID BACKGROUND FID CONCENTRATION --------- -------- -------------------- -------------------- -------------------- -------------------- 10 MAR 96 02:37:13 0.00 % OK 5.19 % DET_FAIL 0 PPB OK 658 PPB OK 10 MAR 96 02:37:33 0.00 % OK 30.71 % OK 0 PPB OK 20 PPB OK 10 MAR 96 02:37:53 0.00 % OK 5.04 % DET_FAIL 0 PPB OK 14 PPB OK
AUTO DATA FLOW-TEST DATE TIME PID BACKGROUND PID CONCENTRATION FID BACKGROUND FID CONCENTRATION --------- -------- -------------------- -------------------- -------------------- -------------------- 10 MAR 96 02:43:10 0.00 % OK 5.21 % DET_FAIL 0 PPB OK 658 PPB OK 10 MAR 96 02:43:30 0.00 % OK 30.68 % OK 0 PPB OK 15 PPB DET_FAIL
AUTO DATA FLOW-TEST DATE TIME PID BACKGROUND PID CONCENTRATION FID BACKGROUND FID CONCENTRATION --------- -------- -------------------- -------------------- -------------------- -------------------- 10 MAR 96 02:45:39 0.00 % OK 5.21 % DET_FAIL 0 PPB OK 658 PPB OK 10 MAR 96 02:45:59 0.00 % OK 30.67 % OK 0 PPB OK 12 PPB DET_FAIL 10 MAR 96 02:46:19 0.00 % OK 5.08 % DET_FAIL 0 PPB OK 12 PPB DET_FAIL
AUTO DATA FLOW-TEST DATE TIME PID BACKGROUND PID CONCENTRATION FID BACKGROUND FID CONCENTRATION --------- -------- -------------------- -------------------- -------------------- -------------------- 10 MAR 96 02:57:38 0.00 % OK -1.27 % UNDERFLOW 0 PPB OK 18 PPB OK 10 MAR 96 02:57:58 0.00 % OK 5.33 % OK 0 PPB OK -142 PPB UNDERFLOW 10 MAR 96 02:58:18 0.00 % OK -1.27 % UNDERFLOW 0 PPB OK -142 PPB UNDERFLOW
AUTO DATA FLOW-TEST DATE TIME PID BACKGROUND PID CONCENTRATION FID BACKGROUND FID CONCENTRATION --------- -------- -------------------- -------------------- -------------------- -------------------- 10 MAR 96 03:01:27 0.00 % OK **.** % OVERFLOW 0 PPB OK 1420 PPB OK 10 MAR 96 03:01:47 0.00 % OK **.** % OK 0 PPB OK 1458 PPB OVERFLOW
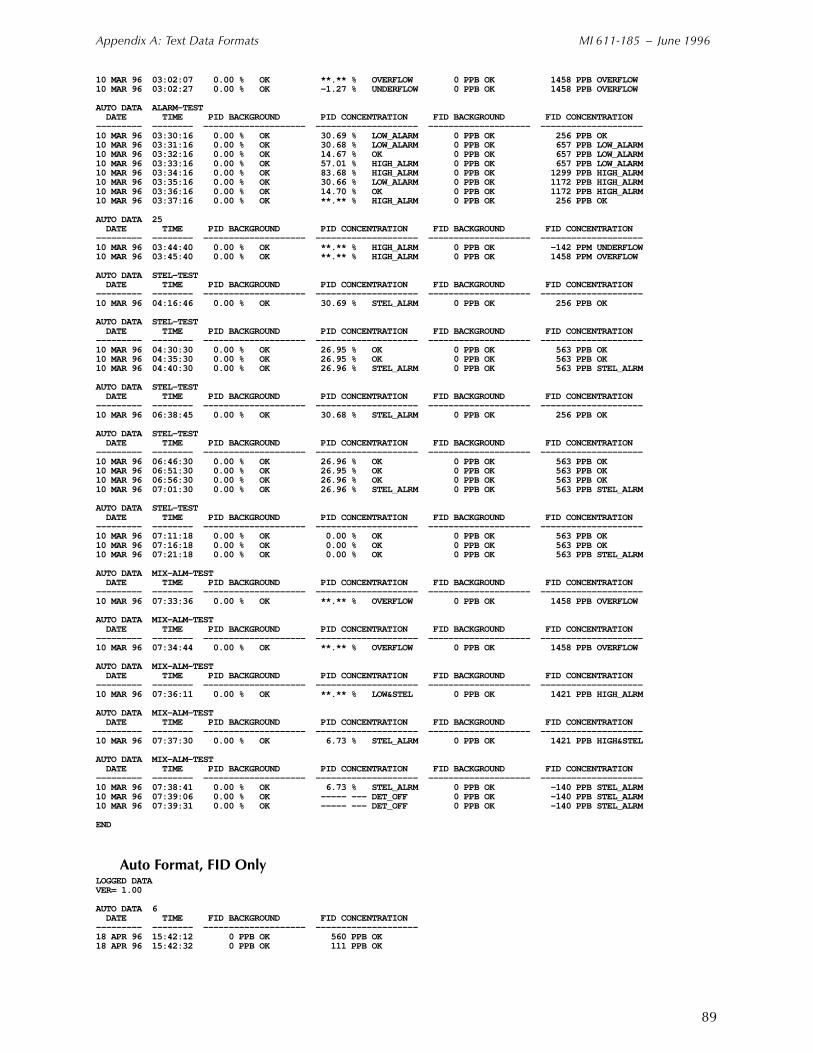
Appendix A: Text Data Formats MI 611-185 – June 1996
89
10 MAR 96 03:02:07 0.00 % OK **.** % OVERFLOW 0 PPB OK 1458 PPB OVERFLOW 10 MAR 96 03:02:27 0.00 % OK -1.27 % UNDERFLOW 0 PPB OK 1458 PPB OVERFLOW
AUTO DATA ALARM-TEST DATE TIME PID BACKGROUND PID CONCENTRATION FID BACKGROUND FID CONCENTRATION --------- -------- -------------------- -------------------- -------------------- -------------------- 10 MAR 96 03:30:16 0.00 % OK 30.69 % LOW_ALARM 0 PPB OK 256 PPB OK 10 MAR 96 03:31:16 0.00 % OK 30.68 % LOW_ALARM 0 PPB OK 657 PPB LOW_ALARM 10 MAR 96 03:32:16 0.00 % OK 14.67 % OK 0 PPB OK 657 PPB LOW_ALARM 10 MAR 96 03:33:16 0.00 % OK 57.01 % HIGH_ALRM 0 PPB OK 657 PPB LOW_ALARM 10 MAR 96 03:34:16 0.00 % OK 83.68 % HIGH_ALRM 0 PPB OK 1299 PPB HIGH_ALRM 10 MAR 96 03:35:16 0.00 % OK 30.66 % LOW_ALARM 0 PPB OK 1172 PPB HIGH_ALRM 10 MAR 96 03:36:16 0.00 % OK 14.70 % OK 0 PPB OK 1172 PPB HIGH_ALRM 10 MAR 96 03:37:16 0.00 % OK **.** % HIGH_ALRM 0 PPB OK 256 PPB OK
AUTO DATA 25 DATE TIME PID BACKGROUND PID CONCENTRATION FID BACKGROUND FID CONCENTRATION --------- -------- -------------------- -------------------- -------------------- -------------------- 10 MAR 96 03:44:40 0.00 % OK **.** % HIGH_ALRM 0 PPB OK -142 PPM UNDERFLOW 10 MAR 96 03:45:40 0.00 % OK **.** % HIGH_ALRM 0 PPB OK 1458 PPM OVERFLOW
AUTO DATA STEL-TEST DATE TIME PID BACKGROUND PID CONCENTRATION FID BACKGROUND FID CONCENTRATION --------- -------- -------------------- -------------------- -------------------- -------------------- 10 MAR 96 04:16:46 0.00 % OK 30.69 % STEL_ALRM 0 PPB OK 256 PPB OK
AUTO DATA STEL-TEST DATE TIME PID BACKGROUND PID CONCENTRATION FID BACKGROUND FID CONCENTRATION --------- -------- -------------------- -------------------- -------------------- -------------------- 10 MAR 96 04:30:30 0.00 % OK 26.95 % OK 0 PPB OK 563 PPB OK 10 MAR 96 04:35:30 0.00 % OK 26.95 % OK 0 PPB OK 563 PPB OK 10 MAR 96 04:40:30 0.00 % OK 26.96 % STEL_ALRM 0 PPB OK 563 PPB STEL_ALRM
AUTO DATA STEL-TEST DATE TIME PID BACKGROUND PID CONCENTRATION FID BACKGROUND FID CONCENTRATION --------- -------- -------------------- -------------------- -------------------- -------------------- 10 MAR 96 06:38:45 0.00 % OK 30.68 % STEL_ALRM 0 PPB OK 256 PPB OK
AUTO DATA STEL-TEST DATE TIME PID BACKGROUND PID CONCENTRATION FID BACKGROUND FID CONCENTRATION --------- -------- -------------------- -------------------- -------------------- -------------------- 10 MAR 96 06:46:30 0.00 % OK 26.96 % OK 0 PPB OK 563 PPB OK 10 MAR 96 06:51:30 0.00 % OK 26.95 % OK 0 PPB OK 563 PPB OK 10 MAR 96 06:56:30 0.00 % OK 26.96 % OK 0 PPB OK 563 PPB OK 10 MAR 96 07:01:30 0.00 % OK 26.96 % STEL_ALRM 0 PPB OK 563 PPB STEL_ALRM
AUTO DATA STEL-TEST DATE TIME PID BACKGROUND PID CONCENTRATION FID BACKGROUND FID CONCENTRATION --------- -------- -------------------- -------------------- -------------------- -------------------- 10 MAR 96 07:11:18 0.00 % OK 0.00 % OK 0 PPB OK 563 PPB OK 10 MAR 96 07:16:18 0.00 % OK 0.00 % OK 0 PPB OK 563 PPB OK 10 MAR 96 07:21:18 0.00 % OK 0.00 % OK 0 PPB OK 563 PPB STEL_ALRM
AUTO DATA MIX-ALM-TEST DATE TIME PID BACKGROUND PID CONCENTRATION FID BACKGROUND FID CONCENTRATION --------- -------- -------------------- -------------------- -------------------- -------------------- 10 MAR 96 07:33:36 0.00 % OK **.** % OVERFLOW 0 PPB OK 1458 PPB OVERFLOW
AUTO DATA MIX-ALM-TEST DATE TIME PID BACKGROUND PID CONCENTRATION FID BACKGROUND FID CONCENTRATION --------- -------- -------------------- -------------------- -------------------- -------------------- 10 MAR 96 07:34:44 0.00 % OK **.** % OVERFLOW 0 PPB OK 1458 PPB OVERFLOW
AUTO DATA MIX-ALM-TEST DATE TIME PID BACKGROUND PID CONCENTRATION FID BACKGROUND FID CONCENTRATION --------- -------- -------------------- -------------------- -------------------- -------------------- 10 MAR 96 07:36:11 0.00 % OK **.** % LOW&STEL 0 PPB OK 1421 PPB HIGH_ALRM
AUTO DATA MIX-ALM-TEST DATE TIME PID BACKGROUND PID CONCENTRATION FID BACKGROUND FID CONCENTRATION --------- -------- -------------------- -------------------- -------------------- -------------------- 10 MAR 96 07:37:30 0.00 % OK 6.73 % STEL_ALRM 0 PPB OK 1421 PPB HIGH&STEL
AUTO DATA MIX-ALM-TEST DATE TIME PID BACKGROUND PID CONCENTRATION FID BACKGROUND FID CONCENTRATION --------- -------- -------------------- -------------------- -------------------- -------------------- 10 MAR 96 07:38:41 0.00 % OK 6.73 % STEL_ALRM 0 PPB OK -140 PPB STEL_ALRM 10 MAR 96 07:39:06 0.00 % OK ----- --- DET_OFF 0 PPB OK -140 PPB STEL_ALRM 10 MAR 96 07:39:31 0.00 % OK ----- --- DET_OFF 0 PPB OK -140 PPB STEL_ALRM
END
Auto Format, FID OnlyLOGGED DATAVER= 1.00
AUTO DATA 6 DATE TIME FID BACKGROUND FID CONCENTRATION --------- -------- -------------------- --------------------18 APR 96 15:42:12 0 PPB OK 560 PPB OK 18 APR 96 15:42:32 0 PPB OK 111 PPB OK
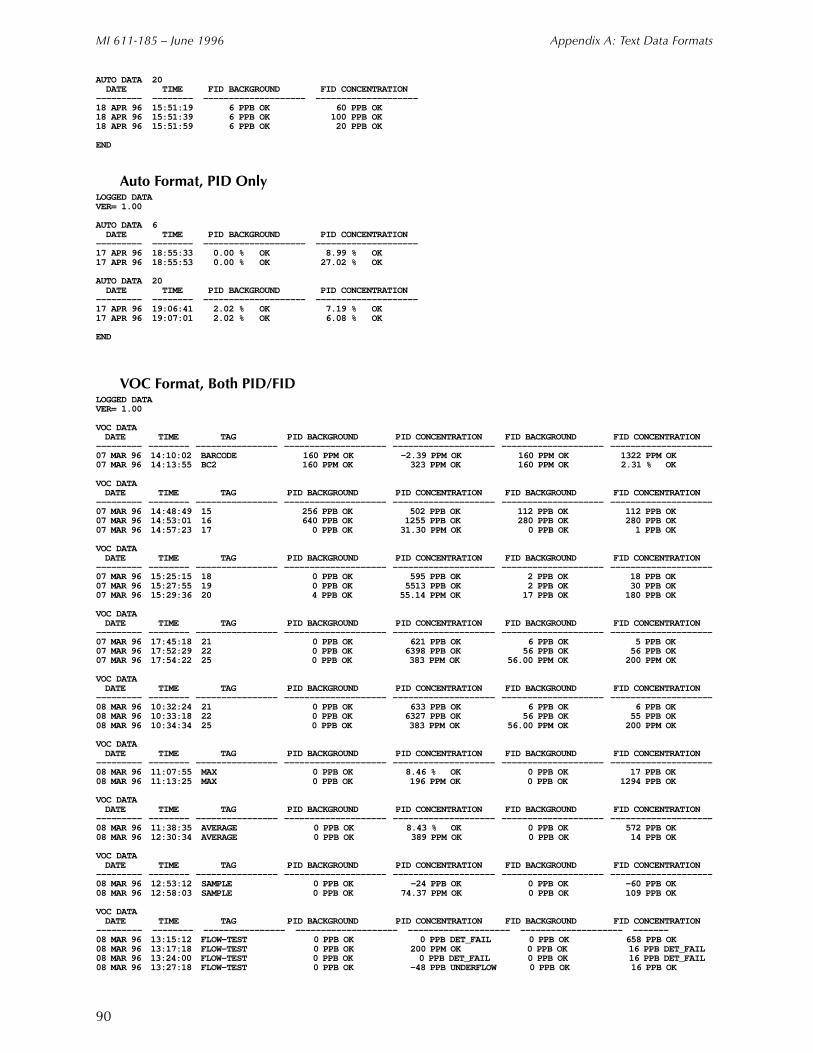
MI 611-185 – June 1996 Appendix A: Text Data Formats
90
AUTO DATA 20 DATE TIME FID BACKGROUND FID CONCENTRATION --------- -------- -------------------- --------------------18 APR 96 15:51:19 6 PPB OK 60 PPB OK 18 APR 96 15:51:39 6 PPB OK 100 PPB OK 18 APR 96 15:51:59 6 PPB OK 20 PPB OK
END
Auto Format, PID OnlyLOGGED DATAVER= 1.00
AUTO DATA 6 DATE TIME PID BACKGROUND PID CONCENTRATION --------- -------- -------------------- --------------------17 APR 96 18:55:33 0.00 % OK 8.99 % OK 17 APR 96 18:55:53 0.00 % OK 27.02 % OK
AUTO DATA 20 DATE TIME PID BACKGROUND PID CONCENTRATION --------- -------- -------------------- --------------------17 APR 96 19:06:41 2.02 % OK 7.19 % OK 17 APR 96 19:07:01 2.02 % OK 6.08 % OK
END
VOC Format, Both PID/FIDLOGGED DATAVER= 1.00
VOC DATA DATE TIME TAG PID BACKGROUND PID CONCENTRATION FID BACKGROUND FID CONCENTRATION --------- -------- ---------------- -------------------- -------------------- -------------------- -------------------- 07 MAR 96 14:10:02 BARCODE 160 PPM OK -2.39 PPM OK 160 PPM OK 1322 PPM OK 07 MAR 96 14:13:55 BC2 160 PPM OK 323 PPM OK 160 PPM OK 2.31 % OK
VOC DATA DATE TIME TAG PID BACKGROUND PID CONCENTRATION FID BACKGROUND FID CONCENTRATION --------- -------- ---------------- -------------------- -------------------- -------------------- -------------------- 07 MAR 96 14:48:49 15 256 PPB OK 502 PPB OK 112 PPB OK 112 PPB OK 07 MAR 96 14:53:01 16 640 PPB OK 1255 PPB OK 280 PPB OK 280 PPB OK 07 MAR 96 14:57:23 17 0 PPB OK 31.30 PPM OK 0 PPB OK 1 PPB OK
VOC DATA DATE TIME TAG PID BACKGROUND PID CONCENTRATION FID BACKGROUND FID CONCENTRATION --------- -------- ---------------- -------------------- -------------------- -------------------- -------------------- 07 MAR 96 15:25:15 18 0 PPB OK 595 PPB OK 2 PPB OK 18 PPB OK 07 MAR 96 15:27:55 19 0 PPB OK 5513 PPB OK 2 PPB OK 30 PPB OK 07 MAR 96 15:29:36 20 4 PPB OK 55.14 PPM OK 17 PPB OK 180 PPB OK
VOC DATA DATE TIME TAG PID BACKGROUND PID CONCENTRATION FID BACKGROUND FID CONCENTRATION --------- -------- ---------------- -------------------- -------------------- -------------------- -------------------- 07 MAR 96 17:45:18 21 0 PPB OK 621 PPB OK 6 PPB OK 5 PPB OK 07 MAR 96 17:52:29 22 0 PPB OK 6398 PPB OK 56 PPB OK 56 PPB OK 07 MAR 96 17:54:22 25 0 PPB OK 383 PPM OK 56.00 PPM OK 200 PPM OK
VOC DATA DATE TIME TAG PID BACKGROUND PID CONCENTRATION FID BACKGROUND FID CONCENTRATION --------- -------- ---------------- -------------------- -------------------- -------------------- -------------------- 08 MAR 96 10:32:24 21 0 PPB OK 633 PPB OK 6 PPB OK 6 PPB OK 08 MAR 96 10:33:18 22 0 PPB OK 6327 PPB OK 56 PPB OK 55 PPB OK 08 MAR 96 10:34:34 25 0 PPB OK 383 PPM OK 56.00 PPM OK 200 PPM OK
VOC DATA DATE TIME TAG PID BACKGROUND PID CONCENTRATION FID BACKGROUND FID CONCENTRATION --------- -------- ---------------- -------------------- -------------------- -------------------- -------------------- 08 MAR 96 11:07:55 MAX 0 PPB OK 8.46 % OK 0 PPB OK 17 PPB OK 08 MAR 96 11:13:25 MAX 0 PPB OK 196 PPM OK 0 PPB OK 1294 PPB OK
VOC DATA DATE TIME TAG PID BACKGROUND PID CONCENTRATION FID BACKGROUND FID CONCENTRATION --------- -------- ---------------- -------------------- -------------------- -------------------- -------------------- 08 MAR 96 11:38:35 AVERAGE 0 PPB OK 8.43 % OK 0 PPB OK 572 PPB OK 08 MAR 96 12:30:34 AVERAGE 0 PPB OK 389 PPM OK 0 PPB OK 14 PPB OK
VOC DATA DATE TIME TAG PID BACKGROUND PID CONCENTRATION FID BACKGROUND FID CONCENTRATION --------- -------- ---------------- -------------------- -------------------- -------------------- -------------------- 08 MAR 96 12:53:12 SAMPLE 0 PPB OK -24 PPB OK 0 PPB OK -60 PPB OK 08 MAR 96 12:58:03 SAMPLE 0 PPB OK 74.37 PPM OK 0 PPB OK 109 PPB OK
VOC DATA DATE TIME TAG PID BACKGROUND PID CONCENTRATION FID BACKGROUND FID CONCENTRATION --------- -------- ---------------- -------------------- -------------------- -------------------- -------08 MAR 96 13:15:12 FLOW-TEST 0 PPB OK 0 PPB DET_FAIL 0 PPB OK 658 PPB OK 08 MAR 96 13:17:18 FLOW-TEST 0 PPB OK 200 PPM OK 0 PPB OK 16 PPB DET_FAIL 08 MAR 96 13:24:00 FLOW-TEST 0 PPB OK 0 PPB DET_FAIL 0 PPB OK 16 PPB DET_FAIL 08 MAR 96 13:27:18 FLOW-TEST 0 PPB OK -48 PPB UNDERFLOW 0 PPB OK 16 PPB OK
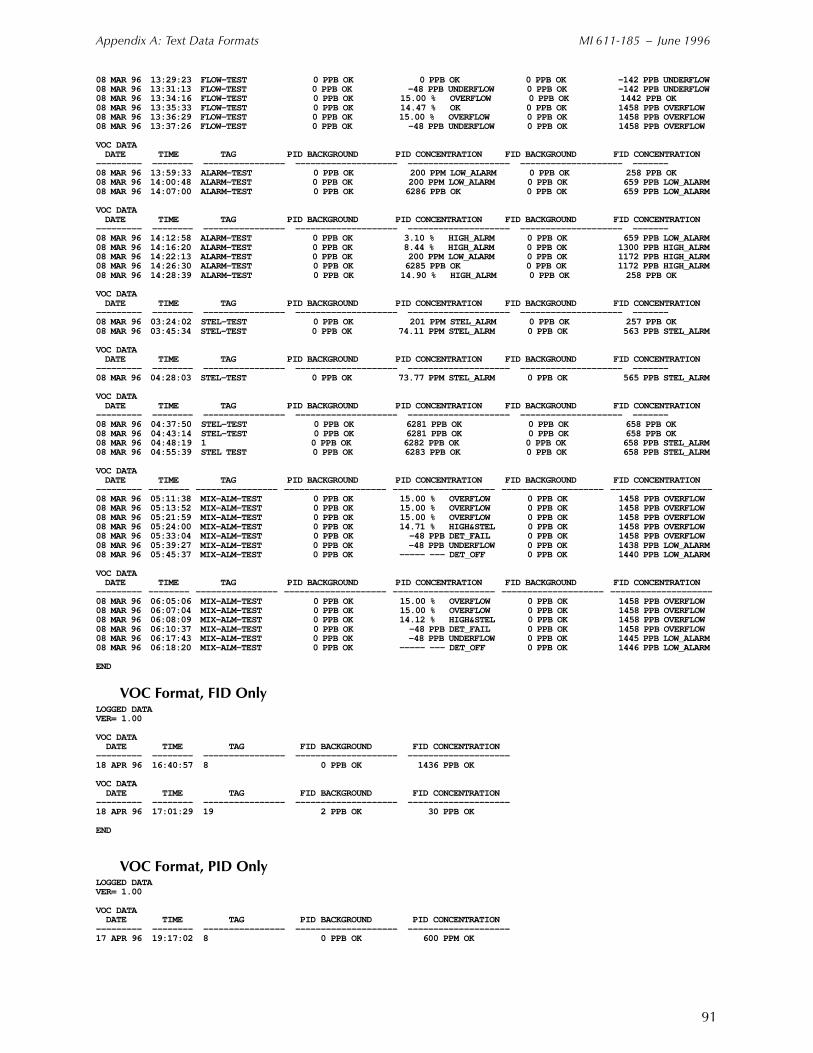
Appendix A: Text Data Formats MI 611-185 – June 1996
91
08 MAR 96 13:29:23 FLOW-TEST 0 PPB OK 0 PPB OK 0 PPB OK -142 PPB UNDERFLOW 08 MAR 96 13:31:13 FLOW-TEST 0 PPB OK -48 PPB UNDERFLOW 0 PPB OK -142 PPB UNDERFLOW 08 MAR 96 13:34:16 FLOW-TEST 0 PPB OK 15.00 % OVERFLOW 0 PPB OK 1442 PPB OK 08 MAR 96 13:35:33 FLOW-TEST 0 PPB OK 14.47 % OK 0 PPB OK 1458 PPB OVERFLOW 08 MAR 96 13:36:29 FLOW-TEST 0 PPB OK 15.00 % OVERFLOW 0 PPB OK 1458 PPB OVERFLOW 08 MAR 96 13:37:26 FLOW-TEST 0 PPB OK -48 PPB UNDERFLOW 0 PPB OK 1458 PPB OVERFLOW
VOC DATA DATE TIME TAG PID BACKGROUND PID CONCENTRATION FID BACKGROUND FID CONCENTRATION --------- -------- ---------------- -------------------- -------------------- -------------------- -------08 MAR 96 13:59:33 ALARM-TEST 0 PPB OK 200 PPM LOW_ALARM 0 PPB OK 258 PPB OK 08 MAR 96 14:00:48 ALARM-TEST 0 PPB OK 200 PPM LOW_ALARM 0 PPB OK 659 PPB LOW_ALARM 08 MAR 96 14:07:00 ALARM-TEST 0 PPB OK 6286 PPB OK 0 PPB OK 659 PPB LOW_ALARM
VOC DATA DATE TIME TAG PID BACKGROUND PID CONCENTRATION FID BACKGROUND FID CONCENTRATION --------- -------- ---------------- -------------------- -------------------- -------------------- -------08 MAR 96 14:12:58 ALARM-TEST 0 PPB OK 3.10 % HIGH_ALRM 0 PPB OK 659 PPB LOW_ALARM 08 MAR 96 14:16:20 ALARM-TEST 0 PPB OK 8.44 % HIGH_ALRM 0 PPB OK 1300 PPB HIGH_ALRM 08 MAR 96 14:22:13 ALARM-TEST 0 PPB OK 200 PPM LOW_ALARM 0 PPB OK 1172 PPB HIGH_ALRM 08 MAR 96 14:26:30 ALARM-TEST 0 PPB OK 6285 PPB OK 0 PPB OK 1172 PPB HIGH_ALRM 08 MAR 96 14:28:39 ALARM-TEST 0 PPB OK 14.90 % HIGH_ALRM 0 PPB OK 258 PPB OK
VOC DATA DATE TIME TAG PID BACKGROUND PID CONCENTRATION FID BACKGROUND FID CONCENTRATION --------- -------- ---------------- -------------------- -------------------- -------------------- -------08 MAR 96 03:24:02 STEL-TEST 0 PPB OK 201 PPM STEL_ALRM 0 PPB OK 257 PPB OK 08 MAR 96 03:45:34 STEL-TEST 0 PPB OK 74.11 PPM STEL_ALRM 0 PPB OK 563 PPB STEL_ALRM
VOC DATA DATE TIME TAG PID BACKGROUND PID CONCENTRATION FID BACKGROUND FID CONCENTRATION --------- -------- ---------------- -------------------- -------------------- -------------------- -------08 MAR 96 04:28:03 STEL-TEST 0 PPB OK 73.77 PPM STEL_ALRM 0 PPB OK 565 PPB STEL_ALRM
VOC DATA DATE TIME TAG PID BACKGROUND PID CONCENTRATION FID BACKGROUND FID CONCENTRATION --------- -------- ---------------- -------------------- -------------------- -------------------- -------08 MAR 96 04:37:50 STEL-TEST 0 PPB OK 6281 PPB OK 0 PPB OK 658 PPB OK 08 MAR 96 04:43:14 STEL-TEST 0 PPB OK 6281 PPB OK 0 PPB OK 658 PPB OK 08 MAR 96 04:48:19 1 0 PPB OK 6282 PPB OK 0 PPB OK 658 PPB STEL_ALRM 08 MAR 96 04:55:39 STEL TEST 0 PPB OK 6283 PPB OK 0 PPB OK 658 PPB STEL_ALRM
VOC DATA DATE TIME TAG PID BACKGROUND PID CONCENTRATION FID BACKGROUND FID CONCENTRATION --------- -------- ---------------- -------------------- -------------------- -------------------- -------------------- 08 MAR 96 05:11:38 MIX-ALM-TEST 0 PPB OK 15.00 % OVERFLOW 0 PPB OK 1458 PPB OVERFLOW 08 MAR 96 05:13:52 MIX-ALM-TEST 0 PPB OK 15.00 % OVERFLOW 0 PPB OK 1458 PPB OVERFLOW 08 MAR 96 05:21:59 MIX-ALM-TEST 0 PPB OK 15.00 % OVERFLOW 0 PPB OK 1458 PPB OVERFLOW 08 MAR 96 05:24:00 MIX-ALM-TEST 0 PPB OK 14.71 % HIGH&STEL 0 PPB OK 1458 PPB OVERFLOW 08 MAR 96 05:33:04 MIX-ALM-TEST 0 PPB OK -48 PPB DET_FAIL 0 PPB OK 1458 PPB OVERFLOW 08 MAR 96 05:39:27 MIX-ALM-TEST 0 PPB OK -48 PPB UNDERFLOW 0 PPB OK 1438 PPB LOW_ALARM 08 MAR 96 05:45:37 MIX-ALM-TEST 0 PPB OK ----- --- DET_OFF 0 PPB OK 1440 PPB LOW_ALARM
VOC DATA DATE TIME TAG PID BACKGROUND PID CONCENTRATION FID BACKGROUND FID CONCENTRATION --------- -------- ---------------- -------------------- -------------------- -------------------- -------------------- 08 MAR 96 06:05:06 MIX-ALM-TEST 0 PPB OK 15.00 % OVERFLOW 0 PPB OK 1458 PPB OVERFLOW 08 MAR 96 06:07:04 MIX-ALM-TEST 0 PPB OK 15.00 % OVERFLOW 0 PPB OK 1458 PPB OVERFLOW 08 MAR 96 06:08:09 MIX-ALM-TEST 0 PPB OK 14.12 % HIGH&STEL 0 PPB OK 1458 PPB OVERFLOW 08 MAR 96 06:10:37 MIX-ALM-TEST 0 PPB OK -48 PPB DET_FAIL 0 PPB OK 1458 PPB OVERFLOW 08 MAR 96 06:17:43 MIX-ALM-TEST 0 PPB OK -48 PPB UNDERFLOW 0 PPB OK 1445 PPB LOW_ALARM 08 MAR 96 06:18:20 MIX-ALM-TEST 0 PPB OK ----- --- DET_OFF 0 PPB OK 1446 PPB LOW_ALARM
END
VOC Format, FID OnlyLOGGED DATAVER= 1.00
VOC DATA DATE TIME TAG FID BACKGROUND FID CONCENTRATION --------- -------- ---------------- -------------------- --------------------18 APR 96 16:40:57 8 0 PPB OK 1436 PPB OK
VOC DATA DATE TIME TAG FID BACKGROUND FID CONCENTRATION --------- -------- ---------------- -------------------- --------------------18 APR 96 17:01:29 19 2 PPB OK 30 PPB OK
END
VOC Format, PID OnlyLOGGED DATAVER= 1.00
VOC DATA DATE TIME TAG PID BACKGROUND PID CONCENTRATION --------- -------- ---------------- -------------------- --------------------17 APR 96 19:17:02 8 0 PPB OK 600 PPM OK

MI 611-185 – June 1996 Appendix A: Text Data Formats
92
VOC DATA DATE TIME TAG PID BACKGROUND PID CONCENTRATION --------- -------- ---------------- -------------------- --------------------17 APR 96 19:38:36 20 4 PPB OK 55.03 PPM OK
END

93
Index
AActivated Charcoal Scrubber 79Alarm Levels 36Alarms
Accessing the Alarm Menu 37High Ceiling Alarm 39Low Ceiling Alarm 38STEL Level Alarm 37
BBattery and Battery Charger 64
CCalibration
Span Reference Point 35Zero or Background Reference Point 34
Concentration Calculation and Calibration 10Control Menu 21, 48
DDate 46Display Delay 47Display Menus 21
EExternal Influences 5
FFID Cartridge 67
HHydrogen Gas Tank 65Hydrogen Tank
Fuel Refilling Procedure 66Precautions in Handling and Storage 65
IInformation Menu 48Instrument Connections 11Instrument Display 12Instrument Functions 2Instrument Keypad 13
KKey Click 47
MI 611-185 – June 1996 Index
MB 121 Printed in U.S.A. 0696
LLog Methods 39
Accessing the LOG Menu 41Log Auto 41Log None 41Log VOC 42
MMain Menu Structure 21Maintenance 63
NNormal Operating Maintenance 64
PPID Cartridge 66Probe Connections 15Probe Display 15Probe Keypad 16, 17
RRemovable, Renewable Parts 63Replacing Probe Tubing 70Route Entry Response Factor 60Run Mode 55
Accessing the Run Menu 56Log Auto 56Log None 56Log VOC 57
SSafety Specifications 6Sintered Metal Probe Filter 69Standard Specifications 3
TTelescoping Extension 79Time of Day 47
UUser Identification Number 46User Options 47Using the Instrument 2
Instruction MI 611-187June 1996
TVA-1000Toxic Vapor Analyzer
PC Software

F.E.C. is a trademark of Fugitive Emissions Control, Inc.Teflon is a trademark of E.I. duPont de Nemours and Co.
Copyright 1996 by Thermo Environmental Instruments Inc.All rights reserved
iii
Contents
Figures............................................................................................................................... v
PC Software ..................................................................................................................... 1
Overview ............................................................................................................................. 1
Running the TVA-1000 PC Program ................................................................................. 1
Hardware and Software Configuration ................................................................................ 2
Installation .......................................................................................................................... 25.25-Inch or 3.5-Inch Diskette Installation .................................................................... 2
Startup ................................................................................................................................ 2Sequence of Operations — Startup ................................................................................. 3
PC Analysis Functions ........................................................................................................ 4Data File ......................................................................................................................... 5Process Data ................................................................................................................. 10Calculate ...................................................................................................................... 14Utilities ........................................................................................................................ 16Exit ............................................................................................................................... 20
PC Utility Functions ......................................................................................................... 20New Directory .............................................................................................................. 21Variables ....................................................................................................................... 22Maintain Blocks ........................................................................................................... 23Delete File .................................................................................................................... 24Reorganize Files ............................................................................................................ 25Toggle Color ................................................................................................................ 25Exit ............................................................................................................................... 25
Index .............................................................................................................................. 27

v
Figures
1 TVA-1000 Main Menu Screen .................................................................................... 42 Data File Menu ............................................................................................................ 53 Download Data Window ............................................................................................. 54 Select Data Window .................................................................................................... 75 Filename Sequence ....................................................................................................... 86 Serial Number Sequence .............................................................................................. 87 Date Sequence ............................................................................................................. 98 Select Save Block Window ........................................................................................... 99 Process Data Menu ...................................................................................................... 10
10 View Header Window .................................................................................................. 1111 Enter Header Text Window ......................................................................................... 1112 Display Data Window ................................................................................................. 1213 Print Data Window ..................................................................................................... 1214 Typical Printout ........................................................................................................... 1315 Export Data Window ................................................................................................... 1416 Calculate Window ....................................................................................................... 1517 Recalculate Window .................................................................................................... 1518 Utilities Menu .............................................................................................................. 1619 Create New Directory Option ...................................................................................... 1720 Change Program Variable Data Window .....................................................................1721 Change Setup Window ................................................................................................ 1822 Logging Screen (Press F7) ............................................................................................ 1923 PID/FID Screen (Press F6) .......................................................................................... 1924 Utilities Main Menu .................................................................................................... 2125 New Directory Menu ................................................................................................... 2226 Change Variable Menu ................................................................................................ 2227 Maintain Blocks Option .............................................................................................. 2328 Delete File Option ....................................................................................................... 2429 Reorganize Files Option ............................................................................................... 25

MI 611-187 – June 1996 Figures
vi

1
PC Software
OverviewThe TVA-1000 on-board datalogger can communicate with a PC using several methods:
♦ A fugitive emissions software package designed to operate with the TVA-1000 (such as F.E.M.S.)
♦ A communications software package capable of text transfer of ASCII files
♦ The TVA-1000 PC Software supplied with your unit
This chapter is devoted to discussing the TVA-1000 PC Software. For more information about the operation of other packages, refer to the instruction manual supplied with the soft-ware. For more information about uploading and downloading information to and from the TVA-1000, refer to the PCLink section of “Display Menus” in MI 611-185.
NOTE: The TVA-1000 PC Software is not designed to accept data generated using multipoint calibration curves. If you are using more than one span point for calibra-tion of your TVA, you many not use the TVA-1000 PC Software to download data. Instead, use the PCIP software (see MI 611-186) or another communications soft-ware package and the text transfer method (or your fugitive emissions software pack-age if it is designed to operate with the TVA-1000).
TVA-1000 PC software is a direct support tool to the TVA-1000. It is uniquely configured to match the data format of the TVA-1000 and is not applicable to any other instrumentation. The purpose of the software is to provide you with a complete set of tools to display, analyze, and print reports from the information collected by the TVA-1000. It also provides a mecha-nism for remote configuration of the TVA-1000 instrument. The user interface is designed so that all functions can be implemented quickly with a minimum number of key strokes and operations.
The software provides two means of invoking a function. The first is to use the keyboard cur-sor keys or space bar to point to a desired function and then press ENTER to invoke the func-tion. An alternative, which gives a direct and faster response, is to type the highlighted letter of the particular function. This has the same effect as pointing with the cursor and pressing ENTER, but requires fewer keystrokes.
Running the TVA-1000 PC ProgramBefore attempting to run the TVA-1000 PC program for the first time, please refer to the fol-lowing installation instructions for use with a hard disk system. You cannot run the program from the installation disk.
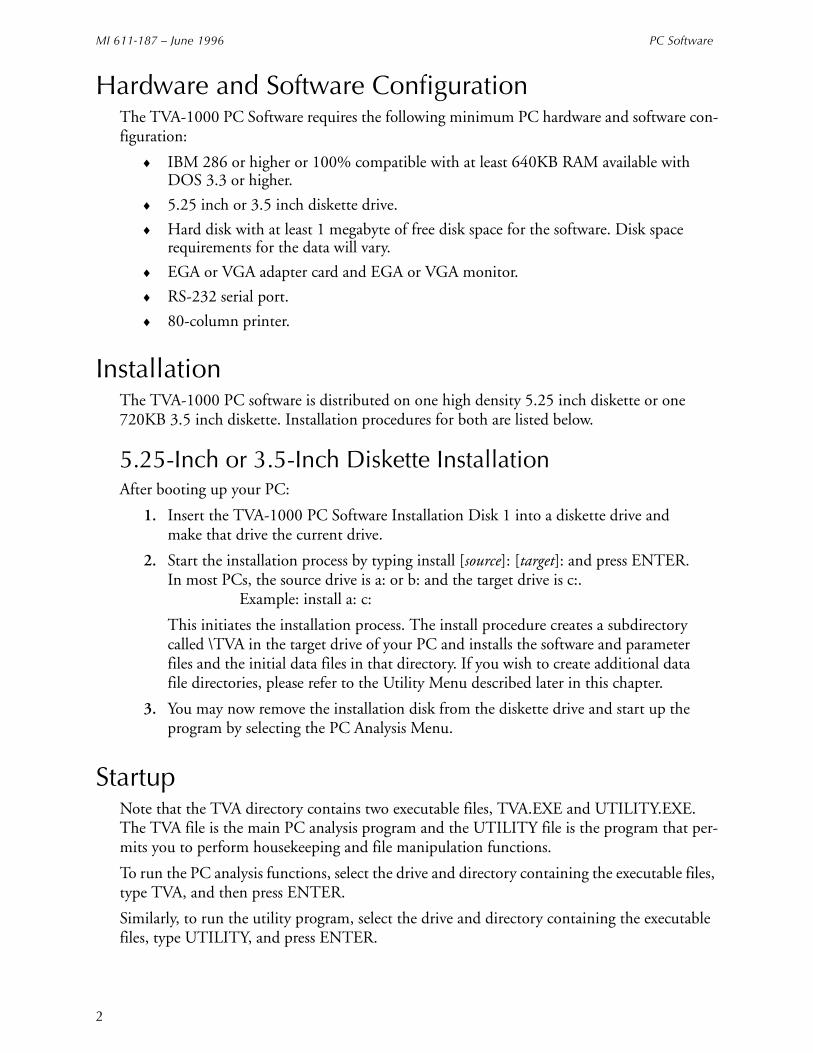
MI 611-187 – June 1996 PC Software
2
Hardware and Software ConfigurationThe TVA-1000 PC Software requires the following minimum PC hardware and software con-figuration:
♦ IBM 286 or higher or 100% compatible with at least 640KB RAM available with DOS 3.3 or higher.
♦ 5.25 inch or 3.5 inch diskette drive.
♦ Hard disk with at least 1 megabyte of free disk space for the software. Disk space requirements for the data will vary.
♦ EGA or VGA adapter card and EGA or VGA monitor.
♦ RS-232 serial port.
♦ 80-column printer.
InstallationThe TVA-1000 PC software is distributed on one high density 5.25 inch diskette or one 720KB 3.5 inch diskette. Installation procedures for both are listed below.
5.25-Inch or 3.5-Inch Diskette InstallationAfter booting up your PC:
1. Insert the TVA-1000 PC Software Installation Disk 1 into a diskette drive and make that drive the current drive.
2. Start the installation process by typing install [source]: [target]: and press ENTER. In most PCs, the source drive is a: or b: and the target drive is c:.
Example: install a: c:
This initiates the installation process. The install procedure creates a subdirectory called \TVA in the target drive of your PC and installs the software and parameter files and the initial data files in that directory. If you wish to create additional data file directories, please refer to the Utility Menu described later in this chapter.
3. You may now remove the installation disk from the diskette drive and start up the program by selecting the PC Analysis Menu.
StartupNote that the TVA directory contains two executable files, TVA.EXE and UTILITY.EXE. The TVA file is the main PC analysis program and the UTILITY file is the program that per-mits you to perform housekeeping and file manipulation functions.
To run the PC analysis functions, select the drive and directory containing the executable files, type TVA, and then press ENTER.
Similarly, to run the utility program, select the drive and directory containing the executable files, type UTILITY, and press ENTER.
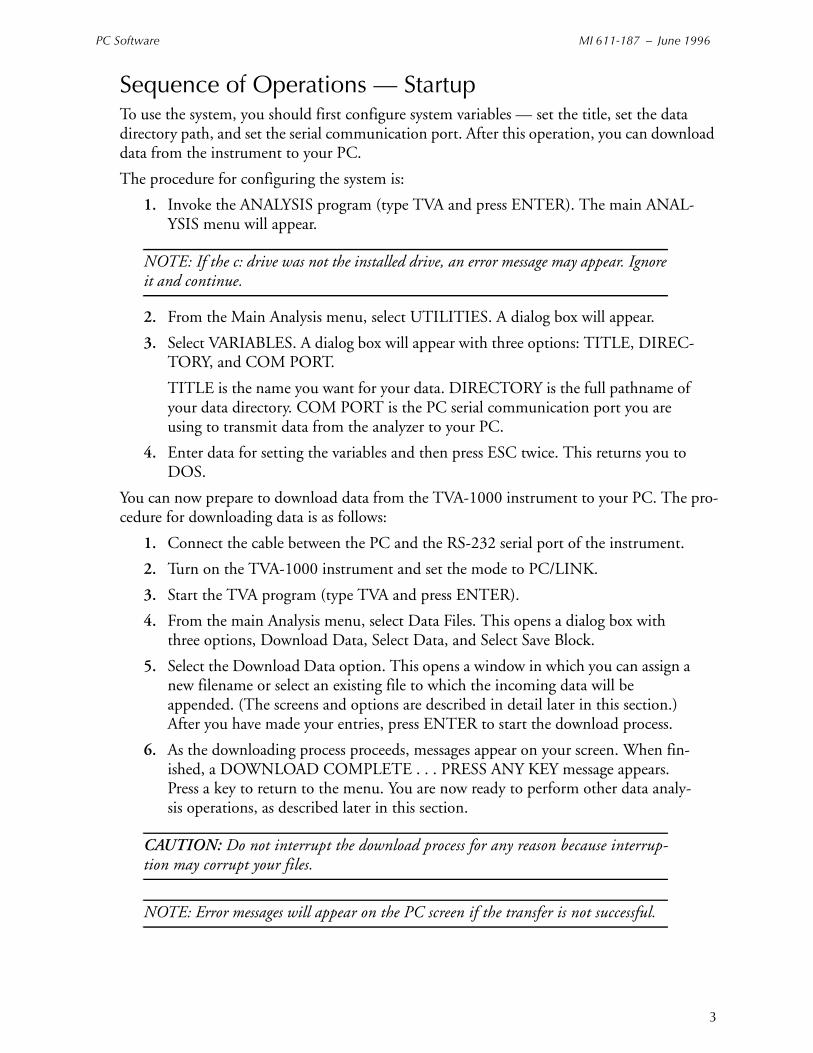
PC Software MI 611-187 – June 1996
3
Sequence of Operations — StartupTo use the system, you should first configure system variables — set the title, set the data directory path, and set the serial communication port. After this operation, you can download data from the instrument to your PC.
The procedure for configuring the system is:
1. Invoke the ANALYSIS program (type TVA and press ENTER). The main ANAL-YSIS menu will appear.
NOTE: If the c: drive was not the installed drive, an error message may appear. Ignore it and continue.
2. From the Main Analysis menu, select UTILITIES. A dialog box will appear.
3. Select VARIABLES. A dialog box will appear with three options: TITLE, DIREC-TORY, and COM PORT.
TITLE is the name you want for your data. DIRECTORY is the full pathname of your data directory. COM PORT is the PC serial communication port you are using to transmit data from the analyzer to your PC.
4. Enter data for setting the variables and then press ESC twice. This returns you to DOS.
You can now prepare to download data from the TVA-1000 instrument to your PC. The pro-cedure for downloading data is as follows:
1. Connect the cable between the PC and the RS-232 serial port of the instrument.
2. Turn on the TVA-1000 instrument and set the mode to PC/LINK.
3. Start the TVA program (type TVA and press ENTER).
4. From the main Analysis menu, select Data Files. This opens a dialog box with three options, Download Data, Select Data, and Select Save Block.
5. Select the Download Data option. This opens a window in which you can assign a new filename or select an existing file to which the incoming data will be appended. (The screens and options are described in detail later in this section.) After you have made your entries, press ENTER to start the download process.
6. As the downloading process proceeds, messages appear on your screen. When fin-ished, a DOWNLOAD COMPLETE . . . PRESS ANY KEY message appears. Press a key to return to the menu. You are now ready to perform other data analy-sis operations, as described later in this section.
CAUTION: Do not interrupt the download process for any reason because interrup-tion may corrupt your files.
NOTE: Error messages will appear on the PC screen if the transfer is not successful.
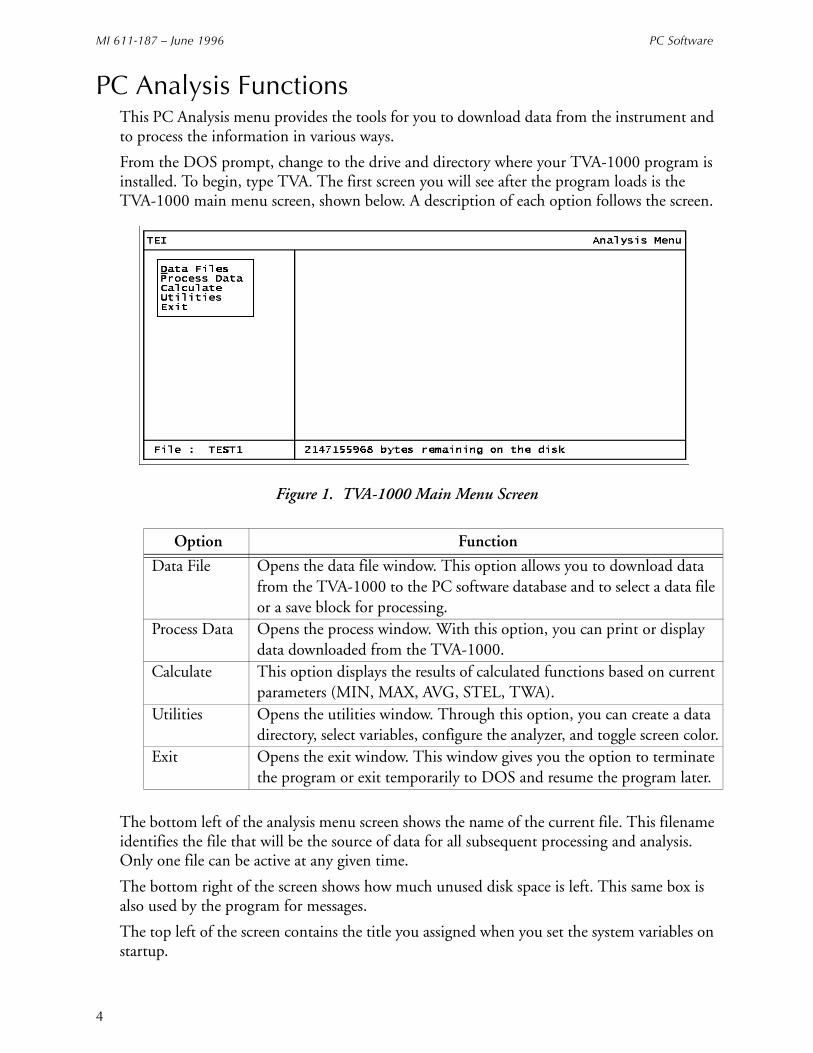
MI 611-187 – June 1996 PC Software
4
PC Analysis FunctionsThis PC Analysis menu provides the tools for you to download data from the instrument and to process the information in various ways.
From the DOS prompt, change to the drive and directory where your TVA-1000 program is installed. To begin, type TVA. The first screen you will see after the program loads is the TVA-1000 main menu screen, shown below. A description of each option follows the screen.
Figure 1. TVA-1000 Main Menu Screen
The bottom left of the analysis menu screen shows the name of the current file. This filename identifies the file that will be the source of data for all subsequent processing and analysis. Only one file can be active at any given time.
The bottom right of the screen shows how much unused disk space is left. This same box is also used by the program for messages.
The top left of the screen contains the title you assigned when you set the system variables on startup.
Option Function
Data File Opens the data file window. This option allows you to download data from the TVA-1000 to the PC software database and to select a data file or a save block for processing.
Process Data Opens the process window. With this option, you can print or display data downloaded from the TVA-1000.
Calculate This option displays the results of calculated functions based on current parameters (MIN, MAX, AVG, STEL, TWA).
Utilities Opens the utilities window. Through this option, you can create a data directory, select variables, configure the analyzer, and toggle screen color.
Exit Opens the exit window. This window gives you the option to terminate the program or exit temporarily to DOS and resume the program later.
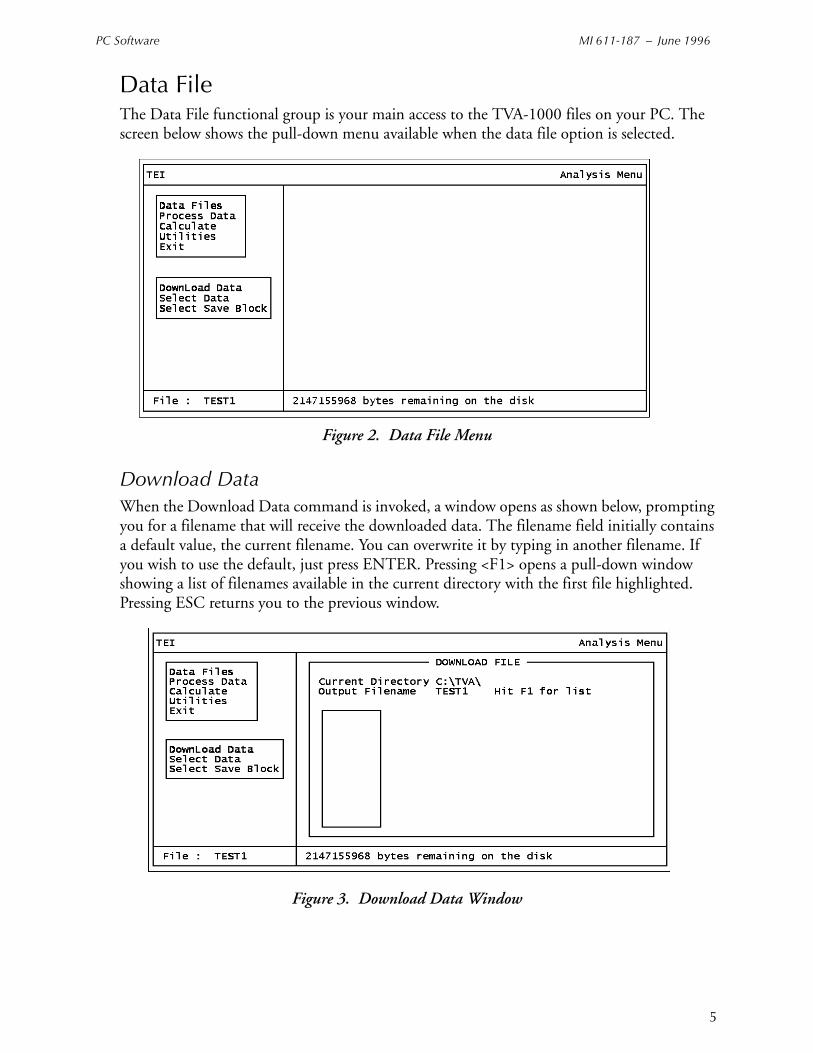
PC Software MI 611-187 – June 1996
5
Data File The Data File functional group is your main access to the TVA-1000 files on your PC. The screen below shows the pull-down menu available when the data file option is selected.
Figure 2. Data File Menu
Download Data When the Download Data command is invoked, a window opens as shown below, prompting you for a filename that will receive the downloaded data. The filename field initially contains a default value, the current filename. You can overwrite it by typing in another filename. If you wish to use the default, just press ENTER. Pressing <F1> opens a pull-down window showing a list of filenames available in the current directory with the first file highlighted. Pressing ESC returns you to the previous window.
Figure 3. Download Data Window
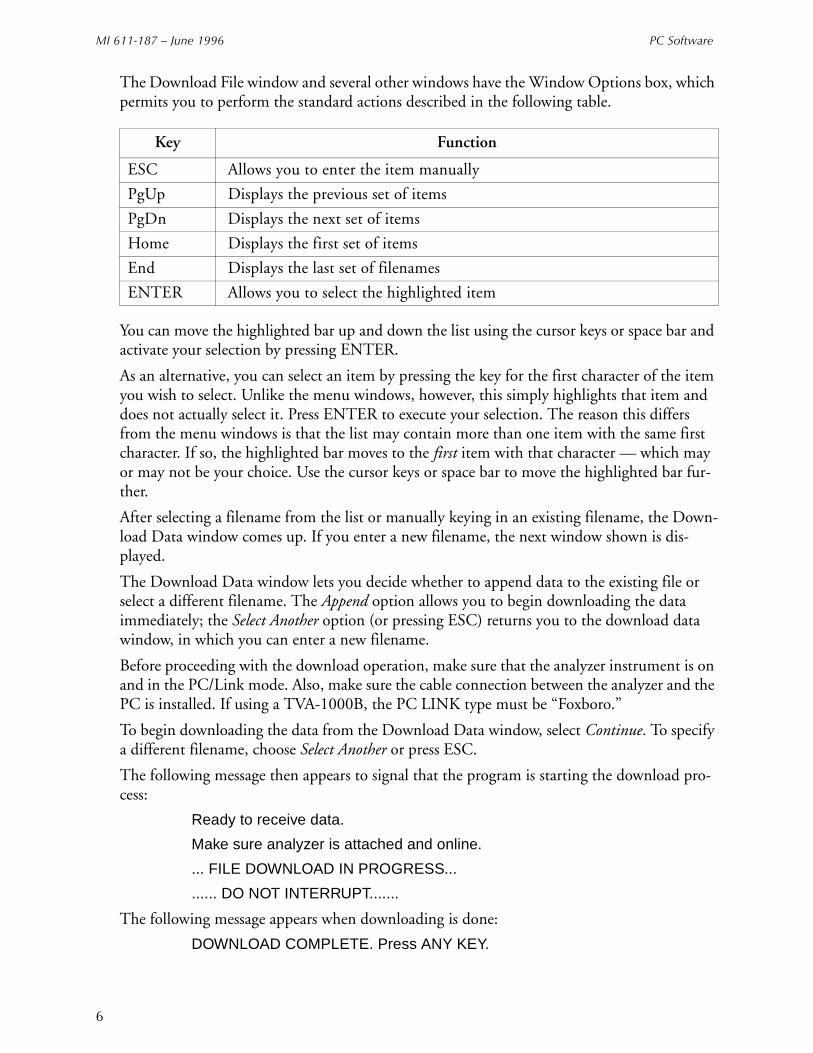
MI 611-187 – June 1996 PC Software
6
The Download File window and several other windows have the Window Options box, which permits you to perform the standard actions described in the following table.
You can move the highlighted bar up and down the list using the cursor keys or space bar and activate your selection by pressing ENTER.
As an alternative, you can select an item by pressing the key for the first character of the item you wish to select. Unlike the menu windows, however, this simply highlights that item and does not actually select it. Press ENTER to execute your selection. The reason this differs from the menu windows is that the list may contain more than one item with the same first character. If so, the highlighted bar moves to the first item with that character — which may or may not be your choice. Use the cursor keys or space bar to move the highlighted bar fur-ther.
After selecting a filename from the list or manually keying in an existing filename, the Down-load Data window comes up. If you enter a new filename, the next window shown is dis-played.
The Download Data window lets you decide whether to append data to the existing file or select a different filename. The Append option allows you to begin downloading the data immediately; the Select Another option (or pressing ESC) returns you to the download data window, in which you can enter a new filename.
Before proceeding with the download operation, make sure that the analyzer instrument is on and in the PC/Link mode. Also, make sure the cable connection between the analyzer and the PC is installed. If using a TVA-1000B, the PC LINK type must be “Foxboro.”
To begin downloading the data from the Download Data window, select Continue. To specify a different filename, choose Select Another or press ESC.
The following message then appears to signal that the program is starting the download pro-cess:
Ready to receive data.
Make sure analyzer is attached and online.
... FILE DOWNLOAD IN PROGRESS...
...... DO NOT INTERRUPT.......
The following message appears when downloading is done:
DOWNLOAD COMPLETE. Press ANY KEY.
Key Function
ESC Allows you to enter the item manually
PgUp Displays the previous set of items
PgDn Displays the next set of items
Home Displays the first set of items
End Displays the last set of filenames
ENTER Allows you to select the highlighted item
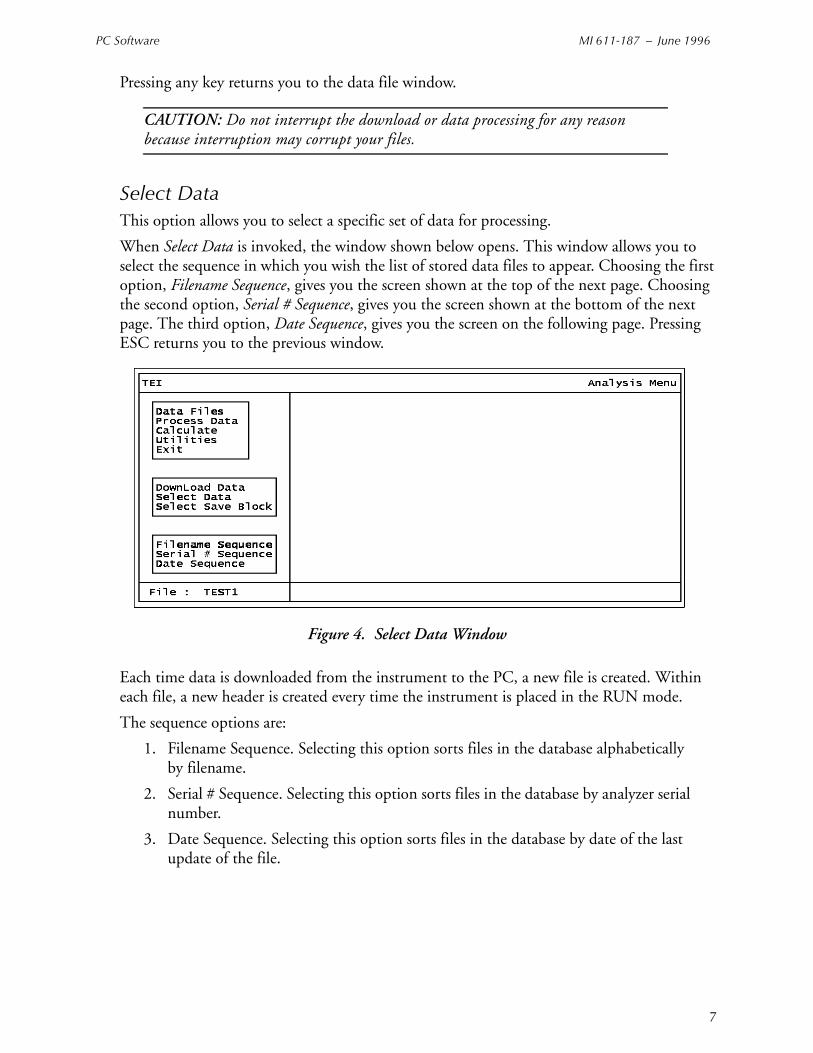
PC Software MI 611-187 – June 1996
7
Pressing any key returns you to the data file window.
CAUTION: Do not interrupt the download or data processing for any reason because interruption may corrupt your files.
Select Data This option allows you to select a specific set of data for processing.
When Select Data is invoked, the window shown below opens. This window allows you to select the sequence in which you wish the list of stored data files to appear. Choosing the first option, Filename Sequence, gives you the screen shown at the top of the next page. Choosing the second option, Serial # Sequence, gives you the screen shown at the bottom of the next page. The third option, Date Sequence, gives you the screen on the following page. Pressing ESC returns you to the previous window.
Figure 4. Select Data Window
Each time data is downloaded from the instrument to the PC, a new file is created. Within each file, a new header is created every time the instrument is placed in the RUN mode.
The sequence options are:
1. Filename Sequence. Selecting this option sorts files in the database alphabetically by filename.
2. Serial # Sequence. Selecting this option sorts files in the database by analyzer serial number.
3. Date Sequence. Selecting this option sorts files in the database by date of the last update of the file.
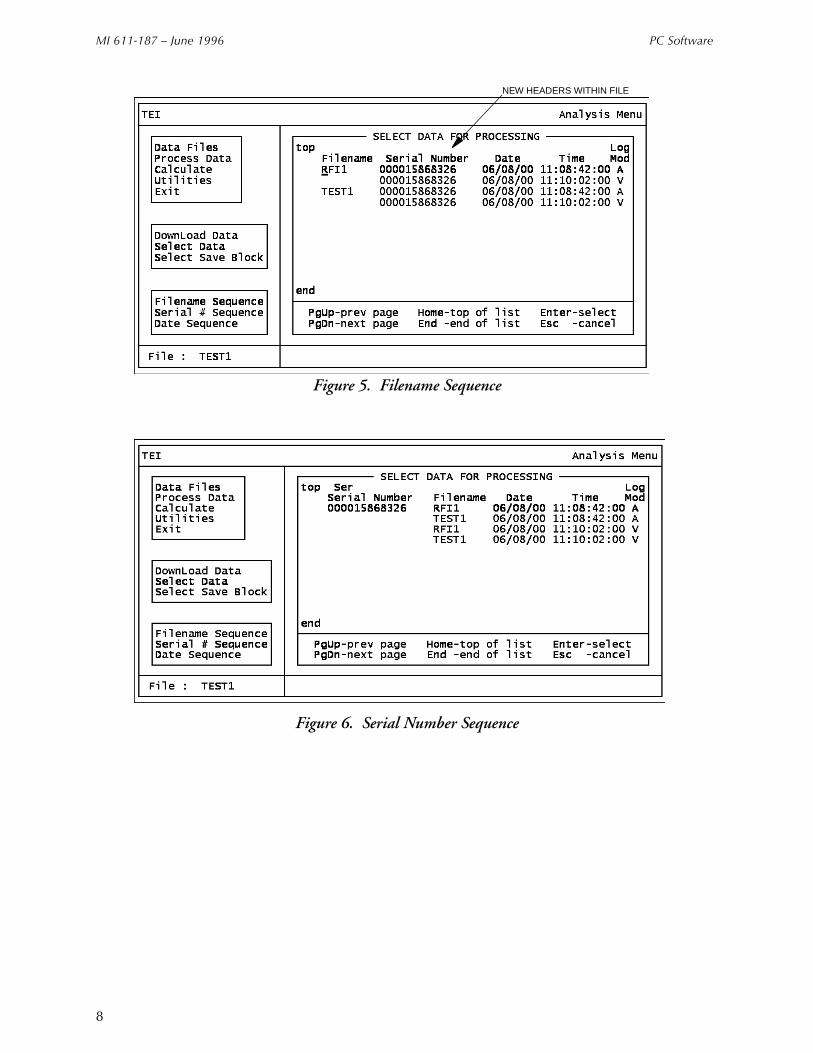
MI 611-187 – June 1996 PC Software
8
Figure 5. Filename Sequence
Figure 6. Serial Number Sequence
NEW HEADERS WITHIN FILE
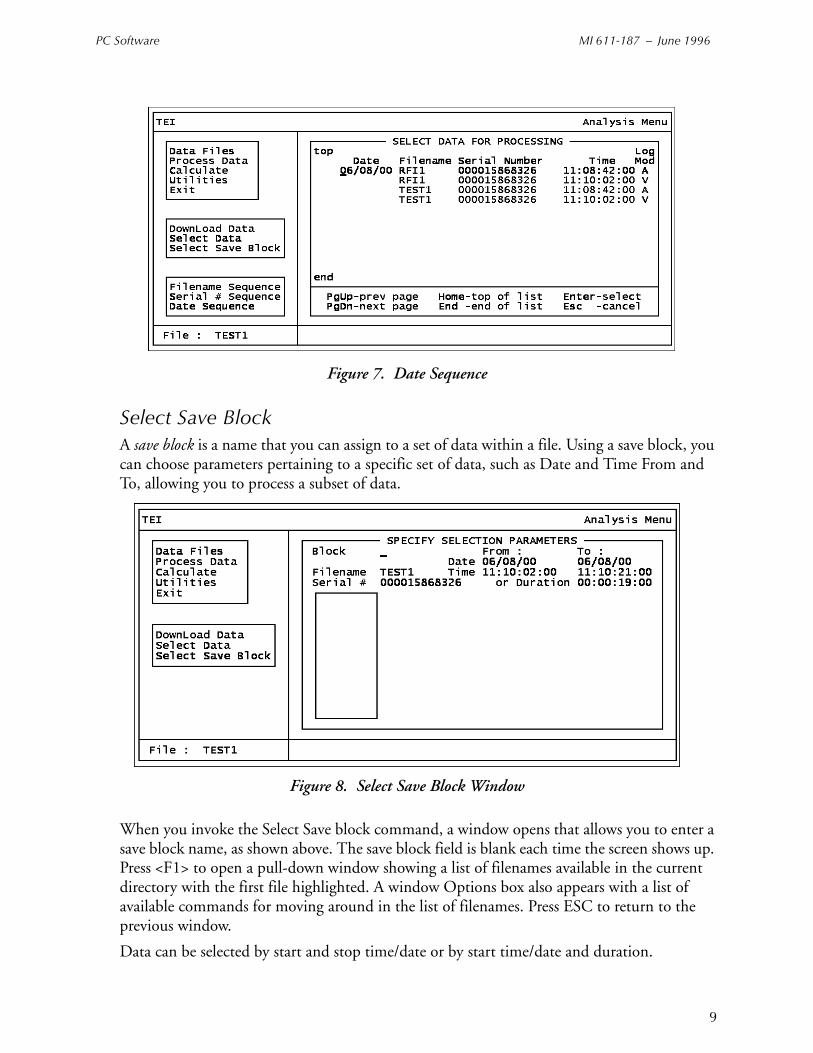
PC Software MI 611-187 – June 1996
9
Figure 7. Date Sequence
Select Save Block A save block is a name that you can assign to a set of data within a file. Using a save block, you can choose parameters pertaining to a specific set of data, such as Date and Time From and To, allowing you to process a subset of data.
Figure 8. Select Save Block Window
When you invoke the Select Save block command, a window opens that allows you to enter a save block name, as shown above. The save block field is blank each time the screen shows up. Press <F1> to open a pull-down window showing a list of filenames available in the current directory with the first file highlighted. A window Options box also appears with a list of available commands for moving around in the list of filenames. Press ESC to return to the previous window.
Data can be selected by start and stop time/date or by start time/date and duration.

MI 611-187 – June 1996 PC Software
10
Select block data by entering the FROM date and time and the TO date and time. As an alter-native, you can enter all 0’s for the TO time and then enter the DURATION. (The software then calculates the TO time by adding the DURATION to the FROM time.) Use the TAB key to move from field to field.
After you enter a save block name or select one from the list, the program allows you to change the date, time, or duration parameters. After you make an entry, a dialog box with two options, Confirm and Redo, appears. Choosing Redo or pressing ESC allows you to change the parameters again. Confirm changes the parameters and brings you back to the data file win-dow.
Process Data The Process Data group of functions is your means of printing or displaying data obtained from your TVA-1000. The screen below displays the menu of available options.
Figure 9. Process Data Menu
View Header When this option is selected, the complete set of header data is displayed as shown below in the upper screen. Press F7 to display the data logging status of the data block. Press F8 to switch between PID and FID data. Press F9 to enter header text as shown in the lower screen. Press F10 to print header and text data.
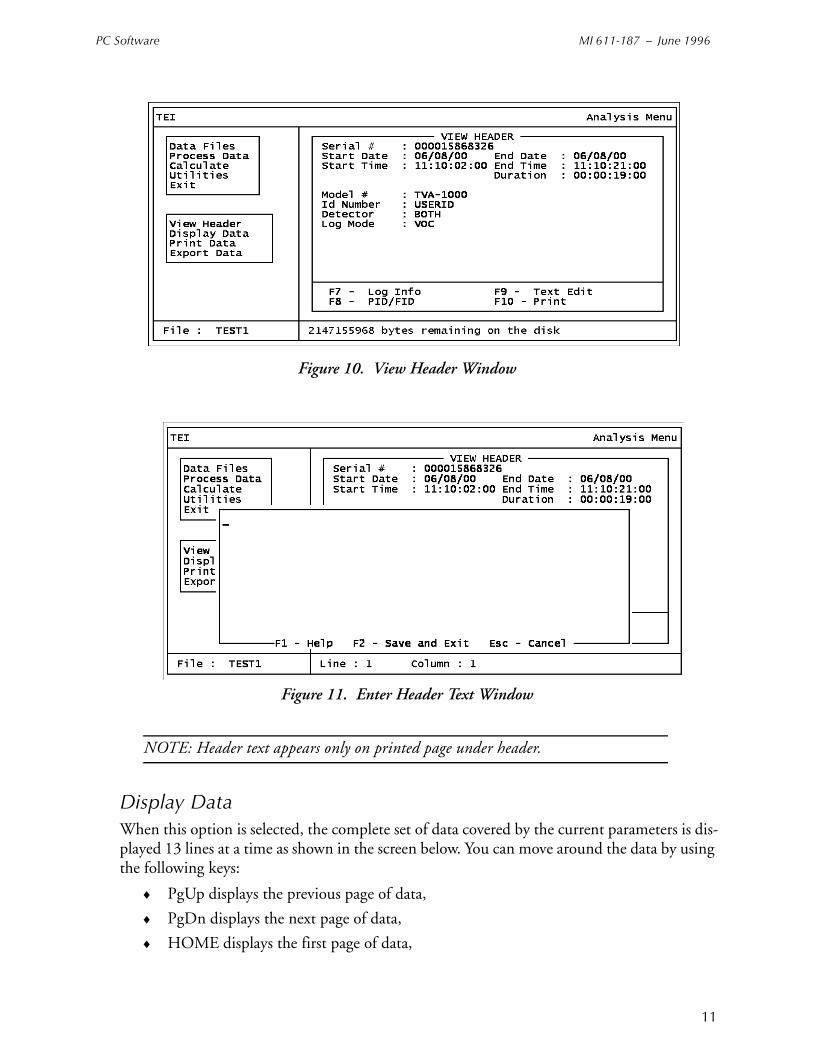
PC Software MI 611-187 – June 1996
11
Figure 10. View Header Window
Figure 11. Enter Header Text Window
NOTE: Header text appears only on printed page under header.
Display Data When this option is selected, the complete set of data covered by the current parameters is dis-played 13 lines at a time as shown in the screen below. You can move around the data by using the following keys:
♦ PgUp displays the previous page of data,
♦ PgDn displays the next page of data,
♦ HOME displays the first page of data,

MI 611-187 – June 1996 PC Software
12
♦ END displays the last page of data,
♦ ENTER works the same way as PgDn.
The top left corner of the display shows the word top if you’re at the top of the list. The bot-tom left corner of the display will show the word end if you are at the end of the list. Both cor-ners will show the word more if you’re neither at the top nor the end of the list. Pressing ESC returns you to the Process Data window. The alarm levels refer to the alarm levels shown in the header (L=Low Ceiling, H=High Ceiling, S=STEL).
Figure 12. Display Data Window
Print Data Choosing this option displays the window shown below. However, before that window comes up, the following message appears at the bottom of the current screen:
Selecting records for processing
The message remains until the selection process is complete.
Figure 13. Print Data Window

PC Software MI 611-187 – June 1996
13
Before starting, make sure that the printer is connected and turned on.
Pressing ENTER from the window gives the following message:
...... PRINTING IN PROGRESS......
...... Press ESC KEY TO CANCEL.....
Pressing ESC will give you the following message:
Print Cancelled. Press Any Key...
The following message appears when printing is done:
FINISHED PRINTING. Press ANY KEY...
Hitting any key returns you to the Process Data window.
The following figure shows a typical printout of logged data.
Figure 14. Typical Printout
Tag
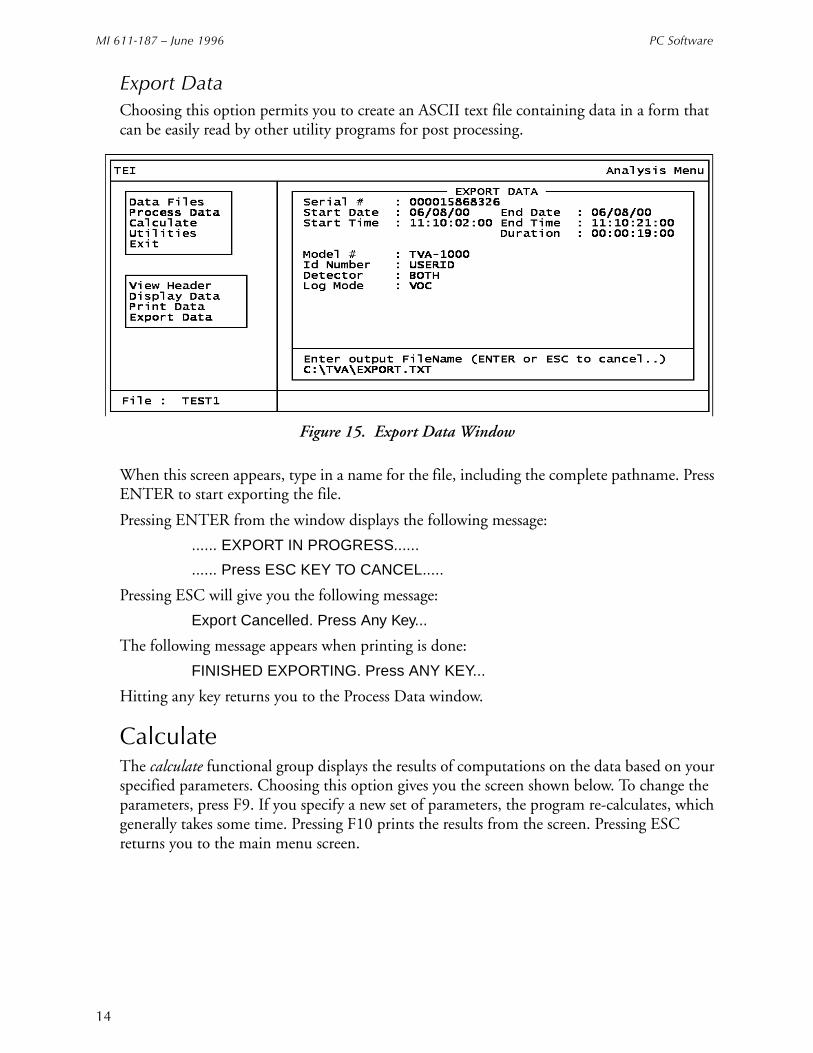
MI 611-187 – June 1996 PC Software
14
Export Data Choosing this option permits you to create an ASCII text file containing data in a form that can be easily read by other utility programs for post processing.
Figure 15. Export Data Window
When this screen appears, type in a name for the file, including the complete pathname. Press ENTER to start exporting the file.
Pressing ENTER from the window displays the following message:
...... EXPORT IN PROGRESS......
...... Press ESC KEY TO CANCEL.....
Pressing ESC will give you the following message:
Export Cancelled. Press Any Key...
The following message appears when printing is done:
FINISHED EXPORTING. Press ANY KEY...
Hitting any key returns you to the Process Data window.
Calculate The calculate functional group displays the results of computations on the data based on your specified parameters. Choosing this option gives you the screen shown below. To change the parameters, press F9. If you specify a new set of parameters, the program re-calculates, which generally takes some time. Pressing F10 prints the results from the screen. Pressing ESC returns you to the main menu screen.

PC Software MI 611-187 – June 1996
15
Figure 16. Calculate Window
The calculated data is defined as follows:
Minimum: Minimum value in the data block.
Maximum: Maximum value in the data block.
Average: Average value for the data block.
TWA: Time-weighted average for a 8-hour period. If less than 8 hours of data is available, N/A (Not Applicable) is displayed.
STEL: Maximum recorded Short Term Exposure Level (average value in a 15-minute window). If the data block is less than 10 minutes, N/A is displayed.
Pressing F9 displays the screen below. This screen permits you to select a block. (Press F1 for a list). Pressing ENTER causes the program to recalculate and display new values.
Figure 17. Recalculate Window
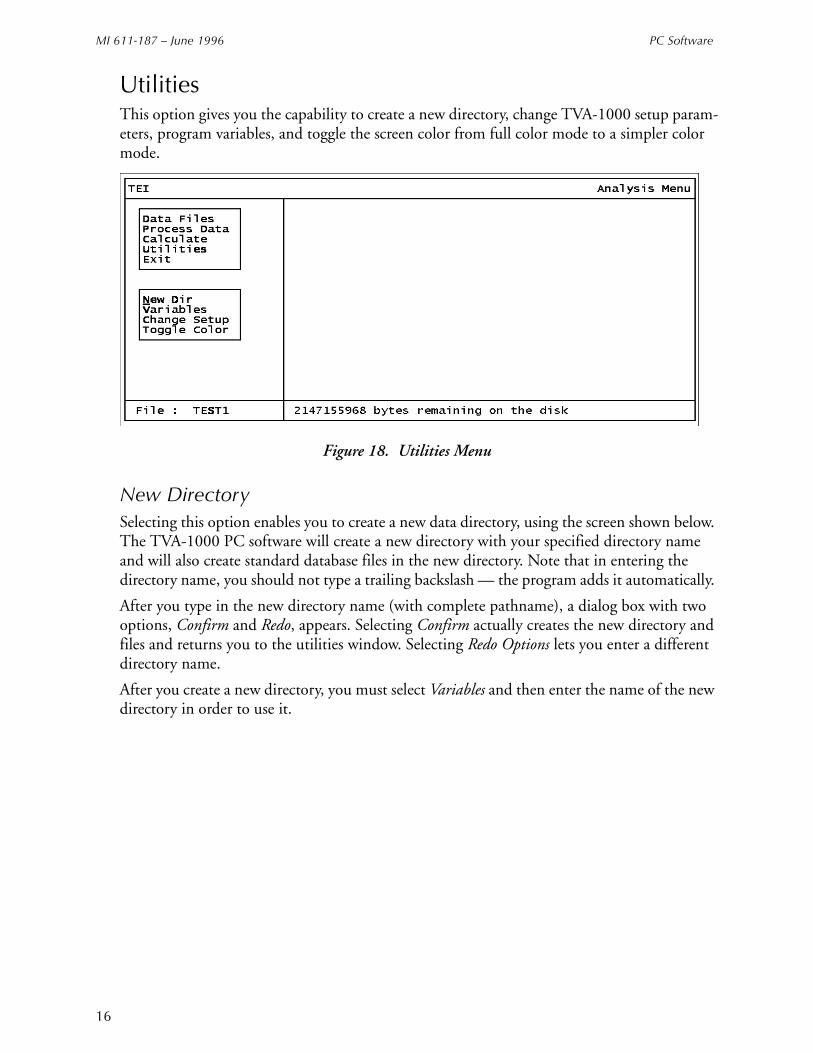
MI 611-187 – June 1996 PC Software
16
Utilities This option gives you the capability to create a new directory, change TVA-1000 setup param-eters, program variables, and toggle the screen color from full color mode to a simpler color mode.
Figure 18. Utilities Menu
New Directory Selecting this option enables you to create a new data directory, using the screen shown below. The TVA-1000 PC software will create a new directory with your specified directory name and will also create standard database files in the new directory. Note that in entering the directory name, you should not type a trailing backslash — the program adds it automatically.
After you type in the new directory name (with complete pathname), a dialog box with two options, Confirm and Redo, appears. Selecting Confirm actually creates the new directory and files and returns you to the utilities window. Selecting Redo Options lets you enter a different directory name.
After you create a new directory, you must select Variables and then enter the name of the new directory in order to use it.
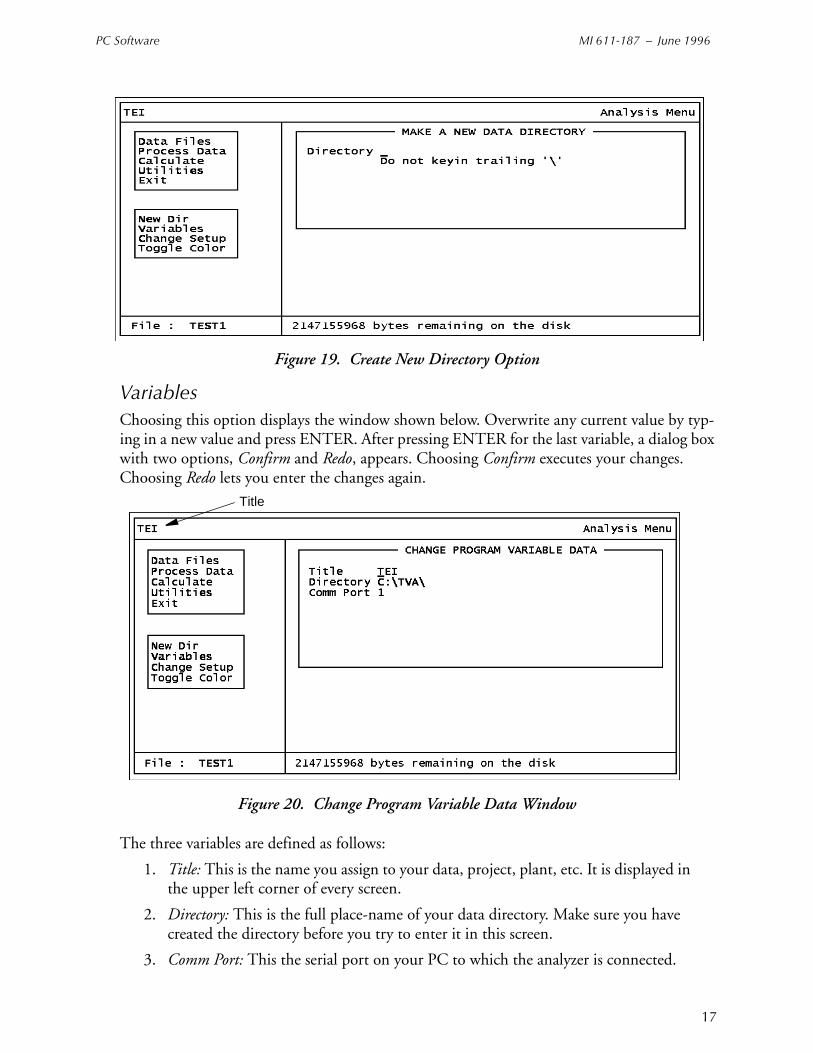
PC Software MI 611-187 – June 1996
17
Figure 19. Create New Directory Option
Variables Choosing this option displays the window shown below. Overwrite any current value by typ-ing in a new value and press ENTER. After pressing ENTER for the last variable, a dialog box with two options, Confirm and Redo, appears. Choosing Confirm executes your changes. Choosing Redo lets you enter the changes again.
Figure 20. Change Program Variable Data Window
The three variables are defined as follows:
1. Title: This is the name you assign to your data, project, plant, etc. It is displayed in the upper left corner of every screen.
2. Directory: This is the full place-name of your data directory. Make sure you have created the directory before you try to enter it in this screen.
3. Comm Port: This the serial port on your PC to which the analyzer is connected.
Title
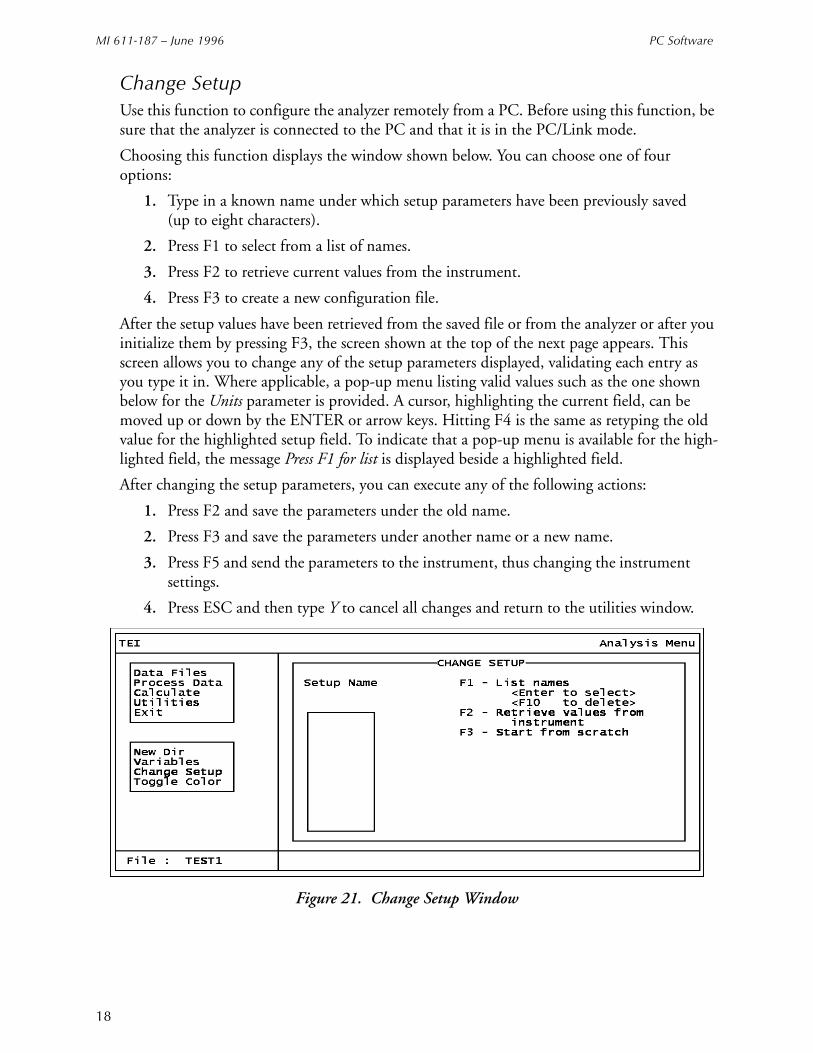
MI 611-187 – June 1996 PC Software
18
Change Setup Use this function to configure the analyzer remotely from a PC. Before using this function, be sure that the analyzer is connected to the PC and that it is in the PC/Link mode.
Choosing this function displays the window shown below. You can choose one of four options:
1. Type in a known name under which setup parameters have been previously saved (up to eight characters).
2. Press F1 to select from a list of names.
3. Press F2 to retrieve current values from the instrument.
4. Press F3 to create a new configuration file.
After the setup values have been retrieved from the saved file or from the analyzer or after you initialize them by pressing F3, the screen shown at the top of the next page appears. This screen allows you to change any of the setup parameters displayed, validating each entry as you type it in. Where applicable, a pop-up menu listing valid values such as the one shown below for the Units parameter is provided. A cursor, highlighting the current field, can be moved up or down by the ENTER or arrow keys. Hitting F4 is the same as retyping the old value for the highlighted setup field. To indicate that a pop-up menu is available for the high-lighted field, the message Press F1 for list is displayed beside a highlighted field.
After changing the setup parameters, you can execute any of the following actions:
1. Press F2 and save the parameters under the old name.
2. Press F3 and save the parameters under another name or a new name.
3. Press F5 and send the parameters to the instrument, thus changing the instrument settings.
4. Press ESC and then type Y to cancel all changes and return to the utilities window.
Figure 21. Change Setup Window

PC Software MI 611-187 – June 1996
19
Figure 22. Logging Screen (Press F7)
Figure 23. PID/FID Screen (Press F6)
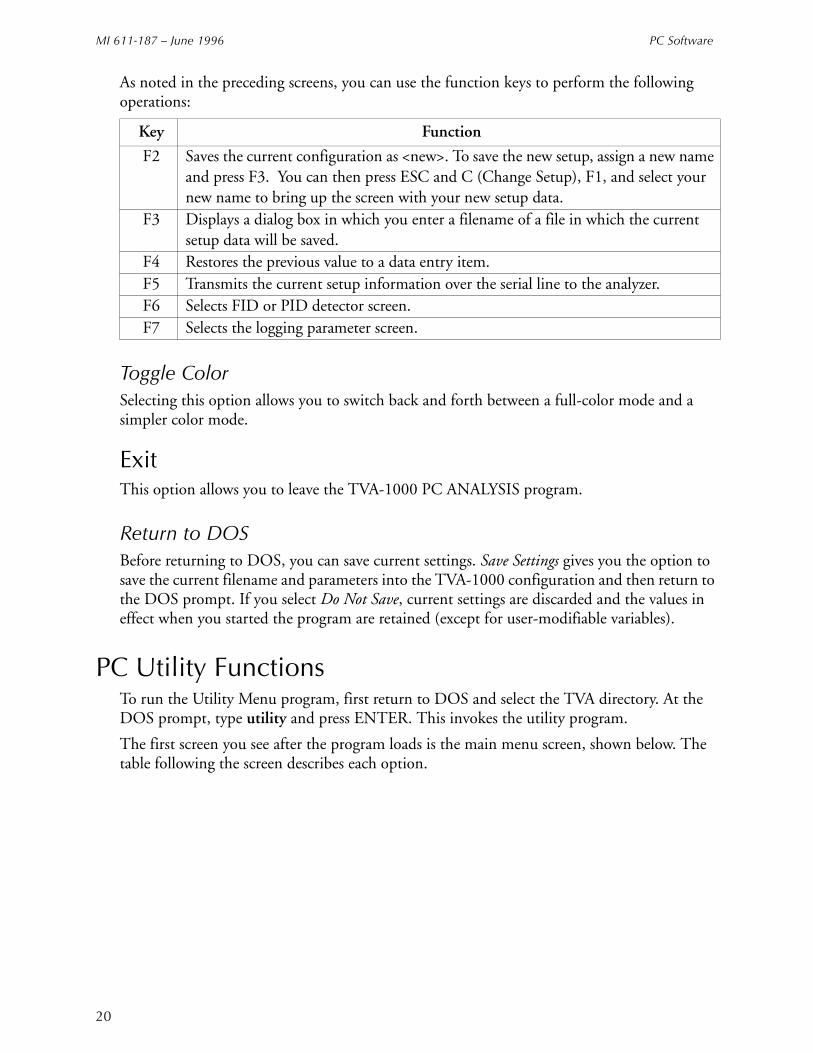
MI 611-187 – June 1996 PC Software
20
As noted in the preceding screens, you can use the function keys to perform the following operations:
Toggle Color Selecting this option allows you to switch back and forth between a full-color mode and a simpler color mode.
Exit This option allows you to leave the TVA-1000 PC ANALYSIS program.
Return to DOS Before returning to DOS, you can save current settings. Save Settings gives you the option to save the current filename and parameters into the TVA-1000 configuration and then return to the DOS prompt. If you select Do Not Save, current settings are discarded and the values in effect when you started the program are retained (except for user-modifiable variables).
PC Utility FunctionsTo run the Utility Menu program, first return to DOS and select the TVA directory. At the DOS prompt, type utility and press ENTER. This invokes the utility program.
The first screen you see after the program loads is the main menu screen, shown below. The table following the screen describes each option.
Key Function
F2 Saves the current configuration as <new>. To save the new setup, assign a new name and press F3. You can then press ESC and C (Change Setup), F1, and select your new name to bring up the screen with your new setup data.
F3 Displays a dialog box in which you enter a filename of a file in which the current setup data will be saved.
F4 Restores the previous value to a data entry item.F5 Transmits the current setup information over the serial line to the analyzer.F6 Selects FID or PID detector screen.F7 Selects the logging parameter screen.
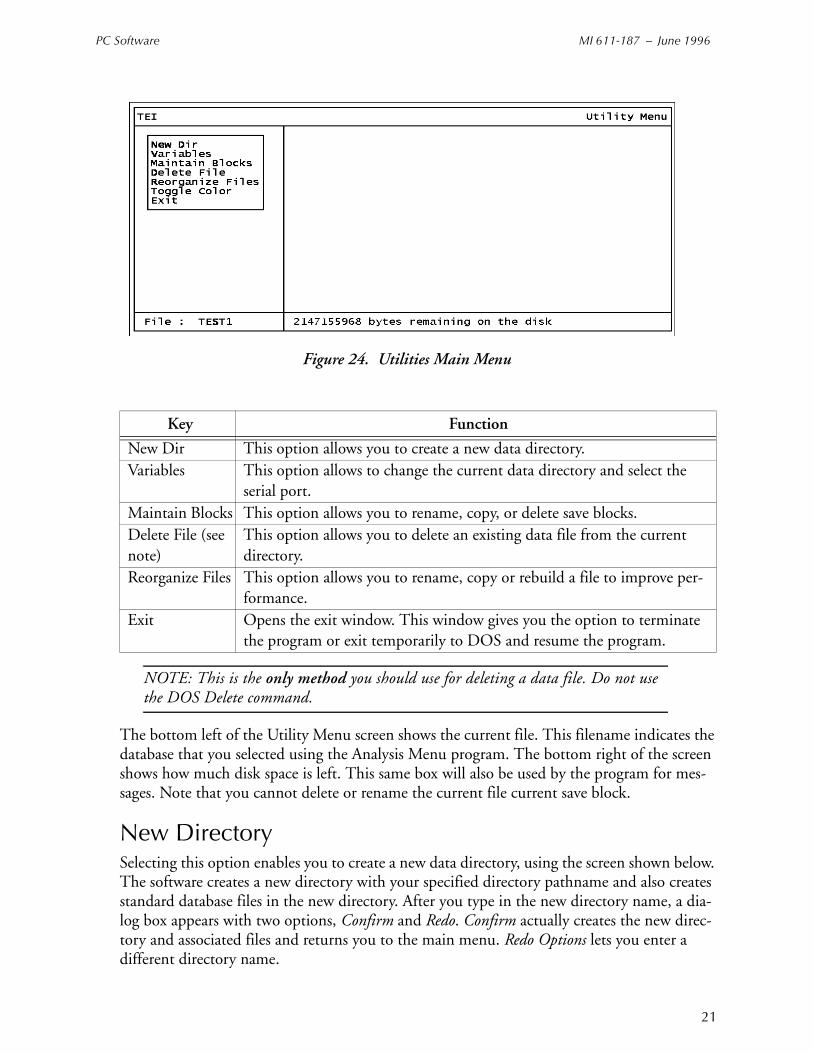
PC Software MI 611-187 – June 1996
21
Figure 24. Utilities Main Menu
NOTE: This is the only method you should use for deleting a data file. Do not use the DOS Delete command.
The bottom left of the Utility Menu screen shows the current file. This filename indicates the database that you selected using the Analysis Menu program. The bottom right of the screen shows how much disk space is left. This same box will also be used by the program for mes-sages. Note that you cannot delete or rename the current file current save block.
New Directory Selecting this option enables you to create a new data directory, using the screen shown below. The software creates a new directory with your specified directory pathname and also creates standard database files in the new directory. After you type in the new directory name, a dia-log box appears with two options, Confirm and Redo. Confirm actually creates the new direc-tory and associated files and returns you to the main menu. Redo Options lets you enter a different directory name.
Key Function
New Dir This option allows you to create a new data directory.Variables This option allows to change the current data directory and select the
serial port.Maintain Blocks This option allows you to rename, copy, or delete save blocks.Delete File (see note)
This option allows you to delete an existing data file from the current directory.
Reorganize Files This option allows you to rename, copy or rebuild a file to improve per-formance.
Exit Opens the exit window. This window gives you the option to terminate the program or exit temporarily to DOS and resume the program.
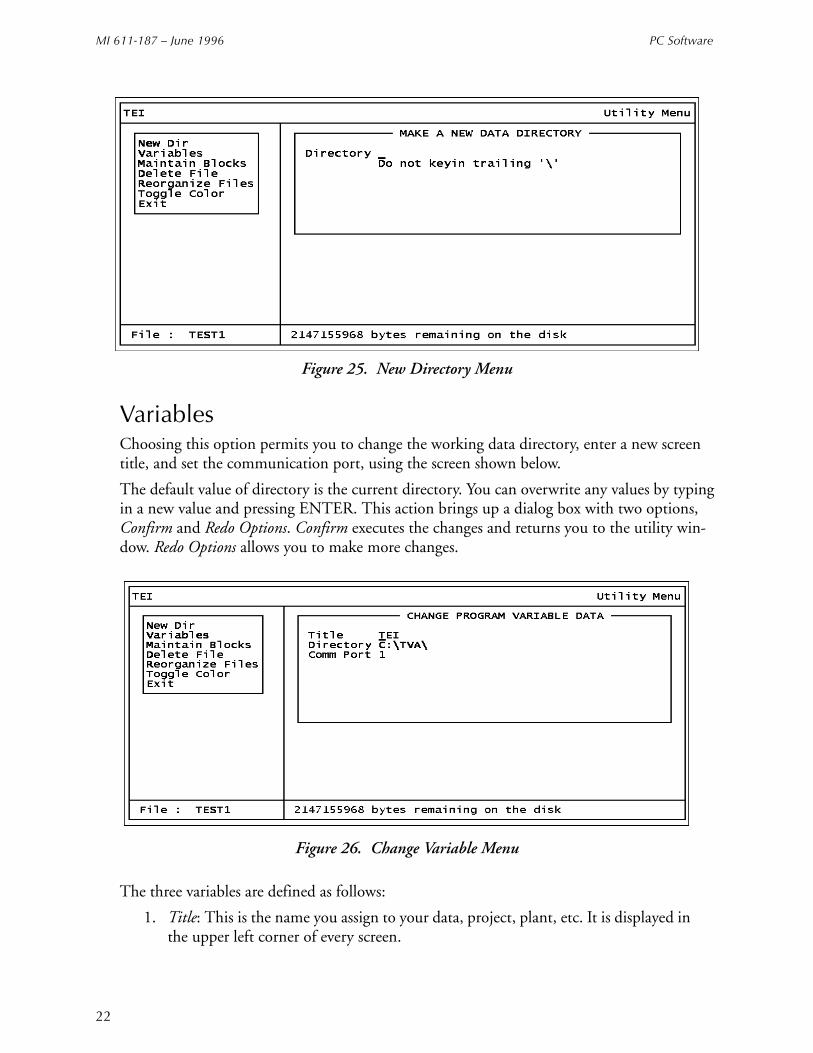
MI 611-187 – June 1996 PC Software
22
Figure 25. New Directory Menu
VariablesChoosing this option permits you to change the working data directory, enter a new screen title, and set the communication port, using the screen shown below.
The default value of directory is the current directory. You can overwrite any values by typing in a new value and pressing ENTER. This action brings up a dialog box with two options, Confirm and Redo Options. Confirm executes the changes and returns you to the utility win-dow. Redo Options allows you to make more changes.
Figure 26. Change Variable Menu
The three variables are defined as follows:
1. Title: This is the name you assign to your data, project, plant, etc. It is displayed in the upper left corner of every screen.

PC Software MI 611-187 – June 1996
23
2. Directory: This is the full pathname of your data directory. Make sure you have cre-ated the directory before you try to enter it in this screen.
3. Comm Port: This the serial port on your PC to which the analyzer is connected.
Maintain Blocks This option allows you to rename, copy, or delete Save Blocks created with the Analysis utility. When you invoke the Maintain Blocks command, a window opens allowing entry of a save block name, as shown in the screen below. The save block field is blank each time the screen appears. Pressing F1 opens a pull-down window that shows a list of filenames available in the current directory — with the first file highlighted. Pressing ESC returns you to the previous window.
NOTE: You cannot rename the currently selected block.
Figure 27. Maintain Blocks Option
Note that the Maintain Blocks window and several other windows display the Window Options box. The actions you may perform when this box is displayed, are:
You can move the highlighted bar up and down the list by using the cursor keys or space bar.
Key Function
ESC Allows you to enter the item manually
PgUp Displays the previous set of items
PgDn Displays the next set of items
Home Displays the first set of items
End Displays the last set of filenames
ENTER Allows you to select the highlighted item

MI 611-187 – June 1996 PC Software
24
You may also press the key corresponding to the first character of the item you wish to select. Unlike the menu windows, however, this simply highlights that item and does not actually select it. To select an item, press ENTER. The reason for this is that more than one item on the list may have the same first character. If so, the highlighted bar moves to the first item with that character, which may or may not be your choice. Use the cursor keys or space bar to move the highlighted bar further.
After typing in a save block name or selecting one from the list, a dialog box with three options, Rename, Copy, and Delete, is displayed. If you choose Rename or Copy, you are asked to type in a new save block name. (Note, however, that you cannot rename the current block.) Pressing ENTER will rename or copy the current save block to the new save block. The fol-lowing message then appears:
Save Block Renamed or
Save Block Copied
Choosing Delete displays another dialog box with two options, Confirm Delete and Redo Options. Choosing Confirm Delete deletes the save block and the following message appears:
Save Block Deleted
Choosing Redo Options takes you back to save block name entry.
Delete File Choosing this option (see note below) gives you the window shown below which allows you to type in a filename to be deleted. Pressing <F1> opens a pull-down window showing a list of filenames available in the current directory with the first filename highlighted. Pressing ESC returns you to the previous window. After typing in a filename or selecting one from the list, a dialog box with two options, Delete File and Select Another appears. Choosing Delete File deletes the file and Select Another returns you to filename entry.
Figure 28. Delete File Option
NOTE: This is the only method you should use for deleting a data file. Do not use the DOS Delete command.
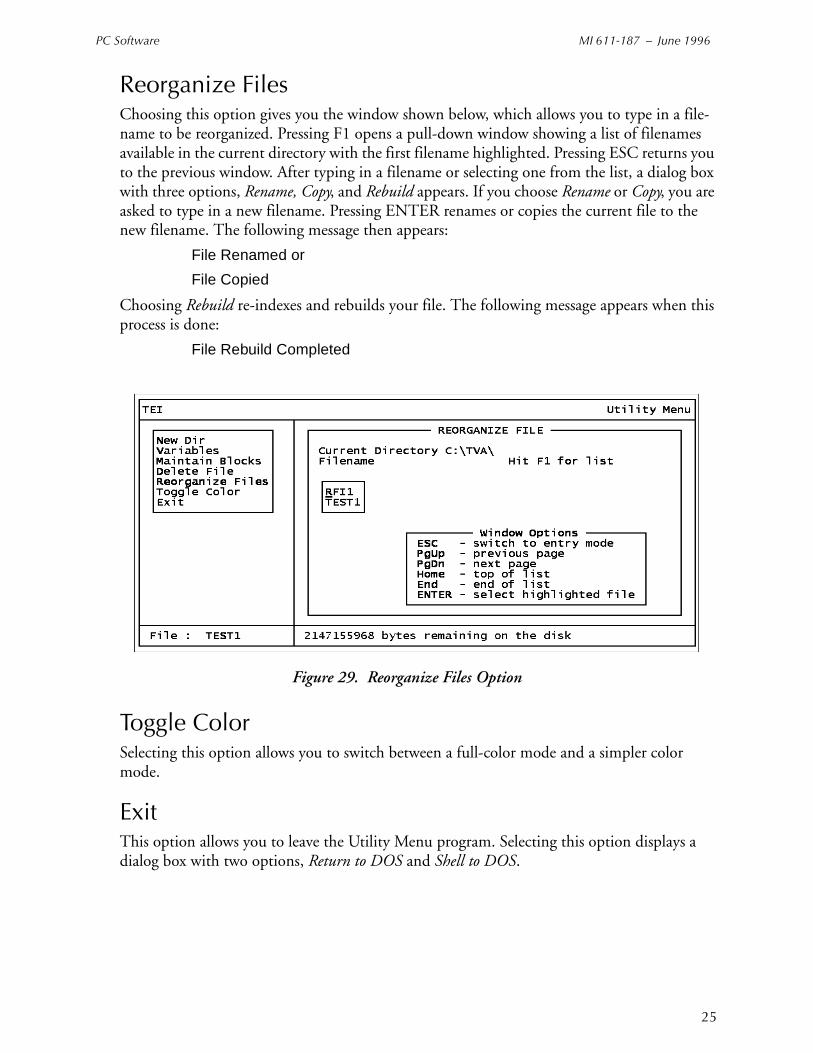
PC Software MI 611-187 – June 1996
25
Reorganize Files Choosing this option gives you the window shown below, which allows you to type in a file-name to be reorganized. Pressing F1 opens a pull-down window showing a list of filenames available in the current directory with the first filename highlighted. Pressing ESC returns you to the previous window. After typing in a filename or selecting one from the list, a dialog box with three options, Rename, Copy, and Rebuild appears. If you choose Rename or Copy, you are asked to type in a new filename. Pressing ENTER renames or copies the current file to the new filename. The following message then appears:
File Renamed or
File Copied
Choosing Rebuild re-indexes and rebuilds your file. The following message appears when this process is done:
File Rebuild Completed
Figure 29. Reorganize Files Option
Toggle Color Selecting this option allows you to switch between a full-color mode and a simpler color mode.
Exit This option allows you to leave the Utility Menu program. Selecting this option displays a dialog box with two options, Return to DOS and Shell to DOS.

MI 611-187 – June 1996 PC Software
26

27
Index
HHardware and Software Configuration 2
IInstallation 2
PPC Analysis
Calculate 14Change Setup 18Data File 5Display Data 11Download Data 5Exit 20Functions 4New Directory 16Process Data 10Return to DOS 20Select Data 7Select Save Block 9Shell to DOS 20Toggle Color 20Utilities 16Variables 17View Header 10
PC Software 1Overview 1Running the TVA-1000 PC Program 1Startup 2
PC UtilityDelete File 24Exit 25Functions 20Maintain Blocks 23New Directory 21Reorganize Files 25Toggle Color 25Variables 22

MI 611-187 – June 1996 Index
MB 121 Printed in U.S.A. 0696

Instruction MI 611-186June 1996
Personal Computer Interface Program (PCIP)Software for Interfacing a PC and an Analyzer

MI 611-186 – June 1996
TVA-1000 is a trademark of Thermo Environmental Instruments Inc.
Copyright 1996 by Thermo Environmental InstrumentsAll rights reserved
iii
Contents
Figures............................................................................................................................... v
Getting Started................................................................................................................. 1
Loading the PCIP Software ................................................................................................. 1
Configuring Your System .................................................................................................... 1
Connecting Your PC to the TVA-1000B Analyzer .............................................................. 4
Starting the PCIP Program ................................................................................................. 4
Overview .......................................................................................................................... 7
Reference Documents ......................................................................................................... 7
PCIP Functions .................................................................................................................. 7Using the PCIP Software Package .................................................................................. 8Main Menu Screen ......................................................................................................... 9PCIP Configuration Screen .......................................................................................... 10HELP Screen ................................................................................................................ 11File Menu Screen .......................................................................................................... 12File Receive Screen ....................................................................................................... 13File Send Screen ........................................................................................................... 14Typical File Edit Screen ................................................................................................ 15
Examples ........................................................................................................................ 17Receiving a File ............................................................................................................ 18Sending a File ............................................................................................................... 20Error Detection/Correction .......................................................................................... 21Mock Calibration File .................................................................................................. 23Mock Configuration File .............................................................................................. 24Mock Route File ........................................................................................................... 25
Index .............................................................................................................................. 27

MI 611-186 – June 1996 Contents
iv

v
Figures
1 Microsoft Diagnostic Screen 1 ..................................................................................... 1 2 Microsoft Diagnostic Screen 2 ..................................................................................... 2 3 Microsoft Diagnostic Screen 3 ..................................................................................... 2 4 Microsoft Diagnostic Screen 4 ..................................................................................... 3 5 Microsoft Diagnostic Screen 5 ..................................................................................... 3 6 Main Menu Screen ....................................................................................................... 4 7 PCIP Configuration Screen .......................................................................................... 5 8 System Setup ................................................................................................................ 7 9 Main Menu Screen ....................................................................................................... 9
10 Configuration Screen ................................................................................................... 10 11 Typical HELP Screen ................................................................................................... 11 12 File Menu Screen ......................................................................................................... 12 13 File Receive Screen ....................................................................................................... 13 14 File Send Screen ........................................................................................................... 14 15 Typical File Edit Screen ............................................................................................... 15 16 Mock Calibration File – Screen 1 ................................................................................. 23 17 Mock Calibration File – Screen 2 ................................................................................. 23 18 Mock Configuration File – Screen 1 ............................................................................ 24 19 Mock Configuration File – Screen 2 ............................................................................ 24 20 Mock Configuration File – Screen 3 ............................................................................ 24 21 Mock Route File – Screen 1 ......................................................................................... 25 22 Mock Route File – Screen 2 ......................................................................................... 25

MI 611-186 – June 1996 Figures
vi

1
Getting Started
Loading the PCIP SoftwareThe TVA-1000B PC Interface Package software consists of files distributed on one 3.5-in diskette. The main files are:
♦ pcip.exe Executable program file♦ pcip.cfg Configuration file ♦ pcip.hlp Help file
♦ pcip.def Instrument definition file
The program can be executed from Windows or directly from DOS.
The load procedure is as follows:
1. On your PC (or network), create a directory for the PCIP software on your work-ing drive. You may also want to create a different directory to hold the various data files for your application. If not, you can use the same directory for both PCIP and data files.
2. Insert the distribution diskette into your diskette drive.
3. Copy all files from the distribution diskette to your new PCIP directory. This completes the load procedure.
Configuring Your SystemBefore attempting to run the PCIP software, check the configuration of serial ports on your PC, using the following procedure (for DOS Version 3.1 or greater):
1. Close your files and exit from Windows.
2. Change to your root directory by typing cd:\<Enter>.
3. Type MSD. The following screen, or something similar, appears.
Figure 1. Microsoft Diagnostic Screen 1

MI 611-186 – June 1996 Getting Started
2
NOTE: In order for the analyzer and a personal computer to communicate, the PC must be equipped with a serial port configured with its own unique IRQ (interrupt request). If, for example, you will be using COM2 with an IRQ of 3, no other device can share this interrupt.
The next screen appears automatically.
Figure 2. Microsoft Diagnostic Screen 2
4. Click on Com Ports (or type “C”). This displays the status of your serial COM ports, as shown in the next screen.
Figure 3. Microsoft Diagnostic Screen 3
5. Note the parameters for your serial ports. The PCIP configuration must be set to match these settings.
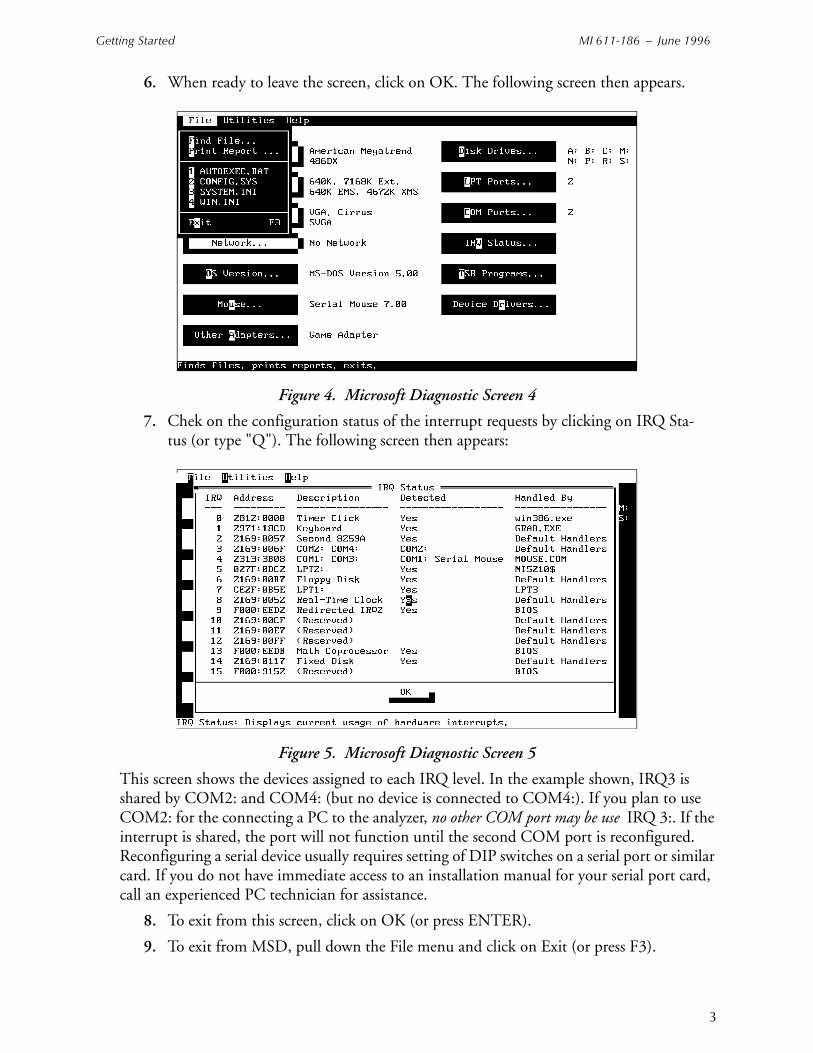
Getting Started MI 611-186 – June 1996
3
6. When ready to leave the screen, click on OK. The following screen then appears.
Figure 4. Microsoft Diagnostic Screen 4
7. Chek on the configuration status of the interrupt requests by clicking on IRQ Sta-tus (or type "Q"). The following screen then appears:
Figure 5. Microsoft Diagnostic Screen 5
This screen shows the devices assigned to each IRQ level. In the example shown, IRQ3 is shared by COM2: and COM4: (but no device is connected to COM4:). If you plan to use COM2: for the connecting a PC to the analyzer, no other COM port may be use IRQ 3:. If the interrupt is shared, the port will not function until the second COM port is reconfigured. Reconfiguring a serial device usually requires setting of DIP switches on a serial port or similar card. If you do not have immediate access to an installation manual for your serial port card, call an experienced PC technician for assistance.
8. To exit from this screen, click on OK (or press ENTER).
9. To exit from MSD, pull down the File menu and click on Exit (or press F3).
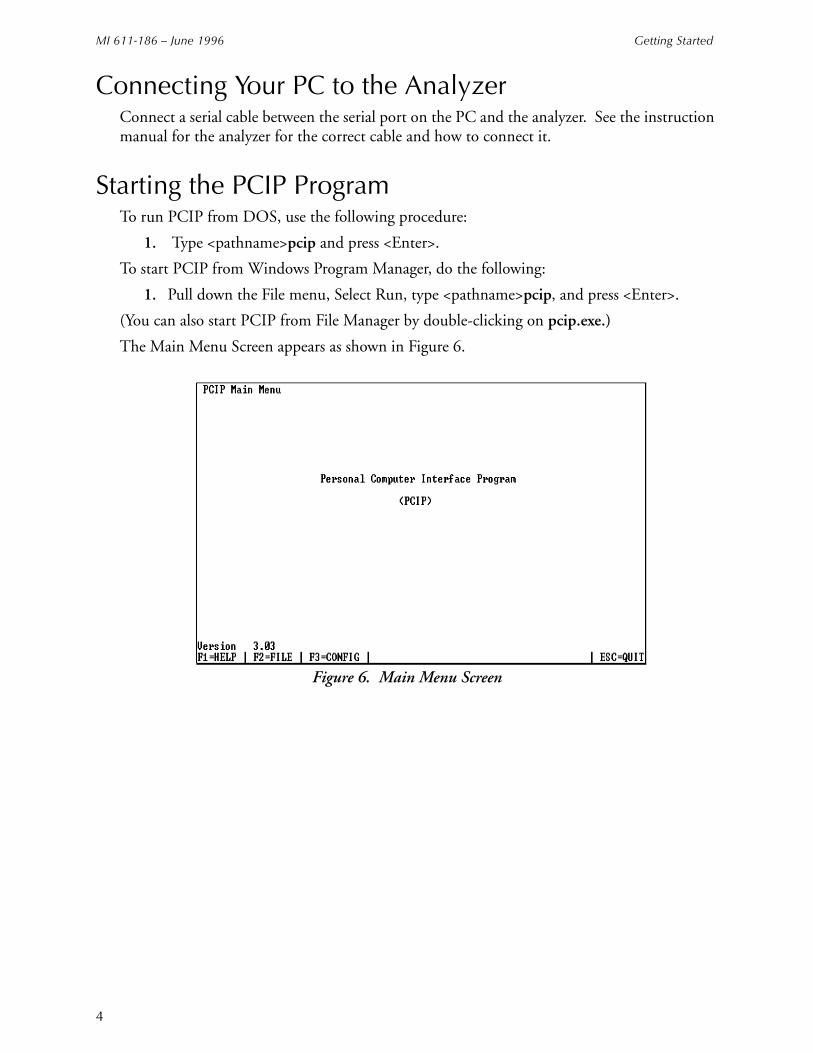
MI 611-186 – June 1996 Getting Started
4
Connecting Your PC to the AnalyzerConnect a serial cable between the serial port on the PC and the analyzer. See the instruction manual for the analyzer for the correct cable and how to connect it.
Starting the PCIP ProgramTo run PCIP from DOS, use the following procedure:
1. Type <pathname>pcip and press <Enter>.
To start PCIP from Windows Program Manager, do the following:
1. Pull down the File menu, Select Run, type <pathname>pcip, and press <Enter>.
(You can also start PCIP from File Manager by double-clicking on pcip.exe.)
The Main Menu Screen appears as shown in Figure 6.
Figure 6. Main Menu Screen
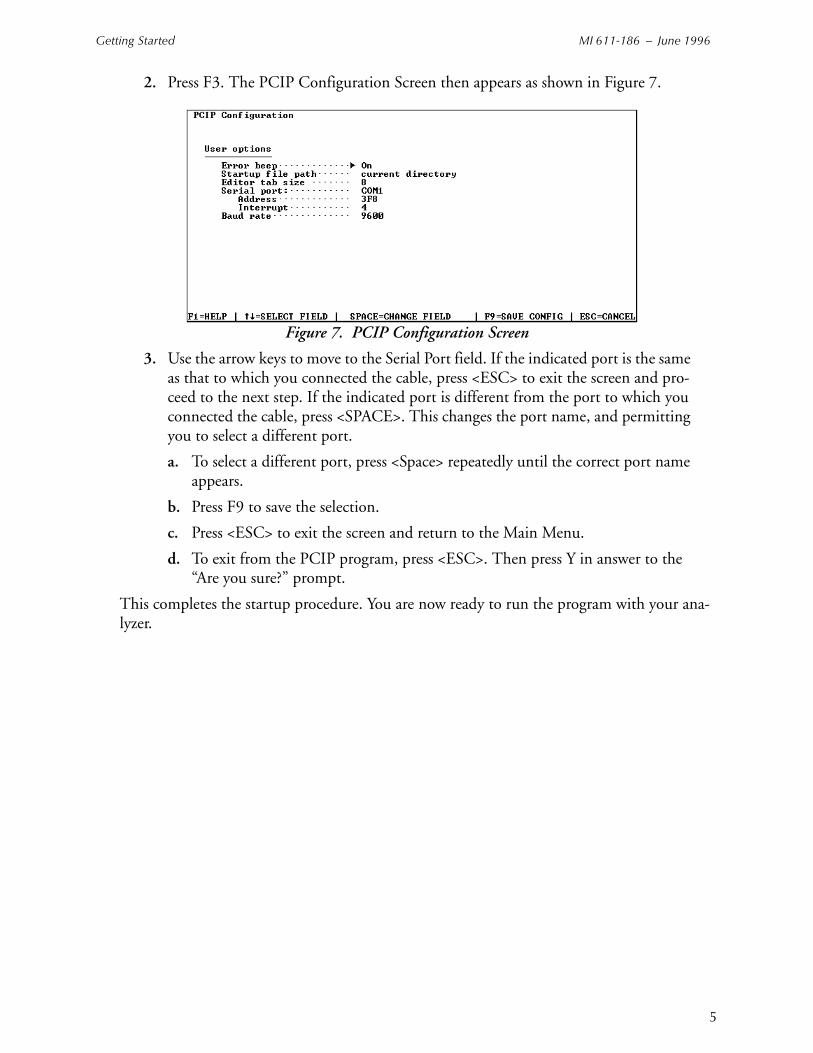
Getting Started MI 611-186 – June 1996
5
2. Press F3. The PCIP Configuration Screen then appears as shown in Figure 7.
Figure 7. PCIP Configuration Screen
3. Use the arrow keys to move to the Serial Port field. If the indicated port is the same as that to which you connected the cable, press <ESC> to exit the screen and pro-ceed to the next step. If the indicated port is different from the port to which you connected the cable, press <SPACE>. This changes the port name, and permitting you to select a different port.
a. To select a different port, press <Space> repeatedly until the correct port name appears.
b. Press F9 to save the selection.
c. Press <ESC> to exit the screen and return to the Main Menu.
d. To exit from the PCIP program, press <ESC>. Then press Y in answer to the “Are you sure?” prompt.
This completes the startup procedure. You are now ready to run the program with your ana-lyzer.

MI 611-186 – June 1996 Getting Started
6
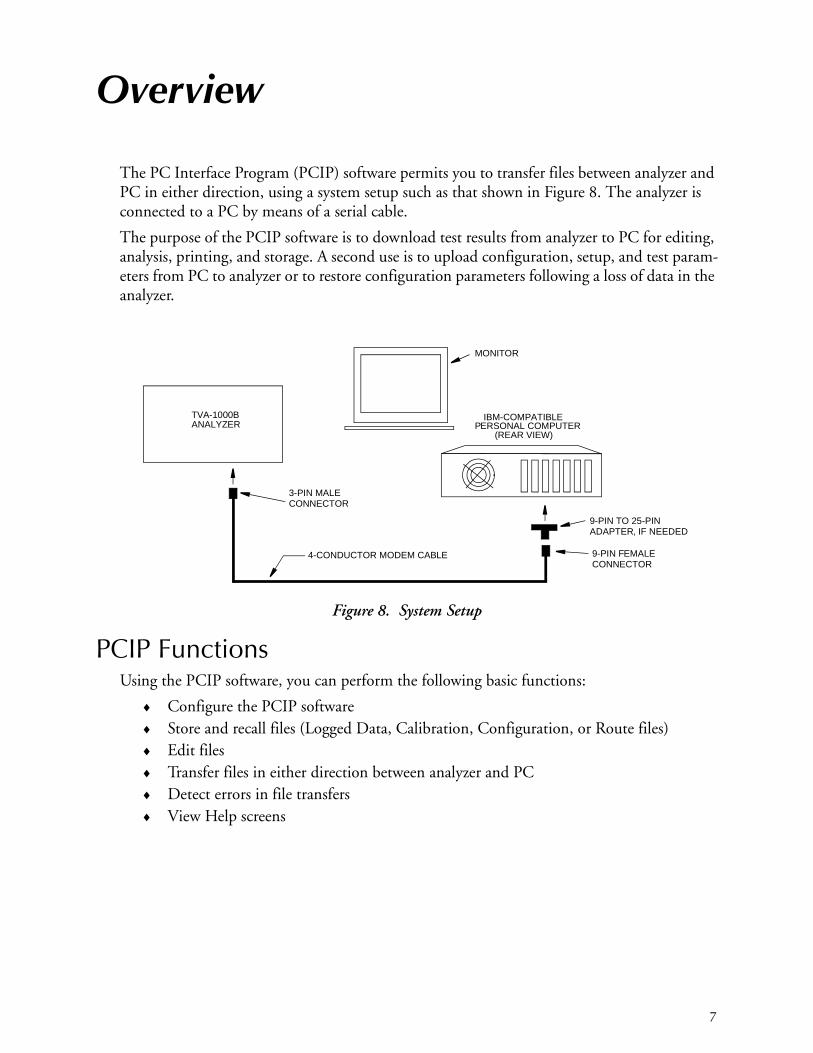
7
Overview
The PC Interface Program (PCIP) software permits you to transfer files between analyzer and PC in either direction, using a system setup such as that shown in Figure 8. The analyzer is connected to a PC by means of a serial cable.
The purpose of the PCIP software is to download test results from analyzer to PC for editing, analysis, printing, and storage. A second use is to upload configuration, setup, and test param-eters from PC to analyzer or to restore configuration parameters following a loss of data in the analyzer.
Figure 8. System Setup
PCIP FunctionsUsing the PCIP software, you can perform the following basic functions:
♦ Configure the PCIP software♦ Store and recall files (Logged Data, Calibration, Configuration, or Route files)♦ Edit files♦ Transfer files in either direction between analyzer and PC♦ Detect errors in file transfers♦ View Help screens
4-CONDUCTOR MODEM CABLE
3-PIN MALECONNECTOR
9-PIN FEMALECONNECTOR
9-PIN TO 25-PIN ADAPTER, IF NEEDED
PERSONAL COMPUTERIBM-COMPATIBLE
MONITOR
(REAR VIEW)ANALYZERTVA-1000B
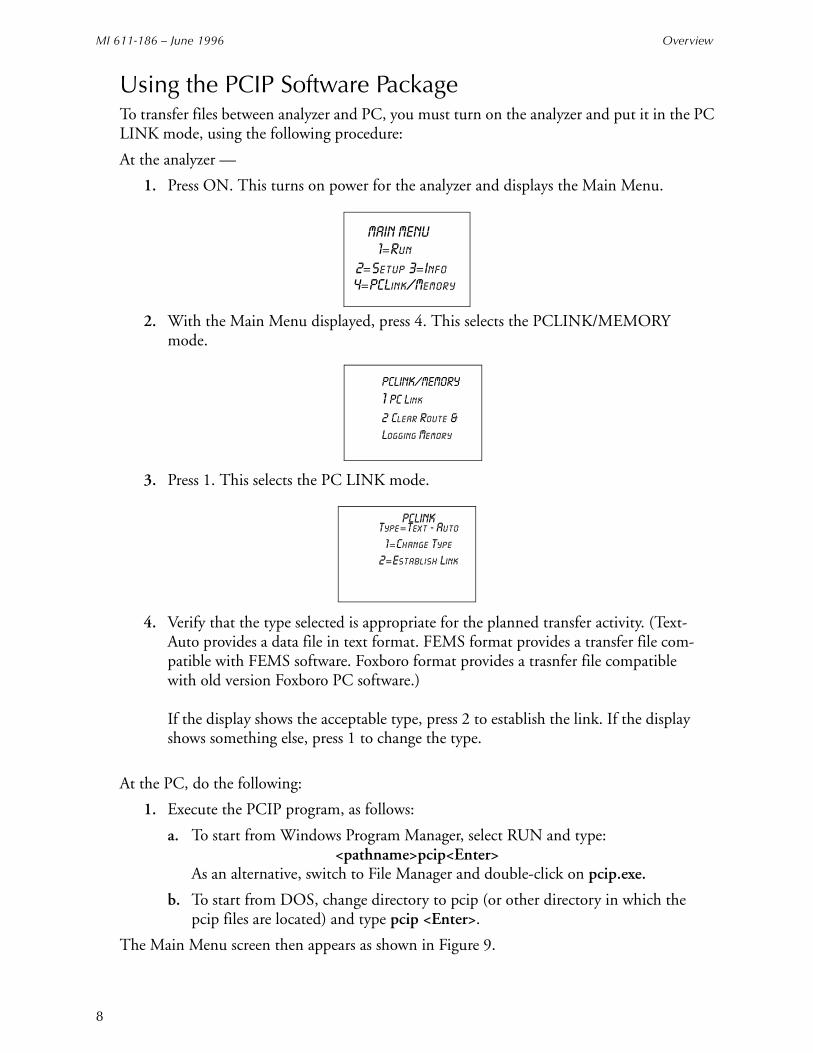
MI 611-186 – June 1996 Overview
8
Using the PCIP Software PackageTo transfer files between analyzer and PC, you must turn on the analyzer and put it in the PC LINK mode, using the following procedure:
At the analyzer —
1. Press ON. This turns on power for the analyzer and displays the Main Menu.
2. With the Main Menu displayed, press 4. This selects the PCLINK/MEMORY mode.
3. Press 1. This selects the PC LINK mode.
4. Verify that the type selected is appropriate for the planned transfer activity. (Text-Auto provides a data file in text format. FEMS format provides a transfer file com-patible with FEMS software. Foxboro format provides a trasnfer file compatible with old version Foxboro PC software.)
If the display shows the acceptable type, press 2 to establish the link. If the display shows something else, press 1 to change the type.
At the PC, do the following:
1. Execute the PCIP program, as follows:
a. To start from Windows Program Manager, select RUN and type: <pathname>pcip<Enter> As an alternative, switch to File Manager and double-click on pcip.exe.
b. To start from DOS, change directory to pcip (or other directory in which the pcip files are located) and type pcip <Enter>.
The Main Menu screen then appears as shown in Figure 9.
MAIN MENU 1=Run
2=Setup 3=Info4=PCLink/Memory
PCLINK/MEMORY
1 =PC Link
2= Clear Route &Logging Memory
PCLINKType=Text - Auto
1=Change Type
2=Establish Link
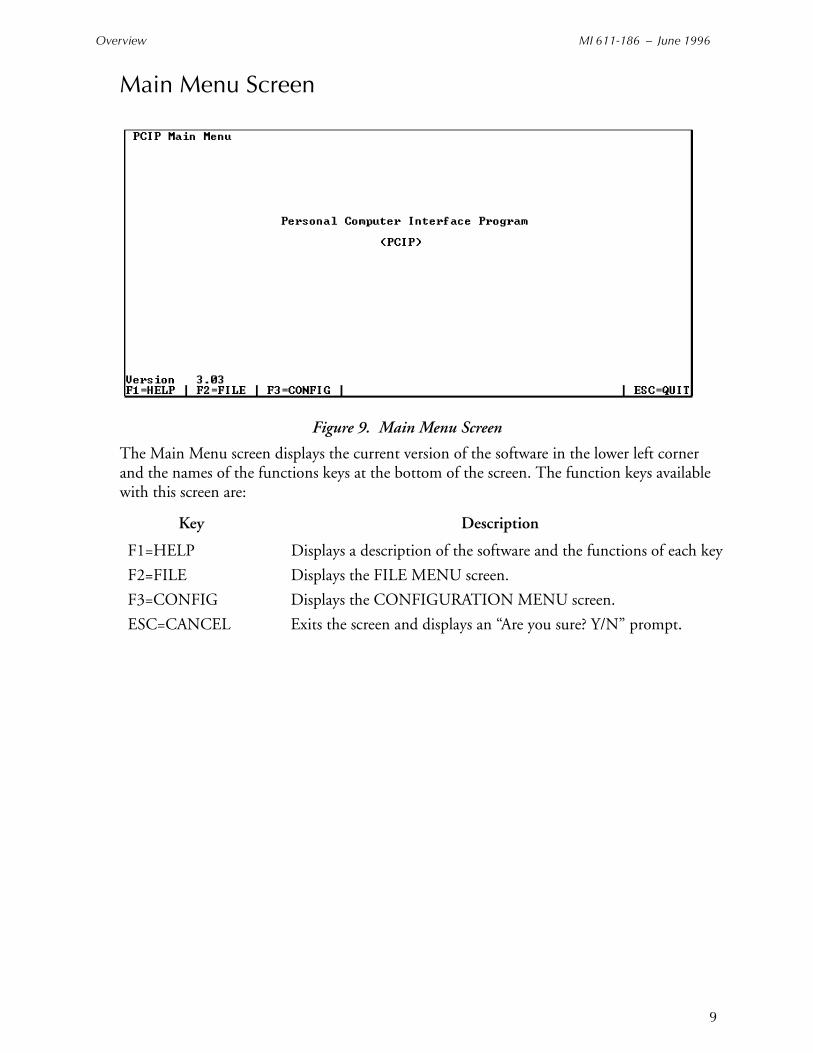
Overview MI 611-186 – June 1996
9
Main Menu Screen
Figure 9. Main Menu Screen
The Main Menu screen displays the current version of the software in the lower left corner and the names of the functions keys at the bottom of the screen. The function keys available with this screen are:
Key Description
F1=HELP Displays a description of the software and the functions of each key
F2=FILE Displays the FILE MENU screen.
F3=CONFIG Displays the CONFIGURATION MENU screen.
ESC=CANCEL Exits the screen and displays an “Are you sure? Y/N” prompt.
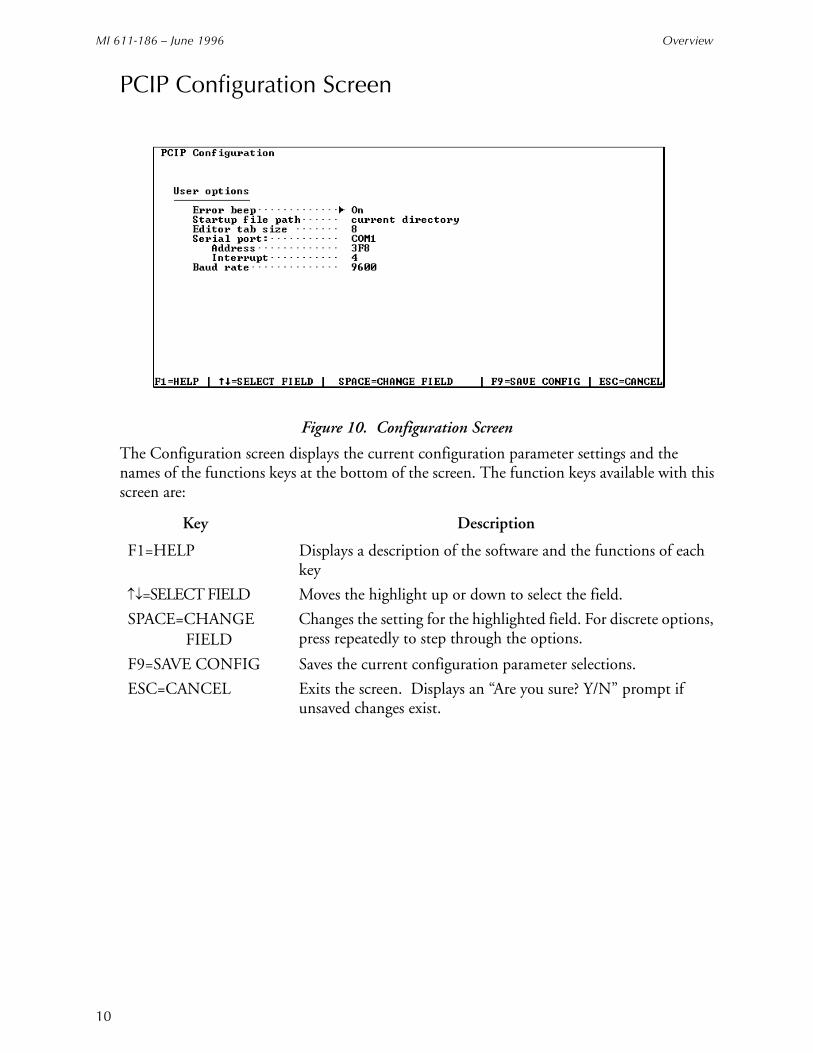
MI 611-186 – June 1996 Overview
10
PCIP Configuration Screen
Figure 10. Configuration Screen
The Configuration screen displays the current configuration parameter settings and the names of the functions keys at the bottom of the screen. The function keys available with this screen are:
Key Description
F1=HELP Displays a description of the software and the functions of each key
↑↓=SELECT FIELD Moves the highlight up or down to select the field.
SPACE=CHANGE FIELD
Changes the setting for the highlighted field. For discrete options, press repeatedly to step through the options.
F9=SAVE CONFIG Saves the current configuration parameter selections.
ESC=CANCEL Exits the screen. Displays an “Are you sure? Y/N” prompt if unsaved changes exist.
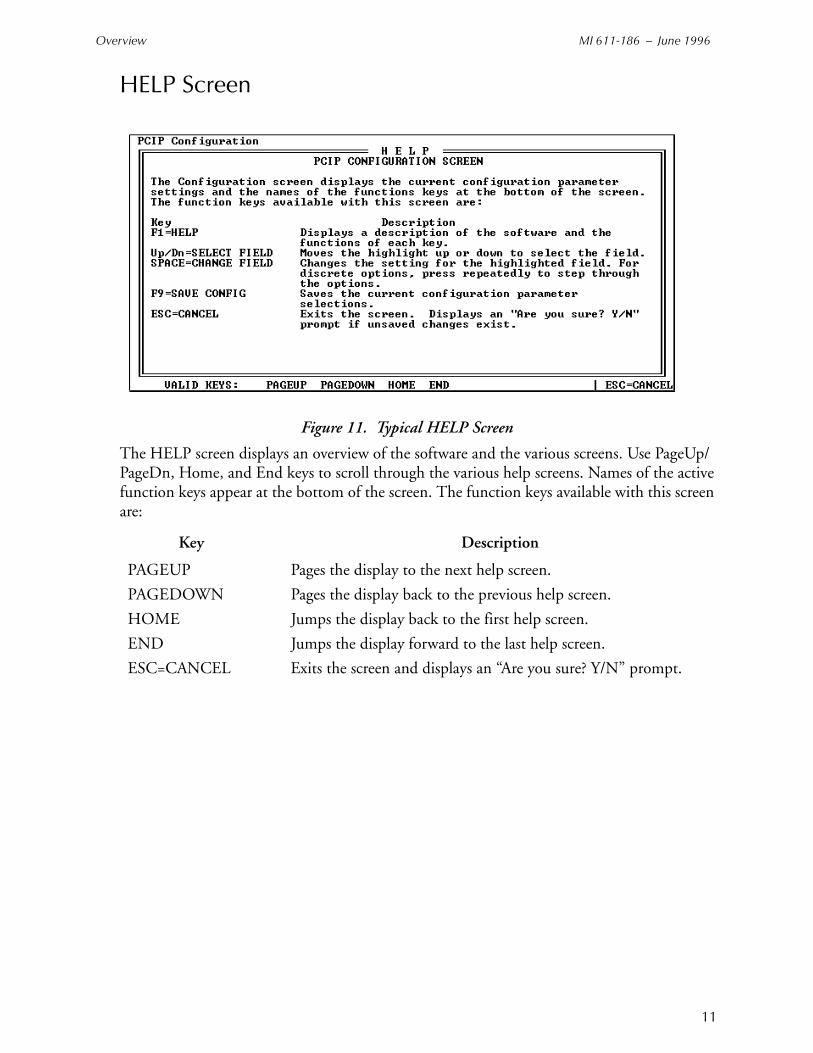
Overview MI 611-186 – June 1996
11
HELP Screen
Figure 11. Typical HELP Screen
The HELP screen displays an overview of the software and the various screens. Use PageUp/PageDn, Home, and End keys to scroll through the various help screens. Names of the active function keys appear at the bottom of the screen. The function keys available with this screen are:
Key Description
PAGEUP Pages the display to the next help screen.
PAGEDOWN Pages the display back to the previous help screen.
HOME Jumps the display back to the first help screen.
END Jumps the display forward to the last help screen.
ESC=CANCEL Exits the screen and displays an “Are you sure? Y/N” prompt.
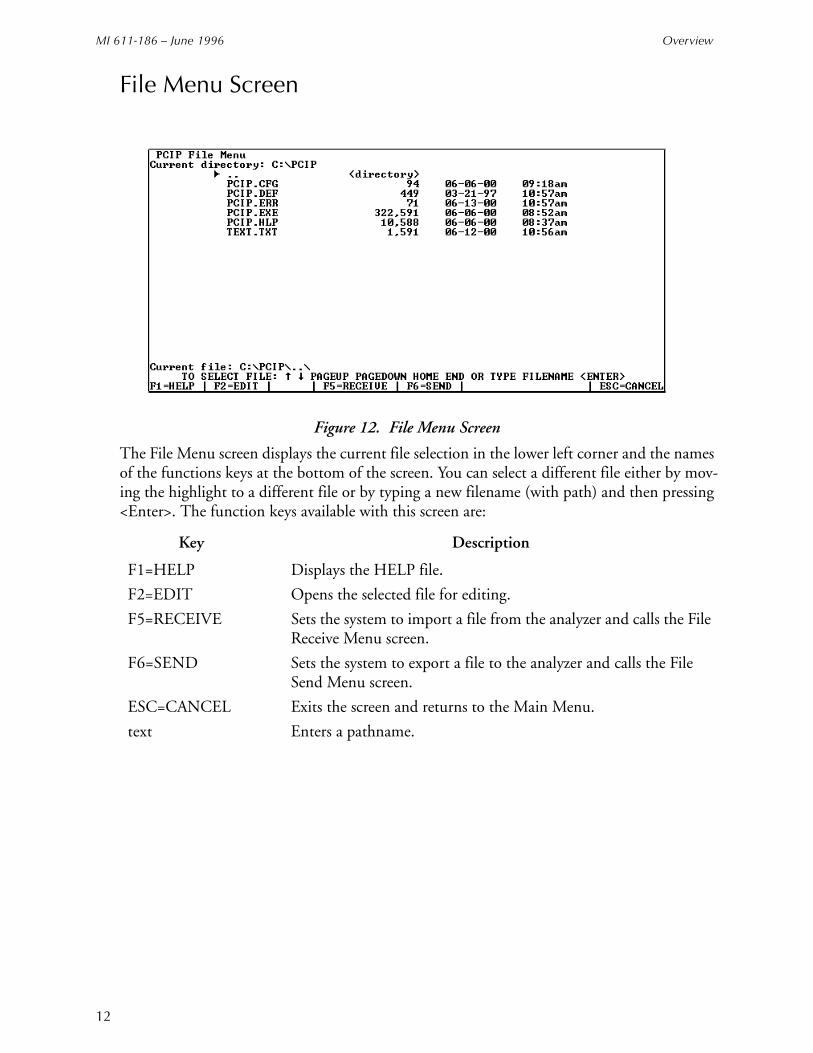
MI 611-186 – June 1996 Overview
12
File Menu Screen
Figure 12. File Menu Screen
The File Menu screen displays the current file selection in the lower left corner and the names of the functions keys at the bottom of the screen. You can select a different file either by mov-ing the highlight to a different file or by typing a new filename (with path) and then pressing <Enter>. The function keys available with this screen are:
Key Description
F1=HELP Displays the HELP file.
F2=EDIT Opens the selected file for editing.
F5=RECEIVE Sets the system to import a file from the analyzer and calls the File Receive Menu screen.
F6=SEND Sets the system to export a file to the analyzer and calls the File Send Menu screen.
ESC=CANCEL Exits the screen and returns to the Main Menu.
text Enters a pathname.
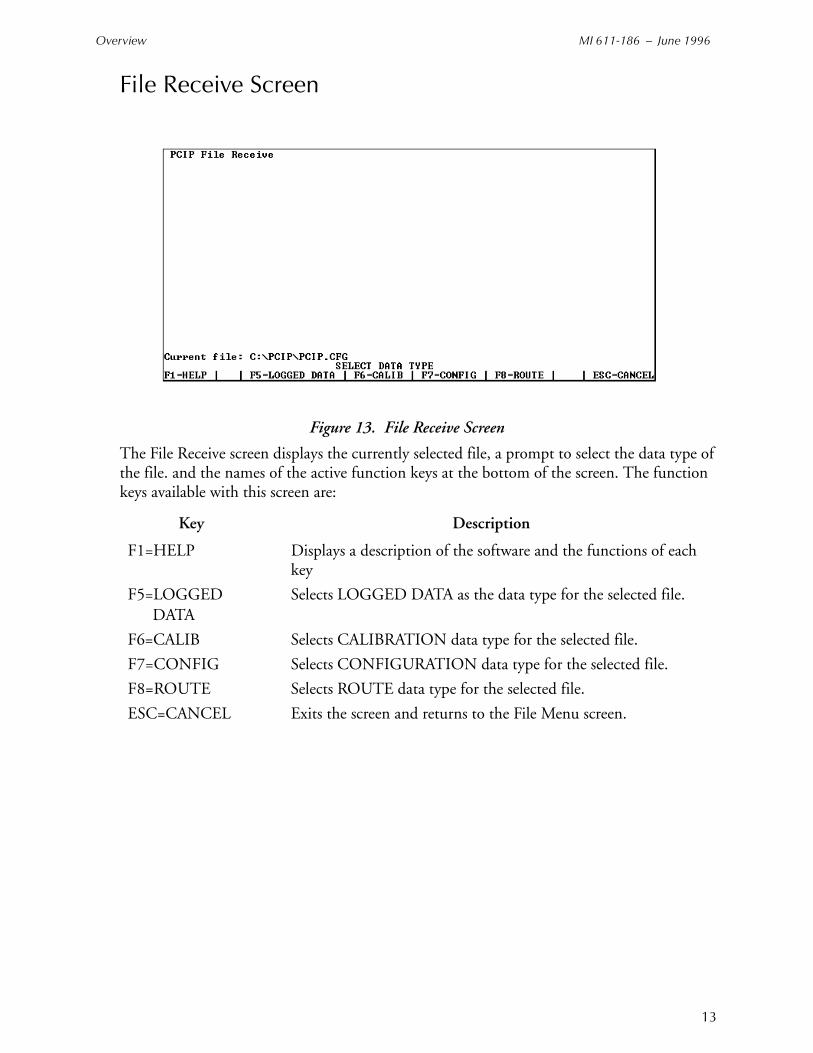
Overview MI 611-186 – June 1996
13
File Receive Screen
Figure 13. File Receive Screen
The File Receive screen displays the currently selected file, a prompt to select the data type of the file. and the names of the active function keys at the bottom of the screen. The function keys available with this screen are:
Key Description
F1=HELP Displays a description of the software and the functions of each key
F5=LOGGED DATA
Selects LOGGED DATA as the data type for the selected file.
F6=CALIB Selects CALIBRATION data type for the selected file.
F7=CONFIG Selects CONFIGURATION data type for the selected file.
F8=ROUTE Selects ROUTE data type for the selected file.
ESC=CANCEL Exits the screen and returns to the File Menu screen.
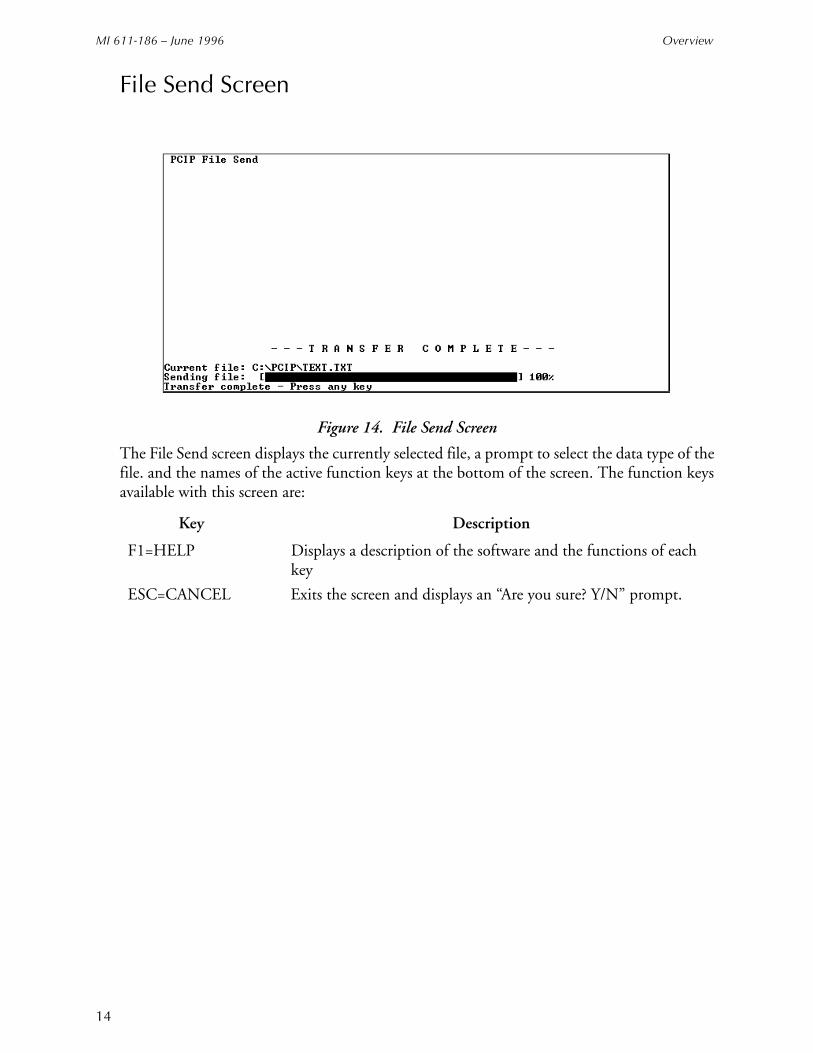
MI 611-186 – June 1996 Overview
14
File Send Screen
Figure 14. File Send Screen
The File Send screen displays the currently selected file, a prompt to select the data type of the file. and the names of the active function keys at the bottom of the screen. The function keys available with this screen are:
Key Description
F1=HELP Displays a description of the software and the functions of each key
ESC=CANCEL Exits the screen and displays an “Are you sure? Y/N” prompt.
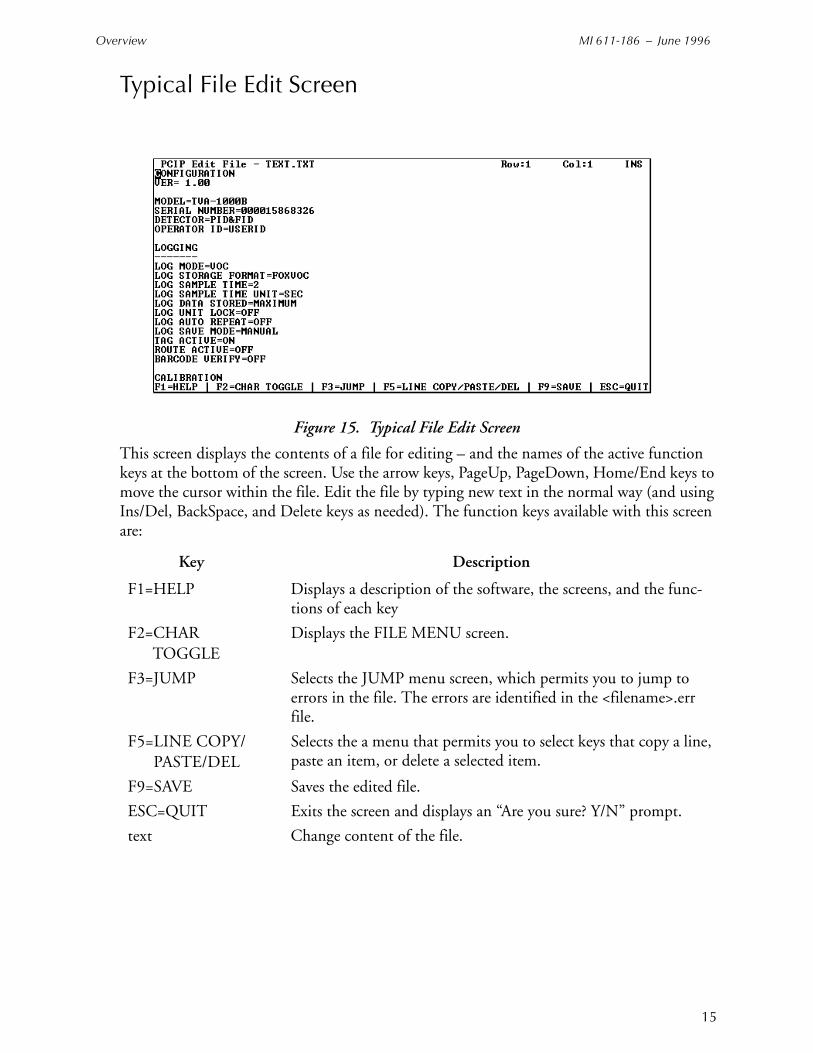
Overview MI 611-186 – June 1996
15
Typical File Edit Screen
Figure 15. Typical File Edit Screen
This screen displays the contents of a file for editing – and the names of the active function keys at the bottom of the screen. Use the arrow keys, PageUp, PageDown, Home/End keys to move the cursor within the file. Edit the file by typing new text in the normal way (and using Ins/Del, BackSpace, and Delete keys as needed). The function keys available with this screen are:
Key Description
F1=HELP Displays a description of the software, the screens, and the func-tions of each key
F2=CHAR TOGGLE
Displays the FILE MENU screen.
F3=JUMP Selects the JUMP menu screen, which permits you to jump to errors in the file. The errors are identified in the <filename>.err file.
F5=LINE COPY/ PASTE/DEL
Selects the a menu that permits you to select keys that copy a line, paste an item, or delete a selected item.
F9=SAVE Saves the edited file.
ESC=QUIT Exits the screen and displays an “Are you sure? Y/N” prompt.
text Change content of the file.

MI 611-186 – June 1996 Overview
16

17
Examples
The following pages contain examples and tutorials for typical functions performed with the PCIP software package, such as “Downloading a File”, “Uploading a File”, and “Correcting Errors in a Downloaded File.” Examples of typical configuration, calibration, and route files are also included.
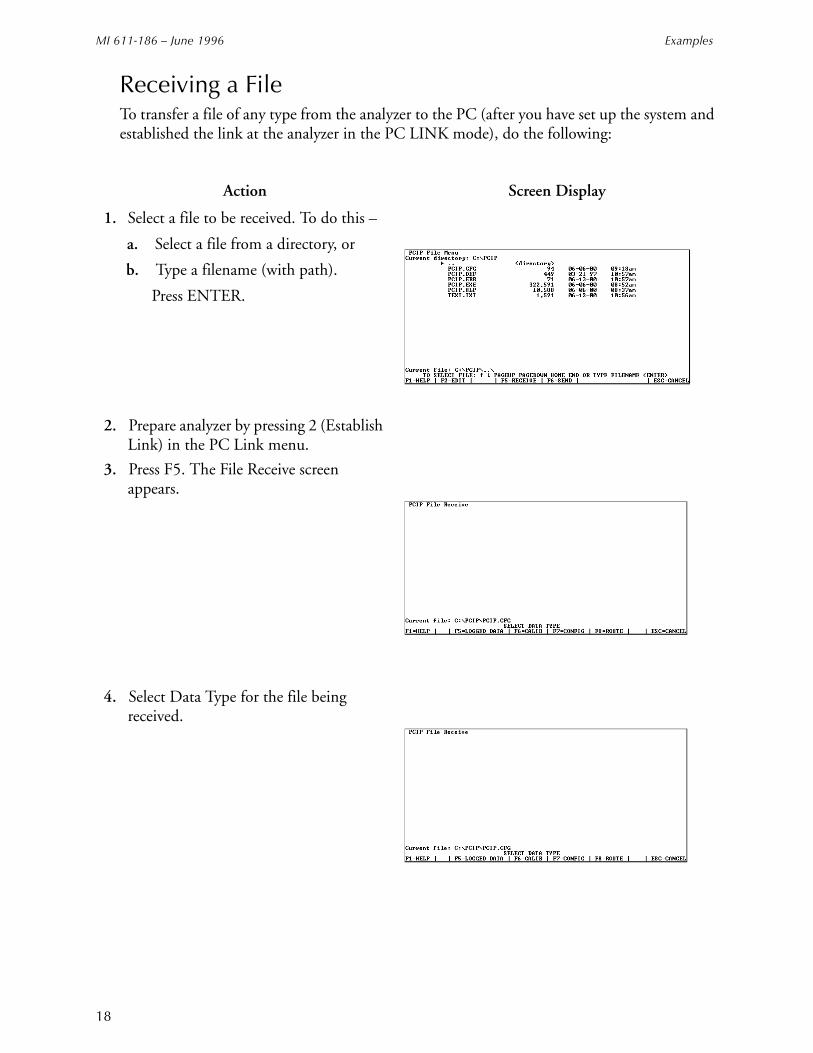
MI 611-186 – June 1996 Examples
18
Receiving a FileTo transfer a file of any type from the analyzer to the PC (after you have set up the system and established the link at the analyzer in the PC LINK mode), do the following:
Action Screen Display
1. Select a file to be received. To do this –
a. Select a file from a directory, or
b. Type a filename (with path).
Press ENTER.
2. Prepare analyzer by pressing 2 (Establish Link) in the PC Link menu.
3. Press F5. The File Receive screen appears.
4. Select Data Type for the file being received.

Examples MI 611-186 – June 1996
19
5. Wait for file transfer process to finish.
6. When complete, press any key.
The File Menu screen appears, with the file highlighted.
To view or edit this file, press F2.
7. Pressing F2 displays the file as shown in this screen. You may edit the file and use the function keys identified at the bot-tom of the screen.
8. When done, press F9 to save the edited file.
Action Screen Display
MI 611-186 – June 1996 Examples
20
Sending a FileTo send a file of any type from the PC to the analyzer (after you have set up the system and established a link at the analyzer in the PC LINK mode), follow a procedure similar to that for receiving a file, except select F6=SEND instead of F5=RECEIVE. The procedure, therefore, is as follows:
1. Select a file to be uploaded.
2. Press F6. The File Send screen appears.
3. Prepare analyzer by pressing 2 (Establish Link) in the PC Link menu.
4. Wait for transfer process to finish.
5. To view/edit the file, press F2.
If an error occurred, press F3 to jump from one error to another.
6. Edit the file to eliminate errors,
7. Press F9 to save the corrected file.
For an example of error detection and correction, refer to the example starting on the next page.
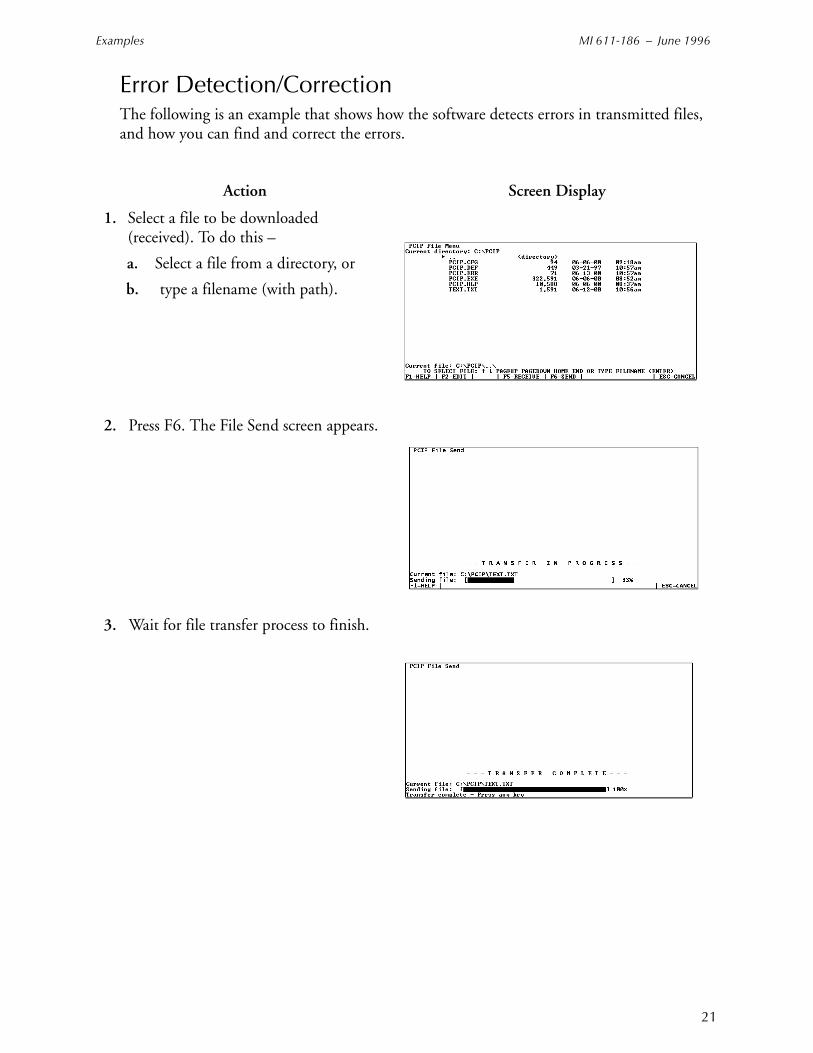
Examples MI 611-186 – June 1996
21
Error Detection/CorrectionThe following is an example that shows how the software detects errors in transmitted files, and how you can find and correct the errors.
Action Screen Display
1. Select a file to be downloaded (received). To do this –
a. Select a file from a directory, or
b. type a filename (with path).
2. Press F6. The File Send screen appears.
3. Wait for file transfer process to finish.
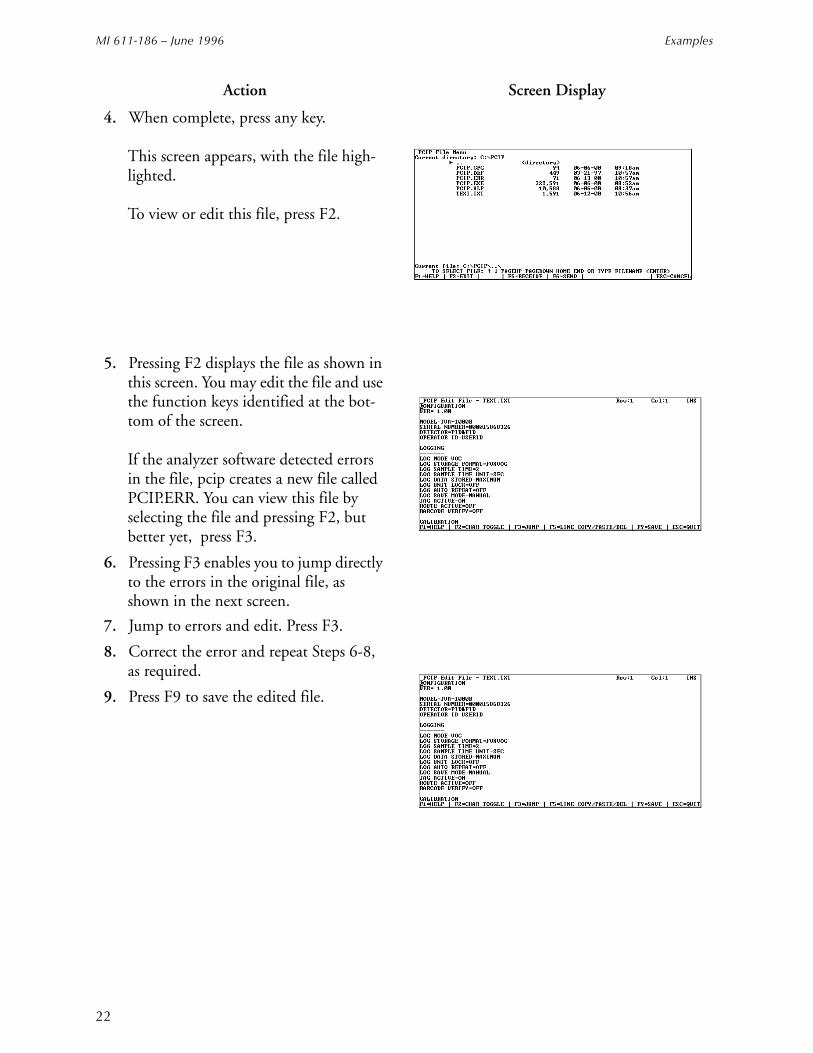
MI 611-186 – June 1996 Examples
22
4. When complete, press any key.
This screen appears, with the file high-lighted.
To view or edit this file, press F2.
5. Pressing F2 displays the file as shown in this screen. You may edit the file and use the function keys identified at the bot-tom of the screen.
If the analyzer software detected errors in the file, pcip creates a new file called PCIP.ERR. You can view this file by selecting the file and pressing F2, but better yet, press F3.
6. Pressing F3 enables you to jump directly to the errors in the original file, as shown in the next screen.
7. Jump to errors and edit. Press F3.
8. Correct the error and repeat Steps 6-8, as required.
9. Press F9 to save the edited file.
Action Screen Display
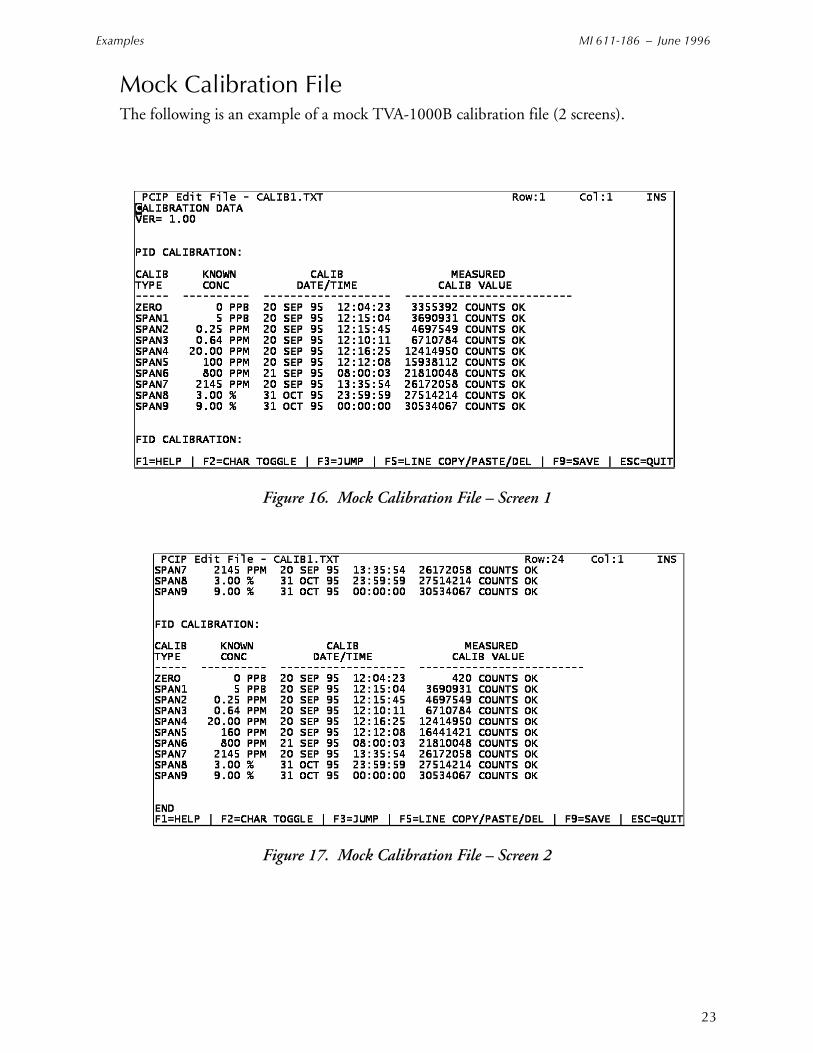
Examples MI 611-186 – June 1996
23
Mock Calibration FileThe following is an example of a mock TVA-1000B calibration file (2 screens).
Figure 16. Mock Calibration File – Screen 1
Figure 17. Mock Calibration File – Screen 2
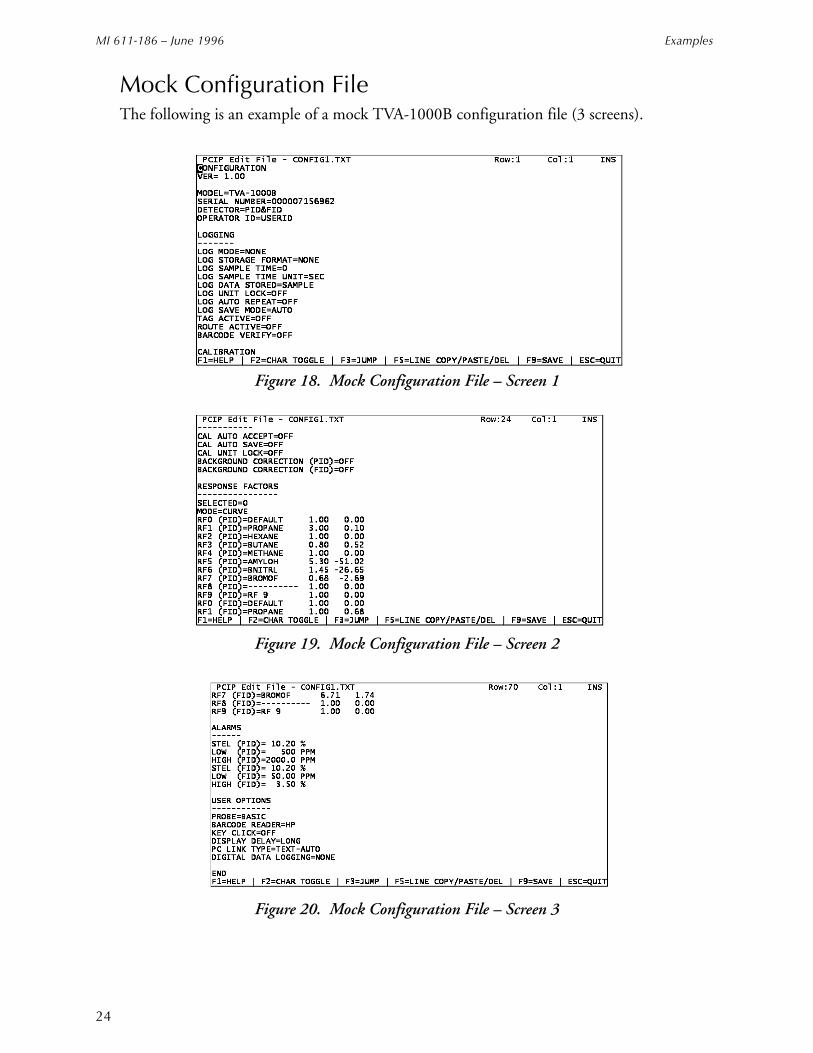
MI 611-186 – June 1996 Examples
24
Mock Configuration FileThe following is an example of a mock TVA-1000B configuration file (3 screens).
Figure 18. Mock Configuration File – Screen 1
Figure 19. Mock Configuration File – Screen 2
Figure 20. Mock Configuration File – Screen 3
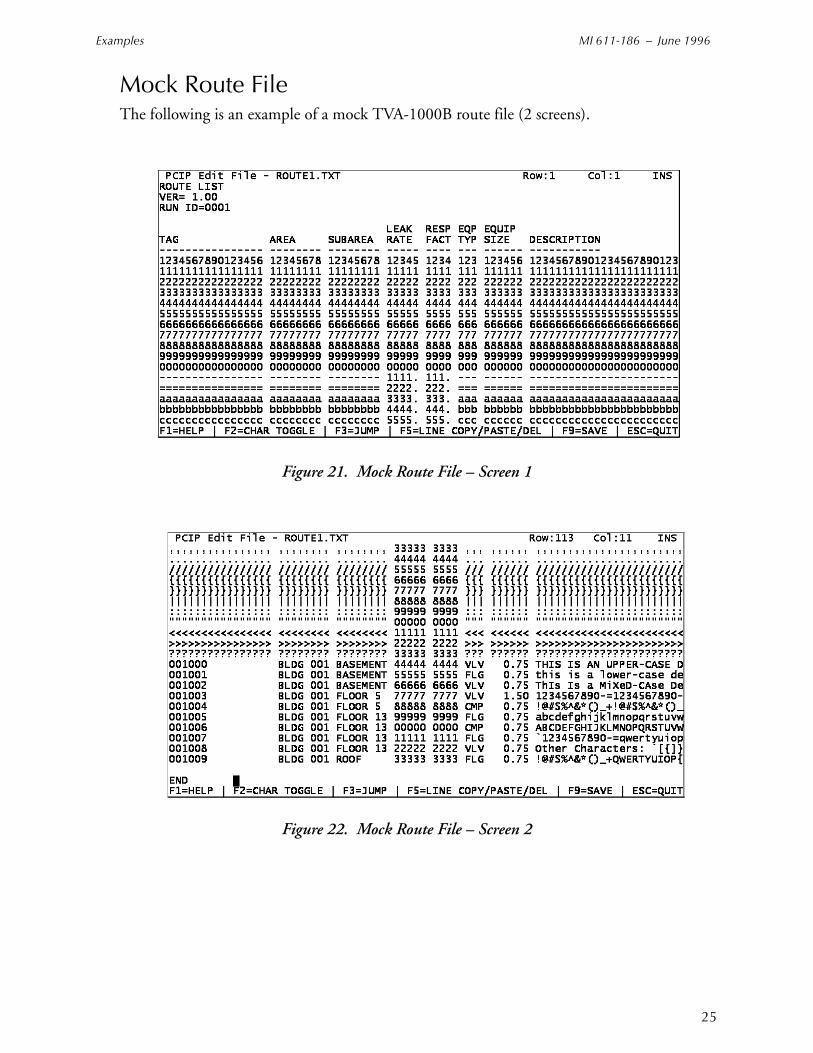
Examples MI 611-186 – June 1996
25
Mock Route FileThe following is an example of a mock TVA-1000B route file (2 screens).
Figure 21. Mock Route File – Screen 1
Figure 22. Mock Route File – Screen 2

MI 611-186 – June 1996 Examples
26

27
Index
CCalibration File 23Configuration File 24Configuring Your System 1Connecting Your PC 4
EError Detection/Correction 21Examples 17
FFile Edit Screen 15File Menu Screen 12File Receive Screen 13File Send Screen 14
HHELP Screen 11
LLoading the PCIP Software 1
MMain Menu Screen 9
PPCIP Configuration Screen 10PCIP Functions 7
RRoute File 25
SStarting the PCIP Program 4

MI 611-186 – June 1996 Index
MB 121 Printed in U.S.A. 0696
UUsing the Instrument 8Using the PCIP Software Package 8
Instruction MI 611-183March 1996
CENTURY® TVA-1000™ Toxic Vapor Analyzer11.8 eV PID Lamp Capsules (Part No. CR011YZ)
IMPORTANT NOTE: This document contains essential information about 11.8 eV PID lamp capsules. PLEASE READ ENTIRE DOCUMENT BEFORE USING AN 11.8 eV PID LAMP CAPSULE IN YOUR TVA-1000.
About 11.8 eV PID LampsThe standard PID capsule supplied with the TVA-1000 contains a 10.6 eV lamp. This PID lamp capsule is suitable for detection of many of the most commonly encountered hydrocar-bons, since their ionization potentials generally tend to fall below 10.6 eV. However, in cases where you need to detect a compound with an ionization potential between 10.6 eV and 11.8 eV, the 11.8 eV PID lamp capsule is required.
NOTE: It is important that you recognize the disadvantages of using an 11.8 eV PID lamp capsule prior to installing one in your TVA-1000.
With normal care and cleaning, a 10.6 eV PID lamp capsule should give you greater than 2000 hours of life. The 11.8 eV PID lamp capsule, however, is not so durable. Its expected life is much shorter (often less than 100 hours) and is much more dependent on environmental conditions and usage pattern. However, with proper care and use you can maximize the life of your 11.8 eV PID lamp capsule and prevent premature failure.
Because of the high energy UV radiation used by the 11.8 eV PID lamp capsule, the same magnesium fluoride material used in the 10.6 eV PID lamp capsule window is unsuitable. A special window material (lithium fluoride) is required in 11.8 eV PID lamp capsules to allow the short wavelength to pass through to the ionization chamber. Although lithium fluoride is one of the few materials that will transmit 11.8 eV photons, its crystal lattice is slowly eroded by the UV energy in a process called solarization. As the PID lamp capsule becomes solarized, the window changes to a yellowish color and transmission of the photons is reduced dramati-cally. Lithium fluoride is also a hygroscopic material, which means that it tends to absorb moisture. Absorption of moisture due to high humidity or contact with liquid water will severely degrade transmission, quickly reducing the usable life of the PID lamp capsule. The use of a WATERTRAP* probe (Part No. CR013EA) is strongly recommended to prevent ingestion of liquid water.
*Manufactured by INTEK Corporation South, Baton Rouge, LA. and A+ Corp., Prairieville, LA.
MI 611-183 – March 1996
Care of 11.8 eV PID Lamp CapsulesBecause of the aforementioned characteristics of 11.8 eV PID lamp capsules, the following precautions are recommended to prolong PID lamp capsule life:
1. Use an 11.8 eV PID lamp capsule only when necessary.
If a 10.6 eV PID lamp capsule or an FID is suitable for detection of the com-pounds of interest, it should be used preferentially. If you are using a dual detector TVA-1000 with an 11.8 eV PID lamp capsule, it is recommended that the PID lamp capsule be removed and stored properly when not required.
2. Avoid storing 11.8 eV PID lamp capsules where moisture can degrade the win-dow.
The PID lamp capsule is shipped to you in a sealed container with a desiccant pack. When the PID lamp capsule is not in use, it is recommended that you return it to this container, or store it in a desicator.
3. Avoid touching the PID lamp capsule window surface.
Moisture, oils and dirt from your fingertips can damage the window material.
4. Never allow the lamp to come in contact with liquid water.
Use of a WaterTrap probe (available through TEI, Part No. CR013EA) is highly recommended. Contact TEI for more information.
5. Regular cleaning of the window is suggested.
This window may be cleaned by gently polishing the surface with anhydrous alco-hol on a cotton swab, followed by an anhydrous methanol or ethanol rinse. This should then be gently wiped with a soft tissue. Take care not to allow the alcohol to remain on the window surface as it will leave a film.
IMPORTANT NOTE: Anhydrous materials must be used as the window material (lithium fluoride) is extremely water soluble and will be damaged.
Warranty of 11.8 eV Lamp CapsulesSince the 11.8 eV PID lamp capsule is sold separately as a part, its warranty is limited to ninety (90) days after shipment, the same as on all parts sold by TEI. Please comply with the suggestions listed above to prolong the life of your PID lamp capsule. If your PID lamp cap-sule should fail within the warranty period due to manufacturing defect (and not due to abuse, misapplication, poor handling, or usage in excess of stated expected lifetime), TEI will replace the PID lamp capsule free of charge.
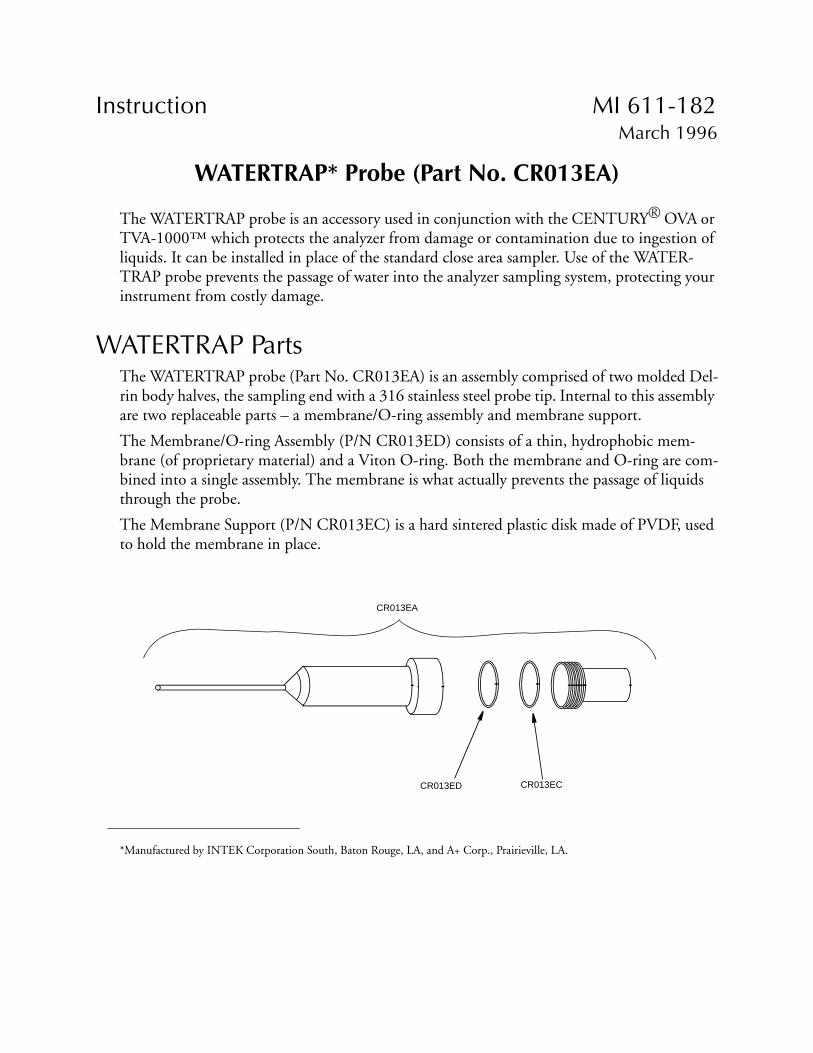
Instruction MI 611-182March 1996
WATERTRAP* Probe (Part No. CR013EA)
The WATERTRAP probe is an accessory used in conjunction with the CENTURY® OVA or TVA-1000™ which protects the analyzer from damage or contamination due to ingestion of liquids. It can be installed in place of the standard close area sampler. Use of the WATER-TRAP probe prevents the passage of water into the analyzer sampling system, protecting your instrument from costly damage.
WATERTRAP PartsThe WATERTRAP probe (Part No. CR013EA) is an assembly comprised of two molded Del-rin body halves, the sampling end with a 316 stainless steel probe tip. Internal to this assembly are two replaceable parts – a membrane/O-ring assembly and membrane support.
The Membrane/O-ring Assembly (P/N CR013ED) consists of a thin, hydrophobic mem-brane (of proprietary material) and a Viton O-ring. Both the membrane and O-ring are com-bined into a single assembly. The membrane is what actually prevents the passage of liquids through the probe.
The Membrane Support (P/N CR013EC) is a hard sintered plastic disk made of PVDF, used to hold the membrane in place.
*Manufactured by INTEK Corporation South, Baton Rouge, LA, and A+ Corp., Prairieville, LA.
CR013EA
CR013ED CR013EC
MI 611-182 – March 1996 WATERTRAP Probe
2
WATERTRAP PerformanceThe WATERTRAP probe will allow vapors (including water vapors) to pass through to the analyzer unhindered while blocking the passage of water and other more viscous liquids. The membrane will not reduce flow to the OVA or TVA-1000 (unless the membrane becomes coated or contaminated), and it will not be corroded by most chemical vapors.
NOTE: The WATERTRAP membrane is not chemically compatible with hydrofluo-ric acid.
Membrane Installation Instructions
NOTE: Take care not to touch or damage the membrane surface.
1. Loosen the probe nut and remove the WATERTRAP probe from the OVA or TVA-1000 readout assembly.
2. Disassemble the WATERTRAP probe by grasping the probe’s lower half and turn-ing the probe half counterclockwise with probe tip in upright position.
3. Insert the tip of the probe into the back end of the probe’s lower half.
4. Use the probe tip to push the membrane support and membrane/O-ring assembly gently out of the lower half of the probe body.
5. Remove and discard the used membrane/O-ring assembly.
6. Re-install the membrane support into the lower half of the probe body with the rough side facing up.
NOTE: Take special care not to contact or damage the membrane during reassembly.
7. Place a new membrane/O-ring assembly over the membrane support and align the O-ring over the O-ring groove. The O-ring should be at the top of the membrane.
8. Carefully press the O-ring into the groove at two opposite locations.
9. Repeat the previous step at different locations until the entire O-ring is depressed approximately one half of its depth. The membrane should not be tightly stretched.
10. Reassemble the probe by grasping each end by hand and turning clockwise until tight.
11. Reinstall the WATERTRAP probe in the OVA or TVA-1000 and tighten the probe nut.
WATERTRAP Probe MI 611-182 – March 1996
3
Membrane LifeThe life of the WATERTRAP membrane depends largely upon the conditions the membrane is exposed to. Theoretically, the membrane can last several months under normal ambient conditions; however, this lifetime will be shortened considerably by prolonged exposure to liq-uids, particulates, high temperatures, and high humidity.
Membrane Replacement SuggestionsIt is recommended to verify the integrity of the membrane each time your analyzer is used. It is also recommended to replace the membrane each month if the OVA or TVA-1000 is used daily. Otherwise, the membrane should be replaced during quarterly instrument evaluations. The membrane should also be replaced after contact with liquid. In some instances, a mem-brane can be restored after contact with only water by shaking the water from the probe. However, if the membrane is contaminated by an oily or high surface tension liquid, it should be replaced immediately and the entire probe assembly thoroughly cleaned. Under dusty con-ditions, membrane operation should be checked frequently. Finally, the membrane should be replaced if it becomes torn, ruptured, or if its surface becomes coated by foreign material.

MI 611-182 – March 1996 WATERTRAP Probe
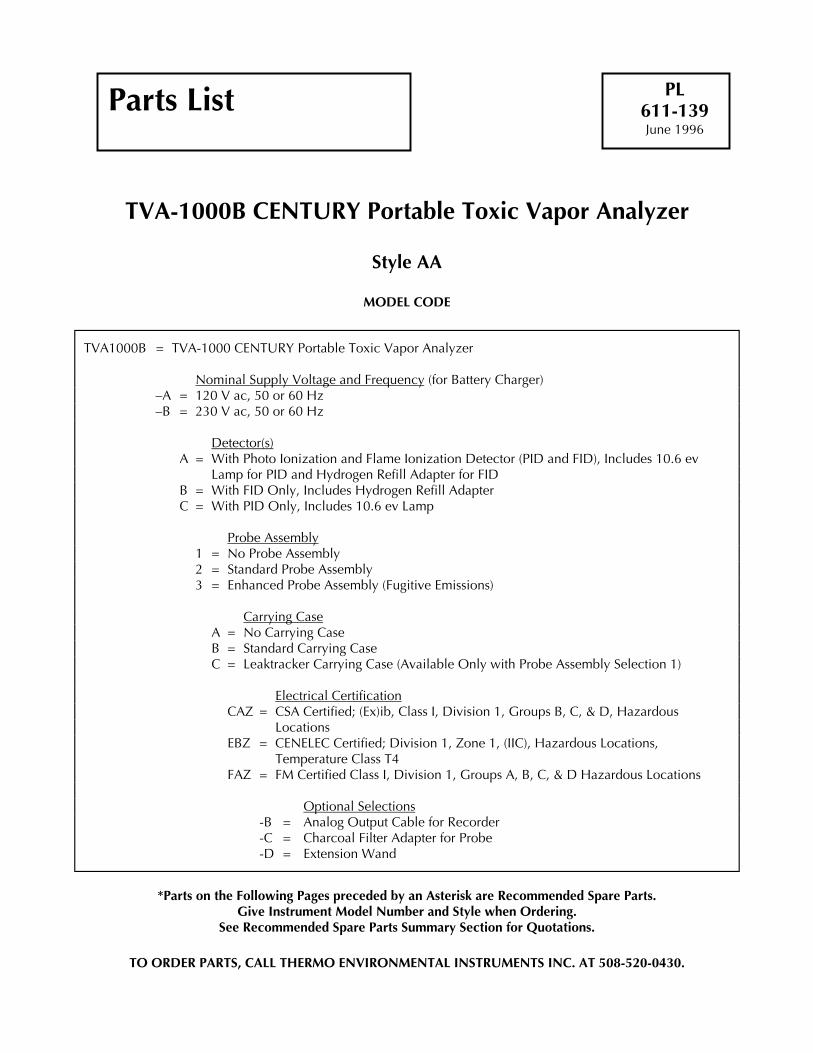
TVA-1000B CENTURY Portable Toxic Vapor Analyzer
Style AA
MODEL CODE
TVA1000B = TVA-1000 CENTURY Portable Toxic Vapor Analyzer
Nominal Supply Voltage and Frequency (for Battery Charger)–A = 120 V ac, 50 or 60 Hz–B = 230 V ac, 50 or 60 Hz
Detector(s)A = With Photo Ionization and Flame Ionization Detector (PID and FID), Includes 10.6 ev
Lamp for PID and Hydrogen Refill Adapter for FIDB = With FID Only, Includes Hydrogen Refill AdapterC = With PID Only, Includes 10.6 ev Lamp
Probe Assembly1 = No Probe Assembly2 = Standard Probe Assembly3 = Enhanced Probe Assembly (Fugitive Emissions)
Carrying CaseA = No Carrying CaseB = Standard Carrying CaseC = Leaktracker Carrying Case (Available Only with Probe Assembly Selection 1)
Electrical CertificationCAZ = CSA Certified; (Ex)ib, Class I, Division 1, Groups B, C, & D, Hazardous
LocationsEBZ = CENELEC Certified; Division 1, Zone 1, (IIC), Hazardous Locations,
Temperature Class T4FAZ = FM Certified Class I, Division 1, Groups A, B, C, & D Hazardous Locations
Optional Selections-B = Analog Output Cable for Recorder-C = Charcoal Filter Adapter for Probe-D = Extension Wand
*Parts on the Following Pages preceded by an Asterisk are Recommended Spare Parts.Give Instrument Model Number and Style when Ordering.
See Recommended Spare Parts Summary Section for Quotations.
TO ORDER PARTS, CALL THERMO ENVIRONMENTAL INSTRUMENTS INC. AT 508-520-0430.
Parts List PL611-139June 1996
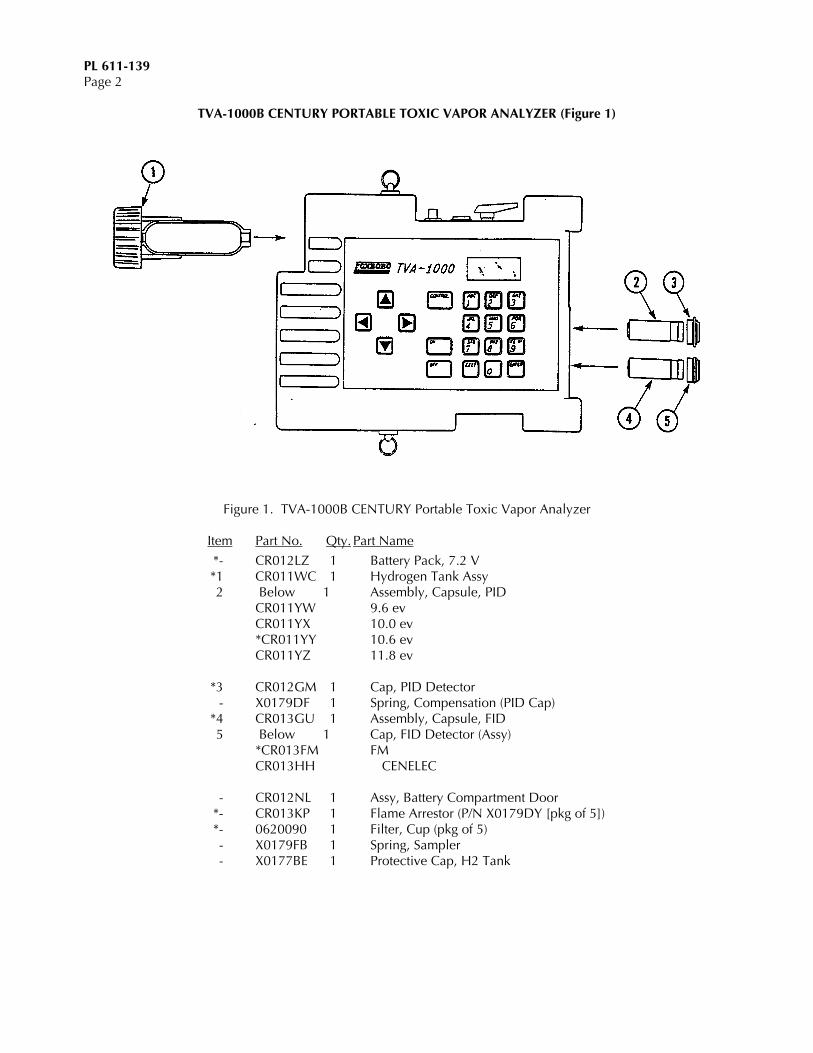
PL 611-139Page 2
TVA-1000B CENTURY PORTABLE TOXIC VAPOR ANALYZER (Figure 1)
Figure 1. TVA-1000B CENTURY Portable Toxic Vapor Analyzer
Item Part No. Qty. Part Name
*- CR012LZ 1 Battery Pack, 7.2 V *1 CR011WC 1 Hydrogen Tank Assy 2 Below 1 Assembly, Capsule, PID
CR011YW 9.6 evCR011YX 10.0 ev*CR011YY 10.6 evCR011YZ 11.8 ev
*3 CR012GM 1 Cap, PID Detector - X0179DF 1 Spring, Compensation (PID Cap)
*4 CR013GU 1 Assembly, Capsule, FID 5 Below 1 Cap, FID Detector (Assy)
*CR013FM FMCR013HH CENELEC
- CR012NL 1 Assy, Battery Compartment Door *- CR013KP 1 Flame Arrestor (P/N X0179DY [pkg of 5]) *- 0620090 1 Filter, Cup (pkg of 5) - X0179FB 1 Spring, Sampler - X0177BE 1 Protective Cap, H2 Tank
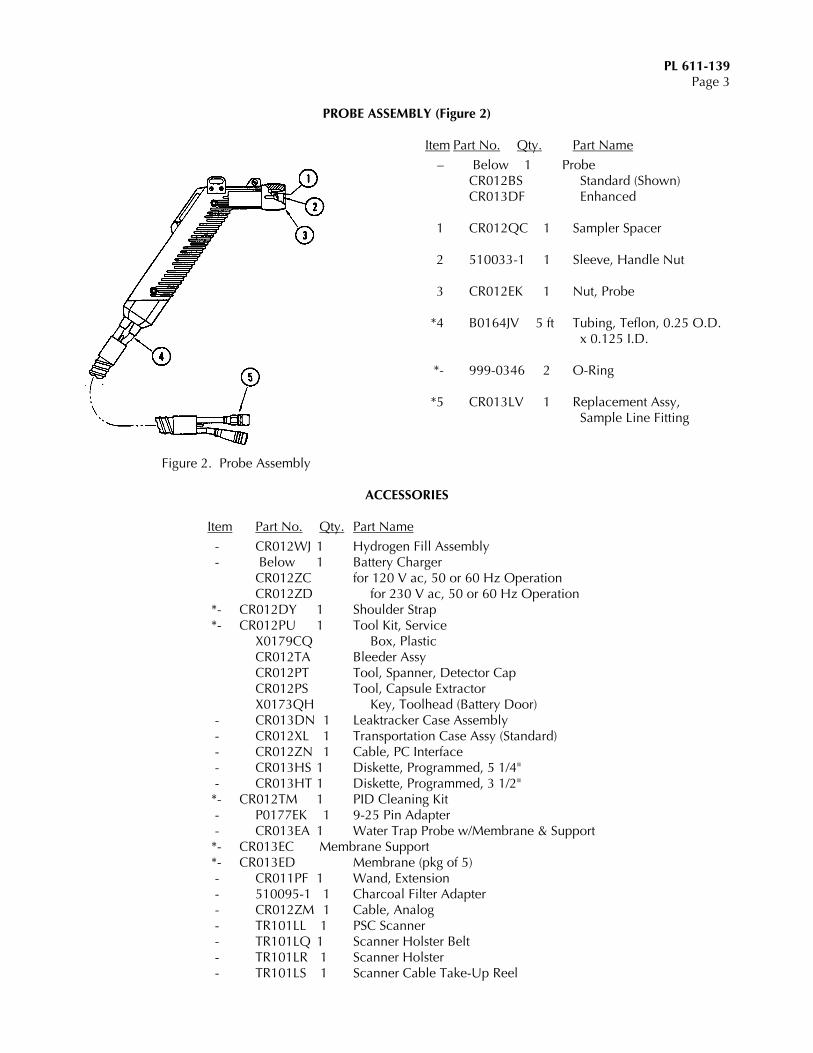
PL 611-139Page 3
PROBE ASSEMBLY (Figure 2)
Figure 2. Probe Assembly
Item Part No. Qty. Part Name
– Below 1 ProbeCR012BS Standard (Shown)CR013DF Enhanced
1 CR012QC 1 Sampler Spacer
2 510033-1 1 Sleeve, Handle Nut
3 CR012EK 1 Nut, Probe
*4 B0164JV 5 ft Tubing, Teflon, 0.25 O.D. x 0.125 I.D.
*- 999-0346 2 O-Ring
*5 CR013LV 1 Replacement Assy, Sample Line Fitting
ACCESSORIES
Item Part No. Qty. Part Name
- CR012WJ 1 Hydrogen Fill Assembly - Below 1 Battery Charger
CR012ZC for 120 V ac, 50 or 60 Hz OperationCR012ZD for 230 V ac, 50 or 60 Hz Operation
*- CR012DY 1 Shoulder Strap *- CR012PU 1 Tool Kit, Service
X0179CQ Box, PlasticCR012TA Bleeder AssyCR012PT Tool, Spanner, Detector CapCR012PS Tool, Capsule ExtractorX0173QH Key, Toolhead (Battery Door)
- CR013DN 1 Leaktracker Case Assembly - CR012XL 1 Transportation Case Assy (Standard) - CR012ZN 1 Cable, PC Interface - CR013HS 1 Diskette, Programmed, 5 1/4" - CR013HT 1 Diskette, Programmed, 3 1/2" *- CR012TM 1 PID Cleaning Kit - P0177EK 1 9-25 Pin Adapter - CR013EA 1 Water Trap Probe w/Membrane & Support *- CR013EC Membrane Support *- CR013ED Membrane (pkg of 5) - CR011PF 1 Wand, Extension - 510095-1 1 Charcoal Filter Adapter - CR012ZM 1 Cable, Analog - TR101LL 1 PSC Scanner - TR101LQ 1 Scanner Holster Belt - TR101LR 1 Scanner Holster - TR101LS 1 Scanner Cable Take-Up Reel
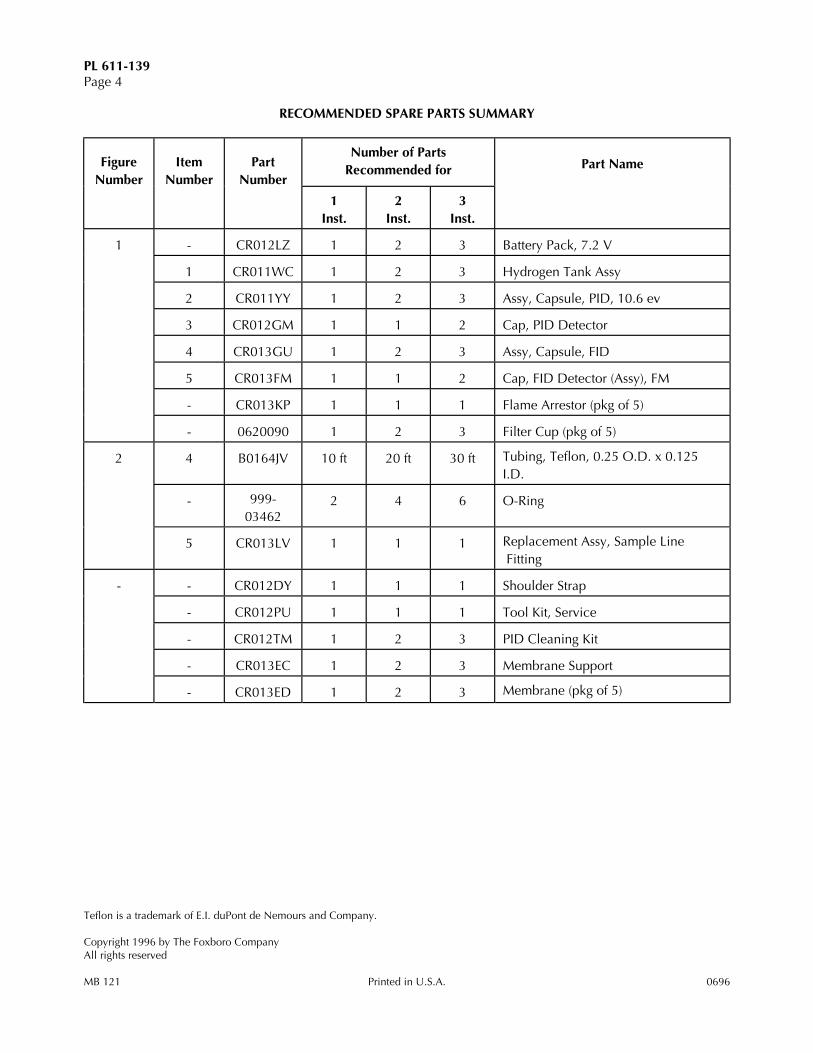
PL 611-139Page 4
RECOMMENDED SPARE PARTS SUMMARY
FigureNumber
ItemNumber
PartNumber
Number of PartsRecommended for Part Name
1Inst.
2Inst.
3Inst.
1 - CR012LZ 1 2 3 Battery Pack, 7.2 V
1 CR011WC 1 2 3 Hydrogen Tank Assy
2 CR011YY 1 2 3 Assy, Capsule, PID, 10.6 ev
3 CR012GM 1 1 2 Cap, PID Detector
4 CR013GU 1 2 3 Assy, Capsule, FID
5 CR013FM 1 1 2 Cap, FID Detector (Assy), FM
- CR013KP 1 1 1 Flame Arrestor (pkg of 5)
- 0620090 1 2 3 Filter Cup (pkg of 5)
2 4 B0164JV 10 ft 20 ft 30 ft Tubing, Teflon, 0.25 O.D. x 0.125I.D.
- 999-03462
2 4 6 O-Ring
5 CR013LV 1 1 1 Replacement Assy, Sample Line Fitting
- - CR012DY 1 1 1 Shoulder Strap
- CR012PU 1 1 1 Tool Kit, Service
- CR012TM 1 2 3 PID Cleaning Kit
- CR013EC 1 2 3 Membrane Support
- CR013ED 1 2 3 Membrane (pkg of 5)
Teflon is a trademark of E.I. duPont de Nemours and Company.
Copyright 1996 by The Foxboro CompanyAll rights reserved
MB 121 Printed in U.S.A. 0696
ADDENDUM
IMPORTING TVA-1000B FILES INTO MICROSOFT EXCEL VIATHE PCIP SOFTWARE


1
Importing TVA-1000 B Route Files into Microsoft Excel via PCIP Software
1. Load or Run Excel click file open
2. Double-click filename (i.e. C:\TVATEXT.TXT)3. Import wizard:
a) Delimited Starting at row 1 File Origin DOS/OS/2 Next
b) Other Text Qualifier = none Next
c) Text Finish
4. Highlight Col A Row 5 to bottom of file (including END)
5. Data Text to Columns
6. Convert Text to Columns wizard:a) Fixed Width Next
b) Remove column line at center of “Area” by double-clicking line
c) Move each column line to the beginning of the following field
d) Delete the extra line in the middle of the “Description” column
e) Change each column to Text format and enter Finish
7. Set width of each column as follows:a) Col: A-17 B-9 C-9 D-6 E-5 F-6 G-5 H-48
(use Format, Column Width and type in the values)8. Save As Formatted Text (Space Delimited) Exit or Close File
9. Go into PCIP software
a) Hit F2 to list files. Highlight file and hit F2 to display. Hit F2 again to
show all characters.
b) Go to row 2 - add a space immediately after ver= 1.00c) Go to row 5 col 51 and hit del twiced) Go to row 6 col 51 and hit del twicee) Go to row 6 col 56 and hit spacebar twicef) Go to row 7 col 51 and hit del twiceg) Go to row 7 col 57 and hit spacebar once and hyphen (-) once
10. Hit F9 to save. Then either enter a new file name or hit F9 to save with original
file name.
11. Hit Esc and F6 to send file to analyzer. Note, although it is unusual, if any errors
occur during transfer, note the row and column of the error and review the file
(using PCIP) for any misaligned data. You can insert and/or delete spaces as
necessary and repeat step 10 and 11.
Note: Look in uppercorner of screen for rowand column.
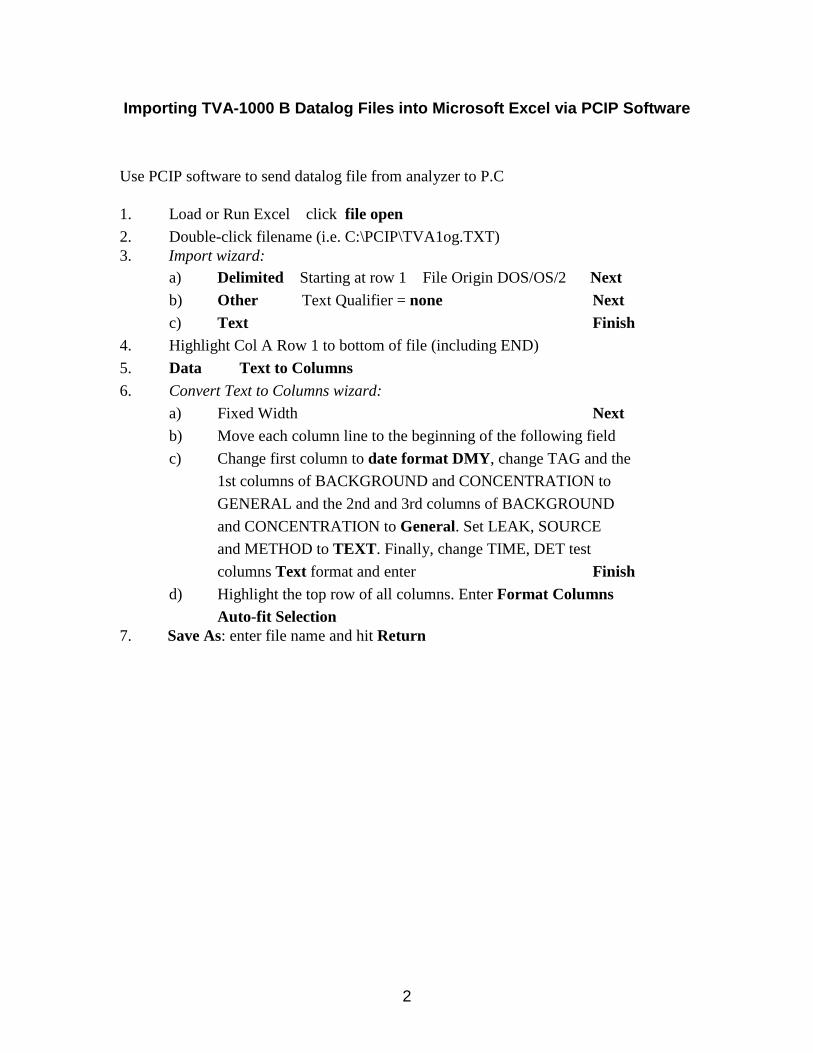
2
Importing TVA-1000 B Datalog Files into Microsoft Excel via PCIP Software
Use PCIP software to send datalog file from analyzer to P.C
1. Load or Run Excel click file open
2. Double-click filename (i.e. C:\PCIP\TVA1og.TXT)3. Import wizard:
a) Delimited Starting at row 1 File Origin DOS/OS/2 Next
b) Other Text Qualifier = none Next
c) Text Finish
4. Highlight Col A Row 1 to bottom of file (including END)
5. Data Text to Columns
6. Convert Text to Columns wizard:a) Fixed Width Next
b) Move each column line to the beginning of the following field
c) Change first column to date format DMY, change TAG and the
1st columns of BACKGROUND and CONCENTRATION to
GENERAL and the 2nd and 3rd columns of BACKGROUND
and CONCENTRATION to General. Set LEAK, SOURCE
and METHOD to TEXT. Finally, change TIME, DET test
columns Text format and enter Finish
d) Highlight the top row of all columns. Enter Format Columns
Auto-fit Selection7. Save As: enter file name and hit Return
Part No. 50040
Thermo Environmental Instruments Inc.
_____________IMPORTANT____________
IMMEDIATELY CHECK THIS SHIPMENT FOR BREAKAGE
Thermo Environmental Instruments cannot be held responsible for damages in shipment ifthese instructions are not followed.
IF THERE IS BREAKAGE
DO NOT discard packaging.DO NOT return the instruments or supplies yourself.
UPS, Truck, or Air Freight Shipments:
1) LEAVE instruments or supplies in same shipping carton in which they were received.2) DO NOT return the instruments or supplies yourself.3) CONTACT the delivering carrier immediately. Request him to inspect the damage and to make an
inspection report.4) NOTIFY Thermo Environmental Instruments Inc. immediately, furnishing the purchase order
number and the delivery number.5) Following the freight carrier’s instructions, return the unit to TEI. Upon receipt, we will assess the
repairs required (or full replacement). You will be billed for the work required and you mustsubmit the invoice to the freight carrier far payment (due to F.O.B. shipment conditions).
Parcel Post Shipments:
1) FILE claim with your Post Office.2) FOLLOW 1, 2, 4, 5 above.
NOTE Unless the above procedures are followed and we are notified within 15 days, we cannotaccept responsibility.
Thermo Environmental Instruments Inc.8 West Forge Parkway, Franklin, MA 02038Tel: 508-520-0430 Fax: 508-520-1460


Part No. 50041
TVA1000B Quick Start and Calibration Guide
1. Install filled hydrogen tank, attach probe/readout assembly, turn on analyzer andhydrogen supply valve.
2. Wait 4-5 minutes for proper hydrogen flow, then press 1 = Run. The unit will igniteand display readings. If flame out message appears, clear the message (press Exit),wait another minute and repeat step 2. If the unit has not been properly calibrated, abad calibration parameter error appears – go to step 3 below.
3. Press Exit until the Main Menu appears. Calibration can now be performed. Forbest results, allow unit to warm up for 20 minutes, then press 2 = Setup.
4. Press 1 = Calib.
5. Press 2 = SpanConc.
6. Select the detector that the span concentration is for, then press the ↑ or ↓ arrow toselect the correct unit of measure for the span gas. Enter the span calibration value,and press the Enter key. Repeat steps 5 & 6 for the second detector. Typically, thecalibration gases are methane (FID) and isobutylene (PID).
7. Next zero the instrument. Press 3 = Zero to start this process.
8. Press 1 = Both for dual detector units, or Enter for single detector units.
9. Introduce zero gas (< 1 ppm total hydrocarbon) into the analyzer through the probe.
10. Press Enter to start (this assumes manual mode, the factory default).
11. Wait for minimal change in values (about 15 seconds). Typically, the sample isstable when the first 2 digits of the reading do not change for 4-5 seconds.
12. Press Enter to accept, then press 1 to save.
13. Next calibrate with the span gas. Press 4 = Span.
14. Select the detector to be calibrated, and press Enter to start. Follow the screenprompts. Wait for the readings to stabilize (typically 10-15 seconds). Enter 1 tosave and repeat steps 13 & 14 for the second detector.
15. Press 5 = RF to verify proper response factor.
16. Confirm that response factor says “RF0: DEFAULT”. If not, set to this value.
17. Press Exit twice to return to MAIN MENU.
18. Press 1 = Run.
This completes the primary calibration, and the instrument is in the survey mode.

Part No. 50041
Daily TVA-1000B Maintenance Procedure Checklist
I.D. Number: [ ______________ ] Date: ______________
With pump off, orient analyzer so that sample line connections face down Remove from sidepack and visually inspect sample line fitting for blockage Check sidepack filter cup and probe filter cup or WATERTRAP Probe
membrane. Replace as necessary and clean debris from sample line adapterfitting.
Check sample line and readout cable for visible damage and contamination Calibrate analyzer in the manual mode and record the following after warm-up
(or calibrate in the Auto mode and return to manual mode to record data):FID: ❑❑❑❑ Zero counts _________________ (should be < 5000 counts)
❑❑❑❑ Span counts _______________ (must = 175-250 counts/PPM Methane)PID: ❑❑❑❑ Zero counts _________________ (should be <20000 counts)(10.6 eV) ❑❑❑❑ Span counts __________ (must = 3500-6000 counts/PPM Isobutylene)
Note: If TVA-1000 is used in logging mode, this data is also included in headerinformation. Retain this data for trend analysis. Although the values may changedaily, the data can be a valuable resource for trend analysis.
At the end of the day or shift: Remove the FID endcap. Blow-out with dry air and replace insert if discolored Remove FID capsule. If visibly wet, shake-out excess water and let air-dry
overnight Perform visual inspection for signs of damage
Weekly Maintenance Checklist: Replace sidepack and probe filter cups and clean sample line adapter fitting For all PID lamps except the 11.8 eV: Remove the PID capsule according to the
instructions in the Maintenance section of the manual. Clean the lamp with acotton swab and isopropyl alcohol. Dry the cartridge with a heat gun for 60seconds to evaporate the alcohol. Reinstall the cartridge and cap. Note: Refer toMI 611-183 in the instruction book on cleaning techniques for the 11.8 eV lamp.
Check and tighten strain-relief screws on readout assembly and screws securingthree connectors on sidepack
If possible, store the unit in a dry environment when not in use.
Example: Counts/ppm 210(PPM) 102
410025500
(PPM) ionConcentrat Span
Counts Zero - Counts Span=
−=

8 West Forge Parkway Tel: (508) 520-0430Franklin, MA 02038 Fax: (508) 520-1460
GEM™2000 GAS ANALYZER & EXTRACTION MONITOR OPERATION MANUAL
GEM™2000 Operation Manual
ii
©Copyright 2001 by CES-LANDTEC All rights reserved. Printed in the United States of America. No part of this book may be used or reproduced in any form or by any means, or stored in a database or retrieval system, without consent of the publisher. Making copies of any part of this book for any purpose other than your own personal use is a violation of United States copyright laws. LANDTEC, GEM and DataField are registered with the U.S. Patent and Trademark Office. DataField software ©Copyright 1995 For further information contact: CES-LANDTEC 937 S. Via Lata, Suite 650 Colton, CA 92324 Telephone: (909) 783-3636 Fax: (909) 825-0591 www.CES-LANDTEC.com

GEM™2000 Operation Manual
iii
Contents
1 INTRODUCTION ......................................................................................................................1
2 GENERAL OPERATIONAL FEATURES .................................................................................2
2.1 PHYSICAL CHARACTERISTICS OF THE GEM™2000 ............................................................................... 2 2.2 TURNING THE INSTRUMENT ON/OFF......................................................................................................... 3 2.3 WARM-UP SELF TEST............................................................................................................................... 3 2.4 WARNING AND ERROR DISPLAY............................................................................................................... 4
2.4.1 WARNING Displayed...................................................................................................................... 4 2.4.2 ERROR Displayed........................................................................................................................... 4
2.5 STORAGE .................................................................................................................................................. 4 2.6 BATTERY/CHARGING ................................................................................................................................ 5 2.7 READ GAS LEVELS SCREEN (GA MODE OF OPERATION)........................................................................ 5 2.8 OPTIONAL GAS PODS............................................................................................................................... 6 2.9 COLD START............................................................................................................................................. 6
3 GENERAL OPERATIONS MENU ............................................................................................7
3.1 ZERO TRANSDUCERS ............................................................................................................................... 7 3.2 UPDATE SITE DATA .................................................................................................................................. 7 3.3 DATA LOGGING (GA MODE ONLY) ............................................................................................................ 7 3.4 PRINT DATA .............................................................................................................................................. 7 3.5 ADJUST CONTRAST .................................................................................................................................. 7 3.6 FIELD CALIBRATION ................................................................................................................................. 7
3.6.1 Zero Channels.................................................................................................................................. 8 3.6.2 Span Channels ................................................................................................................................. 8 3.6.3 Factory Settings ............................................................................................................................... 8 3.6.4 Last Field Cal ................................................................................................................................... 8
3.7 MODE OF OPERATION .............................................................................................................................. 8
4 TAKING PROBE READINGS (GA MODE) ..............................................................................9
4.1 PRELIMINARY CHECKS ............................................................................................................................. 9 4.2 UPDATE SITE DATA .................................................................................................................................. 9 4.3 TAKING READINGS – WITH ID.................................................................................................................. 9 4.4 TAKING READINGS – WITHOUT ID .........................................................................................................10 4.5 TEMPERATURE PROBE READING ...........................................................................................................11 4.6 CROSS-GAS EFFECTS ...........................................................................................................................11
4.6.1 Methane, Carbon Dioxide and Oxygen.........................................................................................11 4.6.2 H2S, CO and other Optional Gas Pods ........................................................................................12
4.7 MEMORY .................................................................................................................................................12
5 TAKING EXTRACTION WELL READINGS (GEM MODE) ....................................................13
5.1 PRELIMINARY CHECKS ...........................................................................................................................13 5.2 UPDATE SITE DATA ................................................................................................................................13 5.3 TAKING GAS AND FLOW READINGS (GEM MODE) ................................................................................13
6 DATAFIELD 3.0 SOFTWARE ................................................................................................15
6.1 INSTALLING DATAFIELD 3.0 ...................................................................................................................15 6.2 ESTABLISHING COMMUNICATIONS .........................................................................................................15 6.3 MAIN SCREEN .........................................................................................................................................16 6.4 FILE.........................................................................................................................................................16
GEM™2000 Operation Manual
iv
6.5 COMMUNICATIONS ..................................................................................................................................16 6.6 FUNCTIONS .............................................................................................................................................17
6.6.1 Comments ......................................................................................................................................17 6.6.2 Entering ID’s ...................................................................................................................................18 6.6.3 Editing ID’s......................................................................................................................................20 6.6.4 Delete ID’s......................................................................................................................................22 6.6.5 Re-sequencing...............................................................................................................................23 6.6.6 Readings ........................................................................................................................................23 6.6.7 Site Questions................................................................................................................................25
6.7 SETTINGS................................................................................................................................................28 6.7.1 Instrument Settings ........................................................................................................................28 6.7.2 Use Headers..................................................................................................................................31
7 FIELD OPERATIONS.............................................................................................................32
7.1 LANDFILL GAS GENERATION..................................................................................................................32 7.2 SUBSURFACE FIRES ...............................................................................................................................32 7.3 TECHNIQUES FOR CONTROLLING LANDFILL GAS ..................................................................................33
7.3.1 Controlling by Wellhead Valve Position ........................................................................................33 7.3.2 Controlling by Wellhead Vacuum...................................................................................................33 7.3.3 Controlling by Gas Composition....................................................................................................33 7.3.4 Controlling by Flow Rate ................................................................................................................33
7.4 WELL FIELD MONITORING ......................................................................................................................34 7.5 TYPICAL FIELD READINGS......................................................................................................................34 7.6 ABBREVIATED FIELD READINGS ............................................................................................................35 7.7 WELL FIELD ADJUSTMENT CRITERIA .....................................................................................................35 7.8 ESTABLISHING TARGET FLOWS .............................................................................................................36 7.9 WELL FIELD OPTIMIZATION....................................................................................................................36 7.10 MIGRATION CONTROL—DEALING WITH POOR METHANE QUALITY ..................................................36 7.11 WELL FIELD ADJUSTMENT—PURPOSE AND OBJECTIVES .................................................................37
8 TROUBLESHOOTING............................................................................................................38
9 TECHNICAL SPECIFICATIONS ............................................................................................39
9.1 PHYSICAL ................................................................................................................................................39 9.2 GENERAL ................................................................................................................................................39 9.3 POWER SUPPLY ......................................................................................................................................39 9.4 GAS RANGES ..........................................................................................................................................39 9.5 PUMP.......................................................................................................................................................40 9.6 OPERATING CONDITIONS .......................................................................................................................40 9.7 OPTIONAL GAS PODS.............................................................................................................................40
GEM™2000 Operation Manual
1
1 Introduction CES-LANDTEC is the premier manufacturer of products, instruments and software for landfill gas extraction and for regulatory monitoring compliance. CES-LANDTEC has provided the landfill industry with a technologically innovative family of products for more than a decade. These products are the result of field-proven experience in design, operation and maintenance of landfills for environmental compliance. The GEM™2000, designed by CES-LANDTEC, is specifically for use on landfills to monitor landfill gas (LFG) extraction systems, flares and migration control systems. The GEM™2000 samples and analyses the Methane, Carbon Dioxide and Oxygen content of LFG. The readings are displayed and can be stored in the instrument or downloaded to a personal computer for reporting, analysing and archiving. The GEM™2000 instrument is frequently shipped in an optional protective hard case with a foam interior offers additional protection, transportation convenience and component hardware storage. When properly sealed, the hard case is watertight. The hard case is equipped with a pressure relief valve (located under the handle on the case) that is normally kept closed. If there is a change in elevation, the hard case may not open until turning the pressure relief valve equalizes internal pressure. When shipping a GEM™2000 back to CES-LANDTEC for calibration or service, always ship it in the original packaging to protect unit from damage. Carefully unpack the contents of the GEM™2000, inspect and inventory them. The following items should be contained in your package:
The GEM™2000 instrument GEM™2000 Operation Manual Registration/Warranty Card Soft carrying case with replaceable protective window and carrying strap Clear ¼” vinyl sampling hose assembly (5 ft.) with external water trap filter assembly Blue ¼” vinyl pressure sampling hose (5 ft.) Spare internal particulate filter element Polypropylene male connector (hose barb) connects to blue vinyl tubing Spare external water trap filter element 100-240 volt battery charger DataField 3.0 software on CD-ROM RS-232 serial cable for computer/printer data downloading Temperature probe (optional) Hard carrying case (optional)
Complete the Registration/Warranty Card and return it to CES-LANDTEC. The model and serial numbers are located on the back of the GEM™2000 instrument. Immediately notify shipper if the GEM™2000 unit or accessories are damaged due to shipping. Contact CES-LANDTEC immediately if any items are missing. For questions regarding instrument operation and procedures, please contact CES-LANDTEC at:
Customer Service or Technical Support Factory Service Spare Parts and Calibration Gas
(800) 821-0496
DataField Software Support (888) 400-2272

GEM™2000 Operation Manual
2
2 General Operational Features
2.1 Physical Characteristics of the GEM™2000
Front View
Back View
Sample Inlet
or Static Pressure
Port
Exhaust Port
RS232 Communication Socket
Charger Socket
Particulate Filter
Housing
Impact Pressure
Port
Left Side View
Charger Socket RS232 Communication Socket for Computer Cable, optional Temperature Probe or optional Gas Pod
Exhaust Port
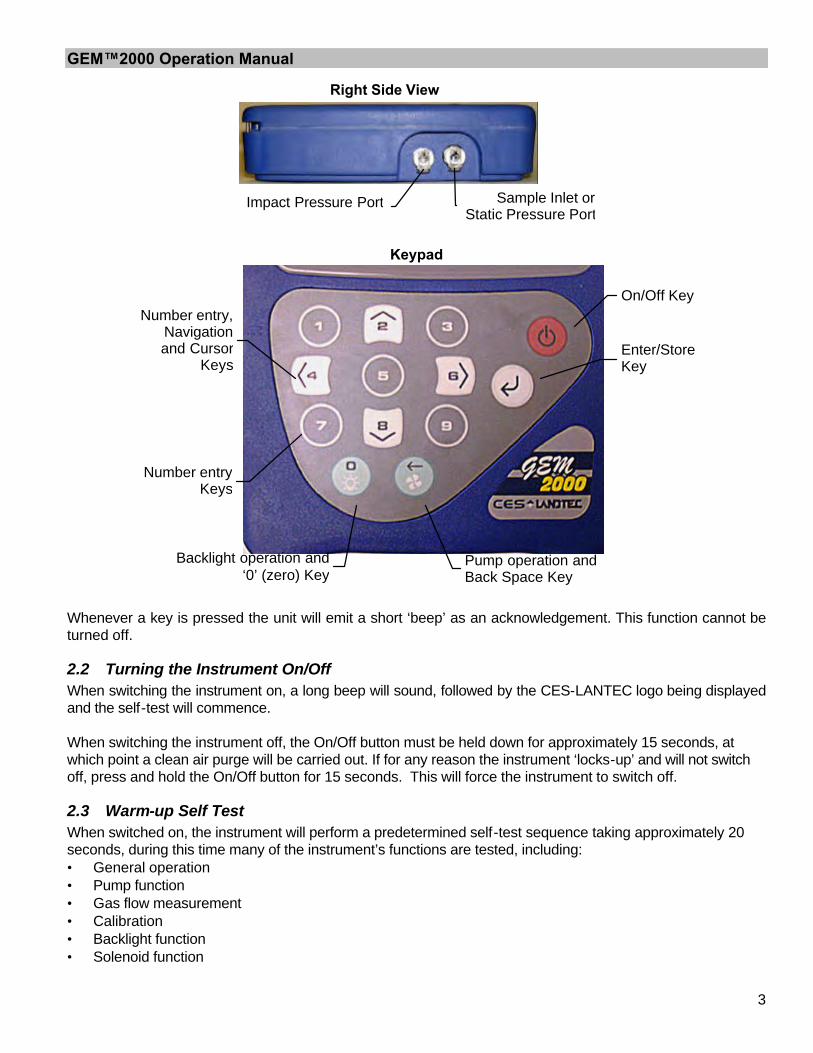
GEM™2000 Operation Manual
3
Right Side View
Sample Inlet or Static Pressure Port
Impact Pressure Port
On/Off Key
Enter/Store Key
Pump operation and Back Space Key
Backlight operation and ‘0’ (zero) Key
Number entry Keys
Number entry, Navigation and Cursor
Keys
Keypad
Whenever a key is pressed the unit will emit a short ‘beep’ as an acknowledgement. This function cannot be turned off.
2.2 Turning the Instrument On/Off When switching the instrument on, a long beep will sound, followed by the CES-LANTEC logo being displayed and the self-test will commence. When switching the instrument off, the On/Off button must be held down for approximately 15 seconds, at which point a clean air purge will be carried out. If for any reason the instrument ‘locks-up’ and will not switch off, press and hold the On/Off button for 15 seconds. This will force the instrument to switch off.
2.3 Warm-up Self Test When switched on, the instrument will perform a predetermined self-test sequence taking approximately 20 seconds, during this time many of the instrument’s functions are tested, including: • General operation • Pump function • Gas flow measurement • Calibration • Backlight function • Solenoid function
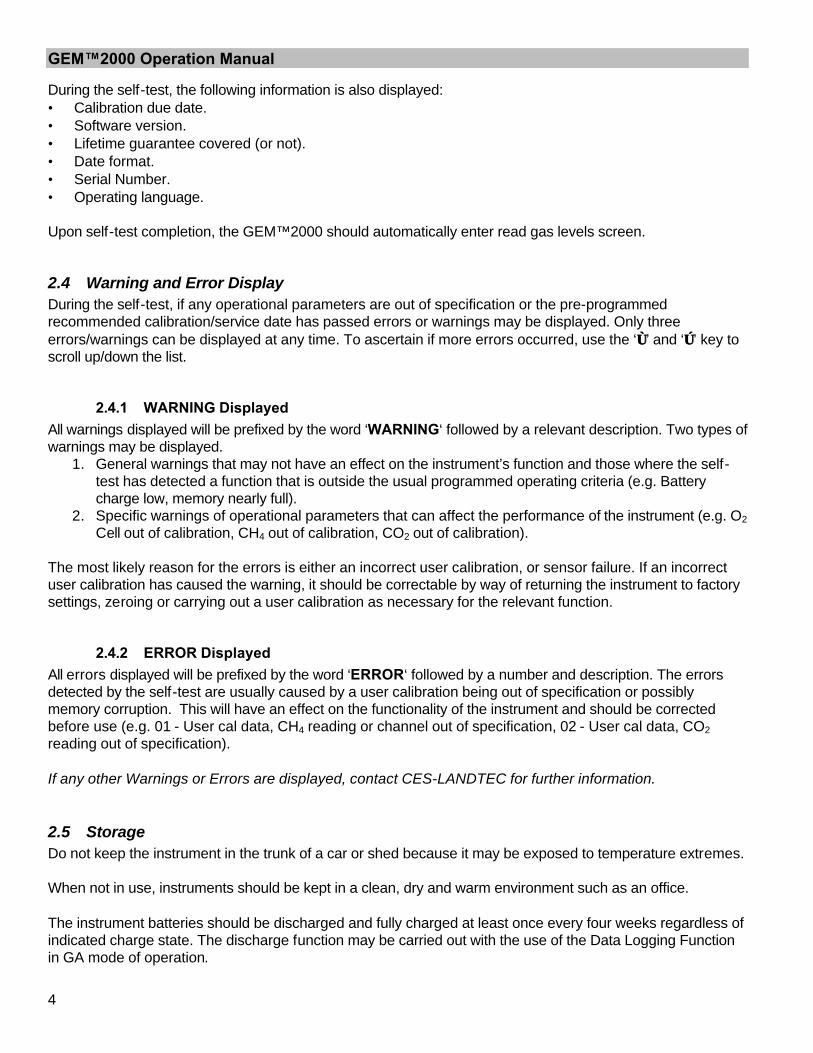
GEM™2000 Operation Manual
4
During the self-test, the following information is also displayed: • Calibration due date. • Software version. • Lifetime guarantee covered (or not). • Date format. • Serial Number. • Operating language. Upon self-test completion, the GEM™2000 should automatically enter read gas levels screen.
2.4 Warning and Error Display During the self-test, if any operational parameters are out of specification or the pre-programmed recommended calibration/service date has passed errors or warnings may be displayed. Only three errors/warnings can be displayed at any time. To ascertain if more errors occurred, use the ‘∧∧’ and ‘∨∨’ key to scroll up/down the list.
2.4.1 WARNING Displayed All warnings displayed will be prefixed by the word ‘WARNING‘ followed by a relevant description. Two types of warnings may be displayed.
1. General warnings that may not have an effect on the instrument’s function and those where the self-test has detected a function that is outside the usual programmed operating criteria (e.g. Battery charge low, memory nearly full).
2. Specific warnings of operational parameters that can affect the performance of the instrument (e.g. O2 Cell out of calibration, CH4 out of calibration, CO2 out of calibration).
The most likely reason for the errors is either an incorrect user calibration, or sensor failure. If an incorrect user calibration has caused the warning, it should be correctable by way of returning the instrument to factory settings, zeroing or carrying out a user calibration as necessary for the relevant function.
2.4.2 ERROR Displayed All errors displayed will be prefixed by the word ‘ERROR‘ followed by a number and description. The errors detected by the self-test are usually caused by a user calibration being out of specification or possibly memory corruption. This will have an effect on the functionality of the instrument and should be corrected before use (e.g. 01 - User cal data, CH4 reading or channel out of specification, 02 - User cal data, CO2 reading out of specification). If any other Warnings or Errors are displayed, contact CES-LANDTEC for further information.
2.5 Storage Do not keep the instrument in the trunk of a car or shed because it may be exposed to temperature extremes. When not in use, instruments should be kept in a clean, dry and warm environment such as an office. The instrument batteries should be discharged and fully charged at least once every four weeks regardless of indicated charge state. The discharge function may be carried out with the use of the Data Logging Function in GA mode of operation.

GEM™2000 Operation Manual
5
2.6 Battery/Charging The Battery Charger IS NOT covered by the unit UL certification. Therefore, when connected to the Battery Charger, the instrument IS NOT intrinsically safe and should not be used in confined spaces. The battery used in the GEM™2000 is a Nickel Metal Hydride manufactured as an encapsulated pack from six individual cells. This type of battery is not so susceptible to “memory effects” as Nickel Cadmium batteries, although it is not recommended that the unit be given short-term charges. When the flashing LED indicates “Charging Complete”, disconnect the charger.
The battery charger indicates when the unit is charging, charged or if there is a fault. A full charge should take approximately 2 hours. Charge the batteries until the ‘Charging Complete’ indicator is flashing.
2.7 Read Gas Levels Screen (GA mode of operation) The read gas levels screen is also considered the normal operation screen and all operations are carried out from this starting point. The following information is displayed in various boxed sections at this time: • Current programmed time and date. • Current selected ID code. • Pump status. • Pump run time. • Three main constituent gases – CH4, CO2, O2 (in %). • Balance gas. • Last read time/date (if previous data is in memory), the benefits of this are, 1 – it is easily noted if a
reading has been taken/stored, 2 – the current and previous readings can be easily compared. • External Gas Pod “Not Fitted” (displays pod type when attached). • Peak CH4 reading (in %) (GA mode only). • LEL CH4 (GA mode only). • Current barometric pressure reading. • Current relative pressure reading (GA mode only). • Gas Pod or Temperature Probe reading (if connected). • Battery Charge graph (5 segment, flashes at 20% remaining). • Memory Usage graph (5 segment, flashes at 5% remaining).
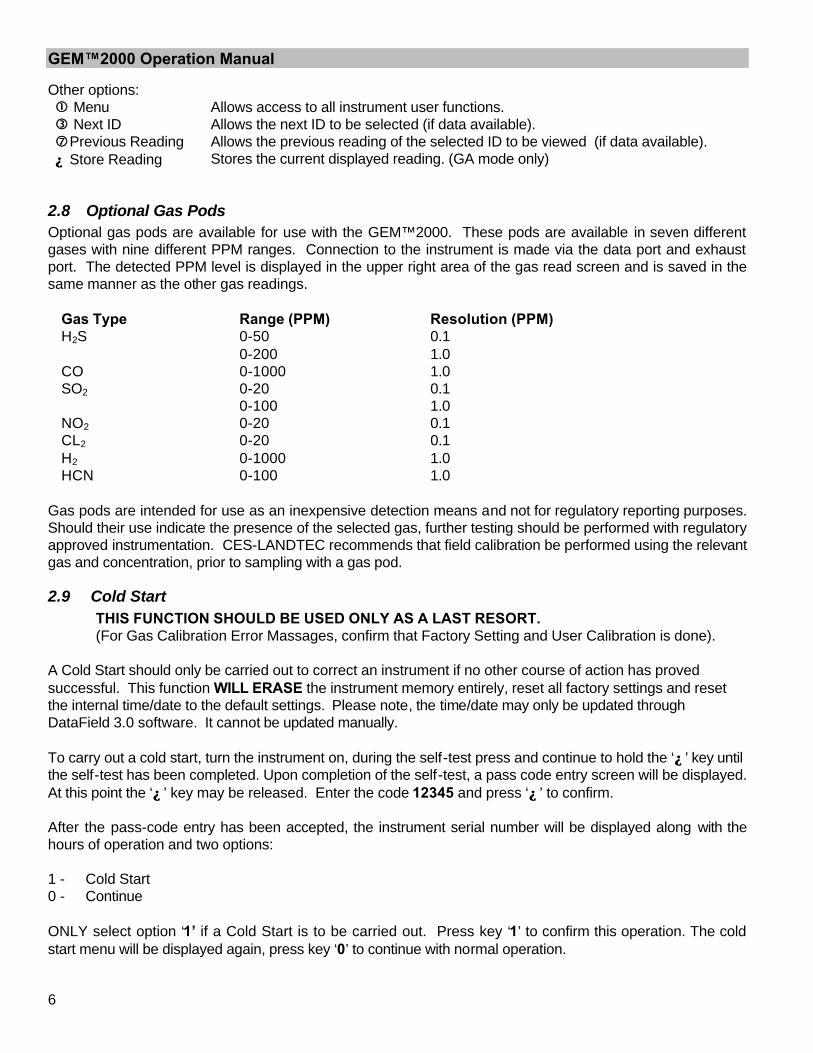
GEM™2000 Operation Manual
6
Other options: �� Menu Allows access to all instrument user functions. �� Next ID Allows the next ID to be selected (if data available). ��Previous Reading Allows the previous reading of the selected ID to be viewed (if data available). ↵↵ Store Reading Stores the current displayed reading. (GA mode only)
2.8 Optional Gas Pods Optional gas pods are available for use with the GEM™2000. These pods are available in seven different gases with nine different PPM ranges. Connection to the instrument is made via the data port and exhaust port. The detected PPM level is displayed in the upper right area of the gas read screen and is saved in the same manner as the other gas readings.
Gas Type Range (PPM) Resolution (PPM) H2S 0-50 0.1 0-200 1.0 CO 0-1000 1.0 SO2 0-20 0.1 0-100 1.0 NO2 0-20 0.1 CL2 0-20 0.1 H2 0-1000 1.0 HCN 0-100 1.0
Gas pods are intended for use as an inexpensive detection means and not for regulatory reporting purposes. Should their use indicate the presence of the selected gas, further testing should be performed with regulatory approved instrumentation. CES-LANDTEC recommends that field calibration be performed using the relevant gas and concentration, prior to sampling with a gas pod.
2.9 Cold Start THIS FUNCTION SHOULD BE USED ONLY AS A LAST RESORT. (For Gas Calibration Error Massages, confirm that Factory Setting and User Calibration is done).
A Cold Start should only be carried out to correct an instrument if no other course of action has proved successful. This function WILL ERASE the instrument memory entirely, reset all factory settings and reset the internal time/date to the default settings. Please note, the time/date may only be updated through DataField 3.0 software. It cannot be updated manually. To carry out a cold start, turn the instrument on, during the self-test press and continue to hold the ‘↵↵ ’ key until the self-test has been completed. Upon completion of the self-test, a pass code entry screen will be displayed. At this point the ‘↵↵ ’ key may be released. Enter the code 12345 and press ‘↵↵ ’ to confirm. After the pass-code entry has been accepted, the instrument serial number will be displayed along with the hours of operation and two options: 1 - Cold Start 0 - Continue ONLY select option ‘1’ if a Cold Start is to be carried out. Press key ‘1’ to confirm this operation. The cold start menu will be displayed again, press key ‘0’ to continue with normal operation.
GEM™2000 Operation Manual
7
3 General Operations Menu The following features and functions are selectable from the main menu via key ‘�� Menu’ from the read gas levels screen. Various options are available to the user including:
3.1 Zero Transducers Allows the user to zero the pressure transducer(s). Upon selection, the current pressure reading is displayed. The operation will be carried out when the ‘↵↵ ’ is pressed.
3.2 Update Site Data Allows the user to answer questions (pre-defined in DataField3.0 software) relating to the site (e.g. name of operator, weather conditions, etc.). Site Questions are different from Site Comments. This is covered in more detail in Section 6 of this manual.
3.3 Data Logging (GA mode only) Enables the user to leave the Instrument unattended to take samples at a pre-determined time. The reading interval and pump run time may be edited prior to commencing the logging cycle. The ID code may ONLY be set in DataField3.0 communication software. Once the logging function is activated, the instrument will carry out a 30 second ‘Warm-up’ countdown (displayed bottom right) and begin the first sample. After each sample, the unit will shut down (sleep) to conserve power if the time between the pump ending and the next sample is greater than 30 seconds. The instrument is reactivated (awakened) during a logging cycle, the company logo will be displayed for a few seconds and the read gas levels screen will be displayed. This will initiate a 30 second countdown to the next sample being taken unless the operator stops the logging function. If for any reason during a logging cycle the inlet port were to become blocked the Instrument will sense this as a flow fail during the ‘pump on’ time and will automatically retry until a reading can be obtained. Therefore, position the sample tubing carefully to ensure no blockage due to water/moisture can occur.
3.4 Print Data Allows ALL the data currently stored to be printed. This may ONLY be carried out with an appropriate RS232 cable (included with new instruments & available from CES-LANDTEC) and a printer with a serial port connection.
3.5 Adjust Contrast The GEM™2000 automatically adjusts the screen contrast according to the ambient temperature to maintain normal viewing. The contrast can be manually adjusted by using the ‘<< ’ and ‘>> ’ cursor keys. The manual contrast setting is stored when the instrument is switched off.
3.6 Field Calibration Whenever carrying out a user calibration function it is important to ensure the correct value is entered. Additionally, in the case of a zeroing function, ensure only ambient air is used and no connection is made to a probe or wellhead fitting.
GEM™2000 Operation Manual
8
Upon selecting this option, the Field Calibration screen is displayed. A brief description of the user span calibration procedure and the current reading (row ‘R’) and user span calibration gas values (row ‘S’) are displayed. The span gas values may be changed via the ‘�� Edit Target Concentrations’ option. Once this option has been selected, all the gas values will require entry. Each entry is to be confirmed by pressing the ‘↵↵ ’ key.
3.6.1 Zero Channels Selected from the ‘Field Calibration’ - ‘↵↵-Calibration Menu’ allows the relevant reading to be zeroed. When selected, a list of the available options will be displayed, this usually includes CH4, and O2, also the Gas Pod (if fitted). Supply a zero gas mixture to the instrument for the gas to be zeroed. Insure the reading for the selected gas has settled to its lowest value before selecting the zero function. When the required option is selected, the user zero function will be carried out automatically. The operation will be carried out when the ‘↵↵ ’ key is pressed.
3.6.2 Span Channels Selected from the ‘Field Calibration’ - ‘↵↵-Calibration Menu’, allows the relevant reading to be span calibrated (in accordance with the calibration value entered). When selected, a list of the available options will be displayed, which includes CH4, CO2, O2, and Gas Pod (if fitted). When the required option is selected from the list, the span calibration function will be carried out automatically. When carrying out this procedure, ensure the span calibration procedure (as outlined below) is followed: 1. Apply the relevant known certified gas concentration through the inlet port of the Instrument. 2. Wait until the current gas reading has stabilized. 3. Select the required calibration option via the ‘↵↵-Calibration Menu’. Spanning Channels should be carried out prior to use or when the ambient operating temperature changes greater than +/- 20 degrees.
3.6.3 Factory Settings This will clear any user zero and span calibration data. It will also restore the pre-programmed factory settings for ALL channels – CH4, CO2, O2 or Gas Pod (if fitted) and pressure transducers.
3.6.4 Last Field Cal Displays the date the last field calibration was carried out (zero or span).
3.7 Mode of Operation Allows changing instrument between GA mode and GEM mode of operation.
GEM™2000 Operation Manual
9
4 Taking Probe Readings (GA Mode)
CES-LANDTEC classifies non-extraction wells as Probes when NOT connected to an active vacuum extraction system. Probes, (commonly known as migration probes), may be placed on the perimeter of the landfill to test for gas migration or may be placed next to a building or road to test for the presence of Methane. The GEM™2000 instrument may be configured as a Gas Analyzer (GA mode) for sampling probes. To access this function from the gas read screen press ‘�� ’ for menu and scroll down to Mode of Operation, press the ‘↵↵ ’ key and highlight Landfill Gas Analyzer, pressing the ‘↵↵ ’ key again will select GA mode of operation.
4.1 Preliminary Checks Prior to going to the test site, it is good practice to ensure: • All necessary ID codes and readings have been uploaded via DataField3.0 software. • The time and date are correct. • The water trap has a clean and dry filter fitted. • The inlet-port particulate filter is clean and dry. • A supply of spare filters is available in case of accidental water blockage or contamination. • The battery has a good charge (minimum 25% charge, even if only a few readings are required). • The memory has sufficient space available. • The CH4, CO2, and O2 readings have been auto-zeroed, without gas concentration present. • Check the span calibration with a known concentration calibration gas. Travel to site with the analyzer in the vehicle's interior - not in the trunk or truck bed, where it may be subjected to extremes of temperature and possible shock damage. Do not place the analyzer against anything hot (e.g. gas extraction pipe, car body or in an unattended car during the summer). This may cause erroneous readings. When moving around a site, protect the instrument from strong direct sunlight, heavy rain or wind-chill. Strong direct sunlight can raise the temperature of the instrument beyond its operating range. If this occurs, the LCD display will appear almost black and the contrast setting cannot alter the contrast. Always use the water trap! If the water trap becomes flooded, change the filter immediately and ensure all tubes are clear before re-use.
4.2 Update Site Data Prior to taking the readings at a particular site, the Site Data should be updated (if programmed). This is accessed via the General Menu ‘�� Update Site Data’. This function removes the need for the site conditions to be recorded manually. A series of up to five questions can be pre-programmed with the use of DataField 3.0 and answered at this time. The answers to these questions are stored and appended to each reading stored thereafter, until the site data is updated for another site.
4.3 Taking Readings – With ID For this function to be used it is essential that the relevant ID and if required, previous readings are uploaded to the Instrument. An ID cannot be entered from the Instrument.
1. When the read gas levels screen is displayed, option ‘�� Next ID’ should be selected. A list of stored ID’s is displayed for selection via the ‘∧∧’ and ‘∨∨’ cursor keys, the ‘next’ ID on the list is automatically
GEM™2000 Operation Manual
10
highlighted. To confirm selection, press the ‘↵↵ ’ key. The display may be toggled to display any relevant ID information such as a description of the probe location, work to be carried out, etc.
2. A reminder is displayed to disconnect sample tubes, as a clean air purge will automatically remove the previous sample from the instrument. Purge time may be set via DataField 3.0 (default is 30 seconds). Once the ‘↵↵ ’ key is pressed, purge will begin and the Read Gas Levels screen will be displayed upon completion. The purge may be aborted by pressing the ‘11EXIT’ key.
3. The ID number selected and the pump runtime is displayed in the upper left corner of the read gas levels display.
4. At this point, connect the sample tube (with water trap) from the sample point to the inlet port of the instrument, ensuring the connector ‘clicks’ into place. Then connect the sample tube to the probe sample port. Do not connect the sample tube to the probe port before connecting to the instrument as this will cause any pressure in the probe to dissipate and a proper pressure reading will not be taken.
5. As soon as the connection is made, the relative/static pressure reading will be displayed. No sample is taken from the probe at this time. Once the reading stabilizes and the pump starts, the relative/static pressure reading is stored. The relative/static reading will remain displayed as the pressure last taken.
6. The pump will run for the pre-programmed time and a countdown timer will be displayed. The pump may be stopped or started at anytime by way of the ‘>>’ (pump) key. The reading may be stored at anytime with the use of the ‘↵↵ ’ key. When the pump automatically stops this should be used as a prompt to store the reading.
7. Upon storing the reading, any pre-programmed questions will be displayed for response. This may require a numeric, alphanumeric selectable comment, or exclusive comment answer. A maximum of eight selectable and exclusive comments may be entered.
8. Disconnect the sample tubing from the probe and proceed to Step 1 for the next probe. For each reading, the following information will be stored: • ID code. • Current time/date. • Site data (if entered). • All gas readings and balance (CH4, CO2, O2). • LEL CH4. • Barometric Pressure. • Relative Pressure. • Questions/comments. • Temperature (if connected). • Gas Pod (if connected). When the instrument is switched off, a clean air purge is automatically started for a pre-determined period. This may be aborted with the use of the ‘↵↵ ’ key, although it is not recommended. A tone will sound and a flashing bell will be displayed next to the appropriate gas reading value if a preset alarm condition has been exceeded.
4.4 Taking Readings – Without ID 1. From the ID list press ‘�� Select No ID ’ or, if ID information has not been uploaded to the instrument,
an ID list will not be available. In either case, the ID will be displayed and stored as ‘- - - - - - - -‘. 9. A reminder is displayed to disconnect sample tubes, as a clean air purge will automatically remove the
previous sample from the instrument. Purge time may be set via DataField 3.0 (default is 30 seconds). Once ‘↵↵ ’ is pressed, purge will begin and the Read Gas Levels screen will be displayed upon completion. The purge may be aborted by pressing the ‘11EXIT’ key.

GEM™2000 Operation Manual
11
2. At this point, connect the sample tube (with water trap) from the sample point to the inlet port of the instrument, ensuring the connector ‘clicks’ in to place.
3. Now connect the sample tube to the probe sample port. Do not connect the sample tube to the probe port before connecting to the instrument as this will cause any pressure in the probe to dissipate and a proper pressure reading will not be taken.
4. The pump may be started or stopped at anytime by way of the ‘>>’ (pump) key and a ‘time-on’ timer will be displayed. The pump should always be stopped using the ‘↵↵ ’ key, before storing a reading.
5. Upon storing the reading, a virtual keyboard will be displayed for any alphanumeric comments to be entered.
6. Disconnect the sample tubing from the probe and proceed from step 1 for the next probe. Except for the ID code information, which will be stored as ‘- - - - - - - -‘, and probe questions, for each reading the information stored will be the same as that for a reading with an ID. A tone will sound and a flashing bell will be displayed next to the appropriate gas reading value if a preset alarm condition has been exceeded.
4.5 Temperature Probe Reading The GEM™2000 has the facility to automatically display and record the probe temperature via an optional temperature probe (TP-100). When a temperature probe is fitted to the RS232 Communication Socket, the temperature will be displayed in the read gas levels screen and recorded with all other data. The temperature probe is part of the GEM™2000 UL certification and is therefore certified for use under the same conditions as the instrument.
4.6 Cross-Gas Effects
4.6.1 Methane, Carbon Dioxide and Oxygen The Methane reading is filtered to an infrared absorption frequency of 3.41µm (nominal), the frequency specific to hydrocarbon bonds. Instruments are calibrated using certified Methane mixtures and will give correct readings provided there are no other hydrocarbon gasses present within the sample (e.g. ethane, propane, butane, etc.). If there are other hydrocarbons present, the Methane reading will be higher (never lower) than the actual Methane concentration being monitored. The extent to which the Methane reading is affected depends upon the concentration of the Methane in the sample and the concentration of the other hydrocarbons. The effect is non-linear and difficult to predict. The Carbon Dioxide reading is filtered to an infrared absorption frequency of 4.29µm (nominal), the frequency specific to Carbon Dioxide. Therefore, any other gases usually found on landfill sites will not affect the Carbon Dioxide reading. The Oxygen sensor is a newly developed galvanic cell type and suffers virtually no influence from CO2, CO, H2S, NO2, SO2 or H2, unlike many other types of Oxygen cell. The infrared sensors will not be "poisoned" by other hydrocarbons. Normal operation will resume as soon as the gas sample has been purged. Note - there has been one reported incident of a high reading due to the presence of Carbon Disulphide, which has a similar absorption frequency to Carbon Dioxide.

GEM™2000 Operation Manual
12
4.6.2 H2S, CO and other Optional Gas Pods The Gas Pods used to measure H2S and CO do suffer from cross-gas effects. Such effects are not accurately specified. However, the following table may be useful as a guide. This table represents how many ppm would be read by a Gas Pod if 100ppm of the interfering gas was applied, (with no other cross-contaminates being present in the sample).
Cell CO H2S SO2 NO2 CL2 H2 CH4 CO2 CO 100 <3 0 <-20 0 <40 0 0 H2S <0.5 100 ~20 ~-20 ~0.1 0 0
NOTE: All readings are given in parts per million (ppm). The life of an electrochemical cell is determined by exposure to gasses, typical life being one to two years. It is recommended that Gas Pods be field calibrated at regular intervals.
4.7 Memory The instrument's memory is volatile. It is maintained by a battery back-up system, which will maintain the memory while the battery is being changed. The memory is not to be used as a permanent storage medium and any data should be transferred to a more permanent storage medium as soon as possible. An Instrument should never be stored for prolonged periods with valuable data in its memory. Although unlikely, sudden shocks, high levels of electromagnetic interference or static discharge may cause memory corruption or loss. If this occurs, the instrument should be Cold Started and the calibration reset to factory settings before further use. Cold starting will erase all data in the instrument including resetting the time and date to the default value.
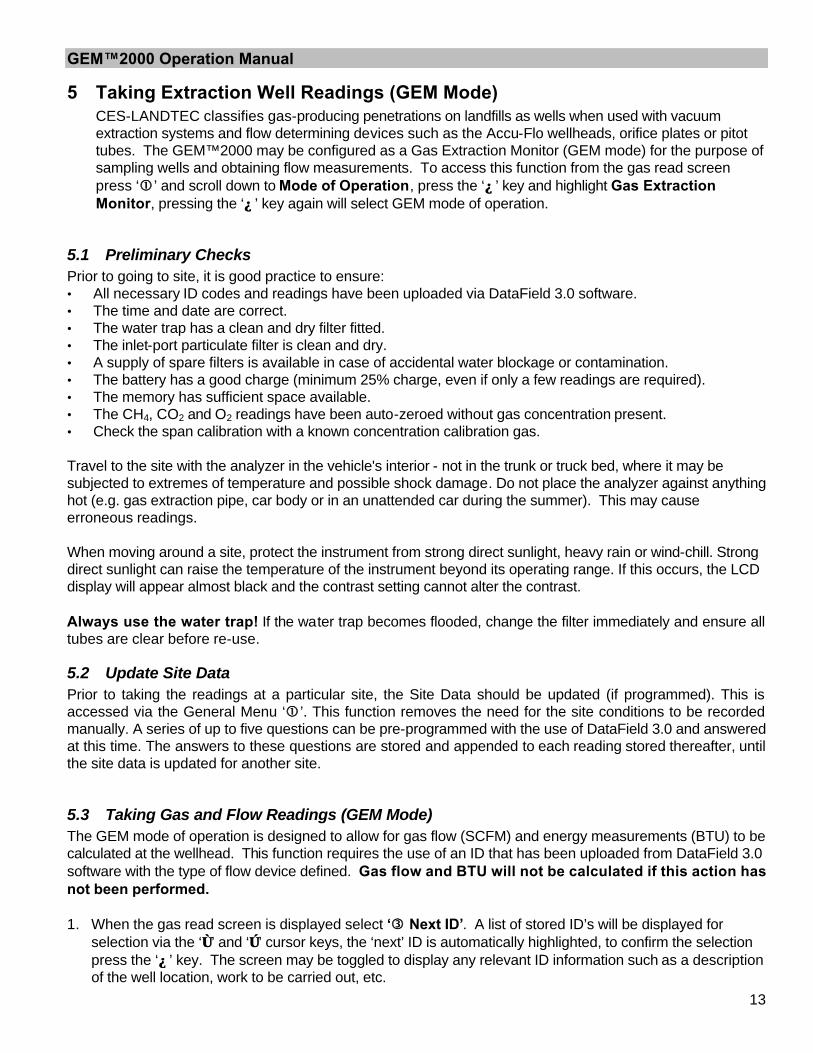
GEM™2000 Operation Manual
13
5 Taking Extraction Well Readings (GEM Mode) CES-LANDTEC classifies gas-producing penetrations on landfills as wells when used with vacuum extraction systems and flow determining devices such as the Accu-Flo wellheads, orifice plates or pitot tubes. The GEM™2000 may be configured as a Gas Extraction Monitor (GEM mode) for the purpose of sampling wells and obtaining flow measurements. To access this function from the gas read screen press ‘�� ’ and scroll down to Mode of Operation, press the ‘↵↵ ’ key and highlight Gas Extraction Monitor, pressing the ‘↵↵ ’ key again will select GEM mode of operation.
5.1 Preliminary Checks Prior to going to site, it is good practice to ensure: • All necessary ID codes and readings have been uploaded via DataField 3.0 software. • The time and date are correct. • The water trap has a clean and dry filter fitted. • The inlet-port particulate filter is clean and dry. • A supply of spare filters is available in case of accidental water blockage or contamination. • The battery has a good charge (minimum 25% charge, even if only a few readings are required). • The memory has sufficient space available. • The CH4, CO2 and O2 readings have been auto-zeroed without gas concentration present. • Check the span calibration with a known concentration calibration gas. Travel to the site with the analyzer in the vehicle's interior - not in the trunk or truck bed, where it may be subjected to extremes of temperature and possible shock damage. Do not place the analyzer against anything hot (e.g. gas extraction pipe, car body or in an unattended car during the summer). This may cause erroneous readings. When moving around a site, protect the instrument from strong direct sunlight, heavy rain or wind-chill. Strong direct sunlight can raise the temperature of the instrument beyond its operating range. If this occurs, the LCD display will appear almost black and the contrast setting cannot alter the contrast. Always use the water trap! If the water trap becomes flooded, change the filter immediately and ensure all tubes are clear before re-use.
5.2 Update Site Data Prior to taking the readings at a particular site, the Site Data should be updated (if programmed). This is accessed via the General Menu ‘�� ’. This function removes the need for the site conditions to be recorded manually. A series of up to five questions can be pre-programmed with the use of DataField 3.0 and answered at this time. The answers to these questions are stored and appended to each reading stored thereafter, until the site data is updated for another site.
5.3 Taking Gas and Flow Readings (GEM Mode) The GEM mode of operation is designed to allow for gas flow (SCFM) and energy measurements (BTU) to be calculated at the wellhead. This function requires the use of an ID that has been uploaded from DataField 3.0 software with the type of flow device defined. Gas flow and BTU will not be calculated if this action has not been performed. 1. When the gas read screen is displayed select ‘�� Next ID’. A list of stored ID’s will be displayed for
selection via the ‘∧∧’ and ‘∨∨’ cursor keys, the ‘next’ ID is automatically highlighted, to confirm the selection press the ‘↵↵ ’ key. The screen may be toggled to display any relevant ID information such as a description of the well location, work to be carried out, etc.
GEM™2000 Operation Manual
14
2. A reminder is displayed to disconnect sample tubes, as a clean air purge will automatically remove the previous sample from the instrument. Purge time may be set via DataField 3.0 (default is 30 seconds). Once the ‘↵↵ ’ key is pressed, purge will begin and the Read Gas Levels screen will be displayed upon completion. The purge may be aborted by pressing the ‘11EXIT’ key.
3. Connect the sample tubes (with water trap filter) to the wellhead ensuring the gas sample tube and impact pressure tubes are properly oriented. Insert the temperature probe if used.
4. Press the ‘>>’ key to start the sample pump; a countdown timer will be displayed in the upper left area of the display. The pump may be stopped and restarted and any time by pressing the ‘>>’ key. The pump run time is set in DataField 3.0 software. Allow the gas readings to stabilize and press ‘55Measure Flow’ key, this will store the gas level readings and display the ‘PRESSURE READINGS’ screen. Note; a flashing bell will be displayed next to the appropriate gas and a beeping tone will be heard, if a preset alarm condition has been exceeded.
5. The ‘PRESSURE READINGS’ screen will prompt the user to disconnect the sample tubes and allow the pressure to stabilize. Once the pressure has stabilized press ‘↵↵ Zero Transducers’. Press ‘11 ’ to continue. Note; if Accu-Flo wellheads are used this zero function may be performed prior to connecting the sample tubes to the well head by selecting ‘11 MENU’ and highlighting ‘ZERO TRANSDUCERS’. This eliminates the need to disconnect and re-connect the sample tubes on the same wellhead.
6. If a temperature probe is not connected, the user is prompted to manually input the gas temperature, press the ‘↵↵ ’ key when entry is finished.
7. The gas flow and energy screen is now displayed showing all the gas level readings taken in the gas read screen as well as the level of gas flow (SCFM) and power (BTU). In addition, Adjusted, Current and Previous (if downloaded) readings are displayed so modifications may be made to the well if required.
8. Pressing ‘↵↵ STORE’ will save the readings to memory. Then, the comments screen (if comments were loaded) will display and allow you to answer questions or select comments about the condition of the well. A total of seven comments and one exclusive comment may be stored with each ID.
9. Press ‘33 NEXT ID’ and proceed to the next wellhead. An automatic purge will be performed at this time to ensure the sample has been exhausted from the instrument.
For each reading, the following information will be stored: • ID code. • Current time/date. • Site data (if entered). • All gas readings and balance gas (CH4, CO2, O2). • Barometric Pressure. • Temperature. • Gas Pod (if connected). • Gas flow (SCFM) and Power (BTU). • Comments and exclusive comment. When the Instrument is switched off, a clean air purge is automatically started for a pre-determined global period. This may be aborted by pressing the ‘↵↵ ’ key, although we do not recommend this action.
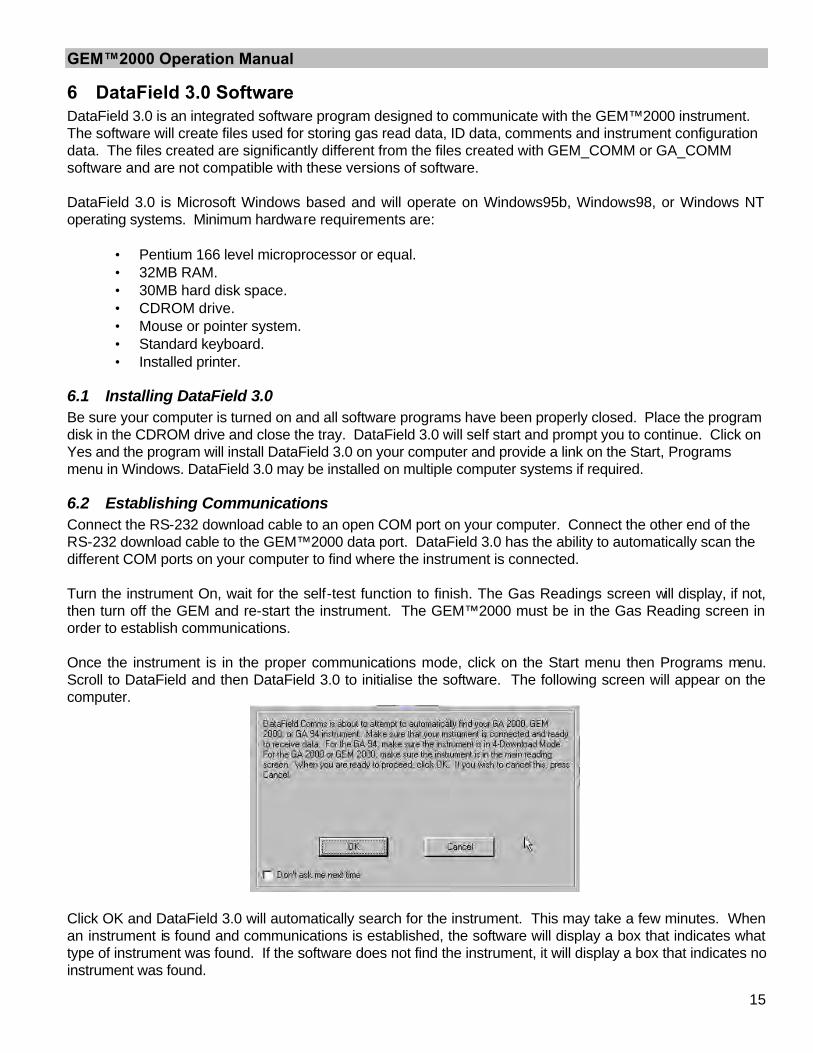
GEM™2000 Operation Manual
15
6 DataField 3.0 Software DataField 3.0 is an integrated software program designed to communicate with the GEM™2000 instrument. The software will create files used for storing gas read data, ID data, comments and instrument configuration data. The files created are significantly different from the files created with GEM_COMM or GA_COMM software and are not compatible with these versions of software. DataField 3.0 is Microsoft Windows based and will operate on Windows95b, Windows98, or Windows NT operating systems. Minimum hardware requirements are:
• Pentium 166 level microprocessor or equal. • 32MB RAM. • 30MB hard disk space. • CDROM drive. • Mouse or pointer system. • Standard keyboard. • Installed printer.
6.1 Installing DataField 3.0 Be sure your computer is turned on and all software programs have been properly closed. Place the program disk in the CDROM drive and close the tray. DataField 3.0 will self start and prompt you to continue. Click on Yes and the program will install DataField 3.0 on your computer and provide a link on the Start, Programs menu in Windows. DataField 3.0 may be installed on multiple computer systems if required.
6.2 Establishing Communications Connect the RS-232 download cable to an open COM port on your computer. Connect the other end of the RS-232 download cable to the GEM™2000 data port. DataField 3.0 has the ability to automatically scan the different COM ports on your computer to find where the instrument is connected. Turn the instrument On, wait for the self-test function to finish. The Gas Readings screen will display, if not, then turn off the GEM and re-start the instrument. The GEM™2000 must be in the Gas Reading screen in order to establish communications. Once the instrument is in the proper communications mode, click on the Start menu then Programs menu. Scroll to DataField and then DataField 3.0 to initialise the software. The following screen will appear on the computer.
Click OK and DataField 3.0 will automatically search for the instrument. This may take a few minutes. When an instrument is found and communications is established, the software will display a box that indicates what type of instrument was found. If the software does not find the instrument, it will display a box that indicates no instrument was found.
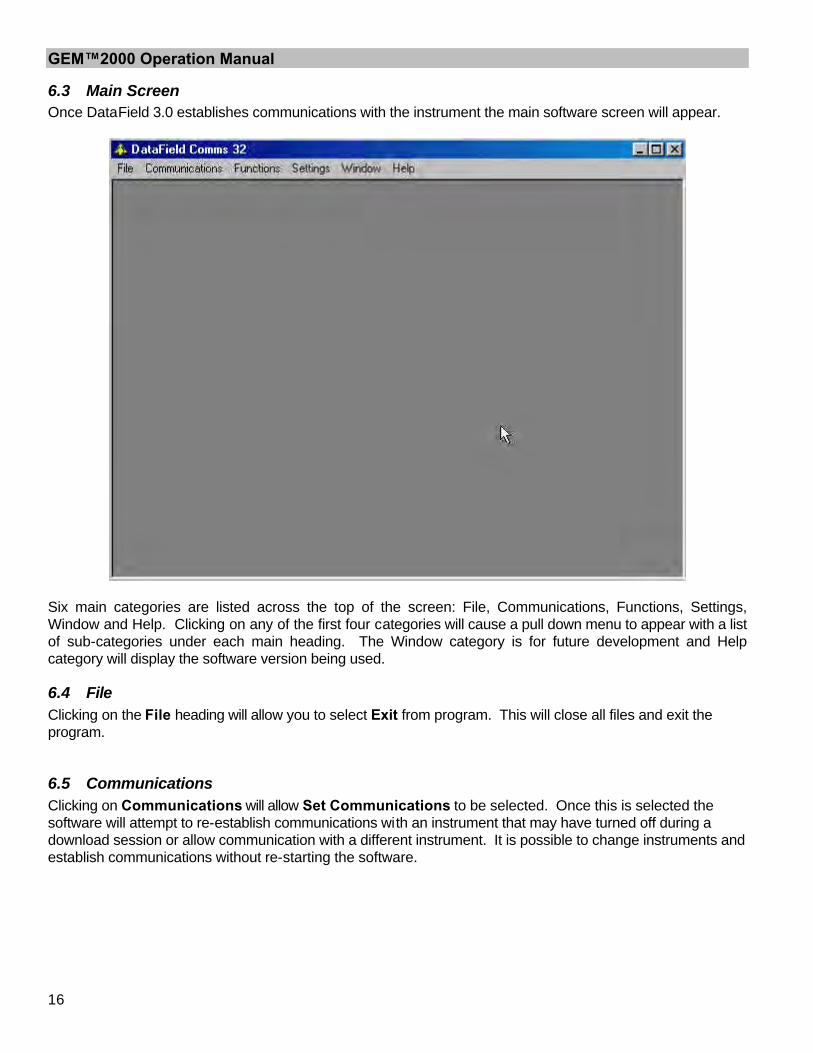
GEM™2000 Operation Manual
16
6.3 Main Screen Once DataField 3.0 establishes communications with the instrument the main software screen will appear.
Six main categories are listed across the top of the screen: File, Communications, Functions, Settings, Window and Help. Clicking on any of the first four categories will cause a pull down menu to appear with a list of sub-categories under each main heading. The Window category is for future development and Help category will display the software version being used.
6.4 File Clicking on the File heading will allow you to select Exit from program. This will close all files and exit the program.
6.5 Communications Clicking on Communications will allow Set Communications to be selected. Once this is selected the software will attempt to re-establish communications with an instrument that may have turned off during a download session or allow communication with a different instrument. It is possible to change instruments and establish communications without re-starting the software.
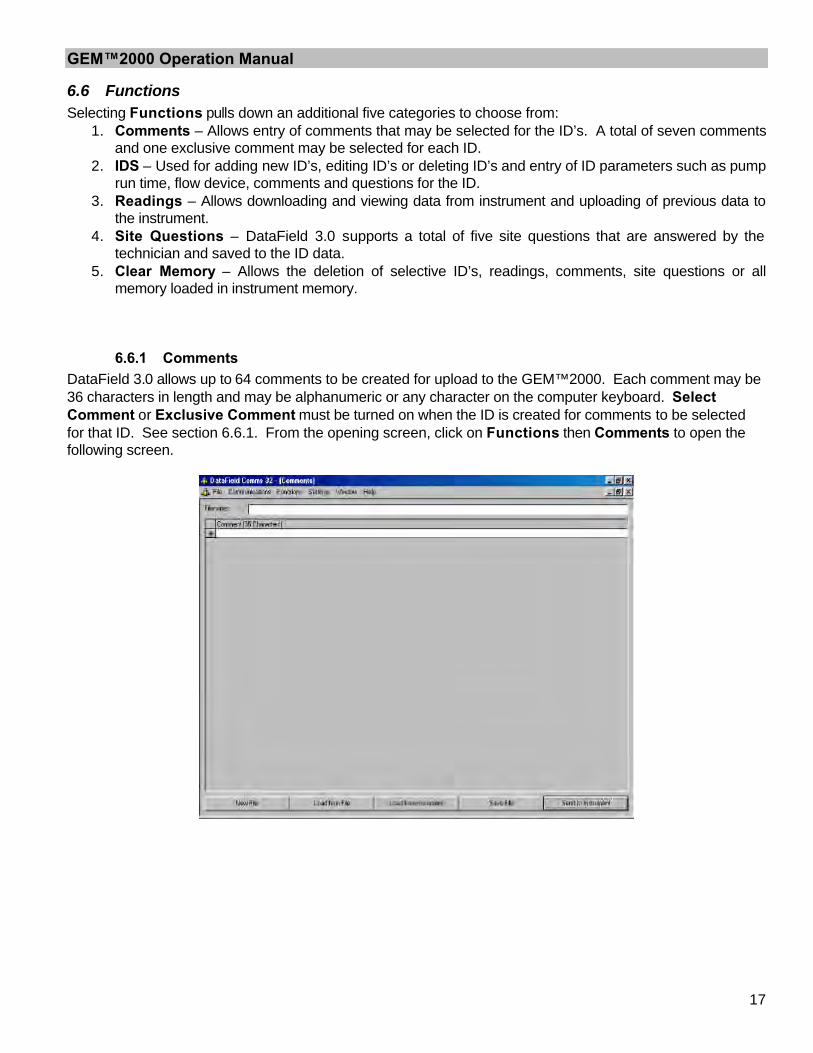
GEM™2000 Operation Manual
17
6.6 Functions Selecting Functions pulls down an additional five categories to choose from:
1. Comments – Allows entry of comments that may be selected for the ID’s. A total of seven comments and one exclusive comment may be selected for each ID.
2. IDS – Used for adding new ID’s, editing ID’s or deleting ID’s and entry of ID parameters such as pump run time, flow device, comments and questions for the ID.
3. Readings – Allows downloading and viewing data from instrument and uploading of previous data to the instrument.
4. Site Questions – DataField 3.0 supports a total of five site questions that are answered by the technician and saved to the ID data.
5. Clear Memory – Allows the deletion of selective ID’s, readings, comments, site questions or all memory loaded in instrument memory.
6.6.1 Comments DataField 3.0 allows up to 64 comments to be created for upload to the GEM™2000. Each comment may be 36 characters in length and may be alphanumeric or any character on the computer keyboard. Select Comment or Exclusive Comment must be turned on when the ID is created for comments to be selected for that ID. See section 6.6.1. From the opening screen, click on Functions then Comments to open the following screen.

GEM™2000 Operation Manual
18
Click on New File and provide a name for file to be saved. It is always suggested to save the comment file because of the potential size and time required to recreate the comments. Once created, the comment file may be modified and saved under a different file name at any time.
Enter the comment on the comment line and press Enter to continue entering comments until all the desired comments have been entered. Click on Save File to save the data to disk and then click on Send to Instrument to save the comments in the instrument. To delete a comment, click on the box to the left of the comment to highlight the comment and press the Delete key on the computer keyboard to remove the highlighted comment.
6.6.2 Entering ID’s From the opening screen select Functions and than ID’s. The following screen will open:
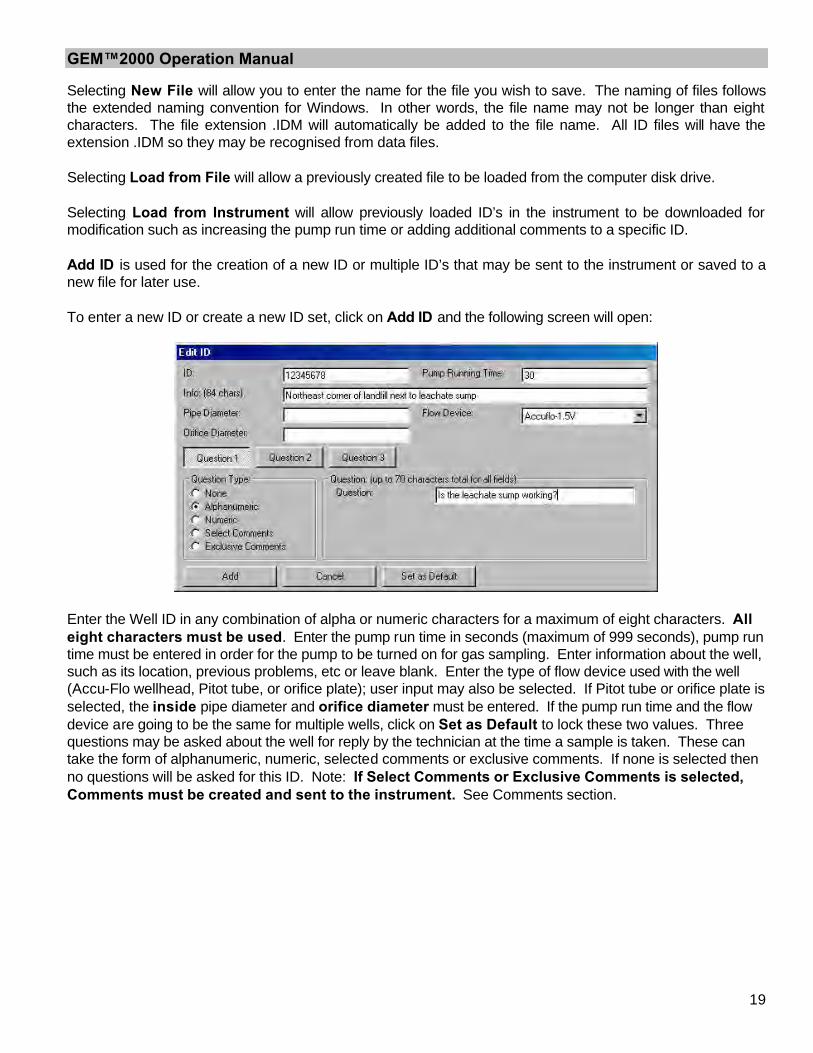
GEM™2000 Operation Manual
19
Selecting New File will allow you to enter the name for the file you wish to save. The naming of files follows the extended naming convention for Windows. In other words, the file name may not be longer than eight characters. The file extension .IDM will automatically be added to the file name. All ID files will have the extension .IDM so they may be recognised from data files. Selecting Load from File will allow a previously created file to be loaded from the computer disk drive. Selecting Load from Instrument will allow previously loaded ID’s in the instrument to be downloaded for modification such as increasing the pump run time or adding additional comments to a specific ID. Add ID is used for the creation of a new ID or multiple ID’s that may be sent to the instrument or saved to a new file for later use. To enter a new ID or create a new ID set, click on Add ID and the following screen will open:
Enter the Well ID in any combination of alpha or numeric characters for a maximum of eight characters. All eight characters must be used. Enter the pump run time in seconds (maximum of 999 seconds), pump run time must be entered in order for the pump to be turned on for gas sampling. Enter information about the well, such as its location, previous problems, etc or leave blank. Enter the type of flow device used with the well (Accu-Flo wellhead, Pitot tube, or orifice plate); user input may also be selected. If Pitot tube or orifice plate is selected, the inside pipe diameter and orifice diameter must be entered. If the pump run time and the flow device are going to be the same for multiple wells, click on Set as Default to lock these two values. Three questions may be asked about the well for reply by the technician at the time a sample is taken. These can take the form of alphanumeric, numeric, selected comments or exclusive comments. If none is selected then no questions will be asked for this ID. Note: If Select Comments or Exclusive Comments is selected, Comments must be created and sent to the instrument. See Comments section.
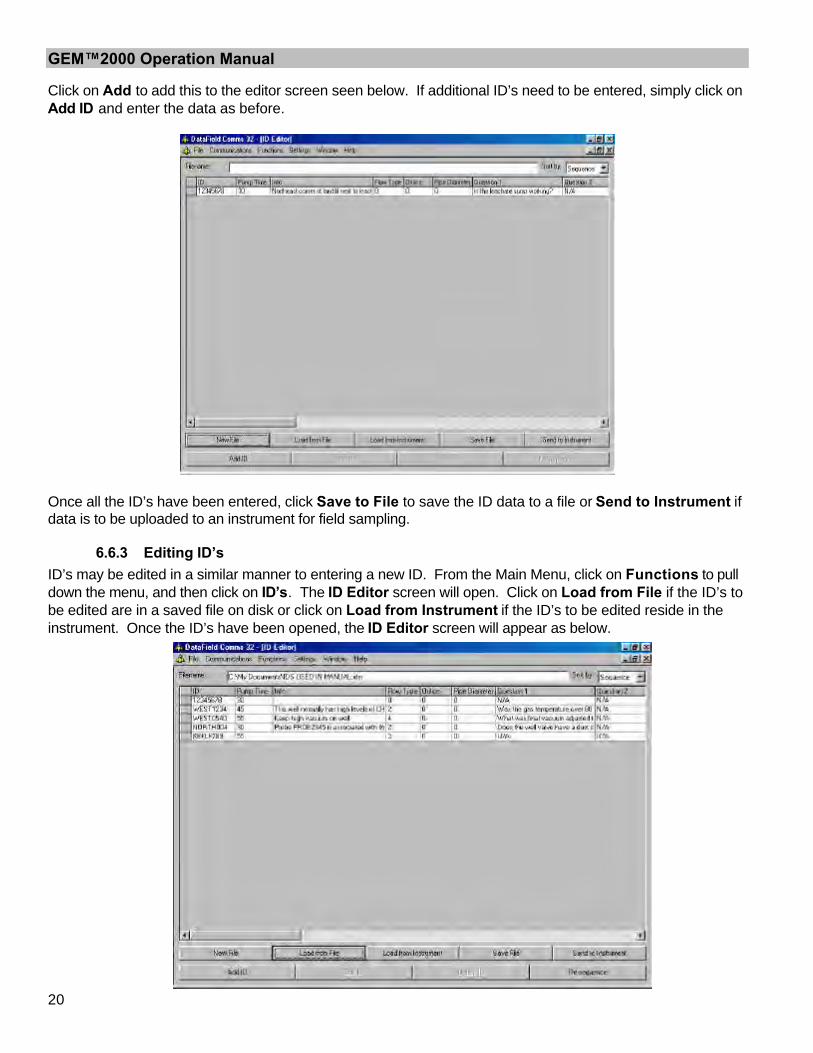
GEM™2000 Operation Manual
20
Click on Add to add this to the editor screen seen below. If additional ID’s need to be entered, simply click on Add ID and enter the data as before.
Once all the ID’s have been entered, click Save to File to save the ID data to a file or Send to Instrument if data is to be uploaded to an instrument for field sampling.
6.6.3 Editing ID’s ID’s may be edited in a similar manner to entering a new ID. From the Main Menu, click on Functions to pull down the menu, and then click on ID’s. The ID Editor screen will open. Click on Load from File if the ID’s to be edited are in a saved file on disk or click on Load from Instrument if the ID’s to be edited reside in the instrument. Once the ID’s have been opened, the ID Editor screen will appear as below.

GEM™2000 Operation Manual
21
To select an ID for editing, click on the button to the left of the ID to highlight the ID, and then click on Edit ID at the bottom of the screen.
The Edit ID screen will open and allow information for the selected ID to be changed. When finished with the changes, click on Save to save the edited ID to the ID list.
When editing is completed, click on Save File to save the edited data to disk or Send to Instrument to update data in the instrument. Any changes made will overwrite existing data.
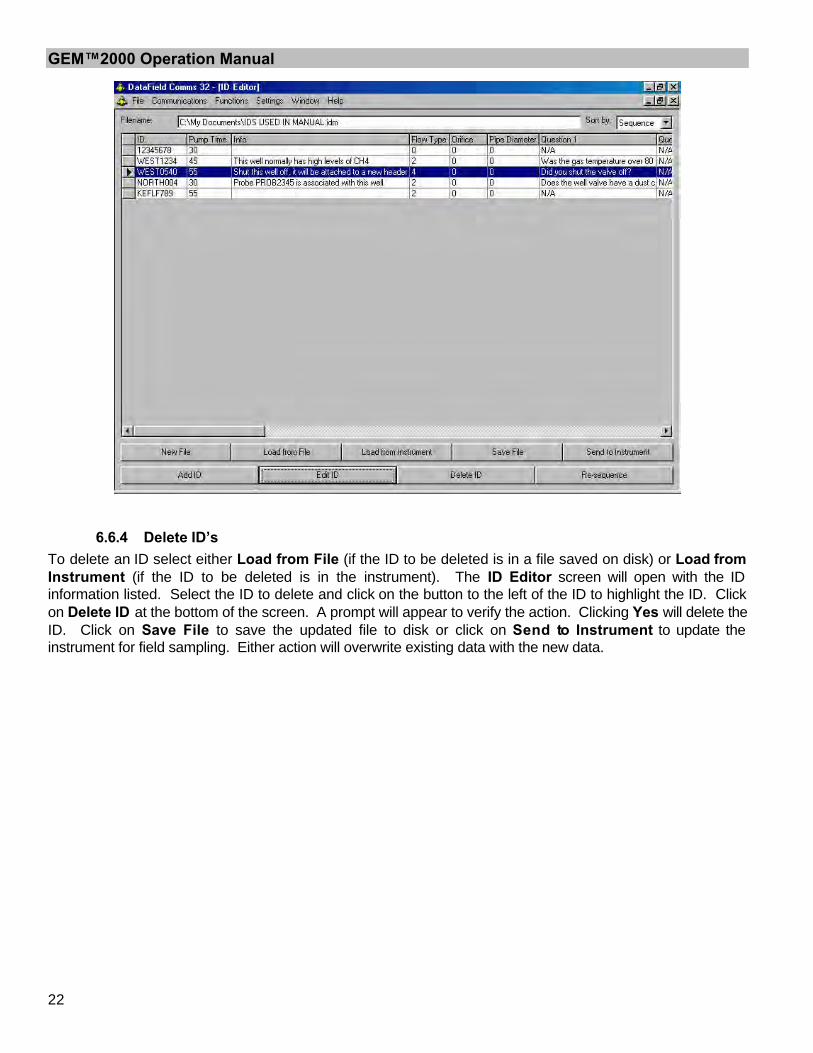
GEM™2000 Operation Manual
22
6.6.4 Delete ID’s To delete an ID select either Load from File (if the ID to be deleted is in a file saved on disk) or Load from Instrument (if the ID to be deleted is in the instrument). The ID Editor screen will open with the ID information listed. Select the ID to delete and click on the button to the left of the ID to highlight the ID. Click on Delete ID at the bottom of the screen. A prompt will appear to verify the action. Clicking Yes will delete the ID. Click on Save File to save the updated file to disk or click on Send to Instrument to update the instrument for field sampling. Either action will overwrite existing data with the new data.
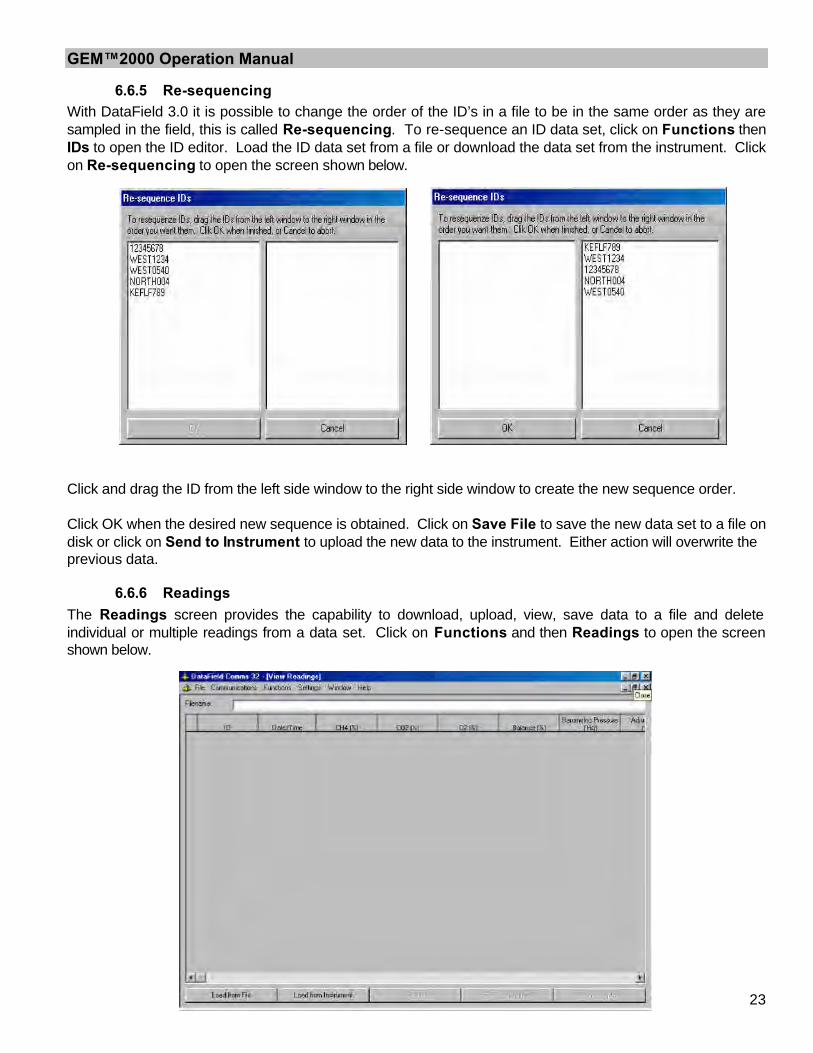
GEM™2000 Operation Manual
23
6.6.5 Re-sequencing With DataField 3.0 it is possible to change the order of the ID’s in a file to be in the same order as they are sampled in the field, this is called Re-sequencing. To re-sequence an ID data set, click on Functions then IDs to open the ID editor. Load the ID data set from a file or download the data set from the instrument. Click on Re-sequencing to open the screen shown below.
Click and drag the ID from the left side window to the right side window to create the new sequence order. Click OK when the desired new sequence is obtained. Click on Save File to save the new data set to a file on disk or click on Send to Instrument to upload the new data to the instrument. Either action will overwrite the previous data.
6.6.6 Readings The Readings screen provides the capability to download, upload, view, save data to a file and delete individual or multiple readings from a data set. Click on Functions and then Readings to open the screen shown below.
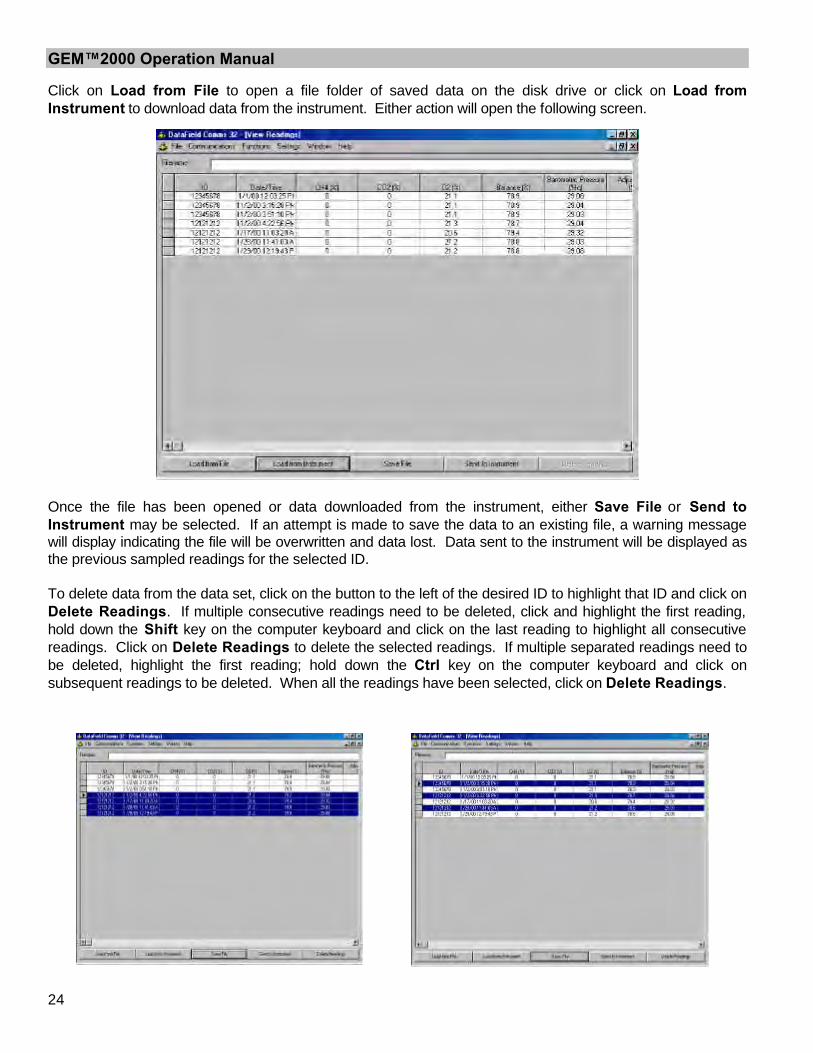
GEM™2000 Operation Manual
24
Click on Load from File to open a file folder of saved data on the disk drive or click on Load from Instrument to download data from the instrument. Either action will open the following screen.
Once the file has been opened or data downloaded from the instrument, either Save File or Send to Instrument may be selected. If an attempt is made to save the data to an existing file, a warning message will display indicating the file will be overwritten and data lost. Data sent to the instrument will be displayed as the previous sampled readings for the selected ID. To delete data from the data set, click on the button to the left of the desired ID to highlight that ID and click on Delete Readings. If multiple consecutive readings need to be deleted, click and highlight the first reading, hold down the Shift key on the computer keyboard and click on the last reading to highlight all consecutive readings. Click on Delete Readings to delete the selected readings. If multiple separated readings need to be deleted, highlight the first reading; hold down the Ctrl key on the computer keyboard and click on subsequent readings to be deleted. When all the readings have been selected, click on Delete Readings.
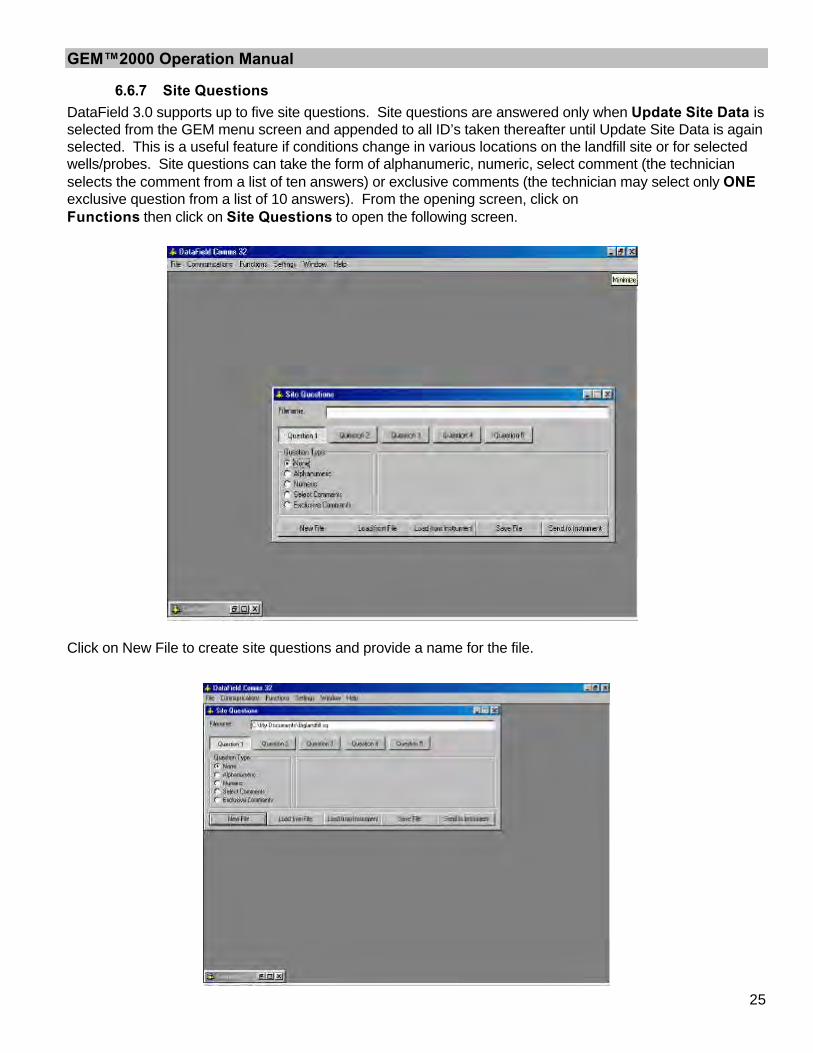
GEM™2000 Operation Manual
25
6.6.7 Site Questions DataField 3.0 supports up to five site questions. Site questions are answered only when Update Site Data is selected from the GEM menu screen and appended to all ID’s taken thereafter until Update Site Data is again selected. This is a useful feature if conditions change in various locations on the landfill site or for selected wells/probes. Site questions can take the form of alphanumeric, numeric, select comment (the technician selects the comment from a list of ten answers) or exclusive comments (the technician may select only ONE exclusive question from a list of 10 answers). From the opening screen, click on Functions then click on Site Questions to open the following screen.
Click on New File to create site questions and provide a name for the file.
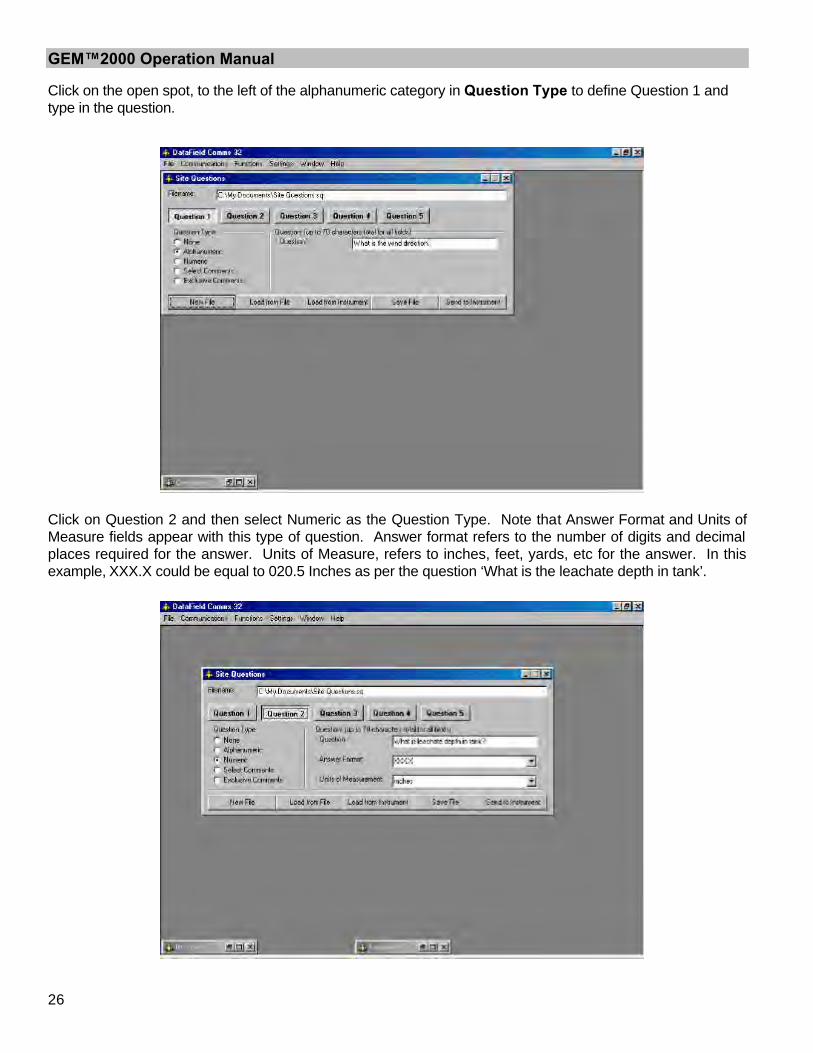
GEM™2000 Operation Manual
26
Click on the open spot, to the left of the alphanumeric category in Question Type to define Question 1 and type in the question.
Click on Question 2 and then select Numeric as the Question Type. Note that Answer Format and Units of Measure fields appear with this type of question. Answer format refers to the number of digits and decimal places required for the answer. Units of Measure, refers to inches, feet, yards, etc for the answer. In this example, XXX.X could be equal to 020.5 Inches as per the question ‘What is the leachate depth in tank’.
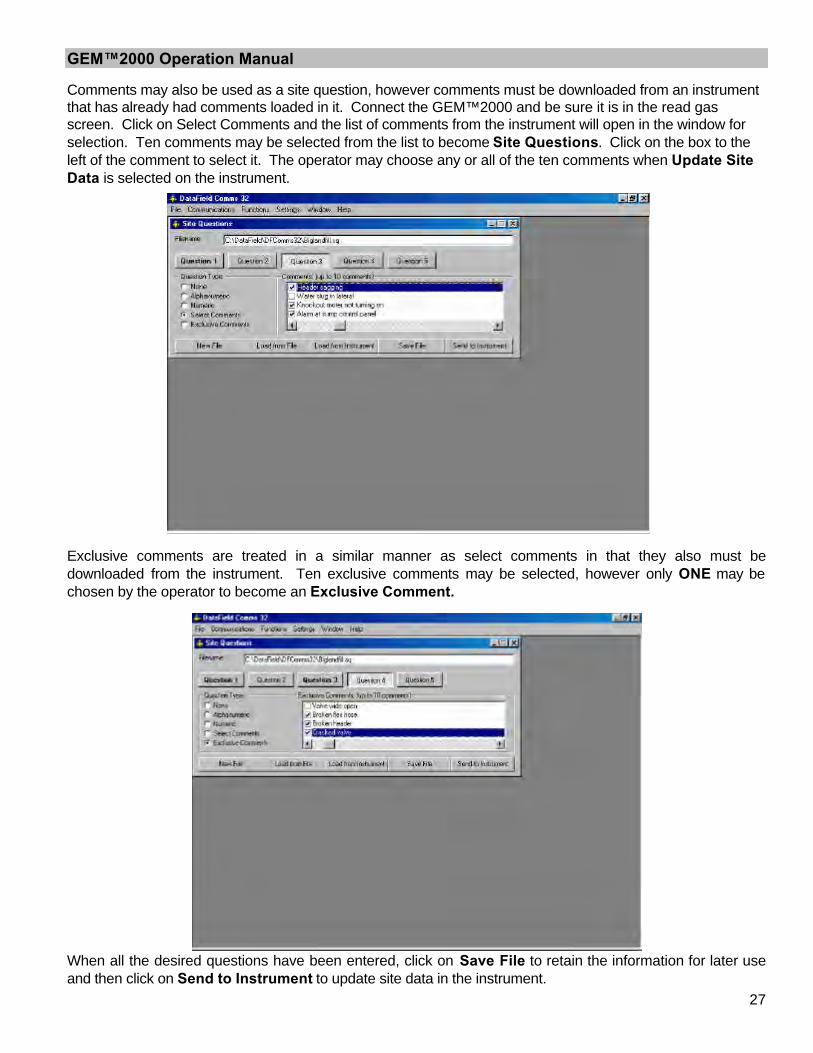
GEM™2000 Operation Manual
27
Comments may also be used as a site question, however comments must be downloaded from an instrument that has already had comments loaded in it. Connect the GEM™2000 and be sure it is in the read gas screen. Click on Select Comments and the list of comments from the instrument will open in the window for selection. Ten comments may be selected from the list to become Site Questions. Click on the box to the left of the comment to select it. The operator may choose any or all of the ten comments when Update Site Data is selected on the instrument.
Exclusive comments are treated in a similar manner as select comments in that they also must be downloaded from the instrument. Ten exclusive comments may be selected, however only ONE may be chosen by the operator to become an Exclusive Comment.
When all the desired questions have been entered, click on Save File to retain the information for later use and then click on Send to Instrument to update site data in the instrument.
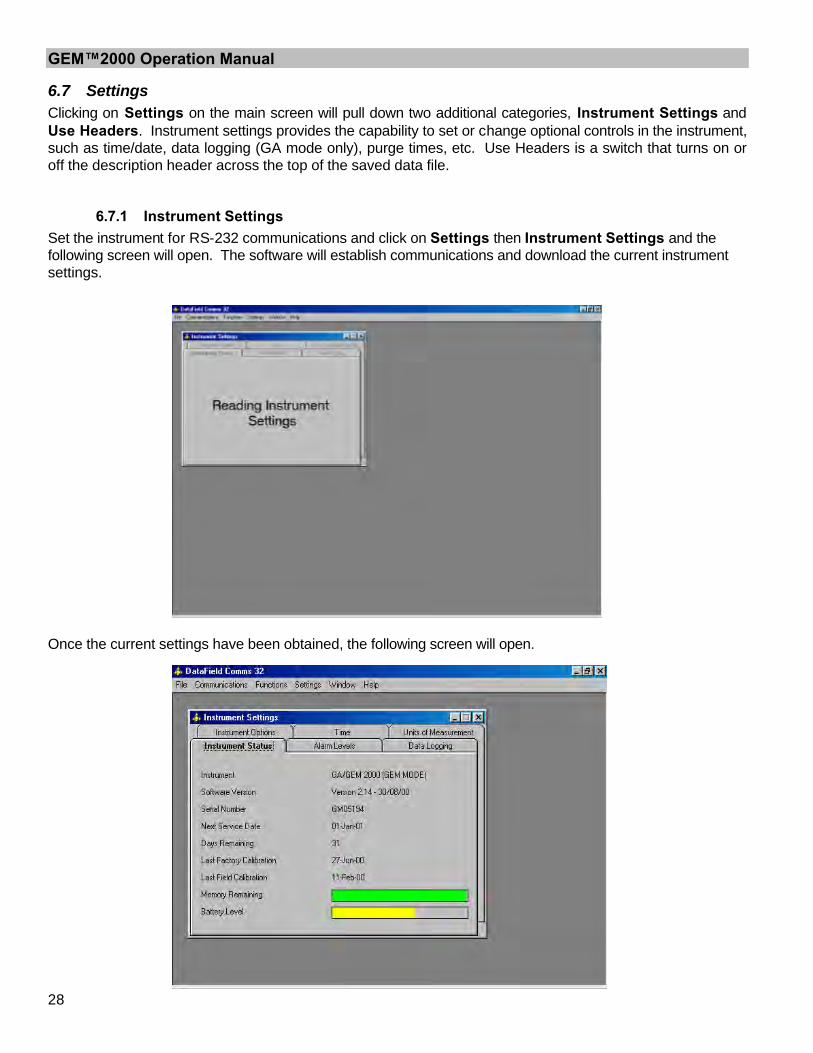
GEM™2000 Operation Manual
28
6.7 Settings Clicking on Settings on the main screen will pull down two additional categories, Instrument Settings and Use Headers. Instrument settings provides the capability to set or change optional controls in the instrument, such as time/date, data logging (GA mode only), purge times, etc. Use Headers is a switch that turns on or off the description header across the top of the saved data file.
6.7.1 Instrument Settings Set the instrument for RS-232 communications and click on Settings then Instrument Settings and the following screen will open. The software will establish communications and download the current instrument settings.
Once the current settings have been obtained, the following screen will open.
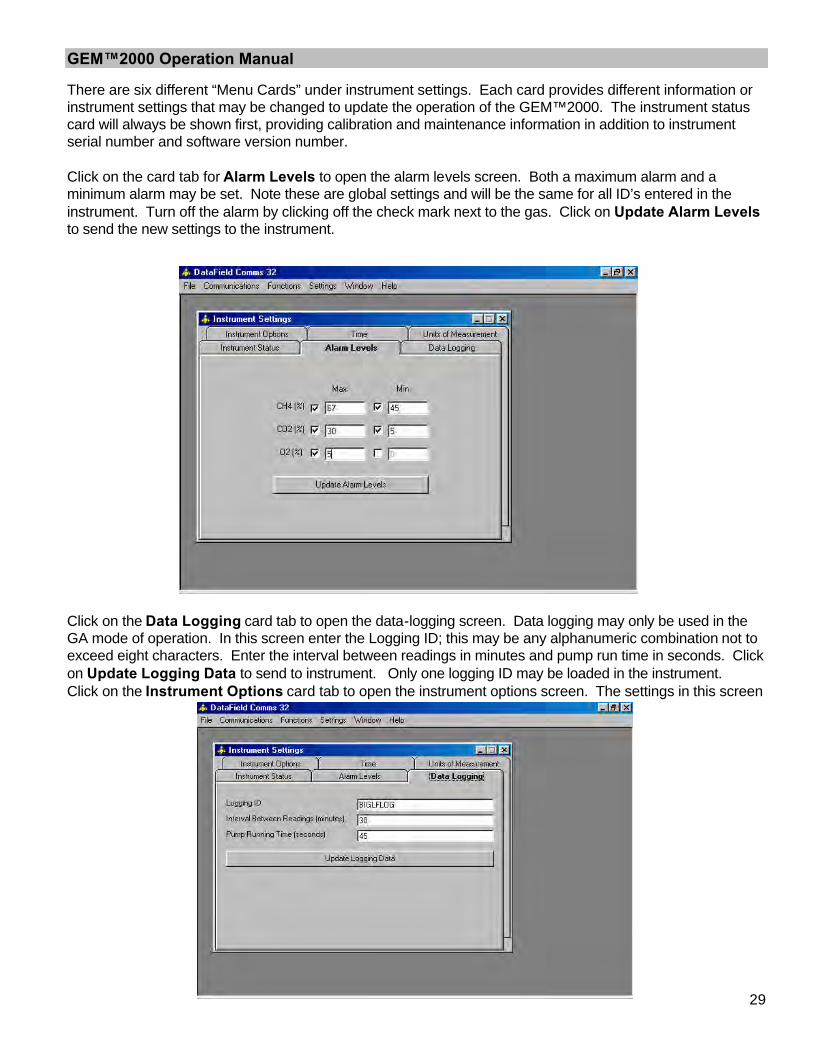
GEM™2000 Operation Manual
29
There are six different “Menu Cards” under instrument settings. Each card provides different information or instrument settings that may be changed to update the operation of the GEM™2000. The instrument status card will always be shown first, providing calibration and maintenance information in addition to instrument serial number and software version number. Click on the card tab for Alarm Levels to open the alarm levels screen. Both a maximum alarm and a minimum alarm may be set. Note these are global settings and will be the same for all ID’s entered in the instrument. Turn off the alarm by clicking off the check mark next to the gas. Click on Update Alarm Levels to send the new settings to the instrument.
Click on the Data Logging card tab to open the data-logging screen. Data logging may only be used in the GA mode of operation. In this screen enter the Logging ID; this may be any alphanumeric combination not to exceed eight characters. Enter the interval between readings in minutes and pump run time in seconds. Click on Update Logging Data to send to instrument. Only one logging ID may be loaded in the instrument. Click on the Instrument Options card tab to open the instrument options screen. The settings in this screen
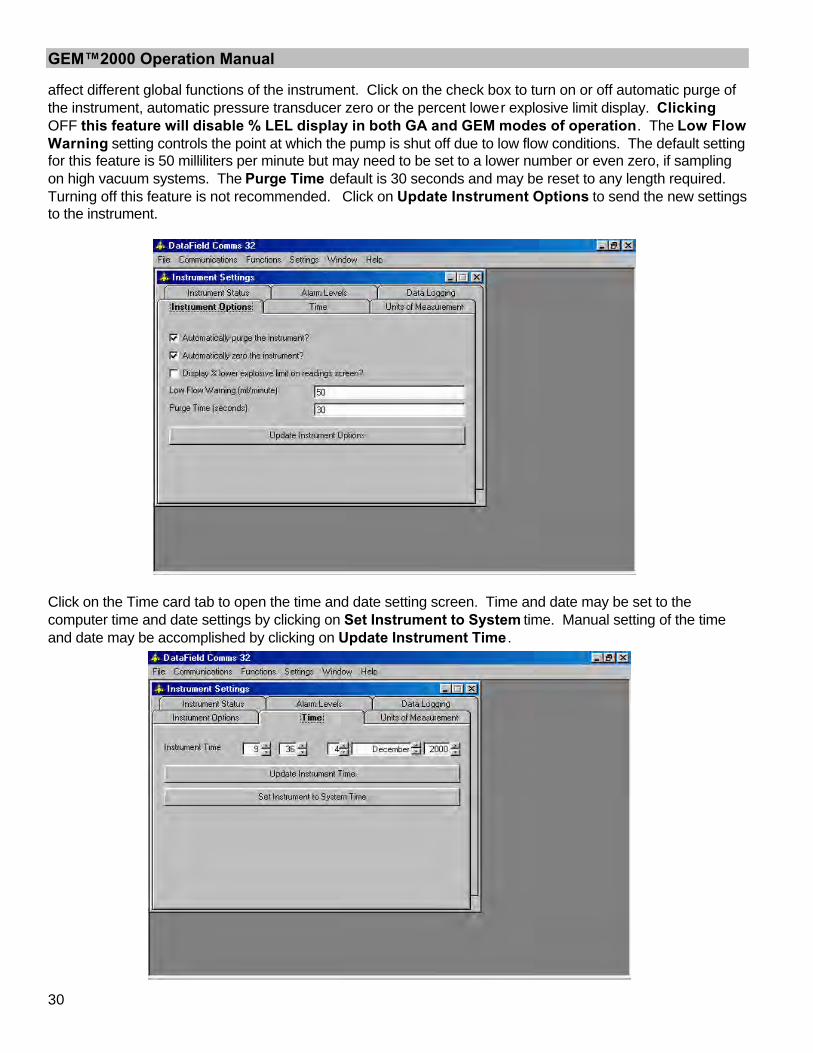
GEM™2000 Operation Manual
30
affect different global functions of the instrument. Click on the check box to turn on or off automatic purge of the instrument, automatic pressure transducer zero or the percent lower explosive limit display. Clicking OFF this feature will disable % LEL display in both GA and GEM modes of operation. The Low Flow Warning setting controls the point at which the pump is shut off due to low flow conditions. The default setting for this feature is 50 milliliters per minute but may need to be set to a lower number or even zero, if sampling on high vacuum systems. The Purge Time default is 30 seconds and may be reset to any length required. Turning off this feature is not recommended. Click on Update Instrument Options to send the new settings to the instrument.
Click on the Time card tab to open the time and date setting screen. Time and date may be set to the computer time and date settings by clicking on Set Instrument to System time. Manual setting of the time and date may be accomplished by clicking on Update Instrument Time .
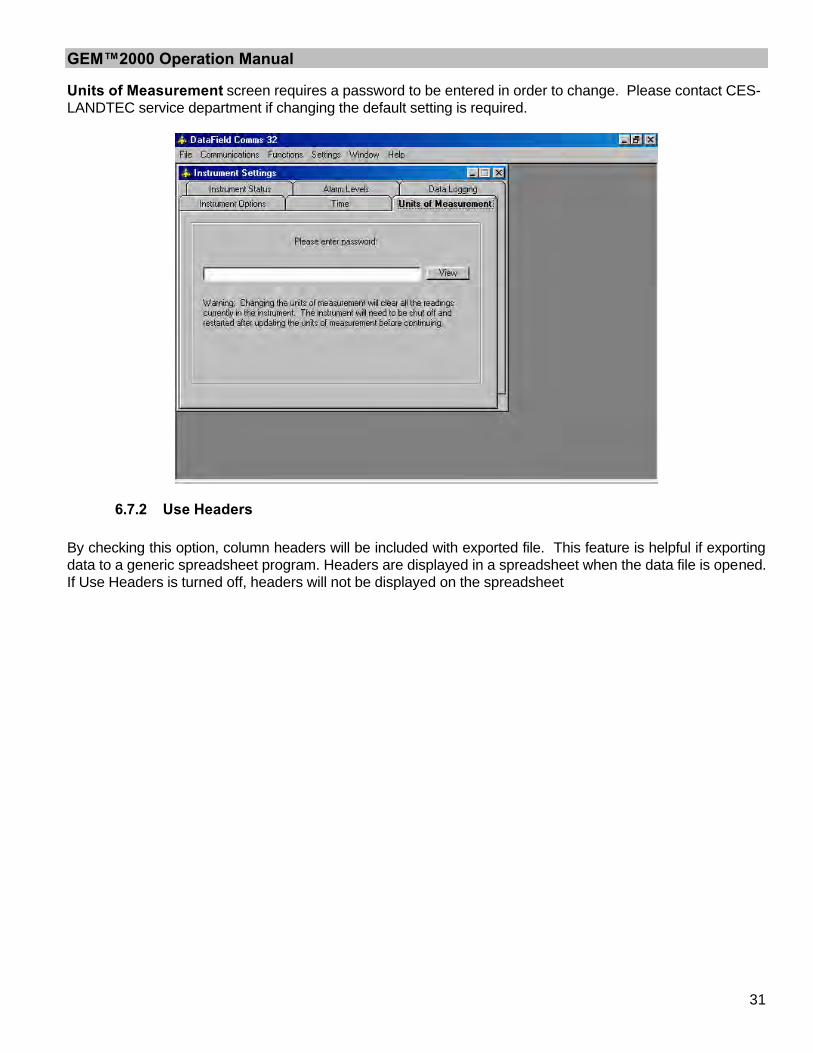
GEM™2000 Operation Manual
31
Units of Measurement screen requires a password to be entered in order to change. Please contact CES-LANDTEC service department if changing the default setting is required.
6.7.2 Use Headers By checking this option, column headers will be included with exported file. This feature is helpful if exporting data to a generic spreadsheet program. Headers are displayed in a spreadsheet when the data file is opened. If Use Headers is turned off, headers will not be displayed on the spreadsheet

GEM™2000 Operation Manual
32
7 Field Operations
7.1 Landfill Gas Generation A brief overview of the theory of landfill gas generation and methane recovery follows. Initially, when decomposable refuse is placed into a solid waste landfill, the refuse is entrained with air from the surrounding atmosphere. Through a natural process of bacterial decomposition, the oxygen from the air is consumed and an anaerobic (oxygen free) environment is created within the landfill. This anaerobic environment is one of several conditions necessary for the formation of methane-CH4. If oxygen is reintroduced into the landfill, those areas are returned to an aerobic (oxygen present) state and the methane-producing bacteria population are destroyed. A period of time must pass before the productive capacity is returned to normal. Since there is some methane of a given quality within the landfill void space, a decline in methane quality is only gradually apparent depending upon the size of the landfill. Carbon Dioxide is also produced under either an aerobic or anaerobic condition. Under static conditions, the landfill gas will be composed of roughly half methane and half Carbon Dioxide with a little nitrogen. As air is introduced into the landfill, the oxygen is initially converted to Carbon Dioxide and residual nitrogen remains. Measurement of residual nitrogen is usually a good indicator of the anaerobic state of the landfill; however, it cannot be directly measured. It can, however, be assumed and estimated using a subtraction basis as the balance gas. Hence, the measurement of Carbon Dioxide is an intermediary step. Because Carbon Dioxide levels may fluctuate depending on the changing concentrations of the other constituent gases, Carbon Dioxide levels are not evaluated directly but are considered in light of other data. In evaluation of residual nitrogen, allowances must be made if there has been any air leakage into the gas collection system or if there has been serious over pull. If enough air is drawn into the landfill, not all oxygen is converted into Carbon Dioxide and the oxygen is apparent in the sample. It is ideal to perform routine analysis of individual wells, as well as an overall well field composite sample, by a gas chromatography. This is not always practical at every landfill. Under some conditions there may be a small amount of hydrogen in the LFG, (about 1 percent, usually much less). This may affect field monitoring response factors, but otherwise it can be ignored.
7.2 Subsurface Fires If very large quantities of air are introduced into the landfill, either through natural occurrence or overly aggressive operation of the LFG system, a partly unsupported subsurface combustion of the buried refuse may be initiated. Subsurface fire situations are difficult to control or extinguish once started, present health and safety hazards, and can be quite costly. Therefore, prevention by good operation of the collection system and maintenance of the landfill cover is the best course of action. The presence of Carbon Monoxide, Carbon Dioxide, and Hydrogen Sulphide are indicators of poorly supported combustion within the landfill.
GEM™2000 Operation Manual
33
7.3 Techniques for Controlling Landfill Gas There are many techniques for controlling landfill gas extraction. These techniques represent tools, which are used together to control landfill gas. The Accu-Flo wellhead is designed to work with all of these techniques. Below is a discussion of the individual techniques, how to use them, and their limitations. Reliance on only a few of the techniques discussed can lead to misinterpretation of field data and improper operation of the well field. Later the best use of these techniques to optimize landfill gas control will be discussed.
7.3.1 Controlling by Wellhead Valve Position Unless the valve handle is calibrated for a given flow rate, this method is unreliable. The position of the valve handle alone does not provide sufficient information about the well to control it. It is useful to note the relative position of the valve, and essential to know which valves are fully open or fully closed.
7.3.2 Controlling by Wellhead Vacuum This technique relies on the relationship of well pressure/vacuum to flow for a given well. Reliance upon this method, however, can be misleading. This is because the square root relationship between flow and pressure is difficult to affect while performing day-to-day well field adjustments. As decomposition, moisture, and other conditions change, this method shows itself to be inadequate and imprecise.
7.3.3 Controlling by Gas Composition This method determines methane, nitrogen (balance gas) and other gas composition parameters at wellheads and at recovery facilities using portable field instruments and, sometimes, analytical laboratory equipment. Complete knowledge of gas composition (i.e., major fixed gases: Methane, Carbon Dioxide, Oxygen and Nitrogen) is desirable. It is also necessary to check other gas parameters, such as Carbon Monoxide, to fully evaluate the condition of the well field. Reliance on this information can lead to improper operation of the well field. Indications of excessive extraction often do not show up right away. This method often leads to a cycle of damage to the methane producing bacteria population and then to over-correction. This cycling of the well and producing area of the landfill is not a good practice. It leads to further misinterpretation of the condition of the well field and has a disruptive effect on the operation of the well field. The use of analytical laboratory instrumentation such as a gas chromatograph is a valuable supplementary tool to verify gas composition. This normally requires collection of samples at the wellhead and analysis at some fixed location where the equipment is located. The drawbacks of this method as a primary means of obtaining information for well field adjustment are the time expended, cost, and probably most important, responsiveness to the needs of the well field for timely adjustment. The laboratory equipment required is also very costly. Some analysis is recommended for verification of field readings from time to time. It is recommended a monthly sample of the composite gas be taken at the inlet to the flare or gas recovery facility.
7.3.4 Controlling by Flow Rate This is a more exacting technique for determining and adjusting gas flow at individual wells. It requires using a fixed or portable flow measurement device at each wellhead to obtain the data needed to calculate volumetric (or mass) flow rates. It is normally convenient to use cubic feet per minute or per day, as a standard unit of measure for volumetric flow. It is important to distinguish between the volumetric quantity of landfill gas and the volumetric quantity of methane extracted from each well and the landfill in total. The two variables are
GEM™2000 Operation Manual
34
somewhat independent of each other and it is the total quantity of methane extracted we are interested in. It is possible for the total quantity of landfill gas extracted to increase while the total quantity of methane extracted decreases. To monitor this, the quantity of methane extracted (LFG flow x percent methane) or the quantity of BTUs recovered per hour (LFG flow x percent methane x BTUs per cubic foot of methane x 60 minutes per hour) can be calculated. It is conventional to measure BTUs per hour as a unit of time. There are approximately 1012 BTUs of heat per cubic foot of pure methane (like natural gas), although this figure varies a little among reference texts. Measuring flow is an essential part of monitoring and adjusting a well field. The well should be adjusted until the amount of methane recovered is maximized for the long term. A greater amount of methane or energy can usually be recovered over the short term; however, this ultimately leads to diminishing returns. This is seen in stages as increased CO2 and gas temperature and later as increased oxygen from well over-pull. In time, the methane will also decline. This is the result of a portion of the landfill, usually at the surface, being driven aerobic. In this portion of the landfill, the methane-producing bacteria will have been destroyed (due to the presence of oxygen). With the methane-producing capacity of the landfill reduced, the pore space in the area no longer producing may become filled with landfill gas equilibrating (moving in) from an unaffected producing area. This leaves the impression that more gas can be recovered from this area, and may lead to the operator opening the well or increasing flow.
7.4 Well field Monitoring The frequency of LFG well field monitoring varies depending upon field requirements and conditions. Normal monitoring frequency for a complete field monitoring session with full field readings (suggested normal and abbreviated field readings list follows) will vary from typically once a month to once a week. Well field monitoring should not normally be extended beyond one month. The importance of regular, timely monitoring cannot be overemphasized.
7.5 Typical Field Readings
• Name of person taking readings • Date/time of each reading • Methane (CH4) • Oxygen (O2) • Carbon Dioxide (CO2) • Balance Gas (primarily nitrogen N2) • Wellhead gas temperature (flowing) • Ambient air temperature • Static pressure (PS) (from GEM™2000 or magnehelic) or other device(anemometer/velometer) • Velocity head (P or PT) (from GEM™2000 or pitot tube and magnehelic) • Wellhead gas flow (from GEM™2000, or pitot tube & magnehelic, or anemometer/velometer) • Wellhead adjustment valve position (initial and adjusted) • New wellhead vacuum and flow information after adjustment • Calculation of each well’s LFG and methane flow and sum total • Observations/comments
Additionally, Carbon Monoxide (CO) or Hydrogen Sulphide (H2S) readings may be taken if problems are suspected. Supplementary monitoring once to several times a week may be performed using an abbreviated form of field readings.
GEM™2000 Operation Manual
35
7.6 Abbreviated Field Readings
• Name of person taking readings • Date/time of each reading • Methane (CH4) • Oxygen (O2) • Wellhead gas temperature (flowing) • Ambient air temperature • Static pressure (PS) (from GEM™2000 or magnehelic) • Velocity head (P or Pt) (from GEM™2000 or pitot tube and magnehelic) • Wellhead gas flow (from GEM™2000, or pitot tube and magnehelic, or anemometer/velometer) • Wellhead adjustment valve position (initial and adjusted) • New wellhead vacuum and flow information after adjustment • Observations/comments
Line vacuums and gas quality may be taken at key points along the main gas collection header and at subordinate branches. This helps to identify locations of poor performance, excessive pressure drop, or leakage. Perform systematic monitoring of the well field, taking and logging measurements at each wellhead and major branch junction in the collection system. During monitoring, examine landfill and gas collection system for maintenance issues. Record needed maintenance or unusual conditions. Examples of unusual occurrences or conditions are unusual settlement, signs of subsurface fires, cracks and fissures, liquid ponding, condensate/leachate weeping from side slopes, surface emissions and hot spots, and liquid surging and blockage in the gas collection system. Field readings should be kept in a chronological log and submitted to management on a timely basis.
7.7 Well field Adjustment Criteria There are several criteria used in well field adjustment. The primary criterion is methane quality. Methane quality is an indicator of the healthy anaerobic state of the landfill and thus proper operation of the LFG collection system. However, a decline in the healthy productive state of the landfill is usually not immediately apparent from methane quality. Due to this, several criteria must be considered at once. Conditions within the landfill favor methane production. Following are well field adjustment criteria and typical conditions for consideration:
• Methane quality (ranging from 26 percent upwards) • pH • Temperature • General overall quality • Moisture conditions • Waste stream characteristics • Placement chronology • Insulation characteristics • Oxygen quality (ranging below 1 percent, preferably less then ½ percent) • Landfill cover porosity and depth in the proximity of the well • Landfill construction factors including: • Type of fill • Size and shape of refuse mass • Depth of fill
GEM™2000 Operation Manual
36
• Compaction • Leachate control methods • Seasonal, climatic, geographical, and recent weather, or other considerations, including
seasonally arid or wet conditions, precipitation, drainage, groundwater • Surrounding topography and geologic conditions • Proximity of the well to side slopes (within 150 to 200 feet and less may require conservative
operation of the well) • Nitrogen (typically 8 to 12 percent and less) • Temperature (between ambient and about 130 °F) • LFG and methane flow from the wellhead • Design of the gas collection system • Landfill perimeter gas migration and surface emission control, or energy recovery objectives • Diurnal fluctuation (day to night) of atmospheric pressure
7.8 Establishing Target Flows For a given individual well, a target flow is established which will likely support maintenance of methane and oxygen quality objectives while maximizing the recovery of landfill gas. Typically, small adjustments are made in flow to achieve and maintain quality objectives. The well must not be allowed to over pull. High well temperatures, (130° to 140°F and greater), are an indication of aerobic activity and, thus, well over-pull. These effects may not be immediately apparent. Well adjustment should be made in as small an increment as possible, preferably an increment of ten percent of the existing flow or less. There may be obvious conditions when this is not appropriate, such as when first opening up a well or when serious over-pull is recognized. Every effort should be made to make adjustments and operations as smooth as possible. Dramatic adjustments, or operating while switching between a high flow mode and a well shutoff mode, should be avoided.
7.9 Well field Optimization Every effort should be made to continuously locate and correct or eliminate conditions (e.g., gas condensate, surging and blockage, settlement, etc.), which inhibit efficient operation of the gas collection system. This allows well monitoring and adjustment to be significantly more effective.
7.10 Migration Control—Dealing with Poor Methane Quality If methane and oxygen quality objectives cannot be maintained at a given well, such as a perimeter migration control well, then an attempt should be made to stabilize the well as closely as is practical, avoiding significant or rapid down trending of methane or up trending of oxygen. It is not uncommon for perimeter migration control wells to be operated at less than 40 percent methane or greater than one-percent oxygen. It should be recognized that these wells are likely in a zone where some aerobic action is being induced, and that there is some risk of introducing or enhancing the spread of a subsurface fire. Sometimes a judicious compromise is necessary to achieve critical migration control objectives or because existing conditions do not allow otherwise. Such situations should be monitored closely.
GEM™2000 Operation Manual
37
7.11 Well field Adjustment—Purpose and Objectives The objective of well field adjustment is to achieve a steady state of operation of the gas collection system by stabilizing the rate and quality of extracted LFG in order to achieve one or several goals. Typical reasons for recovery of LFG and close control of the well field are:
• Achieve and maintain effective subsurface gas migration control. • Achieve and maintain effective surface gas emissions control. • Assist with proper operation of control and recovery equipment. • Avoid well “over-pull” and maintain of a healthy anaerobic state within the landfill. • Optimize LFG recovery for energy recovery purposes. • Control nuisance landfill gas odors. • Prevent or control subsurface LFG fires. • Protect structures on and near the landfill. • Meet environmental and regulatory compliance requirements.
Well field adjustment is partly subjective and can be confusing because it involves judgment calls based on simultaneous evaluation of several variables, as well a general knowledge of site specific field conditions and historical trends. Well field evaluation and adjustment consist of a collection of techniques, which may be used, in combination, to achieve a steady state of well field operation.
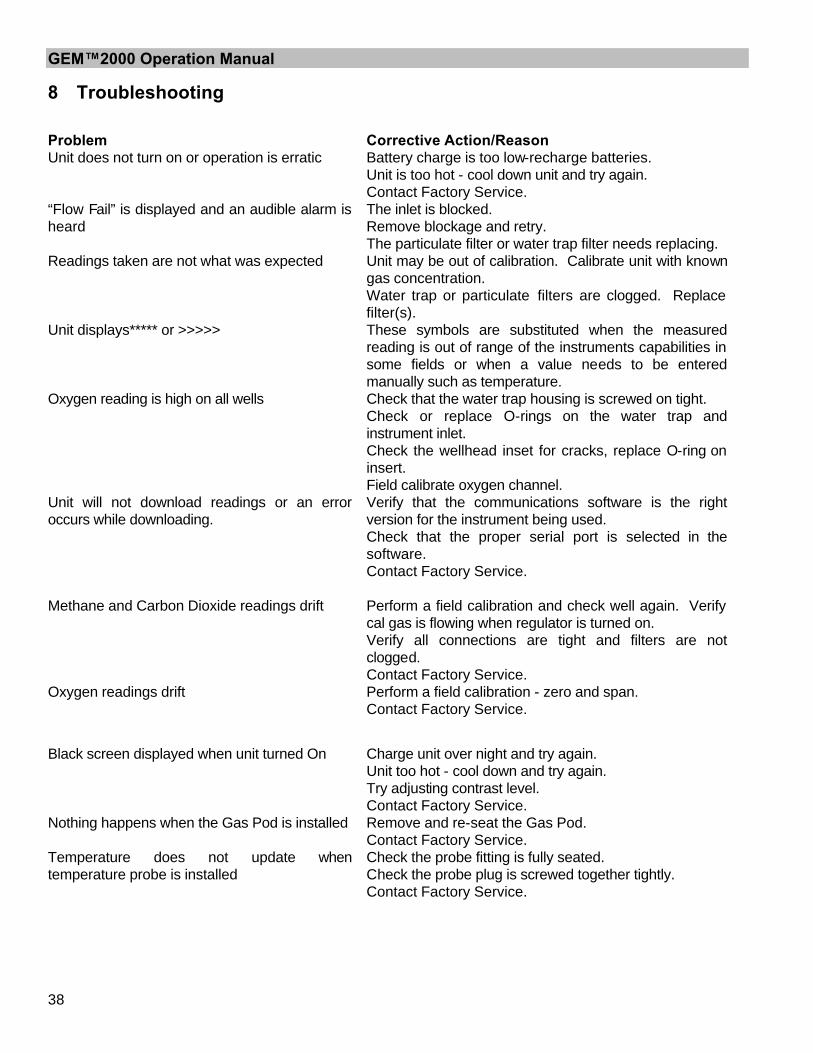
GEM™2000 Operation Manual
38
8 Troubleshooting
Unit does not turn on or operation is erratic Battery charge is too low-recharge batteries. Unit is too hot - cool down unit and try again. Contact Factory Service.
“Flow Fail” is displayed and an audible alarm is heard
The inlet is blocked. Remove blockage and retry. The particulate filter or water trap filter needs replacing.
Readings taken are not what was expected Unit may be out of calibration. Calibrate unit with known gas concentration. Water trap or particulate filters are clogged. Replace filter(s).
Unit displays***** or >>>>> These symbols are substituted when the measured reading is out of range of the instruments capabilities in some fields or when a value needs to be entered manually such as temperature.
Oxygen reading is high on all wells Check that the water trap housing is screwed on tight. Check or replace O-rings on the water trap and instrument inlet. Check the wellhead inset for cracks, replace O-ring on insert. Field calibrate oxygen channel.
Unit will not download readings or an error occurs while downloading.
Verify that the communications software is the right version for the instrument being used. Check that the proper serial port is selected in the software. Contact Factory Service.
Methane and Carbon Dioxide readings drift Perform a field calibration and check well again. Verify cal gas is flowing when regulator is turned on. Verify all connections are tight and filters are not clogged. Contact Factory Service.
Oxygen readings drift Perform a field calibration - zero and span. Contact Factory Service.
Black screen displayed when unit turned On Charge unit over night and try again. Unit too hot - cool down and try again. Try adjusting contrast level. Contact Factory Service.
Nothing happens when the Gas Pod is installed Remove and re-seat the Gas Pod. Contact Factory Service.
Temperature does not update when temperature probe is installed
Check the probe fitting is fully seated. Check the probe plug is screwed together tightly. Contact Factory Service.
Problem Corrective Action/Reason
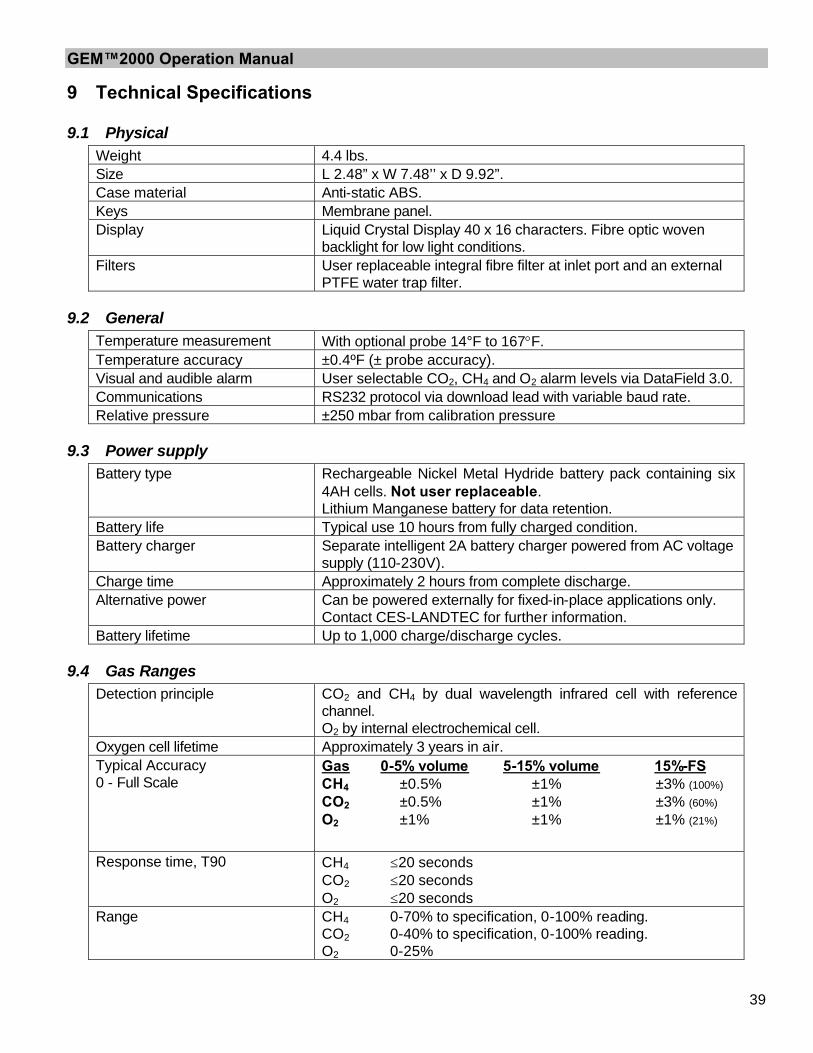
GEM™2000 Operation Manual
39
9 Technical Specifications
9.1 Physical Weight 4.4 lbs. Size L 2.48” x W 7.48’’ x D 9.92”. Case material Anti-static ABS. Keys Membrane panel. Display Liquid Crystal Display 40 x 16 characters. Fibre optic woven
backlight for low light conditions. Filters User replaceable integral fibre filter at inlet port and an external
PTFE water trap filter.
9.2 General Temperature measurement With optional probe 14°F to 167°F. Temperature accuracy ±0.4ºF (± probe accuracy). Visual and audible alarm User selectable CO2, CH4 and O2 alarm levels via DataField 3.0. Communications RS232 protocol via download lead with variable baud rate. Relative pressure ±250 mbar from calibration pressure
9.3 Power supply Battery type Rechargeable Nickel Metal Hydride battery pack containing six
4AH cells. Not user replaceable. Lithium Manganese battery for data retention.
Battery life Typical use 10 hours from fully charged condition. Battery charger Separate intelligent 2A battery charger powered from AC voltage
supply (110-230V). Charge time Approximately 2 hours from complete discharge. Alternative power Can be powered externally for fixed-in-place applications only.
Contact CES-LANDTEC for further information. Battery lifetime Up to 1,000 charge/discharge cycles.
9.4 Gas Ranges Detection principle CO2 and CH4 by dual wavelength infrared cell with reference
channel. O2 by internal electrochemical cell.
Oxygen cell lifetime Approximately 3 years in air. Typical Accuracy 0 - Full Scale
Gas 0-5% volume 5-15% volume 15%-FS CH4 ±0.5% ±1% ±3% (100%) CO2 ±0.5% ±1% ±3% (60%) O2 ±1% ±1% ±1% (21%)
Response time, T90 CH4 ≤20 seconds CO2 ≤20 seconds O2 ≤20 seconds
Range CH4 0-70% to specification, 0-100% reading. CO2 0-40% to specification, 0-100% reading. O2 0-25%
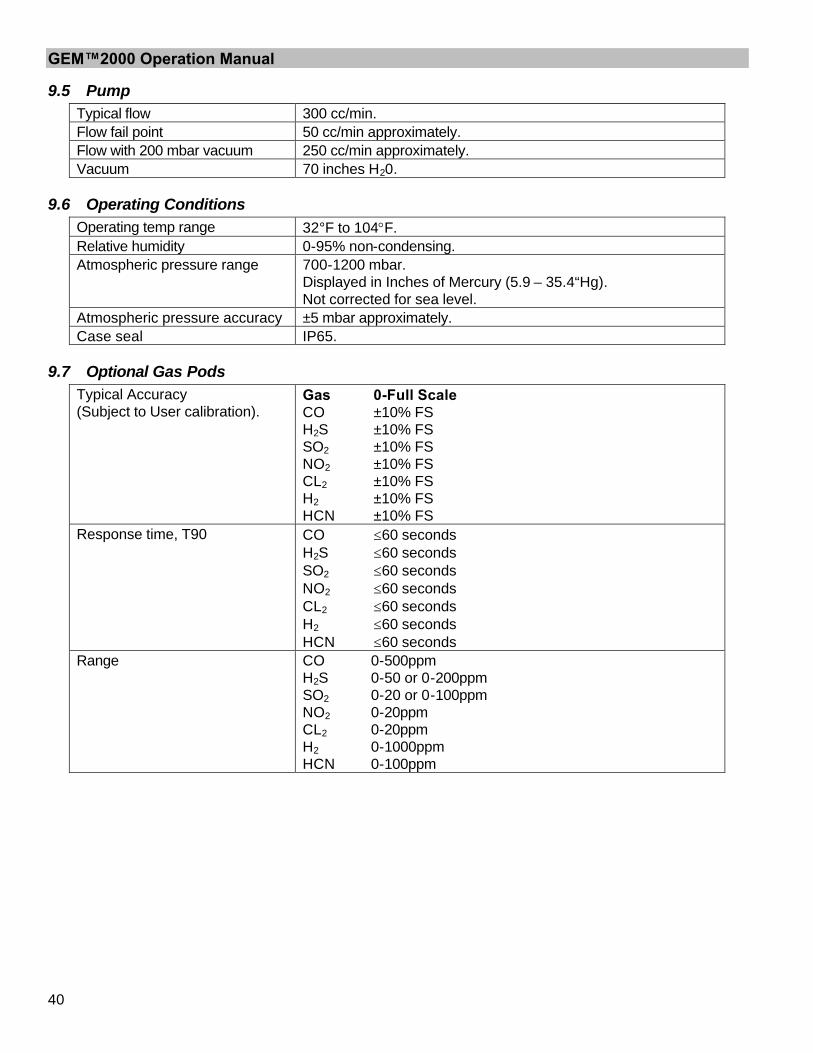
GEM™2000 Operation Manual
40
9.5 Pump Typical flow 300 cc/min. Flow fail point 50 cc/min approximately. Flow with 200 mbar vacuum 250 cc/min approximately. Vacuum 70 inches H20.
9.6 Operating Conditions Operating temp range 32°F to 104°F. Relative humidity 0-95% non-condensing. Atmospheric pressure range 700-1200 mbar.
Displayed in Inches of Mercury (5.9 – 35.4“Hg). Not corrected for sea level.
Atmospheric pressure accuracy ±5 mbar approximately. Case seal IP65.
9.7 Optional Gas Pods Typical Accuracy (Subject to User calibration).
Gas 0-Full Scale CO ±10% FS H2S ±10% FS SO2 ±10% FS NO2 ±10% FS CL2 ±10% FS H2 ±10% FS HCN ±10% FS
Response time, T90 CO ≤60 seconds H2S ≤60 seconds SO2 ≤60 seconds NO2 ≤60 seconds CL2 ≤60 seconds H2 ≤60 seconds HCN ≤60 seconds
Range CO 0-500ppm H2S 0-50 or 0-200ppm SO2 0-20 or 0-100ppm NO2 0-20ppm CL2 0-20ppm H2 0-1000ppm HCN 0-100ppm

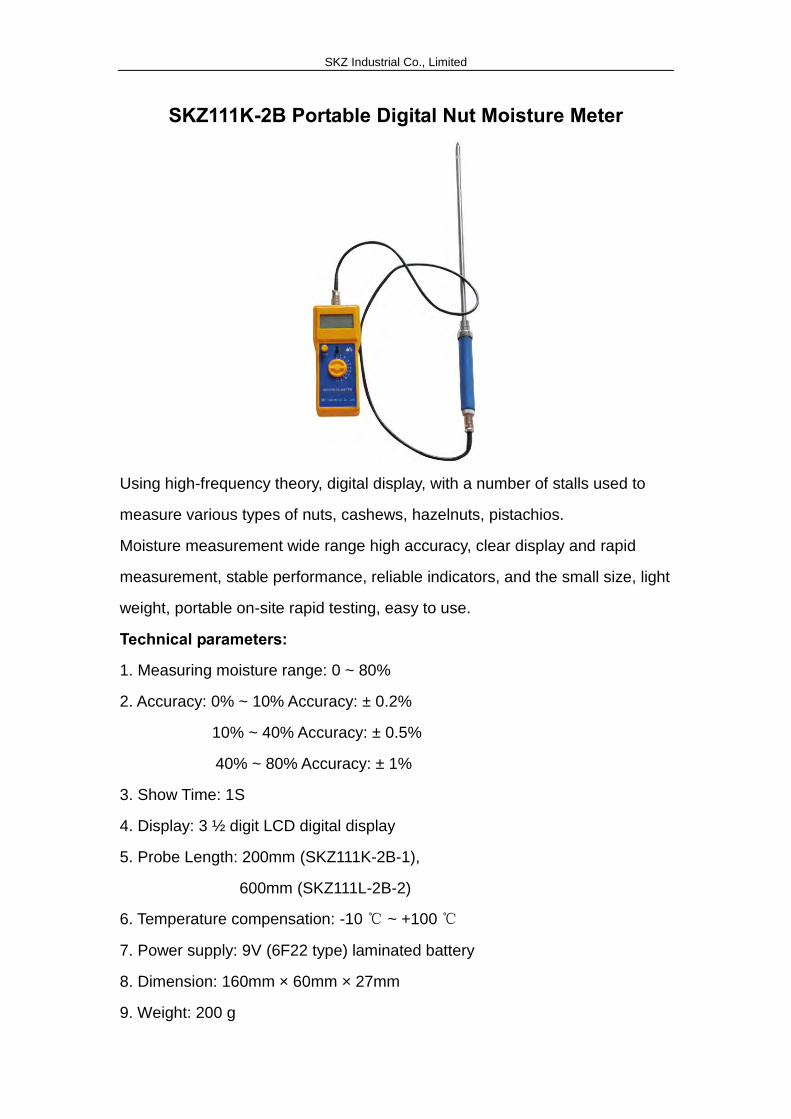
SKZ Industrial Co., Limited
SKZ111K-2B Portable Digital Nut Moisture Meter
Using high-frequency theory, digital display, with a number of stalls used to
measure various types of nuts, cashews, hazelnuts, pistachios.
Moisture measurement wide range high accuracy, clear display and rapid
measurement, stable performance, reliable indicators, and the small size, light
weight, portable on-site rapid testing, easy to use.
Technical parameters:
1. Measuring moisture range: 0 ~ 80%
2. Accuracy: 0% ~ 10% Accuracy: ± 0.2%
10% ~ 40% Accuracy: ± 0.5%
40% ~ 80% Accuracy: ± 1%
3. Show Time: 1S
4. Display: 3 ½ digit LCD digital display
5. Probe Length: 200mm (SKZ111K-2B-1),
600mm (SKZ111L-2B-2)
6. Temperature compensation: -10 ℃ ~ +100 ℃
7. Power supply: 9V (6F22 type) laminated battery
8. Dimension: 160mm × 60mm × 27mm
9. Weight: 200 g

2/26/2016 Soil Moisture Meter | General Tools & Instruments
http://www.generaltools.com/soilmoisturemeter.html 1/3
HOME / SOIL MOISTURE METER
SOIL MOISTURE METERIdeal for commercial, agricultural andprofessional use
BEST FOR:
SHARE:
SOIL MOISTURE METERITEM # DSMM500
Features
Specifications
Resources
FeaturesDETAILS
Heavy-duty probeMin/Max memory + data hold
BUY NOW
HANDTOOLS
INSTRUMENTS BYINDUSTRY
SUPPORT INGENUITYAT WORK
SEARCH
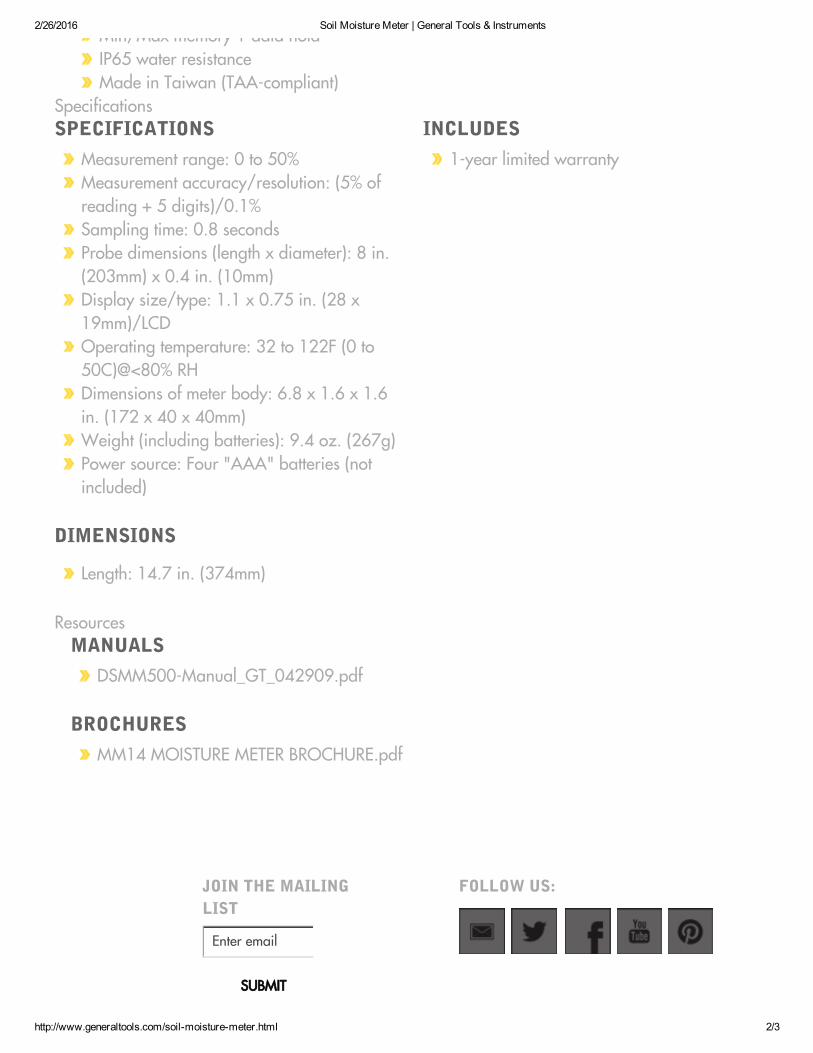
2/26/2016 Soil Moisture Meter | General Tools & Instruments
http://www.generaltools.com/soilmoisturemeter.html 2/3
Min/Max memory + data holdIP65 water resistanceMade in Taiwan (TAA-compliant)
SpecificationsSPECIFICATIONS
Measurement range: 0 to 50%Measurement accuracy/resolution: (5% ofreading + 5 digits)/0.1%Sampling time: 0.8 secondsProbe dimensions (length x diameter): 8 in.(203mm) x 0.4 in. (10mm)Display size/type: 1.1 x 0.75 in. (28 x19mm)/LCDOperating temperature: 32 to 122F (0 to50C)@<80% RHDimensions of meter body: 6.8 x 1.6 x 1.6in. (172 x 40 x 40mm)Weight (including batteries): 9.4 oz. (267g)Power source: Four "AAA" batteries (notincluded)
INCLUDES
1-year limited warranty
DIMENSIONS
Length: 14.7 in. (374mm)
ResourcesMANUALS
DSMM500-Manual_GT_042909.pdf
BROCHURES
MM14 MOISTURE METER BROCHURE.pdf
Enter email
SUBMIT
JOIN THE MAILINGLIST
FOLLOW US:

2/26/2016 Soil Moisture Meter | General Tools & Instruments
http://www.generaltools.com/soilmoisturemeter.html 3/3
NEW TOOLS
INSPECTION &CALIBRATIONTOOLS
PRECISION,MEASURING &MARKING
PRECISION &MEASURINGSCREWDRIVERS
SPECIAL PURPOSETOOLS
WOODWORKINGTOOLS
NEWINSTRUMENTS
VIDEOINSPECTIONCAMERAS
ELECTRICAL TESTINSTRUMENTS
ENVIRONMENTALAND AIRFLOW
THERMOMETERS
MOISTURE-HUMIDITYINSTRUMENTS
INSPECTION ANDCALIBRATIONINSTRUMENTS
MANUALS
POLICIES, TERMS &CONDITIONS
REGISTERPRODUCT
WARRANTY
KNOWLEDGEBASE
WHERE TO BUY
CONTACT US
ABOUT US
NEWS & PRESSRELEASES
BLOG
HAND TOOLS INSTRUMENTS SUPPORT COMPANY
Select Language▼
POLICIES, TERMS & CONDITIONS
© 2015 General Tools & Instruments LLC. All Rights Reserved.
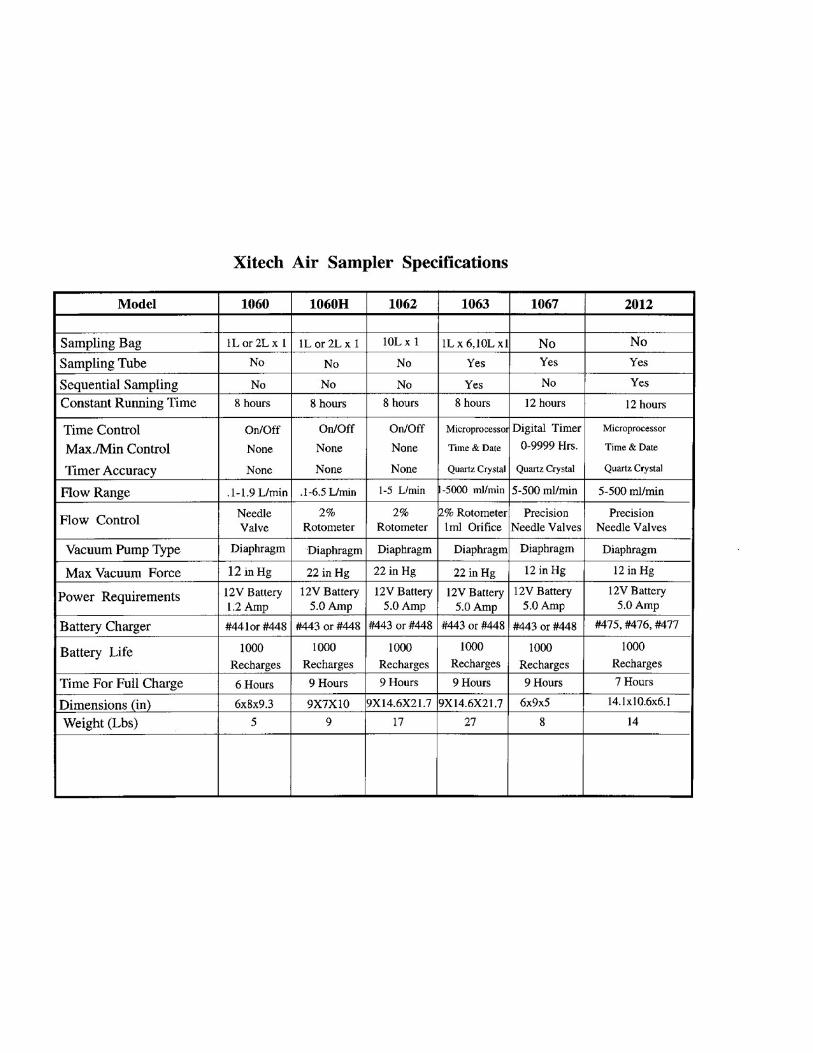
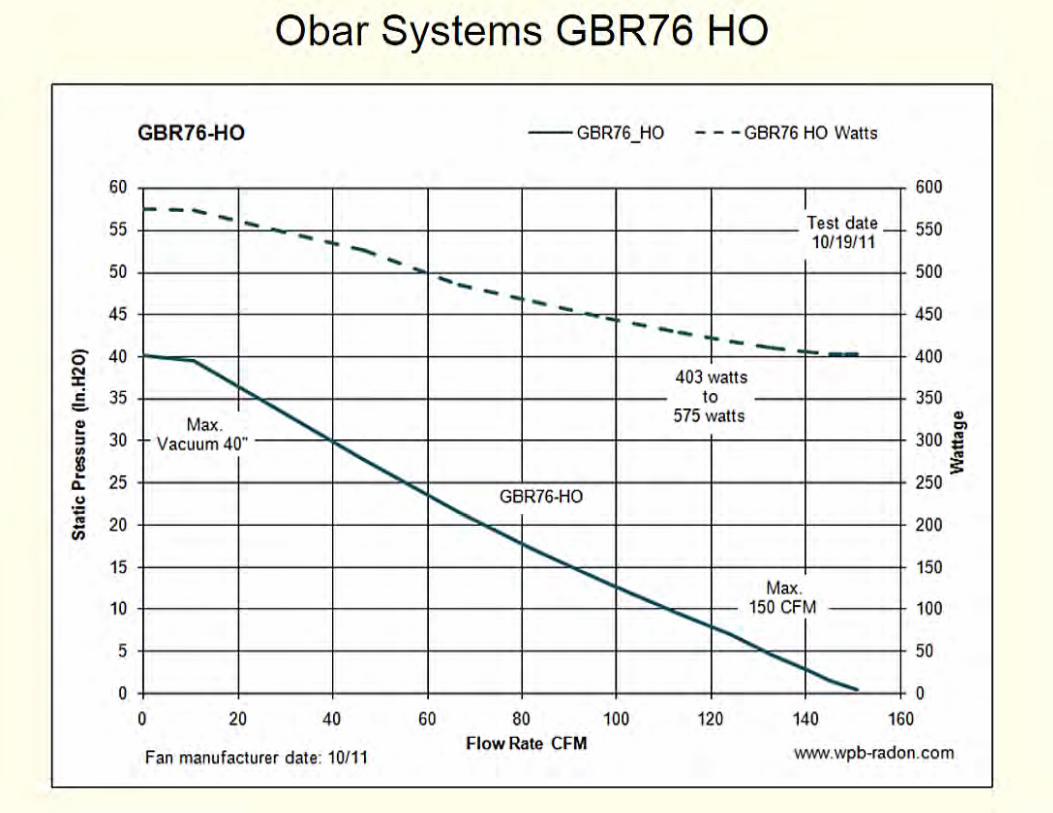

TR0641 March 2016
APPENDIX C
Curriculum Vitae
Todd A. McAlary subsurface vapor transport and inhalation exposure Practice Leader – Vapor Intrusion groundwater investigation and remediation Senior Principal chemical fate and transport modeling innovative technology development
1.0 QUALIFICATIONS
1.1 Education
University of Waterloo: Ph.D., Chemistry, 2014. Thesis: Demonstration/Validation of Passive Samplers for Vapor Intrusion Nominated for W.B. Pearson Medal for creative research
University of Waterloo: Certificate in University Teaching, 2012. Thesis: Applications of Digital Technology in Learning – Experience to Date and a Vision
for the Future University of Waterloo: M.Sc., Earth Sciences - Hydrogeology/Geochemistry, 1989.
Thesis: Comparison of Measured and Calculated Vapor Diffusion Coefficients in Unsaturated Sands
OGS Scholar University of Waterloo: B.A.Sc., Geological Engineering, 1986,
Thesis: The Behavior of Volatile Organic Compounds in Groundwater Monitoring Piezometers
Dean’s List 1.2 Professional Licenses
Professional Engineer – Ontario, License # 90250754 (since 1990) Professional Engineer – British Columbia, License # 40414 (since 2014) Professional Geologist – North Carolina, License # 1539 (since 1996) 1.3 Professional Development
• SERP-ESTCP Tools and Training Webinar Series January 14, 2016 • SMART Remediation Conference, Vancouver, BC, February11, 2016 • Tri-Services Risk Assessment Workgroup Meeting, San Antonio, TC, January 12, 2016 • Pipeline Research Council International Research Exchange, San Ramon, CA, October 19-20, 2015 • Midwestern States Environmental Consultants Association, Indianapolis, August 18, 2015 • National Environmental Monitoring Conference, Chicago, July 13-16, 2015 • AEHS West Coast Conference, San Diego, March 22-25, 2015 • Wisconsin Groundwater Association Annual Conference, Madison, March 13, 2015 • U.S. DOD Joint Alternative Restoration Technology Team and Optimization Workgroups Meeting,
Jacksonville, FL, April 23, 2015.
Curriculum Vitæ of Todd Arthur McAlary, Ph.D., P.Eng., P.G., CUT
2
• Ontario Centres of Excellence Partnering Event, Waterloo, June 18, 2014 • API Pipeline Conference, San Antonio, April 10, 2014 • AEHS West Coast Conference, San Diego, March 17-20, 2014 • PRCI Research Exchange Meeting, Atlanta, Feb 5-8, 2014 • SERDP/ESTCP Vapor Intrusion Seminar and Workshop, Tempe, December 19 and 20, 2013 • SERDP and ESTCP Vapor Intrusion Seminar and Workshop, Tempe, AZ, December 19, 2013. • University Consortium for Field-Focused Groundwater Contamination, May 30 & 31, 2013, Guelph,
Ontario. • USWAG Remediation and Response Committee Meeting, Washington, April 23 and 24, 2013 • AEHS West Coast Conference, San Diego, March 17-20, 2013 • PRCI Research Exchange Meeting, Dallas, Feb 4-6, 2013 • National Environmental Monitoring Conference, Washington, Aug 6 to 8 2012 • SIDISA Conference, Milan, Italy, June 2012 • University Consortium for Field-Focused Groundwater Contamination, Guelph, June, 2012 • Ontario Centres of Excellence - Discovery 2012, Toronto, ON, May 2012 • Air and Waste Management Association’s Air Quality Measurement Methods and Technology
conference April 24 – 26, 2012 in Durham, North Carolina. • Environmental Monitoring and Data Quality Workshop, La Jolla, CA, March 2012 • AEHS West Coast Conference, San Diego, March, 2012 • US DOD Environmental Safety and Health Conference, Denver, February, 2012 • SERDP/ESTCP Partner’s Conference, Washington, November 2011 • Florida Brownfields Conference, Orlando, November 14 & 15, 2011 • International Sites and Spills Conference, Toronto, November 4 and 5 • EPA Workshop on Vapor Intrusion at the AEHS Soils and Sediment Conference, San Diego, CA,
March 2011. • University Consortium for Field-Focused Groundwater Contamination, Guelph, June, 2011 • ESTCP/SERDP Partners Conference, Washington, D.C., December, 2008, 2009, 2010, 2011 • AWMA Specialty Conference: Vapor Intrusion, 2010. Chicago, IL, September, 2010 • ESTCP/SERDP Technical Exchange Meeting on Vapor Intrusion Salt Lake City, UT August, 2010 • Battelle International Conference on Remediation of Chlorinated and Recalcitrant Compounds,
Monterey, CA, May 2010 • University Consortium for Field-Focused Groundwater Contamination, Guelph, Ontario, May, 2010 • Air Force Restoration and Technology Transfer Workshop, San Antonio, April 9, 2010 • AEHS Conference on Contaminated Soils and Sediments, San Diego, March 16, 2010 • North American Environmental Field Conference & Exposition, Tampa, FL, January 2010 • Federal Remediation Technologies Roundtable, November 10, 2009 • RTM Conference on Sustainable Property Transactions: Reconfiguring the Business of
Contaminated Site Redevelopments, San Francisco, October 30, 2009 • DOD Environment, Energy and Sustainability Symposium, Denver, May 2009 • DoD Environmental Monitoring and Data Quality Workshop, San Antonio, TX, April 2009 • NDIA Environment Energy & Sustainability Symposium and Exhibition, Denver, May 4 – 7, 2009 • AWMA Specialty Conference: Vapor Intrusion, 2009. San Diego, CA, January, 2009 • AWMA Specialty Conference on Vapor Intrusion, Toronto, September, 2008 • WIDNR/FET Course Vapor Intrusion Sampling for Environmental Professionals, Milwaukee, WI,
Curriculum Vitæ of Todd Arthur McAlary, Ph.D., P.Eng., P.G., CUT
3
September, 2008 • University Consortium for Field-Focused Groundwater Contamination, Hockley Valley, May, 2008 • RTM Symposium on Contaminated Property Transactions, April 4, 2008, Philadelphia. • AFCEE Conference – Focus on the Goal RIP by 2012, San Antonio, March 2008 • AEHS Conference on Contaminated Soils and Sediments, San Diego, March, 2008 • Battelle International Conference on Remediation of Chlorinated and Recalcitrant Compounds,
Monterey, CA, May 2008 • AWMA Specialty Conference on Vapor Intrusion: Learning from the Challenges, Providence, RI,
September 2007 • Ground Water 2007: A Technical and Regulatory Update Focusing on Site Remediation Issues by
the Site Remediation Committee of the New Jersey Water Environment Association and the New Jersey Department of Environmental Protection, June 5, 2007
• RTM Symposium on Contaminated Property Transactions – Mitigating the Risks of Redevelopment, April 13, 2007, Washington, D.C.
• University Consortium for Field-Focused Groundwater Research, Denver, November 2006. • RTM Conferences on Contaminated Property Transactions: Philadelphia, April, 2008, Washington,
D.C., April, 2007 and San Francisco, CA, October 2006 • AWMA Specialty Conference on Vapor Intrusion: The Next Great Environmental Challenge – An
Update, Los Angeles, September 2006 • Midwestern States Risk Assessment Symposium, Indianapolis, IN, August, 2006 and July, 2002 • Rutgers University Vapor Intrusion Seminar, New Brunswick, NJ, June 14, 2006 • University Consortium for Field-Focused Groundwater Contamination, Denver, November, 2006 • Electric Power Research Institute Annual Meeting, Bar Harbor, Maine, June 22, 2006. • AWMA Specialty Conference on Vapor Intrusion: The Next Great Environmental Challenge,
Philadelphia, PA, January 2006 • Battelle International Conference on Remediation of Chlorinated and Recalcitrant Compounds,
Monterey, CA, May, 2006 • ITRC Vapor Intrusion Workgroup, 2004, 2005, 2006, 2007 • Proceedings of the American Bar Association Joint Fall CL Meeting, San Francisco, CA, September,
2005. • California Groundwater Resources Association Seminar: “Subsurface Vapor Intrusion to Indoor Air:
An Update”, San Jose, CA, May 25, 2005 • AEHS West Coast Conference on Soils, Sediments and Water, San Diego, March 2005 • AEHS Conference on Soils, Sediments and Water, Amherst, MA, October 2004 • Air and Waste Management Annual Conference, Indianapolis, IN, June 2004 • Battelle International Conference on Remediation of Chlorinated and Recalcitrant Compounds,
Monterey, CA, May 2004 • Annual meeting of Remediation Project Managers of a major multi-national corporation, March
2004. • AEHS West Coast Conference on Soils, Sediments and Water, San Diego, March 2004 • The Vapor Intrusion Workshop, Annual General Meeting of EPRI, December 2003. • The New Jersey Site Remediation Information Network, September 2003. • California Groundwater Resources Association Seminar: “Subsurface Vapor Intrusion to Indoor Air:
When is Soil and Groundwater Contamination and Indoor Air Issue?”, San Jose and Long Beach, CA, September and October 2003
Curriculum Vitæ of Todd Arthur McAlary, Ph.D., P.Eng., P.G., CUT
4
• The Environmental Symposium on Indoor Air Pathway Evaluation for VOC Releases held by the Environmental Law Institute, San Francisco, June, 2003.
• The annual meeting of a large, multi-national manufacturing corporation, June, 2003. • PA Seminar on Indoor Air Vapor Intrusion, December 2002 in San Francisco, January 2003, Dallas,
TX, and February 2003, Atlanta, GA. • EPA Seminar on Indoor Air Vapor Intrusion, February 2003, Atlanta, GA. • Indoor Air 2002, 9th International Conference on Indoor Air Quality and Climate, Monterey, July
2002 • Battelle International Conference on Remediation of Chlorinated and Recalcitrant Compounds,
Monterey, CA, May, 2002 • Midwestern States Risk Assessment Symposium, Indianapolis, June 2002 • RCRA National Meetings, Washington, D.C., 2002 • Addressing Indoor Air Contamination: Measurement & Models, MADEP Training Seminar,
Marlboro, October 2001. • Fractured Rock 2001, International Conference in Toronto, March 2001. • RCRA National Meetings, Washington, D.C., August 2000, January, 2002 • The corporate meeting of Remediation Project Managers of a Major Multi-National Corporation, 27
April, 2000. • Battelle International Conference on Remediation of Chlorinated and Recalcitrant Compounds,
Monterey, CA, May 2000 • Battelle International Conference on Remediation of Chlorinated and Recalcitrant Compounds,
Monterey, CA, May 1998 • The Princeton Unsaturated Flow Short Course, Princeton University, 1990 • Department of Labor Occupational Safety and Health Administration. 40-Hour training in
compliance with SARA Title III and 29 CFR 1910.120,1989. Annual 8-hour refreshers
Curriculum Vitæ of Todd Arthur McAlary, Ph.D., P.Eng., P.G., CUT
5
2.0 CONSULTING EXPERIENCE
2.1 Overview
Dr. McAlary is an expert in the evaluation of contaminant fate and transport in groundwater and the vadose zone. He has 30 years of consulting experience on environmental investigation and remediation projects. He is especially experienced with the migration of volatile organic compound (VOC) vapors originating beneath and around buildings and the assessment of inhalation exposures from subsurface vapor intrusion to indoor air. He conducted his first assessment of vapor intrusion beginning in 1992, and has been the Technical Director of one of the world’s largest studies of vapor intrusion since 1997. He was invited by the USEPA in 2000 to participate in the development of the RCRA Supplemental EI Guidance on vapor intrusion, and was one of the 3 primary co-authors (2001). He was the only non-regulator on the Steering Committee for the U.S EPA Seminar on Indoor Air Vapor Intrusion following release of the OSWER 2002 draft Guidance and was a Panel Member for several subsequent EPA Workshops at the AEHS conferences aimed at addressing comments on the 2002 Draft OSWER Vapor Intrusion Guidance. He was the primary author for the Electric Power Research Institute’s (EPRI’s) Vapor Intrusion Reference Handbook, and a contributing author or editor to vapor intrusion or soil gas sampling guidance documents prepared by the Interstate Technical and Regulatory Consortium (ITRC), New Jersey DEP, California DTSC, The US Navy, Atlantic Provinces Partnership for RBCA Implementation (PIRI), Health Canada, Ontario MOE, the UK CIRIA Group and the UK Energy Institute. Dr. McAlary has been the Practice Leader for vapor intrusion services at Geosyntec for the past 17 years, and coordinates inter-office applied research, staffing, training and marketing activities. He is also an Adjunct Professor at the University of Toronto and teaches up to three undergraduate Chemical Engineering courses per year.
2.2 Employment History
• Geosyntec Consultants, Inc., Principal and Practice Leader - 1998 to present • Beak International, Inc., Principal and Director – 1988 to 1998 • Golder Associates, Co-op Student – 1985 (8 months) • Gartner Lee Associates, Co-op Student – 1983 (4 months) • Morrison Beatty Ltd., Co-op Student – 1982 (8 months) and 1983 (4 months) • B.P. Walker Ltd., Co-op Student – 1981 (4 months)
2.3 Assessment of Subsurface Vapor Intrusion to Indoor Air
Vapor Intrusion Assessment and Risk Assessment, Edwards Air Force Base, California. Dr. McAlary was the Technical Director and Project Manager of a base-wide assessment of vapor intrusion at Edwards AFB from 2013 to 2015 for the U.S. Air Force. The regulatory agencies
Curriculum Vitæ of Todd Arthur McAlary, Ph.D., P.Eng., P.G., CUT
6
included the U.S. EPA Region IX, the California EPA Department of Toxic Substances Control and the California Regional Water Quality Control Board, and their initial expectations were sub-slab and indoor air samples from multiple locations in two seasonal events for all 1200 buildings at the base. Dr. McAlary was able to negotiate a phased approach focusing initially on a dozen buildings with the highest likelihood of vapor intrusion risks based on proximity to elevated concentrations of VOCs in the subsurface. The study included a screening component conducted with portable instruments to identify the location in any given building with the greatest potential for vapor intrusion based on sub-slab VOC concentrations, passive indoor air and sub-slab sampling for long-term time-weighted average concentrations, 24-hour Summa canisters in select locations for Level 4 data quality needed for risk assessment and cross-slab pressure differential to characterize whether the indoor air samples were representative. The results showed that only one of the buildings had a potentially unacceptable risk, although the frequency of occupancy was low enough that an administrative control was sufficient to achieve a condition of no significant risk. Based on this outcome, the other buildings at the base would not be expected to have vapor intrusion risks, resulting in considerable savings for the Air Force.
Vapor Intrusion Assessment, former DOE Facility, Pinellas, Florida. Dr. McAlary was the Principal Investigator for a vapor intrusion assessment at Building 100 of the Young-Rainey Star Center, a former Department of Energy facility that has since been re-purposed for multi-use commercial activities. Current occupants manufacture electronics, so indoor air sampling was expected to result in complex background source contributions.
Vapor Intrusion Assessment and Management, Confidential Client, England. Dr. McAlary was the Technical Director since 1997 of one of the largest investigations of subsurface vapor intrusion to indoor air in the world to date adjacent to two former sandstone quarries subsequently used for waste disposal by a chlorinated solvent production facility. The study consisted of several events of indoor air sampling and analysis at 145 properties, soil gas sampling and analysis from over a dozen events at 48 vapor monitoring wells, and was supplemented by over 300 samples of outdoor air quality, subsurface pneumatic testing, borehole and surface geophysics, building pressure and ventilation testing, applied research into phase partitioning in the unsaturated zone, statistical analysis, mathematical modeling, remedial alternatives development and cost-benefit analysis, public meetings, litigation support, and regulatory meetings. The results showed the only buildings with vapor intrusion risks were located on quarry spoil materials that were highly permeable and devoid of the mudstone layers native to the sandstone bedrock through the rest of the study area. Infiltrating precipitation maintains a high water content in the mudstone layers, which restrict the vertical migration of vapors to a degree that naturally maintains a condition of no significant risk.
Vapor Intrusion Assessment and Regulatory Negotiation, Confidential Client, MA. Dr. McAlary was the Project Manager/Technical Director/Peer Reviewer of a detailed investigation of indoor air quality in a residential area adjacent to a former industrial manufacturing facility in Massachusetts since 1992, including indoor air sampling and analysis at about 30 properties,
Curriculum Vitæ of Todd Arthur McAlary, Ph.D., P.Eng., P.G., CUT
7
followed by more than two decades of annual indoor air monitoring at several properties, semi-annual soil gas monitoring at 15 permanent soil gas probes, and soil vacuum extraction as a proactive preventative measure. Dr. McAlary was the first to employ depth-discrete groundwater sampling to demonstrate the presence of a “fresh-water lens” which acts as a barrier to off gassing of vapors from the water table, maintaining a condition of no significant risk.
Vapor Intrusion Assessment, Regulatory Negotiation and Litigation Support, Chevron, OH. Dr. McAlary was the Technical Expert for a Site-Specific Assessment of subsurface vapor fate and transport in support of a Human Health Risk Assessment in a residential community adjacent to a former refinery in Ohio, responsible for developing protocols and work plans, training field sampling personnel for the collection of ~300 soil gas samples over a period of a few months with multi-depth nested probes, near-slab and sub-slab sampling, regulatory negotiation and support for public meetings. The results showed that the hydrocarbon vapors degraded by aerobic metabolism mediated by naturally occurring microbes. Several rounds of soil vapor sampling from nested probes at five-foot intervals from ground surface to 60 foot depth combined with mathematical modeling using first order degradation kinetics provided substantial support for the conclusion of no significant risk in any of the residences.
Vapor Intrusion Assessment and Regulatory Negotiation, Anadarko Petroleum Corporation, Enid, OK. Dr. McAlary was the Project Manager and Technical Director for a Site-Specific Assessment of subsurface vapor fate and transport in residential and institutional areas adjacent to a former refinery in Oklahoma, responsible for regulatory negotiation, workplan development, protocol development, implementation of a sampling program consisting of vertical profiles of soil vapor at 6, 9 and 12 feet below ground in 43 locations during wet and dry seasons, implementing a data quality program designed to provide unassailable quality, and development of two comprehensive reports of the monitoring program results. The results showed no significant risk and the regulatory agency accepted the results unconditionally.
Vapor Intrusion Assessment and Mitigation, Confidential Client, Bridgewater, NJ. Dr. McAlary was the Project Director for an assessment of subsurface vapor intrusion in a residential community adjacent to a former manufacturing facility in New Jersey, consisting of a multi-stage investigation of shallow groundwater, soil gas, sub-slab soil gas, indoor air and outdoor air, along with pneumatic testing, installation of sub-slab venting systems, in both commercial and residential buildings, verification testing and regulatory negotiation. The mitigations systems have been operating effectively for over a decade.
Vapor Intrusion Assessment, Mitigation and Regulatory Negotiation, Army Corps of Engineers, Raritan, NJ. Dr. McAlary was the Technical Expert for Regulatory Negotiation for a former military arsenal in New Jersey that has been redeveloped for multi-use commercial property. Three years of sub-slab soil gas and indoor air sampling by a previous consultant culminated in a pending Order for sub-slab mitigation systems in 4 large buildings, with an estimated cost of over one million dollars. Dr. McAlary a combination of the Trace Atmospheric Gas Analysis (TAGA) unit, passive samplers, pressure-transducers and data loggers, and building ventilation assessment to
Curriculum Vitæ of Todd Arthur McAlary, Ph.D., P.Eng., P.G., CUT
8
demonstrate that subsurface vapor intrusion was not contributing to indoor air concentrations above NJDEP screening levels in any of the four buildings, and successfully negotiated a scope of future activities that substantially reduced the costs of regulatory compliance.
Vapor Intrusion Assessment and Regulatory negotiation, Aberdeen Proving Grounds, MD. Dr. McAlary was the Technical Director for an assessment of vapor intrusion including over 300 buildings and negotiated a tiered approach starting with the buildings most likely to have unacceptable vapor intrusion to reduce the scope of indoor air and sub-slab sampling and analysis to a reasonable level. The site contains compounds that are not typically included in vapor intrusion assessments, which required the development of customized sampling methods. The results showed no unacceptable risk from vapor intrusion in all but one of the buildings, which substantially reduced the cost of further investigation for the Army.
Vapor Intrusion Assessment and Mitigation, Northrop Grumman, Utica, NY. Dr. McAlary was the Project Director for a soil vapor mapping and sub-slab venting system installation program in residences near a former manufacturing facility. Responsible for regulatory negotiation, scoping, workplan development, site characterization, installation and testing of mitigation systems in potentially affected properties, and reporting.
Vapor Intrusion Assessment and Regulatory Negotiation, Atlantic Richfield, Upstate New York. Dr. McAlary was the Project Manager/Technical Director for a vapor intrusion assessment in upstate New York. Demonstrated that clay till overburden provides sufficient additional attenuation of vapor transport compared to generic attenuation factors to obtain No Further Action Letter with a single round of data collection.
Portfolio Review for Vapor Intrusion Assessment, Jersey Central Power & Light, NJ. Dr. McAlary was the Technical Expert for a review of a portfolio of former Manufactured Gas Plant Sites in New Jersey for developing a strategy to achieve compliance with the recently released NJDEP Vapor Intrusion Guidance in the most cost-effective manner possible.
Vapor Intrusion Assessment and Regulatory Negotiation, JCP&L, NJ. Dr. McAlary was the Project Director for a site-specific assessment of sub-surface vapor intrusion to indoor air at a former Manufactured Gas Plant site in New Jersey that has since been developed to multi-use commercial property. Developed a scope of work for soil gas, indoor air and outdoor air sampling, and performed data interpretation, forensics analysis, reporting and regulatory negotiation to demonstrate that chemicals detected in indoor air were from interior or outdoor sources, and not subsurface vapor intrusion.
Vapor Intrusion Assessment and Mitigation, Several Clients, International. Dr. McAlary was the Technical Director or Peer Reviewer for international assessments of vapor intrusion at sites in Loncin Belgium, Nottingham England, Makati Malaysia, Kuala Laumpur Philippines, Thayez France, Vallejo Mexico, Camilia Australia.
Curriculum Vitæ of Todd Arthur McAlary, Ph.D., P.Eng., P.G., CUT
9
2.4 Groundwater Investigation, Remedial Design and Remediation
Soil Vapor Extraction and Treatment, General Electric, Hickory, NC. Dr. McAlary was the Technical Director for soil vapor extraction system that removed 4.7 tons of chlorinated solvents from beneath a former manufacturing building in 1 year, using the G.E.O. compressor/condenser technology for off-gas removal. Mass removal rates were estimated within about 10% accuracy via mathematical modeling and professional judgment in advance of the remediation activities.
Soil Vapor Extraction System Optimization, Operation and Closure, General Electric, Ontario, CA. Dr. McAlary was the Project Manager/Technical Director for soil and groundwater remediation at an active aircraft engine maintenance facility in Chino Basin, Southern California, including soil vacuum extraction to a depth of 250 feet below ground, regulatory negotiation of Monitored Natural Attenuation of VOCs with concentrations up to about 10 times higher than their respective MCLs in a fully prescribed drinking water supply basin, periodic monitoring and regulatory reporting.
Comprehensive Site Investigation, Risk Assessment and Remedy Optimization, General Electric, West Lynn, MA. Dr. McAlary was the Project Manager/Technical Director for environmental investigations, remediation, risk assessment and regulatory negotiations at a 100-year-old industrial manufacturing facility near Boston, involving several subcontractors, multiple chemicals of concern (VOCs, metals, PAHs, CN, etc.), public involvement and re-design of the existing groundwater extraction and treatment system. Demonstrated that extraction wells installed by previous consultant had a very low efficiency, and improved operations through a systematic program of well development, including surging and purging, disinfection, and jetting.
RI/FS/RA and Cost Allocation Support, Confidential Client, Cupertino, CA. Dr. McAlary was the Technical Director of a team of a dozen geoscientists and engineers for the preparation of a RI/FS at a proposed Superfund site in the South San Francisco Bay area, including 3-D geostatistical analysis of vadose zone VOC mass for a non-binding allocation of responsibility, peer review of reports by consultants for the other Responsible Party, effectiveness analysis of a groundwater extraction and treatment system, remedy modification studies and property redevelopment strategic planning.
RI/FS and RD/RA, Confidential Client, Ontario, CA. Dr. McAlary was a Technical Specialist for a site investigation/remediation in Southern California involving a 2.5-mile long plume of TCE in groundwater, including detailed assessment and modeling of vapor transport through a 350 ft thick unsaturated zone, peer review of the design of a groundwater extraction and treatment system, and development of an innovative investigation technique (case-and-bail sampling) for mapping the vertical profile of VOCs in alluvium.
RCRA RFI/CMS and Remedy Optimization, General Electric, Hickory, NC. Dr. McAlary was the Technical Director and Geologist in Responsible Charge for a groundwater extraction and treatment system to contain PCE and TCE in residuum and partially weathered rock in North Carolina, including re-assessing the aquifer hydraulics and developing multiple lines of evidence to
Curriculum Vitæ of Todd Arthur McAlary, Ph.D., P.Eng., P.G., CUT
10
demonstrate the effectiveness of containment, and semi-annual monitoring for the past several years, and regulatory reporting.
RI/FS Manager, Fike Artel Superfund Site, Nitro, WV. Dr. McAlary was the Project Manager for a team of over a dozen professionals who inherited data from previous consultants to produce the reports in less than 3 months, including PRP group meetings, regulatory negotiation, mathematical modeling of monitored natural attenuation, remedial design and costing.
Remedial Design, General Electric, Taoyuan, Taiwan. Dr. McAlary was a Technical Advisor for regulatory decision-making and remediation strategies at a manufacturing facility with chlorinated solvents in groundwater beneath a residential area with private drinking water supply wells, including presenting a lecture to the Taiwan EPA on the DNAPL Paradigm.
Plume Mapping, Natural Attenuation Remedy Negotiation, and Cost Allocation Support, Cooper Tire and Rubber, Bowling Green, OH. Dr. McAlary was the Technical Director for a bedrock hydrogeologic investigation at a manufacturing facility with DNAPL contamination in Ohio, including development and application of the High Purge Volume sampling technique, mathematical modeling and sampling for a variety of parameters to successfully negotiate a monitored natural attenuation remedy.
Remedy Optimization, General Electric Company, Multiple Locations. Dr. McAlary was a Peer Reviewer of multiple groundwater extraction and treatment systems for cost-effectiveness improvements for a large multi-national manufacturing company. Developed a systematic approach to identifying whether extraction flow rates were optimal using a simple graphical technique and identified operational changes for cost savings.
2.5 Mathematical Modeling of Groundwater Hydraulics and Contaminant Transport
Remedy Effectiveness and Optimization Simulations, Tenneco Automotive, Cozad, NE. Dr. McAlary was the Technical Director for a large-scale aquifer hydraulics analysis to evaluate the effectiveness of a 1,500 gpm groundwater extraction and treatment system in Cozad, NE, including aquifer testing, analytical modeling, numerical modeling and 3-D visualization. Calibrated groundwater flow and transport models to 5 different historic pumping configurations, using data from 150 monitoring wells, and achieved numerical simulations that calibrated exceptionally well to 15 years of field data. Used the mathematical model to demonstrate the effectiveness of the existing system, and was able to successfully negotiate with NDEQ to avoid unnecessary expansion of the system, saving our client more than 5 times our fees.
Natural Attenuation Mathematical Modeling Support, Multiple Clients and Locations. Dr. McAlary was the Principal Investigator or Peer Technical Reviewer for modeling of fate and transport of chemicals in groundwater and the effect of intrinsic biodegradation on the natural attenuation of a plume of contaminants in California (3), New Hampshire, Ohio and Taiwan using screening level (Bioscreen, BioChlor), and numerical models (visualModflow with RT3D).
Curriculum Vitæ of Todd Arthur McAlary, Ph.D., P.Eng., P.G., CUT
11
Groundwater Hydraulic Testing and Analysis in Support of Remedy Design, Multiple Clients and Locations. Dr. McAlary was the Principal Investigator for dozens of pumping tests at sites in Massachusetts, Indianapolis, California (several), Ohio, North Carolina, and Ontario (several), including corrections for baseline drift, barometric drift, and earth tides, using real-time data analysis via modem from data loggers, numerical and analytical solutions.
3-D Model Visualization, Multiple Clients and Locations. Dr. McAlary was the Principal Investigator for 3-D interpolation and visualization of contaminant distributions at sites in Central California, Southern California, and Germany for use in risk management, litigation support, public communication, using advanced geostatistical interpolation methods, medical imaging techniques, and post-processing to video for presentation.
2.6 Litigation Support and Expert Services
Cost Allocation for Non-Binding Arbitration, Confidential Client, Cupertino, CA. Dr. McAlary was the Principal Investigator for a cost allocation proceeding to assign responsibility for remediation costs between two potentially responsible parties in California, employing 3-D geostatistical interpolation and visualization, vadose zone transport modeling in aqueous and vapor phases, forensic analysis of chemical speciation, and comprehensive assessment of geologic structural controls on subsurface transport.
Deposition and Testimony for Cost Allocation, Vorys, Slater Seymour and Pease, Columbus, OH. Dr. McAlary was an Expert Witness for an arbitration proceeding involving historic and current landowners to assign responsibility for subsurface contamination in Ohio, contributing to favorable judgment through clear and simple communication of complex technical processes, synergistic relationships with other consultants, internal and external counsel, and timely delivery of high quality work product.
Expert Report for Lathrop & Gage LLP, Kansas City in the Case of State of Missouri v. Republic Services, Inc. et al. in the United States District Court for the Eastern District of Missouri Eastern Division Case No. 4:15-cv-01506. Dr. McAlary provided a review of an expert report related to migration of VOCs around a landfill based on tree core sampling and analysis.
Litigation Support for Beachcroft – Lloyd/MacDonald, UK. Expert Review of of Preliminary Survey to Determine the Presence, Absence and Significance of HCBD at No.8 and No. 13 Tildsley Court, Weston.
Litigation Support for Beveridge & Diamond. Review of environmental documents regarding the City of Modesto versus PPG lawsuit related to tetrachloroethene in groundwater.
Litigation Support for Bingham McCutchen LLP. Vapor intrusion assessment at a former manufacturing building in Modesto California including review and comment on DTSC letter, indoor air sampling and soil gas sampling, preparation of workplan and report for submittal to the RWQCB, oversight of SVE system installation.
Curriculum Vitæ of Todd Arthur McAlary, Ph.D., P.Eng., P.G., CUT
12
Technical Advice to Davies, Ward Phillips & Vineberg. Review of air quality data from residences in the vicinity of a former manufacturing facility in Cambridge, Ontario including: indoor air quality data maps for individual compounds, multi-compound maps for various combinations of compounds, multi-matrix maps showing concentrations of selected compounds, multi-matrix 3D visualization showing concentrations of selected compounds, time-trend charts on concentrations vs. time, review of existing consultants reports, and meetings to present and discuss the interpretation of the results of the graphical analyses.
Litigation Support for Drinker Biddle & Reath LLP. Review of information of the potential for subsurface vapor intrusion for a site in York, PA, including: review of existing site information Conceptual Site Model development, identification of data gaps, risk assessment for existing and future potential buildings, recommendations for additional activities, letter report and teleconference discussions.
Litigation Support for Farella Braun & Martel, LLP. Technical review of the potential for vapor intrusion at a site in San Francisco, California.
Litigation Support for Farella Braun & Martel, LLP. Preparation of a Non-Binding Allocation of Responsibility for costs associated with a co-mingled plume of VOCs in groundwater in Cupertino, California.
Litigation Support for Gardere Wynne Sewell, LLP. Expert services for Freddie Allen, et al. v. Texas Instruments Incorporated, et al. - Cause No. 06-06271 (162nd District Court, Dallas County, Texas) and Civil Action No. 306-CV1171-H (U.S. District Court, N.D. Texas), including: 1) review and analysis of soil, air, and groundwater data, and 2) render an expert opinion regarding the impact, if any, of VOCs on the plaintiff's property.
Litigation Support for Greenberg Traurig Maher, UK. Professional opinion regarding potential future changes to human health and environmental risks associated with Weston Quarries, Runcorn, UK.
Litigation Support for Jones Day. Expert services related to vapor intrusion near an industrial facility in New York State including: 1) receive and review reports, compile existing data into an electronic database, perform checks to verify the database entries, and review the data; 2) develop initial graphics to assist with the visualization of the site features, geology and distribution of subsurface chemicals of concern, and review to assess whether additional data visualization activities may be appropriate; 3) develop an understanding of the site conditions, history, and factors affecting the fate and transport of subsurface chemicals, and; 4) discuss initial interpretations, determine a course of further action.
Litigation Support for Katten Muchin Rosenman, LLP. Vapor intrusion assessment at a Montessori school beside a former dry-cleaning facility in Riverside, California.
Litigation Support for King and Wood Mallesons, Australia. Peer review of protocol for Vapor Intrusion Risk Assessment, and provision of a draft report.
Curriculum Vitæ of Todd Arthur McAlary, Ph.D., P.Eng., P.G., CUT
13
Litigation Support for Liskow & Lewis. Review of an expert report related to the release of chloride ions to shallow groundwater and the potential for impact to the underlying drinking water supply Chicot aquifer in Louisiana.
Litigation Support for McCarter & English, LLP. Plan and perform a preliminary indoor air quality assessment for the building located at the site, attend a site visit, review of records to identify potential background sources of indoor air quality issues at a 4H club building in Springfield New Jersey.
Litigation Support for Wallace, King, Domike & Branson, PLLC. Consulting services including but not limited to: dealings between an Oil Company and the EPA, the District of Columbia Dept. of Health, and Dept. of Environment, other consultants or contractors, and the communities or residents involved in the litigation concerning environmental conditions at and around a former gasoline station in Chillum, Maryland.
Litigation Support for Williams, Kastner & Gibbs PLLC. Technical review of documents pertaining to a Roofing Plant in Winnipeg, Manitoba to identify any discrepancies or vulnerabilities in arguments that waste building/roofing materials that were contaminated with coal tar aggravated the existing contamination and facilitated migration into the adjacent river, across the river and downstream.
Litigation Support for Wolf, Block, Schorr & Solis-Cohen. Vapor intrusion sampling, mitigation system installation and operation at residential buildings downgradient from a former manufacturing facility in Bridgewater, New Jersey.
3.0 RESEARCH EXPERIENCE
3.1 Overview
My research interests are primarily focused on developing improved methods for assessment, mitigation and remediation of contaminated land to reduce human health risk and facilitate redevelopment of contaminated land. I have performed applied research related to mathematical modeling of substrate delivery systems (for in-situ remediation of contaminated groundwater via bioremediation, bioaugmentation, chemical oxidation and emulsified zero-valent iron), multi-phase extraction, soil vapor extraction, biosparging, passive reactive walls and sub-slab venting. I had a primary role in the development and commercialization of the Waterloo Membrane Sampler, a passive permeation sampler for monitoring the concentrations of VOCs in soil vapor and indoor air that was conceived by my Ph.D. Advisor, and we are now jointly commercializing through SiREM, a wholly-owned subsidiary of Geosyntec Consultants, my current employer. I resolved (after about 3 decades of failures by others in the industry) the key to being able to quantitatively measure soil vapor concentrations using passive samplers, which resulted in a 3-part series of peer-reviewed articles and 2 patents pending. I have recently completed or am currently performing 5 large
Curriculum Vitæ of Todd Arthur McAlary, Ph.D., P.Eng., P.G., CUT
14
applied research programs for the US DOD related to assessment and mitigation of soil vapor intrusion to indoor air. I have also completed 3 assignments and am at the final proposal stages of a fourth study as part of a long-term pipeline leak detection program sponsored by the Pipeline Research Council International (PRCI). All of these topics and related areas are still of interest to me.
I am particularly interested in collaborative research between the University and Private Sector, because I feel the benefits of this type of research can be realized quickly and justify additional investment by the Private Sector, which I feel is critical to the future of funding for Canadian Universities. My considerable experience in consulting has provided me with unique insight into the research needs, the value perceived by the funding sources, the administrative systems involved in accessing the funding, and a network of connections that could be very unique and valuable to other members of the UBC faculty. My philosophy regarding practical research with industrial funding stems partly from my involvement over the years with the University Consortium for Applied Groundwater Research, which has been a pervasive influence for students of the University of Waterloo since the 1980s (in various incarnations). I believe that model can be expanded, and that my extensive history with applied research will provide the confidence that Private Sector contributors need in order to grant significant funding.
3.2 Applied Research Contracts
Demonstration/Validation of Passive Samplers for Vapor Intrusion Assessment, Dr. McAlary was the Principal Investigator for a Demonstration/Validation Study comparing five different quantitative passive samplers for use in vapor intrusion investigations. Funding was provided by the U.S. Department of Defense (DOD) Environmental Security and Technology Certification Program (ESTCP, US$1M) and the U.S. Navy SPAWAR Division, NESDI Program. The program consisted of:
Controlled laboratory experiments at concentrations intended to represent typical indoor air quality (1 to 100 parts per billion by volume, ppbv) for 10 different volatile organic compounds (including chlorinated ethenes, ethanes and methanes, as well as aliphatic and aromatic hydrocarbons) to represent the range of compounds of interest, and were conducted at three controlled levels of five factors (temperature, humidity, sample duration, wind speed and concentration) for five sampler types (Radiello, SKC Ultra II, Waterloo Membrane Sampler, and ATD tubes with Tenax TA and Carbopack B), each in triplicate for a total of 24 experimental chamber tests. The results showed passive samplers have comparable accuracy and precision to active sampling via EPA Method TO-17 for a given set of conditions, but show a higher level of variability in response to changes in conditions. Indoor air temperature, humidity and velocity are typically controlled to provide comfort for occupants, so the passive samplers will generally provide data of acceptable quality in most cases. It is advisable to select the sorbent and sampling duration such that the recommended safe sample volume for the compounds of interest are greater than the product of their diffusive
Curriculum Vitæ of Todd Arthur McAlary, Ph.D., P.Eng., P.G., CUT
15
sampler uptake rates and the sample duration (which is equivalent to the volume of air that would need to be drawn through an active sorbent sampler to trap a comparable mass when exposed to comparable concentrations as the passive sampler, and therefore referred to as the “equivalent sample volume”). Published in ES:P&I, McAlary et al., 2015.
Indoor and outdoor sampling at three DOD facilities (Navy Old Town Campus, California, Army Corps of Engineers Cold Regions Research and Engineering Laboratory, New Hampshire and Marine Corps Air Station Cherry Point, North Carolina) in three locations inside and one location outside per location. Each station was monitored using five passive samplers (each in triplicate) and Summa canisters for analysis by EPA Method TO-15 in Selected Ion Monitoring Mode (SIM). The results showed acceptable accuracy and precision for samplers with strong sorbents, but some low bias attributable to poor retention for weakly sorbed compounds in samplers with sorbents designed for thermal desorption sample preparation. Published by Navy SPAWAR Systems Center Pacific: www.dtic.mil/cgi-bin/GetTRDoc?AD=ADA595262.
Mathematical modeling of soil vapor diffusion toward a borehole to simulate the conditions of passive soil vapor sampling using both steady state and transient analytical models. The results showed that the diffusive delivery rate is sufficient to provide sufficient mass to minimize the starvation effect for passive samplers with uptake rates in the range of about 1 mL/min or less, in which case, the passive samplers would be expected to be able to provide accurate and precise soil vapor concentration measurements, which has been elusive for almost 3 decades because previous passive samplers had uptake rates generally higher than about 10 mL/min, which causes the rate limiting step in the sampling process to depend on the diffusivity of the geologic materials (highly variable) instead of the design of the sampler itself (negligible variability between individual sampler devices). Published in ES:P&I, McAlary et al., 2014a.
Controlled laboratory experiments at concentrations intended to represent soil vapor sampling (1 to 100 parts per million by volume (ppmv). The results showed that passive samplers provide concentration measurements with acceptable accuracy and precision under very low face-velocity (5 cm/min), high humidity and high concentration conditions for relatively short (30-minute) sample durations in most cases (exceptions include highly soluble compounds with activated carbon sorbent where water sorption may have either reduced retention via competition or facilitated degradation reactions). Samples collected at zero face velocity also showed acceptable accuracy and precision as long as low-uptake rate varieties of each passive sampler type were used. Published in ES:P&I, McAlary et al., 2014b.
Field sampling experiments in the sub-surface at depths of sub-slab, 1 m and 4m below ground. A wide range of conditions were tested: sample durations from 20 minutes to 11.7 days, concentrations from about 100 to about 60,000 μg/m3, uptake rates from about 0.05 to 80 mL/min, several different chlorinated VOCs, 2.4 to 10 cm (1 to 4 inch) borehole diameter, 2.5 to 46 cm (1 to 18 inch) tall void spaces, ambient temperatures during sample collection from about 15 to about 30 °C, analysis by several different laboratories and different extraction methods (solvent extraction and thermal desorption) for each of several different types of commercially-available passive
Curriculum Vitæ of Todd Arthur McAlary, Ph.D., P.Eng., P.G., CUT
16
samplers and sorbent media. This provides a previously unavailable set of data with which to assess the capabilities and limitations of passive soil vapor sampling for VOC concentration measurement. The results validated the mathematical modeling by showing that quantitative concentration measurements are possible with acceptable accuracy and precision as long as the samplers have a low uptake rate compared to the diffusive delivery rate through soil, or the void volume in which the sampler is deployed is large compared to the equivalent sample volume and the equivalent sample volume is smaller than the recommended safe sample volume for the compounds of interest and the sorbent selected. Published in ES:P&I, McAlary et al., 2014c.
Field sampling in a flow-through cell. There are two possible scenarios where it may be advantageous to collect passive samples in a flow-through cell: 1) where existing sub-slab probes have a diameter too small to accommodate a passive sampler, or 2) where a volume-integrated sample of sub-slab vapor is desired (i.e., draw 1,000 to 1,000,000 L of gas from below a floor slab and measure the average concentration). The test consisted of a fractional factorial experiment with three levels of flow rate and sample duration and Summa canister/TO-15 samples were collected on a 1:1 basis for comparison. The results showed acceptable precision and accuracy as long as the flow rate was higher than the sampler uptake rate and the sampler incorporated a screen or membrane to minimize uptake by advection. Published in ES:P&I, McAlary et al., 2014d.
Demonstration/Validation of High Volume Sampling and Multi-Increment® Sampling for Sub-Slab Vapor Characterization. Dr. McAlary was the Principal Investigator for an applied research project for the U.S. Air Force under their Broad Agency Announcement (BAA) Program, which consisted of comparing two emerging technologies for sub-slab vapor characterization to conventional methods. High Volume Sampling (HVS) consists of drawing large volumes of gas from each sample location, screening the extracted vapors continuously with portable instruments and collecting selected samples for laboratory analysis (see McAlary et al., 2010). Multi-Increment® sampling (MIS) consists of collecting increments of samples at multiple locations along rows and columns of a grid (a localized area of high concentrations will cause the row and column composites including that location to have higher concentrations than other composite samples). The results show that HVS is preferable for buildings with granular fill below the floor slab and MIS sampling is preferable where low permeability materials are below the floor slab. Publication in preparation.
Demonstration/Validation of New Methods for Design and Optimization of Mitigation Systems for Subsurface Vapor Intrusion to Indoor Air. Dr. McAlary is the Principal Investigator for an applied research program to improve the cost-effectiveness of vapor intrusion mitigation systems funded by ESTCP. Conventional design relies on a finite and measurable vacuum below the floor slab in excess of typical cross-floor variations, but this often requires costly systems and indoor air is drawn across the floor and vented to the atmosphere at high rates, which is not energy efficient. The new methods include transient pneumatic testing (vacuum versus time), analysis of the transmissivity of the sub-floor material and leakance of the floor slab using the Hantush-Jacob (1955) Leaky Aquifer Model, verification of the model fit with steady-state (vacuum
Curriculum Vitæ of Todd Arthur McAlary, Ph.D., P.Eng., P.G., CUT
17
versus distance) data, and verification of calculated sub-floor flow velocities with helium inter-well tracer tests with mathematical modeling to optimize the number of vent-pipes and flow rates to capture the available mass flux with allowance for temporal variability in building pressure. The results show that the rate of pore volume flushing below the slab and the mass flux removed by the venting system are important metrics for optimizing and verifying the performance of a system, and the optimal design depends on the building-specific conditions. Publications in preparation.
Demonstration/Validation of Methods to Measure Mass Flux for Vapor Intrusion Assessment. Dr. McAlary is a core member of the research team for a study funded by ESTCP to demonstrate and validate three methods for measuring mass flux: 1) via Fick’s Law and the vertical concentration gradient, building are and effective diffusion coefficient, 2) via depressurizing the building and measuring the corresponding flow through the building and steady indoor air concentrations, and 3) via depressurizing the sub-slab region and measuring the flow and concentrations in the vent-pipes. Preliminary results indicate that mass flux shows much less temporal variability than indoor air concentrations, and may therefore provide a more reliable means to assess potential long-term inhalation exposures for building occupants. Publications expected in 2016.
Assessing CO2 and Formaldehyde as Potential Tracers to Assess Cross-Floor Air Flow to Quantify Energy Losses Attributable to Sub-Slab Depressurization Systems. Dr. McAlary was the Technical Director of a study performed by a graduate student at the University of Toronto (Donna Vakalis) and her advisor (Prof. Jeffrey Siegel) with funding from the Ontario Centres of Excellence (OCE) program and Geosyntec Consultants. The research tested whether CO2 and formaldehyde (HCHO) in indoor air can be monitored in the vent-pipes of a sub-slab depressurization system to quantify energy losses associated with the flow of conditioned indoor air across the floor slab. CO2 was challenged by naturally occurring CO2 in the subsurface and HCHO concentrations were too low to be reliably measured.
Long-Term Passive Sampling with the Waterloo Membrane Sampler. Dr. McAlary was the Technical Director of a two-year study performed at the University of Waterloo as a Post-Doctoral Fellowship by Dr. Paulina Biernacka, jointly by the MITAC Program and Geosyntec. The study included passive sampling with the Waterloo Membrane Sampler modified with a thicker membrane for lower uptake rates to minimize the potential for overloading the sorbent over sample durations up to 6 months. Several different sorbents were tested to evaluate the retention and recovery of a list of 51 compounds (U.S.EPA Method 8260 analyte list). The results demonstrated that the activated carbon-based sorbent Anasorb 747 is a suitable choice for most VOCs and that quantitative concentration measurements are practical for durations up to 6 months. Publication in preparation.
Development of a low-uptake version of the Waterloo Membrane Sampler for Quantitative Soil Vapor Concentration Measurement. Dr. McAlary was the Technical Director of a two-year study performed at the University of Waterloo as a Post-Doctoral Fellowship by Dr. Suresh Seethapathy, funded jointly by the MITAC Program and Geosyntec. The study involved
Curriculum Vitæ of Todd Arthur McAlary, Ph.D., P.Eng., P.G., CUT
18
experimental trials of several different designs of the Waterloo Membrane Sampler to develop a variety with a low uptake rate suitable for soil vapor sampling with minimal risk of a negative bias by starvation (which occurs in cases where the passive sampler draws VOC vapors from the surroundings faster than they are replenished). The results showed that a smaller vial (0.8 mL, instead of 1.8 mL) with a smaller opening provided acceptably low uptake rates for most soil types. Published in McAlary et al., 2014b,c.
Passive Venting for VOC Mitigation, Army Corps of Engineers, Raritan, NJ. Dr. McAlary was the Principal Investigator for applied research into the use of solar and wind-powered venting systems for mitigating subsurface vapor intrusion to indoor air at a former arsenal that has subsequently been redeveloped for the Army Corps of Engineers. The study included measuring the specific capacity (ratio of flow to applied vacuum) for each vent-pipe, and the relationship of the wind-speed to the vacuum in the vent-pipe generated by a wind-turbine, from which the flow rate in the pipe can be calculated based on freely available wind-speed data. The solar-powered fan option provides a stronger motive force, and the vent-pipe vacuum can be easily monitored with a pressure-transducer, from which the flow rate can be calculated using the specific capacity. This research was presented at the AEHS West Coast Conference (Bertrand et al., 2010).
Expanding the Capabilities and Applications of the Waterloo Membrane Sampler. Dr. McAlary was the Industrial Advisor for a 3-year research project sponsored by the Ontario Ministry of the Environment to develop innovative applications for the Waterloo Membrane Sampler for monitoring concentrations of VOCs in soil, soil vapor and groundwater. The research included studies of the use of the WMS sampler for monitoring VOC concentrations in groundwater (Faten Salim M.Sc. thesis) and stable carbon isotope sampling and analysis (Oana Goli thesis).
Pipeline Leak Detection for the Pipeline Research Council International. Dr. McAlary was the Technical Director for three phases of applied research for PRCI and member companies related to the challenge of detecting small (<2 bbl/day) leaks from liquid hydrocarbon pipelines: 1) conceptualization of the fate and transport of hydrocarbons vapors and preliminary screening of technologies for detecting vapors above-ground, 2) mathematical modeling of subsurface vapor fate and transport with BioVapor coupled with atmospheric dispersion modeling with Screen3 to assess the likely concentration distribution of hydrocarbon vapors from a range of different release scenarios, and 3) data collection from the Enbridge Gas and CFER Environmental Leak Detection Experimental Research (ELDER) facility for verification of the previous mathematical model simulations. A proposal is outstanding for a fourth phase of research using a polymer adsorption sensor where Dr. McAlary will be responsible for independent experimental design, data interpretation and technology verification for large-scale (box-car) experiments.
In-Situ Characterization of BioAttenuation of Hydrocarbon Vapors Beneath a Building, American Petroleum Institute, OK. Dr. McAlary was the Principal Investigator for a detailed assessment of soil vapor transport and biodegradation in the vicinity of an office building at a former refinery in Oklahoma, sponsored by the American Petroleum Institute. The study included multiple nested soil vapor probes and a dozen sub-slab probes for sampling and analysis of
Curriculum Vitæ of Todd Arthur McAlary, Ph.D., P.Eng., P.G., CUT
19
hydrocarbon, vapors, oxygen, carbon dioxide and methane, in-situ measurement of vapor diffusion coefficient using helium tracer method, seasonal (wet/dry) monitoring, pneumatic testing, mathematical modeling, forensic hydrocarbon analysis and stable carbon isotope analysis. The results showed that seasonal variability causes significant differences in the sub-slab concentrations of hydrocarbon vapors and oxygen.
Mathematical Modeling Study of Hydrocarbon Vapor Fate and Transport, American Petroleum Institute. Dr. McAlary was a Technical Director for research conducted using the Abreu and Johnson (2006) 3-dimensional model for subsurface vapor transport degradation and vapor intrusion sponsored by the American Petroleum Institute and the U.S. Environmental Protection Agency. Simulations of a wide variety of generic scenarios were performed to demonstrate the conditions expected in response to a variety of different source concentrations, depths, soil types, and building types in order to help regulators and practitioners develop conceptual models of vapor intrusion, design sampling programs, and interpret results in the context of theoretical expectations. Published in API Technical Bulletin #4775 and Abreu, Ettinger and McAlary, 2009.
Mathematical Modeling of Small Leaks of Liquid Hydrocarbon from Pipelines. Dr. McAlary was the Principal Investigator for a scoping study to assess the potential for remote sensing of liquid hydrocarbon leaks sponsored by the Pipeline Research Council International. The study consisted of a wide range of simulations of subsurface hydrocarbon vapor transport and degradation using BioVapor (API), coupled with atmospheric dispersion modeling using Screen3 (US EPA). The results showed that vapor concentrations will likely be too low to detect at the height of a fixed-wing aircraft, and the ability to detect leaks improves dramatically for detectors deployed near or just below the ground surface.
Soil Vapor Sampling in Low Permeability Materials. Dr. McAlary was the Project Manager and Technical Director for development of specialized protocols for soil gas sampling in low-permeability soils for the Anadarko Petroleum Corporation, Enid, OK. Soil vapor samples were collected at depths of 6, 9 and 12 ft below ground surface in a silty clay soil and many of the probes were unable to sustain a target flow rate of 100 mL/min without unacceptable vacuum (100 inches of water column). The protocol included pneumatic testing (flow and vacuum), tracer testing with a helium shroud over the sample train and field screening of the gas purged prior to sample collection with a portable helium meter to demonstrate the absence of unacceptable leaks, sequential incremental sample collection from very low flow rate probes and several independent lines of quality assurance and quality control. All data was collected in two seasonal events to document changes between the end of a very dry summer and the end of a very wet spring. The results were published in GWMR, McAlary et al., 2010.
Building Pressure Cycling to Discern Vapor Intrusion from Background Sources, Confidential Client, Santa Clara, CA. Technical Director for a field demonstration in 2003 of using building pressure cycling to assess vapor intrusion at a redeveloped and re-occupied structure in central California. The building ventilation system was used to pressurize the building for
Curriculum Vitæ of Todd Arthur McAlary, Ph.D., P.Eng., P.G., CUT
20
several hours and then de-pressurize the building for several hours, and indoor air samples were collected near the end of each cycle. The trichloroethene concentrations under negative pressure correlated very strongly to the indoor air concentrations predicted from soil vapor sampling and analysis and mathematical modeling of the soil gas to indoor air attenuation factor, but dropped by at least an order of magnitude (to less than the detection limit) under positive pressure. The benzene concentrations in indoor air were the same for positive and negative pressure, essentially identical to outdoor air concentrations, and at least two orders of magnitude higher than predicted from soil vapor samples. This was the first demonstration of building pressure cycling to resolve which VOCs in indoor air are attributable to the subsurface or background sources. Presented at the Battelle Conference Berry-Spark et al., 2004.
Development of Tracer Gas Applications for Vapor Monitoring, Various Sites. Technical Director for several applications of helium tracer testing to evaluate subsurface gas flow and transport, including: 1) soil gas sampling for vapor intrusion investigations; 2) aerobic co-metabolic degradation pilot testing; 3) in-situ respirometry testing; 4) pneumatic testing in fractured bedrock; and, 5) confirmation of the removal of drill air prior to baseline sampling of gas monitoring wells when installing soil vapor monitoring wells in bedrock using air-rotary methods.
Development of High Volume Sampling for Soil Vapor Intrusion Assessment. Dr. McAlary was the Technical Director for development of a High Volume Sampling (HVS) method for vapors in soil gas for Hewlett Packard, Malaysia. The research included monitoring of vapor concentrations as a function of volume removed to assess the distribution of concentrations between and beyond probe locations, volume-integrated sampling via passive samplers in flow-through cells and canister samples via slip-stream, transient monitoring of vacuum vs time and analysis using a leaky aquifer model of pumping tests to assess vadose zone stratigraphy, and helium tracer testing to verify mass balance and leakage. The results were published in GWMR, McAlary et al., 2010.
Spatial and Temporal Variability in Soil Vapor Concentrations, Chevron, WY & OH. Dr. McAlary was an Invited Peer Reviewer of two extensively monitored field research sites assessing the fate and transport of hydrocarbon vapors in the unsaturated zone at two former refinery properties led by Arizona State University and funded by Chevron. Published in Emma Hong Luo dissertation, ASU.
Soil Vapor Sampling Demonstration, Midwestern States Risk Assessment Symposium, IN. Dr. McAlary was the Technical Director of the Soil Gas Monitoring Demonstration at the Midwestern States Risk Assessment Symposium in Indianapolis in August, 2006. He designed a program of sampling and analysis using multiple lines of evidence and coordinated the activities of over 30 volunteers to execute the demonstration, including three field mobilizations, two classroom sessions, field sampling and analysis, laboratory analysis, statistical correlations and field demonstrations. Tools included active soil gas sampling with Summa canisters, syringes, Tedlar bags, and ATD tubes, passive diffusive sampling, field analyses by the Trace Atmospheric Gas Analysis (TAGA) unit, two portable GCs, Method 8021, the ppbRAE™ and the TVA1000™, laboratory analyses by TO-15 and TO-17, sampling via Continuous MultiChannel Tubing™, Post-
Curriculum Vitæ of Todd Arthur McAlary, Ph.D., P.Eng., P.G., CUT
21
Run Tubing™, soil gas inserts and sub-slab probes, and alternative testing methods, including helium tracer testing, gas permeability testing, barometric pressure logging, and cross-slab differential pressure logging. Preliminary results of the research are summarized at: https://iavi.rti.org/WorkshopsAndConferences.cfm?PageID=documentDetails&AttachID=288
Demonstration of the “Fresh Water Lens” as a Barrier to Vapor Intrusion, Confidential Client, MA. Dr. McAlary was the Project Manager/Technical Director of applied research to demonstrate the effect of a fresh-water lens (a.k.a., “diving plume”) as a barrier to prevent off gassing of VOCs in groundwater at a site in Massachusetts. Depth discrete groundwater samples collected using the Waterloo Profiler™ were used to demonstrate the presence of a 5 ft thick layer of uncontaminated groundwater below the water table table (8 ft bgs), over dissolved concentrations of tricholoethene approaching the solubility limit at shallow as 20 ft bgs. Over a decade of water level and seasonal soil vapor monitoring has been conducted to demonstrate the stability and persistence of the fresh water lens as a barrier to prevent vapor intrusion.
Multi-Level Soil Vapor Monitoring and Numerical Modeling For Soil Vacuum Extraction Design, General Electric, Merced, CA. Dr. McAlary was the Project Manager/Technical Director for field research to verify soil vapor extraction (SVE) system design at a site in Central California. Mr. McAlary designed and installed multi-level soil gas probes to a depth of 50 feet in layered alluvium, conducted individual well pneumatic tests, and monitored vacuum as a function of time, depth and distance in 1988. The data were used to calibrate a finite element model of soil gas flow and the model results agreed very well with the field measurements. The pneumatic testing and analytical/numerical analysis was subsequently applied at several other sites and used to refine the design of several full-scale SVE systems.
4.0 PUBLICATIONS AND TRAINING
4.1 Peer Reviewed Articles, Reports, Chapters and Theses
McAlary, T.A., H. Groenevelt, S. Disher, J. Arnold, S. Seethapathy, P. Sacco, D. Crump, B. Schumacher, H. Hayes, P. Johnson and T. Górecki, 2015. Passive Sampling for volatile organic compounds in indoor air – controlled laboratory comparison of four sampler types, Environmental Science: Processes & Impacts, 2015, 17, 896, DOI: 10.1039/C4EM00560K
ESTCP, 2015. Development of More Cost-Effective Methods for Long-Term Monitoring of Soil Vapor Intrusion to Indoor Air Using Quantitative Passive Diffusive-Adsorptive Sampling, Final Report. ESTCP Project ER-200830, August 2015. https://www.serdp-estcp.org/Program-Areas/Environmental-Restoration/Contaminated-Groundwater/Emerging-Issues/ER-200830/ER-200830
ESTCP, 2015. Development of More Cost-Effective Methods for Long-Term Monitoring of Soil Vapor Intrusion to Indoor Air Using Quantitative Passive Diffusive-Adsorptive Sampling, Cost and
Curriculum Vitæ of Todd Arthur McAlary, Ph.D., P.Eng., P.G., CUT
22
Performance Report. ESTCP Project ER-200830, August 2015. https://www.serdp-estcp.org/Program-Areas/Environmental-Restoration/Contaminated-Groundwater/Emerging-Issues/ER-200830/ER-200830
McAlary, T.A., X. Wang, A. Unger, H. Groenevelt and T. Górecki, Quantitative Passive Soil Vapor Sampling for VOCs - Part I: Theory. Environmental Science: Processes & Impacts, 2014, 16, 482. http://xlink.rsc.org/?doi=C3EM00652B
McAlary, T.A., H. Groenevelt, S. Seethapathy, P. Sacco, D. Crump, M. Tuday, B. Schumacher, H. Hayes, P. Johnson and T. Górecki, Quantitative Passive Soil Vapor Sampling for VOCs – Part 2: Laboratory Experiments. Environ. Sci.: Processes Impacts, 2014, 16, 491. http://xlink.rsc.org/?doi=C3EM00128H
McAlary, T.A., H. Groenevelt, P. Nicholson, S. Seethapathy, P. Sacco, D. Crump, M. Tuday, H. Hayes, B. Schumacher, P. Johnson, T. Górecki and I. Rivera Duarte, Quantitative Passive Soil Vapor Sampling for VOCs - Part 3: Field Experiments. Environ. Sci.: Processes Impacts, 2014, 16, 501. http://xlink.rsc.org/?doi=C3EM00653K
McAlary, T.A., H. Groenevelt, P. Nicholson, S. Seethapathy, P. Sacco, D. Crump, M. Tuday, H. Hayes, B. Schumacher, P. Johnson, T. Górecki and I. Rivera Duarte, Quantitative Passive Soil Vapor Sampling for VOCs - Part 4: Flow-Through Cell. Environ. Sci.: Processes Impacts, 2014, 16, 1103. http://xlink.rsc.org/?doi=C4EM00098F
U.S. Navy, 2014. Project 424 on “Improved Assessment Strategies for Vapor Intrusion (VI)” funded by the Navy Environmental Sustainability Development to Integration (NESDI) program. www.dtic.mil/cgi-bin/GetTRDoc?AD=ADA595262
McAlary, T., 2014. Demonstration and Validation of the Use of Passive Sampler for Monitoring Soil Vapor Intrusion to Indoor Air, Doctoral Dissertation, University of waterloo, Waterloo Ontario, available at: https://uwspace.uwaterloo.ca/handle/10012/8643
McAlary, T.A., P.Nicholson, H. Groenevelt, D. Bertrand and R.Ettinger, 2011. A Case Study on the influence of aerobic biodegradation on vapor intrusion at a former refinery property, chapter in “Vapor Emission to Outdoor Air and Enclosed Spaces for Human Health Risk Assessment: Site Charaterization, Monitoring and Modeling” Ed: Sabrina Saponaro, Elena Sezenna and Luca Bonomo (Politecnico di Milano, Italy), Nova Publishers, ISBN: 978-1-61728-692-6.
McAlary, T.A., J. Provost and H. Dawson, 2010. Vapor Intrusion. Chapter in: Swartjes, F.A. (ed). Dealing with Contaminated Sites. From Theory Towards Practical Application. Springer, Dordrecht. ISBN 978-90-481-9757-6.
McAlary, T.A., Nicholson, P., Yik, L.K., Bertrand, D. and G. Thrupp, 2010. High Purge Volume Sampling - A New Paradigm for Sub-Slab Soil Gas Monitoring, Groundwater Monitoring and Remediation, V. 30, No. 2, pp 73–85, Spring 2010.
Abreu, L. D. V.; Ettinger, R. A. and T. A. McAlary, 2009. “Simulating the Effect of Aerobic Biodegradation on Soil Vapor Intrusion into Buildings: Evaluation of Low Strength Sources associated with Dissolved Gasoline Plumes,” API Technical Bulletin #4775. API, Washington, DC.
Curriculum Vitæ of Todd Arthur McAlary, Ph.D., P.Eng., P.G., CUT
23
Abreu, L., R.Ettinger and T. McAlary, 2009. Simulated Soil Vapor Intrusion Attenuation Factors Including Biodegradation for Petroleum Hydrocarbons, Groundwater Monitoring and Remediation 29, no. 1/ Winter 2009/pages 105–117.
Dawson, H. and T. McAlary, 2009. A Compilation of Order Statistics for VOCs from Post-1990 Indoor Air Concentration Studies in North American Residences Unaffected by Subsurface Vapor Intrusion, Groundwater Monitoring and Remediation 29, no. 1/ Winter 2009/pages 60–69.
McAlary, T.A. and P.C. Johnson, 2009. Editorial Column – Focus Issue on Vapor Intrusion, Groundwater Monitoring and Remediation, 29, no. 1/ Winter 2009/pages 40-41.
McAlary, T.A., P. Nicholson, H. Groenevelt, and D. Bertrand, 2009. A Case-Study of Soil Gas Sampling in Silt and Clay-rich (Low-Permeability) Materials, Groundwater Monitoring and Remediation, 29, no. 1/ Winter 2009/pages 144–152.
McAlary, T.A., R. Ettinger, P. Johnson, B. Eklund, H. Hayes, T. Shields, B. Chadwick and I. Rivera, 2009. Review of Best Practices, Knowledge and Data Gaps, and Research Opportunities for the U.S. Department of Navy Vapor Intrusion Focus Areas. Navy Technical Report #1982, May 2009.
McAlary, T.A., R. Ettinger and P. Johnson, 2005, “Reference Handbook for Site-Specific Assessment of Subsurface Vapor Intrusion to Indoor Air,” EPRI, Palo Alto, CA, 2005, EPRI Document #1008492.
Mendoza, C.A. and T.A. McAlary, “Modeling of Groundwater Contamination Caused by Organic Solvent Vapors,” Ground Water, v. 28, no. 2, 1990, p. 199-206.
McAlary, T.A., 1989. Master's Thesis, “Comparison of Measured and Calculated Reactive Vapor Diffusion Coefficients in Unsaturated Sands,” Department of Earth Sciences, University of Waterloo, 1989.
McAlary, T.A. and J.F. Barker, “Volatilization Losses of Organics During Groundwater Sampling from Low-Permeability Materials,” Groundwater Monitoring Review, No. 7, Vol. 4, 1987, p. 63-68.
McAlary, T.A., 1986. Bachelor's Thesis, “The Behavior of Volatile Organic Compounds in Groundwater Monitoring Piezometers,” Department of Earth Sciences, University of Waterloo, 1986.
4.2 Regulatory and Other Guidance Documents
Navy Facilities Engineering Command, 2015. Passive Sampling for Vapor Intrusion Assessment, Technical Memorandum TM-NAVFAC EXWC-EV-1503, July 2015. https://clu-in.org/download/issues/vi/VI-passive-sampling-EXWC-EV-1503.pdf
United States Environmental Protection Agency, 2014. Challenges in Bulk Soil Sampling and Analysis for Vapor Intrusion Screening of Soil, Engineering Issue Paper, EPA/600/R-14/277. http://nepis.epa.gov/Exe/ZyPURL.cgi?Dockey=P100NDQL.TXT
United States Environmental Protection Agency, 2014. Passive Samplers for Investigations of Air Quality: Method Description, Implementation, and Comparison to Alternative Sampling Methods, Engineering Issue Paper, EPA/600/R14/434.

Curriculum Vitæ of Todd Arthur McAlary, Ph.D., P.Eng., P.G., CUT
24
http://cfpub.epa.gov/si/si_public_record_report.cfm?dirEntryId=308311&subject=Air%20Research&showCriteria=0&searchAll=Air%20and%20Health&actType=Product&TIMSType=PUBLISHED+REPORT&sortBy=revisionDate
RCRA Supplemental Guidance for Subsurface Vapor Intrusion to Indoor Air: One of 3 primary co-authors for the first US EPA Guidance on screening sites for the potential for health risks attributable to Vapor Intrusion (http://www.epa.gov/epaoswer/hazwaste/ca/eis/vapor.htm), December, 2001.
US EPA OSWER Guidance Expert Panel: Paid member of the Expert Panel for responses to comments on the 2002 Draft Federal US EPA (OSWER) Vapor Intrusion Guidance document (http://www.epa.gov/correctiveaction/eis/vapor.htm) and the only non-regulator on the Panel for the seminar series to introduce the OSWER Guidance (http://www.epa.gov/ttbnrmrl/presentations.htm).
EPRI Reference Handbook for Site-Specific Assessment of Subsurface Vapor Intrusion to Indoor Air: Primary author of one of the most detailed resources on the subject of vapor intrusion available to date (http://mydocs.epri.com/docs/public/000000000001008492.pdf), March, 2005.
NJDEP Vapor Intrusion Guidance: Provided draft text, figures and technical review of the section on Conceptual Site Models in the Vapor Intrusion Guidance of the New Jersey Department of Environmental Protection. (http://www.state.nj.us/dep/srp/guidance/vaporintrusion/vig.htm), October, 2005.
Atlantic Province PIRI Appendix 9: Co- author of the Atlantic Provinces Partnership for RBCA Implementation (PIRI) Guidance for Soil Vapor and Indoor Air Monitoring Assessments (http://www.atlanticrbca.com/eng/soil_vapor_guidance.html), July, 2006.
Soil Vapor Intrusion Guidance for Health Canada Screening Level Risk Assessment: Invited peer technical reviewer (http://www.hc-sc.gc.ca/ewh-semt/contamsite/res/proj_pubs_journal_e.html), 2007.
ITRC Vapor Intrusion Guidance: Awarded the 2006 Industry Recognition Award for contribution to the Interstate Technical and Regulatory Council (ITRC) document Vapor Intrusion Pathway: A Practical Guideline (http://www.itrcweb.org/Documents/VI-1.pdf), January, 2007.
Ontario Ministry of Environment Rationale for the Development of Generic Soil and Groundwater Standards for Use at Contaminated Sites in Ontario: Paid Peer technical reviewer of 2007 draft (http://www.ebr.gov.on.ca/ERS-WEB-External/displaynoticecontent.do?noticeId=MTAwMTU1&statusId=MTQ5NTc1)
Canadian Council of Ministers of the Environment: primary author of “Scoping Assessment of Soil Vapor Monitoring Protocols for Evaluating Subsurface Vapor Intrusion to Indoor Air”, July, 2008 http://www.ccme.ca/assets/pdf/pn_1427_vapor_scoping1.pdf
Ontario Ministry of Environment Paid Peer Reviewer of draft Vapor Intrusion Guidance, 2009.
United Kingdom Construction Industry Research and Information Association (CIRIA): Invited Peer Reviewer of “The VOCs Handbook: Investigating, assessing & managing risks from inhalation of Volatile Organic Compounds (VOCs) at land affected by contamination”, (available
Curriculum Vitæ of Todd Arthur McAlary, Ph.D., P.Eng., P.G., CUT
25
online at: http://www.tsoshop.co.uk/bookstore.asp?FO=1160526&Action=Book&ProductID=9780860176855&From=Subject) June, 2009.
US Navy SPAWAR Systems: Primary author of “Review of Best Practices, Knowledge and Data Gaps, and Research Opportunities for the US Department of Navy Vapor Intrusion Focus Areas, Performance Work Statement RO13”, 2009. http://www.spawar.navy.mil/sti/publications/pubs/tr/1982/tr1982cond.pdf
UK Energy Institute: Primary Author of “Introductory Guidance on Petroleum Hydrocarbon Soil Vapor Assessment, available on-line at: www.energyinstpubs.org.uk/cgi-bin/download/download.cgi?articleid=1711&sessionid=1313682614&code=KJVGGOBG and Primary Author of “Soil Vapor Protocol for Assessing Hydrocarbon Sites in the United Kingdom, available online at: http://publishing.energyinst.org/publication/ei-technical-publications/environment/refinery-emissions/soil-vapor-protocol-for-assessing-hydrocarbon-sites-in-the-united-kingdom
4.3 Invited Presentations and Seminars
McAlary, T. Passive Sampling for Vapor Intrusion, and invited webinar for SERDP/ESTCP, January 14, 2016. https://www.serdp-estcp.org/Tools-and-Training/Webinar-Series/01-14-2016
McAlary, T. Managing Spatial and Temporal Variability with Volume and Time-Weighted Average Sampling for Vapor Intrusion Assessments, invited presentation at the Tri-Services Environmental Risk Assessment Workgroup meeting, San Antonio Texas, January 12, 2016.
McAlary, T. and M. Vanderkooy. Detecting Small Pipeline Leaks via Vapors, Sensors and Plants, an invited presentation at the Pipeline Research Council International Research Exchange Meeting, Sand Ramon California, February 4, 2015.
McAlary, T. Vapor Transport, Characterization and Mitigation – How to resolve a vapor intrusion concern without holding your breath, invited keynote address at the Wisconsin Groundwater Association Annual Conference, Madison, WI, March 13, 2015.
McAlary, T. ESTCP Research on Optimization of Vapor Intrusion Mitigation Systems in Large Military Buildings, invited platform presentation at the EPA Workshop on Vapor Intrusion at the AEHS Soils and Sediments Conference, San Diego, March, 23, 2015.
McAlary, T. and H. Dawson, Advances in Vapor Intrusion Characterization and Mitigation, invited presentation at the Joint Alternative Restoration Technology Team and Optimization Workgroups Meeting of the U.S. DOD, Jacksonville, FL, April 23, 2015.
McAlary, T., Passive Sampling Demonstration/Validation for Vapor Intrusion Assessments, invited presentation at the National Environmental Monitoring Conference, Chicago, IL, July 16, 2015.
McAlary, T., Applied Research on Vapor Intrusion Assessment and Mitigation, invited presentation at the Midwestern States Environmental Consultants Association Quarterly Meeting, Indianapolis, IN, August 18, 2015.
Curriculum Vitæ of Todd Arthur McAlary, Ph.D., P.Eng., P.G., CUT
26
Vanderkooy, M. and T. McAlary, 2014. Remote Sensing of Small Liquid Hydrocarbon Leaks – Model Simulations and Interpretation of Options, invited plaform presentation at the Petroleum Research Council International annual conference, Atlanta, GA., Feb. 6, 2014.
McAlary, T. ESTCP Research for Improving the Effectiveness, Efficiency and Sustainability of Mitigation, invited presentation at the US EPA Workshop on Vapor Intrusion at the AEHS Conference, San Diego, CA, March 18, 2014.
McAlary, T. and M. Vanderkooy, Remote Sensing of Small Liquid Hydrocarbon Leaks – Model Simulations and Interpretation of Options, invited presentation at the API Pipeline Conference and Cybernetics Symposium, San Antonio, TX, April 10, 2014.
McAlary, T. Environmental Applications of Devices and Sensors, invited presentation at the Ontario Centres of Excellence Research Partnering Event, University of Waterloo, Waterloo, Ontario, June 18, 2014.
McAlary, T. and R. Ettinger, 2013. Finding Small Leaks of Liquid Hydrocarbons from Pipelines: Conceptualization, Expected Conditions and Sensing Opportunities, invited platform presentation at the Petroleum Research Council International annual conference, Atlanta, GA., Feb. 4, 2013.
McAlary, T., H. Groenevelt, J. Rosen and D. Kuntz, 2013. Spatial and Temporal Variability: Order Statistics for Indoor Air Concentrations from 2 Sites with Large Data Sets, invited platform presentation at the EPA Workshop on Vapor Intrusion at the AEHS Soils and Sediments Conference, San Diego, March, 18, 2013.
McAlary, T., Vapor Intrusion Challenges and Solutions Specific to MGP Sites, invited presentation at the Utilities Solid Waste Activities Group Remediation and Response Committee meeting, Washington, DC, April 23, 2013.
McAlary, T., R.Ettinger, S. Welt, J. Kurtz, D. Folkes, and W. Wertz, 2013. Update on the USEPA OSWER Guidance for Vapor Intrusion, invited presentation at the University Consortium for Field-Focused Groundwater Contamination Research Program for Annual Progress Meeting: May 30&31, 2013, Guelph, Ontario.
McAlary, T., 2013. Quantitative Passive Diffusive Sampling for Assessing Soil Vapor Intrusion to Indoor Air, invited presentation at the SERDP and ESTCP Vapor Intrusion Seminar and Workshop, Tempe, AZ, December 19, 2013.
McAlary, T., 2013. Overview of ESTCP 13 EB-ER1-015 Demonstration/Validation of More Cost-Effective Methods for Mitigating Radon and VOC Subsurface Vapor Intrusion to Indoor Air, invited presentation at the SERDP and ESTCP Vapor Intrusion Seminar and Workshop, Tempe, AZ, December 19, 2013.
McAlary, T., 2012. Quantitative Passive Diffusive Sampling for Assessing Soil Vapor Intrusion to Indoor Air, invited presentation at the Environmental Monitoring and Data Quality Workshop, La Jolla California, March 28, 2012.
Curriculum Vitæ of Todd Arthur McAlary, Ph.D., P.Eng., P.G., CUT
27
McAlary, T., Groenevelt, H., Gorecki, T., Seethapathy, S., Crump, D., Sacco, P., Hayes, H., Tuday, M., Schumacher, B., and P. Johnson, 2012. Quantitative Passive Diffusive Sampling for Assessing Soil Vapor Intrusion to Indoor Air, invited presentation at the USEPA workshop on vapor intrusion at the AEHS Soils and Sediments Conference, San Diego, March 20, 2012.
McAlary, T. Groenevelt, H., Gorecki, T., Seethapathy, S., Sacco, P., Crump, D., Schumaker, B., Tuday, M., Hayes, H., and P. Johnson, 2012. Quantitative Passive Diffusive Sampling for Assessing Soil Vapor Intrusion to Indoor Air, invited presentation and proceedings paper at the Air and Waste Management Association’s Air Quality Measurement Methods and Technology conference April 24 – 26, 2012 in Durham, North Carolina.
McAlary, T., Bertrand, D., Nicholson and R. Ettinger, 2012. A Case Study on the Influence of Aerobic Biodegradation on Vapor Intrusion at a Former Refinery Property, invited presentation at the SIDSA Conference, Milan, Italy, June 26-29.
McAlary, T., Groenevelt, H. and T. Gorecki, 2012. Status of the Waterloo Membrane Sampler for VOC Vapor Sampling, invited presentation at the University Consortium for Field-Focused Groundwater Contamination Research Program, June 12-14, Guelph, Ontario.
McAlary, T., Nicholson, P., Groenevelt, H., Wang, X., Unger, A., Seethapathy, S. and T. Gorecki, 2012. Quantitative Passive Soil Vapor Sampling for VOCs, invited presentation at the National Environmental Monitoring Conference, Washington, D.C., August 7, 2012.
McAlary, T., Bertrand, D., Nicholson, P., Wadley, S., Rowlands, D. Thrupp, G. and R. Ettinger, 2011. Pneumatic Testing, Mathematical Modeling and Flux Testing to Assess and Optimize the Performance and Establish Termination Criteria for Sub-Slab Depressurization Systems, invited presentation at the EPA Workshop on Vapor Intrusion at the AEHS Soils and Sediment Conference, San Diego, CA, March 2011.
McAlary, T., Groenevelt, H., Seethapathy, S., and T. Gorecki, 2011. Recent Advances in Techniques for Measuring Soil Vapor Concentrations, invited presentation at the University Consortium for Field Focused Groundwater Research meeting, Guelph, ON, June, 2011.
McAlary, T., 2011. Overcoming the Challenges of Vapor Intrusion Assessment and Mitigation, invited presentation at the first International Sites and Spills Conference, Nov. 4 & 5 2011, Toronto, Canada.
McAlary, T., 2011. Keys to Vapor Intrusion Assessment and Mitigation – Specifically for the Florida Brownfields Market, invited presentation, Florida Brownfileds Conference, Orlando, Florida, November 16, 2011.
McAlary, T., 2011. Development of More Cost-Effective Methods for Long-Term Monitoring of Subsurface Vapor Intrusion to Indoor Air Using Quantitative Passive Diffusive-Adsorptive Sampling Techniques, invited presentation at the specialty side meeting on vapor intrusion at the ESTCP/SERDP Partners Conference, 30 November 2011, Washington, D.C.
McAlary, T., H. Groenevelt, T. Gorecki, S. Seethapathy, P. Sacco, D. Crump, M. Tuday, B. Schumacher, J. Nocerico, H. Hayes and P. Johnson, 2010. Quantitative Passive Diffusive-
Curriculum Vitæ of Todd Arthur McAlary, Ph.D., P.Eng., P.G., CUT
28
Adsorptive Sampling Techniques for Vapor Intrusion Assessment, invited poster at the ESTCP/SERDP Partners Conference, December 2, 2010, Washington, D.C.
McAlary, T., 2010. Think Outside the Summa: Time Weighted Average and Volume Averaged Sampling to Manage Temporal and Spatial Variability in Vapor Intrusion Assessment Data, invited platform presentation at the Vapor Intrusion Technical Session, ESTCP/SERDP Partners’ Conference, Washington, D.C., December 1, 2010.
McAlary, T., 2010. Quantitative Passive Diffusive-Adsorptive Sampling Techniques for Vapor Intrusion Assessment, an invited presentation at the Ai and Waste Management Association Specialty Conference on Vapor Intrusion, Chicago, September 30, 2010.
McAlary, T., 2010. Development of More Cost-Effective Methods for Long-Term Monitoring of Soil Vapor Intrusion to Indoor Air using Quantitative Passive Sampling Techniques, an invited presentation at the SERDP/ESTCP Technical Exchange Meeting on Vapor Intrusion, Salt Lake City, August 10, 2010.
McAlary, T., H. Groenevelt, H. Hayes, S. Seethapathy and T. Gorecki, 2010. Recent Developments, Applications and Commercialization of the Waterloo Membrane Sampler™. Invited Presentation at the University Consortium for Field-Focused Groundwater Contamination Research Program for Annual Progress Meeting: May 19-21, 2010, Guelph, Ontario
McAlary, T., 2010. New Methods for Vapor Intrusion Assessment to Minimize Variability, Maximize Value and Optimize Mitigation in One Step, an invited platform presentation at the 2010 Air Force Restoration and Technology Transfer Workshop, San Antonio, April 9, 2010.
McAlary, T. and P. Johnson, 2010. Vapor Intrusion Pathway Assessment – Challenges, Developments and On-Going Research, an invited platform presentation at the 2010 Air Force Restoration and Technology Transfer Workshop, San Antonio, April 9, 2010.
McAlary, T.A., R. Ettinger and P. Johnson, 2010. Cutting Edge Vapor Intrusion Research, an invited platform presentation at the EPA Workshop on Vapor Intrusion at the AEHS Conference on Contaminated Soils and Sediments, San Diego, March 16, 2010.
McAlary, T.A., W.Wertz and L. Siegel, 2010. Multiple Lines of Evidence for Assessing Vapor Intrusion, an invited platform presentation at the EPA Workshop on Vapor Intrusion at the AEHS Conference on Contaminated Soils and Sediments, San Diego, March 16, 2010.
McAlary, T.A., 2009. Development of More Cost-Effective Methods for Long-Term Monitoring of Soil Vapor Intrusion to Indoor Air Using Quantitative Passive Diffusive-Adsorptive Sampling Techniques, ESTCP Project #08EB-ER3-036, an invited presentation at the Environmental Data Quality Workgroup Meeting At the ESTCP/SERDP Partners Conference, December 2, 2009, Washington, D.C.
McAlary, T.A., 2009. Development of More Cost-Effective Methods for Long-Term Monitoring of Soil Vapor Intrusion to Indoor Air Using Quantitative Passive Diffusive-Adsorptive Sampling
Curriculum Vitæ of Todd Arthur McAlary, Ph.D., P.Eng., P.G., CUT
29
Techniques, ESTCP Project #08EB-ER3-036, Invited Presentation at the Federal Remediation Technologies Roundtable, November 10, 2009.
McAlary, T.A., 2009. Current Challenges and New Directions for Vapor Intrusion Assessment and Management, Invited Presentation at the RTM Conference on Sustainable Property Transactions: Reconfiguring the Business of Contaminated Site Redevelopments, San Francisco, October 30, 2009.
McAlary, T.A., R. Ettinger, P. Johnson, B. Eklund, H. Hayes, T. Shields, B. Chadwick and I. Rivera, 2009. A Review for the U.S. Navy of Best Practices, Knowledge and Data Gaps and Research Directions for Vapor Intrusion, invited presentation at the DOD Environment, Energy and Sustainability Symposium, Denver, May 2009.
McAlary, T.A., R. Ettinger, P. Johnson, B. Eklund, H. Hayes, T. Shields, B. Chadwick and I. Rivera, 2009. A Review for the U.S. Navy of Best Practices, Knowledge and Data Gaps and Research Directions for Vapor Intrusion, invited presentation at the DoD Environmental Monitoring and Data Quality Workshop, San Antonio, TX, April 2009.
McAlary, T., 2010. PDMS Membrane Samplers for Quantitative Passive Sampling of Subsurface Vapor Intrusion to Indoor Air, an invited presentation at the Air and Waste Management Association Specialty Conference on Vapor Intrusion, San Diego, January 27-30, 2009.
McAlary, T.A., 2008. Guidance, Guidance Everywhere, but What Does it all Mean? invited presentation at the Air and Waste Management’s Specialty Conference on Vapor Intrusion, Toronto, September, 2008.
Groenevelt, H.G. and T. McAlary, 2008. Quantitative Passive Sampling for Vapor Intrusion Studies, invited presentation at the Air and Waste Management’s Specialty Conference on Vapor Intrusion, Toronto, September, 2008.
McAlary, T.A., 2008. Lessons From Petroleum Hydrocarbon and Chlorinated Solvent Sites Extensively Monitored for Vapor Intrusion, invited presentation at the USEPA Workshop on Vapor Intrusion at the AEHS Conference on Contaminated Soils and Sediments, San Diego, March, 2008.
McAlary, T.A., 2008. Planning Soil Vapor Intrusion Investigations Based on Various Conceptual Models – Understanding the Processes and Mechanisms to Design an Efficient and Effective Characterization Program, invited presentation at the AFCEE Technology Transfer Workshop, March 25-28, 2008, San Antonio, TX.
McAlary, T.A., 2008. Current Directions and Research Trends for Vapor Intrusion, invited presentation at the University Consortium for Field-Focused Groundwater Research semi annual meeting, May 6, 2008, Hockley Valley.
McAlary, T.A., 2008. Screening and Evaluating Sites for Vapor Intrusion During Property Transactions, invited presentation at the RTM Symposium on Contaminated Property Transactions, April 4, 2008, Philadelphia.
Curriculum Vitæ of Todd Arthur McAlary, Ph.D., P.Eng., P.G., CUT
30
McAlary, T., P. Nicholson, D. Bertrand, L. Abreu, and R. Ettinger, 2007. A Case Study on the Influence of Aerobic Biodegradation on Vapor Intrusion at a Former Refinery Property, invited presentation at the Air and Waste Management Association’s Specialty Conference on Vapor Intrusion, Providence, RI, September 27, 2007.
McAlary, T. and E. McNally, 2007. Vapor Intrusion: Technical Issues and Updates, invited presentation at the New Jersey Water Environment Association and New Jersey Department of Environmental Protection Seminar “Ground Water 2007”, East Windsor, New Jersey, June 5, 2007.
McAlary, T. and K. Berry-Spark, 2007. Screening and Evaluating Sites for Vapor Intrusion During Contaminated Property Transactions, invited presentation at RTM Symposium on Contaminated Property Transactions – Mitigating the Risks of Redevelopment, April 13, 2007, Washington, D.C.
McAlary, T. 2006. Sources of Variability in Soil Gas Data, an invited presentation at the University Consortium for Field-Focused Groundwater Research, Denver, November 2006.
McAlary, T. 2006. Conceptual Models of Vapor Intrusion, an invited presentation at the University Consortium for Field-Focused Groundwater Research, Denver, November 2006.
McAlary, T., 2006. Screening and Evaluating Sites for Vapor Intrusion During Contaminated Property Transactions, invited presentation at the RTM Symposium on Contaminated Property Transaction – Navigating the Complex Deals, San Francisco, October 20, 2006.
McAlary, T., 2006, “Recommended Soil Gas Sampling Techniques for Vapor Intrusion Investigations,” invited presentation at the Air and Waste Management Association Specialty Conference on Vapor Intrusion, Los Angeles, September 2006.
McAlary, T., 2006, “Soil Gas Sampling Methods,” invited platform presentation at the Midwestern States Risk Assessment Symposium, Indianapolis, IN, August, 2006.
McAlary, T., 2006. Screening and Evaluating Sites for Vapor Intrusion During Contaminated Property Transactions, invited presentation at the RTM Webinar on Vapor Intrusion – Deals and Due Diligence, November 29, 2006.
McAlary, T. and R. Ettinger, 2006, “Modeling the Vapor Intrusion Pathway,” invited presentation at the Electric Power Research Institute Annual Meeting, Bar Harbor, Maine, June 22, 2006.
McAlary, T., 2006, “Sub-Slab Soil Gas Monitoring for Assessing Subsurface Vapor Intrusion to Indoor Air,” invited presentation at the Rutgers University Seminar on Vapor Intrusion, June 14, 2006.
McAlary, T.A., R.E. Ettinger, 2005, “A Practitioner’s Perspective on Vapor Intrusion,” invited Editorial in: Proceedings of the American Bar Association Joint Fall CL Meeting, San Francisco, CA, September, 2005.
Curriculum Vitæ of Todd Arthur McAlary, Ph.D., P.Eng., P.G., CUT
31
McAlary, T.A., and R.E. Ettinger, 2005, “Key Considerations for Vapor Intrusion Evaluations,” invited presentation at the American Bar Association Joint Fall CL Meeting, San Francisco, CA, September 17, 2005.
McAlary, T.A. and R. Ettinger, 2005, “Strategy for Assessment, Data Analysis, and Interpretation of Subsurface Vapor Intrusion,” invited presentation at Subsurface Vapor Intrusion to Indoor Air: An Update, The 14th Symposium in GRA's Series on Groundwater Contaminants, May 25, 2005, San Jose, CA.
McAlary, T.A., and R.E. Ettinger, 2004, “A Practitioner’s Perspective on Vapor Intrusion,” invited guest editorial, in “In the Air”, the newsletter of Air Toxics Limited, Volume 9, No. 1, 2004.
McAlary, T.A., 2004, “Measured Attenuation Coefficients for Soil Gas to Indoor Air, Runcorn, Cheshire, UK,” an invited presentation at the US EPA Vapor Intrusion Workshop held at the AEHS 14th Annual West Coast Conference on Soils, Sediment and Water, March 2004.
McAlary, T.A., K. Berry-Spark, T.A. Krug and J.M. Uruskyj, 2004, “The Fresh Water Lens and its Effects on Groundwater to Indoor Air Attenuation Coefficients,” an invited presentation at the US EPA Vapor Intrusion Workshop held at the AEHS 14th Annual West Coast Conference on Soils, Sediment and Water, San Diego, March 15-18, 2004.
McAlary, T.A., 2004, “Vapor Intrusion: Regulatory Drivers, Challenges, and Management Issues,” an invited presentation at the annual meeting of Remediation Project Managers of a major multi-national corporation, March 2004.
McAlary, T.A., 2003, “Federal Guidance on Vapor Intrusion, History and Status,” an invited presentation at the Vapor Intrusion Workshop, Annual General Meeting of EPRI, December 2003.
McAlary, T.A., 2003, “Conceptual Site Models of Vapor Intrusion,” an invited presentation at the Vapor Intrusion Workshop, Annual General Meeting of EPRI, December 2003.
McAlary, T.A., 2003, “Vapor Intrusion into Indoor Air, with a focus on New Jersey,” an invited presentation to the New Jersey Site Remediation Information Network, September 2003.
McAlary, T.A., 2003, “Empirical Experience Gathering Data to Assess Vapor Intrusion,” an invited presentation at the California Groundwater Resources Association seminar “Subsurface Vapor Intrusion to Indoor Air: When is Soil and Groundwater Contamination an Indoor Air Issue?” September 30 and October 1, 2003.
McAlary, T.A., 2003, “Strategies for the Site-Specific Assessment: How to Protect Yourself from the Hidden Traps,” an invited seminar at the Environmental Symposium on Indoor Air Pathway Evaluation for VOC Releases held by the Environmental Law Institute, San Francisco, June, 2003.
McAlary, T.A., 2003, “Impact of New Vapor Intrusion Guidance on Site Remediation,” an invited presentation at the annual meeting of a large, multi-national manufacturing corporation, June, 2003.
Curriculum Vitæ of Todd Arthur McAlary, Ph.D., P.Eng., P.G., CUT
32
McAlary, T.A., 2003, “Conceptual Site Models of Vapor Intrusion,” an invited presentation at the U.S. EPA Seminar on Indoor Air Vapor Intrusion, December 2002 in San Francisco, January 2003, Dallas, TX, and February 2003, Atlanta, GA.
McAlary, T.A., and R. Ettinger, 2003, “Key Considerations for Evaluating the Vapor Intrusion Pathway,” an invited presentation at the U.S. EPA Seminar on Indoor Air Vapor Intrusion, February 2003, Atlanta, GA.
McAlary, T.A., 2000, “The Pathway from Soil Gas to Indoor Air,” A presentation at the corporate meeting of Remediation Project Managers of a Major Multi-National Corporation, 27 April, 2000.
McAlary, T.A., L. MacKinnon and E. Hood, 2000, “In-Situ Chemical Oxidation with Permanganate,” A presentation at the corporate meeting of Remediation Project Managers of a Major Multi-National Corporation, 27 April, 2000.
McAlary, T.A. and R. Tossell, 2000, “Phytoremediation – An Overview of Applications, Capabilities and Limitations,” A presentation at the corporate meeting of Remediation Project Managers of a Major Multi-National Corporation, 27 April, 2000.
McAlary, T.A. and D. Major, 2000, “The Use of Nano-Scale Iron for In-Situ Remediation of DNAPLs,” A presentation at the corporate meeting of Remediation Project Managers of a Major Multi-National Corporation, 27 April, 2000.
4.4 Invited Lectures, Short Courses and Session Chairs
Lecturer for Laurentian Society of Environmental Toxicology and Chemistry (SETAC) short course on Vapor Intrusion, Burlington, April 16, 2015. Lecturer for the Air Force internal training session entitled: “Vapor Intrusion Training for the U.S. Air Force”, San Antonio TX, December 11, 2012. Session Chair for the Air and Waste Management Specialty Conference on Vapor Intrusion, Denver, CO, October 3 and 4, 2012. Lecturer for University course on Engineering and Geology presenting a guest lecture entitled “Site Reclamation”, University of Waterloo, July 23, 2012. Lecturer for the Environmental Monitoring and Data Quality Workshop, presenting a half-day workshop on vapor intrusion, La Jolla, CA, March 26, 2012. Lecturer for a 3-hour webinar training session on vapor intrusion for employees of Health Canada nationwide, February 29, 2012. Lecturer for the Environmental Safety and Environmental Health Conference of the US Department of Defense, presenting a 2-hour seminar entitled: “Vapor Intrusion Assessment and Mitigation Training for the US Department of Defense”, Denver, February 15, 2012. Instructor for the ITRC 2-day Vapor Intrusion Classroom Training in Detroit, MI (June 2011), San Antonio, TX (January, 2010), Norfolk, WV (March 2010), Oklahoma City, OK (April 2009),
Curriculum Vitæ of Todd Arthur McAlary, Ph.D., P.Eng., P.G., CUT
33
Portland OR (October, 2008), and San Francisco, CA (July 2008). Principal Lecturer for a 2.5-day short course on vapor intrusion presented to 75 members of the staff of the Ontario Ministry of the Environment, March 1-3 2011, Toronto.
Lecturer for a 1-day Short Course for the Australian Contaminated Land Consultants Association entitled Vapor Intrusion – International Perspectives and Lessons Learned in Sydney on August 25 and Melbourne on August 30, 2010.
Lecturer for a 2-day Short Course for the Swedish Environment Agency in Stockholm entitled Assessing and Managing Subsurface Vapor Intrusion to Indoor Air, June 10 and 11, 2010.
Lecturer for a 2-day Short Course for the Danish Regional Governments in Copenhagen entitled Assessing and Managing Subsurface Vapor Intrusion to Indoor Air, June 7 and 8, 2010.
Lecturer for full day training session on soil gas sampling methods for the California Department of Toxic Substances Control, Sacramento, CA, May 27, 2009. Lecturer for graduate course in Environmental Engineering at the University of Western Ontario, including 3 hour lecture and 2 hour hands-on exercise on vapor intrusion, Feb. 2009 and Mar. 2010. Lecturer for half-day short course on Soil Gas Sampling at the Vapor Intrusion Sampling for the Environmental Professional, sponsored by the Federation of Environmental Technologists and Wisconsin DNR Bureau of Remediation and Redevelopment, Milwaukee, WI, September 2008. Session Chair at the Air and Waste Management’s Specialty Conference on Vapor Intrusion: Learning from the Challenges, September 26-28, 2007, Providence, RI. Session Chair and Short-Course Instructor and the Air and Waste Management’s Specialty Conference on Vapor Intrusion, Los Angeles, CA, September 2006.
Soil Vapor Sampling Workshop Coordinator at the Midwestern States Risk Assessment Symposium Soil Vapor Sampling Workshop, Indianapolis, IN, August, 2006.
Instructor at the Rutgers University Vapor Intrusion Training Seminar, June 14, 2006, presenting a practical demonstration on sub-slab and soil gas sampling for assessing subsurface vapor intrusion to indoor air”.
Co-Instructor for a Short Course on “Managing Vapor Intrusion Sites” at the Battelle Conference on Remediation of Chlorinated and Recalcitrant Compounds, Monterrey, CA, May 2006.
Workshop Coordinator for the Aerospace Industry Association meeting in Salt Lake City, UT, February 2006.
Session Chair at the Air and Waste Management Association Specialty Conference on Vapor Intrusion, Philadelphia, PA, January, 2006 and Los Angeles, CA, September, 2006.
Panel Member at the American Bar Association Annual CL Meeting, San Francisco, CA, September, 2005.
Panel Member at the AEHS Vapor Intrusion Attenuation Workshop at the 15th Annual East Coast Conference on Soils, Sediments and Water, Amherst, MA, October 2005.

Curriculum Vitæ of Todd Arthur McAlary, Ph.D., P.Eng., P.G., CUT
34
Invited Panel Member at the AEHS Vapor Intrusion Attenuation Workshop at the 15th Annual West Coast Conference on Soils, Sediments and Water, San Diego, CA, March 2005.
Panel Member for AEHS Vapor Intrusion Attenuation Workshop at the 14th Annual West Coast Conference on Soils, Sediments and Water, San Diego, CA, March 2004.
Chairman of a two-day workshop on vapor intrusion at the Electrical Power Research Institute’s annual general meeting, Jupiter Beach FL, December 2003.
Panel Member for two seminars held by the California Groundwater Resources Association, entitled: “Subsurface Vapor Intrusion to Indoor Air: When is Soil and Groundwater Contamination and Indoor Air Issue?”, San Jose and Long Beach, CA, September and October 2003.
Steering Committee Member for the EPA seminar series introducing the OSWER Vapor Intrusion Guidance, San Francisco, CA, December 2002, Dallas, TX, January, 2002, and Atlanta, GA, February, 2003.
Author and Presenter of two on-line training seminars on subsurface vapor intrusion through the Environmental Institute for Continuing Education: “Evaluating Subsurface Vapor Intrusion into Buildings”, June, 2001 and “Case Studies of Subsurface Vapor Intrusion Into Buildings”, Jan., 2003.
Invited Lecturer for a 3-day Short Course “Technologies for Remediation of Volatile Organic Compounds in Groundwater,” at the Politechnico di Torino in Italy, covering Bioremediation, Permeable Reactive Barriers, Phytoremediation, In-Situ Oxidation, Monitored Natural Attenuation and Bioaugmentation, 15-17 January, 2001.
Course Instructor for the RTDF course on Accelerated Bioremediation, contributing specifically in the design and modeling of in-situ mixing systems.
4.5 Conference Presentations, Posters and Abstracts
Creamer, T., D. Larson and T McAlary, 2010. “Urban Infrastructure and the Challenges Posed for Assessing and Mitigating Vapor Intrusion Adjacent to a Former Dry Cleaner: A Case Study”, platform presentation at the Air & Waste Management Association - Vapor Intrusion 2010, Chicago, IL, September 2010.
Bertrand, D., H. Groenevelt, J. Lanzon, W. Bingham and T. McAlary, 2010. Passive (Wind-Driven) Systems for Sub-slab Venting to Mitigate Potential Vapor Intrusion, platform presentation and proceedings paper in Proceedings of the 7th Conference on Remediation of Chlorinated and Recalcitrant Compounds, Monterey, CA, May 25, 2010.
Nicholson, P., D. Bertrand and T. McAlary, 2010. High Purge Volume Tests for Managing Variability in Sub-Slab Soil Gas, poster and proceedings paper in Proceedings of the 7th Conference on Remediation of Chlorinated and Recalcitrant Compounds, Monterey, CA, May 25, 2010.
Groenevelt, H., T. McAlary, S. Seethapathy, T. Gorecki, and H.Hayes, 2010. A New Quantitative Passive Sampler for Vapor Intrusion Assessment: the Waterloo Membrane Sampler™, platform
Curriculum Vitæ of Todd Arthur McAlary, Ph.D., P.Eng., P.G., CUT
35
presentation and proceedings paper in Proceedings of the 7th Conference on Remediation of Chlorinated and Recalcitrant Compounds, Monterey, CA, May 25, 2010.
Groenevelt, H., T. McAlary, B. Chadwick, and I. Rivera, 2010. Quantitative Passive Samplers for Indoor and Outdoor Air Monitoring of VOCs During Vapor Intrusion Investigations, poster presented at the 7th Conference on Remediation of Chlorinated and Recalcitrant Compounds, Monterey, CA, May 25, 2010.
McAlary, T., H. Groenevelt, T. Gorecki, S. Seethapathy, P. Sacco, D. Crump, M. Tuday, B. Schumacher, J. Nocerico, H. Hayes and P. Johnson, 2010. Quantitative Passive Diffusive-Adsorptive Sampling Techniques for Vapor Intrusion Assessment, poster presented at the 7th Conference on Remediation of Chlorinated and Recalcitrant Compounds, Monterey, CA, May 25, 2010.
Groenevelt, H. and T. McAlary, 2010. Quantitative Passive Diffusive-Adsorptive Sampling Techniques for Vapor Intrusion Assessment, ESTCP Project 08 EB-EBR-036, a presentation at the DOD Environmental Monitoring and Data Quality Workshop, Louisville, KT, April 15, 2010.
McAlary, T, H. Groenevelt, T. Górecki, S. Seethapathy, and H. Hayes, 2010. PDMS Membrane Samplers for Quantitative Passive Monitoring of Soil Vapor Intrusion to Indoor Air, a platform presentation at North American Environmental Field Conference & Exposition, January 2010, Tampa, FL.
Michaelski. P., Thompson, S., DeWolf, C., Nicholson, P. and T. McAlary, 2010. Effects of Alternate Petroleum Hydrocarbon Sources in the Vadose Zone on the Vapor Intrusion Pathway beneath a Residential Community, in Proceedings of the Air and Waste Management Association Specialty Conference on Vapor Intrusion, Chicago, September 29, 2010.
McAlary, T., Groenevelt, H., Gorecki, T., Seethapathy, S., Crump, D., Sacco, P., Hayes, H., Tuday, M., Schumacher, B., Nocerino, J. and P. Johnson, 2010. Quantitative Passive Diffusive-Adsorptive Sampling for Vapor Intrusion Assessment, platform presentation and proceedings paper at the AWMA Specialty Conference – Vapor Intrusion 2010, Chicago, IL, September 30, 2010.
Majcher, E.H., P. Nicholson, D. Himmelheber, A. Krasnopoler, T. McAlary, and R. Ettinger, J. Harris and J. Wrobel, 2009. Implementation of a Strategic Approach for Complex VI Assessment at a Large Military Facility: CSM Development Through Field Investigation and Assessment, Poster presentation at the ESTCP/SERDP Partners Conference, December 2, 2009, Washington, D.C.
Groenevelt, H., P. Nicholson, D Bertrand, and T. McAlary, 2009. High Purge Volume Sampling: A New Paradigm for Sub-slab Soil Gas Monitoring, Platform presentation, 25th Annual International Conference on Soils, Sediments, Water & Energy, University of Massachusetts, October 2009, Amherst, MA.
de Haven, P., H. Groenevelt, P. Dollar and T. McAlary, 2008. Long-Term Monitoring to Assess the Potential for Vapor Intrusion with Particular Focus on Data Quality and Data Management,
Curriculum Vitæ of Todd Arthur McAlary, Ph.D., P.Eng., P.G., CUT
36
Poster presentation, Department of Defence, Environmental Monitoring & Data Quality Workshop, March 31 ¬-April 4, 2008, Atlanta, GA.
Creamer,T., R. Ettinger and T. McAlary, 2009. “Knowledge (from High Quality Data) is Power: Vapor Intrusion Site Conceptual Models Really Work.” The 19th Annual AEHS (Association for Environmental Health and Sciences) Meeting & West Coast Conference on Soils, Sediments and Water (San Diego, CA; March 2009)
McAlary, T. A., H. Groenevelt, T. Gorecki, S. Seethapathy and H. Hayes, 2009. PDMS Membrane Samplers for Quantitative Passive Monitoring of Soil Vapor to Indoor Air, in Proceedings of the Air and Waste Management Specialty Conference – Vapor Intrusion 2009, January 27 to 30, 2009, San Diego.
Abreu, L., R. Ettinger and T. McAlary, 2007. Application of 3D Numerical Modeling to Assess Vapor Intrusion Screening Criteria for Petroleum Hydrocarbon Sites. Platform Presentation at the Air and Waste Management Association’s Specialty Conference on Vapor Intrusion, Providence, RI, September 26, 2007.
Nicholson, P., D. Bertrand, and T. McAlary, 2007. Soil Gas Sampling in Low-Permeability Materials. Platform Presentation at the Air and Waste Management Association’s Specialty Conference on Vapor Intrusion, Providence, RI, September 28, 2007.
Abreu, L., R. Ettinger and T. McAlary, 2007. Application of 3D Numerical Modeling to Assess Vapor Intrusion Screening Criteria for Petroleum Hydrocarbon Sites. Platform presentation at the AEHS Conference on Contaminated Soils and Sediments, San Diego, March, 2007
Luo, H., P. Dahlen, P. Johnson, T. Creamer, T. Peargin, P. Lundegard, B. Hartman, L. Abreu and T. McAlary, 2006, “Spatial and Temporal Variability in Hydrocarbon and Oxygen Concentrations Beneath a Building Above a Shallow NAPL Source,” Platform Presentation at the Battelle Conference on Remediation of Chlorinated and Recalcitrant Compounds, Monterrey CA, May 2006.
Creamer, T., and T. McAlary, 2006, “The Effects of Purge Rate and Volume on Sub-slab Soil Gas Samples,” A Platform Presentation at the Battelle Conference on Remediation of Chlorinated and Recalcitrant Compounds, Monterrey CA, May 2006.
McAlary, T., 2006, “Beyond Screening – The Site Characterization Process,” A talk at the Vapor Intrusion Short course “Managing Vapor Intrusion Sites” at the Battelle Conference on Remediation of Chlorinated and Recalcitrant Compounds, Monterrey, CA, May 2006.
McAlary, T., 2006, “Regulatory Perspectives on Vapor Intrusion,” a talk at the Vapor Intrusion Short course “Managing Vapor Intrusion Sites” at the Battelle Conference on Remediation of Chlorinated and Recalcitrant Compounds, Monterrey, CA, May 2006.
Abreu, L., P. Johnson, and T. McAlary. 3D Model Simulations and Implications to Near Building Sampling. Presented at 16th Annual AEHS (Association for Environmental Health and Sciences) Meeting & West Coast Conference on Soils, Sediments and Water, March 2006. San Diego, CA.
Curriculum Vitæ of Todd Arthur McAlary, Ph.D., P.Eng., P.G., CUT
37
McAlary, T.A., R.E. Ettinger, and K. Berry-Spark, 2006, “Practical Considerations for Vapor Intrusion Investigations,” and Extended Abstract in: Proceedings of the Air and Waste Management Association Specialty Conference on Vapor Intrusion, Philadelphia, January 2006.
McAlary, T.A., R.E. Ettinger, and K. Berry-Spark, 2006, “Practical Considerations for Vapor Intrusion Investigations,” a Platform Presentation in: Proceedings of the Air and Waste Management Association Specialty Conference on Vapor Intrusion, Philadelphia, January 2006.
Ettinger, R.A. and T. McAlary, 2005. Site-Specific Vapor Intrusion Evaluation Including Biodegradation. Battelle In-Situ and On-Site Bioremediation Symposium, Baltimore, Maryland. June 6 – 9, 2005.
Berry-Spark, K., T. McAlary, N. Bice and P. Zeeb, 2005, “Mitigation of the Vapor Intrusion Pathway at Four Chlorinated Solvent Sites,” in Subsurface Vapor Intrusion to Indoor Air: An Update. The 14th Symposium in GRA's Series on Groundwater Contaminants, May 25, 2005, San Jose, CA.
McAlary, T.A., 2005, “Examples of Data Collection Strategies and Methods,” 14th Annual West Coast Conference on Soils, Sediments, and Water – The Association for Environmental Health and Sciences, March 15-18, San Diego, CA.
McAlary, T.A., and H. Dawson, 2005, “How to Determine, Interpret, and Resolve Background Contributions from Indoor Air Data,” 14th Annual West Coast Conference on Soils, Sediments, and Water – The Association for Environmental Health and Sciences, March 15-18, San Diego, CA.
McAlary, T.A., 2004, “Future Directions for Assessing Vapor Intrusion,” Panel Member Presentation at the AEHS 20th Annual International Conference on Soils, Sediments and Water, Modeling Vapor Attenuation Workshop: A Study of Vapor Intrusion Modeling in the Context of EPA’s Guidance, Amherst, MA, October 18-21, 2004.
Berry-Spark, K., T. McAlary, N. Bice and M. DeFlaun, “Empirical and Modeled Alpha Factors at Two Vapor Intrusion Sites,” Platform presentation at the AEHS 20th Annual International Conference on Soils, Sediments and Water, Modeling Vapor Attenuation Workshop: A Study of Vapor Intrusion Modeling in the Context of EPA’s Guidance, Amherst, MA, October 18-21, 2004.
McAlary, T.A., D. Mickunas and G. Plantz, 2004, “Approaches and Methods Influencing Observational Data,” Platform Presentation at the AEHS Annual Conference on Soils, Sediments and Water, Modeling Vapor Attenuation Workshop: A Study of Vapor Intrusion Modeling in the Context of EPA’s Guidance, Amherst, MA, October 2004.
McAlary, T.A., 2004, “Vapor Intrusion: Regulatory Drivers and Technical Challenges,” Panel Member Presentation at the Florida Brownfields Conference, Sarasota, FL, October 2004.
McAlary, T.A., 2004, “Subsurface Vapor Intrusion, Challenges and Future Directions,” a presentation at Session WR1a: Advances in Indoor Air Vapor Intrusion: Guidance and
Curriculum Vitæ of Todd Arthur McAlary, Ph.D., P.Eng., P.G., CUT
38
Application at the Air and Waste Management Association’s Annual Conference, Indianapolis, June 23, 2004.
Berry-Spark, K., T. McAlary, M. DeFlaun, J. Finn, J. Lennon and C. Sweeney, 2004, “Vapor Intrusion at a Former Manufactured Gas Plant Site – Assessing Background Contributions to Indoor Air Quality,” a presentation at the Midwestern States Risk Assessment Symposium, Indianapolis, June 2004.
Berry-Spark, K., T. McAlary, N. Bice, M. DeFlaun, and P. Zeeb, 2004, “Risk Management Approaches at Vapor Intrusion Sites - Chlorinated Solvents Case Studies,” Platform presentation at the Fourth International Conference on Remediation of Chlorinated and Recalcitrant Compounds, Monterey, CA, May 24-27, 2004.
McAlary, T.A., P. Dollar, H. Groenevelt, R. Moss, and G. Wilkinson, 2004, “Subsurface Vapor Intrusion to Indoor Air, Effect of Phase Partitioning,” Abstract in the proceedings of Remediation of Chlorinated and Recalcitrant Compounds, Monterey, CA, May, 2004.
McAlary, T.A., P. Dollar, H. Groenevelt, P. DeHaven, J. Rosen, and R. Moss, 2004, “Calculated Vapor Attenuation Coefficients at the Weston Quarries Site, Runcorn, Cheshire, UK,” an abstract and data presented at the US EPA Vapor Intrusion Workshop held at the AEHS 14th Annual West Coast Conference on Soils, Sediment and Water, San Diego, March 15-18, 2004.
McAlary, T.A., 2004, “Empirical Data: Challenges and Future Directions,” closing address at the AEHS 14th Annual West Coast Conference on Soils, Sediment and Water, San Diego, March 15-18, 2004.
Berry-Spark, K., T.A. McAlary and N.T. Bice, 2004, “Empirical Alpha Factors at ‘Wet Basement’ Sites,” a presentation at the US EPA Vapor Intrusion Workshop held at the AEHS 14th Annual West Coast Conference on Soils, Sediments and Water - San Diego, March 15-18, 2004.
McAlary, T.A., P. Dollar, P. de Haven, R. Moss, G. Wilkinson, J. Llewellyn, and D. Crump, 2002, “Assessment of Subsurface Vapor Transport Through Triassic Sandstone and Quarry Fill into Indoor Air in Weston Village, Runcorn”, Platform Presentation, Indoor Air 2002, Monterey, CA, July 1-5, 2002.
McAlary, T.A., P. Dollar, R. Moss, and G. Wilkinson, 2002, “Vapor Intrusion: Comparison Between Triassic Sandstone and Unconsolidated Fill Using Field Data and Models,” a Poster at the Midwestern States Risk Assessment Symposium, Indianapolis, June 2002.
McAlary, T.A., P. Dollar, P. de Haven, R. Moss, G. Wilkinson, J. Llewellyn, and D. Crump, 2002, “Characterization of Vapor Transport in Fractured Rock,” Platform Presentation, Remediation of Chlorinated and Recalcitrant Compounds, Monterey, CA, May 20-23, 2002.
McAlary, T.A., P. Dollar, K. Berry-Spark, and T. Krug, 2002, “Management Decisions for Assessing Subsurface Vapor Intrusion into Indoor Air,” Poster Presentation, Remediation of Chlorinated and Recalcitrant Compounds, Monterey, CA, May 20-23, 2002.
Curriculum Vitæ of Todd Arthur McAlary, Ph.D., P.Eng., P.G., CUT
39
Berry-Spark, K, T.A. McAlary, P. Dollar, and T. Krug, 2002, “Intrusion of Subsurface Vapors into Buildings - Chlorinated Solvents Case Studies,” Poster Presentation, Remediation of Chlorinated and Recalcitrant Compounds Battelle Conference, Monterey, CA, May 20-23, 2002.
McAlary, T., J. Rosen, M. McMaster, D. Major, and E. Cox, 2002, “Designing Aqueous Amendment Delivery Systems for In-Situ Groundwater Remediation,” Poster Presentation, Remediation of Chlorinated and Recalcitrant Compounds, Monterey, CA, May 20-23, 2002.
Cox, E., R. Borch, T.A. McAlary and M. McMaster, 2002, “In Situ Bioremediation of Perchlorate: Comparison of Results from Multiple Field Demonstrations,” Platform Presentation, Remediation of Chlorinated and Recalcitrant Compounds, Monterey, CA, May 20-23, 2002.
McAlary, T.A., 2002, “Alpha Factors, Measured and Modeled: A Case Study,” A presentation at the RCRA National Meeting, 17 January, 2002, Washington, D.C.
McAlary, T.A., M. McMaster and J. Brasaemle, 2001, “Evidence of Intrinsic Degradation in a Carbonate Aquifer,” Poster presented at Fractured Rock 2001, Toronto, Canada, March, 2001.
McAlary, T.A., W. Waldrop and R. Ash, 2001, “Characterizing the Vertical Profile of Contaminant Concentration and Mass Flux in Groundwater Using the Electromagnetic Borehole Flowmeter and Depth-Discrete Sampling,” Poster presented at Fractured Rock 2001, Toronto, Canada, March 2001.
McAlary, T.A., P. Dollar, P. deHaven, H. Groenevelt, A. Lawrence, D. Crump and R. Moss, 2001, “Characterization of Subsurface Vapor Transport in Triassic Sandstone,” Poster presented at Fractured Rock 2001, Toronto, Canada, March, 2001.
McAlary, T.A., “A Case Study: Subsurface Vapor Migration into Indoor Air in the United Kingdom,” presented at the RCRA Corrective Action Environmental Indicator Forum, August 15-17, 2000, Washington, D.C.
McAlary, T.A. and P. Dollar, 2000, “Characterization of Vapor Transport in Fractured Rock,” Poster presented at Remediation of Chlorinated and Recalcitrant Compounds conference sponsored by Battelle, Monterey, CA, 22-25 May, 2000.
McAlary, T.A., D. Hendron, V. Batu, S. Simmons and P. de Haven, 2000, “TCE Remediation by Pump and Treat – A Rare Success Story,” Poster presented at “Remediation of Chlorinated and Recalcitrant Compounds” conference sponsored by Battelle, Monterey, CA, 22-25 May, 2000.
Krug, T. A., P. Dollar, T.A. McAlary and N. Davies, 2000, “Field-Scale Test of an Innovative PRB Passive Drain,” Platform presentation at Remediation of Chlorinated and Recalcitrant Compounds conference sponsored by Battelle, Monterey, CA, 22-25 May, 2000.
Cox, E., T.A. McAlary, J. Allan, L. Lehmicke, S. Neville and D.W. Major, “Cometabolic Bioventing of Chlorinated Solvents at a Former Waste Lagoon,” Remediation of Chlorinated and Recalcitrant Compounds, Volume 1, Battelle Press, Columbus, Ohio, Presented May 1998, Monterey, California.
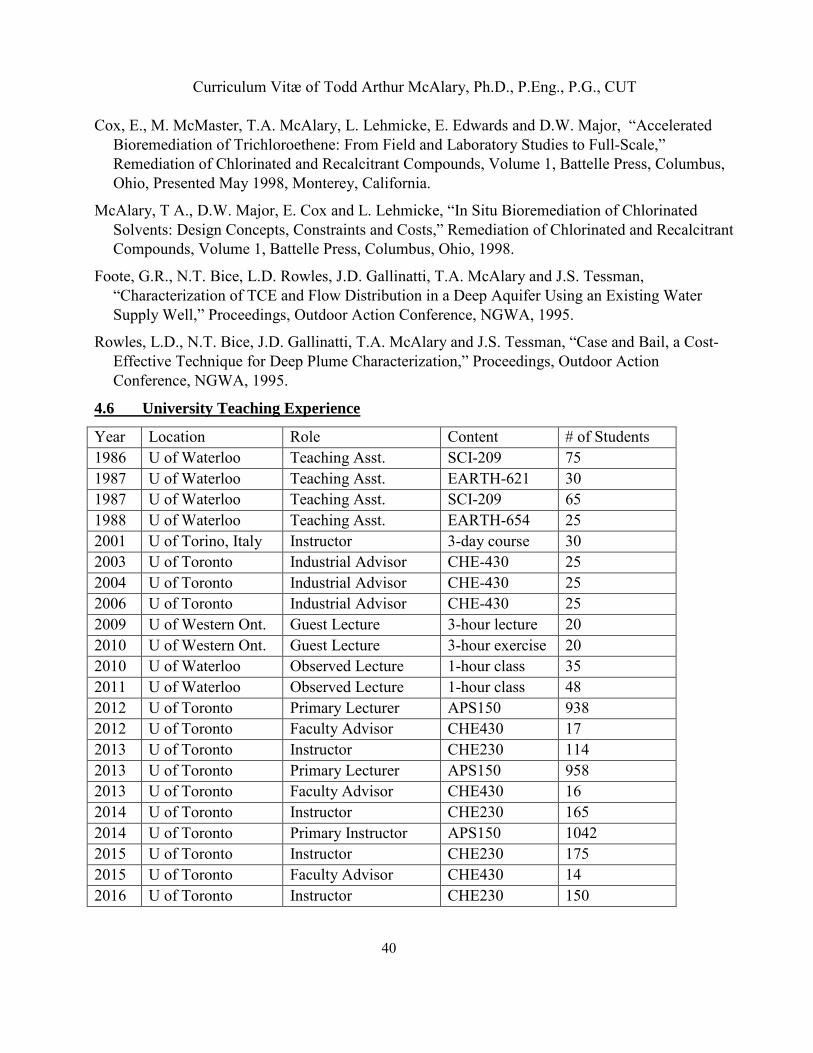
Curriculum Vitæ of Todd Arthur McAlary, Ph.D., P.Eng., P.G., CUT
40
Cox, E., M. McMaster, T.A. McAlary, L. Lehmicke, E. Edwards and D.W. Major, “Accelerated Bioremediation of Trichloroethene: From Field and Laboratory Studies to Full-Scale,” Remediation of Chlorinated and Recalcitrant Compounds, Volume 1, Battelle Press, Columbus, Ohio, Presented May 1998, Monterey, California.
McAlary, T A., D.W. Major, E. Cox and L. Lehmicke, “In Situ Bioremediation of Chlorinated Solvents: Design Concepts, Constraints and Costs,” Remediation of Chlorinated and Recalcitrant Compounds, Volume 1, Battelle Press, Columbus, Ohio, 1998.
Foote, G.R., N.T. Bice, L.D. Rowles, J.D. Gallinatti, T.A. McAlary and J.S. Tessman, “Characterization of TCE and Flow Distribution in a Deep Aquifer Using an Existing Water Supply Well,” Proceedings, Outdoor Action Conference, NGWA, 1995.
Rowles, L.D., N.T. Bice, J.D. Gallinatti, T.A. McAlary and J.S. Tessman, “Case and Bail, a Cost-Effective Technique for Deep Plume Characterization,” Proceedings, Outdoor Action Conference, NGWA, 1995.
4.6 University Teaching Experience
Year Location Role Content # of Students 1986 U of Waterloo Teaching Asst. SCI-209 75 1987 U of Waterloo Teaching Asst. EARTH-621 30 1987 U of Waterloo Teaching Asst. SCI-209 65 1988 U of Waterloo Teaching Asst. EARTH-654 25 2001 U of Torino, Italy Instructor 3-day course 30 2003 U of Toronto Industrial Advisor CHE-430 25 2004 U of Toronto Industrial Advisor CHE-430 25 2006 U of Toronto Industrial Advisor CHE-430 25 2009 U of Western Ont. Guest Lecture 3-hour lecture 20 2010 U of Western Ont. Guest Lecture 3-hour exercise 20 2010 U of Waterloo Observed Lecture 1-hour class 35 2011 U of Waterloo Observed Lecture 1-hour class 48 2012 U of Toronto Primary Lecturer APS150 938 2012 U of Toronto Faculty Advisor CHE430 17 2013 U of Toronto Instructor CHE230 114 2013 U of Toronto Primary Lecturer APS150 958 2013 U of Toronto Faculty Advisor CHE430 16 2014 U of Toronto Instructor CHE230 165 2014 U of Toronto Primary Instructor APS150 1042 2015 U of Toronto Instructor CHE230 175 2015 U of Toronto Faculty Advisor CHE430 14 2016 U of Toronto Instructor CHE230 150
________________________________________________________________________________ Page 1 of 12
SCOTT R. DREW, L.S.R.P. remediation technology selection and design site investigation vapor intrusion investigation environmental chemistry
EDUCATION
Graduate Studies, Chemistry, Northeastern University, Boston, Massachusetts, 1984-1986 B.S., Environmental Sciences, University of Massachusetts, Amherst, Massachusetts, 1977
REGISTRATIONS AND CERTIFICATIONS
New Jersey Licensed Site Remediation Professional (LSRP), No. 576317
CAREER SUMMARY
Scott Drew has over 36 years of experience in the fields of environmental technology, site investigation and remediation, and environmental chemistry. He is currently managing projects evaluating the release of chlorinated pesticides to the subsurface from a formulations facility and using of aerobic biostimulation for groundwater treatment in a karst formation. His past experience includes projects employing anaerobic bioaugmentation in a fractured bedrock system; the field demonstration of innovative approaches for the in situ biodegradation of the gasoline oxygenates MTBE and TBA, and the design of sampling and analytical methodologies for the Habitability Study of Love Canal. His experience also includes the evaluation and remediation of wastes associated with former manufactured gas plants, chemical and pharmaceutical production facilities, and plants that produced military ordnance. In addition, he has managed projects using biofiltration technology for the treatment of odors and chemical vapors, and bioreactors for the treatment of water containing organic and inorganic compounds, including manufactured gas plant wastes and ammonium perchlorate.
Mr. Drew serves as a member of several New Jersey Department of Environmental Protection Stakeholders Committees. He was a member of the committee that wrote the NJDEP Vapor Intrusion Technical Guidance (versions 2, 3, and 3.1) and is a frequent speaker on the application of the guidance. He is currently a member of the committee that developed technical guidance for the Evaluation of the Discharge of Contaminated Groundwater to Surface Water. He was also selected for the NJDEP Stakeholders committee for the re-authorization of the Remediation Standards Rule (N.J.A.C 7:26D). He is currently a member of the Executive Committee of the Board of Trustees of the Licensed Site Remediation Professionals Association (LSRPA), and serves as co-Chair
Scott R. Drew, L.S.R.P.
Page 2 of 12
of the Regulatory Outreach Committee.
Mr. Drew has designed and executed numerous bench scale and field pilot scale treatability studies for remediation technologies and has managed subsequent scale-up projects. He has served as project manager for monitored natural attenuation studies, including the review and interpretation of site data, design of microcosm studies, the selection of field parameters, and the collection and analysis of field data. He has reviewed data from numerous sites, screened remediation technologies, and developed conceptual remediation plans. In addition, he has directed commercialization teams for innovative environmental technologies, matching the technical capabilities and performance of technologies with client requirements. As a chemist, he has developed analytical procedures, written Quality Assurance Project Plans, performed forensic evaluations, and conducted data audits.
REPRESENTATIVE EXPERIENCE
Licensed Site Remediation Professional
Remediation of an Active Chemical Manufacturing Facility, Confidential Client, New Jersey. Currently serving as the LSRP for this active plant site in northern New Jersey. Issues at the site include delineation of contaminants of concern in soil and groundwater, vapor intrusion, and the removal and treatment of sediment containing polychlorinated biphenyls (PCBs), chlorinated VOCs, mercury, and lead. The remedy selection process has included both technical and regulatory evaluations, as the remedial approach requires compliance with TSCA, RCRA, and NJDEP regulations.
Remediation of a Former Chemical Manufacturing Plant, Confidential Client, New Jersey. LSRP for this inactive site in New Jersey. In June 2010, the person responsible for conducting the remediation of the site voluntarily entered into the LSRP program created by the New Jersey Department of Environmental Protection (NJDEP) Site Remediation Reform Act of 2009. The Remedial Action Workplan includes the demolition of site buildings, disposal of rubble containing polychlorinated biphenyls, characterization of soil and groundwater, excavation and disposal of soils, capping, and the preparation of a deed restriction and a groundwater classification exception area.
Remediation of a Former Agricultural Chemicals Plant Site, Confidential Client, New Jersey. LSRP for this inactive site in New Jersey. The 40 acre site was the former location of a facility that manufactured chemical fertilizers. The site is located in a New Jersey Brownfields Development Area and borders a tidal, urban waterway. Issues at the site include metals (arsenic and lead) in soil and groundwater, organochlorine pesticides, and construction debris that were illegally deposited on the site. The
Scott R. Drew, L.S.R.P.
Page 3 of 12
Remedial Action Workplan for the site includes the construction of a permeable cap across the site, and a groundwater remedy based on natural remediation. A deed restriction will be placed on site soil and a classification exception area will be developed for groundwater.
Remediation of a Former Chemical Manufacturing Site, Confidential Client, New Jersey. LSRP for the site of a former chemical manufacturing facility that produced road tars, naphthalene, and phenolic compounds. The 37 acre site was originally developed for industrial activity in the late 1800s. Much of the site was built on historic fill placed on wetlands. Remedial activity includes the assessment of impacts to groundwater, and the remediation and closure of waste lagoons containing tar. Remedial strategies currently being evaluated include an innovative in situ thermal technology, excavation and capping.
Remediation of Soil and Groundwater, Former Industrial Site, Confidential Client, New Jersey. LSRP for a Remedial Investigation/Remedial Action program for soil and groundwater impacts at this 385 acre site. The site has a 100-year history of industrial activity, including an iron and steel foundry and equipment manufacturing. Over 600 Areas of Concern have been identified. Bedrock at the site consists of dolomite and limestone and based on data collected from extensive borings in the formation, is an active karst aquifer. More than 70 wells are installed in the formation at depths up to 300 feet below ground surface. Current remedial measures for groundwater include the operation of a free product recovery system and the evaluation of natural remediation of chlorinated solvents dissolved in groundwater. Remedial measures for soil include excavation, capping, and the closure and capping of former wastewater treatment ponds. The project also includes the evaluation of potential vapor intrusion pathways, including the management of a Vapor Concern area and the development of site-specific alternative ground water screening levels for vapor intrusion. The site is a RCRA 2020 site and includes an NJDEP case management team.
Investigation and Remediation of Former Industrial Glass Manufacturing Plant, Confidential Client, New Jersey. LSRP for a 48 acre site in southern New Jersey with a long history of glass manufacturing. Issues at the site include discharges of petroleum hydrocarbons and chlorinated solvents, off-site migration of contaminated groundwater, impacts to a surface water body, and vapor intrusion. Approximately one half of the site includes abandoned industrial buildings, while the other half has an operating glass manufacturing plant located on it. The primary focus of the program is to complete remedial investigation by May 2014, in accordance with the Site Remediation Reform Act.
Scott R. Drew, L.S.R.P.
Page 4 of 12
Remediation of Chlorinated Solvents in Soil and Groundwater, Confidential Client, New Jersey. LSRP for a plastics manufacturing company that has three sites in New Jersey where chlorinated solvents have been released to the subsurface during historical manufacturing operations. One of the sites is a current manufacturing facility, one is an abandoned facility and the third is currently owned and occupied by another party. The focus of the projects is to complete the remedial investigation phase at each site, including the identification of source areas, and the development of remedial action work plans.
Investigation of Chlorinated Solvents in Groundwater and the Vapor Intrusion Pathway, Confidential Client, New Jersey. LSRP for a facility that was formerly the site of a commercial dry cleaning operation. Historical releases of chlorinated solvents to groundwater in this mixed commercial/residential neighborhood required the evaluation of the vapor intrusion pathway in two on-site buildings, five off-site commercial buildings, and four off-site residential buildings. Identification of a clean groundwater lens limited further down-gradient investigation. One of the on-site building was identified as an Immediate Environmental Concern (IEC) and a mitigation system was installed. Future work will include the delineation and remediation of groundwater.
Site Investigation and Remediation
A Comparison of Pump-and-Treat, Natural Attenuation, and Enhanced Biodegradation to Remediate Chlorinated Ethene-Contaminated Fractured Rock Aquifers, New Jersey. Investigator from 2007 to 2012 for a research program (ER-1555) funded by the Strategic Environmental Research and Development Program (SERDP), which has been conducted jointly by the U.S. Geological Survey and Geosyntec. This unique program is focused on the direct comparison of two standard approaches for remediation of groundwater in bedrock systems with the innovative approach of bioaugmentation. The study has involved the injection of microorganisms into the fractured mudstones of the Lockatong Formation in the Newark Basin containing concentrations of trichloroethylene (TCE) as high as 30,000 µg/L. The final report for this program will be released in 2012.
Evaluation of Contaminated Groundwater Discharge to Surface Water Technical Guidance Document.. Selected by the NJDEP to serve on a Stakeholders Committee to develop a Technical Guidance Document. The Committee was formed in September 2012 and will write the first technical guidance in this subject area for application in New Jersey.

Scott R. Drew, L.S.R.P.
Page 5 of 12
Corrective Action Program, Confidential Client, Virginia. Project Manager for a large industrial site in Virginia where biosparging has been implemented as a corrective measure for groundwater. The project began with the preparation of an Assessment of Corrective Measures and a Corrective Action Plan for submittal to the Virginia Department of Environmental Quality in accordance with U.S. EPA Resource Conservation and Recovery Act (RCRA) requirements. This innovative remediation measure involves the application of biosparging in a karst limestone bedrock formation as an integrated remedial strategy that includes groundwater pumping and a RCRA cap on a closed landfill. The program has involved the performance of a field pilot study and regulatory and public comment meetings. The full-scale system was installed and started in August 2007. Substantial reduction in target compounds have been achieved in three years of operation, and alternative oxygen sources are being used to biologically treat residual concentrations of benzene and chlorobenzene.
Demonstration of Bioaugmentation in a Fractured Bedrock Formation, Confidential Client, New Jersey. Project Manager for a remedial program using bioaugmentation with KB-1®, a microbial culture for the anaerobic biodegradation of chlorinated solvents. The target zone for treatment is in Passaic formation bedrock. Both passive injection and injection under the influence of a pumping well were pilot tested. Monitoring data has demonstrated successful removal of TCE over a nine month period.
Evaluation of Potential Vapor Intrusion Pathways at a New York State Superfund Site, New York. Project Manager for a program to assess possible off-site vapor intrusion impacts at a Brownfields site. Historic releases from a waste oil reprocessing facility, as well as subsequent site uses, led to the presence of residual materials in soil and groundwater at this site including petroleum non-aqueous phase liquid (NAPL) and chlorinated solvents. The project is being reviewed by the New York State Department of Environmental Conservation and Department of Health.
Biodegradation of Nitroaromatic Compounds by Stimulating Humic Substance and Fe(III) Reduction. Co-Principal Investigator with the University of Illinois, directing research work performed under the SERDP Project Number ER-1377. The program evaluated the fundamental processes involved in the reduction of the explosive RDX under iron reducing conditions and demonstrated strategies for enhancing the rate of biodegradation of RDX in the presence of humic-like substances. The final report was published in June 2007.
Combined Biological and Chemical Mechanisms for Degradation of Insensitive Munitions in the Presence of Alternate Explosives. Co-Investigator with Clemson University and the US Army Corps of Engineers for SERDP Project Number ER-2222. The primary focus of the work is to evaluate the biodegradation of new explosives
Scott R. Drew, L.S.R.P.
Page 6 of 12
composites including the compounds DNAN, NTO, and NQ. The project was awarded in 2012.
Bioaugmentation, U.S. Navy, West Trenton, New Jersey. Project Manager for a field demonstration program at a U.S. Navy site. Bioaugmentation was performed over a large plot using well couplets and groundwater recirculation to disperse emulsified soybean oil and strain KB-1® for the anaerobic biodegradation of chlorinated solvents. The subsurface geology is fractured bedrock consisting of the Lockatong Formation (shale) and the Stockton Formation (sandstone). Monitoring data has demonstrated the successful removal of TCE over a three year period where original concentrations were in excess of 15 ppm.
Vapor Intrusion Study, Petroleum Pipeline Company, New Jersey. Project Manager for the evaluation of vapor intrusion impacts to off-site commercial buildings from a historic spill from a pipeline terminal. The project included evaluation of a groundwater remediation system. Project issues included a shallow water table, vapor emissions from sumps, and MTBE as a compound of concern.
Petroleum Remediation Study, Woods Hole Group, Kingdom of Saudi Arabia. Project Manager for a broad study of remedial options for the oiled coast of the Kingdom of Saudi Arabia (KSA). The Saudi Government was assessing the feasibility and cost of cleaning approximately 400 miles of coastline that was damaged as a result of the release of 10 to 20 million barrels of oil from Kuwait during the 1991 Gulf War. Key considerations for the project included the desert conditions under which the program was performed, the weathered nature of the crude oil on the shoreline, and the excavation and materials handling issues associated with a number of shoreline habitats. The project was executed over a 15 month period in four major phases including comprehensive literature reviews, selection of candidate technologies, performance of laboratory treatability studies, and the design and performance of field demonstration studies. Laboratory studies were performed at several facilities in the U.S. using samples from the KSA. Tests were carried out for anaerobic and aerobic biodegradation, high temperature thermal desorption, and re-vegetation (germination studies). Field testing protocols were prepared for the evaluation of both remediation and excavation technologies. Technologies evaluated in the field included high temperature thermal desorption, anaerobic and aerobic biodegradation, re-vegetation strategies, and several excavation and transport approaches. As a separate task, literature reviews were prepared regarding the restoration and re-vegetation of terrestrial desert environments impacted by military operations during the 1991 Gulf War.
Assessment of Former Manufactured Gas Plant Wastes, Electric Power Research Institute (EPRI). Task Manager for the EPRI project entitled Environmental Behavior
Scott R. Drew, L.S.R.P.
Page 7 of 12
of Organic Substances. The project was the first EPRI funded work investigating the identification, fate and transport of organic chemicals associated with former manufactured gas plant (MGP) sites in the U.S. The project included the development of a guidance document for the evaluation of MGP sites.
Former Manufactured Gas Plant, Confidential Client, New Jersey. Project Director for a program to evaluate, design, and construct a biological fluidized bed reactor (FBR) to treat groundwater containing contaminants from a former MGP site in New Jersey. The treatment train included equalization tanks that allowed the removal of light non-aqueous phase liquid (LNAPL) and dense non-aqueous phase liquid (DNAPL) dissolved air flotation, the FBR, and activated carbon. Each unit process was tested at pilot scale using groundwater collected from the site. The system was designed to treat up to 110 gpm, and was constructed and started up in 2001.
Remedial Technology Demonstration, RangeSafe Program, Picatinny Arsenal, New Jersey. Program Manager for the demonstration of a remedial technology for the biological degradation of tetryl (2,4,6-trinitrophenylmethylnitramine), an explosive used in military ordnance. The project involved the treatment of soil at a contaminated production facility resulting from the historical disposal of wastewater in pits. Tetryl had been found in soils at concentrations ranging up to 2%. The process involved the use of an anoxic/anaerobic bioslurry prepared by the addition of soil, water and nutrients to a stirred tank. Molasses was added as an electron donor/co-substrate. Bench scale treatability studies indicated that tetryl could be reduced to less than detection limits using the approach. The field demonstration was successfully performed with approximately 50 cubic yards of soil and was completed in 2002.
Aerobic Bioaugmentation, Petrochemical Company, Norristown, Pennsylvania. Project Manager for the first field use of hydrogenophaga flava ENV735, an aerobic bacterium that grows on MTBE and TBA, as a technology for treating contaminated groundwater at a service station in Pennsylvania. The field test was preceded by a successful bench-scale study. An existing pump-and-treat system was modified to oxygenate and re-inject groundwater at the site. Approximately 200 gallons of the concentrated culture was added to the site and the system was operated for 30 days.
Remediation Pilot Study, Semiconductor Manufacturer, New Jersey. Project Manager for the study of biological and chemical methods for the reduction of gallium arsenide, used in semiconductor manufacturing. Evaluated the use of biological treatment and phytoremediation to treat soil. Reducing the arsenide form of arsenic improved the uptake of arsenic by a proprietary species of fern.
Scott R. Drew, L.S.R.P.
Page 8 of 12
Remediation of MTBE and TBA, Sunoco, Inc., New Jersey. Program Manager directing the first use of propane-oxidizing bacteria as a means of achieving the co-metabolic degradation of MTBE and TBA in groundwater. An air sparging system was modified to inject low levels of propane mixed with air and a treatment zone was established to mitigate off-site migration of contaminated groundwater. Greater than 90% reduction in the concentration of MTBE was observed during operation of the system.
Natural Attenuation of Chlorinated/Non-Chlorinated Hydrocarbons in Groundwater, Pharmaceutical Facility, New Jersey. Project Manager for the evaluation of natural attenuation of a wide range of chlorinated and non-chlorinated hydrocarbons in groundwater at a pharmaceutical facility in New Jersey. The project was conducted as part of a RCRA Corrective Measures Study. Subsurface geology included alluvial overburden and fill and highly fractured bedrock. The project included the preparation of a large microcosm study using water collected from the site. A Quality Assurance Project Plan covering all sampling and analytical procedures was prepared.
Natural Attenuation, Biostimulation and Bioaugmentation, Chemical Company, West Virginia. Project Manager for the evaluation of potential remedial strategies at a site in West Virginia. The focus of the project included natural attenuation, biostimulation, and bioaugmentation. Primary contaminants of interest included carbon tetrachloride and chlorinated ethenes. Participated in the development of natural attenuation guidelines for the State of West Virginia Voluntary Remediation Program.
Perchlorate Remediation, Aerojet, Inc., Rancho Cordova, California. Program Director and client manager for the first biological system constructed in the United States for the full scale treatment of groundwater containing ammonium perchlorate. The FBR system currently treats more than 6,000 gpm of groundwater. This anoxic process includes the addition of substrate (ethanol) to the reactor to achieve reducing conditions amenable to the removal of perchlorate. The system includes four 16-foot diameter reactors, an ethanol feed system, biomass control, continuous sand filters, and UV filtration.
401H Permit Monitoring Program, City of Gloucester, Gloucester, Massachusetts. Project Manager for the execution of the monitoring and reporting requirements of a 401H permit, governing the discharge of the effluent of an advanced primary wastewater treatment system to the ocean. The project included the sampling of the water column and sediments for chemical parameters and the evaluation and measurement of benthic organisms. The report was prepared under the provisions of the Clean Water Act for U.S. EPA Region I.
Scott R. Drew, L.S.R.P.
Page 9 of 12
Sampling and Assessment of Combined Sewer Overflow System, CH2M Hill, Boston, Massachusetts. Project Manager for the sampling and subsequent analysis of data collected during storm events to evaluate a Combined Sewer Overflow System for the Massachusetts Water Resources Authority. The project included managing the logistics of mobilizing several sampling teams for storm events and the coordination of chemical analysis of samples, including the implementation of the Quality Assurance Program.
Baird Maguire Superfund Site, U.S. EPA, Holbrook, Massachusetts. Task Manager for analytical tasks associated with the evaluation of bioaccumulation of chemicals in trophic levels at this Superfund site in Massachusetts. Funded as a research program by U.S. EPA, the project involved the collection and chemical analysis of plants and animals from the site and the comparison of these data with the predictions of risk assessment models.
Love Canal Superfund Site, U.S. EPA, Niagara Falls, New York. Task Manager working as a subcontractor to CH2M Hill. Developed and tested sampling and analytical methodologies for the Habitability Study of Love Canal, conducted by U.S. EPA. The project included extensive method development to improve the measurement of low levels of Love Canal Indicator Compounds, the modeling and evaluation of soil sampling techniques, and the development of stringent quality assurance protocols required for the analytical phase of the project which was conducted by multiple laboratories. The project included the statistical comparison of data developed at Love Canal and from samples collected from a comparison area.
Technical Support for RCRA Delisting Petitions, U.S. EPA. Task Manager working as a contractor to the U.S. EPA Office of Solid Waste. Managed sampling and evaluation projects associated with the submittal of RCRA delisting petitions to the Agency by the stainless steel finishing industry. Project work included unannounced sampling events at three plants in the U.S. and the collection of samples from acid baths and metal hydroxide sludges. Data developed was compared to data submitted by the industry as part of the delisting petition process. Litigation Support/Expert Witness Testifying Expert Witness, M. Fitzpatrick Inc. v. Jomac Construction, et. al. Served as an expert witness for the defendants for this trial in Superior Court of New Jersey, Passaic County, NJ. The plaintiff alleged that the use of recycled concrete for pre-construction surcharge at a site led to the contamination of the concrete. Prepared an expert report in rebuttal to the claim based on scientific and regulatory evidence, including forensic analysis of PAHs, was deposed by the plaintiff’s attorney, and
Scott R. Drew, L.S.R.P.
Page 10 of 12
presented expert testimony at the jury trial. The case was concluded in a summary judgment by the court for the defendants, based on the evidence presented. Expert Witness. Confidential Real Estate Development Company v. Confidential Manufacturing Company. Served as an expert for the plaintiff for this case in United States District Court, District of New Jersey. The plaintiff received recycled concrete from the demolition of a former industrial manufacturing facility for use at construction sites. The concrete was subsequently discovered to contain contaminants above NJ standards for soil and had to be removed from the sites for disposal. Prepared an expert report based on the review of depositions, historical reports, and regulations in force at the time. Expert Witness. Confidential Chemical Company v. Confidential Construction Company. Served as an expert for the plaintiffs in this case in State Superior Court, Middlesex County, NJ. The case involved the illegal disposal of a large amount of construction debris and soil at a site under a NJDEP Class B recycling permit. Materials were brought to the site in excess of the permit limits and were abandoned. Prepared an expert witness report that included an examination of technical and regulatory issues in the case as well as the estimation of costs to remediate the site. PROFESSIONAL EXPERIENCE Geosyntec Consultants, Inc., Princeton, New Jersey; 2002 to present Envirogen, Inc., Lawrenceville, New Jersey; 1994-2002 Vapex Environmental Technologies (a unit of Envirogen), Canton, Massachusetts, 1992-
1994 National Environmental Testing, Inc., Cherry Hill, New Jersey; 1989-1992 Cambridge Analytical Associates, Boston, Massachusetts; 1983-1989 Energy Resources Company, Cambridge, Massachusetts; 1978-1983
AFFILIATIONS
Licensed Site Remediation Professionals Association, Board of Trustees Member Society of American Military Engineers Environmental Business Council of the Commerce & Industry Association of New Jersey Chemistry Council of New Jersey
Scott R. Drew, L.S.R.P.
Page 11 of 12
REPRESENTATIVE PUBLICATIONS AND PRESENTATIONS
13-01 Millerick, K., Drew, S.R., Finneran, K.T., “Electron Shuttle-Mediated Biotransformation of Hexahydro-1,3,5-trinitro-1.3.5-triazine Adsorbed to Granular Activate Carbon”. Environmental Science & Technology, Vol. 47, pp. 8743-8750. 2013.
09-01 Imbrigiotta, T.E., Drew, S. R., Goode, D.J., Tiedeman, C.R., DeFlaun, M.F., Shapiro, A.M., “Evidence of Increased Microbial Degradation Following Bioaugmentation of TCE in Fractured Sedimentary Rock at the Former Naval Air Warfare Center, NJ” ESTCP/SERDP Partners in Environmental Technology Technical Symposium, Washington D.C., December 1-3.
07-01 Penrod, H., S.R. Drew, M. Hall, “RCRA Corrective Action at the Merck Stonewall Plant: Managing Multiple SWMUs and Remedies” Presented at the EPA Region III/State RCRA Corrective Action Workshop, Rocky Gap, MD, November 2007
06-01 Finneran, K., M.J. Kwon, S.R. Drew, 2006, “Biodegradation of Hexahydro-1,3,5-triazine (RDX) by Stimulating Humic Substance and Fe(III) Reduction,” Proceedings of the Fifth International Battelle Conference on Remediation of Chlorinated and Recalcitrant Compounds, Monterey, California, May 22-25.
06-02 Drew, S., M.F. DeFlaun, D. Spicuzza, 2006, “Bioaugmentation to Treat Chlorinated Solvents in Fractured Bedrock,” Proceedings of the Fifth International Battelle Conference on Remediation of Chlorinated and Recalcitrant Compounds, Monterey, California, May 22-25.
06-03 DeFlaun, M.F., S. Drew, J. Dale, P. Lacombe, P. Schauble, 2006, “The Application of Bioaugmentation for TCE DNAPL in Fractured Bedrock,” Proceedings of the Fifth International Battelle Conference on Remediation of Chlorinated and Recalcitrant Compounds, Monterey, California, May 22-25.
06-04 Kwon, M.J., S. Drew, K. Finneran, “Extracellular Electron Shuttle Mediated Biodegradation of Hexahydro-1,3,5-triazine (RDX) in RDX-Contaminated Aquifer Material,” American Society for Microbiology General Meeting, Orlando, FL, May 21-25, 2006.
03-01 Steffan, R.J., Y.H. Farhan, C.W. Condee, S.R. Drew, “Bioremediation at a New Jersey Site Using Propane-oxidizing Bacteria,” In MTBE Remediation
Scott R. Drew, L.S.R.P.
Page 12 of 12
Handbook, E. Moyer and P. Kostecki, editors, Amherst Scientific Publishers, Amherst, MA. 2003.
02-01 Cerbone, R., S. R. Drew, D. Lippincott, J. Robertson, “In Situ Bioremediation of MTBE in a Source Area,” National Ground Water Association Conference on MTBE: Assessment, Remediation, and Public Policy, June 2002.
01-01 Steffan, R.J., P.B. Hatzinger, Y. Farhan, S. R. Drew, 2001, “In Situ and Ex Situ Biodegradation of MTBE and TBA in Contaminated Groundwater,” Petroleum Hydrocarbons and Organic Chemicals in Ground Water: Prevention, Detection, and Remediation, Conference Proceedings, National Ground Water Association/American Petroleum Institute.
01-02 Hatzinger, P.B., Y. Farhan, S.R. Drew, 2001,”MTBE Bioremediation: Reformulating Treatment Methods,” in Industrial Wastewater, Vol. 9, No.4, pp. 26-29.
00-01 Midwest Environmental Enforcement Association, Annual Conference, “Remediation Technology for MTBE,” June 2000, Guest Speaker.
91-01 Burmaster, D.E., C. Menzies, J. Freshman, J. Burris, N. I. Maxwell, S. Drew, 1991. “Assessment of Methods for Estimating Aquatic Hazards at Superfund-Type Sites: A Cautionary Tale”. Environmental Toxicology and Chemistry, Vol. 10, pp 827-842, 1991.
87-01 Presented expert testimony at the Ottati and Goss/Great Lakes Container NPL Site Trial, Concord, NH, 1987.
81-01 Boehm P., S. Drew, T. Dorsey, J. Yarko, N. Mosesman, A. Jefferies, D. Pilson, D. Fiest, 1981, “Sources of Organic Pollutants in New York Bight Suspended Particulates; Waste Deposit Resuspension Versus Riverine/Estuarine Fluxes,” Third International Ocean Disposal Symposium, October, 1981.
81-02 “Test Methods for Evaluating Solid Waste SW-846.” U.S. Environmental Protection Agency, Office of Solid Waste. Revised and edited procedures for publication of the second edition.
DALE M. PROKOPCHAK, CIH, CSP industrial hygiene public and industrial health safety training and programming
EDUCATION
MS, Industrial Hygiene, Wayne State University, Detroit, Michigan, 1981 B.S., Microbiology and Public Health, Michigan State University, East Lansing,
Michigan, 1978
PROFESSIONAL REGISTRATIONS
Certified Safety Professional, #10226, 1990 Certified Industrial Hygienist, #3185, 1985
CAREER SUMMARY
Mr. Prokopchak is an industrial hygienist and safety specialist based in Virginia with more than 31 years’ experience in corporate environmental health and safety program management, training, and emergency response planning and implementation. He focuses on the development of environmental, health and safety programs to protect site personnel and the public. Working with contractor teams, Mr. Prokopchak specializes in the development of project-specific training programs and medical monitoring programs to ensure compliance with applicable health and safety regulations. He also develops health and safety procedures and policies as part of an overall environmental, heal, and safety management system to reduce potential risk and exposure to hazard agents.
PROFESSIONAL EXPERIENCE
Federal Emergency Management Agency, Four Disaster Responses, Nationwide. Health and safety manager for program team to evaluate health, safety, and environmental hazards during response to tornadoes, hurricanes, flooding, fires, and other natural disasters. Developed a program health and safety plan to identify, assess, and recommend appropriate control measures (engineering, administrative, personal protective equipment) to minimize exposure risks during FEMA work activities, which include onsite disaster recovery assistance, physical facilities analysis and damage assessments, and environmental assessments and hazard mitigation. Hazard agents include compromised structural integrity of buildings, energized facilities, flammable/explosive gases, animal/plant vectors, hazardous materials/ sludge in sediments, and the growth and proliferation of mold. Coordinated the medical surveillance program (Hepatitis A and tetanus/diphtheria) for more than 200 personnel
Dale M. Prokopchak, CIH, CSP Page 2
deployed throughout the southeastern United States in response to damage incurred by Hurricanes Katrina and Rita. Developed a database to identify and prioritize risk and subsequent safe entry procedures into buildings and facilities based on a risk assessment checklist and coordination with EPA, OSHA, FEMA, and local health authorities.
U.S. Postal Service, Anthrax Response, Nationwide. Industrial hygienist responsible for developing and communicating a response-specific health and safety plan (HASP) and training program for personnel providing emergency assessment of Bacillus anthracis (anthrax) contamination at USPS facilities across the country. The HASP detailed personal protective equipment during entry into facilities, work zones/delineation to minimize potential exposure and risk, and emergency procedures in the event of a release to ensure both employees and USPS personnel were aware of proper response procedures.
AFCEE, WERC - Rebuild Iraqi Army Base, An Numaniyah, Iraq. Provided overall construction safety and health support during the rebuilding of an abandoned army facility.
U.S. EPA - Region 6 ERRS - Space Shuttle Columbia Debris Collection, Texas and Louisiana. Coordinated the deployment and regulatory compliance of more than 150 employees and subcontractors for support.
City of Richmond, Indoor Air Survey, Richmond, Virginia. Program manager for the investigation of suspected gasoline infiltrating homes, residences, and day care centers from sewers after a spill. Developed and implemented the monitoring survey to evaluate volatile organic levels. Air monitoring was performed using stainless steel Summa canisters, with analysis performed by the T014-Volatile Organic GC/MS methodology. Developed risk assessment levels that allowed children and adults to re-enter the buildings without suffering any adverse health effects.
U.S. Air Force, Multiple Contracts, Various Installations. H&S manager for environmental and construction projects to include low-level radiation, UXO, UST, groundwater contamination, asbestos/lead, decontamination/demolition of bulk storage tanks, and construction of building/hospital additions. Coordinated development and implementation of site-specific HASPs and confirmed regulatory compliance by conducting site audits. Reviewed subcontractor H&S prequalification packages to ensure their safety programs and performance met Company and government requirements. Conducted meetings on site with subcontractors to review and approve task hazard analysis (THA) to minimize risk to personnel, the environment, and the community.
U.S. EPA - Regions 2, 3, 4, 5, and 6, Emergency Response Cleanup Services (ERCS)/ Emergency and Rapid Response Services (ERRS) Contracts. Health &

Dale M. Prokopchak, CIH, CSP Page 3
safety manager for more than 750 removal and remedial actions at National Priorities List sites throughout U.S. EPA Regions 2, 3, 4, 5 and 6. Developed site-specific HASPs; conducted site audits to ensure compliance with the HASP and other appropriate OSHA, federal, and state requirements; and implemented person al/perimeter air-monitoring strategies to ensure the adequacy of PPE and to document fence-line airborne levels of health hazard agents that may affect the surrounding community. Projects include characterization of unknown waste, buried container removal, unexploded ordnance removal, low-level radiation remediation, industrial facility decontamination and demolition, lagoon closures, landfill closures, and environmental assessments.
Southeastern Public Service Authority, Remediation of Boiler Fly Ash, Chesapeake, Virginia. Health & safety manager for the remediation, demolition, dismantling, and cutting of air pollution control components at a Navy steam plant that was retrofitted with spray dryer absorbers and fabric filters to meet the Clean Air Act regulations. Developed a worker protection and training program and implemented and enforced the site-specific OSHA-approved HASP at the first project in the United States involving both the remediation of boiler fly ash resulting from the combustion of refuse-derived fuel (RDF) and the demolition of ash-laden components. Ensured that the remediation phase of work complied with requirements set forth in 29 CFR 1926.62 (lead), 29 CFR 1926.63 (cadmium), and 29 CFR 1926.1118 (arsenic) and that the demolition phase of work activities adhered to the OSHA Construction Standard 29 CFR 1926 provisions for cranes, welding/cutting /burning, fire protection, electrical, fall protection, and demolition. Oversaw performance in a healthy and safe manner to prevent releases of potential health hazard agents and protect the public, workers, and plant staff from adverse exposures.
Kimmins Thermal Corporation, Asbestos, Radium, Beryllium, and PCB Decontamination at the Norfolk Naval Air Station, Norfolk, Virginia. Construction Quality Control (CQC) representative for the remediation of PCBs, asbestos, radium, unknown chemicals, and beryllium at two U.S. Navy buildings (V60/V90). Implemented a quality management organization and system in accordance with OSHA, EPA, and Navy standards and specifications to ensure subcontractor compliance with the contract provisions and to minimize exposure to health/physical hazard agents. The CQC system included air/wipe/soil/water sampling strategies, periodic inspections, and verification documentation as specified in the technical requirements of the project. Developed a strict chain-of-custody program to ensure sample integrity and accuracy of laboratory analysis during all phases of work including baseline surveys, remediation, and demolition for verification of contaminant-free buildings, and new construction work. Worked on site and audited remediation construction activities of subcontractors.

Dale M. Prokopchak, CIH, CSP Page 4
Reynolds Metals Company, Richmond, Virginia. Conducted industrial hygiene and environmental surveys of company facilities and processes to prevent occupational diseases; assisted in the development of policy guidelines to protect worker health; provided professional direction to field industrial hygiene personnel; developed training programs on environmental health hazards.
Wan Technologies, Atlanta, Georgia. Manager for industrial hygiene and asbestos abatement projects. Developed site health and safety plans and training for hazardous waste generators and remediation personnel and coordinated the company's medical surveillance program. Project manager at the U.S. Embassy in Moscow responsible for ensuring that all contract specifications were in compliance with applicable OSHA and U.S. EPA regulations. Oversaw the construction of the containment area, air sampling and proper waste disposal procedures, and coordination of public affairs information with project management and the military.
Virginia Power, Richmond, Virginia. Conducted industrial hygiene audits at fossil, nuclear, and hydroelectric generating facilities. Developed and implemented health and safety training programs for: respiratory protection, hearing conservation, confined space entry, and hazardous chemical/PCB emergency response. Developed an asbestos work procedure manual for contractors/plant personnel involved with asbestos removal projects.
State of North Carolina. Evaluated industrial facilities throughout the state to determine compliance with OSHA regulations by monitoring chemical, physical, and biological hazards. Based on air sampling results, wrote reports that recommended engineering/work practice/PPE controls to minimize personal exposure to chemical/physical/biological agents. Assisted the State Asbestos Task Force in developing specifications for asbestos abatement projects.
Earth Tech, Hazardous Materials Handling and Shipping Program. Initiated the development of the program by identifying personnel that ship hazardous materials and prioritizing appropriate training based on risk. Enrolled affected personnel in an on-line computer training program that outlined proper requirements for shipping, labeling, handling, and packaging of hazardous materials.
Earth Tech, Ergonomics Program, Richmond, Virginia. Coordinated the development of an ergonomics program for a department of 75 Support Service personnel that were hired in the Richmond office within six months that involved initial input into the work station equipment, training on office safety and ergonomics, development of an ergonomic self-evaluation and assessment questionnaire, and interaction with employees and managers on cost-effective control measures to increase output in a safe manner.
Dale M. Prokopchak, CIH, CSP Page 5
PROFESSIONAL DEVELOPMENT
HAZWOPER Refresher 2012 MSHA H&S Training 2011 OSHA 10 Hour Construction 2010 DOT Handling Hazardous Materials & Shipping 2009-2012 FEMA IS-631 Public Assistance Operations I, 2005 FEMA IS-632 Debris Management, 2005 Health & Safety Risks During Industrial Counterterrorism, PCIH, 2006 Industrial Hygienists as Experts in Trials and Depositions, PCIIH, 2006 Improving Communication Effectiveness for the IH Manager, PCIH, 2005 Construction Safety for Industrial Hygienists, PCIH, 2001 Managing Health and Safety at Multi-Employer Sites, AIHCE, 1999 Personal Protective Equipment Standard 29 CFR 1910.132, American Management
Society, 1995 Auditing of Health and Safety Programs, Manufacturing Facilities/Hazardous Waste
Sites - American Industrial Hygiene Association, 1994
TEACHING EXPERIENCE
Adjunct faculty member, Virginia Commonwealth University/Medical College of Virginia, Master's Program in Industrial Hygiene - Concentration in Industrial Hygiene/Safety at Hazardous Waste Sites

MARK P. MALCHIK, CIH, CSP occupational health and safety industrial hygiene public health
EDUCATION
M.S., Public Health, University of Massachusetts, Amherst, Massachusetts, 1985 B.S., Environmental Sciences, University of Massachusetts, Amherst, Massachusetts,
1977
CERTIFICATIONS
Certified Industrial Hygienist, No. 4094 CP
Certified Safety Professional, No. 12307
HAZWOPER 40 hour, Supervisor and 8-hour refreshers
CAREER SUMMARY
Mr. Malchik is an experienced environmental health and safety professional who is passionate about worker protection, regulatory compliance, and institutional risk reduction. He is a Certified Industrial Hygienist and Certified Safety Professional with over 25 years of experience providing technical, regulatory and risk management assistance to organizations in many business sectors. Prior to Geosyntec, he also served for 10 years as the Health & Safety Director at a multi-disciplinary environmental engineering firm providing institutional leadership, subject matter expertise, and a practical approach to safety, while also functioning as a “safety liaison” with clients, contractors, and regulators. He provides a wealth of experience implementing safety programs and establishing a positive safety culture through collaborative relationships with project managers, engineers, site supervisors, safety professionals, and field personnel.
Consulting Safety Officer
Mr. Malchik provided comprehensive EHS consulting services to life sciences and technology companies in the Greater Boston area, including development of OSHA programs, hazardous waste management, incident reporting and root cause analysis, potent compound safety programs, regulatory compliance audits, and worker training.
EH&S Director / Senior Technical Specialist / Sr. Project Manager
Mr. Malchik managed the internal Environmental Health and Safety Program for a
Mark P. Malchik, CIH, CSP Page 2
northeast regional environmental/geotechnical engineering firm with 500 employees, 15 offices and two laboratories, and serving clientele in many business sectors. In this role, he authored corporate safety policies and SOPs, established safety committees, mentored H&S Coordinators, and advised senior management on safety compliance and risk reduction. He led internal efforts in pre-task planning and field implementation of H&S plans, employee training, medical surveillance, incident reporting, root cause analysis, OSHA recordkeeping, construction safety and contractor safety oversight. He also served as Radiation Safety Officer and OSHA Outreach Construction Safety Trainer.
As a safety and industrial hygiene consultant for external clientele, Mr. Malchik worked with organizations in many business sectors, including manufacturing, industrial, construction, institutional, energy, legal, commercial, and the public sector. Areas of specialization included personal exposure monitoring, safety program development, worker training, regulatory compliance, chemical safety, indoor air quality, building-related hazards, and laboratory chemical hygiene.
Right-to-Know Program Manager/Senior Industrial Hygienist
With the public sector, Mr. Malchik supervised a staff of five industrial hygienists, providing technical support to public agencies and private companies for implementation of the Massachusetts Right to Know (RTK) Law. He also conducted hazardous material surveys in public schools and monitored hazard abatement projects.
PROFESSIONAL EXPERIENCE
Geosyntec Consultants, Acton, Massachusetts, 2013 - present Safety Partners, Inc., Bedford, Massachusetts, 2012 - 2013 GZA GeoEnvironmental, Inc., Norwood and Newton, Massachusetts, 1986 - 2011 Massachusetts Division of Occupational Hygiene, West Newton, Massachusetts, 1984 -
1986
AFFILIATIONS
New England Section, American Industrial Hygiene Association (President, 2011)
American Society for Training and Development, Greater Boston Chapter

Paul J. Nicholson Project management Senior Engineer vapor intrusion investigation Remediation and mitigation design
EDUCATION
B.A.Sc., Environmental Engineering, Chemical Specialization, University of Waterloo: 2004
REGISTRATIONS AND CERTIFICATIONS
Professional Engineer, Ontario, No. 10012745
CAREER SUMMARY
Paul Nicholson is a senior environmental engineer with over 12 years of experience in environmental consulting with a focus on assessing and mitigating human health risks associated with sub-surface vapor intrusion (the migration of volatile organic compounds from the sub-surface into overlying buildings). He has specific experience in the development, oversight and management of large vapor intrusion investigations at petroleum hydrocarbon and chlorinated solvent sites. This includes developing many large scale vapor intrusion assessment programs for properties with as many as a 1,000 buildings and prioritizing properties based on a building specific conceptual site model using historical soil and groundwater information. Investigations incorporate a multiple lines of evidence approach and are conducted using state of the art sampling techniques such as passive sampling, high volume sampling and building pressure cycling to assess both temporal and spatial variability in order to refine the site conceptual model and assess the potential for vapor intrusion. Mr. Nicholson has experience with the design, construction, monitoring and maintenance/optimization of many vapor intrusion mitigation systems including innovative passive sub-slab venting systems, solar and wind powered venting systems at industrial, commercial and residential properties, in addition to soil vapor extraction systems. He also conducts vapor transport modeling and has completed research and design into the optimization of existing powered sub-slab depressurization and soil vapor extraction systems to reduce energy consumption, while maintaining occupant protectiveness. Mr. Nicholson was integrally involved in the development of Geosyntec’s High Volume Sampling protocol (McAlary et al, 2010) and the subsequent modeling and analysis of HVS data for mitigation system design and optimization. Other areas of proficiency
Paul, Nicholson, P.Eng. Page 2
include groundwater remediation, including pump and treat, soil vapor and multi-phase extraction systems, bioremediation and treatability study design, sediment capping and remediation and in-situ technologies including self-sustaining treatment for active remediation (STAR) for the in-situ or ex-situ smoldering combustion of non-aqueous phase liquids (NAPL).
Remediation System Design
Confidential Client, Indianapolis. Engineer for the review and optimization of a soil vapor extraction system. Reviewed the existing design and conducted optimization tests and mass flux measurements to reduce system operational costs, while maintaining system performance and effectiveness. Results showed that the extraction system power consumption could be reduced by 50% while achieving the same system performance.
Former Gas Station, Hamilton, Ontario, Canada. Project Manager for the design, installation and operation of a multi-phase extraction (MPE) system for the remediation of a former gas station property. Lead the design of a MPE including air-sparging for the enhanced removal of sub-surface VOCs. Interpreted analytical data and made system improvements to optimize mass removal and decrease remediation timeline.
Former Dry Cleaner, Riverside, California. Project Manager for the design, installation and operation of a soil vapor extraction (SVE) system for the remediation of a former dry cleaner property.
Confidential Client, Michigan. Engineer for the design, of a soil vapor extraction system (SVE) and continued monitoring for optimization of system mass removal.
Thorium Waste Remediation, Ipoh/Malaysia. Project supervisor for an environmental monitoring program on a low level radioactive waste remediation project. The program included airborne particulate monitoring, surface water sampling, groundwater sampling using low-flow protocols, sediment and vegetation sampling for laboratory analysis, and radioactivity monitoring using active and passive monitors. Responsible for coordination of monitoring activities, data evaluation and preparation of environmental monitoring reports.
Vapor Intrusion
Edwards Air Force Base Vapor Intrusion Assessment, Air Force Base, California. Project Manager for a site wide vapor intrusion assessment including more than 1,000 buildings. Developed a GIS database using existing extensive soil and groundwater data to evaluate and prioritize a small subset of buildings for investigation. Developed a Uniform Federal Policy Quality Assurance Project Plan (UFP-QAPP) which included

Paul, Nicholson, P.Eng. Page 3
both active and passive sampling techniques of sub-slab, indoor air and outdoor air and building pressure cycling to assess the potential for vapor intrusion.
United States Department of Energy, Pinellas County, Florida. Project Manager for vapor intrusion assessment at a 450,000 square foot building. Incorporated the use of high volume sampling (HVS) to reduce the number of sampling points and characterize sub-slab VOCs and provide data for the installation of an optimize sub-slab mitigation system.
Investigation at an Active Semiconductor Manufacturer, Ampang/Malaysia. Project Manager for a soil vapor investigation beneath an active semi-conductor manufacturer in Malaysia. Implemented innovative passive sample techniques using the Waterloo Membrane Sampler and conducted High Volume Sampling (HVS) and subsequent transient response data analysis to optimize the design of a soil vapor extraction/sub-slab venting system.
Vapor Intrusion Investigation, Army Installation, Baltimore, Maryland. Project Manager and Site Supervisor for a soil vapor investigation at a large Army installation. Conducted a phased approach for assessing potential VI risks, which were prioritized based on historic data using the project developed conceptual site model. Supervised a field crew of up to 10 individuals for the assessment of 13 different buildings using litigation-quality sampling protocols including sampling for both volatile and semi-volatile organic compounds, PCBs, pesticides, mercury and chemical warfare agents.
Vapor Intrusion Investigation and Mitigation, Active Printing facility, Mexico City, Mexico. Project Manager and Project Manager and Site Supervisor for a soil vapor investigation at an active printing facility. Completed groundwater monitoring well installation and sampling underneath the active facility and assessed groundwater impacts of historical operations. Performed a vapor intrusion assessment using the Waterloo Membrane Sampler for indoor air, outdoor air and sub-slab samples. Incorporated High Purge Volume sampling and transient response analysis to design and install an effective sub-slab mitigation system.
Vapor Intrusion Investigation, Electronics Manufacturer, Dallas, Texas. Project Manager for several phases of soil vapor investigations near a residential community adjacent to an electronics manufacturing facility in Texas. Managed installation and sampling of ~100 soil gas probes using litigation-quality field protocols and documentation with 2 drilling crews and a staff of up to 5 individuals. Presented results in client meetings, prepared reports of investigative activities, and managed project budget, schedule, invoices and subcontractors
Paul, Nicholson, P.Eng. Page 4
Vapor Intrusion Investigation, Former Oil refinery, Oklahoma, Site Supervisor for an extensive soil vapor investigation at and near a former refinery in Okalahoma. Supervised and directed installation and sampling of ~140 soil gas probes using litigation-quality field protocols and documentation with 2 drilling crews and a staff of up to 10 individuals. Assisted with reports of investigative activities, and managed project budget, schedule and subcontractors.
Vapor Intrusion Investigation, Former Oil refinery, Ohio, Project Scientist and Site Supervisor for soil vapor intrusion investigation in a residential community near a former refinery in Ohio. Supervised and directed installation and sampling of sub-slab, near-slab and nested soil gas probes for hydrocarbon vapors, oxygen and carbon dioxide with a total of ~300 samples collected over a period of 8 weeks using a field crew of up to 25 individuals. Trained staff from incumbent consulting firm on the application of Geosyntec’s soil vapor sampling protocols, and implemented procedures for consistency among multiple sampling crews Continue to provide technical review of sample collection methods and data interpretation and modeling.
Remediation Technology Research & Development Activities
Sub-slab Mitigation System Optimization, Multiple DOD Sites. Project Manager for a 3-year ESTCP funded research project on the optimization of existing sub-slab depressurization systems. Developed and evaluated innovative sampling techniques including transient response testing, sub-slab vapor pumps tests, sub-slab helium tracer testing, indoor air tracer testing and mass flux measurements. One building had the existing SSD system reduced by 90% while maintaining protectiveness of the occupants, resulting in considerable cost savings in both energy and operation and maintenance costs of the system.
EISB Pilot Test at Semiconductor Manufacturer, Malacca/Malaysia. Project Manager for the site investigation and implementation of an enhanced in-situ bioremediation (EISB) pilot test at a semi-conductor facility with VOC impacts to groundwater. Investigation included groundwater sampling for development of a site conceptual model, soil boring to evaluate the soil lithology. The site investigation was followed by a pilot study to evaluate the injection of emulsified palm oil (biostimulation) and bioaugmentation with KB-1.
Sediment Biotreatability Study, New York. Task Manager for a biotreatability study to assess the anaerobic degradation of dichlorobenzenes, chlorobenzene, naphthalene and BTEX in an engineered sediment cap. Coordinated construction and sampling programs and provided data interpretation and calculation of degradation rates for each
Paul, Nicholson, P.Eng. Page 5
compound under a variety of geochemical conditions which would be expected in different intervals within an engineered cap.
STAR Pilot Test, New Jersey, NY. Environmental Engineer for the first pilot test self-sustaining treatment for active remediation (STAR) for the in-situ smoldering combustion of coal tar at a site. Coordinated the continuous emission monitoring system, obtained applicable air permits, conducted extensive health and safety oversight and aided in construction of the system and operation.
PROFESSIONAL EXPERIENCE
Geosyntec Consultants Inc., Guelph, ON, 2003- present Geosyntec Consultants Inc., Ipoh, Malaysia, 2011-2012 Conestoga Rovers and Associates , Phoenix, Arizona, 2003-2003 Conestoga Rovers and Associates, Waterloo, ON, 2001-2002 Velcro Canada, Brampton, ON, 2001-2001
PROFESSIONAL TRAINING
OSHA Health and Safety Training - 40-Hour
OSHA Health and Safety Annual Refresher - 8-Hour
OSHA Supervisor - 8-Hour
Transportation of Dangerous Goods Training
CPR and Basic First Aid
REPRESENTATIVE PUBLICATIONS
14-01 McAlary, T.A., H. Groenevelt, P. Nicholson, S. Seethapathy, P. Sacco, D. Crump, M. Tuday, H. Hayes, B. Schumacher, P. Johnson, T. Górecki and I. Rivera Duarte. 2014. Quantitative Passive Soil Vapor Sampling for VOCs - Part 3: Field Experiments. Environ. Sci.: Processes Impacts
10-02 McAlary, T., P. Nicholson, H. Groenevelt, D. Bertrand and R. Ettinger. 2010. A Case Study on the Influence of Aerobic Biodegradation on Vapor Intrusion at a Former Refinery Property. Chapter in Vapor Emission to Outdoor Air and Enclosed Spaces. Nova Science.
10-01 McAlary, T., P. Nicholson, L. K. Yik G. Thrupp, and D. Bertrand. 2010. High Purge Volume Sampling: A New Paradigm for Sub-slab Soil Gas Monitoring. Groundwater Monitoring and Remediation, Spring, 2010.

Paul, Nicholson, P.Eng. Page 6
09-01 McAlary, T., P. Nicholson, H. Groenevelt, D. Bertrand. 2009. A Case Study of Soil-Gas Sampling in Silt and Clay-Rich (Low-Permeability) Soils. Groundwater Monitoring and Remediation, Volume 29 Issue 1, p 144-152, Winter, 2009.
07-01 McAlary, T., P. Nicholson, D. Bertrand, L. Abreu, and R. Ettinger. 2007. A Case Study on the Influence of Aerobic Biodegradation on Vapor Intrusion at a Former Refinery Property. Presentation and Paper for the Air and Waste Management Association Vapor Intrusion Conference: Vapor Intrusion - Learning From the Challenges, Providence, RI. September 26-28, 2007.
06-01 Aziz, C.E., P. Nicholson, R. Borch, and E. Cox. 2006. Alternative Causes of Wide-Spread, Low Concentration Perchlorate Impacts to Groundwater. Chapter In Gu, B. and J.D. Coates. Ed. Perchlorate Environmental Occurrence, Interactions and Treatment, Springer.
INVITED PRESENTATIONS
15-10 Paul Nicholson. 2015. “Streamlining Vapor Intrusion Assessments with High Volume Sampling (HVS) at Large Industrial Activities”. Presentation for the Environmental Remediation and Risk Management Conference, Grand Rapids, Michigan. October 2015.
14-04 Paul Nicholson. 2014. “Comparing Conventional and Innovative Vapor Intrusin Assessment Methods to Reduce Costs and Improve Data Quality and Spatial Resolution”. Ninth International Conference on Remediation of Chlorinated and Recalcitrant Compounds. Monterey, California. May, 2014.
14-04 Paul Nicholson. 2014. “Managing Environmental Liabilities in Malaysia”. Ninth International Conference on Remediation of Chlorinated and Recalcitrant Compounds. Monterey, California. May, 2014.
12-01 Todd McAlary, Paul Nicholson and Hester Groenevelt, Xiaomin Wang, Andre Unger, Suresh Seethapathy, Tadeusz Gorecki, Ignacio Rivera-Duarte. 2012. “Quantitative Passive Soil Vapor Sampling for VOCs”. Presentation and Paper for the National Environmental Monitoring Conference, Washington DC. August 2012
12-02 Todd McAlary, Paul Nicholson and Hester Groenevelt, Xiaomin Wang, Andre Unger, Suresh Seethapathy, Tadeusz Gorecki, Sacco,D. Crump, M. Tuday, B. Schumacher, H. Hayes, P. Johnson, I. Rivera. 2012. “Quantitative Passive Sampling for Assessing Subsurface VOC Vapor Intrusion to Indoor Air”. Presentation for Air Quality Measurement, Methods and Technology, Durham, NC. April 24-26, 2012.
Paul, Nicholson, P.Eng. Page 7
11-03 Todd McAlary, Paul Nicholson and David Bertrand. “Pneumatic Testing, Mathematical Modeling and Flux Monitoring to Assess Modeling and Flux Monitoring to Assess and Optimize the Performance and Establish Termination Criteria for Sub Establish Termination Criteria for Sub - Slab Depressurization Systems” Presented at: USEPA Workshop on Vapor Intrusion, AEHS Soil and Sediment Conference San Diego CA AEHS Soil and Sediment Conference, San Diego, CA March 2011
11-01 Paul Nicholson, Robert Bruce. 2011. “Bioremediation: A Remediation Application for Contaminated Electronics Industry Sites in Malaysia”. Presentation and Paper for Brownfields Asia Conference. Kuala Lumpur, Malaysia. 12-14 July, 2011
10-03 David Himmelheber, Paul Nicholson, Todd McAlary, Robert Ettinger, Jennifer Harris, John Wrobel. 2010. “Implementation of a Strategic Approach for Complex VI Assessment at a Large Military Facility”. Presentation and Paper for the Air and Waste Management Association Vapor Intrusion Conference. Chicago, Il. September 28-29, 2010.
10-02 Paul Michalski, Shannon Thompson, Charlie DeWolf, Paul Nicholson, Todd McAlary. 2010. “Effects of Alternate Petroleum Hydrocarbon Sources in the Vadose Zone on the Vapor Intrusion Pathway Beneath a Residential Community”. Presentation and Paper for the Air and Waste Management Association Vapor Intrusion Conference. Chicago, Il. September 28-29, 2010
10-01 Bertrand, David, T. McAlary, P. Nicholson. 2010. “Passive (Wind-driven) Systems for Sub-slab Venting to Mitigate Potential Vapor Intrusion.” Proceedings of Seventh International Conference on Remediation of Chlorinated and Recalcitrant Compounds. Monterey, CA, May 2010.
09-01 Nicholson, P., T. McAlary, D. Bertrand, H. Groenevelt. October, 2009. A New High Purge Volume Sampling Method for Sub-slab Soil Gas Monitoring for the Evaluation of the Vapor Intrusion Pathway. Presentation for the 25th Annual International Conference on Soils, Sediment, Water and Energy. University of Massachusetts, Amherst, MA. October 19-22, 2009.
08-01 Seethapathy, Suresh1, Tadeusz Gorecki1, Todd McAlary2, Duane Graves, Ph.D.3, Hester Groenevelt2, David. M Bertrand2 and Paul Nicholson2, (1) University of Waterloo, (2) Geosyntec Consultants International, (3) Geosyntec Consultants, 2008. Application of New Permeation Passive Samplers for Field Analysis. Presentation for the National Groundwater Association: 2008 Groundwater Summit, Memphis, TN. March 30-April 3, 2008.
Paul, Nicholson, P.Eng. Page 8
07-01 Nicholson, P., D. Bertrand, T. McAlary. September, 2007. Soil Gas Sampling in Low-Permeability Materials. Presentation and Paper for the Air and Waste Management Association Vapor Intrusion Conference: Vapor Intrusion - Learning From the Challenges. Providence, RI. September 26-28, 2007.
06-01 Konzuk, J.S., P. Nicholson, and J. Roberts, “Improving the Understanding of Oil Emulsion Behavior in the Subsurface,” Proceedings, Fifth International Conference on Remediation of Chlorinated and Recalcitrant Compounds, Monterey, CA, May 2006.

1
JARED B. BRISMAN, E.I.T sediment assessment and remediation vapor intrusion investigation and mitigation site investigation and characterization EDUCATION B.S., Bioenvironmental Engineering, Rutgers School of Engineering, New Brunswick, New
Jersey, 2010
CAREER SUMMARY
Mr. Brisman is an Engineer in the Princeton, New Jersey office with more than four years of consulting experience. Since joining Geosyntec, Mr. Brisman has had a central role in the New Jersey office vapor intrusion practice. He has led several vapor intrusion investigations as well as managed the installation and design of various mitigation systems. Mr. Brisman has also been as an active member of the Geosyntec sediments practice. He has worked extensively on the Berry’s Creek Study Area (BCSA) mega-site RI/FS in New Jersey as well as various components of the Remedial Design for the Gowanus Canal Superfund Site in Brooklyn, New York. Mr. Brisman has also gained experience characterizing sites with both groundwater and soil contamination. Highlights of Mr. Brisman’s relevant experience are provided below:
REPRESENTATIVE EXPERIENCE Sediment Assessment and Remediation
Remedial Investigation and Feasibility Study, Berry’s Creek Study Area, Bergen County, New Jersey. 2009-present. Mr. Brisman has participated in the planning and implementation of the Remedial Investigation (RI) and Feasibility Study (FS) for the Berry’s Creek Study Area (BCSA) mega-site. Mr. Brisman’s involvement in the remedial investigation portion of the project includes the following:
• Since August 2014, Mr. Brisman has served as phase/task manager for the Biota program. His responsibilities have included the direct management of field teams, planning and coordinating sampling efforts, and management of budgets and scheduling.
• Mr. Brisman has acted as the field team leader for the Surface Water baseline monitoring program on several occasions. During this time, Mr. Brisman managed the installation of automated samplers as well as the deployment of field teams for manual sampling efforts.
JARED B. BRISMAN, EIT
2
• Mr. Brisman led field efforts associated with the installation, development, and sampling of marsh monitoring wells. Interactions and interflow characterization between marshes and waterway were also conducted through the sampling of marsh runoff.
• Mr. Brisman was responsible for the programming, deployment, and maintenance of remote cameras used to evaluate human use of the site for use in a human health risk assessment.
• Mr. Brisman has studied the relationship between chlorophyll-a to TSS concentrations in site surface water in an attempt to provide data to support the conceptual site model of sediment balance in the Berry’s Creek System. Surface water sampling was conducted concurrently with chlorophyll-a measurements.
• Mr. Brisman has studied the transport of sediment into and out of the Berry’s Creek system using automated samplers, optical and pygmy velocity measurements, and water quality instruments.
• Mr. Brisman has supported field efforts associated with the in situ redox profiling of marsh and waterway sediments at the site. This study utilized voltammetric microelectrodes to evaluate the spatial and temporal evolution of redox conditions present within site sediments and help inform the mercury and manganese conceptual site model (CSM).
• Mr. Brisman has sampled a variety of media at the site including marsh and waterway sediment, marsh and waterway pore water, surface and interflow water, vegetation, marsh invertebrates, benthic organisms, and ambient air. Collection of marsh sediment samples included the development of custom sampling devices and methods.
Mr. Brisman’s involvement in the FS portion of the project includes the following:
• Mr. Brisman has served as phase/task manager for the pilot study performance monitoring program. Monitoring of the thin-layer sediment capping pilot tests has included the collection of physical, chemical, and biological data through periodic core collection, surface elevation measurements, sediment and pore water sampling, and benthic community surveys and bioaccumulation studies.
Remedial Design, Gowanus Canal Superfund Site, National Grid, Brooklyn, New York. Mr. Brisman has assisted in developing various project control related documents, those of which include remedial design schedules, work breakdown structure charts, and cash flow spreadsheets. Mr. Brisman also provided significant authorship support for the development of a project pre-design work plan.
JARED B. BRISMAN, EIT
3
Vapor Intrusion Investigation and Mitigation
Vapor Intrusion Investigation and Mitigation at Residential and Commercial Properties, Confidential Client, New Jersey. Mr. Brisman has served as Task Manager for an extensive vapor intrusion investigation of chlorinated solvents downgradient of a former semi-conductor manufacturing facility. He performed sub-slab and soil gas investigations as well as Oversight and Maintenance (O&M) for the sub-slab depressurization systems installed at one commercial and nine residential buildings. Mr. Brisman developed O&M plans, prepared occupant notification letters as well as mitigation system progress reports.
Vapor Intrusion Investigation, Former Manufactured Gas Plants, Confidential Client, New Jersey/Pennsylvania. Mr. Brisman has served as Project Manager for multiple vapor intrusion investigations of former manufactured gas plants in New Jersey and Pennsylvania. Responsibilities associated with these projects included the development of site specific works plans, collection of sub-slab and indoor air samples, evaluation of data, and reporting to respective regulatory agencies.
Vapor Intrusion Mitigation and Retrofitting at Commercial Business Park, Confidential Client, Edison, New Jersey. Mr. Brisman has served as Task Manager for the installation and retrofitting of multiple sub-slab depressurization systems (both passive and active venting systems) for commercial facilities built on an extensive chlorinated solvent groundwater plume. He oversaw and had hands-on involvement in the diagnostic testing, design, and installation of a passive (solar powered) mitigation system at one of the commercial properties. Both sites require annual inspections and progress reports to document system performance and mass removal rates. Vapor Intrusion Investigation, Former Manufacturing Facility, Former Ingersoll Rand Facility, Phillipsburg, New Jersey. Mr. Brisman has served as Task Manager for a project that included the evaluation of historic groundwater and geologic data for development of a vapor intrusion work plan, including subsurface investigations and indoor air testing. Mr. Brisman served as the vapor intrusion lead on the project and conducted a full-scale vapor intrusion investigation which resulted in a long-term monitoring program for one of the commercial properties located on the site.
Vapor Intrusion Investigation, North Penn Area 5 Superfund Site, Confidential Client, Colmar, Pennsylvania. Mr. Brisman has served as Task Manager for a vapor intrusion investigation for a TCE release site under USEPA Region 3 CERCLA. Responsibilities included the collection of sub-slab vapor, evaluation of data, and development of a Remedial Action Plan (RAP).
Vapor Intrusion Mitigation Evaluation, Philadelphia Freedom Valley YMCA, Confidential Client, Havertown, Pennsylvania. Mr. Brisman has served as Task Manager for a project that included the evaluation of a newly constructed building with a cupolex vapor venting system. System design specifications were reviewed and indoor air and void space vapor testing were performed using EPA TO-17 method.
JARED B. BRISMAN, EIT
4
On-Site and Off-Site Vapor Intrusion Investigation and Mitigation, Former Dry Cleaning Facility, Confidential Client, Belleville, New Jersey. Mr. Brisman has served as Task Manager for an extensive vapor intrusion investigation of chlorinated solvents at a former dry cleaning facility. The site is located adjacent to a mixed use residential and commercial area, so a clear community relation plan with regard to vapor intrusion was a concern for the responsible party. He performed sub-slab and soil investigations as well as the installation, design and O&M of a sub-slab depressurization system at one commercial property.
Site Investigation and Characterization
Somerville Landfill Redevelopment Project, Borough of Somerville, Somerset County, New Jersey. Mr. Brisman performed site and remedial investigations associated with the redevelopment of a former municipal solid waste landfill, and assisted in the development of the Remedial Investigation Report.
Former Ingersoll Rand Facility, Ingersoll Rand, Phillipsburg, New Jersey. Mr. Brisman was responsible for preparing a field sampling plan to investigate and delineate impacted soils at the former manufacturing facility. He also developed the Sampling Procedures Manual for the groundwater treatment system which is currently used by the site O&M subcontractor.
Trane-Trenton Manufacturing Facility, Trenton, New Jersey. Mr. Brisman was responsible for conducting a remedial investigation of impacted soils at the manufacturing facility. Responsibilities included developing a field sampling plan, coordinating sub-contractors, managing and implementing the field effort, and evaluating the results. Results of the investigation were used to support the development of a Remedial Action Report (RAR).
PROFESSIONAL EXPERIENCE Geosyntec Consultants, Chicago/Oak Brook, Illinois, Co-Op Intern, 2009-2010
Geosyntec Consultants, Princeton, New Jersey, 2010-present
PROFESSIONAL DEVELOPMENT AND TRAINING Project Management I Training, June 2013
Boating Safety Education Certificate, State of New Jersey, Marine Services Bureau, June 2010
OSHA 40-hour Hazardous Waste Operations and Emergency Response (HAZWOPER) Training, May 2009

JARED B. BRISMAN, EIT
5
DOT Hazardous Materials Shipping for Environmental Professionals, April 2010
American Red Cross First Aid and CPR Certified
TEACHING EXPERIENCE
Rutgers University, Office of Continuing Professional Education, New Brunswick, New Jersey, 2013-2014. NJDEP Vapor Intrusion Guidance, Instructor
RESEARCH Use of Dehalococcoides in the Dechlorination of PCBs, Rutgers University Environmental Science Lab, New Jersey. Mr. Brisman studied the degradation of PCB compounds via a unique Rutgers species of dehalococcoides.
Use of Thermophilic Bacteria in the Anaerobic Degradation of BTEX, Rutgers University Microbiology Lab, New Jersey. Mr. Brisman sequenced the genes responsible for the degradation of BTEX in anaerobic conditions.
Green Roof Development, Rutgers University Water Resources Department, New Jersey. Mr. Brisman developed a green roof for a building in Hackensack, New Jersey, and modeled the runoff.
South Jersey Stormwater Management Project, Rutgers University Water Resources Department, New Jersey. Mr. Brisman used Hydrocad and HEC-RAS to model the floodplain of a river in South Jersey. The model was used to help alleviate stormwater runoff issues in the area.
Matthew Mraw site assessment environmental sampling data management
EDUCATION
B.S., Biology, James Madison University, Harrisonburg, Virginia, 2011
CAREER SUMMARY
Mr. Mraw’s career experience includes groundwater, surface water, soil, biota and sediment sampling. He has broad field experience in planning, organizing, and leading groundwater sampling events. He has gained comprehensive boating and waterway sampling experience through his work at the Berry’s Creek Superfund Site in Northern New Jersey. Matthew has extensive experience with Vapor Intrusion monitoring and site assessment, and mitigation for vapor intrusion.
REPRESENTATIVE EXPERIENCE
Remedial Investigation of Berrys Creek Superfund Site, Bergen County, New Jersey. Participated in the implementation of the remedial investigation field campaign and feasibility studies for the Berry’s Creek Study Area (BCSA), a USEPA Superfund sediment mega-site. Mr. Mraw’s involvement in the large-scale complex remedial investigation includes the following:
• Sediment Investigation: via waterway and marsh coring. Collected and processed high resolution marsh and waterway cores and assisted with sampling along 2 cm intervals. Box coring, 4 inch and 8 inch polycarbonate vibracoring, hand coring. Analytes collected included TAL metals, mercury, methyl mercury, PCBs, pesticides, ammonia, nitrate, sulfate, as well as BOD, COD, TOC and DOC.
• Sediment Capping: Construction oversight for thin-layer sediment capping pilot tests in tidally influenced marsh and mudflat environments with sand and granular activated carbon as capping material. Verification of cap construction specifications to a cm-scale through monitoring of surface elevations and cap thicknesses. Monitoring of cap stability and integrity under a variety of hydrodynamic conditions through periodic core collection, visual confirmation of cap thickness, surface elevation measurements, and time-lapsed photography
• Biota Investigation: collection of fiddler crabs, amphipods, and arachnids.
Matthew L. Mraw
Page 2
• Surface Water sampling: both automated and manual collection of surface water. Automated devices included ISCOs while manual collection used peristaltic pumps. Analytes collected included TAL metals, mercury, methyl mercury, PCBs, pesticides, ammonia, nitrate, sulfate, as well as BOD, COD, TOC and DOC.
Remedial Activities of Gowanus Canal Superfund Site, Brooklyn, New York. Participated in remedial and investigation activities including, sediment sampling, geotechnical sampling, groundwater sampling, UVOST, TarGOST, and CPT investigations, Vibrating Wire Piezometers installation and monitoring, and ISS oversight.
• Sediment Sampling: collected continuous soft sediment samples via sonic drilling. Samples were collected on barges within the canal waterway.
• Groundwater Sample and Investigation: installed temporary wells with inflatable packers and sample groundwater for laboratory analysis. Installed vibrating wire piezometers for monitoring of groundwater flow. Conducted OMM of equipment.
• Geotechnical Sampling, collected split spoon sample and Shelby tube samples for geotechnical analysis. Conducted dust monitoring during drilling activities.
• ISS Oversight: Conducted oversight of In-Situ Stabilization and Solidification of sediments.
Environmental Soil Remediation, Oakhurst, New Jersey. Conducted construction oversight of contractors for excavation of impacted soils. Collected post excavation samples for laboratory analysis.
Environmental Soil Remediation, Former Industrial Facility, Confidential Client, Newark, New Jersey. Conducted air monitoring with collection of time integrated samples for air permitting during excavation and processing of soils.
Bio-remediation, Merck Stonewall Facility, Conducted pull-push bio remediation with injection of KB1 bacteria culture for reductive de-chlorination of chlorinated. Coordinated field efforts for injection of bacteria at two well locations.
Vapor Intrusion, conducted construction oversight for installation of an active vapor mitigation system. Conducted routine inspection and monitoring of the system including sampling.
MtBE Litigation Support, Assisted with an investigation into potential sources of
Matthew L. Mraw
Page 3
MtBE impacting municipal water supply wells. Developed in-depth site reviews for locations with MtBE groundwater plumes.
Environmental Sampling, Former Manufacturing Facility, Confidential Client, Phillipsburg, New Jersey. Performed low flow groundwater sampling, passive diffusion bag well sampling, soil sampling, and construction oversight.
Environmental Monitoring, Confidential Client, Voorhees Township, New Jersey. Performed general gauging and well monitoring work at this closed disposal site. Operation and maintenance of air injection system.
Environmental Sampling, Somerville Landfill, Somerville, New Jersey, Planned, organized and led groundwater sampling events.
Environmental Sampling, Former Industrial Facility, Confidential Client, Newark, New Jersey. Performed groundwater sampling, with use of peristaltic pump and hydraulic lift. He also performed test pitting, and oversight of TaRGOSt
Environmental Monitoring, Active HVAC Manufacturing Facility, Confidential Client, Trenton, New Jersey. Performed construction oversight and LNAPL recovery from monitoring wells.
Environmental Sampling, Dublin NPL Site, Dublin, Pennsylvania. Performed low flow groundwater sampling.
Wetlands Investigation, Rail Yard Property, Confidential Client, New Jersey. Performed wetlands delineation and wetlands assessment of site.
Vapor Intrusion Investigation, Raritan Arsenal, New Jersey. Monitored mitigation systems (both passive and active venting systems) for industrial facility built on former military arsenal. Collected composite air samples using waterloo membrane samplers as well as summa canisters.
Vapor Intrusion Investigation, Former GE/RCA Facility, Bridgewater, New Jersey. Performed indoor, outdoor, sub-slab, sump and passive venting system vapor sampling at several residences near a former manufacturing facility.
Environmental Sampling, Former Manufacturing Facility, Confidential Client, East Hanover New Jersey. Performed low flow groundwater sampling.
PROFESSIONAL EXPERIENCE
Geosyntec Consultants, Princeton, New Jersey, 2011 – Present

Matthew L. Mraw
Page 4
ADDITONAL TRAINING AND CERTIFICATIONS
OSHA 40-Hour HAZWOPER CPR and First Aid 8-Hour HAZWOPER Site Supervisor Training Boating Safety Certificate/License NJ Lab Manager
Darius Mali Senior Staff Scientist
soil gas investigation STAR ex situ testing
ZVI PRB injection groundwater investigation and remediation EISB treatment system design
atmospheric pollutants
EDUCATION
M.A.Sc., Environmental Engineering, University of Guelph, Guelph, Ontario, 2013 B.Eng., Environmental Engineering, University of Guelph, Guelph, Ontario, 2011
CAREER SUMMARY
Mr. Mali is a senior staff scientist in the Vapour Intrusion group of Geosyntec Consultant’s Guelph operations. Mr. Mali has experience in environmental consulting including self-sustaining active remediation (STAR) ex-situ testing, zero valent iron (ZVI) permeable reactive barrier (PRB) construction oversight, excavations, ground water sampling, soil vapor sampling, high volume sampling (HVS) and investigation of atmospheric pollutants. Since starting his full-time position at Geosyntec, he has become involved in a number of projects in which he has performed detailed engineering designs, engineering calculations, process design and review, equipment selection, system construction and testing, sample collection, data management, and technical writing.
Soil Gas Investigation and Remediation
MOECC Peterborough, Peterborough Ontario. The senior staff scientist took quarterly soil gas samples from probes as part of an ongoing study. Three of the four quarters limited probes were sampled, and annually a comprehensive sampling event of the probes was completed. New soil gas probes were installed on Romaine St and Brioux Ave, and sampled as part of the annual event. Some low vacuum/flow sampling techniques were used when encountering water in order to collect a sample.
Highschool, Former Industrial Site, NY. Senior staff scientist performed high volume sampling (HVS) as part of a vapour intrusion study. This project was time sensitive and 23 locations had to be completed in 2 days. Prior planning was crucial to help this program run smoothly. HVS was used to test the permeability and to sample the soil at a larger radius. Communication testing was also completed to determine the
Darius Mali, B.Eng., M.A.Sc. EIT Page 2
connectivity of the subsurface, which helped to design the soil vapour extraction system.
ESTCP – HVS, Demonstration/Validation of More Cost-Effective Methods for Mitigating Radon and VOC Subsurface Vapor Intrusion to Indoor Air, Edison, NJ. Senior staff scientist tested different methods to help validate models used by the vapour intrusion team. A number of tracer tests to determine the flow rate of soil gas were performed using helum, radon and formaldehyde. Testing was also done to determine the leakiness of the concrete slab of a building. Transient testing and static vacuum testing was also performed to determine the effectiveness and efficiency of the system.
Metal Parts Manufacturer, - Investigation of Onsite VOCs, Indianapolis, IN. Senior staff scientist lead a high volume sampling (HVS) campaign to evaluate the extent and level of potential VOCs in the subsurface. Building walk-through, exact locations of HVS probes and overseeing that the testing was executed properly were part of the responsibilities. A demonstration was also given for the Indiana Department of Environmental Management, who had never seen this method used.
Bridgewater, Corporate Environmental Programs, Bridgewater, NJ. Senior staff scientist preformed soil gas sampling from probes previously installed in the ground. Special low flow techniques were needed due to the low permeability of the soil.
Tidewater Service Center, Corporate Environmental Programs, Chesapeake, VA. Senior staff scientist drilled holes in the concrete slab of a warehouse, installed sampling probes and preformed sub-slab samples of the soil vapors. High volume sampling was also performed to test the permeability and sample the soil at a larger radius.
Equipment Manufacturer, Springfield, OH. Senior staff Scientist went to residences to evaluate the potential for vapour intrusion. A survey was completed by the homeowner under the instruction of the staff scientist. The details of the survey can indicate possible preferential pathways or household items that may interfere with indoor air sampling. Upon completion of the survey indoor air samples were taken using summa canister. If a crawlspace was present a sample was taken in that location and if a basement was present a sub-slab sample was taken instead.
Former Manufacturing Facility, Plymouth, MI. Senior staff scientist lead a team to preform high volume sampling (HVS) at a facility to evaluate the extent and magnitude of possible VOCs beneath the slab. This project had employees in the building and working so creative solutions were used to route the exhaust tubing through dropped ceilings so that a tripping hazard was not created. HVS was used to test the
Darius Mali, B.Eng., M.A.Sc. EIT Page 3
transmissivity of the soil, the leakage of the slab and to sample the soil at a larger radius. Communication testing was also completed to determine the connectivity of the subsurface. All of this data helped to design the soil vapour extraction system.
Former Manufacturing Facilty, Belleville, ON. Senior staff Scientist led the vapour intrusion study. This included installing soil gas wells, sampling the soil gas wells using standard operating procedures, performing tracer testing in the fractured rock with helium to identify pathways and sampling residential homes for possible vapour intrusion risks.
Former Dry Cleaning Facility, Belleville NJ. Senior Staff Scientist led a high volume sampling study to determine the extent of a plume. The install of probes and testing was done in the evenings and weekends to accommodate the operations in the facility. Helium tracer tests were also performed to help identify possible pathways, footers or areas that are disconnected from the footprint of the high volume sampling tests.
STAR Ex Situ Testing
Treating Hydrocarbon Waste, London, ON. Senior staff scientist performing vapour sampling, data collection and analysis. In addition to performing on-site trouble shooting of vapour analyzers and equipment.
ZVI PBR Injection
Dry Cleaning Facility, Granby, QC. Senior staff scientist performing installation oversight of the installation of a permeable zero valent iron reactive barrier. Provided documentation of borehole installation and injection of ZVI and was acting client representative on site for incident mitigation.
Excavations
Tool Manufacturing, Excavation Activities, St. Catharines, ON. Senior staff scientist met with representatives for a site walk to evaluate the course of action. Excavation was performed and soil samples taken at multiple intervals, screened and sent for testing as needed per Ontario regulations. A report detailing the excavation and sample results was also produced based on risk based calculations and analysis of the data collected.
Groundwater Investigation and Remediation
Former Manufacturing Facility , Burlington, ON. Senior staff scientist performed water level monitoring and groundwater sampling using a variety of techniques, including documentation of activities and adherence to company sampling procedures.
Darius Mali, B.Eng., M.A.Sc. EIT Page 4
Former Manufacturing Facility - Mississauga, Mississauga, ON. Senior staff Scientist preformed a survey of the wells, sampling of the wells using multiple techniques depending on the depth of the well. Work was preformed both indoors and outdoors in a sensitive manner as to not upset the flow of work taking place. Well repair and construction oversight was preformed to ensure quality of work, on those wells in need of repair.
Confidential Client, Newark, NJ. Senior staff scientist preformed groundwater sampling and falling and rising head hydraulic response tests. The site was heavily contaminated, so special attention to proper personal protective equipment and decontamination between wells was of high priority. The hydraulic conductivity and water sampling was also performed using the Waterloo Profiler.
EISB Treatment System Design
Former Manufacturing Facility, Troy MI. Senior staff scientist performed oversight on emulsified vegetable oil (EVO) for use in an ongoing bioremediation system. The site presented multiple geological conditions which required extemporaneous decisions to keep the injections going while still getting proper coverage. Operational conditions had to be recorded and monitored closely and adjusted as needed.
Chemtronics, Swannanoa, NC. Senior staff scientist performing pipe and pump sizing calculations, equipment selection and layout, and technical drawing development and editing for an enhanced in-situ bioremediation (EISB) system.
Deer Park, East Melbourne, VIC. Senior staff scientist preformed evaluation of the needs for an enhanced in-situ bioremediation (EISB) system and recommended pipe sizes, pump models and other specifications. Developed and edited technical drawings, and developed and operation and maintenance (O&M) document to aid operators.
Atmospheric Pollutant Investigation
AGGP, University of Guelph, New Hamburg, ON. Senior staff scientist performing experimental design, continuous emissions monitoring, data analysis and production of technical reports and presentations.
PROFESSIONAL EXPERIENCE
Geosyntec Consultants, Guelph, Ontario, 2013 – Present Ontario Ministry of the Environment, Toronto, Ontario, 2010-2011 Kerr Wood Leidal Consultants, Burnaby, British Columbia, 2009 BM Ross Consultants, Goderich, Ontario, 2007
Darius Mali, B.Eng., M.A.Sc. EIT Page 5
CONFERENCE PROCEEDINGS AND PUBLICATIONS
16-01 Resilient Infrastructure 2016 conference: New Methods for Design and Performance Monitoring of Sub-slab Venting Systems for VOCs and Radon.
13-01 American society of Agricultural and Biological Engineers 2013 conference: Emission Inventory of Atmospheric Pollutants from a Combined Commercial Dairy Facility.
13-02 International Greenhouse Gasses and Animal Agriculture 2013 conference: Emission Inventory of Ammonia and Methane from a Commercial Holstein Dairy Farm.
12-01 Canadian Association of Biological Engineers 2012 conference: Protocol for measuring the impact of Agriculture Animal Housing on Local Air Quality.
Lukas Gillham watershed systems design Staff Engineer urban water management design soil water conservation
EDUCATION
B.Eng., Water Resources, University of Guelph, 2011 - 2015
CAREER SUMMARY
Mr. Gillham is a Staff Engineer in the Vapour Intrusion group of Geosyntec Consultant’s Canadian operations.
Watershed Systems Design
U of G project, Ontario. This design project involved a dam in southern Ontario that was in need of repair or replacement and developing a 3-phase report to address the problem. A phase I report was completed which involved an extensive literature review of the dam and the contributing watershed. This involved using tools such as OFATIII and GIS to collect watershed data such as land use, soil conditions, peak flows, and low flows. Phase II of the report determined the dams effectiveness in providing flood control using a design storm with a 2 year return period. Phase III required the theoretical removal of the dam and development of a natural stream. HEC-RAS software was used to model the stream.
Urban Water Management Design
U of G project, Ontario. A storm water management pond was designed for a recently developed subdivision. EPA-SWMM modeling software was used to analyze the effectiveness of the pond design. The second part of the design project was to implement LID (low impact development) features into the developed area and compare the results using EPA-SWMM.
Soil Water Conservation
U of G project, Ontario. A 120 hectare piece of land located in the Grand River Watershed required drainage. An initial topographic analysis was carried out to determine water flow direction. Soil classes were taken into account to determine locations that needed surface, subsurface or both drainage systems. A cost estimate was completed taking into account governmental grants and current interest rates.
Lukas, Gillham, B.Eng. Page 2
PROFESSIONAL EXPERIENCE
Geosyntec Consultants Inc., Guelph, ON, 2016-present University of Guelph, Research Assistant, ON, 05, 2015-09, 2015 Geosyntec Consultants Inc., Guelph, ON, 05, 2014-09, 2014 Uxbridge Roads Department, ON, 05-09, 2012 and 2013
COURTNEY L. THOMAS, Ph.D., E.I.T. sediment capping and remediation site assessment and monitoring passive sampling
EDUCATION
PhD, Civil Engineering, University of Texas at Austin, Austin, Texas, 2014 MS, Environmental Engineering, University of Texas at Austin, Austin, Texas, 2011 BE, Chemical and Biomolecular Engineering, Vanderbilt University, Nashville,
Tennessee, 2010 BS, Mathematics, Vanderbilt University, Nashville, Tennessee, 2010
CAREER SUMMARY
Dr. Thomas is an environmental engineer in the Princeton, New Jersey office specializing in contaminant attenuation processes in sediment environments. Dr. Himmelheber is particularly knowledgeable regarding passive sampling methods for hydrophobic organic contaminants, fate and transport of contaminants, and capping as a remediation tool. Dr. Thomas’ doctoral dissertation investigated passive sampling as a monitoring tool to assess sediment cap performance. Dr. Thomas has authored multiple research papers on the use of passive samplers and performance reference compounds to determine the fraction of steady state achieved between the pore water and passive sampling material. At Geosyntec, she has been a central member of a design team to commercialize passive samplers and has been a part of field efforts to characterize contaminant distribution
REPRESENTATIVE EXPERIENCE
Remedial Investigation and Feasibility Study of Berry’s Creek Study Area, Bergen
County, New Jersey. Participated in the implementation of the remedial investigation field campaign and feasibility studies for the Berry’s Creek Study Area (BCSA), a USEPA Superfund sediment mega-site. Dr. Thomas’ involvement in the large-scale complex remedial investigation includes the following:
Sediment Investigation: via waterway and marsh coring. Collected and processed high resolution marsh and waterway cores and assisted with sampling along 2 cm intervals. Box coring and hand coring. Analytes collected included TAL metals, mercury, methyl mercury, PCBs, pesticides, ammonia, nitrate, sulfate, as well as BOD, COD, TOC, and DOC.
Sediment Capping: Monitoring of cap stability and integrity under a variety of hydrodynamic conditions through periodic core collection, visual
Courtney L. Thomas, Ph.D., E.I.T. Page 2
confirmation of cap thickness, and surface elevation measurements. Surface Water Sampling: Planned, organized, and led surface water
sampling via automated samplers (ISCOS) as well as water quality and velocity measurement devices. Field activities performed include both automated and manual collection of surface water. Automated devices included ISCOs while manual collection used peristaltic pumps. Analytes collected included TAL metals, mercury, methyl mercury, PCBs, pesticides, ammonia, nitrate, sulfate, as well as BOD, COD, TOC and DOC.
Remedial Activities of Gowanus Canal Superfund Site, Brooklyn, New York. Participated in remedial and investigation activities including, sediment sampling, geotechnical sampling, and vibrating wire piezometers installation and monitoring.
Sediment Sampling: Collected continuous soft sediment samples via sonic drilling. Samples were collected on barges within the canal waterway.
Groundwater Sampling: Installed vibrating wire piezometers for monitoring of groundwater flow. Conducted OMM of equipment.
Geotechnical Sampling: Collected split spoon sample and Shelby tube samples for geotechnical analysis.
Vapor Intrusion Investigation, G&K Facility, Belleville, New Jersey. Performed indoor, outdoor, and high volume vapor sampling at the operations and storage building of a historic industrial dry cleaning operation. Performed off-site long-term monitoring plans at residential and commercial buildings near the G&K facility. Assisted with data manipulation and inference.
Vapor Intrusion Investigation, Former GE/RCA Facility, Bridgewater, New Jersey. Performed indoor, outdoor, sub-slab, sump and passive venting system vapor sampling at several residences near a former manufacturing facility.
Environmental Sampling, Somerville Landfill, Somerville, New Jersey, Performed low flow groundwater sampling events.
Environmental Monitoring, Active HVAC Manufacturing Facility, Confidential Client,
Trenton, New Jersey. Planned, organized, and led low flow groundwater sampling events pre- and post bioinjections.
PROFESSIONAL EXPERIENCE
Geosyntec Consultants, Ewing, New Jersey, 2015 – Present; University of Texas at Austin, Graduate Research Assistant, 2010 – 2015 Texas A&M University, Summer Undergraduate Research Fellow, 2009
Courtney L. Thomas, Ph.D., E.I.T. Page 3
PROFESSIONAL DEVELOPMENT AND TRAINING
Boating Safety Education Certificate, New Jersey, 2015 Occupational Safety and Health Administration (OSHA) 40-hour Hazardous Waste
Operations and Emergency Response (HAZWOPER) Training American Red Cross First Aid and CPR Certified Engineer in Training
REPRESENTATIVE PUBLICATIONS
15-02 Courtney Thomas and Danny D. Reible, Modeling Compound Loss from PDMS Passive Samplers, Chromatography, October 2015, Pages 611-624.
15-01 David J. Lampert, Courtney Thomas, and Danny D. Reible, Internal and
external transport significance for predicting contaminant uptake rates in passive samplers, Chemosphere, Volume 119, January 2015, Pages 910-916.
14-01 Courtney Thomas, David J. Lampert, and Danny D. Reible, Remedy performance monitoring at contaminated sediment sites used profiling solid phase microextraction (SPME) polydimethylsiloxane (PDMS) fibers, Environmental Science: Processes & Impacts, March 2014, Pages 445-452.
REPRESENTATIVE PRESENTATIONS 1. H. Bottcher, H. Orlean, S. Sheldrake, K. Carbonneau, R. Moore, D. Reible, C. Thomas.
Evaluating Sediment Porewater and Surface Water Column PAH Concentrations in a Marine Intertidal Environment Using In Situ SPME PDMS Samplers. Eighth International Conference on Remediation of Contaminated Sediments, New Orleans LA. January 12-15th, 2015.
2. C. Thomas, D. Reible, P. Schroeder, K. Gustavson, M. Mills, A. Mucha, H. Williams.
Characterization of PAH Fate and Transport Utilizing SPME-PDMS to Address Cap Effectiveness at the West Branch of the Grand Calumet River. Eighth International Conference on Remediation of Contaminated Sediments, New Orleans LA. January 12-15th, 2015.
3. C. Thomas, D. Reible, M. Mills, H. Williams, K. Gustavson, P. Schroeder. Monitoring Cap
Effectiveness Over Time Using Profiling SPME: A Case Study of the West Branch Grand Calumet River. SETAC North America 34th Annual Meeting, Nashville TN. November 17-21st, 2013.
4. C. Thomas, D. Reible. Monitoring PAH Levels using Profiling SPME at Contaminated Sediment Sites. ISPAC 2013. Corvallis OR. September 9-12th, 2013.
Courtney L. Thomas, Ph.D., E.I.T. Page 4
5. C. Thomas, D. Reible, X. Lu, M. Michalsen, J. Wakeman, K. Kerns, H. Orlean, J. Barton, T. Thompson. Monitoring Cap Effectiveness Using Bulk Sediment and Passive Porewater Sampling at the Wyckoff/Eagle Harbor Superfund Site. Seventh International Conference on Remediation of Contaminated Sediments, Dallas TX. February 4-7th, 2013.
6. D. Reible, C. Thomas, X. Lu, D. Lampert. Monitoring Sediment Cap Performance with
Profiling SPME. Seventh International Conference on Remediation of Contaminated Sediments, Dallas TX. February 4-7th, 2013.
7. D. Reible, C. Thomas, X. Lu, D. Lampert. Monitoring Sediment Cap Performance with
Profiling SPME. SETAC North America 33rd Annual Meeting, Long Beach CA. November 11-15th, 2012.
8. C. Thomas, D. Reible, X. Lu, M. Michalsen, J. Wakeman, K. Kerns, H. Orlean, J. Barton,
T. Thompson. Monitoring Cap Effectiveness Using Bulk Sediment and Passive Porewater Sampling at the Wyckoff/Eagle Harbor Superfund Site. SETAC North America 33rd Annual Meeting, Long Beach CA. November 11-15th, 2012.
9. C. Thomas, D. Reible, X. Lu, D. Lampert. Monitoring Sediment Cap Performance with
Profiling SPME. 5th International Passive Sampling Workshop and Symposium, Columbia MO. September 11-12th, 2012.
TR0641 March 2016
APPENDIX D
Statement of Qualifications

vapor intrusion services
Statement of Qualifications
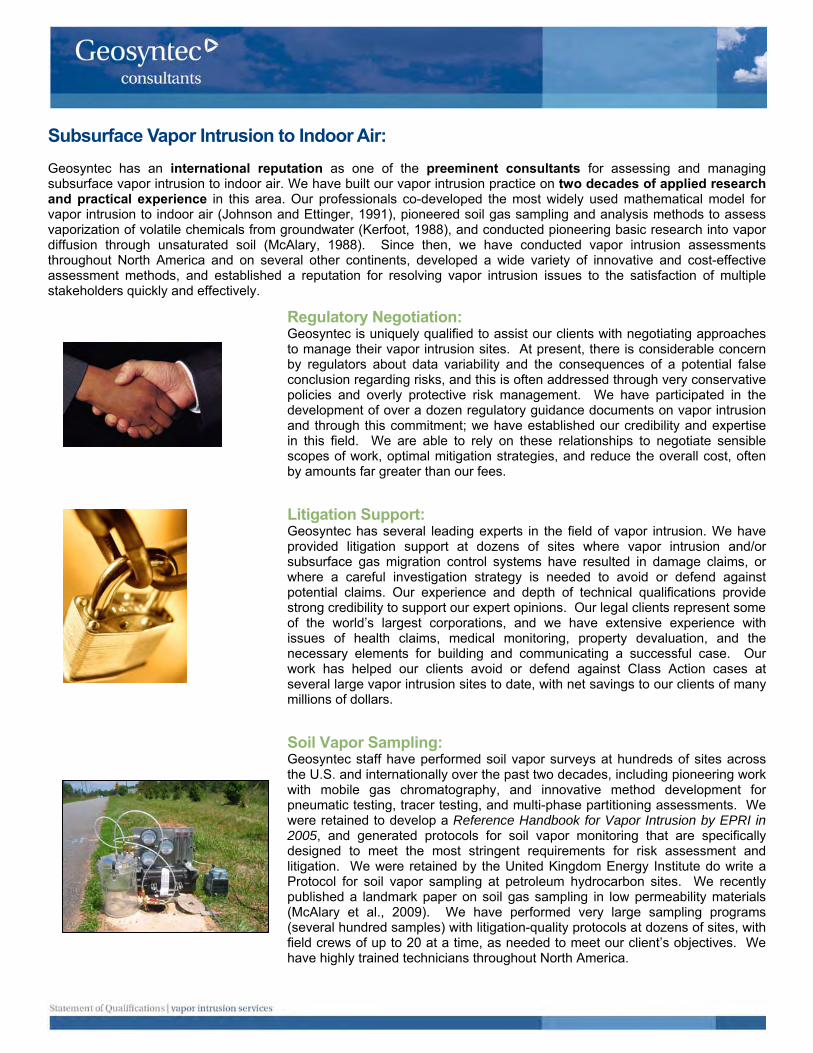
Subsurface Vapor Intrusion to Indoor Air: Geosyntec has an international reputation as one of the preeminent consultants for assessing and managing subsurface vapor intrusion to indoor air. We have built our vapor intrusion practice on two decades of applied research and practical experience in this area. Our professionals co-developed the most widely used mathematical model for vapor intrusion to indoor air (Johnson and Ettinger, 1991), pioneered soil gas sampling and analysis methods to assess vaporization of volatile chemicals from groundwater (Kerfoot, 1988), and conducted pioneering basic research into vapor diffusion through unsaturated soil (McAlary, 1988). Since then, we have conducted vapor intrusion assessments throughout North America and on several other continents, developed a wide variety of innovative and cost-effective assessment methods, and established a reputation for resolving vapor intrusion issues to the satisfaction of multiple stakeholders quickly and effectively.
Regulatory Negotiation: Geosyntec is uniquely qualified to assist our clients with negotiating approaches to manage their vapor intrusion sites. At present, there is considerable concern by regulators about data variability and the consequences of a potential false conclusion regarding risks, and this is often addressed through very conservative policies and overly protective risk management. We have participated in the development of over a dozen regulatory guidance documents on vapor intrusion and through this commitment; we have established our credibility and expertise in this field. We are able to rely on these relationships to negotiate sensible scopes of work, optimal mitigation strategies, and reduce the overall cost, often by amounts far greater than our fees.
Litigation Support: Geosyntec has several leading experts in the field of vapor intrusion. We have provided litigation support at dozens of sites where vapor intrusion and/or subsurface gas migration control systems have resulted in damage claims, or where a careful investigation strategy is needed to avoid or defend against potential claims. Our experience and depth of technical qualifications provide strong credibility to support our expert opinions. Our legal clients represent some of the world’s largest corporations, and we have extensive experience with issues of health claims, medical monitoring, property devaluation, and the necessary elements for building and communicating a successful case. Our work has helped our clients avoid or defend against Class Action cases at several large vapor intrusion sites to date, with net savings to our clients of many millions of dollars.
Soil Vapor Sampling: Geosyntec staff have performed soil vapor surveys at hundreds of sites across the U.S. and internationally over the past two decades, including pioneering work with mobile gas chromatography, and innovative method development for pneumatic testing, tracer testing, and multi-phase partitioning assessments. We were retained to develop a Reference Handbook for Vapor Intrusion by EPRI in 2005, and generated protocols for soil vapor monitoring that are specifically designed to meet the most stringent requirements for risk assessment and litigation. We were retained by the United Kingdom Energy Institute do write a Protocol for soil vapor sampling at petroleum hydrocarbon sites. We recently published a landmark paper on soil gas sampling in low permeability materials (McAlary et al., 2009). We have performed very large sampling programs (several hundred samples) with litigation-quality protocols at dozens of sites, with field crews of up to 20 at a time, as needed to meet our client’s objectives. We have highly trained technicians throughout North America.
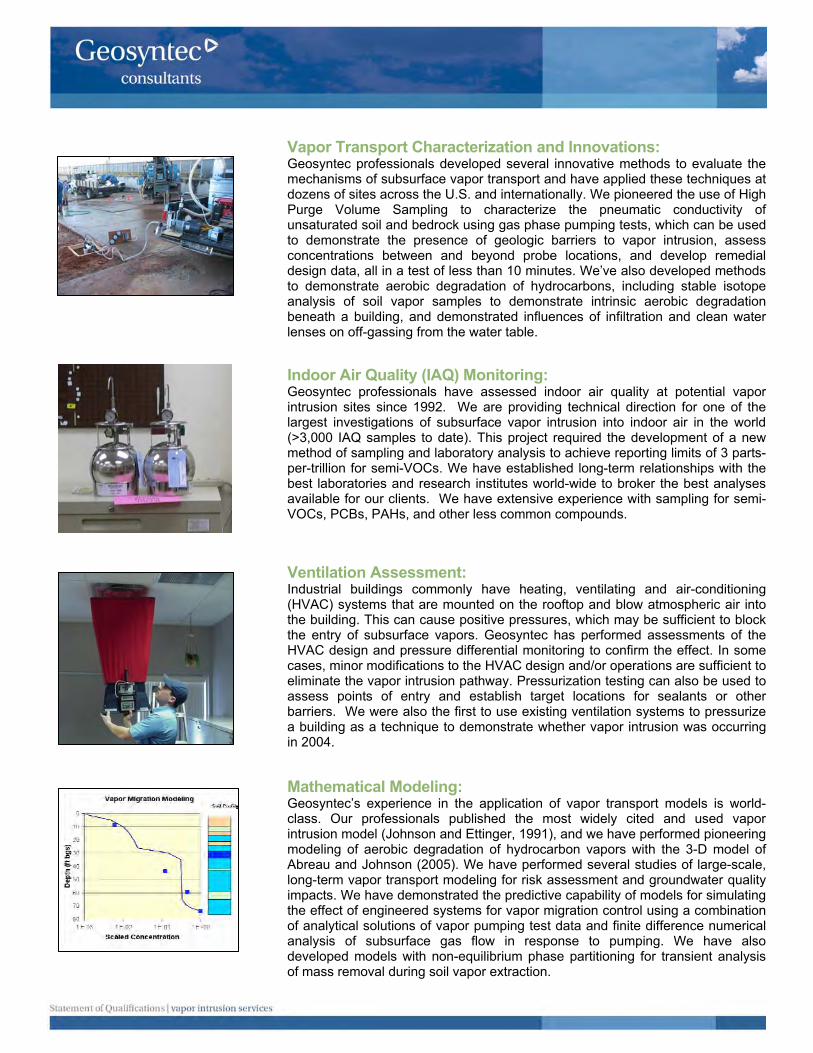
Vapor Transport Characterization and Innovations: Geosyntec professionals developed several innovative methods to evaluate the mechanisms of subsurface vapor transport and have applied these techniques at dozens of sites across the U.S. and internationally. We pioneered the use of High Purge Volume Sampling to characterize the pneumatic conductivity of unsaturated soil and bedrock using gas phase pumping tests, which can be used to demonstrate the presence of geologic barriers to vapor intrusion, assess concentrations between and beyond probe locations, and develop remedial design data, all in a test of less than 10 minutes. We’ve also developed methods to demonstrate aerobic degradation of hydrocarbons, including stable isotope analysis of soil vapor samples to demonstrate intrinsic aerobic degradation beneath a building, and demonstrated influences of infiltration and clean water lenses on off-gassing from the water table.
Indoor Air Quality (IAQ) Monitoring: Geosyntec professionals have assessed indoor air quality at potential vapor intrusion sites since 1992. We are providing technical direction for one of the largest investigations of subsurface vapor intrusion into indoor air in the world (>3,000 IAQ samples to date). This project required the development of a new method of sampling and laboratory analysis to achieve reporting limits of 3 parts-per-trillion for semi-VOCs. We have established long-term relationships with the best laboratories and research institutes world-wide to broker the best analyses available for our clients. We have extensive experience with sampling for semi-VOCs, PCBs, PAHs, and other less common compounds.
Ventilation Assessment: Industrial buildings commonly have heating, ventilating and air-conditioning (HVAC) systems that are mounted on the rooftop and blow atmospheric air into the building. This can cause positive pressures, which may be sufficient to block the entry of subsurface vapors. Geosyntec has performed assessments of the HVAC design and pressure differential monitoring to confirm the effect. In some cases, minor modifications to the HVAC design and/or operations are sufficient to eliminate the vapor intrusion pathway. Pressurization testing can also be used to assess points of entry and establish target locations for sealants or other barriers. We were also the first to use existing ventilation systems to pressurize a building as a technique to demonstrate whether vapor intrusion was occurring in 2004.
Mathematical Modeling: Geosyntec’s experience in the application of vapor transport models is world-class. Our professionals published the most widely cited and used vapor intrusion model (Johnson and Ettinger, 1991), and we have performed pioneering modeling of aerobic degradation of hydrocarbon vapors with the 3-D model of Abreau and Johnson (2005). We have performed several studies of large-scale, long-term vapor transport modeling for risk assessment and groundwater quality impacts. We have demonstrated the predictive capability of models for simulating the effect of engineered systems for vapor migration control using a combination of analytical solutions of vapor pumping test data and finite difference numerical analysis of subsurface gas flow in response to pumping. We have also developed models with non-equilibrium phase partitioning for transient analysis of mass removal during soil vapor extraction.

I believe that the complexity of the issues, the scientific rigor and professionalism with which they are being addressed and the competence of
you and your teams came across most clearly.
Jim Hill, ICI Chemicals and Polymers
Data Management/GIS: Geosyntec developed and manages several large databases for vapor intrusion assessments. This allow us to quickly and reliably sort, filter, flag, search and perform calculations using a geographical information system (GIS) and the latest state-of-the-art software packages for 3-dimensional interpolation and data visualization. This is particularly valuable when communicating complex site conditions to a non-technical audience, such as in public meetings, litigation, or business management planning. We have also developed a proprietary tool to allow our clients to interact with their data more easily than ever before, without expensive software licenses or costly training.
Passive Sampler Research and Development: Geosyntec performed applied research with the University of Waterloo over a 3-year period to develop the Waterloo Membrane Sampler, and commercialize it for use in vapor intrusion assessments. The sampler consists of a permeable membrane covering a vial filled with an adsorbent. Organic chemical vapors permeate across the membrane at a quantifiable rate, so the concentrations can be calculated from measuring the mass adsorbed over a known exposure time. Geosyntec was retained by the US DOD to perform a 4-year research program comparing four different passive samplers to conventional methods of sampling and analysis, and are the leaders in applied research in this area. Passive samplers have several benefits over conventional sampling, including that they are easier to use, less expensive, smaller and more discrete, easier to ship, and they provide long-term average concentrations, which are more relevant for assessing human health risks. Geosyntec continues to work with the University of Waterloo to expand the applicability and find new uses for passive samplers.
Laboratory Testing and Method Development: Geosyntec staff developed a laboratory column testing method for measuring the effective vapor diffusion coefficient of vapors in unsaturated sands as a function of the moisture content and fraction of organic carbon. Our laboratory is equipped for headspace gas chromatography, and we have access to additional laboratory equipment at the University of Waterloo for custom testing, including compound-specific stable isotope analysis for forensic determination of the source of VOC vapors and chamber tests for controlled atmospheres.

I was impressed with your thoughtful analytical work, which was presented in a clear, concise report. Your writing style is readable even though the material covered was technical and complicated. More importantly, your
written presentation was very persuasive…
James Vroman, Jenner & Block, Chicago
Vapor Intrusion Mitigation Systems: Design to Optimization: Geosyntec has a long history of gas and soil vapor mitigation system design, construction, operation, trouble-shooting and repair for both passive and active systems. We have provided engineering support for all elements of the systems including passive barriers, air filtration, sub-slab depressurization systems, and combinations of these elements. We have also utilized both manual and automated monitoring and alarm systems along with remote sensing systems to evaluate the effectiveness of the individual systems and corresponding upgrades, if needed. Geosyntec has provided the engineering design and managed the construction and operation of these systems for a large retailer at several Brownfield sites including sites overlying inactive landfills. A Geosyntec employee holds a patent for a particular configuration and design of a gas and soil vapor collection system, which increases the effectiveness of the system at a lower cost than conventional collection systems. We were invited by the City of Los Angeles Unified School District to serve on an expert panel to evaluate development options for one of the highest profile vapor intrusion sites in the U.S. Recently, we have been conducting pioneering research into the application of passive (wind and solar powered) systems for sub-slab ventilation, and have developed proprietary techniques for demonstrating their effectiveness to the satisfaction of regulatory agencies.
This provides a representative cross-section of our services related to vapor intrusion assessment and management. If you have questions, or would like more information, feel free to contact us at [email protected].

Vapor Intrusion Assessment and Innovative Technologiesto Reduce Long-Term Liabilities
Edison and Woodbridge, New Jersey
state regulations | vapor intrusion assessment | former military facility
Project ObjectiveGeosyntec was retained by the Army Corps of Engineers as a specialty subconsultant to Shaw Environmental to assess and mitigate vapor intrusion at the former Raritan Arsenal in New Jersey. The arsenal was used by the U.S. Army from World War I until the 1960s as an ammunition storage and renovation facility. It has since been redeveloped and reoccupied for multi-unit commercial use. There are chlorinated solvents in groundwater at the Site, which are being monitored and remediated. The New Jersey Department of Environmental Protection (NJDEP) requested an assessment of subsurface vapor intrusion into indoor air and required extensive sub-slab and indoor air monitoring. Three years of data collected by a previous consultant repeatedly showed detectable concentrations of volatile organic compounds (VOCs) in groundwater, soil gas and indoor air samples, interpreted by the NJDEP as a complete exposure pathway despite indications of interior sources for both tetrachloroethene (PCE) and trichloroethene (TCE). Prior to the NJDEP issuing an Order for expensive mitigation, the Agency retained Geosyntec to review historic data, provide an independent interpretation, and conduct a single phase of data collection to resolve once and for all the relative contributions of vapors from sources inside the building versus any contribution of vapors from the subsurface, and refine the mitigation program to an appropriate level.
Geosyntec’s Scope of ServicesGeosyntec prepared a presentation with a forensic analysis of the historic data, demonstrating to the NJDEP that interior sources were likely to be contributing a significant background level of PCE and TCE. NJDEP agreed to allow us to design and implement an additional data collection event using a different approach to the previous conventional sampling. We employed a mobile laboratory for real-time indoor air sampling to track the interior sources, building pressure-ventilation assessment to derive the influence of the building and an innovative, quantitative passive diffusive sampling method (the Waterloo Membrane Sampler, or WMS) for long-term average indoor air sampling. We presented a detailed analysis of the data to the NJDEP, clearly identifying the presence of interior sources of solvents associated with electronics equipment in one of the current building occupant’s warehouse areas. As a result, NJDEP concurred that three of the four buildings in question did not require vapor intrusion mitigation. Furthermore, Geosyntec was able to negotiate an innovative passive sub-slab ventilation system for the remaining building powered by wind turbines above the roof level, a low-cost, sustainable option for situations where indoor air concentrations are below regulatory guidelines but sub-slab concentrations are modestly above conservative soil gas screening levels. This system is now in a 5-year monitoring phase. Geosyntec is using WMS samplers to monitor the performance of the mitigation system with written approval of this innovative sampling method by the NJDEP.
Notable AccomplishmentsGeosyntec demonstrated that vapor intrusion posed no significant risk in three of the four buildings and was able to implement a passive remedy in the fourth. This reduced the cost of mitigation from approximately $1 million to approximately $120,000. We are currently applying a similar approach at another Operable Unit at the facility. In all cases, we have demonstrated a clear understanding and appropriate mitigation to the current occupants and their consultants, owners, and regulators, which has fostered good relations throughout the process.
Client: U.S. Army Corps of EngineersServices Provided:
Interpretation of existing data 5
Forensic analysis of background sources 5
Regulatory negotiation 5
Alternative vapor intrusion assessment 5
Innovative mitigation system design, installation and 5
testing
Geosyntec initiated a vapor intrusion sampling (left) and passive mitigation (right)program that reduced our client’s long-term liabilities by almost 90%.

Analysis of Subsurface Vapor Intrusion to Indoor Air and Background Conditions near a Former Refi nery
Hooven, Ohio
RCRA | vapor intrusion assessment | former refi nery site
Project ObjectiveTrihydro Corporation, a prime contractor to a major integrated petroleum refi ning company with historic operations across the United States, has responsibility for the remediation of groundwater impacted by hydrocarbons at a site in Ohio. One of the key issues to be resolved as the groundwater remediation program moved forward was the potential for subsurface vapor intrusion into indoor air in a residential neighborhood adjacent to the site. Light, non-aqueous phase liquid (LNAPL) hydrocarbons from the former refi nery operations were present at one time beneath a portion of the community. The U.S. EPA Region 5 required an assessment of the potential for vapor intrusion, and Trihydro wished to ensure that the sampling and analysis program would provide the best practicable data quality. Background concentrations of some gasoline constituents (such as benzene) can exceed risk-based target concentrations for inhalation exposures, so it was clear from the beginning of the project that a forensic analysis could be required to ascertain the source of certain vapors. Resolution of any off -site vapor intrusion issues is part of long-term strategy for redevelopment of the original refi nery site for recreational, commercial, and/or manufacturing uses.
Geosyntec’s Scope of ServicesTrihydro selected Geosyntec to design soil gas sampling protocols with several quality assurance/quality control (QA/QC) measures to ensure the integrity of the data, and to develop a scope of work that provided a statistically valid comparison of sub-slab to near-slab soil gas chemistry, as well as a comparison between areas underlain by hydrocarbons from the former refi nery versus those remote from the refi nery impacts. Our approach called for the collection of vertical profi les of soil gas samples to assess the downward fl ux of oxygen from the atmosphere, and the production of carbon dioxide resulting from biodegradation of the hydrocarbon vapors. In implementing the sampling program, Geosyntec provided a fi eld team of a dozen experienced staff , and trained TriHydro staff in the detailed sampling protocols to create a team capable of collecting the requisite number of samples within the time requirements. Together, Geosyntec and TriHydro installed 86 sub-slab probes and 100 near-slab soil gas probes within or immediately adjacent to 43 residences. The team collected over 300 soil gas samples from these and seven nests of soil gas probes at depths of 5, 10, 15, 20, 30, 40 and 50 feet below ground to provide suffi cient data to assess the potential for vapor intrusion risks, all within a period of only 6 weeks.
Notable AccomplishmentsGeosyntec calibrated a mathematical model of vapor transport and biodegradation to the vertical profi les of hydrocarbon vapors, oxygen and carbon dioxide, and demonstrated that intrinsic biodegradation reduces concentrations of hydrocarbons to levels that pose no risk via vapor intrusion. Geosyntec worked closely with TriHydro to generate a report of fi ndings. U.S. EPA Region 5 concurred with the report fi nding that vapor intrusion posed no unacceptable human health risk. Throughout the assignment, Geosyntec provided support to TriHydro for regulatory meetings and negotiation. As a subcontractor, Geosyntec worked with TriHydro on a number of fronts (regulatory, strategy development, and technology transfer) to ensure that their mission on as the prime contractor was met in a timely cost-eff ective manner.
Client: Trihydro CorporationServices Provided: Services Provided:
Soil gas sampling Soil gas sampling
Vapor transport modelingVapor transport modeling
Biodegradation assessmentBiodegradation assessmentBiodegradation assessment
Public meeting supportPublic meeting support
Regulatory liaisonRegulatory liaison
Soil gas probes were installed adjacent to residences as part of the TriHydro program to assess the presence of vapors.

Vapor Intrusion Assessment and Mitigation for an Elementary School Site
Los Angeles, California
state regulated | vapor intrusion mitigation | public school
Project ObjectiveThe Los Angeles Unified School District (LAUSD)’s 28th St. Elementary School is located in the lower downtown area of Los Angeles. When it was found that sub-pavement material that was impacted with lead had been used beneath a newly paved playground area, LAUSD retained Geosyntec to assess the nature and extent of metals and volatile organic compounds (VOCs) in soil and VOCs in soil gas, and to conduct a vapor intrusion assessment for the school site.
Geosyntec’s Scope of ServicesGeosyntec conducted an investigation at the school site, and although lead was the primary chemical detected in the sub-pavement material, we identified areas of soil vapor impacted with tetrachloroethylene (PCE). Based on our human health risk assessment, we found that the level of PCE detected in soil vapor posed a potential human health risk due to the subsurface vapor intrusion to indoor air pathway.
Geosyntec then performed a vapor intrusion investigation consisting of multiple investigation components that included:
• a soil gas and sub-slab soil gas investigation to characterize source and distribution of contaminants;
• modeling to assess the likelihood of a vapor intrusion concern for portable classrooms with crawl space construction;
• indoor air sampling to identify classrooms where vapor intrusion was occurring and assess the effectiveness of engineering controls implemented at the site;
• data analysis to distinguish background contributions to indoor air quality from vapor intrusion;
• recommendations for mitigation system design consisting of HVAC operational modifications, crawl space ventilation, and installation of air purification units in select classrooms; and
• development of an operations, maintenance, and monitoring plan to provide long-term verification that engineering controls were meeting the site objectives.
We conducted this work under the oversight of the state regulatory agencies and provided frequent updates to school staff, student families, and the community.
Notable AccomplishmentsRecent quarterly indoor air sampling results indicate that the mitigation measures that Geosyntec recommended be implemented at the school have reduced indoor air PCE concentrations in all classrooms below the risk-based action level recommended by the State regulatory agency. These mitigation measures have successfully reduced indoor air PCE concentrations in twelve class rooms with detected concentrations above risk-based targets. Also, two classrooms that were previously kept vacant due to elevated indoor air concentrations are now available for student instruction. Restoring this classroom capacity is essential to the ongoing efforts of LAUSD to provide adequate classrooms in neighborhood school settings. Geosyntec is currently assisting the LAUSD with the operation, maintenance, and monitoring of the engineering controls in use at the school, and we are providing public participation support for community outreach activities.
Client: Los Angeles Unified School DistrictServices Provided:
vapor intrusion investigation 5
indoor air sampling 5
mitigation implementation and confirmation monitoring 5
public participation support 5
Geosyntec conducted a vapor intrusion assessment and implemented mitigation measures at an elementary school site.
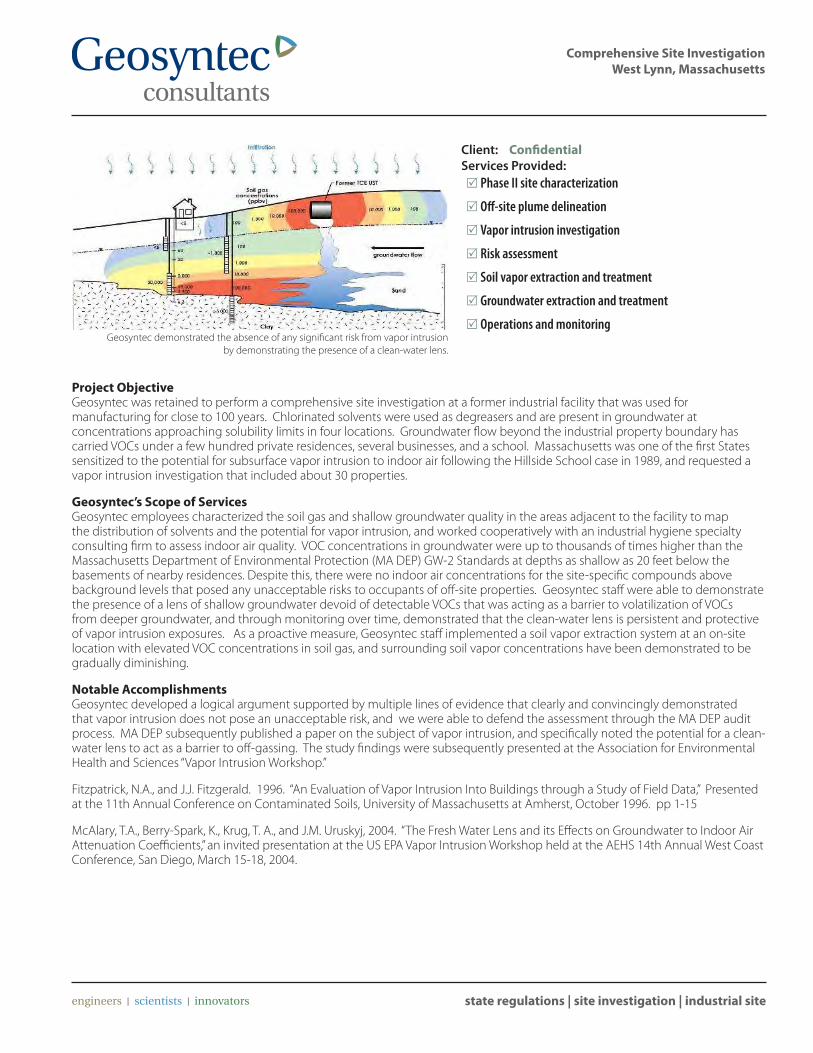
Comprehensive Site Investigation West Lynn, Massachusetts
state regulations | site investigation | industrial site
Project ObjectiveGeosyntec was retained to perform a comprehensive site investigation at a former industrial facility that was used for manufacturing for close to 100 years. Chlorinated solvents were used as degreasers and are present in groundwater at concentrations approaching solubility limits in four locations. Groundwater flow beyond the industrial property boundary has carried VOCs under a few hundred private residences, several businesses, and a school. Massachusetts was one of the first States sensitized to the potential for subsurface vapor intrusion to indoor air following the Hillside School case in 1989, and requested a vapor intrusion investigation that included about 30 properties.
Geosyntec’s Scope of ServicesGeosyntec employees characterized the soil gas and shallow groundwater quality in the areas adjacent to the facility to map the distribution of solvents and the potential for vapor intrusion, and worked cooperatively with an industrial hygiene specialty consulting firm to assess indoor air quality. VOC concentrations in groundwater were up to thousands of times higher than the Massachusetts Department of Environmental Protection (MA DEP) GW-2 Standards at depths as shallow as 20 feet below the basements of nearby residences. Despite this, there were no indoor air concentrations for the site-specific compounds above background levels that posed any unacceptable risks to occupants of off-site properties. Geosyntec staff were able to demonstrate the presence of a lens of shallow groundwater devoid of detectable VOCs that was acting as a barrier to volatilization of VOCs from deeper groundwater, and through monitoring over time, demonstrated that the clean-water lens is persistent and protective of vapor intrusion exposures. As a proactive measure, Geosyntec staff implemented a soil vapor extraction system at an on-site location with elevated VOC concentrations in soil gas, and surrounding soil vapor concentrations have been demonstrated to be gradually diminishing.
Notable AccomplishmentsGeosyntec developed a logical argument supported by multiple lines of evidence that clearly and convincingly demonstrated that vapor intrusion does not pose an unacceptable risk, and we were able to defend the assessment through the MA DEP audit process. MA DEP subsequently published a paper on the subject of vapor intrusion, and specifically noted the potential for a clean-water lens to act as a barrier to off-gassing. The study findings were subsequently presented at the Association for Environmental Health and Sciences “Vapor Intrusion Workshop.”
Fitzpatrick, N.A., and J.J. Fitzgerald. 1996. “An Evaluation of Vapor Intrusion Into Buildings through a Study of Field Data,” Presented at the 11th Annual Conference on Contaminated Soils, University of Massachusetts at Amherst, October 1996. pp 1-15
McAlary, T.A., Berry-Spark, K., Krug, T. A., and J.M. Uruskyj, 2004. “The Fresh Water Lens and its Effects on Groundwater to Indoor Air Attenuation Coefficients,” an invited presentation at the US EPA Vapor Intrusion Workshop held at the AEHS 14th Annual West Coast Conference, San Diego, March 15-18, 2004.
Client: ConfidentialServices Provided:
Phase II site characterization 5
Off-site plume delineation 5
Vapor intrusion investigation 5
Risk assessment 5
Soil vapor extraction and treatment 5
Groundwater extraction and treatment 5
Operations and monitoring 5Geosyntec demonstrated the absence of any significant risk from vapor intrusion
by demonstrating the presence of a clean-water lens.
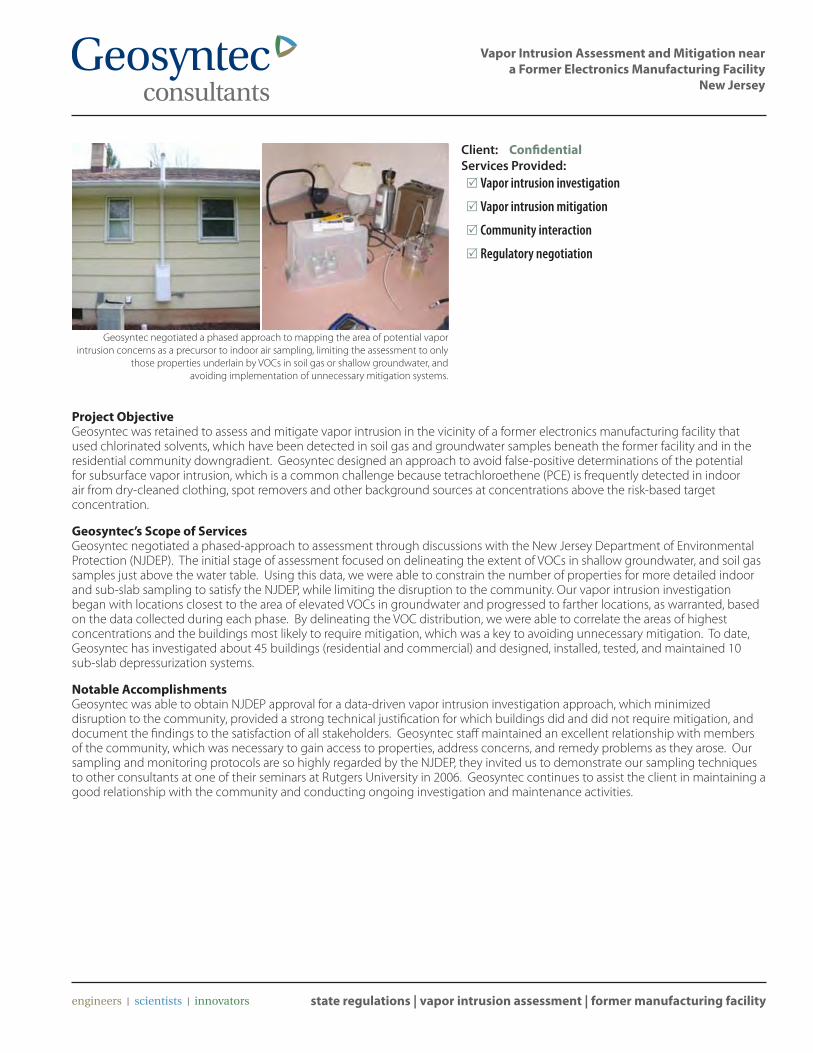
Vapor Intrusion Assessment and Mitigation near a Former Electronics Manufacturing Facility
New Jersey
state regulations | vapor intrusion assessment | former manufacturing facility
Project ObjectiveGeosyntec was retained to assess and mitigate vapor intrusion in the vicinity of a former electronics manufacturing facility that used chlorinated solvents, which have been detected in soil gas and groundwater samples beneath the former facility and in the residential community downgradient. Geosyntec designed an approach to avoid false-positive determinations of the potential for subsurface vapor intrusion, which is a common challenge because tetrachloroethene (PCE) is frequently detected in indoor air from dry-cleaned clothing, spot removers and other background sources at concentrations above the risk-based target concentration.
Geosyntec’s Scope of ServicesGeosyntec negotiated a phased-approach to assessment through discussions with the New Jersey Department of Environmental Protection (NJDEP). The initial stage of assessment focused on delineating the extent of VOCs in shallow groundwater, and soil gas samples just above the water table. Using this data, we were able to constrain the number of properties for more detailed indoor and sub-slab sampling to satisfy the NJDEP, while limiting the disruption to the community. Our vapor intrusion investigation began with locations closest to the area of elevated VOCs in groundwater and progressed to farther locations, as warranted, based on the data collected during each phase. By delineating the VOC distribution, we were able to correlate the areas of highest concentrations and the buildings most likely to require mitigation, which was a key to avoiding unnecessary mitigation. To date, Geosyntec has investigated about 45 buildings (residential and commercial) and designed, installed, tested, and maintained 10 sub-slab depressurization systems.
Notable AccomplishmentsGeosyntec was able to obtain NJDEP approval for a data-driven vapor intrusion investigation approach, which minimized disruption to the community, provided a strong technical justification for which buildings did and did not require mitigation, and document the findings to the satisfaction of all stakeholders. Geosyntec staff maintained an excellent relationship with members of the community, which was necessary to gain access to properties, address concerns, and remedy problems as they arose. Our sampling and monitoring protocols are so highly regarded by the NJDEP, they invited us to demonstrate our sampling techniques to other consultants at one of their seminars at Rutgers University in 2006. Geosyntec continues to assist the client in maintaining a good relationship with the community and conducting ongoing investigation and maintenance activities.
Client: ConfidentialServices Provided:
Vapor intrusion investigation 5
Vapor intrusion mitigation 5
Community interaction 5
Regulatory negotiation 5
Geosyntec negotiated a phased approach to mapping the area of potential vapor intrusion concerns as a precursor to indoor air sampling, limiting the assessment to only
those properties underlain by VOCs in soil gas or shallow groundwater, and avoiding implementation of unnecessary mitigation systems.
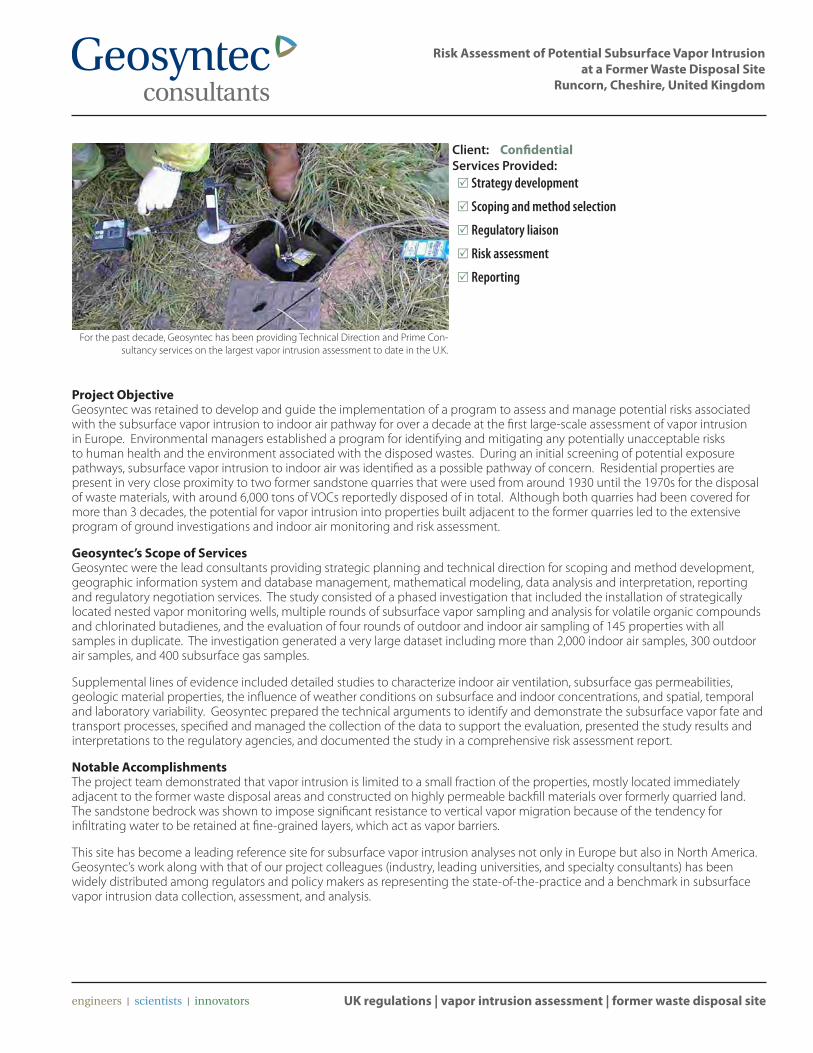
Risk Assessment of Potential Subsurface Vapor Intrusionat a Former Waste Disposal Site
Runcorn, Cheshire, United Kingdom
UK regulations | vapor intrusion assessment | former waste disposal site
Project ObjectiveGeosyntec was retained to develop and guide the implementation of a program to assess and manage potential risks associated with the subsurface vapor intrusion to indoor air pathway for over a decade at the first large-scale assessment of vapor intrusion in Europe. Environmental managers established a program for identifying and mitigating any potentially unacceptable risks to human health and the environment associated with the disposed wastes. During an initial screening of potential exposure pathways, subsurface vapor intrusion to indoor air was identified as a possible pathway of concern. Residential properties are present in very close proximity to two former sandstone quarries that were used from around 1930 until the 1970s for the disposal of waste materials, with around 6,000 tons of VOCs reportedly disposed of in total. Although both quarries had been covered for more than 3 decades, the potential for vapor intrusion into properties built adjacent to the former quarries led to the extensive program of ground investigations and indoor air monitoring and risk assessment.
Geosyntec’s Scope of ServicesGeosyntec were the lead consultants providing strategic planning and technical direction for scoping and method development, geographic information system and database management, mathematical modeling, data analysis and interpretation, reporting and regulatory negotiation services. The study consisted of a phased investigation that included the installation of strategically located nested vapor monitoring wells, multiple rounds of subsurface vapor sampling and analysis for volatile organic compounds and chlorinated butadienes, and the evaluation of four rounds of outdoor and indoor air sampling of 145 properties with all samples in duplicate. The investigation generated a very large dataset including more than 2,000 indoor air samples, 300 outdoor air samples, and 400 subsurface gas samples.
Supplemental lines of evidence included detailed studies to characterize indoor air ventilation, subsurface gas permeabilities, geologic material properties, the influence of weather conditions on subsurface and indoor concentrations, and spatial, temporal and laboratory variability. Geosyntec prepared the technical arguments to identify and demonstrate the subsurface vapor fate and transport processes, specified and managed the collection of the data to support the evaluation, presented the study results and interpretations to the regulatory agencies, and documented the study in a comprehensive risk assessment report.
Notable AccomplishmentsThe project team demonstrated that vapor intrusion is limited to a small fraction of the properties, mostly located immediately adjacent to the former waste disposal areas and constructed on highly permeable backfill materials over formerly quarried land. The sandstone bedrock was shown to impose significant resistance to vertical vapor migration because of the tendency for infiltrating water to be retained at fine-grained layers, which act as vapor barriers.
This site has become a leading reference site for subsurface vapor intrusion analyses not only in Europe but also in North America. Geosyntec’s work along with that of our project colleagues (industry, leading universities, and specialty consultants) has been widely distributed among regulators and policy makers as representing the state-of-the-practice and a benchmark in subsurface vapor intrusion data collection, assessment, and analysis.
For the past decade, Geosyntec has been providing Technical Direction and Prime Con-sultancy services on the largest vapor intrusion assessment to date in the U.K.
Client: ConfidentialServices Provided:
Strategy development 5
Scoping and method selection 5
Regulatory liaison 5
Risk assessment 5
Reporting 5

Demonstrating No Significant Risk and Securing a No Further Action Letter
New York State
state regulations | vapor intrusion assessment | manufacturing facility
Project ObjectiveGeosyntec was retained to assess potential risks associated with subsurface vapor intrusion in a residential community adjacent to an industrial facility where chlorinated solvents were identified in groundwater. The New York State Department of Environmental Conservation (NYSDEC) and New York State Department of Health (NYSDOH) requested indoor air and sub-slab soil gas sampling and analysis at many surrounding homes. The responsible party for the environmental liabilities retained Geosyntec to negotiate a more appropriate scope of work, limited only to properties overlying the distribution of solvent vapors emanating from the facility. A critical component of the work was to demonstrate sufficient knowledge of the subsurface vapor distribution to support prioritization of the nearby residences according to the subsurface concentrations.
Geosyntec’s Scope of ServicesGeosyntec negotiated an investigative approach with the NYSDEC and NYSDOH to delineate the subsurface vapor distribution using a novel method developed by Geosyntec over the past decade, referred to as High Purge Volume (HPV) Sampling (McAlary et al., 2010). HPV sampling consists of drawing large volumes of soil gas by applying a vacuum to existing groundwater monitoring wells screened across the water table. Monitoring of the trend of vapor concentration as a function of the volume of gas removed provides insight into the distribution of vapors between and beyond existing well locations quickly and inexpensively. Using this method, Geosyntec demonstrated that only a limited number of residential properties were located near the subsurface vapor distribution, and were thus able to reduce the scope of the investigation.
Furthermore, the HPV testing data demonstrated that the clay-rich soils in the unsaturated zone would likely inhibit upward vapor migration and reduce the risk of vapor intrusion. Geosyntec then applied our industry-leading sampling protocols to gather defensible data, included pneumatic testing, sub-slab to indoor air pressure differential measurements, and the use of a helium tracer for leak testing. Geosyntec conducted the field sampling activities under continuous oversight of representatives from the NYSDEC and NYSDOH, and were complimented on the level of detail applied to assure good quality data.
Notable AccomplishmentsGeosyntec was able to negotiate an appropriately limited scope of indoor air and sub-slab assessment, and clearly demonstrate a condition of no significant risk in a linear progression resulting in a No Further Action (NFA) letter from the regulatory agencies, which is no small task for a vapor intrusion assessment in New York State.
Reference:
McAlary, T.A., Nicholson, P., Yik, L.K., Bertrand, D. and G. Thrupp, 2010. “High Purge Volume Sampling - A New Paradigm for Sub-Slab Soil Gas Monitoring,” Groundwater Monitoring and Remediation document # GWMR20091006-0047R.
Client: ConfidentialServices Provided:
Interpretation of existing data 5
Vapor intrusion assessment and conceptual model 5
development
Demonstration of sampling protocols to regulatory 5
agencies
Geosyntec’s innovative strategy and industry-leading data quality assurance and control allowed us to clearly demonstrate the absence of vapor intrusion risks
and significantly reduce our client’s future liabilities.

Vapor Intrusion Investigation and Mitigation System Design at a Silicon Chip Manufacturing Facility
Kuala Lumpur, Malaysia
international regulations | vapor intrusion assessment | manufacturing facility
Project ObjectiveAn industrial firm retained Geosyntec, in collaboration with GSM Alamsutria (M) Sdn. Bhd. (GSM), our wholly-owned Malaysian subsidiary, for services at an operating electronics manufacturing facility in Kuala Lumpur, Malaysia. The objectives of the work were to characterize the distribution of volatile organic compounds (VOCs) in the subsurface; assess the potential for subsurface vapor intrusion to indoor air; and provide data for the design of a sub-slab depressurization (SSD) system for mitigation with minimal cost and minimal disruption to on-going activities at the facility.
Geosyntec’s Scope of ServicesGeosyntec performed a phased investigation beginning with an initial screening of sub-slab vapor concentrations using quantitative passive diffusive samplers (the Waterloo Membrane Sampler, or WMS), which was developed jointly by the University of Waterloo and Geosyntec. The WMS samplers provide low level reporting limits at about half the cost of the conventional Summa canister sampling method and analysis. The initial phase of investigation identified areas of the building with elevated sub-slab concentrations of VOCs, which justified additional assessment of the extent of the vapor distribution and collection of pneumatic data for mitigation system design. The second phase of work was conducted using a Geosyntec proprietary method referred to as High Purge Volume (HPV) sampling, which involves removal of a large volume of soil gas from selected locations and monitoring of the vapor concentrations as a function of the volume removed to assess concentrations between and beyond the points of withdrawal. Monitoring of the vacuum response also provides the necessary information to design a sub-slab depressurization (SSD) or soil vapor extraction (SVE) system. We also used WMS samplers to provide an average concentration of subsurface VOCs during each HPV test. Geosyntec also performed a mathematical analysis of the transient vacuum response data to develop an optimal design of a mitigation system to only those portions of the building with elevated subsurface concentrations with flushing rates tailored to achieve remedial goals within the client’s time-frame.
Notable AccomplishmentsGeosyntec used two proprietary investigative and sampling methods, HPV testing with WMS samplers, to cost-effectively characterize the concentrations of VOCs in the subsurface, significantly reducing the client’s costs associated with characterizing a large manufacturing facility. These methods were also easier to implement considering the challenges of shipping samples to and from Malaysia. At the same time, we collected a wealth of subsurface vacuum response data to allow us to design a custom-tailored mitigation system to treat only the necessary portions of the building and achieve remedial goals within a constrained period.
Client: ConfidentialServices Provided:
Existing data interpretation 5
Vapor intrusion assessment 5
International logistics 5
Recommended mitigation and remediation options 5
Geosyntec performed a vapor intrusion assessment using our proprietary High Purge Volume Sampling Method to determine potential risk to workers and develop a
mitigation system to meet remedial objectives within our client’s specified timeframe.

Transaction Due Diligence, Vapor Intrusion, and Brownfield Redevelopment
Brantford, Ontario
Canadian regulations | site characterization | brownfield site
Project ObjectiveGeosyntec was initially retained to provide peer review of site characterization and remediation data collected by a consultant working for a land developer as part of a brownfield redevelopment plan. Subsequently, we were retained to evaluate potential health risks to occupants of a building that was to be constructed on the brownfield property. This role evolved into negotiation of remediation and construction techniques to mitigate potential vapor intrusion risks.
Geosyntec’s Scope of ServicesAs part of a property acquisition due diligence process, Geosyntec reviewed existing site characterization data and conducted an evaluation of potential exposures related to prior use of petroleum hydrocarbons and chlorinated solvents at a former industrial site that was slated for demolition and redevelopment. We identified the potential for chlorinated solvents to pose a potential health risk to occupants of a new building via the soil vapor intrusion to indoor air. We also installed and sampled several soil gas probes to quantify the potential exposure.
As a result of soil gas concentrations identified, Geosyntec negotiated with the developer to conduct additional soil and groundwater remediation, to design and install a vapor barrier beneath the new building, and to conduct performance monitoring to demonstrate successful operation of the vapor barrier.
Notable Accomplishments to DateGeosyntec’s negotiations with the developer resulted in less contaminant mass in place on the acquired property, and a safer new building constructed over the footprint of the contamination.
Client: Confidential Services Provided:
Site characterization 5
Vapor intrusion assessment 5
Transaction due diligence 5
Peer review 5
Geosyntec conducted soil gas sampling to assess the vapor intrusion potential at a Brownfield site that played a key role in constructing a safe building.
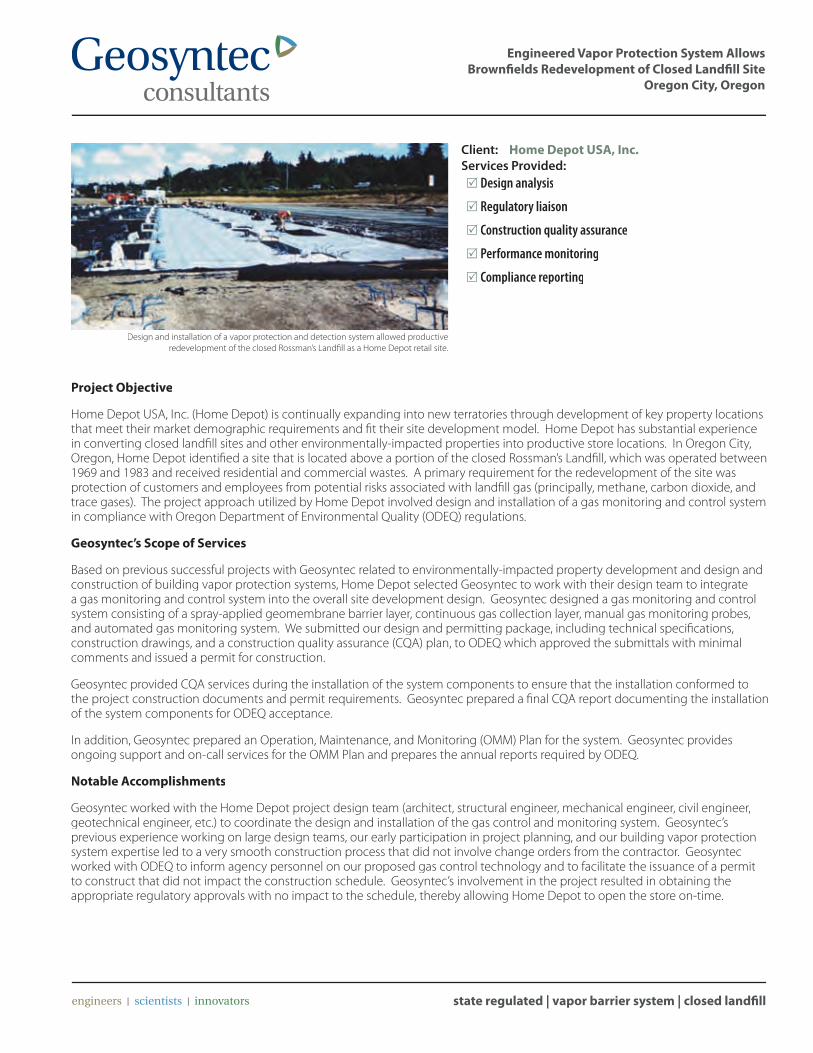
Engineered Vapor Protection System Allows Brownfi elds Redevelopment of Closed Landfi ll Site
Oregon City, Oregon
state regulated | vapor barrier system | closed landfi ll
Project Objective
Home Depot USA, Inc. (Home Depot) is continually expanding into new terratories through development of key property locations that meet their market demographic requirements and fi t their site development model. Home Depot has substantial experience in converting closed landfi ll sites and other environmentally-impacted properties into productive store locations. In Oregon City, Oregon, Home Depot identifi ed a site that is located above a portion of the closed Rossman’s Landfi ll, which was operated between 1969 and 1983 and received residential and commercial wastes. A primary requirement for the redevelopment of the site was protection of customers and employees from potential risks associated with landfi ll gas (principally, methane, carbon dioxide, and trace gases). The project approach utilized by Home Depot involved design and installation of a gas monitoring and control system in compliance with Oregon Department of Environmental Quality (ODEQ) regulations.
Geosyntec’s Scope of Services
Based on previous successful projects with Geosyntec related to environmentally-impacted property development and design and construction of building vapor protection systems, Home Depot selected Geosyntec to work with their design team to integrate a gas monitoring and control system into the overall site development design. Geosyntec designed a gas monitoring and control system consisting of a spray-applied geomembrane barrier layer, continuous gas collection layer, manual gas monitoring probes, and automated gas monitoring system. We submitted our design and permitting package, including technical specifi cations, construction drawings, and a construction quality assurance (CQA) plan, to ODEQ which approved the submittals with minimal comments and issued a permit for construction.
Geosyntec provided CQA services during the installation of the system components to ensure that the installation conformed to the project construction documents and permit requirements. Geosyntec prepared a fi nal CQA report documenting the installation of the system components for ODEQ acceptance.
In addition, Geosyntec prepared an Operation, Maintenance, and Monitoring (OMM) Plan for the system. Geosyntec provides ongoing support and on-call services for the OMM Plan and prepares the annual reports required by ODEQ.
Notable Accomplishments
Geosyntec worked with the Home Depot project design team (architect, structural engineer, mechanical engineer, civil engineer, geotechnical engineer, etc.) to coordinate the design and installation of the gas control and monitoring system. Geosyntec’s previous experience working on large design teams, our early participation in project planning, and our building vapor protection system expertise led to a very smooth construction process that did not involve change orders from the contractor. Geosyntec worked with ODEQ to inform agency personnel on our proposed gas control technology and to facilitate the issuance of a permit to construct that did not impact the construction schedule. Geosyntec’s involvement in the project resulted in obtaining the appropriate regulatory approvals with no impact to the schedule, thereby allowing Home Depot to open the store on-time.
Client: Home Depot USA, Inc.Services Provided:
Design analysis
Regulatory liaison
Construction quality assurance
Performance monitoring
Compliance reporting
Design and installation of a vapor protection and detection system allowed productive Design and installation of a vapor protection and detection system allowed productive Design and installation of a vapor protection and detection system allowed productive Design and installation of a vapor protection and detection system allowed productive Design and installation of a vapor protection and detection system allowed productive redevelopment of the closed Rossman’s Landfi ll as a Home Depot retail site.redevelopment of the closed Rossman’s Landfi ll as a Home Depot retail site.redevelopment of the closed Rossman’s Landfi ll as a Home Depot retail site.
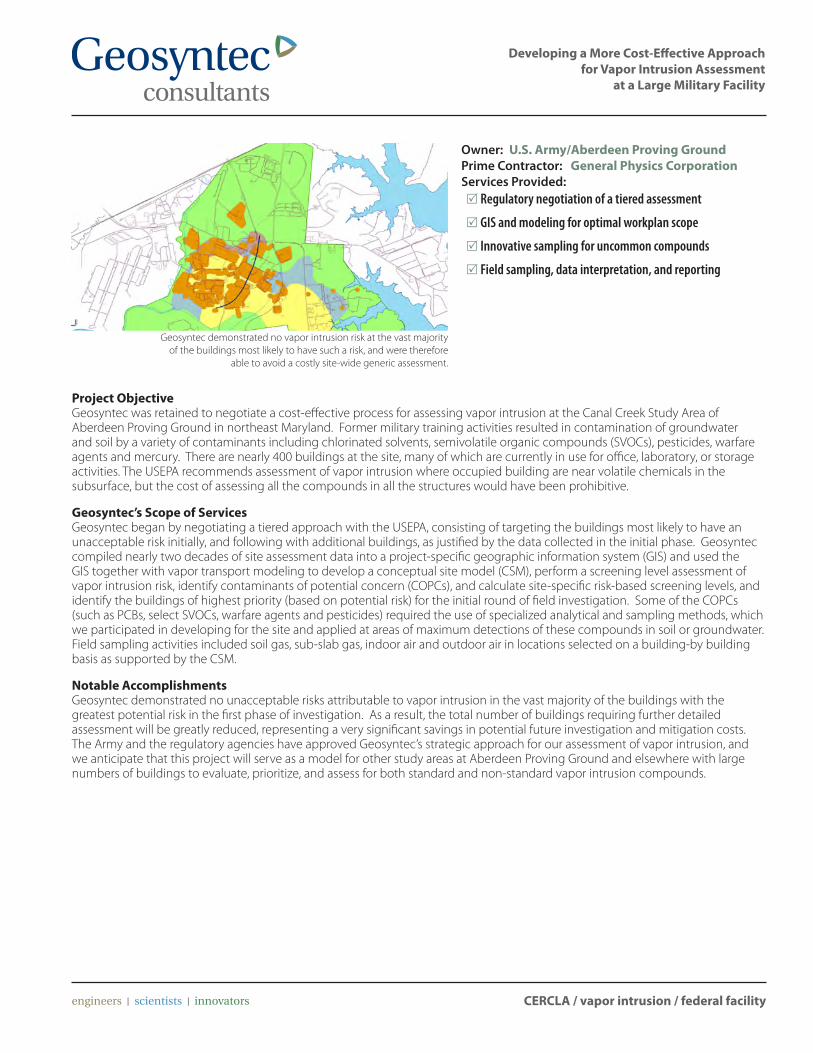
Developing a More Cost-Effective Approach for Vapor Intrusion Assessment
at a Large Military Facility
CERCLA / vapor intrusion / federal facility
Project ObjectiveGeosyntec was retained to negotiate a cost-effective process for assessing vapor intrusion at the Canal Creek Study Area of Aberdeen Proving Ground in northeast Maryland. Former military training activities resulted in contamination of groundwater and soil by a variety of contaminants including chlorinated solvents, semivolatile organic compounds (SVOCs), pesticides, warfare agents and mercury. There are nearly 400 buildings at the site, many of which are currently in use for office, laboratory, or storage activities. The USEPA recommends assessment of vapor intrusion where occupied building are near volatile chemicals in the subsurface, but the cost of assessing all the compounds in all the structures would have been prohibitive.
Geosyntec’s Scope of ServicesGeosyntec began by negotiating a tiered approach with the USEPA, consisting of targeting the buildings most likely to have an unacceptable risk initially, and following with additional buildings, as justified by the data collected in the initial phase. Geosyntec compiled nearly two decades of site assessment data into a project-specific geographic information system (GIS) and used the GIS together with vapor transport modeling to develop a conceptual site model (CSM), perform a screening level assessment of vapor intrusion risk, identify contaminants of potential concern (COPCs), and calculate site-specific risk-based screening levels, and identify the buildings of highest priority (based on potential risk) for the initial round of field investigation. Some of the COPCs (such as PCBs, select SVOCs, warfare agents and pesticides) required the use of specialized analytical and sampling methods, which we participated in developing for the site and applied at areas of maximum detections of these compounds in soil or groundwater. Field sampling activities included soil gas, sub-slab gas, indoor air and outdoor air in locations selected on a building-by building basis as supported by the CSM.
Notable AccomplishmentsGeosyntec demonstrated no unacceptable risks attributable to vapor intrusion in the vast majority of the buildings with the greatest potential risk in the first phase of investigation. As a result, the total number of buildings requiring further detailed assessment will be greatly reduced, representing a very significant savings in potential future investigation and mitigation costs. The Army and the regulatory agencies have approved Geosyntec’s strategic approach for our assessment of vapor intrusion, and we anticipate that this project will serve as a model for other study areas at Aberdeen Proving Ground and elsewhere with large numbers of buildings to evaluate, prioritize, and assess for both standard and non-standard vapor intrusion compounds.
Owner: U.S. Army/Aberdeen Proving GroundPrime Contractor: General Physics CorporationServices Provided:
Regulatory negotiation of a tiered assessment 5
GIS and modeling for optimal workplan scope 5
Innovative sampling for uncommon compounds 5
Field sampling, data interpretation, and reporting 5
Geosyntec demonstrated no vapor intrusion risk at the vast majority of the buildings most likely to have such a risk, and were therefore
able to avoid a costly site-wide generic assessment.
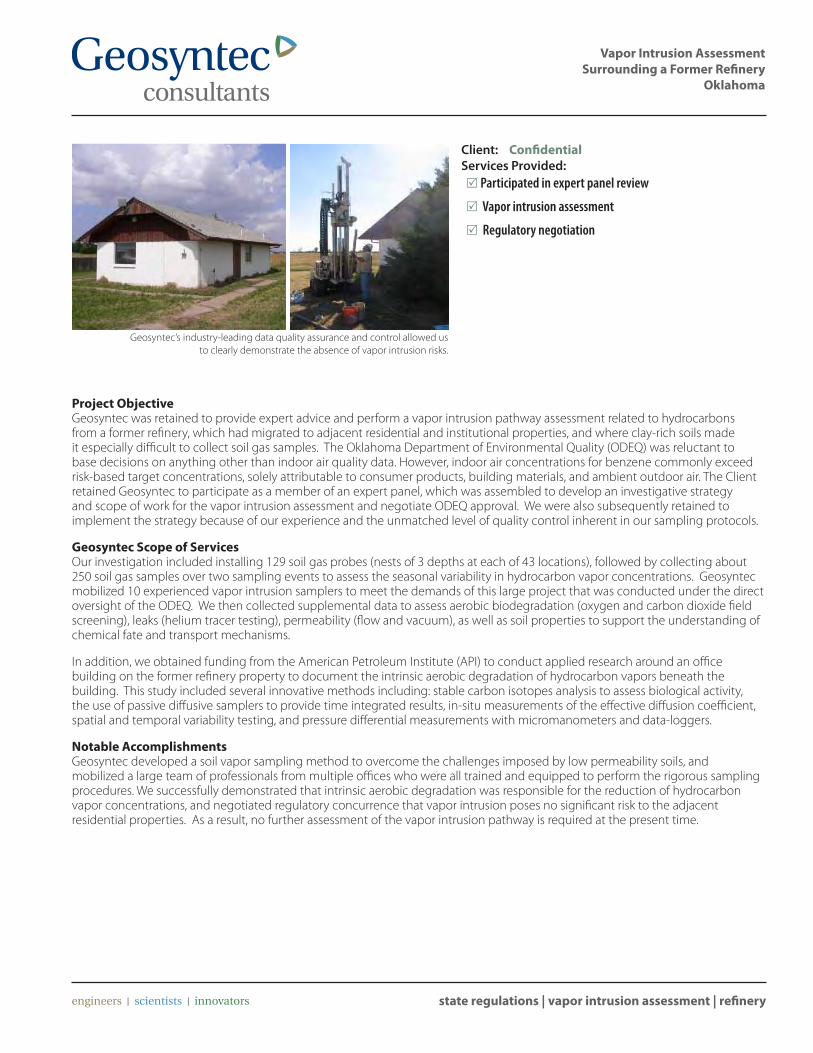
Vapor Intrusion Assessment Surrounding a Former Refinery
Oklahoma
state regulations | vapor intrusion assessment | refinery
Project ObjectiveGeosyntec was retained to provide expert advice and perform a vapor intrusion pathway assessment related to hydrocarbons from a former refinery, which had migrated to adjacent residential and institutional properties, and where clay-rich soils made it especially difficult to collect soil gas samples. The Oklahoma Department of Environmental Quality (ODEQ) was reluctant to base decisions on anything other than indoor air quality data. However, indoor air concentrations for benzene commonly exceed risk-based target concentrations, solely attributable to consumer products, building materials, and ambient outdoor air. The Client retained Geosyntec to participate as a member of an expert panel, which was assembled to develop an investigative strategy and scope of work for the vapor intrusion assessment and negotiate ODEQ approval. We were also subsequently retained to implement the strategy because of our experience and the unmatched level of quality control inherent in our sampling protocols.
Geosyntec Scope of ServicesOur investigation included installing 129 soil gas probes (nests of 3 depths at each of 43 locations), followed by collecting about 250 soil gas samples over two sampling events to assess the seasonal variability in hydrocarbon vapor concentrations. Geosyntec mobilized 10 experienced vapor intrusion samplers to meet the demands of this large project that was conducted under the direct oversight of the ODEQ. We then collected supplemental data to assess aerobic biodegradation (oxygen and carbon dioxide field screening), leaks (helium tracer testing), permeability (flow and vacuum), as well as soil properties to support the understanding of chemical fate and transport mechanisms.
In addition, we obtained funding from the American Petroleum Institute (API) to conduct applied research around an office building on the former refinery property to document the intrinsic aerobic degradation of hydrocarbon vapors beneath the building. This study included several innovative methods including: stable carbon isotopes analysis to assess biological activity, the use of passive diffusive samplers to provide time integrated results, in-situ measurements of the effective diffusion coefficient, spatial and temporal variability testing, and pressure differential measurements with micromanometers and data-loggers.
Notable AccomplishmentsGeosyntec developed a soil vapor sampling method to overcome the challenges imposed by low permeability soils, and mobilized a large team of professionals from multiple offices who were all trained and equipped to perform the rigorous sampling procedures. We successfully demonstrated that intrinsic aerobic degradation was responsible for the reduction of hydrocarbon vapor concentrations, and negotiated regulatory concurrence that vapor intrusion poses no significant risk to the adjacent residential properties. As a result, no further assessment of the vapor intrusion pathway is required at the present time.
Client: ConfidentialServices Provided:
Participated in expert panel review 5
Vapor intrusion assessment 5
Regulatory negotiation 5
Geosyntec’s industry-leading data quality assurance and control allowed us to clearly demonstrate the absence of vapor intrusion risks.
Vapor Intrusion Guidance Documents: Geosyntec has contributed substantial effort to support the development of vapor intrusion guidance documents. Through this involvement, we have helped to shape regulatory policy toward practical and implementable approaches for the assessment and management of VI issues. We have earned the respect of federal and state regulators for vapor intrusion assessment in various jurisdictions. Our reputation and technical expertise combine for the benefit of stakeholders in the negotiation of protective and cost-effective approaches and the development and acceptance of new technologies.
NAVY SPAWAR Review of VI Focus Areas: Geosyntec was retained by the Space and Naval Warfare Systems Center Pacific (SSC Pacific) to prepare a Review of Best Practices, Knowledge and Data Gaps, and Research Opportunities for the U.S. Department of Navy Vapor Intrusion Focus Areas. This guidance is designed to help the Navy optimize their investment in future research and development to minimize the cost of performing vapor intrusion investigations at their facilities nationwide. We have been retained for follow-on research with passive samplers. The document is available at: http://www.spawar.navy.mil/sti/publications/pubs/tr/1982/tr1982cond.pdf
ITRC Vapor Intrusion Guide: Geosyntec was a voluntary participant in the Interstate Technical and Regulatory Council (ITRC) Vapor Intrusion Workgroup, which included 24 member States and 33 Federal or Private members. We were awarded the 2006 Industry Recognition Award for our contribution, and were among the invited instructors for the highly successful 2-day classroom training sessions. The guide is available on-line at: http://www.itrcweb.org/Documents/VI-1.pdf.
Electrical Power Research Institute Reference Handbook: Geosyntec was retained by EPRI to develop a reference handbook to guide vapor intrusion assessments for the member companies. At the time (2005) there were a growing number of regulatory guidance documents, whose focus was primarily on a conservative initial screening, which is not conducive to a cost-effective outcome. This guidance provides a very comprehensive description of the processes contributing to vapor intrusion and the techniques available for assessment to enable responsible parties to manage their assessments much more cost-effectively and is available on-line at: http://mydocs.epri.com/docs/public/000000000001008492.pdf.
US EPA OSWER Guidance Expert Panel: Geosyntec has been a paid member of the US EPA Expert Panel on Vapor Intrusion since 2000, and was the only non-regulator on the Panel for the seminar series to introduce the 2002 Draft OSWER Guidance. We have prepared responses to comments on the 2002 Draft and participated in a series of workshops (http://www.epa.gov/osw/hazard/correctiveaction/eis/vapor.htm) as speakers and panel members to develop several supporting documents that are scheduled for release in 2010.
NJDEP Vapor Intrusion Guidance: Geosyntec served as both a member of the Vapor Intrusion Technical Guidance (VITG) Stakeholders Committee, charged with re-writing the 2005 guidance document, and as a technical reviewer of the document. The 18 month process resulted in the publication of the VITG in January 2012. Geosyntec was also a part of the team that provided technical training and instruction at seminars sponsored by the NJDEP and other organizations. http://www.state.nj.us/dep/srp/guidance/vaporintrusion/vig.htm
American Petroleum Institute 3-D Mathematical Modeling Study: API retained Geosyntec to perform a mathematical modeling study to assess the influence of intrinsic aerobic biodegradation of petroleum hydrocarbons as a function of the source depth and concentration for a variety of scenarios. This study provides practitioners and regulators with unique insights into the behavior of biodegradable vapors in the subsurface. This may allow appropriate attenuation factors to be selected during screening of the potential for vapor intrusion, instead of the current conservative policies in most regulatory guidance documents. The document is available on-line at: http://www.api.org/environment-health-and-safety/clean-water/ground-water/vapor-intrusion/vi-publications/~/media/EF2CA242DC264E808D501F5E861E3F76.ashx
Ontario Ministry of Environment: Geosyntec was a paid Peer technical reviewer of the 2007 draft Rationale for the Development of Generic Soil and Groundwater Standards for Use at Contaminated Sites in Ontario. We later participated as a volunteer on the Expert Panel for development of a Tier 2 Risk Assessment Framework and as a paid Peer Reviewer of the MOE Draft Vapor Intrusion Guidance. Geosyntec provided a 2.5 day training course to 75 staff members of the MOE on vapor intrusion in February 2011. The MOE Draft Standards are available on-line at: http://www.ebr.gov.on.ca/ERS-WEB-External/displaynoticecontent.do?noticeId=MTAwMTU1&statusId=MTY1NTk5
Canadian Council of Ministers of the Environment: Geosyntec was retained to prepare a Scoping Assessment of Soil Vapour Monitoring Protocols for Evaluating Subsurface Vapour Intrusion to Indoor Air” for the CCME, which is available on-line at: http://www.ccme.ca/assets/pdf/pn_1427_vapour_scoping1.pdf. Subsequently, Geosyntec was also retained by the CCME to develop A Protocol for the Development of Soil Vapour Quality Guidelines. These documents provide direction for individual Provinces to develop their own guidelines and policies.

Your contribution to the U.S. EPA Seminars on Vapor Intrusion was huge. Not only did you serve on the Steering Committee by providing valuable input to the agenda, your presentation on Conceptual Models of Vapor Intrusion was an integral part of the program and very well received.
Doug Grosse, USEPA
Atlantic Province PIRI Appendix 9: Geosyntec was one of two primary authors of the Atlantic Provinces Partnership for RBCA Implementation (PIRI) Guidance for Soil Vapour and Indoor Air Monitoring Assessments. The guidance is available at: http://www.atlanticrbca.com/eng/soil_vapour_guidance.html
United Kingdom Construction Industry Research and Information Association (CIRIA): Geosyntec was an invited Peer Reviewer of “The VOCs Handbook, Investigating, Assessing & Managing Risks from Inhalation of Volatile Organic Compounds (VOCs) at Land Affected by Contamination”, based on our experience providing technical direction for the largest assessment of vapor intrusion conducted in the United Kingdom to date.
US EPA RCRA: Geosyntec was one of 3 primary co-authors for the RCRA Supplemental Guidance for Subsurface Vapor Intrusion to Indoor Air, which was the first US EPA Guidance on screening sites for the potential for health risks attributable to Vapor Intrusion, which was issued as a supplement to the RCRA Environmental Indicators guidance. (http://www.epa.gov/wastes/hazard/correctiveaction/eis/vapor/vapor.pdf)
Your insights on the current EPA guidance developments…were very useful for the strategic planning efforts of (our) team.
Hoai Huynh, Aerospace Industry Association

Geosyntec makes a concerted effort to contribute to the scientific literature by regularly publishing their latest research in journals, conference proceedings, textbooks and workshops. We believe this contributes to an improved rate of information exchange and knowledge growth for the entire industry. If you would like copies of any of our work, please let us know at [email protected]. McAlary, T., Bertrand, D., Nicholson and R. Ettinger, 2012. A Case Study on the Influence of Aerobic Biodegradation on
Vapor Intrusion at a Former Refinery Property, Invited platform presentation at the SIDSA Conference, Milan, Italy, June 26-29.
McAlary, T., Groenevelt, H. and T. Gorecki, 2012. Status of the Waterloo Membrane Sampler for VOC Vapor Sampilng, invited presentation at the University Consortium for Field-Focused Groundwter Contamination Research Program, June 12-14, Guelph, Ontario.
McAlary, T., 2012. Quantitative Passive Diffusive Sampling for Assessing Soil Vapor Intrusion to Indoor Air, an invited platform presentation at the Environmental Monitoring and Data Quality Workshop, La Jolla California, March 28, 2012.
Groenevelt, H., McAlary, T., Gorecki, T., Seethapathy, S., Crump, D., Sacco, P., Hayes, H., Tuday, M., Schumacher, B., and P. Johnson, 2012. Quantitative Passive Diffusive Sampling for Assessing Soil Vapor Intrusion to Indoor Air, an invited platform presentation at the USEPA workshop on vapor intrusion at the AEHS Soils and Sediments Conference, San Diego, March 20, 2012.
McAlary, T and H. Groenevelt, 2012. Quantitative Passive Diffusive Sampling for Assessing Soil Vapor Intrusion to Indoor Air, an invited platform presentation at the Air and Waste Management Association’s Air Quality Measurement Methods and Technology conference April 24 – 26, 2012 in Durham, North Carolina.
McAlary, T., 2012. Vapor Intrusion Assessment and Mitigation Training for the U.S. Department of Defense, an invited 2-hour short-course at the Environment, Energy, Security and Sustainability Symposium, Denver, Colorado, February 15.
McAlary, T., Bertrand, D., Nicholson, P., Wadley, S., Rowlands, D. Thrupp, G. and R. Ettinger, 2011. Pneumatic Testing, Mathematical Modeling and Flux Testing to Assess and Optimize the Performance and Establish Termination Criteria for Sub-Slab Depressurization Systems, invited platform presentation at the EPA Workshop on Vapor Intrusion at the AEHS Soils and Sediment Conference, San Diego, CA, March 2011.
McAlary, T., Groenevelt, H., Seethapathy, S., and T. Gorecki, 2011. Recent Advances in Techniques for Measuring Soil Vapor Concentrations, invited platform presentation at the University Consortium for Field Focused Groundwater Research meeting, Guelph, ON, June, 2011.
McAlary, T.A., P.Nicholson, H. Groenevelt, D. Bertrand and R.Ettinger, 2011. A Case Study on the influence of aerobic biodegradation on vapor intrusion at a former refinery property, in “Vapor Emission to Outdoor Air and Enclosed Spaces for Human Health Risk Assessment: Site Charaterization, Monitoring and Modeling” Ed: Sabrina Saponaro, Elena Sezenna and Luca Bonomo (Politecnico di Milano, Italy), Nova Publishers, ISBN: 978-1-61728-692-6.
McAlary, T., 2011. Overcoming the Challenges of Vapour Intrusion Assessment and Mitigation, invited platform presentation at the first International Sites and Spills Conference, Nov. 4 & 5 2011, Toronto, Canada.
McAlary, T., 2011. Keys to Vapor Intrusion Assessment and Mitigation – Specifically for the Florida Brownfields Market. Invited Platform Presentation, Florida Brownfields Conference, Orlando, Florida, November 16, 2011.
McAlary, T., 2011. Development of More Cost-Effective Methods for Long-Term Monitoring of Subsurface Vapor Intrusion to Indoor Air Using Quantitative Passive Diffusive-Adsorptive Sampling Techniques, an invited presentation at the specialty side meeting on vapor intrusion at the ESTCP/SERDP Partners Conference, 30 November 2011, Washington, D.C.
McAlary, T., P. Nicholson, L. K. Yik, D. Bertrand, and G. Thrupp. 2010. High Purge Volume Sampling - A New Paradigm for Sub-Slab Soil Gas Monitoring. Groundwater Monitoring and Remediation document # GWMR20091006-0047R
Creamer, T., Larson, D. and McAlary, T. 2010. Urban Infrastructure and the Challenges Posed for Assessing and Mitigating Vapor Intrusion Adjacent to a Former Dry Cleaner: A Case Study. Air & Waste Management Association - Vapor Intrusion 2010, September 20 Chicago, IL
Creamer, T., Ettinger, R. and McAlary, T. 2010. Vapor Intrusion Evaluations: Better Decisions through Site Conceptual Models and High Quality Data. Licensed Site Professional Association invited keynote address Westford, MA; May
McAlary, T., H. Groenevelt, T. Górecki, S. Seethapathy, and H. Hayes. 2010. PDMS Membrane Samplers for Quantitative Passive Monitoring of Soil Vapor Intrusion to Indoor Air. Oral presentation at North American Environmental Field Conference & Exposition. January 2010, Tampa, FL
Abreu, L., and R. A. Ettinger. 2009. Understanding the Conceptual Site Model for Vapor Intrusion into Buildings. USEPA National Forum on Vapor Intrusion. 12 – 13 January, 2009, Philadelphia, PA
Todd Creamer, Todd McAlary, Hester Groenevelt, Tadeusz Górecki and Suresh Seethapathy (2009). A New Quantitative Passive Sampler for Vapor Intrusion Pathway Evaluation: The PDMS Membrane Sampler. The 25th Annual International Conference on Soils, Sediments, Water and Energy; Amherst, MA; October.
Abreu, L. D. V., R. A. Ettinger, and T. McAlary. 2009. Simulation of the Vapor Intrusion Process for Nonhomogeneous Soils Using a Three-Dimensional Numerical Model. Ground Water Monitoring & Remediation 29, no. 1: 92-104
Creamer, T., R. A. Ettinger, and T. McAlary. 2009. Knowledge (from High Quality Data) is Power: Vapor Intrusion Site Conceptual Models Really Work. The 19th Annual AEHS (Association for Environmental Health and Sciences) Meeting & West Coast Conference on Soils, Sediments and Water. March 2009, San Diego, CA
Dawson, H., and T. McAlary. 2009. A Compilation of Statistics for VOCs from Post – 1990 Indoor Air Concentration Studies in North American Residences Unaffected by Subsurface Vapor Intrusion. Ground Water Monitoring & Remediation v 29, no. 1: 60-69
Groenevelt, H. 2009. Quantitative Passive Sampling for Vapor Intrusion Studies. Presentation given to North Carolina Department of Environment and Natural Resources. July 2009, Raleigh, NC
Groenevelt, H., P. Nicholson, D. Bertrand, and T. McAlary. 2009. High Purge Volume Sampling: A New Paradigm for Sub-slab Soil Gas Monitoring. Oral presentation, 25th Annual International Conference on Soils, Sediments, Water & Energy, University of Massachusetts. October 2009, Amherst, MA
Johnson, P., R. A. Ettinger, J. Kurtz, R. Bryan, and J. Kester. 2009. Empirical Assessment of Ground Water-to-Indoor Air Attenuation Factors for the CDOT-MTL Denver Site. Ground Water Monitoring & Remediation 29, no. 1: 153-159
Luo, H., P. Dahlen, P. C. Johnson, T. Peargin, and T. Creamer. 2009. Spatial Variability of Soil-Gas Concentrations near and beneath a Building Overlying Shallow Petroleum Hydrocarbon-Impacted Soils. Ground Water Monitoring & Remediation 29, no. 1: 81-91
McAlary, T., H. Groenevelt, T. Górecki, S. Seethapathy, and H. Hayes. 2009. PDMS Membrane Samplers for Quantitative Passive Monitoring of Soil Vapor Intrusion to Indoor Air. Platform presentation, Air and Waste Management Specialty Conference. January 2009, San Diego, CA
McAlary, T., H. Groenevelt, B. Schumacher, D. Crump, T. Gorecki, P. Sacco, M. Tuday, H. Hayes, and P. C. Johnson. 2009. Development of More Cost-Effective Methods for Long-Term Monitoring of Soil Vapor Intrusion to Indoor Air Using Quantitative Passive Diffusive-Adsorptive Sampling Techniques. Proceedings, Partners in Environmental Technology Symposium and Workshop. Annual presentations from December 2008 to 2009, Washington, D.C.
McAlary, T., P. Nicholson, H. Groenevelt, and D. Bertrand. 2009. A Case Study of Soil-Gas Sampling in Silt and Clay-Rich (Low-Permeability) Soils. Ground Water Monitoring & Remediation 29, no. 1: 144-152
Abreu, L. D. V., R. A. Ettinger, and T. McAlary. 2008. Simulating the Effect of Aerobic Biodegradation on Soil Vapor Intrusion into Buildings: Evaluation of Low Strength Sources associated with Dissolved Gasoline Plumes. API Technical Bulletin #4775. 2008, Washington, D.C.
de Haven, P., H. Groenevelt, P. Dollar, and T. McAlary. 2008. Long-Term Monitoring to Assess the Potential for Vapor Intrusion with Particular Focus on Data Quality and Data Management. Poster presentation, Department of Defence, Environmental Monitoring & Data Quality Workshop. 31 March - 4 April, 2008, Atlanta, GA
Ettinger, R. A. 2008. ASTM’s New Standard for Vapor Intrusion: the Good, the Bad and the Ugly, Los Angeles County Bar Association Seminar. 23 October, 2008, Los Angeles, CA
Ettinger, R. A. 2008. Current Strategies to Evaluate the Vapor Intrusion Pathway. 2008 Environmental Law Conference at Yosemite, State Bar of California Environmental Law Section. 17 October, 2008
Ettinger, R. A. 2008. Recent Developments in Vapor Intrusion Investigations and Regulations. Tri-Service Environmental Risk Assessment Work Group Meeting. 10 September, 2008, Port Hueneme, CA
Ettinger, R. A. 2008. Current Strategies to Evaluate the Vapor Intrusion Pathway. Florida Chamber of Commerce 22nd Annual Environmental Permitting Summer School. 18 July, 2008, Marco Island, FL
Ettinger, R. A. 2008. Vapour Intrusion Evaluation Strategy and Modeling Developments. Maxxam’s 2008 Scientific Conference, Atlantic Region. 23 June, 2008, Halifax, NS
Ettinger, R. A. 2008. Vapor Intrusion Evaluation Strategy and Modeling Developments. Northwest Environmental Business Council. 10 April, 2008, Portland, OR
Ettinger, R. A. 2008. Soil Vapor Intrusion Pathway Modeling. An Invited Platform Presentation at the Air Force Center for Environmental Excellence (AFCEE) Technology Transfer Workshop. 25 to 28 March, 2008, San Antonio, TX
Groenevelt, H., and T. McAlary. 2008. Quantitative Passive Sampling for Vapor Intrusion Studies. Platform Presentation, Air and Waste Management Specialty Conference. September, 2008, Toronto, Canada
McAlary, T. 2008. Lessons from Petroleum Hydrocarbon and Chlorinated Solvent Sites Extensively Monitored for Vapor Intrusion. An Invited Platform Presentation at the Specialty Seminar on Technical Updates to USEPA & ITRC Vapor Intrusion Guidance Data from Vapor Intrusion Investigations, March 13, 9:00 am–5:30 pm, Association for Environmental Health and Sciences (AEHS). Spring 2008 Meeting, San Diego, CA
McAlary, T. 2008. Planning Soil Vapor Intrusion Investigations Based on Various Conceptual Models: Understanding the Processes and Mechanisms to Design an Efficient and Effective Characterization Program. An Invited Platform Presentation at the Air Force Center for Environmental Excellence (AFCEE) Technology Transfer Workshop. 25 - 28 March, 2008, San Antonio, TX
Abreu, L. D. V., R. A. Ettinger, and T. McAlary. 2007. Application of 3D Numerical Modeling to Assess Vapor Intrusion Screening Criteria for Petroleum Hydrocarbon Sites. Proceeding of the AWMA Specialty Conference, Vapor Intrusion: Learning from the Challenges. 26 – 28 September, 2007, Providence, RI
Luo, H., P. Dahlen, P. C. Johnson, T. Creamer, T. Peargin, and T. McAlary. 2007. Spatial and Temporal Variability of Sub-Slab Soil Gas Concentrations at a Petroleum-Impacted Site. Air and Waste Management Association, Vapor Intrusion: Learning from the Challenges. September 2007, Providence, RI
Abreu, L., R. A. Ettinger, and T. McAlary. 2007. Application of 3D Numerical Modeling to Assess Vapor Intrusion Screening Criteria for Petroleum Hydrocarbon Sites. Platform presentation at the AEHS Conference on Contaminated Soils and Sediments. March 2007, San Diego, CA
Ettinger, R. A. 2007. Evaluation of the Effect of Vadose Zone Biodegradation on Vapor Intrusion at Petroleum Hydrocarbon Sites. Assessment and Remediation of Oxygenates and Other Fuel Components. Sponsored by NEIWPCC, API, and ASTSWMO. 22 – 23 October, 2007
Ettinger, R. A., L. Abreu, and T. McAlary. 2007. Evaluation of the Effect of Vadose Zone Biodegradation on Vapor Intrusion at Petroleum Hydrocarbon Sites. Vapor Intrusion Mitigation Workshop. Sponsored by NEWMOA and Brown University. 11-12 June, 2007
Ettinger, R. A., S. Costello, K. Tolson, and C. Caulk. 2007. Quantitative Evaluation of Soil Gas Profile Data for the Assessment of the Vapor Intrusion Pathway. The Seventeenth Annual AEHS Meeting and West Coast Conference on Soils, Sediments, and Water. 19-22 March, 2007, San Diego, CA
McAlary, T. 2007. Vapour Intrusion – Recent Trends and Future Directions. An Invited Presentation at the Ministry of the Environment of Ontario. 20 December, 2007
McAlary, T., P. Nicholson, D. Bertrand, L. Abreu, and R. A. Ettinger. 2007. A Case Study on the Influence of Aerobic Biodegradation on Vapor Intrusion at a Former Refinery Property. Platform Presentation at the Air and Waste Management Association’s Specialty Conference on Vapor Intrusion. 27 September, 2007, Providence, RI

McAlary, T., and E. McNally. 2007. Vapor Intrusion: Technical Issues and Updates. Invited Platform Presentation at the New Jersey Water Environment Association and New Jersey Department of Environmental Protection Seminar “Ground Water 2007”. 5 June, 2007, East Windsor, NJ
McAlary, T., and K. Berry-Spark. 2007. Screening and Evaluating Sites for Vapor Intrusion During Contaminated Property Transactions. Invited Platform presentation at RTM Symposium on Contaminated Property Transactions – Mitigating the Risks of Redevelopment. 13 April, 2007, Washington, D.C.
Nicholson, P., D. Bertrand, and T. McAlary. 2007. Soil Gas Sampling in Low-Permeability Materials. Platform Presentation at the Air and Waste Management Association’s Specialty Conference on Vapor Intrusion. 28 September, 2007, Providence, RI
Menatti, J. A., T. R. Peargin, and T. Creamer. 2006. The Vapor Intrusion Pathway and Biodegradation of Gasoline and Benzene Vapors in the Vadose Zone: A Utah Experience. National Groundwater Association, Petroleum Hydrocarbons and Organic Chemicals in Groundwater: Prevention, Assessment and Remediation Conference. November 2006, Houston, TX
Abreu, L. D. V., and P. C. Johnson. 2006. Simulating the Effect of Aerobic Biodegradation on Soil Vapor Intrusion into Buildings: Influence of Degradation Rate, Source Concentration, and Depth. Environmental Science and Technology 40, no. 7: 2304-2315.
Creamer, T., and T. McAlary. 2006. The Effects of Purge Rate and Volume on Subslab Soil Gas Samples. Proceedings of the Fifth International Conference on Remediation of Chlorinated and Recalcitrant Compounds. May 2006, Monterey, CA. Battelle Press, Columbus, OH
Ettinger, R. A. 2006. Vapor Intrusion Evaluation Strategy and Modeling Developments. California Industrial Hygiene Council’s 16th Annual Conference. 4-6 December, 2006, San Diego, CA
Ettinger, R. A. 2006. Alternate Model-based Approach for Assessing Vapor Intrusion at Petroleum Hydrocarbon Sites. Air and Waste Management Association Vapor Intrusion: The Next Great Environmental Challenge – An Update. 13-15 September, 2006, Los Angeles, CA
Luo, H., P. Dahlen, P. C. Johnson, T. Creamer, T. Peargin, P. Lundegard, B. Hartman, L. Abreu, and T. McAlary. 2006. Spatial and Temporal Variability in Hydrocarbon and Oxygen Concentrations Beneath a Building Above a Shallow NAPL Source. Platform Presentation at the Battelle Conference on Remediation of Chlorinated and Recalcitrant Compounds. May 2006, Monterrey, CA
McAlary, T. 2006. Screening and Evaluating Sites for Vapor Intrusion During Contaminated Property Transactions. Invited Presentation at the RTM Webinar on Vapor Intrusion – Deals and Due Diligence. 29 November, 2006
McAlary, T. 2006. Screening and Evaluating Sites for Vapor Intrusion During Contaminated Property Transactions. Invited Platform presentation at the RTM Symposium on Contaminated Property Transaction – Navigating the Complex Deals. 20 October, 2006, San Francisco, CA
McAlary, T. 2006. Recommended Soil Gas Sampling Techniques for Vapor Intrusion Investigations. Invited platform presentation at the Air and Waste Management Association Specialty Conference on Vapor Intrusion. September 2006, Los Angeles, CA
McAlary, T. 2006. Soil Gas Sampling Methods. Invited platform presentation at the Midwestern States Risk Assessment Symposium. August, 2006, Indianapolis, IN.
McAlary, T., and R. A. Ettinger. 2006. Modeling the Vapor Intrusion Pathway. Invited presentation at the Electric Power Research Institute Annual Meeting. 22 June, 2006, Bar Harbor, ME
McAlary, T. 2006. Sub-Slab Soil Gas Monitoring for Assessing Subsurface Vapor Intrusion to Indoor Air. Invited presentation at the Rutgers University Seminar on Vapor Intrusion. 14 June, 2006
McAlary, T. 2006. Beyond Screening – The Site Characterization Process. A talk at the Vapor Intrusion Short course “Managing Vapor Intrusion Sites” at the Battelle Conference on Remediation of Chlorinated and Recalcitrant Compounds. May 2006, Monterrey, CA
McAlary, T., R. A. Ettinger, and K. Berry-Spark. 2006. Practical Considerations for Vapor Intrusion Investigations. An Invited Platform Presentation and Extended Abstract in: Proceedings of the Air and Waste Management Association Specialty Conference on Vapor Intrusion. January 2006, Philadelphia, PA
Berry-Spark, K., T. McAlary, N. Bice, and P. Zeeb. 2005. Mitigation of the Vapor Intrusion Pathway at Four Chlorinated Solvent Sites. In Subsurface Vapor Intrusion to Indoor Air: An Update. The 14th Symposium in GRA's Series on Groundwater Contaminants, 25 May, 2005, San Jose, CA
Ettinger, R. A. 2005. Vapor Intrusion Modeling for Contaminated Properties. RTM Contaminated Property Transaction Symposium. 19 October, 2005, Cambridge, MA
Ettinger, R. A., and T. McAlary. 2005. Site-specific Vapor Intrusion Evaluation Including Biodegradation. Battelle In-Situ and On-Site Bioremediation Symposium, 6 – 9, June, 2005, Baltimore, MD
McAlary, T., and R. A. Ettinger. 2005. A Practitioner’s Perspective on Vapor Intrusion. an Invited Editorial in: Proceedings of the American Bar Association Joint Fall CL Meeting, September, 2005, San Francisco, CA
McAlary, T., and R. A. Ettinger. 2005. Key Considerations for Vapor Intrusion Evaluations. Platform presentation at the American Bar Association Joint Fall CL Meeting, 17 September, 2005, San Francisco, CA
McAlary, T. A., R. A. Ettinger, and P. C. Johnson. 2005. Reference Handbook for Site-Specific Assessment of Subsurface Vapor Intrusion to Indoor Air. EPRI, 2005, Palo Alto, CA, EPRI Document #1008492
McAlary, T., and R. A. Ettinger. 2005. Strategy for Assessment, Data Analysis, and Interpretation of Subsurface Vapor Intrusion. In Subsurface Vapor Intrusion to Indoor Air: An Update, The 14th Symposium in GRA's Series on Groundwater Contaminants, 25 May, 2005, San Jose, CA
McAlary, T. 2005. Examples of Data Collection Strategies and Methods. Invited Platform Presentation at the 14th Annual West Coast Conference on Soils, Sediments, and Water – The Association for Environmental Health and Sciences. 15-18 March, 2005, San Diego, CA
McAlary, T., and H. Dawson. 2005. How to Determine, Interpret, and Resolve Background Contributions from Indoor Air Data. Invited Platform Presentation at the 14th Annual West Coast Conference on Soils, Sediments, and Water – The Association for Environmental Health and Sciences. 15-18 March, 2005, San Diego, CA
Berry-Spark, K., T. McAlary, and N. Bice. 2004. Empirical Alpha Factors at Wet Basement Sites. Presented at the US EPA Vapor Intrusion Workshop held at the AEHS 14th Annual West Coast Conference on Soils, Sediments and Water. 15-18 March, 2004, San Diego, CA
Berry-Spark, K. 2004. Understanding the Subsurface Vapor Intrusion Pathway. Presented to the Louisiana Department of Environmental Quality. 31 March, 2004, Baton Rouge, LA
Berry-Spark, K., T. McAlary, N. Bice, M. DeFlaun, and P. Zeeb. 2004. Risk Management Approaches at Vapor Intrusion Sites - Chlorinated Solvents Case Studies. Presented at the Fourth International Conference on Remediation of Chlorinated and Recalcitrant Compounds. 24-27 May, 2004, Monterey, CA
Berry-Spark, K., T. McAlary, N. Bice, and M. DeFlaun. 2004. Empirical and Modeled Alpha Factors at Two Vapor Intrusion Sites. Platform presentation at the AEHS 20th Annual International Conference on Soils, Sediments and Water, Modeling Vapor Attenuation Workshop: A Study of Vapor Intrusion Modeling in the Context of EPA’s Guidance. 18-21 October, 2004, Amherst, MA
Berry-Spark, K., T. McAlary, and N. Bice. 2004. Empirical Alpha Factors at ‘Wet Basement’ Sites. A presentation at the US EPA Vapor Intrusion Workshop held at the AEHS 14th Annual West Coast Conference on Soils, Sediments and Water. 15-18 March, 2004, San Diego, CA
Berry-Spark, K., T. McAlary, M. DeFlaun, J. Finn, J. Lennon, and C. Sweeney. 2004. Vapor Intrusion at a Former Manufactured Gas Plant Site – Assessing Background Contributions to Indoor Air Quality. A presentation at the Midwestern States Risk Assessment Symposium, June 2004, Indianapolis, IN
Ettinger, R. A. 2004. Key Modeling Considerations for Subsurface Vapor Intrusion Evaluation. Soil and Groundwater Remediation Seminar, The Gas Company’s Energy Resource Center, 19 October, 2004, Downey, CA
Ettinger, R. A. 2004. The impact of background concentration on vapor intrusion assessment. DOE/Petroleum Environmental Research Forum Vapor Pathway Workshop. 28 January, 2004, Brea, CA
McAlary, T. 2004. Future Directions for Assessing Vapor Intrusion. Panel Member Presentation at the AEHS 20th Annual International Conference on Soils, Sediments and Water, Modeling Vapor Attenuation Workshop: A Study of Vapor Intrusion Modeling in the Context of EPA’s Guidance. 18-21 October, 2004, Amherst, MA
McAlary, T., D. Mickunas, and G. Plantz. 2004. Approaches and Methods Influencing Observational Data. Invited Platform Presentation at the AEHS Annual Conference on Soils, Sediments and Water, Modeling Vapor Attenuation Workshop: A Study of Vapor Intrusion Modeling in the Context of EPA’s Guidance, October 2004, Amherst, MA
McAlary, T. 2004. Vapor Intrusion: Regulatory Drivers and Technical Challenges. Invited Panel Member Presentation at the Florida Brownfields Conference. October 2004, Sarasota, FL
McAlary, T. 2004. Subsurface Vapor Intrusion, Challenges and Future Directions. A presentation at Session WR1a: Advances in Indoor Air Vapor Intrusion: Guidance and Application at the Air and Waste Management Association’s Annual Conference, 23 June, 2004, Indianapolis, IN
McAlary, T., and R. A. Ettinger. 2004. A Practitioner’s Perspective on Vapor Intrusion. Invited guest editorial, in “In the Air”, the newsletter of Air Toxics Limited 9, no. 1
McAlary, T., P. Dollar, H. Groenevelt, R. Moss, and G. Wilkinson. 2004. Subsurface Vapor Intrusion to Indoor Air, Effect of Phase Partitioning. In Remediation of Chlorinated and Recalcitrant Compounds. Battelle Press May, 2004, Monterey, CA
McAlary, T. 2004. Measured Attenuation Coefficients for Soil Gas to Indoor Air, Runcorn, Cheshire, UK. An invited presentation at the US EPA Vapor Intrusion Workshop held at the AEHS 14th Annual West Coast Conference on Soils, Sediment and Water, March 2004.
McAlary, T., P. Dollar, H. Groenevelt, P. DeHaven, J. Rosen, and R. Moss. 2004. Calculated Vapor Attenuation Coefficients at the Weston Quarries Site, Runcorn, Cheshire, UK. An abstract and data presented at the US EPA Vapor Intrusion Workshop held at the AEHS 14th Annual West Coast Conference on Soils, Sediment and Water. 15-18 March, 2004, San Diego, CA
McAlary, T., K. Berry-Spark, T. Krug, and J. Uruskyj. 2004. The Fresh Water Lens and its Effects on Groundwater to Indoor Air Attenuation Coefficients. An invited presentation at the US EPA Vapor Intrusion Workshop held at the AEHS 14th Annual West Coast Conference on Soils, Sediment and Water. 15-18 March, 2004, San Diego, CA
McAlary, T. 2004. Empirical Data: Challenges and Future Directions. Closing address at the AEHS 14th Annual West Coast Conference on Soils, Sediment and Water. 15-18 March, 2004, San Diego, CA
McAlary, T. 2004. Vapor Intrusion: Regulatory Drivers, Challenges, and Management Issues. An invited presentation at the annual meeting of Remediation Project Managers of a major multi-national corporation. March 2004
Ettinger, R. A. 2003. Identifying Key Factors and Preferred Lines of Evidence. EPRI MGP Site Management Program Subsurface Vapor Intrusion (SVI) to Indoor Air Workshop. 11–12 December, 2003, Jupiter, FL
Ettinger, R. A. 2003. The Impact of Background Concentration on Vapor Intrusion Assessment. Groundwater Resources Association Symposia, Subsurface Vapor Intrusion to Indoor Air: When is Soil and Groundwater Contamination an Indoor Air Issue? 30 September, 2003, San Jose, CA, and 1 October, 2003, Long Beach, CA
Ettinger, R. A. 2003. Key Considerations for Evaluating the Vapor Intrusion Pathway. Seminar on Indoor Air Vapor Intrusion. December 2002, San Francisco, CA and January 2003, Dallas, TX
Kerfoot, H. B., J. A. Baker, and D. M. Burt. 2003. The Use of Isotopes to Identify Landfill Gas Effects on Groundwater. Journal of Environmental Monitoring DOI:10.1039/ B310351J
Kerfoot, H. B., J. A. Baker, and D. A. Burt. 2003. Geochemical changes in groundwater due to landfill gas effects. Groundwater Monitoring and Remediation 24, no. 1: 60-65
McAlary, T. 2003. Federal Guidance on Vapor Intrusion – History and Status. EPRI MGP Site Management Program Subsurface Vapor Intrusion (SVI) to Indoor Air Workshop. 11-12 December, 2003, Jupiter, FL
McAlary, T. 2003. Conceptual Models of Vapor Intrusion. EPRI MGP Site Management Program Subsurface Vapor Intrusion (SVI) to Indoor Air Workshop. 11-12 December, 2003, Jupiter, FL
McAlary, T., and R. A. Ettinger. 2003. Modeling the Vapor Intrusion Pathway. EPRI MGP Site Management Program Subsurface Vapor Intrusion (SVI) to Indoor Air Workshop. 11-12 December, 2003, Jupiter, FL
McAlary, T. 2003. Vapor Intrusion into Indoor Air, with a focus on New Jersey. An invited presentation to the New Jersey Site Remediation Information Network. September 2003
McAlary, T. 2003. Empirical Experience Gathering Data to Assess Vapor Intrusion. An invited presentation at the California Groundwater Resources Association seminar “Subsurface Vapor Intrusion to Indoor Air: When is Soil and Groundwater Contamination an Indoor Air Issue?” 30 September and 1 October, 2003
McAlary, T. 2003. Strategies for the Site-Specific Assessment: How to Protect Yourself from the Hidden Traps. An invited seminar at the Environmental Symposium on Indoor Air Pathway Evaluation for VOC Releases held by the Environmental Law Institute. June, 2003, San Francisco, CA
McAlary, T. 2003. Impact of New Vapor Intrusion Guidance on Site Remediation. An invited presentation at the annual meeting of a large, multi-national manufacturing corporation. June, 2003
McAlary, T. 2003. Case Studies of Subsurface Vapor Intrusion Into Buildings. An On-Line Seminar through the Environmental Institute for Continuing Education. 29 January, 2003
McAlary, T. 2003. Conceptual Site Models of Vapor Intrusion. An invited presentation at the U.S. EPA Seminar on Indoor Air Vapor Intrusion. December 2002, San Francisco, CA; January 2003, Dallas, TX, and February 2003, Atlanta, GA
McAlary, T., and R. A. Ettinger. 2003. Key Considerations for Evaluating the Vapor Intrusion Pathway. An invited presentation at the U.S. EPA Seminar on Indoor Air Vapor Intrusion. February 2003, Atlanta, GA
Williams, S. 2003. Getting to Redevelopment: A Case Study of the Implementation of Engineering Controls versus Site Remediation. Presented at the Creating Vibrant Communities: Redeveloping California’s Brownfields workshop sponsored by the California Center for Land Recycling. 3 April, 2003, Los Angeles, CA
Williams, S. 2003. Vapor Control Issues and Considerations for Development of Brownfields Sites. Presented to the California Recycling Market Development Zones (RMDZ) Innovations in Brownfields Development Workshop. 5 June 2003, San Diego, CA
Williams, S. 2003. Use of Innovative Technologies in Developing Brownfields Sites: Case Studies Involving Engineering Controls to Mitigate Vapor Intrusion. Presented at the National Association of Local Government Environmental Professionals Seminar, Western Regional Brownfields Workshop. 25 June, 2003, Las Vegas, NV
Berry-Spark, K., T. McAlary, P.Dollar, and T. Krug. 2002. Intrusion of Subsurface Vapors into Buildings – Chlorinated Solvent Case Studies. Poster Presentation, Remediation of Chlorinated and Recalcitrant Compounds. 20-23 May, 2002, Monterey, CA
DeVaull, G. E., R. A. Ettinger, and J. B. Gustafson. 2002. Chemical vapor intrusion from soil or groundwater to indoor air: Significance of unsaturated zone biodegradation of aromatic hydrocarbons. Soil and Sediment Contamination 11, no. 3: 625-641
Ettinger, R. A. 2002. Vapor Intrusion Modeling: Theory and implications. USEPA Technical Support Project. 3-6 June, 2002, Denver, CO
Johnson, P. C., R. A. Ettinger, J. Kurtz, R. Bryan, and J. E. Kester. 2002. Migration of Soil gas Vapors to Indoor Air: Determining Vapor Attenuation Factors Using a Screening-Level model and Field Data from the CDOT-MTL Denver, Colorado Site. American Institute Bulletin No. 16, April, 2002
McAlary, T., P. Dollar, P. de Haven, R. Moss, G. Wilkinson, J. Llewellyn, and D. Crump. 2002. Assessment of Subsurface Vapour Transport Through Triassic Sandstone and Quarry Fill into Indoor Air in Weston Village, Runcorn. Platform Presentation, Indoor Air 2002. 1-5 July, 2002, Monterey, CA
McAlary, T., P. Dollar, R. Moss, and G. Wilkinson. 2002. Vapor Intrusion: Comparison Between Triassic Sandstone and Unconsolidated Fill Using Field Data and Models. A Poster at the Midwestern States Risk Assessment Symposium, June 2002, Indianapolis, IN

McAlary, T., P. Dollar, P. de Haven, R. Moss, G. Wilkinson, J. Llewellyn, and D. Crump. 2002. Characterization of Vapour Transport in Fractured Rock,” Platform Presentation, Remediation of Chlorinated and Recalcitrant Compounds. 20-23 May, Monterey, CA
McAlary, T., P. Dollar, K. Berry-Spark, and T. Krug. 2002. Management Decisions for Assessing Subsurface Vapor Intrusion into Indoor Air. Poster Presentation, Remediation of Chlorinated and Recalcitrant Compounds. 20-23 May, 2002, Monterey, CA
McAlary, T. 2002. Alpha Factors, Measured and Modeled: A Case Study. A presentation at the RCRA National Meeting, 17 January, 2002, Washington, D.C.
Ettinger, R. A., and L. Hay Wilson. 2001. Practical considerations for the assessment of the vapor migration to indoor air pathway. 2001 Petroleum Hydrocarbons and Organic Chemicals in Ground Water: Prevention, Detection, and Remediation. Conference and Exposition. 13 November, 2001, Houston, TX
Ettinger, R. A. 2001. Vapor migration to indoor air fate and transport considerations. 13th Annual UST/LUST National Conference. March 2001, Albuquerque, NM
Lahvis, M. A., G. E. DeVaull, and R. A. Ettinger. 2001. Effects of diffusion-coefficient heterogeneity and biodegradation on vapor transport to indoor air at gasoline spill sites. 2001 Petroleum Hydrocarbons and Organic Chemicals in Ground Water: Prevention, Detection, and Remediation. Conference and Exposition. 13 November, 2001, Houston, TX,
McAlary, T. 2001. Evaluating Subsurface Vapor Intrusion into Buildings. An on-line seminar through the Environmental Institute for Continuing Education. 20 June, 2001
McAlary, T., P. Dollar, P. de Haven, H. Groenevelt, A. Lawrence, D. Crump and R. Moss. 2001. Characterization of Subsurface Vapour Transport in Triassic Sandstone. Poster presented at Fractured Rock 2001. March, 2001, Toronto, Canada
Williams, S., and H. Kerfoot. 2001. Sources of Groundwater Impacts at Landfills, Is it Landfill Gas or Leachate? Seminar presented to California County Counsels' Associations, Hazardous Waste/Solid Waste Study Section. 11 October, 2001, Pasadena, CA
Williams, S. 2001. The First Successful Hawaii Voluntary Response Program Site, Former Dole Cannery, Home Depot Development – How Engineering Controls Facilitated Development of Contaminated Property. Invited speaker to Brownfields Hawaii 2001, Honolulu. sponsored by the State of Hawaii and the US EPA. 18 October, 2001
Bryan, R., J. Kurtz, R. A. Ettinger, and P. C. Johnson. 2000. In-depth review of Colorado (CDOT facility) data. USEPA RCRA Environmental Indicators Forum. August 2000, Washington, D.C.
Corcoran, G. T., D. W. Riotte, and T. R. Sanglerat. 2000. Gas Control System Experience. Presented to Blue Ribbon Citizens’ Oversight Committee and Augmented Facilities Committee (Los Angeles School Board Public Meeting). Los Angeles, CA
Ettinger, R. A. 2000. Conceptual model for migration of volatile contaminant vapors into buildings. USEPA RCRA Environmental Indicators Forum. August 2000, Washington, D.C.
McAlary, T. 2000. A Case Study: Subsurface Vapour Migration into Indoor Air in the United Kingdom. Presented at the RCRA Corrective Action Environmental Indicator Forum. 15-17 August, 2000, Washington, D.C.
McAlary, T., and P. Dollar. 2000. Characterization of Vapor Transport in Fractured Rock. Poster presented at Remediation of Chlorinated and Recalcitrant Compounds conference sponsored by Battelle. 22-25 May, 2000, Monterey, CA
McAlary, T. 2000. The Pathway from Soil Gas to Indoor Air. A presentation at the corporate meeting of Remediation Project Managers of a Major Multi-National Corporation. 27 April, 2000
Riotte, D. W., G. T. Corcoran, and T. R. Sanglerat. 2000. Design and Construction of Subsurface Gas Control System for Buildings. Presented to Los Angeles Department of Toxic Substances Control. Los Angeles, CA
Williams, S. 2000. Anatomy of Two Complicated Brownfield Sites - The use of Engineering Controls for Brownfields Development, Regulatory, Technical, and Policy Issues. Pacific Environmental Restoration Conference sponsored by the Department of Defense and The Society of American Military Engineers. 5 April, 2000, Honolulu, HI
Williams, S. 2000. Beyond Agency Standards: Success Stories of Risk-Based Corrective Action – The Use of Engineering Controls to Mitigate Vapor Intrusion. Invited speaker for Mealey's MTBE and UST Litigation Conference. 23 October, 2000, Phoenix, AZ
Cox, E. E., T. McAlary, J. Allan, L. Lehmicke, S. Neville, and D. W. Major. 1998. Cometabolic Bioventing of Chlorinated Solvents at a Former Waste Lagoon. Remediation of Chlorinated and Recalcitrant Compounds Volume 1, Battelle Press, Columbus, Ohio. Presented May 1998, Monterey, CA
Williams, S., and M. Lahasaie. 1998. Vapor Phase Migration Model. Site Assessment and Mitigation Manual, Appendix B, prepared for County of San Diego Department of Environmental Health. January, 1998
DeVaull, G. E., R. A. Ettinger, J. P. Salinitro, and J. B. Gustafson. 1997. Benzene, Toluene, Ethylbenzene and Xylenes (BTEX) Degradation in Vadose Zone Soils During Vapor Transport: First Order Rate Constants. Proceedings of the API/NGWA Petroleum Hydrocarbons and Organic Chemicals in Groundwater: Prevention, Detection and Remediation Conference. 12-14 November, 1997, Houston, TX. 365-379
Williams, S. 1997. Vapor Phase Transport, A Less Conservative Approach. Presented at the Soil Vapor Transport to Indoor Air Workshop sponsored by the Petroleum Environmental Research Forum, Risk Assessment Cooperative. 6-7 February, 1997, Brea, CA
Kerfoot, H. B. 1994. In Situ Determination of the Rate of Unassisted Degradation of Dissolved Hydrocarbon Contamination. Journal of the Air and Waste Management Association 44: 877-880
Heins, T. R., H.B. Kerfoot, D. J. Miller, D. A. Peterson. 1992. Quality Assurance in Soil-Gas Surveys: False Positive Acetone Identifications at a Codisposal Site. In Current Practices in Ground-Water and Vadose Zone Monitoring, STP 1118, American Society for Testing and Materials. January, 1992, Philadelphia, PA
Johnson, P. C., and R. A. Ettinger. 1991. Heuristic Model for Predicting the Intrusion Rate of Contaminant Vapors into Buildings. Environmental. Science and Technology 25:1445-1452
Kerfoot, H. B. 1991. Subsurface Partitioning of Volatile Organic Compounds: Effects of Temperature and Soil Moisture. Ground Water 29, no. 5: 678-684
Kerfoot, H. B., S. L. Pierett, E. N. Amick, D. W. Bottrell, and J. D. Petty. 1990. Analytical Performance of Four Portable Gas Chromatographs Under Field Conditions. Journal of the Air Pollution Control Association 40, no. 8: 1106-1113
Kerfoot, H. B. 1990. Soil-Gas Surveys for Detection and Delineation of Ground-Water Contamination. Invited Paper, Trends in Analytical Chemistry. April, 1990
Mendoza, C. A., and T. McAlary. 1990. Modeling of Groundwater Contamination Caused by Organic Solvent Vapours. Ground Water 28, no. 2: 199-206
Kerfoot, H. B. 1989. Soil-Gas Sampling for Delineation of Groundwater Contamination. Invited Lecture, Pittsburgh Conference and Exposition on Analytical Chemistry and Spectroscopy. 3-7 March, 1989, Atlanta, GA
Kerfoot, H. B., C. L. Mayer, P. B. Durgin, and J. J. D'Lugosz. 1988. Measurement of Carbon Dioxide in Soil Gases for Indication of Subsurface Organic Contamination. Ground Water Monitoring Review Spring, 1988
Kerfoot, H. B. 1988. Soil-Gas Monitoring. Invited Lecture, "Second Annual Outdoor Action Conference on Groundwater Monitoring and Geophysical Methods", National Water Well Association. Dublin, Ohio, 1988
Kerfoot H. B. 1988. Is Soil-Gas Analysis an Effective Means of Tracking Contaminant Plumes in Ground Water? What are the Limitations of the Technology Currently Employed?" Invited Position Paper, Ground Water Monitoring Review Spring, 1988
Kerfoot, H. B., and M. J. Miah. 1987. Network Design in Soil-Gas Surveys. EOS 16: 322
Marrin, D. L., and H. B. Kerfoot. 1988. Soil-Gas Surveys. Feature Article, Environmental Science and Technology August, 1988
McAlary, T. 1988. Comparison of Measured and Calculated Reactive Vapor Diffusion Coefficients in Unsaturated Sands. M.Sc. Thesis, Department of Earth Sciences, University of Waterloo, 1989
Kerfoot, H. B., and M. J. Miah. 1987. Spatial Resolution of Ground-Water Contamination by Soil-Gas Measurement. Chemometrics and Intelligent Laboratory Systems 1987
Kerfoot, H. B. 1987. Shallow-Probe Soil-Gas Sampling for Indication of Ground-Water Contamination by Chloroform. International Journal of Environmental Analytical Chemistry 30: 167-181
Kerfoot, H. B. 1987. Shallow-Probe Soil-Gas Sampling for Detection of Ground-Water Contamination by Volatile Organic Compounds. Environmental Science and Technology October, 1987
Kerfoot, H. B. 1987. Soil-Gas Surveying for Subsurface Organic Contamination: Active and Passive Techniques. Seminar, Superfund '87, Hazardous Materials Control Research Institute. November, 1987, Silver Spring, MD
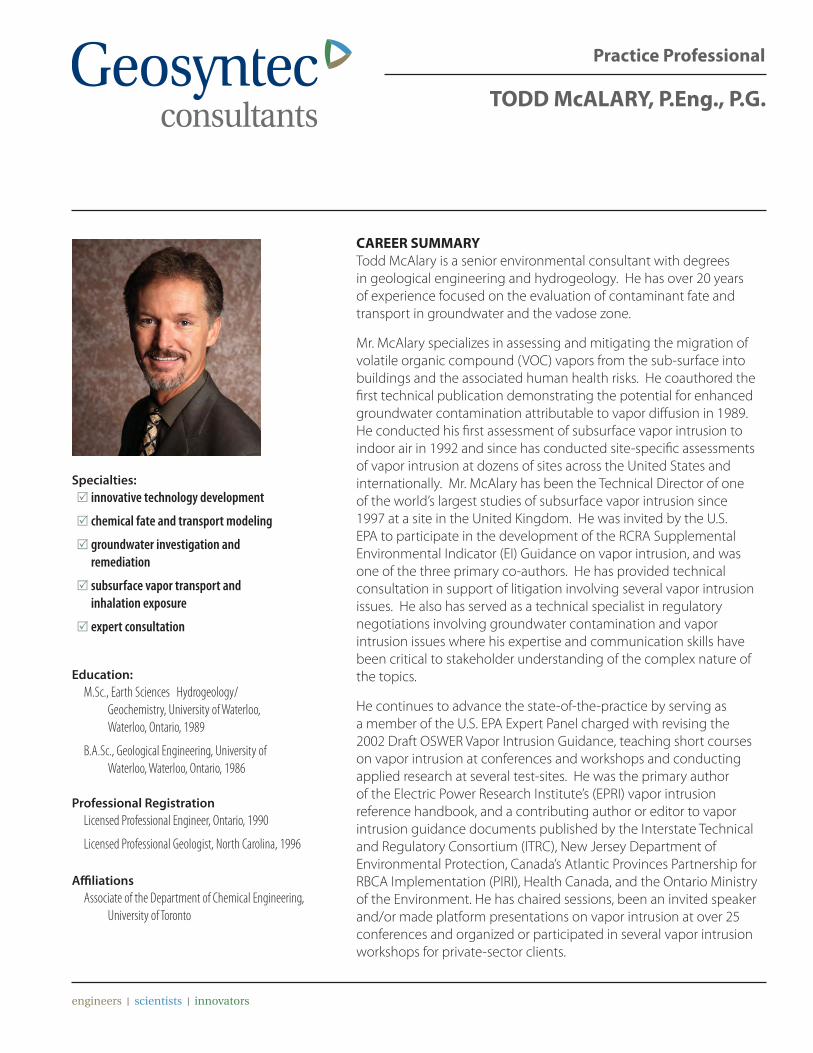
Practice Professional
TODD McALARY, P.Eng., P.G.
CAREER SUMMARYTodd McAlary is a senior environmental consultant with degrees in geological engineering and hydrogeology. He has over 20 years of experience focused on the evaluation of contaminant fate and transport in groundwater and the vadose zone.
Mr. McAlary specializes in assessing and mitigating the migration of volatile organic compound (VOC) vapors from the sub-surface into buildings and the associated human health risks. He coauthored the fi rst technical publication demonstrating the potential for enhanced groundwater contamination attributable to vapor diff usion in 1989. He conducted his fi rst assessment of subsurface vapor intrusion to indoor air in 1992 and since has conducted site-specifi c assessments of vapor intrusion at dozens of sites across the United States and internationally. Mr. McAlary has been the Technical Director of one of the world’s largest studies of subsurface vapor intrusion since 1997 at a site in the United Kingdom. He was invited by the U.S. EPA to participate in the development of the RCRA Supplemental Environmental Indicator (EI) Guidance on vapor intrusion, and was one of the three primary co-authors. He has provided technical consultation in support of litigation involving several vapor intrusion issues. He also has served as a technical specialist in regulatory negotiations involving groundwater contamination and vapor intrusion issues where his expertise and communication skills have been critical to stakeholder understanding of the complex nature of the topics.
He continues to advance the state-of-the-practice by serving as a member of the U.S. EPA Expert Panel charged with revising the 2002 Draft OSWER Vapor Intrusion Guidance, teaching short courses on vapor intrusion at conferences and workshops and conducting applied research at several test-sites. He was the primary author of the Electric Power Research Institute’s (EPRI) vapor intrusion reference handbook, and a contributing author or editor to vapor intrusion guidance documents published by the Interstate Technical and Regulatory Consortium (ITRC), New Jersey Department of Environmental Protection, Canada’s Atlantic Provinces Partnership for RBCA Implementation (PIRI), Health Canada, and the Ontario Ministry of the Environment. He has chaired sessions, been an invited speaker and/or made platform presentations on vapor intrusion at over 25 conferences and organized or participated in several vapor intrusion workshops for private-sector clients.
Specialties:innovative technology development
chemical fate and transport modeling
groundwater investigation and remediation
subsurface vapor transport and inhalation exposure
expert consultation
Education:M.Sc., Earth Sciences Hydrogeology/
Geochemistry, University of Waterloo, Waterloo, Ontario, 1989
B.A.Sc., Geological Engineering, University of Waterloo, Waterloo, Ontario, 1986
Professional RegistrationLicensed Professional Engineer, Ontario, 1990
Licensed Professional Geologist, North Carolina, 1996
Affi liationsAssociate of the Department of Chemical Engineering,
University of Toronto
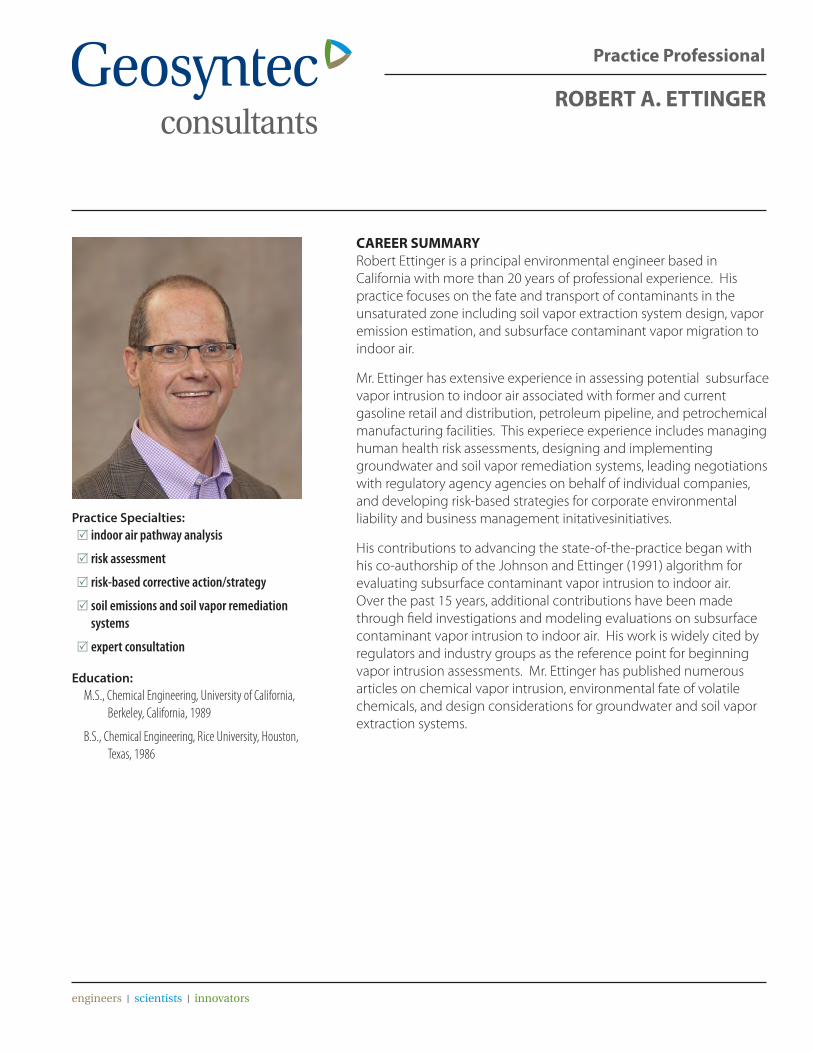
Practice Professional
ROBERT A. ETTINGER
CAREER SUMMARYRobert Ettinger is a principal environmental engineer based in California with more than 20 years of professional experience. His practice focuses on the fate and transport of contaminants in the unsaturated zone including soil vapor extraction system design, vapor emission estimation, and subsurface contaminant vapor migration to indoor air.
Mr. Ettinger has extensive experience in assessing potential subsurface vapor intrusion to indoor air associated with former and current gasoline retail and distribution, petroleum pipeline, and petrochemical manufacturing facilities. This experiece experience includes managing human health risk assessments, designing and implementing groundwater and soil vapor remediation systems, leading negotiations with regulatory agency agencies on behalf of individual companies, and developing risk-based strategies for corporate environmental liability and business management initativesinitiatives.
His contributions to advancing the state-of-the-practice began with his co-authorship of the Johnson and Ettinger (1991) algorithm for evaluating subsurface contaminant vapor intrusion to indoor air. Over the past 15 years, additional contributions have been made through field investigations and modeling evaluations on subsurface contaminant vapor intrusion to indoor air. His work is widely cited by regulators and industry groups as the reference point for beginning vapor intrusion assessments. Mr. Ettinger has published numerous articles on chemical vapor intrusion, environmental fate of volatile chemicals, and design considerations for groundwater and soil vapor extraction systems.
Practice Specialties: 5 indoor air pathway analysis
5 risk assessment
5 risk-based corrective action/strategy
5 soil emissions and soil vapor remediation systems
5 expert consultation
Education:M.S., Chemical Engineering, University of California,
Berkeley, California, 1989
B.S., Chemical Engineering, Rice University, Houston, Texas, 1986
Practice Professional
KAREN L. BERRY-SPARK, M.Sc.
CAREER SUMMARYKaren Berry-Spark is a senior hydrogeologist based in Guelph, Ontario, with more than 20 years of professional experience. Her practice focuses on the characterization and remediation of sites impacted by chlorinated solvents and other dense non-aqueous phase liquids (DNAPLs) in soil and groundwater. Ms. Berry-Spark has developed site-specifi c remedies using in situ bioremediation, zero-valent iron, and related technologies at sites throughout North America.
Ms. Berry-Spark’s practice also focuses on the assessment and mitigation of subsurface vapor intrusion to indoor air. In this area, she applies her knowledge and experience in not only contaminant fate and transport, but also human health risk assessment. Her experience includes management of groundwater remediation projects using emerging remediation technologies. For example, she managed the design and installation of the fi rst zero-valent iron permeable reactive barrier (ZVI PRB) at a Superfund Site in New Hampshire under U.S. EPA’s risk-sharing program. While managing this project, she also obtained EPA approval to use passive diff usion bag (PDB) samplers for PRB performance monitoring. Her demonstration of the PDB technology at this site has been cited by U.S. EPA as exemplary, and the case study is contained in the Interstate Technology and Regulatory Council (ITRC) guidance document for PDBs. Her experience with the U.S. EPA risk-sharing program includes the design of an in situ chemical oxidation system for the treatment of TCE in fractured bedrock at the Dublin Superfund Site. Ms. Berry-Spark has also conducted numerous risk assessments, many of which have been to support the risk management, remediation, and redevelopment of Brownfi elds properties. Among her recent projects are the design of vapor barriers for new homes and the remediation of a former industrial site in Michigan that is being converted to residential use under the Michigan Department of Environmental Quality Land Redevelopment Brownfi elds site program.
Ms. Berry-Spark continues to advance the state-of-the practice by participating as an invited speaker at a number of conferences to discuss vapor intrusion assessment and mitigation strategies. She was an instructor at the vapor intrusion short course off ered as part of Battelle’s Remediation of Chlorinated and Recalcitrant Compounds in Monterey in May 2006, and peer reviewed a number of guidance documents on vapor intrusion, including the recently released Michigan guidance.
Practice Specialties:soil and groundwater assessment and remediation
brownfi elds site redevelopment
vapor intrusion assessment and mitigation
risk assessment
risk-based corrective action
environmental management
Education:M.Sc., Earth Sciences – contaminant hydrogeology,
University of Waterloo, Waterloo, Ontario, 1987B.Sc., Earth Sciences (honours – co-operative program),
University of Waterloo, Waterloo, Ontario, 1984

Practice Professional
TODD N. CREAMER, P.G.
Specialties:
groundwater investigation and remediation
development of conceptual site models subsurface vapor transport
soil gas sampling design and methodology
LNAPL characterization and mobility modeling
Education:
M.S., Geology, North Carolina State University, Raleigh, North Carolina, 1998
B.A., Geology & Native American Studies, University of Rochester, Rochester, New York, 1993
Professional Registration:
Licensed Professional Geologist, California, 2007 Licensed Professional Geologist, Wyoming, 2004
CAREER SUMMARY Todd Creamer is a Senior Geologist based in Acton, Massachusetts with 15 years’ experience in environmental consulting services, surface water hydrology, and oil and natural gas exploration and production. Mr. Creamer’s work has focused on the characterization of and remedial strategy for industrial and residential properties impacted by petroleum hydrocarbons and chlorinated solvents. Specializing in vapor intrusion of volatile compounds into indoor air and LNAPL behavior in porous media, his technical experience includes soil gas sampling field methods development, construction of conceptual site models for large, complex sites, LNAPL mobility modeling and site characterization using hydro-geologic and advanced geophysical methods.
Currently, Mr. Creamer manages Geosyntec’s Remediation Practice in Boston as well as the remedy implementation at a large, complex urban site in Massachusetts with more than 10 acres of PCE-impacted groundwater. Key technical issues include mitigation of subsurface vapor intrusion to offsite residences, and implementation of bioremediation under a major traffic artery.
Mr. Creamer’s work has also included oversight, strategy formulation and participation in public outreach on several litigious projects involving former industrial facilities with subsurface LNAPL and groundwater impacts extending into residential areas. He has conducted extensive field investigations at these sites under public scrutiny. Recently, Mr. Creamer has managed two vapor intrusion research projects under the technical leadership of Professor Paul Johnson of Arizona State University. These projects are contributing significantly to the national discussion on subsurface contaminant vapor behaviors in proximity to occupied structures.
Practice Professional
DAVID M. BERTRAND, B.Sc., P.Geo.
CAREER SUMMARYMr. Bertrand is a hydrogeologist with 12 years of experience in the oversight and management of large vapor intrusion investigations; community relations; and the installation, operation, maintenance and monitoring of sub-slab depressurization systems at residential, commercial, and industrial properties.
Mr. Bertrand was one of the primary developers of Geosyntec’s soil gas sampling procedures, specifically designed to provide the quality of data required for human health risk assessment and to withstand criticism in litigation (published in the EPRI Reference Handbook for Site-Specific Assessment of Subsurface Vapor Intrusion, 2005). Recently, Mr. Bertrand was a guest speaker at the Air and Waste Management Association Vapor Intrusion Conferences in Toronto (September 2008) and Ottawa (October 2008) and at Maxxam’s Vapor Intrusion Conference (June 2008). In addition, Mr. Bertrand demonstrated Geosyntec’s soil gas sampling techniques to state and EPA regulators, consultants and vendors, and made a platform presentation at the Midwestern States Risk Assessment Symposium in Indianapolis, Indiana (August 2006).
Mr. Bertrand continues to develop and refine Geosyntec’s soil gas sampling protocols and equipment, and manages the program of cross-training Geosyntec staff across all of the firm’s offices to foster a uniformly high standard of data quality for vapor intrusion investigations.
Mr. Bertrand also has specific experience in the management and oversight of soil and groundwater remediation projects including: multi-phase extraction and enhanced bioremediation of Dense Non-Aqueous Phase Liquids (DNAPLs), alternative approaches for in-situ bioremediation of perchlorate, and phytoremediation and excavation of soils containing chlorinated solvents and mercury. Mr. Bertrand was honored with the National Aeronautics and Space Administration (NASA)’s Group Achievement Award in 2003 for his part in the successful evaluation of Dehalogenation of Dense Non-Aqueous Phase Liquids (DNAPLs) Using Emulsified Zero-Valent Iron at Launch Complex 34 in Cape Canaveral, Florida. Mr. Bertrand was also one of Geosyntec’s Health and Safety (H&S) Coordinators from 2001 to 2005, was involved in providing the H&S training for other staff, and provided technical assistance in the development of corporate H&S procedures.
Specialties:groundwater investigation and remediation 5
subsurface vapor intrusion investigation and 5
mitigation
Education:B.Sc., Earth Sciences Hydrogeology, University of
Waterloo, 2000
Professional Registration:Association of Professional Geoscientists of Ontario, No.
1559
Specialties:
vapor intrusion site investigation and remediation including:
subsurface vapor transport
soil gas sampling design and methodology
structure sampling design and methodology
vapor intrusion mitigation structure mitigation
post-mitigation monitoring and analysis
Education:
Pennsylvania State University: B.S., Geochemistry (with Honors)
Pennsylvania State University: Ph.D. Geology
WILLIAM E. WERTZ Ph.D.
Practice Professional
CAREER SUMMARYWilliam Wertz is a Senior Advisor based in Albany, New York with 28 years’ experience in investigation and remediation of contaminated groundwater, soil and vapor intrusion sites. He served as an Engineering Geologist with the New York State Department of Environmental Conservation (NYSDEC) from 1982-2010.
From the early 2000’s through the present, Bill’s primary focus has been on the evaluation of the vapor intrusion pathway. He has served as the NYSDEC’s technical advisor and project manager on a variety of high profile sites throughout New York State, including many sites where tens to hundreds of structures required mitigation to address vapor intrusion.
Bill served as the NYSDEC’s technical lead on the development of the State’s “Guidance for Evaluating Soil Vapor Intrusion in the State of New York, and on the development of several other policy documents related to vapor intrusion. He helped develop and lead New York State’s vapor intrusion training seminars for State and EPA Region 2 staff, consultants and industry representatives.
Bill developed the technical criteria that were used to prioritize the reevaluation of the vapor intrusion pathway at the state’s 400 plus “legacy sites” and headed the team conducting those site evaluations.
Bill’s research has been used to develop NYSDEC policies on how to conduct vapor intrusion evaluations (number of samples, time of year to sample, which locations within and beneath a home to sample, use of tracers….), how to evaluate the efficacy of mitigation systems, how long to monitor structures where a potential for vapor intrusion exists, and when to consider “blanket mitigation” of adjacent structures in a neighborhood.
Practice Professional
HESTER GROENEVELT, M.Sc.
CAREER SUMMARYHester Groenevelt is an environmental chemist with over 17 years experience in the chemical analysis of chlorinated solvents, and data management and data quality assessment. After graduation, she worked for seven years at the University of Waterloo developing analytical techniques and experimental field and laboratory designs for the study of fate and transport of chlorinated solvents as dense non-aqueous phase liquids (DNAPLs) and as dissolved constituents of groundwater. Her work resulted in the publication of several articles on the sorption of chlorinated solvents on sandy and clayey materials in peer-reviewed journals.
Ms. Groenevelt joined Geosyntec in 2000, and has since then significantly advanced her experience in data validation of analysis of samples of groundwater, soil and vapor for compounds of environmental concern. This is an area of interest for many environmental investigations, including vapor intrusion, because significant decisions are made on the mistaken assumption that the results of environmental sampling and analysis are always valid. Additionally, if there is the possibility of litigation, data validation is a necessary precaution to ensure that data will stand up in court.
Ms. Groenevelt has been involved in the assessment of vapor intrusion at many sites in the US, the UK and Canada, including some of the largest, longest-standing vapor intrusion assessments in the world, as well as at smaller, less complicated sites. This breadth has generated her solid base of experience in regulatory understanding, interaction with homeowners and other stakeholders in vapor intrusion, risk assessment, and project management. She has also been involved in writing funding proposals for research for vapor intrusion from groundwater into indoor air.
Specialties:environmental chemistry 5
analytical chemistry 5
data validation 5
subsurface vapor transport 5
Education:M.Sc., Biochemistry, University of Waterloo, 1992
B.E.S, Environmental Studies and Chemistry, University of Waterloo, 1988

Practice Professional
PAUL NICHOLSON, P.Eng.
CAREER SUMMARYMr. Nicholson is an environmental engineer with eight years of experience in environmental consulting with a focus on assessing and mitigating human health risks associated with sub-surface vapor intrusion (the migration of volatile organic compounds into overlying buildings). He has specific experience in the oversight and management of soil vapor sampling assessments at petroleum hydrocarbon and chlorinated solvent sites. This includes the co-ordination and planning of several large scale soil gas sampling programs and managing field crews of up to a dozen individuals.
Mr. Nicholson was integrally involved in the development of Geosyntec’s soil gas sampling procedures, which were published in the EPRI Reference Handbook (2005). Unique features of these protocols include pneumatic testing, helium tracer testing, real-time monitoring via portable instruments and rigorous procedures for sampling of soil gas from low permeability soils. He continues to develop and refine Geosyntec’s soil gas sampling protocols and equipment, as well as provide training to other staff in soil gas sampling methods. Mr. Nicholson is currently one of Geosyntec’s Health and Safety Coordinators (2005 to present) and is involved in providing training to other staff, as well as providing technical assistance in the development of corporate health and safety procedures.
Specialties:sub-surface vapor intrusion investigation and 5
mitigation
field oversight and project management 5
environmental health and safety 5
Education:B.A.Sc., Environmental Engineering, Chemical
Specialization, University of Waterloo, Ontario, 2004
Professional Registration:Licensed Professional Engineer, Ontario, No. 100127451

About Us Geosyntec Consultants is a specialized consulting and engineering firm that works with private and public sector clients to address their new ventures and complex problems involving the environment, natural resources, and the civil infrastructure. Geosyntec has engineers, geologists, environmental scientists, and other technical and project staff based in offices throughout the United States and at select locations in Australia, Canada, Ireland, Malaysia, and the United Kingdom.
Our private sector clients come from a variety of industries including oil and gas, chemical, aerospace, pharmaceutical, diversified manufacturing, advanced technology, power and utility and environmental management. Our private sector clients also include regional and national developers, large commercial property owners, and law firms. Our public sector clients are departments and agencies of municipal, state/provincial, regional, and national governments.
Since our founding in 1983, our business has grown around projects involving environmental contamination studies and remediation, natural resources assessment and restoration, and engineering and design for environmental, water resources, and geotechnical infrastructures. We also provide construction management and quality assurance services in support of these practices. We are known nationally for our technology leadership, broad experience, and exceptional client service. Our professionals continue to develop new technology applications and capabilities. Our applied research partnerships with leading universities, NASA, U.S. EPA, FHWA, USGS, and others are producing better methods for the in situ remediation of recalcitrant chemicals in the environment; management of urban watersheds to reduce pollutant loadings; protection of endangered species from the impacts of stormwater runoff; design and construction of industrial and municipal waste disposal facilities; and geotechnical analysis and design of transportation facilities. Our goal is to provide the best possible service and value to our clients, to advance technology in our primary practice areas, and to provide a stimulating, progressive, and friendly work environment that will enable us to continue to recruit and retain great staff.

At Geosyntec, our vision of success builds on our internal culture of technical excellence, the outstanding qualities of our staff and their common commitment to our core values, and our long-held belief that exceptional client service coupled with exceptional project solutions will result in long-term, mutually rewarding business relationships. Our university liaisons, internally- and externally-funded applied research, and first-to-field deployment of emerging technologies provide us with a differentiated set of tools to use in creating innovative, high-value solutions to challenges involving the environment, our natural resources, and our civil infrastructure.
At Geosyntec, we believe technology leadership and client service are the foundations for producing solutions of exceptional value.
We have built a work environment that enables our engineers and scientists to focus their energies and creativity on applying these tools to our clients’ most exciting ventures and complex problems. We have been and remain a forward-looking company — one that is working diligently to develop solutions for some of society’s emerging challenges and issues. Today, Geosyntec staff are developing practical approaches related to sustainable, low impact development, operating protocols to lower greenhouse gas emissions coupled with credit trading plans to create financial opportunities, and environmental management initiatives that help clients reduce their energy consumption, use of hazardous chemicals, and stormwater impact to receiving water. We appreciate that you have taken a few moments to review our credentials. The best way to learn more about our company is through a one-on-one conversation with a Geosyntec professional. We invite you to learn more about our practice specialties and capabilities by contacting any one of our senior personnel.

Practices We apply our expertise to projects involving environmental studies and remediation, natural resources assessment and restoration, and management of the environmental, water resources, and geotechnical infrastructure.
Environmental Studies and Cleanup Site Investigation and Remediation
Groundwater Assessment and Remediation
Sediment Assessment and Remediation
Specialized In Situ Treatment Technologies
Risk Assessment and Applied Toxicology
Subsurface Vapor Intrusion to Indoor Air
Environmental Management Assessment and Systems
Infrastructure Assessment, Engineering, and Design
Industrial Water Supply/Wastewater Treatment Planning and Design
Waste Containment Facility Planning and Design
Brownfields Redevelopment Planning and Design
Geohazard/Earthquake Characterization and Mitigation
Geotechnical Infrastructue/Foundation Engineering
Natural Resources Assessment and Restoration Watershed and Stormwater Management
Water and Natural Resources Conservation and Management
Surface Water/Groundwater Supply Studies and Development
Erosion and Sediment Control
Construction Management and Quality Assurance in Support of Practices As an employee-owned and managed firm of more than 750 engineers, scientists, and project support staff, we are large enough to perform the most complex and technically challenging projects in-house, while still delivering customized, personal service, and consistently excellent results.
People
Engineering Agricultural Geoenvironmental Chemical Hydraulic Civil Mechanical Environmental Structural Geotechnical Water Resources
Earth Sciences Geology Geochemistry Geomorphology Geophysics Hydrogeology Geography Hydrology GIS
Environmental and Biological Sciences Aquatic Biology Microbiology Biochemistry Public Health Biology Soil Science Chemistry Toxicology Environmental Science Wetlands Science Fisheries Science Zoology Marine Biology
Construction Management and Operations CADD Health and Safety Construction Mgmt. Industrial Hygiene Construction QC/QA Project Controls GPS Surveying Regulatory Affairs
Geosyntec attracts some of the brightest, most creative scientists and engineers in the consulting and engineering business. We seek out entry level and mid-career professionals who have exceptional technical and problem-solving skills and also the personality to be great team players who care about their clients. People stay with Geosyntec because of our interesting clients, projects, and technology development initiatives. We have created a supportive work environment that offers significant opportunities for both personal career growth and individual award and recognition through participation in the company’s employee ownership program. More than 80% of our technical staff have advanced degrees in engineering, scientific, and business management disciplines. With more than 20 in-house technical disciplines, we have the depth and breadth of resources to apply our expertise and experience to every project.
Locations in the United States Metropolitan Area/Telephone
Alaska Illinois Oregon Anchorage/ 907.433.0770 Chicago / 312.658.0500 Portland / 503.222.9518
Arizona Oak Brook / 630.203.3340 Pennsylvania
Phoenix/ 602.513.5812 Louisiana Philadelphia / 610.940.1703
California Baton Rouge / 225.929.7333 South Huntington Beach / 714.969.0800 Maine Greenville / 864.438.4900 Los Angeles / 310.957.6100 Augusta / 207.622.2540 Tennessee Oakland / 510.836.3034 Maryland Knoxville / 865.330.0037Pasadena / 626.449.0664 Columbia / 410.381.4333 Texas Riverside / 951.682.8576 Massachusetts Austin / 512.451.4003
Sacramento / 916.637.8048 Boston / 978.263.9588 Houston / 281.920.4601 San Diego / 858.674.6559 Brookline / 617.734.4436 Virginia San Diego Old Town / 619.297.1530 Michigan Richmond / 804.332.6376
Santa Barbara / 805.899.3800 Ann Arbor / 734.426.0100 Washington Florida Grand Rapids / 616.277.1355 Seattle / 206.496.1450
Boca Raton / 561.995.0900 Minnesota West Virginia Cape Canaveral / 321.269.5880 Minneapolis / 612.605.8260 Huntington / 304.522.0470
Clearwater / 813.792.4820 Missouri Wisconsin
DeLand / 386.490.4353 Columbia / 573.443.4100 Milwaukee / 262.377.9828
Jacksonville / 904.858.1818 St. Louis / 636.681.1374 Orlando / 407.321.7030 New Jersey
Pensacola / 850.477.6547 Princeton / 609.895.1400 Tampa / 813.558.0990 North Carolina*
Vero Beach / 772.564.8717 Charlotte / 704.227.0840 Georgia Raleigh / 919.870.0576
Atlanta / 678.202.9500 Ohio Atlanta (Corporate) / 404.267.1101 Columbus / 614.433.9280 Macon / 478.328.6181
* Please note that, in accordance with North Carolina laws and regulations, professional engineering and geology services on assignments in North
Carolina are provided through Geosyntec Consultants of NC, Inc. offices in Charlotte, Raleigh, and Atlanta.
International Locations Australia - Perth United Kingdom - Aberdeen United Kingdom - Teesside
+61 (0) 8 9278 2514 +44 (0) 1224 217 354 +44 (0) 1642 438182
Canada - Kingston United Kingdom - Northern Ireland 613.542.0228 +44 (0) 28 256 32916
Canada - Toronto United Kingdom - Bristol 519.822.2230 +44 (0) 117 960 2212
Malaysia - Ipoh United Kingdom - Manchester +605 323 5301 +44 (0) 1925 230655
Malaysia - Kuala Lumpur United Kingdom - Leeds +603 7665 3081 +44 (0) 113 388 4868

Geosyntec Consultants is a consulting firm with engineers, geologists, environmental scientists, and other technical and project staff based in offices throughout the United States and at select locations in Australia, Canada, Ireland, Malaysia, and the United Kingdom. We address new ventures and complex problems involving our environment, natural resources, and civil infrastructure.
Offices in Principal Cities of the United States and Select International Locationsgeosyntec.com
CONTACT INFORMATION
Todd McAlary130 Research Lane, Suite 2Guelph, Ontario N1G 1G3Phone: (9519) 822-2230
Todd Creamer289 Great Road, Suite 105
Acton, Massachusetts 01720Phone: (978) 263-9588
Robbie Ettinger924 Anacapa Street, Suite 4A
Santa Barbara, California 93101Phone: (805) 897-3800