Flood hazard assessment of Atrato River in Colombia
19
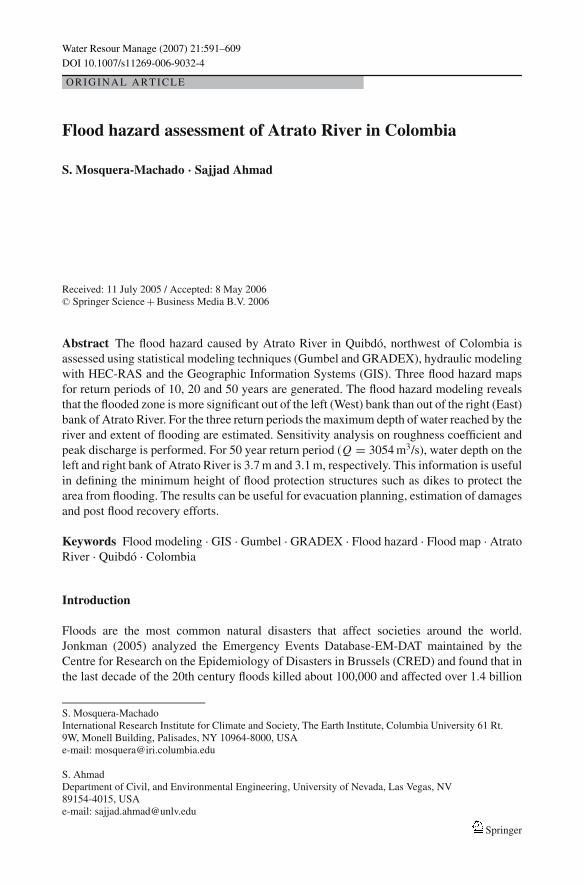
Water Resour Manage (2007) 21:591–609 DOI 10.1007/s11269-006-9032-4 ORIGINAL ARTICLE Flood hazard assessment of Atrato River in Colombia S. Mosquera-Machado · Sajjad Ahmad Received: 11 July 2005 / Accepted: 8 May 2006 C Springer Science + Business Media B.V. 2006 Abstract The flood hazard caused by Atrato River in Quibd´ o, northwest of Colombia is assessed using statistical modeling techniques (Gumbel and GRADEX), hydraulic modeling with HEC-RAS and the Geographic Information Systems (GIS). Three flood hazard maps for return periods of 10, 20 and 50 years are generated. The flood hazard modeling reveals that the flooded zone is more significant out of the left (West) bank than out of the right (East) bank of Atrato River. For the three return periods the maximum depth of water reached by the river and extent of flooding are estimated. Sensitivity analysis on roughness coefficient and peak discharge is performed. For 50 year return period ( Q = 3054 m 3 /s), water depth on the left and right bank of Atrato River is 3.7 m and 3.1 m, respectively. This information is useful in defining the minimum height of flood protection structures such as dikes to protect the area from flooding. The results can be useful for evacuation planning, estimation of damages and post flood recovery efforts. Keywords Flood modeling . GIS . Gumbel . GRADEX . Flood hazard . Flood map . Atrato River . Quibd´ o . Colombia Introduction Floods are the most common natural disasters that affect societies around the world. Jonkman (2005) analyzed the Emergency Events Database-EM-DAT maintained by the Centre for Research on the Epidemiology of Disasters in Brussels (CRED) and found that in the last decade of the 20th century floods killed about 100,000 and affected over 1.4 billion S. Mosquera-Machado International Research Institute for Climate and Society, The Earth Institute, Columbia University 61 Rt. 9W, Monell Building, Palisades, NY 10964-8000, USA e-mail: [email protected] S. Ahmad Department of Civil, and Environmental Engineering, University of Nevada, Las Vegas, NV 89154-4015, USA e-mail: [email protected] Springer
Transcript of Flood hazard assessment of Atrato River in Colombia
Water Resour Manage (2007) 21:591–609
DOI 10.1007/s11269-006-9032-4
OR IGINAL ART ICLE
Flood hazard assessment of Atrato River in Colombia
S. Mosquera-Machado · Sajjad Ahmad
Received: 11 July 2005 / Accepted: 8 May 2006C© Springer Science + Business Media B.V. 2006
Abstract The flood hazard caused by Atrato River in Quibdo, northwest of Colombia is
assessed using statistical modeling techniques (Gumbel and GRADEX), hydraulic modeling
with HEC-RAS and the Geographic Information Systems (GIS). Three flood hazard maps
for return periods of 10, 20 and 50 years are generated. The flood hazard modeling reveals
that the flooded zone is more significant out of the left (West) bank than out of the right (East)
bank of Atrato River. For the three return periods the maximum depth of water reached by the
river and extent of flooding are estimated. Sensitivity analysis on roughness coefficient and
peak discharge is performed. For 50 year return period (Q = 3054 m3/s), water depth on the
left and right bank of Atrato River is 3.7 m and 3.1 m, respectively. This information is useful
in defining the minimum height of flood protection structures such as dikes to protect the
area from flooding. The results can be useful for evacuation planning, estimation of damages
and post flood recovery efforts.
Keywords Flood modeling . GIS . Gumbel . GRADEX . Flood hazard . Flood map . Atrato
River . Quibdo . Colombia
Introduction
Floods are the most common natural disasters that affect societies around the world.
Jonkman (2005) analyzed the Emergency Events Database-EM-DAT maintained by the
Centre for Research on the Epidemiology of Disasters in Brussels (CRED) and found that in
the last decade of the 20th century floods killed about 100,000 and affected over 1.4 billion
S. Mosquera-MachadoInternational Research Institute for Climate and Society, The Earth Institute, Columbia University 61 Rt.9W, Monell Building, Palisades, NY 10964-8000, USAe-mail: [email protected]
S. AhmadDepartment of Civil, and Environmental Engineering, University of Nevada, Las Vegas, NV89154-4015, USAe-mail: [email protected]
Springer
592 Water Resour Manage (2007) 21:591–609
people. Dilley et al. (2005) estimated that more than one-third of the world’s land area is
flood prone affecting some 82 percent of the world’s population. UNDP (2004) observed
that about 196 million people in more than 90 countries are exposed to catastrophic flooding,
and that some 170,000 deaths were associated with floods worldwide between 1980 and
2000. Those figures show that flooding is a major concern in many regions of the world.
In Europe and especially in Mediterranean Region floods are the major natural hazards.
During the past two decades, several extreme floods have occurred in central European
rivers including the Rhine, Danube, Odra, and Wisla. One such disastrous flood occurred in
the Elbe River basin and parts of the Danube basin in August 2002 (Becker and Grunewald,
2003). Rough cost estimates for the Elbe 2002 flood alone are approximately $3 billion in
the Czech Republic and more than $9 billion in Germany. In USA, for example, in a period
of 6 years (1989–1994) 80% of declared federal disasters were related to flooding; floods
themselves average four billion dollars annually in property damages alone (Wardswoth,
1999). Losses from flood hazards in the United States are not only very large, on average,
$115 million per week, but they have also been increasing dramatically (Congressional
Natural Hazards Caucus Work Group, 2001). Flood damages in Canada are also on the rise
(Ahmad and Simonovic, 2001, 2006; Simonovic and Ahmad, 2005).
In South America, concern over flooding has grown rapidly in recent years and has resulted
in significant efforts to produce new information and studies of flooding patterns at national
as well as transnational levels. Accumulated losses including investment, operation, and
maintenance due to South American floods in the period 1995 to 2004 were of US$25 billion,
(NIBH/SHS/EESC/USP, 2004). Wolfgang and Karin (1993) in a general review of tropical
South American floodplains estimated the areal extent of different types of floodplains in this
region. Hamilton et al. (2002) synthesized results of various works on the regional inundation
patterns among the major floodplains of South America. They also analyzed the spatial as well
as temporal variability in inundation patterns in the two largest South American flood plains
(Hamilton et al., 2004). Despite the progress in flood modeling research for flood hazard
assessment, flooding continues to cause havoc in many areas of South America, Colombia
is no exception. The occurrence of climate-related hazards has always been a serious threat
for Colombian population. A recent and very severe flood, caused by a continuous and
sustained above normal season of precipitation in the eastern, northern and western regions
of Colombia, occurred in October and November of 2004, resulting in an emergency being
declared in approximately one third of the country.
Colombia is divided into 32 States called departments and one Capital District. The Choco
department situated in the north-west corner of Colombia, is exposed to numerous natural haz-
ards such as earthquakes, coastal erosion, landslides, storms, floods, and avalanches. Floods
constitute the most prevalent natural disaster in Choco department (Mosquera-Machado,
2002). Of the 287 natural disasters registered in the department between 1970 and 2000,
more than three-fourth (76%) were caused by floods. The damages resulting from floods
have the largest economic, social, and environmental consequences across the department
and especially in Quibdo, the capital of the state.
In Colombia, like many other developing countries, field data defining the extent, timing,
and depth of flooding are generally limited and are rarely available for large flood events.
This makes flood modeling a challenging task. Since the blueprint paper by Freeze and
Harlan (1969), flood modeling has been developing rapidly and as a consequence flood
hazard assessment has considerably improved in recent years, especially due to the use
of geographic information systems (GIS). Recent work in the area of flood modeling has
focused on developing more efficient tools for GIS analysis. Robayo et al. (2004) developed
a new Map-to-Map tool that concocts the Next Generation Radar-NEXRAD precipitation
Springer
Water Resour Manage (2007) 21:591–609 593
time series with GIS applications and hydrological modeling to produce a floodplain map.
Remote sensing has also been acknowledged as a very useful tool in mapping flood extent
(Horritt et al., 2001) and hence for validating numerical inundation models. Despite the
availability of sophisticated tools and techniques through GIS and remote sensing, still much
remains to be understood about the relationship between runoff and flood extent and depth.
Several studies have been carried out in regional universities and institutions in Colombia
on flood modeling (i.e. Cardona and Londono, 1991; Franco and Perez, 1995; Acosta and
Ruiz, 1997). An assessment study of inundation of Magdalena basin was carried out by
National Institute of Hydrology, Meteorology and Environmental Studies-IDEAM in 1997.
Most of these studies, however, are limited to the calculation of maximum discharges as-
sociated to different return periods and to the extent of the area flooded in regions other
than Choco department. No flood studies have been carried out in Choco department so
far. An important prerequisite for developing management strategies for the mitigation of
extreme flood events is to identify areas of potentially high risk to such events, thus accurate
information on the extent of floods is essential for flood monitoring, and relief (Smith, 1997).
This study aims at assessing the flood risk caused by Atrato River in Quibdo, the capital
of Choco department, located in north west of Colombia. We present an approach combining
statistical techniques, hydraulic modeling and GIS to assess the risk of flooding in Atrato
River in Quibdo. We estimate the depth and extent of flooding in Quibdo for floods of 10, 20
and 50 years of return periods.
The remainder of this paper is organized as follows. First the study area is described. That
is followed by details on the method used to model flood hazard. Details on data sets used in
this research are provided, statistical modeling techniques used to estimate flood discharge are
described, and details on hydraulic modeling are provided. A rigorous sensitivity analysis
of roughness coefficient and peak discharge is reported. This is followed by results and
discussion of findings. The paper concludes with comments on potential applications of
research findings.
Study area
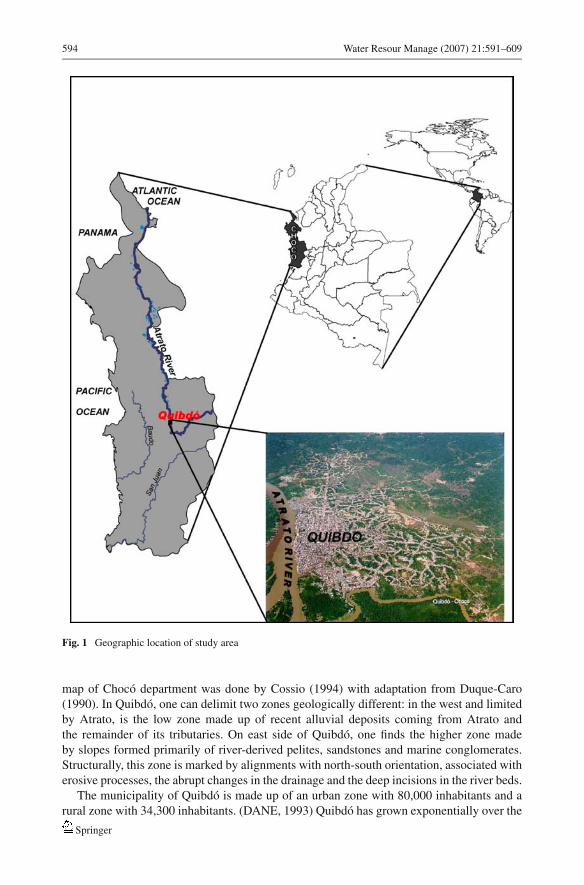
The focus of this study is the Atrato River in Quibdo. The Atrato River is 750 km long and
is the fastest flowing river in the world, discharging 4,900 m3/s of water into the Caribbean
(Government of Colombia, 1993).
Quibdo is situated at 5◦41′13′′ Latitude North and 76◦39′40′′ Longitude West with an
area of 3,337 km2 (Figure 1). The altitude of study area ranges from 23 to 75 m above mean
sea level. It lies in the multi-hazard prone (earthquake, landslide, coastal erosion and floods)
and economically backward Choco department on the pacific region of Colombia. Choco
department is composed of 31 municipalities, and Quibdo is the capital. Quibdo is a city
seriously affected by natural hazards, especially extreme weather and climate events, among
which flood disaster causes the most serious damages and losses (Mosquera-Machado, 2002).
Quibdo not only has the highest incidences of disaster but also the variety of associated
hazards, including floods, earthquakes, landslides, strong winds, and storms (in descending
order, respectively). Quibdo ranks first by diversity and recurrence of disasters during the
past three decades, with 85 disasters of five different types (Mosquera-Machado, 2006). The
estimated direct economic losses of disasters reached US$1.6 billion (adjusted price) for
1970–2000.
Tectonics and geological data of northwestern region of Colombia are more abundant
than those of Quibdo (i.e. Nygren, 1950; Case et al., 1971; Macia, 1985). The geological
Springer
594 Water Resour Manage (2007) 21:591–609
Fig. 1 Geographic location of study area
map of Choco department was done by Cossio (1994) with adaptation from Duque-Caro
(1990). In Quibdo, one can delimit two zones geologically different: in the west and limited
by Atrato, is the low zone made up of recent alluvial deposits coming from Atrato and
the remainder of its tributaries. On east side of Quibdo, one finds the higher zone made
by slopes formed primarily of river-derived pelites, sandstones and marine conglomerates.
Structurally, this zone is marked by alignments with north-south orientation, associated with
erosive processes, the abrupt changes in the drainage and the deep incisions in the river beds.
The municipality of Quibdo is made up of an urban zone with 80,000 inhabitants and a
rural zone with 34,300 inhabitants. (DANE, 1993) Quibdo has grown exponentially over the
Springer
Water Resour Manage (2007) 21:591–609 595
last decades. The urban development is characterized by the lack of planning at the point that
there are houses built directly in the riverbed.
The highest annual rainfall in the Americas, and among the highest in the world, is observed
in the Choco department, on the Pacific coastal plain west of the Andes (Eslava, 1992, 1994;
Horel and Cornejo-Garrido, 1986; Figueroa and Nobre, 1990; Mesa et al., 1997; Poveda
and Mesa, 2000). In Quibdo precipitation is very intense with an annual average value of
8700 mm. Maximum daily rainfall in Quibdo, extracted from IDEAM data for Atrato sub-
basin ranges between 35 mm in January and 301 mm in July. The average temperature is
27◦C and the average relative humidity is 98%.
The hydrographic network of Quibdo is formed by Atrato River and its tributaries Cabi,
La Yesca, Guayabal, Quito, La Platina, and Tutunendo. The section of the Atrato River
floodplain chosen for investigation lies adjacent to the urban part of Quibdo. The Atrato
River in this reach is a 250–500 meter-wide meandering alluvial channel which occupies
a 2–3.5 km-wide valley. The upper Atrato River catchment has a maximum elevation of
3,300 m at the El Carmen watershed in the northeast.
Method
For this work we developed a method based on the use of statistical techniques of Gumbel
and GRADEX, hydraulic modeling (using HEC-RAS), and the Geographic Information
Systems (GIS). The proposed method to evaluate the flood risk in a river flood plain involves
several steps: (1) Rainfall data, stream flow data, topographic data as well as geological and
land used data were collected, stored and preprocessed in Excel and Dbase. (2) The data
digitalization was carried out in IDRISI, Arc/Info, and Arc/View. (3) Flood frequency anal-
ysis was done by selecting maximum daily precipitation in Quibdo and monthly and annual
maximum gauge levels at Atrato gauge site. Two methods of statistical distribution i.e.,
Gumbel’s extreme value distribution and GRADEX are employed by selecting peak gauge
level data for 24 years (1970–1994) at Quibdo. (4) The hydraulic simulation of Atrato River’s
floods to predict water level in the river and floodplains is done with HEC-RAS. (5) The
hydraulic simulation is validated through the calibration of manning roughness coefficient
using the observed water levels during the great flood of Choco department on October 17th,
1994. (6) Sensitivity analysis is carried out on roughness coefficient and peak discharge. (7)
The HEC-RAS results are processed using GIS tools (IDRISI and Arc-Info) to produce the
flood hazard maps of Atrato River in Quibdo. The flow chart of the method is presented in
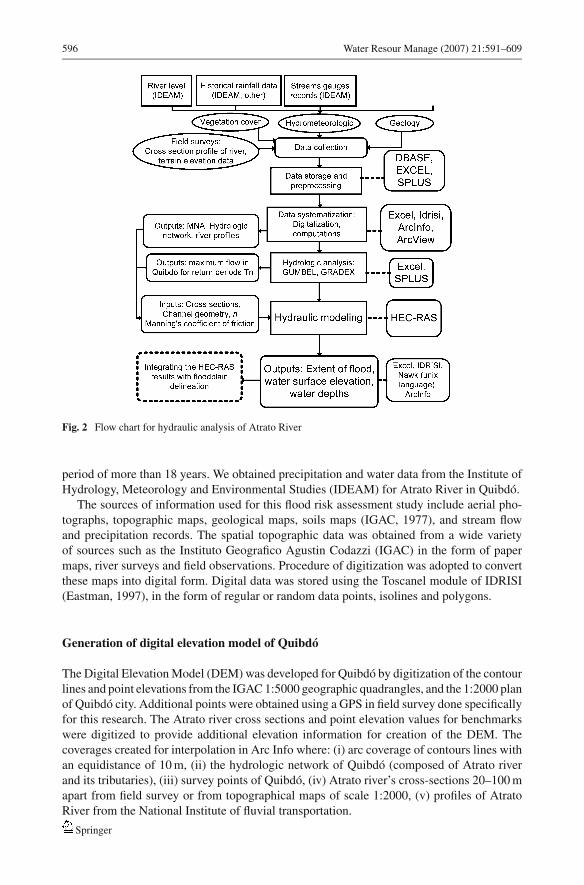
Figure 2.
Data collection and preprocessing
Rivers situated deep inside tropical rain forests are often poorly gauged, and data on extreme
flows are rare. Even when stations are gauged, it is quite common that >40% of the record
is missing; the rivers of the northwestern of Colombia are no exception. There are twenty
three hydro-meteorological stations in Choco Department, 11 are in the Atrato River and the
remaining 12 are located on the tributaries. The hydrological stations measure water level,
from which the river discharges are computed. The meteorological stations measure precipi-
tations and in some case the extreme temperatures. Within a radius of twelve kilometers from
the center of the watershed there is a network of five rain gauges reporting hourly rain accu-
mulations, two of which are closer to the watershed, providing representative estimates of the
basin-averaged hourly rainfall rates. The two stations used in his study have an observational
Springer
596 Water Resour Manage (2007) 21:591–609
Fig. 2 Flow chart for hydraulic analysis of Atrato River
period of more than 18 years. We obtained precipitation and water data from the Institute of
Hydrology, Meteorology and Environmental Studies (IDEAM) for Atrato River in Quibdo.
The sources of information used for this flood risk assessment study include aerial pho-
tographs, topographic maps, geological maps, soils maps (IGAC, 1977), and stream flow
and precipitation records. The spatial topographic data was obtained from a wide variety
of sources such as the Instituto Geografico Agustin Codazzi (IGAC) in the form of paper
maps, river surveys and field observations. Procedure of digitization was adopted to convert
these maps into digital form. Digital data was stored using the Toscanel module of IDRISI
(Eastman, 1997), in the form of regular or random data points, isolines and polygons.
Generation of digital elevation model of Quibdo
The Digital Elevation Model (DEM) was developed for Quibdo by digitization of the contour
lines and point elevations from the IGAC 1:5000 geographic quadrangles, and the 1:2000 plan
of Quibdo city. Additional points were obtained using a GPS in field survey done specifically
for this research. The Atrato river cross sections and point elevation values for benchmarks
were digitized to provide additional elevation information for creation of the DEM. The
coverages created for interpolation in Arc Info where: (i) arc coverage of contours lines with
an equidistance of 10 m, (ii) the hydrologic network of Quibdo (composed of Atrato river
and its tributaries), (iii) survey points of Quibdo, (iv) Atrato river’s cross-sections 20–100 m
apart from field survey or from topographical maps of scale 1:2000, (v) profiles of Atrato
River from the National Institute of fluvial transportation.
Springer
Water Resour Manage (2007) 21:591–609 597
First only the contours lines were interpolated in ILWIS obtaining a DEM with visual er-
rors and artefacts. Next the interpolation was done using the TOPOGRID Module of ArcInfo,
that allows the combination of different types of coverages, including single rivers profiles,
hydrologic networks, contours and points. The resulting DEM of Quibdo has a grid resolu-
tion of 20 m with a contour interval of 5 m. The DEM has a square grid array and is thus
computationally efficient. To estimate the accuracy the DEM was field checked using a GPS
at 80 points; it was found that a vertical error of 1.5 cm and horizontal error of 0.25 m exists.
Hydrologic frequency analysis
The frequency analysis is used to relate the magnitude of extreme events to their exceedance
probability though the use of probability distribution. The return period of any event in
observation is the inverse of its exceedance probability. Since prediction of large floods
requires knowledge of the underlying distribution, major portion of the work was devoted to
statistical modeling of extreme values using some well-established theories. The statistical
distribution of Gumbel is a frequential model widely used in hydrology, to model extreme
events, rains in particular. Gumbel (1958) postulates that the exponential double law of
Gumbel is the limiting form of the distribution of the maximum value of a sample of nvalues. The annual maximum of a variable being regarded as the maximum of 365 daily
values; this law must thus be able to describe the series of maximum annual. The function
of distribution of the law of Gumbel F(x) is expressed in the following way:
F(x) = exp
(− exp
(− x − a
b
))(1)
where a is the location parameter and b is the parameter of scale.
Defining the reduced variable of Gumbel as
u = x − a
b(2)
Then the Gumbel distribution may be writen as:
F(x) = exp(− exp(−u)) (3)
and
u = − ln(− ln F(x)) (4)
The advantage of using the reduced variable of Gumbel u is the linearization of the
expression of a quintile. The calculation of the value of a quintile xq can be done either by
direct reading on the graph or by using the equation of distribution
xq = a + buq (5)
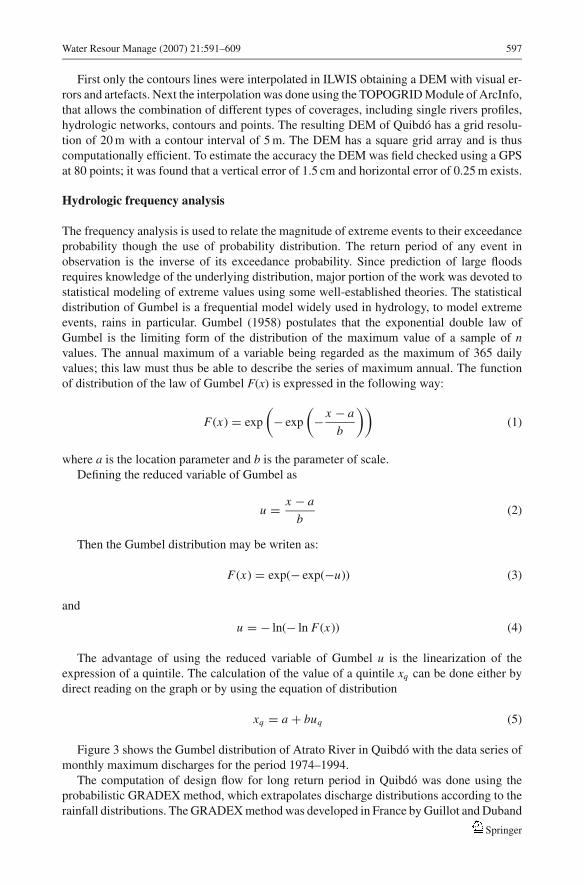
Figure 3 shows the Gumbel distribution of Atrato River in Quibdo with the data series of
monthly maximum discharges for the period 1974–1994.
The computation of design flow for long return period in Quibdo was done using the
probabilistic GRADEX method, which extrapolates discharge distributions according to the
rainfall distributions. The GRADEX method was developed in France by Guillot and Duband
Springer
598 Water Resour Manage (2007) 21:591–609
1300
1500
1700
1900
2100
2300
2500
2700
2900
3100
-2.5 -2 -1.5 -1 -0.5 0 0.5 1 1.5 2 2.5 3 3.5 4 4.5
Reduced variable of Gumbel U
m( w
olf ylht
no
m m
umix
aM
3)s/
Fig. 3 Gumbel analysis for Atrato River in Quibdo (1984–1994)
in 1967 for extreme flood estimation in catchments up to 5000 square kilometers, and it is
widely used in Europe and Canada (i.e Garcon, 1993; Bontron et al., 1999; Ouarda et al., 1999;
Merz et al., 1999; Bloschl et al., 2000; Mic, 2002). The GRADEX represents a simplified
rainfall-runoff model which provides estimates of flood magnitudes of given probabilities
and is based on rainfall data which often cover longer periods and are more reliable than
flow data. It is based on the hypotheses (Guillot and Duband, 1967; Guillot, 1973; Duband
and Garros, 1994) that beyond a given rainfall threshold known as the pivot point, all water
is transformed into runoff, and that a rainfall event of a given duration generates runoff
for the same length of time. These hypotheses are equivalent to assuming that, beyond the
pivot point, the rainfall-runoff relationship is linear and that the precipitation and runoff
probability curves are parallel on a Gumbel plot. This definition is equivalent to taking the
slope of the line passing through the points corresponding to the given return period on a
Gumbel plot. For Quibdo’s station we evaluated eleven GRADEX values, i.e., one for each
month (except August for which data was missing) using data from 1974–1994. Then we
obtain the GRADEX values and estimated extreme flow value for different return periods.
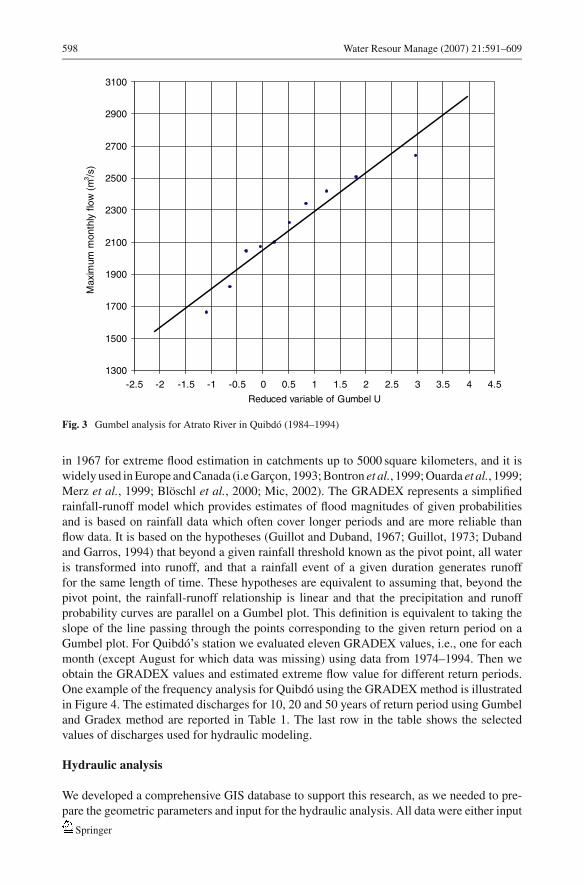
One example of the frequency analysis for Quibdo using the GRADEX method is illustrated
in Figure 4. The estimated discharges for 10, 20 and 50 years of return period using Gumbel
and Gradex method are reported in Table 1. The last row in the table shows the selected
values of discharges used for hydraulic modeling.
Hydraulic analysis
We developed a comprehensive GIS database to support this research, as we needed to pre-
pare the geometric parameters and input for the hydraulic analysis. All data were either input
Springer
Water Resour Manage (2007) 21:591–609 599
Table 1 Estimated discharges of Atrato River in Quibdo using Gumbel and GRADEX methods
Q for T = 10 Q for T = 20 Q for T = 50
years (m3/s) years (m3/s) years (m3/s)
Month Gumbel Gradex Gumbel Gradex Gumbel Gradex
January 2559.3 2575.5 2761.3 2825.3 3002.1 3042.1
February 2019.3 2032.3 2148.3 2252.4 2300.1 2358.1
March 2457.5 2457.1 2638.5 2578.1 2888.5 2912.4
April 2520.2 2498.2 2732.3 2761.1 3009.1 3028.1
May 2449 2461 2569.6 2591.6 2723.1 2741.3
June 2666.5 2675.5 2867.5 2867.5 3027.1 3053.6
July 2303.3 2320.3 2450 2460.4 2633.1 2644.2
August 2654.9 2875.9 3036.1
September 2514.2 2544.1 2686.5 2697.3 2921.5 2930.6
October 2589.6 2599.6 2767.6 2777.6 2990.1 2990.1
November 2544.7 2562.8 2692 2720.1 2981.5 2908.5
December 2349.4 2289.3 2485 2425.2 2669.3 2718.3
Discharges Q used for 2676 2868 3054
flood simulation
0
50
100
150
200
250
300
350
400
-2 0 2 4 6 8
Reduced variable of Gumbel U
yli
ad .
xa
M fo
noit
ubirt
sid
ylht
no
M
)m
m( n
oitati
pic
erp
Da
ily
ma
xim
um
flo
w (
mm
)
0
0.5
1
1.5
2
2.5
3
Fig. 4 GRADEX analysis for Atrato River in Quibdo (1970–1994)
or derived within IDRISI (a raster-based GIS and image processing software) or Arc/Info (a
vector-based GIS). The base variables included elevation contours, elevation points, hydro-
graphic network, soils and watersheds.
The Atrato river hydraulic modeling was done using the HEC-RAS, River Analysis
System (USACE, 1998). The HEC-RAS computational procedure is based on the solution
of the one-dimensional energy equation. Energy losses are evaluated by friction using
Manning’s Equation (6) and contraction/expansion (coefficient multiplied by the change in
velocity head).
Q = k
nAR
23 S
12 (6)
Springer
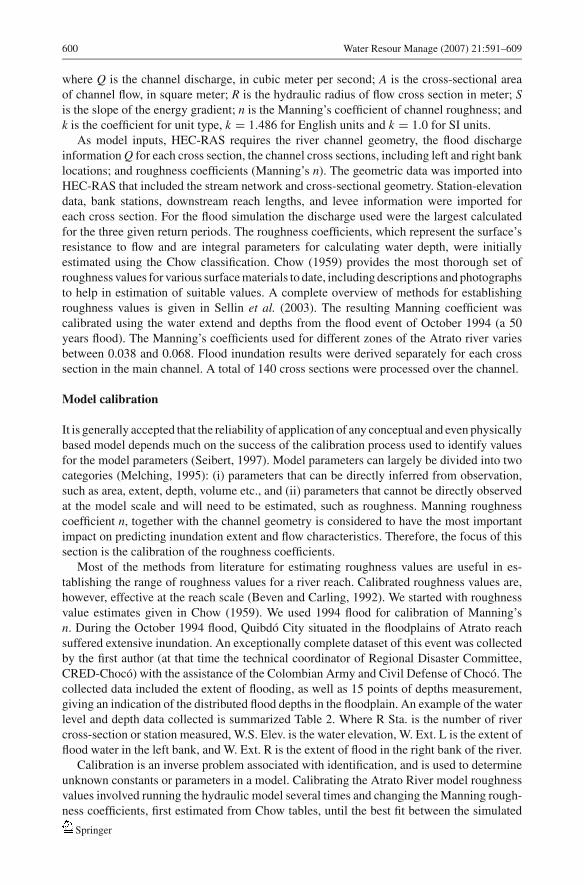
600 Water Resour Manage (2007) 21:591–609
where Q is the channel discharge, in cubic meter per second; A is the cross-sectional area
of channel flow, in square meter; R is the hydraulic radius of flow cross section in meter; Sis the slope of the energy gradient; n is the Manning’s coefficient of channel roughness; and
k is the coefficient for unit type, k = 1.486 for English units and k = 1.0 for SI units.
As model inputs, HEC-RAS requires the river channel geometry, the flood discharge
information Q for each cross section, the channel cross sections, including left and right bank
locations; and roughness coefficients (Manning’s n). The geometric data was imported into
HEC-RAS that included the stream network and cross-sectional geometry. Station-elevation
data, bank stations, downstream reach lengths, and levee information were imported for
each cross section. For the flood simulation the discharge used were the largest calculated
for the three given return periods. The roughness coefficients, which represent the surface’s
resistance to flow and are integral parameters for calculating water depth, were initially
estimated using the Chow classification. Chow (1959) provides the most thorough set of
roughness values for various surface materials to date, including descriptions and photographs
to help in estimation of suitable values. A complete overview of methods for establishing
roughness values is given in Sellin et al. (2003). The resulting Manning coefficient was
calibrated using the water extend and depths from the flood event of October 1994 (a 50
years flood). The Manning’s coefficients used for different zones of the Atrato river varies
between 0.038 and 0.068. Flood inundation results were derived separately for each cross
section in the main channel. A total of 140 cross sections were processed over the channel.
Model calibration
It is generally accepted that the reliability of application of any conceptual and even physically
based model depends much on the success of the calibration process used to identify values
for the model parameters (Seibert, 1997). Model parameters can largely be divided into two
categories (Melching, 1995): (i) parameters that can be directly inferred from observation,
such as area, extent, depth, volume etc., and (ii) parameters that cannot be directly observed
at the model scale and will need to be estimated, such as roughness. Manning roughness
coefficient n, together with the channel geometry is considered to have the most important
impact on predicting inundation extent and flow characteristics. Therefore, the focus of this
section is the calibration of the roughness coefficients.
Most of the methods from literature for estimating roughness values are useful in es-
tablishing the range of roughness values for a river reach. Calibrated roughness values are,
however, effective at the reach scale (Beven and Carling, 1992). We started with roughness
value estimates given in Chow (1959). We used 1994 flood for calibration of Manning’s
n. During the October 1994 flood, Quibdo City situated in the floodplains of Atrato reach
suffered extensive inundation. An exceptionally complete dataset of this event was collected
by the first author (at that time the technical coordinator of Regional Disaster Committee,
CRED-Choco) with the assistance of the Colombian Army and Civil Defense of Choco. The
collected data included the extent of flooding, as well as 15 points of depths measurement,
giving an indication of the distributed flood depths in the floodplain. An example of the water
level and depth data collected is summarized Table 2. Where R Sta. is the number of river
cross-section or station measured, W.S. Elev. is the water elevation, W. Ext. L is the extent of
flood water in the left bank, and W. Ext. R is the extent of flood in the right bank of the river.
Calibration is an inverse problem associated with identification, and is used to determine
unknown constants or parameters in a model. Calibrating the Atrato River model roughness
values involved running the hydraulic model several times and changing the Manning rough-
ness coefficients, first estimated from Chow tables, until the best fit between the simulated
Springer
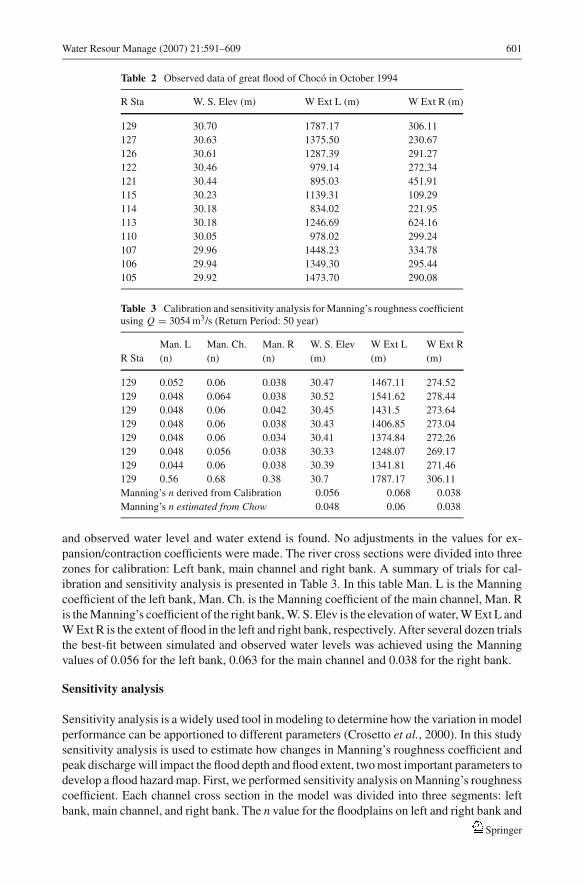
Water Resour Manage (2007) 21:591–609 601
Table 2 Observed data of great flood of Choco in October 1994
R Sta W. S. Elev (m) W Ext L (m) W Ext R (m)
129 30.70 1787.17 306.11
127 30.63 1375.50 230.67
126 30.61 1287.39 291.27
122 30.46 979.14 272.34
121 30.44 895.03 451.91
115 30.23 1139.31 109.29
114 30.18 834.02 221.95
113 30.18 1246.69 624.16
110 30.05 978.02 299.24
107 29.96 1448.23 334.78
106 29.94 1349.30 295.44
105 29.92 1473.70 290.08
Table 3 Calibration and sensitivity analysis for Manning’s roughness coefficientusing Q = 3054 m3/s (Return Period: 50 year)
Man. L Man. Ch. Man. R W. S. Elev W Ext L W Ext R
R Sta (n) (n) (n) (m) (m) (m)
129 0.052 0.06 0.038 30.47 1467.11 274.52
129 0.048 0.064 0.038 30.52 1541.62 278.44
129 0.048 0.06 0.042 30.45 1431.5 273.64
129 0.048 0.06 0.038 30.43 1406.85 273.04
129 0.048 0.06 0.034 30.41 1374.84 272.26
129 0.048 0.056 0.038 30.33 1248.07 269.17
129 0.044 0.06 0.038 30.39 1341.81 271.46
129 0.56 0.68 0.38 30.7 1787.17 306.11
Manning’s n derived from Calibration 0.056 0.068 0.038
Manning’s n estimated from Chow 0.048 0.06 0.038
and observed water level and water extend is found. No adjustments in the values for ex-
pansion/contraction coefficients were made. The river cross sections were divided into three
zones for calibration: Left bank, main channel and right bank. A summary of trials for cal-
ibration and sensitivity analysis is presented in Table 3. In this table Man. L is the Manning
coefficient of the left bank, Man. Ch. is the Manning coefficient of the main channel, Man. R
is the Manning’s coefficient of the right bank, W. S. Elev is the elevation of water, W Ext L and
W Ext R is the extent of flood in the left and right bank, respectively. After several dozen trials
the best-fit between simulated and observed water levels was achieved using the Manning
values of 0.056 for the left bank, 0.063 for the main channel and 0.038 for the right bank.
Sensitivity analysis
Sensitivity analysis is a widely used tool in modeling to determine how the variation in model
performance can be apportioned to different parameters (Crosetto et al., 2000). In this study
sensitivity analysis is used to estimate how changes in Manning’s roughness coefficient and
peak discharge will impact the flood depth and flood extent, two most important parameters to
develop a flood hazard map. First, we performed sensitivity analysis on Manning’s roughness
coefficient. Each channel cross section in the model was divided into three segments: left
bank, main channel, and right bank. The n value for the floodplains on left and right bank and
Springer
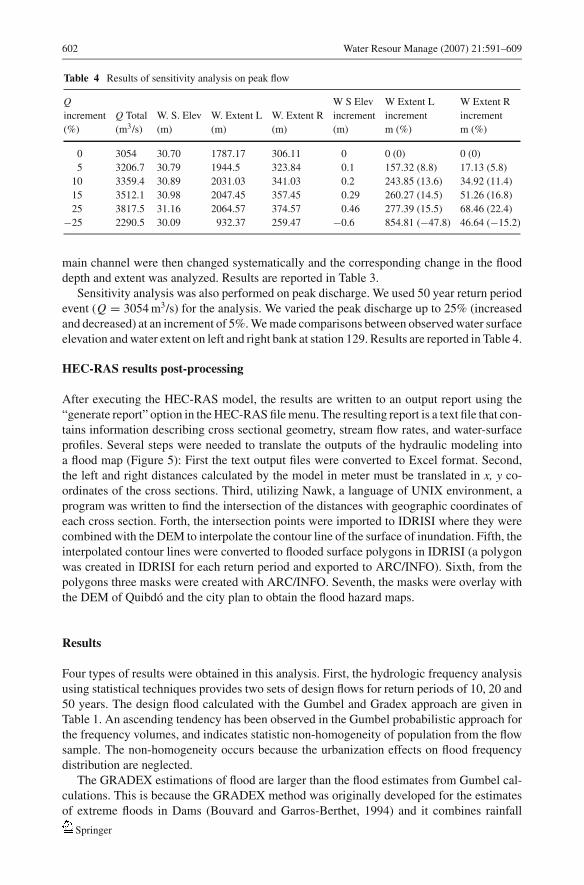
602 Water Resour Manage (2007) 21:591–609
Table 4 Results of sensitivity analysis on peak flow
Q W S Elev W Extent L W Extent R
increment Q Total W. S. Elev W. Extent L W. Extent R increment increment increment
(%) (m3/s) (m) (m) (m) (m) m (%) m (%)
0 3054 30.70 1787.17 306.11 0 0 (0) 0 (0)
5 3206.7 30.79 1944.5 323.84 0.1 157.32 (8.8) 17.13 (5.8)
10 3359.4 30.89 2031.03 341.03 0.2 243.85 (13.6) 34.92 (11.4)
15 3512.1 30.98 2047.45 357.45 0.29 260.27 (14.5) 51.26 (16.8)
25 3817.5 31.16 2064.57 374.57 0.46 277.39 (15.5) 68.46 (22.4)
−25 2290.5 30.09 932.37 259.47 −0.6 854.81 (−47.8) 46.64 (−15.2)
main channel were then changed systematically and the corresponding change in the flood
depth and extent was analyzed. Results are reported in Table 3.
Sensitivity analysis was also performed on peak discharge. We used 50 year return period
event (Q = 3054 m3/s) for the analysis. We varied the peak discharge up to 25% (increased
and decreased) at an increment of 5%. We made comparisons between observed water surface
elevation and water extent on left and right bank at station 129. Results are reported in Table 4.
HEC-RAS results post-processing
After executing the HEC-RAS model, the results are written to an output report using the
“generate report” option in the HEC-RAS file menu. The resulting report is a text file that con-
tains information describing cross sectional geometry, stream flow rates, and water-surface
profiles. Several steps were needed to translate the outputs of the hydraulic modeling into
a flood map (Figure 5): First the text output files were converted to Excel format. Second,
the left and right distances calculated by the model in meter must be translated in x, y co-
ordinates of the cross sections. Third, utilizing Nawk, a language of UNIX environment, a
program was written to find the intersection of the distances with geographic coordinates of
each cross section. Forth, the intersection points were imported to IDRISI where they were
combined with the DEM to interpolate the contour line of the surface of inundation. Fifth, the
interpolated contour lines were converted to flooded surface polygons in IDRISI (a polygon
was created in IDRISI for each return period and exported to ARC/INFO). Sixth, from the
polygons three masks were created with ARC/INFO. Seventh, the masks were overlay with
the DEM of Quibdo and the city plan to obtain the flood hazard maps.
Results
Four types of results were obtained in this analysis. First, the hydrologic frequency analysis
using statistical techniques provides two sets of design flows for return periods of 10, 20 and
50 years. The design flood calculated with the Gumbel and Gradex approach are given in
Table 1. An ascending tendency has been observed in the Gumbel probabilistic approach for
the frequency volumes, and indicates statistic non-homogeneity of population from the flow
sample. The non-homogeneity occurs because the urbanization effects on flood frequency
distribution are neglected.
The GRADEX estimations of flood are larger than the flood estimates from Gumbel cal-
culations. This is because the GRADEX method was originally developed for the estimates
of extreme floods in Dams (Bouvard and Garros-Berthet, 1994) and it combines rainfall
Springer
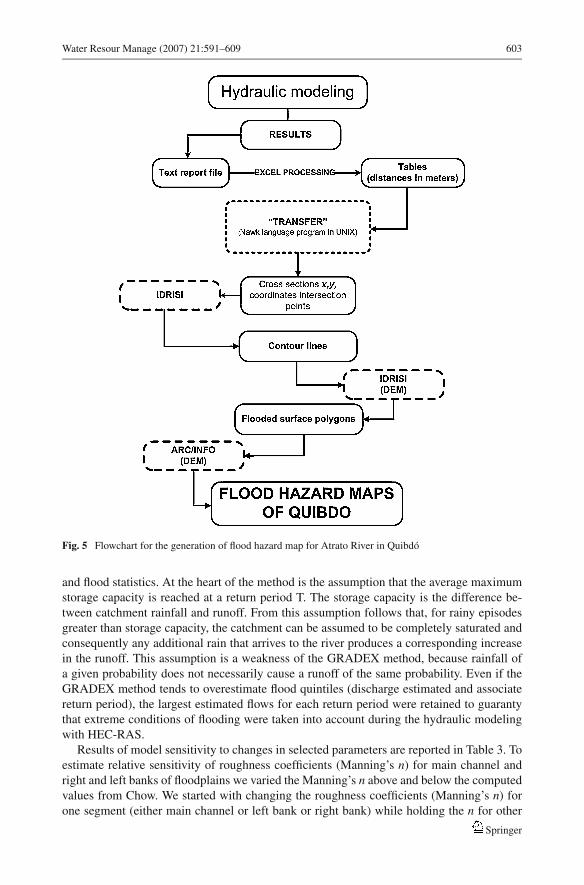
Water Resour Manage (2007) 21:591–609 603
Fig. 5 Flowchart for the generation of flood hazard map for Atrato River in Quibdo
and flood statistics. At the heart of the method is the assumption that the average maximum
storage capacity is reached at a return period T. The storage capacity is the difference be-
tween catchment rainfall and runoff. From this assumption follows that, for rainy episodes
greater than storage capacity, the catchment can be assumed to be completely saturated and
consequently any additional rain that arrives to the river produces a corresponding increase
in the runoff. This assumption is a weakness of the GRADEX method, because rainfall of
a given probability does not necessarily cause a runoff of the same probability. Even if the
GRADEX method tends to overestimate flood quintiles (discharge estimated and associate
return period), the largest estimated flows for each return period were retained to guaranty
that extreme conditions of flooding were taken into account during the hydraulic modeling
with HEC-RAS.
Results of model sensitivity to changes in selected parameters are reported in Table 3. To
estimate relative sensitivity of roughness coefficients (Manning’s n) for main channel and
right and left banks of floodplains we varied the Manning’s n above and below the computed
values from Chow. We started with changing the roughness coefficients (Manning’s n) for
one segment (either main channel or left bank or right bank) while holding the n for other
Springer
604 Water Resour Manage (2007) 21:591–609
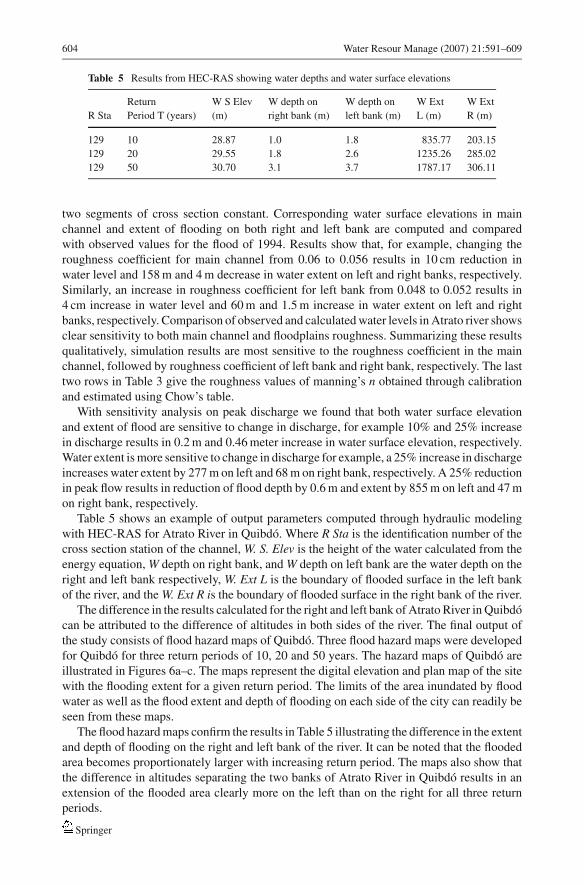
Table 5 Results from HEC-RAS showing water depths and water surface elevations
Return W S Elev W depth on W depth on W Ext W Ext
R Sta Period T (years) (m) right bank (m) left bank (m) L (m) R (m)
129 10 28.87 1.0 1.8 835.77 203.15
129 20 29.55 1.8 2.6 1235.26 285.02
129 50 30.70 3.1 3.7 1787.17 306.11
two segments of cross section constant. Corresponding water surface elevations in main
channel and extent of flooding on both right and left bank are computed and compared
with observed values for the flood of 1994. Results show that, for example, changing the
roughness coefficient for main channel from 0.06 to 0.056 results in 10 cm reduction in
water level and 158 m and 4 m decrease in water extent on left and right banks, respectively.
Similarly, an increase in roughness coefficient for left bank from 0.048 to 0.052 results in
4 cm increase in water level and 60 m and 1.5 m increase in water extent on left and right
banks, respectively. Comparison of observed and calculated water levels in Atrato river shows
clear sensitivity to both main channel and floodplains roughness. Summarizing these results
qualitatively, simulation results are most sensitive to the roughness coefficient in the main
channel, followed by roughness coefficient of left bank and right bank, respectively. The last
two rows in Table 3 give the roughness values of manning’s n obtained through calibration
and estimated using Chow’s table.
With sensitivity analysis on peak discharge we found that both water surface elevation
and extent of flood are sensitive to change in discharge, for example 10% and 25% increase
in discharge results in 0.2 m and 0.46 meter increase in water surface elevation, respectively.
Water extent is more sensitive to change in discharge for example, a 25% increase in discharge
increases water extent by 277 m on left and 68 m on right bank, respectively. A 25% reduction
in peak flow results in reduction of flood depth by 0.6 m and extent by 855 m on left and 47 m
on right bank, respectively.
Table 5 shows an example of output parameters computed through hydraulic modeling
with HEC-RAS for Atrato River in Quibdo. Where R Sta is the identification number of the
cross section station of the channel, W. S. Elev is the height of the water calculated from the
energy equation, W depth on right bank, and W depth on left bank are the water depth on the
right and left bank respectively, W. Ext L is the boundary of flooded surface in the left bank
of the river, and the W. Ext R is the boundary of flooded surface in the right bank of the river.
The difference in the results calculated for the right and left bank of Atrato River in Quibdo
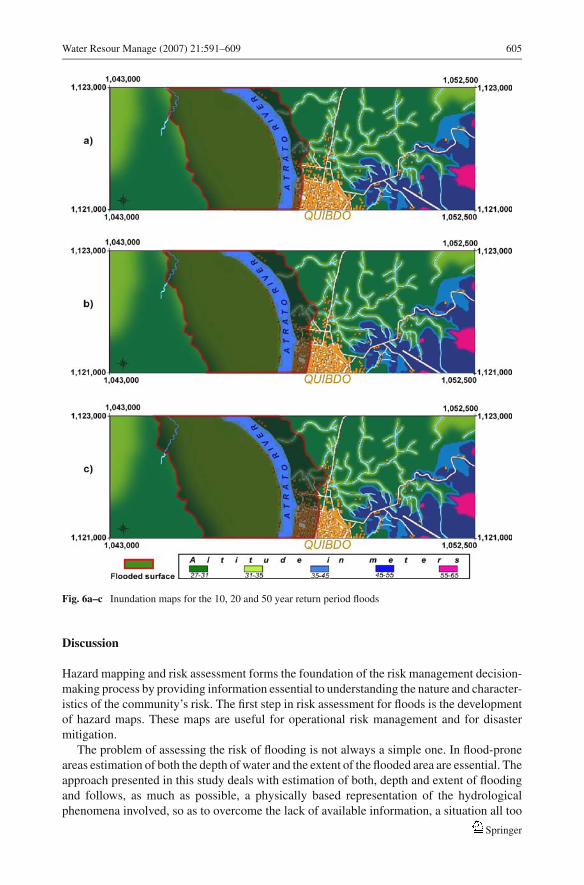
can be attributed to the difference of altitudes in both sides of the river. The final output of
the study consists of flood hazard maps of Quibdo. Three flood hazard maps were developed
for Quibdo for three return periods of 10, 20 and 50 years. The hazard maps of Quibdo are
illustrated in Figures 6a–c. The maps represent the digital elevation and plan map of the site
with the flooding extent for a given return period. The limits of the area inundated by flood
water as well as the flood extent and depth of flooding on each side of the city can readily be
seen from these maps.
The flood hazard maps confirm the results in Table 5 illustrating the difference in the extent
and depth of flooding on the right and left bank of the river. It can be noted that the flooded
area becomes proportionately larger with increasing return period. The maps also show that
the difference in altitudes separating the two banks of Atrato River in Quibdo results in an
extension of the flooded area clearly more on the left than on the right for all three return
periods.
Springer
Water Resour Manage (2007) 21:591–609 605
Fig. 6a–c Inundation maps for the 10, 20 and 50 year return period floods
Discussion
Hazard mapping and risk assessment forms the foundation of the risk management decision-
making process by providing information essential to understanding the nature and character-
istics of the community’s risk. The first step in risk assessment for floods is the development
of hazard maps. These maps are useful for operational risk management and for disaster
mitigation.
The problem of assessing the risk of flooding is not always a simple one. In flood-prone
areas estimation of both the depth of water and the extent of the flooded area are essential. The
approach presented in this study deals with estimation of both, depth and extent of flooding
and follows, as much as possible, a physically based representation of the hydrological
phenomena involved, so as to overcome the lack of available information, a situation all too
Springer
606 Water Resour Manage (2007) 21:591–609
frequently encountered in practice. In particular, the use of the GRADEX method to transform
the precipitation into flood discharges entering the river channel has the advantage of using
the available data of precipitation to estimate the maximum flow. The method not only uses
the available data but also has been developed based on objective hydrologic principles and
can be applied consistently on a departmental or national scale. The approach presented here
used two statistical models for computing extreme flows, to fit varying application needs
and data availability scenarios. Geographic Information System and newly created digital
database are used in the determination of channel geometric characteristics, required for
hydraulic modeling. The validation of the model was successful.
The present study has shown that the hybrid methodology combining statistical analysis,
hydraulic modeling and GIS has a sufficient range of functionality to be able to produce
the flood extents and flood depth based on the available data. The purpose of the sensitivity
analysis is to identify the response of the model to the variations in input parameter values and
boundary conditions. This helped in identifying the input error that may contribute to most
of the output uncertainty. The sensitivity analysis of the calibration shows a good agreement
between the observed and simulated data. The use of high-resolution elevation data makes
estimates of friction factor; Manning’s n, relatively more important for correct results in
inundation studies.
One key factor in developing this method was the search for the simplest solution that can
work with available data.
The rapid growth of the population and expansion of the city on the left bank of the Atrato
River requires planning based on realistic and dynamic evaluation of flood hazard. Some
qualitative and quantitative analysis of the results clearly show that all the neighborhoods of
the center of Quibdo in the right bank of Atrato river are vulnerable to the 50 years flood,
while the left bank is completely covered by water during different flood events of return
periods from 10 to 50 years. The difference resides not only in the area covered but also in
the percentage of buildings submerged. The most vulnerable districts in the event of flood
are: Kennedy, Yesca- Grande, Yesquita, Nino Jesus, Roma, and Esmeralda on right bank and
Bahia Solano on left bank. The total number of buildings which could be impacted by the 50
years flood are 9,000, this account for 30% of buildings in Quibdo. The population which
could be affected by the 50 years flood is approximately 37,000 inhabitants, equivalent to
45% of the population in the area.
These estimates could obviously be affected by a series of uncertainties, and by the
possibility of errors of different kind, which may in some way influence the final result. These
possible errors lie in: (i) the estimation of the extreme flow values; (ii) the representation
of the river channel and floodplain (iii) the representativeness of the Manning’s roughness
coefficient and (4) the use of one dimensional model for flood estimation in urban areas.
We acknowledge the limitations of using ID model such as HEC-RAS for flood studies
in an urban catchment, where flow is essentially two dimensional. Because of limited data
requirements and computational efficiency ID models are still popular for flood studies for
applications where details of the flow field are not of prime importance. In this work our
focus was on reproducing the depth and extent of flooding, that model did reasonably well.
The results of this study lustrate the potential exposure of Quibdo, capital of the Depart-
ment of Choco, to flood hazard in the Atrato River. The research will benefit future flood
management efforts by providing the first assessment of flooding risk in the study area. These
flood inundation maps produced here can be used: (i) to identify minimum height of flood
protection works such as dikes to protect city from flooding; (ii) to identify the regions that
will be affected by the flood of a given magnitude or return period, (iii) to plan for emergency
need e.g., shelter, medical supplies, food (iv) to assess flood damages; and (v) to determine
Springer
Water Resour Manage (2007) 21:591–609 607
if a potential site for proposed development is in a flood risk zone. While designed for Atrato
River in Quibdo, this approach may be used as a prototype for flood hazard assessment in
other areas of the department and country.
Acknowledgements The financial support of the Confederation Helvetica and Natural Sciences and Engi-neering Foundation of Switzerland is greatly acknowledged. This paper is partly funded by a grant/cooperativeagreement from the National Oceanic and Atmospheric Administration, NA050AR4311004. The views ex-pressed herein are those of the author(s) and do not necessarily reflect the views of NOAA or any of itssub-agencies.
References
Acosta Z, Ruiz D (1997) Adaptacion del metodo Gradex en cuencas antioquenas. Dissertation. UniversidadNacional de Colombia
Ahmad S, Simonovic SP (2001) A decision support tool for evaluation of impacts of flood managementpolicies. Hydrol Sci Technol 17(1–4):11–22
Ahmad S, Simonovic SP (2006) An intelligent decision support system for management of floods. WaterResour Manage 20:391–410
Becker A, Grunewald U (2003) Disaster management: Flood Risk in Central Europe. Scienc 300(5622):1099–1099
Beven KJ, Carling PA (1992) Velocities, roughness and dispersion in a lowland River Severn. In: CarlingPA, Petts GE (eds) Lowland floodplain rivers: Geopmorphological perspectives. John Wiley & Sons Ltd.,Chichester, pp 71–93
Bloschl G, Burlando P, Merz R, Pfaundler M, Piock-Ellena U (2000) An intercomparison of regional floodfrequency methods. Eos Trans AGU 81(48), Fall Meeting Suppl., Abstract H62F-11
Bouvard M, Garros-Berthet H (1994) Les crues de projet des barrages: Methode du Gradex. Bulletin du ComiteFrancais des Grands Barrages, Barrages et Reservoirs, 18th ICOLD Congress, No. 2, 95 pp
Bontron G, Menez G, Duband D, Gautier JN (1999) Application de la methode du Gradex a des grands bassinsversants; cas de la Loire au Bec d’Allier (32,000 km2). Houille Blanche 54(6):29–36
Cardona A, Londono G (1991) Calibracion de los parametros del modelo de William y Hanns para cuencasantioquenas. Dissertation, Universidad Nacional de Colombia
Case JE, Duran LG, Lopez A, Moore R (1971) Tectonic investigations in Western Colombia and EasternPanama. Bull Geol Soc Am 82:2685–2711
Chow VT (1959) Open Channel Hydraulics. McGraw-Hill Book Company, New YorkCossio U (1994) Mapa geologico generalizado del departamento del Choco. Escala 1:600.000 Memoria
Explicativa. Ingeominas, pp 7–46Congressional Natural Hazards Caucus Work Group (2001) Discussion paper for the Congressional Natural
Hazards Caucus. Website: http://www.agiweb.org/workgroup.Departamento Administrativo Nacional de Estadısticas-DANE (1993) V censo nacional de la poblacion.
Bogota, ColombiaCrosetto M, Tarantola S, Saltelli A (2000) Sensitivity and uncertainty analysis in spatial modelling based on
GIS. Agriculture, Ecosystems and Environmen, pp 71–79Dilley M, Chen RS, Deichmann U, Lerner-Lam AL, Arnold M with Agwe J, Buys P, Kjekstad O, Lyon B,
Yetman G (2005) Natural disaster hotspots: a global risk analysis. International Bank for Reconstructionand Development/The World Bank and Columbia University, Washington, DC
Duband D, Garros-Berthet H (1994) Design flood determination by the Gradex method. In Bulletin du ComiteFrancais des Grands Barrages, Barrages et Reservoirs (CFGB), 96 pp
Duque-Caro H (1990) El bloque del Choco en el noroccidente colombiano: implicaciones estructurales,tectonoestratigraficas y paleogeograficas. Boletin Geologico Ingeominas 31(1):47–71
Eastman R (1997) IDRISI Geographic Information System, User’s Guide Version 2.0. Clark Labs for Geo-graphic Technology and Geographic Analysis, Clark University, Worcester MA. [Available from ClarkLabs for Geographic Technology and Geographic Analysis, Clark University, 950 Main St., Worcester,MA 01610]
Eslava JA (1992) La precipitacion en la region del Pacıfico colombiano (Lloro: el sitio mas lluvioso delmundo). Revista Zenit 3:47–71
Eslava JA (1994) Acerca de la distribucion espacio-temporal de la precipitacion en la region del pacıficoColombiano. Atmosfera 22:71–80
Springer
608 Water Resour Manage (2007) 21:591–609
ESRI (1997) ArcView GIS 3.2 User’s manual, Redlands, CAFigueroa SN, Nobre CA (1990) Precipitation distribution over central and western tropical South America.
Climanalise 5:36–45Franco CJ, Perez CA (1995) Regionalizacion de Caudales maximos en Antioquia. Dissertation, Universidad
Nacional de ColombiaFreeze RA, Harlan RL (1969) Blueprint for a physically-based digitally-simulated hydrological response
model. Journal of Hydrology 9:237–258Garcon R (1993) The gradex method: for a statistically robust evaluation of extreme values floods based on
local characteristics. Stochastic and Statistical Methods in Hydrology and Environmental Engineering.Waterloo, Canada
Government of Colombia (1993) World Heritage List Nomination Form. Los Katıos National Park (Colombia).Extension of the World Heritage Status hold by El Darien National Park in Panama. 15 pp
Guillot P, Duband D (1967) La methode du Gradex pour le calcul de la probabilite ’des crues a partir des pluies.Coloque International sur les crues et leur evaluation. In: Proceedings of the Leningrad Symposium 15–22August, IASH, 84:560–569
Guillot P (1973) Precisions sur la methode du Gradex: utilisation de l’information logique pour l’evaluationde ‘la crue de projet. Proceeding International Commission On Large Damns, XI Congress, Madrid41:131–136
Gumbel EJ (1958) Statistics of Extremes. Columbia University Press, New York, New YorkHamilton SK, Sippel SJ, Melack JM (2002) Comparison of inundation patterns in South American floodplains.
Journal of Geophysical Research 107(D20). DOI 10.1029/2000JD000306Hamilton SK, Sippel SJ, Melack JM (2004) Seasonal inundation patterns in two large savanna floodplains of
South America: the Llanos de Moxos (Bolivia) and the Llanos del Orinoco (Venezuela and Colombia).Hydrolog Process 18(11):2103–2116
Horel JD, Cornejo-Garrido AG (1986) Convection Along the coastal of northern Peru during 1983: spatialand temporal variation of clouds and rainfall. Mon Weather Rev 114:2091–2105
Horritt MS, Mason DC, Luckman AJ (2001) Flood boundary delineation from synthetic aperture radar imageryusing a statistical active contour model. Int J Remote Sensing 22(13):2489–2507
IDEAM (1997) National institute of hydrology, meteorology and environmental research. Hydrometeorolog-ical information system
Instituto Geografico Agustin Codazzi-IGAC (1977) Estudio General de Suelos del Municipio de Quibdo.Subdireccion Agrologica. Instituto Geografico Agustın Codazzi. Bogota
Jonkman SN (2005) Global Perspectives on Loss of Human Life Caused by Floods. Nat Hazards 34(2):151–175Macıa C (1985) Caracterısticas petrograficas y geoquımicas de rocas basalticas de la penınsula del Cabo
Corrientes (Serranıa de Baudo). Colombia. Geologıa Colombiana 14:25–37Melching CS (1995) Reliability estimation. In: Singh VP (ed) Computer models for watershed hydrology.
Water Resources Publications, pp 69–118Mesa OJ, Poveda G, Carvajal LF (1997) Introduccion al clima de Colombia. Universidad Nacional de
Colombia, 390 ppMerz R, Bloschl G, Piock-Ellena U (1999) Applicability of the Gradex-Method in Austria. Oesterreichische
Wasser und Abfallwirtschaft 51(11–12):291–305Mic R, Galea G, Javelle P (2002) Floods regional modeling of the Cris watershed: classical regional and
reference models approach. Revue des Sciences de l’Eau 15(3):677–700Mosquera-Machado SC (2002) Analyse multi-aleas et risques naturels dans le Departement du Choco, Nord-
Ouest de Colombie. Doctoral dissertation, Terre & Environnement, Section des Sciences de la Terre,Universite de Geneve, Vol. 37, 159 pp
Mosquera-Machado SC (2006) Analisis multiriesgos de los desastres naturales del Choco, durante las tresultimas decadas: 1970–2000. Entorno Geografico (in press)
NIBH/EESC/USP (2004) Reflections on flood impacts and proposals of mitigating public policy. InternalReport #2, SHS-EESC-USP, Sao Carlos, Brazil (in Portuguese)
Nygren WE (1950) The Bolivar Geosinclyne in northwestern South America. Bull Am Assoc PetroleumGeologists 4(10):1998–2006
Ouarda TB, Lang M, Bobee B, Bernier J, Bois P (1999) Analysis of regional flood models utilized in Franceand Quebec. Revue des Sciences de l’Eau 12(1):155–182
Poveda G, Mesa OJ (2000) On the existence of Lloro (the rainiest locality on Earth): Enhanced ocean–land–atmosphere interaction by a low-level jet. Geophys Res Lett 27:1675–1678
Robayo O, Whiteaker T, Maidment D (2004) Converting a NEXRAD map to a floodplain map. Paper presentedat the meeting of the American Water Resources Association, Nashville, Tennessee, May 17–19, 2004
Seibert J (1997) Estimation of parameter uncertainty in the hbv model. Nord Hydrol 28:247–262
Springer
Water Resour Manage (2007) 21:591–609 609
Sellin R, Bryant T, Loveless J (2003) An improved method for roughening floodplains on physical rivermodels. J Hydraulics Res 41:3–14
Simonovic SP, Ahmad S (2005) Computer-based model for flood evacuation emergency planning. NaturalHazards 34(1):25–51
Smith LC (1997) Satellite remote sensing of river inundation area, stage, and discharge: A review. HydrolProcess 11:1427–1439
United Nation Development Programme-UNDP (2004) Reducing disaster risk: A challenge for development.United Nations Development Programme, Bureau for Crisis Prevention and Recovery, New York, 146 pp
US Army Corps of Engineers (USACE) (1998) HEC-RAS River Analysis System, User’s Manual Version2.2. Hydrologic Engineering Center, Davis, California
Wadsworth G (1999) Flood damage statistics. Public Works Department, Napa, CAWolfgang J, Karin F (1993) A general review of tropical South American floodplains. Wetlands Ecol Manage
(Historical Archive) 2(4):231–238
Springer


![.Noah's Flood WTJ2004[1]](https://static.fdokumen.com/doc/165x107/631c39e73e8acd997705cf6b/noahs-flood-wtj20041.jpg)