C-TAK1 Regulates Ras Signaling by Phosphorylating the MAPK Scaffold, KSR1
Upload
independentCategory
view
1download
0
BioMed CentralCardiovascular Diabetology
ss
Open AcceOriginal investigationDuration of streptozotocin-induced diabetes differentially affects p38-mitogen-activated protein kinase (MAPK) phosphorylation in renal and vascular dysfunctionHongmei Chen, Sachin Brahmbhatt, Akanksha Gupta and Avadhesh C Sharma*Address: Cardionome Laboratory, Department of Pharmaceutical Sciences, College of Pharmacy North Dakota State University, Fargo, ND 58105, USA
Email: Hongmei Chen - [email protected]; Sachin Brahmbhatt - [email protected]; Akanksha Gupta - [email protected]; Avadhesh C Sharma* - [email protected]
* Corresponding author
NIDDMthoracic aortakidney cortexkidney medullablood flownitric oxide synthaseendothelin-1signaling
AbstractBackground: In the present study we tested the hypothesis that progression of streptozotocin(STZ)-induced diabetes (14-days to 28-days) would produce renal and vascular dysfunction thatcorrelate with altered p38- mitogen-activated protein kinase (p38-MAPK) phosphorylation inkidneys and thoracic aorta.
Methods: Male Sprague Dawley rats (350–400 g) were randomized into three groups: sham (N =6), 14-days diabetic (N = 6) and 28-days diabetic rats (N = 6). Diabetes was induced using a singletail vein injection of STZ (60 mg/kg, I.V.) on the first day. Rats were monitored for 28 days and food,water intake and plasma glucose levels were noted. At both 14-days and 28-days post diabetesblood samples were collected and kidney cortex, medulla and aorta were harvested from each rat.
Results: The diabetic rats lost body weight at both 14-days (-10%) and 28-days (-13%) moresignificantly as compared to sham (+10%) group. Glucose levels were significantly elevated in thediabetic rats at both 14-days and 28-days post-STZ administration. Renal dysfunction as evidencedby renal hypertrophy, increased plasma creatinine concentration and reduced renal blood flow wasobserved in 14-days and 28-days diabetes. Vascular dysfunction as evidenced by decreased carotidblood flow was observed in 14-days and 28-days diabetes. We observed an up-regulation ofinducible nitric oxide synthase (iNOS), prepro endothelin-1 (preproET-1) and phosphorylated p38-MAPK in thoracic aorta and kidney cortex but not in kidney medulla in 28-days diabetes group.
Conclusion: The study provides evidence that diabetes produces vascular and renal dysfunctionwith a profound effect on signaling mechanisms at later stage of diabetes.
Published: 05 March 2005
Cardiovascular Diabetology 2005, 4:3 doi:10.1186/1475-2840-4-3
Received: 15 November 2004Accepted: 05 March 2005
This article is available from: http://www.cardiab.com/content/4/1/3
© 2005 Chen et al; licensee BioMed Central Ltd. This is an Open Access article distributed under the terms of the Creative Commons Attribution License (http://creativecommons.org/licenses/by/2.0), which permits unrestricted use, distribution, and reproduction in any medium, provided the original work is properly cited.
Page 1 of 13(page number not for citation purposes)

Cardiovascular Diabetology 2005, 4:3 http://www.cardiab.com/content/4/1/3
IntroductionDiabetes is a complex and multifarious group of disorderscharacterized by hyperglycemia that has reached epidemicproportions in the present century. Infection is a leadingcause of morbidity and mortality among the diabetic pop-ulation [1]. Diabetes is associated with vascular and renaldysfunction characterized by hypertension, dyslipidemia,microalbuminuria, macroalbuminuria and glomerularmesangial expansion [2,3].
Mitogen-activated protein kinases (MAPKs) are impli-cated in the etiology of diabetes [4,5]. MAPKs are serine-threonine protein kinases involved in cell survival, prolif-eration and apoptosis [6]. Three MAPK subfamilies havebeen well characterized: extracellular signal regulatedkinase 1 and 2 (ERK1/2), c-jun N-terminal kinases (JNK)and p38-MAPK [7]. ERK1/2 is involved in the growthresponse of cell while p38-MAPK and JNK are associatedwith cellular response to stress [7], inflammation [8] andvasoactive mediators such as endothelin-1 (ET-1) [9]. Alsop38-MAPK activation stimulates inducible nitric oxidesynthase (iNOS) expression in serum-deprived RAW264.7 cells [10]. These observations suggest that signalingmechanisms can regulate various vasoactive moleculesand vice-versa. However it is still not known if progressionof diabetes produces a time dependent activation of p38-MAPK in vascular blood vessels and kidneys. We speculatea differential regulation of p38-MAPK and ERK1/2 in tho-racic aorta and kidneys depending upon the duration andseverity of diabetes.
We have earlier demonstrated that diabetes during coro-nary artery bypass grafting, and chronic peritoneal sepsisproduced an imbalance in the myocardial and systemicET-1 and nitric oxide (NO) profiles [11,12]. However, theprofile of ET-1 during progression of diabetes is unclear.Diabetes, both type 1 and type 2, is associated withdecreased NO bioavailability [13,14]. Conflicting reports(i.e. increased, unchanged and decreased) exist regardingthe state of inducible nitric oxide synthase (iNOS) andendothelial NOS (eNOS) during diabetes [15,16]. Wehave earlier reported that elevation of ET-1 and NO mech-anisms, either systemically or locally in the myocardium,correlated well with the development of myocardial dys-function during sepsis [11] and make the heart suscepti-ble to myocardial injury [17]. We anticipate that theduration of hyperglycemia would differentially modulatesystemic and renal ET-1 and NO mechanisms.
We hypothesize that progression of diabetes [mild (14-days) to moderate (28-days)] would produce renal andvascular dysfunction that correlate with altered p38-MAPK phosphorylation in kidneys and thoracic aorta.Therefore, the specific aims of the study are to characterizethe progression of STZ-induced renal and vascular dys-
function at 14- and 28-days; and to examine if the pro-gression of STZ-induced diabetes would alter thebiosynthesis and activation of ET-1, NO and the phospho-rylation of p38-MAPK and ERK1/2 in thoracic aorta, kid-ney cortex and kidney medulla.
Materials and methodsMale Sprague-Dawley rats (Harlan, Indianapolis, IN)weighing 350–400 g were used in the study. The rats wereacclimatized to the laboratory conditions for at least 7days following their arrival. All animal experiments wereconducted in compliance with humane animal care stand-ards outlined in the NIH Guide for the Care and Use ofExperimental Animals, and were approved by the Institu-tional Animal Care and Use Committee of North DakotaState University.
Experimental ProtocolAll animals were age-matched at the onset of the study.The rats were randomly divided into three groups: con-trol, 14-days and 28-days diabetic rats (n = 6 for eachgroup).
Induction of diabetesDiabetes was produced by a single tail vein injection ofstreptozotocin (STZ; 60 mg/kg, I.V.) [15]. Diabetes wasconfirmed by blood glucose estimation (GlucometerElite®, Bayer Corporation, IN) 2 days after STZ-injection.Diabetes was confirmed if blood glucose > 200 mg/dL.The animals were not given insulin supplementation.Food intake and water intake were examined everydayafter STZ-injection.
The non-diabetic control rats received an injection of 1mL/kg saline. 14-days and 28-days post-STZ administra-tion recordings of systemic hemodynamics, carotid bloodflow, and renal arterial blood were done. Arterial bloodwas collected in plastic tubes containing EDTA (1 mg/mL)and heparin (5 units/mL) to determine the plasma con-centration of ET-1, NO by-products (NOx) and creatinine.The animals were euthanitized by pentobarbital (100 mg/kg, I.P.), the thoracic aorta and kidney were harvested. Theconcentration of ET-1, NOx, creatinine and proteinexpression of preproET-1, iNOS, eNOS, phosphorylatedp38-MAPK (pp38-MAPK), total p38-MAPK, phosphor-ylated ERK, total ERK were determined in the thoracicaorta, kidney cortex and kidney medulla obtained fromeach animal.
Surgical protocolSeparate group of animals (N = 6) were used for hemody-namic study. On the day of experiment, the rats were anes-thetized with an intraperitoneal injection of pentobarbitalsodium (Nembutal®, Abbott; 50 mg/kg).
Page 2 of 13(page number not for citation purposes)

Cardiovascular Diabetology 2005, 4:3 http://www.cardiab.com/content/4/1/3
Common carotid arterial blood flow measurement (acute)Under pentobarbital (50 mg/kg I.P.) anesthesia, rats wereplaced in dorsal recumbency and through a midline cervi-cal incision, the left common carotid artery was identifiedand carefully separated from adhering connective mate-rial. The carotid artery was cleared from the vagal nerveand a Transonic® flow probe (0.3 mm 1RB, Transonic Sys-tems Inc., Ithaca, NY) was placed carefully around theartery. The probe was manually positioned so that theartery was centered within its window and then probe washeld in position. Through a sterile 10 CC syringe loadedwith sterile K-Y brand lubricating jelly (Johnson & John-son, Arlington, TX), the acoustical window within theflow probe was filled while avoiding any air bubble.
Renal arterial blood flow measurement (acute)Under pentobarbital anesthesia, rats were place in dorsalrecumbency, and through a midline abdominal skin inci-sion the left renal artery was carefully separated from renalvein and a 0.5 VB Transonic® flow probe was placedaround it. The probe was manually positioned so that theartery is centered within the window and the probe washeld in position. The acoustical window within the flowprobe was filled with K-Y brand lubricating jelly (Johnson& Johnson, Arlington, TX). Renal and carotid artery bloodflow was measured using Transonic® flow meter T206attached to MP100 system of Biopac Systems Inc., CA viaanalog to digital conversion. The MP100 system was cali-brated with minimum and maximum flow capacity of theindividual probe connected to the flow meter. The sam-pling of data was carried out at 1000 Hz and recorded toa dedicated computer using AcqKnowledge™ software.
Biochemical estimationsDetermination of the concentration of plasma creatinineThe concentration of creatinine was determined in plasmausing creatinine liquid reagents (end-point, colorimetric,DIAZYME). The blood samples immediately after collec-tion were spun down at 5000 rpm for 10 minutes. Theplasma was then decanted and stored at -20°C until thetime of creatinine determination using manufacturer'sinstruction. Plasma concentration of creatinine (mg.dL-
1.Kg-1) normalized to individual rat body weight wascalculated.
Determination of the plasma concentration of ET-1The concentration of ET-1 was determined in plasma. Theblood samples were collected in plastic tubes containingEDTA (1 mg/mL) before euthanasia. The sample was cen-trifuged at 3,000 × g for 15 min at 4°C and plasma wasseparated and assayed for ET-1. Plasma was acidified add-ing an equal volume of 20% acetic acid. ET-1 like materialwas extracted from plasma [11] using C-18 SEP-Columns(Peninsula labs, CA). The recovery of ET from plasma wasapproximately 87%. Immunoassay (IA) was performed
using EIA kit for ET-1 (R and D systems, Minneapolis,MN). The assay was performed in microtiter plates coatedwith a rat antibody to human ET-1. Diluted anti-ET-1 HRPconjugate (100 µL) (ET-1 conjugated to horseradish per-oxidase) was added in each well. Standards (0.25 pg – 65pg ET-1), parameter control (24.5 ET-1 pg/ml) or sampleextract (100 µL, each) were added. The plates were cov-ered with plate sealers and incubated for 1 hr at room tem-perature. The contents of each well were aspirated andwashed using wash buffer provided with the kit. After thelast wash, contents of each well were decanted and tetram-ethylbenzidine (100 µL) was added. After 30 min, stopsolution (100 µL) containing 1 N HCl was added. Within30 min of addition of the stop solution, the optical den-sity of each well was measured using a micro plate readerat 450 (OD 450) and 620 (OD 620) nm separately. Astandard curve was created and the concentration of ET-1of each sample calculated and expressed as pg/ml ofplasma.
Determination of the concentration of nitric oxide byproducts (NOx)The concentration of endogenous NOX (nitrate + nitrite)was determined in plasma, thoracic aorta, kidney cortexand medulla. Blood (500 µL) was collected and 40 µL ofheparin was added to each sample to prevent clotting. Theblood sample was then decanted and stored at -20°C untilthe time of nitric oxide byproducts, (NO2 + NO3) NOx,determination. To determine the NOx level of thoracicaorta, kidney cortex and kidney medulla, those tissuesamples were harvested from each experimental rat andimmediately homogenized with cold phosphate bufferedsaline (PBS) on ice, which inhibited the activity of NOS exvivo. The homogenate was centrifuged (3000 × g, 5 min)and the supernatant was collected. The supernatantobtained from tissues and plasma was passed through a1.2 µm multiscreen filter plate. Plasma NOx and tissueNOx concentration was determined by using Greiss reac-tion [11,15]. 6 µL of plasma was mixed with 44 µl distilledH2O, 20 µl 0.31 M phosphate buffer (pH 7.5) and 10 µLeach of 0.86 mM NADPH (Sigma), 0.11 mM flavenidi-nine dinucleotide and 1.0 U/mL of nitrate reductase. NO3was converted to NO2 by nitrate reductase (BoehrigerMannheim). Unknown tissue samples were run in dupli-cate. The samples were allowed to incubate for 1 hr atroom temperature in the dark. Two hundred microliters ofGreiss reagent [1:1 mixture of 1% sulfanilamide in 5%H3PO3 and 0.1% N-(1-naphthyl) ethyl-enediamine] wereadded to each well and the plates were incubated for anadditional 10 min at room temperature. Absorbance wasmeasured at 540 nm using a plate reader and converted toNOx concentration using a nitrate standard curve andexpressed as µM in plasma and µmoles/g protein in tissue.Protein in the supernatant obtained from each samplewas determined using standard Lowry method.
Page 3 of 13(page number not for citation purposes)

Cardiovascular Diabetology 2005, 4:3 http://www.cardiab.com/content/4/1/3
Immunoblot AnalysisPreproET-1, iNOS, eNOS, total and phosphorylated p38-MAPK and ERK protein expressions of thoracic aorta, kid-ney cortex and kidney medulla were determined usingstandard SDS-PAGE and immunoblot technique. Briefly,thoracic aorta, kidney cortex and kidney medulla tissueswere homogenized in lysis buffer and centrifuged asdescribed by Pollack et al. [16]. The supernatants, at afinal protein content of 25 µl, were loaded to the gelsusing a 2:1 laemmli sample buffer (62.5 mM Tris-HCl, pH6.8, 25% glycerol, 2% SDS, 0.01% bromophenol blue and710 mM β-mercaptoethanol). The prepared samples wereelectrophoresed on 10% denaturing sodium dodecyl sul-fate (SDS) polyacrylamide gels. The proteins were trans-ferred electrophoretically onto polyvinylidene difluoride(PVDF) membrane (Gelman Sciences, Pierce, Rockford,IL). Non-specific binding sites on the membrane wereblocked overnight at 4°C with 5% nonfat dry milk in Tris-buffered saline containing Tween 20 (TBST, 20 mM Tris-HCl, 150 mM NaCl, 0.2% Tween 20, pH 7.4). The mem-branes were then probed with the primary antibody(Santa Cruz Biotechnology, Santa Cruz, CA) for 1 hr atroom temperature. The primary antibodies are highly spe-cific against the proteins studies and had no cross-reactiv-ity with related members. After five washings in TBST, themembranes were incubated with the secondary antibody(Sigma, St. Louis, MO) for 1 hr at room temperature.Finally membranes were washed three times with TBST.The specific proteins were detected by enhanced chemilu-minescence (ECL) reagent (Amersham Pharmacia Bio-tech). The blots were analyzed using Un-Scan-It™ softwareto estimate the density of the blots in pixels. Uniformloading was assessed by β-actin (Sigma) protein expres-sion. While analyzing the data for immunoblot analysis,the beta-actin blots for each gel were analyzed first to con-firm equal protein loading. Only after confirming thatthere was equal protein loading in the wells, as evidencedby no significant difference in pixel values of beta-actinblots, the bands for individual proteins were analyzed.
Statistical AnalysesAll the data were expressed as mean ± SEM. One-wayANOVA was performed to analyze the hemodynamic andbiochemical data using SPSS software. Following a signif-icant F value, a post hoc Students Newman Keuls test wasperformed for inter- and intra-group comparisons. Statis-tical significance was realized at p ≤ 0.05 to approve thenull hypothesis for individual parameters.
ResultsGeneral characteristics of the animalsAll control rats were freely moving in their individualcages through out the study. Although diabetic ratsappeared to be lethargic and displayed restricted move-ments, there was no sign of infection or motor disorder in
any of the rats studied. The food intake and water intakeof 14-days and 28-days diabetes groups were significantlyincreased as compared to control group (Fig 1).
The average body weight change, blood glucose and kid-ney weight/ 100 g body weight in all groups are summa-rized in Table 1. The body weight change (%) wassignificantly decreased in 14-days and 28-days diabetesgroups as compared to their age-matched control group.All STZ-treated rats were diabetic with mean blood glu-cose around 480 mg/dL. Blood glucose was significantlyelevated in 14-days diabetes and 28-days diabetes groupsas compared to their age-matched control group. Kidneyweight normalized to body weight was significantlygreater in diabetic (14-days and 28-days) rats than in con-trol rats. Plasma creatinine concentration was increased 3-fold in 14-days diabetes group and 2-fold in 28-days dia-betes group as compared to control group (Table 1). Dia-betes (14- and 28-days) produced no significant change inmean arterial pressure but caused a significant decrease inheart rate (Table 1).
Effect of STZ-induced diabetes on aortic and renal blood flowControl groups exhibited aortic and renal blood flow 10.8± 0.3 mL/min and 5.4 ± 0.1 mL/min, respectively. Induc-tion of diabetes produced a significant decrease in renal(Fig 2A) and carotid blood flow (Fig 2B) at both 14-daysand 28-days as compared to control group.
Effect of STZ-induced diabetes on the concentration of ET-1 in plasma and expression of preproET-1 in thoracic aorta, kidney cortex and medullaTo determine the effect of duration of diabetes (14-days to28-days) on aortic and renal ET-1 biosynthesis we deter-mined the concentration of ET-1 in plasma and expres-sion of ET-1 precursor, preproET-1 in thoracic aorta,kidney cortex and kidney medulla. A significant elevationin plasma ET-1 concentration was observed in 28-daysdiabetes as compared to 14-days diabetes and controlgroups (Fig 3A). We did not find any significant change inthe plasma concentration of ET-1 in 14-days diabetesgroup as compared to control group. The expression ofpreproET-1 was significantly increased in thoracic aorta in14-days and 28-days diabetes groups as compared to con-trol group (Fig 3B). We also found a significant increase inthe expression of preproET-1 in kidney cortex in 14-daysdiabetes groups as compared to control group. A signifi-cant increase in the protein expression of preproET-1 ofkidney cortex was observed in 28-days diabetes group ascompared to 14-days diabetes and control groups (Fig3C). Induction of diabetes did not produce any change inthe expression of preproET-1 in kidney medulla at 14-days and 28-days diabetes groups as compared to controlgroup (Fig 3D).
Page 4 of 13(page number not for citation purposes)

Cardiovascular Diabetology 2005, 4:3 http://www.cardiab.com/content/4/1/3
Food intake (gm/day) (A) and water intake (mg/day) (B) in controlFigure 1Food intake (gm/day) (A) and water intake (mg/day) (B) in control. 14-days and 28-days STZ-induced diabetes groups (N = 6 in each group); * p ≤ 0.05 Vs control group.
Food intake
0
10
20
30
40
50
60
1 3 5 7 9 11 13 15 17 19 21 23 25 27
Days
Fo
od
(gm
s/d
ay
)
Diabetes
Control
Water intake
0
50
100
150
200
250
300
1 3 5 7 9 11 13 15 17 19 21 23 25 27
Days
Wate
r(m
L/d
ay)
Diabetes
Control
(A)
(B)
* *
* *
Page 5 of 13(page number not for citation purposes)

Cardiovascular Diabetology 2005, 4:3 http://www.cardiab.com/content/4/1/3
Effect of STZ-induced diabetes on the concentration of NOx and expression of eNOS and iNOSA significant increase in the concentration of NOx inplasma of 28-days diabetes group as compared to the con-trol and 14-days diabetes groups was observed (Fig 4A).The NOx level was also elevated in thoracic aorta of 28-days diabetes group as compared to the control and 14-
days diabetes groups (Fig 4B). In kidney cortex, we alsofound that NOx level was significantly increased in 14-days and 28-days diabetes groups as compared to controlgroup (Fig 4C). But we did not find any significant changein kidney medulla of 14-days and 28-days diabetes groups(Fig 4D).
A significant up-regulation of eNOS and iNOS in thoracicaorta in 14-days and 28-days diabetes groups wasobtained as compared to control group (Fig 5A1–A3).Also in kidney cortex in 28-days diabetes, eNOS and iNOSwere significantly increased as compared to 14-days dia-betes and control groups. Protein expression of iNOS wasalso significantly increased in kidney cortex in 14-daysdiabetes group as compared to control group (Fig 5B1–B3). In kidney medulla we did not find any significantchange in eNOS and iNOS in 14-days and 28-days diabe-tes groups as compared to control group (Fig 5C1–C3).
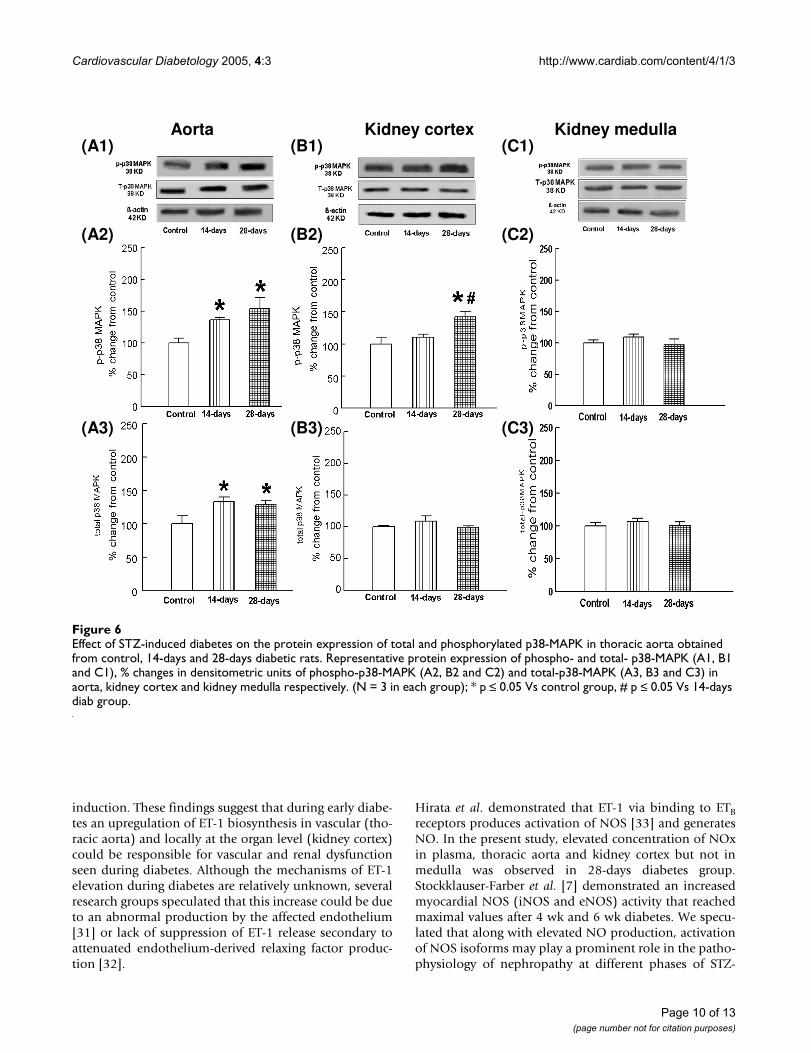
Effect of STZ-induced diabetes on the expression of total and phosphorylated p38-MAPK and ERK1/2 in thoracic aorta, kidney cortex and medullaTotal p38-MAPK and phosphorylated p38-MAPK proteinexpressions in thoracic aorta were significantly elevated in14-days and 28-days diabetes groups as compared to con-trol group (Fig 6A1–A3). Expression of phosphorylatedp38-MAPK was significantly increased in kidney cortexobtained from 28-days diabetes group as compared to 14-days diabetes and control groups. Total p38-MAPK wasnot altered in kidney cortex in 14-days and 28-days diabe-tes groups as compared to control group (Fig 6B1–B3). Inkidney medulla of 14-days and 28-days diabetes groupswe did not observe any significant change in total andphosphorylated p38-MAPK (Fig 6C1–C3).
A significant decrease in the expression of phosphorylatedERK 1/2 of thoracic aorta in 28-days diabetes group butnot in 14-days diabetes group was observed as comparedto control group. We found that total ERK 2 but not totalERK 1 was significantly increased in thoracic aorta in 14-days diabetes groups as compared to control group. Therewas no change in the expression of total ERK 1 in 14-days
Table 1: Effect of STZ-induced diabetes on percent body weight (BW) change, blood glucose levels (mg.dL-1), mean arterial pressure (mmHg), heart rate (beats per min), kidney weight/100 g BW, and plasma creatinine concentration (g.dL-1.kg-1 BW) at 14-days (Diab, 14-days) and 28-days (Diab, 28-days). (N = 6 in each group) * p ≤ 0.05 Vs control group.
Parameter Control Diab (14-days) Diab (28-days)
BW change (%) 10 ± 3 -10 ± 3* -13 ± 2*Blood glucose (mg.dL-1) 84 ± 2 480 ± 3* 486 ± 11*Mean arterial pressure (mmHg) 130 ± 3 120 ± 6 117 ± 2HR (Beats per min) 419 ± 5 326 ± 7* 339 ± 10*Kidney weight/100 g BW 0.72 ± 0.03 1.1 ± 0.05* 1.0 ± 0.03*Plasma creatinine (mg.dL-1.kg-1) 2.4 ± 0.5 6.4 ± 3.5 4.5 ± 3.5
Renal blood flow (mL/min) (A) and carotid blood flow (mL/min) (B) in control, 14-days and 28-days STZ-induced diabe-tes groups (N = 6 in each group); * p ≤ 0.05 Vs control groupFigure 2Renal blood flow (mL/min) (A) and carotid blood flow (mL/min) (B) in control, 14-days and 28-days STZ-induced diabe-tes groups (N = 6 in each group); * p ≤ 0.05 Vs control group.
(A)
(B)
Page 6 of 13(page number not for citation purposes)

Cardiovascular Diabetology 2005, 4:3 http://www.cardiab.com/content/4/1/3
and 28-days diabetes groups and ERK 2 in 28-days diabe-tes group as compared to control group (Fig 7A1–A3). Inkidney cortex phosphorylated ERK 1/2 protein expressionwas significantly elevated in 28-days diabetes group ascompared to 14-days diabetes and control groups. In kid-ney cortex, phosphorylated ERK 1/2 was significantly ele-vated in 14-days diabetes group as compared to controlgroup. Total ERK 1/2 was not altered in kidney cortex in14-days and 28-days diabetes groups (Fig 7B1–B3). Inaddition, in kidney medulla we did not observe any sig-nificant change in total and phosphorylated ERK 1/2 in14-days and 28-days diabetes group as compared to con-trol group (Fig 7C1–C3).
DiscussionSTZ has long been used as a drug of choice to induce type2 diabetes in various animal models. This well-establishedmodel is characterized by insulin deficiency associatedwith insulin resistance [18]. It was reported that a singleintravenous injection of STZ (55 mg/kg) could causeincreased plasma glucose levels, decrease in body weightand 17% mortality in rats [18]. In the present study, too,we have observed a mortality of 20% in 14-days diabetesgroup and 26% in 28-days diabetes group. STZ-treatedrats, post 48-h, were confirmed to be hyperglycemic, lostbody weight 10% and 13% in 14-days and 28-days diabe-tes groups respectively. Kavalali et al. [19] found that foodand water intake amount was higher in diabetic groups
The concentration of plasma ET-1 (pg.mL-1) in control, 14-days and 28-days STZ-induced diabetes groups (A) (N = 6 in each group)Figure 3The concentration of plasma ET-1 (pg.mL-1) in control, 14-days and 28-days STZ-induced diabetes groups (A) (N = 6 in each group). Effect of duration (14-days and 28-days) of STZ-induced diabetes on the expression of preproET-1 protein in thoracic aorta (B), in kidney cortex (C) and in kidney medulla (D) and % change in densitometric units of preproET-1 (N = 3 in each group); * p ≤ 0.05 Vs control group, # p ≤ 0.05 Vs 14-days diab group.
(C) Kidney cortex
(A) (B) Aorta
(D) Kidney medulla
Page 7 of 13(page number not for citation purposes)

Cardiovascular Diabetology 2005, 4:3 http://www.cardiab.com/content/4/1/3
than the control group. In our study too, we observed thatdiabetic rats had an increase in the food intake and waterintake following 14-days and 28-days of STZ-administra-tion. These observations suggested that single intravenousinjections of STZ (60 mg/kg) produced a reproducible andconsistent model of diabetes in our laboratory conditions.
Renal hypertrophy can be detected as early as one dayafter the onset of diabetes and seen regularly post 60-hr ofsingle STZ injection [20]. It has been reported that diabe-tes-induced renal hypertrophy produces increased dimen-sions of renal cells along with increased kidney weight[21]. In the present study, we observed an elevated kidneyweight corrected by body weight in diabetic (14-days and
28-days) rats suggesting that STZ-induced diabetes pro-duced renal hypertrophy. We also observed that both 14-and 28-days diabetic rats exhibited reduced renal bloodflow along with 3-2 fold increase in plasma creatinineconcentration. Umerani and Goyal [22] demonstrated anincrease in serum creatinine as an indicator of deterio-rated renal function in diabetic rats. Similar to our results,Itoh and coworkers [23] also demonstrated that serumcreatinine levels in control group and diabetes group var-ied from 0.8 to 1.4 mg/dl respectively. Thus the resultsobtained in our study provide evidence for diabetes-induced renal dysfunction in the rat.
Effect of STZ-induced diabetes on the plasma (A), thoracic aorta (B), kidney cortex (C) and kidney medulla (D) concentration of nitric oxide byproducts (NOx) in control, 14-days and 28-days diabetic ratsFigure 4Effect of STZ-induced diabetes on the plasma (A), thoracic aorta (B), kidney cortex (C) and kidney medulla (D) concentration of nitric oxide byproducts (NOx) in control, 14-days and 28-days diabetic rats. (N = 6 in each group); * p ≤ 0.05 Vs control group, # p ≤ 0.05 Vs 14-days diab group.
(A) (B)
(C) (D)
Page 8 of 13(page number not for citation purposes)

Cardiovascular Diabetology 2005, 4:3 http://www.cardiab.com/content/4/1/3
ET-1, a potent vasoconstrictor peptide, has been impli-cated in diabetes and cardiovascular disorders. Elevated,unchanged and attenuated plasma ET-1 levels have beenreported during diabetes [24-27]. Although the reason forsuch a variation in findings appears difficult to fathom,the discrepancies in data may be attributed to differencesin species of animals, duration of hyperglycemia, dose ofSTZ administered etc. In the present study, we observeddecreased aortic and renal blood flow in both 14-days and28-days diabetics rats. However elevation of ET-1 andNOx in plasma was seen only in 28-days diabetic ratsgroup but not in 14 days-diabetes group. Taken together,these observations suggest that STZ-induced hyperglyc-emia produced alterations in the systemic and regional
blood flow, which could be due to altered systemic levelsof ET-1 and NO. Makino et al. [27] demonstrated upregu-lated preproET-1 mRNA in the aorta from STZ-induceddiabetic rats. They suggested that increased release of ET-1from the aorta contributes to enhanced plasma level ofET-1 seen in diabetic rats. Also ET-1 concentration hasbeen shown to increase in kidneys [28] following diabe-tes. Since ET-1 exists not only in the vascular endothelialcells but also in the mesangial cells or tubular cells, thisincrease in ET-1 could be attributed to increased biosyn-thesis of ET-1 in the renal cells [28-30]. In the presentstudy, we also observed an elevated expression of pre-proET-1 proteins in aorta and kidney cortex but not inkidney medulla at 14-days and 28-days following diabetes
Effect of STZ-induced diabetes on the protein expression of iNOS and eNOS in thoracic aorta obtained from control, 14-days and 28-days diabetic ratsFigure 5Effect of STZ-induced diabetes on the protein expression of iNOS and eNOS in thoracic aorta obtained from control, 14-days and 28-days diabetic rats. Representative protein expression of inducible- and endothelial-NOS (A1), % change in densitomet-ric units of eNOS (A2) and iNOS (A3) in aorta, eNOS (B2) and iNOS (B3) in kidney cortex and eNOS (C2) and iNOS (C3) in kidney medulla. (N = 3 in each group); * p ≤ 0.05 Vs control group, # p ≤ 0.05 Vs 14-days diab group.
Aorta Kidney cortex Kidney medulla
(A2)
(A3)
(A1) (C1)(B1)
(B2)
(B3)
(C2)
(C3)
Page 9 of 13(page number not for citation purposes)
Cardiovascular Diabetology 2005, 4:3 http://www.cardiab.com/content/4/1/3
induction. These findings suggest that during early diabe-tes an upregulation of ET-1 biosynthesis in vascular (tho-racic aorta) and locally at the organ level (kidney cortex)could be responsible for vascular and renal dysfunctionseen during diabetes. Although the mechanisms of ET-1elevation during diabetes are relatively unknown, severalresearch groups speculated that this increase could be dueto an abnormal production by the affected endothelium[31] or lack of suppression of ET-1 release secondary toattenuated endothelium-derived relaxing factor produc-tion [32].
Hirata et al. demonstrated that ET-1 via binding to ETBreceptors produces activation of NOS [33] and generatesNO. In the present study, elevated concentration of NOxin plasma, thoracic aorta and kidney cortex but not inmedulla was observed in 28-days diabetes group.Stockklauser-Farber et al. [7] demonstrated an increasedmyocardial NOS (iNOS and eNOS) activity that reachedmaximal values after 4 wk and 6 wk diabetes. We specu-lated that along with elevated NO production, activationof NOS isoforms may play a prominent role in the patho-physiology of nephropathy at different phases of STZ-
Effect of STZ-induced diabetes on the protein expression of total and phosphorylated p38-MAPK in thoracic aorta obtained from control, 14-days and 28-days diabetic ratsFigure 6Effect of STZ-induced diabetes on the protein expression of total and phosphorylated p38-MAPK in thoracic aorta obtained from control, 14-days and 28-days diabetic rats. Representative protein expression of phospho- and total- p38-MAPK (A1, B1 and C1), % changes in densitometric units of phospho-p38-MAPK (A2, B2 and C2) and total-p38-MAPK (A3, B3 and C3) in aorta, kidney cortex and kidney medulla respectively. (N = 3 in each group); * p ≤ 0.05 Vs control group, # p ≤ 0.05 Vs 14-days diab group.
Aorta Kidney cortex Kidney medulla
(A2)
(A3)
(A1) (C1)(B1)
(B2)
(B3)
(C2)
(C3)
Page 10 of 13(page number not for citation purposes)

Cardiovascular Diabetology 2005, 4:3 http://www.cardiab.com/content/4/1/3
induced diabetes [34,35]. Increased expression of eNOSin afferent arterioles and glomeruli was found by Sugim-oto et al. [36]. In a previous study, these authors demon-strated an enhanced renal expression of iNOS 5 days postdiabetes that was sustained for 20 days, while eNOS andnNOS were not altered [37]. We also observed that theprogression of diabetes from 14-days to 28-days upregu-lated iNOS and eNOS in thoracic aorta and kidney cortexwhile decreasing aortic and renal blood flow that corre-lated well with systemic and local increase in NOx levelsin thoracic aorta. This suggests that NO stimulation inthoracic aorta and kidney cortex occurs with increasedduration of hyperglycemia in STZ-induced diabetic rats.Since in the present study both ET-1 and NOS activation
exhibit a similar course in 28-days diabetic rats, we specu-late that NOS stimulation could be due to activation ofETB receptors via elevated ET-1 mechanisms. However,further studies will be required to strengthen thisspeculation.
Signaling mechanisms in diabetesHyperglycemia has been shown to phosphorylate ERK1/2in rat glomerular and mesangial cells [38] and p38-MAPKin vascular smooth muscle cells and aorta in derived fromdiabetic rats [39]. Pearson et al. [40] and Tian et al. [41]demonstrated that ET-1 stimulation of mesangial cell(MC) proliferation involves several pathways, amongwhich MAPK figures prominently. In the present study, we
Effect of STZ-induced diabetes on the protein expression of total and phosphorylated ERK 1/2 in thoracic aorta obtained from control, 14-days and 28-days diabetic ratsFigure 7Effect of STZ-induced diabetes on the protein expression of total and phosphorylated ERK 1/2 in thoracic aorta obtained from control, 14-days and 28-days diabetic rats. Representative protein expression of phospho- and total-ERK (A1, B1 and C1), % changes in densitometric units of p-ERK (A2, B2 and C2) and Total-ERK (A3, B3 and C3) in aorta, kidney cortex and kidney medulla respectively. (N = 3 in each group); * p ≤ 0.05 Vs control group, # p ≤ 0.05 Vs 14-days diab group.
Aorta Kidney cortex Kidney medulla
(A2)
(A3)
(A1) (C1)(B1)
(B2)
(B3)
(C2)
(C3)
Page 11 of 13(page number not for citation purposes)

Cardiovascular Diabetology 2005, 4:3 http://www.cardiab.com/content/4/1/3
observed that 14-days diabetes up-regulated phosphor-ylated p38-MAPK but not ERK1/2 in thoracic aorta. Wealso observed down-regulation of phosphorylated ERK 1/2 in thoracic aorta post 28-days diabetes. In kidney cortexalthough p38-MAPK was not altered post 14-days diabeticgroup, ERK1/2 is elevated. This suggests that ERK1/2phosphorylation predominate during 14-days diabetes inkidney cortex but not in thoracic aorta, while both p38-MAPK and ERK1/2 remain unaffected in kidney medulla.
Both in vivo and in vitro results suggest that ERK andp38MAPK may be involved in high-glucose-induced cel-lular hypertrophy [42]. In the present study, we observedthat ERK1/2 precedes p38-MAPK phosphorylationdepending upon the progression of diabetes from 14-daysto 28-days. We observed a profound increase in plasmaNOx levels and iNOS expression with a correspondingincrease in p38-MAPK activation in kidney cortex and tho-racic aorta during 28-days diabetes. We propose that p38-MAPK activation could be an important signaling mecha-nism that causes iNOS activation as was reported by Liu etal. [14]. We speculate that activated p38-MAPK and iNOSmechanisms outweigh ERK1/2 mechanisms in kidneycortex and thoracic aorta during moderate diabetes. Asimilar finding, though not directly related to the presentstudy, was shown by Purves et al. [43] where theydemonstrated using cultured sensory neurons that co-treatment with high glucose and oxidative stress results inan additive effect on p38-MAPK phosphorylation withoutaffecting ERK1/2 activation. The findings of the presentstudy suggested that phosphorylation of p38-MAPK andnot ERK1/2 was associated with iNOS activation and renaland vascular dysfunction following 28-days of STZ-induced hyperglycemia.
The results obtained in the present study characterize theSTZ (60 mg/kg, I.V.)-induced diabetic rat model in ourlaboratory. The marked characteristics of diabetic ratmodel include weight loss, increase food and waterintake, and bradycardia. STZ-induced diabetes, both at14-days and 28-days, produced renal dysfunction and vas-cular dysfunction that correlated well with levels of ET-1and NOx and expression of preproET-1 and NOS proteinsin kidney cortex and thoracic aorta. The data obtained inthe present study demonstrate that progression of diabe-tes from 14-days to 28-days caused a factorial increase inp38-MAPK phosphorylation along with NOS upregula-tion in kidney cortex and thoracic aorta. The studyprovides evidence that diabetes produces vascular andrenal dysfunction with a profound effect on signalingmechanisms at later stage of diabetes. However, morestudies will be required to further delineate the inherentlink or interaction between p38-MAPK upregulation, ET-1and NO mechanisms and development of renal and vas-cular dysfunction during diabetes.
AcknowledgementsFirst two authors contributed equally in this study. This work was sup-ported by Beginning Grant-in Aid Award from American Heart Association Northland Affiliate, Academic Research Enhancement Award from National Institutes of Health-National Heart, Lung and Blood Institute grant No. HL 066016 and NDEPSCOR, National Science Foundation (ACS), Presidential Fellowship (AG) and fellowship to SB was provided from the funds obtained from National Institutes of Health-National Center for Research Resources 1 P20RR15566.
References1. Hostetter MK: Handicaps to host defense: effects of hypergly-
cemia on C3 and Candida albicans. Diabetes 1990, 39:271-275.2. Feener EP, King GL: Vascular dysfunction in diabetes mellitus.
Lancet 1997, 350 Suppl 1:SI9-SI13.3. Carey RM, Siragy HM: The intrarenal renin-angiotensin system
and diabetic nephropathy. Trends in Endocrinology and Metabolism2003, 14:274-281.
4. Johnstone MT, Creager SJ, Scales KM, Cusco JA, Lee BK, Creager MA:Impaired endothelium-dependent vasodilation in patientswith insulin-dependent diabetes mellitus. Circulation 1993,88:2510-2516.
5. Fogelson BG, Nawas SI, Vigneswaran WT, Ferguson JL, Law WR,Sharma AC: Diabetic patients produce an increase in coronarysinus endothlin-1 after coronary artery bypass grafting. Diabe-tes 1998, 47:1161-1163.
6. Williams SB, Cusco JA, Roddy MA, Johnstone MT, Creager MA:Impaired nitric oxide-mediated vasodilation in patients withnon-insulin-dependent diabetes mellitus. J Am Coll Cardiol 1996,27:567-574.
7. Stockklause-Farber K, Balhausen T, Laufer A, Rosen P: Influence ofdiabetes on cardiac nitric oxide synthase expression andactivity. Biochim Biophys Acta 2000, 1535:10-20.
8. Zhao G, Zhang X, Smith CJ, Xu X, Ochoa M, Greenhouse D, VogelT, Curran C, Hintze TH: Reduced coronary NO production inconscious dogs after the development of alloxan-induceddiabetes. Am J Physiol 1999, 277:H268-278.
9. Tsuneo K, Katsuo K: Effect of chronic insulin treatment on NOproduction and endothelium-dependent relaxation in aortaefrom established STZ-induced diabetes rats. Atherosclerosis2001, 155:313-320.
10. Kumar S, Boehm J, Lee JC: p38 MAP kinases: key signaling mol-ecules as therapeutic targets for inflammatory diseases. NatRev Drug Discov 2003, 2:717-726.
11. Sharma AC, Motew SJ, Farias S, Alder KJ, Bosmann HB, Law WR, Fer-guson JL: Sepsis alters myocardial and plasma concentrationsof endothelin and nitric oxide in rats. J Mol Cell Cardiol 1997,29:1469-1477.
12. Sharma AC, Fogelson BG, Nawas SI, Vigneswaran WT, Sam AD II,Alden KJ, Ferguson JL, Law WR: Elevated coronary endothelin-1but not nitric oxide in diabetics during CABG. Ann Thorac Surg1999, 67:1659-63.
13. Clerk A, Michael A, Sugden PH: Stimulation of the p38 mitogen-activated protein kinase pathway in neonatal rat ventricularmyocytes by the G protein-coupled receptor agonists,endothelin-1 and phenylephrine: a role in cardiac myocytehypertrophy? J Cell Biol 1998, 142:523-535.
14. Liu W, Kato M, Itoigawa M, Murakami H, Yajima M, Wu J, Ishikawa N,Nakashima I: Distinct involvement of NF-kB and p38 mitogen-activated protein kinase pathways in serum deprivation-mediated stimulation of inducible nitric oxide synthase andits inhibition by 4-hydroxynoneal. J Cell Biochem 2001,83:271-280.
15. Gupta A, Brahmbhatt S, Sharma AC: Left ventricular mitogenactivated protein kinase signaling following polymicrobialsepsis during streptozotocin-induced hyperglycemia. BiochimBiophys Acta 2004, 1690:42-53.
16. Pollack JS, Nakane M, Buttery LDK, Martinez A, Springdall JM, PolakJM, Forstermann U, Murad F: Characterization and localizationof endothelial nitric oxide synthase using specific mono-clonal antibodies. Am J Physiol 1993, 265:C1379-C1387.
17. Le-Marchand-Brustel Y, Freychet P: Effect of fasting and strepto-zotocin diabetes insulin binding and action in the isolatedmouse soleus muscle. J Clin Invest 1979, 64:1505-1515.
Page 12 of 13(page number not for citation purposes)

Cardiovascular Diabetology 2005, 4:3 http://www.cardiab.com/content/4/1/3
Publish with BioMed Central and every scientist can read your work free of charge
"BioMed Central will be the most significant development for disseminating the results of biomedical research in our lifetime."
Sir Paul Nurse, Cancer Research UK
Your research papers will be:
available free of charge to the entire biomedical community
peer reviewed and published immediately upon acceptance
cited in PubMed and archived on PubMed Central
yours — you keep the copyright
Submit your manuscript here:http://www.biomedcentral.com/info/publishing_adv.asp
BioMedcentral
18. Bar-On H, Roheim PS, Eder HE: Hyperlipoproteinemia in strep-tozotocin-treated rats. Diabetes 1976, 25:509-515.
19. Kavalali G, Tuncel H, Goksel S, Hatemi HH: Hypoglycemic activityof Urtica pilulifera in streptozotocin-diabetic. Ethnopharmacol2003, 84:241-245.
20. Seyer-Hansen K: Renal hypertrophy in streptozotocin diabeticrats. Clin Sci Mol Med Suppl 1976, 51:551-555.
21. Tang D, Yu T, Khraibi AA: Cardiovascular and renal character-istics, and responses to acute volume expansion of a ratmodel of diabetic pregnancy. Life sciences 2004, 74:2909-2918.
22. Umrani DN, Goyal RK: Fenoldopam treatment improvesperipheral insulin sensitivity and renal function in STZ-induced type 2 diabetic rats. Clin Exp Hypertension 2003,25:221-233.
23. Itoh Y, Imamura S, Yamamoto K, Ono Y, Nagata M, Kobayashi T,Kato T, Tomita M, Nakai A, Itoh M, Nagasaka A: Changes ofendothelin in streptozotozin-induced diabetic rats: effects ofan angiotensin converting enzyme inhibitor, enalaprilmaleate. Endocrin 2002, 175:233-239.
24. Fujii K, Soma M, Huang YS, Manku MS, Horrobin DF: Increasedrelease of prostaglandins from mesenteric vascular bed ofdiabetic animals. The effects of glucose and insulin. Prostaglan-dins Leulptroenes Med 1986, 24:51-161.
25. Takahashi K, Ghatei MA, Lam HC, O' Halloran DJ, BloomS R: Ele-vated plasma endothelin in patients with diabetes mellitus.Diabetologia 1990, 33:306-310.
26. Haak T, Jungmann E, Felber A, Hillmann U, Usadel KH: Increasedplasma levels of endothelin in diabetic patients withhypertension. Am J Hypertens 1992, 5:161-166.
27. Makino A, Oda Shu-Ichi, Katsuo K: Mechanisms underlyingincreased release of endothelin-1 from aorta in diabetic rats.Peptides 2001, 22:639-645.
28. Kosaka T, Suzuki N, Matsumoto H, Itoh Y, Yasuhara T, Onda H,Fujino M: Synthesis of the vasoconstrictor peptide endothelinin kidney cells. FEBS Letters 1989, 249:42-46.
29. Simonson MS, Dunn MJ: Endothelin-1 stimulates contraction ofrat glomerular mesangial cells and potentiates beta-adren-ergic-mediated cyclic adenosine monophosphateaccumulation. Journal of Clinical Investigation 1990, 85:790-797.
30. Kohan DE: Endothelin synthesis by rabbit renal tubule cells.Am J Physiol 1991, 261:F221-F226.
31. Vermes I, Spooren PF, Kalsbeek-Batenburg EM, Haanen C: In addi-tion to von Willebrand factor and urinary albumin excretion,plasma endothelin is an indicator of endothelial dysfunctionin diabetes mellitus. Diabetologia 1993, 36:472-473.
32. Boulanger C, Luscher TF: Release of endothelin from the por-cine aorta. Inhibition by endothelium-derived nitric oxide. JClin Invest 1990, 85:587-590.
33. Hirata Y, Emori T, Eguchi S: Endothelin receptor subtype Bmediates synthesis of nitric oxide by cultured bovineendothelial cells. J Clin Invest 1993, 91:1367-1372.
34. Craven PA, DeRubertis FR, Melhem M: Nitric Oxide in diabeticnephropathy. Kidney Int Suppl 1997, 52:S46-S53.
35. Trachtman H, Futterweit S, Pine E, Mann J, Elsa V: Chronic diabeticnephropathy: role of inducible nitric oxide synthase. PediatrNephrol 2002, 17:20-29.
36. Sugimoto H, Shikaka K, Matsuda M, Kushiro M, Hayashi Y, HiragushiK, Wada J, Makino H: Increased expression of endothelial cellnitric oxide synthase in afferent and glomerular hyperfil-traion of diabetic nephropathy. Diabetologia 1998, 41:1426-1434.
37. Cosenzi A, bernobich E, Bonavita M, Trevisan R, Bellini G, Campan-acci L: Early effects of diabetes on inducible nitric oxide syn-thase in the kidney. Acta Diabetol 2002, 39:91-92.
38. Haneda M, Araki S, Togawa M, Sugimoto T, Isono M, Kikkawa R:Mitogen-activated protein kinase cascade is activated inglomeruli of diabetic rats and glomerular mesangial cells cul-tured under high glucose conditions. Diabetes 1997, 46:847-853.
39. Igarashi M, Wakasaki N, Takahara N, Ishii H, Jiang ZY, Yamauchi T,Kuboki K, Meier M, Rhodes CJ, King GL: Glucose or diabetes acti-vates p38 mitogen-activated protein kinase via differentpathways. J Clin Invest 1999, 103:185-195.
40. Pearson G, Robinson F, Beers G, Xu B, Karandikar M, Berman K,Cobb M: Mitogen-activated protein (MAP) kinase pathways:regulation and physiological functions. Endocr Rev 2001,22:153-183.
41. Tian W, Zhang Z, Cohen D: MAPK signaling and the kidney. AmJ Physiol Renal Physiol 2000, 279:F593-F604.
42. Fujita H, Omori S, Ishikura K, Hida M, Awazu M: ERK and p38mediate high-glucose-induced hypertrophy and TGF-βexpression in renal tubular cells. Am J Physiol Renal Physiol 2004,286:F120-126.
43. Purves T, Middlemas A, Agthong S, Jude EB, Boulton AJ, FernyhoughDR, Tomlinson DR: A role for mitogen-activated proteinkinases in the etiology of diabetic neuropathy. FASEB J 2001,15:2508-2514.
Page 13 of 13(page number not for citation purposes)
Copyright © 2022 FDOKUMEN