Drawing Area-Proportional 3-Venn Diagrams Using Ellipses
18
eulerAPE: Drawing Area-Proportional 3-Venn Diagrams Using Ellipses Luana Micallef* ¤ , Peter Rodgers Abstract Venn diagrams with three curves are used extensively in various medical and scientific disciplines to visualize relationships between data sets and facilitate data analysis. The area of the regions formed by the overlapping curves is often directly proportional to the cardinality of the depicted set relation or any other related quantitative data. Drawing these diagrams manually is difficult and current automatic drawing methods do not always produce appropriate diagrams. Most methods depict the data sets as circles, as they perceptually pop out as complete distinct objects due to their smoothness and regularity. However, circles cannot draw accurate diagrams for most 3-set data and so the generated diagrams often have misleading region areas. Other methods use polygons to draw accurate diagrams. However, polygons are non-smooth and non-symmetric, so the curves are not easily distinguishable and the diagrams are difficult to comprehend. Ellipses are more flexible than circles and are similarly smooth, but none of the current automatic drawing methods use ellipses. We present eulerAPE as the first method and software that uses ellipses for automatically drawing accurate area-proportional Venn diagrams for 3-set data. We describe the drawing method adopted by eulerAPE and we discuss our evaluation of the effectiveness of eulerAPE and ellipses for drawing random 3-set data. We compare eulerAPE and various other methods that are currently available and we discuss differences between their generated diagrams in terms of accuracy and ease of understanding for real world data. Citation: Micallef L, Rodgers P (2014) eulerAPE: Drawing Area-Proportional 3-Venn Diagrams Using Ellipses. PLoS ONE 9(7): e101717. doi:10.1371/journal.pone. 0101717 Editor: Hans A. Kestler, University of Ulm, Germany Received February 2, 2014; Accepted June 10, 2014; Published July 17, 2014 Copyright: ß 2014 Micallef, Rodgers. This is an open-access article distributed under the terms of the Creative Commons Attribution License, which permits unrestricted use, distribution, and reproduction in any medium, provided the original author and source are credited. Funding: The authors are employed by the School of Computing, University of Kent, UK (http://www.cs.kent.ac.uk) and thus, this research was fully funded by the School. The funders had no role in study design, data collection and analysis, decision to publish, or preparation of the manuscript. Competing Interests: The authors have declared that no competing interests exist. * Email: [email protected] ¤ Current address: Helsinki Institute for Information Technology, Aalto University, Helsinki, Finland Introduction Data is routinely generated and analysed. For instance, relationships between groups of genes are studied to understand biological processes, improve health care, find cures to illnesses, and solve problems in agriculture. To aid analysis, Venn diagrams are often used. Each data set is represented by a closed curve and each set relation is represented by one of the spatial relationships between the curves. Both the curves and their spatial relationships are often easily visible, as closed curves are processed preatten- tively and pop out as complete distinct objects [1], particularly when the curves are smooth and have good continuation [2]. Closed curves also aid set analysis due to the perceptual grouping principles of common regions [3] and closure [4]. A Venn diagram with n curves is referred to as an n-Venn diagram and its regions depict all of the 2 n different combinations of the curve overlaps. A Venn diagram can also be area- proportional, such that the area of each region in the diagram is directly proportional to quantitative data corresponding to the depicted set relation [5]. Size is processed preattentively [6] and is easily noticeable due to its pop-out effect [7]. Thus, a Venn diagram can easily depict the data set relations as well as their cardinality or other associated quantitative data. Small multiples of such diagrams can also facilitate the analysis of a collection of data sets for different attributes (e.g., Venn diagrams depicting overlapping disease symptoms for different countries [8]; [9,10]). Consequently, area-proportional 3-Venn diagrams have been used to, for instance: compare the cell-type of differentially regulated genes after an anti-cancer drug treatment [11] (Figure 1A); summarize prognostic indicators of severe malaria [12] (Figure 1B); analyse differences and similarities between chicken egg white proteome in three different studies [13] (Figure 1C) and between gene libraries [14] (Figure 1D); study transcriptome variation of different tissue types of the male field cricket [15] (Figure 1E); summarize genes affecting DNA damage in three different studies [16] (Figure 1F). Such diagrams have also been used in various other disciplines, such as: neuroscience [17]; biosciences [18]; microbiology [19]; botany [20]; ecology [21]; public health [22]; museum conservation [23]; criminology [24]; information search and filtering [25]. Scientific work that specifically focuses on the generation of an area-proportional Venn diagram for the quantification of the relationships between studied data sets is also available (e.g., [26–28]). An informal study identified various area-proportional Venn diagrams in the world’s most cited journals (e.g., Nature) [29]. Almost all of these diagrams have two or three curves and are drawn using circles. Most of those with three circles are misleading and depict the required data inappropriately, like Figure 1A–C. For instance: in Figure 1A, the region with value 45 is bigger than those with value 53 and 54; in Figure 1B, the region with value 25 is bigger than that with value 36; in Figure 1C, the region with PLOS ONE | www.plosone.org 1 July 2014 | Volume 9 | Issue 7 | e101717 School of Computing, University of Kent, Canterbury, Kent, United Kingdom
-
Upload
khangminh22 -
Category
Documents
-
view
0 -
download
0
Transcript of Drawing Area-Proportional 3-Venn Diagrams Using Ellipses

eulerAPE: Drawing Area-Proportional 3-Venn DiagramsUsing EllipsesLuana Micallef*¤, Peter Rodgers
Abstract
Venn diagrams with three curves are used extensively in various medical and scientific disciplines to visualize relationshipsbetween data sets and facilitate data analysis. The area of the regions formed by the overlapping curves is often directlyproportional to the cardinality of the depicted set relation or any other related quantitative data. Drawing these diagramsmanually is difficult and current automatic drawing methods do not always produce appropriate diagrams. Most methodsdepict the data sets as circles, as they perceptually pop out as complete distinct objects due to their smoothness andregularity. However, circles cannot draw accurate diagrams for most 3-set data and so the generated diagrams often havemisleading region areas. Other methods use polygons to draw accurate diagrams. However, polygons are non-smooth andnon-symmetric, so the curves are not easily distinguishable and the diagrams are difficult to comprehend. Ellipses are moreflexible than circles and are similarly smooth, but none of the current automatic drawing methods use ellipses. We presenteulerAPE as the first method and software that uses ellipses for automatically drawing accurate area-proportional Venndiagrams for 3-set data. We describe the drawing method adopted by eulerAPE and we discuss our evaluation of theeffectiveness of eulerAPE and ellipses for drawing random 3-set data. We compare eulerAPE and various other methods thatare currently available and we discuss differences between their generated diagrams in terms of accuracy and ease ofunderstanding for real world data.
Citation: Micallef L, Rodgers P (2014) eulerAPE: Drawing Area-Proportional 3-Venn Diagrams Using Ellipses. PLoS ONE 9(7): e101717. doi:10.1371/journal.pone.0101717
Editor: Hans A. Kestler, University of Ulm, Germany
Received February 2, 2014; Accepted June 10, 2014; Published July 17, 2014
Copyright: � 2014 Micallef, Rodgers. This is an open-access article distributed under the terms of the Creative Commons Attribution License, which permitsunrestricted use, distribution, and reproduction in any medium, provided the original author and source are credited.
Funding: The authors are employed by the School of Computing, University of Kent, UK (http://www.cs.kent.ac.uk) and thus, this research was fully funded bythe School. The funders had no role in study design, data collection and analysis, decision to publish, or preparation of the manuscript.
Competing Interests: The authors have declared that no competing interests exist.
* Email: [email protected]
¤ Current address: Helsinki Institute for Information Technology, Aalto University, Helsinki, Finland
Introduction
Data is routinely generated and analysed. For instance,
relationships between groups of genes are studied to understand
biological processes, improve health care, find cures to illnesses,
and solve problems in agriculture. To aid analysis, Venn diagrams
are often used. Each data set is represented by a closed curve and
each set relation is represented by one of the spatial relationships
between the curves. Both the curves and their spatial relationships
are often easily visible, as closed curves are processed preatten-
tively and pop out as complete distinct objects [1], particularly
when the curves are smooth and have good continuation [2].
Closed curves also aid set analysis due to the perceptual grouping
principles of common regions [3] and closure [4].
A Venn diagram with n curves is referred to as an n-Venn
diagram and its regions depict all of the 2n different combinations
of the curve overlaps. A Venn diagram can also be area-proportional, such that the area of each region in the diagram is
directly proportional to quantitative data corresponding to the
depicted set relation [5]. Size is processed preattentively [6] and is
easily noticeable due to its pop-out effect [7]. Thus, a Venn
diagram can easily depict the data set relations as well as their
cardinality or other associated quantitative data. Small multiples of
such diagrams can also facilitate the analysis of a collection of data
sets for different attributes (e.g., Venn diagrams depicting
overlapping disease symptoms for different countries [8]; [9,10]).
Consequently, area-proportional 3-Venn diagrams have been
used to, for instance: compare the cell-type of differentially
regulated genes after an anti-cancer drug treatment [11]
(Figure 1A); summarize prognostic indicators of severe malaria
[12] (Figure 1B); analyse differences and similarities between
chicken egg white proteome in three different studies [13]
(Figure 1C) and between gene libraries [14] (Figure 1D); study
transcriptome variation of different tissue types of the male field
cricket [15] (Figure 1E); summarize genes affecting DNA damage
in three different studies [16] (Figure 1F). Such diagrams have also
been used in various other disciplines, such as: neuroscience [17];
biosciences [18]; microbiology [19]; botany [20]; ecology [21];
public health [22]; museum conservation [23]; criminology [24];
information search and filtering [25]. Scientific work that
specifically focuses on the generation of an area-proportional
Venn diagram for the quantification of the relationships between
studied data sets is also available (e.g., [26–28]).
An informal study identified various area-proportional Venn
diagrams in the world’s most cited journals (e.g., Nature) [29].
Almost all of these diagrams have two or three curves and are
drawn using circles. Most of those with three circles are misleading
and depict the required data inappropriately, like Figure 1A–C.
For instance: in Figure 1A, the region with value 45 is bigger than
those with value 53 and 54; in Figure 1B, the region with value 25
is bigger than that with value 36; in Figure 1C, the region with
PLOS ONE | www.plosone.org 1 July 2014 | Volume 9 | Issue 7 | e101717
School of Computing, University of Kent, Canterbury, Kent, United Kingdom

value 3 is much smaller than that with value 4. In some cases, the
generated diagrams do not depict all the required overlaps
between the curves, as demonstrated in Section 4.3 and Section
4.4.
Such area-proportional Venn diagrams cannot be drawn
analytically using a specific curve shape and so numerical methods
or heuristics are required [30]. Circles can draw Venn diagrams
with region areas that are proportional to any data with two sets
[5], but not three [30] due to their limited degrees of freedom (i.e.,
a centre and a radius). Polygons can draw accurate area-
proportional Venn diagrams for any data with three sets [30],
but as shown in Figure 1D–F, their non-smooth and non-
symmetric curves are not easily distinguishable and impede
comprehension [31,32]. Despite these problems, current drawing
methods use either circles or polygons.
Ellipses have more degrees of freedom (i.e., a centre, two semi-
axes, an angle of rotation) than circles and are similarly smooth. So
diagrams drawn with ellipses are more likely to be accurate with
respective to the required quantitative data and easy to
comprehend due to their distinguishable curves. This is illustrated
in Figure 2 where the diagrams accurately depict the quantities
indicated by the numeric labels of the respective diagram in
Figure 1. The diagrams in Figure 2 were drawn using our novel
drawing method and software, eulerAPE, which is the first to use
ellipses.
The benefits of ellipses was noted earlier (in 2004 in the first
paper on area-proportional Venn diagrams [5] and later [29,30]),
but ellipses were never adopted due to difficulties in calculating the
area of the regions of overlapping ellipses and in adjusting the
various properties of the ellipses [5]. Thus, eulerAPE is the first to
Figure 1. Examples of area-proportional 3-Venn diagrams drawn with circles (A–C) and polygons (D–F) in literature. (A) Comparingthe cell-type of differentially regulated genes after an anti-cancer drug treatment [11]. The method used to draw the diagram has not been noted.This diagram is a reprint of Figure 3B in [11], previously published under a CC BY license. (B) Summarizing prognostic indicators of severe malaria [12].The method used to draw the diagram has not been noted. This diagram is a reprint of Figure 3 in [12] (with the N value and the percentages inparenthesis removed), previously published under a CC BY license. (C) Analysing differences and similarities between identified chicken egg whiteproteome in three different studies [13]. Drawn using Venn Diagram Plotter [http://omics.pnl.gov/software/VennDiagramPlotter.php]. This diagram isa reprint of Figure 2A in [13], previously published under a CC BY license. (D) Analysing overlaps between gene libraries [14]. Drawn using DrawVenn[5]. This diagram is a reprint of Figure 4B in [14] under a CC BY license, with permission from John Wiley and Sons, original copyright 2009. (E)Studying transcriptome variation of different tissue types of the male field cricket, namely testis, accessory gland and the rest of the body [15]. Drawnusing Convex Venn-3 [51]. This diagram is a reprint of Figure 1 (left) in [15] under a CC BY license, with permission from Nathan Bailey, originalcopyright 2013. (F) Summarizing genes affecting Top1-induced DNA damage identified in three different studies [16]. Drawn using DrawEuler [55].This diagram is a reprint of Figure 3A in [16] (with added numeric labels indicating the quantitative data that according to the article each region inthe diagram should represent), previously published under a CC BY license.doi:10.1371/journal.pone.0101717.g001
eulerAPE: Drawing Area-Proportional 3-Venn Diagrams Using Ellipses
PLOS ONE | www.plosone.org 2 July 2014 | Volume 9 | Issue 7 | e101717

address this well-known, difficult problem. It is also novel, in that it
is neither an extension nor an adaptation of any other previous
drawing method. The current applications of eulerAPE are
extensive and diverse. Diagrams generated by eulerAPE have
appeared in numerous journal articles from diverse disciplines
(e.g., [33–35]). A New York Times Science article (http://www.
nytimes.com/interactive/2013/04/16/science/disease-overlap-in-
elderly.html) cites eulerAPE, and the Pacific Northwest National
Laboratory recommends it on their Venn diagram drawing
software webpage (http://omics.pnl.gov/software/VennDiagram
Plotter.php). This work is also the first to assess the effectiveness of
ellipses in drawing accurate diagrams for the required set relations
and associated quantitative data. We discuss the availability of
eulerAPE in Section 3.5.
Our contributions include: (1) an optimization method to
automatically draw accurate diagrams with ellipses comprised of
(1a) a novel cost function to direct the optimization process
(Section 3.2), (1b) a method to generate a rational starting (Section
3.3), and (1c) a mechanism to adjust the properties of the ellipses in
search for a good solution (Section 3.4); (2) evaluation of (2a) the
effectiveness of eulerAPE in drawing an accurate diagram when
one is known to exist for the given 3-set data (Section 4.1), (2b) the
effectiveness of eulerAPE and ellipses in drawing an accurate
diagram for random 3-set data for which an accurate diagram
drawn with ellipses might not exist and the comparison of these
diagrams with those generated by a variant of eulerAPE that
restricts the ellipses to circles (Section 4.2), (2c) the effectiveness of
eulerAPE and venneuler [29] (the latest proposed circle-based
method) in generating accurate Venn diagrams for 3-set data
(Section 4.3), and (2d) the quality of the diagrams generated by
eulerAPE and various other drawing methods that use circles or
polygons in depicting real world medical data (Section 4.4).
All the experiments mentioned in this article were run on an
Intel Core i7-3770 CPU @3.4GHz with 8GB RAM, 64-bit
Microsoft Windows 7 Professional SP1 and Java Platform
1.7.0_10.
Current Automatic Drawing Methods andSoftware
2.1. Circle-basedThe first automatic drawing methods to use circles were
developed for area-proportional Venn diagrams with two [5] and
three [36] (known as 3 Circle Venn) curves. These were then used
in areas such as medicine and health care (e.g., Figure 3-D [37] or
Figure 3-C3). Various other methods were later developed. A few
of these methods and examples of diagrams drawn using them,
include: BioVenn [38] (e.g., Figure 3-C5, [39]); Venn Diagram
Plotter [http://omics.pnl.gov/software/VennDiagramPlotter.
php] (e.g., Figure 1C, Figure 3-C2, [13]); a module in PatternLab
for proteomics [40] (e.g., Figure 3-C4, [41]); R packages,
Vennerable [https://r-forge.r-project.org/projects/venerable] (e.g.,
Figure 3-C6, [42]) and venneuler [29] (e.g., Figure 3-C7, [43]);
GeneSpring [http://www.strandgenomics.com/GeneSpring] (e.g.,
[44]); Google Venn Charts [https://developers.google.com/chart/
image/docs/gallery/venn_charts] (e.g., Figure 3-C8); Stata’s PVENN
Figure 2. Accurate area-proportional 3-Venn diagrams drawn with ellipses and eulerAPE for the data in Figure 1. Each of thesediagrams depicts the sets and the quantitative data indicated by the numeric labels in the regions of the corresponding diagram in Figure 1. Thesediagrams have been drawn with eulerAPE, but the labels have been added manually.doi:10.1371/journal.pone.0101717.g002
eulerAPE: Drawing Area-Proportional 3-Venn Diagrams Using Ellipses
PLOS ONE | www.plosone.org 3 July 2014 | Volume 9 | Issue 7 | e101717

[http://ideas.repec.org/c/boc/bocode/s457368.html] (e.g., Figure 3-
C1); SAS macro [45] (e.g., [27]); Matlab’s VENN [http://
www.mathworks.com/matlabcentral/fileexchange/22282-venn] and
vennX [http://www.mathworks.com/matlabcentral/fileexchange/
6116-proportional-venn-diagrams]; a web application [http://
bioinforx.com/lims/cloud-based-free-research-tools-for-scientific-
Figure 3. Diagrams generated by various drawing methods for the same medical data from a journal article. All the diagrams aremeant to depict v = {A = 0.25, B = 0.01, C = 0.11, AB = 0.10, AC = 0.29, BC = 0.03, ABC = 0.15}, which represents the findings of a medical survey from ajournal article [37] that also included diagram D for v. The diagrams generated for v using circle-based drawing methods are marked as C, those ofpolygon-based methods are marked as P, and the only diagram with ellipses, that by eulerAPE, is E. Green indicates accurate diagrams with diagError#1026. Red indicates diagrams with inaccurate or missing regions. D is a redrawing of Figure 5 (bottom) in [37], previously published under a CC BYlicense.doi:10.1371/journal.pone.0101717.g003
eulerAPE: Drawing Area-Proportional 3-Venn Diagrams Using Ellipses
PLOS ONE | www.plosone.org 4 July 2014 | Volume 9 | Issue 7 | e101717
data-management-and-analysis/bxtoolbox] (e.g., [46]). Excluding
venneuler, all of these methods draw area-proportional Venn
diagrams with two or three circles and most are simple variants of
the first devised method for three curves [36]. Various methods (e.g.,
BioVenn, PatternLab for proteomics) were specifically designed for
biological data.
The latest proposed method, venneuler, is different from most
others as it uses a statistical model for fitting an area-proportional
diagram to the required quantitative data. The model is comprised
of a normalized loss function stress (defined as the sum of squared
residuals divided by the total sum of squares) and a mechanism to
minimize the function. Compared to 3 Circle Venn [36] and a
method VennMaster [47,48] that draws the diagrams with convex
regular polygons, venneuler is the most effective with respect to
both accuracy and generation time. However, venneuler still
generates inaccurate and misleading diagrams for most quantita-
tive data due to the limitations of circles.
An accurate area-proportional 2-Venn diagram can be drawn
for any quantitative data using two circles a and b. This is fully
constrained, as given a and b have radius ra and rb respectively and
distance dab between the centre of a and b, only one overlapping
region area exists. When a circle c is added, the overlapping region
of the 2-Venn diagram is split up into two and new regions are
introduced. So a 3-Venn diagram is made up of three 2-Venn
diagrams (i.e., 2-Vennab, 2-Vennac, 2-Vennbc). Thus, an area-
proportional 3-Venn diagram for the quantitative data indicated
by the numeric labels in Figure 4A can be constructed by first
drawing the accurate 2-Venn diagrams in Figure 4B (the numeric
values in the regions indicate their current area), whereby two
copies of circle c are drawn to ensure that both 2-Vennac and 2-Vennbc are accurate. Then, rotate the left copy of c anticlockwise
about the centre of a and the right copy of c clockwise about the
centre of b. Only one circle c is required and thus, the two copies
of c must be rotated until they overlap completely (Figure 4C). At
this point, the overlapping regions in a 3-Venn diagram are
automatically formed (Figure 4D). However, the resulting region
areas (Figure 4E) are unlikely to be the same as those required (i.e.,
the numeric labels in Figure 4A) and yet, no changes can be made
to improve the accuracy of a region area without making others
less accurate.
2.2. Polygon-basedThe first proposed method, VennMaster [47,48], uses convex
regular polygons. Such polygons are similar in shape to circles and
thus the generated diagrams are often inaccurate (e.g., Figure 3-
P1, [49]). Other methods use: triangles as in Vennerable [https://
r-forge.r-project.org/projects/venerable] (e.g., Figure 3-P2); rect-
angles (e.g., [50]); orthogonal rectilinear curves as in DrawVenn
[5] (e.g., Figure 1D, Figure 3-P3, [14]) and Vennerable [https://r-
forge.r-project.org/projects/venerable] (e.g., Figure 3-P4); 4-sided
and 5-sided convex polygons as in Convex Venn-3 [51] (e.g.,
Figure 1E, Figure 3-P5, [15]); parallelograms [52]; orthogonal
polyominoes [53]; a combination of convex and non-convex,
smooth and rectilinear curves as in VENNTURE [54] and in
Vennerable [https://r-forge.r-project.org/projects/venerable];
convoluted polygons as in DrawEuler [55] (e.g., Figure 1F,
Figure 3-P6, [16]) and Fan Diagrams [56]. A method that draws
diagrams with polygons for any number of curves has been
proposed but not implemented [57]. A recent method, Euler3, was
devised to use polygons only when circles cannot be used [58].
eulerAPE Method and Software
Our drawing method eulerAPE is based on the simple hill-
climbing optimization technique to draw an area-proportional
diagram with ellipses in a time that is relatively fast and that
Figure 4. A method for constructing an area-proportional 3-Venn diagram using circles. (A) The quantitative values in each regionindicate the required region areas, for which an area-proportional 3-Venn diagram should be drawn. (B) The first step of the construction whereby thethree accurate 2-Venn diagrams are drawn. (C) The second step of the construction whereby the identical copies of the circle labelled c are rotatedsuch that they overlap completely and only one circle labelled c is visible. (D) The instance when only three circles are visible, such that the regions ofthe 3-Venn diagram are obtained. (E) The actual area of the regions in the constructed diagram D, which, as in most cases when these diagrams aredrawn with circles, do not correspond to the desired values in A. The numeric label in each region of this diagram indicates the regions’ actual area.doi:10.1371/journal.pone.0101717.g004
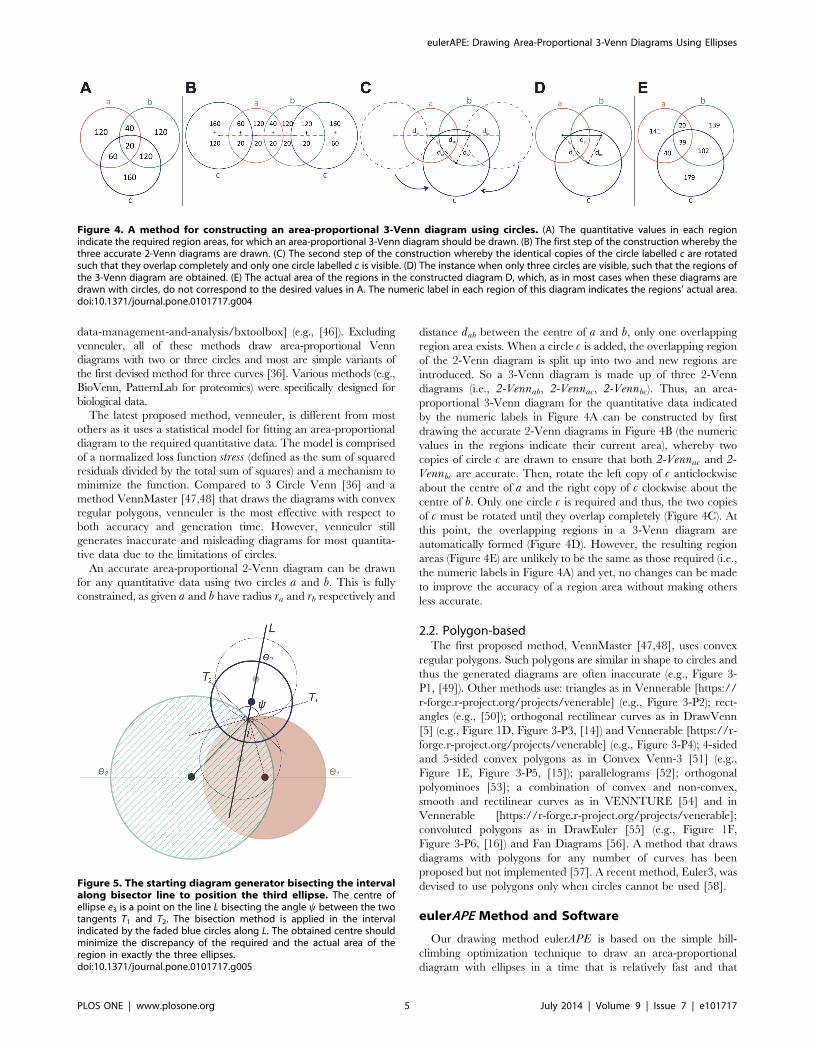
Figure 5. The starting diagram generator bisecting the intervalalong bisector line to position the third ellipse. The centre ofellipse e3 is a point on the line L bisecting the angle y between the twotangents T1 and T2. The bisection method is applied in the intervalindicated by the faded blue circles along L. The obtained centre shouldminimize the discrepancy of the required and the actual area of theregion in exactly the three ellipses.doi:10.1371/journal.pone.0101717.g005
eulerAPE: Drawing Area-Proportional 3-Venn Diagrams Using Ellipses
PLOS ONE | www.plosone.org 5 July 2014 | Volume 9 | Issue 7 | e101717

maintains users’ attention. The area of the regions of the three
intersecting ellipses is computed accurately and instantaneously
using an analytic method that is based on integral calculus ([59] -
Section 5.4).
Each of the quantities in the provided data, for which a diagram
should be drawn, is first scaled by a factor of (100 / smallestquantity in the data), so the same diagram is generated for
quantitative data that is different but proportional. The scaled
quantity corresponding to a region is then the required area of the
region in the diagram to be generated. Later, the search for a
solution that satisfies our diagram goodness measure (Section 3.1)
commences, so that a diagram with region areas that are directly
proportional to the scaled quantitative data is generated. A cost
function directs the optimization process to a good solution
(Section 3.2), in that, starting with a rational diagram for the
required region areas (Section 3.3), the properties of the ellipses
are adjusted based on the cost of the modified diagram (Section
3.4). The software is online and free to use (Section 3.5).
3.1. The Diagram Goodness MeasureTo verify whether the region areas of an area-proportional
diagram are accurately and directly proportional to the required
quantitative data, eulerAPE uses the following measure:
If
N v is the set of quantities for which a diagram had to be drawn,
N d is an area-proportional diagram generated for v,
N R is the set of labels describing the required set of regions
interior to the curves of the diagram,
N v (r) [Rz is the quantity assigned to r[R that should be
depicted by the area of r in d, and
N A (r) [Rz is the area of r[R in d,
then the error in each r [ R is defined as
regionError rð Þ~ v rð ÞvS
{A rð ÞAS
��������
where vS~Xr[R
v(r)
and AS~Xr[R
A(r)
ð1Þ
and the error in d is defined as
diagError~ max r[R regionError(r)½ � ð2Þ
so that d is a good, accurate diagram with respect to v, in that its
region areas are accurately and directly proportional to the
quantities in v, if and only if
diagErrorƒe where e?0 ð3Þ
In eulerAPE, e = 1026, which value is consistent with that of
other methods when defining a value for zero in their implemen-
tation (e.g., venneuler [29]). The value of regionError and
diagError is always in [0,1].
Rather than using the absolute region area, eulerAPE’s measure
considers the proportion of each region area to the area of the total
diagram. An inaccuracy in one region could make other accurate
regions or curves in the diagram seem erroneous, as regions and
curves might be compared for their area to be estimated. This can
be avoided by considering the area of the region with respect to
Figure 6. The different ways the ellipses’ properties are modified during the optimization search process. At every iteration of theoptimization algorithm, the (A) centre, (B) semi-axes and (C) angle of rotation of every ellipse are respectively modified by parameters pc, pab and phin search for other solutions. (A) The grey points indicate the new centres that are obtained when one or both coordinates of the centre of an ellipse(solid black) are increasing or decreasing by pc. (B) A label +pab means that that semi-axis was increased by the pab percentage, while -pab meansthat that semi-axis was decreased by the pab percentage. The dashed ellipses indicate how an ellipse (solid black) is changed when: (top, left) onlythe semi-major axis is increased or decreased by pab; (top, right) only the semi-minor is increased or decreased by pab; (bottom, left) the semi-axesare both increased or both decreased by pab; (bottom, right) one of the semi-axes is increased and the other is decreased by pab. (C) The dashedellipses indicate how an ellipse (solid black) is changed when its angle of rotation is increased or decreased by ph.doi:10.1371/journal.pone.0101717.g006
eulerAPE: Drawing Area-Proportional 3-Venn Diagrams Using Ellipses
PLOS ONE | www.plosone.org 6 July 2014 | Volume 9 | Issue 7 | e101717
the total area of the diagram. A similar measure to the one used by
eulerAPE was considered by a previous drawing method [36].
3.2. The Cost FunctionTo obtain a good, accurate diagram with respect to the required
quantitative data (as defined in Section 3.1), our optimization
algorithm minimizes a cost function that takes into account the
accuracy of the diagram as well as paths that could lead to a local
minimum. In an informal experimentation, we observed that the
cost function of most of the current methods, such as venneuler’s
stress [29] and Chow and Rodgers’s ‘idealistic’ function [36], often
drive the optimization to a local minimum, as the overall error of
the diagram is reduced at the expense of diminishing a region to a
point where it is close to non-existent and its actual-to-required
area ratio is close to zero. In such cases, no further changes can be
carried out otherwise the diagram would no longer depict all of the
required regions. Following our observation, we devised the
following novel cost function:
If
N v is the set of quantities for which a diagram should be drawn,
N v9 is the set of scaled quantities of v (obtained as explained
earlier in Section ‘eulerAPE Method and Software’), indicating
the required region areas in the required good diagram for v,
N d is an area-proportional diagram that is explored for v during
the optimization,
N R is the set of labels describing the required set of regions
interior to the curves of the diagram,
N v9 (r) [Rz is the area that r[R should have in the required
good diagram, and
N A (r) [Rz is the area of r[R in d,
then the cost of d is defined as
1
Rj jXr[R
v0(r){A(r)ð Þ2
A(r)ð4Þ
Thus, the cost of a diagram is the mean of the cost of all the
regions in that diagram. The sum could have been used since this
work focuses on 3-Venn diagrams. However, we used mean so this
function could be used in other future algorithms for diagrams
with any number of curves and overlaps.
A diagram is generated for the required region areas scaled (i.e.,
those in v9) and so, it is adequate to consider the absolute area of
the regions. A similar approach was adopted by previous
techniques, such as VennMaster [47,48]. If relative region areas
are considered as in our goodness measure, the search could be
restricted, particularly at the initial stages of the optimization when
a good but non-refined solution is adequate.
The denominator A(r) for r[R in our function prevents the
optimization from taking paths that reduce the overall error of the
diagram at the expense of diminishing the actual-to-required area
ratio of a region, leading to a local minimum. With our function, a
region with a very small actual-to-required area ratio will have a
very large cost and thus prevent the optimization from taking such
paths.
Though our cost function in Equation (4) is non-dimensionless,
it is still adequate as the provided quantitative data is scaled before
a diagram is generated for this data. However, we still considered
ways how to make Equation (4) dimensionless. The denominator
A(r) for r[R could be squared as in
1
Rj jXr[R
v0(r){A(r)
A(r)
� �2
ð5Þ
or the numerator could be the absolute difference between the
required and actual region area not squared as in
1
Rj jXr[R
v0(r){A(r)j jA(r)
ð6Þ
However, these two dimensionless functions will have a different
effect from that intended by our non-dimensionless cost function,
as the cost of a region would be much smaller than that in
Equation (4) when the actual region area is greater than one and
much greater than that in Equation (4) when the actual region
area is less than one. This means that large errors would be less
easily identified and the actual region area would have a greater
impact on the cost than that intended to identify regions with a
very small actual-to-required area ratio. The cost of a region in
Equation (6) is the same as that in Equation (5) except that it is not
squared. Thus, if large errors in a region result in a smaller cost in
Equation (5) than in Equation (4), then in Equation (6) the cost
would be even smaller, making it more difficult to identify
inappropriate paths. So, we expect Equation (5) and Equation (6)
to be less effective than Equation (4), and for Equation (6) to
perform worse than Equation (5).
To choose the most effective cost function for eulerAPE, we
conducted an experimental comparison of the following cost
functions: F1, venneuler’s stress, using the source code of
venneuler version 1.1-0, but with v9 (r) and A(r) for the required
and the actual area of a region r[R; F2, the first component of
Chow and Rodgers’s ‘idealistic’ function, which is related to our
regionError; F3, the sum of the squared relative error of the
regions; F4, the maximum of the relative error of the regions; F5,
the sum of the relative error of the regions; F6, our non-
dimensionless cost function Equation (4); F7, our dimensionless
cost function Equation (5); F8, our dimensionless cost function
Equation (6).
The cost function of the optimization algorithm in Section 3.4
was replaced by one of F1–F8 and used to generate diagrams (with
the rerun option disabled) for two libraries of 10,000 random 3-set
data items each: L1 with quantitative data for which an accurate
3-Venn diagram with ellipses is known to exist; L2 with
quantitative data for which it is not clear whether an accurate 3-
Venn diagram with ellipses can be drawn. The details and results
of this evaluation are available in Micallef’s PhD thesis [59]
(Chapter 5 and Appendix A).
This evaluation and experimental comparison indicated that
our non-dimensionless cost function F6 is the most effective in:
N Generating good diagrams for quantitative data for which a
good diagram is known to exist;
N Converging to diagrams that have a low diagError even when
a good diagram cannot be drawn with respect to the given
data;
N Identifying and avoiding paths that lead the optimization to a
local minimum when the overall error of the diagram is
reduced at the expense of diminishing the area of a region to a
point where it is close to non-existent and its actual-to-required
region area ratio is close to zero;
eulerAPE: Drawing Area-Proportional 3-Venn Diagrams Using Ellipses
PLOS ONE | www.plosone.org 7 July 2014 | Volume 9 | Issue 7 | e101717

N Taking the least amount of the time and iterations to generate
a diagram, particularly for data for which a good diagram is
known to exist;
N Generating a large majority of the diagrams (97.3%,
N = 20000) within a time (1 second) that ensures that the
users’ train of thought is maintained, and generating nearly all
the diagrams (99.6%, N = 20000) within a time (10 seconds)
that ensures that the users’ attention is maintained.
The effectiveness of F6 over the other cost functions with respect
to the generation of good diagrams, the diagError of the non-good
diagrams, generation time and number of iterations was highly
evident for the diagrams generated for the data in L1, but less
evident for those of L2. The results for L1 could be more
important than those for L2, as an accurate diagram with ellipses
exists for all of the 10,000 data items in L1. There is 3-set data for
which an accurate diagram cannot be drawn with convex curves
[30] (and thus ellipses) and it is unknown how much of this data is
in L2. This evaluation also demonstrated that all of the cost
functions (F1–F5), except for those we devised (F6–F8), often direct
the optimization to a local minimum as the actual-to-required area
ratio of a region is reduced to a value close to zero. Thus the cost
function should heavily weight regions whose area is very small
with respect to that required, as done in F6–F8. However, as
expected, our dimensionless cost functions F7 and F8 were not as
effective as our non-dimensionless F6.
Following the results of this evaluation, eulerAPE uses our cost
function F6, as given in Equation (4).
3.3. The Starting DiagramThe optimization process has to commence with a solution.
This is often an arbitrary or an invariant solution. Both types of
starting diagrams were considered for eulerAPE. The arbitrary
starting diagram was a Venn diagram comprised of three ellipses
whose properties were assigned random values. The invariant
starting diagram was a Venn diagram with 3-fold rotational
symmetry, comprised of three equally-sized circles and regions
that were similar in size, except for those in only one curve that
were around three times as much as the rest. As expected, both
types of starting diagrams led to poor results in terms of generation
time and diagram quality, as such starting diagrams do not take
into account the data that the good solution must satisfy and are
more likely to direct the optimization to a local minimum [60,61].
We wanted eulerAPE to be deterministic and so an arbitrary
starting diagram was particularly inappropriate, as different
diagrams would be generated for the same data every time the
optimization is run (as in e.g., VennMaster [47,48]).
A rational starting diagram that is adapted to the required
quantitative data is more effective, as it reduces convergence time
and the likelihood of reaching a local minimum. Such a starting
diagram is used by for instance venneuler [29]. The starting
diagram used and generated by eulerAPE is drawn using three
ellipses with equal semi-axes, so the ellipses are depicted as circles.
An angle of rotation of 0, p/3 and 2p/3 is assigned to the three
respective ellipses to ensure that the entire space of possible angles
of rotation is considered during the optimization. Assigning an
appropriate centre for the ellipses is difficult and yet important as
this determines the accuracy of the region areas. The two largest
required ellipses, e1 and e2, in the diagram are chosen and an area-
proportional 2-Venn diagram that accurately depicts the data
corresponding to e1 and e2 and their overlap is drawn using Chow
and Ruskey’s bisection method [5]. This increases the likelihood
that the overall starting diagram is close to that required, as an
accurate area-proportional Venn diagram can be drawn with
circles for any data with two sets [5] and the 2-Venn diagram with
e1 and e2 covers a large portion of the starting diagram.
Changes to the ellipses during the optimization affect the area of
the region in exactly the three ellipses. So a starting diagram that
minimizes the error of this region seems helpful. To achieve this,
the centre for the third ellipse e3 is obtained by applying the
bisection method in an interval along a line L, as shown in
Figure 5. L is the bisector of the angle, y, between two lines, T1
and T2, that are respectively tangents to e1 and e2 at i1 (i.e., the
upper intersection point of e1 and e2). The interval along L is (u, l)where u is a point that lies above another point l on L, such that,
as shown by the faded blue circles in Figure 5, the centre of e3
must be between u and l (but not equal to u or l) for e3 to intersect
each of e1 and e2 twice and form the seven regions interior to the
curves of a 3-Venn diagram. As illustrated by the faded blue circles
in Figure 5, the endpoints of the interval as well as any value that is
not in the interval will generate a diagram that is not a Venn
diagram.
Out of the starting diagrams generated for 10,000 random 3-set
data items for which an accurate Venn diagram with ellipses is
known to exist, 63% had diagError #0.05 (i.e., 5%). The value of
diagError is always in [0,1] and so, this result indicates that the
generated starting diagrams are relatively close to the required
solution. Also, the time to generate the diagrams is 10 times less
than the 0.1 second limit for an instantaneous response [62,63]
with a mean of 8 milliseconds for the 10,000 diagrams.
3.4. The Optimization AlgorithmOur simple hill-climbing algorithm commences with a rational
starting diagram and systematically adjusts the properties of its
ellipses to minimize our cost function, until a good diagram with
respect to the given quantitative data is obtained. Though simple
and a local search, it rarely encounters a local minimum and if it
does, our algorithm is capable of handling such cases and obtain a
good solution whenever an accurate area-proportional 3-Venn
diagram drawn with ellipses is known to exist for the given data (as
shown in Section 4.1).
Our optimization algorithm is characterized by the following
three parameters that determine how at every iteration, each
ellipse e is modified in search for other possible solutions:
N pc, the number of pixels by which one or both coordinates of
the centre of e are modified to explore eight new centres for
e—these are shown in Figure 6A, where the black ellipse and
black point are e and its centre prior to any change, and the
grey points are the eight new centres for e;
N pab, the scaling percentage by which one or both semi-axes of
e are modified to explore eight new semi-axes for e—these are
shown in Figure 6B, where the solid black ellipse is e prior to
any change and the dashed coloured ellipses are e with the
eight new semi-axes;
N ph, the number of radians by which the angle of rotation of e is
modified to explore two new angles of rotation for e—these are
shown in Figure 6C, where the solid black ellipse is e prior to
any change and the dashed coloured ellipses are e with the two
new angles of rotation.
Changes that lead to a reduced cost of the diagram are
accepted. At the start, pc = 10 pixels, pab = 5% and ph = 2p/3.
These values were chosen after the diagram generation for
different 3-set data was observed for different pc, pab and phvalues. If, at the end of an iteration, a property of the ellipses is not
changed, the value of the respective parameter is reduced linearly
(halved). This means that major changes only occur at the start
eulerAPE: Drawing Area-Proportional 3-Venn Diagrams Using Ellipses
PLOS ONE | www.plosone.org 8 July 2014 | Volume 9 | Issue 7 | e101717

when the search space is explored for a good yet non-refined
solution. As the values of pc, pab and ph are reduced further,
minor changes to the diagram are explored, so that the diagram is
refined to the required good solution. This cooling schedule,
similar to that used in the global optimization method of simulated
annealing, reduces the likelihood of converging to a local
minimum and the time required to converge to the good solution.
We halve the parameters as we observed that faster cooling rates
restrict diagram refinement, while slower cooling rates are
computationally expensive. This is the algorithm for the diagram
generation process given a set of quantities, v:
Algorithm eulerAPE (v)
Input: v is a set of seven quantities each corresponding to a
region interior to the curves of a 3-Venn diagram
Output: an area-proportional 3-Venn diagram drawn with
ellipses for v and whether the diagram is accurate
1: d r a rational starting diagram with respect to v2: if d is a good diagram for v by Equation (3) then
4: end if5: v9 r the set of scaled quantities of v6: pc r10 pixels, pab r 5%, ph r 2p/3
7: do
e in d is c then
axes of e in d are s then
rotation of e in d is r then
44: loop
Step 38 is reached when a local minimum is encountered. To
handle such cases, eulerAPE has a rerun option which when
enabled, it reruns the optimization using starting values for pc, paband ph that are 20% larger than those used in the previous run.
eulerAPE then terminates either when a good diagram is found or
when 10 reruns are completed and a good diagram is yet not
found. In the latter case, the diagram with the lowest diagErrorout of the 11 generated diagrams is returned. We opted for a 20%
increase in the parameter values following our information
experimentation of different parameter values when we observed
cases that could benefit from such an increase and extended
exploration of the search space.
3.5. Availability and How to UseThe software executable and the Java source code are freely
available under the GNU General Public License version 3 at
www.eulerdiagrams.org/eulerAPE. The latest release of eulerAPEshould be downloaded from the webpage and opened by clicking
on the downloaded jar file. Three steps are then required to use
eulerAPE:
1. enter the quantities to be depicted by the regions of the
diagram—these quantities should be typed in manually,
generated randomly or loaded from a file;
Figure 7. The number of reruns to generate a good diagram for 61 data items in L1. The number of reruns (1–10) that were required foreulerAPE to generate a good diagram for the 61 data items in L1 for which a non-good diagram was generated during the first run.doi:10.1371/journal.pone.0101717.g007
eulerAPE: Drawing Area-Proportional 3-Venn Diagrams Using Ellipses
PLOS ONE | www.plosone.org 9 July 2014 | Volume 9 | Issue 7 | e101717
3: return d, accurate
8: for every ellipse e in d do9: centres r the eight centres obtained by pc for e10: for each c in centres do
12: Change the centre of e in d to c
11: if the cost of d by Equation (4) is reduced when the centre of
13: end if14: end for
17: if the cost of d by Equation (4) is reduced when the semi-
16: for each s in semiaxes do15: semiaxes r the eight semi-axes obtained by pab for e
18: Change the semi-axes of e in d to s19: end if20: end for21: rotations r the two angles of rotation obtained by ph for e22: for each r in rotations do
23: if the cost of d by Equation (4) is reduced when the angle of
24: Change the angle of rotation of e in d to r25: end if26: end for
27: end for28: if no ellipse in d had its centre changed then
30: end if29: Divide pc by 2
31: if no ellipse in d had any of its semi-axes changed then32: Divide pab by 2
33: end if34: if no ellipse in d had its angle of rotation changed then
35: Divide ph by 2
36: end if37: if pc #e, pab #e and ph #e, where e = 1 0 26 then
38: return d, inaccurate39: else
40: if d is a good diagram for v by Equation (3) then
41: return d, accurate42: end if
43: end if

2. select preferences—including: whether the diagram should be
saved, how the diagram should be displayed (e.g., labels,
colours, ellipses or circles), whether to view the search process;
3. generate the diagram—by clicking on the ‘RUN’ button.
Further details, example how to load the required quantitative
data from a file or how to save the diagram, are available on
eulerAPE’s webpage. The latest release, v3.0.0, has been fully
tested on Windows and Mac OS X, is locale-independent,
supports command-line execution (details on eulerAPE’s web-
page), and exports diagrams in png and svg format as well as in
textual format with details about the properties of the ellipses in
the diagram.
Effectiveness of eulerAPE and Ellipses
To evaluate the effectiveness of ellipses in drawing accurate
area-proportional 3-Venn diagram for given data, we first
evaluated the effectiveness of eulerAPE in drawing good diagrams
for drawable 3-set data, that is data for which a good diagram is
known to exist (Section 4.1). Being able to handle such data means
that eulerAPE can avoid and handle local minima and if
eulerAPE cannot draw an accurate, good diagram for any
Figure 9. Examples of good diagrams generated after the first run for data in L1. (A) and (B) illustrate (i) the good diagram that was foundusing (ii) the starting diagram generated for the data item in L1 ({a = 2273, b = 24458, c = 44454, ab = 7116, ac = 740, bc = 18807, abc = 12092} for A and{a = 17033, b = 6248, c = 16230, ab = 615, ac = 289, bc = 840, abc = 922} for B) that was equal to the set of region areas of (iii) a randomly generated 3-Venn diagram.doi:10.1371/journal.pone.0101717.g009
Figure 8. Time and total number of iterations to generate good diagrams for data in L1. The log10 (time in seconds) and log10(total numberof iterations) taken to generate good diagrams for 9939 of the 10,000 data items in L1 during the first run (labelled as ‘Run 1’) and for 61 of the 10,000data items in L1 during any of the one to a maximum of 10 reruns (labelled as ‘Reruns’).doi:10.1371/journal.pone.0101717.g008
eulerAPE: Drawing Area-Proportional 3-Venn Diagrams Using Ellipses
PLOS ONE | www.plosone.org 10 July 2014 | Volume 9 | Issue 7 | e101717

random data in our second evaluation (Section 4.2), then it is
highly likely that a good diagram drawn with ellipses does not exist
for that data. In this way, we were able to identify characteristics of
3-set data that are drawable with ellipses (Section 4.2). In our
second evaluation, we also generated diagrams for the same
random data using a variant of eulerAPE that restricts the ellipses
to circles to identify whether in these cases an accurate diagram
could be drawn with circles (Section 4.2). We then compared these
results to the diagrams generated by the latest circle-based
method, venneuler [29], for the same random data (Section 4.3).
Finally, we compared the accuracy and the curve aesthetics of the
diagrams generated by eulerAPE and various other drawing
methods using circles or polygons for real world data in a medical
application area (Section 4.4).
The error of the diagrams generated by eulerAPE and other
drawing methods was measured by diagError in Equation (2)
whose value is in [0,1]. Good diagrams are those that satisfy our
diagram goodness measure in Equation (3) and are thus diagrams
that depict all the required regions and have diagError #1026. In
our experiments, the number of iterations and the time taken to
generate the diagrams were also recorded.
This evaluation focuses on 3-set data that associates a quantity
greater than zero to each of the seven regions interior to the curves
of a 3-Venn diagram. Diagrams with region areas that are zero
percent of the total area of the diagram can still be drawn with
eulerAPE, but further evaluation is required in the future.
In this section, L1 and L2 refer to two libraries each with
10,000 sets of seven numbers greater than zero. The numbers of a
set in L1 are the region areas of a 3-Venn diagram generated after
random values are assigned to the properties of three overlapping
ellipses. The numbers of a set in L2 are randomly obtained from a
uniform distribution in the interval [1,10000]. The data in these
two libraries is different from that used in the evaluation of
different cost functions in Section 3.2.
4.1. For Drawable DataDiagrams were generated with ellipses by eulerAPE for the
10,000 drawable data items in L1. The rerun option of the
optimization algorithm (Section 3.4) was enabled to verify whether
eulerAPE still draws a good diagram if a local minimum is reached
in the first run.
By the first run, good diagrams were generated for 9939 of the
10,000 data items (i.e., 99.4%). Despite generating a non-good
diagram for the remaining 61 data items (i.e., 0.6%), the diagErrorof these diagrams was relatively low (median 1.0661024, mean
2.3861023, minimum 1.0261026, maximum 3.0961022) and 54
of them (i.e., 88.5%) had diagError #0.01. Good diagrams were
generated for all of these 61 data items after the optimization
algorithm was rerun. For the majority (38/61, i.e., 62.3%), a good
Figure 10. Examples of good diagrams generated after the first rerun for data in L1. (A) An example of (i) a non-good diagram with a verylow diagError (6.5161024) generated during the first run and (ii) the good diagram generated during the first rerun for the data ({a = 10018, b = 27132,c = 39737, ab = 9567, ac = 11454, bc = 3, abc = 668}) in L1 obtained from (iii) a random diagram. The good diagram in ii was generated in 1.2 secondsand 86 iterations (including the first run and the one rerun). (B) An example of (i) a non-good diagram with a low diagError (8.3861023) generatedduring the first run and (ii) the good diagram generated during the first rerun for the data ({a = 53804, b = 39550, c = 1256, ab = 15606, ac = 15,bc = 29904, abc = 3597}) in L1 obtained from (iii) a random diagram. The good diagram in ii was generated in 2.9 seconds and 367 iterations (includingthe first run and the one rerun).doi:10.1371/journal.pone.0101717.g010
eulerAPE: Drawing Area-Proportional 3-Venn Diagrams Using Ellipses
PLOS ONE | www.plosone.org 11 July 2014 | Volume 9 | Issue 7 | e101717

diagram was generated after the first rerun (Figure 7; number of
reruns, median 1 and mean 2.1). Thus, with 99% confidence,
these results indicate that for 99.2% to 99.6% of drawable 3-set
data, eulerAPE draws a good diagram during the first run, and for
99.9% to 100.0% of the same type of 3-set data, eulerAPE draws a
good diagram after one to 10 reruns.
When the optimization algorithm is rerun, more time and total
number of iterations are required to generate a good diagram
(Figure 8). Even so, the generation of the 10,000 good diagrams
had an overall median and mean time of respectively 0.4 seconds
and 2.5 seconds, and an overall median and mean number of
iterations of respectively 32 and 273. Also, for 97.7% of the 10,000
data items, a good diagram was generated within 1 second (98.1%
and 34.4% of respectively the 9939 good diagrams generated
during first run and the 61 good diagrams generated during a
rerun), and for 99.7% of the 10,000 data items a good diagram
was generated within 10 seconds (99.9% and 62.3% of respectively
the 9939 good diagrams generated during first run and the 61
good diagrams generated during a rerun). So, with 99%
confidence, these results indicate that for 97.4% to 98.0% of
drawable 3-set data, eulerAPE draws a good diagram within 1
second, and for 99.6% to 99.8% of the same type of 3-set data,
eulerAPE draws a good diagram within 10 seconds. These results
are important as a response time of 1 second ensures the users’
train of thought is uninterrupted and a response time of 10 seconds
ensures the users’ attention is retained [62,63].
Figure 9A and Figure 9B illustrate (i) the good diagram obtained
from (ii) the starting diagram generated for the data item in L1
that was equal to the set of region areas of (iii) a randomly
generated diagram. These examples illustrate that whenever
possible eulerAPE draws circle-like curves (e.g., the semi-axes of
ellipses a, b and c in Figure 9Ai differ by 6.0%, 5.4% and 8%
Figure 11. Examples of diagrams generated by venneuler and eulerAPE (circles and ellipses) for data in L2. Examples of diagramsgenerated with (i) circles by venneuler, (ii) circles by eulerAPE, and (iii) ellipses by eulerAPE for random 3-set data in L2. (A) Diagrams generated fordata {a = 3491, b = 3409, c = 3503, ab = 120, ac = 114, bc = 132, abc = 126}. Ai is missing region abc and has stress = 5.6961024 and diagError= 1.1661022. Aii and Aiii have the required regions, one for every data set relation. Aii has stress = 8.3661023 and diagError = 2.6361022. Aiii hasstress = 3.96610212 and diagError = 6.5561027. (B) Diagrams generated for data {a = 45910, b = 3261, c = 45467, ab = 58845, ac = 3028, bc = 16406,abc = 18496}. Bi is missing region ac and has stress = 3.1761023 and diagError = 2.0761022. There are two regions in Bi depicting only b. Bii and Biiihave the required regions, one for every data set relation. Bii has stress = 2.1361022 and diagError = 4.3661022. Biii has stress = 3.43610212 anddiagError = 6.8561027. (C) Diagrams generated for data {a = 3664, b = 46743, c = 59811, ab = 1742, ac = 2099, bc = 17210, abc = 24504}. Ci, Cii and Ciiihave the required regions, one for every data set relation. Ci has stress = 4.2761023 and diagError = 2.3061022. Cii has stress = 8.3161023 anddiagError = 2.4461022. Ciii has stress = 1.13610212 and diagError = 4.0361027.doi:10.1371/journal.pone.0101717.g011
eulerAPE: Drawing Area-Proportional 3-Venn Diagrams Using Ellipses
PLOS ONE | www.plosone.org 12 July 2014 | Volume 9 | Issue 7 | e101717

respectively). In other cases, elongated ellipses are required to
accurately draw the desired region areas (e.g., in Figure 9Bi, the
required area for the regions located in only one of the curves is
large compared to that of other regions), but the curves are still
highly symmetric and distinguishable in shape from the regions,
thus facilitating diagram comprehension [32]. Also, the curves in
the diagrams are often evenly distributed, thus increasing the
likelihood that the curves are easily distinguishable.
The majority of the non-good diagrams generated during the
first run had a low diagError and just needed further refinement.
Figure 10Ai is an example of such a diagram generated during the
first run with diagError = 6.5161024. Figure 10Aii is the good
diagram that was generated after one rerun for the data in L1
obtained from the diagram in Figure 10Aiii. The area of region bcis 0.003% of the area of the total diagram and yet eulerAPE was
still capable of accurately computing the region areas and generate
a good diagram. Figure 10Bii is an example of a good diagram
that was generated after the first rerun for the data in L1 obtained
from the diagram in Figure 10Biii. As shown in Figure 10Bi,during the first run, the optimization was trapped in a local
minimum as ellipse b approached the edge of ellipse c (making
region c seem like it was made up of two regions). By rerunning the
optimization algorithm, different paths were explored and
Figure 10Bii was generated.
The results of this evaluation indicate the effectiveness of
eulerAPE in drawing good diagrams for drawable data. So, if
eulerAPE cannot draw a good 3-Venn diagram for a set of seven
quantities greater than zero, each corresponding to a region in the
diagram, then it is highly likely that a good 3-Venn diagram drawn
with ellipses does not exist for that quantitative data.
4.2. For Random DataSince eulerAPE can generate good diagrams for drawable data
(Section 4.1), we used eulerAPE to evaluate the effectiveness of
ellipses in drawing accurate area-proportional 3-Venn diagrams
for any random 3-set data with values greater than zero. Diagrams
for the 10,000 data items in L2 were generated using eulerAPE.
The data in L2 is made up of random values and thus, it is
unknown whether an accurate diagram drawn with ellipses exists
Figure 12. Stress and diagError of all the diagrams generated by venneuler and eulerAPE (circles and ellipses). The (A) stress and (B)diagError of all the diagrams generated with circles by venneuler, with circles by eulerAPE and with ellipses by eulerAPE for the 10,000 3-set data in L2.The 10,000 diagrams generated with circles by venneuler had stress in [3.7761025, 6.1461021] with median 3.0461022 and mean 6.4161022, anddiagError in [1.5661023, 2.4661021] with median 4.5661022 and mean 5.7361022. The 10,000 diagrams generated with circles by eulerAPE had stressin [1.91610210, 7.7961021] with median 7.0061022 and mean 1.1361021, and diagError in [3.3061026, 3.3161021] with median 6.2861022 andmean 6.7361022. The 10,000 diagrams generated with ellipses by eulerAPE had stress in [3.98610214, 2.2461021] with median 7.59610212 and mean1.17610210, and diagError in [6.0061028, 1.3961021] with median 8.0061027 and mean 2.9461023.doi:10.1371/journal.pone.0101717.g012
eulerAPE: Drawing Area-Proportional 3-Venn Diagrams Using Ellipses
PLOS ONE | www.plosone.org 13 July 2014 | Volume 9 | Issue 7 | e101717

for this data (i.e., whether the data is drawable). The rerun option
of the optimization algorithm (Section 3.4) was enabled to ensure
that a good diagram is drawn for all drawable data. Diagrams with
circles are preferred and the most effective [32], so we also
evaluated whether an accurate, good diagram can be drawn using
a variant of eulerAPE that restricts the ellipses to circles for any of
the 10,000 data items in L2.
Good diagrams drawn with ellipses were generated for 8607 of
the 10,000 data items in L2 (i.e., 86.1%)—8372 after the first run
(i.e., 97.3% of the 8607) and 235 after one to a maximum of 10
reruns (i.e., 2.7% of 8607). More than half of the 235 good
diagrams (56.2%) were generated during the first rerun and only
one was generated after 10 reruns, as the diagError of the non-
good diagrams generated for these data items during the first run
was relatively low (diagError in [1.5161026, 3.2861022] with
median 1.8961023 and mean 3.7761023).
None of the diagrams drawn with circles for the 10,000 data
items in L2 were good, and the diagError of these diagrams was
greater than that of the non-good diagrams drawn with ellipses
(median, mean: 6.2861022, 6.7361022 for circles; 1.6561022,
2.1161022 for ellipses). With a 99% confidence, these results
indicate that for 85.2% to 86.9% of random 3-set data, a good
diagram can be drawn (using eulerAPE) with ellipses, and for
0.0% to 0.1% of random 3-set data, a good diagram can be drawn
(using eulerAPE) with circles. There are 3-set data for which an
area-proportional 3-Venn diagram cannot be drawn accurately
using convex curves [30] and so, drawing good diagrams with
ellipses for a large majority of the 10,000 random data items in L2
indicates great potential for using curves that are regular and
smooth as circles, but more general and with more degrees of
freedom like ellipses.
The time and number of iterations that were required for the
generation of the good diagrams using ellipses were similar to
those of our evaluation in Section 4.1 (this evaluation: medians 0.4
seconds and 35 iterations, means 1.9 seconds and 201 iterations,
N = 8607). Non-good diagrams with ellipses required more time
and iterations as the optimization algorithm was rerun a
maximum of 10 times (medians, 4.0 seconds, 586 iterations;
means, 25.9 seconds, 4417 iterations). Similarly, the diagrams
drawn with circles required more time and iterations (medians, 3.2
seconds, 500 iterations; means 3.4 seconds, 529 iterations), as none
were good.
The majority of the 10,000 diagrams with ellipses were
generated within 1 second (84.1%—8405/8607 good, 0/1393
non-good) and nearly all with ellipses within 10 seconds (96.9%—
8569/8607 good, 1119/1393 non-good). So similar to Section 4.1,
with 99% confidence, these results indicate that for 83.1% to
85.0% of random 3-set data, eulerAPE draws a diagram with
ellipses within 1 second, and for 96.4% to 97.3% of the same type
of 3-set data, eulerAPE draws a diagram with ellipses within 10
seconds. Out of the 10,000 diagrams with circles, none were
generated within 1 second, but 99.6% (9959/10,000) were
generated within 10 seconds.
This evaluation also revealed that data for which an area-
proportional 3-Venn diagram can be drawn with ellipses often has
larger areas for the regions in only one curve than those in only
two curves, and an area for the region in only the three curves that
is typically similar to those for the regions in only one curve.
4.3. Comparison with Circles and venneulerUsing a variant of eulerAPE, our evaluation in Section 4.2
indicates that it is highly unlikely that there is 3-set data for which
a good diagram can be drawn with circles. To verify this finding,
we used the latest circle-based method venneuler version 1.1-0 to
generate diagrams with circles for the 10,000 data items in L2.
This method is the first to take a statistical approach and differs
from eulerAPE in various ways. For instance, venneuler uses a
numerical approximation method to compute the region areas and
a steepest descent method with an approximate gradient to
minimize its loss function stress. The accuracy of venneuler’s
diagrams was then compared with that of the diagrams generated
by eulerAPE with circles and ellipses in Section 4.2.
For eulerAPE, a good diagram is a 3-Venn diagram with
diagError #1026 (Equation (3)). For venneuler, a good diagram is
one with stress #1026. Thus, to compare the accuracy of the
diagrams generated by eulerAPE and venneuler, we computed:
stress for the diagrams generated by eulerAPE using venneuler’s
version 1.1-0 source code, but eulerAPE’s analytic method to
compute the region areas; diagError for the diagrams generated
by venneuler using eulerAPE’s source code, but venneuler’s
numerical approximation to compute the region areas.
None of the diagrams generated by venneuler for the 10,000
data items in L2 had stress #1026 or diagError #1026. Thus,
none of the diagrams were good according to venneuler’s and
eulerAPE’s diagram error measures. Also, only 64.5% (i.e., 6453/
10,000) of the generated diagrams depicted all of the required
regions. The other 35.5% (i.e., 3547/10,000) had one or more of
the required regions missing.
Figure 11Ai and 10Bi are examples of the diagrams generated
by venneuler with missing regions. Both diagrams had a relatively
low stress (5.6961024 and 3.1761023 respectively), close to that of
a good diagram (i.e., stress #1026). However, Figure 11Ai was
missing region abc (despite that its required area was larger than
that of regions ab and ac and similar to that of region bc) and
Figure 11Bi was missing region ac (despite that its required area
was similar to that of region b). Such diagrams are more
misleading than ones with inaccurate region areas, as besides
showing incorrect quantities, not all the required set relations are
depicted. In contrast, the diagError for these diagrams was not so
low (1.1661022 and 2.0761022 respectively). Some of venneuler’s
diagrams also had aesthetic features that could impede diagram
comprehension [64]. For instance, Figure 11Bi has two regions
representing only b. These problems are not evident in eulerAPE’s
diagrams ii and iii in Figure 11, as the diagram goodness measure
and other checks during the optimization disallow the generation
of such diagrams. When venneuler generated a diagram with all
the required regions, the diagram was often misleading, as the
region areas were inaccurate due to the limited degrees of freedom
of circles. Figure 11Ci is an example of such a diagram. According
to the data for which this diagram was generated, region a had to
be 2.1 times larger than region ab and 1.7 times larger than region
ac. However, region a was smaller than both regions ab and ac.
The stress of the diagram was low (stress = 4.2761023, diagError= 2.3061022), but greater than that of Figure 11Ai and
Figure 10Bi, despite that the latter had missing regions and were
thus more misleading.
The diagrams by eulerAPE with circles (ii in Figure 11) had
inaccurate and misleading region areas like those of venneuler, but
all depicted the required regions. All of eulerAPE’s diagrams with
ellipses (iii in Figure 11) had the required regions as well as stress #
1026 and diagError #1026 and were thus considered good by
both venneuler’s and eulerAPE’s error measures.
As shown in Figure 12A (for stress) and Figure 12B (for
diagError), the majority of venneuler’s diagrams had a lower stressand diagError than those of eulerAPE’s diagrams with circles (a
lower stress for 8675/10,000 diagrams; a lower diagError for
6234/10,000 diagrams), but a greater stress and diagError than
those of eulerAPE’s diagrams with ellipses (a greater stress for
eulerAPE: Drawing Area-Proportional 3-Venn Diagrams Using Ellipses
PLOS ONE | www.plosone.org 14 July 2014 | Volume 9 | Issue 7 | e101717

9730/10,000 diagrams; a greater diagError for 9660/10,000
diagrams).
The differences between venneuler’s diagrams and eulerAPE’s
diagrams with ellipses were expected due to the limitations of
circles in generating accurate diagrams for most data [30]. None of
venneuler’s diagrams were considered good by stress and
diagError, but 8529 and 8607 of the 10,000 diagrams generated
by eulerAPE with ellipses were considered good by respectively
stress and diagError (the difference between the percentages of
good diagrams by stress and diagError for eulerAPE’s diagrams
with ellipse is not statistically significant—using R’s pro.test with
Yates’ continuity correction disabled, x2(1) = 2.48, p = 0.12).
The differences between venneuler’s and eulerAPE’s diagrams
with circles could be less expected. A Friedman rank sum test for
non-normal distributions and repeated-measure data revealed a
significant effect of drawing method on stress (x2(1) = 5402.3, p,
2.2610216) and diagError (x2(1) = 609.1, p,2.2610216). Post-hoc
tests using Wilcoxon tests with Bonferroni correction showed
significant differences between venneuler and eulerAPE with a
large effect size on stress (W = 1763624, Z = 280.50, p,
2.2610216, r = 0.57) and a medium effect size on diagError(W = 14730686, Z = 235.58, p,2.2610216, r = 0.25). So accord-
ing to these measures venneuler’s diagrams were more accurate
than those of eulerAPE. However, while all of eulerAPE’s
diagrams depicted the required regions, 35.5% of venneuler’s
diagrams had missing regions and yet 83.5% of these diagrams
had a low stress (stress,1022). So, eulerAPE’s diagrams could still
be more helpful than those of venneuler as all the required set
relations are depicted. Also, out of the 10,000 diagrams drawn by
eulerAPE with circles, zero (i.e., 0%) had diagError #1026
(Section 4.3), but 28 (i.e., 0.3%) had stress #1026 (the difference
between these percentages is statistically significant—using R’s
pro.test with Yates’ continuity correction disabled, x2(1) = 28.04,
p = 1.1961027). Thus, with 99% confidence, these stress results
indicate that a good diagram with stress #1026 can be generated
with circles for 0.2% to 0.5% of random 3-set data by eulerAPEand for 0.0% to 0.1% of the same type of data by venneuler. The
diagError of these diagrams that were considered good by stresswas still relatively low and close to diagError #1026.
This evaluation also revealed that if the required areas for the
regions in only one curve are around twice as large as those for the
regions in only two curves, and the area for the region in exactly
the three curves is larger or as large as the areas for the regions in
only one curve, then it is highly likely that a close to accurate area-
proportional 3-Venn diagram drawn with circles exists.
With respect to the time taken to generate each diagram,
venneuler was faster than eulerAPE. The median and mean
generation time of venneuler were 0.6 seconds each, with a
minimum of 0.4 seconds and a maximum of 1.0 second. The
median and mean times for eulerAPE to generate a diagram with
ellipses were 0.4 seconds and 5.3 seconds and with circles 3.2
seconds and 3.4 seconds. This could be due to the various
differences between venneuler and eulerAPE (e.g., the method to
compute the region areas; the way the optimization is run and
terminated after a maximum of 200 iterations). Despite this,
eulerAPE generates more accurate diagrams than venneuler and
within a time that ensures users’ attention is maintained (Section
4.2).
4.4. Comparison with Circles and Polygons, and VariousDrawing Methods
Area-proportional 3-Venn diagrams are used extensively in
various disciplines to facilitate data analysis, but often the diagrams
are more misleading than helpful due to the limitations of the
curve shapes used by current drawing methods. We investigated
this further using real world medical data obtained from a BMC
Medicine journal article [37]. Diagrams for this data were
generated using most of the current drawing methods (Section
‘Current Automatic Drawing Methods and Software’). These were
then analysed and compared with the diagram generated by
eulerAPE using ellipses.
The selected article discusses the results from a web-based
survey that assessed whether US trainees in family and internal
medicine are aware of the complications, screening methods and
therapy for chronic kidney disease (CKD). This survey data was
comprised of sets A, B and C: trainees who claimed that secondary
hyperparathyroidism is a complication of CKD (set A); trainees
who screened by stage 3 of CKD (set B); trainees who commenced
therapy or referred the patient to a specialist when parathyroid
hormone (PTH) reached a level of PTH.70 ng/ml (set C). The
set relations and associated quantitative data can be summarized
as v = {A = 0.25, B = 0.01, C = 0.11, AB = 0.10, AC = 0.29,
BC = 0.03, ABC = 0.15}. To raise awareness that current trainees
need further skills and guidelines to timely identify and manage
patients with CKD, an area-proportional Venn diagram with
respect to v (Figure 3-D) was included in the article.
Diagrams with respect to v were generated using eight circle-
based drawing methods (from those listed and cited in Section 2.1),
namely: C1, Stata’s PVENN; C2, Venn Diagram Plotter; C3, 3
Circle Venn; C4, a module in PatternLab for proteomics; C5,
BioVenn; C6, Vennerable circles; C7, venneuler; C8, Google
Venn Charts. Other diagrams with respect to v were generated
using six polygon-based drawing methods (from those listed and
cited in Section 2.2), namely: P1, VennMaster, with regular,
circle-like polygons; P2, Vennerable triangles, with triangles; P3,
DrawVenn, with rectilinear polygons; P4, Vennerable squares,
Figure 13. The figure in a medical journal article and the figure recreated with eulerAPE. (A) The figure with two Venn diagrams drawnwith circles in a medical journal article [37]. This is a redrawing of Figure 5 in [37], previously published under a CC BY license. (B) The figure as itwould have looked like if the diagrams were drawn with ellipses using eulerAPE. Labels for eulerAPE’s diagrams were added manually.doi:10.1371/journal.pone.0101717.g013
eulerAPE: Drawing Area-Proportional 3-Venn Diagrams Using Ellipses
PLOS ONE | www.plosone.org 15 July 2014 | Volume 9 | Issue 7 | e101717

with rectangular polygons; P5, Convex Venn-3, with 4-sided and
5-sided convex polygons; P6, DrawEuler, with irregular, non-
convex polygons. All the diagrams are available in Figure 3,
together with the diagram generated by E, eulerAPE with ellipses.
The design of each diagram (e.g., labels, legend, colours, outlines,
background) is precisely the same as that generated by the drawing
method. Curve labels were only added to C2, P3 and P6 as no
labels or legend are provided with the diagram. The numeric
labels in eulerAPE’s diagram were added manually to illustrate
how the diagram in the article would have looked like if it was
drawn with ellipses.
The diagError was devised to compute the error of only those
diagrams that depict all the required set relations, as diagrams with
missing regions are more misleading than those with inaccurate
region areas and should not be accepted altogether. Thus, Figure 3
shows the diagError of only those diagrams with seven regions
interior to their curves as required by the data. For the other
diagrams, the missing regions are noted. To calculate diagErrorusing Equation (2), the region areas of the diagrams were
computed using eulerAPE’s analytic method for those drawn
with circles and standard geometry formulae for those drawn with
polygons.
In Figure 3, we note that all the diagrams drawn with circles
including D (the diagram in the article) have inaccurate region
areas and are misleading. For instance, region B (1% in v) is much
larger than region BC (3% in v), region C (11% in v) is larger
than regions AB (10% in v) and ABC (15% in v), and region A(25% in v) in most diagrams is larger than region AC (29% in v).
Similar problems are also evident in C7, the diagram generated by
the latest method venneuler. C3, generated by the first circle-based
drawing method 3 Circle Venn, also has region ABC (15% in v)
similar in area to that of region AC (29% in v). The same is
evident in D, as D was generated by the method of C3. However,
C8 is the most misleading and inaccurate, as region BC is missing
and regions B and AB (respectively 1% and 10% in v) are much
larger than regions C, AC and ABC (respectively 11%, 29% and
15% in v). With respect to diagError, the most accurate are C4
and C7 (diagError = 0.03), followed by C2, C5, C6 (diagError= 0.04) and C1 (diagError = 0.05), and finally C3 and thus D
(diagError = 0.14). Due to the regularity and good continuation of
circles, the curves are often easily distinguishable and identifiable.
In a few cases (e.g., C3 and D), it is difficult to comprehend in
which curves the regions are located. However, this is often down
to design as, for instance, different unrelated colours are used for
regions located in the same curve (e.g., C2, C3, C6).
In contrast, most of the diagrams with polygons are either
accurate with diagError #1026, as P3, P5, P6, or have region
areas that are less misleading than those of diagrams with circles,
as P2, P4. The latter is true as for instance, consistent with v,
region B is always the smallest and region AC is always the largest.
The only diagram with missing regions (regions C and BC) is P1
generated by the non-deterministic method VennMaster. Since
the curves are depicted as regular, circle-like polygons, Venn-
Master has the same limitations as others that use circles. Though
the diagrams with polygons are more accurate than those with
circles, the curves are non-smooth. So the curves are not easily
identified [65] and are less likely to pop out as discrete and
complete objects [2]. Curve identification is particularly difficult
when, for instance: the curves met at bending points, as P5 and P6;
the curves are partially concurrent, as P2, P3, P4; the curves are
non-convex, as P6. Such features impede diagram comprehension
[32,64], making these diagrams accurate but not usable. Thus, the
preference for the less accurate diagrams with circles instead of
polygons.
Using ellipses, diagram E has region areas that are accurately
and directly proportional to the quantities in v (diagError #
1026). It is also easy to comprehend, as the curves are regular and
have good continuation like circles. So ellipses can be more
effective than both circles and polygons. This was also demon-
strated with other real world data in Section ‘Introduction’, where
Figure 2 illustrates the accurate and easy to comprehend diagrams
generated by eulerAPE with ellipses as alternatives to the
respective misleading diagrams drawn with circles in Figure 1A–
C and the incomprehensible diagrams drawn with polygons in
Figure 1D–F. Being the only method that uses ellipses, the
effectiveness of ellipses could be the primary reason why eulerAPEis being used in various areas and why its diagrams are appearing
in various journal articles (discussed in Section ‘Introduction’). The
design of the diagrams adopted by eulerAPE is also different from
that of other drawing methods, as eulerAPE uses a heterogeneous
channel-based approach [2] whereby different feature types (i.e.,
outline, colour, texture) that are perceptually processed in parallel
are used. In this way, none of the curve designs fuse perceptually at
overlaps, and the curves and the regions are easily identified.
Another area-proportional 3-Venn diagram for the same data
sets but for the management of anaemia rather than secondary
hyperparathyroidism (so set C was based on the haemoglobin level
rather than parathyroid hormone) was included in the article, as
shown in Figure 13. As explained earlier, Figure 13Aii (replica of
Figure 3-D) is misleading due to inaccuracies in the region areas.
Figure 13Ai could be more misleading as besides inaccuracies in
the region areas (e.g., region B with 3% is larger than region ACwith 4%; region A with 36% is larger than region AB with 41%),
seven regions are shown when according to the data (i.e.,
{A = 0.36, B = 0.03, C = 0.00, AB = 0.41, AC = 0.04, BC = 0.00,
ABC = 0.11}), regions C and BC should not be depicted.
Currently eulerAPE draws highly accurate 3-Venn diagrams even
when regions are very small and barely visible. So, Figure 13Bi,generated by eulerAPE with respect to {A = 0.36, B = 0.03,
C = 0.00001, AB = 0.41, AC = 0.04, BC = 0.00001, ABC = 0.11},
could be used instead of Figure 13Ai. Looking at Figure 13Bi and
ii, we can easily note that though most participants claimed that
anaemia and secondary hyperparathyroidism were complications
of CKD (set A), timely screening (set B) was more common with (i)anaemia than (ii) secondary hyperparathyroidism, while com-
mencement of therapy or referral to a specialist (set C) was more
often delayed when diagnosis was based on the (i) haemoglobin
level than on the (ii) parathyroid hormone level. Thus, Figure 13B
could have been more effective than Figure 13A in raising
awareness of the need for trainees to be provided with further
guidelines in managing CKD.
Conclusions
We have described eulerAPE, the first automated method for
drawing area-proportional 3-Venn diagrams using ellipses. Previ-
ous methods used either circles or polygons. Circles are smooth
and generate easy to comprehend diagrams, but are limited as
they cannot draw accurate diagrams for most 3-set data. Polygons
are flexible and generate accurate diagrams, but their non-smooth
curves produce difficult to comprehend diagrams.
Our evaluation indicates that using ellipses and eulerAPE,
accurate area-proportional 3-Venn diagrams can be drawn for a
large majority of random 3-set data (86%, N = 10000), far more
than is possible with the circles that are highly preferred over
polygons. So curves that are smooth like circles but more general
like ellipses should be considered whenever a diagram cannot be
drawn accurately with circles. This finding opens a wider research
eulerAPE: Drawing Area-Proportional 3-Venn Diagrams Using Ellipses
PLOS ONE | www.plosone.org 16 July 2014 | Volume 9 | Issue 7 | e101717

question as to whether curves with different degrees of freedom
such as circles, ellipses, ovals, n-ellipses, regular n-gons and
irregular n-gons could be considered progressively from the most
specific to the more general until a curve type that generates an
accurate diagram for the required region areas is found [30].
The results of our evaluation also indicate great potential for
using ellipses to draw area-proportional diagrams with more
curves. However, first, further evaluation should be conducted to
assess the effectiveness of ellipses and a method like eulerAPE in
handling 3-set data that requires an area of zero for various
regions in the diagram. Following this, characteristics of different
types of quantitative 3-set data that can or cannot be depicted
accurately with an area-proportional diagram drawn with ellipses
should be determined, and analytic methods that identify whether
a diagram can be drawn accurately for the given data should be
formalized.
Apart from the shape of the curves, diagram design features
(e.g., colours, labelling strategies) can also facilitate or impede
understanding of the diagram and the depicted data. The effect of
such features and the possible benefits of adding interaction should
be investigated. Other features that could aid understanding for
users with different abilities (e.g., spatial and numeracy abilities)
should also be identified.
A number of the studies could be conducted to understand: how
such diagrams are processed perceptually and cognitively; how
region areas are perceived; the effect of the shape of the regions
and curves on area judgement; what discrepancies in areas are not
noticeable; whether perceptual scaling measures like those
proposed for map symbols in cartography [66], but highly
criticized by Tufte [67], aid or hinder area judgement in these
diagrams. The findings of these studies will aid in the identification
of diagrams whose region area errors are not human detectable. In
this way, an inaccurate diagram drawn with ellipses for the
required data could be considered accurate for human use and
perception and so, it could be drawn with ellipses rather than other
more complex curves with less desirable features, such as irregular
and jagged polygons. A study should also determine whether
numeric labels in the regions could conceal errors in region areas,
thus allowing the use of smooth curves.
Following these studies, aesthetic criteria, metrics and cognitive
measures as well as perceptual and design guidelines defining an
effective, good diagram for human use that facilitates comprehen-
sion and reasoning should be formalized and prioritized. A variant
of eulerAPE should then be devised to optimize such measures,
such that a diagram that is the best compromise between region
area accuracy and aesthetics is generated. Such a diagram should
ideally have all the important aesthetic features and none of its
region area inaccuracies should be noticeable to the human user.
This would be particularly important for data for which an
accurate diagram with specific aesthetic features cannot be drawn.
With such a compromise, an inaccurate diagram with smooth
curves whose errors are not human detectable could be generated.
It might also be interesting to assess the effectiveness of allowing
users to select aspects of the diagram that they consider important
and they would like to optimize. Such aspects could include
aesthetic features, such as the shape of certain curves or the
accuracy of the regions.
Acknowledgments
We acknowledge Prof Leland Wilkinson (University of Illinois at Chicago)
for providing us the source code of venneuler [29]. We thank Angela
Morelli (Graphic and Information Designer, Central Saint Martins College
of Art and Design, UK) for her feedback on the diagram designs.
Author Contributions
Conceived and designed the experiments: LM PR. Performed the
experiments: LM. Analyzed the data: LM PR. Contributed reagents/
materials/analysis tools: LM. Wrote the paper: LM PR.
References
1. Treisman A, Souther J (1985) Search asymmetry: a diagnostic for preattentive
processing of separable features. Journal of Experimental Psychology: General
114: 285–310.
2. Ware C (2012) Information Visualization: Perception for Design, 3rd Edition.
Waltham, MA, USA: Morgan Kaufmann.
3. Palmer SE (1992) Common region: A new principle of perceptual grouping.
Cognitive Psychology 24: 436–447.
4. Koffka K (1935) Principles of Gestalt Psychology. New York, NY, USA:
Harcourt Brace.
5. Chow S, Ruskey F (2004) Drawing Area-Proportional Venn and Euler
Diagrams. Proceedings of the 11th International Symposium on Graph Drawing
(GD 2003), Lecture Notes in Computer Science 2912: 466–477.
6. Treisman A (1985) Preattentive Processing in Vision. Computer Vision,
Graphics, and Image Processing 31: 156–177.
7. Treisman AM, Gelade G (1980) A feature-integration theory of attention.
Cognitive Psychology 12: 97–136.
8. Lam HT, Tuong NV, Ekerljung L, Ronmark E, Lundback B (2011) Allergic
rhinitis in northern vietnam: increased risk of urban living according to a large
population survey. Clinical and Translational Allergy 1: 1–8.
9. Mathioni SM, Belo A, Rizzo CJ, Dean RA, Donofrio NM (2011) Transcriptome
profiling of the rice blast fungus during invasive plant infection and in vitro
stresses. BMC Genomics 12: 49.
10. Nikulenkov F, Spinnler C, Li H, Tonelli C, Shi Y, et al. (2012) Insights into p53
transcriptional function via genome-wide chromatin occupancy and gene
expression analysis. Cell Death & Differentiation 19: 1992–2002.
11. Regenbrecht CRA, Jung M, Lehrach H, Adjaye J (2008) The molecular basis of
genistein-induced mitotic arrest and exit of self-renewal in embryonal carcinoma
and primary cancer cell lines. BMC Medical Genomics 1: 49.
12. Dzeing-Ella A, Obiang PCN, Tchoua R, Planche T, Mboza B, et al. (2005)
Severe falciparum malaria in Gabonese children: clinical and laboratory
features. Malaria Journal 4.
13. Mann K, Mann M (2011) In-depth analysis of the chicken egg white proteome
using an LTQ Orbitrap Velos. Proteome Science 9: 7.
14. Huber JA, Morrison HG, Huse SM, Neal PR, Sogin M, et al. (2009) Effect of
PCR amplicon size on assessments of clone library microbial diversity and
community structure. Environmental Microbiology 11: 1292–1302.
15. Bailey NW, Veltsos P, Tan Y-F, Millar AH, Ritchie MG, et al. (2013) Tissue-
Specific Transcriptomics in the Field Cricket Teleogryllus oceanicus. G3: Genes,
Genomes, Genetics 3: 225–230.
16. Reid RJD, Gonzalez-Barrera S, Sunjevaric I, Alvaro D, Ciccone S, et al. (2011)
Selective ploidy ablation, a high-throughput plasmid transfer protocol, identifies
new genes affecting topoisomerase I–induced DNA damage. Genome Research
21: 477–486.
17. Wang YY, Chang RB, Liman ER (2010) TRPA1 is a component of the
nociceptive response to CO2. The Journal of Neuroscience 30: 12958–12963.
18. Klees RF, Salasznyk RM, Vandenberg S, Bennett K, Plopper GE (2007)
Laminin-5 activates extracellular matrix production and osteogenic gene
focusing in human mesenchymal stem cells. Matrix biology 26: 106–114.
19. Bielecki P, Komor U, Bielecka A, Musken M, Puchałka J, et al. (2013) Ex vivo
transcriptional profiling reveals a common set of genes important for the
adaptation of Pseudomonas aeruginosa to chronically infected host sites.
Environmental Microbiology 15: 570–587.
20. Ma X, Feng B, Ma H (2012) AMS-dependent and independent regulation of
anther transcriptome and comparison with those affected by other Arabidopsis
anther genes. BMC plant biology 12: 23.
21. Liao L, Xu X-W, Jiang X-W, Wang C-S, Zhang D-S, et al. (2011) Microbial
diversity in deep-sea sediment from the cobalt-rich crust deposit region in the
Pacific Ocean. FEMS Microbiology Ecology 78: 565–585.
22. Zielinski J, Bednarek M, Gorecka D, Viegi G, Hurd SS, et al. (2006) Increasing
COPD awareness. European Respiratory Journal 27: 833–852.
23. McNamara C, Konkol NR, Ross BP, Mitchell R (2011) Characterization of
Bacterial Colonization of Stone at Global and Local Scales. Smithsonian
Contributions to Museum Conservation 2: 29–36.
24. Farrell G, Sousa W (2001) Repeat victimization and hot spots: the overlap and
its implications for crime control and problem-orientated policing. Crime
Prevention Studies 12: 221–240.
eulerAPE: Drawing Area-Proportional 3-Venn Diagrams Using Ellipses
PLOS ONE | www.plosone.org 17 July 2014 | Volume 9 | Issue 7 | e101717

25. Dang T, Anand A, Wilkinson L (2012) FmFinder: Search and Filter Your
Favorite Songs. Advances in Visual Computing, Lecture Notes in ComputerScience 7431: 348–358.
26. Cibella F, Cuttitta G, La G, Stefania, Melis MR, et al. (2011) Proportional Venn
diagram and determinants of allergic respiratory diseases in Italian adolescents.Pediatric Allergy and Immunology 22: 60–68.
27. Soriano JB, Davis KJ, Coleman B, Visick G, Mannino D, et al. (2003) TheProportional Venn Diagram of Obstructive Lung Disease*: Two Approxima-
tions From the United States and the United Kingdom. CHEST 124: 474–481.
28. Viegi G, Matteelli G, Angino A, Scognamiglio A, Baldacci S, et al. (2004) Theproportional Venn diagram of obstructive lung disease in the Italian general
population. CHEST 126: 1093–1101.29. Wilkinson L (2012) Exact and approximate area-proportional circular Venn and
Euler diagrams. IEEE Transactions on Visualization and Computer Graphics18: 321–331.
30. Chow SC (2007), Generating and Drawing Area-Proportional Venn and Euler
Diagrams, PhD thesis, Department of Computer Science, University of Victoria,Victoria, BC, Canada.
31. Benoy F, Rodgers P (2007) Evaluating the comprehension of Euler diagrams.Proceedings of the 11th International Conference on Information Visualization
(IV): 771–780.
32. Blake A, Stapleton G, Rodgers P, Cheek L, Howse J (2014) The Impact of Shapeon the Perception of Euler Diagrams. Proceedings of the 8th International
Conference on the Diagrammatic Representation and Inference (Diagrams) inpress.
33. Won J, Charette JR, Philip VM, Stearns TM, Zhang W, et al. (2014) GeneticModifier Loci of Mouse Mfrp rd6 Identified by Quantitative Trait Locus
Analysis. Experimental Eye Research 118: 30–35.
34. Burdon FJ, McIntosh AR, Harding JS (2013) Habitat loss drives thresholdresponse of benthic invertebrate communities to deposited sediment in
agricultural streams. Ecological Applications 23: 1036–1047.35. Gresnigt MS, Becker KL, Smeekens SP, Jacobs CWM, Joosten LAB, et al.
(2013) Aspergillus fumigatus—Induced IL-22 Is Not Restricted to a Specific Th
Cell Subset and Is Dependent on Complement Receptor 3. The Journal ofImmunology 190: 5629–5639.
36. Chow S, Rodgers P (2005) Constructing area-proportional Venn and Eulerdiagrams with three circles. Proceedings of the 2nd International Workshop on
Euler Diagrams.37. Lenz O, Fornoni A (2006) Chronic kidney disease care delivered by US family
medicine and internal medicine trainees: results from an online survey. BMC
Medicine 4: 30.38. Hulsen T, De V, Jacob, Alkema W (2008) BioVenn—a web application for the
comparison and visualization of biological lists using area-proportional Venndiagrams. BMC Genomics 9: 488.
39. Bouyer D, Roudier F, Heese M, Andersen ED, Gey D, et al. (2011) Polycomb
repressive complex 2 controls the embryo-to-seedling phase transition. PLoSGenetics 7: e1002014.
40. Carvalho PC, Fischer JSG, Chen EI, Yates JR, Barbosa VC (2008) PatternLabfor proteomics: a tool for differential shotgun proteomics. BMC Bioinformatics
9: 316.41. Chun HB, Scott M, Niessen S, Hoover H, Baird A, et al. (2011) The proteome
of mouse brain microvessel membranes and basal lamina. Journal of Cerebral
Blood Flow & Metabolism 31: 2267–2281.42. Rochman M, Taher L, Kurahashi T, Cherukuri S, Uversky VN, et al. (2011)
Effects of HMGN variants on the cellular transcription profile. Nucleic AcidsResearch 39: 4076–4087.
43. Jepsen JU, Biuw M, Ims RA, Kapari L, Schott T, et al. (2012) Ecosystem
Impacts of a Range Expanding Forest Defoliator at the Forest-Tundra Ecotone.Ecosystems: 1–15.
44. Szeles L, Poliska S, Nagy G, Szatmari I, Szanto A, et al. (2010) Researchresource: transcriptome profiling of genes regulated by RXR and its permissive
and nonpermissive partners in differentiating monocyte-derived dendritic cells.
Molecular Endocrinology 24: 2218–2231.45. Shiqun LS (2009) Customized Proportional Venn Diagrams from SAS Syste.
Proceedings of the 22nd NorthEast SAS Users Group Annual Conference(NESUG).
46. Kang Y, Norris MH, Zarzycki-Siek J, Nierman WC, Donachie SP, et al. (2011)
Transcript amplification from single bacterium for transcriptome analysis.
Genome research 21: 925–935.
47. Kestler HA, Muller A, Gress TM, Buchholz M (2005) Generalized Venn
diagrams: a new method of visualizing complex genetic set relations.
Bioinformatics 21: 1592–1595.
48. Kestler HA, Muller A, Kraus JM, Buchholz M, Gress TM, et al. (2008)
VennMaster: Area-proportional Euler diagrams for functional GO analysis of
microarrays. BMC Bioinformatics 9: 67.
49. Rodrigues FA, Marcolino-Gomes J, Carvalho JdFC, Nascimento LCd,
Neumaier N, et al. (2012) Subtractive libraries for prospecting differentially
expressed genes in the soybean under water deficit. Genetics and Molecular
Biology 35: 304–314.
50. Marshall RJ (2005) Scaled rectangle diagrams can be used to visualize clinical
and epidemiological data. Journal of Clinical Epidemiology 58: 974–981.
51. Rodgers P, Flower J, Stapleton G, Howse J (2010) Drawing Area-Proportional
Venn-3 Diagrams with Convex Polygons. Proceedings of the 6th International
Conference on the Diagrammatic Representation and Inference (Diagrams),
Lecture Notes in Computer Science (Lecture Notes in Artificial Intelligence)
6170 6170: 54–68.
52. Wieland B, Wittwer M, Regula G, Wassenaar TM, Burnens AP, et al. (2005)
Phenon cluster analysis as a method to investigate epidemiological relatedness
between sources of Campylobacter jejuni. Journal of Applied Microbiology 100:
316–324.
53. Chow S, Ruskey F (2007) Minimum area Venn diagrams whose curves are
polyominoes. Mathematics Magazine 80: 91–103.
54. Martin B, Chadwick W, Yi T, Park S-S, Lu D, et al. (2012) VENNTURE—A
Novel Venn Diagram Investigational Tool for Multiple Pharmacological Dataset
Analysis. PLoS ONE 7: e36911.
55. Chow S, Ruskey F (2005) Towards a general solution to drawing area-
proportional Euler diagrams. Electronic Notes in Theoretical Computer Science
134: 3–18.
56. Kim B, Lee B, Seo J (2007) Visualizing set concordance with permutation
matrices and fan diagrams. Interacting with Computers 19: 630–643.
57. Stapleton G, Rodgers P, Howse J (2011) A general method for drawing area-
proportional Euler diagrams. Journal of Visual Languages & Computing 22:
426–442.
58. Rodgers P, Howse J, Stapleton G, Flower J (2014) Drawing Area-Proportional
Euler Diagrams Representing Up To Three Sets. IEEE Transactions on
Visualization and Computer Graphics 20.
59. Micallef L (2013), Visualizing Set Relations and Cardinalities Using Venn and
Euler Diagrams, PhD thesis, School of Computing, University of Kent,
Canterbury, UK. Available: http://www.cs.kent.ac.uk/people/staff/lm357/
PhDthesis.pdf.
60. Clark AK (1976) Re-evaluation of Monte Carlo studies in nonmetric
multidimensional scaling. Psychometrika 41: 401–403.
61. Spence I, Young FW (1978) Monte Carlo studies in nonmetric scaling.
Psychometrika 43: 115–117.
62. Miller RB (1968) Response time in man-computer conversational transactions.
Proceedings of the December 9–11, 1968 (AFIPS) fall joint computer
conference, part I: 267–277.
63. Card SK, Robertson GG, Mackinlay JD (1991) The information visualizer, an
information workspace. Proceedings of the 9th SIGCHI Conference on Human
Factors in Computing Systems (CHI): 181–186.
64. Rodgers P, Zhang L, Purchase H (2012) Wellformedness Properties in Euler
Diagrams: Which Should Be Used? IEEE Transactions on Visualization and
Computer Graphics 18: 1089–1100.
65. Field DJ, Hayes A, Hess RF (1993) Contour Integration by the Human Visual
System: Evidence for a Local ‘‘Association Field’’. Vision Research 33: 173–193.
66. Montello DR (2002) Cognitive Map-Design Research in the Twentieth Century:
Theoretical and Empirical Approaches. Cartography and Geographic Informa-
tion Science 29: 283–304.
67. Tufte ER (1983) The Visual Display of Quantitative Information, 1st Edition.
Cheshire, CT, USA: Graphics Press.
eulerAPE: Drawing Area-Proportional 3-Venn Diagrams Using Ellipses
PLOS ONE | www.plosone.org 18 July 2014 | Volume 9 | Issue 7 | e101717


![Conhecimento Simbólico na Álgebra da Lógica de Boole e Venn (Symbolic Knowledge in Boole's and Venn's Algebra of Logic) [2011]](https://static.fdokumen.com/doc/165x107/63130073fc260b71020ee582/conhecimento-simbolico-na-algebra-da-logica-de-boole-e-venn-symbolic-knowledge.jpg)