Developing proportional reasoning in Mathematical Literacy students
169
Developing proportional reasoning in Mathematical Literacy students March 2010 Thesis presented in partial fulfilment of the requirements for the degree Master of Education at the University of Stellenbosch Supervisor: Mr A. I. Olivier Co-supervisor: Dr M.F. Gierdien Department of Curriculum Studies by Elmarie Meyer (Randewijk)
Transcript of Developing proportional reasoning in Mathematical Literacy students

Developing proportional reasoning in Mathematical Literacy students
March 2010
Thesis presented in partial fulfilment of the requirements for the degree
Master of Education at the
University of Stellenbosch
Supervisor: Mr A. I. Olivier Co-supervisor: Dr M.F. Gierdien
Department of Curriculum Studies
by Elmarie Meyer (Randewijk)

i
Declaration
By submitting this thesis/dissertation electronically, I declare that the entirety of the
work contained therein is my own, original work, that I am the owner of the copyright
thereof (unless to the extent explicitly otherwise stated) and that I have not previously
in its entirety or in part submitted it for obtaining any qualification.
March 2010 Copyright © 2010 Stellenbosch University All rights reserved

ii
Abstract
The aim of this research is three-fold. Firstly I aimed to show the difficulty of the
concept of proportional reasoning through empirical research. Several researchers
have shown the degree of difficulty learners experience with proportional reasoning
and have even indicated that many university students (and adults) do not have sound
proportional reasoning skills. Piaget’s controversial developmental levels classify
proportional reasoning as a higher order thinking skill in his highest level of
development, formal operational thought, and claims that most people do not reach
this level. The difficulty of proportional reasoning and the fact that it is a skill needed
within all Learning Outcomes of Mathematical Literacy creates a predicament in
terms of the difficulty of the subject in general. Is it then fair to classify Mathematical
Literacy as an inferior subject in the way it has been done over the last few years if it
is a subject that requires learners to operate at such a high level of thought through
proportional reasoning?
Secondly, I would like to confirm with the use of a baseline assessment that learners
entering Grade 10 Mathematical Literacy have poor proportional reasoning skills and
have emotional barriers to Mathematics and therefore Mathematical Literacy. The
research will be done in three private schools located in the West Coast District of the
Western Cape in South Africa. If learners in these educationally ideal environments
demonstrate poor proportional reasoning skills even though they were privileged
enough to have all the possible support since their formative years, then results from
overcrowded government schools may be expected to be even worse.
The learners in Mathematical Literacy classes often lack motivation, interest and
enthusiasm when it comes to doing mathematics. Through the baseline assessment I
confirm this and also suggest classroom norms and values that will help these learners
to become involved in classroom activities and educational discourse.

iii
Thirdly and finally this research will focus on the design of activities that will aim to
build on learners’ prior knowledge and further develop their proportional reasoning
skills. I argue that activities to develop proportional reasoning should take
equivalence of fractions as basis to work from. The activities will aim to help learners
to set up questions in such a way that they can solve it with techniques with which
they are familiar.
Interconnectivity will form a vital part to this investigation. Not only do I indicate the
interconnectivity between concepts in the Mathematical Literacy Learning Outcomes
of the National Curriculum Statement, but I would like to make these links clear to
learners when working through the proposed activities. Making links between
concepts is seen as a higher order thinking skill and is part of meta-cognition which
involves reflection on thoughts and processes.
In short, this research can be summarised as the design of activities (with proposed
activities) that aims to develop proportional reasoning by making connections
between concepts and requires of learners to be active participants in their own
learning.

iv
Opsomming
Die doel van hierdie navorsing is drieledig. Eerstens will ek die probleme met die
konsep van proporsionele denke uitlig deur eksperimentele ontwerp navorsing.
Verskeie navorsers verwys na die moeilikheidsgraad van probleme wat leerders
ondervind met proporsionele denke. Sommige van hierdie navorsers het ook bevind
dat verskeie universiteitstudente (en ander volwassenes) nie oor die vaardigheid van
proporsionele denke beskik nie. Piaget se kontroversiële ontwikkelingsvlakke
klassifiseer proporsionele denke as ‘n hoër orde denkvaardigheid in sy hoogste vlak
van ontwikkeling, formele operasionele denke, en noem dat meeste mense nooit
hierdie vlak bereik nie. Die hoë moeilikheidsgraad van proporsionele denke en die feit
dat dit ‘n vaardigheid is wat binne al die Leeruitkomste van Wiskundige Geletterdheid
benodig word veroorsaak ‘n dilemma as mens dit vergelyk met die moeilikheidsgraad
van die vak oor die algemeen.
Tweedens wil ek met behulp van ‘n grondfase assessering bewys dat leerders wat
Graad 10 Wiskunde Geletterdheid betree swak proporsionele denkvaardighede het,
gepaardgaande met emosionele weerstand teenoor Wiskunde en Wiskunde
Geletterdheid. Die navorsing sal gedoen word in drie privaatskole in die Weskus
distrik van die Wes-Kaap van Suid-Afrika. Indien leerders in hierdie ideale
opvoedkundige omstandighede swak proporsionele denkvaardighede ten toon stel, ten
spyte van die feit dat hulle bevoorreg was om sedert hulle vormingsjare alle moontlike
opvoedkundige ondersteuning te geniet, dan kan verwag word dat resultate komende
van oorvol staatskole selfs swakker mag wees.
By leerders in Wiskunde Geletterdheid klasse kan daar gereeld ‘n gebrek aan
motivering, belangstelling en entoesiasme ten opsigte van Wiskunde bespeur word.
Deur gebruik van die grondfase assessering wil ek hierdie stelling bewys en ook
voorstelle maak vir klaskamernorme en waardes wat sal help om die leerders meer
betrokke te maak by klaskameraktiwiteite en opvoedkundige gesprekke.

v
Derdens sal hierdie navorsing fokus op die ontwikkeling van aktiwiteite wat ten doel
sal hê om leerders se huidige kennis te versterk en hul proporsionele denkvaardighede
verder te ontwikkel. Ek wil dit stel dat aktiwiteite vir die ontwikkeling van
proporsionele denkvaardighede gebaseer moet wees op die konsep van gelykheid of
ekwavilensie van breuke. Die aktiwiteite sal leerders help om probleme op so ‘n wyse
te struktureer dat dit opgelos kan word deur die gebruik van ekwavilensie tegnieke
waarmee hulle reeds vertroud is.
‘n Belangrike aspek van hierdie navorsing is interkonnektiwiteit. Ek wil die
interkonnektiwiteit tussen aspekte in die Wiskunde Geletterdheid Leer Uitkomste van
die Nationale Kurrikulum Verklaring uitwys en hierdie verbande aan die leerders
duidelik maak deur die voorgestelde aktiwiteite. Die begrip van interkonnektiwiteit
word ook beskou as a hoër-orde denkvaardigheid en maak deel uit van meta-kognisie
wat handel oor refleksie oor gedagtes en prosesse.
In kort kan hierdie navorsing opgesom word as die ontwikkeling van aktiwiteite wat
ten doel het om die proporsionele denkvaardighede van leerders te ontwikkel en
konneksies te maak tussen verskeie konsepte terwyl daar van leerders vereis word om
aktief deel te neem aan hul eie leer van vaardighede en kennis.
vi
Table of Contents
Chapter one: Introduction .............................................................................................. 1
1.1 Overview ......................................................................................................................................... 1
1.2 Background and context of the inquiry................................................................................ 4
1.3 Rationale of the inquiry ............................................................................................................. 6
1.3.1 Why Mathematical Literacy?............................................................................................... 6
1.3.2 Why proportional reasoning? ............................................................................................. 7
1.4 Problem statement ....................................................................................................................... 9
1.5 Research approach ....................................................................................................................11
1.6 Scope ...............................................................................................................................................13
1.7 Limitations ....................................................................................................................................14
1.8 Importance of the research ....................................................................................................15
1.9 Outline and organisation of this report .............................................................................15
Chapter two: Literature Review ................................................................................... 17
2.1 The teacher’s perspective and the importance of fractions .......................................17
2.2 Understanding learners’ understanding of proportionality ......................................24
2.2.1 Noelting’s pedagogical approach to ratio ...................................................................27
2.2.2 Thompson and Thompson’s research in the mental process in moving from
ratio to rate ..........................................................................................................................................29
2.3 Summary ........................................................................................................................................31
Chapter three: Research ............................................................................................... 32
3.1 The theoretical approach to the baseline assessment ..................................................32
3.2 Analysis of the baseline assessment ....................................................................................33
3.3 Baseline assessment results ...................................................................................................42
3.3.1 Results for Question 1 ..........................................................................................................42
3.3.2 Results for Question 2 ..........................................................................................................44

vii
3.3.3 Results for Question 3 ..........................................................................................................47
3.3.4 Results for Question 4 ..........................................................................................................48
3.3.5 Result for Question 5 ............................................................................................................52
3.3.6 Concerning factors ................................................................................................................53
3.4 Section B: The questionnaire ................................................................................................54
3.4.1 Analysis of the questionnaire results ..............................................................................54
3.5 Conclusion ....................................................................................................................................61
Chapter four: Proposed didactical strategies for teaching proportional reasoning ...... 63
4.1 A theoretical approach to didactical strategies .............................................................63
4.1.1 Defining proportionality ....................................................................................................64
4.1.2 Proportional reasoning through-out the Mathematical Literacy National
Curriculum Statement ......................................................................................................................67
4.1.3 The theory of Realistic Mathematics Education.........................................................77
4.1.4 Interconnectivity .....................................................................................................................81
4.2 A psychological approach to Mathematical Literacy ..................................................84
4.2.1 Logical structured thought .................................................................................................84
4.2.2 Understanding .........................................................................................................................86
4.2.3 Classroom culture ..................................................................................................................88
4.3 Conclusion ....................................................................................................................................89
Chapter five: Towards a theory of teaching and learning proportional reasoning ...... 91
5.1 The didactical approach .........................................................................................................93
5.2 A Non-linear approach to developing proportional reasoning................................95
5.3 The didactics used for a linear approach .........................................................................98
5.3.1 Missing value ........................................................................................................................ 100
5.3.2 Comparison questions ....................................................................................................... 102
5.4 A linear approach to proportional reasoning .............................................................. 105
5.5 Activities used in the classroom ........................................................................................ 108

viii
5.5.1 The link between ratios and fractions ......................................................................... 109
5.5.2 Missing value, sharing and comparison..................................................................... 120
5.5.3 Percentages as fractions and ratios ............................................................................. 127
5.5.4 Ratio, scale and enlargements and reductions ........................................................ 132
5.5.5 Looking at rate and the role of ratio ........................................................................... 134
5.5.6 Conversions ........................................................................................................................... 140
5.5.7 Distinguishing between proportion and direct and indirect proportion ........ 141
5.6 Conclusion ....................................................................................................... 146
Conclusion ................................................................................................................. 148
References .................................................................................................................. 150
Addendum A .............................................................................................................. 154
Addendum B .............................................................................................................. 157
Addendum C .............................................................................................................. 159

1
Chapter one: Introduction
1.1 Overview
This investigation recounts research into proportionality as higher order thinking skill
in the Mathematical Literacy classroom and the problems encountered in developing
these skills within three private schools on the West Coast of the Western Cape in
South Africa. It is an account of activities designed from in-depth analysis of learners’
understanding of proportional reasoning that can potentially help to develop
proportional thinking skills with learners entering the field of Mathematical Literacy.
These learners often enter the Mathematical Literacy class with a number of
emotional and cognitive barriers towards Mathematics as I will show through a
baseline assessment.
Mathematics as being taught in schools is generally perceived as a subject to make
children mathematically literate, and although this is a major outcome of the subject,
Mathematics is also a mental discipline (Schoenfeld 1992: 35). Ideally teachers want
their learners to be inquisitive problem solvers by the time they leave school. We want
them to take whatever information is available, see what is applicable and use it to
solve intricate real-world problems, very much the process being followed when for
example solving geometry questions at school: use the theorems we know, see which
ones are applicable to the situation and use them to find the unknown. Unfortunately
this idea is not always the reality in schools.
Mathematics as mental discipline dates back as far as Plato. The idea that
mathematicians are good thinkers and those trained in Mathematics become good
thinkers can only be true if teachers give their learners opportunities to think. So often
teachers use a Pavlovian technique with their learners where learners have to spot a
stimulus and give a certain automatic response. Although giving an automatic
response requires some thought, it is not the thought processes of an autonomic, self-
thinking and individual that will develop high order thinking skills.

2
When the South African Department of Education enforced Mathematical Literacy as
compulsory alternative to Mathematics for all students within the National
Curriculum Statement in 2006, it placed both teachers and students in unfamiliar
terrain. This new initiative aims to empower all learners to be mathematically literate
by the time they leave school, meaning that learners should be able to identify,
interpret and understand mathematics in their daily lives. This includes comparing
prices, calculating discounts, interpreting map scales, understanding taxes, inflation
and interest, to mention but a few.
There has been some controversy about the meaning of mathematics in the “daily
lives” of teenagers. Certainly not all teenagers are active investors, car buyers or the
like (Julie 2006: 67). Although this is true, and many may argue that these teens
might need this knowledge once they become independent young adults, I believe that
the emphasis should be on the use and appreciation of Mathematics, rather than
forcing realistic but unfamiliar context upon them. In Mathematical Literacy, like in
many other subjects, context is used as vehicle to convey information. When learners
write newspaper articles in the language classrooms it does not make them journalists,
and since few young people still read newspapers the context may not even be that
familiar to them at all. Yet, whilst writing these articles, they are learning about
writing styles and techniques. When using a context in Mathematical Literacy, it is
mostly used as a problem solving approach where learners must evaluate and reflect
upon answers using the context. Using a financial context, does not mean that we
want learners to be financial advisers, it is used to spark thought and educational
discourse. When for example we refer to a choice between two investments, the
context guides learners to come to a conclusion after they have completed the
necessary calculations. Without a context the calculations would be meaningless. It is
important that teachers are empowered to teach in such a way that the intention of
meaning and appreciation for Mathematics may materialise. This emphasises the great
need for research into Mathematical Literacy.
What is of great concern, is the lack of qualified Mathematical Literacy teachers and
the lack of interest by Mathematics teachers to teach this new subject. Julie (1996)
reports that Mathematical Literacy is “more difficult to teach than the ‘normal’

3
school-going Mathematics”. Although no reasons were offered for this finding during
his research I would like to think that it is a combination of the following factors:
1. Often learners taking Mathematical Literacy have a negative attitude towards
Mathematics.
2. Some textbooks present Mathematical Literacy as watered down Mathematics
and this is de-motivating to both teachers and learners since it is perceived as
lower grade Mathematics.
3. Learners taking Mathematical Literacy and even teachers teaching
Mathematical Literacy are perceived to be less capable than learners taking
and teachers teaching Mathematics.
4. For a teacher to make Mathematical Literacy a challenging and enjoyable
subject, many additional resources need to be gathered which is time
consuming for already overburdened teachers.
I have had the experience more than once that learners taking Mathematics are
hesitant to ask Mathematical Literacy teachers for help since these learners perceive
teachers teaching Mathematical Literacy as less competent.
Learners taking Mathematical Literacy are also often labelled by learners taking
Mathematics as being “stupid” or “not clever enough” to take Mathematics. This does
not contribute towards building a positive Mathematics-specific self-esteem.
Teaching Mathematical Literacy places a heavy emotional and time management
burden upon teachers. The teacher in the Mathematical Literacy classroom cannot
only teach learners to be mathematically literate, but must build a sound self-esteem
in learners taking the subject so that they may too experience Mathematics as a
wonderful tool to interpret the world around them. They have to create an
appreciation for the subject by finding resources that will excite and entice their
learners – a difficult task indeed. Research into Mathematical Literacy is thus not only
to empower learners to discover the wonder of Mathematics, but to also empower
teachers to be enthusiastic about the possibilities of the subject.

4
This chapter is an introduction to the inquiry by first examining the background,
context and rationale for the investigation. The research problem is also set out before
looking at the research design and methodology. Finally the scope, importance and
limitations will be discussed before outlying the rest of the inquiry.
1.2 Background and context of the inquiry
Mathematical Literacy as compulsory alternative to Mathematics has always appealed
to me as a deserving initiative. The thought of empowering all learners with basic
Mathematical knowledge is a worthy cause. I have become increasingly passionate
about the possibilities of the new subject. There is a strong thread of proportionality
running through the Mathematical Literacy curriculum which is a hallmark of the
formal operational stage of development – the highest level of thought according to
Piaget’s levels of cognitive development (Inhelder & Piaget, 1958). Proportional
reasoning skills are essential in understanding a range of related concepts such as rate,
functions, percentages, appreciation, depreciation, trigonometry, enlargements and
reductions, to mention but a few.
Many researchers have reported on the difficulties that students have with
proportional reasoning and have identified some of the variables that affect problem
difficulty (Abramowitz 1974; Karplus, Pulos & Stage 1983; Hart 1981, 1984;
Noelting 1980a, 1980b; Rupley 1981). More than a mere lesson or two must be spent
on ratios for learners to master the concept and accompanying proportional reasoning
skills, yet many Mathematical Literacy have very limited sections on this concept.
It is important to realise that although the learners taking Mathematical Literacy may
not be talented in manipulating algebraic expressions or recognise theorems in a
complex geometric drawing, they are not mathematically illiterate. Many skills being
developed in Mathematics classes are in fact of little particular use to the average
adult and I am doubtful if many highly successful doctors, accountants or even
lawyers can still remember how to factorise a trinomial. What would have been of
value to them, would have been the development of specific thought patterns that
would aid them in drawing up a budget, calculating the effect of higher interest rates

5
and inflation, reading a map and calculating distance or even something simple as
manipulating a recipe. But, as mentioned earlier, these concepts all have proportional
reasoning as foundation and to fully understand these concepts sound proportional
reasoning skills are necessary.
In my grade 12 Mathematical Literacy class of 2008, I had 23 learners of who 22 took
either Dance, Drama, Visual Arts or a combination of these subjects. It made me
realise that the learners in my class may not be as capable as I am in solving intricate
Mathematics problems, but that they are talented far beyond my own capabilities in
other interest fields. Each of them bring a unique set of experiences and interests to
the classroom and it is my responsibility to use these interests as window through
which learners can see the wonder of Mathematics. Would it be fair to judge these
learners’ intelligence based on their ability to manipulate algebraic or trigonometry
expressions?
In 2008 a grade 11 girl taking Mathematics requested to move to Mathematical
Literacy since she felt that she was not coping in Mathematics. I provided her with the
work she missed out on and scheduled tutorials for her to catch up. After about a
month, and poor progress, she requested to move back to the Mathematics class. She
explained that Mathematical Literacy was just beyond her grasp and she found
Mathematics much easier. Learners who failed grade 9 Mathematics, unlike this girl
who did fairly well in grade 9, and have been in Mathematical Literacy ever since the
start of grade 10, were able to easily score between 60% and 80% on the same tests
she was not able to pass.
This made me even more curious as to the nature of Mathematical Literacy. To what
extent am I empowering the learners in my Mathematical Literacy classes? What
skills have they acquired that this girl lacked? Is it possible to change the perception
that currently exists around Mathematical Literacy?

6
1.3 Rationale of the inquiry
1.3.1 Why Mathematical Literacy?
Mathematical Literacy is defined as a subject driven by life-related applications of
mathematics. It enables learners to develop the ability and confidence to think
numerically and spatially in order to interpret and critically analyse everyday
situations and to solve problems (Department of Education 2006a: 9).
Little work has been done in the new field of Mathematical Literacy and many
Mathematics teachers believe that it will also die a silent death as other “Applied
Mathematics” subjects of the past, such as . To keep this initiative alive it is of the
utmost importance that research must be conducted that will show the subject’s worth
and the valuable position it has in the curriculum.
Unlike the heavily loaded curriculum of Mathematics, Mathematical Literacy has a
less intensive work load. The approach in Mathematical Literacy is more on
developing logic and problem-solving techniques than on the manipulation of
expressions as we find so often in Mathematics. Mathematical Literacy provides the
teacher with time to develop thought and investigate Mathematics and Mathematical
procedures in all aspects of life. It is important to have teachers teaching
Mathematical Literacy that will encourage thought and that are aware of the
Mathematics around them.
North (2008) has remarked how Mathematical Literacy has changed his outlook on
life. He uses the example of going to Mugg and Bean for a bottomless coffee. He was
given a big mug instead of a standard size cup for his coffee and started wondering
why the restaurant would do this? On investigation, he realised that people who are
given a cup, tend to drink two cups of coffee, and people who were given a mug
would normally have just one helping. He asked the waitress to supply him with a
cup, a mug and a big glass of water. After filling the cup with water twice and filling
the mug using the water in the cups, he found that two cups could hold more coffee
than one mug. To save on their bottomless coffee, it is better for the management of
Mugg and Bean to give their clients a mug rather than a cup. Other teachers of
Mathematical Literacy could relate similar stories. If Mathematical Literacy teachers

7
could develop this investigative outlook with their students, may change the way
Mathematical Literacy is currently perceived.
The didactical strategies involved in teaching Mathematical Literacy are complex. It
follows a strong Learning Support (remedial) approach to teaching, not only in the
content but also in attitudes. If teachers are not excited and interested themselves in
the subject, their learners will not be excited and involved either.
1.3.2 Why proportional reasoning?
“Proportionality underlies key aspects of number, algebra, shape, space and measures,
and handling data1. It is also central in applications of mathematics in subjects such as
science, technology, geography and art” (Department of Education & Employment
1999: 5). Proportional reasoning underlies nearly all content in the Mathematical
Literacy National Curriculum Statement. If we look at an example of comparing
prices:
If one apple costs 15c, how much would five apples cost? We work with the
equivalent ratios of 1:15 and 5:75
We also use proportional reasoning in map scales, functions, calculus, enlargements
and reductions, probabilities, percentages, tax and especially trigonometry.
Proportional reasoning can be seen as the foundation of all learning content in
Mathematical Literacy and it is thus important that teachers help learners in building a
strong foundation for their learning structures.
Many leading researchers (such as Carpenter, Fennema, Franke, Levi & Empson
1999; Tournaire & Pulos 1985) have identified the difficulty that learners experience
with proportional reasoning and state that many of them, even as adults, never fully
1 There is a strong correlation between the UK Framework for Teaching and South Africa’s five Learning
Outcomes in Mathematics and Mathematical Literacy: LO1 : Numbers, Operations and Relationships, LO2 :
Patterns, Functions and Algebra, LO3 : Space and Shape, LO4 : Measurement and LO5 : Data Handling

8
develop the ability. If there are adults who are not able to reason proportionally, how
do Mathematical Literacy teachers develop proportional reasoning with learners who
have predominant negative experiences in Mathematics? How do teachers engage
them in activities that will make them think proportionally if they associate
Mathematics (and Mathematical Literacy) with feelings of failure and confusion?
Although researchers have identified the problems associated with proportional
reasoning and defined levels of developing proportional reasoning (such as Noelting
1980; Carpenter et al. 1999), little has been done on solutions to the problem. In the
words of Lamon (1993) “we need to move beyond the level of identifying a litany of
task variables that affect problem difficulty, toward the identification of components
that offer more explanatory power for children's performances in the domain.”
Guidelines towards teaching and developing proportional reasoning are available, but
researchers (e.g., Lamon 1999) agree that proportional reasoning entails much more
than setting up a proportion and cross-multiplying. In particular, a proportional
reasoner should be able to do the following:
1. solve a variety of problem types (Carpenter et al. 1999; Cramer, Post, &
Currier 1993; Behr & Lesh 1989; Karplus et al. 1983b; Lamon 1993b;
Noelting 1980; Post, Lesh, & Behr 1988)
2. discriminate proportional from non-proportional situations (Cramer et al.
1993; Lamon 1995)
3. understand the mathematical relationships embedded in proportional
situations (Cramer et al. 1993; Lesh et al. 1988).
It should be clear from the three identified learning outcomes that, unlike what many
teachers and learners might believe, proportional reasoning entails a lot more than
merely the manipulation of ratio problems. Many textbook chapters labelled “Ratio
and Proportion” present a few ratio word problems as the extent of the concept.
Proportionality is a much wider concept and not seeing it as such is in my opinion a
cause for great concern. As the research above suggests, to reason proportionally (and
reach higher levels of thought), one must be able to think of proportionality in its

9
wider sense of meaning. To think that it is merely the manipulation of ratios is to sell
oneself short of the wonder of Mathematics and its interconnectivity. Wu (2002) uses
the following analogy fr the problem of transferring knowledge in Mathematics: “We
endeavour to make students see the individual trees clearly but, in the process, we
short-change them by not calling their attention to the forest.” Using one’s knowledge
of ratios to better understand functions, rate and percentages is fundamental in
developing sound proportional reasoning. This is why the researchers say that
children need to solve a variety of problem types. This variety must include direct,
indirect and proportion with a constant, such as y = mx + c, so that learners can
distinguish between proportional and non-proportional situations. This all helps in
understanding the mathematical relationships embedded in proportional situations.
The aim of this study will be to focus on proportionality (not merely ratio) and how
we can develop proportional skills in such a way that learners will be able to see
proportionality in a variety of Mathematical concepts.
1.4 Problem statement
How should Mathematical Literacy teachers design activities that will help learners to
develop proportional reasoning skills?
Key questions that will arise from this research problem:
1. How can existing research on proportional reasoning help learners to develop
proportional reasoning?
2. How important is proportional reasoning within the Mathematical Literacy
National Curriculum Statement and how can the concept of proportional
reasoning be developed as an interconnected knowledge structure within the
National Curriculum Statement?
3. How can proportional reasoning activities be designed and sequenced so that
learners will build on existing knowledge structures as well as interconnected
knowledge structure between related concepts?
It is a misconception that higher order skills, such as thinking proportionally, can be
taught. These skills need to be developed through carefully constructed activities to

10
initiate thought and engage learners in problem solving. It is the task of the
Mathematical Literacy teacher to develop these thinking patterns so that learners may
develop a better understanding of proportionality and how it links to other concepts.
This also raises the question of how a better understanding of proportionality can aid
learners’ understanding of related concepts, if indeed it does. If this be the case, then
how can teachers help learners in making the mental links between related concepts?
Through Person’s (2004: 23) study he has found that “techniques and number
operations are given higher priority than concept clarity. It may also throw students in
an abstract and technical world where connections between concepts are harder to
make but where the correct answer is found.”
As mentioned earlier, teaching for mere reproduction is not the aim of Mathematical
Literacy or of the National Curriculum Statement as such. With teachers who do not
fully comprehend proportionality, it is nearly impossible for learners to develop a
sound understanding of the concept. This study hopes to provide teachers with an
understanding of proportionality and methods of teaching that will help to develop a
more comprehensive understanding of proportionality and the associated thought
patterns with learners.
The concept of interconnectivity forms a vital part of this study and will show how
proportional reasoning is prevalent in all four learning outcomes of Mathematical
Literacy with in National Curriculum Statement. This prevalence supports the
importance of research into didactical practices that will support the development of
proportional reasoning in Mathematical Literacy. It also poses a challenge to
Mathematical Literacy teachers who must guide learners in developing cognitive
structures that are able to connect knowledge from different concepts through a range
of higher order thinking processes. Piaget, as in Louw, Van Ede and Louw (1998: 75)
describe these thinking processes as adaptation where learners either have to integrate
new knowledge into existing knowledge structures, known as assimilation, or adapt
existing knowledge structures according to the new knowledge, known as
accommodation. Activities must therefore be designed, sequenced and structured in such
11
a way that it will assist learners in making these cognitive adaptations in order to build a
network of interconnected knowledge structures.
1.5 Research approach
Coe (2007: 17) states the “goal of research is to provide a coherent model to explain
the possible ways a person may be thinking.” The type of research that I will be using
during this investigation is experimental in nature and is classified as “design
research” according to Edelson (2002).
The design of the research will be based on experimenting with designed activities for
classroom teaching to form a better understanding of proportional reasoning and how
it links to other subject content. I will thus be designing activities based on theoretical
and field research and present the activities in a researched didactical way that
supports the activity. Data collected on learners’ thinking patterns and motivation for
answers will aid analysis and interpretation on learners’ response, the didactics used
and the activities itself (Mouton 1996: 24).
During this study I will investigate cognitive processes involved in developing
proportional reasoning. Piaget classified proportional reasoning as a higher order
thinking skill, and although his work has sparked strong critique and controversy,
research has shown that few people are able to think proportionally. Kolodity, as in
McLaughlin (2003: 1) states “that a majority of college freshmen do not function at
this level and Lawson (1975) cites that 40% to 75% of post–secondary students do not
operate at Piaget’s formal level.”
This evidence supports Piaget’s claims of the high level of thought that is involved in
proportional reasoning and emphasises the great need of more insight into
proportional reasoning teaching and learning within Mathematical Literacy. Many
researchers have done research into children’s understanding, and problem of
understanding, ratios and proportions. I shall be using this as basis for further study
into proportionality and its interconnectivity to other concepts within the subject of
Mathematical Literacy.

12
I shall also be conducting a baseline assessment to determine the level of
understanding of proportionality that a learner possesses when entering the subject of
Mathematical Literacy at grade 10 level. The analysis of the baseline assessment will
be an indication of learners’ pre-existing knowledge and misconceptions from which
further activities can be developed. This is in line with Outcomes Based Education
where continuous formative assessment forms a central part of teaching. This
investigation will use formative assessment to monitor the learner’s progress and to
ensure that the strategies used in the designed activities are in fact being learnt by
learners.
The main focus of this study will however fall on designing didactical material to help
learners in forming a better understanding of proportional reasoning, and I will
therefore mainly use design research. Design research takes the problem statement to
merely direct the research process. The process is experimental in nature and after
design and implementation the process and the hypotheses needs to be analysed to
make adaptations and elaborations on the original hypotheses. The design and
implementation is central to design research as researchers engage in teaching and
learning experiences in order to develop a better and meaningful research
understanding on didactical practices. Information yielded from the research can thus
be used by teachers in the classroom to better an understanding of the research
concept (Edelson 2002: 107, 118-119).
The existing research into ratios and proportional reasoning will help to formulate
certain set hypotheses which will either be supported or proved insufficient after the
baseline assessment. From here, if necessary, a new set of hypotheses can be
formulated and activities can be designed accordingly. Evaluation of the process will
happen continuously in the form of formative assessment. The directing hypothesis
will be to design activities in such a manner that it will better learners’ understanding
of proportionality and its interconnectivity in the Mathematical Literacy National
Curriculum Statement.

13
1.6 Scope
For the purpose of this study, I shall direct my focus on grade 10 learners entering the
subject of Mathematical Literacy in three private schools in the West Coast District of
the Western Cape. At this stage of their high school careers they have been through
the General Education and Training strand and should have a basic understanding of
most Mathematical concepts. We need to assume that most of these learners have a
fairly wealthy home environment and have been enriched by a privileged school
setting.
All three of these schools offer easy access to computers and related teaching aids to
enhance teaching and learning in the classroom. Classes are kept small with no more
than 25 learners per class. Individual attention and support to learners is a high
priority of both teachers and parents. Parents sending their child to any of these three
schools see their child’s schooling as an investment rather than a mere obligation and
for this reason also expect results. This gives an interesting slant to teaching practises.
Teaching and learning in a private school environment differs in many regards to
teaching and learning in most government schools where classrooms are crowded,
technology limited and parent involvement is often inadequate. These factors should
not be overlooked during this study for two main reasons:
1. The teaching and learning environment can mostly be described as ideal in
comparison to the environment found in most government schools.
2. If the development of proportional reasoning as a high order thinking skill
proves to be problematic in such an “ideal” environment, how much more
difficult must it then not be in an overcrowded, technology poor classroom?
I have decided to focus my attention on grade 10 Mathematical Literacy since the
National Curriculum Statement is rather thin and many of the schools I have dealt
with complain that they finish it too quickly. Except for the fact that teachers will feel
less concerned about their teaching time being used for this research, I will also be
looking at ways in which the grade 10 National Curriculum Statement could be used
as better foundation for grades 11 and 12 Mathematical Literacy.

14
The National Curriculum Statement is not heavily loaded for Mathematical Literacy
in grade 10 and teachers should caution that learners do not start to think that
Mathematical Literacy is indeed the substandard subject that many make it out to be.
Although easy tests and resultant high test scores by learners may boost learner’s self-
esteem, it is meaningless if learners know that they are writing ridiculously easy tests.
Mathematical Literacy at grade 10 level should build on grade 9 and should not be
substandard to it. I am of the opinion that grade 10 can be used as a remedial year
during which learners’ problems can be addressed and self-confidence built whilst
still challenging their abilities. Learners cannot rise to the occasion if no occasion is
provided. Grade 10 should not be a calculator number punching year, it should be the
start of level four reasoning and reflecting according to the Mathematical Literacy
taxonomy (Department of Education 2007: 14).
1.7 Limitations
The timeframe of this research was restricted to one term only. Classroom activities
done in this time period and information yielded from these activities were
experimental in nature and was used to help design activities rather than to examine
the successfulness of the final product. This process formed part of the design
research approach described under research methodology. Constant reflection was
needed on the process and the activities to ensure that it was in line with the needs of
learners. Activities that showed to be deficient after reflection on the process supplied
the process of opportunities of improvement. Since this is a continuous process, it is
difficult to establish when the activities are near perfected. The design research
process is thus limiting due to its continuous nature.
Although it would be possible to conduct a post-test in these three schools to test the
successfulness of the sequence of activities designed, results would be biased since
my role as both teacher and researcher could influence the outcomes. To have
objective results, this program should be given to a representative sample group of
schools with teachers that are willing to engage in and give criticism on the program.

15
1.8 Importance of the research
Although there are currently some controversy on the creditability of Mathematical
Literacy when applying for certain university courses since it is seen as lower grade
Mathematics and not as a valuable subject in itself, I argue that the subject lends itself
towards becoming an intensive remedial programme in which teachers can address
problems and work towards developing proportional thinking patterns that is of a
higher level thinking order. Mathematical Literacy could thus be taught and ultimately
assessed in grade 12 in such a manner that learners who developed these high order
thinking skills could be distinguished from learners with a basic understanding of the
content being covered. Through this study I would like to argue that learners who
display higher levels of thought in Mathematical Literacy must be considered for
tertiary studies (excluding fields of study which require calculus), but most definitely
in financial fields.
1.9 Outline and organisation of this report
I start this research with a literature review on proportional reasoning in chapter two.
This will include the teachers’ perspective as well as learners’ development of
proportional reasoning. It would not be possible to design a baseline assessment
without understanding the concept of proportional reasoning and having insight into
both teacher’s and learners’ understanding of the concept.
Chapter three contains all information regarding the baseline assessment to test
learners’ existing knowledge of proportional reasoning as well as their attitude
towards Mathematical Literacy. This will include the theoretical analysis of the
baseline assessment as well as detailed results of the assessment.
The theory regarding the didactical practices needed for the design research and
teaching process is described in chapter four. This will include both the way in which
the activities will be presented as well as the context within which the activities will
be presented. It is also in chapter four where the importance of proportional reasoning
throughout the Mathematical Literacy National Curriculum Statement is described
and the importance of the interconnectivity of these different learning fields.

16
Chapter 5 describes the rationale for the designed activities as well as the sequential
progression of the presentation of these activities.

17
Chapter two: Literature Review
Before designing activities for baseline assessment or for the development of
proportional reasoning, it is important to reflect on literature done on people’s
understanding of the concept. I will firstly look at the work of Clark, Berenson and
Laurie (2003) who have researched the comparison of fractions and ratios and
teachers’ understanding of the relation between these two concepts. To have insight
into teacher’s perspective of proportional reasoning might help in understanding
learners’ understanding of the concept. Since I will also point to the importance of
understanding fractions in order to understand ratio, considering the work of Clark,
Berenson and Laurie (2003) is essential.
Secondly, I will look at learners’ understanding of proportional reasoning through the
work of Noelting (1980) and Thompson and Thompson (1994). Noelting’s research
on the developmental stages of acquiring proportional reasoning skills played a vital
role in the design of the baseline assessment activities.
2.1 The teacher’s perspective and the importance of fractions
One cannot assume that all teachers teaching Mathematical Literacy are proficient in
proportionality. “Although a lot of research has been conducted on students’
understanding of proportional reasoning, few publications actually focus on teachers’
conceptual understanding of ratios and proportions, especially at a high school level”
(Person 2004: 4).
Teachers bring a unique view of proportionality to the classroom based on the way
they have been taught years ago and made sense of the concept. “But traditional
mathematics lessons have consisted of the demonstration (sometimes with
explanation) of a single method followed by practice with a variety of different
numbers. Converting fractions to decimals or percentages, performing operations on
directed numbers, and solving proportion problems have all been dealt with in this
way” (Bell 1993: 7). Many teachers qualified before the introduction of Outcomes

18
Based Education, many newly qualified teachers still revert back to the way they have
been taught at school and so the cycle of instructional teaching keeps on repeating
itself. “The notation and strategies that teachers use in class to solve proportion-
related problems has an impact on the conceptions and activity of individual students,
while the students’ preferences may influence the teacher’s pedagogical strategy, and
therefore the classroom mathematical practices” (Clarke, Berenson, & Cavey 2003:
302).
Because of the broad extent of proportionality, teachers take a variety of views when
thinking about the concept. Clarke et al. (2003) distinguish between five models:
Model 1: ratios as a subset of fractions
Model 2: fractions as a subset of ratios
Model 3: ratios and fractions as distinct sets
Model 4: ratios and fractions as overlapping sets
Model 5: ratios and fractions as identical sets
According to Clarke et al. (2003) and Person (2004) teachers choosing Model 1, do so
on the assumption that all ratios are rational numbers that can be written in a fraction
format. This however excludes irrational numbers as we encounter so often in
trigonometry ratios (the ratio of the hypotenuse to leg length of an isosceles right
triangle (√2)) or working with π when doing calculations in geometry. It also
excludes ratios that imply more than two numbers, for example an inheritance that is
divided between three siblings according to their age.
Model 2 implies that all fractions can be interpreted as ratios, but that not all ratios are
fractions. In Clarke et al.’s (2003) research this model proved to be the most popular
amongst participating teachers and mathematicians, since this model includes the
scenarios that have been excluded in model 1. It can however be argued that fractions
encountered in pure number related context, for example measuring, cannot be
considered a ratio, although some argue that it is still a part-whole relationship (as in
20 mm of 1 m).

19
Teachers supporting Model 3 did so by describing a fraction as a part-whole
relationship and a ratio as a part-part relationship with no connection between the two
(Clark et al. 2003: 299). If we think of mixing juice, we can represent the situation in
a variety of ways: 2 parts concentrate to 8 parts water (2:8) or 2 parts of the 10 part
liquid are concentrate ( 210
). Surely the part-whole (fraction) relationship is also a ratio
2:10?
Model 4 considers the queries about model 2 and implies that “some, but not all,
ratios are fractions, and some, but not all, fractions are ratios” (Clarke et al. 2003:
300). This model seems to accommodate the views of most teachers and the broad
extent of proportionality.
In Clarke et al.’s (2003) research they have not identified any textbooks that claim
that fractions and ratios are the same, as Model 5 suggests. Yet, the concepts are
sometimes presented as so similar, that it is difficult to distinguish.
Clarke et al. (2003) defend their view of Model 4 with the concern that ratio as an all-
inclusive concept “loses its power of discrimination”. They argue that ratio is
attenuated when the term is used so loosely. This is however exactly what I would
like to argue: teachers need to convey the broad extent of proportionality. I believe
that in contrast to the belief of Clark and his fellow authors, model 2 rather intensifies
the concept of ratio. The distinct relationship between fractions and ratios as set out in
Model 2 could be a handy starting point to initiate discussion in class and could act as
concept for debate.
Teachers should have a clear understanding of proportionality and how it can be
presented before they try to convey this broad and powerful idea to learners as a mere
simple “comparison of numbers”. Clarke et al. (2003: 315) also emphasise the
importance of mathematical terminology together with notation that “can act as either
pathway for students as they grow in their understanding or as obstacles to that
growth.” It is important to note that the introduction of ratio and proportion does not
have to include the colon or fraction representation. In fact, no mathematical notation

20
is needed when developing proportional reasoning. Karplus et al. (1983) found that
“when students did employ proportional reasoning, they usually chose the type of
comparison that allowed them to use integral ratios among the given data…” and tried
to avoid working with fractions as far as possible. Unless we are thus sure that
learners are secure in their fraction understanding, fraction notation could prove
daunting to learners. Although learners might have seen the colon notation on maps or
juice mixtures, the meaning of the notation might be more inhibiting than helpful.
Adjidage and Pluvinage (2007) have conducted extensive research into the concept of
ratio and proportion and found that “processing fractions is well accorded to the valid
treatments in proportionality, so that pupils that master fractions should better master
proportionality”. If teachers can make this all important link between fractions and
ratios, Adjidage and Pluvinage (2007: 170) argues that it will not only lead to a better
understanding of proportionality, but also of Algebra. Many fraction type questions
can also be considered as ratios and vice versa. Let us look at the following example.
Would this be categorised as fraction, ratio or rate?
Three boys share two pizzas and nine girls share seven pizzas. Did the boys or the
girls have more pizza each? Explain your answer.
Thinking in terms of fractions:
Sharing 2 pizza’s between 3 boys, is 2 ÷ 3 =
Sharing 7 pizza’s between 9 girls, is 7 ÷ 9 =
If there were 9 boys, they would have had to get 6 pizzas ( = ), thus meaning that
the girls had more.
Thinking in terms of ratio:
Boys: 2:3 Girls: 7:9
With-in strategy2:
Boys: 2 x 1,5 = 3
2 The with-in and between strategy will be discussed under the work done by Gerald Noelting.
23
79
23
69

21
Girls: 7 x 1,5 = 10,5
Between strategy:
Boys: 2 (x3) : 3 (x3) = 6:9
Girls: 7:9
The girls had more.
Thinking in terms of rate:
How much pizza did 1 boy have? or 0.67
How much pizza did 1 girl have? or 0.78
The girls had more.
Ratio problems can thus be a natural extension to fractions and learners can be left to
explore informal ways of representation.
Comprehensive research has been done by Noelting (1980) who tested a large number
of children between the ages of six and sixteen on their concept of fractions versus
ratios. He gave them the following four questions:
1. The orange juice problem where learners have to compare the strength of the
two mixtures: (2:3) vs. (7:9)
2. The pizza problem where 3 boys shared 2 pizza and 9 boys shared 7 pizza and
learners had to determine which group had more pizza per person.
3. A normal comparison of fractions problem: vs.
4. A normal addition of fractions problem: +
His findings showed that pupils had few problems in solving calculations involving
adding and comparing fractions, but that pupils found ratio questions problematic.
This leads us to the question: Can the pizza problem really be seen as purely a ratio
problem? In the way the question was asked, it could surely be classified as a rate
problem. Furthermore, this type of question should, according to Murray, Olivier and
Human (1999), be used as part of the problem-solving approach in fractions. Learners
23
79
23
79
23
79

22
could possibly find this problem difficult due to the wording being used or a lack of
exposure to problem-solving questions when dealing with fractions. Previous teaching
experiences might have been mostly instrumental in nature, where learners where
given strict methods and procedures to follow when confronted with fraction
questions. This automatic technique does not guarantee that learners understand
fractions. I am sure that learners who were faced with problem-solving type questions
when dealing with fractions would have recognised the pizza problem as a fraction
problem and would have dealt with it accordingly.
Learners are exposed to fractions from as early as grade four and might have been
continuously exposed to problems similar to the normal addition and comparison of
fractions, whereas their knowledge of problem-solving type questions or ratios might
have been limited. For learners who have never been exposed to ratios, the notation in
itself might be problematic.
Wu (2002) supports the link between ratios and fractions when he says that if “Euclid
in his Elements…had the mathematical understanding of the real numbers as we do
now, he would have said outright: ‘the ‘ratio of A to B’ means the quotient ’. For
this reason, the long tradition of the inability to make sense of ratio continues to
encroach on school textbooks even after human beings came to a complete
understanding of the real numbers round 1870.”
If learners are comfortable in solving fraction problems, then a logical deduction
would be that if we can stress the important link between fractions and ratios, then
learners could represent the ratio problem in terms of fractions and solve it. As an
example: 2 apples cost R3, what is the price of 5 apples? Learners could represent it
as rather than calculating the cost per apple. Wu (2002) warns however “that the
central issue is why these enigmatic “ratios” should be equal, but the explanation of
this issue is usually not forthcoming in a typical classroom.” Learners who were
taught that fractions are a part-whole situation will have trouble buying into the fact
that 2 apples is a part of 3 Rand. This fraction is capturing the rate: 2 apples per R3,
which can first be simplified to 1 apple per R1,50 before further calculation. This is
AB
2 53 ?=

23
the joy of writing ratios as fractions that we simplify (within) before we make
calculations (between). This does not necessarily mean that we find the rate, but
merely that we simplify to more manageable set of numbers. For example: 21:18 =
28: ? can be calculated as:
simplified to
With the simplification it is easy to see that the multiplicative between factor is 4.
7 x 4 = 28 thus 6 x 4 = 24
Some researchers hardly distinguish between proportional reasoning and fractions.
Whilst discussing the difficulties learners experience in proportional reasoning
Schwartz (1998) gives an example of comparing to and goes on by explaining
how learners have to compare both denominators and numerators and the relation
between and with-in each fraction.
Lo and Watanabe (1997: 225) conducted research on a fifth grader’s developing
understanding of ratio and proportion. The following problem was given to a fifth
grader named Bruce. His strategy in solving it clearly supports the importance of
fractions in developing proportional reasoning schemes:
A house was 24 feet tall and had a window that was 12 feet above the ground.
This house became 18 feet tall after a certain amount of magic liquid was
applied. How tall would the window be above the ground after the magic
liquid was applied?
Bruce's solution of this task clearly indicated his intention to find the
multiplicative relationship between the new height of the house and the old
height of the house, which he knew needed to be preserved between the new
height of the window and the old height of the window. He identified 6 as a
common factor between 24 and 18. The number 24 was reconceptualised as 4
sixes, and the number 18 was reconceptualised as 3 sixes. Then it appeared
that there was another level of reconceptualisation, similar to what Lamon
21 2818 ?
=7 286 ?=
25
12

24
(1993a) described as "norming": the 4 sixes were reconceptualised as "one,"
but the 3 sixes were reconceptualised as "three fourths." Bruce's last
statements, "Nine is one half of 18. Twelve is one half of 24," did not appear
to be part of his original thinking, but rather another way to explain his
solution. Implicitly, Bruce seemed to be saying, "See, all these equivalent
relationships prove that my answer is correct.
The concept of equivalence and equivalent fractions seems to be the foundation of
Bruce’s approach. Although Bruce might not be able to express his scheme in formal
Mathematical language, he is reasoning proportionally and finding equivalent
proportions to solve the problem.
I would like to stress at this point that I am analysing fractions as a method that can be
employed to help learners create proportional reasoning schemes. They should not be
seen as methods that are followed without any discussion of why they are followed.
The reason why I suggest the use of fractions in developing proportional reasoning, is
because learners should have a firm understanding of fractions by the time they enter
into grade 10. Noelting’s tests support the fact that they feel comfortable with
fractions, but not with ratios, and if the link can be made to show learners the
connection between the two concepts it might be a doorway to a better understanding
of ratios and ultimately proportionality.
2.2 Understanding learners’ understanding of proportionality
It is important that teachers not only have a clear understanding of the concept to be
taught, but also the learners’ understanding and possible misconceptions that may
arise. When teachers anticipate certain common mistakes or misconceptions they can
use these as learning experiences. It was Shulman (1986) who introduced this notion
of pedagogical content knowledge.
When learners, for example, think additively instead of multiplicatively during
proportional problems, it would be a good idea to give counter problems to prove
them wrong. Placing the problem into a context and using the context to give meaning

25
to answers is the aim of context in Mathematical Literacy and should be used as such.
If the context is used merely to mask a set of calculations, the context has no meaning.
To make Mix-On® cool drink, one needs 2 litres of water on 3 sachets of Mix-On®.
How many sachets does one need for 3 litres of water?
Children reasoning additively would instinctively say 2 + 1 = 3 litres, thus 3 + 1 = 4
sachets. Mixing the cool drink in class would be a visual and “tasty” activity to prove
the learners wrong, since only adding 4 sachets would give a weaker taste. A counter
argument that is also helpful is the following: “In other words, if I want to know how
many sachets I need for 100 litres, I must say 2 + 98 = 100 litres, thus 3 + 98 = 101
sachets. Do you think this will taste the same than a mix of 2:3?”
Another idea might be to work with rate by asking learners how many sachets would
be needed for one litre of water. Through calculating the sachets needed per litre, they
are determining the rate. Linking the Mix-On® question to that of rate and price as in
the following example might also give learners some insight into the Mix-On® ratio:
If I buy 2 apples for R3, how much would I pay for 3 apples?
Learners normally have a better “feel” for price than for ratios although both
questions are asking them to make the exact same calculation.
Proportional reasoning is a high order thinking skill and so is transferring knowledge
from one concept to the next as in ratio to rate and vice versa. This is one of biggest
concerns in the Mathematical Literacy class: Linking knowledge of fractions, to
ratios, to rate, to scale or any other related concept. When teaching Mathematical
Literacy teachers must thus not teach these concepts in isolation since this will not
lead to internalisation of knowledge. If we want learners to truly understand a
concept, it is essential to link knowledge structures so that they may be able to use
strategies that they are familiar with and have used in previous related concepts. Most
learners entering Mathematical Literacy in Grade 10 know that and are not 23
34

26
equivalent, yet they do not make this link to ratios. This link will help them to realise
that the ratio 2 : 3 and 3 : 4 are not the same.
Teachers need to ask conflicting questions to initiate thought about the procedures
they used. “Does this strategy you used mean that and are the same? Or would the
price of 3 apples be R4 if 2 apples cost R3?” When learners reflect on their thoughts,
they are using essential higher order thinking skills.
Creating conflict to initiate thought is one of the most powerful approaches we can
use when teaching Mathematical Literacy. Mathematical Literacy teachers need to get
their learners into a habit of thinking about the process of getting to the answer, rather
than merely producing the answer. Teachers need to press upon learners to stop and
think about what they are doing rather than to produce answers in order to receive
praise. They must establish a classroom culture where reasoning and reflection is
praised instead of only correct answers. Teachers need to realise they need to develop
skills such as transfer of knowledge and meta-cognition (reflection on thought) rather
than teaching procedures which learners must be able to apply in different context
based questions. Riedesel (1969: 428) found that “many students believe they are
dealing with a new discipline with its own operations and rules. It is no wonder that
they stumble through by memorising the new game rather than building firmly on past
experiences.”
Teaching proportional reasoning is much more than manipulating numbers around a
colon. Taking all these intricacies into consideration, Mathematical Literacy can not
be seen as watered down Mathematics. In fact, it is an opportunity to explore all these
high level thinking skills in a less packed curriculum. It is essential that teachers
teaching Mathematical Literacy are empowered to give learners the support they need
to develop these skills. This opportunity has a low priority in the heavily loaded
curriculum of the Mathematics class.
23
34

27
2.2.1 Noelting’s pedagogical approach to ratio
Noelting (1980) focused his attention on learners’ understanding of two comparative
ratios. This study enabled him to look at strategies used by learners in the
development of proportional reasoning. Two major thoughts stemming from his
research is that if the “between” strategy, referring to relations between a term in the
first ratio and a term of the second ratio, and the “within” strategy, referring to the
relation between terms in the same ratio. His research can be described as
developmental stages of understanding of proportionality and can thus guide teachers
in making sense of their learners’ level of understanding. If teachers know why
learners make certain mistakes, it is easier for them to design activities in such a way
that it will address these problems and create conflicting thoughts.
Noelting distinguishes between three broad strands, each with a couple of sub-stages.
Stage I, subset A, has a typical structure of (1:4) vs. (4:1). The within strategies would
here be of less value, but the between strategy, comparing for example the amount of
concentrate in ratio one to ratio two, proved efficient. This method is however only
possible if the second term remains constant or if two ratios are inversely related.
Children often find it difficult to distinguish between inverse ratios and tend to say
that the taste of the drinks would be the same. This is typical of stage 1A which only
entails the comparison between the first terms of the two ratios.
Subset IB keeps the first terms of the two ratios the same (a = c where b > d, for
example 1: 4 vs. 1: 2) but have different terms for the second terms in the ratios.
Subset B thus includes the strategy of 1A by first comparing the first terms in the
ratios, finding them the same and then focussing on the relation between the second
numbers.
To progress to stage IC, learners have to choose the with-in strategy as the appropriate
strategy for the circumstance. According to Noelting this stage focuses on with-in
ratios first and between ratios second to that. A typical structure of this stage would be
(a = b, c < d, for example 1: 1 vs. 2: 3). The thought process involved in choosing a
with-in ratio first, is what distinguishes level IC from level 1A and B. Although this
problem could be solved by using between ratios, a quick, logical way would be to see

28
that the two parts in the first ratio are exactly the same whilst it is not the case in the
second ratio. Al learners at stage IC still experience problems with the order of
numbers within the ratio. They would be able to recognise that the ratios are different,
but if the ratios represented concentrate and water, they would not be able to say
which has a stronger or weaker taste. They would also not be able to see the
difference between ratios 1 : 1 and 2 : 2.
Stage II requires that learners must be able to compare two with-in ratios, thus looking
at between ratios of with-in ratios. Stage II is also the start of the use of calculations,
and specifically multiplicative strategies, to compare ratios. At stage IIA, computation
are not really necessary, since the structure is kept simple (a = b ; c = d). The strategy
that was used in IC is similar to that of IIA.
Stage IIB requires learners to first use with-in calculations, before comparing the
with-in results, thus the between strategy. A typical structure of stage IIB is that of (a
≠ b ; c ≠ d), but kept to equivalent ratios of (2:3 vs. 4:6) where the second ratio is a
multiple of the first. Noelting (1980) describes the difference between stage IIA to IIB
as “the independence of first and second terms inside the equivalence class”. The
results of IIA and IIB are thus the same, since both compare equivalent ratios, but
stage IIB requires the recognition of both terms in the second ratio being multiples of
the terms in the first ratio.
The structure of stage IIIA is also (a ≠ b ; c ≠ d), but only the first terms in each ratio
are multiples of each other, whilst the second ones are not. The structure of the stage
is thus of a non-multiplicative strategy within the ratios, but a multiplicative strategy
in one between ratio. It is at this level where learners have to know to use both with-in
and between strategies to compare the ratios.
The last stage is that of IIIB, which has a general structure of (a ≠ c ; b ≠ d and a ≠ b ;
c ≠ d) where no multiple relation is found between terms within ratios or between
ratios. As in stage IIIA, both with-in and between strategies need to be used as well as
multiplicative and additive strategies to transform the ratios into comparable forms.
These multiplicative and additive strategies are the same strategies used when

29
comparing fractions with different denominators, where we first need to find a
common denominator before making judgements about values.
It is clear, that stage IIIB would be rather difficult to reach if a sound understanding of
fractions is not in place. Teachers seem to underestimate the importance of fractions
as foundation for proportionality and algebra. I want to argue that without a clear
understanding of equivalent fractions, learners would not be able to comprehend the
thoughts underlying ratio and proportion as well as certain key concepts in Algebra.
Although Noelting’s research gives us an indication of learners’ developing thoughts
surrounding proportional reasoning, his work mainly focuses on comparison
problems. Although the comparison of ratios are important concept in developing
proportional reasoning, more than half of the proportional reasoning situations
encountered in Mathematical Literacy are missing value problems. The following
concepts, which I will explain in terms of proportional reasoning in chapter 4.4, are all
missing value type questions: VAT, appreciation, inflation, consumer price index
(CPI), depreciation, scale, conversions and trigonometry.
2.2.2 Thompson and Thompson’s research in the mental process in moving from
ratio to rate
Thompson and Thompson (1994) acknowledge the importance of ratio in
understanding other related concepts, such as rate. Rate is of course of great
importance in understanding functional mathematics (and later calculus). Several
researchers have made the same claims about the importance of ratio and rate in
understanding higher level mathematics: Monk 1987; Thompson 1994a; Zandieh
2000; Carlson, Jacobs, Coe, Larsen, and Hsu 2002 as in Coe 2007:13. The question I
would like to ask is, if problems in these concepts could be traced back to a poor
understanding of ratio?
As Noelting, Thompson and Thompson (1994: 8) have also identified levels of
development in children’s understanding of ratio to rate. They distinguish between

30
four levels of development in the mental process of moving from an understanding of
ratio to an understanding of rate:
1. The first level is that of ratio, in which children are able to compare two ratios
without the need to change them. At this level they do not use any
computations to solve the ratio, they make judgments merely on face-value.
Children at this level would recognise that the ratios 1:4 and 1:3 are not
equivalent and would be able to reason that the second ratio has less. In a
problem with numbers that are not the same, children functioning at this level
would not be able to compare ratio. If the ratios of 1:3 and 2:6 are presented,
they will not be able to recognise the numbers in the second ratio as multiples
of the first.
2. At the second level, internalised ratio, children compare ratios through basic
additive strategies without realising that additive strategies will change the
ratio between numbers. These learners will assume that 2:3 is equivalent to 3:4
since 2 + 1 = 3 and 3 + 1 = 4.
3. At the third level, interiorised ratio, children are able to use appropriate
additive strategies to compare ratios or to find missing value. These strategies
are also referred to as “building-up” strategies. For these children to calculate
of 2:3 and 3:4 are equivalent, they will reason that if half of 2, namely 1, is
added onto 2 to get 3, then the half of 3, namely 1.5, must be added onto 3 to
get 4.5. Since this method did produce an answer of 4, the two ratios are not
equivalent. Another example would be: 300g sugar for 4 people, 600g sugar
for 8 people, another 2 people is half of 4 people, so that we need 750g sugar
for 10 people. Although the “build-up” strategy delivers correct answers and
can be seen as primitive multiplicative reasoning, researchers agree that is “is
a relatively weak indicator of proportional reasoning” (Lesh et al., 1988, pp.
104–105).
4. It is only at level four that learners use the concept of rate as multiplicative
strategy to solve ratio problems. Thompson et al. (1994) refers to this level as
“reflectively-abstracted conception of constant ratio.” Children that are able to

31
operate at this level will be able to recognise that in the ratio 2:3, three is 1.5
times more than two.
2.3 Summary
Thompson’s levels have the same progression to that of Noelting, but are not
restricted to comparison problems only. The use of both level systems is important
since each bring a different perspective to light. Noelting focus a lot of attention on
the use of with-in and between strategies. Karplus, Pulos and Stage (1983) found that
learners who were able to reason proportionally “exploited integral ratios within or
between relationships, and… recommend the emphasis of these approaches to
proportionality problems.” Since these strategies are largely linked to the nature of the
problem, problems should be given that will draw attention to both strategies. It is
important that learners are made aware of different approaches to a question since this
initiates thought on their own thoughts, also known as meta-cognitive skills.
These levels of development are important to teacher researchers if they want to
determine the level of understanding of their own students. It is an indication of where
they are, where they are going to and what we as teachers can do to get them to where
we want them to go. With this in mind we can set activities accordingly to support the
growth process. I will also be using this information in setting a comprehensive
baseline assessment and to henceforth develop activities that will help my
Mathematical Literacy students in forming proportional reasoning schemes.

32
Chapter three: Research
This chapter will give a theoretical background to the baseline assessment. This
theoretical background will be the rationale for activities that were used and will be
based on the research of Noelting (1980) as well as Thompson and Thompson (1994).
The data collected from the three independent schools will then be analysed to
determine learners’ existing proportional reasoning knowledge as well as their
feelings and attitudes towards Mathematics. The data collected on their proportional
reasoning skills will be analysed according to the work of Noelting (1980) and
Thomson and Thompson (1994) to highlight different levels of understanding as well
as different strategies used to solve proportional reasoning questions. Concerning
factors will be summarised before analysing the baseline questionnaire results to
determine learners’ perceptions of Mathematical Literacy.
3.1 The theoretical approach to the baseline assessment
Noelting (1980) has distinguished between three broad strands of developing
proportional thoughts in acquiring knowledge about ratios. We can assume with
relative certainty that most learners entering Mathematical Literacy in Grade 10 will
be confident in handling stage I questions. They should even find stage II questions
relatively easy, but as can be expected the problem occurs with stage III questions. In
the baseline assessment I will aim to determine learners’ understanding of
proportionality according to these strands. I will furthermore also include related
proportional questions which will also be structured according to the degree of
difficulty as Noelting (1980) set it out in his research on ratios. Questions will be
structured in such a manner that it does not promote any strategies. Learners will thus
be able to use either the with-in or between strategies.
The baseline assessment acts as a base-line from where activities will be designed that
could potentially address any problem areas identified in the assessment. Through the
baseline assessment I will also try and identify learners’ level of understanding

33
according to Noelting’s levels and if learners can relate their knowledge of one
concept to similar situations. I would also like to determine which strategies they
follow when working with ratios and if these are the same strategies they employ
when working with related concepts. Questions are set up in such a manner, as
Noelting also intended, to favour several strategies such as the with-in or between
strategy or a combination of the two.
The baseline assessment will include a questionnaire that will contain questions on
learners’ perception of Mathematics and Mathematical Literacy. With these questions
I would like to establish learners’ experiences in the Mathematics class – if it was
constituted with feelings of confusion, persistent failure or low self-worth. I would
also like to determine the reason why they chose to take Mathematical Literacy and
what they expect from the subject. Questions on what they perceive as difficult in
Mathematics and what they normally found problematic might give teachers some
insight into ways to approach these concepts in the Mathematical Literacy class.
3.2 Analysis of the baseline assessment
The idea with the baseline assessment was to test learners on several concepts
involving proportional reasoning including fractions, probability, ratios and scale.
In question 1 the focus was on fractions:
At the athletics days the tuck-shop sells hot potato chips. To make one small bag of
chips they use of a kilogram of potatoes.
1) If the school has 120 kg of potatoes, how many small packets of chips can
they make?
2) The tuck-shop ladies estimate that they will need to make 200 small packets
of chips. How many kilograms of potatoes will they need for 200 packets of
chips?
34

34
3) If the price of potatoes is R6,75 per kilogram, what is the cost of making a
small bag of potatoes?
Learners had to think in terms of the following ratio:
1 packet of chips : 0,75 kg of potatoes
Learners had to realise that they either had to multiply by to calculate the amount of
kilograms or divide by to obtain the number of packets. This implies that learners
have to realise that dividing by a fraction gives a bigger answer and multiplying by
fraction gives a smaller answer.
In question 1.1 learners were given the amount of available potatoes in kilogram and
they had to calculate, by means of division, how many packets of potato chips can be
made. In question 1.2 they had to calculate the exact opposite. Question 1.3 required
similar calculations to that of question 1.2 but dealt with the price per kilogram to
calculate the price per packet. Learners that were able to calculate question 1.2 should
thus be able to also calculate question 1.3.
We assume that learners should be comfortable with fractions by the time they get to
grade 10 since they have been doing fractions since grade 4. They should also have
been introduced to Algebraic fractions in grade 9 which requires a firm understanding
and knowledge of fractions.
Look at the following tables in which the times for the 100 m and the 200 m races
have been summarised. All four these learners ran in both races.
34
34

35
1) Did Sam run at the same average speed for both races? Explain your answer.
2) Which of the runners kept the same average speed for both races?
3) Which of the runners managed to run at a faster average speed for the 200 m
race?
4) If Charlie can manage to run at the same average speed for 400 m, what will
his time be for completing the 400 m race?
Question 2 was set up in accordance with research done by Noelting, with special
reference to stage IIB and IIIA.
Stage IIB requires learners to first use with-in calculations before comparing the with-
in results, thus the between strategy. A typical structure of stage IIB is that of (a ≠ b ;
c ≠ d), but kept to equivalent of (2:3 vs. 4:6) where the second ratio is a multiple of
the first. The structure of stage IIIA is also (a ≠ b ; c ≠ d), but only the first terms in
each ratio are multiples of each other, whilst the second ones are not. The structure of
the stage is thus of a non-multiplicative strategy within the ratios, but a multiplicative
strategy in one between ratio.
The question required learners to realise a doubling in distance from 100 m to 200 m
from where they could compare the times for the races. If the time was also doubled,
the athlete ran at the same average speed for both races. If the time was less than
double, then the athlete ran faster and if the time was more than double, the athlete ran
slower. Learners merely had to compare the running times without any calculations of
average speed involved. Realising that both the distance and the time has been
doubled is, according Noelting, at stage IIB, but realising that it is more or less than
doubled is at stage IIIA. It is only in question 2.4 where the comparative nature of

36
this question changes to that of a missing value type question. Here learners have to
see the multiplicative relationship between the distances as being multiplied by 4, so
that they may be able to also multiply the time by 4.
Question 3
The school has organised soft drinks for all the athletes that finish an event. They
ordered 500 soft drinks and received 240 tins of Coke-Cola®s, 140 tins of Fanta®
Orange, 84 tins of Fanta® Grape and 36 tins of Sprite®. The school organises that a
couple of parents will hand out the soft drinks as the athletes finish.
1) What is the chance that an athlete will receive a Coke-Cola®?
2) What is the chance that an athlete will not receive a Coke-Cola®?
When working with probability learners have to see the fractional relationship within
the situation, for example, 240 Coke-Colas® out of 500 soft drinks or . This part-
whole fraction that has to be converted to a percentage is another form of proportional
reasoning. Look at the following set-up:
= or 240 : 500 = ? : 100 a typical missing value problem
When asked what the chance is that an athlete will not receive a Coke-Cola®, learners
will need to recognise that the remainder of the fraction that makes up a whole will be
the chance on not receiving a Coke-Cola®. If 240 of the 500 tins are Coke-Cola®s,
then the remaining 260 tins will not be Coke-Cola®s.
= or 260 : 500 = ? : 100
Question 4
Sam and Alex both brought post race energy drinks. Sam has Energade® concentrate
and Alex has a Game® sachet. On Alex’s Game® sachet, it says that 1 sachet makes 1
litre of Game®.
1) How many sachets does she need to make 2 litres of Game®?
2) How many sachets does she need to make 500 m of Game®?
240500
240500
?100
260500
?100

37
Question 4 is similar in terms of difficulty to question 2 where learners were asked to
compare times of athletes over 100 m and 200 m. The big difference between question
4, where learners need to calculate the amount of Game® sachets needed, and
question 2, where learners had to compare the times of athletes, is that question 2 asks
of learners to find the missing value instead of comparing the ratios as in question 2.
The work of Noelting is mostly done on comparison problems, but these problems can
surely be classified as stage IIA where computation is not really necessary, since the
structure is kept simple (a = b ; c = d). If 1 sachet makes 1 litre, then 2 sachets will
make 2 litres. The same when asked how many sachets for 500 m. If learners knew
that 500 m is the same as half a litre, then they would be able to make the same
deduction as for question 4.1. If 1 sachet makes 1 litre, then a sachet would make
a litre.
Sam’s Energade® bottle has mixing instructions in the form of a ratio. It says that
you must always mix the Energade® concentrate and the water in the ratio of 1:3.
3) If Sam wants to make 1 litre (or 1000 m) of Energade®, how many millilitres
of concentrate and how many millilitres of water is needed for 1 litre?
4) What percentage of the Energade® will always be concentrate if it is mixed in
the ratio 1:3?
5) What percentage of the Energade® will always be water if it is mixed in the
ratio 1:3?
6) If Sam mixed 75 m of concentrate with 300 m of water, was the
Energade® mixed according to the ratio 1:3?
7) Which will have the stronger taste: Energade® made from 75 m of
concentrate and 300 m of water or 45 m of concentrate and 270 m of
water?
What makes the remainder of question 4 more difficult than the first two questions, is
that learners need to realise than the ratio 1:3 has a part-part relationship. In question
4.3 the “whole” is given and learners are asked to calculate the parts of the whole.
12
12

38
Learners thus need to realise that 1 part concentrate is 1 part of a total of 4 parts and
that 3 parts water are 3 parts of the total of 4 parts. It is imperative that learners can
make the link between fractions and ratios in order to solve this missing-value
question. Learners must be able to change the part-part relationship to a part-whole
relationship, especially since the whole (or total) is given in question 4.3 and learners
must calculate the parts.
The part-whole notation is also important when learners are asked in questions 4.4
and 4.5 to calculate the percentage of concentrate and the percentage of water
respectively. As with question 3, they will have to set it up as follows:
= or 1 : 4 = ? : 100
Question 4.6 can be classified as a Noelting level IIIA. Learners are asked to see the
multiplicative relationship ratio between 3 and 300 as dissimilar to the relationship
between 1 and 75. They will have to reason in either of the following ways:
If the ratio 1 : 3 is made hundred times bigger so that three will become three
hundred, then one will become hundred and not seventy five as in the given ratio 75 :
300.
OR
In the ratio 1 : 3, three is three times bigger than one, but in the ratio 75 : 300, three
hundred is not three times bigger than seventy five.
Question 4.7 takes the comparison problem one step further by asking to compare two
ratios where there is no obvious with-in or between ratio between the numbers in the
ratios. This is at Noelting’s level IIIB, the highest of Noelting’s proportional
reasoning levels. There are several ways in which learners could approach this
question either by using with-in or between strategies, but for all approaches it is
imperative to make one of the quantities (either the concentrate or the water) the same
so that the other quantities (either the water or the concentrate) can be compared.
14
?100

39
When using the between strategy, learners can either realise that 75 and 45 are both
multiples of five or that 300 and 270 are both multiples of three. When following this
strategy, learners can then solve it in either of the following two ways:
Working with the multiplicative relationship between the concentrates:
If we have to multiply 75 by to obtain 45 then we also have multiply 300 by , but
this equals 180 and not 270. The ratios are thus 75 : 300 and 45 : 180. This means that
a ratio of 45 : 270 contains a lot more water and will thus not taste as strong as the
ratio 75 : 300.
Working with the multiplicative relationship between the waters:
If we have to multiply 300 by to obtain 270 then we also have multiply 75 by ,
but this equals 67.5 and not 45. The ratios are thus 75 : 300 and 67.5 : 270. This
means that a ratio of 45 : 270 contains less concentrate and will thus not taste as
strong as the ratio 75 : 300.
It is not always easy for learners to spot the multiplicative relationship between
quantities and many learners rather opt for different strategies.
Working with the multiplicative relationship with-in the ratios:
75 : 300 can be simplified to 1 : 4
45 : 270 can be simplified to 1 : 6
Since the ratio 45 : 270 contains two more parts water to the one part concentrate it
will not taste as strong as the ratio 75 : 300.
This last method has, once again, several similarities with the calculations involved in
fractions. The colon notation can thus be substituted for fraction notation if learners
should find it more familiar:
915
915
910
910

40
and
This fraction is of course not a part-whole fraction as in questions 4.3 to 4.5, but a
part-part relationship where the numerator is the concentrate and the denominator the
water. Should learners however use a part-whole relationship, it would be set up as:
of the Energade® in concentrate versus
of the Energade® is concentrate
Since is bigger than , the Energade® with of concentrate tastes stronger than
the Energade® with of concentrate.
There are thus several methods which learners can follow to solve question 4.7, but
firm proportional reasoning skills need to be in place. Learners need to be able to
think either in terms of fractions: “does this part equal that part when either the
denominators or numerators are made the same” or in terms of multiplicative
relationships: “does this quantity equal that quantity if multiplied by the same ratio”
Alex builds a scale model of the Athletics Stadium.
1. If her scale model measures 30 cm from the start of the 100 m mark to the
finish line (of the 100 m mark), what is the scale of the model? (100 cm = 1 m)
2. Using the scale calculated in 1 above, if the width of the field (the grass) is
70m in real life, what will the width of the field be on the model?
3. According to Alex’s research, the height of the stadium pavilion is 12 m. If she
makes the height of her model 4 cm, will this be to scale (as in question 1)?
Here learners are asked to simplify a given ratio so that it can read as a scale of
drawing. They need to recognise that both units need to be the same for this special
type of ratio called scale. They thus need to make 30 cm to 100 m into 30 (cm) : 10
000 (cm). This ratio can first be simplified to 3 : 1000 and further to 1 : 333,3.
Because the final answer is not a whole number, learners could find this question
difficult.
75 1300 4
=45 1
270 6=
75 1375 5
=
45 1315 6
=
15
16
15
16

41
Once learner found the ratio for question 5.1 it would have been easy to find the
missing value in the question 5.2. If the real life measurements are 333,3 times bigger
than the scale, then the scale model would 333,3 times smaller than the real life
stadium. Once again learners first had to convert all measurements to the same unit.
The between method of calculation will thus look as follow:
70 m = 7000 cm
7000 cm ÷ 333,3 = 21 cm
Learners could also work with the un-simplified ratio to solve the missing value
problem with a with-in ratio strategy.
x x
30 cm : 100 m thus ? cm : 70 m 70 m x = 21 cm
Question 5.3 is a comparison problem and could be solved using any of the methods
above. Learners have to determine if the ratio 4 cm : 12 m is the same as 30 cm : 100
m. Here the with-in strategy seems to be the most obvious method to follow since 4
can be multiplied by 3 to get 12, but 30 multiplied by 3 is not 90. Learners using the
with-in strategy in question 5.2 will be more likely to use this strategy again in
question 5.3.
Another strategy would be to determine the scale of the drawing 4 cm : 12 m.
Simplified it would come to 1 : 300 which is clearly not the same as 1 : 333,3. The
measurements are thus not correct since it is not to scale (of 1:333,3).
There seem to be a considerable number of methods that can be used to solve these
questions, but in fact there are only two: determining the relationship between the
numbers with-in a ratio and determining the relationship of the numbers between the
ratios. We can also distinguish between two types of problems: missing value and
310
310
310

42
comparison. Although all of these questions covered several different concepts in the
Mathematics curriculum, they were all either a missing value or a comparison
problem.
3.3 Baseline assessment results
When marking the baseline assessment only one mark was given for every correct
answer since it was only important for the purpose of the research to see which
questions learners could and could not do. It is interesting to note the similarities
between the responses of learners in school 1 and school 3. These two schools
conducted the baseline assessment during the first week of teaching whilst school 2,
which started its year a week earlier, conducted the baseline assessment after a week
of teaching ratios. It is for this reason that results of the three schools were kept
separate to see if a week of teaching would make any substantial difference to
learners’ understanding of ratios. A graphical representative summary of this
information is included in Appendix B.
Although learners in school 2 seemed to score better and on average answered more
questions, the overall group average was merely 1% more than that of school 1.
Learners in school 2 also seemed to score lower in question 2, a question in which the
other two schools scored really well.
The averages achieved by the three schools are as follows:
School 1: 47% out of a total of 5 learners
School 2: 48% out of a total of 19 learners
School 3: 37% out of a total of 6 learners
3.3.1 Results for Question 1
Almost 60% of students in school 2 that obtained the wrong answer in question 1.1,
used multiplication instead of division to calculate the answer. Instead of saying 120
kg ÷ , they said 120 kg x . None of the learners in school 1 and 3 made this 34
34

43
mistake. Interestingly enough only 16% of learners in school 2 that multiplied instead
of divided, used the same method to obtain the correct answer in question 1.2.
Other incorrect methods for question 1.1 include a learner that divided by 3.4 (instead
of 0.75), thinking that it equals . Two learners divided 120 by 4, but did not
multiply by 3 to get the final answer and left the answer as 30. Two more learners
somehow obtained an answer of 10 packets when dividing 120 by .
Answers obtained through “alternative” methods includes one learner from school 1
that first converted kg into 750 grams and 120 kg to 120 000 grams before dividing
120 000 by 750 to obtain 160 bags.
The wrong answers to question 1.2 were diverse with few learners obtaining the same
wrong answers. Three learners divided by instead of multiplying by of which two
of them set the calculation out as ⃞ x = 200. The same two learners that only
divided by 4 in question 1.1, did the same for question 1.2 and calculated an answer of
50 kg. A further two learners subtracted 40 from 200 to get an answer of 160 kg
which seems arbitrary.
The answers to question 1.3 were equally haphazard. Learners from schools 1 and 3
that managed to answer question 1.2 correctly were also able to correctly calculate
question 1.3, but in school 2 the picture looks slightly different and are summarised in
table 1.
16% of learners in school 2 managed to calculate the answer to question 1.3 without
being able to calculate the answers to the previous questions which also required a
multiplicative procedure. Only 21% of learners in school 2 calculated the answers to
both questions 1.2 and 1.3 correctly.
34
34
34
34
34
34

44
Table 1
Question School 1 School 2 School 3 average
1.1 If of a kg potatoes make one small
packet of chips, how many packets of
chips does 120 kg of potatoes make?
60% 16% 50% 42%
1.2 How many kilograms of potatoes are
needed for 200 packets of chips? 20% 47% 17% 28%
1.3 What is the cost of a bag of chips if
the price of potatoes is R6,75? 20% 37% 17% 25%
The overall performance of learners on questions 1.2 and 1.3 was low with
performance figures of 28% and 25% respectively.
3.3.2 Results for Question 2
The results for question 2 was by far the highest of all the questions and are
summarised in table 2:
Table 2
Question SScchhooooll 11 SScchhooooll 22 SScchhooooll 33 Average 2.1 Did Sam run at the same average speed
for both races if she ran 15 s for the 100 m
and 40 s for the 200 m race?
100% 68% 100% 89%
2.2 Which runner ran at the same average
speed for both races? 100% 84% 83% 89%
2.3 Which runner ran at a faster average
speed for the 200 m race? 80% 58% 83% 74%
2.4 If Charlie can manage to run at the same
average speed for the 400 m race, what will
his speed be?
100% 63% 83% 82%
Once again school 2’s results were not in line with that of school 1 and 2 although it
also showed a lower success rate for question 2.3.

45
For question 2.1 several learners in school 2 said that Sam ran faster in the 200 m
race. A number of learners also wrote incoherent answers to this question, such as:
“In the first race there was two times below 20 and 2 above 20, so it’s a tie. In the
second race she was in the average time.”
Another learner calculated Sam’s speed in metres per second (but wrote seconds per
metre) without drawing any conclusion.
“100m / 15 seconds 100 ÷ 15 = 6,7 seconds/m
200m / 40 seconds 200 ÷ 40 = 5 seconds/m”
80% of learners in school 1 and 50% of learners in school 3 gave a multiplicative
reasoning answer for question 2.1 that read mostly as:
“No, because 15 x 2 isn’t 40, it’s 30 and he would have to run exactly the same
amount just double.”
Only 16% of students in school 2 noticed the multiplicative relationship. Most
learners in school 2 calculated the speed of each athlete and then drew a conclusion
based on the speed in metres per second. None of the learners in the other two schools
followed this method.
One would think that if learners were successful in question 2.1, that they would
achieve the same success in question 2.2. If learners were able to see that the average
speed at which Sam completed the two races were not the same in question 2.1, then
surely they could find which learner kept his/her average speed for both races and
vice versa. Although this was the case for school 1, school 2 and 3 showed different
results. Where school 3 scored 17% lower for question 2.2, school 2 scored 16%
higher. The learner responsible for the lower results for school 3 must have misread
the question since she swopped the answers for question 2.2 and 2.3 around. Almost
all the learners in school 2 that obtained the incorrect answer did so by calculating the

46
average speed of each runner in metres per second and due to their rounding
techniques they calculated that Alex ran at the same average speed in both races. One
learner scratched out the decimals to obtain an answer of 4 m/s (or in her case
seconds/m).
“100m / 23 seconds 100 ÷ 23 = 4,35 seconds/m
200m / 45 seconds 200 ÷ 45 = 4,44 seconds/m”
Question 2.3 seemed to have obtained the lowest scores of question 2. 55% of learners
that obtained the incorrect answer did so by saying that Sam and/or Jordan ran faster
because their time was more. One learner explained it as running “higher for 200 m”.
One learner came to the conclusion that “no body” ran faster and a further 36% of
learners said that Charlie ran at a faster average speed for the 200 m race. One of
these learners even gave the correct answer for question 2.2 by saying that Charlie ran
at the same average speed for both races.
A third of the learners that obtained the incorrect answer for question 2.4 left the
question blank. An additional third obtained the incorrect answer by trying to work
with average speed in metres per second, but incorrectly multiplying the answer by
400 m. The remainder of the learners all worked with the wrong person’s time and
calculated the time for Sam or Jordan instead of for Charlie.
One learner in school 2 clearly used a build-up strategy during question 2. It is not
clear how much insight there is into her calculations since the explanations that
accompanied her calculation were quite puzzling. Her methods are as follows:
2.1 He did in a way because another 15 is added to 15 gives you 30 and he ran
10 s after that, so he did basically keep the same average: 100 + 100 = 200
and 15 + 15 = 30
2.2 They all did basically. Some just over
Sam: 15 + 15 = 30 / 40
Alex: 23 + 23 = 46 / 45
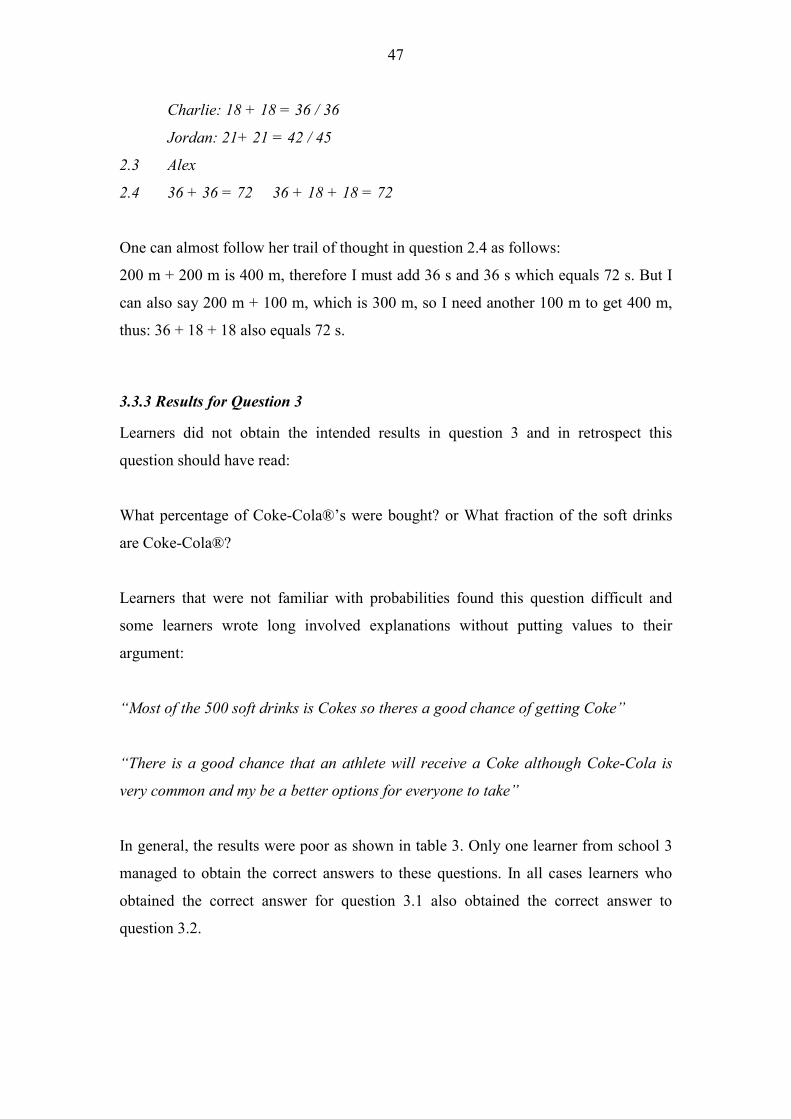
47
Charlie: 18 + 18 = 36 / 36
Jordan: 21+ 21 = 42 / 45
2.3 Alex
2.4 36 + 36 = 72 36 + 18 + 18 = 72
One can almost follow her trail of thought in question 2.4 as follows:
200 m + 200 m is 400 m, therefore I must add 36 s and 36 s which equals 72 s. But I
can also say 200 m + 100 m, which is 300 m, so I need another 100 m to get 400 m,
thus: 36 + 18 + 18 also equals 72 s.
3.3.3 Results for Question 3
Learners did not obtain the intended results in question 3 and in retrospect this
question should have read:
What percentage of Coke-Cola®’s were bought? or What fraction of the soft drinks
are Coke-Cola®?
Learners that were not familiar with probabilities found this question difficult and
some learners wrote long involved explanations without putting values to their
argument:
“Most of the 500 soft drinks is Cokes so theres a good chance of getting Coke”
“There is a good chance that an athlete will receive a Coke although Coke-Cola is
very common and my be a better options for everyone to take”
In general, the results were poor as shown in table 3. Only one learner from school 3
managed to obtain the correct answers to these questions. In all cases learners who
obtained the correct answer for question 3.1 also obtained the correct answer to
question 3.2.

48
Table 3
Question SScchhooooll 11 SScchhooooll 22 SScchhooooll 33 aavveerraaggee 3.1 What is the probability of receiving a
Coke-Cola if 240 out of 500 tins are Coke-
Cola?
40% 53% 17% 36%
3.2 What is the probability of not receiving a
Coke-Cola? 40% 53% 17% 36%
An undetected error crept in with question 3 but interestingly enough the learners that
followed the expected method were not bothered by this error at all. If the tins of
Coke-Cola®, Fanta® and Sprite® are added together the total is only 480 tins and not
500. Learners who calculated the chance of not getting a Coke-Cola® by subtracting
the number of Coke-Colas® from 500, obtained the correct answer of 260 in 500
chance or 52% did not notice this discrepancy. Learners who added all the Fantas®
and Sprites® came to an answer of 240 in 500 or 48% - this was also taken as correct
since learners showed that they had insight into the problem and could reason
proportionally. Some learners even expressed the answer as 240 in 480 thus equalling
50% for both chance on Coke-Cola® or not getting Coke-Cola®.
One learner recognised that the chance of receiving a Coke-Cola® at the end would
be less than 50% but included the following calculation:
“500 ÷ 240 = 2,08 the chance would be less that half”
3.3.4 Results for Question 4
Learners achieved the best results in question 4.1 and 4.2. with all learners obtaining
the correct answer to question 4.1 and only four learners (11%) incorrectly answering
question 4.2. The remainder of question 4 was poorly answered with only learners
from school 2 attempting all questions. No learners from school 3 obtained any
correct answer for questions 4.3, 4.4, 4.5, 4.5 and 4.7. In school 1 some learners were
only able to answer questions 4.3 and 4.6, but there were no correct answers for
questions 4.4, 4.5 and 4.7 as is clear from table 4:

49
Table 4
Question SScchhooooll 11 SScchhooooll 22 SScchhooooll 33 Average 4.1 If 1 sachet of Game makes 1 ℓ then how
many sachets are needed to make 2 ℓ? 100% 100% 100% 100%
4.2 How many sachets are needed for 500
mℓ of Game? 100% 84% 83% 89%
4.3 Energade is mixed in the ratio 1:3, how
many mℓ of concentrate and water is
needed for make 1 ℓ of Energade.
20% 21% 0% 14%
4.4 What percentage of the Energade is
concentrate? 0% 26% 0% 9%
4.5 What percentage of the Energade is
water? 0% 26% 0% 9%
4.6 Is 75 mℓ of concentrate and 300 mℓ of
water mixed in the ratio 1:3? 60% 74% 50% 61%
4.7 Which will have the stronger taste: 75
mℓ of concentrate to 300 mℓ or 45 mℓ of
concentrate and 270 mℓ of water?
0% 58% 0% 19%
In question 4.1 learners had to recognise the doubling of values. If 1 sachet of Game®
is needed to make 1 litre of Game® energy drink, then to make 2 litres of energy
drink – double the amount of energy drink – one would need double the amount of
Game® sachets, thus 2 sachets.
In question 4.2 learners had to recognise the halving of values. If 1 sachet of Game®
is needed for 1 litre of Game® energy drink, then to make 500 m of energy drink –
half the amount of energy drink – one would need half the amount of Game® sachets,
thus ½ a sachet. The incorrect answers to these questions were quite arbitrary with
answers ranging from 500 m to 2, 3 and 4 sachets.
Question 4.3 saw learners really confused with the ratio 1:3. A third of learners that
obtained the incorrect answer for question 4.3 worked with a fraction of instead of
. Learners incorrectly thought of the ratio 1:3 as a part-whole ratio where one part is
concentrate of the total of three parts energy drink and the remaining two parts of the
13
14

50
whole is concentrate. For this reason they obtained the answer of 333,3 m
concentrate and 666,6 m water.
7% of learners obtained the answer of 300 m of concentrate and 700 m of water
with no calculations to substantiate their answer. This still seemed to make more
Mathematical sense than the following three answers:
“1 millilitres of Energade® and 3 millilitres of water is needed = 1:3”
“13 millilitres of concentrate and 500 m of water is needed for 1 litre”
“0.5 m : 1.5 m “
“3.9”
One really wonders how much thought went into answers like these and how long it
will take learners like these to adapt from an answer driven approach to Mathematics
to a thought driven approach to Mathematics – an essential quality needed to make
sense of Mathematical Literacy.
Two thirds of learners that calculated question 4.3’s answer as 333,3 m and 666,7
m, gave the answers of 33,3% and 66,7% for questions 4.4 and 4.5 respectively. One
learner that also obtained the answer of 333,3 m and 666,7 m made the following
interesting calculation:
“333 x 3% = 10% of the Energade® will always be concentrate
667 x 3% = 20% of the mix is water”
One would think that a learner that was able to calculate the correct answer for
question 4.3 would use the same strategy to solve questions 4.4 and 4.5. From the
mere 9% of learners that obtained the correct answers for questions 4.4 and 4.5, only
two learners also obtained the correct answer for question 4.3. The rest of these
learners only answered question 4.4 and 4.5 correctly.

51
61% of learners obtained the correct answer for question 4.6. Only 35% gave an
explanation for their answer which was disappointing since giving no explanation can
merely indicate a lucky guess on the learners’ part. This argument is strengthened by
two learners that correctly answered “no” to this question but reasoned that the ratio
contained too much concentrate and too little water. Explanations that were given
were not always clear and two learners correctly simplified the ratio of 75 : 300 to the
ratio 1 : 4 from which they deduced that the mixture contained too much water. Three
of the learners worked with the with-in ratio of 1 : 3 to calculate that for the ratios to
be the same one would either need 100 ml (300 ÷ 3) of concentrate or 225 ml of
water (75 x 3).
One learner used the between ratio strategy and explain it as:
1 : 3 x 75 x 100
75 : 300 no
Without any further explanation it was clear how this learner thought about the
calculation. The multiplicative relationship between the first terms and between the
second terms is not the same and therefore the ratios are not equivalent.
In question 4.7 learners achieved less successful results and only learners from school
2 managed to answer this question correctly. In this question it was clear that learners
from school 2 had spent some time on ratios before the baseline assessment. 60% of
learners in school 1 and 17% of learners in school 3 thought that the two ratios were
the same which could indicate towards additive instead of multiplicative strategies.
No learners in school 2 made this mistake. The reason why learners could possibly
think that the two ratios were equivalent could be explained as:
45 + 30 = 75 and 270 + 30 = 300 thus the ratio 45 : 270 and 75 : 300 must be
equivalent. Learners reason that if you could add equal amounts of water and
concentrate to the mixture it would remain in the same ratio.

52
Four learners explained their answers to question 4.7. Only one learner simplified
each ratio to obtain the answers of 1 : 4 and 1 : 6 from where it was easy to explain
that the second ratio contains more water.
The remaining three learners gave explanations which used a combination of
multiplicative and additive strategies.
“45 m x 3 = 135 m 270 – 235 = 135 m more water
75 m x 3 = 225 m 300 – 225 = 75 m more water
45 m mixed with 270 m is less stronger”
Interestingly enough, although these three learners all used the multiplicative
relationship of “multiply by three”, none of them seem to calculate the answer to 4.3
and 4.5 correctly. Although this method ensured the correct results for this question,
learners might not be so successful when given the following two ratios:
75 : 300 and 40 : 160
40 m x 3 = 120 m 160 – 120 = 40 m more water
75 m x 3 = 225 m 300 – 225 = 75 m more water
A learner will say that the ratio of 75 : 300 contains more water, whilst in fact both
ratios can be simplified to 1 : 4.
3.3.5 Result for Question 5
Table 5
Question SScchhooooll 11 SScchhooooll 22 SScchhooooll 33 Average 5.1 What is the scale of a model, if 30
cm on a scale model represents 100 m? 20% 0% 0% 7%
5.2 If the real life width of the track is
70, what will the width of the track on
the model be?
0% 0% 0% 0%
5.3 If the real height of the stadium is 12
m and Alex makes the height on the
model 4 cm, is the height in the same
scale as 5.1?
40% 37% 0% 26%

53
In Question 5.1 no learners were able to simplify the scale of the drawing to 1 : 333,3.
Only one learner managed to determine the un-simplified scale of 3 : 1000 and wrote
it in fraction form as .
50% of learners in school 3 obtained the answer of 1 : 3. In itself this mistake is
excusable, but what is of concern is that their teacher marked this answer correct. If
his knowledge on scale (and ratio) is of such a nature that he interprets this answer as
correct, then it will reflect in his learners understanding.
With the poor results of question 5.1 it was no surprise that no learners managed to
calculate the correct answer to question 5.2.
Question 5.3 was answered in a similar fashion to that of question 4.6 where one can
expect “educated guesses” instead of calculations. Only learner gave an explanation to
her answer of 4 : 12 which can be simplified to 1 : 3 and made no conclusion since
she was unable to find the ratio to question 5.1 to compare it to. No other learner gave
explanations to their answers.
3.3.6 Concerning factors
While school 1 and 3 conducted this assessment during the first week of school,
school 2 conducted this assessment at the end of the second week of teaching. During
this teaching period they covered the concept of ratio and proportion. Conducting this
assessment at different stages of teaching proportional reasoning gave valuable insight
into learners’ thinking. Learners in school 2 where clearly more experienced in
answering questions such as “which will have the stronger taste: 75 mℓ of concentrate to 300
mℓ or 45 mℓ of concentrate and 270 mℓ of water?”, and yet they performed worst on
presumably easier questions according to Noelting’s levels. For question 2 on the
comparison of running time, school 1 scored an average of 95%, school 3 score 88%
and school 2 scored a mere 68%. This raises questions about the foundations on which
teaching for proportional reasoning is happening.
30 310000 1000
=

54
When it comes to Mathematics one is always faced with learners memorising methods
rather than using intuition and logical thought processes. When looking at the answers
given by school 2, especially for question 2, one wonders how learners reasoned about
the situation to obtain such unmethodical answers and if methods they had been
taught were not merely misused. As was shown in the results of question 1 where
learners had to calculate the number of packets chips or the amount of kilograms
needed, learners often get confused between having to multiply or divide. They either
have a poor understanding of the fractions and ratio or they are not making sense of
what is being asked. Many of the responses to other questions were equally confusing
and it would seem to appear that learners are not trying to make sense of what is being
asked. They do not seem to engage in problems and seem to write down a set of
calculations for the sake of doing answering the question. This attitude is supported
by answers given to the questionnaire below.
3.4 Section B: The questionnaire
The questionnaire, as set out in Addendum C, was given to learners as section B of
baseline assessment and aimed to capture some of the attitudes that learners bring to
the Mathematical Literacy classroom. I compiled this questionnaire with the goal of
gaining some insight into learners’ attitude towards Mathematical Literacy and their
conception about Mathematics, Mathematical Literacy and ratios, so that it may help
to design activities accordingly.
3.4.1 Analysis of the questionnaire results
The response captured here are the combined responses of Mathematical Literacy
students in the three different private schools in the West Coast District. There were
no remarkable difference in the responses between the schools except for question 3
and 4 where learners were asked about their favourite concepts in Mathematics and
what they find the easiest in Mathematics. 67% of learners in one of the schools were
the only learners who said they like geometry and found it easy. Interestingly enough,
even the remaining 33% of learners in this specific school said they dislike Geometry
and find it the most difficult concept. Most learners within the other two schools said
they dislike Geometry and find it the most difficult concept in Mathematics.

55
Question 1: There were a variety of reasons why learners chose Mathematics over
Mathematical Literacy. This could be due to the way the subject was “sold” to
learners but the leading perception was still that Mathematical Literacy is easier than
Mathematics. Few learners chose Mathematical Literacy over Mathematics because
they dislike Mathematics although most of them expressed their emotions as “tense
and/or irritated” in question 7.
Figure 1
Question 2: When asked how learners perceive the difference between Mathematical
Literacy and Mathematics, the overwhelming response was once again that they
perceived Mathematical Literacy as being easier. They did however recognise that the
objective of the subject is different to that of Mathematics and focuses on
Mathematics in everyday life rather than the manipulation of numbers.
Reasons why learners choose Mathematical Literacy over Maths
0
10
20
30
40
50
60
easier marks dislike maths better for career
perc
enta
ge

56
Figure 2
Question 3: When asked what learners enjoy the most in Mathematics the responses
varied from “nothing” to “getting the answer right” to even “problem solving”. The
learners who enjoy Geometry are from one specific school whilst the rest of the
responses were varied with no particular favourites within a particular school.
Figure 3
Question 4: It is interesting to note that although there is a strong connection between
what learners like and what they perceive as easy, it is not exactly the same. Look for
example at the percentage of learners that enjoy problem solving – it is not necessarily
Perceptions of Mathematical Literacy
It has application in every day life
37%It is easier
than Mathematics
63%
Favourite topics in Mathematics
0
5
10
15
20
25
30
35
probability algebra nothing %, ratios,fractions
problemsolving
getting theansw er
right
geometry dataanalysisgraphs &
tallys
interest
Perc
enta
ge

57
easy for them, but yet they find it enjoyable. We can speculate why learners enjoy
interest, and find it easy, as that it can be attributed to the “follow the formula and get
the answer” nature of interest as it is presented in grade 9. In general the responses to
this question were diverse with no definite favourite under participants. Once again
the geometry responses only came from one particular school.
Figure 4
Question 5: It was clear from the gathered information that almost 50% of the
participants strongly disliked Geometry. One normally anticipates that most learners
would dislike Algebra, but only 21% of participants indicated a dislike in Algebra in
comparison to a dislike in Geometry of 47%. Where 32% of participants indicated
fractions as a favourite concept, 21% showed a dislike in the concept.
What learners find the easiest in Mathematics
02468
1012141618
alge
bra
bodm
as
expo
nent
s
prob
abilit
y
prob
lem
sol
ving
data
ana
lysi
s gr
aphs
&ta
llys ge
omet
ry
noth
ing %
inte
rest
Perc
enta
ge

58
Figure 5
Question 6: The responses to this question are not in line with the answers from
question 5 as was the case with question 3 and 4. Although some learners seemed to
dislike fractions, they did not necessarily find in difficult. The percentage of learners
that dislike ratio and scale, 16%, is not the same as those that find it difficult, 11%,
but an additional 5% of learners find conversions difficult which could directly be
linked to ratio and scale. For example: if there are 100 000 cm in 1 km, then we are
working with a ratio (or scale) of 1 : 100 000. Although most learners seem to find
Geometry difficult it is still only 32% of participants compared to 47% of participants
that dislike the concept. The percentage of learners that dislike Algebra is much more
in line with the percentage that finds it difficult. None of the participants said that they
dislike problem solving – on the contrary – 16% of learners said that they enjoy the
concept, yet learners listed it as a concept which they find difficult. This is a clear
indication that learners taking Mathematical Literacy do not necessarily dislike
challenges which they may find difficult. 16% of learners answered that “getting the
answer right” as the best part of Mathematics and although a lot can be read into this
statement in terms of classroom norms where answers are more important than
methods, I am sure that all mathematicians have felt that wonderful sense of
satisfaction when solving an intricate problem.
Dislikes in Mathematics
05
101520253035404550
everthing probability fractions algebra ratios/scale geometry
Perc
enta
ge

59
Figure 6
Question 7: What learners like and dislike and the type of answers given to these
questions like “I enjoyed nothing” and “everything is difficult” already conveyed
messages of the type of emotions that these learners experienced in the Mathematics
class. Except that these are not the type of emotions that a teacher would like to evoke
in children, it is also these attitudes that the learners bring to the Mathematical
Literacy class. Most participants in this study said they felt tense or irritated in class
and that they struggle to keep up with everything that was happening. Some of the
statements include:
“confussed, the teacher never helped me”
“I feel bored, stupid and under constant pressure”
“Stressed, because it moves so fast and it takes a long time for me to understand.”
What learners find the most difficult in Mathematics
0
5
10
15
20
25
30
35
probability conversions problemsolving
ratios/scale everthing fractions algebra geometry
Perc
enta
ge

60
Figure 7
Questions 8 and 9: Learners really struggled to explain what they knew about ratios
and its application. Most learners (36%) did not know that it had any application in
real life and one learner thought it meant the same as “radius”. 31% of learners said
that it had to do with division while another 11% and a further 5% gave more specific
examples of distance, scale and exchange rates. The 15% of learners that said that we
use it “everywhere” did not supply any examples and we can thus not assume that
they can substantiate their answer.
Some of the answers to question 8 include:
“Makes the bigger proportions of numbers into their simplest form.”
From this statement we can gather that the learners have experienced simplifying
ratios but saying that you simplify the “bigger proportion” almost sounds as if the
learner thinks the ratios are not equivalent.
“That its comparing 2 or more points in as specific form.”
Emotions experienced in the Mathematics classroom
31%
21%
11%
5%11%
21%shy
not really bother
good
tense/irritated
w aste of time
clueless

61
Although it is also a clumsy explanation, this learner’s answer was the closest to the
nature of ratios. Ratios can indeed be seen as comparisons of quantities: Boys to girls,
measurements on a map to measurement in reality etc.
Figure 8
3.5 Conclusion
Most learners chose to take Mathematical Literacy since it is perceived as “easier”
than Mathematics. Although the baseline assessment showed very poor results on
learners’ proportional reasoning skills, as well as their knowledge of where ratios are
used in real life, many of them indicated percentages, ratios and fractions as favourite
concepts in Mathematics. A close second was “getting the answer right” which show
these learners’ need for success and appreciation. 84% of learners felt shy, tense,
irritated or clueless in the Mathematics class or that Mathematics was a waste of time.
The highest scoring concepts that learners rated as the easiest in Mathematics
included interest and data analysis – two concepts that require, in most cases, merely
Learners' thoughts on where ratio's are used in our daily lives
5%
16%
21%11%
11%36%
not much
division
distance and scale
everthing
cooking
exchange rate

62
the substitution of numbers into a given formula. This supports the claim that learners
prefer not to actively engage in problems. This is further supported by almost 50% of
learners that dislike geometry since geometry requires learners to actively analyse
questions in order to find solutions. It cannot be solved by using a set formula.

63
Chapter four: Proposed didactical strategies for teaching
proportional reasoning
This chapter contains the theoretical rationale for the didactics used during this
research process. These didactics are influenced both by learners’ proportional
reasoning skills identified in the baseline assessment test, as well their attitudes
identified by the baseline assessment questionnaire. The theoretical approach to
didactical strategies will include the meaning of proportional reasoning and extent of
the concept in the Mathematical Literacy National Curriculum Statement. It will also
look at the principles of Realistic Mathematics Education and especially how the
principle of intertwinement or interconnectivity must be employed to link concepts
that require proportional reasoning.
The psychological approach will link to this by exploring the type of thought patterns
that learners will need in order to make sense of proportional reasoning. This will
include the work of Skemp on relational versus instrumental understanding. This all
forms part of the classroom culture that needs to be created in the Mathematical
Literacy class.
4.1 A theoretical approach to didactical strategies
There are several problems that hinder the successful teaching of proportional
reasoning in Mathematical Literacy. As we discussed earlier, the nature of the
proportional reasoning itself is quite problematic and requires that the teacher has a
firm understanding of the concept him/herself as well as a clear understanding of
learners’ thoughts. What is also of great concern, is that teachers not only have to
facilitate transfer of proportional reasoning knowledge between the different fields in
Mathematical Literacy that require proportional reasoning, (such as ratio, rate,
percentages), but also facilitate transfer from abstract concepts to real life situations.
Although Mathematical Literacy has a strong focus on real-world problems and by its
nature follows a problem-solving approach, learners still find it difficult to connect
their primitive strategies to the formal strategies suggested by teachers. It thus
becomes a fine balancing act to include different context that will include different

64
concepts in such a way that teachers enable learners to transfer knowledge within
context and concept whilst dealing with the difficult concept of proportional
reasoning.
Cramer et al. (1993: 13) describes the ability to reason proportionally as follows:
Proportional reasoning also involves the ability to solve a variety of problem
types. Missing value problems, numerical comparison problems, and two
types of qualitative situations are among the types of problems that are
important for children to understand. Proportional reasoning involves the
ability to discriminate proportional from nonproportional situations. A
proportional reasoner ultimately should not be influenced by context nor
numerical complexity. That is, students should be able to overcome the effects
of unfamiliar settings and cumbersome numbers.
Cramer also emphasises the importance of transfer by saying that learners should not
be affected by context and numerical differences. By teaching proportional reasoning
we are not only focussing on the high order thinking skills involved in proportionality,
but also on the high order thinking skill of transfer of knowledge between one
proportional reasoning problem to the next.
4.1.1 Defining proportionality
Wu (2002) places a lot of emphasis on giving meaning to Mathematics. He stresses
the following three points which should be the cornerstone of any Mathematics
teachers’ didactical approach:
1. that precise definitions form the basis of any mathematical explanation, and
without explanations mathematics becomes difficult to learn,
2. that logical reasoning is the lifeblood of mathematics, and one must always
ask why as well as find out the answer, and finally,
3. that concepts and facts in mathematics are tightly organised as part of a
coherent whole so that the understanding of any fact or concept requires also
the understanding of its interconnections

65
It is point three that is the essence of this investigation: “the understanding of any fact
or concept requires also the understanding of its interconnections.” Interconnectivity
is such an important concept in Mathematics teaching but it is not an easy task to
focus learners’ attention on the bigger picture whilst teaching the smaller parts that
make up this intricate network of knowledge. I will therefore be focussing my
attention on the teaching of proportional reasoning and its interconnectivity in the
next chapter.
Mathematics teachers seem to focus their attention on the manipulation of numbers
rather than the meaning and the wording behind their actions. Children seem to think
that the words being used in the Mathematics classroom have nothing to do with what
they learn in the language class. Take for example the words binomial and trinomial.
Few children make the link to bicycle, meaning two, and tricycle, meaning three.
They have learnt the prefixes and their meanings in the language class, yet they do not
connect it to what is being taught in the Mathematics class. Teachers can blame
learners for this, but it is ultimately the responsibility of the teacher to make
Mathematics a sensible subject that is, in contrast to what learners might believe,
connected to the world around them. This is in fact what Mathematical Literacy is all
about: Mathematics in the world around us. But if learners cannot make the link
between the language being used outside the Mathematics class to the language being
used inside the Mathematics class, what is the chance that they will make the all
important connections between concepts teachers would like for them to make?
Wu (2002) places a lot of emphasis on definition. Whilst reading his article I looked
up the Oxford Dictionary’s definition of the word “proportionality”. It gives us the
following explanations:
1. Part of Whole: a part or share of a whole: Water covers a large proportion of
the earth’s surface
2. Relationship: the relationship of one thing to another in size, amount, etc.
Ratio: The proportion of men to women in the college has changed
dramatically over the years.
3. Size/Shape: the measurement of something; it’s size and shape

66
4. Mathematics: the equal relationship between two pairs of numbers, as in the
statement “4 is to 8 as 6 is to 12”. (Oxford Advanced Learner’s Dictionary,
2005: 1166)
What is interesting to note is that even in the dictionary the meaning of the word has a
different description in terms of Mathematics. Yet, if we look at all four the
descriptions, they are all true to the Mathematical meaning. The second meaning of
“relationship”, which immediately brings thought of functions and rate to mind is then
also in their opinion synonymous with ratio. If linguists can see the links between
these Mathematical concepts, then why do teachers of Mathematics seem to have such
a difficult time in making the link ourselves and helping our learners to make the link?
By opening the dictionary and exploring the meaning of a word, teachers can initiate
complex discussions on the nature of a concept in Mathematics. By doing this,
teachers are addressing all three cornerstones of Wu’s approach to teaching
Mathematics. They are explaining and defining a concept. They are initiating logical
thought and exploring the interconnectivity of the proportionality. And although this
discussion will not turn all students into immediate masters of proportionality, it is a
way to open the door for exploration. It can act as platform to work from and refer
back to whilst busy with proportionality and also related concepts. Teachers must aim
to create a web of interconnected pieces of information and skills in Mathematics
rather than carefully structured chunks of information that learners need to memorise
in order to pass exams.
What remains the most important and defining factor of proportional reasoning, is that
it is multiplicative in nature. To develop proportional reasoning, learners will thus
have to move away from additive strategies to multiplicative strategies. Instead of
asking how much more, they will have to ask how many times more?
Whilst working on this research, a Mathematical Literacy teacher happened to ask me
if I had any proportion problems she could use. Enthusiastically I replied that I had
several and wanted to know exactly what she was looking for whilst handing her a set
of activities. She looked confused and asked again as if she had not made herself clear

67
the first time. It was only after a while that I realised that she was referring to inverse
proportions only. She interpreted the content of the chapter of ratio and proportion as
directly proportional situations being ratio and indirectly proportional questions being
proportion.
She was convinced of her opinion and ensured me that it was how her subject head, an
experienced Mathematical Literacy teacher and textbook writer, had designed the
work-schedule.
Her argument has its merit since I have often wondered what the “proportion” in the
chapter ratio and proportion refers to. What concerns me though is this teacher’s
ability to teach Mathematical Literacy in such a way that it has meaning to learners if
she is not even able to make sense of the word proportion herself. Surely she has used
the word “proportion” outside its mathematical context and has a specific meaning
she attaches to the word. Are the mathematical and the non-mathematical meanings
mutually exclusive as the dictionary had tried to explain?
4.1.2 Proportional reasoning through-out the Mathematical Literacy National
Curriculum Statement
Transfer plays a vital role in the Mathematical Literacy classroom: not only between
content and context, but also between content concepts. As mentioned earlier, few
teachers, and ultimately learners, make the connection between different proportional
situations. Hence, I will briefly point out the importance of proportional reasoning
throughout the Mathematical Literacy curriculum and Subject Assessment Guidelines
as published by the Department of Education (2007).
Learning Outcome One
Learning outcome one centrals around numbers, operations and relationships. The
learner must be able to recognise, describe and represent numbers and their
relationships, and to count, estimate, calculate and check with competence and
confidence in solving problems.

68
Assessment standard 1.1 includes the following explanation of the range of problem
types that is included: “percentage, ratio, rate and proportion (direct and inverse),
simple and compound growth, calculations with very small and very large numbers in
decimal and scientific notation” (Department of Education 2007: 14).
Once again the term “proportion” is used freely alongside ratio and rate as to suggest
that it is an independent concept linked to ratio and rate and not related to
percentages, growth and fractions at all.
A sharing problem often given to primary school learners as part of fractions can also
be seen as a ratio problem. I would like to refer back to the pizza problem as example
of this where 3 boys shared 2 pizzas and 9 boys shared 7 pizzas and learners have to
decide which group had more pizza. The calculations involved are:
2 ÷ 3 = (or 0,67)
7 ÷ 9 = (or 0,78)
What teachers want learners to achieve during this question is to compare the
fractions of and by either using decimals or equivalent fractions depending on
what has been specified in the question. In this specific situation learners can make
use of a build-up strategy: If the three children have 2 pizza, then six children will
have 4 and nine children will have 6. Thus, the 9 boys who have 7 pizza have more.
This build-up strategy could be an indication of either a ratio or a fraction approach.
The fractions being used in this instance would be or compared to whilst the
ratios would be 2 : 3 or 6 : 9 compared to 7 : 9. A learner using the build-up strategy
would not make use of either of these notations but yet reasons proportionally,
although not on a formal level. I would like to argue that the equivalence of fractions
is vital in making sense of ratios and comparing ratios and will be using this
hypothesis in my didactical strategies.
23
79
23
79
23
69
79

69
The concept of percentages is another way in which proportional reasoning can be
addressed. If 58% of learners in a school are girls and there are a total of 1200
learners, how many girls are in the school? This is in fact a missing value ratio
problem:
58 : 42 totals 100
? : ? totals 1200
It is unlikely that teachers set this question out in such a way or relates to a question
such as the following:
The ratio of boys to girls in a specific school is 5 : 7. If there are 1200 learners, how
many are boys and how many are girls?
The question is basically the same:
5 : 7 totals 12
? : ? totals 1200
A learner who knows how to calculate 58% of 1200 will be able to make use of the
same strategy for the ratio question. In both cases the learner will have to reason
proportionally: and . As mentioned before the
confusion normally centres around part-part and part-whole representations, not only
for teachers, as in the work by Clarke et al. (2003), but ultimately also for learners.
Where 58% is part of a whole 5 : 7 are two parts (that make up a whole of 12). The
two different representations will also be addressed during the chapter on didactical
practises and is an important distinguishing factor when dealing with proportional
reasoning in the classroom.
Percentages form a vital part of Financial Mathematics – a concept that spreads
broadly across the Mathematical Literacy National Curriculum Statement.
Percentages in Financial Mathematics includes: converting currency, VAT, price
increases, appreciation, price decreases, depreciation, inflation and interest.
58 1200 696100
× =7 1200 700
12× =

70
As simple as it may sound, the conversion of currency is not an easy concept for
learners. They struggle to make sense of a situation where the exchange rate of $1 =
R7,80 is given and they are asked to calculate how many dollars one can buy from
R200. Learners want to jump in and make calculations without reasoning. Often their
reasoning is incorrect: instead of understanding that a lot of Rand is needed for few
dollars, they reason that because the Dollar is stronger, it needs to be more. They
make the following calculation:
200 × 7,80 = $1560 instead of 200 ÷ 7,80 = $25,64
Another aspect which seems to influence learners’ choice of operation is the nature of
the answer. Learners who multiply and obtain an answer of $1560 will assume it is
correct since the answer of $25,64102564 is not as visually attractive as $1560. Since
most learners were seldom confronted with “unsightly” numbers in the junior grades,
they assume that the calculation giving them a whole number must be correct.
Murray, Olivier and Human (1999) confirmed this in their research when asking the
apple tart question: of an apple is used to make one apple tart. If there are 20 apples
available, how many apple tarts can be made? Many learners immediately make the
calculation of and feel satisfied with their answer. It takes some probing to
make learners question their answer: if less than one apple is needed to make an apple
tart, how can 20 apples only give 15 tarts?
It is this same type of probing that Mathematical Literacy teachers need to do to
initiate reflection on answers: How can R200 give me $1560? Is $1560 dollars not
worth a lot more than R200?
Most learners find it fairly easy to calculate the amount of VAT that needs to be
added onto a product. If 14% VAT needs to be added onto an amount of R550, most
learners will make the following calculation effortlessly: . Yet, if asked
what amount of VAT was charged on R456, few learners can make the calculation. If
structured as ratios, the two questions would look as follow:
34
3 20 154× =
14 550 77100
× =

71
VAT that has to be charged on R550:
14 : 100
? : 550
VAT that has been charged on R456:
14 : 114
? : 456
Of course one can argue that the reason that most learners cannot solve the latter
question is due to their inability to recognise that R456 is representative of (or
equivalent to) 114%. Regardless of the fact that the learners might or might not
recognise VAT inclusive amounts as representative of 114%, the reasoning involved
in solving this type of question remains proportional in nature. Most learners
calculating VAT would first calculate the VAT amount and add it onto the original
price. Although it is a totally acceptable method, it does not allow learners insight into
the “make-up” of the new price. They calculate the 14% VAT, without reasoning that
the new price is comprised of the original price, of 100%, plus the VAT, of 14%, to
make 114%.
The same principle applies when calculating price increases or assets that have
appreciated in value. If the price of milk has increased with 50% to that of R16,50
then the R16,50 is representative of 150% and the original price which is
representative of 100%. Setting the question up in ratio format would look as follow:
150 : 100
16,50 : ?
This is another example of a typical missing value type of problem. Once again
learners would find this question much more difficult than calculating the price after
an increase.

72
When working with price decreases or the depreciation of an item, it would also be
easier to calculate the price after the decrease than before the decrease. Once again
many learners follow a two step method during which they first calculate the decrease
amount after which they subtract the decrease amount from the original amount. For
example: A car valued at R100 000 depreciated with 5%. What is the car worth now?
Learners who follow a two step method would make the following calculation:
These learners would not necessarily recognise that the new price is represented by
95%. Although it might seem a rather simple calculation to make to find that the new
price is 95% of the original price, learners do not seem to make the link between this
calculation and their two-step method.
The proportional set-up to this question would look as follow:
95 : 5
94050 : ?
Price changes due to inflation work on the same principles as price increases. The
Consumer Price Index (CPI), associated with inflation, requires of learners to find
representative values of prices and cannot be solved by using the two step method
mentioned earlier unless learners first calculate the index difference to calculate the
price difference so that they can calculate the new price of an item. For example: If
the CPI for 2001 was 106 and the CPI for 2002 was 115, then what would a basket of
groceries that was R100 in 2001 amount to in 2002?
One would need to realise that the groceries of R100 are represented by an index of
106, whilst the groceries for 2002 are represented by 115. The situation could be set-
up as follow:
5100000 5000100
100000 5000 95000
× =
− =
594050 495095
× =

73
106 : 115
100 : ?
When solving this problem one would have to say:
Interest in terms of the growth of money in an account, at either simple or compound
interest, is an excellent way of exploring constant growth versus non-constant growth.
According to Cramer et al. (1993) the ability to reason proportionally “involves the
ability to discriminate proportional from non-proportional situations”. What is
important to note is that the amount of interest over time in a simple interest account
will grow directly proportional, whilst the total amount of money in the account over
time will grow merely proportionally. A further discrimination can be made between
this proportional growth (either directly or not) and exponential growth of compound
interest.
Learning Outcome Two
Learning Outcome two: Patterns, Functions and Algebra - The learner will be able to
recognise, describe and represent patterns and relationships, as well as to solve
problems using algebraic language and skills.
It is clear from this description that this outcome focuses on rate and growth rate.
Direct and indirect proportions are included in this learning outcome as well as the
distinction between directly proportional growth (y = mx) and proportional growth
that includes a constant (y = mx + c). As Olivier (1992) and Riedesel (1969) suggest,
functional mathematics and presenting ratios as a “special” function or direct
proportion are essential in developing proportional reasoning.
Once again I would like to draw the attention to the use of equivalence, learnt from
fractions, when teaching for proportional reasoning using rate. If 3 boys share 2
pizzas, then 6 boys share 4 and 9 boys share 6 pizzas. Only if the question specifically
asks how much pizza did each person get, are we implying that learners have to
calculate the (gradient) value of . Learners will need to realise that they employ the
115100 108,49106
× =
23

74
same strategies when filling in a table indicating “rate of change” as when they
calculate equivalent fractions.
The counter argument to this statement will of course be that fractions have a limiting
representation. If the numbers in the following table have to be written as fractions, it
would become rather unsightly:
People: 1 2 3 4 5 6
Pizza: 2 2 3 4
As fractions:
Although I would not for one moment expect from learners to represent the situation
as fractions, I feel that learners (hopefully) already have knowledge on multiplicative
strategies used in equivalent fractions. This knowledge of multiplicative strategies in
equivalence should be used as reference from where rate, and other concepts
involving proportional reasoning, should be introduced.
Learning Outcome Three
Learning Outcome three: Space and Shape (Geometry) - The learner will be able to
describe and represent characteristics and relationships between two-dimensional
shapes and three-dimensional objects in a variety of orientations and positions.
Assessment standards 3.2 and 3.3 specifically refer to conversions and scale drawings
which are proportional concepts. Understanding that 70 m is equivalent to 0,07 km or
calculating that 1 m² = 10000 cm² is for some reason not an easy concept for learners
and could most likely be attributed to the proportional nature of the problem.
Proportionally, the problem look as follows:
1000 m : 1 km
70 m : ?
or
23
113
23
13
1 2 3 4 5 6 ; ; ; ; ; 2 1 2 12 41 2 33 3 3 3

75
1 m : 100 cm
1 m² : ?
In the latter question learners would need to realise that 1 m² = 1 m × 1 m, so that they
will be able to calculate that 100 cm × 100 cm equals 10000 cm².
Scale, as rate, is a simplified ratio. Just as rate is for example distance per one hour, so
scale is the real world measurement to a single unit on the map. On a map with a scale
of 1 : 50000, a single unit represent 50000 of those specific units in real life. What has
been interesting in my experience is that learners often ask what unit the scale is in.
The fact that it could be any unit is mind-boggling to them. When working with scale
it is best to use terminology such as “the map is 50000 times smaller than the real
life”, to make learners accustomed to the multiplicative idea of a certain amount of
“times” bigger or “times” smaller.
Although trigonometry is not currently examined at the end of grade 12 in the two
obligatory papers, the National Curriculum Statement originally included this section
and many textbooks have included it as well. I do believe that simple trigonometry
questions of sin, cos and tan where learners must find either missing sides or missing
angles is well within the reach of Mathematical Literacy students. It is also a way of
explaining the special ratios of sides that exists between similar triangles – an activity
which is often used as introduction to triangles.
The link between proportional reasoning and trigonometry is not always as clear as
the links to ratio, rate, fractions and percentages and the importance of proportion in
trigonometry lies in similar triangles. Take for example sin 30° = . This means that
the ratio of the side opposite to the 30° angle and the hypotenuse will always be 1:2.
The following is an example this relationship within a 30-60-90 triangle:
12

76
A B C E
If angle E is 30°, then the ratio of CG:EG will equal BH:EH will equal AF:EF will
equal 1:2.
Learning Outcome Four
Learning Outcome four: Data Handling - The learner will be able to collect,
summarise, display and analyse data and to apply knowledge of statistics and
probability to communicate, justify, predict and critically interrogate findings and
draw conclusions.
An aspect of proportional reasoning which is also often overlooked is that of
probability. In the questions of the probability that you will draw a spade from a pack
of cards, we are working with the fraction of (or ) or 25% or even a ratio of 13
spades to 52 cards (13:52). The wording teachers use when teaching probability is
often accidental and support the link between fractions, ratios and percentages. People
would generally say things such as: “He has a 50% chance of survival” or “you have
half a chance of being right” or “the odds of him winning is 2 to 1”.
To see how all of these concepts are linked is not difficult for someone familiar with
the content, although Sowder et al. (1998) and Person et al. (2004) agree that teachers
1352
14
F
H
G
30°

77
do not always make these links on their own. For starters, teachers have to make these
links themselves so that they can devise teaching activities that will support learners
in making these links. For this purpose social interaction (Boaler 1993: 13) and
Realistic Mathematics Education can be most helpful.
4.1.3 The theory of Realistic Mathematics Education
Social interaction is the heart of constructivism. Von Glasersfeld (1987) talks of
constructivism as a theory of knowledge. The constructivist view involves two
principles:
1. Knowledge is actively constructed by the learner, not passively received from
the environment.
2. Coming to know is a process of adaptation based on and constantly modified
by a learner's experience of the world.
This entails that the child must be an active participator in the learning experience.
The didactical method of teaching must enable the child to dig into the essence of the
work and not merely listen passively to an explanation by the teacher. Constructivism
links to the outcomes of Outcomes-based Education and places strong emphasis on a
learner centred approach rather than a “talk and chalk” approach. The involvement of
the child is thus crucial. This concept was already mentioned by both Piaget and
Vygotsky who emphasised the active involvement of the learner in the learning
process (Green 2001: 84). Heller et al., as in McLaughlin (2003) “support this
constructivist suggestion seeing value in developing the mathematics to deal with
situations rather than look at the situations as an afterthought application.”
A study of Mathematical Literacy would not be complete without looking at research
done into Realistic Mathematics Education or RME. This stresses Mathematics as
meaningful or real activity. Bakker (2004) clarifies that “this does not necessarily
mean that the problem situations are always encountered in daily life. Students can
experience an abstract mathematical problem as real when the mathematics of that
problem is meaningful to them.”

78
On the basis of earlier projects in mathematics education, Treffers (1987) has defined
five general principles of Realistic Mathematics Education:
1. Phenomenological exploration. A rich and meaningful context or
phenomenon, concrete or abstract, should be explored to develop intuitive
notions that can be the basis for concept formation.
2. Using models and symbols for progressive mathematisation. The development
from intuitive, informal, context-bound notions towards more formal
mathematical concepts is a gradual process of progressive mathematisation. A
variety of models, schemes, diagrams, and symbols can support this process,
provided these instruments are meaningful for the students and have the
potential for generalisation and abstraction.
3. Using students’ own constructions and productions. It is assumed that what
students make on their own is meaningful for them. Hence, using students’
constructions and productions is promoted as an essential part of instruction.
4. Interactivity. Students’ own contributions can then be used to compare and
reflect on the merits of the different models or symbols. Students can learn
from each other in small groups or in whole-class discussions.
5. Intertwinement. It is important to consider an instructional sequence in its
relation to other domains. Mathematics education should lead to useful
integrated knowledge. This means, for instance, that theory and applications
are not taught separately, but that theory is developed from solving problems
(Bakker 2004: 6)
As the term Realistic Mathematics Education suggests, the mathematics that are being
dealt with must be “real” to students. Since “realistic mathematics” is also the
underlying theory of Mathematical Literacy, the principles of RME cannot be
overlooked when dealing with the subject of Mathematical Literacy.
“The approach that needs to be adopted in developing Mathematical Literacy is to
engage with context rather than applying Mathematics already learned to the context”
Department of Education (2003a: 42). The context referred to in Mathematical
Literacy documentation is not the same than “word problems” or “story sums” where

79
learners need to recognise the mathematical concept they have been taught. The
context that is referred to is a problem-solving approach where learners are not asked
to do a “sum”, but to engage in a problem using logical thought rather than
manipulating a set of numbers.
During this investigation I will be using context for problems within which learners
can explore the nature of proportional reasoning. The context will also help learners to
verify answers and engage in educational discourse with other students that might
disagree with them.
The models and symbols that I will be using to help learners to make sense of
proportional problems, will be in the form a structural “set-up” of the questions. For
this set-up I will be using a ratio notation although other symbols could be used
instead of the colon. (This set up will be discussed in further detail in Chapter 5.)
When teaching learners how to analyse and make sense of a situation by using this
set-up, I aim to draw their attention to the proportional nature of different concepts
that require proportional reasoning skills. The model for setting up proportional
reasoning problems will thus aid in intertwinement.
When helping learners to set-up question, it is not to teach a specific method. The set-
up is to help learners to construct their own methods and procedures. If learners
cannot make sense of a situation, they also not be able to construct methods to solve
the problem. Models and symbols are thus there to help learners to construct their own
methods. It is this process that Von Glasersfeld (1987) refers to as constructivism.
Constructivism also entails interaction with others to reflect on one’s own methods
and methods used by others. This interactivity is also referred to as educational
discourse. When sharing their views with peers, learners are not only passing
information to others, they are also actively reflecting on their own strategies.
The interconnectivity of concepts through proportional reasoning, as set out in the
previous section, is linked to Treffer’s notion of intertwinement. This concept entails
connections between concepts as well as connections between mathematics in the

80
classroom and mathematics in real life. Further connections could even be made to
other Learning Areas.
These principles of Realistic Mathematics Education, and especially the concept of
intertwinement or interconnectivity, will be central to didactical practises described in
chapter 5.
The concept of Realistic Mathematics Education is also in line with Bell’s (1993)
implications for teaching when stating that “the pupils' main lesson experience should
be of genuine and substantial mathematical activities, which bring into play general
mathematical strategies such as abstracting, representing, symbolising, generalising,
proving, and formulating new questions.” This sentence is laden with responsibilities
for the Mathematical Literacy teachers teaching proportional reasoning. “Genuine”
(real life or authentic) activities make up the essence of Mathematical Literacy, and
teachers should aim to give “substance” to these genuine problems.
Keeping the numbers in Mathematics problems simple they are helping their learners.
Especially in proportional problems this may lead to stagnation. If learners are always
able to use build-up strategies to find the answer in a missing value question, they will
never start thinking multiplicatively. Even if numbers are of such a nature that
learners have to use calculators, all is well as long as they know, and understand, the
multiplicative methods involved. Instead of given problems with ratios such as 2:3 =
8: ?, rather give problems such as 2:3 = 7:?. Learners who always used build-up
strategies to solve the ratio problem by saying 2:3 is the same as 4:6 and is the same
as 8:12, will now have to rethink their methods. This will initiate higher level of
thought even though they might use a calculator.
Bell also refers to “abstracting, representing, symbolising, generalising, proving, and
formulating new questions” – qualities that are all part of advanced levels of cognitive
development. One may think that these qualities are only developed in the
Mathematics, but abstraction is also of great importance in the Mathematical Literacy
class. A simple activity such as finding a formula for the total cost or total income is a
form of abstracting, representing and symbolising. This alone does not constitute that

81
learners have higher order thinking skills that include proportional reasoning.
Proportional reasoning still needs to be developed by means of the qualities that Bell
refers to.
Sowder, Armstrong, Lamon, Simon, Sowder and Thompson (1998) argues that there
are several considerations when preparing teachers to teach multiplicative strategies
for proportional reasoning. The following two strategies which he suggests must be
included in teacher training are also strategies that must be followed when teaching
for proportional reasoning.
1. Teachers need to encounter problems that involve enough complexity to
require sense making with the quantities involved.
2. Teachers should be given extensive opportunities to use notation (conventional
and unconventional) to express their reasoning about quantitative relationships
in given contexts and to describe their own invented solution methods.
As mentioned before, we can mainly distinguish between two types of proportional
reasoning questions: the missing value problem and the comparison problem. These
two types of problems should be given to learners simultaneously. Context play an
important role in Mathematical Literacy due to its application based nature, but
caution should be taken that the emphasis on context for the content does not
overshadow the content. This does not imply that the context is not important, but that
learners also need an opportunity to implement the Mathematical concepts they
“extracted” from a context. The context can at no point overshadow the powerful
Mathematics behind it.
4.1.4 Interconnectivity
Tourniare and Pulas (1985: 200) recognises that “proportional reasoning is not a
unitary construct (and) it is therefore difficult to conceive of a linear teaching
sequence. On the contrary, proportional reasoning should be considered as a multi-
faceted activity, and presented as such.” It is this multi-faced nature of Mathematical
Literacy that I will be taking as my directing paradigm in this investigation. This
interconnectivity, or multi-faced nature of proportional reasoning, is also a wonderful

82
way of giving meaning, proof and logic to Mathematics, but it is a difficult concept to
convey to learners when it comes to didactical practises. Two main problems arise.
1. Where does one start teaching in this web of knowledge?
2. How does one teach or develop interconnectivity?
The word interconnectivity is a way of expression the connections and
interrelatedness between concepts in the Mathematical Literacy National Curriculum
Statement that require proportional reasoning. Bell (1993: 9) refers to this concept as
“connectedness” whilst Treffers (1987), refers to it as “intertwinement”.
Literature on Outcomes Based Education all stress the importance of prior knowledge
as a basis from which to work. It is for this reason that we use assessment tools to
determine our learners’ pre-existing knowledge on the concept. For the purpose of this
study I compiled a fairly comprehensive baseline assessment covering almost all
concepts of proportionality on Noelting’s levels of proportional development, but for
the non researching teacher this can be in the form of informal discussions on the
concept or a less comprehensive baseline assessment. My aim with the baseline
assessment is to determine what learners already know, be it correct or incorrect,
from which I would be able to build on the correct strategies and try to remediate the
incorrect strategies or misconceptions. The Mathematical Literacy teachers often have
not taught the learners in grade 9 and cannot formulate an opinion on the learners’
proportional knowledge and skills. The concept might not have been addressed at all
or it was covered only briefly.
It is also a good idea to test learners on related concepts. Should a teacher wish to start
teaching proportionality from a fraction perspective, for example, he/she need to
know that learners have a sound understanding of fractions. If the foundation for our
teaching is not firm, we cannot build a solid understanding of proportionality. As
Riedesel (1969: 428) suggest, we cannot isolate concepts in Mathematics since
learners will interpret it as new operations with its own set of rules. Bell (1993: 9)
supports this by emphasising that “richly connected bodies of knowledge are well
retained; isolated elements are quickly lost.” Since proportional reasoning skills are

83
needed in such a wide range of concepts in the Mathematical Literacy National
Curriculum Statement, as will be discussed earlier in this chapter, it is essential to
help learners to grasp the extent of the concept.
Some researchers (such as Olivier 1992, Riedesel 1969) suggest that in developing
proportional reasoning teachers have to focus their attention on functional
relationships and present ratios as a “special” function, i.e. a direct proportion with the
format of y = mx. These researchers support the importance of equivalence in ratios
and place emphasis on the use of tables where learners have to complete the table with
the use of the specific constant ratio. The importance of equivalence is thus evident in
their research and I would like to argue that learners that are able to do calculations
involving equivalent fractions, would find the notion of equivalent ratios, as found in
functional relationships, easier. It is for this reason that I will start my proposed
activities for development of proportional reasoning with fractions to not only build
on learners’ prior knowledge, but to insure that learners have a firm understanding of
equivalence.
Once again I would like to stress the difference between ratios and proportional
reasoning. Whilst ratio is but one concept in the mathematics curriculum that requires
proportional reasoning it cannot be seen as proportional reasoning in itself.
Lovell and Butterworth (1966: 5) states that “proportion involves a relation between
relations and the ability to handle it necessitates that the child recognise the
equivalence of two ratios.” Although this explanation of proportion tends to focus
one’s attention to relational or functional mathematics, I argue that we cannot
overlook the importance of equivalence. If a learner is able to set up the ratio pairs
and compare them, either with with-in or between strategies, he/she still has to have a
basic understanding of equivalence as taught in fractions. Learners will have to know
that in order to compare the two sets they have to be in a comparable format – similar
to having common denominators.
The interconnectivity of proportional reasoning is always visible, though problematic,
when teaching this concept. When taking a functional approach to proportional
84
reasoning, learners are essentially determining the “gradient” or rate at which the one
number changes to give the other. For example: If 2 apples cost R3, what is the price
of 5 apples? A child will have to determine the value of m in the expression 2m = 3 in
order to solve 5m. Once they know that the rate is R1.50 or , they can solve the
equation by substitution: 5 x = R7.50. In this example it might be quite easy to
calculate the rate or “price per apple”, but what if we worked with similar triangles
(enlargements or reductions) or VAT? Would learners know that they need to find the
simplified ratio, or rate, to solve the proportional reasoning problem? Functional
Mathematics and rate is a powerful idea in Mathematics and eventually leads to
calculus. It is without doubt a natural part of proportional reasoning, but the problem
remains: is it an adequate starting point to work from?
Interconnectivity can also be seen as transfer of knowledge between concepts and
Boaler (1993) makes the link by referring to the same principles as set discussed in
Realistic Mathematics Education.
“The problems of transfer may be attributed to a mechanised learning environment
which ignores the needs of students and the cultural and social setting of the
mathematics classroom. It is the individuals who negotiate, integrate and makes sense
of the mathematics in their setting. They do this through interacting with the
environment, each student arrives with a multitude of experiences and these influence
and go toward the social dynamic of the mathematics classroom which in turn informs
understanding” (Boaler 1993: 13).
4.2 A psychological approach to Mathematical Literacy
4.2.1 Logical structured thought
It is my strong belief that the aim of Mathematical Literacy is perfectly summarised in
Freudenthal’s ideal that mathematical learning should be an augmentation of common
sense (Gravemeijer and Terwel 2000: 785) Unfortunately it is true that what teachers
perceive as common sense is not always common to learners. For learners taking
32
32

85
Mathematical Literacy logically structured thought does not necessarily come
naturally at all, whilst it seems to be in the genetic make-up of any mathematician or
mathematics teacher. Almost all the learners I teach in my Mathematical Literacy
classes are highly talented artists, dancers or musicians with a strong creative side.
Although we cannot generalise and say that all creative people lack structure and
order in their lives, psychologists have made strong links with the arts and right brain
thinking. Caine (1992) discusses Herrmann’s Whole Brain Model and how it can be
used to build learning experiences to enhance learning and make it more memorable
for all participants.
I do not intend to explore the Whole Brain Theory in any detail, but believe that the
concept can be of great value in the Mathematical Literacy class. In short the theory
centrals around the idea that teaching focuses, to a great extent, on left brain
characteristics such as logical, sequential, rational, analytical and objective thoughts
that look at parts and not the whole in contrast to right brain thinking which involves
intuition and a holistic approach.
Many learners cannot analyse a problem and break it down into smaller pieces of
information so that they can deal with it in order to solve the bigger problem.
Learners, who find it difficult to approach a mathematical problem in a logical step by
step manner, often tend to memorise steps taught by the teacher. Yet, teachers who
focus their attention on the smaller parts of the information should not neglect to see
the bigger relations between concepts, such as the interconnectivity of proportional
reasoning discussed in this study. As Sowder et al. (1998) and Person, Berenson and
Greenspon (2004) found, teachers struggle to make the correct connection between
fractions, ratios, rate and trigonometry as proportional reasoning themes. They tend to
focus their attention on the computations involved in solving the fractions, ratios, rate
and trigonometry questions, so that they fail to see the strong proportional reasoning
theme present in all of them. Mathematical Literacy teachers need to see the web of
interconnected knowledge themselves before they attempt to convey this web of
knowledge to learners.
How the brain works has a significant impact on what kinds of learning activities are
most effective. Teachers need to create appropriate experiences and capitalise on

86
those experiences. According to Caine (1992: 113) there are three interactive elements
that are essential in helping learners to make connections:
1. Teachers must immerse learners in complex, interactive experiences that are
both rich and real.
2. Students must have a personally meaningful challenge. Such challenges
stimulate a student's mind to the desired state of alertness.
3. In order for a student to gain insight about a problem, there must be intensive
analysis of the different ways to approach it, and about learning in general.
This is what's known as the "active processing of experience."
Caine (1992) also stresses that designers of educational tools must be artistic in their
creation of brain-friendly environments. Instructors need to realise that the best way to
learn is not through lecture, but by participation in realistic environments that will
enable learners to experience and explore new situations in the safe environment of
the classroom. If learners in the Mathematical Literacy class tend to be artistic in
nature, teachers cannot keep lessons confined to explanation on the board and pen and
paper textbook activities. Lessons need to be colourful and interactive and even
without the availability of data projectors (and PowerPoint’s®), there is no reason for
a Mathematical Literacy teacher to teach in a traditional structured manner.
4.2.2 Understanding
Skemp (1972) differentiates between Instrumental understanding and Relational
understanding. Instrumental understanding refers to the old school way of teaching
and learning. Formulas and procedures are given to learners to memorise and
reproduce in examination situations. When confronted with a problem, the learners
must merely pick a method and follow the procedures to produce an answer. The
focus falls on the correct answer or performance of the student, and not on the reason
or meaning of the calculations. When teachers use an instrumental way of teaching,
learners have trouble recalling the work after a period of time. The reason for this
being that learners never really fully comprehended it. They memorised rules and
procedures, not mathematics. They were merely following procedures and
manipulating numbers. Truly understanding mathematics means to get to the core of

87
the subject: constructing relations, asking why and finding the how. Although
instrumental teaching allows for quick and easy results, there are a number of things
that are of concern. Learners have no idea why they are following certain procedures,
the concept has no value to them and they tend to develop a negative attitude towards
the subject as a result of this.
If the teacher follows a relational way of teaching, the focus falls on the meaning of
the word: building relationships. Learners are given the opportunity to make sense of
what they are doing. They are encouraged to ask why a certain method is being used
and what other methods could be used. When confronted with a problem, they must
try to make sense of what is being asked and how it could be solved in a logical way.
Each learner is allowed to choose his/her own way of conceptualising the problem.
When learners use their “own”3 methods, and understand the basic concepts of what
and why they are doing something, it makes it easier to remember. It is thus not a
memorising act, but a comprehensive understanding. In years to come, it will be
easier for a learner with a relational understanding of Mathematics to build on his/her
prior knowledge and concepts, than for a learner who memorised a list of procedures.
Boaler (1993: 12) supports this notion that learners’ own self-generated methods
when he says that “students transfer (methods) from one situation to another because
these methods are meaningful to (them); the methods learned in school often are not.”
Bell (1993: 7) also states that the traditional didactics used in the Mathematics class
was always just of “the demonstration (sometimes with explanation) of a single
method followed by practice with a variety of different numbers”. There are no
opportunities for learners to explore the concept and experiment with different
methods. They are forced to memorise given methods, often with limited insight into
the concept and are resultantly unable to apply the concepts they have learnt to similar
situations which Bell (1993: 7) refers to as “the extension or adaptation of the basic
idea”. Even a situation as simple as changing the given and required information
seems mind-boggling to these learners and this is of course where many educators 3 “Own” methods refers to the methods that learners have chosen as their own and not necessarily their
own creations.

88
falter when it comes to proportional reasoning. What is important to note is that
learners often become frustrated by this relational way of teaching, since there is now
no quick and easy way to solve a problem and the reasoning behind this should be
explained.
4.2.3 Classroom culture
One of the most important tasks of a teacher is to create an atmosphere of trust,
respect, willingness and questioning in the class that is a culture vital to relational
teaching. It has no meaning to present problems that lead to exploration and
questioning, if the learners in the class are used to passively listening for instructions.
We must try to change the attitudes of learners in such a way that they are willing to
dig into the essence of a problem. Some learners perceive mathematics as only within
the capacity of a selected few. Some parents tell their children that they are not
capable of doing mathematics. Teachers must let learners experience the joys of
mathematics and assure them that everyone has a valuable contribution to make.
Classrooms should be playgrounds of experimenting with mathematical ideas, taking
chances, making mistakes and not feeling embarrassed by attempts. This atmosphere
is called a positive classroom culture.
Creating a positive classroom culture is probably one of the most difficult dimensions
to teaching, since so many learners are used to an instrumental way of teaching and
since relational teaching involves trust and respect between all role-players. A
classroom where learners feel safe to express their ideas and communicate their
thoughts is vital for teaching relational understanding. Both the constructivism and the
problem-solving approach place emphasis on communicating ideas and reflecting on
thought. This is of great importance if we want learners to make sense of a situation.
By sharing their ideas, learners also reflect on their thoughts in a different way and
sometimes make sense of a problem without even listening to the thoughts of others.
Without learners having respect for others, teachers experience the problem of
learners not listening to the ideas of their classmates. Learners are prejudiced in the
sense that they will listen to some learners and not to others on various grounds, being
it popularity or a perceived idea of competence. Teachers must enforce the idea that

89
all learners have the right to express their thoughts. As mentioned by Mathematical
Literacy learners in the questionnaire, they have all had generally unpleasant
experiences in the junior grade Mathematics classes in the past. These learners would
not necessarily feel comfortable with sharing ideas and actively searching for
solutions since they perceive themselves as less competent in Mathematics. It could
have happened that these learners had the rest of the class react negatively towards
them in the past.
Through creating social norms and standards, teachers can improve the quality of
reflection and communication. Hiebert (1992) calls this, learning through cognitive
psychology and social cognition: Reflection has its emphasis on internal mental
operations, cognitive psychology, and communication has its emphasis on the context
of learning and social interaction, social cognition.
It should be clear that by classroom culture we do not only refer to mathematical
norms and values, but also to social norms and values. “In classrooms that promote
(relational) understanding, the norms indicate that tasks are viewed as problems to be
solved, not exercises to be completed using specific procedures” (Carpenter et al.,
1999) Especially in senior grades, the task of creating an accepting atmosphere is
quite difficult since teenagers are much more aware of the image they hold than junior
learners. It is however imperative that teachers ask learners to reflect on their methods
and ask them if they could relate the new concepts to things they have learnt in the
past. This is the essence of relational understanding: building a network of
knowledge.
4.3 Conclusion
What should be clear from this chapter is the importance of both a theoretical as well
as a psychological approach to teaching Mathematical Literacy. The research on
Realistic Mathematics Education and concept of interconnectivity or intertwinement
will be a directing theory in the design of activities to develop proportional reasoning.
Proportional reasoning is evident in every Learning Outcomes of Mathematical

90
Literacy within the National Curriculum Statement and in the next chapter I will be
showing how the different concepts employing proportional reasoning skills in each
Learning Outcomes can be connected. This needs to be structured in realistic contexts
and implemented in classrooms that support constructivism.

91
Chapter five: Towards a theory of teaching and learning
proportional reasoning
Gravemeijer, Dolk and Den Hertog (2002: 170) distinguish between three phases of
design research that occur and reoccur within the cycle of this research approach. The
first is the preliminary phase where a hypothetical learning trajectory of an
instructional theory is presented. In the second phase this trajectory is either extended
or amended in a cyclic process of making a new hypothetical learning trajectory and
reflecting on the improved trajectory. The third phase is the result of information
gathered throughout the process that can be “used to reconstruct an optimal
instructional sequence” (Gravemeijer et al. 2002: 170).
The chapter will start by describing the original hypothetical trajectory of a non-linear
approach in developing proportional reasoning in Mathematical Literacy and how and
why this trajectory failed to work in the classroom. The change to a linear approach
and the theoretical and structural analysis of the order of the progression of activities
are subsequently described as an amended trajectory. The order of this amended
trajectory and linear approach can in itself be seen as the optimal instructional
sequence.
The manner in which these activities where designed was based on both the baseline
assessment and on empirical research. The principles of Realistic Mathematics
Education (Treffers 1987) is a common thread throughout these activities both in the
way the activities were designed and was conducted in the classroom. As discussed
earlier, on page 83, the principles of Realistic Mathematics Education are closely
linked to the principles of Mathematical Literacy.
In the activities discussed in this chapter, I aimed to keep the context meaningful to
learners so that the context supports the mathematics rather than distract from it. The
linear approach discussed in the most of this chapter starts with an informal, context
supported manner of dealing with proportionality and builds up towards the notion of

92
discrimination between proportional and non-proportional situations. Cramer et al.
(1993) and Lamon (1995), as referred to on page 16, describe the ability to discriminate
between proportional and non-proportional situations as one of the characteristic qualities
of a proportional reasoner and it is therefore the goal and final stage of the activities
described here.
The baseline assessment gave some insight into learners’ constructions, methods and
thinking patterns. This information was essential in conducting the activity to engage
learners in class discussion and challenge them on their methods of reasoning. As
Treffers (1987) suggests, learners that are actively involved in making sense of what
they are doing, make the mathematics their own. This is strengthened by peer
discussions and interaction, as the constructivism theory by Von Glasersfeld (1987)
suggest, since learners have to reflect on their own understanding before orally
expressing their ideas to others.
The last principle of Realistic Mathematics Education and the main theme of this
chapter, is the idea of intertwinement, or as I am referring to it, interconnectivity. A
great deal of research has been done on proportional reasoning. To my knowledge,
none of the researchers have suggested a sequential progression of proportional
activities that will take learners from an informal understanding of proportionality to a
discriminative understanding of proportionality (Cramer et al. 1993; Lamon 1995)
where they can solve a variety of problems types (Carpenter et al. 1999; Cramer, Post,
Currier 1993; Behr & Lesh 1989; Karplus et al. 1983b; Lamon 1993b; Noelting 1980;
Post, Lesh & Behr 1988) and understand the relationships embedded in proportionality
(Cramer et al. 1993; Lesh et al. 1988). These qualities of a proportional reasoner are high
standards to obtain, especially when setting these goals for grade 10 Mathematical
Literacy students. Yet, when analysing the curriculum content, as in chapter 4.1.2,
proportionality is strongly prominent and learners must therefore be supported into
becoming proportional reasoners.

93
5.1 The didactical approach
This research was done during the first term of 2009 with grade 10 learners entering
the subject of Mathematical Literacy. Included in the baseline assessment, a
questionnaire was given to determine learners’ attitude towards Mathematics and
Mathematical Literacy.
As was evident in the questionnaire results where 83% of learners experienced
negative emotions in the Mathematics class, learners enter the subject of
Mathematical Literacy with a range of emotional barriers. When asked in the baseline
assessment questionnaire why learners have chosen Mathematical Literacy over
Mathematics, the answers where saddening. Answers ranged from a dislike in
Mathematics, to hate of the subject as well as learners being forced to take
Mathematical Literacy because, according to teachers, they were to “dumb” to take
Mathematics. Although I am doubtful that any teachers used the word “dumb”, this
was how learners perceived the recommendation to take Mathematical Literacy.
Without intervention these learners will most likely carry this emotional burden with
them throughout their high school careers. This places a big responsibility on
Mathematical Literacy teachers. Except for teaching Mathematical Literacy students
basic mathematics that will empower them in their future lives, these teachers need to
rebuild these learners’ mathematical self-confidence.
Many schools have strict policies that do not allow learners to change to from
Mathematics to Mathematical Literacy in the middle of a year or any later than the
end of grade 10. These schools are therefore very strict in allowing grade 10 learners
into Mathematics. If teachers have any doubt that learners will pass Mathematics, they
are “strongly recommended” to take Mathematical Literacy.
The questionnaire and baseline assessment results were used to direct the nature of
activities and the nature in which the activities must be conducted in order to help
develop proportional reasoning skills. The Mathematical Literacy student and the
Mathematical Literacy classroom must be distinguished from a normal Mathematics
classroom. In this environment mathematical self-esteems are being developed first
and content second. These learners need to hear that they “can do it”, not by giving

94
them substandard work that will lead to high marks, but challenging them in calm and
reassuring way and showing them what they are capable of. These learners know very
well when they are being challenged and when success opportunities are given to
them on a silver platter.
As mentioned throughout this study and supported by researchers such as McLaughlin
(2003) and Lawson (1975), proportional reasoning is a higher order thinking skill and
is therefore not a simple concept to teach. The further interconnectivity between
proportional concepts within the Mathematical Literacy curriculum is another
challenging concept to teach. It would have been unwise to conduct this investigation
without taking into account the type of learners involved. For this learner the
cognitive processes of acquiring knowledge might not come as natural as to a learner
taking Mathematics, since this learner might have created several emotional barriers
towards learning Mathematics throughout their school career.
Piaget, as in Louw, Van Ede and Louw (1998: 75), distinguishes between two
invariant cognitive functions: organisation and adaptation. It the cognitive field of
adaption, Piaget further distinguishes between assimilation, a process where new
knowledge is integrated into existing knowledge structures, and accommodation,
where existing knowledge structures needs to be adapted and structured according to
the new knowledge. When showing learners the similarities and differences between
the concepts and the common procedures that can be followed in order to obtain
answers to different types of proportion questions, learners will use either of these
cognitive processes. Only when learners are made aware of the (correct) similarities and
differences, can they formulate and develop their knowledge structures to include the new
information they have acquired. When learners are able to do think and reflect on these
processes by themselves, they have made the step from assisted thought to metacognitive
thought processes and metacognition is seen as higher order cognitive skill.
The process of designing activities that will aid in developing proportional reasoning
was experimental in nature. The principle of interconnectivity between concepts that
involve proportional reasoning was the directing paradigm, but the manner in which

95
activities should be structured or conducted was a trial and error process. The final
structure was the result of several less successful approaches to the principle.
5.2 A Non-linear approach to developing proportional reasoning
Since Tourniare and Pulas (1985: 200) argued that “proportional reasoning is not a
unitary construct (and) it is therefore difficult to conceive of a linear teaching
sequence”, my initial thought when designing activities to develop proportional
reasoning was to adopt a non-linear approach with a strong emphasis on
interconnectivity. The interconnectedness, or intertwinement as Treffers (1987) refers
to this concept in the principles of Realistic Mathematics Education, of proportional
reasoning became more and more visible within every learning outcome as this
research progressed. For this reason my initial strategy was to design activities that
covered all learning outcomes with proportional reasoning as the main theme. One
worksheet would contain as many concepts as possible, but would have one
dimension of proportional reasoning as theme. The approach could almost be
described as a mind-map approach to proportional reasoning. An example of such a
dimension of proportional reasoning would be missing value – a type of proportional
reasoning question that could be asked in almost all of the Learning Outcomes of the
National Curriculum Statement but all requiring proportional reasoning. The
following questions formed part of such a worksheet covering all several concepts
requiring proportional thought, such as ratio, interest, percentages and scale:
1. Jay and Silent Bob are two brothers. Their parents have decided to give them
monthly allowances in the ratio of their ages.
a) If Jay is 17 and Silent Bob 13, what is the ratio of their allowance?
b) If Jay receives R255 per month, how much will Silent Bob get?
2. Angelina decides to open a savings account for her children’s schooling. How
much money will she have in her account if she receives 12% interest on her
investment of R100 000?

96
3. Brad and Angelina flew to Namibia for their twins’ birth. The flight took them
22 hours at an average cruising speed of 500 km/h. How far was their
journey?
4. Sean bought a Lamborghini three years ago that have depreciated with 25%
to R360 000.
a) What was the price of the car when he bought it three years ago?
b) What is car worth now in $ if 1$ = R8,25?
5. Scale models are often used in the design and planning of movie sets. If a
building of 25 meters high needs to be made using a scale of 1:50, what will
the height of the model be?
Although this approach emphasised the idea of interconnectivity and the importance
of proportional reasoning, learners found this a too general approach to developing
proportional reasoning. In the above example, all questions were missing value type
questions and required similar strategies, yet it covered several concepts with which
learners were not necessarily familiar. Learners could not focus on the mathematics
(and multiplicative reasoning) behind proportionality since each concept brought “a
new context” and “new set of rules” all within one activity.
During this activity learners dealt with the concepts of ratio, percentages, interest,
rate, exchange rate depreciation, and scale. Several learners did not know that scale is
not unit bound. They wanted to know what unit the scale was in. They did not
comprehend that the scale merely refers to the ratio of the model to that of real life.
This is scale-specific knowledge that is important in understanding the scale.
Another learner did not make sense of speed. He wanted the formula to calculate
speed so that he could calculate the distance. On explaining that “kilometres per hour”
gives you a ratio of distance travelled in one hour and that this ratio could be used to
find the missing value, he argued that km/h is merely a unit. It took him quite a while

97
to realise that the unit is descriptive of the concept. In his mind km/h, was a unit such
as metre or litre with no meaning.
When following such a general approach to proportional reasoning, specific concept
knowledge is second to the concept of interconnectivity. For learners to understand
the essence of each concept it was imperative to interrupt the broad discussion to first
teach specific concept knowledge in order for learners to understand the broader
discussion. Learners’ superficial knowledge of a specific concept was not enough to
answer questions within all inclusive activities. In-depth knowledge of each concept
was needed. As mentioned before, teaching Mathematical Literacy is vastly different
to teaching Mathematics. The aim of the subject is to develop mathematical self-
confidence whilst developing mathematical content. If learners are faced with so
many different conceptual knowledge which they have to understand in order to
identify differences and similarities they are hardly feeling self-confident.
It was for this reason that I decided on a linear approach to develop proportional
reasoning. The concepts which needed to be addressed were the same as in the general
approach, but needed to be structured in such a way that it would form a logical
sequential progression. To find this sequential progression the work of Noelting and
Thompson and Thompson described in chapter two, the baseline assessment results in
chapter three and the didactical strategies described in chapter four, was of utmost
importance. It was also essential to analyse each concept so that the key concepts in
each could be clear. When referring back to Tourniare and Pulas (1985: 200) thoughts
of a non-linear approach to proportional reasoning where “proportional reasoning is
(described as) not a unitary construct (and) therefore difficult to conceive of a linear
teaching sequence,” it does not necessarily mean that a linear approach is inadequate.
Tourniare and Pulas are referring the difficulty of a linear approach. I argue that with
a detailed analysis of each concept requiring proportional reasoning skills, a
progressive sequence of activities can be designed that will link concepts
appropriately.

98
5.3 The didactics used for a linear approach
As discussed in 4.2.2 on page 73, Skemp (1972) differentiates between instrumental
and relational understanding. From responses during class activities it became evident
that many learners that have struggled with Mathematics in the junior grades have
adopted an instrumental understanding to cope with difficult content. From the
answers to questions in the baseline assessment test and questionnaire (as discussed in
3.5 on page 66), one could deduce that these learners entering the subject of
Mathematical Literacy are not active participants in their own learning. They seem to
prefer formulas and recipes to solve problems to taking time to think logically about
what is being asked. This approach is not in line with the definition of Mathematical
Literacy since it is a subject which “provides learners with an awareness and
understanding of the role that mathematics plays in the modern world. It enables
learners to develop the ability and confidence to think numerically and spatially in
order to interpret and critically analyse the everyday situations and to solve problems”
(Department of Education 2003a: 9).
One of the objectives of Mathematical Literacy is to create an appreciation for
Mathematics with students and to enable them to become critical thinkers. Whilst
teaching Mathematical Literacy I have had two instances where learners changed back
to Mathematics since they could not get used to the context and application based
questions in Mathematical Literacy. They wanted to follow a formula and get an
answer without much reading and interpretation.
It is the concept of interconnectivity that forms the core of this investigation into
developing proportional reasoning. My aim with these activities is to use learners’
prior knowledge, link it to new knowledge and emphasise the common strategies
between the different concepts which were difficult to do in the non-linear approach.
With the linear approach we scaffold the information and allow learners to continue
once their foundational understanding is secure.
Whilst helping individual learners during class time and tutorials on the concept of
ratios, it became evident that many of them had trouble “setting” up ratio and
proportion equations when asked as word problems. Many learners in Mathematical

99
Literacy have not yet mastered the skill of asking reflective questions to help answer
problems: When mixing Energade® in the ratio 1:3, it means I can use 1 part
concentrate and 3 parts water which gives me 4 parts juice. So if I would like to make
a litre of juice, the litre represents 4 parts of which 1 part is concentrate and 3 parts
water.
To make it even more complicated when working with ratios, there are problems that
ask of learners to work with parts of wholes (as in the Energade® question), or only
parts. Then they can follow either a with-in or a between strategy and these strategies
are also determined by the structure of the problem.
The “setting up” of equations refers to the way one structures the given information in
such a way that it can easily be solved. Here are several ways in which people would
structure the Energade® question from the baseline assessment:
1 : 3 = 4 x 250
: = 1000 mℓ
1 x 250 : 3 x 250 = 250 : 750
1000 mℓ ÷ 4 x 1 = 250
1000 mℓ ÷ 4 x 3 = 750
1000 mℓ x 14
= 250
1000 mℓ x 34
= 750
Although these strategies might all look similar they are representative of different
thinking patterns. The first of these strategies explain, in my opinion, exactly what is
described by the given problem since it acknowledges exactly what the 4 represents as
well as “equivalence” between the 4 and the 1000 millilitres. The other two more
formal strategies assume that the learner has mentally completed the first
representation.

100
Teaching learners how to set out a question does not necessarily mean that one is
coaching methods instrumentally. It merely helps learners to analyse the numerical
relationships without the words that make up the problem. I conjecture that this set-up
of a proportional situation will help learners to identify what is being given and what
is being asked. Would a total, for example be applicable to the specific situation to
help in finding the part-whole representation or is situation where a total (or whole) is
not applicable. Although there are several factors to take into consideration when
faced with a proportional situation, structuring the given numbers in the “A is to B, as
C is to D” structure, will help in identifying the type of proportional problem.
We can distinguish between four types of proportionality problems: missing value,
comparison, rate and sharing. Although these concepts problem types are themselves
closely linked, they each require a slightly different approach. Where missing value
and comparison problems have a strong emphasis on equivalence, sharing problems
have a strong focus on the part-whole representation. The key concept in rate is that of
simplifying to a quantity per one unit, as in 100 kilometre per (one) hour. I will
distinguish between these four types of questions and also the different strategies that
can be used to solve each type. To distinguish between these four types of questions I
will give some examples of questions:
5.3.1 Missing value
The heights of Jane and Jess are in the ratio 7:9. The shorter one of the two is 154
cm. Who is taller and what is her height?
When explaining a question such as this one, I helped learners to set up the question
as follows:
Jane : Jess
7 : 9
154 :
This representation helps learners to realise that the 7 represents Jane’s height of 154
centimetres and that the question asks for the height of Jess, represented as 9. From
this learners can reason in a number of ways. In this instance it is a part-part scenario

101
and it would not make sense to find a total for the two girls’ length. If learners
understand the meaning of the ratio they would know that if Jane was (ridiculously
speaking) 7 centimetres tall, then Jess would be 9 centimetre tall, but now Jane is 154
centimetre. Then they can ask themselves: How many times bigger is 154 than 7?
Once they know this, they could do the same to 9. This is very much the same
principles we use when solving equivalent fractions:
7 1549 ?=
Representing the situation as a fraction reminds learners of the multiplicative
calculations involved in equivalent fractions. Unfortunately this method has a strong
emphasis on the relationship between ratios and the numbers being used also support
this notion.
This missing value question does not require learners to find a total and is thus a part-
part question. A part-whole missing value question would be a question like the
Energade® question (where learners will have to find how many millilitres of water
and concentrate is needed to make a litre of Energade®) described earlier.
The use of the colon to represent the information is not essential in this set-up.
Arrows, or any other symbol that has a similar meaning, can be used with equal
success:
Jane → Jess
7 → 9
154 →

102
5.3.2 Comparison questions
Which of the following ratios will give the lightest shade of lilac (contains the most
white paint). Red: Blue: White in a mix of 1:2:5 or in a mix of 2:3:5?
When setting up this question it would look as follow:
Red : Blue : White Total
1 : 2 : 5 8
2 : 3 : 5 10
The easiest and most logical approach to this question would be to see the with-in
ratio of red and blue to white. In both mixtures the white paint is represented by 5, but
in the first ratio the red and blue make up 3 parts, while it makes up 5 parts in the
second ratio. In comparison to the other colours, there is more white paint in the first
ratio (since there are less red and blue.)
A fraction method in this scenario will have to take into account the total in each case.
Learners will have to find the fraction of paint in each ratio which is white paint:
58
in the first ratio versus 510
in the second ratio. Some learners will immediately
recognize that 58
is bigger than 510
whilst others will have to find a common
denominator. The big question is however if learners will know to pick the bigger or
smaller fraction and what each means? It is here where the “literacy” comes into
Mathematical Literacy. Although learners taking Mathematics have to evaluate their
answers, they seldom do so, unless the instruction specifically asks for it to be done.
Learners will have to be conscious of the fact that the numerator is the white paint
whilst the denominator is the whole paint mix. Learners who can see that 58
is a bigger
fraction will need to know that this bigger fraction means more white paint.

103
It is not wrong for learners to make fractions of white paintred and blue paint
, but it does
understandably make less sense. Once again learners will have to keep in mind
exactly what they use as numerator and denominator to make sense of their answers.
The numbers in this question were convenient to work with and most learners can
clearly see that the first ratio contains more white. If the amounts of white paint were
not the same, it would involve a lot more calculations:
Which of the following ratios will give the lightest shade of lilac (contains the most
white paint). Red: Blue: White in a mix of 1:2:5 or in a mix of 2:3:6?
Red : Blue : White Total
1 : 2 : 5 8
2 : 3 : 6 11
58
of the mix is white in the first ratio versus 611
in the second ratio. In this scenario it
is not so easy to merely see the answer. Equivalent fractions provide the answer:
From 58
= 5588
and 611
= 4888
, it is clear that the first ratio has more white paint.
I have used both routine problems (with limited context), to focus learners’ attention
on the Mathematics involved in the problem, and problem-solving questions to tap
into learners logical thinking and reasoning skills. Problem-solving enables learners to
confirm their answers by using the context – something not possible when working
with routine problems. Yet, routine problems are often useful to practise concepts
learnt from problem-solving questions. An example of this would be the part-part
versus part-whole problem which arose from the Energade® problem where learners
thought that the ratio 1:3 means that 13
of the mix is concentrate. After a discussion on
this concept and working through similar problem-solving questions, it would be a
good idea to give a few “conversion” questions where learners need to convert ratios
to fractions and vice versa. These routine problems will help learners in practising the

104
skills learnt within a context-driven problem and give them an opportunity to focus on
the Mathematics involved without being influenced by context.
From the baseline assessment it was evident that learners had some multiplicative idea
when it came to proportional reasoning but that the nature of the numbers and the
context influenced their understanding to a great extent.
The pizza problem: 3 boys shared 2 pizzas and 9 girls shared 7 pizzas.
Learners in the senior grades seem to interpret these type of questions the way
teachers intend to ask them. Caution should however be taken with the wording of this
type of question since it can greatly influence the answer. When asking learners to
compare the two situations (or ratios) by saying: Which group had more pizza? The
correct answer would be the girls, since they had 7 pizzas and the boys had 2. 7 is
more than 2. This is not necessarily the answer intended by this question.
If the question is asked: Which group had more pizza per person? It is implied that
learners should use rate, leading to calculations such as:
2 ÷ 3 = 23
or 0,67
7 ÷ 9 = 79
or 0,78
It can also be asked: What percentage of the pizza did each boy and each girl get. Can
you tell who had more? Here we are guiding them to use percentage - another logical
approach to this problem. Learners will thus have to extend on the rate approach to
get 67% and 78% respectively.
Yet, this problem is often used as a fraction question due to the nature of the integers
used. Learners are thus expected to compare the fractions 23
and 79
.

105
Certain problems lend themselves more towards one approach than another, but the
way in which the question is formulated, should give an indication of what is
expected.
5.4 A linear approach to proportional reasoning
From the data collected on the baseline assessment, it was clear that learners have
poor proportional reasoning skills and strategies employed, such as the build-up
strategy, were weak. It was thus important to approach this concept almost as if
learners had never done it before. From the research drawn from both the baseline
assessment and researchers such Adjidage and Pluvinage (2007), Clarke et al. (2003),
Noelting (1980) and Treffers (1987) ,the following linear approach was prearranged.
• The link between fractions and ratios
• Distinguishing between missing value, sharing and comparison
• Percentages
• Ratio, Scale and enlargements and reductions
• Looking at rate and the role of ratios
• Conversions
• Distinguishing between proportion and direct and indirect proportion
Interconnectivity forms a vital part of this research and deciding on the most
appropriate linear approach to connecting all concepts required a thorough analysis of
each concept. The reasoning behind this approach is as follow:
When designing the linear structure during this research the basis from where to start
this linear program was always clear. Adjidage and Pluvinage (2007: 170) argued that
“processing fractions is well accorded to the valid treatments in proportionality, so
that pupils that master fractions should better master proportionality”.
When introducing a new concept it is important to link the new knowledge with
learners’ prior knowledge. It was clear from the baseline assessment that learners had
a basic understanding of ratios but that there were several areas of concern. Noelting’s
findings on learners’ understanding of fractions and ratios, as discussed on page 17,

106
showed that pupils had few problems in solving calculations involving adding and
comparing fractions, but that pupils found ratio questions problematic. The
importance of fractions and the similarities between the multiplicative strategies used
when solving equivalent fraction problems and those involved in solving equivalent
ratio problems, was used as basis from which further concepts could be introduced.
When learners were asked to calculate the amount of packets of chips in question 1.1
of the baseline assessment, 60% of learners used multiplication instead of division.
This is an indication that learners do not have a clear understanding of the nature of
fractions. They were able to do the multiplicative calculation correctly, but lacked an
understanding of what they were doing. Since both fractions and ratios employ the
same multiplicative strategies, supported by the research of Clark et al. (chapter 2),
fractions and ratio will be the start of the sequential progression of activities.
The goal of the linear program was equally well apparent in the definition of
proportional reasoning: a learner that can reason proportionally has a discriminative
understanding of proportionality (Cramer et al. 1993; Lamon 1995). As the first
principle of Realistic Mathematics Education suggests, there needs to be a growth from
an intuitive understanding of the concept to an abstract understanding. In the case of
proportional reasoning, learners need to be able to think in terms of functions and the
accompanying formulas and graphs and distinguish direct proportions from proportions
and indirect proportions.
By defining a starting point and objective to work towards with the linear approach, it
directed the structure of the activities and concepts that should make up the path
towards this goal. Conversion was initially an introductory concept, having functions
as objective brought to mind the functional nature of conversions and more
specifically conversions, such as temperatures, which are not directly proportional.
For this reason conversions could be a defining factor between directly and non-
directly proportional situations. By having an objective of functions, it was possible to
fill the other concepts in like puzzle pieces either from the objective backwards or
from the starting point of fractions forward.
To link with fraction and the idea of equivalence in the concept of fractions fractions
and ratio as discussed earlier in this chapter, it was important to follow fraction with

107
ratios. The different structures of questions that involve proportional reasoning,
namely missing value, comparison, sharing and rate had to follow accordance. The
research of Noelting focused a great deal of attention on the use of with-in and
between strategies. Karplus, Pulos and Stage (1983: 232) found that learners who
were able to reason proportionally “exploited integral ratios within or between
relationships, and (therefore) recommend the emphasis of these approaches to
proportionality problems.” Together with the different structures of proportional
reasoning, different strategies in solving proportional reasoning must be investigated.
For this reason I included questions that either preference with-in or between
strategies so that learners would be able to use both and discuss the differences.
Since percentages are merely another form of fractions, it is important to extend
learners’ knowledge of fractions and ratio to that of percentages. Although it may
seem a relatively easy concept, proportional reasoning is essential in making sense of
appreciation, depreciation, VAT and inflation, especially when learners need to find
values before increases or decreases.
Scale and enlargements and reductions was placed before rate since scale is similar to
rate in the sense that it is a simplified ratio. Scale is also an important concept in
understanding proportional reasoning since it explains the concept of
“representation”. On a map with a scale of 1 : 50 000, one unit represents 50 000 units
in real life. This concept is similar to, for example, a 20% increase, where 100%
represents the original price and 120% represents the increased amount.
Rate, as scale, requires of learners to simplify. When, for example, they need to
compare speed or price, they needs find the kilometres travelled per one hour and the
price per one unit. This strategy could also be employed in other situations and links
closely to that of conversions. A concept such as exchange rate for example, can be
classified as both rate and a conversion. It is for this reason that conversions were the
sixth concept in this sequence.
When working with conversions most, but not all conversions are directly
proportional, which means that 0 metres would be 0 kilometres and $0 would be R0.
108
When converting degrees Celsius to degrees Fahrenheit, it is not directly proportional
and this situation is ideal for initiating conversation on directly proportional situations
and non-directly proportional situation. The formula for calculating degrees
Fahrenheit has a proportional structure of y = mx + c structure whilst most other
conversions are direct proportions with a y = mx structure. Compare the following:
Fahrenheit = 9 325
C +
Kilometres = 1000 m
To distinguish between different types of proportionality is the last stage of this set of
activities. Since learners should have an understanding of rate, introducing gradient or
rate of change should be a natural progression. Both Cramer et al. (1993) and Lamon,
(1995) emphasise that to be able to reason proportionally one must be able to
“discriminate proportional from non-proportional situations”. Converting degrees
Celsius to degrees Fahrenheit, for example, must be recognized as a proportional
question, unlike Rands to dollars which is a directly proportional question.
5.5 Activities used in the classroom
Proportionality is in most cases represented in textbooks as the concept “Ratio and
Proportion” where proportion is hardly defined or spoken of after its use in the title of
the chapter. It is assumed that proportion is synonymous with “ratios” and a set of
ratio questions are thus presented. Although ratios form a mayor part of proportional
reasoning, not synonymous terms and learners that might be able to answer ratio
questions are hardly proportional reasoners. The aim of these activities is to introduce
learners to the widespread use of proportional reasoning throughout the Learning
Outcomes of Mathematical Literacy within the National Curriculum Statement. These
activities will not merely put a few proportional reasoning questions in context, but
will aim to link all concepts which require proportional reasoning and discuss how the
same thought processes can be applied to solve problems within all these concepts.
All activities described below were used in the classroom as part of a grade 10
Mathematical Literacy work schedule.

109
5.5.1 The link between ratios and fractions
The multiplicative reasoning involved in equivalent fractions is similar to that of
equivalent ratios and I believe that the link between fraction and ratios are vital in
developing proportional reasoning. Showing learners that they can take their pre-
existing basic knowledge of fractions and apply it to the less familiar concept of ratios
is a strategy which aims to help learners to make sense of the new concept. As
Noelting (1980) showed in his investigation of learners’ fraction and ratio knowledge,
learners had few problems in solving calculations involving adding and comparing
fractions, but that pupils found ratio questions problematic. One would think that if
learners can simplify 2128
they would be able to simplify 21 : 28. Or if they are able to
calculate the missing value of 21 1828 ?
= , they should also be able to calculate the
missing value of 21 : 28 which is equivalent to 18 : ?. In the light of design research,
more attention could have been focussed on the computations involved in fraction and
ratios within the baseline assessment. Results from these questions could then have
been used to support Noelting’s findings on fractions and ratios.
Several learners in my class had trouble seeing the similarities between ratios and
fractions. They were comfortable answering questions where they had to find the
missing denominator and numerator, but seemed confused when asked ratio questions
which required the same operations. To make the link between multiplicative
strategies needed for both ratios and fractions, it was helpful to compare the two
concepts by writing it in two columns on the whiteboard as in the following example:
Sally wants to convert her test mark
out of 40 to a mark out of 10 for her
portfolio. If she received for her
test, what will her mark out of 10 be?
A poster has with to length ratio of 32 :
40. If this poster must be reduced so
that the length is 10 cm, what will the
width be?
32 : 40
: 10

110
Examples like these seemed to have helped learners in making the connection (or
adaptation) between fractions and ratios.
To further explain the reasoning behind the link between fractions and ratios, situation
must be presented where it is essential for learners to be able to distinguish between
the two concepts. Clark et al. (2003) distinguish between the part-part and part-whole
representation and it is the confusion between these two concepts that resulted in
learners being confused about the ratio 1:3 in the baseline assessment. Learners could
not distinction between ratios and fraction when asked to mix Energade® in the ratio
1:3. A third of learners that obtained the incorrect answer for the Energade® question
worked with a fraction of 13
instead of 14
. They assumed that 13
must be concentrate
and 23
water instead of one part concentrate to three parts water.
Fractions are more commonly known as part-whole scenarios where the numerator
shows the parts and the denominator the whole. If one third of a one litre mixture of
Energade® is concentrate, it means that 333 millilitres would be concentrate and 667
millilitres would be water. But the ratio on the bottle is written as a part-part scenario
which means that one part of a one litre of Energade® would be 250 millilitres and
three parts would be 750 millilitres. It is important that learners are able to distinguish
between a part-part and part-whole scenario since it is often helpful to switch between
the two. For example in the ratio 1:3 learners need to realise that there are four parts
in total. The concentrate is thus 14
of the Energade® and the water is 34
. If learners
are able to realise this important concept, it would be easy for them to realise that to
make one litre of Energade® they need one part, 1000 millilitres ÷ 4 or 250 millilitres
of concentrate and three parts, 250 millilitres x 3 or 750 millilitres of water.
To help learners to discriminate between ratios and fraction I used visual
representation of the Energade® questions to initiate discussion on the fraction of
water and the fraction of concentrate used in a specific mix.

111
Water
Water
Water
Concentrate
To initiate education discourse, which forms part of both principle three and four of
Realistic Mathematics Education (Treffers 1987), I created conflict in the class by
writing both the correct (part-part interpretation) as well as the incorrect (part-whole
interpretation) answers to the Energade® question on the board. I asked learners to
decide which answer is correct and which is incorrect and to discuss the two different
approaches. I also encourage learners to make a drawing of the situations (as the one
above) to motivate their choice of answer or to use the Energade® bottle in class
examine the markings on the bottle. When confronted with both these possible
solutions learners soon realised their incorrect thinking patterns when being
convinced by peers, and themselves, of the correct part-whole method. Learners are
thus both activity involved in reflective processes of their learning and sharing ideas
with others. By creating conflict in the classroom, learners are forced to interact with
the mathematics and their peers.
The following activity was used as extension on the baseline assessment Energade®
question. It focuses on the concept of part-part representation versus part-whole.
Learners are asked specific questions related to the total amount of liquid in each mix
to emphasize the part-whole representation that could be made from the part-part
(concentrate-water) representation.
Julio and Craig are on a summer camp and have to make orange juice for all the
campers. They plan to make the juice by mixing water and orange-juice concentrate.
They are not sure how to mix the juice and make a couple of mixtures from which
they can have a taste:

112
1. Which mix will give a stronger taste? Explain your answer.
2. Which mix will give the weakest taste? Explain your answer.
3. Which comparison is correct?
59
of mix B is concentrate or 5
14of mix B is concentrate
Explain your answer.
4. Assume that each camper will get 12
a cup of juice, how many batches of
each mix needs to be made for 240 campers?
5. For each mix, how much water and how much concentrate is needed to make
juice for 240 campers?
6. For each mix, how much water and how much concentrate is needed to make
1 cup of juice ?
In this activity learners are consciously made aware of the total of a ratio. In Mix B 5
parts of the whole 14 parts are concentrate. Saying that 514
of the mixture is
concentrate is correct, but many learners still tend to use comparisons like
2 5 1 3; ; ;3 9 2 5
that they concert to 60 50 45 54; ; ;90 90 90 90
. This representation is not a
wrong way of comparing the ratios. It is merely incorrect to say that 59
of the mixture
113
is concentrate. Learners who compare fractions like 2 5 1 3; ; ;3 9 2 5
need to be
reminded that they are not comparing part-whole fraction, but that they are comparing
part-part fractions. They can therefore only compare the ratios if one of the
“ingredients” (water or concentrate) is made the same for every mixture. Between 3,
9, 2 and 5 they find a common denominator (90) that will ensure that all the mixtures
have the same amount of water, but resultantly have different quantities of
concentrate: 60 50 45 54; ; ;90 90 90 90
. With this set of equivalent fractions one can
conclude that the ratio 2:3 converts to the biggest fraction where there are 90 units of
water to 60 units of concentrate.
Several learners, mostly girls, employed the visual representation method to analyse
the question before making any further calculations. This approached helped them to
use part-whole fractions with which they compared the amounts of concentrate. In this
specific example, the common denominator between 5, 14, 3 and 8 amounted to a
rather big common denominator of 840, which resulted in a few calculation issues.
Learners using part-part calculations in this situation seemed to make fewer
calculation errors due to the nature of the numbers. Although the methodologies
surrounding this question were good, the numbers should be revised for future use. If
the ratio of 5:9 were changes to 5:7, the common denominator of 120 would be easier
to work with.
One learner used percentages to solve the mixture question. He explained that it was
easier to calculate the percentage of concentrate in each mix than to find the common
denominator. His calculations resulted in the following percentages: 67%, 56%, 50%
and 60%. This learner recognized the connection between fractions and percentages
and was able to use knowledge to apply this knowledge to ratio questions.
I used this opportunity to draw the rest of the class’s attention to the link between
fractions, ratios and percentages. This specific learner preferred to think in terms of
percentages instead of fractions. Percentages seem to feel more “natural” to him than
fractions. This could be ascribed to the use of percentages on the end of term report,
in the media and have even people’s way of speaking.

114
Learners however still need the part-whole fraction format to calculate the percentage
on their calculators and must thus be comfortable with the notion. I used the following
activity to help learners in making the link between ratios, fractions and percentages
and also focuses their attention on the difference between part-whole and part-part
representations.
1. Change to a Ratio
If possible, change each comparison of concentrate to water into a ratio. If it is not
possible, explain why:
a) The mix is 60% concentrate
b) The fraction of the mix that is water is 35
.
c) The difference between the amount of concentrate and water is 4 cups
2. Change to a Percentage
If possible, change each comparison of red paint to white paint into a percentage. If
it is not possible, explain why:
a) The fraction of the mix that is red paint is 14
.
b) The ratio of red to white paint in a different mix is 2 to 5.
3. Change to a Fraction
If possible, change each comparison to a fraction comparison. If it is not possible,
explain why:
a) The nut mix has 30% peanuts.
b) The ratio of almonds to other nuts in the mix is 1 to 7.
It is important to constantly remind learners of the part-part versus the part-whole
representation which they are confronted with in transforming ratios to fractions and
vice versa. Teachers need to create conflicting thoughts by asking learners if the part-
part and part-whole representations are equivalent. This will enable learners to
develop the habit of asking this question themselves when faced with a similar
problem. By enabling the process of self reflection, we are not only helping learners

115
with proportional reasoning, but also creating valuable meta-cognition skills which
form a vital part of higher order thinking skills. Questioning one’s answers and
reflecting on methods and calculations is a skill vital for making sense of
mathematics. Mathematical Literacy is but a tool in developing logical thinking and
problem-solving skills.
As discussed in chapter 2, Clark et al. (2003) argues against the use of model two that
implies that all fractions can be interpreted as ratios, but that not all ratios are
fractions. Their view is that this model is not a powerful discrimination between the
concepts. As I argued on page 25, model two is in fact a better basis for
discrimination. At this stage of the sequential progression of activities, it would be a
good idea to confront learners with this idea and ask them what link they identified
between the two concepts.
To start this discussion, learners should be made aware of the fact that it is not always
possible to write ratio questions as part-whole scenarios. If we take the question of the
heights of two people being in a specific ratio, say 7:9, it is meaningless to say that the
shorter one of the two has a height of 716
of their combined height. Saying the shorter
person is 79
of the height of the taller person is indeed much more meaningful. The
latter fraction will also help in calculating the height of the shorter person if the height
of the taller person is given. Say the taller person is 198 cm, then the shorter person
will be 79
’s of 198 cm which amounts to 154 cm. Teachers must also keep in mind
that asking the height of the taller person if the height of the shorter person is given,
may not be as simple for learners since they will have to work with an improper
fraction or mixed fraction which somehow does not seem as natural to them. Saying
that Sally is 79
’s of David’s height seems much more natural than saying that David is
97
’s of Sally’s height.

116
It is difficult for learners to distinguish between part-part and part-whole situations
and they should be encouraged to think of situations where a total (or whole) would
be meaningful and where it would not be.
Another question arising from the baseline assessment apart from the part-part versus
part-whole representative problem was that of additive strategies. 60% of learners in
school 1 and 17% of learners in school 3 used incorrect additive strategies and clearly
operated on Thompson and Thomson’s level 2. A number of students also used
additive build-up strategies in the baseline assessment and although this strategy is not
incorrect, it is seen as “weak” proportional reasoning (Lesh et al. 1988: 105).
In exploring the reasons behind incorrect methods, the emphasis falls on the reasoning
behind the correct methods. Learners who “instinctively” knew not to use additive
strategies might not have realised that proportional problems are multiplicative in
nature. By exploring incorrect additive strategies the multiplicative nature of
proportionality might become more apparent to them.
I gave learners the following question to discuss the incorrect additive strategies
employed by learners:
Are the following two ratios the same or different? Motivate your answer:
2:3 and 3:4
Two learners in the class were convinced that the ratios were equivalent. Even after
using visual representation they were not convinced otherwise. A learner in the class
gave the following counter argument to the problem:
“So you are saying they’re the same because two plus one is three and three plus
one is four. That means that two to three must be the same as 1001 to 1002
because you added a thousand. But this can’t be right because in two to three,
three is half of two more, but 1001 and 1002 are almost the same.”

117
His explanation did not manage to explain a correct method of comparison to the two
“adders” in the class, but did cause them to realise that their additive strategy was
incorrect.
The learner’s explanation contained more than one argument. Firstly he showed how
the ratios cannot be equivalent when applying additive strategies. He supported this
referring to the with-in relationship between the two and the three. Although he
explained this as “half of two more”, is reasoned that the three was 50% or 150% of
two. His explanation of “half of two more” can in fact be classified as an additive
strategy as well since he utilised a build-up method. Although it might not be evident
of strong proportional reasoning skills, his convincing argument does deserve merit.
The following activity focuses on the distinctive differences between additive and
multiplicative strategies to build on this class discussion. In question C learners are
also asked to investigate an incorrect additive (or subtractive) strategy and have to
explain why it is incorrect.
The dining hall at a school campsite has two different kinds of tables. There are
larger tables seating ten persons and smaller tables seating eight persons. On pizza
night the students serving dinner put three pizzas on each small table and four pizzas
on each large table.
A) Suppose the pizzas are shared equally by everyone seated at the table. Does
a person seated at one of the small tables get the same amount of pizza as a
person seated at one of the large tables? Explain your reasoning.

118
B) Which table relates to the fraction 38
? What do the 3 and the 8 mean? Is 38
a
part-to-part comparison or a part-to-whole comparison?
C) John thinks he can calculate at which table a person gets the most pizza. He
uses the following reasoning:
10 – 4 = 6 and 8 – 3 = 5 so it is better to be seated at a large table.
1) What does the 6 mean and what does the 5 mean in John’s reasoning?
2) Do you agree or disagree with John’s method?
3) Suppose you put 9 pizzas on a large table.
4) What answer does John’s method give?
5) Does this answer make sense?
6) What can you now say about John’s method?
On asking learners about the meaning of 38
, a learner gave the following explanation:
“I think if we went out for pizza we would order different pizzas so that we could
all taste different ones. If there was eight of us and we ordered three pizzas I
would ask them to make sure they divided the pizza into eight. That way I could
get a slice from each pizza. That means I would have three slices and each one is
an eight of the pizza – that makes three eights!”
On asking this learner how much she would get at the bigger table, she gave the
following explanation:
“I am not sure if they can cut pizzas in ten? It would be nice because then I could
taste four different pizzas.”
I asked her if these smaller slices would be more than the three bigger slices.
“I will have to work it out. I’m not sure.”

119
Since this learner made sense of the situation and indentified the amount of pizza she
would get at each table as 38
and 410
, she was able to compare the fractions by using
her knowledge of equivalent fraction to obtain the correct answer.
I conjecture that a firm understanding of fraction will lead to a better understanding of
proportionality. The specific aspect of fractions I am referring to here is equivalence.
Let us consider the following primary school question:
Bella ate 23
of her pizza whilst Tess finished 34
of her pizza. Who ate the biggest
portion?
Although many high school learners still have an unsatisfactory understanding of
fractions, I am convinced that most learners will remember that they have to find a
common denominator and then compare the portions. Is this not similar to the
following ratio question:
Bella mixes juice by adding concentrate and water in the ratio 2:3 whilst Tess mixes it
in the ratio 3:4. Who of Bella or Tess mixed the stronger tasting juice?
The ratio question does not seem as easy as the fraction question and it is largely due
to the part-part versus part-whole dilemma. It was clear in the fraction question that
the girls had a fraction of one pizza. In the ratio question it is not clear if both girls
made the same amount of juice or if Bella for example made 5 litres (2 parts
concentrate plus three parts water) and Tess 7 litres (3 parts concentrate and 4 parts
water). Although it is possible to compare the two ratios by comparing 23
and 34
, one
would need to realise that when making the fractions equivalent, the water parts of the
ratio (the denominator) would be equivalent and therefore the bigger numerator would
be the mixture with more concentrate. What would sound more logical, would be to
say that 2 parts of Bella’s 5 part mixture is concentrate, thus 25
, and 3 parts of Tess’s

120
7 part mixture is concentrate, thus 37
. This means that one can compare the portion of
concentrate per mixture.
However one approaches the question, there will be equivalence involved in order to
compare the ratios. The problem with ratios is that learners need to recognise the
ratios as fractions before they can use fraction strategies to solve the problem. But as
Clarke et al. (2003) explained, teachers themselves are unsure about the connection
between fractions and ratios.
The idea of exploring ratio and fractions out of context is to investigate learners’
specific methods that they follow when dealing with ratio and fraction. Learners often
use a set of instructions without fully comprehending what they are doing. Without a
context, learners have the chance to solve fraction and ratio problems using the
methods they have been taught and it helps to highlight these methods for research
purposes. Just as context can be helpful in solving problems in can also cloud the
problem for learners. Mathematical Literacy students tend to struggle to make the
transfer from the largely number-driven subject of Mathematics to the context-driven
subject of Mathematical Literacy. It seems a great effort to them to extract the
necessary information and use it to solve the given problem. Yet, in the words of
Cramer et al. (1993: 13): “A proportional reasoner ultimately should not be influenced
by context nor numerical complexity”. It is the function of the Mathematical Literacy
teacher to help learners to develop these proportional reasoning skills that are
independent of context or number complexity. By giving learners a chance to
experiment with strategies outside of context, I am hoping that the experience will
open their minds to the range of methods discussed in this chapter to solve a problem
within context.
5.5.2 Missing value, sharing and comparison
Whilst the previous section have devoted much attention to the similarities between
concepts and methods in solving different types of proportional reasoning questions,
this section will focus on the different types of proportional questions and the
importance of being able to distinguish between part-part and part-whole situation.

121
Learners should at this stage have some idea of the difference between part-part and
part-whole situations and should also have decided on a method of solving
proportional problems with which they feel comfortable.
A “missing value” question takes a single ratio and states its equivalence to another
incomplete ratio. The following question would be an example of a missing value
question. The ratio of the heights of the two people is given as well as the actual
height of one person. The missing value to be calculated is the height of the shorter
person:
Sally and David’s heights are in the ratio 5:7. If David is 189 cm, how tall is Sally?
Learners will need to recognize that 189 cm is 27 times more than 7 and therefore 5
must be multiplied by 27 as well to obtain 135 cm. The multiplicative reasoning in
this question is the same reasoning as utilized for equivalent fractions:
5 1357 189=
Most proportional questions are missing value type of questions as I will show in the
following sections of this sequential progression of activities. Below is an example of
a slightly more complex or multi-step procedure and level three question according to
the knowledge level taxonomy (Department of Education 2007: 14):
Lindi works as a hairdresser. She uses shampoo and conditioner in the ratio 5:2. At
the start of the day she opens a 500 m bottle of conditioner. During the day she
uses 1 litre of shampoo.
a) How much conditioner is left over at the end of the day?
b) If she used the whole 500 m of conditioner, how much shampoo would she
have used?
It is important that learners know exactly what is being asked in this question. They
would need to realise that they will have to find the amount of conditioner used for 1
litre of shampoo before they can calculate how much conditioner is left over. The 500

122
mℓ conditioner is thus not used in the initial proportion. It would also be advisable
that learners convert the 1 litre to millilitres since the unit for the conditioner is given
in millilitres. This conversion is in itself a ratio, but should be general knowledge to
learners rather than a calculation that needs to be made.
5 : 2
1000 : ?
As mentioned before, learners can either solve the situation with the use of fractions,
or they could see that 1000 is 200 times more than 5, which will mean that the amount
of conditioner must be 200 times more than 2, equalling 400 millilitres Only once
learners have calculated this amount can they subtract it from 500 millilitres to obtain
the 100 millilitres that is left over.
The second question asks of learners to calculate the amount of shampoo for 500
millilitres of conditioner which is thus asking to find “the other” missing value:
5 : 2
? : 500
After employing the structure for quite some time, a girl remarked that she has finally
realized how straightforward ratio type questions are:
“You divide the two ones under each other and them times it to find the one you
want. It’s like finding out what one is.”
This girl realized that she has to find the multiplicative relationship between ratios. In
the question above, she would have made the following calculation:
500 ÷ 2 = 250
5 × 250 = 1250
When I asked this girl how she made sense of the situation, she explained that she was
first getting the value of one unit (as one would do in rate) and then used this value to
find the missing value by multiplying.

123
Another typical proportion problem is that of sharing which is in fact a “missing
values” question. Sharing implies that the whole is given and that it must be
distributed in a specific ratio. The following question would be an example of a
sharing question:
A grandfather leaves an inheritance to his three grandsons of R4500 which must be
divided proportionally according to their age of 3 years, 5 years and 7 years. How
much money must each child get?
Setting up the question and including a total would help to make sense of what is
being asked.
3 : 5 : 7 totals 15
? : ? : ? totals 4500
By using this set-up learners can either see that the amount of money is 300 times
more than the total of their ages or that the sons will each receive a specific fraction of
R4500. With the knowledge of part-part and part-whole representations, learners
could also conclude that each child will get a fraction of the money equivalent to their
age as part of the three boys’ total age. This approach seems to be logical in terms of
the given context. The youngest child will thus get 315
of R4500, the middle child will
get 515
of R4500 and the eldest will receive 715
of R4500. If learners are able to
reason in such a way that they can verbalise these methods they would know that 315
of R4500 is the calculation of 315
× 4500 which leads to the answer of R900. The
inheritance of R1500 and R2100 could then be calculated using the same strategy.
Since learners are constantly reminded of ratios as either part-part or part-whole
situations throughout this sequential progression of activities, they become
increasingly aware of the nature of problems. On asking learners about the number of
pieces the inheritance needs to shared in, most learners response where that of three.

124
On making the calculation of 4500 ÷ 3 = R1500 several learners remarked that the
method was incorrect.
“It’s shared between the three, but not in three. The older ones get more.”
To help learners in obtaining the correct fractions, I changed the multi-step procedure
broke it down into a few short questions as to guide learners to the answer. An
example of such a pyramid question would be: What fraction of the inheritance would
the youngest child receive? Although these “guiding” questions are suitable when
introducing these types of questions to learners, we ultimately want learners to
perform these guiding questions without being asked for it. By giving learners this
question in pyramid format, we are asking them to operate on a lower thinking level.
Although there is nothing wrong with asking level two or three questions, according
to the knowledge level taxonomy (Department of Education 2007: 14), it is important
to keep in mind that teaching is not merely assessment preparation, but for
development of learners into individuals with an appreciation of mathematics and the
ability to reason for themselves.
At this stage there is no need to ask learners to simplify the fractions. Saying that the
middle child receives a third of the inheritance could lead learners to believe that the
money is divided equally among the boys. Keeping the fractions in terms of the age as
part of the sum of the boys’ ages makes much more sense than writing the fractions in
their simplest form as 13
and 15
. The one, three and five has no meaning in the
context and could lead to misinterpretations. Simplifying ratios might have its place
when working with scale, but if it does not impact on the calculation there is no need
to force learners into simplifying the ratios.
Noelting (1980) focussed his attention on comparison questions in his quest to
distinguish between different stages of development of proportional reasoning.
Comparison questions are mainly used in ratios and rate and lesser so in financial
mathematics, conversions, scales and geometry. The following question is an example
of comparing ratios:

125
The colour lilac is mixed using red, blue and white paint.
1) Which of the following ratios will give the lightest shade of lilac (contains the
most white paint). Red: Blue: White in a mix of 1:2:5 or in a mix of 2:3:5?
Explain your answer
2) If you mix 1 litre of lilac using red : blue : white in the ratio 2:3:5. What
percentage of the mix would be red paint?
3) If you mix 1 litre of lilac using red : blue : white in the ratio 2:3:5, how many
millilitres would be red paint?
4) Which of the following ratios would give the lightest shade of lilac (contains
the most white paint) red : blue : white in a mix of 1:2:5 or in a mix of 2:3:6.
Explain your answer.
As with the mixing Energade® question in the baseline assessment, this question is
difficult in the sense that a part-part ratio is given and the question requires learners to
calculate a part of the whole. Learners will have to find which fraction or percentage
of each mix contains the most white or red paint. There is build-up in terms of
difficulty which is meant to guide learners in using the correct strategy. In question 1
it is easy to compare which of the mixtures contain the most white since the part of
the ratios that represent the white paint are in both cases five. Learners merely have to
realise that there are more of the other colours in the second ratio since two parts red
and three parts blue are mixed with the white, whereas one part red and two parts blue
are mixed with the white in the first ratio. This question is an extension of Noelting’s
subset IB which keeps the first terms of the two ratios the same (a = c where b > d).
Although this question works with a ratio containing three terms where we kept the
last terms the same, learners can still use the same strategy to solve this question.
Learners are asked to explain their answer which will hopefully lead to a class
discussion on different methods used. Not all learners recognized that the numbers
representing the white paint where the same in both ratios and some learners used
calculations to solve their problem. Explaining the calculations behind this notion and
how it might be linked to calculations done by other learners, can enhance the
learning experience.

126
Most learners in class were able to compare the ratio of 1:2:5 and 2:3:5 without any
calculations. These learners recognised that the amounts of white paint in both ratios
were the same but that there were “more other colours” in the 2:3:5 ratio than in the
1:2:5 ratio. This realisation does not conclude that learners have a sound proportional
understanding of the question. Comparison without calculation is in fact on
Thompson and Thompson’s first level of proportional reasoning. Yet, the method
employed by learners in solving this question involved both between and within
strategies.
I structured questions 2 and 3 in such a way that it will force learners to look at the
fraction (or percentage) of red paint before comparing more difficult ratios in question
4. This was to lead learners’ thinking to a part-whole approach. They must calculate
what percentage (or part) the red paint is of the whole mix. Numbers are kept simple
as to encourage this way of thinking. The idea is that learners who are able to
calculate question 2 and 3 correctly, would ultimately also calculate question 4
correctly using the same part-whole strategies in their calculation.
A number of learners still employed visual representations to analyse the question
before calculating the percentage. A few learners were not able to see the connection
between the percentage of red paint and the amount of red paint needed for a litre of
paint.
In question 4 the numbers are more difficult and it is assumed that learners will follow
similar strategies of part-whole representations to calculate their answer. This
question is set at Noelting’s stage IIIB where there is no obvious with-in or between
ratio between the terms in the ratios. Learners are encouraged to find the part-whole
relationships from these part-part ratios: out of the 8 parts, 5 parts are white and out of
the 11 parts, 6 parts are white. Learners can either calculate the percentage in each
case (62,5% and 54,4%) or work with equivalent fractions:
5 558 88= vs 6 48
11 88=
From either of these calculations it should be clear that the first ratio contains more
white paint than the second ratio.

127
5.5.3 Percentages as fractions and ratios
The concept of percentages was touched upon during the previous sections and
conversions between fractions, ratios and percentages were already discussed. The
nature of percentages that I will be dealing with in the section, is mainly that of
percentage increases and decrease in the form of appreciation, inflation, VAT,
depreciation and Consumer Price Index.
I used the context of the upcoming April 2009 elections as simple percentage activity
for learners to start this section:
In a recent survey researchers found that approximately 59% of South Africans will
be voting for the ANC. If South Africa has approximately 35 million registers voters,
how many of them would be voting for the ANC?
Many learners have been taught in primary school already that the word “of” means
times or multiply. With this in mind they should know that 59% of 35 000 000 means
59% times 35 000 000. As was evident in the first question in the baseline assessment
regarding the amount of kilograms of potatoes and the number of packets of chips that
can be made, there is the possibility that learners will confuse multiply and divide
operations. Learners should however have some intuition of how many people of the
35 million will be voting for the specific party. Learners also tend to be more familiar
with percentages since they relate it to (their) test scores. On asking learners how they
could check their answer, several learners remarked that the answers should be a “bit
more than” half of 35 million. Although a “bit more” in this case amounts to 3 150
000, learners’ reasoning implied that they were making sense of the situation and not
merely manipulating a set of numbers.
I tried to give my learners a range of different types of percentage question so that the
importance of proportional reasoning can be more and more visible to them. The next
question is an example of a “percentage more” instead of asking for the “percentage
of“as in the previous question.

128
Wholesale quotations are often given excluding VAT. If a product is quoted as R900
excluding VAT, what would the VAT inclusive price be if VAT is calculated at 14% (of
the wholesale price).
This can be solved by using percentage of and then adding it on to the original
amount. From classroom experience I have seen that learners are relatively
comfortable with this calculation. Although I would like learners to understand the
concept of the VAT inclusive amount being representative of 114%, it is not an
incorrect method followed by learners. Working backwards to find the original
amount after a percentage has been added, however requires this concept of “more
than a 100%”. Learners using a two-step method to add a percentage onto the original
amount find working backwards problematic as in the next question:
A promotional bottle of cooldrink contains 10% more than a normal bottle of
cooldrink. If the promotional bottle contains 660 mℓ of cooldrink, how much did the
original bottle contain?
Learners have to comprehend that the promotional bottle is representative of 110%. I
normally write the following layout on the board and ask learners if the question looks
familiar to them:
100 : 110
? : 660
Several learners recognised that the answer to this question was 600 m but struggled
to give a reason to their answer. The set-up used above helped learners to see that a
multiplicative ratio of 6 existed between 110% and 660 m.
For learners that struggle to understand the concept of 100% and 110%, the question
could be asked: If the promotional bottle is 110 mℓ, what was the original bottle? It
should be explained that the 100 and 110 are merely ways of representing the
relationship between the original and the promotional bottle, similar to saying that the
length of two people are in the ratio 5:7. The amounts in this specific question where

129
however kept simple so that learners will most likely “see” that the promotional
bottle containing 660 mℓ after a 10% increase had originally only 600 mℓ content.
Learners that are able to “see” the answer do not necessarily know how to solve it
when numbers in the question are more complex, which is an indication that they
might operate on a lower level or proportional reasoning skill. It is a way of initiating
didactical discourse where learners have to find and discuss methods that could be
used to find the answer they can “see” so clearly.
Another example of this type of question is when learners are asked to calculate the
VAT exclusive price from a given VAT inclusive price when analysing a till slip.
Learners are thus asked to calculate the VAT exclusive amount from the VAT
inclusive amount. Learners often tend to try and solve this question by also trying a
percentage of method where they calculate 14% of the VAT inclusive amount and
then subtract it from the (VAT inclusive) amount. In proportional terms they are
reasoning that the exclusive and inclusive amounts are in the ratio 86 : 100 instead of
100 : 114. It is at this stage where one can distinguish between learners who think
proportionally and those who try and find methods that have been taught to them in
seemingly similar scenarios. Learners who think proportionally will recognise the
VAT inclusive amount as representative of 114% and the exclusive amount of 100%
and will use appropriate multiplicative strategies to solve the problem. They would
most likely also use a similar strategy to find the VAT inclusive amount from the
exclusive amount by multiplying the exclusive amount by 1,14 instead of finding the
value of VAT and then adding it onto the exclusive amount. Learners not thinking
proportionally will try to use additive (or subtractive) strategies to solve the problem
which would prove somewhat problematic in this case. As with the “promotional
bottle” question, easy numbers such as 100 and 114 or 200 and 228 can be used to
introduce questions involving VAT. Also ask learners to produce their own set of
questions where they know the VAT exclusive amount, have calculated the VAT
inclusive amount from that, and have to work backwards to get their original answer.
An activity that worked really well in the class was to use till slips to analyse the VAT
that has been charged on items. Since the amount of VAT is given on the till slip,

130
learners were asked to show the method of calculation to obtain the correct answer.
On doing this activity one learner remarked:
“But what about just dividing by 114100
? If you have to times to get the price with
the VAT then you must do the opposite to get the price without VAT?”
This lead to an interesting discussion on multiplying with the inverse fraction when
dividing. Most learners had no idea why they were multiplying when dividing by
fractions. This indicates to Skemp’s (1972) instrumental understanding as discussed
in 4.2.2 on page 73.
Although it is not expected from learners at grade 10 level, the concepts of
appreciation and depreciation are linked to the concept of percentage increases and
decreases. Many schools do not include the calculation of VAT exclusive amounts
from VAT inclusive amounts. These concepts are however touched in the grade 9
Mathematical National Curriculum Statement and not including it in grade 10 would
be to underestimating the ability of learners taking Mathematical Literacy.
Appreciation type questions could be kept simple as in the following examples:
1. A small apartment of R500 000 increased in value to R700 000. With what
percentage did it increase?
2. A house of R1 200 000 increased in value with 80%. What is the house worth
after the increase?
3. A house has increased in price by 50% to a value of R900 000. What was the
price of the house before the increase?
Solving the first question with a proportional approach would look as follow:
500 000 : 700 000 (or simplified to 5:7)
100 : 140
or 7 ?5 100=

131
Both methods would lead to an answer of 140, from which learners could then see
that the house has increase with 40%. Learners can also compare the increase, of
R200 000 to the original amount:
500 000 : 200 000 (or simplified to 5:7)
100 : 40
To calculate the increase most learners use a two-step method to find the answer o
801200000 960000100
1200000 960000 2160000
× =
+ =
As explained earlier, learners have trouble realising that the new price of the house
would be 180%. Since VAT (and the idea of 114%) was discussed before
appreciation, learners were more comfortable with the concept of “more than 100%”,
but still preferred to use the two-step method.
Even though learners might use their own set of successful methods to calculate the
answer, the proportional nature of the question should be highlighted through the
following method:
1 200 000 : ?
100 : 180
or 100 1200000180 ?
=
Once again, both methods will lead to an answer of R2 160 000.
Question 3 employed the same concept of a percentage more than 100% when asking
learners to calculate the original price of the house before the increase.
. 100 : 150 (or simplified to 2:3)
? : 900 000
or 100 2 ?150 3 900000
= =
132
If teachers can get learners used to these types of questions in grade 10 already, it will
make it much easier for students to deal with concepts such Consumer Price Index
and Inflation when they get to grade 11 and 12.
To link with the concept of financial mathematics, I also include the following type of
questions:
Tabi saves 15% of her monthly salary. If she saves the amount of R975, what is her
monthly salary?
It is a seemingly easy question but also contains a strong proportional quality.
Learners need to realise that R975 is representative of 15% and that they are asked for
100%. We are thus working with the ratio 15 : 100. They would either have to
recognise that 100 is 6 23
times more than 15, as a within strategy, or they would have
to calculate the value of 1%, by dividing 975 by 15, as a between strategy. When
using the latter method, learners are in fact calculating the rate by finding the value of
1% and will then have to calculate 100% by multiplying by 100. However learners
choose to approach this question, they will work with either of the following
representations.
15 : 100
975 : ?
or
15 975100 ?
=
5.5.4 Ratio, scale and enlargements and reductions
Scale, enlargements and reduction offer a range of didactical possibilities that include
reading maps, building models and drawing house plans. Firstly learners need to
realise that the scale is a mere ratio indicating how many times bigger the real world
is to that of the representation, being it on a map or a scale model. 1 : 50000 can mean

133
that 1 cm on the map is 50000 cm in real life, but it can also mean that 1 mm on the
map is representative of 50000 mm in real life. The scale is not unit-bound. It is this
concept of scale that is the most difficult for learners to comprehend. They often ask:
”But what’s the unit?”
Learners also need to understand that scale is customarily written as one to a specific
number. If 2 cm represent 5 m, not only do the units have to be made the same, but it
also needs to be simplified to 1, thus:
2 cm : 5 m
2 : 500 units are made the same
1 : 250 simplified to one
When working with scale the conversion of units is often involved which makes scale
a multi-step procedure, and thus a taxonomy level three question.
A project often given to grade 10 learners is the lay-out of a room. They have to find
an appropriate scale for their room which will also apply to the furniture. They can for
example make a scale drawing of the classroom and make desks to the same scale that
they can arrange with-in the given space. From here they can make a range of
calculations to see if the floor area of the drawing and the real life floor area would be
in the same ratio as the lengths of the walls on the drawings to the lengths of the walls
in real life. It is also an opportunity to discuss the use of scale models and scale
drawings in real life.
Enlargements and reductions are natural extension to scale. When enlarging an A4
page to A3, there is a specific ratio involved just as reducing an A4 page to A5 size.
Many school copiers work with enlargement end reduction percentages which is a
starting point for discussions around the concept.
When a teacher reduces a double page out of a textbook to A4 size, she sets the
copier on 70%.
1) What does the 70% mean?

134
2) Use the size of an A4 page to calculate the size of the original double spread
in the textbook?
3) What are the dimensions of the book?
It is fairly easy to understand that the 70% means 70% of the original size, but having
the measurements of the A4 page and working backwards to find the original size is
slightly more complicated. If we are looking for the measurements of the original
100%, and we have 70% and its measurements, the set-up would look as follow:
70% : 100%
30 cm : ? length
20 cm : ? width
Learners would first have to find the value of 1%, which could be rounded to 0,43 cm,
from where they can calculate the full 100% of 43 cm. It is the same strategy used
when calculating how many times 30 is bigger than 70 and then multiplying 100 by
the same amount.
5.5.5 Looking at rate and the role of ratio
The pizza question mentioned earlier is a powerful comparison problem. It involved
fractions, division and also rate (as will be discussed in this section.) When comparing
the amount of pizza each boy will get, when 3 boys share 2 pizzas, and the amount of
pizza each girls will get, when 9 girls share 7 pizzas we are referring to rate: “How
much per boy” and “how much per girl?” Yet, it is also a division problem and
involves fractions.
In this specific problem, the question was phrased as a rate question referring to pizza
per child. It is also possible to look at this question in terms of equivalence (as
learners use it within fraction calculations).

135
If two more groups of 3 boys joined the group of three boys and each group bought
two more pizzas, the 9 boys will have 6 pizzas. Since the 9 girls have 7 pizzas, it is
clear that the girls have more pizzas than they boys.
Although this method can be labelled as equivalence, it is also a form of rate. The rate
per nine boys is 6 pizzas, whilst the rate per nine girls is seven pizzas. The big
advantage to this method is that we are working with whole pizzas instead of 23
and
79
of a pizza which also first needs to be made into equivalent fractions before being
compared.
One of the types of questions which are commonly used in Mathematical Literacy to
explain rate is that of comparing prices.
Which is the better buy: 2 ℓ of milk for R15,95 or 1 ℓ of milk R7,85.
One must of course be careful when wording these type of questions not to ask
“which is cheaper” since the answer to this question would be that R7,45 since it is
less than R15,95. Teachers can either phrase the question as “which one is cheaper per
litre” or “is it better to buy two one litre bottles or one two litre bottle”. Depending on
the question, learners would either have to calculate the price per litre or per two litre:
1 : 7,45 thus
2 : (7,45 x 2 = 14,90)
2 : 15,95
or
2 : 15,95 thus
1 : (15,95 ÷ 2 = 7,975 ≈ 7,98)
1 : 7,45
In both cases it is clear that the one litre milk container works out to be cheaper.
Teachers need to vary the way in which they ask these types of comparison rate
problems so that learners may become sensitive to the methods being asked.

136
Answering the question of which container of milk is cheaper per litre by doing the
first set of calculations would be wrong although the correct answer might have been
given. This comes back to classroom norms of calculations being more important than
answers. Learners using this incorrect method in a test or examination should not
receive the marks since they did not answer the question.
Exchange rate is another form of rate. If it is R7,89 to a Dollar, then the multiplicative
relationship between Rand and Dollar would be 7,89. The concept of exchange rate is
also associated with conversions discussed in the next section.
Another concept in Mathematical Literacy is that of function mathematics. When
introducing functions one normally thinks of speed questions: kilometre per hour,
metres per second. The constant rate (ratio or gradient) is of course multiplicative in
nature. Few learners will make the mistake of saying that a person driving at 100
km/h will drive 101 km in 2 hours. Yet, additive strategies are prevalent when
working with ratios and rate can help to prove those strategies wrong. Unlike the
comparison of prices, function questions are normally missing value type questions.
I am sure that most learners have asked the following question whilst travelling in car
on holiday: Are we there yet? A range of powerful proportional reasoning problems
could be structured around this tongue in cheek question, for example:
If the family is travelling at 120 km/h and they are 30 km away from their
destination, how long will it take them to reach their destination?
This specific example can explore both with-in and between strategies:
120 : 60
30 : ?
In seems that in most cases it is easier to use between strategies to solve a missing
value question since numbers in a specific ratio are not necessarily multiplicatively
linked by a whole number. In this specific case the with-in relationship is almost
calling out for use since it could easily be simplified to 2:1. Realizing that the distance

137
is twice the time in minutes would lead to the answer of 15 minutes without almost
any calculations. The problem of course in this regard would be to realise that 120
km/h means that you cover 120 km in 1 hour and one would also have to know that 1
hour equals 60 minutes. Once again I would like to stress the fact that learners need to
be taught how to set up a question since this is a way of looking at what is given and
what needs to be calculated.
It is not essential that learners convert hours to minutes. They could also reason that
30 is a 14
of 120 and therefore the time must be 14
of an hour.
As mentioned in the beginning of this chapter, a specific learner in my class could not
make sense of kilometres per hour as a method of calculation. He saw km/h as a unit
and nothing more. On asking him how far his dad will drive in 1 hour if he drives at
100 km/h, he replied with a confused expression:
“I don’t know… Sixty?”
Except for the fact that his peers found it a rather amusing answer, it was saddening to
see that this learner did not make sense of speed at all. He wanted to know if he can
have the formula to work it out:
“Isn’t it something like distance over time? Then I just work backwards!”
He seemed oblivious the explanations of both myself and his peers in trying to
convince him of the logic of the situation.
The importance of rate questions is that they are introductory to functional
mathematics. It is normally the start of linear graphs and the concept of constant
growth and gradient. As mentioned earlier, Riedesel (1969) and later Olivier (1992)
suggested that rate is the key factor in proportional reasoning. Although rate and
functional mathematics play an important role in developing proportional reasoning,
learners still have to understand basic concepts such as equivalence, and the

138
multiplicative reasoning involved in equivalence, before they can understand the
intricacies surrounding functions. To be able to plot a speed graph, learners will most
likely use a table such as the one below:
Distance 0 100 200 300 600 900
Hours 0 1
If a distance of 100 km was covered in 1hour, then learners should see that:
1 : 100 equals 2 : 200 equals 9 : 900
or
1 2 9100 200 900
= =
Both researchers valued the concept of equivalence when focusing on the use of rate
in proportion and used the table format extensively so that learners were able to see
the ratio (or constant gradient) between the two variables. Although they worked with
a structure of y = mx, and not with the equivalent fraction notation shown above, their
contribution to the importance of equivalence in proportional situation supports the
view of the importance of learners having a sound foundation in equivalent fractions
in order to understand related proportional concepts.
The following question on ratio, scale and rate is given to adults in the Map Work
section of the Trial Walking Guide Qualification (Tourism Guide Qualification 19,
Unit standard 9284.) It embodies the interconnectivity of proportional reasoning
within a real life situation. Due to the authentic nature of the questions in terms of
Realistic Mathematics Education, this question was included in this sequential
progression of activities:
If a person hiking with a heavy backpack walk at 3 km/h on a section of a mountain
trial represented by 8 cm on a 1:50 000 map and gains 200 m in height, how long did
he walk for? (10 minutes is added to the time for every 100 m gained in height.)

139
This question employs several proportional reasoning concepts and it is not surprising
that many prospective mountain walking guides struggle with this question. First they
would need to calculate the distance covered by using the scale and conversions (from
cm to km).
1 : 50 000
8 : 50 000 x 8
8 : 400 000
400 000 cm = 4 km
Secondly, they would need to work with the walking rate (or speed) of the hiker:
3 km : 1 h
or
3 km : 60 min
4 km : 80 min
Thirdly, they would need to find the extra time needed when gaining 200 m.
100 m : 10 min
200 m : 20 min
Only after three proportional reasoning calculations could they determine the total
amount of time needed for the 4 km hike, amounting to 100 minutes or 1 h 40
minutes.
Not only did this question cover ratio, scale, conversions and rate, it also suggested
both with-in and between strategies. Scale suggests a between strategies, since 8
centimetres is 8 times bigger than 1, then 50 000 should also be 8 times bigger. Yet,
the missing value in the speed ratio is easily calculated by using with-in strategies
since the numbers used, especially when converted to minutes, are multiples of each
other. If 3 × 20 = 60, then 4 × 20 = 80. This method would be much easier than
calculating that 4 is 43
times more than 3 and therefore the missing value will be 43
times more than 60.

140
5.5.6 Conversions
For some reason conversions are not as easy for learners as one would expect. There
are a range of conversions that could be looked at: converting between units within
the metric system, converting between the metric and imperial system, conversions
between currencies (although this could also be seen as rate), time and time zone
conversions and even British shoe sizes to American or European shoe sizes.
It was interesting to see that learners seem to be comfortable with the first conversion,
but not with the second:
1) If 10 litres equals 2,2 gallons, how many gallons will 15 litres be?
2) How many litres will 15 gallons be?
Learners tend to use a build-up strategy to solve the first question, by saying that since
5 litres will be 1,1 gallons, that will mean that 15 litres will equal 3,3 gallons. It is not
as simple to use this strategy to solve the second question.
10 : 2,2
? : 15
Learners that have used this set-up method with continuous success, are learners that
realise that they have to divide by 2,2 and multiply by 10. When dividing by 2,2 they
are calculating how many times bigger 15 is than 2,2 and if they have this value, they
can also multiply the 10 by this figure, as shown below:
10 : 2,2
? : 15 × 6,82
Thus 10 × 6,82 = 68,2
Learners that are not able to calculate the second question are thus not yet fully
developed proportional reasoners and are functioning on Thompson and Thompson’s
level three since they are employing build-up strategies.

141
Employing rate strategies by first finding the value of one gallon or one litre will aid
in making sense of conversions. Learners that simplified the ratio of litres to gallons
to 1 : 0,22, were able to either multiply the amount of litres by 0,22 to calculate the
gallons or divide the gallons by 0,22 to calculate the litres.
Not all conversions are directly proportional in nature. When converting degrees
Celsius to degrees Fahrenheit, the formula suggest a proportional scenario rather than
a directly proportional scenario. The formula below suggests a proportional y = mx +
c structure rather than a directly proportional y = mx structure.
Fahrenheit = 9 325
C +
On investigating different types of conversions and their proportional or directly
proportional structure, it is advisable to fill in the tables and draw linear
representations. This helped learners to see that proportional situations could have
value other than zero when one of the variables were zero. Although the 0 centimetre
would b equal to 0 metre, 0 degrees Celsius would be equal to 32 degrees Fahrenheit.
Unlike directly proportional conversions, proportional conversions will also not have
a constant ratio between variables due this constant value when one of the variable
equal zero.
5.5.7 Distinguishing between proportion and direct and indirect proportion
Distinguishing between different types of proportional situations is a natural extension
to conversions since it also touched on the differences between directly proportional
and proportional situations. Cramer et al. (1993) and Lamon (1995) describe the
ability of a proportional reasoner, to, except solving a variety of problems and
understanding mathematical relationships involved in proportion, also be able to
discriminate proportional from nonproportional situations. Comparing directly
proportional problems of y = mx to proportional problems of y = mx + c, seems better
distinguished when presented visually by means of linear graphs.
According to the Mathematical Literacy assessment standards, learners in grade 10
merely have to plot values on linear graphs, but they must be able to calculate input

142
value from output values and output values from input values. These assessment
standards should have been covered in grade 9 already and learners should have some
idea of functions when entering Mathematical Literacy in grade 10. The idea of “a
fixed cost”, is visually well explained when learners investigate graphs of total
income and total cost. When discussing the following graph, learners can “see” that
the total cost is a constant that remains unchanged and influences the relationship
between the variables. This links to the difference of proportional conversions (such
as temperature conversions) and directly proportional conversions (such as between
metric units) discussed in the previous sections
A didactic that almost always seems to work in helping learners to distinguish
between directly proportional situations and proportional situations, is asking learners
to create their own context for each type of situation. Learners are encouraged to think
of situations that have not been discussed in class and to be as creative as possible.
Discussing these situations in class exposes learners to a variety of context that can be
used to distinguish between directly proportional situations and proportional
situations.
Asking learners to create posters of the situation and giving them opportunities to
draw their graphs on Microsoft Excel®, helps them to buy into the activity. Teachers
must not think that putting learner work up in class or giving rewards for the most
creative situation is reserved for use by primary school teachers only. High school
learners seem to appreciate these gestures and even plead for stickers in their books.
0
10
20
30
40
50
60
70
80
90
100
0 5 10 15 20
income
total cost

143
The power of motivation cannot be misjudged and it is often these silly extrinsic
motivational tricks that will aid learners in creating intrinsic motivation. These
motivational actions help to create a classroom atmosphere of trust and appreciation
especially in the light of overwhelming negative attitudes of learners towards
Mathematics (and Mathematical Literacy) as shown in the baseline assessment
questionnaire.
To be able to distinguish between direct proportions and other types of
proportionality, situations must be given that are also indirectly proportional. The
following questions are examples of such indirect proportions.
1) It costs R156 each for 7 workers to hire a minibus for a day. How much will
each person have to pay if 12 workers hire a minibus?
2) A farmer estimates that it takes 12 workers 10 days to harvest his crop. How
many workers would it take to harvest his crop in 8 days?
3) Three people can deliver 1000 brochures in 30 minutes. How long will it take
five people to deliver 1000 brochures?
Before learners can begin to make calculations, they need to realise that unlike with
direct proportions, the two variables do not grow with the same factor. With indirect
proportions the one unknown decreases as the other increases: the more workers, the
less days; the more people, the less each one has to pay; the more people, the less the
amount of time to deliver the brochures.
The first question is relatively easy since the context makes it easy to find the product
of the two variables. If 7 workers each pay R156, then they pay R1092 in total. If 12
workers have to share this cost, the cost per person would be R1092 ÷ 12 = R91.
The second question is not as simple as the first since calculating the product of the
variables does not fit into the context. To help learners in answering the question of
how many workers are needed to harvest the crop in 8 days, the following questions
could be asked: If 12 workers take 10 days, then how long will 24 workers take?

144
Learners should be able to interpret from the context that double the number of
workers, would take half the time. Also ask learners how many workers would be
needed to finish the project in 20 days. Since it is double the number of days, the work
must have been done by half the amount of workers. Learners can write a range of
ratios to see if they can find a pattern. It can be represented in a table or as a set of
ratios:
Workers 3 6 12 24 48
Days 40 20 10 5 2.5
Learners can reason in one of two ways. Either they can realise that every time we
multiply the one variable by two, we divide the other variable by two. Thus, if we
want to know how many workers it will take to finish the project in 8 days, we must
see what we have to multiply or divide 10 by to get to 8 and do the exact opposite to
12.
Working with whole numbers: if 10 8 10 8× ÷ = then 12 8 10 15÷ × =
Or as fractions: if 810 810
× = then 812 1510
÷ =
Learners can also realise that the multiplicative relationship between the variables is
always equal to 120 ( 24 5 12 10 6 20 3 40× = × = × = × ). With this knowledge, they can
calculate:
120 8 15÷ = because the product of 8 and 15 also equals 120.
What makes the third question more difficult than the previous two is the fact that like
question two, the product of the variable are not a natural extension to the context.
There is also redundant information, of 1000 brochures, included in this problem
which learners need to discard in order to make sense of what is being asked:
3 people take 30 minutes, that will mean that
6 people take 15 minutes (twice the amount of people, half the time)
9 people take 10 minutes (trice the amount of people, a third of the time)

145
Learners must be encouraged to find their own formula to calculate inverse
proportions. To supply learners with the formula is to deny them the opportunity to
engage with the situation. Understanding that 5 is 53
time more than 3 and that the
amount of minutes must thus be 53
times less than 30, is a powerful concept.
Substituting the values into the formula of cyx
= requires little proportional reasoning
and learners using this method of substitution does not necessarily understand the
reasoning behind it.
Learners need to be made aware of the difference between inversely proportional
problems and that of proportions with a negative growth or gradient. Take the
example of a candle burning:
If a candle with a length of 25 cm burns at a rate of 1,5 cm per hour, what will its
length be after 4 hours?
Learners will need to realise that the candle gets shorter as time increases, but that it is
not an inverse proportion. The reason for this being that it is a constant negative
growth. Learners should be asked to plot graphs of the different situations to see the
difference in growth patterns. The candles graph would look as follow:
0
5
10
15
20
25
30
0 1 2 3 4 5 6
cm
hours

146
Whereas the graph of the workers renting a taxi would look as follows:
These representations should help learners in distinguishing between negative growth
and inverse proportions.
5.6 Conclusion Throughout this sequential progression of activities the interconnectivity between
concepts should formed clear links between concepts. These links are shortly
summarised below.
The activities start off with building on learners’ knowledge of equivalent fractions
and distinguishing between part-part and part-whole ratio situations. Throughout this
progression of activities learners are encourage to set-up questions in a ratio format in
order to analyse the structure of what is being asked. Since there can be distinguished
between missing value, sharing, comparison and later rate, learners can use the set-up
structure to help them to indentify the nature of each problem.
Once learners are able to distinguish between different types of proportional problems
and employ multiplicative strategies similar to that of equivalent fraction, they can use
these strategies in a variety of context. Since percentages are merely another form of
fractions, this section is included first. Percentages include the notion of percentages
more, as in inflation and appreciation, and percentages less, as in depreciation. These
0
200
400
600
800
1000
1200
0 1 2 3 4 5 6 7 8
R
number of workers

147
missing value type of questions can be solved by using similar strategies to that of
ratio questions discussed in the previous sections.
Scale and enlargements and reductions are the start of the idea of simplifying to the
simplest form to calculate the missing value. Learners have trouble understanding that
a scale is not unit specific and that it is merely a representative ratio of “how many
times bigger or smaller” the representation is. This is the same strategy used when
working with rate when the amount per one unit is worked with. It is for this reason
that the concept of rate follows that of scale. If the rate of a proportional problem is
calculated it is simple to calculate the missing values by merely multiplying or
dividing by the rate. Rate can thus be used as a strategy in solving proportional
problems.
Exchange rate is a special form of rate that works with the conversions between
currencies. It can however also be linked to the concept of conversions and therefore
conversions were used as an extension to rate. Not all conversion are directly
proportional in nature and some conversions, such as temperature conversions, have a
proportional structure of y = mx + c.
To be able to reason proportionally one must be able to “discriminate proportional
from nonproportional situations” (Cramer et al. 1993; and Lamon 1995).
Distinguishing between proportion and direct and indirect proportion links to different
structures of conversions covered in the previous section. At this final stage of the
sequence of activities, learners should have a better understanding of the different
types of directly proportional situations as well as strategies to solve them.
Discriminating direct proportional situations from non-direct proportional situation is
thus the final stage in becoming a proportional reasoner.
Although this sequential progression of activities will not guarantee that learners will
become proportional reasoners that operate on Piaget’s highest level of cognitive
development, it should help learners along the process of becoming proportional
reasoners.

148
Conclusion
In this research I have focused on the great extent of research that has been done on
the different stages of acquiring proportional reasoning. Yet few researchers have
offered solutions to the problem of acquiring proportional reasoning skill. Researchers
also limited the concept of proportionality to ratios, rate and indirect proportions. As I
have set out in Chapter four, the concept of proportional reasoning extends far beyond
these concepts and it is evident in all the Mathematical Literacy learning outcomes
within the National Curriculum Statement. The concept of proportional reasoning
cannot merely be brushed over in Mathematical Literacy textbooks. It is a powerful
set of activities that runs through the subject. This supports the claim of the
importance of research into proportional reasoning in Mathematical Literacy since it
is a concept that is needed within all learning outcomes in the subject.
Proportional reasoning is not a cognitive skill that learners will acquire with age. It is
a skill that needs to be developed. With the use of baseline assessment I was able to
show the poor proportional reasoning skills of learners in Grade 10 Mathematical
Literacy classes as well as their mostly negative attitudes towards Mathematics and
Mathematical Literacy. Learners attending government schools would most likely
have even weaker proportional reasoning skills. What is also noteworthy is the fact
that most government schools have overcrowded classrooms where individual
attention and support is hardly possible. This supports the great need for activities that
will help learners to develop proportional reasoning skills in Mathematical Literacy
classrooms.
The baseline assessment also points out the great anxiety and emotional barriers that
learners bring to the classroom. This places a great responsibility on the Mathematical
Literacy teacher to create an environment which will be uplifting and motivating to
learners. If learners do not feel comfortable in the Mathematical Literacy classroom,
they will not engage in learning activities and educational discourse.

149
Since there is such overwhelming evidence of the difficulty of proportional reasoning
by several researchers since the beginning of the previous century and further
supported in this research, and since I have shown the strong thread of proportional
reasoning throughout the Mathematical Literacy learning outcomes of the National
Curriculum Statement, the views of Mathematical Literacy as lower grade
mathematics need to be revised. This subject lends itself towards the development of a
range of high order thinking skills that is not only restricted to the Mathematical
Literacy classroom. Mathematical Literacy teachers have the opportunity to help
develop learners’ critical and analytical thinking skills, transfer of knowledge skills
and reflection on thinking methods skills, whilst developing proportional reasoning
skills. It is a task that should not be taken lightly.
The activities suggested in this research to develop proportional reasoning focused on
the development of these skills high order thinking skills. For learners to develop
sound proportional reasoning skills, they will need to make clear links between
interconnective concepts. The activities take the concept of equivalence in the concept
of fractions, and the methods involved in solving it, as the basis from which to reason
proportionally. It aimed to make sequential links between concepts that all require
proportional reasoning skills. I have argued that the methods learners employ to solve
missing value and comparison questions involving fractions are the same methods
learners must tap into to solve ratios, percentages, conversions and other proportional
situations.
Implementing the aspects of the proposed activities will help to deliver the intended
Learning Outcomes of the National Curriculum Statement within the subject of
Mathematical Literacy. It is a field of study that lends itself to further research and
development so that teachers may be empowered to teach Mathematical Literacy in
such a way that it will also empower their learners.

150
References
Abramowitz, S. (1974). Investigation of adolescent understanding of proportionality. Unpublished doctoral dissertation. Stanford University, USA.
Adjidage, R., & Pluvinage, F. (2007). An experiment in teaching ratio and proportion.
Educational Studies in Mathematics, 65, 149–175. Bell, A. (1993). Principles for the design of teaching. Educational Studies in
Mathematics, 24(1), 5–34. Boaler, J. (1993). The role of contexts in the mathematics classroom: Do they make
mathematics more real? For the learning of Mathematics, 13(2), 12–17. Caine, R.N., & Caine, G. (1991). Making connections: Teaching and the human
brain. Virginia: Association for Supervision and Curriculum Development. Carpenter, T., Fennema, E., Franke, M. L., Levi, L., & Empson, S. (1999). Children’s
mathematics: Cognitively Guided Instruction. Portsmouth: Heinemann. Clarke, M. R., Berenson, S. B., & Cavey, L. O. (2003). A comparison of ratios and
fractions and their roles as tools of proportional reasoning. Journal of Mathematical Behavior, 22(1), 297–317.
Coe, E.E. (2007). Modeling teachers’ ways of thinking about rate of change.
Unpublished doctoral dissertation, Arizona State University, USA. Cramer, K., & Lesh, R. (1988). Rational number knowledge of preservice elementary
education teachers. In M. Behr (Ed.), Proceedings of the 10th Annual Meeting of the North American Chapter of the International Group for Psychology of Mathematics Education (pp. 425-431). DeKalb: PME.
Cramer, K., Post, T., & Behr, M. (1989). Interpreting proportional relationships.
Mathematics Teacher, 82(6), 445–452. Cramer, K., Post, T., & Currier, S. (1993). Learning and teaching ratio and
proportion: Research implications. In D. Owens (Ed.), Research ideas for the classroom (pp. 159-178). New York: Macmillan Publishing Company.
Department of Education (DoE), 2007. National Curriculum Statement Grades 10-12
(General). Subject Assessment Guidelines: Mathematical Literacy. Pretoria: Government Printer.
Department of Education and Employment (UK), 1999. The National Numeracy
Strategy: Framework for Teaching Mathematics from Reception to Year 6. London: Prentice Hall/Harvester Wheatsheaf.

151
Edelson, D.C. (2002). Design research: What we learn when we engage in design. The Journal of the Learning Sciences, 11(1), 5–121.
Gravemeijer K., & Terwel J. (2000). Hans Freudenthal: A mathematician on didactics
and curriculum theory. Journal for Curriculum Studies, 32(6), 777–779. Gravemeijer, K., Dolk, M., & Den Hertog, J. (2002). Using multimedia cases for
educating the primary school mathematics teacher educator: A design study. International Journal of Educational Research, 37(2), 161–178.
Hart, K. (1981). Strategies and errors in secondary mathematics: The addition strategy
in ratio. Proceedings of the Fifth Conference of the International Group for the Psychology of Mathematics Education (pp. 199–202). France: Grenoble.
Hart, K. M. (1984). Ratio: Children's strategies and errors. London: NFER-Nelson. Hiebert, J. (Ed.) (1985). Conceptual and procedural knowledge: The case of
mathematics. New Jersey: Lawrence Erlbaum. Inhelder, B., & Piaget, J. (1958). The growth of logical thinking (5th ed.). (A. Parsons,
& S. Milgram, Trans.). New York: Basic Books Inc. Julie, C. (2006). Mathematical Literacy: Myths, further inclusions and exclusions.
Pythagoras, 64, 62–69. Karplus, R., Pulos, S., & Stage, E. K. (1983). Proportional reasoning of early
adolescents. Educational Studies in Mathematics, 14(3), 219–233. Lamon, S.J. (1999). Teaching fractions and ratios for understanding: Essential
content knowledge. New York: Lawrence Erlbaum Associates. Lamon, S.J. (1993). Ratio and proportion: Connecting content and children’s thinking.
Journal for Research in Mathematics Education, 24(1), 41–61. Lamon, S. J. (1995). Ratio and proportion: elementary didactical phenomenology. In J. T.
Sowder, & B. P. Schappelle (Eds.), Providing a foundation for teaching mathematics in the middle grades (pp. 167–198). Albany, NY: State University of New York Press.
Lesh, R., Post, T., & Behr, M. (1988). Proportional reasoning. In: M. Behr, & J.
Hiebert (Eds.), Number concepts & operations for the middle grades (pp. 93–118). New Jersey: Lawrence Erlbaum Associates.
Lo, J., & Watanabe, T. (1997). Developing ratio and proportion schemes: A story of a
fifth grader. Journal for Research in Mathematics Education, 28(2), 216–236. Louw, D.A., Van Ede, D.M., & Louw A.E. (1998). Menslike Ontwikkeling. Derde
Uitgawe. Kaapstad. Kagiso Tersiêr. Lovell, K., & Butterworth, I. B. (1966). Abilities underlying the understanding of
proportionality. Mathematics Teaching, 37, 5–9.

152
Murray, H., Olivier, A., & Human, P. (1999). Teachers' mathematical experiences as links to children's needs. In B. Jaworski, T. Wood, & A.J. Dawson (Eds.), Mathematics teacher education: Critical international perspectives (pp. 33–42). London: The Falmer Press.
McLaughlin, S. (2003, revised August 28). Effect of modeling instruction on
development of proportional reasoning II: Theoretical background. Norwalk High School.
Mouton, J., & Marais, H.C. (1996). Basic concepts in the methodology of the social
sciences. Pretoria: Human Sciences Research Council Publishers. Noelting. G. (1980). The development of proportional reasoning and the ratio concept.
Part 1-Differentiation of stages. Educational Studies in Mathematics, 11, 217–253.
Noelting, G. (1980). The development of proportional reasoning and the ratio concept.
Part 2-Problem-structure at successive stages: Problem-solving strategies and the mechanism of adaptive restructuring. Educational Studies in Mathematics, 11, 331–363.
North M. (2008). The great Mugg and Bean Mystery? Learning and Teaching
Mathematics, 6, 29–35. Olivier, A. (1992). Developing proportional reasoning. In M. Moodley, R.A. Njisani,
& N. Presmeg (Eds.), Mathematics education for pre-service and in-service (pp.297–313). Pietermaritzburg: Shuter & Shooter.
Oxford Advanced Learner’s Dictionary (7th ed.). (2005). New York: Oxford
University Press. Person, A. C., Berenson, S.B., & Greenspon, P.J. (2004). The role of number in
proportional reasoning: A prospective teacher’s understanding. Proceedings of the 28th Conference of the International Group for the Psychology of Mathematics Education 4 (pp. 17–24). North Carolina State University, USA.
Riedesel C.A. (1969). Guiding discovery in elementary school mathematics. New
York: Appelton-Century-Crofts. Rupley, W. H. (1981). The effects of numerical characteristics on the difficulty of
proportional problems. Unpublished doctoral dissertation. University of California, Berkeley, USA.
Schoenfeld, A. H. (1992). Learning to think mathematically: Problem solving, meta-
cognition and sense-making in mathematics. In D. Grouws (Ed.), Handbook for research on mathematics teaching and learning (pp.334–370). New York: MacMillan.
Schwartz, D.L. (1998). On the role of mathematics in explaining the material world:
Mental models for proportional reasoning. Cognitive Science, 22(4), 471–516.

153
Shulman, L.S. (1986). Those who understand: Knowledge growth in teaching.
Educational Researcher, 15(2), 4–14. Skemp R.R. (1972). The psychology of learning mathematics. Harmondsworth:
Penguin Books. Sowder, J., Armstrong, B., Lamon, S., Simon, M., Sowder, L., & Thompson, A.
(1998). Educating teachers to teach multiplicative structures in the middle grades. Journal of Mathematics Teacher Education, 1, 127–155.
Thompson, P.W., & Thompson, A. G. (1994). Talking about rates conceptually, Part
I: A teacher’s struggle. Journal for Research in Mathematics Education, 25, 279–303.
Thompson, P.W. (1994). Images of rate and operational understanding of the
fundamental theorem of calculus. Educational Studies in Mathematics, 26, 2–3. Tourniaire, F. (1986). Proportions in elementary school. Educational Studies in
Mathematics, 17, 401–412. Tourniaire, F., & Pulos, S. (1985). Proportional reasoning: A review of the literature.
Educational Studies in Mathematics, 16, 181–204. Treffers, A. (1987). Three dimensions. A model of goal and theory descriptions in
mathematics instruction – The Wiskobas Project. Dordrecht, The Netherlands: Reidel Publishing Company.
Von Glasersfeld, E. (1987). Learning as a constructive activity. In C. Janvier (Ed.),
Problems of representation in the teaching and learning of mathematics. Hillsdale, NJ: Lawrence Erlbaum,.
Vygotsky, L. S. (1962). The development of scientific concepts in childhood. Thinking
and speech. Cambridge, MA: MIT Press. Wu, H. (2002). What is so difficult about the preparation of mathematics teachers?
Unpublished manuscript. University of California, Berkeley USA.

154
Addendum A
MMaatthheemmaattiiccaall LLiitteerraaccyy Grade 1100
PPrrooppoorrttiioonnaall RReeaassoonniinngg WWoorrkksshheeeett
Please show all your calculations and reasoning. Don’t hesitate to explain answers in words
rather than in numbers. Your methods for doing these activities are far more important than
your answers.
Question 1 At the athletics days the tuck-shop sells hot potato chips. To make one small bag of chips they use of a kilogram of potatoes.
1. If the school has 120 kg of potatoes, how many small packets of chips can they make?
2. The tuck-shop ladies estimate that they will need to make 200 small packets of chips. How many kilograms of potatoes will they need for 200 packets of chips?
3. If the price of potatoes is R6,75 per kilogram, what is the cost of making a small bag of potatoes?
Question 2 Look at the following tables in which the times for the 100 m and the 200 m races have been summarised. All four of these learners ran in both races.
1. Did Sam run at the same average speed for both races? Explain your answer. 2. Which of the runners kept the same average speed for both races? 3. Which of the runners managed to run at a faster average speed for the 200 m
race? 4. If Charlie can manage to run at the same average speed for 400 m, what will
his time be for completing the 400 m race?
34

155
Question 3 The school has organised soft drinks for all the athletes that finish an event. They ordered 500 soft drinks and received 240 tins of Coke-Cola®s, 120 tins of Fanta® Orange, 84 tins of Fanta® Grape and 36 tins of Sprite®. The school organises that a couple of parents will hand out the soft drinks as the athletes finish.
1. What is the chance that an athlete will receive a Coke-Cola®? 2. What is the chance that an athlete will not receive a Coke-Cola®?
Question 4
Sam and Alex both brought post race energy drinks. Sam has Energade® concentrate and Alex has a Game® sachet. On Alex’s Game® sachet, it says that 1 sachet makes 1 litre of Game®.
1. How many sachets does she need to make 2 litres of Game®? 2. How many sachets does she need to make 500 m of Game®?
Sam’s Energade® bottle has mixing instructions in the form of a ratio. It says that you must always mix the Energade® concentrate and the water in the ratio of 1:3.
3. If Sam wants to make 1 litre (or 1000 m) of Energade®, how many millilitres of concentrate and how many millilitres of water is needed for 1 litre?
4. What percentage of the Energade® will always be concentrate if it is mixed in the ratio 1:3?
5. What percentage of the Energade® will always be water if it is mixed in the ratio 1:3?
6. If Sam mixed 75 m of concentrate with 300 m of water, was the Energade® mixed according to the ratio 1:3?
7. Which will have the stronger taste: Energade® made from 75 m of concentrate and 300 m of water or 45 m of concentrate and 270 m of water?
Question 5 Alex builds a scale model of the Athletics Stadium.
1. If her scale model measures 30 cm from the start of the 100 m mark to the finish line (of the 100 m mark), what is the scale of the model? (100 cm = 1 m)
2. Using the scale calculated in 1 above, if the width of the field (the grass) is 70 m in real life, what will the width of the field be on the model?
3. According to Alex’s research, the height of the stadium pavillian is 12 m. If she makes the height of her model 4 cm, will this be to scale (as in question 1)?

156
height
30cm width

157
Addendum B
Table of analysis of results:
5 learners 19 learners 6 learners
SScchhooooll 11 %% SScchhooooll 22 %% SScchhooooll 33 %% average
1.1 If of a kg potatoes make one small
packet of chips, how many packets of chips
does 120 kg of potatoes make? 3 60 3 16 3 50 42
1.2 How many kilograms of potatoes are
needed for 200 packets of chips? 1 20 9 47 1 17 28
1.3 What is the cost of a bag of chips if the
price of potatoes is R6,75? 1 20 7 37 1 17 25
2.1 Did Sam run at the same average
speed for both races if she ran 15 s for the
100 m and 40 s for the 200 m race? 5 100 13 68 6 100 89
2.2 Which runner ran at the same average
speed for both races? 5 100 16 84 5 83 89
2.3 Which runner ran at a faster average
speed for the 200 m race? 4 80 11 58 5 83 74
2.4 If Charlie can manage to run at the
same average speed for the 400 m race,
what will his speed be? 5 100 12 63 5 83 82
3.1 What is the probability of receiving a
Coke-Cola if 240 out of 500 tins are Coke-
Cola? 2 40 10 53 1 17 36
3.2 What is the probability of not receiving
a Coke-Cola? 2 40 10 53 1 17 36
4.1 If 1 sachet of Game makes 1 ℓ then
how many sachets are needed to make 2
ℓ? 5 100 19 100 6 100 100
4.2 How many sachets are needed for 500
mℓ of Game? 5 100 16 84 5 83 89
4.3 Energade is mixed in the ratio 1:3, how
many mℓ of concentrate and water is
needed for make 1 ℓ of Energade. 1 20 4 21 0 0 14

158
4.4 What percentage of the Energade is
concentrate? 0 0 5 26 0 0 9
4.5 What percentage of the Energade is
water? 0 0 5 26 0 0 9
4.6 Is 75 mℓ of concentrate and 300 mℓ of
water mixed in the ratio 1:3? 3 60 14 74 3 50 61
4.7 Which will have the stronger taste: 75
mℓ of concentrate to 300 mℓ or 45 mℓ of
concentrate and 270 mℓ of water? 0 0 11 58 0 0 19
5.1 What is the scale of a model, if 30 cm
on a scale model represents 100 m? 1 20 0 0 0 0 7
5.2 If the real life width of the track is 70,
what will the width of the track on the
model be? 0 0 0 0 0 0 0
5.3 If the real height of the stadium is 12 m
and Alex makes the height on the model 4
cm, is the height in the same scale as 5.1? 2 40 7 37 0 0 26
47
48
37 44

159
Addendum C
Research into Mathematical Literacy A M.ED STUDY DONE BY MRS ELMARIE MEYER AT THE UNIVERISTY OF STELLENBOSH
Please note that there are no right or wrong answers when completing this questionnaire. It is a way
in which teachers want to determine what your fears and ideas are about Mathematics and
Mathematical Literacy. The only reason why you are asked to write your name on this questionnaire is
so that your teacher can ask you questions about some of your answers if he/she is not clear on what
you meant. Your name will not be used in any research documentations. The goal of this study is to
better understand learners taking Mathematical Literacy so that teachers can be better at teaching
the subject.
Mathematical Literacy QUESTIONNAIRE
Name: .
School: .
1. Why have you chosen to take Mathematical Literacy instead of Mathematics?
2. How do you think Mathematical Literacy will be different to Mathematics?
3. What do you like most in Mathematics?
4. What do you find the easiest in Mathematics?
5. What do you dislike most in Mathematics?

160
6. What do you find most difficult in Mathematics?
7. How did you normally feel in the Mathematics class and why?
8. What do you know about ratios?
9. Where do we use ratios in our every day lives?