Dopamine modulation of excitatory currents in the striatum is dictated by the expression of D1 or D2...
15
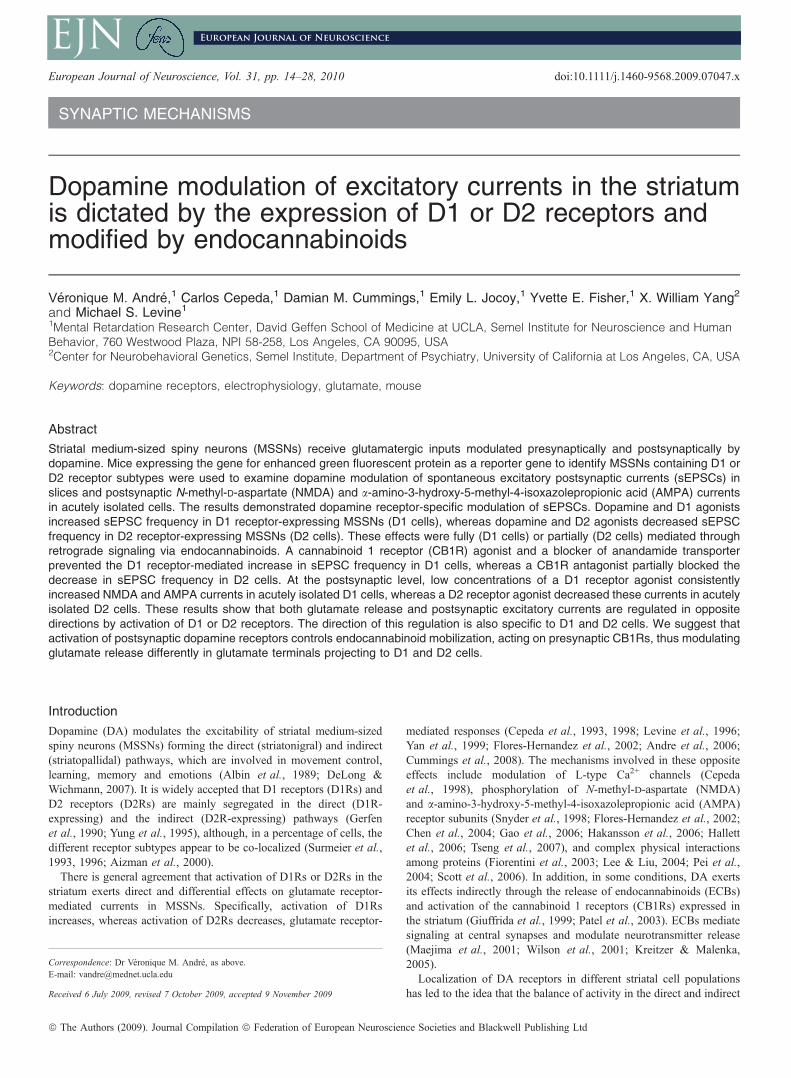
SYNAPTIC MECHANISMS Dopamine modulation of excitatory currents in the striatum is dictated by the expression of D1 or D2 receptors and modified by endocannabinoids Ve´ronique M. Andre´, 1 Carlos Cepeda, 1 Damian M. Cummings, 1 Emily L. Jocoy, 1 Yvette E. Fisher, 1 X. William Yang 2 and Michael S. Levine 1 1 Mental Retardation Research Center, David Geffen School of Medicine at UCLA, Semel Institute for Neuroscience and Human Behavior, 760 Westwood Plaza, NPI 58-258, Los Angeles, CA 90095, USA 2 Center for Neurobehavioral Genetics, Semel Institute, Department of Psychiatry, University of California at Los Angeles, CA, USA Keywords: dopamine receptors, electrophysiology, glutamate, mouse Abstract Striatal medium-sized spiny neurons (MSSNs) receive glutamatergic inputs modulated presynaptically and postsynaptically by dopamine. Mice expressing the gene for enhanced green fluorescent protein as a reporter gene to identify MSSNs containing D1 or D2 receptor subtypes were used to examine dopamine modulation of spontaneous excitatory postsynaptic currents (sEPSCs) in slices and postsynaptic N-methyl-d-aspartate (NMDA) and a-amino-3-hydroxy-5-methyl-4-isoxazolepropionic acid (AMPA) currents in acutely isolated cells. The results demonstrated dopamine receptor-specific modulation of sEPSCs. Dopamine and D1 agonists increased sEPSC frequency in D1 receptor-expressing MSSNs (D1 cells), whereas dopamine and D2 agonists decreased sEPSC frequency in D2 receptor-expressing MSSNs (D2 cells). These effects were fully (D1 cells) or partially (D2 cells) mediated through retrograde signaling via endocannabinoids. A cannabinoid 1 receptor (CB1R) agonist and a blocker of anandamide transporter prevented the D1 receptor-mediated increase in sEPSC frequency in D1 cells, whereas a CB1R antagonist partially blocked the decrease in sEPSC frequency in D2 cells. At the postsynaptic level, low concentrations of a D1 receptor agonist consistently increased NMDA and AMPA currents in acutely isolated D1 cells, whereas a D2 receptor agonist decreased these currents in acutely isolated D2 cells. These results show that both glutamate release and postsynaptic excitatory currents are regulated in opposite directions by activation of D1 or D2 receptors. The direction of this regulation is also specific to D1 and D2 cells. We suggest that activation of postsynaptic dopamine receptors controls endocannabinoid mobilization, acting on presynaptic CB1Rs, thus modulating glutamate release differently in glutamate terminals projecting to D1 and D2 cells. Introduction Dopamine (DA) modulates the excitability of striatal medium-sized spiny neurons (MSSNs) forming the direct (striatonigral) and indirect (striatopallidal) pathways, which are involved in movement control, learning, memory and emotions (Albin et al., 1989; DeLong & Wichmann, 2007). It is widely accepted that D1 receptors (D1Rs) and D2 receptors (D2Rs) are mainly segregated in the direct (D1R- expressing) and the indirect (D2R-expressing) pathways (Gerfen et al., 1990; Yung et al., 1995), although, in a percentage of cells, the different receptor subtypes appear to be co-localized (Surmeier et al., 1993, 1996; Aizman et al., 2000). There is general agreement that activation of D1Rs or D2Rs in the striatum exerts direct and differential effects on glutamate receptor- mediated currents in MSSNs. Specifically, activation of D1Rs increases, whereas activation of D2Rs decreases, glutamate receptor- mediated responses (Cepeda et al., 1993, 1998; Levine et al., 1996; Yan et al., 1999; Flores-Hernandez et al., 2002; Andre et al., 2006; Cummings et al., 2008). The mechanisms involved in these opposite effects include modulation of L-type Ca 2+ channels (Cepeda et al., 1998), phosphorylation of N-methyl-d-aspartate (NMDA) and a-amino-3-hydroxy-5-methyl-4-isoxazolepropionic acid (AMPA) receptor subunits (Snyder et al., 1998; Flores-Hernandez et al., 2002; Chen et al., 2004; Gao et al., 2006; Hakansson et al., 2006; Hallett et al., 2006; Tseng et al., 2007), and complex physical interactions among proteins (Fiorentini et al., 2003; Lee & Liu, 2004; Pei et al., 2004; Scott et al., 2006). In addition, in some conditions, DA exerts its effects indirectly through the release of endocannabinoids (ECBs) and activation of the cannabinoid 1 receptors (CB1Rs) expressed in the striatum (Giuffrida et al., 1999; Patel et al., 2003). ECBs mediate signaling at central synapses and modulate neurotransmitter release (Maejima et al., 2001; Wilson et al., 2001; Kreitzer & Malenka, 2005). Localization of DA receptors in different striatal cell populations has led to the idea that the balance of activity in the direct and indirect Correspondence: Dr Ve ´ronique M. Andre ´, as above. E-mail: [email protected] Received 6 July 2009, revised 7 October 2009, accepted 9 November 2009 European Journal of Neuroscience, Vol. 31, pp. 14–28, 2010 doi:10.1111/j.1460-9568.2009.07047.x ª The Authors (2009). Journal Compilation ª Federation of European Neuroscience Societies and Blackwell Publishing Ltd European Journal of Neuroscience
-
Upload
independent -
Category
Documents
-
view
2 -
download
0
Transcript of Dopamine modulation of excitatory currents in the striatum is dictated by the expression of D1 or D2...
SYNAPTIC MECHANISMS
Dopamine modulation of excitatory currents in the striatumis dictated by the expression of D1 or D2 receptors andmodified by endocannabinoids
Veronique M. Andre,1 Carlos Cepeda,1 Damian M. Cummings,1 Emily L. Jocoy,1 Yvette E. Fisher,1 X. William Yang2
and Michael S. Levine1
1Mental Retardation Research Center, David Geffen School of Medicine at UCLA, Semel Institute for Neuroscience and HumanBehavior, 760 Westwood Plaza, NPI 58-258, Los Angeles, CA 90095, USA2Center for Neurobehavioral Genetics, Semel Institute, Department of Psychiatry, University of California at Los Angeles, CA, USA
Keywords: dopamine receptors, electrophysiology, glutamate, mouse
Abstract
Striatal medium-sized spiny neurons (MSSNs) receive glutamatergic inputs modulated presynaptically and postsynaptically bydopamine. Mice expressing the gene for enhanced green fluorescent protein as a reporter gene to identify MSSNs containing D1 orD2 receptor subtypes were used to examine dopamine modulation of spontaneous excitatory postsynaptic currents (sEPSCs) inslices and postsynaptic N-methyl-d-aspartate (NMDA) and a-amino-3-hydroxy-5-methyl-4-isoxazolepropionic acid (AMPA) currentsin acutely isolated cells. The results demonstrated dopamine receptor-specific modulation of sEPSCs. Dopamine and D1 agonistsincreased sEPSC frequency in D1 receptor-expressing MSSNs (D1 cells), whereas dopamine and D2 agonists decreased sEPSCfrequency in D2 receptor-expressing MSSNs (D2 cells). These effects were fully (D1 cells) or partially (D2 cells) mediated throughretrograde signaling via endocannabinoids. A cannabinoid 1 receptor (CB1R) agonist and a blocker of anandamide transporterprevented the D1 receptor-mediated increase in sEPSC frequency in D1 cells, whereas a CB1R antagonist partially blocked thedecrease in sEPSC frequency in D2 cells. At the postsynaptic level, low concentrations of a D1 receptor agonist consistentlyincreased NMDA and AMPA currents in acutely isolated D1 cells, whereas a D2 receptor agonist decreased these currents in acutelyisolated D2 cells. These results show that both glutamate release and postsynaptic excitatory currents are regulated in oppositedirections by activation of D1 or D2 receptors. The direction of this regulation is also specific to D1 and D2 cells. We suggest thatactivation of postsynaptic dopamine receptors controls endocannabinoid mobilization, acting on presynaptic CB1Rs, thus modulatingglutamate release differently in glutamate terminals projecting to D1 and D2 cells.
Introduction
Dopamine (DA) modulates the excitability of striatal medium-sizedspiny neurons (MSSNs) forming the direct (striatonigral) and indirect(striatopallidal) pathways, which are involved in movement control,learning, memory and emotions (Albin et al., 1989; DeLong &Wichmann, 2007). It is widely accepted that D1 receptors (D1Rs) andD2 receptors (D2Rs) are mainly segregated in the direct (D1R-expressing) and the indirect (D2R-expressing) pathways (Gerfenet al., 1990; Yung et al., 1995), although, in a percentage of cells, thedifferent receptor subtypes appear to be co-localized (Surmeier et al.,1993, 1996; Aizman et al., 2000).There is general agreement that activation of D1Rs or D2Rs in the
striatum exerts direct and differential effects on glutamate receptor-mediated currents in MSSNs. Specifically, activation of D1Rsincreases, whereas activation of D2Rs decreases, glutamate receptor-
mediated responses (Cepeda et al., 1993, 1998; Levine et al., 1996;Yan et al., 1999; Flores-Hernandez et al., 2002; Andre et al., 2006;Cummings et al., 2008). The mechanisms involved in these oppositeeffects include modulation of L-type Ca2+ channels (Cepedaet al., 1998), phosphorylation of N-methyl-d-aspartate (NMDA)and a-amino-3-hydroxy-5-methyl-4-isoxazolepropionic acid (AMPA)receptor subunits (Snyder et al., 1998; Flores-Hernandez et al., 2002;Chen et al., 2004; Gao et al., 2006; Hakansson et al., 2006; Hallettet al., 2006; Tseng et al., 2007), and complex physical interactionsamong proteins (Fiorentini et al., 2003; Lee & Liu, 2004; Pei et al.,2004; Scott et al., 2006). In addition, in some conditions, DA exertsits effects indirectly through the release of endocannabinoids (ECBs)and activation of the cannabinoid 1 receptors (CB1Rs) expressed inthe striatum (Giuffrida et al., 1999; Patel et al., 2003). ECBs mediatesignaling at central synapses and modulate neurotransmitter release(Maejima et al., 2001; Wilson et al., 2001; Kreitzer & Malenka,2005).Localization of DA receptors in different striatal cell populations
has led to the idea that the balance of activity in the direct and indirect
Correspondence: Dr Veronique M. Andre, as above.E-mail: [email protected]
Received 6 July 2009, revised 7 October 2009, accepted 9 November 2009
European Journal of Neuroscience, Vol. 31, pp. 14–28, 2010 doi:10.1111/j.1460-9568.2009.07047.x
ª The Authors (2009). Journal Compilation ª Federation of European Neuroscience Societies and Blackwell Publishing Ltd
European Journal of Neuroscience

pathways is regulated by opposite actions of DA. Release of DAwould increase the activity of direct pathway MSSNs and reduce theactivity of indirect pathway MSSNs (Wooten, 1997; DeLong &Wichmann, 2007). However, direct electrophysiological evidence hasbeen lacking, partly because of the difficulties in identifying D1R-expressing MSSNs (D1 cells) and D2R-expressing MSSNs (D2 cells)(Kawaguchi et al., 1989; Venance & Glowinski, 2003). The use of thegene for enhanced green fluorescent protein (EGFP) as a reporter genefor a variety of neuronal receptors (Gong et al., 2003) permits theselection of D1 cells or D2 cells for electrophysiological recordings(Day et al., 2006; Kreitzer & Malenka, 2007; Ade et al., 2008;Cepeda et al., 2008; Ding et al., 2008; Taverna et al., 2008). Recently,we reported differences in passive and active membrane properties aswell as in synaptic inputs to D1 cells and D2 cells (Cepeda et al.,2008). In the present study, we examined DA effects on spontaneoussynaptic glutamate currents and modulation by ECBs in D1 and D2cells, as well as DA modulation of postsynaptic NMDA and AMPAresponses.
Materials and methods
All experimental procedures were performed in accordance with theUnited States Public Health Service Guide for Care and Use ofLaboratory Animals, and were approved by the Institutional AnimalCare and Use Committee at the University of California, Los Angeles.Experiments were conducted on two groups of FVB ⁄ N backgroundmice, one that expressed EGFP under the control of the D1 promoter(n = 57, 48.0 ± 1.5 days), and one that expressed EGFP under thecontrol of the D2 promoter (n = 50, 46.6 ± 1.9 days), obtained fromour colony at the University of California at Los Angeles.
Cell visualization
EGFP-positive cells were visualized in slices or after acute isolationusing ·40 water immersion lenses. The microscopes (OlympusBX50WI or Zeiss Axioscope) were equipped with differentialinterference contrast optics and fluorescence filters. For infraredvideomicroscopy, a halogen lamp and an infrared filter (790 nm;Ealing Optics, Hollston, MA, USA) were used. For fluorescencemicroscopy, labeled cells were excited with ultraviolet light. The lightsource was a mercury lamp (100 W), and filtered light (450–480 nm)was detected with a videocamera (QICAM-IR Fast 1394; Burnaby,BC, Canada) optimized to detect EGFP fluorescence and infraredlight. Images were digitized and saved using QCapture Pro software(version 5; Burnaby). When a viable MSSN had been identified withinfrared videomicroscopy, the filter was switched to fluorescencemode to determine whether it was labeled with EGFP. The digitizedinfrared image was superimposed over the fluorescence image, andelectrophysiological recordings were proceeded with only if the cellidentified with infrared light showed a complete overlap with EGFPfluorescence.
Experiments in slices
Detailed procedures have been published elsewhere (Cepeda et al.,1998, 2008; Flores-Hernandez et al., 2002). Mice were deeplyanesthetized with halothane, and killed. The brains were dissectedand immediately placed in oxygenated ice-cold low-Ca2+ artificialcerebrospinal fluid (ACSF) containing 130 mm NaCl, 3 mm KCl,1.25 mm NaH2PO4, 26 mm NaHCO3, 5 mm MgCl2, 1 mm CaCl2 and10 mm glucose. Coronal slices (350 lm) were cut and transferred to
an incubating chamber containing ACSF (with 2 mm CaCl2 and 2 mm
MgCl2) oxygenated with 95% O2 ⁄ 5% CO2 (pH 7.2–7.4, 290–310 mOsm, 25 ± 2 �C). After 1 h of incubation, slices were visual-ized, and EGFP-expressing cells were selected for voltage clamprecordings. The patch pipette contained the following solution:130 mm Cs-methanesulfonate, 10 mm CsCl, 4 mm NaCl, 1 mm
MgCl2, 5 mm MgATP, 5 mm EGTA, 10 mm Hepes, 0.5 mm GTP,10 mm phosphocreatine, 0.1 mm leupeptin (pH 7.25–7.3, 280–290 mOsm). Access resistances were <25 MX. Spontaneous postsyn-aptic currents were recorded in standard ACSF at room temperature.The membrane current was filtered at 1 kHz and digitized at 100–200 ls, using Clampex 10.2 (gap-free mode). Cells were voltageclamped at )70 mV to determine basic membrane properties and toexamine spontaneous glutamate receptor-mediated EPSCs. Bicucul-line methiodide (BMI, 10 lm) was applied in order to block GABAA
receptor-mediated currents. At that voltage, in the presence of BMI,spontaneous synaptic activity is mediated by activation of AMPAreceptors, as addition of 6-cyano-7-nitroquinoxaline-2,3-dione com-pletely abolished the events (data not shown). Baseline activity wasrecorded for 3–5 min in BMI and 5–10 min after addition of DA (5,50 and 100 lm), D1R agonist or D2R agonist (SKF81297 orquinpirole, 10 lm), or in DA and D1R antagonist or D2R antagonist(SCH23390 or remoxipride, 10 lm), tetrodotoxin (TTX, 1 lm), aCB1R agonist (WIN55,212-2, 3 lm) or a CB1R antagonist (AM251,3 lm).For study of DA modulation of NMDA currents in slices, cells were
held at )70 mV, and TTX (1 lm) was added to block Na+
conductances. Drugs were applied iontophoretically through a five-barreled pipette (tip diameter, 6–8 lm) placed close to the recordedcell (30–60 lm). The pipette contained NMDA (0.1 m, pH 8), DA(0.1 m, pH 4.5), and saline for current balancing and control. Holdingcurrents of appropriate polarity ranged between 15 and 20 nA. NMDAwas iontophoretically ejected in an ascending series of currentintensities (usually 10–20 nA) until inward currents reached anamplitude of 100–200 pA. The ejection pulse duration was 3 s. Theinterval between ejection pulses was at least 1 min, to avoidcumulative effects of the drugs. After a stable baseline response hadbeen obtained (two or three applications of NMDA), DA was appliediontophoretically for 30–40 s and stopped 3 s before NMDA appli-cation, to eliminate any potential current interaction. Three to fourNMDA responses were assessed just after DA application, and threeor four NMDA responses were then assessed without prior DAapplication to confirm that the DA effect could be washed out.
Acutely isolated neurons
Slices were prepared as described above. After at least 1 h ofincubation in oxygenated ACSF, the dorsal striatum was dissected,placed in an oxygenated cell-stir chamber (Wheaton, Millville, NJ,USA), and enzymatically treated for 20 min with papain (0.5 mg ⁄ mL;Calbiochem, EMD Bioscience, Inc., La Jolla, CA, USA) at 35 �C in aHepes-buffered Hank’s balanced salt solution (Sigma-Aldrich, Saint-Louis, MO, USA) supplemented with 1 mm pyruvic acid, 0.005 mm
glutathione, 0.1 mm NG-nitro-l-arginine, and 1 mm kynurenic acid(pH 7.4, 300–310 mOsm). After enzymatic digestion, the tissue wasrinsed with a low-Ca2+ Hepes-buffered sodium isethionate solutioncontaining 140 mm sodium isethionate, 2 mm KCl, 2 mm MgCl2,0.1 mm CaCl2, 23 mm glucose, and 15 mm Hepes (pH 7.4, 300–310 mOsm). Striatal slices were mechanically dissociated withfire-polished Pasteur pipettes. The cell suspension was then platedinto a 35-mm Nunclon Petri dish mounted on the stage of an upright
Dopamine modulation of excitatory currents 15
ª The Authors (2009). Journal Compilation ª Federation of European Neuroscience Societies and Blackwell Publishing LtdEuropean Journal of Neuroscience, 31, 14–28
fixed-stage microscope (Zeiss Axioscope, Thornwood, NY, USA)containing a Hepes-buffered salt solution. Only cells containing EGFPwere selected for recordings.Standard whole-cell patch clamp recordings in voltage clamp mode
were used (Bargas et al., 1994). Electrodes were pulled from Corning8250 glass (A-M Systems, Carlsborg, WA, USA) and heat-polishedprior to use. The internal solution consisted of 175 mm N-methyl-d-glucamine, 40 mm Hepes, 2 mm MgCl2, 10 mm EGTA, 12 mm
phosphocreatine, 2 mm Na2ATP, 0.2 mm Na2GTP, and 0.1 mm
leupeptin (pH 7.25, 265–270 mOsm). The external solution consistedof 135 mm NaCl, 20 mm CsCl, 3 mm BaCl2, 2 mm CaCl2, 10 mm
glucose, 10 mm Hepes, and 0.0003 mm TTX (pH 7.4, 300–310 mOsm).Recordings were obtained with an Axon Instruments 200A patch
clamp amplifier controlled by a computer running pClamp (v. 8.01)with a DigiData 1200 series interface (Axon Instruments, Foster City,CA, USA). Negative pressure was used to obtain tight seals (>1 GX).Additional negative pressure disrupted the membrane and created thewhole-cell configuration. Data were collected from neurons that hadaccess resistances below 20 MX. There were no significant differencesbetween mean access resistances among groups. After the whole-cellconfiguration was reached, series resistance was compensated (70–90%) and periodically monitored. All recordings were made frommedium-sized neurons.Drugs were applied through a pressure-driven fast perfusion system,
using an array of application capillaries positioned a few hundredmicrometers from the cell. A DC drive system controlled by anSF-77B perfusion system (Warner Instruments, Hamden, CT, USA)synchronized by pClamp changed solutions by shifting the position ofthe capillary array. Values for peak currents and peak current densitieswere calculated for all neurons. Current density was obtained bydividing currents by cell capacitance to normalize values with respectto the size of the cell (Alzheimer et al., 1993).After basic membrane properties had been obtained, NMDA
currents (3-s duration every 10 s) were evoked by applying differentconcentrations of the agonist (1–3000 lm) while holding the cell at)70 mV. AMPA and cyclothiazide (CTZ, 10 lm; an AMPA receptordesensitization blocker) were applied (3-s duration every 20 s) whileholding the cell at )80 mV. The D2R agonist quinpirole (0.1–10 lm)and antagonist remoxipride (5 lm) were applied 3–5 s prior to andwith NMDA (100 lm) and AMPA (100 lm). The D1R agonistSKF81297 (0.01–1.0 lm) and D1R antagonist SCH23390 (10 lm), aswell as DA (0.1–50 lm), were only pre-applied, as it has been shownthat D1R agonists can act as NMDA receptor channel blockers (Cuiet al., 2006).
Drugs
Stocks of NMDA (100 mm; Sigma-Aldrich, Saint-Louis, MO, USA),AMPA (100 mm; Sigma), the D1R agonist SKF81297 (1 mm;Sigma), the D1R antagonist SCH23390 (10 mm; Sigma), the D2Ragonist quinpirole (10 mm; Sigma) and the D2R antagonist remox-ipride (10 mm; Tocris, Ellisville, MO, USA) were all dissolved inH2O. CTZ (10 mm; Sigma) was dissolved in 0.1% dimethylsulfoxide(DMSO) in 0.1 m NaOH. DA (Sigma) was prepared on the day of theexperiment, and 50 lm sodium metabisulfite (Sigma) was added toprevent oxidation. In addition, as DA drugs are light-sensitive,experiments were performed in the dark. The CB1R agonistWIN55,212-2 (10 mm; Sigma) and CB1R antagonist AM251(10 mm; Tocris) and the anandamide membrane transporter blockerVDM11 (10 mm; Sigma) were dissolved in DMSO.
Data analysis and statistics
In the text, values are presented as means ± SEM. Data analyses wereperformed with Origin (Microcal Software, Northampton, MA,USA), pClamp 8.2 and pClamp 10.2. Group means for all measureswere compared using Student’s t-tests (for two-group comparisons)and appropriately designed anovas followed by Bonferroni t-tests(multiple-group comparisons) using SigmaStat software (SPSS,Chicago, IL, USA). Differences were considered to be statisticallysignificant when P < 0.05. Spontaneous synaptic currents wereanalysed offline using the automatic detection protocol within theMini Analysis Program (Synaptosoft, Decatur, GA, USA) andsubsequently checked manually for accuracy. Event counts wereperformed blind to genotype. The threshold amplitude for thedetection of an event (5 pA) was set above the root mean squarebackground noise level (1–2 pA at a holding potential of )70 mV).Amplitude–frequency, cumulative-amplitude and cumulative-fre-quency histograms were constructed to evaluate differences in eventsat each amplitude.
Results
Membrane properties
In slices and acutely isolated neurons, membrane capacitance and timeconstant were significantly larger in D1 than in D2 cells (t151 = 3.69,P < 0.001 for dissociated cells; t102 = 2.12, P = 0.036 for slice),suggesting that D1 cells are larger than D2 cells. Indeed, measurementof cell somatic cross-sectional areas in acutely isolated neuronsshowed that D1 cells were larger than D2 cells (t111 = 2.98,P = 0.004; Table 1). In contrast, input resistance was smaller in D1cells (t150 = 2.49, P = 0.014 for dissociated cells; t102 = 3.18,P = 0.002 for slices), as previously reported (Gertler et al., 2008).High-voltage-activated Ca2+ currents induced by a depolarizing rampvoltage command ()80 to )10 mV) were similar in D1 and D2 cells(data not shown), confirming, in a larger sample, our previous findings(Cepeda et al., 2008).
Spontaneous excitatory postsynaptic currents (sEPSCs)
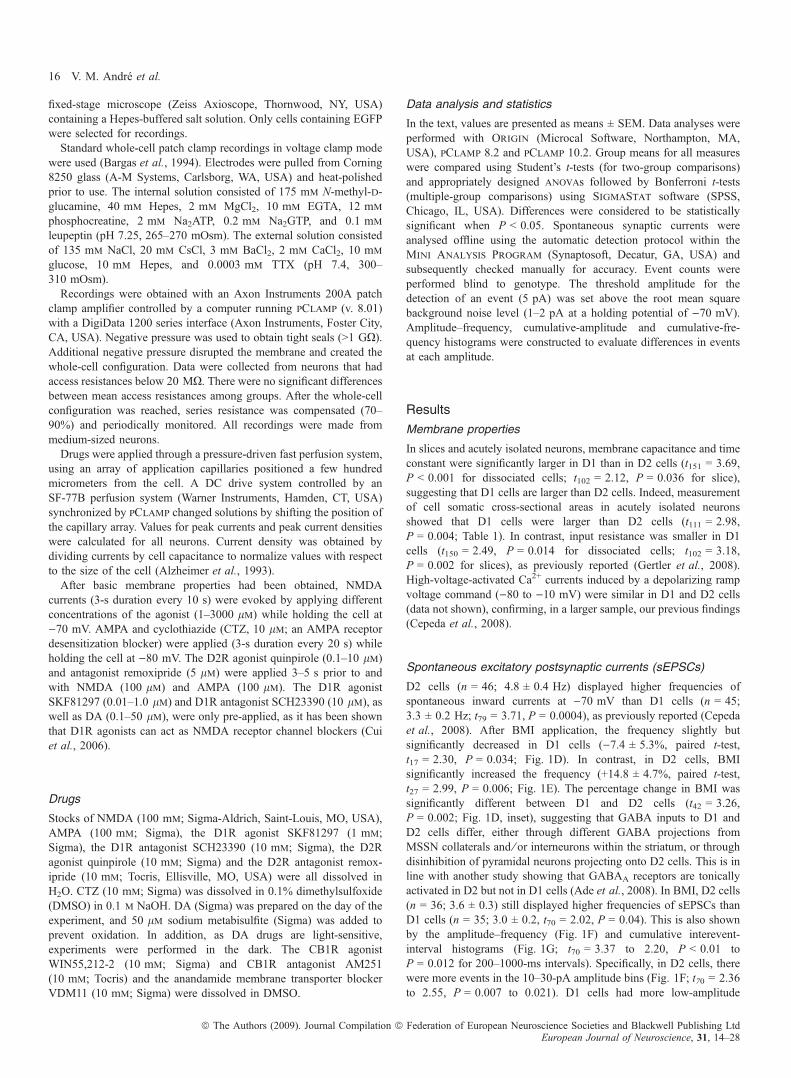
D2 cells (n = 46; 4.8 ± 0.4 Hz) displayed higher frequencies ofspontaneous inward currents at )70 mV than D1 cells (n = 45;3.3 ± 0.2 Hz; t79 = 3.71, P = 0.0004), as previously reported (Cepedaet al., 2008). After BMI application, the frequency slightly butsignificantly decreased in D1 cells ()7.4 ± 5.3%, paired t-test,t17 = 2.30, P = 0.034; Fig. 1D). In contrast, in D2 cells, BMIsignificantly increased the frequency (+14.8 ± 4.7%, paired t-test,t27 = 2.99, P = 0.006; Fig. 1E). The percentage change in BMI wassignificantly different between D1 and D2 cells (t42 = 3.26,P = 0.002; Fig. 1D, inset), suggesting that GABA inputs to D1 andD2 cells differ, either through different GABA projections fromMSSN collaterals and ⁄ or interneurons within the striatum, or throughdisinhibition of pyramidal neurons projecting onto D2 cells. This is inline with another study showing that GABAA receptors are tonicallyactivated in D2 but not in D1 cells (Ade et al., 2008). In BMI, D2 cells(n = 36; 3.6 ± 0.3) still displayed higher frequencies of sEPSCs thanD1 cells (n = 35; 3.0 ± 0.2, t70 = 2.02, P = 0.04). This is also shownby the amplitude–frequency (Fig. 1F) and cumulative interevent-interval histograms (Fig. 1G; t70 = 3.37 to 2.20, P < 0.01 toP = 0.012 for 200–1000-ms intervals). Specifically, in D2 cells, therewere more events in the 10–30-pA amplitude bins (Fig. 1F; t70 = 2.36to 2.55, P = 0.007 to 0.021). D1 cells had more low-amplitude
16 V. M. Andre et al.
ª The Authors (2009). Journal Compilation ª Federation of European Neuroscience Societies and Blackwell Publishing LtdEuropean Journal of Neuroscience, 31, 14–28
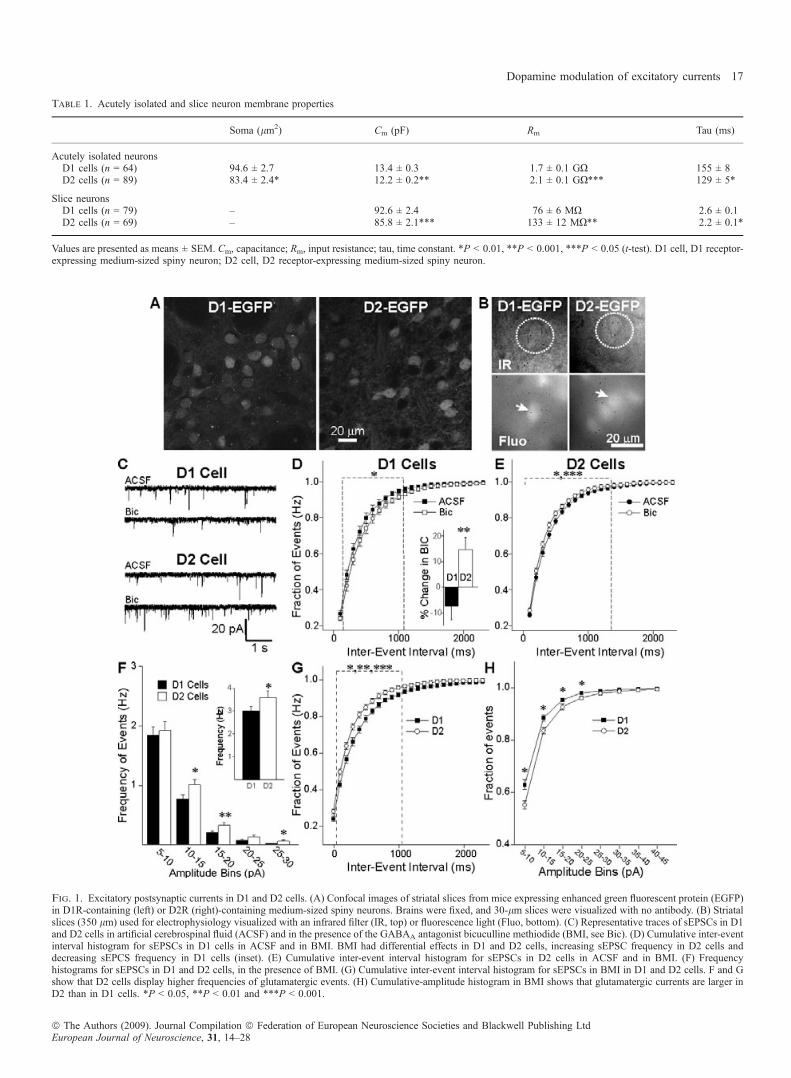
Fig. 1. Excitatory postsynaptic currents in D1 and D2 cells. (A) Confocal images of striatal slices from mice expressing enhanced green fluorescent protein (EGFP)in D1R-containing (left) or D2R (right)-containing medium-sized spiny neurons. Brains were fixed, and 30-lm slices were visualized with no antibody. (B) Striatalslices (350 lm) used for electrophysiology visualized with an infrared filter (IR, top) or fluorescence light (Fluo, bottom). (C) Representative traces of sEPSCs in D1and D2 cells in artificial cerebrospinal fluid (ACSF) and in the presence of the GABAA antagonist bicuculline methiodide (BMI, see Bic). (D) Cumulative inter-eventinterval histogram for sEPSCs in D1 cells in ACSF and in BMI. BMI had differential effects in D1 and D2 cells, increasing sEPSC frequency in D2 cells anddecreasing sEPCS frequency in D1 cells (inset). (E) Cumulative inter-event interval histogram for sEPSCs in D2 cells in ACSF and in BMI. (F) Frequencyhistograms for sEPSCs in D1 and D2 cells, in the presence of BMI. (G) Cumulative inter-event interval histogram for sEPSCs in BMI in D1 and D2 cells. F and Gshow that D2 cells display higher frequencies of glutamatergic events. (H) Cumulative-amplitude histogram in BMI shows that glutamatergic currents are larger inD2 than in D1 cells. *P < 0.05, **P < 0.01 and ***P < 0.001.
Table 1. Acutely isolated and slice neuron membrane properties
Soma (lm2) Cm (pF) Rm Tau (ms)
Acutely isolated neuronsD1 cells (n = 64) 94.6 ± 2.7 13.4 ± 0.3 1.7 ± 0.1 GX 155 ± 8D2 cells (n = 89) 83.4 ± 2.4* 12.2 ± 0.2** 2.1 ± 0.1 GX*** 129 ± 5*
Slice neuronsD1 cells (n = 79) – 92.6 ± 2.4 76 ± 6 MX 2.6 ± 0.1D2 cells (n = 69) – 85.8 ± 2.1*** 133 ± 12 MX** 2.2 ± 0.1*
Values are presented as means ± SEM. Cm, capacitance; Rm, input resistance; tau, time constant. *P < 0.01, **P < 0.001, ***P < 0.05 (t-test). D1 cell, D1 receptor-expressing medium-sized spiny neuron; D2 cell, D2 receptor-expressing medium-sized spiny neuron.
Dopamine modulation of excitatory currents 17
ª The Authors (2009). Journal Compilation ª Federation of European Neuroscience Societies and Blackwell Publishing LtdEuropean Journal of Neuroscience, 31, 14–28

glutamate currents, as demonstrated by the cumulative amplitudehistograms obtained in ACSF (not shown) and in BMI. There weresignificant differences for individual 5–30-pA bins (Fig. 1H;t70 = 2.70 to 2.04, P = 0.009 to 0.044).
Spontaneous EPSC modulation by DA, D1R agonists andD2R agonists in D1 cells in the presence of BMI
In D1 cells, 5 lm DA had no effect but 50 lm DA increased sEPSCfrequency in 11 of 15 cells (73%) and had no effect in four of 15 cells.The average increase in 50 lm DA (including cells showing noresponse) was 46.2 ± 18.3% (paired t-test, t14 = 2.77, P = 0.015; seetraces in Fig. 2, A1). Amplitude–frequency histograms showedsignificantly more events after DA application for 5–15-pA bins(Fig. 2, B1; paired t-test, t13 = 2.59, P = 0.022 for 5–10 pA, andt13 = 3.00 P = 0.01 for 10–15 pA) and cumulative inter-event intervalhistograms showed a significantly increased probability of release afterDA (Fig. 2, C1; t14 = 4.16 to 2.37, P = 0.002 to 0.037 for 200–1000-
ms intervals). In contrast, the cumulative-amplitude histogram wasunchanged by DA in D1 cells (data not shown). We then testedspecific D1R and D2R agonists to determine which DA receptorscontributed to the sEPSC frequency increase in D1 cells. The D1Ragonist SKF81297 (10 lm) increased sEPSC frequency by30.5 ± 5.7% (t17 = 5.86, P < 0.001; Fig. 2, A2), and 13 of 18 cells(72%) showed an increase with SKF81297, which corresponds to theproportion of D1 cells showing an increase with DA. Differences inamplitude–frequency histograms (Fig. 2, B2; t17 = 4.75 to 2.61,P = 0.0001 to 0.016 for 5–20-pA bins) and cumulative inter-eventinterval histograms (Fig. 2, C2; t17 = 5.31 to 2.31, P < 0.001 toP = 0.026 for 100–1600-ms intervals) suggest that SKF81297increased the probability of glutamate release. In contrast, thecumulative-amplitude histogram was unchanged by SKF81297 inD1 cells (data not shown). In the presence of the D2R agonistquinpirole (10 lm), only one cell (n = 8) showed a decrease in sEPSCfrequency ()19%). Amplitude–frequency and cumulative inter-eventinterval plots were similar before and after quinpirole in D1 cells
Fig. 2. Dopamine (DA) modulation of spontaneous excitatory postsynaptic currents (sEPSCs) in D1 cells in slices. (A) Representative traces of sEPSCs [inbicuculline methiodide (BMI, see Bic)] in control conditions and after application of each drug. (A1, B1 and C1) DA (50 lm) increased sEPSC frequency, as shownon the amplitude–frequency histogram and the cumulative inter-event interval histogram. (A2, B2 and C2) The D1R agonist SKF81297 (10 lm) also increasedsEPSC frequency. (A3, B3 and C3) The D2R agonist quinpirole (Quin; 10 lm) did not have any effect on sEPSC frequency in D1 cells. (A4, B4 and C4) The D1Rantagonist SCH23390 (10 lm) blocked the DA effect in D1 cells. Insets in B show mean sEPSC frequencies in control conditions and after bath application of eachdrug. *P < 0.05, **P < 0.01 and ***P < 0.001.
18 V. M. Andre et al.
ª The Authors (2009). Journal Compilation ª Federation of European Neuroscience Societies and Blackwell Publishing LtdEuropean Journal of Neuroscience, 31, 14–28
(Fig. 2, A3, B3 and C3). The average change in overall sEPSCfrequency after quinpirole in D1 cells was 3.3 ± 4.4% (t11 = 0.44,P = 0.66). In the presence of the D1 antagonist (SCH23390, 10 lm),DA (50 lm) did not induce any significant increase in sEPSCfrequency in D1 cells (n = 9; Fig. 2, A4, B4 and C4). Together, thesedata suggest that the increase in sEPSC frequency caused by DA in D1cells is due to selective activation of D1Rs.
Spontaneous EPSC modulation by DA, D1R agonists andD2R agonists in D2 cells in the presence of BMI
In D2 cells, 5 and 50 lm DA did not change sEPSC frequency.However, at 100 lm, DA decreased sEPSC frequency in seven of 11cells (63%) and had no effect in four of 11. The average decrease was)16.3 ± 3.8% (t10 = 3.07, P = 0.012; see traces in Fig. 3, A1).Amplitude–frequency histograms showed a significantly decreasedprobability after DA application (Fig. 3, B1). The cumulativedistribution showed significant differences for 100–1300-ms inter-event intervals (Fig. 3, C1; t10 = 3.77 to 2.27, P = 0.004 to 0.046).
The cumulative-amplitude plot was unchanged by DA (data notshown). We then tested specific D1R and D2R agonists to determinewhich DA receptors contribute to the decrease in sEPSC frequency.The D2R agonist quinpirole (10 lm) decreased sEPSC frequency by23.6 ± 5.4% (Fig. 3, A2; t13 = 5.34, P < 0.001). Nine of 14 cells(64%) showed a decrease with quinpirole, which corresponded to thesame proportion of D2 cells showing a decrease with DA. Differencesin cumulative inter-event interval histograms suggest that quinpiroledecreased glutamate release (Fig. 3, B2 and C2; t13 = 4.71 to 2.72,P < 0.001 to P = 0.018 for 100–1400-ms intervals). In contrast,the cumulative-amplitude histogram was unchanged by quinpirolein D2 cells (not shown). None of the D2 cells (n = 7) showedan increase in the presence of the D1R agonist SKF81297 (10 lm;Fig. 3, A3; t6 = 0.082, P = 0.93). Amplitude plots and cumulativeinter-event interval (Fig. 3, B3 and C3) were both unchanged in thepresence of SKF81297 in D2 cells. In the presence of the D2Rantagonist (remoxipride, 10 lm), DA (100 lm) did not induce anydecrease in sEPSC frequency in D2 cells (n = 8; Fig. 3, A4, B4 andC4; t7 = 1.46, P = 0.186). These data indicate that the decrease in
Fig. 3. Dopamine (DA) modulation of spontaneous excitatory postsynaptic currents (sEPSCs) in D1 cells in slices. (A) Representative traces of sEPSCs in controlconditions and after each drug. (A1, B1 and C1) DA (100 lm) decreased sEPSC frequency, as shown on the amplitude–frequency histogram and the cumulativeinter-event interval histogram. (A2, B2 and C2) The D2R agonist quinpirole (Quin; 10 lm) also decreased sEPSC frequency. (A3, B3 and C3) The D1R agonistSKF81297 (10 lm) did not have any effect on sEPSC frequency in D2 cells. (A4, B4 and C4) The D2R antagonist remoxipride (Rex; 10 lm) blocked the DA effectin D2 cells. Insets in B show mean frequencies in control conditions and after bath application of each drug. *P < 0.05, **P < 0.01 and ***P < 0.001. Bic,bicuculline methiodide.
Dopamine modulation of excitatory currents 19
ª The Authors (2009). Journal Compilation ª Federation of European Neuroscience Societies and Blackwell Publishing LtdEuropean Journal of Neuroscience, 31, 14–28
sEPSC frequency caused by DA in D2 cells is due to selectiveactivation of D2Rs.
D1R and D2R agonist effects on sEPSCs is actionpotential-dependent
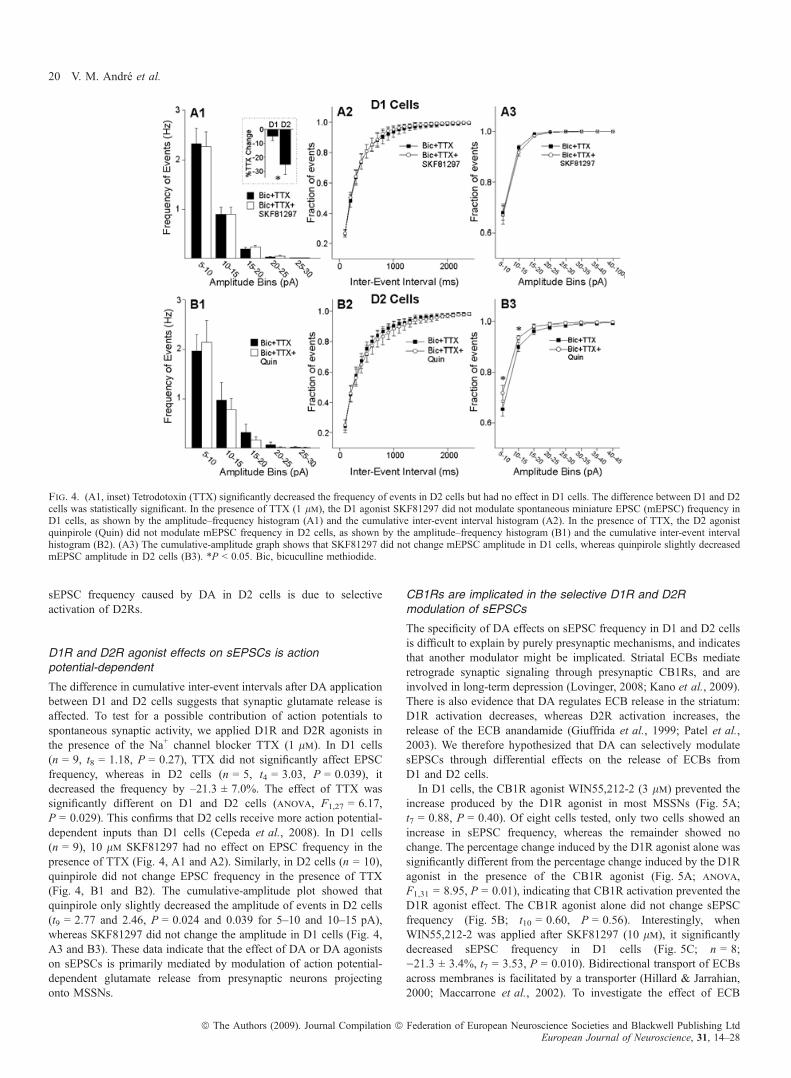
The difference in cumulative inter-event intervals after DA applicationbetween D1 and D2 cells suggests that synaptic glutamate release isaffected. To test for a possible contribution of action potentials tospontaneous synaptic activity, we applied D1R and D2R agonists inthe presence of the Na+ channel blocker TTX (1 lm). In D1 cells(n = 9, t8 = 1.18, P = 0.27), TTX did not significantly affect EPSCfrequency, whereas in D2 cells (n = 5, t4 = 3.03, P = 0.039), itdecreased the frequency by –21.3 ± 7.0%. The effect of TTX wassignificantly different on D1 and D2 cells (anova, F1,27 = 6.17,P = 0.029). This confirms that D2 cells receive more action potential-dependent inputs than D1 cells (Cepeda et al., 2008). In D1 cells(n = 9), 10 lm SKF81297 had no effect on EPSC frequency in thepresence of TTX (Fig. 4, A1 and A2). Similarly, in D2 cells (n = 10),quinpirole did not change EPSC frequency in the presence of TTX(Fig. 4, B1 and B2). The cumulative-amplitude plot showed thatquinpirole only slightly decreased the amplitude of events in D2 cells(t9 = 2.77 and 2.46, P = 0.024 and 0.039 for 5–10 and 10–15 pA),whereas SKF81297 did not change the amplitude in D1 cells (Fig. 4,A3 and B3). These data indicate that the effect of DA or DA agonistson sEPSCs is primarily mediated by modulation of action potential-dependent glutamate release from presynaptic neurons projectingonto MSSNs.
CB1Rs are implicated in the selective D1R and D2Rmodulation of sEPSCs
The specificity of DA effects on sEPSC frequency in D1 and D2 cellsis difficult to explain by purely presynaptic mechanisms, and indicatesthat another modulator might be implicated. Striatal ECBs mediateretrograde synaptic signaling through presynaptic CB1Rs, and areinvolved in long-term depression (Lovinger, 2008; Kano et al., 2009).There is also evidence that DA regulates ECB release in the striatum:D1R activation decreases, whereas D2R activation increases, therelease of the ECB anandamide (Giuffrida et al., 1999; Patel et al.,2003). We therefore hypothesized that DA can selectively modulatesEPSCs through differential effects on the release of ECBs fromD1 and D2 cells.In D1 cells, the CB1R agonist WIN55,212-2 (3 lm) prevented the
increase produced by the D1R agonist in most MSSNs (Fig. 5A;t7 = 0.88, P = 0.40). Of eight cells tested, only two cells showed anincrease in sEPSC frequency, whereas the remainder showed nochange. The percentage change induced by the D1R agonist alone wassignificantly different from the percentage change induced by the D1Ragonist in the presence of the CB1R agonist (Fig. 5A; anova,F1,31 = 8.95, P = 0.01), indicating that CB1R activation prevented theD1R agonist effect. The CB1R agonist alone did not change sEPSCfrequency (Fig. 5B; t10 = 0.60, P = 0.56). Interestingly, whenWIN55,212-2 was applied after SKF81297 (10 lm), it significantlydecreased sEPSC frequency in D1 cells (Fig. 5C; n = 8;)21.3 ± 3.4%, t7 = 3.53, P = 0.010). Bidirectional transport of ECBsacross membranes is facilitated by a transporter (Hillard & Jarrahian,2000; Maccarrone et al., 2002). To investigate the effect of ECB
Fig. 4. (A1, inset) Tetrodotoxin (TTX) significantly decreased the frequency of events in D2 cells but had no effect in D1 cells. The difference between D1 and D2cells was statistically significant. In the presence of TTX (1 lm), the D1 agonist SKF81297 did not modulate spontaneous miniature EPSC (mEPSC) frequency inD1 cells, as shown by the amplitude–frequency histogram (A1) and the cumulative inter-event interval histogram (A2). In the presence of TTX, the D2 agonistquinpirole (Quin) did not modulate mEPSC frequency in D2 cells, as shown by the amplitude–frequency histogram (B1) and the cumulative inter-event intervalhistogram (B2). (A3) The cumulative-amplitude graph shows that SKF81297 did not change mEPSC amplitude in D1 cells, whereas quinpirole slightly decreasedmEPSC amplitude in D2 cells (B3). *P < 0.05. Bic, bicuculline methiodide.
20 V. M. Andre et al.
ª The Authors (2009). Journal Compilation ª Federation of European Neuroscience Societies and Blackwell Publishing LtdEuropean Journal of Neuroscience, 31, 14–28
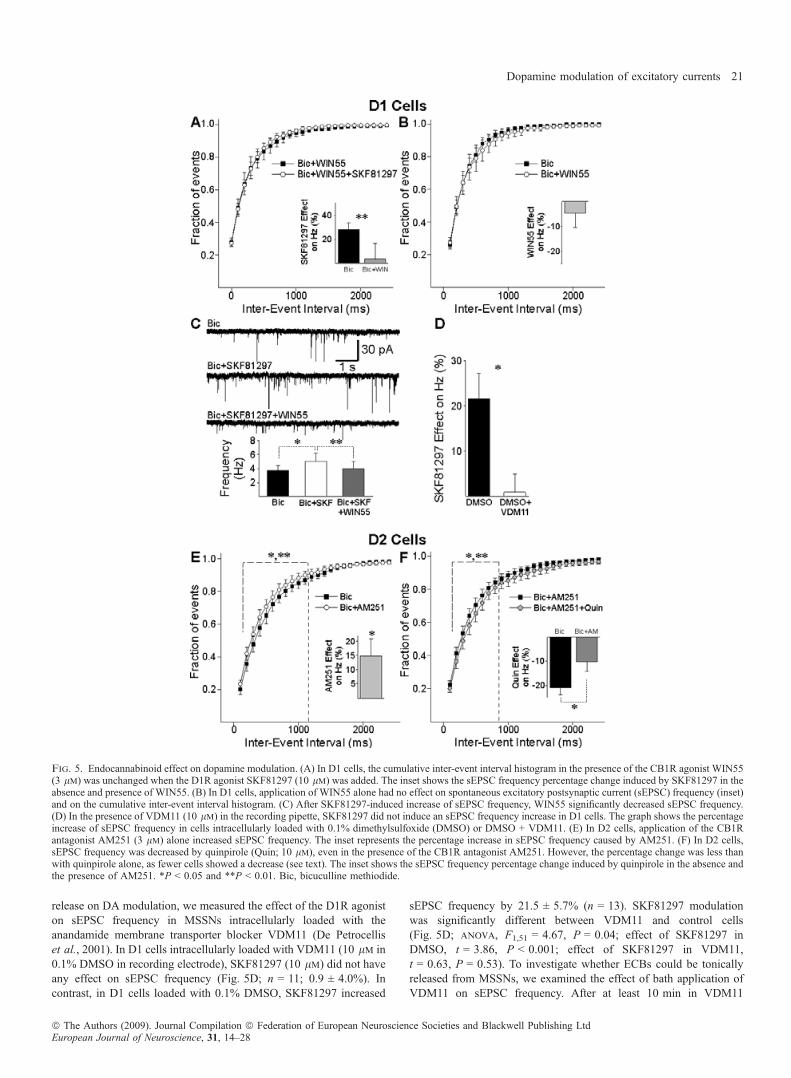
release on DA modulation, we measured the effect of the D1R agoniston sEPSC frequency in MSSNs intracellularly loaded with theanandamide membrane transporter blocker VDM11 (De Petrocelliset al., 2001). In D1 cells intracellularly loaded with VDM11 (10 lm in0.1% DMSO in recording electrode), SKF81297 (10 lm) did not haveany effect on sEPSC frequency (Fig. 5D; n = 11; 0.9 ± 4.0%). Incontrast, in D1 cells loaded with 0.1% DMSO, SKF81297 increased
sEPSC frequency by 21.5 ± 5.7% (n = 13). SKF81297 modulationwas significantly different between VDM11 and control cells(Fig. 5D; anova, F1,51 = 4.67, P = 0.04; effect of SKF81297 inDMSO, t = 3.86, P < 0.001; effect of SKF81297 in VDM11,t = 0.63, P = 0.53). To investigate whether ECBs could be tonicallyreleased from MSSNs, we examined the effect of bath application ofVDM11 on sEPSC frequency. After at least 10 min in VDM11
Fig. 5. Endocannabinoid effect on dopamine modulation. (A) In D1 cells, the cumulative inter-event interval histogram in the presence of the CB1R agonist WIN55(3 lm) was unchanged when the D1R agonist SKF81297 (10 lm) was added. The inset shows the sEPSC frequency percentage change induced by SKF81297 in theabsence and presence of WIN55. (B) In D1 cells, application of WIN55 alone had no effect on spontaneous excitatory postsynaptic current (sEPSC) frequency (inset)and on the cumulative inter-event interval histogram. (C) After SKF81297-induced increase of sEPSC frequency, WIN55 significantly decreased sEPSC frequency.(D) In the presence of VDM11 (10 lm) in the recording pipette, SKF81297 did not induce an sEPSC frequency increase in D1 cells. The graph shows the percentageincrease of sEPSC frequency in cells intracellularly loaded with 0.1% dimethylsulfoxide (DMSO) or DMSO + VDM11. (E) In D2 cells, application of the CB1Rantagonist AM251 (3 lm) alone increased sEPSC frequency. The inset represents the percentage increase in sEPSC frequency caused by AM251. (F) In D2 cells,sEPSC frequency was decreased by quinpirole (Quin; 10 lm), even in the presence of the CB1R antagonist AM251. However, the percentage change was less thanwith quinpirole alone, as fewer cells showed a decrease (see text). The inset shows the sEPSC frequency percentage change induced by quinpirole in the absence andthe presence of AM251. *P < 0.05 and **P < 0.01. Bic, bicuculline methiodide.
Dopamine modulation of excitatory currents 21
ª The Authors (2009). Journal Compilation ª Federation of European Neuroscience Societies and Blackwell Publishing LtdEuropean Journal of Neuroscience, 31, 14–28

(5 lm), sEPSC frequency in D1 cells was significantly increased, by28.3 ± 14.9% (n = 7; t6 = 3.76, P = 0.009).In D2 cells, the CB1R antagonist AM251 (3 lm) increased sEPSC
frequency by 14.9 ± 6.0% (n = 11; Fig. 5E; t10 = 2.79, P = 0.021),further indicating that CB1Rs are tonically activated. In contrast to theeffect produced by the CB1R agonist in D1 cells, the CB1R antagonistdid not completely prevent the D2R agonist-mediated decrease insEPSC frequency in D2 cells (five of 11; Fig. 5F; t10 = 2.29,P = 0.045). The cumulative inter-event interval histogram showedsignificant differences for intervals from 200 to 800 ms (Fig. 5F;t10 = 3.53 to 2.29; P = 0.009 to 0.032). However, the percentagedecrease of sEPSC frequency induced by the D2R agonist quinpirolewas larger in the absence ()23.6 ± 5.4%) than in the presence of theCB1R antagonist ()12.1 ± 3.8%; Fig. 5F; anova, F1,53 = 4.99,P = 0.035), and fewer cells were modulated by quinpirole in thepresence of the CB1R antagonist (45%) than by quinpirole alone(64%, v2 = 33.51, n = 50, P = 0.005), indicating that the CB1Rantagonist partially prevented the effect of quinpirole. Fig. 6summarizes the pharmacology of DA modulation of sEPSCs in D1and D2 cells in slices.
DA modulation of NMDA currents in isolated D1 and D2 cells
As the cell-specific effects of DA on excitatory synaptic activityrequires differential modulation of postsynaptic MSSNs, we testedwhether DA also had distinct actions on D1 and D2 cells. Althoughwe previously demonstrated that DA enhances glutamate receptor-mediated currents via D1Rs, whereas it reduces them via D2Rs(Cepeda et al., 1993), the cell-type specificity of this modulation hasnever been demonstrated electrophysiologically.Modulation of NMDA currents (100 lm) by the D1R agonist
SKF81297 (0.01, 0.1 and 1 lm) was assessed in D1 cells (n = 17) andD2 cells (n = 20) (Fig. 7A). SKF81297 (0.1 lm, t = 3.13, P = 0.008;1 lm, t = 9.98, P < 0.001) dose-dependently and reversibly increasedNMDA currents in all D1 cells but not in D2 cells (anova, effect of
SKF81297 concentration, F2,111 = 37.96, P < 0.001). The increaseinduced by 1 lm SKF81297 was completely blocked by the D1Rantagonist SCH23390 (Fig. 7A; n = 4; paired t-test, t3 = 4.07,P = 0.027). In D2 cells, the low concentrations of SKF81297 (0.01and 0.1 lm) did not significantly modulate NMDA currents (Fig. 7A).At the highest concentration (1 lm SKF81297), 25% of D2 cells (fiveof 20) showed a significant increase (18.5 ± 1.3%; t4 = 11.29,P < 0.001).Modulation of NMDA currents (100 lm) by the D2R agonist
quinpirole (0.1, 1 and 10 lm) was tested in D1 cells (n = 17) and D2cells (n = 10) (Fig. 7B). Quinpirole (10 lm; t = 7.28, P < 0.001)reversibly decreased NMDA currents in all D2 cells, but not in D1cells (anova, effect of quinpirole concentration, F3,93 = 25.53,P < 0.001). The effects of quinpirole (10 lm) were partially blockedby remoxipride (5 lm), a D2R antagonist (Fig. 7B; n = 4; t3 = 4.52,P = 0.02). Quinpirole did not have a significant effect on D1 cells atlow concentrations (t = 1.79, P = 0.46 for 0.1 lm; t = 2.6, P = 0.069for 1 lm). At 10 lm, quinpirole decreased NMDA currents in D1cells, although the average decrease was not statistically significant. Atthis concentration, 29% of the D1 cells (five of 17) showed asignificant reduction ()20.6 ± 0.9%).Modulation of NMDA currents (100 lm) by DA (0.1, 1, 10 and
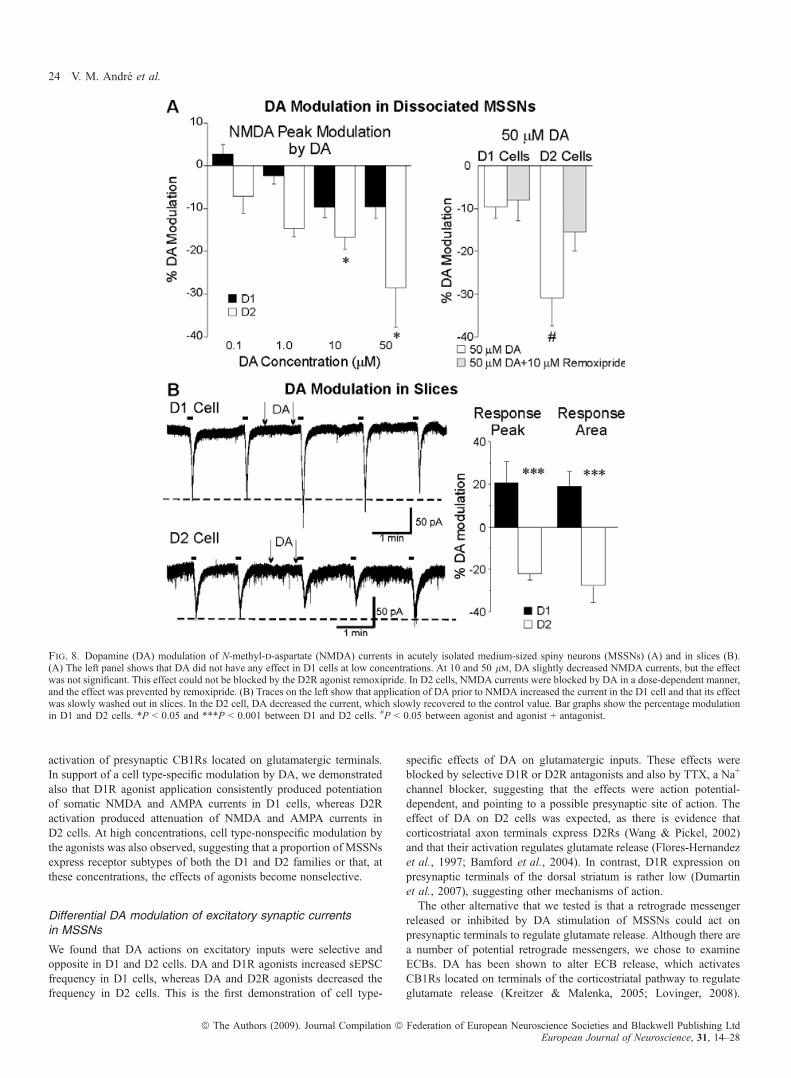
50 lm) was tested in D1 cells (n = 23) and D2 cells (n = 12)(Fig. 8A). DA did not significantly modulate NMDA currents in D1cells, whereas it decreased them in D2 cells (anova, effect of DAconcentration, F4,96 = 4.19, P = 0.005). In D2 cells, 10 and 50 lm
DA reversibly decreased NMDA currents (Bonferroni t-test, t = 3.26,P = 0.019 for 10 lm, and t = 2.92, P = 0.049 for 50 lm). This effectcould be partially blocked by remoxipride (n = 4) (Fig. 8A), suggest-ing that DA decreases NMDA currents via D2Rs in D2 cells.
DA modulation of postsynaptic NMDA currents in slices
As DA could reproduce the effect observed with the D2R agonist inD2 cells, but not the effect of the D1R agonist (increase in NMDAcurrents) in D1 cells, we performed the same experiments in slices, inwhich the distal processes (possibly containing the highest density ofD1Rs) are more intact, and the use of enzymes that could compromisethe integrity of D1Rs is not required. In slices, iontophoreticapplication of DA prior to NMDA had opposite effects on D1 andD2 cells. In D1 cells, DA induced increases in NMDA peak currents(21.0 ± 7.8%, t5 = 3.23, P = 0.018) and response areas (19.2 ± 6.9%,t5 = 3.94, P = 0.008) (Fig. 8B). This increase was observed in five ofsix cells, whereas one cell showed a slight decrease (<10%). In D2cells, iontophoretic application of DA induced decreases in NMDAcurrents in six of six cells. Average changes for peak currents()22.1 ± 3.0%, t5 = 15.41, P < 0.001) and area ()28.2 ± 8.3%,t5 = 2.78, P = 0.039) in D2 cells were significantly different fromchanges in D1 cells (anova, F1,25 = 24.23, P < 0.001).
D1R and D2R agonist modulation of AMPA currentsin isolated cells
Modulation of AMPA (100 lm) plus CTZ (10 lm) currents by theD1R agonist SKF81297 (1 and 10 lm) was tested in D1 (n = 6) andD2 (n = 6) acutely isolated cells (Fig. 9). Repeated exposure toAMPA induced currents that desensitized with time and repeatedapplications. In D1 cells, the D1R agonist did not increase AMPAcurrents, but prevented rundown (Fig. 9A and B; anova, effect ofSKF81297 · application, F18,158 = 5.05, P < 0.001; effect of 1 lm
SKF81297 significant from applications 4 to 7, t = 3.52 to 2.78,
Fig. 6. (A) Graph summarizing the percentage change in spontaneousexcitatory postsynaptic current (EPSC) frequency in D1 cells in the presenceof dopamine (DA) and different modulators. DA or SKF81297 significantlyincreased the frequency, whereas tetrodotoxin (TTX) + SKF81297, quinpirole(Quin), SCH23390 + DA or WIN55 + SKF81297 did not have any effect.(B) Graph summarizing the percentage change in sEPSC mean frequency in D2cells in the presence of DA and different modulators. DA or quinpirolesignificantly decreased the frequency, whereas TTX + quinpirole, SKF81297or remoxipride (Rex) + DA did not have any effect. AM251 + quinpirole alsosignificantly decreased sEPSC frequency, but to a lesser extent than quinpirolealone. *P < 0.05, and ***P < 0.001.
22 V. M. Andre et al.
ª The Authors (2009). Journal Compilation ª Federation of European Neuroscience Societies and Blackwell Publishing LtdEuropean Journal of Neuroscience, 31, 14–28

P = 0.004 to 0.027; effect of 10 lm SKF81297 significant fromapplications 4 to 10, t = 4.99 to 3.93, P < 0.001 to P = 0.001), asreported previously (Yan et al., 1999). In the presence of the D1Rantagonist SCH23390, rundown occurred (n = 4, anova, effect ofSKF81297 + SCH23390 · application, F7,71 = 0.37, P = 0.91), con-firming that this effect was mediated by D1Rs. In D2 cells, the D1Ragonist did not prevent AMPA current rundown (Fig. 9C).
Modulation of AMPA (100 lm) plus CTZ (10 lm) currents by theD2R agonist quinpirole (10 lm) was tested in D1 cells (n = 8) and D2cells (n = 12). In D1 cells, the D2R agonist did not have any effect onAMPA rundown (Fig. 9E). In D2 cells, the D2R agonist enhanced therundown (anova, effect of quinpirole · application, F9,228 = 4.78,P < 0.001; effect of quinpirole significant from applications 4 to 10,t = 3.7 to 2.67, P < 0.001 to P = 0.009). This effect was prevented bythe D2R antagonist sulpiride (Fig. 9F; n = 3).
Discussion
The principal finding of the present study was the unexpected celltype-specific modulation by DA of spontaneous excitatory synapticinputs onto striatal MSSNs. DA and D1R agonists increased, whereasDA and D2R agonists decreased, EPSC frequency in D1 cells and D2cells, respectively. This opposite modulation was action potential-dependent, as TTX abolished these effects. In addition, the increase insEPSC frequency by DA and D1R agonists was completely abolishedby a CB1R agonist and by an ECB transporter blocker in D1 cells,whereas the decrease in sEPSC frequency was partially abolished by aCB1R antagonist in D2 cells, indicating that ECBs contribute to DA’sdifferential effects on sEPSC frequency. The mechanism by which DAand its selective agonists produce these effects is probably via oppositeactions by D1Rs and D2Rs on ECB release from MSSNs and
Fig. 7. Dopamine receptor agonist modulation of N-methyl-d-aspartate (NMDA) currents in acutely isolated medium-sized spiny neurons. (A) The D1 agonistSKF81297 (0.1 and 1.0 lm) potentiated NMDA currents in all D1 cells. The effect was dose-dependent and blocked by the D1R antagonist SCH23390. In D2 cells,SKF81297 did not significantly increase NMDA currents at any concentration. (B) The D2R agonist quinpirole (Quin) did not have any effect in D1 cells at lowconcentrations. At 10 lm, quinpirole induced a slight decrease (29% of the D1 cells showed a significant decrease; see Results). In D2 cells, quinpirole (10 lm)decreased NMDA currents. The effect was blocked by the D2R antagonist remoxipride (Remx). **P < 0.01 and ***P < 0.001 indicate a significant effect of theD1R or D2R agonist. #P < 0.05 between agonist and agonist + antagonist. Vh, holding potential.
Dopamine modulation of excitatory currents 23
ª The Authors (2009). Journal Compilation ª Federation of European Neuroscience Societies and Blackwell Publishing LtdEuropean Journal of Neuroscience, 31, 14–28
activation of presynaptic CB1Rs located on glutamatergic terminals.In support of a cell type-specific modulation by DA, we demonstratedalso that D1R agonist application consistently produced potentiationof somatic NMDA and AMPA currents in D1 cells, whereas D2Ractivation produced attenuation of NMDA and AMPA currents inD2 cells. At high concentrations, cell type-nonspecific modulation bythe agonists was also observed, suggesting that a proportion of MSSNsexpress receptor subtypes of both the D1 and D2 families or that, atthese concentrations, the effects of agonists become nonselective.
Differential DA modulation of excitatory synaptic currentsin MSSNs
We found that DA actions on excitatory inputs were selective andopposite in D1 and D2 cells. DA and D1R agonists increased sEPSCfrequency in D1 cells, whereas DA and D2R agonists decreased thefrequency in D2 cells. This is the first demonstration of cell type-
specific effects of DA on glutamatergic inputs. These effects wereblocked by selective D1R or D2R antagonists and also by TTX, a Na+
channel blocker, suggesting that the effects were action potential-dependent, and pointing to a possible presynaptic site of action. Theeffect of DA on D2 cells was expected, as there is evidence thatcorticostriatal axon terminals express D2Rs (Wang & Pickel, 2002)and that their activation regulates glutamate release (Flores-Hernandezet al., 1997; Bamford et al., 2004). In contrast, D1R expression onpresynaptic terminals of the dorsal striatum is rather low (Dumartinet al., 2007), suggesting other mechanisms of action.The other alternative that we tested is that a retrograde messenger
released or inhibited by DA stimulation of MSSNs could act onpresynaptic terminals to regulate glutamate release. Although there area number of potential retrograde messengers, we chose to examineECBs. DA has been shown to alter ECB release, which activatesCB1Rs located on terminals of the corticostriatal pathway to regulateglutamate release (Kreitzer & Malenka, 2005; Lovinger, 2008).
Fig. 8. Dopamine (DA) modulation of N-methyl-d-aspartate (NMDA) currents in acutely isolated medium-sized spiny neurons (MSSNs) (A) and in slices (B).(A) The left panel shows that DA did not have any effect in D1 cells at low concentrations. At 10 and 50 lm, DA slightly decreased NMDA currents, but the effectwas not significant. This effect could not be blocked by the D2R agonist remoxipride. In D2 cells, NMDA currents were blocked by DA in a dose-dependent manner,and the effect was prevented by remoxipride. (B) Traces on the left show that application of DA prior to NMDA increased the current in the D1 cell and that its effectwas slowly washed out in slices. In the D2 cell, DA decreased the current, which slowly recovered to the control value. Bar graphs show the percentage modulationin D1 and D2 cells. *P < 0.05 and ***P < 0.001 between D1 and D2 cells. #P < 0.05 between agonist and agonist + antagonist.
24 V. M. Andre et al.
ª The Authors (2009). Journal Compilation ª Federation of European Neuroscience Societies and Blackwell Publishing LtdEuropean Journal of Neuroscience, 31, 14–28

Fig. 9. Effect of the dopamine agonists on a-amino-3-hydroxy-5-methyl-4-isoxazolepropionic acid (AMPA) (100 lm) plus cyclothiazide (10 lm) currents inacutely isolated medium-sized spiny neurons (MSSNs). (A) Traces show that in a D1 cell, AMPA currents run down with time in control conditions. Application ofSKF81297 prevented the rundown. In the presence of the D1R antagonist SCH23390, the rundown occurred. (B) Graph showing that AMPA rundown in D1 cellswas dose-dependently prevented by SKF81297. This effect was blocked by SCH23390. (C) In D2 cells, AMPA rundown was not prevented by any concentrationof SKF81297. #P < 0.05 between control and 1 lm SKF81297. *P < 0.05 between control and 10 lm SKF81297. *P < 0.05 between 1 lm SKF81297 and 1 lm
SKF81297 plus 10 lm SCH23390. (D) Traces show that in a D2 cell, AMPA currents run down with time in control conditions. Application of quinpirole decreasedAMPA currents, increasing the rundown. In the presence of the D2R antagonist sulpiride, the decrease in AMPA currents was prevented. (E) Graph showing thatAMPA rundown in D1 cells was not changed by quinpirole. (F) In D2 cells, AMPA rundown was increased by quinpirole. Quinpirole’s effect was blocked bysulpiride. The rundown in the presence of sulpiride and quinpirole was not significantly different from the control rundown. *P < 0.05 between control and 10 lm
quinpirole. *P < 0.05 between 10 lm quinpirole and 10 lm quinpirole plus 10 lm sulpiride.
Dopamine modulation of excitatory currents 25
ª The Authors (2009). Journal Compilation ª Federation of European Neuroscience Societies and Blackwell Publishing LtdEuropean Journal of Neuroscience, 31, 14–28
Importantly, D1R activation decreases the release of the ECBanandamide, whereas D2R activation increases it (Giuffrida et al.,1999; Patel et al., 2003). Furthermore, it has been demonstratedrecently that neuronal firing regulates ECB release and synapticplasticity in MSSNs (Adermark et al., 2009). We therefore hypoth-esized that DA differentially modulates sEPSCs by controlling therelease of ECBs from D1 and D2 cells.We have demonstrated ECB involvement in the DA-modulated
increase in glutamate transmission in D1 cells, as the increase insEPSC frequency caused by the D1R agonist was prevented by aCB1R agonist. Although CB1R activation normally decreases neuro-transmitter release [for review see Kano et al. (2009)], the agonistalone did not significantly change sEPSC frequency in D1 cells,whereas it decreased it after the D1R agonist-induced effect. This is inline with previous studies in MSSNs showing that presynaptic and ⁄ orpostsynaptic activity is required for ECB-induced long-term depres-sion (Adermark & Lovinger, 2007; Singla et al., 2007). It could alsosuggest that there is tonic release of ECBs in the striatum as describedin other brain structures (Hentges et al., 2005; Neu et al., 2007) andthat ambient ECBs stimulate CB1Rs under normal conditions in slices.It is possible that the initial D1R activation decreases ECB releasefrom MSSNs, and that subsequent application of the CB1R agoniststimulates presynaptic CB1Rs, which would explain the decrease infrequency. In our experiments, blocking ECB release by bathapplication of VDM11, a blocker of the ECB membrane transporter,increased sEPSC frequency, indicating that ECBs are tonicallyreleased and that ambient ECBs activate CB1Rs in the striatum.Also, blocking the postsynaptic release of ECBs by postsynapticloading of VDM11 prevented the D1R agonist-induced increase insEPSC frequency, indicating ECB involvement in the DA-modulatedincrease in glutamate transmission in D1 cells.In D2 cells, the CB1R antagonist did not block the effect of the D2R
agonist in all cells, probably because presynaptic D2R activation alsodecreases glutamate release from corticostriatal terminals (Bamfordet al., 2004). However, the CB1R antagonist still significantly blockedthe D2R agonist effect on sEPSC frequency, indicating the involvementof CB1Rs in the regulation of glutamate release onto D2 cells.Application of the CB1R antagonist AM251 alone significantlyincreased sEPSC frequency in D2 cells, again suggesting that ECBstonically activate CB1Rs in the striatum. Here, we showed that DAdecreased sEPSC frequency in D2 cells only, which agrees with datashowing that long-term depression could be induced in cells of theindirect pathway only (Kreitzer & Malenka, 2007).
Differential DA modulation of postsynaptic currents in MSSNs
In isolated cells, modulation of NMDA and AMPA currents by D1Rand D2R agonists was specific to the D1R or D2R population,suggesting that D1Rs and D2Rs are segregated in those cells.However, in 25–30% of cells, higher concentrations of D1R or D2Ragonists had effects in cells that did not express the correspondingreceptor, suggesting that some co-localization exists. Previous studiesdemonstrated that only 5–7% of MSSNs co-localize D1R and D2RmRNA or protein (Deng et al., 2006; Lobo et al., 2006; Bertran-Gonzalez et al., 2008; Cepeda et al., 2008). The present findings thata larger population of cells functionally respond to both D1R and D2Ragonists suggests that a larger proportion of D1 and D2 cells mightalso express D3Rs, D4Rs and D5Rs, as shown previously (Surmeieret al., 1996). Another interpretation could be that D1R and D2Ragonists lose their specificity at high concentrations.Activation of D1Rs produced a consistent potentiation of postsyn-
aptic NMDA (peak amplitude) and AMPA (block of rundown) currents
in all D1 cells, in line with previous findings (Galarraga et al., 1997;Cepeda et al., 1998; Yan et al., 1999; Flores-Hernandez et al., 2002).Activation of D2Rs also produced a consistent effect, which was areduction in NMDA and AMPA currents in all D2 cells. Our resultsdiffer from those of studies reporting only a decreasing effect or no effectof DA or its agonists on NMDA currents (Calabresi et al., 1995; Nicola&Malenka, 1998; Lin et al., 2003). Besidesmethodological differences(Cepeda & Levine, 1998), it is possible that those studies failed toobserve enhancement of NMDAcurrents because amixed population ofMSSNs was examined. Furthermore, recent studies have shown that,under certain conditions, DA and D1R agonists can decrease NMDAcurrents by directly binding to the NMDA receptor (Cui et al., 2006).Although DA decreased NMDA currents in isolated D2 cells, we
were unable to demonstrate the potentiating effect of DA in D1neurons. However, DA reproduced the D1R effect (increase in NMDAcurrents) in D1 cells in slices. One of the differences betweendissociated cells and cells in slices is the presence of an extensivedendritic tree. Acutely isolated cells have most of their dendritesremoved. However, the lack of effect of DA in dissociated D1 cells isnot likely to be entirely due to dendritic receptor loss, as we obtainedthe D1R effect very consistently with the D1R agonist SKF81297.Some enzymes compromise receptor structure during the isolationprocedure (Akaike et al., 1988). One possibility is that the enzymeused to digest tissue partially alters the D1R structure, so that DA doesnot effectively bind, but the D1R agonist is still capable of binding tothe DA receptor. SKF81297 has a higher affinity and a greater abilityto activate adenylate cyclase than DA (Ryman-Rasmussen et al.,2005), which could explain why it is able to bind to the D1R andproduce effects, and DA is not.
Conclusions
Our data show that DA modulates striatal glutamate transmissionthrough a combination of DA receptor activation at the presynapticand postsynaptic levels and through release of ECBs. Our results alsosupport the hypothesis that striatonigral and striatopallidal MSSNsreceive distinct glutamatergic inputs and that corticostriatal terminalsprojecting to D1 and D2 MSSNs are differentially modulated by DA.Postsynaptically, the primary conclusion is that the direction of DAmodulation of glutamate receptor-mediated responses in MSSNs isdictated by the DA receptor most abundantly expressed in that cell.Presynaptically, the direction of DA modulation is also dictated by theDA receptor primarily expressed by the postsynaptic cell, but themechanism of action is indirect, as it requires ECB release. Thesefindings could help to explain the different mechanisms of plasticityobserved in direct and indirect pathways contributing to striatal outputand basal ganglia function.
Acknowledgement
This work was supported by USPHS Grant NS33538.
Abbreviations
ACSF, artificial cerebrospinal fluid; AMPA, a-amino-3-hydroxy-5-methyl-4-isoxazolepropionic acid; BMI, bicuculline methiodide; CB1R, cannabinoid 1receptor; CTZ, cyclothiazide; DA, dopamine; D1 cell, D1 receptor-expressingmedium-sized spiny neuron; D2 cell, D2 receptor-expressing medium-sizedspiny neuron; DMSO, dimethylsulfoxide; D1R, dopamine D1 receptor; D2R,dopamine D2 receptor; ECB, endocannabinoid; EGFP, enhanced greenfluorescent protein; MSSN, medium-sized spiny neuron; NMDA, N-methyl-d-aspartate; sEPSC, spontaneous excitatory postsynaptic current; TTX, tetrodo-toxin.
26 V. M. Andre et al.
ª The Authors (2009). Journal Compilation ª Federation of European Neuroscience Societies and Blackwell Publishing LtdEuropean Journal of Neuroscience, 31, 14–28
References
Ade, K.K., Janssen, M.J., Ortinski, P.I. & Vicini, S. (2008) Differential tonicGABA conductances in striatal medium spiny neurons. J. Neurosci., 28,1185–1197.
Adermark, L. & Lovinger, D.M. (2007) Retrograde endocannabinoid signalingat striatal synapses requires a regulated postsynaptic release step. Proc. NatlAcad. Sci. USA, 104, 20564–20569.
Ademark, L., Talani, G. & Lovinger, D.M. (2009) Endocannabinoid-dependentplasticity at GABAergic and glutamatergic synapses in the striatum isregulated by synaptic activity. Eur. J. Neurosci., 29, 32–41.
Aizman, O., Brismar, H., Uhlen, P., Zettergren, E., Levey, A.I., Forssberg, H.,Greengard, P. & Aperia, A. (2000) Anatomical and physiological evidencefor D1 and D2 dopamine receptor colocalization in neostriatal neurons. Nat.Neurosci., 3, 226–230.
Akaike, N., Kaneda, M., Hori, N. & Krishtal, O.A. (1988) Blockade ofN-methyl-D-aspartate response in enzyme-treated rat hippocampal neurons.Neurosci. Lett., 87, 75–79.
Albin, R.L., Young, A.B. & Penney, J.B. (1989) The functional anatomy ofbasal ganglia disorders. Trends Neurosci., 12, 366–375.
Alzheimer, C., Scgwindt, P.C. & Gill, W.E. (1993) Postnantal development of apersistent Na+ current in pyramidal neurons from sensorimotor cortex.J. Neurophysiol., 69, 290–292.
Andre, V.M., Cepeda, C., Lobo, M.K., Yamazaki, I., Yang, X.W. & Levine,M.S. (2006) Differential AMPA receptor function in genetically definedmedium-sized spiny striatal neurons. Soc. Neurosci. Abstr., 56, 10.
Bamford, N.S., Robinson, S., Palmiter, R.D., Joyce, J.A., Moore, C. & Meshul,C.K. (2004) Dopamine modulates release from corticostriatal terminals.J. Neurosci., 24, 9541–9552.
Bargas, J., Howe, A., Eberwine, J., Cao, Y. & Surmeier, D.J. (1994) Cellularand molecular characterization of Ca2+ currents in acutely dissociated, adultrat neostriatal neurons. J. Neurosci., 14, 6667–6686.
Bertran-Gonzalez, J., Bosch, C., Maroteaux, M., Matamales, M., Herve, D.,Valjent, E. & Girault, J.A. (2008) Opposing patterns of signaling activationin dopamine D1 and D2 receptor-expressing striatal neurons in response tococaine and haloperidol. J. Neurosci., 28, 5671–5685.
Calabresi, P., De Murtas, M., Pisani, A., Stefani, A., Sancesario, G., Mercuri,N.B. & Bernardi, G. (1995) Vulnerability of medium spiny striatal neurons toglutamate: role of Na+ ⁄ K+ ATPase. Eur. J. Neurosci., 7, 1674–1683.
Cepeda, C. & Levine, M.S. (1998) Dopamine and N-methyl-D-aspartatereceptor interactions in the neostriatum. Dev. Neurosci., 20, 1–18.
Cepeda, C., Buchwald, N.A. & Levine, M.S. (1993) Neuromodulatory actionsof dopamine in the neostriatum are dependent upon the excitatory aminoacid receptor subtypes activated. Proc. Natl Acad. Sci. USA, 90, 9576–9580.
Cepeda, C., Colwell, C.S., Itri, J.N., Chandler, S.H. & Levine, M.S. (1998)Dopaminergic modulation of NMDA-induced whole cell currents in neo-striatal neurons in slices: contribution of calcium conductances. J. Neuro-physiol., 79, 82–94.
Cepeda, C., Andre, V.M., Yamazaki, I., Wu, N., Kleiman-Weiner, M. & Levine,M.S. (2008) Differential electrophysiological properties of dopamine D1 andD2 receptor-containing striatal medium-sized spiny neurons. Eur. J. Neuro-sci., 27, 671–682.
Chen, G., Greengard, P. & Yan, Z. (2004) Potentiation of NMDA receptorcurrents by dopamine D1 receptors in prefrontal cortex. Proc. Natl Acad. Sci.USA, 101, 2596–2600.
Cui, C., Xu, M. & Atzori, M. (2006) Voltage-dependent block of N-methyl-D-aspartate receptors by dopamine D1 receptor ligands. Mol. Pharmacol., 70,1761–1770.
Cummings, D.M., Yamazaki, I., Cepeda, C., Paul, D.L. & Levine, M.S. (2008)Neuronal coupling via connexin36 contributes to spontaneous synapticcurrents of striatal medium-sized spiny neurons. J. Neurosci. Res., 86, 2147–2158.
Day, M., Wang, Z., Ding, J., An, X., Ingham, C.A., Shering, A.F., Wokosin, D.,Ilijic, E., Sun, Z., Sampson, A.R., Mugnaini, E., Deutch, A.Y., Sesack, S.R.,Arbuthnott, G.W. & Surmeier, D.J. (2006) Selective elimination ofglutamatergic synapses on striatopallidal neurons in Parkinson diseasemodels. Nat. Neurosci., 9, 251–259.
De Petrocellis, L., Harrison, S., Bisogno, T., Tognetto, M., Brandi, I., Smith,G.D., Creminon, C., Davis, J.B., Geppetti, P. & Di Marzo, V. (2001) Thevanilloid receptor (VR1)-mediated effects of anandamide are potentlyenhanced by the cAMP-dependent protein kinase. J. Neurochem., 77,1660–1663.
DeLong, M.R. & Wichmann, T. (2007) Circuits and circuit disorders of thebasal ganglia. Arch. Neurol., 64, 20–24.
Deng, Y.P., Lei, W.L. & Reiner, A. (2006) Differential perikaryal localization inrats of D1 and D2 dopamine receptors on striatal projection neuron typesidentified by retrograde labeling. J. Chem. Neuroanat., 32, 101–116.
Ding, J., Peterson, J.D. & Surmeier, D.J. (2008) Corticostriatal and thalamo-striatal synapses have distinctive properties. J. Neurosci., 28, 6483–6492.
Dumartin, B., Doudnikoff, E., Gonon, F. & Bloch, B. (2007) Differences inultrastructural localization of dopaminergic D1 receptors between dorsalstriatum and nucleus accumbens in the rat. Neurosci. Lett., 419, 273–277.
Fiorentini, C., Gardoni, F., Spano, P., Di Luca, M. & Missale, C. (2003)Regulation of dopamine D1 receptor trafficking and desensitization byoligomerization with glutamate N-methyl-D-aspartate receptors. J. Biol.Chem., 278, 20196–20202.
Flores-Hernandez, J., Galarraga, E. & Bargas, J. (1997) Dopamine selectsglutamatergic inputs to neostriatal neurons. Synapse (NY), 25, 185–195.
Flores-Hernandez, J., Cepeda, C., Hernandez-Echeagaray, E., Calvert, C.R.,Jokel, E.S., Fienberg, A.A., Greengard, P. & Levine, M.S. (2002) Dopamineenhancement of NMDA currents in dissociatedmedium-sized striatal neurons:role of D1 receptors and DARPP-32. J. Neurophysiol., 88, 3010–3020.
Galarraga, E., Hernandez-Lopez, S., Reyes, A., Barral, J. & Bargas, J. (1997)Dopamine facilitates striatal EPSPs through an L-type Ca2+ conductance.Neuroreport, 8, 2183–2186.
Gao, C., Sun, X. & Wolf, M.E. (2006) Activation of D1 dopamine receptorsincreases surface expression of AMPA receptors and facilitates their synapticincorporation in cultured hippocampal neurons. J. Neurochem., 98, 1664–1677.
Gerfen, C.R., Engber, T.M., Mahan, L.C., Susel, Z., Chase, T.N., Monsma, F.J.Jr & Sibley, D.R. (1990) D1 and D2 dopamine receptor-regulated geneexpression of striatonigral and striatopallidal neurons. Science (NY), 250,1429–1432.
Gertler, T.S., Chan, C.S. & Surmeier, D.J. (2008) Dichotomous anatomicalproperties of adult striatal medium spiny neurons. J. Neurosci., 28, 10814–10824.
Giuffrida, A., Parsons, L.H., Kerr, T.M., Rodriguez de Fonseca, F., Navarro, M.& Piomelli, D. (1999) Dopamine activation of endogenous cannabinoidsignaling in dorsal striatum. Nat. Neurosci., 2, 358–363.
Gong, S., Zheng, C., Doughty, M.L., Losos, K., Didkovsky, N., Schambra,U.B., Nowak, N.J., Joyner, A., Leblanc, G., Hatten, M.E. & Heintz, N.(2003) A gene expression atlas of the central nervous system based onbacterial artificial chromosomes. Nature, 425, 917–925.
Hakansson, K., Galdi, S., Hendrick, J., Snyder, G., Greengard, P. & Fisone, G.(2006) Regulation of phosphorylation of the GluR1 AMPA receptor bydopamine D2 receptors. J. Neurochem., 96, 482–488.
Hallett, P.J., Spoelgen, R., Hyman, B.T., Standaert, D.G. & Dunah, A.W. (2006)Dopamine D1 activation potentiates striatal NMDA receptors by tyrosinephosphorylation-dependent subunit trafficking. J. Neurosci., 26, 4690–4700.
Hentges, S.T., Low, M.J. & Williams, J.T. (2005) Differential regulation ofsynaptic inputs by constitutively released endocannabinoids and exogenouscannabinoids. J. Neurosci., 25, 9746–9751.
Hillard, C.J. & Jarrahian, A. (2000) The movement of N-arachidonoyletha-nolamine (anandamide) across cellular membranes. Chem. Phys. Lipids, 108,123–134.
Kano, M., Ohno-Shosaku, T., Hashimotodani, Y., Uchigashima, M. &Watanabe, M. (2009) Endocannabinoid-mediated control of synaptic trans-mission. Physiol. Rev., 89, 309–380.
Kawaguchi, Y., Wilson, C.J. & Emson, P.C. (1989) Intracellular recording ofidentified neostriatal patch and matrix spiny cells in a slice preparationpreserving cortical inputs. J. Neurophysiol., 62, 1052–1068.
Kreitzer, A.C. & Malenka, R.C. (2005) Dopamine modulation of state-dependent endocannabinoid release and long-term depression in the striatum.J. Neurosci., 25, 10537–10545.
Kreitzer, A.C. & Malenka, R.C. (2007) Endocannabinoid-mediated rescue ofstriatal LTD and motor deficits in Parkinson’s disease models. Nature, 445,643–647.
Lee, F.J. & Liu, F. (2004) Direct interactions between NMDA and D1receptors: a tale of tails. Biochem. Soc. Trans., 32, 1032–1036.
Levine, M.S., Altemus, K.L., Cepeda, C., Cromwell, H.C., Crawford, C.,Ariano, M.A., Drago, J., Sibley, D.R. & Westphal, H. (1996) Modulatoryactions of dopamine on NMDA receptor-mediated responses are reduced inD1A-deficient mutant mice. J. Neurosci., 16, 5870–5882.
Lin, J.Y., Dubey, R., Funk, G.D. & Lipski, J. (2003) Receptor subtype-specificmodulation by dopamine of glutamatergic responses in striatal medium spinyneurons. Brain Res., 959, 251–262.
Lobo, M.K., Karsten, S.L., Gray, M., Geschwind, D.H. & Yang, X.W. (2006)FACS-array profiling of striatal projection neuron subtypes in juvenile andadult mouse brains. Nat. Neurosci., 9, 443–452.
Dopamine modulation of excitatory currents 27
ª The Authors (2009). Journal Compilation ª Federation of European Neuroscience Societies and Blackwell Publishing LtdEuropean Journal of Neuroscience, 31, 14–28
Lovinger, D.M. (2008) Presynaptic modulation by endocannabinoids. InSudhoh, T.C. & Starke, K. (eds.) Handbook of Experimental Pharmacology.Springer-Verlag, Berlin Heidelberg, pp. 435–477.
Maccarrone, M., Bari, M., Battista, N. & Finazzi-Agro, A. (2002) Estrogenstimulates arachidonoylethanolamide release from human endothelial cellsand platelet activation. Blood, 100, 4040–4048.
Maejima, T., Hashimoto, K., Yoshida, T., Aiba, A. & Kano, M. (2001)Presynaptic inhibition caused by retrograde signal from metabotropicglutamate to cannabinoid receptors. Neuron, 31, 463–475.
Neu, A., Foldy, C. & Soltesz, I. (2007) Postsynaptic origin of CB1-dependenttonic inhibition of GABA release at cholecystokinin-positive basket cellto pyramidal cell synapses in the CA1 region of the rat hippocampus.J. Physiol., 578, 233–247.
Nicola, S.M. & Malenka, R.C. (1998) Modulation of synaptic transmissionby dopamine and norepinephrine in ventral but not dorsal striatum.J. Neurophysiol., 79, 1768–1776.
Patel, S., Rademacher, D.J. & Hillard, C.J. (2003) Differential regulation of theendocannabinoids anandamide and 2-arachidonylglycerol within the limbicforebrain by dopamine receptor activity. J. Pharmacol. Exp. Ther., 306, 880–888.
Pei, L., Lee, F.J., Moszczynska, A., Vukusic, B. & Liu, F. (2004) Regulation ofdopamine D1 receptor function by physical interaction with the NMDAreceptors. J. Neurosci., 24, 1149–1158.
Ryman-Rasmussen, J.P., Nichols, D.E. & Mailman, R.B. (2005) Differentialactivation of adenylate cyclase and receptor internalization by noveldopamine D1 receptor agonists. Mol. Pharmacol., 68, 1039–1048.
Scott, L., Zelenin, S., Malmersjo, S., Kowalewski, J.M., Markus, E.Z., Nairn,A.C., Greengard, P., Brismar, H. & Aperia, A. (2006) Allosteric changes ofthe NMDA receptor trap diffusible dopamine 1 receptors in spines. Proc.Natl Acad. Sci. USA, 103, 762–767.
Singla, S., Kreitzer, A.C. & Malenka, R.C. (2007) Mechanisms for synapsespecificity during striatal long-term depression. J. Neurosci., 27, 5260–5264.
Snyder, G.L., Fienberg, A.A., Huganir, R.L. & Greengard, P. (1998) Adopamine ⁄ D1 receptor ⁄ protein kinase A ⁄ dopamine- and cAMP-regulatedphosphoprotein (Mr 32 kDa) ⁄ protein phosphatase-1 pathway regulatesdephosphorylation of the NMDA receptor. J. Neurosci., 18, 10297–10303.
Surmeier, D.J., Reiner, A., Levine, M.S. & Ariano, M.A. (1993) Are neostriataldopamine receptors co-localized? Trends Neurosci., 16, 299–305.
Surmeier, D.J., Song, W.J. & Yan, Z. (1996) Coordinated expression ofdopamine receptors in neostriatal medium spiny neurons. J. Neurosci., 16,6579–6591.
Taverna, S., Ilijic, E. & Surmeier, D.J. (2008) Recurrent collateral connectionsof striatal medium spiny neurons are disrupted in models of Parkinson’sdisease. J. Neurosci., 28, 5504–5512.
Tseng, K.Y., Snyder-Keller, A. & O’Donnell, P. (2007) Dopaminergicmodulation of striatal plateau depolarizations in corticostriatal organotypiccocultures. Psychopharmacology, 191, 627–640.
Venance, L. & Glowinski, J. (2003) Heterogeneity of spike frequencyadaptation among medium spiny neurones from the rat striatum. Neurosci-ence, 122, 77–92.
Wang, H. & Pickel, V.M. (2002) Dopamine D2 receptors are present inprefrontal cortical afferents and their targets in patches of the rat caudate–putamen nucleus. J. Comp. Neurol., 442, 392–404.
Wilson, R.I., Kunos, G. & Nicoll, R.A. (2001) Presynaptic specificity ofendocannabinoid signaling in the hippocampus. Neuron, 31, 453–462.
Wooten, G.F. (1997) Functional anatomical and behavioral consequences ofdopamine receptor stimulation. Ann. NY Acad. Sci., 835, 153–156.
Yan, Z., Hsieh-Wilson, L., Feng, J., Tomizawa, K., Allen, P.B., Fienberg, A.A.,Nairn, A.C. & Greengard, P. (1999) Protein phosphatase 1 modulation ofneostriatal AMPA channels: regulation by DARPP-32 and spinophilin. Nat.Neurosci., 2, 13–17.
Yung, K.K., Bolam, J.P., Smith, A.D., Hersch, S.M., Ciliax, B.J. & Levey, A.I.(1995) Immunocytochemical localization of D1 and D2 dopamine receptorsin the basal ganglia of the rat: light and electron microscopy. Neuroscience,65, 709–730.
28 V. M. Andre et al.
ª The Authors (2009). Journal Compilation ª Federation of European Neuroscience Societies and Blackwell Publishing LtdEuropean Journal of Neuroscience, 31, 14–28