An Excitatory Loop with Astrocytes Contributes to Drive Neurons to Seizure Threshold
19
An Excitatory Loop with Astrocytes Contributes to Drive Neurons to Seizure Threshold Marta Go ´ mez-Gonzalo 1,2. , Gabriele Losi 1,2. , Angela Chiavegato 1,2 , Micaela Zonta 1,2 , Mario Cammarota 1,2 , Marco Brondi 3,4 , Francesco Vetri 4 , Laura Uva 5 , Tullio Pozzan 1,2,6 , Marco de Curtis 5 , Gian Michele Ratto 3,4 , Giorgio Carmignoto 1,2 * 1 Institute of Neuroscience – Consiglio Nazionale delle Ricerche (CNR), University of Padova, Padova, Italy, 2 Department of Experimental Biomedical Sciences, University of Padova, Padova, Italy, 3 National Enterprise for nanoScience and nanoTechnology (NEST), Instituto Nanoscienze CNR, Scuola Normale Superiore, Pisa, Italy, 4 Institute of Neuroscience – CNR, Pisa, Italy, 5 Fondazione Istituto Neurologico Carlo Besta, Milano, Italy, 6 Venetian Institute of Molecular Medicine, Padova, Italy Abstract Seizures in focal epilepsies are sustained by a highly synchronous neuronal discharge that arises at restricted brain sites and subsequently spreads to large portions of the brain. Despite intense experimental research in this field, the earlier cellular events that initiate and sustain a focal seizure are still not well defined. Their identification is central to understand the pathophysiology of focal epilepsies and to develop new pharmacological therapies for drug-resistant forms of epilepsy. The prominent involvement of astrocytes in ictogenesis was recently proposed. We test here whether a cooperation between astrocytes and neurons is a prerequisite to support ictal (seizure-like) and interictal epileptiform events. Simultaneous patch- clamp recording and Ca 2+ imaging techniques were performed in a new in vitro model of focal seizures induced by local applications of N-methyl-D-aspartic acid (NMDA) in rat entorhinal cortex slices. We found that a Ca 2+ elevation in astrocytes correlates with both the initial development and the maintenance of a focal, seizure-like discharge. A delayed astrocyte activation during ictal discharges was also observed in other models (including the whole in vitro isolated guinea pig brain) in which the site of generation of seizure activity cannot be precisely monitored. In contrast, interictal discharges were not associated with Ca 2+ changes in astrocytes. Selective inhibition or stimulation of astrocyte Ca 2+ signalling blocked or enhanced, respectively, ictal discharges, but did not affect interictal discharge generation. Our data reveal that neurons engage astrocytes in a recurrent excitatory loop (possibly involving gliotransmission) that promotes seizure ignition and sustains the ictal discharge. This neuron–astrocyte interaction may represent a novel target to develop effective therapeutic strategies to control seizures. Citation: Go ´ mez-Gonzalo M, Losi G, Chiavegato A, Zonta M, Cammarota M, et al. (2010) An Excitatory Loop with Astrocytes Contributes to Drive Neurons to Seizure Threshold. PLoS Biol 8(4): e1000352. doi:10.1371/journal.pbio.1000352 Academic Editor: John R. Huguenard, Stanford University School of Medicine, United States of America Received May 7, 2009; Accepted March 2, 2010; Published April 13, 2010 Copyright: ß 2010 Gomez-Gonzalo et al. This is an open-access article distributed under the terms of the Creative Commons Attribution License, which permits unrestricted use, distribution, and reproduction in any medium, provided the original author and source are credited. Funding: This work was supported by grants from the European Community 7th Framework Program (NeuroGlia, HEALTH-F2-2007-202167), Telethon Italy (GGP07278), and CARIPARO foundation. MGG was also supported by the MEC (Spain). The funders had no role in study design, data collection and analysis, decision to publish, or preparation of the manuscript. Competing Interests: The authors have declared that no competing interests exist. Abbreviations: AP, action potential; EC, entorhinal cortex; 2P-LSM, two-photon laser scanning microscopy; SE, status epilepticus; SIC, slow inward current * E-mail: [email protected] . These authors contributed equally to this work. Introduction Focal epilepsies are characterized by a condition of neuronal hyperexcitability that is restricted to the epileptogenic region. Focal seizures originate at this region and secondarily spread to distant cortical areas [1–5]. Several factors, from ion channel mutations to brain injury, may cause neuronal hyperexcitability changes that sustain an epileptic condition [6]. Yet, the earlier cellular events that initiate a seizure in the first place are still unclear. The understanding of ictogenesis is thus central to the pathophysiology of focal epilepsies and is a requirement to develop new pharmacological therapies for drug-resistant focal epilepsies [7]. In the present study, we specifically address the hypothesis that the activation of a loop between neurons and astrocytes is an early event that contributes to focal seizure initiation. This hypothesis stems from a series of recent studies that reappraised the role of neurons in epileptogenesis and hinted at a possible, direct contribution of astrocytes to the generation of an epileptic discharge. The first clue was the observation that the release of glutamate from astrocytes, elicited by Ca 2+ oscillations, promotes local synchronous activities in hippocampal neurons by acting on extrasynaptic N-methyl-D-aspartic acid (NMDA) receptors [8]. Studies performed both on brain slices and in vivo showed that during epileptiform activity, the frequency of Ca 2+ oscillations in astrocytes is significantly increased [9,10], and it is reduced by anticonvulsant drugs [9]. Moreover, the expression of metabotro- pic glutamate receptors (mGluRs, mediators of Ca 2+ oscillations in these cells) in hippocampal astrocytes from animal models of temporal lobe epilepsy was found to be increased [11,12]. These observations suggest that the excessive neuronal synchronization that characterizes the epileptic discharge might be sustained, at least in part, by an astrocyte hyperactivity. In support of an astrocyte role in epileptiform activities, it has been proposed that PLoS Biology | www.plosbiology.org 1 April 2010 | Volume 8 | Issue 4 | e1000352
Transcript of An Excitatory Loop with Astrocytes Contributes to Drive Neurons to Seizure Threshold

An Excitatory Loop with Astrocytes Contributes to DriveNeurons to Seizure ThresholdMarta Gomez-Gonzalo1,2., Gabriele Losi1,2., Angela Chiavegato1,2, Micaela Zonta1,2, Mario
Cammarota1,2, Marco Brondi3,4, Francesco Vetri4, Laura Uva5, Tullio Pozzan1,2,6, Marco de Curtis5, Gian
Michele Ratto3,4, Giorgio Carmignoto1,2*
1 Institute of Neuroscience – Consiglio Nazionale delle Ricerche (CNR), University of Padova, Padova, Italy, 2 Department of Experimental Biomedical Sciences, University
of Padova, Padova, Italy, 3 National Enterprise for nanoScience and nanoTechnology (NEST), Instituto Nanoscienze CNR, Scuola Normale Superiore, Pisa, Italy, 4 Institute of
Neuroscience – CNR, Pisa, Italy, 5 Fondazione Istituto Neurologico Carlo Besta, Milano, Italy, 6 Venetian Institute of Molecular Medicine, Padova, Italy
Abstract
Seizures in focal epilepsies are sustained by a highly synchronous neuronal discharge that arises at restricted brain sites andsubsequently spreads to large portions of the brain. Despite intense experimental research in this field, the earlier cellularevents that initiate and sustain a focal seizure are still not well defined. Their identification is central to understand thepathophysiology of focal epilepsies and to develop new pharmacological therapies for drug-resistant forms of epilepsy. Theprominent involvement of astrocytes in ictogenesis was recently proposed. We test here whether a cooperation betweenastrocytes and neurons is a prerequisite to support ictal (seizure-like) and interictal epileptiform events. Simultaneous patch-clamp recording and Ca2+ imaging techniques were performed in a new in vitro model of focal seizures induced by localapplications of N-methyl-D-aspartic acid (NMDA) in rat entorhinal cortex slices. We found that a Ca2+ elevation in astrocytescorrelates with both the initial development and the maintenance of a focal, seizure-like discharge. A delayed astrocyteactivation during ictal discharges was also observed in other models (including the whole in vitro isolated guinea pig brain)in which the site of generation of seizure activity cannot be precisely monitored. In contrast, interictal discharges were notassociated with Ca2+ changes in astrocytes. Selective inhibition or stimulation of astrocyte Ca2+ signalling blocked orenhanced, respectively, ictal discharges, but did not affect interictal discharge generation. Our data reveal that neuronsengage astrocytes in a recurrent excitatory loop (possibly involving gliotransmission) that promotes seizure ignition andsustains the ictal discharge. This neuron–astrocyte interaction may represent a novel target to develop effective therapeuticstrategies to control seizures.
Citation: Gomez-Gonzalo M, Losi G, Chiavegato A, Zonta M, Cammarota M, et al. (2010) An Excitatory Loop with Astrocytes Contributes to Drive Neurons toSeizure Threshold. PLoS Biol 8(4): e1000352. doi:10.1371/journal.pbio.1000352
Academic Editor: John R. Huguenard, Stanford University School of Medicine, United States of America
Received May 7, 2009; Accepted March 2, 2010; Published April 13, 2010
Copyright: � 2010 Gomez-Gonzalo et al. This is an open-access article distributed under the terms of the Creative Commons Attribution License, which permitsunrestricted use, distribution, and reproduction in any medium, provided the original author and source are credited.
Funding: This work was supported by grants from the European Community 7th Framework Program (NeuroGlia, HEALTH-F2-2007-202167), Telethon Italy(GGP07278), and CARIPARO foundation. MGG was also supported by the MEC (Spain). The funders had no role in study design, data collection and analysis,decision to publish, or preparation of the manuscript.
Competing Interests: The authors have declared that no competing interests exist.
Abbreviations: AP, action potential; EC, entorhinal cortex; 2P-LSM, two-photon laser scanning microscopy; SE, status epilepticus; SIC, slow inward current
* E-mail: [email protected]
. These authors contributed equally to this work.
Introduction
Focal epilepsies are characterized by a condition of neuronal
hyperexcitability that is restricted to the epileptogenic region.
Focal seizures originate at this region and secondarily spread to
distant cortical areas [1–5]. Several factors, from ion channel
mutations to brain injury, may cause neuronal hyperexcitability
changes that sustain an epileptic condition [6]. Yet, the earlier
cellular events that initiate a seizure in the first place are still
unclear. The understanding of ictogenesis is thus central to the
pathophysiology of focal epilepsies and is a requirement to develop
new pharmacological therapies for drug-resistant focal epilepsies
[7].
In the present study, we specifically address the hypothesis that
the activation of a loop between neurons and astrocytes is an early
event that contributes to focal seizure initiation. This hypothesis
stems from a series of recent studies that reappraised the role of
neurons in epileptogenesis and hinted at a possible, direct
contribution of astrocytes to the generation of an epileptic
discharge. The first clue was the observation that the release of
glutamate from astrocytes, elicited by Ca2+ oscillations, promotes
local synchronous activities in hippocampal neurons by acting on
extrasynaptic N-methyl-D-aspartic acid (NMDA) receptors [8].
Studies performed both on brain slices and in vivo showed that
during epileptiform activity, the frequency of Ca2+ oscillations in
astrocytes is significantly increased [9,10], and it is reduced by
anticonvulsant drugs [9]. Moreover, the expression of metabotro-
pic glutamate receptors (mGluRs, mediators of Ca2+ oscillations in
these cells) in hippocampal astrocytes from animal models of
temporal lobe epilepsy was found to be increased [11,12]. These
observations suggest that the excessive neuronal synchronization
that characterizes the epileptic discharge might be sustained, at
least in part, by an astrocyte hyperactivity. In support of an
astrocyte role in epileptiform activities, it has been proposed that
PLoS Biology | www.plosbiology.org 1 April 2010 | Volume 8 | Issue 4 | e1000352

the interictal events recorded between seizures might be in some
conditions tetrodotoxin (TTX)-resistant and mediated by gluta-
mate release from astrocytes [9]. These findings fuelled a
controversial debate on the role of astrocytes in focal epileptogen-
esis and in the generation of epileptiform discharges [13–15].
In the present study, we used different models of epileptic
seizures, including a new model of focal seizures, to define the role
of astrocytes in the generation of epileptiform activities. We
performed simultaneous Ca2+ imaging and electrophysiological
recordings of epileptic discharges in brain slices and in isolated
intact guinea pig brains, focusing on the entorhinal cortex. This
experimental approach allowed us to define the timing of astrocyte
Ca2+ excitability in relation to interictal and ictal discharges. By
using different pharmacological tools to affect selectively the Ca2+
signal in astrocytes, we also investigated a possible causative role of
astrocyte activation in the generation of these epileptic discharges.
We demonstrate here that a recurrent excitatory loop between
neurons and astrocytes involving Ca2+ elevations in a large
number of glial cells is an early event that contributes to the
initiation of a focal seizure-like discharge.
Results
A Large Number of Astrocytes Are Activated by Ictal, butNot Interictal, Discharges
Picrotoxin/zero-Mg2+ entorhinal cortex slice model. In
a first series of experiments, we investigated neuron and astrocyte
activities in entorhinal cortex (EC) slices during interictal and ictal
discharges induced by the gamma-aminobutyric acid (GABA)Areceptor inhibitor picrotoxin applied in Mg2+-free solution. Slice
incubation with the Ca2+ dye Oregon Green BAPTA-1
acetoxymethyl ester (OGB1-AM) allowed us to monitor Ca2+
signals from both neurons and astrocytes, identified according to
morphological and functional criteria [16–18] (see also Materials
and Methods). Patch-clamp recordings coupled to Ca2+ imaging
revealed a clear correlation between action potential (AP) bursts
and Ca2+ changes from the patched neuron during both the brief
interictal and the prolonged ictal discharges (Figure 1A and 1B).
Ca2+ elevations with similar onset and time course were also
observed in unpatched neurons simultaneously monitored in the
same field (Figure 1A, and other neurons in 1B). These
observations demonstrate that the neuronal Ca2+ signal reflects
faithfully the AP discharge during ictal and interictal discharges
and represents a useful tool to i) detect epileptic discharges; ii)
mark ictal discharge initiation; and iii) evaluate the extension of
underlying neuronal synchronies.
A Ca2+ rise was distinctly activated by ictal discharges in most
astrocytes, whereas interictal discharges failed to evoke a similar
astrocyte activation (Figure 1A and 1B; see also Figure 1E and
Video S1), and it increased only the frequency of independent
Ca2+ oscillations in single astrocytes (Figure S1). In a total of 15
experiments, 73.564.0% of the astrocytes present in the recording
field (n = 227; Figure 1E) were activated by the ictal discharge, and
in most of these (57.7%) a Ca2+ elevation occurred 1.860.2 s after
the ictal discharge onset. A similar distinct activation of astrocytes
during the ictal event evoked by picrotoxin/zero-Mg2+ was
observed also in CA3 region from hippocampal slices of both rats
(Figure 1E) and pGFAP-EGFP transgenic mice in which astrocytes
are labelled by the enhanced green fluorescent protein (EGFP)
under the control of the human glial fibrillary acidic protein
(GFAP) promoter (unpublished data).
Bicuculline-perfused, whole guinea pig brain model. To
validate in an intact brain the findings obtained in EC slices, we
used the in vitro isolated whole brain from young adult guinea pigs
[19] since imaging of the EC is impracticable in vivo. In this
preparation, networks responsible for focal ictogenesis in the EC–
hippocampus have been analyzed in detail [20,21]. We
simultaneously recorded the extracellular field potential and
Ca2+ signals by two-photon laser scanning microscopy (2P-LSM)
during epileptiform activities induced by arterial application of the
GABAA receptor antagonist, bicuculline methiodide. Ca2+ signals
in neuropile were tightly correlated with the changes in the field
potential observed during the seizure discharge and increased in
parallel with the appearance of a fast activity at 20–30 Hz that
accompanied the onset of the ictal discharge [21,22] (Figure 1D).
As in brain slices, in this close to in vivo condition, seizure-like
events regularly evoked Ca2+ elevations in astrocytes (Figure 1C
and 1D), whereas interictal events failed to activate astrocyte
responses (Figure S1). A bar graph summarizes the different
response of astrocytes to interictal and ictal discharges in the
different models (Figure 1E).
Astrocyte Activation by the Ictal Discharge InvolvesGlutamate and ATP
The activation of astrocytes by neuronal activity is mainly
mediated by synaptic neurotransmitter release, such as glutamate
[16,23] and ATP [24]. We next asked whether these neuronal
signals mediate Ca2+ elevations triggered in astrocytes by the ictal
discharge. We found that the activation of astrocytes by the ictal
discharge was significantly reduced by slice perfusion with either
the antagonist of mGlu receptors 2-methyl-6-(phenylethynyl)-
pyridine (MPEP), or the antagonist of purinergic (P2) receptors
pyridoxal phosphate-6-azophenyl-29,49-disulfonic acid (PPADS,
Figure 2A). MPEP/PPADS co-perfusion abolished ictal discharg-
es, thus hampering the possibility to clarify whether glutamate and
ATP can entirely account for astrocyte activation by the ictal
event.
We also found that after slice perfusion with either MPEP or
PPADS, the duration and frequency of ictal episodes in neurons
were significantly reduced with respect to controls (Figure 2B and
2C), whereas interictal discharges were either unaffected (PPADS
and MPEP/PPADS) or increased in frequency (MPEP; Figure 2D).
These results clearly show that Ca2+ elevations mediated by mGlu
and P2 receptors in astrocytes (and neurons) do not have a role in
the generation of interictal discharges. Given that MPEP and
PPADS block receptors in both neurons and astrocytes, these
Author Summary
In focal epilepsy, seizures are generated by a localized,synchronous neuronal electrical discharge that may spreadto large portions of the brain. Despite intense experimentalresearch in this field, a key question relevant to the humanepilepsy condition remains completely unanswered: whatare the cellular events that lead to the onset of a seizure inthe first place? In various in vitro models of seizures usingrodent brain slices, we simultaneously recorded neuronalfiring and Ca2+ signals both from neurons and fromastrocytes, the principal population of glial cells in thebrain. We found that activation of astrocytes by neuronalactivity and signalling from astrocytes back to neuronscontribute to the initiation of a focal seizure. This reciprocalexcitatory loop between neurons and astrocytes representsa new mechanism in the pathophysiology of epilepsy thatshould be considered by those aiming to develop moreeffective therapies for epilepsies that are not controlled bycurrently available treatments.
Astrocyte Role in Ictogenesis
PLoS Biology | www.plosbiology.org 2 April 2010 | Volume 8 | Issue 4 | e1000352
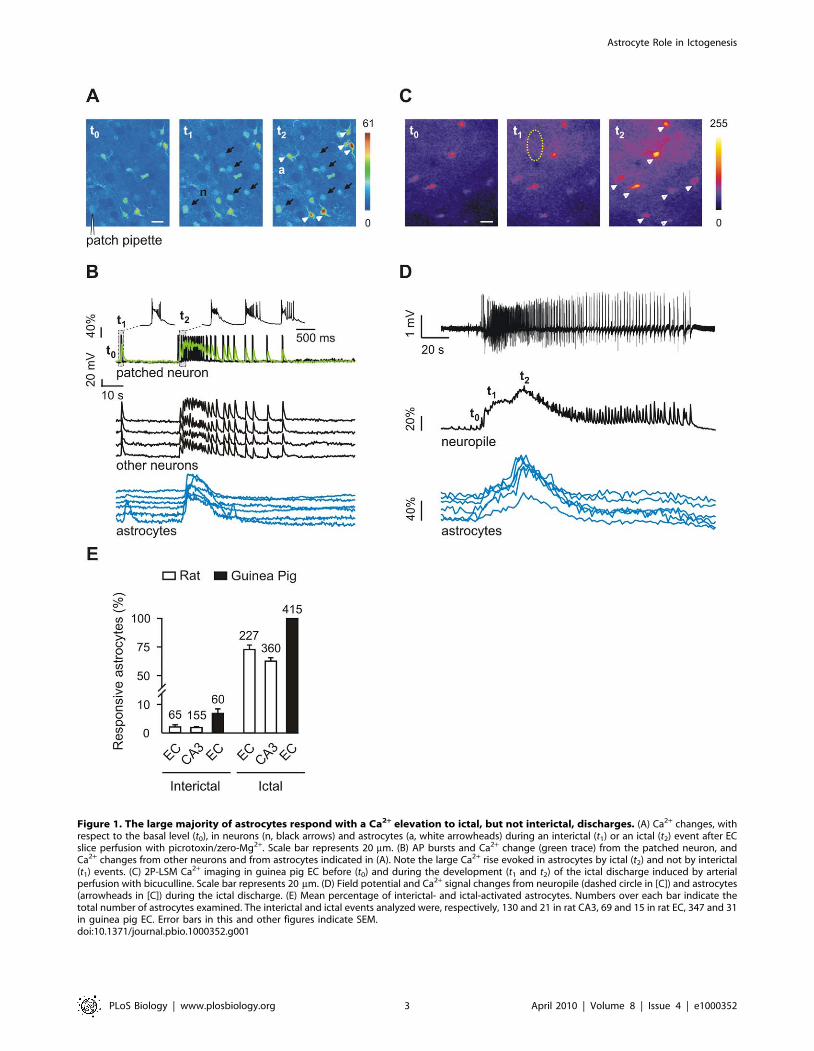
Figure 1. The large majority of astrocytes respond with a Ca2+ elevation to ictal, but not interictal, discharges. (A) Ca2+ changes, withrespect to the basal level (t0), in neurons (n, black arrows) and astrocytes (a, white arrowheads) during an interictal (t1) or an ictal (t2) event after ECslice perfusion with picrotoxin/zero-Mg2+. Scale bar represents 20 mm. (B) AP bursts and Ca2+ change (green trace) from the patched neuron, andCa2+ changes from other neurons and from astrocytes indicated in (A). Note the large Ca2+ rise evoked in astrocytes by ictal (t2) and not by interictal(t1) events. (C) 2P-LSM Ca2+ imaging in guinea pig EC before (t0) and during the development (t1 and t2) of the ictal discharge induced by arterialperfusion with bicuculline. Scale bar represents 20 mm. (D) Field potential and Ca2+ signal changes from neuropile (dashed circle in [C]) and astrocytes(arrowheads in [C]) during the ictal discharge. (E) Mean percentage of interictal- and ictal-activated astrocytes. Numbers over each bar indicate thetotal number of astrocytes examined. The interictal and ictal events analyzed were, respectively, 130 and 21 in rat CA3, 69 and 15 in rat EC, 347 and 31in guinea pig EC. Error bars in this and other figures indicate SEM.doi:10.1371/journal.pbio.1000352.g001
Astrocyte Role in Ictogenesis
PLoS Biology | www.plosbiology.org 3 April 2010 | Volume 8 | Issue 4 | e1000352
results also suggest that Ca2+ signals activated by these receptors,
on one or both cells, may have a role in ictal discharge generation.
Selective Activation of Astrocytes Favours Ictal DischargeGeneration
We next asked whether astrocyte Ca2+ elevations may have a
specific role in ictal discharge generation. To investigate this
hypothesis, an agonist able to selectively trigger a Ca2+ increase
in astrocytes should be used. The peptide TFLLR, a PAR-1
thrombin receptor agonist, is preferentially expressed in astrocytes
and is known to activate glutamate release in astrocytes [25,26].
We found that PAR-1 immunoreactivity in the EC was largely
associated with the soma and the processes of GFAP-positive
astrocytes (Figure 3A). Noteworthy, GFAP-negative PAR-1 puncta
appeared in continuity with distal portions of astrocyte processes,
where GFAP is barely expressed [27] (Figure 3B). Following
TFLLR (10 mM) bath perfusion in the presence of both TTX
and D-2-amino-5-phosphonopentanoate (D-AP5), which blocks
NMDAR-mediated astrocyte-to-neuron signalling [8,28], we
could not detect any Ca2+ change in EC neurons, whereas large
Ca2+ elevations were observed in astrocytes (Figure 3C).
We next asked whether PAR-1 receptor activation could
stimulate the release of glutamate from EC astrocytes, as
previously reported for hippocampal astrocytes [25,26]. We found
that Ca2+ elevations triggered in EC astrocytes by short pressure
pulses applied to a TFLLR-containing pipette (1 mM) were
followed by slow inward currents (SICs) in adjacent patched
neurons (Figure 3D). Most of the SICs recorded in six of 12
neurons occurred within 10 s (mean delay 6 SEM, 1.360.3 s)
after the TFLLR-induced Ca2+ elevations in astrocytes (Figure 3D
and 3E). Unlike fast spontaneous synaptic currents (asterisks in
Figure 3D), SICs have typical slow kinetics (rise time, 83.0636 ms,
decay time, 4516171 ms; n = 13), are insensitive to TTX, and are
sensitive to the NMDAR blocker D-AP5 (Figure 3E), as
demonstrated in neurons from other brain regions [8,28–30].
In the picrotoxin/zero-Mg2+ entorhinal cortex slice model, we
then investigated whether selective astrocyte activation enhanced
ictal discharge generation. We found that Ca2+ elevations
triggered in astrocytes by local TFLLR applications were sufficient
to shift neurons towards the ictal discharge threshold (Figure 3F;
Video S2). To demonstrate the causal link between the ictal
discharge and the immediately preceding TFLLR-induced Ca2+
increase in astrocytes, we simulated the ictal occurrence by a
Monte Carlo procedure. Results from this analysis revealed that
in six experiments in which 30 TFLLR applications were
performed, 10 of the 15 observed ictal events were correlated at
the 0.05 confidence level with a preceding astrocyte Ca2+ increase
(Figure S2).
These results suggest that when the level of basal excitability and
the predisposition of neurons to generate epileptiform discharges is
high, as in the picrotoxin/zero-Mg2+ model, activation of the
NMDAR by astrocytic glutamate could trigger neuronal hyper-
activity that is sufficient to generate an ictal discharge. Compelling,
although indirect, support for this hypothesis derived from the
observation that a short pressure-pulse application of NMDA via
an NMDA-containing pipette could also evoke an ictal discharge
(Figure S3).
In the Presence of 4-AP, a Local Application of NMDAEvokes a Focal Ictal Discharge
To further investigate the possible role of astrocytes in seizure
initiation, we developed a model of focal seizures alternative to
the picrotoxin/zero-Mg2+ model. In this latter model, indeed,
epileptic activities arise spontaneously and at unpredictable foci
[31,32], and therefore the cellular mechanism of seizure initiation
cannot be analyzed accurately.
In our new model, ictal discharges are reproducibly generated
at discrete sites of the EC by focal NMDA applications. Figure 4A
reports schematically the positions of an NMDA-containing
pipette and an OGB1-containing patch pipette in layer V of the
EC. A confocal image of this region under basal conditions (t0) is
also presented. Focal episodes of neuronal hyperactivity are
induced in the presence of 100 mM 4-aminopyridine (4-AP) and
0.5 mM Mg2+ by short pressure-pulse applications of NMDA via
the NMDA-containing pipette. The effect of the NMDA pulse
ejection was monitored by simultaneously recording Ca2+ signals
from neurons and the AP firing from one of the neurons close to
the NMDA pipette. Notably, in the submerged chamber
experiment used in our study, no spontaneous ictal discharges
were observed during 4-AP slice perfusion, whereas under
different experimental conditions, such as in interface chamber
experiments, epileptiform activities arise spontaneously [2]. As
illustrated by the fluorescence change, a single NMDA pulse
stimulated a transient Ca2+ increase in a limited number of layer
V-VI neurons from the region close to the pipette tip, that we
termed the field A (t1, Figure 4B; Video S3). This local response is
clearly illustrated by the difference image generated by subtract-
ing the fluorescence image captured at basal conditions to that
obtained after the NMDA stimulation (t1 2 t0, Figure 4B).
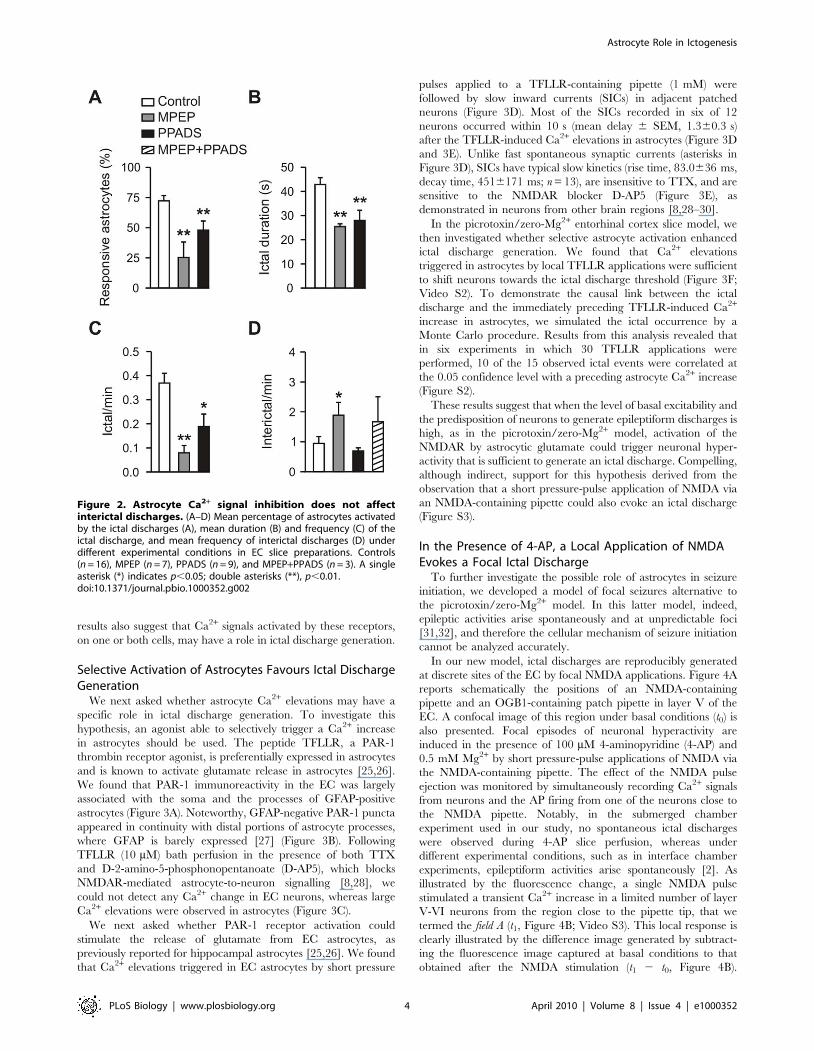
Figure 2. Astrocyte Ca2+ signal inhibition does not affectinterictal discharges. (A–D) Mean percentage of astrocytes activatedby the ictal discharges (A), mean duration (B) and frequency (C) of theictal discharge, and mean frequency of interictal discharges (D) underdifferent experimental conditions in EC slice preparations. Controls(n = 16), MPEP (n = 7), PPADS (n = 9), and MPEP+PPADS (n = 3). A singleasterisk (*) indicates p,0.05; double asterisks (**), p,0.01.doi:10.1371/journal.pbio.1000352.g002
Astrocyte Role in Ictogenesis
PLoS Biology | www.plosbiology.org 4 April 2010 | Volume 8 | Issue 4 | e1000352

Simultaneous patch-clamp recording and Ca2+ imaging revealed
that the NMDA stimulus leads to AP burst firing in the patched
neuron coupled with a Ca2+ elevation in this and the other
neurons from field A, but it failed to activate neurons of the
surrounding region, which we termed field B (Figure 4D1).
Two-pulse NMDA stimulation with a 3-s interval evoked a
stronger activation of neurons and a transient Ca2+ elevation in
some of the previously unresponsive neurons from the surrounding
field B (t2 and t2 2 t0, Figure 4C). The response to the double
NMDA pulse evolved into a sustained plateau with superimposed
Ca2+ spikes correlated with AP bursts typical of an ictal discharge,
i.e., the cellular equivalent of a seizure [2] (Figure 4D2, see also
Figure 4C, t3). The ictal discharge was characterized by Ca2+
spikes from unpatched neurons in both field A and field B, highly
synchronized with the AP bursts (Figure 4D2; Video S4). The
recruitment of neurons in field B that underlines the spreading to
this region of the ictal discharge is also clearly illustrated by the
difference image t3 2 t0 (Figure 4C). The time window between
Figure 3. PAR-1 receptor activation in astrocytes favours ictal discharge generation. (A) Images showing PAR-1 (red) and GFAP (green)immunoreactivity and the merged image in EC layers V-VI; 86.7% of GFAP-positive astrocytes were PAR-1 immunopositive. Scale bar represents20 mm. (B) High magnification of a confocal image showing a merged image of PAR-1 and GFAP immunoreactivity from EC layer V-VI. Note thecontinuity of PAR-1 punctate signals that are presumably associated with GFAP-negative distal portions of GFAP-positive astrocyte processes (whitearrowheads). Scale bar represents 5 mm. (C) Bar graph showing that bath perfusion with TFLLR (10 mM) in the presence of D-AP5 and TTX failed totrigger any Ca2+ response in 70 neurons analyzed from three different experiments. (D) Ca2+ elevations in astrocytes (top traces) and whole-cellrecording of an adjacent neuron (lower trace) after a single TFLLR pulse (indicated by an open red arrowhead) applied in the presence of TTX. TheCa2+ elevation in astrocytes is followed by the activation of SICs in the nearby patched neuron. Note the slower kinetics of SICs (insets) with respect tothose of a spontaneously occurring fast synaptic miniature event (*). (E) Bar graph reporting the frequency of SICs before and after TFLLR pulses. Thelarge majority of SICs (six of 11) occurred within 10 s of the TFLLR-evoked Ca2+ increase in astrocytes. No SICs where observed after TFLLR inducedCa2+ elevations in astrocytes in the presence of D-AP5. (F) In the picrotoxin/zero-Mg2+ model, astrocyte stimulation by TFLLR (open red arrowhead)was sufficient to evoke an ictal discharge.doi:10.1371/journal.pbio.1000352.g003
Astrocyte Role in Ictogenesis
PLoS Biology | www.plosbiology.org 5 April 2010 | Volume 8 | Issue 4 | e1000352
Astrocyte Role in Ictogenesis
PLoS Biology | www.plosbiology.org 6 April 2010 | Volume 8 | Issue 4 | e1000352
the double NMDA pulse and the Ca2+ elevation that occurs
synchronously in both field A and B neurons represents a
transition phase during which the ictal discharge develops in field
A. In the presence of TTX, the ictal discharge in both field A and
B neurons was abolished, whereas the initial response of field A
neurons was unaffected (Figure 4E). The size of the cortical region
occupied by neurons that respond directly with a transient Ca2+
rise to a double NMDA pulse applied in the presence of TTX was
369617 mm. Notably, the number of neurons in this response
(56.567.2) is underestimated since it comprises only neurons
activated by NMDA in a single focal plane. These results
demonstrated that i) AP-mediated events secondary to the initial
activation of field A neurons are crucial for ictal discharge
maturation; and ii) the activation of neurons from field B and the
generation of the ictal discharge was not due to a delayed diffusion
of NMDA. Paired recordings from two pyramidal neurons (one in
field A and the other in field B) confirmed that similar ictal
discharges were regularly evoked in field A and B by successive
double NMDA pulses (Figure S4).
According to results obtained from 14 experiments, no failures
were observed in a total of 101 double NMDA pulse stimulations,
and the mean duration of the ictal discharge repetitively evoked by
these stimulations was reproducible over long time periods (up to
60 min, Figure S4). By applying successive double NMDA pulses
in the presence of TTX, no NMDA-mediated Ca2+ elevations
were detected in field B neurons, whereas the number of field A
neurons activated directly by NMDA and the amplitude of their
Ca2+ response were found to be unchanged over the same time
period (Figure S4).
Ictal discharges could be evoked also by two single NMDA
pulses applied at two different sites, either simultaneously or in
succession. Intervals of 3 or 5 s were successful, but not an interval
of 10 s. To be effective, the two pipette tips should be positioned
close enough to allow a large spatial overlapping of the two pulses.
Only in this overlapping region were neurons strongly activated by
the two NMDA pulses. Notably, if the distance between the two
pipette tips was 172630.2 mm (n = 5) (a value similar to the mean
radius of the field A directly activated by double NMDA pulses),
the two single NMDA pulses regularly evoked an ictal discharge. If
the distance of the two pipette tips was 220638.5 mm, no ictal
discharges could be evoked.
Altogether, these data show that an episode of activity evoked
in a group of neurons by local NMDA applications creates
an initiation site for a seizure-like discharge that secondarily
involves adjacent neuronal populations. They also demonstrate
that our model is highly reliable since comparable ictal
discharges can be evoked by repetitive stimulations applied to
the same restricted site. Notably, in contrast to the picrotoxin/
zero-Mg2+ model, in the 4-AP model, single NMDA pulses
failed to trigger focal ictal discharges, suggesting different
thresholds for seizure generation in these two models (see
Discussion).
The Development of the Ictal Discharge Is Accompaniedby Astrocyte Activation
We next investigated astrocyte activities during the develop-
ment of focal ictal discharges. We observed that shortly after the
initial neuronal response to a double NMDA pulse, a large Ca2+
elevation occurred almost simultaneously in the large majority of
field A astrocytes (Figure 5A, red traces; Video S4). Similar Ca2+
elevations in these astrocytes were never observed during the
neuronal response to a single NMDA pulse. In 13 experiments, a
mean of 17.463.5 out of 2063.1 responsive astrocytes in field A
displayed an early Ca2+ elevation during the transition phase. As
a mean, astrocyte activation in field A occurred 4.861.1 s before
field B neurons were recruited into the ictal discharge. Most of
the astrocytes in field B were activated later, i.e., after the
invasion of the ictal discharge into this region (Figure 5A, blue
traces; Video S4). High-magnification images in Figure 5B
illustrate ‘‘early’’ and ‘‘late’’ Ca2+ changes of astrocytes from field
A and B, respectively. The mean percentage of astrocytes from
field A and B displaying ‘‘early’’ and ‘‘late’’ responses is reported
in Figure 5C. Notably, when the ictal discharge was evoked by
two single NMDA pulses applied at two distinct sites (Figure 5D),
most astrocytes from both the field of spatial overlapping of the
two pulses and the immediately surrounding regions (fields A1
and A2) displayed a similar early Ca2+ elevation (85.665.4%),
whereas most astrocytes from the surrounding regions (the fields
B) showed a late activation (71.665.4%). Noteworthy is that
astrocytes failed to be similarly activated by each single NMDA
pulse alone (Figure 5D).
We next asked whether the initial Ca2+ elevation in astrocytes
(and neurons) from field A spread to other astrocytes (and neurons)
in the surrounding regions through a concentric wave of activation
centred on the NMDA pipette. We found that the Ca2+ response
of astrocytes as well as the recruitment of neurons into the ictal
discharge is more consistent with a process of modular
recruitments rather than with a propagation of a concentric wave
of activity (Figure S5).
Astrocyte activation was largely due to AP-mediated neuro-
transmitter release since 70.468.3% (n = 143, 5 experiments) of
the field A astrocytes, activated by a first double NMDA pulse,
failed to respond to a second double NMDA pulse applied
in the presence of TTX. The Ca2+ rise in still-responsive
astrocytes displayed slow kinetics and were of small amplitude
(DF/F0, 64.163.6 before and 29.062.2 after TTX; n = 41;
p,0.001). This residual astrocyte response in TTX could be
due either to neurotransmitter release mediated by activation of
presynaptic NMDA receptors [33] or to the direct activation by
NMDA of NMDA receptors that may be present on astrocytes
[34,35].
The results from these experiments indicate that the develop-
ment of a focal ictal discharge is accompanied by Ca2+ elevations
in astrocytes.
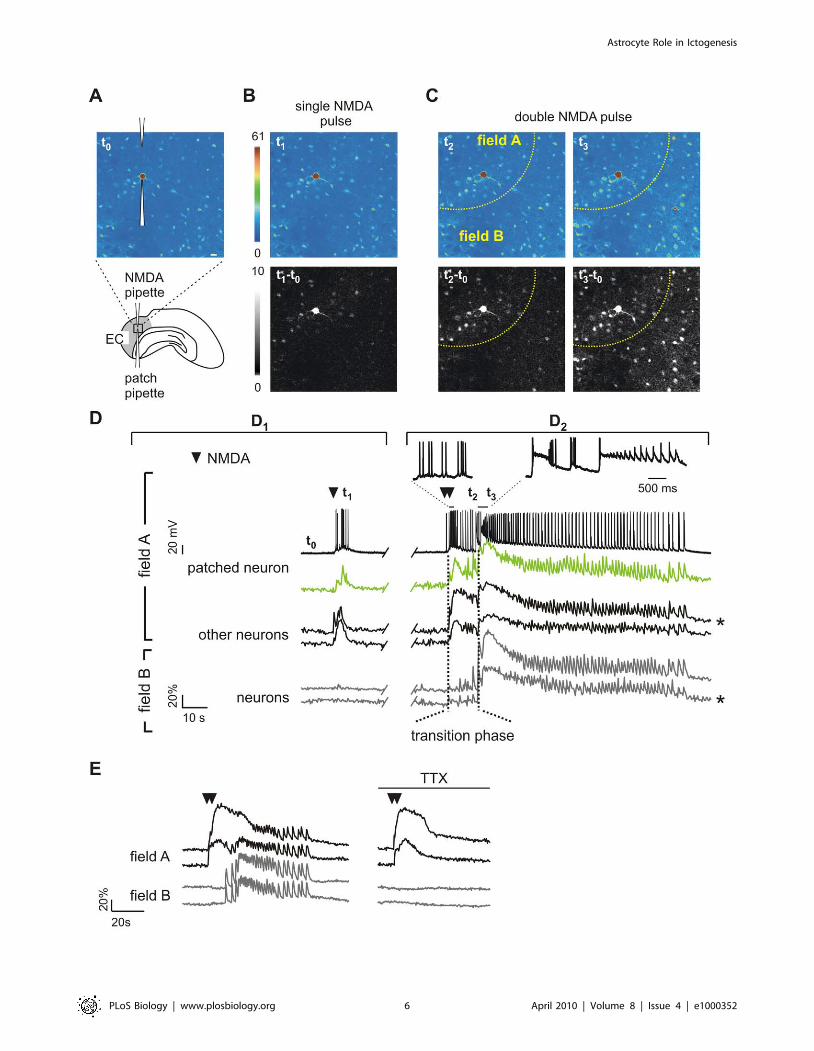
Figure 4. Local neuronal activation evokes ictal discharges. (A) Drawing and pseudocolour image of the Ca2+ signal at basal conditions (t0) ofan EC slice showing the NMDA-containing pipette and the patch pipette on a layer V neuron. Scale bar represents 20 mm. (B) Pseudocolour (t1) anddifference image (t1 2 t0) of local Ca2+ changes after a single NMDA pulse. (C) Pseudocolour and difference images of the Ca2+ response triggered bya double NMDA pulse. t2 and t2 2 t0 illustrate the initial Ca2+ elevation in neurons from the region close to the NMDA pipette (field A, dashed yellowline) and in some neurons from the surrounding field B. t3 and t3 2 t0 illustrate the Ca2+ change in all neurons reflecting the ictal discharge. (D) (D1)NMDA-induced AP firing from the patched neuron and Ca2+ changes from this (green trace) and other neurons from field A and field B after a singleNMDA pulse (indicated by a black arrowhead). (D2) AP bursts from the patched neuron (see also insets) and Ca2+ changes from this and otherneurons from field A and field B during the ictal discharge induced by a double NMDA pulse (black arrowheads). Vertical dashed lines mark thetransition phase from the onset of the direct response (left line) to the emergence of the ictal discharge in field B neurons (right line). t0-3 mark thetiming for the images shown in (A–C). *Traces are reported also in Figure 5. (E) TTX blocked the ictal discharge in both field A and B neurons, but notthe direct response of field A neurons to a double NMDA pulse (black arrowheads).doi:10.1371/journal.pbio.1000352.g004
Astrocyte Role in Ictogenesis
PLoS Biology | www.plosbiology.org 7 April 2010 | Volume 8 | Issue 4 | e1000352

Figure 5. The ictal discharge generation is accompanied by Ca2+ elevations in astrocytes. (A) Ca2+ changes of a field A neuron, a field Bneuron, and astrocytes in field A and field B from the same experiment illustrated in Figure 4A–4D. The single NMDA pulse fails to activate astrocytes(red and blue traces, left), whereas the double NMDA pulse evokes a large astrocyte Ca2+ rise that in field A (red traces, right) is associated with theinitial development of the ictal discharge, whereas in field B (blue traces, right), the rise follows it. Vertical dashed lines mark the transition phase.*Traces from Figure 4 are shown for comparison. (B) Image at high magnifications (dashed boxes in left panel) illustrating the early Ca2+ increase thatin field A astrocytes occurs during the transition phase (t1) and the late Ca2+ increase that in field B astrocytes occurs after the ictal discharge (t2).Arrows and arrowheads mark neurons and astrocytes, respectively. Scale bars represent 20 mm. (C) Percentage of field A astrocytes (13 experiments,262 responsive astrocytes) and field B astrocytes (12 experiments, 187 responsive astrocytes) that displayed an early or a late Ca2+ increase. (D) Left,
Astrocyte Role in Ictogenesis
PLoS Biology | www.plosbiology.org 8 April 2010 | Volume 8 | Issue 4 | e1000352
Selective Inhibition of Astrocytes Impairs Ictal DischargeGeneration
If this early Ca2+ elevation in astrocytes is not a mere
consequence of neuronal activity and has, instead, a causative
role in ictal discharge generation, its inhibition should reduce the
ability of NMDA to trigger an ictal discharge. To address this
hypothesis, we first bath applied MPEP and PPADS (n = 4) and
found that the direct activation of neurons by a double NMDA
pulse was unchanged, but early activated astrocytes were reduced
to 4.662.6% of controls. Under these conditions, the generation of
the ictal discharge in field A and the subsequent recruitment of
neurons into the epileptic discharge in field B were inhibited
(Figure 6A). The ictal discharge recovered after washout of the
antagonists and the reappearance of the associated Ca2+ elevation
in astrocytes. Interestingly, a stronger neuronal stimulation
obtained by increasing the number of successive NMDA puffs
evoked an ictal discharge, although of short duration, even in the
presence of MPEP/PPADS and without a recovery of astrocyte
Ca2+ signals (Figure 6A).
We also found that the NMDA-induced ictal discharge was
blocked after inhibition of the early responsive astrocytes in field A
by MPEP/PPADS applied locally to this region (Figure 6B; n = 4).
Ictal discharge recovery was regularly observed 5–10 min after
cessation of the MPEP/PPADS pulses. In contrast, applications of
MPEP/PPADS to a limited sector of field B failed to affect the
spread to field B of the ictal discharge generated in field A (n = 4).
However, it is noteworthy that the Ca2+ elevations in astrocytes
from this sector were poorly affected (Figure 6B).
Given that MPEP and PPADS are not selective antagonists of
Ca2+ signals in astrocytes, to provide a direct evidence for a causal
link between Ca2+ elevations in field A astrocytes and ictal
discharge generation, we inhibited Ca2+ signals in these astrocytes
selectively by introducing the Ca2+ chelator 1,2-bis(o-aminophe-
noxy)ethane-N,N,N’,N’-tetraacetic acid (BAPTA; 50 mM) into
individual astrocytes through a patch pipette [36].
First, we indirectly evaluated BAPTA spreading in the astrocyte
syncytium by patching single EC astrocytes with a Texas Red-
containing pipette. We counted 3167 red-labelled astrocytes in an
area of 242650 mm in diameter (Figure 7A). This value is close to
the size of the cortical region occupied by neurons that respond
directly with a transient Ca2+ rise to a double NMDA pulse
applied in the presence of TTX (Figure 7A). In subsequent
experiments, before patching a field A astrocyte with a BAPTA-
containing pipette, a double NMDA pulse was applied to trigger
an ictal discharge (Figure 7B and 7C). In five out of nine BAPTA
experiments, a double NMDA pulse applied 50 min after BAPTA
diffusion in the astrocyte syncytium failed to activate both the Ca2+
elevations in astrocytes and the ictal discharge (Figure 7B and 7C).
Notably, in these five experiments, the response of early activated
field A astrocyte was strongly reduced with respect to that
observed before BAPTA (Figure 7D). In these experiments, we
addressed the contribution of astrocytes in the activation of
neurons during the transition phase. In the presence of BAPTA,
which specifically inhibited Ca2+ signals in field A astrocytes, the
number of recruited neurons upon the double NMDA pulse was
33.163.2% lower than in controls (p,0.05). Such a reduction is
unlikely due to experimental variability in the intensity of the
NMDA stimulation since the number of neurons activated and the
amplitude of their Ca2+ responses to successive double NMDA
pulse stimulations (as measured in the presence of TTX) were
unchanged over a 50-min period (Figure S4). These observations
indicate that the recruitment of neurons into the ictal discharge is
also mediated by the early activated astrocytes that signal back to
neurons.
In the four experiments with BAPTA in which the ictal
discharge was preserved, most of the astrocytes in field A still
displayed an early Ca2+ response, suggesting a defective diffusion
of BAPTA in the astrocyte syncytium in these experiments
(Figure 7D). These data provide a plausible explanation for the
lack of inhibition of the ictal discharge in these BAPTA
experiments.
In a number of different control experiments, we found that i)
two subsequent double NMDA pulses applied before and 50 min
after patching either a neuron (n = 8) or an astrocyte (n = 4) with a
pipette not containing BAPTA always evoked comparable ictal
discharges, indicating that such a long time interval does not affect
the ability of a double NMDA pulse to trigger an ictal discharge; ii)
double NMDA pulses regularly evoked an ictal discharge even
after 50 mM BAPTA was puffed directly over the neurons for
2 min via a pipette (n = 4), indicating that a leakage of BAPTA,
putatively occurring during astrocyte seal formation, cannot
account for the ictal discharge inhibition observed in the BAPTA
experiments; iii) successive double NMDA pulses applied in the
presence of TTX over a period of 50 min, while patching single
astrocytes with a BAPTA-containing pipette, evoked an un-
changed response in neurons (Figure 7E), demonstrating that the
direct response of neurons to NMDA is not affected after BAPTA-
mediated inhibition of astrocyte Ca2+ signals.
We next asked whether the late activation of astrocytes in field B
contributes to the spreading of the ictal discharge. After patching
individual field B astrocytes with a BAPTA-containing pipette, we
observed that the ictal discharge evoked in field A by a double
NMDA pulse still invaded field B and further propagated to the
adjacent region, whereas the activation of field B astrocytes was
drastically affected both in terms of Ca2+ signal amplitude
(256.662.4%, p,0.001) and kinetics (time to peak, 2.660.4 s
and 15.263.3 s, before and after BAPTA, respectively; p,0.001;
Figure S6).
As a further control for the specificity of the BAPTA effect, we
demonstrated that the ictal discharge inhibition by BAPTA was
spatially restricted. After the astrocyte syncytium in region 1 was
loaded with BAPTA, a double NMDA pulse stimulation close to
the BAPTA-loaded region failed to trigger an ictal discharge,
whereas the same NMDA stimulation applied ,500 mm away
from region 1 readily evoked an ictal discharge (region 2,
Figure 7F–7H).
The ictal discharge blocked after the BAPTA-mediated
inhibition of field A astrocytes was recovered in two of three
experiments by applying a stronger stimulation of neurons, such as
a triple NMDA pulse (Figure 7I; white arrowheads). Notably is
that under these conditions, astrocytes recovered a Ca2+ response
that was, however, delayed and of reduced amplitude with respect
to that without BAPTA. These results are consistent with the
hypothesis that the astrocyte contribution to ictal discharge
generation is not an absolute requirement and can be bypassed
by a stronger stimulation of neurons, as already suggested by the
results obtained in MPEP/PPADS experiments.
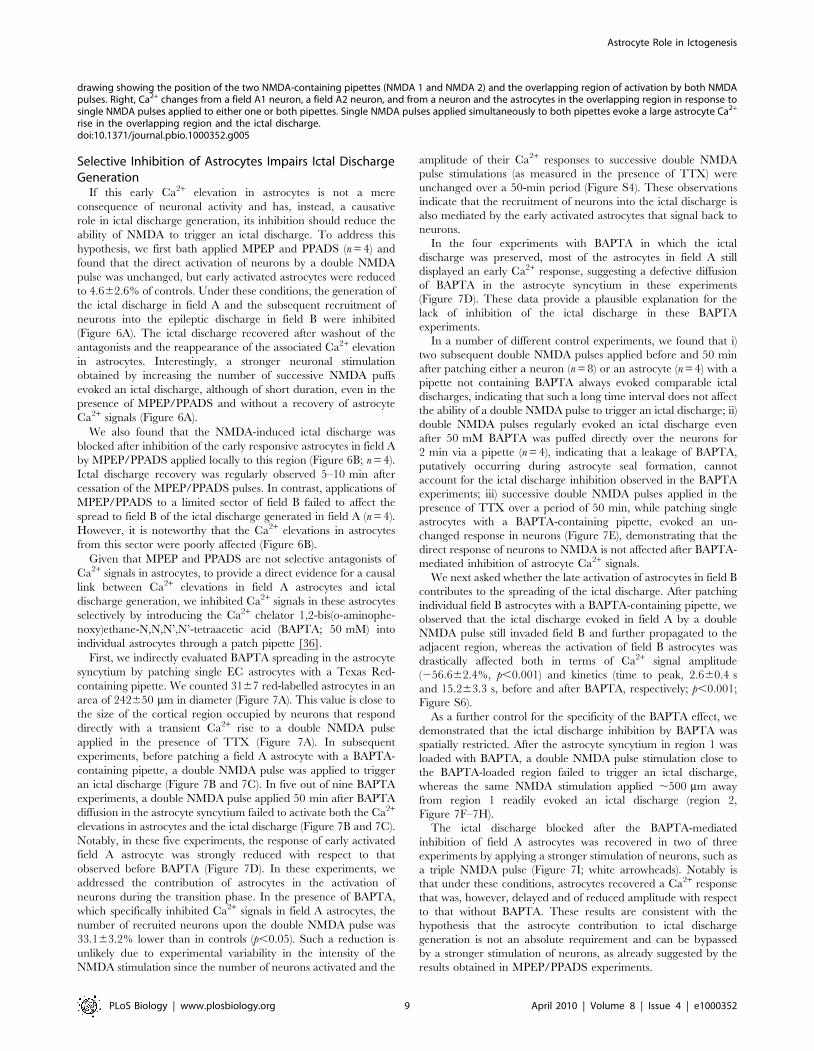
drawing showing the position of the two NMDA-containing pipettes (NMDA 1 and NMDA 2) and the overlapping region of activation by both NMDApulses. Right, Ca2+ changes from a field A1 neuron, a field A2 neuron, and from a neuron and the astrocytes in the overlapping region in response tosingle NMDA pulses applied to either one or both pipettes. Single NMDA pulses applied simultaneously to both pipettes evoke a large astrocyte Ca2+
rise in the overlapping region and the ictal discharge.doi:10.1371/journal.pbio.1000352.g005
Astrocyte Role in Ictogenesis
PLoS Biology | www.plosbiology.org 9 April 2010 | Volume 8 | Issue 4 | e1000352

Figure 6. Inhibition of field A astrocytes by MPEP/PPADS impairs ictal discharge generation. (A) Ca2+ signal from a field A neuron, a fieldB neuron, and field A astrocytes in response to repetitive episodes of NMDA stimulation (black arrowheads). The NMDA stimulation that evoked anictal discharge became ineffective after blocking the astrocyte response by bath perfusion with MPEP and PPADS. An ictal discharge could berecovered by increasing the number of NMDA puffs (white arrowheads). A double NMDA pulse evoked both astrocyte activation and the ictaldischarge after inhibitor washout. (B) Top, drawings of field A and B illustrating different experimental conditions. The three black arrows symbolizethe spreading of a focal ictal discharge. The red spots indicate the region of local MPEP/PPADS applications. Bottom, Ca2+ signal from a field Aneuron, a field B neuron, field A astrocytes, and field B astrocytes in response to repetitive episodes of NMDA stimulation (black arrowheads). Thedouble NMDA pulse that evoked an ictal discharge became ineffective after local MPEP/PPADS application to field A, but not to field B. Note also theabsence of ‘‘early’’ responsive astrocytes after MPEP/PPADS applications to field A, whereas ‘‘late’’ responsive astrocytes are only slight changed afterMPEP/PPADS applications to field B.doi:10.1371/journal.pbio.1000352.g006
Astrocyte Role in Ictogenesis
PLoS Biology | www.plosbiology.org 10 April 2010 | Volume 8 | Issue 4 | e1000352

Astrocyte Role in Ictogenesis
PLoS Biology | www.plosbiology.org 11 April 2010 | Volume 8 | Issue 4 | e1000352

Taken together, the results of these series of experiments
confirm the reliability of the double NMDA pulse paradigm in
evoking an ictal discharge over long time periods and, on the other
hand, validate the selective inhibition of astrocyte Ca2+ signals by
intracellular BAPTA application.
Selective Activation of Astrocytes Favours the Generationof Focal Ictal Discharges
If inhibition of Ca2+ signals in astrocytes can block the
generation of a focal ictal discharge, it would be expected that
direct astrocyte stimulation promotes ictal discharges. In the
experiments that addressed this hypothesis, we took advantage of
the finding that none of the 48 single NMDA pulses performed in
the 4-AP ictogenic model could generate an ictal event. Single
NMDA pulses that repetitively failed to trigger an ictal discharge
became effective when they were coapplied with TFLLR
(Figure 8). We found that a single NMDA pulse coupled with
TFFLR, evoked an ictal event in six of nine trials from a total of
three experiments. In these experiments, we also found that the
number of neurons activated by the NMDA/TFLLR coapplica-
tion during the transition phase was higher than that activated by
NMDA alone (mean increase, +119.3616.3%; n = 6; p,0.001).
These data confirm that the contribution of astrocytes in the
recruitment of neurons can be critical for the generation of the
ictal discharge.
Discussion
In brain slice models of seizures, the ictal discharge is proposed
to initiate at focal brain sites by asynchronous neuronal
hyperactivities that progressively recruit adjacent neurons into a
synchronous discharge [1,3–4]. In our study, we found that
neuronal hyperactivities at these restricted brain sites are
accompanied by Ca2+ elevations in a large number of astrocytes
that contribute to drive neurons towards seizure threshold.
The focal ictogenesis in our model is schematically illustrated in
Figure 9. This process starts with an isolated episode of local
neuronal hyperactivity that triggers a large and synchronous Ca2+
elevation in closely associated astrocytes (N1). These activated
astrocytes signal back to neurons (A1) favouring the recruitment of
neurons into a coherent activity that underlines the hypersyn-
Figure 9. Neuron–astrocyte loop in ictal discharge generation.Schematic of the sequence of events in the recurrent neuron–astrocyteexcitatory loop that develops at a restricted brain site to generateseizures. N1 and N2, neuron-to-astrocyte signalling; A1 and A2, astrocyte-to-neuron signalling.doi:10.1371/journal.pbio.1000352.g009
Figure 7. Selective inhibition of astrocytes impairs ictal discharge generation. (A) Maximal projection of a Texas Red–labelled astrocytesyncytium after patching a single astrocyte with a Texas Red–containing pipette in an EC slice. Top, bar graph reporting the mean size of the labelledastrocyte syncytium (n = 5) and of the region of neurons directly activated by NMDA (n = 4). Scale bar represents 20 mm. (B) Images from an EC sliceillustrating the Ca2+ signal in neurons and astrocytes from field A before and after BAPTA spreading in the astrocyte syncytium, at rest (t0 and t2,respectively) and after the NMDA stimulation (t1 and t3, respectively). Responsive neurons (black arrows) and astrocytes (white arrowheads) areindicated. Note the absence of astrocyte responses after BAPTA (t3). Scale bar represents 20 mm. (C) Ca2+ changes from some of the neurons andastrocytes indicated in (B). Also reported is the Ca2+ change of the ictal discharge from a field B neuron not present in the image (gray trace). TheNMDA stimulation that can evoke an ictal discharge becomes ineffective after inhibition of the astrocyte Ca2+ signal in field A by BAPTA (red traces).(D) Change in the number of early responsive field A astrocytes and in the amplitude of the Ca2+ increase activated by a double NMDA pulse appliedafter BAPTA spreading in the astrocyte syncytium, expressed as percentage of control values, i.e., before BAPTA dialysis, in the experiments in whichBAPTA inhibited, or failed to inhibit, the ictal discharge. One-sample Student t-test, an asterisk (*) indicates p,0.05. (E) Number of responsive neuronsand amplitude of the Ca2+ signal after repetitive double NMDA pulses applied in the presence of TTX during BAPTA spreading in the astrocytesyncytium (n = 3), expressed as relative values with respect to measurements performed before BAPTA spreading. (F) Differential interference contrastimage of an EC slice showing the BAPTA-containing pipette (arrowhead) and the first location of the NMDA pipette (asterisk in region 1) that wasused to trigger the first ictal discharge. The NMDA pipette was then moved to region 2 and its tip is indicated by the two asterisks. Dashed circleindicates the field A in each region. The small circles mark the position of a field B neuron in region 1 (neuron 1) and in region 2 (neuron 2). Scale barrepresents 100 mm. (G) Double NMDA pulse–induced ictal discharge in field A and B neurons in region 1 and its failure 50 min after BAPTA spreadingin the astrocyte syncytium. (H) Recovery of the ictal discharge evoked by a double NMDA pulse after moving the NMDA pipette to region 2. (I) Ca2+
changes in field A and B neurons and field A astrocytes illustrating the inhibition of the ictal discharge by BAPTA in a different EC slice and its recoveryafter increasing the NMDA stimulation to three pulses (white arrowheads). Note that after increasing the NMDA stimulation, astrocyte activationpartially recovers, but the response is delayed and develops after the emergence of the ictal discharge in field B neurons.doi:10.1371/journal.pbio.1000352.g007
Figure 8. Selective astrocyte activation favours focal ictaldischarges. In the 4-AP model, single NMDA pulses evoke the ictaldischarge only when an astrocyte Ca2+ increase is induced by TFLLR.doi:10.1371/journal.pbio.1000352.g008
Astrocyte Role in Ictogenesis
PLoS Biology | www.plosbiology.org 12 April 2010 | Volume 8 | Issue 4 | e1000352

chronous ictal discharge. This event, in turn, triggers a second
activation of astrocytes (N2). The secondary astrocyte activation
may then contribute to sustain the ictal discharge (A2). This
sequence of events represents a recurrent neuron–astrocyte
excitatory loop that drives neurons towards the ictal discharge
threshold.
Since our slice experiments were performed mainly in young
animals, the role of astrocytes to seizure generation may be
restricted to the immature brain. Although additional experiments
are necessary to clarify this important issue, the ability of astrocytes
to release glutamate and activate neuronal SICs in slices from
young adult rats [8,28,37,38] suggests that astrocyte-to-neuron
signalling may contribute to seizure initiation also in the adult
brain.
The Early Ca2+ Elevation in Astrocytes Has a CausativeRole in Ictal Discharge Initiation
In EC slices perfused with the proconvulsant agent 4-AP in low
Mg2+ conditions, we found that a synchronous Ca2+ elevation in a
high number of astrocytes occurred along with the development of
the ictal discharge evoked by a local NMDA application. This
response was largely TTX sensitive, indicating that astrocytes were
activated by AP-mediated neurotransmitter release. Most impor-
tantly, the early astrocyte activation was a crucial step in the
generation of ictal discharges. Indeed, when Ca2+ elevations in
field A astrocytes were inhibited by BAPTA, the episode of
neuronal hyperactivity induced by NMDA failed to generate an
ictal discharge. According to results obtained from different
control experiments, the effect of BAPTA on ictal discharge
generation was specifically linked to the inhibition of astrocyte
Ca2+ signals.
The Ca2+ elevations in astrocytes are associated with the release
of gliotransmitters, such as glutamate [39–41] and D-serine [42],
that modulates neurotransmitter release [24,43,44], triggers AP
firing in neurons [10], and promotes local neuronal synchrony
[8,28]. Ca2+-dependent release of D-serine from astrocyte
activated by Schaffer collateral stimulation has been also recently
shown to be crucial for the potentiation of synaptic transmission in
the CA1 hippocampal region [45]. As previously reported in the
hippocampus [25,26], we show here that Ca2+ elevations
stimulated in EC astrocytes by the PAR-1 receptor agonist,
TFLLR, triggers glutamate release in these cells and, in turn,
NMDA receptor–mediated SICs in neurons. The activation of
neurons by gliotransmission can thus account for the finding that a
single NMDA pulse, ineffective per se, was able to trigger the ictal
discharge if coupled with the direct stimulation of a Ca2+ rise in
astrocytes by TFLLR. Data analysis of these experiments revealed
that the number of neurons activated after NMDA/TFLLR
coapplication was higher than that activated after NMDA alone.
These results suggest that when an episode of hyperactivity in a
group of neurons consistently engages nearby astrocytes, a larger
population of neurons is recruited into a coherent activity. If this
feedback signal operates on a brain network prone to seizures, it
contributes to drive neurons towards the ictal discharge threshold.
The initiation site is thus represented, not only by the neurons
activated by NMDA, but also by those that are secondarily
activated in a recruitment process that involves astrocytes.
Consistent with this view is our finding that when a double
NMDA pulse (that successfully evoked an ictal discharge) was
applied either after BAPTA was introduced in the astrocyte
syncytium or after local applications of MPEP/PPADS to the site
of activation, astrocytes were poorly activated, fewer neurons were
recruited, and no ictal discharge was evoked. Further support for
this conclusion derives from the experiments with a single NMDA
pulse delivered from two pipettes positioned at different distances.
These experiments revealed that an ictal discharge could be
evoked when astrocytes from the region of overlapping neuronal
activation were activated. When the pipette tips were more distant,
the overlapping region was reduced, astrocytes were poorly
activated, and no ictal discharge was evoked.
Distinct subpopulations of astrocytes might differently contrib-
ute to modulate neuronal hyperactivity in the epileptogenic region,
possibly by releasing in addition to glutamate, ATP, and other
neuroactive signals, e.g., GABA, through a Ca2+-dependent or -
independent mechanism [46,47]. Given that inhibitory interneu-
rons have been reported to restrain the recruitment of neurons
during the development of the ictal discharge [4,48], an opposite
action of astrocytes in this process might involve a distinct
inhibition of interneurons by GABA released from astrocytes.
Indirect support for this possible astrocyte action derives from the
observation that GABA released from astrocytes can, indeed,
result in a long-lasting inhibition of inhibitory granule cell activity
in the olfactory bulb [37]. Whether a similar signalling between a
subpopulation of GABA-releasing astrocytes and interneurons
may be involved in ictal discharge initiation in the EC represents
an interesting question to be addressed in future studies.
Episodes of focal seizures can arise in a nonepileptic tissue due
to genetic causes or as a consequence of various brain damage.
These may lead to status epilepticus (SE), a condition of persistent
seizures, and evolve into chronic epilepsy after a latent period of
epileptogenesis. Our results were obtained in nonepileptic brain
tissue and provide evidence for the contribution of astrocytes in the
initiation of seizure during SE. Therefore, whether astrocytes
contribute also to seizure initiation in chronic epilepsy is, at
present, unknown and should be appropriately investigated in
chronic epilepsy models. However, results from a recent in vivo
study showed that astrocytes, which exhibited long-lasting Ca2+
oscillations during SE, contributed to the neuronal death that
characterizes chronic epilepsy [38]. This effect was due to
astrocytic glutamate that activated neuronal NMDARs, possibly
favouring seizure generation. It is also worth underlining that in
the epileptic brain tissue, astrocytes undergo significant changes in
their physiological properties that may result in decreased
glutamate uptake, altered extracellular K+ buffering capacities,
and activation of inflammatory pathways [49,50]. All these
changes may contribute to the increased neuronal network
excitability that characterizes the epileptic brain.
The Astrocyte Contribution to Ictal Discharge GenerationDepends on Neuronal Excitability Levels
The efficacy of astrocyte stimulation in evoking an epileptic
discharge was different in the two models used in the present
study, probably because of differences in their intrinsic neuronal
predisposition to ictal discharge generation. As suggested by the
presence of recurrent spontaneous epileptic discharges, the
picrotoxin/zero-Mg2+ model can be considered, indeed, a model
with a low-threshold for epileptic discharges. In this model, a
single NMDA pulse triggered synchronous activity in a number of
neurons sufficient to reach the ictal discharge threshold, and a
single stimulation of astrocytes was also sufficient to trigger an ictal
discharge. As suggested by the absence of spontaneous epileptic
events, the 4-AP model has a higher threshold for epileptic
phenomena. In this model, seizure discharges could be triggered
by a more prolonged and intense episode of neuronal activity
induced by a double NMDA pulse, and not by single NMDA or
TFLLR pulses. An ictal discharge could be also evoked when a
single NMDA application (ineffective per se) was coupled with
TFLLR-mediated astrocyte activation. Furthermore, the reduc-
Astrocyte Role in Ictogenesis
PLoS Biology | www.plosbiology.org 13 April 2010 | Volume 8 | Issue 4 | e1000352
tion in astrocyte Ca2+ signals blocked the ictal discharge in the 4-
AP model, but not in the picrotoxin/zero-Mg2+ model. These data
demonstrate that experimental manipulations of the astrocyte
Ca2+ signals can influence neuronal recruitment and thus affect, in
concert with the level of neuronal activity, the likelihood of ictal
events.
As revealed by results from both BAPTA and MPEP/PPADS
experiments, when the astrocyte contribution was reduced by
inhibiting Ca2+ signals in these cells and the double NMDA pulse
consequently failed to evoke an ictal discharge, we could recover
an ictal discharge by applying a more intense NMDA stimulation.
By activating directly a larger number of neurons, this higher
stimulus evokes a level of correlated activity that is sufficient for
seizure-like discharge generation, bypassing the astrocyte contri-
bution in the recruitment process. Thus, astrocyte activation is not
an absolute requirement for ictal discharge generation.
However, astrocytes respond readily to synaptic activity with
Ca2+ oscillations [16,23,51], and the frequency of these oscillations
increases in parallel with an increased neuronal activity [16]. In
vivo studies also revealed that sensory stimuli can evoke distinct
Ca2+ elevations in astrocytes confirming the strict association
between neuron and astrocyte activities [52–55]. Thus, patholog-
ical hyperactivities in neurons [6] should be regularly accompa-
nied by an increased astrocyte activity. In support of this view,
studies in brain slices showed that chemically induced epileptiform
activity causes a sustained increase in astrocyte Ca2+ signalling
[9,10], and in vivo studies reported a long-lasting hyperactivity of
astrocytes after pilocarpine-induced SE [38]. It is conceivable that
a pathological hyperexcitability that predisposes neurons to seizure
discharges may originate from abnormalities in the neuron–
astrocyte network activity, whatever the origin of the initial
dysfunction might be. As we showed here, depending on the
different level of excitability in neurons, the astrocyte contribution
varies, but it can even be crucial for ictal discharge generation.
Ictal, but Not Interictal, Discharges Activate a SecondaryAstrocyte Ca2+ Elevation
In our 4-AP slice model, a second Ca2+ elevation even of larger
amplitude than that early evoked by the double NMDA pulse,
occurred in astrocytes in both field A and field B. This delayed
activation of astrocytes was observed also after the spontaneously
occurring ictal discharges in the picrotoxin/zero-Mg2+ model in
both rats and pGFAP-EGFP transgenic mice, as well as in other
models such as the 4-aminopyridine/picrotoxin and high-potas-
sium models (unpublished data). Most importantly, this observa-
tion was validated in the intact guinea pig brain preparation, a
well-characterized model of EC–hippocampus focal ictogenesis
[20,21]. In this close to in vivo preparation, the development of the
ictal discharge was regularly accompanied by a Ca2+ elevation in
virtually all astrocytes present in the recording field, whereas large-
amplitude interictal discharges were never associated with a
significant Ca2+ change in astrocytes. This Ca2+ elevation and the
following release of gliotransmitters may contribute to the
maintenance of AP bursts and to the process of neuronal
recruitment that characterize seizure discharge propagation. Our
finding that the duration of the ictal discharges was significantly
reduced upon inhibition of the astrocyte Ca2+ signal by bath
perfusion with MPEP or PPADS is consistent with this hypothesis,
which needs, however, to be specifically addressed in future
experiments.
In the present study, we also addressed a possible role of the late
astrocyte response in the propagation of the ictal discharge outside
the focal region. After BAPTA introduction in field B astrocyte
syncytium, the ictal discharge still propagated to this region and
further, suggesting that Ca2+ elevations in field B astrocytes may
have no role in this process. Given that initiation, propagation and
cessation of the ictal discharge are likely governed by distinct
mechanisms [3], it would not be surprising that astrocytes have,
indeed, a role in ictal discharge initiation but not in propagation.
This conclusion is, however, reasonable, but it is not proven
beyond all doubt. Indeed, the inhibition by BAPTA could be
exerted only in astrocytes from a small sector of the large field B,
whereas astrocytes outside this sector were totally unaffected.
Their activation might thus be sufficient to sustain the propagation
of the ictal discharge even to the small sector where astrocytes
were inhibited by BAPTA. As to MPEP/PPADS, when locally
applied to field B, these competitive receptor antagonists failed to
inhibit the ictal discharge propagating to this region. These results,
however, do not allow us to draw any conclusions since the ictal
discharge invading field B still activated a significant response in
astrocytes even in the presence of MPEP/PPADS. To clarify this
point, another experimental approach is thus required.
It is unclear why MPEP/PPADS failed to inhibit the Ca2+
elevation evoked by the ictal discharge in field B astrocytes. It is
likely that, with respect to the NMDA pulse, the ictal discharge
represents a more powerful stimulus that triggers the release of
glutamate and ATP. Accordingly, the extracellular concentration
of MPEP/PPADS reached after local applications might have
been insufficient to inhibit the large activation of astrocyte mGlu
and P2 receptors upon the ictal discharge. However, mechanisms
other than mGlu and P2 receptor activation may be also involved
in this astrocyte response.
Interictal discharges failed to activate significantly a Ca2+
elevation in astrocytes. Recently, it has been reported that
glutamate release triggered by Ca2+ elevations in astrocytes plays
a predominant, if not obligatory role in the generation of epileptic
activity in the hippocampus and, in particular, in the slow
depolarization shift associated with interictal discharges [9]. This
conclusion is, however, at variance with a number of studies
showing that both interictal and ictal seizure-like discharges from
different brain regions, including the hippocampus, are strictly
linked to neuronal activity being efficiently prevented or blocked,
depending on the time of application, by TTX [10,38,56–58]. In
the present study, we observed that i) the interictal activity was not
blocked after Ca2+ elevations in astrocytes were drastically
reduced; and ii) synchronous astrocyte Ca2+ elevations were never
observed to accompany an interictal discharge in the different
models. We thus failed to confirm a role of astrocytic glutamate in
interictal discharge generation. The reasons for this discrepancy
are, at present, unknown.
Conclusions and PerspectivesThe present study reveals a crucial role of neuron–astrocyte
interactions in sculpting activity at the epileptogenic zone. When a
group of neurons is abnormally active (due to acquired or genetic
causes), ictal epileptiform events may occur through the activation
of astrocytes. Astrocytes can thus play a key role in seizure
initiation in a nonepileptic brain tissue and, in contrast to previous
observations [9], do not appear to be involved in the generation of
the interictal events. This peculiarity makes the astrocyte–neuron
unit a primary target for novel drug development aimed at
interfering selectively with ictogenesis, without affecting the
interictal activity that, by preventing seizure precipitation, may
have a beneficial role in focal epilepsies [59,60].
The high reproducibility in the generation of comparable ictal
discharges represents an important advantage of our new EC slice
model of ictogenesis. This model allowed us to investigate the early
events that, at a restricted brain site, predispose neurons to seizure
Astrocyte Role in Ictogenesis
PLoS Biology | www.plosbiology.org 14 April 2010 | Volume 8 | Issue 4 | e1000352
and to obtain some insights into the mechanism of focal ictal
generation that involves astrocytes. Other aspects that were not
addressed in the present study, such as the neuronal recruitment
process during the diffusion of the ictal discharge to regions distant
from the site of ictal discharge generation, could be investigated in
this model. These acute experiments set the conditions for
validating the mechanisms here described in future studies in
chronic models of epilepsy, including genetically determined in
vivo models of epilepsy, that more closely mimic the complex
feature of seizures in epileptic patients. A validation of the
astrocyte role in seizures generation in these models is fundamen-
tal to provide further arguments in favour of astrocytes as targets
for developing new therapeutic strategies for epilepsies.
Materials and Methods
Ethics StatementAll experimental procedures were authorized by the Italian
Ministry of Health.
Brain Slice, Guinea Pig Brain Preparations, and DyeLoading
Transverse cortico-hippocampal slices were prepared from
postnatal day 14–18 Wistar rats or pGFAP-EGFP transgenic
mice [61], and loaded with OGB1-AM (excited at 488 nm) or
Rhod-2 (excited at 543 nm), respectively, as previously described
[8]. Briefly, brain was removed and transferred to ice-cold cutting
solution containing (in mM): NaCl, 120; KCl, 3.2; KH2PO4, 1;
NaHCO3, 26; MgCl2, 2; CaCl2, 1; glucose, 10; Na-pyruvate, 2;
and ascorbic acid, 0.6; at pH 7.4 (with 5% CO2/95% O2).
Coronal slices were obtained by cutting with a Leica vibratome
VT1000S in the presence of the ionotropic glutamate receptor
inhibitor kynurenic acid (2 mM). Slices were recovered for 15 min
at 37uC and then loaded with the Ca2+-sensitive dye OGB1-AM
(Invitrogen) for 60 min at 37uC. Loading was performed in the
cutting solution containing sulfinpyrazone (200 mM), pluronic
(0.12%), and kynurenic acid (1 mM). After loading, slices were
recovered and kept at room temperature in the presence of
200 mM sulfinpyrazone. Brains from postnatal day 14–20 guinea
pigs were isolated and perfused at a rate of 5.5 ml/min through
the basilar artery [19,62] with a solution containing (in mM):
NaCl, 126; KCl, 3; KH2PO4, 1.2; MgSO4, 1.3; CaCl2, 2.4;
NaHCO3, 26; glucose, 15; and 3% dextran M.W. 70.000;
oxygenated with a 95% O2/5% CO2 gas mixture (pH 7.3). The
dye OGB1-AM (50 mg) was diluted in 5 ml of standard pluronic/
DMSO solution and 75 ml of saline, and filtered through a 0.2-mm
microfilter (Millipore). A patch pipette (3–4 MV was used to
pressure inject (1–2 min at 4 PSI) the Ca2+ dye into the EC at a
depth of about 200 mm via a picospritzer (NPI Electronics).
Following this procedure, the Ca2+ signal from astrocytes, neurons,
and neuropile was monitored. All experiments were performed at
33–35uC.
Ca2+ ImagingIn slice experiments, we used a TCS-SP2-RS or a TCS-SP5-RS
confocal microscope (Leica) equipped with a 206 objective (NA,
1.0) and a CCD camera for differential interference contrast
images. For experiments on isolated guinea pig brains, we used a
Fluoview 300 scanning head customized for two-photon micros-
copy equipped with a 5W Verdi-Mira laser (Coherent) tuned at
830 nm and external photomultipliers (Hamamatsu). Time frame
acquisitions from 314 ms to 1.24 s (with one to six line averaging)
were used. No background subtraction or other manipulations
were applied to digitized Ca2+ signal images that are reported as
raw data, with the exception of the difference images in Figure 4
that were obtained by subtracting the prestimulation image from
the poststimulation image. In brain slice preparations, neurons
and astrocytes were distinguished on the basis of the distinct
kinetics of their Ca2+ response to a stimulation with high K+
extracellular solution (40 mM) obtained by isosmotic replacement
of Na+ with K+ [16], applied at the end of the recording session in
the presence of 1 mM TTX (Figure S7). Due to the lack of voltage-
dependent Ca2+ channels in astrocytes, the Ca2+ elevation in these
cells upon high K+ stimulation occurs with a delay of several
seconds with respect to the response in neurons, and appears to be
mediated by glutamate release from depolarizing neurons [17]. In
the present study, the presence of TTX was necessary to block the
epileptic discharges and the underlying Ca2+ changes in neurons
and astrocytes that would have hampered the possibility to
distinguish these cells from their different responses to high K+
stimulation. Astrocytes were identified also by their small size, low
membrane potentials (27460.4 mV without the correction for
the liquid junction potential at the pipette tip, which was 15 mV;
n = 9), and passive responses to a series of depolarizing steps. In
slices from pGFAP-EGFP mice, astrocytes were identified by their
green GFP fluorescence. In the guinea pig brain, astrocytes were
identified using the astrocyte-specific marker sulforhodamine 101
(Invitrogen) applied at 100 mM to the cortical surface [63]. The
onset of the slow Ca2+ elevation in astrocytes was determined on
the basis of a threshold criterion. The onset was identified by the
change in DF/F0 that should be more than two standard
deviations over the average baseline and remained above this
value in the successive frames for at least 2 s (two to six frames,
depending on the frame acquisition rate).
Electrophysiology and NMDA Pulse ApplicationsRat brain slices in a submerged chamber (Warner Instruments)
were continuously perfused at a rate of 2 ml/min with (in mM):
NaCl, 120; KCl, 3.2; KH2PO4, 1; NaHCO3, 26; MgCl2, 1;
CaCl2, 2; glucose, 10; sulfinpyrazone, 0.2; at pH 7.4 (with 95%
O2/5% CO2). Whole-cell patch-clamp recordings in rat brain
slices were performed using standard procedures and one or two
Axopatch-200B amplifiers (Molecular Devices), as previously
reported [8]. Typical pipette resistance was 3–4 MV for neurons.
Data were filtered at 1 kHz and sampled at 5 kHz with a Digidata
1320 interface and pClamp8 software (Molecular Devices).
Whole-cell intracellular pipette solution was (in mM): K-gluconate,
145; MgCl2, 2; EGTA, 0.5; Na2ATP, 2; Na2GTP, 0.2; HEPES,
10; to pH 7.2 with KOH, and contained a low concentration
(10 mM) of OGB1 (Invitrogen); osmolarity, 305–315 mOsm. Data
analysis was performed with Clampfit 8 and Origin 6.0 (Microcal
Software) software. SICs with an amplitude greater than 20 pA
and a rise time slower than 10 ms are classified as SICs, as
described previously. SIC rise time was calculated with the 20%–
80% criterion and the decay time as the time constant of a single
exponential fit. The delay of each SIC activated in neurons after
astrocyte stimulation with TFLLR was calculated with respect to
the peak of the immediately preceding astrocyte Ca2+ increase.
Interictal and ictal seizure-like events resembling those recorded at
the electrographic recordings from patient’s brain [21], at a
cellular level manifest as intense and hypersynchronous discharges
that involve large neuronal population and fundamentally differ in
their duration. Despite this common characteristic, they have
radically different durations. Indeed, the duration of the epileptic
event was an important criterion for classifying interictal and ictal
events in slice and the isolated whole guinea pig brain
preparations. In Ca2+ imaging experiments, interictal events lasted
less that 3 s, whereas ictal discharges were sustained for tens of
Astrocyte Role in Ictogenesis
PLoS Biology | www.plosbiology.org 15 April 2010 | Volume 8 | Issue 4 | e1000352
seconds with a final pattern of highly synchronous afterdischarges.
The duration of ictal events varied between 15 and 110 s in brain
slices and between 21 and 152 s in the guinea pig brain. Postictal
depression was also consistently observed after an ictal event,
whereas it was not present after an interictal spike [21]. A pressure
ejection unit (PDES, NPI Electronics) was used to apply pressure
pulses (4–10 psi, 200–600 ms duration) to NMDA-containing
pipettes. Pulse pressure (or duration) was increased until a double
NMDA pulse evoked an ictal discharge. The stimulus parameters
for successive stimulations remained unchanged over the entire
recording session, except in the BAPTA experiments in which they
were changed to increase the stimulation of neurons by NMDA
and thus to recover the ictal discharge after inhibition of Ca2+
signals in astrocytes. In the double NMDA pulse, the interval
between the two pulses was 3 s. NMDA pulses applied with
intervals of 5 s, but not 20 s also triggered an ictal discharge
(unpublished data). For BAPTA dialysis into the astrocyte
syncytium, we used a patch pipette (5–6 MV; 310–315 mOsm)
containing (in mM): K-methylsulfate, 50; ATP, 2; GTP, 0.4;
HEPES, 10; BAPTA, 50. To avoid a leakage of BAPTA from the
pipette during seal formation, the BAPTA solution was backfilled
after loading the tip with a standard intracellular solution. Texas
Red dye (excited at 543 nm) was included at 0.2 mM in a patch
pipette containing standard solution and monitored 50–60 min
after the whole-cell configuration. For the BAPTA and Texas Red
experiments, only GluT (coupled) astrocytes were included. GluT
(coupled) and GluR (uncoupled) astrocytes were distinguished
according to their different responses to hyperpolarizing and
depolarizing current pulses of increasing amplitude and 750 ms
duration. Field potentials were recorded from the guinea pig brain
with saline-filled micropipettes used to deliver OGB1-AM, via a
multichannel differential amplifier (NPI Electronics). A precise
allignement of Ca2+ and electrophysiological signals was achieved
by acquiring with a syncronisation signal produced by the confocal
microscope. Tip potential was measured against a ground
reference placed in the recording chamber by means of a voltage
follower coupled to an amplifier.
DrugsMPEP (50 mM), PPADS (10 mM), TTX (1 mM), D-AP5
(50 mM), 4-AP (100 mM; Ascent Scientific), TFLLR (10 mM;
Tocris), and picrotoxin (50 mM; Sigma-Aldrich) were bath applied.
TFLLR (1 mM) and NMDA (1 mM; Sigma-Aldrich) were
pressure applied. To induce local astrocyte inhibition, we applied
pressure pulses of 2 s per 5 min at a frequency of 0.1 Hz to a
pipette containing MPEP (500 mM) and PPADS (5 mM).
Bicuculline methiodide (50 mM; Sigma-Aldrich) was applied by
arterial perfusion to guinea pig brains.
Monte Carlo Simulation ProceduresThe Monte Carlo simulation was designed to test whether the
observed series of stimuli and ictal episodes were compatible with a
random distribution. Each simulation run generated randomly
distributed stimuli and ictal events based on i) recording duration;
ii) number of stimuli and ictal events; iii) minimum interval
between stimuli; iv) minimum interval between two successive ictal
events; and v) minimum interval between a stimulus and an ictal
event (ictal events seem to be followed by at least 20 s of refractory
period). These rules imply that the occurrence of ictals and pulses
are not completely independent. The random generator produced
30,000 temporal series for each experimental run, using
experiment-specific parameters. Figure S2A shows an experiment
and three simulated runs. The distance between each stimulus and
the first following ictal events were computed for each simulation.
The datasets were used to compute the density probability p(t) of
observing one ictal at time t after an astrocyte activation (Figure
S2B). The cumulative probability CP(t) is obtained by the
integration of the probability density and yields the probability
of observing an ictal at a time #t under the hypothesis that stimuli
and ictals are not causally related (Figure S2C). Each ictal event in
the experiment was associated with the delay from the immedi-
ately preceding stimulus, and the probability of observing the ictal
was calculated. If the cumulative probability was less than 0.05,
the event was deemed as not satisfying the null hypothesis. Results
are presented in Figure S2D.
ImmunocytochemistryCoronal slices (100-mm thick) of rat brains were cut with a VT
1000S vibratome (Leica) and directly fixed for 1 h in iced 4%
paraformaldehyde in phosphate-buffered solution (PBS). Floating
sections were first preincubated in a blocking solution (BS; 1%
BSA, 2% horse serum, and 2% goat serum) containing 0.3% triton
X-100 and subsequently incubated with the primary mouse anti-
thrombin receptor PAR-1 antibody (1:300, Zymed Laboratories,
Invitrogen) and rabbit anti-GFAP (1:500, Dako) diluted in BS.
After 24 h, slices were washed at 4uC in PBS and incubated with
the secondary antibodies (Cy3 conjugated donkey anti-mouse IgG,
and Cy2 conjugated goat anti-rabbit F(ab’)2 fragments; Chemicon
International) for 2 h at room temperature. Slices were extensively
washed in PBS, mounted in Elvanol, and observed with a Leica
SP2 laser scanning confocal microscopy. Negative controls were
performed in the absence of the primary antibodies. Images were
assembled using CS Adobe Photoshop software.
Data AnalysisThe Ca2+ signal is reported as DF/F0, where F0 is the baseline
fluorescence. Data are shown as mean 6 standard error of the
mean (S.E.M.). Unless stated otherwise, the Student t-test was
used, with p values #0.05 taken as statistically significant.
Supporting Information
Figure S1 Interictal events activate in astrocytes only anincrease in Ca2+ oscillation frequency. (A) Representative
experiment from a rat hippocampal slice showing the Ca2+
elevations in CA3 neurons (black trace, averaged signal from all 20
neurons monitored) corresponding to interictal discharges in the
picrotoxin/zero-Mg2+ model. This interictal discharge activity is
accompanied by an increase in Ca2+ oscillation frequency in
astrocytes (blue traces). (B) Bar graphs reporting the mean
astrocyte Ca2+ oscillation frequency in controls and during
interictal activity. *p,0.05. (C) 2P-LSM images from the EC of
a guinea pig brain before (t0), during (t1), and after (t2) an interictal
discharge induced by arterial perfusion with bicuculline. Astro-
cytes (white arrowheads), neuropile (dashed circle), and a neuron
(yellow arrow) are indicated. Scale bar represents 20 mm. (D) Field
potential recording of two interictal discharges and correlated
Ca2+ changes in the neuropile and the neuron indicated in (C). No
correlated Ca2+ changes were observed from the two astrocytes
(arrowheads in [C]).
Found at: doi:10.1371/journal.pbio.1000352.s001 (0.72 MB TIF)
Figure S2 Analysis by Monte Carlo simulation. (A)
Diagram representing the entire length of the recording of the
experiment partially reported, in terms of Ca2+ signal changes in
neurons and astrocytes, in Figure 3F. Horizontal bar on the top
marks the timing of the traces shown in Figure 3F. Black bars
indicate the peak of the astrocyte Ca2+ response triggered by
TFLLR stimuli, and the green boxes correspond to the ictal
Astrocyte Role in Ictogenesis
PLoS Biology | www.plosbiology.org 16 April 2010 | Volume 8 | Issue 4 | e1000352
events. The three underlying rows represent three results from the
Monte Carlo simulation procedure (see Materials and Methods).
(B and C) Density probability (B) and cumulative probability (C)
computed from the Monte Carlo simulation for the depicted
experiment in (A). Green arrowheads indicate the p value for the
five ictal events occurring during the recording. These are the
probabilities for each ictal to be independent from the astrocyte
activation. The value 1 2 p (reported in [D]) is the probability of
correlation of the timing of the ictal discharge with the astrocyte
Ca2+ increase. (D) Graph reporting the probability that the 15 ictal
events (black dots) observed in six experiments are correlated
positively with an astrocyte Ca2+ increase induced by TFLLR in
the picrotoxin/zero-Mg2+ model.
Found at: doi:10.1371/journal.pbio.1000352.s002 (0.35 MB TIF)
Figure S3 In the picrotoxin/zero-Mg2+ model, a singleNMDA application is sufficient to trigger epileptiformdischarges. Representative experiment showing the effect of
single local NMDA stimulation (arrowheads) on neurons from an
EC slice perfused with picrotoxin/zero-Mg2+. The Ca2+ signal
from a neuron in the region close to the NMDA pipette tip (blue
trace) and the current-clamp recording from a neuron located in a
region distant from the NMDA pipette (black trace) revealed that
NMDA puffs could induce a local response that either remained
restricted (open arrowheads) or triggered a response (black
arrowheads) that evolved into an interictal (second and third
puffs) or an ictal event (fifth puff). Spontaneous and evoked
interictal and spontaneous and evoked ictal discharges recorded
from the patched neuron are undistinguishable (see lower panels).
This observation validates our model since it suggests that both
events i) are sustained by a similar number and subtype of active
cells; and ii) rely on a common basic mechanism.
Found at: doi:10.1371/journal.pbio.1000352.s003 (0.46 MB TIF)
Figure S4 The ictal discharge triggered by a localneuronal stimulation is highly reproducible. (A) Pair
recordings showing that successive ictal discharges occur in both
field A and B neurons, whereas only field A neurons showed a
direct NMDA effect. (B) Mean duration of successive ictal
discharges evoked by repetitive double NMDA pulses expressed
as relative values with respect to the first two ictal episodes. (C)
Number of responsive neurons and mean Ca2+ change after
repetitive double NMDA pulses applied in the presence of TTX
(n = 3). Data are expressed as percentage of the first response.
Found at: doi:10.1371/journal.pbio.1000352.s004 (0.53 MB TIF)
Figure S5 Spatiotemporal profile of the Ca2+ signal inneurons and astrocytes during a focal ictal discharge. (A)
Pseudocolour raster plots showing the time derivative of the
smoothed fluorescence signal (by averaging over five points) for
individual neurons and astrocytes from the region within 200 mm
of the NMDA pipette tip (field A) and from the surrounding
region (field B) during an ictal discharge evoked by a double
NMDA pulse applied at t = 0. If the activation were propagating
as a concentric wave originating at the focus, the time of ictal
onset in each cell would increase proportionally with the distance
from the focus. Therefore, the raster plots would show a diagonal
band of activation. Instead, the development and spreading of the
ictal discharge is more similar to a process of modular
recruitments of groups of neurons (and astrocytes): cells in the
field A enter in the ictal phase more or less simultaneously. Cells
in field B are recruited simultaneously, but at a later time than
cells at the focal site of activation. (B) Bar graphs showing the
distribution of the Ca2+ elevation onsets in neurons and astrocytes.
The onset of the Ca2+ signal for each neuron was defined as the
time of the absolute maximum derivative value (that better reflects
the large Ca2+ rise of the recruitment of neurons into the ictal
discharge), whereas for astrocytes, it was the time of the first local
maximum derivative value (that reflects the initial Ca2+ rise in
these cells).
Found at: doi:10.1371/journal.pbio.1000352.s005 (1.76 MB TIF)
Figure S6 BAPTA-containing astrocyte syncytium infield B does not impair ictal discharge generation. The
introduction of BAPTA into astrocytes from a sector of field B
does not impair either the generation of the ictal discharge in field
A or the engagement of distant neurons from fields B and C into
the ictal discharge. Note, however, that in the BAPTA-containing
region, field B astrocytes are still activated by the ictal discharge,
although their Ca2+ response have reduced amplitude and slow
kinetics.
Found at: doi:10.1371/journal.pbio.1000352.s006 (0.27 MB TIF)
Figure S7 High-potassium stimulation as a tool for cellclassification in brain slices. (A) Pseudocolour image from an
EC slice loaded with OGB1-AM. Scale bar represents 20 mm. (B)
Ca2+ signal from the eight cells indicated in (A) during an ictal
event in the 4-AP model (left traces) and during the perfusion with
a 40 mM K+ solution in 1 mM TTX (right traces). TTX was
perfused for 5 min to block the epileptic activity before perfusion
with the high K+ solution. Note that presumed neurons, i.e., large
cells 1–4, in response to high K+ displayed a Ca2+ elevation largely
before that of the presumed astrocytes, i.e., small cells 5–8. This
delayed Ca2+ elevation is due to the lack of voltage-dependent
Ca2+ channels in these cells. (C) Pseudocolour image from an EC
slice loaded with OGB1-AM from a different experiment on the
picrotoxin/zero-Mg2+ model. Scale bar represents 20 mm. (D)
Ca2+ signal from the eight cells indicated in (C) during an ictal
event that arose spontaneously (left traces) and during the
perfusion with a 40 mM K+ solution and TTX (1 mM; right
traces). Note that similar to what observed in (B), presumed
astrocytes, i.e., small cells 5–8, displayed a delayed Ca2+ response
to the high-potassium stimulation with respect to that in the large
cells, presumed neurons. Note the high synchronous Ca2+ peaks in
neurons from both experiments that reflect the afterdischarges of
the seizure-like event.
Found at: doi:10.1371/journal.pbio.1000352.s007 (1.80 MB TIF)
Video S1 Response of astrocytes to ictal and interictaldischarges in EC slices. This video shows the synchronous
Ca2+ increase in EC neurons after slice perfusion with picrotoxin/
zero-Mg2+ that reflects an interictal and an ictal discharge (as
reported in Figure 1A and 1B). Note that at the beginning of the
video there is an interictal discharge that activates only one
astrocyte. A subsequent ictal discharge evokes a large and
synchronous Ca2+ response in most astrocytes (indicated by the
arrowheads in the first frame). In the final part of the video,
synchronous, repetitive Ca2+ elevations in neurons reflect the
afterdischarges typical of the late ictal phase. Time frame, 314 ms.
Found at: doi:10.1371/journal.pbio.1000352.s008 (3.34 MB
MOV)
Video S2 Selective stimulation of astrocytes withTFLLR triggers an ictal discharge. This video shows the
Ca2+ change in neurons and in astrocytes (indicated in the first
frame by the orange arrowheads) evoked by a local application of
TFLLR in an EC slice during perfusion with picrotoxin/zero-
Mg2+ (as reported in Figure 3F). TFLLR induces a Ca2+ increase
in astrocytes that is followed by an ictal discharge. Time frame,
1 s.
Found at: doi:10.1371/journal.pbio.1000352.s009 (5.49 MB
MOV)
Astrocyte Role in Ictogenesis
PLoS Biology | www.plosbiology.org 17 April 2010 | Volume 8 | Issue 4 | e1000352

Video S3 A single NMDA stimulation triggers only alocal Ca2+ response. This video shows the Ca2+ increase that is
restricted to a group of layer V-VI EC neurons that follows a single
NMDA stimulation (as reported in Figure 4). The orange circle
marks the timing of the NMDA puff and the position of the
NMDA pipette. Note the absence of astrocyte responses. Time
frame, 356 ms.
Found at: doi:10.1371/journal.pbio.1000352.s010 (0.78 MB
MOV)
Video S4 Two successive NMDA applications trigger anictal discharge. This video shows an ictal event generated by an
NMDA stimulation composed of two successive puffs (as reported
in Figure 4). The orange circle in field A marks the timing of the
NMDA puffs and the position of the NMDA pipette, whereas the
yellow circle in field B marks the engagement of neurons from this
region into the ictal discharge. The orange arrowheads indicate
astrocytes in field A at the onset of their Ca2+ increase. Note that
Ca2+ elevations in these astrocytes accompany the development of
the ictal discharge. Yellow arrowheads indicate astrocytes in field
B (at the onset of their Ca2+ increase) that are activated after the
emergence of the ictal discharge in field B. Time frame, 356 ms.
Found at: doi:10.1371/journal.pbio.1000352.s011 (2.39 MB
MOV)
Acknowledgments
We thank Paulo Magalhaes for critical reading of the manuscript and
Renato Nobili for helpful discussion. We are grateful to Lamberto Maffei
for supporting the construction of the 2P-LSM.
Author Contributions
The author(s) have made the following declarations about their
contributions: Conceived and designed the experiments: MdC GMR
GC. Performed the experiments: MGG GL AC MZ MB FV LU MdC
GMR GC. Analyzed the data: MGG GL AC MZ MC MB MdC GMR
GC. Wrote the paper: TP MdC GMR GC.
References
1. Traub RD, Wong RK (1982) Cellular mechanism of neuronal synchronization
in epilepsy. Science 216: 745–747.
2. Avoli M, D’Antuono M, Louvel J, Kohling R, Biagini G, et al. (2002) Network
and pharmacological mechanisms leading to epileptiform synchronization in the
limbic system in vitro. Prog Neurobiol 68: 167–207.
3. Pinto DJ, Patrick SL, Huang WC, Connors BW (2005) Initiation, propagation,
and termination of epileptiform activity in rodent neocortex in vitro involve
distinct mechanisms. J Neurosci 25: 8131–8140.
4. Trevelyan AJ, Sussillo D, Watson BO, Yuste R (2006) Modular propagation of
epileptiform activity: evidence for an inhibitory veto in neocortex. J Neurosci 26:
12447–12455.
5. Jefferys JG (1990) Basic mechanisms of focal epilepsies. Exp Physiol 75:
127–162.
6. McNamara JO, Huang YZ, Leonard AS (2006) Molecular signaling mechanisms
underlying epileptogenesis. Science’s STKE 2006: re12.
7. Baulac M, Pitkanen A (2008) Research priorities in epilepsy for the next decade:
a representative view of the european scientific community. Epilepsia 50:
571–578.
8. Fellin T, Pascual O, Gobbo S, Pozzan T, Haydon PG, et al. (2004) Neuronal
synchrony mediated by astrocytic glutamate through activation of extrasynaptic
NMDA receptors. Neuron 43: 729–743.
9. Tian G-F, Azmi H, Takano T, Xu Q, Peng W, et al. (2005) An astrocytic basis of
epilepsy. Nat Med 11: 973–981.
10. Fellin T, Gomez-Gonzalo M, Gobbo S, Carmignoto G, Haydon PG (2006)
Astrocytic glutamate is not necessary for the generation of epileptiform neuronal
activity in hippocampal slices. J Neurosci 26: 9312–9322.
11. Aronica E, van Vliet EA, Mayboroda OA, Troost D, da Silva FH, et al. (2000)
Upregulation of metabotropic glutamate receptor subtype mGluR3 and
mGluR5 in reactive astrocytes in a rat model of mesial temporal lobe epilepsy.
Eur J Neurosci 12: 2333–2344.
12. Ulas J, Satou T, Ivins KJ, Kesslak JP, Cotman CW, et al. (2000) Expression of
metabotropic glutamate receptor 5 is increased in astrocytes after kainate-
induced epileptic seizures. Glia 30: 352–361.
13. D’Ambrosio R (2006) Does glutamate released by astrocytes cause focal
epilepsy? Epilepsy Curr 6: 173–176.
14. Seifert G, Schilling K, Steinhauser C (2006) Astrocyte dysfunction in
neurological disorders: a molecular perspective. Nat Rev Neurosci 7: 194–206.
15. Wetherington J, Serrano G, Dingledine R (2008) Astrocytes in the epileptic
brain. Neuron 58: 168–178.
16. Pasti L, Volterra A, Pozzan T, Carmignoto G (1997) Intracellular calcium
oscillations in astrocytes: a highly plastic, bidirectional form of communication
between neurons and astrocytes in situ. J Neurosci 17: 7817–7830.
17. Carmignoto G, Pasti L, Pozzan T (1998) On the role of voltage-dependent
calcium channels in calcium signaling of astrocytes in situ. J Neurosci 18:
4637–4645.
18. Steinhauser C, Jabs R, Kettenmann H (1994) Properties of GABA and
glutamate responses in identified glial cells of the mouse hippocampal slice.
Hippocampus 4: 19–35.
19. de Curtis M, Biella G, Buccellati C, Folco G (1998) Simultaneous investigation
of the neuronal and vascular compartments in the guinea pig brain isolated in
vitro. Brain Res Prot 3: 221–228.
20. Uva L, Librizzi L, Wendling F, de Curtis M (2005) Propagation dynamics of
epileptiform activity acutely induced by bicuculline in the hippocampal-
parahippocampal region of the isolated Guinea pig brain. Epilepsia 46:
1914–1925.
21. Gnatkovsky V, Librizzi L, Trombin F, de Curtis M (2008) Fast activity at seizureonset is mediated by inhibitory circuits in the entorhinal cortex in vitro. Ann
Neurol 64: 674–686.
22. Uva L, Librizzi L, Marchi N, Noe F, Bongiovanni R, et al. (2008) Acute
induction of epileptiform discharges by pilocarpine in the in vitro isolatedguinea-pig brain requires enhancement of blood-brain barrier permeability.
Neuroscience 151: 303–312.
23. Porter JT, McCarthy KD (1996) Hippocampal astrocytes in situ respond toglutamate released from synaptic terminals. J Neurosci 16: 5073–5081.
24. Jourdain P, Bergersen LH, Bhaukaurally K, Bezzi P, Santello M, et al. (2007)
Glutamate exocytosis from astrocytes controls synaptic strength. Nat Neurosci10: 331–339.
25. Lee CJ, Mannaioni G, Yuan H, Woo DH, Gingrich MB, et al. (2007) Astrocytic
control of synaptic NMDA receptors. J Physiol 581: 1057–1081.
26. Shigetomi E, Bowser DN, Sofroniew MV, Khakh BS (2008) Two forms of
astrocyte calcium excitabilty have distinct effects on NMDA receptor-mediatedslow inward currents in pyramidal neurons. J Neurosci 28: 6659–6663.
27. Peters A, Palay SL, Webster HdF (1991) In: Press OU, ed. The fine structure of
the central nervous system: neurons and their supportive cells. 3rd edition. NewYork (New York): Oxford University Press. pp 276–295.
28. Angulo MC, Kozlov AS, Charpak S, Audinat E (2004) Glutamate released from
glial cells synchronizes neuronal activity in the hippocampus. J Neurosci 24:6920–6927.
29. D’Ascenzo M, Fellin T, Terunuma M, Revilla-Sanchez R, Meaney DF, et al.
(2007) mGluR5 stimulates gliotransmission in the nucleus accumbens. Proc Natl
Acad Sci U S A 104: 1995–2000.
30. Perea G, Araque A (2005) Properties of synaptically evoked astrocyte calciumsignal reveal synaptic information processing by astrocytes. J Neurosci 25:
2192–2203.
31. Demir R, Haberly LB, Jackson MB (1998) Voltage imaging of epileptiformactivity in slices from rat piriform cortex: onset and propagation. J Neurophysiol
80: 2727–2742.
32. Tsau Y, Guan L, Wu JY (1998) Initiation of spontaneous epileptiform activity inthe neocortical slice. J Neurophysiol 80: 978–982.
33. Woodhall G, Evans DI, Cunningham MO, Jones RS (2001) NR2B-containing
NMDA autoreceptors at synapses on entorhinal cortical neurons. J Neurophysiol
86: 1644–1651.
34. Conti F, Minelli A, DeBiasi S, Melone M (1997) Neuronal and glial localizationof NMDA receptors in the cerebral cortex. Mol Neurobiol 14: 1–18.
35. Lalo U, Pankratov Y, Kirchhoff F, North RA, Verkhratsky A (2006) NMDA
receptors mediate neuron-to-glia signaling in mouse cortical astrocytes.J Neurosci 26: 2673–2683.
36. Serrano A, Haddjeri N, Lacaille JC, Robitaille R (2006) GABAergic network
activation of glial cells underlies hippocampal heterosynaptic depression.J Neurosci 26: 5370–5382.
37. Kozlov AS, Angulo MC, Audinat E, Charpak S (2006) Target cell-specific
modulation of neuronal activity by astrocytes. Proc Natl Acad Sci U S A 103:
10058–10063.
38. Ding S, Fellin T, Zhu Y, Lee SY, Auberson YP, et al. (2007) Enhanced astrocyticCa2+ signals contribute to neuronal excitotoxicity after status epilepticus.
J Neurosci 27: 10674–10684.
39. Parpura V, Basarsky TA, Liu F, Jeftinija K, Jeftinija S, et al. (1994) Glutamate-mediated astrocyte-neuron signalling. Nature 369: 744–747.
40. Bezzi P, Carmignoto G, Pasti L, Vesce S, Rossi D, et al. (1998) Prostaglandins
stimulate calcium-dependent glutamate release in astrocytes. Nature 391:281–285.
Astrocyte Role in Ictogenesis
PLoS Biology | www.plosbiology.org 18 April 2010 | Volume 8 | Issue 4 | e1000352

41. Pasti L, Zonta M, Pozzan T, Vicini S, Carmignoto G (2001) Cytosolic calcium
oscillations in astrocytes may regulate exocytotic release of glutamate. J Neurosci21: 477–484.
42. Mothet JP, Pollegioni L, Ouanounou G, Martineau M, Fossier P, et al. (2005)
Glutamate receptor activation triggers a calcium-dependent and SNAREprotein-dependent release of the gliotransmitter D-serine. Proc Natl Acad
Sci U S A 102: 5606–5611.43. Fiacco TA, McCarthy KD (2004) Intracellular astrocyte calcium waves in situ
increase the frequency of spontaneous AMPA receptor currents in CA1
pyramidal neurons. J Neurosci 24: 722–732.44. Perea G, Araque A (2007) Astrocytes potentiate transmitter release at single
hippocampal synapses. Science 317: 1083–1086.45. Hennemberg C, Papouin T, Oliet SHR, Rusakov DA (2010) Long-term
potentiation depends on release of D-serine from astrocytes. Nature 463:232–236.
46. Kimelberg HK, Macvicar BA, Sontheimer H (2006) Anion channels in
astrocytes: biophysics, pharmacology, and function. Glia 54: 747–757.47. Zhang Z, Chen G, Zhou W, Song A, Xu T, et al. (2007) Regulated ATP release
from astrocytes through lysosome exocytosis. Nat Cell Biol 9: 945–953.48. Trevelyan AJ, Sussillo D, Yuste R (2007) Feedforward inhibition contributes to
the control of epileptiform propagation speed. J Neurosci 27: 3383–3387.
49. Binder DK, Steinhauser C (2006) Functional changes in astroglial cells inepilepsy. Glia 54: 358–368.
50. Friedman A, Kaufer D, Heinemann U (2009) Blood-brain barrier breakdown-inducing astrocytic transformation: Novel targets for the prevention of epilepsy.
Epilepsy Res 85: 142–149.51. Araque A, Martın ED, Perea G, Arellano JI, Buno W (2002) Synaptically
released acetylcholine evokes Ca2+ elevations in astrocytes in hippocampal slices.
J Neurosci 22: 2443–2450.52. Hirase H, Qian L, Bartho P, Buzsaki G (2004) Calcium dynamics of cortical
astrocytic networks in vivo. PLoS Biol 2: e96. doi:10.1371/journal.pbio.0020096.
53. Wang X, Lou N, Xu Q, Tian GF, Peng WG, et al. (2006) Astrocytic Ca2+
signaling evoked by sensory stimulation in vivo. Nat Neurosci 9: 816–823.
54. Winship IR, Plaa N, Murphy TH (2007) Rapid astrocyte calcium signals
correlate with neuronal activity and onset of the hemodynamic response in vivo.
J Neurosci 27: 6268–6272.
55. Schummers J, Yu H, Sur M (2008) Tuned responses of astrocytes and their
influence on hemodynamic signals in the visual cortex. Science 320: 1638–1643.
56. Perreault P, Avoli M (1991) Physiology and pharmacology of epileptiform
activity induced by 4-aminopyridine in rat hippocampal slices. J Neurophysiol
65: 771–785.
57. Stasheff SF, Hines M, Wilson WA (1993) Axon terminal hyperexcitability
associated with epileptogenesis in vitro. I. Origin of ectopic spikes. J Neurophysiol
70: 961–975.
58. Siniscalchi A, Calabresi P, Mercuri NB, Bernardi G (1997) Epileptiform
discharge induced by 4-aminopyridine in magnesium-free medium in neocor-
tical neurons: physiological and pharmacological characterization. Neuroscience
81: 189–197.
59. Barbarosie M, Avoli M (1997) CA3-driven hippocampal-entorhinal loop
controls rather than sustains in vitro limbic seizures. J Neurosci 17: 9308–9314.
60. Librizzi L, de Curtis M (2003) Epileptiform ictal discharges are prevented by
periodic interictal spiking in the olfactory cortex. Ann Neurol 53: 382–389.
61. Nolte C, Matyash M, Pivneva T, Schipke CG, Ohlemeyer C, et al. (2001) GFAP
promoter-controlled EGFP-expressing transgenic mice: a tool to visualize
astrocytes and astrogliosis in living brain tissue. Glia 33: 72–86.
62. de Curtis M, Pare D, Llinas RR (1991) The electrophysiology of the olfactory-
hippocampal circuit in the isolated and perfused adult mammalian brain in vitro.
Hippocampus 1: 341–354.
63. Nimmerjahn A, Kirchhoff F, Kerr JN, Helmchen F (2004) Sulforhodamine 101
as a specific marker of astroglia in the neocortex in vivo. Nat Methods 1: 31–37.
Astrocyte Role in Ictogenesis
PLoS Biology | www.plosbiology.org 19 April 2010 | Volume 8 | Issue 4 | e1000352