Detection of Masses in Digital Mammograms using K-means and Support Vector Machine
12
Electronic Letters on Computer Vision and Image Analysis 8(2):39-50, 2009 Detection of Masses in Digital Mammograms using K-means and Support Vector Machine Leonardo de Oliveira Martins * , Geraldo Braz Junior + , Arist ´ ofanes Corrˆ ea Silva + , Anselmo Cardoso de Paiva + , and Marcelo Gattass * * Federal University of Maranh˜ ao, Av. dos Portugueses, SN, Campus do Bacanga, 65085-580, S˜ ao Lu´ ıs, MA, Brazil + Pontifical Catholic University of Rio de Janeiro, R. S˜ ao Vicente, 225, G´ avea, 22453-900, Rio de Janeiro, RJ, Brazil Received 23th May 2008; accepted 16th July 2009 Abstract Breast cancer is a serious public health problem in several countries. Computer Aided Detection/Diagnosis systems (CAD/CADx) have been used with relative success aiding health care professionals. The goal of such systems is contribute on the specialist task aiding in the detection of different types of cancer at an early stage. This work presents a methodology for masses detection on digitized mammograms using the K-means algorithm for image segmentation and co-occurrence matrix to describe the texture of segmented structures. Classification of these structures is accomplished through Support Vector Machines, which separate them in two groups, using shape and texture descriptors: masses and non-masses. The methodology obtained 85% of accuracy. Key Words: Mammogram, Computer-Aided Detection, Co-occurrence matrix, K-means, Support Vector Machine. 1 Introduction Breast cancer is the major cause of cancer-related deaths among the female population. It is well known that the best prevention method is the precocious diagnosis, what lessens the mortality and enhance the treatment [1]. According to the American National Cancer Institute [2], it is estimated that every three minutes, a woman is diagnosed with breast cancer, and every 13 minutes, a woman dies from this disease. It is also estimated that one in eight women will be diagnosed with breast cancer in her lifetime, and 1 in 30 will die from it. Mammography is currently the best technique for reliable detection of early, non-palpable, potentially curable breast cancer [1]. The mortality rate from this disease decreased for the first time in 1995, due in part to the increasing utilization of screening mammography [1]. However, radiologists vary in their interpretation of mammograms. In addition, the interpretation is a repetitive task that requires much attention to minimal details. With the advances of computer technology, radiologists have an opportunity to improve their image interpretation using computer capabilities that can enhance the image quality of mammograms. Over the past two decades, many attempts have been made by computer scientists to assist the radiologists in detection and Correspondence to: [email protected] Recommended for acceptance by Chulhee Lee ELCVIA ISSN:1577-5097 Published by Computer Vision Center / Universitat Autonoma de Barcelona
Transcript of Detection of Masses in Digital Mammograms using K-means and Support Vector Machine
Electronic Letters on Computer Vision and Image Analysis 8(2):39-50, 2009
Detection of Masses in Digital Mammograms using K-means andSupport Vector Machine
Leonardo de Oliveira Martins∗, Geraldo Braz Junior+, Aristofanes Correa Silva+,Anselmo Cardoso de Paiva+, and Marcelo Gattass∗
∗ Federal University of Maranhao, Av. dos Portugueses, SN, Campus do Bacanga, 65085-580, Sao Luıs, MA, Brazil+ Pontifical Catholic University of Rio de Janeiro, R. Sao Vicente, 225, Gavea, 22453-900, Rio de Janeiro, RJ, Brazil
Received 23th May 2008; accepted 16th July 2009
Abstract
Breast cancer is a serious public health problem in several countries. Computer AidedDetection/Diagnosis systems (CAD/CADx) have been used with relative success aiding health careprofessionals. The goal of such systems is contribute on the specialist task aiding in the detection ofdifferent types of cancer at an early stage. This work presents a methodology for masses detection ondigitized mammograms using the K-means algorithm for image segmentation and co-occurrence matrixto describe the texture of segmented structures. Classification of these structures is accomplished throughSupport Vector Machines, which separate them in two groups, using shape and texture descriptors: massesand non-masses. The methodology obtained 85% of accuracy.
Key Words: Mammogram, Computer-Aided Detection, Co-occurrence matrix, K-means, Support
Vector Machine.
1 Introduction
Breast cancer is the major cause of cancer-related deaths among the female population. It is well known that thebest prevention method is the precocious diagnosis, what lessens the mortality and enhance the treatment [1].According to the American National Cancer Institute [2], it is estimated that every three minutes, a womanis diagnosed with breast cancer, and every 13 minutes, a woman dies from this disease. It is also estimatedthat one in eight women will be diagnosed with breast cancer in her lifetime, and 1 in 30 will die from it.Mammography is currently the best technique for reliable detection of early, non-palpable, potentially curablebreast cancer [1]. The mortality rate from this disease decreased for the first time in 1995, due in part tothe increasing utilization of screening mammography [1]. However, radiologists vary in their interpretation ofmammograms. In addition, the interpretation is a repetitive task that requires much attention to minimal details.
With the advances of computer technology, radiologists have an opportunity to improve their imageinterpretation using computer capabilities that can enhance the image quality of mammograms. Over the pasttwo decades, many attempts have been made by computer scientists to assist the radiologists in detection and
Correspondence to: [email protected]
Recommended for acceptance by Chulhee LeeELCVIA ISSN:1577-5097Published by Computer Vision Center / Universitat Autonoma de Barcelona

40 Leonardo de Oliveira Martins et al. / Electronic Letters on Computer Vision and Image Analysis 8(2):39-50, 2009
diagnosis of masses by developing computer-aided tools for mammography interpretation. Image processingand intelligent systems are two mainstreams of computer technologies that have been constantly explored inthe development of computer-aided mammography systems.
The main difficulty regarding digital mammogram diagnosis is the detection of suspicious regions. Toaddress this problem, several image-processing techniques have been developed. The principal difficulty in thistask is the lack of a general algorithm that produces good results for all images. We can highlight two classesof regions in a digital mammogram, naming them mass and non-mass areas. The mass areas are associated toevery region on a mammogram that corresponds to a benign or malignant neoplasy. All regions not associatedto a neoplasy are labeled non-mass; i.e., all the normal tissue present on the mammogram is non-mass.
In this paper we intend to investigate the efficacy of a detection methodology that uses textural and shapemeasures as input features for the K-means clustering algorithm, and a Support Vector Machine, aiming todetecting masses in mammogram images. This work is organized as follows. In Section 2 we present somerelated works about detection of masses in mammogram images. In Section 3, the techniques for featureextraction, clusterization and classification are presented. Next, in Section 4, the results are shown and theapplication of the techniques under study are discussed. Finally, Section 5 presents some concluding remarks.
2 Related Works
Several works have been formulated aiming to develop computer aided breast cancer detection and diagnosistools. Tang et al [3] present an overview of recent advances in the development of such tools and relatedtechniques.
Kom et al [4] proposed an algorithm for detection of suspicious masses in mammographic images thatexhibits a sensitivity of 95.91% for mass detection, with ROC area of 0.946 when the enhancement of theoriginal image was performed before detection and 0.938 otherwise.
Eltonsy et al [5] showed a technique for the automated detection of malignant masses in screeningmammography. The technique is based on the presence of concentric layers surrounding a focal area withsuspicious morphological characteristics and low relative incidence in the breast region. Malignant masseswere detected with 92%, 88%, and 81% sensitivity of 5.4, 2.4, and 0.6 false positive per image. Rojas et al [6]explores the use of characterization features based on breast-mass contours that are obtained by automatedsegmentation. The method presented low sensitivity and high specificity values (e.g. 0.6 and 0.8, respectively)since the positive class in the classification experiments is the set of malignant masses.
Belloti et al [7] presented an automatic computational tool for mass detection. The authors used an edge-based segmentation algorithm in order to separate suspicious regions. Second order measures obtained fromco-occurrence matrices were used to describe the texture of each region. Finally, artificial neural networks wereused in the classification step. The results showed a sensitivity of 80% and 4.23 false positives per image. Chanet.al [8] proposes a CAD system based in tridimensional mammograms obtained from a tomosynthesis process.The area under the ROC curve was 0.91, with standard deviation of 0.03. The CAD tool obtained a sensitivityof 85%, with 1.32 false positives per image.
Martins et al [9] presented a mass detection method that use Growing Neural Gas algorithm to perform thesegmentation step. For each segmented region, shape measures are computed in order to discard bad masscandidates and texture measures are obtained from Ripley’s K function. The classification step is performedusing a SVM classifier. The method provides an accuracy rate of 89.30%. Campanini et al [10] presentedan approach for detection of masses in digital mammograms that reaches a sensitivity around 80%, with afalse-positive rate of 1.1 marks per image. The work used images coming from the DDSM database.
Also, in Martins et al [11], rates of about 86.85% are reached to classify regions of mammograms into benign,malignant and normal using a Bayesian Neural Network. A Support Vector Machine together with IndependentComponent Analysis was used in [12] to classify mammogram tissues, reaching 99.6% of accuracy. Braz etal [13] reaches an accuracy of 98.36% employing geoestatistical functions and SVM.

Leonardo de Oliveira Martins et al. / Electronic Letters on Computer Vision and Image Analysis 8(2):39-50, 2009 41
In [14], the authors proposed a method for discrimination and classification of mammograms with benign,malignant and normal tissues using independent component analysis and multilayer neural networks. The bestperformance was obtained with probabilistic neural networks, resulting in a success rate of 97.3%, 100% ofspecificity and 96% of sensitivity.
We may observe that there is a need for methodologies that provide support to automatic detection of lesionsin mammogram images with little or no specialist participation. Such objective is a great challenge for thesegmentation methods, because this is a problem that strongly depends on the characteristics of objects.
3 Material and Methods
The methodology proposed in this work intends to classify breast tissues on mammograms into mass and non-mass groups. This methodology is based on three steps: Images Database formation; structures segmentationusing K-means and texture descriptors; structures classification using texture and shape descriptors submittedto the Support Vector Machine classifier.
The first step is the construction of the image database, which is done by obtaining mammograms from apublic available database. After this, we perform a clustering step using characteristics based on co-occurrencematrix to describe the texture of the mammography tiles and the K-means algorithm to cluster the tilesrepresenting breast structures in the mammography, like fat regions, muscles, mass, calcifications, etc. Inthe last step, the extraction of texture characteristics from structures is done using co-occurrence matrix andshape descriptors and their classification as mass or non-mass through the Support Vector Machine classifier.
3.1 Image Database
For the development and evaluation of the proposed methodology, we used the Digital Database for ScreeningMammography (DDSM) [15] that is a publicly available database of digitized screen-film mammograms. Itcontains 2620 cases acquired from Massachusetts General Hospital, Wake Forest University, and WashingtonUniversity in St. Louis School of Medicine. The data are comprised of studies of patients from different ethnicand racial backgrounds. The DDSM contains descriptions of breast lesions in terms of the American Collegeof Radiology’s breast imaging lexicon called the Breast Imaging Reporting and Data System (BI-RADS) [15].Mammograms in the DDSM database were digitized by different scanners depending on the institutional sourceof the data.
A subset of the DDSM cases was selected for this study. Cases with mass lesions were selected through thereports that only included the BI-RADS descriptors for mass margin and mass shape. From 2620 cases, 433images were selected based on these criteria.
3.2 Texture Descriptors
Textures represent tonal variations in the spatial domain and determine the overall visual smoothness orcoarseness of image features. They reveal important information about the structural arrangements of theobjects in the image and their relationship to the environment. Consequently, texture analysis providesimportant discriminatory characteristics related to variability patterns of digital classifications.
Texture processing algorithms are usually divided into three major categories: structural, spectral andstatistical [16]. Structural methods consider textures as repetitions of basic primitive patterns with a certainplacement rule [17]. Spectral methods are based on the Fourier transform, analyzing the power spectrum [17].The third and most important group in texture analysis is that of statistical methods, which are mainly based onstatistical parameters such as the Spatial Gray Level Dependence Method (co-occurrence matrices), the GrayLevel Difference Method, and Gray Level Run Length Matrices [18], [19].
In this work we use co-occurrence matrix, which displays the gray level spatial-dependency along differentangular relationships, horizontal, vertical and two diagonal directions on an image, to calculate textural
42 Leonardo de Oliveira Martins et al. / Electronic Letters on Computer Vision and Image Analysis 8(2):39-50, 2009
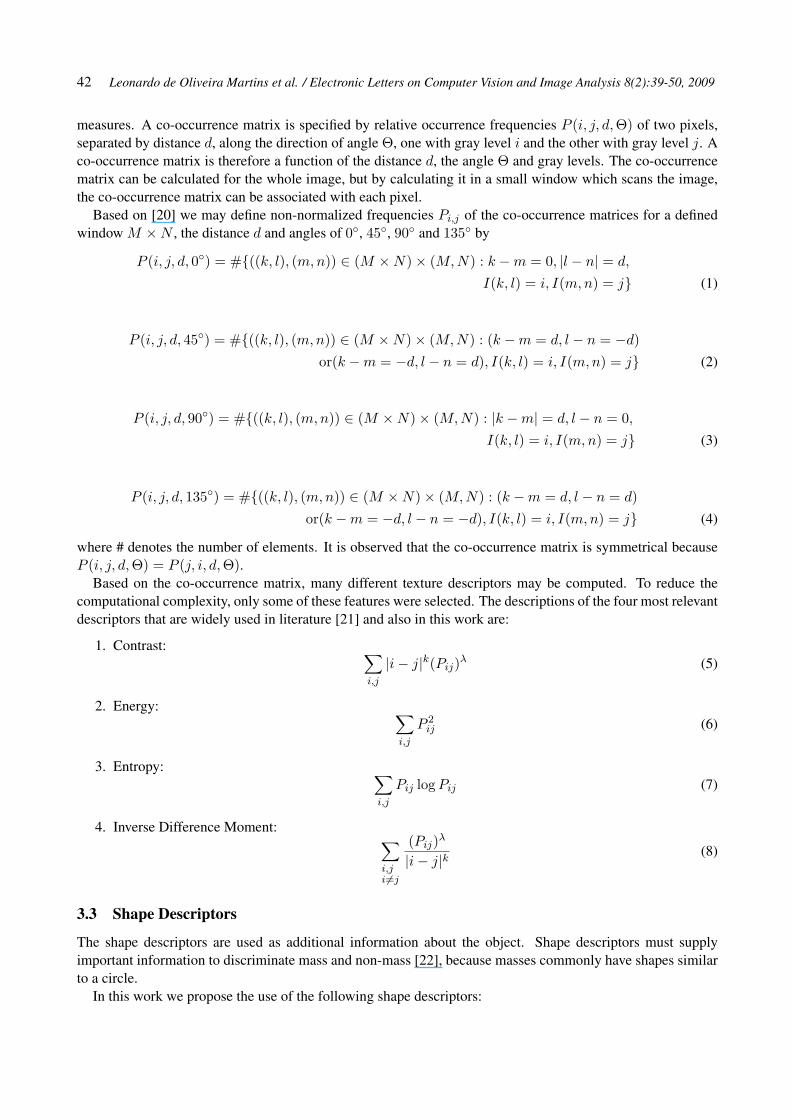
measures. A co-occurrence matrix is specified by relative occurrence frequencies P (i, j, d,Θ) of two pixels,separated by distance d, along the direction of angle Θ, one with gray level i and the other with gray level j. Aco-occurrence matrix is therefore a function of the distance d, the angle Θ and gray levels. The co-occurrencematrix can be calculated for the whole image, but by calculating it in a small window which scans the image,the co-occurrence matrix can be associated with each pixel.
Based on [20] we may define non-normalized frequencies Pi,j of the co-occurrence matrices for a definedwindow M ×N , the distance d and angles of 0◦, 45◦, 90◦ and 135◦ by
P (i, j, d, 0◦) = #{((k, l), (m,n)) ∈ (M ×N)× (M,N) : k −m = 0, |l − n| = d,
I(k, l) = i, I(m,n) = j} (1)
P (i, j, d, 45◦) = #{((k, l), (m,n)) ∈ (M ×N)× (M,N) : (k −m = d, l − n = −d)or(k −m = −d, l − n = d), I(k, l) = i, I(m,n) = j} (2)
P (i, j, d, 90◦) = #{((k, l), (m,n)) ∈ (M ×N)× (M,N) : |k −m| = d, l − n = 0,I(k, l) = i, I(m,n) = j} (3)
P (i, j, d, 135◦) = #{((k, l), (m,n)) ∈ (M ×N)× (M,N) : (k −m = d, l − n = d)or(k −m = −d, l − n = −d), I(k, l) = i, I(m,n) = j} (4)
where # denotes the number of elements. It is observed that the co-occurrence matrix is symmetrical becauseP (i, j, d,Θ) = P (j, i, d,Θ).
Based on the co-occurrence matrix, many different texture descriptors may be computed. To reduce thecomputational complexity, only some of these features were selected. The descriptions of the four most relevantdescriptors that are widely used in literature [21] and also in this work are:
1. Contrast: ∑i,j
|i− j|k(Pij)λ (5)
2. Energy: ∑i,j
P 2ij (6)
3. Entropy: ∑i,j
Pij logPij (7)
4. Inverse Difference Moment: ∑i,ji 6=j
(Pij)λ
|i− j|k(8)
3.3 Shape Descriptors
The shape descriptors are used as additional information about the object. Shape descriptors must supplyimportant information to discriminate mass and non-mass [22], because masses commonly have shapes similarto a circle.
In this work we propose the use of the following shape descriptors:

Leonardo de Oliveira Martins et al. / Electronic Letters on Computer Vision and Image Analysis 8(2):39-50, 2009 43
3.3.1 Eccentricity
The eccentricity defines how the object is spatially distributed along his axis. It is calculated using centralmoment functions as
(µ02 − µ20)2 + 4µ11
A(9)
where A is the object area, and the central moments µ can be calculated by
µpq =M−1∑x=0
N−1∑y=0
(x− x)p(y − y)q (10)
with p+ q > 1
3.3.2 Circularity
Circularity shows how circular a certain object is, being calculated by
4πAp2
(11)
where A is the area of the object and P the convex perimeter.
3.3.3 Convexity
Convexity is the relative difference between an object and a convex hull containing it. It is calculated startingfrom the ratio between the perimeter of the o convex hull of the object and the perimeter of the object. It isdefined by
PchPimg
(12)
where Pch is the perimeter of the convex hull of the object, and Pimg is the perimeter of the object.
3.4 K-means Algorithm
Clustering algorithms can be applied to solve the segmentation problem. They consist in choosing an initialpixel or region that belongs to one object of interest, followed by an interactive process of neighborhoodsanalysis, deciding if whether each neighboring pixel belongs or not to the same object. In this work we usethe K-means to resolve the mass detection task on mammograms using texture information obtained fromHaralick’s descriptors. The K-means algorithm is one of the simplest non-supervised learning algorithms classthat solves the clustering segmentation problem [23].
The method follows the usual steps to satisfy the primary objective: clustering all the image objects into Kdistinct groups. First, K centroids are defined, one for each group, being their initial position very important tothe result. After that, it is determined a property region for each centroid, which groups a set of similar objects.The interactive stage of the algorithm is started, in which the centroid of each group is recalculated in order tominimize the objective function. This function, for K-means, is the minimum square method, calculated by
J =∑k
j=1
∑n
i=1||x(j)
i − cj ||2 (13)
where ||x(j)i − cj ||2 is the distance metric from any point x(j)
i to the group centroid cj . Thus, the J (objectivefunction) represents the similarity measure of the n objects contained in their respective groups.

44 Leonardo de Oliveira Martins et al. / Electronic Letters on Computer Vision and Image Analysis 8(2):39-50, 2009
3.5 Support Vector Machine
In this section we briefly sketch the Support Vector Machine (SVM) algorithm and the reasons for using it. Amore detailed description of SVM can be found in [24].
The SVM is a method to estimate the function that classifies data into two classes. SVM is based on the ideaof minimizing the generalization error when the classifier is applied to test samples that do not exactly matchany training sample used to train the classifier. In comparison, most classifiers (e.g., neural networks) try tominimize the training error, and tend to ”overfit the training data.
The basic concepts we want to use are the following: there are two classes (mass e non-mass), yi ∈ {−1, 1},and there are N labeled training examples: (xi, yi), · · · , (xN , yN ), x ∈ Rd where d is the dimensionality of thevector.
If two classes are linearly separable, then one can find an optimal weight vector w∗ such that ||w∗||2 isminimum; and
w∗ • xi − b ≥ 1, ifyi = 1w∗ • xi − b ≤ −1, ifyi = −1 (14)
Training examples that satisfy the equality are termed support vectors. The support defines two hyperplanes,one that goes through the support vector of one class and another one that goes through of the support vectorthe other class. The distance between two hyperplanes defines a margin and this margin is maximized whenthe norm of the weight vector ||w∗|| is minimum. This minimization can be performed with the maximizationof the following function with respect to the variables αj .
W (α) =N∑i=1
αi − 0.5N∑j=1
αiαj(xi • xj)yiyj (15)
subject to the constraint: 0 ≤ αi where it is assumed there are N training examples, xj is one of the trainingvectors, and • represents the dot product. If αj ≥ 0 the xj is termed a support vector. For an unknown vectorxj classification then corresponds to finding
F (xj) = sign{w∗ • xj − b} (16)
where
w∗ =r∑i=1
αiyixi
and the sum is over the r nonzero support vectors.For the non-separable case, training errors are allowed and we now must minimize
||w∗||2 + CN∑i=1
ξi (17)
subject to the constraintyi(w∗ • xi − b) ≤ 1− ξ,ξ ≥ 0
ξ is a slack variable and allows training examples to exist in the region between the two hyperplanes that gothrough the support points of the two classes.
4 Results and Discussion
This section intends to investigate the efficiency of using shape and textural descriptors for detection of massesin digital mammograms using K-means and SVM.

Leonardo de Oliveira Martins et al. / Electronic Letters on Computer Vision and Image Analysis 8(2):39-50, 2009 45
4.1 Clustering
In this step we group breast structures (fat, mass, calcification, etc.). We just intend to group similar regions ofthe mammography irrespective of identifying mass and non-mass structures.
The proposed method uses a 4 × 4 sliding window to allow co-occurrence calculation and extraction ofdescriptors. For each pixel p in the input image, the sliding window is positioned so that its first cell (0,0)matches the position of p in the image. A co-occurrence matrix is computed inside the window, the fourHaralick’s descriptors shown in Section 3.2 are computed based on it and associated to pixel p. This is doneusing the gray level co-occurrence already presented before. The sliding window size was chosen because,after some experiments, we observed that this size is the one that best fits the shape characteristics of the mass.It was observed that this window size is adequate because we want to detect masses in a range of dimensionsfrom 3 mm to 30 mm.
We considered as parameters for co-occurrence matrices the four directions (0◦, 45◦, 90◦ and 135◦) andthree distances (d = 1, 2 and 3). As we computed four Haralick’s descriptors for each co-occurrence matrix,we obtained a set of 48 descriptors (4 directions × 3 distances × 4 descriptors) for each sliding window. Thesedescriptors are defined as the textural descriptors for each specific sliding window.
The next step, in the proposed scheme, is the grouping of similar sliding windows performed with the K-means algorithm, which generates the segmentation of input image.
The set of textural descriptors are submitted to the K-means algorithm which them in accordance with texturesimilarity. We use the number of K groups equal to 4, 5 and 6. Finally, the various connected windows returnedfrom K-means are considered as segmented structures. It is important to highlight that in this step we just groupbreast internal structures (fat, mass, calcification, etc.) without performing a classification of these structures,leaving this task to the next step.
In the next phase we analyze each segmented structure (a set of connected windows from the previous phase)individually, based on their shape and texture descriptors, and use SVM to classify them as mass and non-mass.
We used 433 mammogram images from our image database, each one containing at least one mass. Applyingtexture descriptors and K-means algorithm we obtained 60.06% of accuracy. From this set of 433 images, weverified that 260 contained a mass structure between the set of structures grouped by the clustering algorithm.This verification was performed based on DDSM metadata. This set of 260 mammograms, with segmentedstructures composed of mass and non-mass regions is considered as the new sample set for the next step, theclassification of structures as mass or non-mass.
Figure 1 presents a mammography that generates an incorrect segmentation of a structure represented asmass. For more specific information, analyzing the cases on which the K-means presented problems, it wasverified that they were related to mammograms that have high density tissue; i.e., dense breast. In Figure 1b themass cannot be defined with the clustering algorithm due to the great similarity between the mass region andthe neighboring structures. Thus, the K-means algorithm was not capable of making the distinction (inadequategray level) or did not search the separation (inadequate number K for the image).
Figure 2b presents a result of correct segmentation of the mass on Figure 2a. In this mammogram image wenotice that the gray level of the mass is much more intense than that of other structures in the breast and it is notconnected to other dense structure, where the K-means could recognize the mass as an isolated breast structure.
4.2 Mass Classification
In this step we used 250 segmented structures defined as mass obtained from the previous step. Ten segmentedstructures, defined as mass in the previous step, were discarded because they were connected to other segmentedstructures defined as non-mass. We also included 927 random non-mass segmented structures in our newsample to test the classification performance.
We analyzed individually each of the 1177 (250 masses and 927 non-masses) segmented structures. Todo that, were calculated the Haralick’s descriptors and the three shape descriptors described respectively in

46 Leonardo de Oliveira Martins et al. / Electronic Letters on Computer Vision and Image Analysis 8(2):39-50, 2009
(a) (b)
Figure 1: (a) Original mammogram. (b) Clustered mammogram with segmentation error.
(a) (b)
Figure 2: (a) Original mammogram. (b) Clustered mammogram with correct segmentation.
Section 3.2 and 3.3. These sets of descriptors compose the new feature vector for a segmented structure thatis composed of several sliding windows grouped in accordance with the similarity with each other. Now, weintend to classify the resulting segmentation structure into two classes: mass or non-mass. For the computedHaralick’s descriptors, we considered four directions (0◦, 45◦, 90◦ and 135◦), six quantizations of gray levels(8, 16, 32, 64, 128 and 256) and three distances (d=1, 2 and 3) totalizing a feature vector composed of 360texture descriptors. Also, we included in this feature vector the three shape descriptors (eccentricity, circularityand convexity). However, to make the computation feasible, we need to select from all the obtained descriptorswhich was the minimum set that had the power of discriminating mass from non-mass elements. Thus, weused the stepwise discriminant analysis [25] that reduced the number of variables. This technique reduced thenumber of variables to 9 (6 of texture and 3 of shape). Initially all segmented structures will be considered asmass until our classification technique verifies the opposite.
The samples (1177 segmented structures) were separated randomly into two sets: 960 samples for trainingand 217 samples for tests. Then, the training set was composed of 200 masses and 760 non-masses samples.The testing set contains 50 samples related to mass regions and 167 non-masses samples.
A Library for SVM, called LIBSVM [26], was used for training and testing. We used Radial Basis Functionas kernel and the parameters values used were C = 8192 and γ = 0.5. Table 1 shows the training and testsresults of the SVM classifier, using as metric True Positive (TP), True Negative (TN), False Positive (FP), FalseNegative (FN), Sensitivity (SE), Specificity (SP) and accuracy (AC) .
The experimental results show that in the training set, 85% of the mass are classified correctly and 95.39%of non-mass are labeled accurately. For tests, these values are 86% for the masses and 94.61% for non-massobjects. The global accuracy, considering both training and test sets, is equal to 93.11%.

Leonardo de Oliveira Martins et al. / Electronic Letters on Computer Vision and Image Analysis 8(2):39-50, 2009 47
Set TP TN FP FN SE (%) SP (%) AC (%)Training 170 725 35 30 85 95.39 93.23
Test 43 158 9 7 86 94.61 92.63
Table 1: Detailed analysis of the mass vs. non-mass characterization.
To measure the effectiveness of separation of abnormalities in medical images, an evaluation by an expertor radiographs technician is required, in order to indicate whether or not the algorithm separated the suspectedregion from the rest of the image. The DDSM, used in this study, provides the location of the abnormality incases where it exists.
The experimental results show that in the training set, 85% of the mass is correctly classified and 95.39%of non-mass is accurately labeled. For tests, these values are 86% for the masses and 94.61% for non-massstructures. The global accuracy, considering both training and test sets, is equal to 93.11%.
Table 2 shows a comparative view among several mass detection methods, including the proposed method,by examining the sensitivity of each method and their rate of false positives per image.
Method Sensitivity (%) Fp/ImageBelloti et al. [7] 80 4.23Chan et al. [8] 85 1.32
Eltonsy et al. [5] 88 2.4Campanini et al. [10] 80 1.1
Lim and Er [27] 62 1.81Martins et al. [9] 89.3 0.93
New method 86 1.2
Table 2: Performance results for mass detection methods.
Examining the results presented in 2, we can observe that the method proposed in this paper provides supportfor detection of masses in digitalized mammograms in a similar way as the other methods available in researchliterature.
Our method is based on the use of techniques (K-means, SVM) and characteristics (co-occurrence matrix,eccentricity, circularity and convexity) for detection of masses. These techniques are consecrated in theliterature, making their reproducibility easier.
In order to perform the clustering we used the K-means algorithm, which needs a previous definition of thenumber of clusters, other than a more robust one, such as the Growing Neural Gas [28], on which the numberof clusters varies in an incremental manner. This choice is based on the performance, as with K-means weobtained a satisfactory processing time (approximately 20 seconds per image).
The use of geometrical and texture measures in the characterization of the segmented objects presents someadvantages in relation to other approaches. Usually, just the texture information isn’t enough to completelydescribe the mass, since a great part of its characterization can come from its shape. Besides, the use of texturemeasures discards most of the objects that represent healthy tissues.
Among the classifiers available in the literature, SVM comes off since it deals with sets of highdimensionality non-linear data with much accuracy and computational efficiency. Another advantage incomparison to other classifiers, such as Artificial Neural Networks (ANN) is the reduced number of parameters.So, after several tests and due to the large number of input variables used in this work, we concluded that SVMis the best candidate to perform the task of classification in the problem under discussion.
Thus, through the analysis of the results, it is possible to conclude that the proposed methodology proved tobe effective in detecting masses in screening mammograms. The presented results allow us to infer that the useof the K-means algorithm in the task of segmenting screening mammograms provides a good rate of correctsegmentation of mass structures. Similarly, the use of the co-occurrence matrix allows describing textures

48 Leonardo de Oliveira Martins et al. / Electronic Letters on Computer Vision and Image Analysis 8(2):39-50, 2009
and shape descriptors in an efficient way, thus contributing to the correct recognition of segmented structures.Furthermore, the SVM classification provides good generalization, also contributing to the effectiveness of themethodology during the classification of segmented structures.
5 Conclusion
The use of computational tools to aid detection and diagnosis of breast masses has grown and gained increasingacceptance in recent years, as a kind of ”second readers” of medical images. These tools have been contributingto increase the early detection rates for breast cancer.
This paper presented a methodology for detection of masses in digital screening mammograms, which canalso be used in the development of a CAD tool. Such methodology used for both purposes is subdivided intopreprocessing, segmentation through K-means algorithm, reduction of mass candidates, and classification ofsegmented structures into mass or non-mass, based on co-occurrence matrix, shape descriptors (eccentricity,circularity and convexity) and Support Vector Machine classification.
The results indicate that the use of these techniques in the detection of masses is promising, since it achievesaccuracy rates of over 85%. This will lead to a natural development of a CAD system capable of assistinghealth professionals in the painstaking task of tracing mammograms in search of mass abnormalities.
Acknowledgements
The authors acknowledge CAPES, CNPq and FAPEMA for the financial support for this research.
6 Publisher:
Computer Vision CenterEdifici O - Campus UAB08193 Bellaterra (Barcelona) - Spaine-mail: [email protected]: 34 - 93 - 581 18 28Fax: 34 - 93 - 581 16 70
References
[1] A. C. S. (AMS), Learn about breast cancer, available at http://www.cancer.org/docroot/LRN/LRN 0.asp?dt=5(May 2009).
[2] N. C. I. (NCI), Cancer stat fact sheets: Cancer of the breast, available athttp://seer.cancer.gov/statfacts/html/breast.html (May 2009).
[3] J. Tang, R. Rangayyan, J. Xu, I. El Naqa, Y. Yang, Computer-aided detection and diagnosis ofbreast cancer with mammography: Recent advances, Information Technology in Biomedicine, IEEETransactions on 13 (2) (2009) 236–251.
[4] G. Kom, A. Tiedeu, M. Kom, Automated detection of masses in mammograms by local adaptivethresholding, Comput. Biol. Med. 37 (1) (2007) 37–48.
[5] N. Eltonsy, G. Tourassi, A. Elmaghraby, A concentric morphology model for the detection of masses inmammography, Medical Imaging, IEEE Transactions on 26 (6) (2007) 880–889.

Leonardo de Oliveira Martins et al. / Electronic Letters on Computer Vision and Image Analysis 8(2):39-50, 2009 49
[6] A. R. Domınguez, A. K. Nandi”, ”toward breast cancer diagnosis based on automated segmentation ofmasses in mammograms”, ”Pattern Recognition” ”42” (”6”) (”2009”) ”1138 – 1148”, ”Digital ImageProcessing and Pattern Recognition Techniques for the Detection of Cancer”.URL "http://www.sciencedirect.com/science/article/B6V14-4T70854-1/2/379a42509ac6ad2a4b5435a694fac459"
[7] R. Bellotti, ”A completely automated CAD system for mass detection in a large mammographic database”,Medical Physics 33 (2006) 3066–+.
[8] H.-P. Chan, J. Wei, B. Sahiner, E. A. Rafferty, T. Wu, M. A. Roubidoux, R. H. Moore, D. B. Kopans, L. M.Hadjiiski, M. A. Helvie, Computer-aided Detection System for Breast Masses on Digital TomosynthesisMammograms: Preliminary Experience, Radiology (2005) 2373041657.URL http://radiology.rsnajnls.org/cgi/content/abstract/2373041657v1
[9] L. Oliveira Martins, A. C. Silva, A. C. De Paiva, M. Gattass, Detection of breast masses in mammogramimages using growing neural gas algorithm and ripley’s k function, J. Signal Process. Syst. 55 (1-3) (2009)77–90.
[10] R. Campanini, D. Dongiovanni, E. Iampieri, N. Lanconelli, M. Masotti, G. Palermo, A. Riccardi,M. Roffilli, A novel featureless approach to mass detection in digital mammograms based on supportvector machines, Phisics in Medicine and Biology 49 (2004) 961–975.
[11] L. Martins, A. dos Santos, A. Silva, A. Paiva, Classification of Normal, Benign and Malignant Tissuesusing Co-Occurrence Matrix and Bayesian Neural Network in Mammographic Images, Proceedings ofthe Ninth Brazilian Symposium on Neural Networks (2006) 479–486.
[12] D. D. Costa, A. K. Barros, A. C. Silva, Independent component analysis in breast tissues mammogramsimages classification using lda and svm., Information Technology Applications in Biomedicine -ITAB2007 - Tokyo. Conference on 6th International Special Topic (2007) 231–234.
[13] G. Braz Jr, E. C. Silva, A. C. Paiva, A. C. Silva, Breast tissues classification based on the application ofgeostatistical features and wavelet transform, IEEE Computer Society Press, Tokio, 2007, pp. 227–230.
[14] L. F. A. Campos, A. C. Silva, A. K. Barros, Diagnosis of breast cancer in digital mammogramsusing independent component analysis and neural networks, X Iberoamerican Conference on PatternRecognition, Havana. Lecture notes in computer science 3773 (2005) 460–469.
[15] D. K. M. Heath, K.W. Bowyer, Current status of the digital database for screening mammography,in: Proceedings of the Fourth International Workshop on Digital Mammography, Kluwer AcademicPublishers, 1998, pp. 457–460.
[16] R. C. Gonzalez, R. E. Woods, Digital Image Processing, 3rd Edition, Addison-Wesley, Reading, MA,USA, 1992.
[17] A. Meyer-Baese, Pattern Recognition in Medical Imaging, Academic Press, Inc., Orlando, FL, USA,2003.
[18] V. A. Kovalev, F. Kruggel, H.-J. Gertz, D. Y. V. Cramon, Three-dimensional texture analysis of MRI braindatasets, IEEE Transactions on Medical Imaging 20 (5) (2001) 424–433.
[19] X. Li, Texture analysis for optical coherence tomography image, Master’s thesis, The University ofArizona (2001).
[20] R. M. Haralick, Dinstein, K. Shanmugam, Textural features for image classification, IEEE Transactionson Systems, Man, and Cybernetics SMC-3 (1973) 610–621.

50 Leonardo de Oliveira Martins et al. / Electronic Letters on Computer Vision and Image Analysis 8(2):39-50, 2009
[21] A. Baraldi, F. Parmiggiani, An investigation of the textural characteristics associated with gray levelcooccurrence matrix statistical parameters, Geoscience and Remote Sensing, IEEE Transactions on 33 (2)(Mar 1995) 293–304.
[22] R. M. Rangayyan, N. M. El-Faramawy, J. E. Desautels, O. A. Alim, Measures of acutance and shape forclassification of breast tumors., IEEE Trans Med Imaging 16 (6) (1997) 799–810.URL http://view.ncbi.nlm.nih.gov/pubmed/9533580
[23] J. A. Hartigan, M. A. Wong, A k-means clustering algorithm, Applied Statistics 28 (1979) 100–108.URL http://www.jstor.org/view/00359254/di993342/99p04867/0
[24] C. J. C. Burges, A Tutorial on Support Vector Machines for Pattern Recognition, Kluwer AcademicPublishers (1998).
[25] M. Kendall, Multivariate Analysis, Charles Griffin and Company, London, 1975.
[26] C.-C. Chang, C.-J. Lin, Libsvm - a library for support vector machines, available athttp://www.csie.ntu.edu.tw/ cjlin/libsvm/ (2009).
[27] W. Lim, M. ER, Classification of Mammographic Masses using Generalized Dynamic Fuzzy NeuralNetworks, Medical Physics 31 (2004) 1288.
[28] B. Fritzke, A growing neural gas network learns topologies, in: Advances in Neural InformationProcessing Systems 7, MIT Press, 1995, pp. 625–632.