Computer aided detection of clustered microcalcifications in digitized mammograms using Gabor...
12
Computer-aided detection of clustered microcalcifications in digital breast tomosynthesis: A 3D approach Berkman Sahiner, a),b) Heang-Ping Chan, Lubomir M. Hadjiiski, Mark A. Helvie, Jun Wei, Chuan Zhou, and Yao Lu Department of Radiology, University of Michigan, Ann Arbor, Michigan 48109 (Received 16 April 2011; revised 28 September 2011; accepted for publication 19 October 2011; published 9 December 2011) Purpose: To design a computer-aided detection (CADe) system for clustered microcalcifications in reconstructed digital breast tomosynthesis (DBT) volumes and to perform a preliminary evaluation of the CADe system. Methods: IRB approval and informed consent were obtained in this study. A data set of two-view DBT of 72 breasts containing microcalcification clusters was collected from 72 subjects who were scheduled to undergo breast biopsy. Based on tissue sampling results, 17 cases had breast cancer and 55 were benign. A separate data set of two-view DBT of 38 breasts free of clustered microcal- cifications from 38 subjects was collected to independently estimate the number of false-positives (FPs) generated by the CADe system. A radiologist experienced in breast imaging marked the biop- sied cluster of microcalcifications with a 3D bounding box using all available clinical and imaging information. A CADe system was designed to detect microcalcification clusters in the reconstructed volume. The system consisted of prescreening, clustering, and false-positive reduction stages. In the prescreening stage, the conspicuity of microcalcification-like objects was increased by an enhancement-modulated 3D calcification response function. An iterative thresholding and 3D object growing method was used to detect cluster seed objects, which were used as potential centers of microcalcification clusters. In the cluster detection stage, microcalcification candidates were identified using a second iterative thresholding procedure, which was applied to the signal-to-noise ratio (SNR) enhanced image voxels with a positive calcification response. Starting with each cluster seed object as the initial cluster center, a dynamic clustering algorithm formed a cluster candidate by including microcalcification candidates within a 3D neighborhood of the cluster seed object that satisfied the clustering criteria. The number, size, and SNR of the microcalcifications in a cluster candidate and the cluster shape were used to reduce the number of FPs. Results: The prescreening stage detected a cluster seed object in 94% of the biopsied microcalcifi- cation clusters at a threshold of 100 cluster seed objects per DBT volume. After clustering, the detection sensitivity was 90% at 15 marks per DBT volume. After FP reduction, at 85% sensitivity, the average number of FPs estimated using the data set containing microcalcification clusters was 3.8 per DBT volume, and that estimated using the data set free of microcalcification clusters was 3.4. The detection performance for malignant microcalcification clusters was superior to that for benign clusters. Conclusions: Our study indicates the feasibility of the 3D approach to the detection of clustered microcalcifications in DBT and that the newly designed enhancement-modulated 3D calcification response function is promising for prescreening. Further work is needed to assess the generalizabil- ity of our approach and to improve its performance. V C 2012 American Association of Physicists in Medicine. [DOI: 10.1118/1.3662072] Key words: digital breast tomosynthesis, computer-aided detection, microcalcification I. INTRODUCTION Digital breast tomosynthesis (DBT) is a promising new mo- dality for detection and diagnosis of breast cancer. DBT imaging involves acquiring projection views (PVs) of the compressed breast over a range of projection angles using a full-field digital mammography (FFDM) detector. Each PV can be obtained using a fraction of the x-ray exposure used in conventional mammography so that the total DBT dose can be comparable with or slightly higher than that of mam- mography. A variety of techniques have been used to recon- struct the DBT volume from the acquired PVs. 1–7 Since the PVs in a DBT scan are acquired only within a limited range of acquisition angles of the compressed breast, the recon- structed 3D DBT volume contains artifacts due to missing information, regardless of the reconstruction technique applied. Despite reconstruction artifacts, DBT is considered to have a strong potential to improve breast imaging, by reducing the camouflaging effect of the overlapping fibro- glandular breast tissue that is usually a limiting factor for lesion detection and characterization in mammography. The 28 Med. Phys. 39 (1), January 2012 0094-2405/2012/39(1)/28/12/$30.00 V C 2012 Am. Assoc. Phys. Med. 28
-
Upload
independent -
Category
Documents
-
view
5 -
download
0
Transcript of Computer aided detection of clustered microcalcifications in digitized mammograms using Gabor...

Computer-aided detection of clustered microcalcifications in digitalbreast tomosynthesis: A 3D approach
Berkman Sahiner,a),b) Heang-Ping Chan, Lubomir M. Hadjiiski, Mark A. Helvie, Jun Wei,Chuan Zhou, and Yao LuDepartment of Radiology, University of Michigan, Ann Arbor, Michigan 48109
(Received 16 April 2011; revised 28 September 2011; accepted for publication 19 October 2011;
published 9 December 2011)
Purpose: To design a computer-aided detection (CADe) system for clustered microcalcifications in
reconstructed digital breast tomosynthesis (DBT) volumes and to perform a preliminary evaluation
of the CADe system.
Methods: IRB approval and informed consent were obtained in this study. A data set of two-view
DBT of 72 breasts containing microcalcification clusters was collected from 72 subjects who were
scheduled to undergo breast biopsy. Based on tissue sampling results, 17 cases had breast cancer
and 55 were benign. A separate data set of two-view DBT of 38 breasts free of clustered microcal-
cifications from 38 subjects was collected to independently estimate the number of false-positives
(FPs) generated by the CADe system. A radiologist experienced in breast imaging marked the biop-
sied cluster of microcalcifications with a 3D bounding box using all available clinical and imaging
information. A CADe system was designed to detect microcalcification clusters in the reconstructed
volume. The system consisted of prescreening, clustering, and false-positive reduction stages. In
the prescreening stage, the conspicuity of microcalcification-like objects was increased by an
enhancement-modulated 3D calcification response function. An iterative thresholding and 3D
object growing method was used to detect cluster seed objects, which were used as potential centers
of microcalcification clusters. In the cluster detection stage, microcalcification candidates were
identified using a second iterative thresholding procedure, which was applied to the signal-to-noise
ratio (SNR) enhanced image voxels with a positive calcification response. Starting with each cluster
seed object as the initial cluster center, a dynamic clustering algorithm formed a cluster candidate
by including microcalcification candidates within a 3D neighborhood of the cluster seed object that
satisfied the clustering criteria. The number, size, and SNR of the microcalcifications in a cluster
candidate and the cluster shape were used to reduce the number of FPs.
Results: The prescreening stage detected a cluster seed object in 94% of the biopsied microcalcifi-
cation clusters at a threshold of 100 cluster seed objects per DBT volume. After clustering, the
detection sensitivity was 90% at 15 marks per DBT volume. After FP reduction, at 85% sensitivity,
the average number of FPs estimated using the data set containing microcalcification clusters was
3.8 per DBT volume, and that estimated using the data set free of microcalcification clusters was
3.4. The detection performance for malignant microcalcification clusters was superior to that for
benign clusters.
Conclusions: Our study indicates the feasibility of the 3D approach to the detection of clustered
microcalcifications in DBT and that the newly designed enhancement-modulated 3D calcification
response function is promising for prescreening. Further work is needed to assess the generalizabil-
ity of our approach and to improve its performance. VC 2012 American Association of Physicists inMedicine. [DOI: 10.1118/1.3662072]
Key words: digital breast tomosynthesis, computer-aided detection, microcalcification
I. INTRODUCTION
Digital breast tomosynthesis (DBT) is a promising new mo-
dality for detection and diagnosis of breast cancer. DBT
imaging involves acquiring projection views (PVs) of the
compressed breast over a range of projection angles using a
full-field digital mammography (FFDM) detector. Each PV
can be obtained using a fraction of the x-ray exposure used
in conventional mammography so that the total DBT dose
can be comparable with or slightly higher than that of mam-
mography. A variety of techniques have been used to recon-
struct the DBT volume from the acquired PVs.1–7 Since the
PVs in a DBT scan are acquired only within a limited range
of acquisition angles of the compressed breast, the recon-
structed 3D DBT volume contains artifacts due to missing
information, regardless of the reconstruction technique
applied. Despite reconstruction artifacts, DBT is considered
to have a strong potential to improve breast imaging, by
reducing the camouflaging effect of the overlapping fibro-
glandular breast tissue that is usually a limiting factor for
lesion detection and characterization in mammography. The
28 Med. Phys. 39 (1), January 2012 0094-2405/2012/39(1)/28/12/$30.00 VC 2012 Am. Assoc. Phys. Med. 28

potential of DBT in comparison to or as an adjunct to mam-
mography has been demonstrated by several observer
studies.8–12
Computer-aided detection (CADe) systems for cancer
detection in mammography have been under development
for over two decades and have been commercially available
for over a decade. Based on Medicare data, CAD was used
in 74% of screening mammographic studies that were
performed in 2008.13 The effect of CADe on radiologists’
cancer detection performance has been investigated in a num-
ber of prospective clinical trials.14–23 Two of the studies with
historical controls16,21 did not find a major effect or found a
large increase in the call-back rate with CADe; however,
other studies14,15,17–20,22,23 found an increase in sensitivity
accompanied by a moderate increase in the call-back rate.
As a new modality, a number of important issues con-
cerning DBT are still under investigation including how
DBT can be optimized for breast cancer detection and diag-
nosis, and how it will fit into the current breast imaging prac-
tice. Some of these issues are related to the development and
use of CADe. Similar to mammography, there may be
lesions missed by radiologists in DBT due to a number of
factors, and a consistent second reader may be helpful.
Because of the large volume of image data needed to be
interpreted in DBT, the chance of missing cancers may not
be negligible. CADe may be of particular interest in DBT
for microcalcification detection. The detection of microcalci-
fication clusters by radiologists in DBT volumes may be
more difficult compared with mammography for two rea-
sons: First, the cluster of microcalcifications may be sepa-
rated into several reconstructed slices, the number of
microcalcifications on each slice will be fewer, making it
less conspicuous. Although visualization techniques such as
maximum intensity projection (MIP) or slab view may alle-
viate this problem, these techniques may also cause image
blur, and their optimal parameter settings are currently
unknown. Second, the microcalcifications may appear
blurred due to many factors that can cause blurring in DBT
reconstruction, including inaccuracy in the system geometry
and the projection model, a range of oblique incidence
angles to the detector, focal spot motion and patient motion.
A recent study by Spangler et al.24 found that the detection
performance of radiologists for microcalcification clusters
was higher in FFDM compared with DBT, although the dif-
ference did not reach statistical significance for the data set
used in that study. In addition to the radiologists’ detection
performance, searching for microcalcification clusters in a
3D DBT volume may be more demanding than on mammo-
grams and false negatives may not be negligible. For these
reasons, it is expected that CADe may play an even more im-
portant role in microcalcification detection in DBT than in
mammography.
A number of studies investigated the development of
CADe techniques for the detection of masses in DBT.25–29
Compared with the detection of masses, studies investigating
the detection of microcalcification clusters on DBT are more
preliminary.30–33 Reiser et al.30 investigated the detection of
microcalcifications on individual PVs. The detected micro-
calcifications were then backprojected into the 3D volume.
A second-stage detection was performed after this 3D vol-
ume was transformed using MIP. False-positive reduction
was performed with features extracted from the PVs,
followed by 3D clustering. On a data set of 30 image sets
with microcalcification clusters and 30 image sets without
visible findings, their detection method achieved a sensitivity
of 86% with 1.3 false-positive (FP) clusters per DBT vol-
ume. Bernard et al.31 developed an algorithm for the detec-
tion of microcalcification clusters on filtered back-projection
reconstructed slices. The voxel contrast was enhanced by
convolving the image volume with a Mexican hat wavelet at
a specific scale. A voxel was selected as a candidate based
on its contrast and the local noise level. A set of scales cov-
ering the microcalcification size range was used for the
Mexican hat. On a data set of 13 DBT volumes containing
microcalcification clusters and 37 normal DBT volumes,
their method had a sensitivity of 85% at an average of 1.4
FP marks per breast volume. Park et al.32 compared two pre-
liminary detection methods. The first method detected
microcalcification clusters on the individual PVs, and the
second method detected clusters on the individual recon-
structed slices. Both methods then grouped the detected clus-
ters using location information. The first method detected 14
of 20 (70%) clusters seen on the PV images with an average
of 3.99 FPs per DBT volume. The second method detected
35 of 40 (86%) of clusters seen on the reconstructed slices
with an average of 15.9 FPs per DBT volume. In our pilot
study, we investigated the detection of microcalcification
clusters in the reconstructed DBT volume using 3D multi-
scale filtering and SNR enhancement.33 On a data set of two-
view DBTs of 39 breasts containing microcalcification
clusters, a view-based sensitivity of 80% (59=74) was
achieved at 2.0 FPs per DBT volume. In this paper, we
expanded this preliminary study by almost doubling the data
set size for DBT with clustered microcalcifications. We also
investigated the effects of filter parameters for both multi-
scale Hessian enhancement and SNR enhancement and the
effect of clustering, and compared the detection performance
of the enhancement-modulated 3D calcification response
function with that of using SNR enhancement alone. An in-
dependent data set of DBTs was also collected to evaluate
the FP rate on images free of clustered microcalcifications.
II. METHODS AND MATERIALS
The DBT scans were acquired with a GE GEN2 prototype
system in the breast imaging research laboratory at the Uni-
versity of Michigan. The DBT system acquires 21 PV
images over a 630 angular range in 3 increments in a step-
and-shoot operation. Rh target and Rh filter are used for
breasts of all thicknesses. The DBT system has a CsI=aSi
active matrix flat panel digital detector with dimensions of
19.20 cm � 23.04 cm and a pixel pitch of 0.1 mm � 0.1
mm. The digital detector is stationary during image acquisi-
tion. The dose per DBT view was set to be about 1.5 times
that of a single-view conventional mammogram in this pro-
totype DBT system. The DBT volumes were reconstructed
29 Sahiner et al.: Computer-aided detection of microcalcification clusters in DBT 29
Medical Physics, Vol. 39, No. 1, January 2012

at 1 mm slice interval using the simultaneous algebraic
reconstruction technique (SART), with a relaxation parame-
ter k of 0.5 and a single iteration.4
II.A. Data Set
The subject recruitment protocol was IRB approved.
Breast imaging patients in our health system who were rec-
ommended for breast biopsy based on suspicious mammo-
graphic microcalcifications were eligible. Written informed
consent was obtained from each subject. DBT scans of the
breast were acquired in both craniocaudal (CC) and medio-
lateral oblique (MLO) views before biopsy was performed.
For this study, we collected two-view DBT scans of 72
breasts containing microcalcifications. The location of the
biopsy-proven microcalcification cluster was marked by a
3D box in each DBT volume by an experienced Mammog-
raphy Quality Standards Act (MQSA) radiologist using the
clinical mammograms and the biopsy report as references. A
total of 139 microcalcification clusters were identified on the
144 DBT scans. In five breasts, the microcalcification cluster
was visible only in one of the DBT views. The radiologist
also subjectively rated the visibility of the microcalcification
clusters on a scale of 1 to 10, where 1 corresponded to the
most visible cluster. Figure 1 shows the histogram of visibil-
ity ratings for the 139 visible clusters. Of the 72 breast biop-
sies, 17 of the clusters were found to be malignant and 55
benign. This data set is referred to as the abnormal data set.
To investigate the number of FPs generated by our CAD
system on cases that were free of microcalcification clusters,
we used a data set of two-view DBT scans from 38 breasts
(76 DBT volumes). These DBTs were acquired from sub-
jects who were scheduled for biopsy due to a suspicious
mass. The cases were verified to be free of microcalcification
clusters by the same experienced radiologist. For the pur-
poses of this study, these cases are referred to as the “normal
data set” since they did not contain any microcalcification
clusters,
II.B. Detection algorithm
In this study, a prototype microcalcification cluster detec-
tion system was developed using a 3D approach in which the
reconstructed 3D DBT volume was used as input. Figure 2
shows a block diagram of the CADe system, which consists
of prescreening, cluster detection, and false-positive reduc-
tion stages. The details of each stage of the CADe system
are described below.
II.B.1. Prescreening
In the prescreening stage, the microcalcifications are first
enhanced using two parallel processes: One process is based
on multiscale Hessian enhancement with a calcification
response function, and the other is based on SNR enhance-
ment of the microcalcifications in the reconstructed DBT
volume. The calcification response volume resulting from
Hessian enhancement is weighted by the SNR enhanced vol-
ume to obtain the enhancement-modulated calcification
response (EMCR) at each voxel, and a maximum-gradient
object growing and selection process is applied to the
EMCR to identify seed objects for microcalcification
clusters.
II.B.1.a. Multiscale calcification response
The multiscale Hessian enhancement method34 is adapted
to detect small bright objects with a spherical shape in DBT.
It is based on the principle that at the center of a spherically
symmetric object with positive contrast, the eigenvalues of
the Hessian matrix are all negative and equal to each other.
The Hessian matrix at voxels that are part of other kinds of
shapes, such as lines or elongated ellipses, will have unequal
eigenvalues. In practice, in order to tune the Hessian
FIG. 1. Visibility of the malignant and benign microcalcification clusters on
the DBT volume, as rated by a breast radiologist experienced in the interpre-
tation of mammograms and DBT. A rating of 1 corresponded to the most
visible clusters. The malignant and benign clusters had average visibilities
of 4.0 and 4.5, respectively.
FIG. 2. The block diagram of the microcalcification detection system for
DBT.
30 Sahiner et al.: Computer-aided detection of microcalcification clusters in DBT 30
Medical Physics, Vol. 39, No. 1, January 2012

enhancement to objects at different scales and to reduce the
noise that is amplified by the second-order derivatives in the
Hessian operator, the image Iðx; y; zÞ is first convolved with
a 3D Gaussian smoothing filter with scale r
srðx; y; zÞ ¼1
ð2pr2Þ3=2exp �ðx2 þ y2 þ z2Þ=2r2� �
: (1)
Let fðx; y; zÞ denote the smoothed image volume,
Hrðx; y; zÞ ¼fxx fxy fxz
fyx fyy fyz
fzx fzy fzz
24
35; (2)
denote the Hessian matrix at a voxel (x,y,z) of the smoothed
volume, and
k3j j � k2j j � k1j j; (3)
denote the eigenvalues of the Hessian matrix at (x,y,z). One
of the methods proposed in the literature35 for enhancement
of spherically symmetric object is to define a response rr at
scale r as
rr ¼ �k23=k1 if k1 � k2 � k3 � 0
0 otherwise
�: (4)
If the object has a Gaussian shape with
Iðx; y; zÞ ¼ exp �ðx2 þ y2 þ z2Þ=2r20
� �; (5)
then it can be shown that among all possible scales for the
filter srðx; y; zÞ, the scale
rð¼ffiffiffiffiffiffiffiffi3=2
pr0; (6)
maximizes rr. In general, the size of the object is not known.
A common approach in this case is to use a bank of Hessian
filters S ¼ sr1; sr2
;…; srNf g, at multiple scales frg
¼ r1; r2;…; rNf g. A response vector R ¼ rr1; rr2
;…; rrNf g
is obtained at (x,y,z), and the elements of R are combined to
achieve the desired signal enhancement. In a previous study
on pulmonary nodule registration, we used a neural network
to combine the elements of R.36 In the current study, we first
defined
i� ¼ arg maxi
rrif g: (7)
The multiscale calcification response at (x,y,z) was then
defined as
Eðx; y; zÞ ¼ rri�
ri�: (8)
II.B.1.b. SNR enhancement
SNR enhancement was applied to each slice independ-
ently. It consisted of a combination of three filters, F1, F2,
and F3, of sizes M1 �M1, M2 �M2, and M3 �M3, respec-
tively, where M1 > M2 � M3. The filters can be linear or
nonlinear. If linear filters are chosen, the filters can be com-
bined as follows to produce a single band-pass filter before
convolution with the image to reduce processing time. The
kernels of the filters are designed based on the following
considerations. When the kernels are centered at the calcifi-
cation candidate, a linear combination of the filters F1 and F2
is designed to obtain an estimate of the background image
intensity around the calcification candidate. M1 should be
large enough to include the background, and M2 large
enough so that the microcalcification signal is excluded from
the background estimation. The filter F3 is used to estimate
or increase the average signal intensity for the microcalcifi-
cation candidate, depending on the selection of M3. In this
study, for simplicity, we chose to use boxcar filters for F1,
F2, and F3, where the kernel weights of the filter Fi is 1=M2i
in an Mi �Mi box, and 0 elsewhere. Other filters such as
Gaussian filters with appropriate kernels can be used as well.
SNR enhancement was accomplished by convolving the
combined band-pass filter with the DBT volume
Fðx; yÞ ¼ F3ðx; yÞ �1
M21 �M2
2
�hM2
1F1ðx; yÞ �M22F2ðx; yÞ
i:
(9)
Examples of the enhancement filter for different values of
M1, M2, and M3 are shown in Fig. 3.
II.B.1.c. Cluster seed object detection
The EMCR volume was defined as the voxel-by-voxel
weighting of the multiscale calcification response volume by
the SNR-enhanced volume
EMCRðx; y; zÞ ¼ Eðx; y; zÞ � Iðx; y; zÞ � Fðx; yÞ½ �; (10)
where Iðx; y; zÞ � Fðx; yÞ denotes the SNR-enhanced vol-
ume. Since both multiscale calcification response and SNR-
enhancement are intended to make the microcalcifications
more discernable, their product may also be expected to
improve microcalcification detection. Although other meth-
ods can be used to fuse these two images (including super-
vised methods), we did not investigate other potential
methods in this feasibility study.
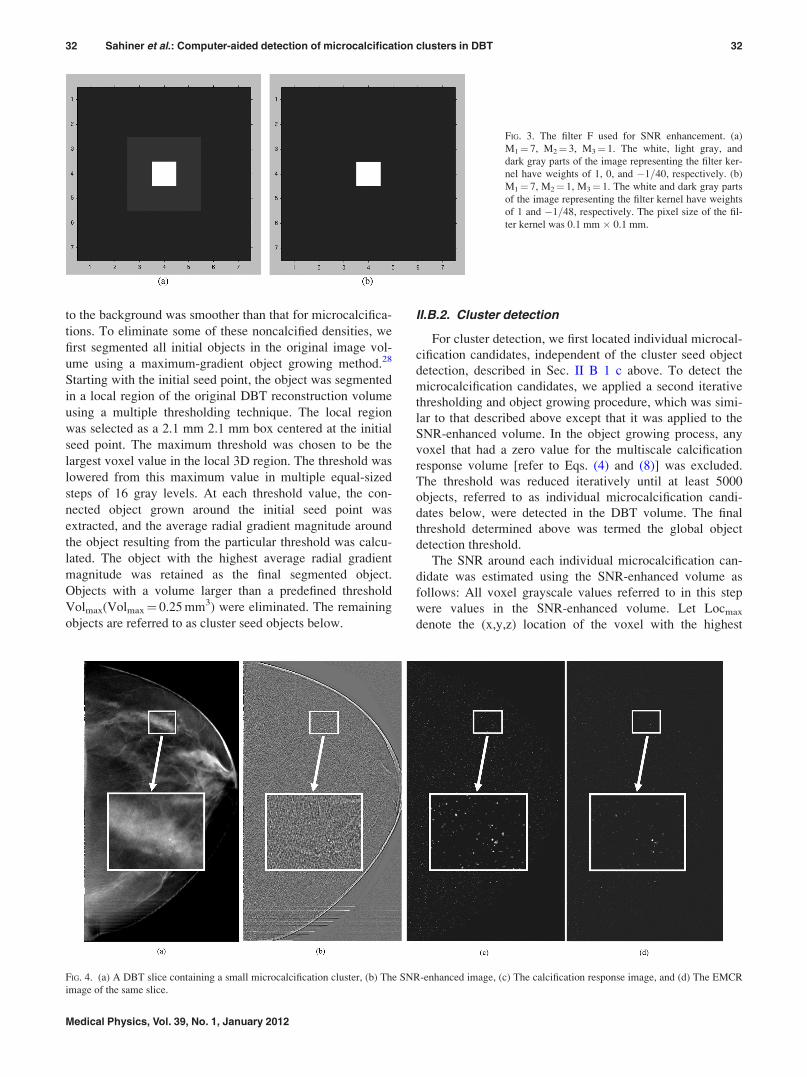
Figure 4(a) shows a slice of a DBT volume containing a
microcalcification cluster that was biopsy-proven to be duc-
tal carcinoma in situ. Figures 4(b)–4(d) show the SNR-
enhanced image, multiscale calcification response image,
and EMCR image, respectively, corresponding to the same
slice.
In the EMCR volume, an iterative thresholding and object
growing technique was designed to detect at least 500 initial
objects. The technique started with an initial threshold. Vox-
els that were above the initial threshold were marked and
grouped into 3D connected objects using 26-connectivity.37
The initial threshold was chosen to be relatively high so that
only a few connected objects would be initially detected.
The threshold was then iteratively decreased until the num-
ber of connected objects was at least 500. For each detected
initial object, the voxel with the highest EMCR value was
defined as the initial seed point.
In the early stage of development, it was found that these
initial objects included small, noncalcified densities in the
image. The sizes of these densities were larger than those of
most microcalcifications, and the transition from the density
31 Sahiner et al.: Computer-aided detection of microcalcification clusters in DBT 31
Medical Physics, Vol. 39, No. 1, January 2012
to the background was smoother than that for microcalcifica-
tions. To eliminate some of these noncalcified densities, we
first segmented all initial objects in the original image vol-
ume using a maximum-gradient object growing method.28
Starting with the initial seed point, the object was segmented
in a local region of the original DBT reconstruction volume
using a multiple thresholding technique. The local region
was selected as a 2.1 mm 2.1 mm box centered at the initial
seed point. The maximum threshold was chosen to be the
largest voxel value in the local 3D region. The threshold was
lowered from this maximum value in multiple equal-sized
steps of 16 gray levels. At each threshold value, the con-
nected object grown around the initial seed point was
extracted, and the average radial gradient magnitude around
the object resulting from the particular threshold was calcu-
lated. The object with the highest average radial gradient
magnitude was retained as the final segmented object.
Objects with a volume larger than a predefined threshold
Volmax(Volmax¼ 0.25 mm3) were eliminated. The remaining
objects are referred to as cluster seed objects below.
II.B.2. Cluster detection
For cluster detection, we first located individual microcal-
cification candidates, independent of the cluster seed object
detection, described in Sec. II B 1 c above. To detect the
microcalcification candidates, we applied a second iterative
thresholding and object growing procedure, which was simi-
lar to that described above except that it was applied to the
SNR-enhanced volume. In the object growing process, any
voxel that had a zero value for the multiscale calcification
response volume [refer to Eqs. (4) and (8)] was excluded.
The threshold was reduced iteratively until at least 5000
objects, referred to as individual microcalcification candi-
dates below, were detected in the DBT volume. The final
threshold determined above was termed the global object
detection threshold.
The SNR around each individual microcalcification can-
didate was estimated using the SNR-enhanced volume as
follows: All voxel grayscale values referred to in this step
were values in the SNR-enhanced volume. Let Locmax
denote the (x,y,z) location of the voxel with the highest
FIG. 3. The filter F used for SNR enhancement. (a)
M1¼ 7, M2¼ 3, M3¼ 1. The white, light gray, and
dark gray parts of the image representing the filter ker-
nel have weights of 1, 0, and �1=40, respectively. (b)
M1¼ 7, M2¼ 1, M3¼ 1. The white and dark gray parts
of the image representing the filter kernel have weights
of 1 and �1=48, respectively. The pixel size of the fil-
ter kernel was 0.1 mm � 0.1 mm.
FIG. 4. (a) A DBT slice containing a small microcalcification cluster, (b) The SNR-enhanced image, (c) The calcification response image, and (d) The EMCR
image of the same slice.
32 Sahiner et al.: Computer-aided detection of microcalcification clusters in DBT 32
Medical Physics, Vol. 39, No. 1, January 2012

grayscale value within a segmented microcalcification candi-
date. The background region around Locmax was defined as a
5� 5� 5 mm cube centered at Locmax with voxels that had
values less than the global object detection threshold. The
average of the background voxels was calculated and sub-
tracted from the grayscale value at Locmax to define the sig-
nal level. The SNR of the microcalcification candidate was
then found as the ratio of the signal level to the standard
deviation of the background voxels. The segmentation of the
microcalcification candidate centered at Locmax was refined
by extracting voxels that had an SNR greater than a selected
threshold and were connected by 26-connectivity. An SNR
threshold of 3.0 was chosen for including a voxel in the
microcalcification candidate. The final size of the microcal-
cification candidate was estimated from the SNR-segmented
object.
After the set of cluster seed objects and the set of individ-
ual microcalcification candidates were detected, as described
above, a dynamic clustering process was used to detect clus-
ter candidates as follows. Note that although at least 5000
individual microcalcification candidates were detected, clus-
tering was performed only around the cluster seed objects.
Starting with a cluster seed object as the initial cluster center,
individual microcalcification candidates that satisfied the
membership criteria below were included as cluster mem-
bers one at a time. Microcalcification candidates were
ranked with respect to their SNR and were sequentially
included as members of the cluster candidate following their
rank order if their SNR exceeded an SNR threshold, chosen
as 3.0 in this study, and if they were within a 5 mm radius of
the cluster center. These parameters were chosen based on
our experience in microcalcification detection on mammo-
grams38+40 and further experiments with DBT. After the
inclusion of each new microcalcification candidate, the clus-
ter center was updated as the centroid of all individual
microcalcification locations included in the cluster. The
SNR of the cluster was also updated as the highest SNR
among the individual microcalcifications within the cluster.
Individual microcalcification candidates that were included
into a given cluster were marked and were excluded from
being a candidate member of other clusters.
II.B.3. False-positive reduction
We used a rule-based classifier with three rules related to
the size, SNR, and the number of individual microcalcifica-
tions within a candidate cluster for false-positive reduction.
First, we counted the number of individual microcalcification
candidates within a cluster candidate with an SNR of 3.5 or
more. The first rule specified that if this number was less than
4, the cluster candidate would be eliminated. Second, we
counted the number of individual microcalcification candi-
dates with a size of seven voxels or more within a cluster can-
didate. As described above, an SNR threshold of 3.0 was
used as a region-growing criterion to find the individual
microcalcification size. The second rule specified that if this
number was less than 4, the cluster candidate would be elimi-
nated, unless the third rule, described below, was satisfied.
As an example, according to the second rule, if a cluster can-
didate had eight microcalcification candidates, but only three
of them had a size larger than or equal to 7, the cluster candi-
date was eliminated. This rule was therefore aimed at elimi-
nating FP clusters with small objects that are presumably
caused by image noise. However, some true clusters may
consist of a large number of tiny microcalcifications. In order
not to eliminate these clusters, the third rule specified that
cluster candidates with ten or more members should be kept,
regardless of the individual object sizes and their SNRs.
The bounding boxes of the clusters were also examined for
false-positive reduction. The width and height of the cluster
were defined as the two dimensions of the bounding box in
the plane parallel to the detector, while the depth was defined
as that in the perpendicular direction. A width or height less
than 2 mm, and a rectangularity >3, where rectangularity is
defined as the ratio of the larger dimension to smaller dimen-
sion, was considered to be an indication of a linear artifact,
and such cluster candidates would be eliminated.
II.C. Performance evaluation
In order to select parameters for prescreening, we per-
formed a number of experiments. The prescreening perform-
ance was estimated using only the abnormal data set of 144
DBT scans that contained microcalcification clusters. The
normal data set was not used at this stage. At this early phase
of design, we used a simple method to plot a curve similar to
a free-response receiver operating characteristic (FROC)
curve to evaluate the performance of the prescreening stage.
First, we defined the score of each object as the highest
EMCR value within the object. Next, we ranked the objects
within the DBT volume according to their scores. Finally,
we determined what fraction F of DBT volumes would
have a correctly localized cluster if we only kept R highest-
scoring objects per volume. As an example, assume that
each DBT volume contained one true cluster, V0 out of a
total of V volumes had the true cluster as the highest ranking
object, and V1 different volumes had the true cluster as the
second-highest ranking object. Then one would have
FðR ¼ 1Þ ¼ V0=V, and FðR ¼ 2Þ ¼ ðV0 þ V1Þ=V. The
resulting plot of (R, F) pairs is referred to as a rank-
sensitivity plot below. At a given operating point defined by
the number of retained objects R0, the rank-sensitivity plot
indicates that F(R0)*V true clusters were detected in the
data set. However, this is a minimum number in terms of
TP objects because some clusters may be detected as
multiple objects. Since the total number of computer marks
at this operating point is R0*V, the average number of
FPs per image unit at this operating point is at most
(R0 - F(R0))*V.
After parameter selection, the overall performance of the
detection system, including clustering and FP reduction, was
evaluated using FROC analysis. For this purpose, the highest
SNR value among the objects within a detected cluster was
defined as the SNR of the cluster and used as the decision
variable. The detected cluster was considered to be a true-
positive if its centroid was within the 3D ground-truth box
33 Sahiner et al.: Computer-aided detection of microcalcification clusters in DBT 33
Medical Physics, Vol. 39, No. 1, January 2012

determined by the radiologist. Otherwise, the detected clus-
ter was considered a false-positive. Separate FROC curves
were constructed for malignant, benign, and all calcification
clusters for comparison. We separately used the normal data
set of 76 DBT volumes, and the abnormal data set of 144
DBT volumes to estimate the average number of FPs at each
SNR threshold. FPs estimated from these two data sets were
used to plot two sets of FROC curves.
III. RESULTS
III.A. Effect of the Hessian response functionparameters
As discussed above, a bank of Gaussian filters S corre-
sponding to a set of N scales frg ¼ r1; r2;…; rNf g was
used for multiscale Hessian response function. We evaluated
the effect of the scales on the calcification response. A small
number of scales, N¼ 3, was used to keep the computational
cost low. The scale of the Gaussian filter was varied between
r ¼ 0:15 mm and 0:45 mm, with various combinations of the
scales to constitute the bank of filters S. In this part of the
investigation, the SNR enhancement filter was fixed at
M1 ¼ 0:7 mm, M2 ¼ 0:1 mm, and M3 ¼ 0:1 mm. The rank-
sensitivity plots are shown in Fig. 5. Based on these results,
the set of scales was selected as frg ¼ 0:2 mm; 0:25 mm;f0:35 mmg because it could reach the highest sensitivity
(with lax rank threshold) at this prescreening stage.
III.B. Effect of the SNR enhancement filter parameters
To investigate the effect of SNR enhancement filter
parameters, we first changed M1 in the range of 0.3 mm to
1.1 mm. In this part of the investigation, we fixed the other
two filters to be M2 ¼ M3 ¼ 0:1 mm, and the Hessian multi-
scale filters at frg ¼ 0:20 mm; 0:25 mm; 0:35 mmf g. The
resulting rank-sensitivity plots are shown in Fig. 6. It is
observed that a small background area, M1¼ 0.3, resulted in
a slightly poorer performance, while the other values of M1
led to comparable rank-sensitivity curves. We then studied
the effect of M2 and M3. Figures 7(a)–7(c) show the effects
of varying M2 and M3 for M1 ¼ 0.3, 0.7, and 0.11 mm,
respectively. Because the seed object detection appeared to
be relatively stable for M1 from 0.7 to 1.1 mm, we selected
M1 ¼ 0:7 mm, M2 ¼ 0:1 mm, and M3 ¼ 0:1 mm for the
SNR enhancement. As shown in Fig. 7(b), at an operating
point of rank threshold of 100, which was equivalent to a
threshold of keeping 100 cluster seed objects per DBT
volume, 94% of biopsied calcification clusters contained a
seed object.
III.C. Effect of enhancement modulated calcificationresponse
We investigated the effect of modulating the multiscale
calcification response with the SNR-enhanced image. We
compared the prescreening rank-sensitivity plot with the
calcification response function in place (frg ¼ 0:20 mm;f0:25 mm; 0:35 mmg) to that when the output of the multi-
scale calcification response (see Fig. 2) was replaced by a
spatially constant value over the DBT volume. This was
equivalent to removing the multiscale calcification response
enhancement and using only SNR-enhancement during pre-
screening. The parameters of the SNR enhancement filter
were M1 ¼ 0:7 mm, M2 ¼ 0:1 mm, and M3 ¼ 0:1 mm, as
discussed above. Figure 8 shows a comparison of the two
prescreening approaches.
III.D. Effect of clustering and false-positive reduction
The next step in our detection system was clustering. We
first compared the rank-sensitivity plots with and without the
multiscale calcification response in Fig. 9. At this stage, the
cluster SNR (i.e., the highest SNR value of the microcalcifi-
cation candidates within a cluster) was available, as
described in Sec. II B 2 above. Similar to the final FROC
curves described below, we used the cluster SNR as the deci-
sion variable, since the unit of interest at this stage was the
cluster, instead of the cluster seed objects as in Figs. 5–8.
FIG. 5. The effect of the size of the Hessian multiscale filters on the prescre-
ening performance. The plot shows the fraction of true clusters in the data
set that included a cluster seed object as a function of the rank of the objects
that were retained per DBT volume. In this part of the investigation, the
SNR enhancement filter kernels were fixed at M1 ¼ 0:7 mm, M2 ¼ 0:1 mm,
and M3 ¼ 0:1 mm.
FIG. 6. The effect of the size of the outer filter kernel (M1) on the prescreen-
ing performance. The inner filter kernel sizes were selected as
M2 ¼ M3 ¼ 0:1 mm, and the Hessian multiscale filters were fixed at
frg ¼ 0:20 mm; 0:25 mm; 0:35 mmf g
34 Sahiner et al.: Computer-aided detection of microcalcification clusters in DBT 34
Medical Physics, Vol. 39, No. 1, January 2012

Figure 9 is similar to Fig. 8 except that the cluster SNR was
used as the decision variable for ranking. At an operating
point of ten clusters per DBT volume, 88% and 79% of the
true calcification clusters could be correctly identified with
and without the multiscale calcification response, respec-
tively. The rank-sensitivity curve after clustering was higher
than those before clustering (Figs. 5–8) because the cluster-
ing process eliminated some of the false positives. A com-
parison of the sensitivity of the system at different rank
thresholds before and after clustering is shown in Table I.
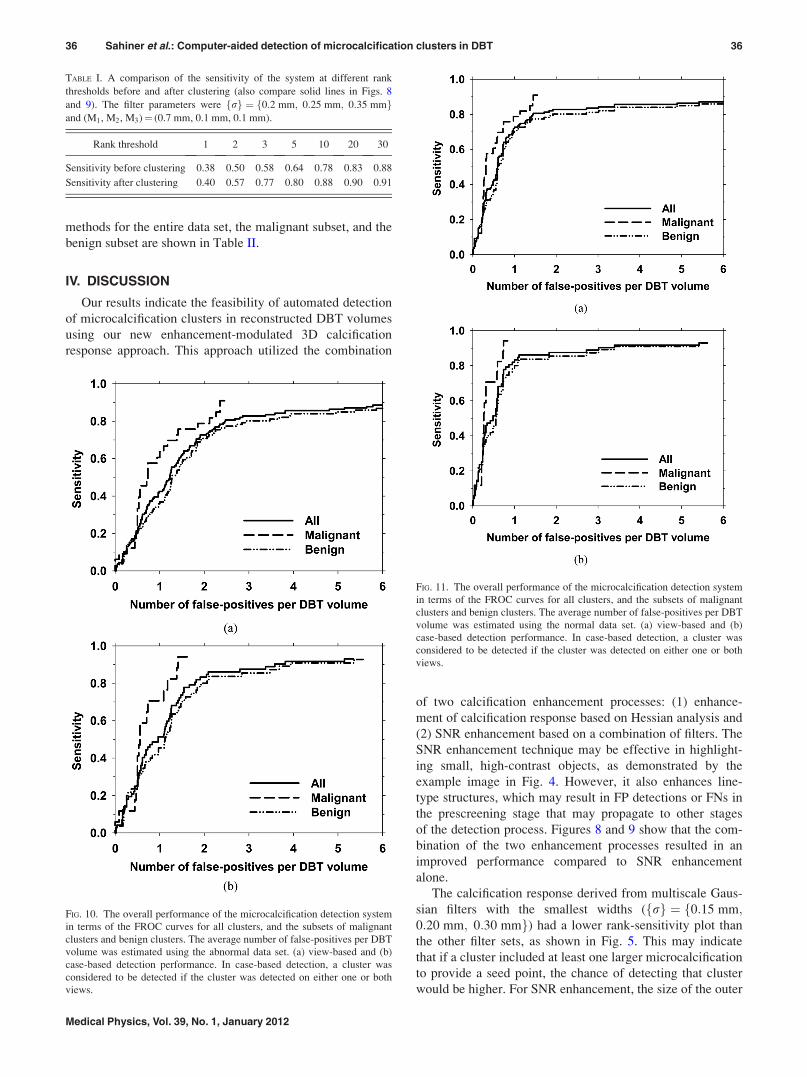
The final FROC curves for the detection system, with the
FP rate estimated from the abnormal data set after false-
positive reduction, are shown in Figs. 10(a) and 10(b) for
view-based and case-based scoring, respectively. In view-
based scoring, the same cluster seen in the CC and MLO
views was counted independently such that the total number
of true clusters was 139. In case-based scoring, a cluster was
considered to be detected if its score exceeded the decision
threshold in either one or both of the CC and MLO views
and the total number of true clusters were 72. The FROC
curves for view-based and case-based scoring with the aver-
age FP rates estimated from the normal data set are shown in
Figs. 11(a) and 11(b), respectively. Using view-based scor-
ing, at 85% sensitivity, the average number of FPs estimated
using the abnormal and normal data sets were 3.8 and 3.4
per DBT volume, respectively. The FP rates estimated using
the two data sets at these sensitivity levels for both scoring
FIG. 7. The effect of the sizes of the inner filter kernels (M2 and M3) on the
prescreening performance. The Hessian multiscale filters were fixed at {r}
¼ {0.20 mm, 0.25 mm, 0.35 mm}. The outer filter kernel M1 was set to be
0.3, 0.7, and 0.11 mm in Figs. 7(a)–7(c), respectively.
FIG. 8. Rank-sensitivity plots for the prescreening performance with and
without the multiscale calcification response (CR) enhancement.
FIG. 9. Rank-sensitivity plots for the performance after the clustering stage
with and without the multiscale CR enhancement.
35 Sahiner et al.: Computer-aided detection of microcalcification clusters in DBT 35
Medical Physics, Vol. 39, No. 1, January 2012
methods for the entire data set, the malignant subset, and the
benign subset are shown in Table II.
IV. DISCUSSION
Our results indicate the feasibility of automated detection
of microcalcification clusters in reconstructed DBT volumes
using our new enhancement-modulated 3D calcification
response approach. This approach utilized the combination
of two calcification enhancement processes: (1) enhance-
ment of calcification response based on Hessian analysis and
(2) SNR enhancement based on a combination of filters. The
SNR enhancement technique may be effective in highlight-
ing small, high-contrast objects, as demonstrated by the
example image in Fig. 4. However, it also enhances line-
type structures, which may result in FP detections or FNs in
the prescreening stage that may propagate to other stages
of the detection process. Figures 8 and 9 show that the com-
bination of the two enhancement processes resulted in an
improved performance compared to SNR enhancement
alone.
The calcification response derived from multiscale Gaus-
sian filters with the smallest widths (frg ¼ 0:15 mm;f0:20 mm; 0:30 mmg) had a lower rank-sensitivity plot than
the other filter sets, as shown in Fig. 5. This may indicate
that if a cluster included at least one larger microcalcification
to provide a seed point, the chance of detecting that cluster
would be higher. For SNR enhancement, the size of the outer
TABLE I. A comparison of the sensitivity of the system at different rank
thresholds before and after clustering (also compare solid lines in Figs. 8
and 9). The filter parameters were frg ¼ 0:2 mm; 0:25 mm; 0:35 mmf gand (M1, M2, M3)¼ (0.7 mm, 0.1 mm, 0.1 mm).
Rank threshold 1 2 3 5 10 20 30
Sensitivity before clustering 0.38 0.50 0.58 0.64 0.78 0.83 0.88
Sensitivity after clustering 0.40 0.57 0.77 0.80 0.88 0.90 0.91
FIG. 10. The overall performance of the microcalcification detection system
in terms of the FROC curves for all clusters, and the subsets of malignant
clusters and benign clusters. The average number of false-positives per DBT
volume was estimated using the abnormal data set. (a) view-based and (b)
case-based detection performance. In case-based detection, a cluster was
considered to be detected if the cluster was detected on either one or both
views.
FIG. 11. The overall performance of the microcalcification detection system
in terms of the FROC curves for all clusters, and the subsets of malignant
clusters and benign clusters. The average number of false-positives per DBT
volume was estimated using the normal data set. (a) view-based and (b)
case-based detection performance. In case-based detection, a cluster was
considered to be detected if the cluster was detected on either one or both
views.
36 Sahiner et al.: Computer-aided detection of microcalcification clusters in DBT 36
Medical Physics, Vol. 39, No. 1, January 2012

box used for background estimation, M1, did not have a
major effect on the prescreening performance, as shown in
Fig. 6, when it was 0.5 mm or larger. Because most micro-
calcifications of interest were smaller than 0.5 mm, this
result was consistent with the expectation that the back-
ground should be estimated in a small region surrounding
the microcalcification without including the calcification
itself. The prescreening performance was slightly degraded
when the inner box sizes were increased from (M2,
M3)¼ (0.1 mm, 0.1 mm), as shown if Fig. 7. The final choice
of (M1, M2, M3)¼ (0.7 mm, 0.1 mm, 0.1 mm) showed that
the reconstructed DBT slices were relatively smooth so that
no additional smoothing was needed to achieve the best
SNR for our data set.
The FP rate estimated from the abnormal data set was
higher than that estimated from the normal data set
(Table II). To investigate the cause of the difference in the
FP rates, the reference radiologist inspected each of the 832
FP marks (5.8 FPs=DBT volume) produced by the CAD sys-
tem for the abnormal data set at the highest sensitivity level
in Fig. 10 (sensitivity¼ 88%). A similar inspection was also
performed for the normal data set. The results indicated that
an average of 1.8 FP marks per DBT volume in the abnormal
data set contained individual microcalcifications that were
not considered clustered, while the normal data set contained
an average of 0.7 such FP marks per DBT volume. It there-
fore appears that the abnormal cases more likely contained
scattered microcalcifications that were not considered clini-
cally significant clusters. However, when they were com-
bined with microcalcification candidates caused by image
noise, these microcalcifications increased the likelihood of
producing FP clusters, resulting in the higher FP rates esti-
mated from the abnormal data set.
Similar to previous results for the detection of microcalci-
fication clusters on mammograms,41 the detection perform-
ance for malignant clusters in this work was superior to that
for benign clusters. For malignant clusters, a case-based sen-
sitivity of 80% was obtained at about 1.2 FP per DBT vol-
ume, while the FP rate was about 1.9 for benign clusters at
the same sensitivity. However, the number of malignant
cases in this work was relatively low (17 of 72), which may
limit the generalizability of this result. Due to the small data
set size for both malignant and benign clusters in this prelim-
inary study, independent testing was not performed for the
detection system. Although the performance in the prescre-
ening stage was not very sensitive to filter parameters within
the studied range, and the FP reduction stage included sim-
ple rule-based decision criteria to reduce overtraining, our
results may be optimistically biased due to the lack of inde-
pendent testing. Future study with independent training and
test sets is required to assess the generalizability of our
detection system.
The processing parameters used in prescreening may
depend on the reconstruction algorithm. The DBT volumes
in this study were reconstructed using the SART algorithm.
Other techniques, such as filtered-backprojection or
maximum-likelihood reconstruction methods may produce
DBT with different noise and signal properties. Likewise,
the relaxation parameter, number of iterations, and the
access order to the PVs in SART reconstruction may affect
the reconstructed images. The effect of the reconstruction
algorithm and parameters on the detection performance, and
whether the techniques and parameters in the detection sys-
tem need to be redesigned to adapt to different quality of
DBT images are topics for further investigation.
Our CAD system contained a large number of parameters
for presecreening, clustering, and FP reduction stages. In this
preliminary study, we focused on the effect of the filter pa-
rameters for the multiscale calcification response and SNR
enhancement. The choices of other parameters, such as the
Volmax threshold, the minimum number of cluster seed
objects detected in the EMCR volume, and the minimum
number of microcalcification candidates detected in the
SNR-enhanced volume, were based on initial experience
rather than systematic investigations. Further studies with a
larger database to optimize these and other processing pa-
rameters have a potential to improve the microcalcification
detection performance.
The calcification response function used in this study was
designed for spherically symmetric objects. True microcalci-
fications will have a variety of shapes, including oblong and
irregular. In addition, the interplane artifacts from the recon-
struction algorithm will distort the shape of the microcalcifi-
cations in the depth direction. The design of the parameters
in this preliminary study did not take into consideration the
anisotropic properties of the signal and the noise. Accurate
modeling of the electronic, quantum, and structured noise
components, the microcalcification signal, and the artifacts
introduced by the limited-angle reconstruction and studies of
their effects on detection performance will be interesting
topics of future investigation.
This study investigated the detection of microcalcification
clusters only in the reconstructed DBT volumes, while some
other studies have investigated microcalcification detection
TABLE II. Average number of false-positives per reconstructed DBT volume at a sensitivity of 80% and 85%. For each level of sensitivity, the number of
false-positives estimated from abnormal cases (i.e., cases containing microcalcification clusters) and estimated from normal cases (i.e., cases free of microcal-
cification clusters) are listed in columns labeled “Abnorm” and “Norm,” respectively.
80% sensitivity (view-based) 85% sensitivity (view-based) 80% sensitivity (case-based) 85% sensitivity (case-based)
Clusters Abnorm Norm Abnorm Norm Abnorm Norm Abnorm Norm
All 2.5 1.4 3.8 3.4 1.8 0.9 2.1 1.1
Malignant 2.1 1.1 2.4 1.4 1.2 0.6 1.4 0.7
Benign 2.9 1.9 5.4 5.4 1.9 1.1 3.5 1.8
37 Sahiner et al.: Computer-aided detection of microcalcification clusters in DBT 37
Medical Physics, Vol. 39, No. 1, January 2012

on PVs.30,32 These two approaches may have different
strengths. Detection on PVs may leverage existing detection
algorithms on mammograms and does not depend on specific
reconstruction method. However, due to the low SNR on
each PV, some of the parameters in the existing detection
algorithms on mammograms will require adjustment. It is
generally accepted that preprocessing is one of the key com-
ponents of a CADe algorithm. Tomosynthesis reconstruction
can be considered to be a preprocessing step in the 3D detec-
tion approach, which combines the information from the
multiple PVs and increases the SNR of the targets. We have
previously demonstrated that fusion of information from
mass candidates detected in the 3D volume and those
detected in the 2D PVs can improve the detection accuracy
compared to the individual approaches.28 The usefulness of
such strategy should be investigated for microcalcification
detection in future studies.
V. CONCLUSION
We have investigated the feasibility of developing a
CADe system for detection of microcalcification clusters in
reconstructed DBT volumes. The results indicate that our
new enhancement-modulated 3D calcification response
method is a promising approach although the current false-
positive rate is too high to be acceptable in clinical practice.
Future work includes further optimization of the machine
vision techniques and parameters using a large training set
and evaluation using an independent test set, the combina-
tion of 2D detection on PVs with 3D detection in the recon-
structed volume, study of the effects of reconstruction
technique and parameters on detection accuracy, and com-
parison of microcalcification detection in DBT and in corre-
sponding mammograms. Further improvement in detection
accuracy is needed before observer performance studies can
be conducted to evaluate whether the CADe system may be
useful as a second reader to assist radiologists in detection of
clustered microcalcifications in DBT.
ACKNOWLEDGMENT
This work is supported by USPHS Grant Nos. R01
CA151443 and R33 CA120234. The content of this paper
does not necessarily reflect the position of the funding agen-
cies and no official endorsement of any equipment and prod-
uct of any companies mentioned should be inferred. The
digital breast tomosynthesis system was developed by the
GE Global Research Group, with input and some revisions
from the University of Michigan investigators through the
Biomedical Research Partnership (USPHS Grant No.
CA91713, PI: Paul Carson, Ph.D.).
a)Author to whom correspondence should be addressed. Electronic mail:
[email protected])Current address: Center for Devices and Radiological Health, US Food
and Drug Administration, Silver Spring, MD 209931L. T. Niklason, B. T. Christian, L. E. Niklason, D. B. Kopans, D. E. Cas-
tleberry, B. H. Opsahl-Ong, C. E. Landberg, P. J. Slanetz, A. A. Giardino,
R. Moore, D. Albagli, M. C. DeJule, F. C. Fitzgerald, D. F. Fobare, B. W.
Giambattista, R. F. Kwasnick, J. Liu, S. J. Lubowski, G. E. Possin, J. F.
Richotte, C. Y. Wei, and R. F. Wirth, “Digital tomosynthesis in breast
imaging,” Radiology 205, 399–406 (1997).2S. Suryanarayanan, A. Karellas, S. Vedantham, S. J. Glick, C. J. D’Orsi,
S. P. Baker, and R. L. Webber, “Comparison of tomosynthesis methods
used with digital mammography,” Acad. Radiol. 7, 1085–1097 (2000).3T. Wu, R. H. Moore, E. A. Rafferty, and D. B. Kopans, “A comparison of
reconstruction algorithms for breast tomosynthesis,” Med. Phys. 31,
2636–2647 (2004).4Y. Zhang, H.-P. Chan, B. Sahiner, J. Wei, M. M. Goodsitt, L. M. Had-
jiiski, J. Ge, and C. Zhou, “A comparative study of limited-angle cone-
beam reconstruction methods for breast tomosynthesis,” Med. Phys. 33,
3781–3795 (2006).5Y. Chen, J. Y. Lo, and J. T. Dobbins, “Importance of point-by-point back
projection correction for isocentric motion in digital breast tomosynthesis:
Relevance to morphology of structures such as microcalcifications,” Med.
Phys. 34, 3885–3892 (2007).6E. Y. Sidky, X. C. Pan, I. S. Reiser, R. M. Nishikawa, R. H. Moore, and
D. B. Kopans, “Enhanced imaging of microcalcifications in digital breast
tomosynthesis through improved image-reconstruction algorithms,” Med.
Phys. 36, 4920–4932 (2009).7Y. Lu, H.-P. Chan, J. Wei, and L. M. Hadjiiski, “Selective-diffusion regu-
larization for enhancement of microcalcifications in digital breast tomo-
synthesis reconstruction,” Med. Phys. 37, 6003–6014 (2010).8S. P. Poplack, T. D. Tosteson, C. A. Kogel, and H. M. Nagy, “Digital
breast tomosynthesis: Initial experience in 98 women with abnormal digi-
tal screening mammography,” Am. J. Roentgenol. 189, 616–623 (2007).9A. P. Smith, E. A. Rafferty, and L. Niklason, “Clinical performance of
breast tomosynthesis as a function of radiologist experience level,” Lect.
Notes Comput. Sci. 5116, 61–66 (2008).10I. Andersson, D. M. Ikeda, S. Zackrisson, M. Ruschin, T. Svahn, P. Tim-
berg, and A. Tingberg, “Breast tomosynthesis and digital mammography:
A comparison of breast cancer visibility and BIRADS classification in a
population of cancers with subtle mammographic findings,” Eur. Radiol.
18, 2817–2825 (2008).11D. Gur, G. S. Abrams, D. M. Chough, M. A. Ganott, C. M. Hakim, R. L.
Perrin, G. Y. Rathfon, J. H. Sumkin, M. L. Zuley, and A. I. Bandos,
“Digital breast tomosynthesis: Observer performance study,” Am. J.
Roentgenol. 193, 586–591 (2009).12G. Gennaro, A. Toledano, C. di Maggio, E. Baldan, E. Bezzon, M. La
Grassa, L. Pescarini, I. Polico, A. Proietti, A. Toffoli, and P. C. Muzzio,
“Digital breast tomosynthesis versus digital mammography: A clinical
performance study,” Eur. Radiol. 20, 1545–1553 (2010).13V. M. Rao, D. C. Levin, L. Parker, B. Cavanaugh, A. J. Frangos, and J. H.
Sunshine, “How widely is computer-aided detection used in screening and
diagnostic mammography?,” J. Am. Coll. Radiol. 7, 802–805 (2010).14T. W. Freer and M. J. Ulissey, “Screening mammography with computer-
aided detection: Prospective study of 12,860 patients in a community
breast center,” Radiology 220, 781–786 (2001).15M. A. Helvie, L. M. Hadjiiski, E. Makariou, H.-P. Chan, N. Petrick,
B. Sahiner, S. C. B. Lo, M. Freedman, D. Adler, J. Bailey, C. Blane,
D. Hoff, K. Hunt, L. Joynt, K. Klein, C. Paramagul, S. Patterson, and
M. A. Roubidoux, “Sensitivity of noncommercial computer-aided detec-
tion system for mammographic breast cancer detection—A pilot clinical
trial,” Radiology 231, 208–214 (2004).16D. Gur, J. H. Sumkin, H. E. Rockette, M. A. Ganott, C. Hakim, L. A.
Hardesty, W. R. Poller, R. Shah, and L. Wallace, “Changes in breast can-
cer detection and mammography recall rates after the introduction of a
computer-aided detection system,” J. Natl. Cancer Inst. 96, 185–190
(2004).17R. L. Birdwell, P. Bandodkar, and D. M. Ikeda, “Computer-aided detec-
tion with screening mammography in a university hospital setting,” Radi-
ology 236, 451–457 (2005).18T. E. Cupples, J. E. Cunningham, and J. C. Reynolds, “Impact of
computer-aided detection in a regional screening mammography pro-
gram,” Am. J. Roentgenol. 185, 944–950 (2005).19J. C. Dean and C. C. Ilvento, “Improved cancer detection using computer-
aided detection with diagnostic and screening mammography: Prospective
study of 104 cancers,” Am. J. Roentgenol. 187, 20–28 (2006).20M. J. Morton, D. H. Whaley, K. R. Brandt, and K. K. Amrami, “Screening
mammograms: Interpretation with computer-aided detection—prospective
evaluation,” Radiology 239, 375–383 (2006).21J. J. Fenton, S. H. Taplin, P. A. Carney, L. Abraham, E. A. Sickles,
C. D’Orsi, E. A. Berns, G. Cutter, R. E. Hendrick, W. E. Barlow, and J. G.
38 Sahiner et al.: Computer-aided detection of microcalcification clusters in DBT 38
Medical Physics, Vol. 39, No. 1, January 2012

Elmore, “Influence of computer-aided detection on performance of screen-
ing mammography,” N. Engl. J. Med. 356, 1399–1409 (2007).22M. Gromet, “Comparison of computer-aided detection to double reading
of screening mammograms: Review of 231,221 mammograms,” Am. J.
Roentgenol. 190, 854–859 (2008).23B. Brancato, N. Houssami, D. Francesca, S. Bianchi, G. Risso, S. Catarzi,
R. Taschini, M. R. Del Turco, and S. Ciatto, “Does computer-aided detec-
tion (CAD) contribute to the performance of digital mammography in a
self-referred population?,” Breast Cancer Res. Treat. 111, 373–376
(2008).24M. L. Spangler, M. L. Zuley, J. H. Sumkin, G. Abrams, M. A. Ganott,
C. Hakim, R. Perrin, D. M. Chough, R. Shah, and D. Gur, “Detection and
classification of calcifications on digital breast tomosynthesis and 2D digi-
tal mammography: A comparison,” Am. J. Roentgenol. 196, 320–324
(2011).25I. Reiser, R. M. Nishikawa, M. L. Giger, T. Wu, E. Rafferty, R. H. Moore,
and D. B. Kopans, “Computerized detection of mass lesions in digital
breast tomosynthesis images using two- and three dimensional radial gra-
dient index segmentation,” Technol. Cancer Res. Treat. 3, 437–441
(2004).26H.-P. Chan, J. Wei, B. Sahiner, E. A. Rafferty, T. Wu, M. A. Roubidoux,
R. H. Moore, D. B. Kopans, L. M. Hadjiiski, and M. A. Helvie,
“Computer-aided detection system for breast masses on digital tomosyn-
thesis mammograms—Preliminary experience,” Radiology 237,
1075–1080 (2005).27I. Reiser, R. M. Nishikawa, M. L. Giger, T. Wu, E. A. Rafferty, R. H.
Moore, and D. B. Kopans, “Computerized mass detection for digital breast
tomosynthesis directly from the projection images,” Med. Phys. 33,
482–491 (2006).28H.-P. Chan, J. Wei, Y. H. Zhang, M. A. Helvie, R. H. Moore, B. Sahiner,
L. Hadjiiski, and D. B. Kopans, “Computer-aided detection of masses in
digital tomosynthesis mammography: Comparison of three approaches,”
Med. Phys. 35, 4087–4095 (2008).29S. Singh, G. D. Tourassi, J. A. Baker, E. Samei, and J. Y. Lo, “Automated
breast mass detection in 3D reconstructed tomosynthesis volumes: A fea-
tureless approach,” Med. Phys. 35, 3626–3636 (2008).30I. Reiser, R. M. Nishikawa, A. V. Edwards, D. B. Kopans, R. A. Schmidt,
J. Papaioannou, and R. H. Moore, “Automated detection of microcalcifica-
tion clusters for digital breast tomosynthesis using projection data only: A
preliminary study,” Med. Phys. 35, 1486–1493 (2008).
31S. Bernard, S. Muller, and J. Onativia, “Computer-aided microcalcification
detection on digital breast tomosynthesis data: A preliminary evaluation,”
Lect. Notes Comput. Sci. 5116, 151–157 (2008).32S. C. Park, B. Zheng, X. H. Wang, and D. Gur, “Applying a 2D based
CAD scheme for detecting micro-calcification clusters using digital
breast tomosynthesis images: An assessment,” Proc. SPIE 6915, 071–078
(2008).33H.-P. Chan, B. Sahiner, J. Wei, L. M. Hadjiiski, C. Zhou, and M. A. Hel-
vie, “Digital tomosynthesis mammography: Computerized detection of
microcalcifications in reconstructed breast volume using a 3D approach,”
Proc. SPIE 7624, 1D1–1D8 (2010).34Y. Sato, C. F. Westin, A. Bhalerao, S. Nakajima, N. Shiraga, S. Tamura,
and R. Kikinis, “Tissue classification based on 3D local intensity struc-
tures for volume rendering,” IEEE Trans. Vis. Comput. Graph. 6, 160–180
(2000).35Q. Li, S. Sone and K. Doi, “Selective enhancement filters for nodules, ves-
sels, and airway walls in two- and three-dimensional CT scans,” Med.
Phys. 30, 2040–2051 (2003).36J. Shi, B. Sahiner, H.-P. Chan, L. M. Hadjiiski, C. Zhou, P. N. Cascade,
E. A. Kazerooni, Y.-T. Wu, and J. Wei, “Pulmonary nodule registration in
serial CT scans based on rib anatomy and nodule template matching,”
Med. Phys. 34, 1336–1347 (2007).37A. Huang, H.-M. Liu, C.-W. Lee, C.-Y. Yang, and Y.-M. Tsang, “On con-
cise 3-D simple point characterizations: A marching cubes paradigm,”
IEEE Trans. Med. Imaging 28, 43–51 (2009).38H.-P. Chan, K. Doi, C. J. Vyborny, R. A. Schmidt, C. E. Metz, K. L. Lam,
T. Ogura, Y. Wu, and H. MacMahon, “Improvement in radiologists’
detection of clustered microcalcifications on mammograms. The potential
of computer-aided diagnosis,” Invest. Radiol. 25, 1102–1110 (1990).39H.-P. Chan, S. C. B. Lo, B. Sahiner, K. L. Lam, and M. A. Helvie,
“Computer-aided detection of mammographic microcalcifications: Pattern
recognition with an artificial neural network,” Med. Phys. 22, 1555–1567
(1995).40B. Sahiner, H.-P. Chan, L. M. Hadjiiski, M. A. Helvie, C. Paramagul,
J. Ge, J. Wei, and C. Zhou, “Joint two-view information for computerized
detection of microcalcifications on mammograms,” Med. Phys. 33,
2574–2585 (2006).41J. Ge, B. Sahiner, L. M. Hadjiiski, H.-P. Chan, J. Wei, M. A. Helvie, and
C. Zhou, “Computer aided detection of clusters of microcalcifications on
full field digital mammograms,” Med. Phys. 33, 2975–2988 (2006).
39 Sahiner et al.: Computer-aided detection of microcalcification clusters in DBT 39
Medical Physics, Vol. 39, No. 1, January 2012