Breast Mass Detection in Mammograms using Modified K-means Clustering
7
29 th NATIONAL RADIO SCIENCE CONFERENCE (NRSC 2012) April 10 - 12, 2012, Faculty of Engineering/Cairo University, Egypt C19. Breast Mass Detection in Mammograms using Modified K-means Clustering Osama R. Shahin 1 , Hamdy M. Kelash 2 , Gamal Mahrous 2 , and Osama S. Faragallah 2 1 Physic and Mathematic Department, Faculty of Engineering, Helwan University, Egypt 2 Department of Computer science and Engineering, Faculty of Electronic Engineering, Menoufia University, Menouf, 32952, Egypt ABSTRACT Breast cancer is one of the major causes of death among women. Small clusters of masses appearing as collection of white spots on mammograms show an early warning of breast cancer. Early detection performed on X-ray mammography is the key to improve breast cancer diagnosis. In order to increase radiologist’s diagnostic performance, several computer-aided diagnosis (CAD) schemes have been developed to improve the detection of primary identification of this disease. In this paper, an attempt is made to develop a modified k-means clustering algorithm for breast image segmentation for early detection of breast cancer. Our proposal aims to segment the breast for grouping those pixels with similar tissue appearance according to certain number of clusters. The number of clusters were determined a according to the number of bins in the image histogram. The method was tested over several images of image databases taken from Breast Imaging Reporting and Data System (BI-RADS) developed by the American College of Radiology, and from digital mammogram images that were provided from online mammogram database (MIAS database), that provides a standardized classification for mammographic studies. Keywords: K-mean, breast image, segmentation, detection. I. INTRODUCTION Breast cancer is the most frequently diagnosed cancer in women worldwide with an estimated 1.4 million new cases in 2008. About half of these cases occurred in economically developing countries [1]. Breast cancer has placed itself on top of the list of health problems for women in Egypt, representing 35.1% of all female cancer cases, according to the National Cancer Institute in Cairo [2]. No effective way to prevent the occurrence of breast cancer exists. Therefore, early detection is the first crucial step towards treating breast cancer. It plays a key role in breast cancer diagnosis and treatment. This process requires image segmentation and analysis of the images. Different segmentation algorithms are used for breast density segmentation such as k-Means algorithm [3], Fuzzy C-Means (FCM) algorithm [4], the Dogs and Rabbit (DaR) algorithm [5]. The main difficulty for those algorithms was the selection of the final segmentation clusters. The work presented in this paper was concerned specifically to segment the breast pixels with similar tissue appearance according to certain number of clusters. The number of clusters were determined a according to the number of bins in the image histogram. All the input images were in gray level, so that the histogram for these images can be used to classify the images into three main regions. These regions are the background, normal tissues, and lesions tissues. According to these regions we can define the number of the final segmentation clusters. In our experimental study, we will use the digital mammogram images that were provided from online mammogram database (MIAS database) [6]. The remainder of the paper is organized as follows: we discuss the main mammographic abnormalities in section II. The methodology was described in section III. Experimental results are presented in section IV. Finally, conclusions are drawn in section V. II. MAMMOGRAPHIC ABNORMALITIES There are about eight typical kinds of abnormalities revealed with a conventional mammogram. An experienced radiologist is highly tuned to the appearance of abnormalities in breast X-rays, and most of the time has a pretty good idea whether a suspicious abnormality is likely to be malignant or not. Typical mammographic findings from breast cancer screening mammograms would include asymmetrical breast tissue, asymmetric density, architectural distortion, mass, microcalcifications, interval changes compared with previous films, adenopathy, and other miscellaneous findings. Usually, a mammographic abnormality is followed by additional imaging studies, such as ultrasound, and if the lesion still appears suspicious it may be sent for biopsy [7]. A. Characteristics of Mass Lesion In terms of shape, if it is round, oval, or slightly lobular, the mass is probably benign. If the mass has a multi- lobular contour, or an irregular shape, then it is suggestive of malignancy. 'Margin' refers to the characteristics of the border of the mass image. When the margin is circumscribed and well-defined the mass is probably benign. If 309 978-1-4673-1887-7/12/$31.00 ©2012 IEEE
Transcript of Breast Mass Detection in Mammograms using Modified K-means Clustering
29th NATIONAL RADIO SCIENCE CONFERENCE
(NRSC 2012) April 10 - 12, 2012, Faculty of Engineering/Cairo University, Egypt
C19. Breast Mass Detection in Mammograms using Modified K-means Clustering
Osama R. Shahin 1, Hamdy M. Kelash
2, Gamal Mahrous
2, and Osama S. Faragallah
2
1 Physic and Mathematic Department, Faculty of Engineering, Helwan University, Egypt
2Department of Computer science and Engineering, Faculty of Electronic Engineering, Menoufia University,
Menouf, 32952, Egypt
ABSTRACT
Breast cancer is one of the major causes of death among women. Small clusters of masses appearing as
collection of white spots on mammograms show an early warning of breast cancer. Early detection performed on
X-ray mammography is the key to improve breast cancer diagnosis. In order to increase radiologist’s diagnostic
performance, several computer-aided diagnosis (CAD) schemes have been developed to improve the detection of
primary identification of this disease. In this paper, an attempt is made to develop a modified k-means clustering
algorithm for breast image segmentation for early detection of breast cancer. Our proposal aims to segment the
breast for grouping those pixels with similar tissue appearance according to certain number of clusters. The
number of clusters were determined a according to the number of bins in the image histogram. The method was
tested over several images of image databases taken from Breast Imaging Reporting and Data System (BI-RADS)
developed by the American College of Radiology, and from digital mammogram images that were provided from
online mammogram database (MIAS database), that provides a standardized classification for mammographic
studies.
Keywords: K-mean, breast image, segmentation, detection.
I. INTRODUCTION
Breast cancer is the most frequently diagnosed cancer in women worldwide with an estimated 1.4 million new
cases in 2008. About half of these cases occurred in economically developing countries [1]. Breast cancer has
placed itself on top of the list of health problems for women in Egypt, representing 35.1% of all female cancer
cases, according to the National Cancer Institute in Cairo [2]. No effective way to prevent the occurrence of breast
cancer exists. Therefore, early detection is the first crucial step towards treating breast cancer. It plays a key role
in breast cancer diagnosis and treatment. This process requires image segmentation and analysis of the images.
Different segmentation algorithms are used for breast density segmentation such as k-Means algorithm [3], Fuzzy
C-Means (FCM) algorithm [4], the Dogs and Rabbit (DaR) algorithm [5]. The main difficulty for those algorithms
was the selection of the final segmentation clusters. The work presented in this paper was concerned specifically
to segment the breast pixels with similar tissue appearance according to certain number of clusters. The number of
clusters were determined a according to the number of bins in the image histogram. All the input images were in
gray level, so that the histogram for these images can be used to classify the images into three main regions. These
regions are the background, normal tissues, and lesions tissues. According to these regions we can define the
number of the final segmentation clusters. In our experimental study, we will use the digital mammogram images
that were provided from online mammogram database (MIAS database) [6]. The remainder of the paper is
organized as follows: we discuss the main mammographic abnormalities in section II. The methodology was
described in section III. Experimental results are presented in section IV. Finally, conclusions are drawn in
section V.
II. MAMMOGRAPHIC ABNORMALITIES
There are about eight typical kinds of abnormalities revealed with a conventional mammogram. An
experienced radiologist is highly tuned to the appearance of abnormalities in breast X-rays, and most of the time
has a pretty good idea whether a suspicious abnormality is likely to be malignant or not. Typical mammographic
findings from breast cancer screening mammograms would include asymmetrical breast tissue, asymmetric
density, architectural distortion, mass, microcalcifications, interval changes compared with previous films,
adenopathy, and other miscellaneous findings. Usually, a mammographic abnormality is followed by additional
imaging studies, such as ultrasound, and if the lesion still appears suspicious it may be sent for biopsy [7].
A. Characteristics of Mass Lesion
In terms of shape, if it is round, oval, or slightly lobular, the mass is probably benign. If the mass has a multi-
lobular contour, or an irregular shape, then it is suggestive of malignancy. 'Margin' refers to the characteristics of
the border of the mass image. When the margin is circumscribed and well-defined the mass is probably benign. If
309978-1-4673-1887-7/12/$31.00 ©2012 IEEE
29th NATIONAL RADIO SCIENCE CONFERENCE
(NRSC 2012) April 10 - 12, 2012, Faculty of Engineering/Cairo University, Egypt
the margin is obscured more than 75% by adjacent tissue, it is moderately suspicious of malignancy. Likewise,
there is moderate suspicion if the margin having many small lobes. If the margin is indistinct or speculated
(consisting of many small 'needle-like' sections) then there is also high suspicion of malignancy. 'Density' is
usually classified as either fatty, low, or high. The mass is probably benign for fatty and low densities, moderately
suspicious of malignancy for high densities [8].
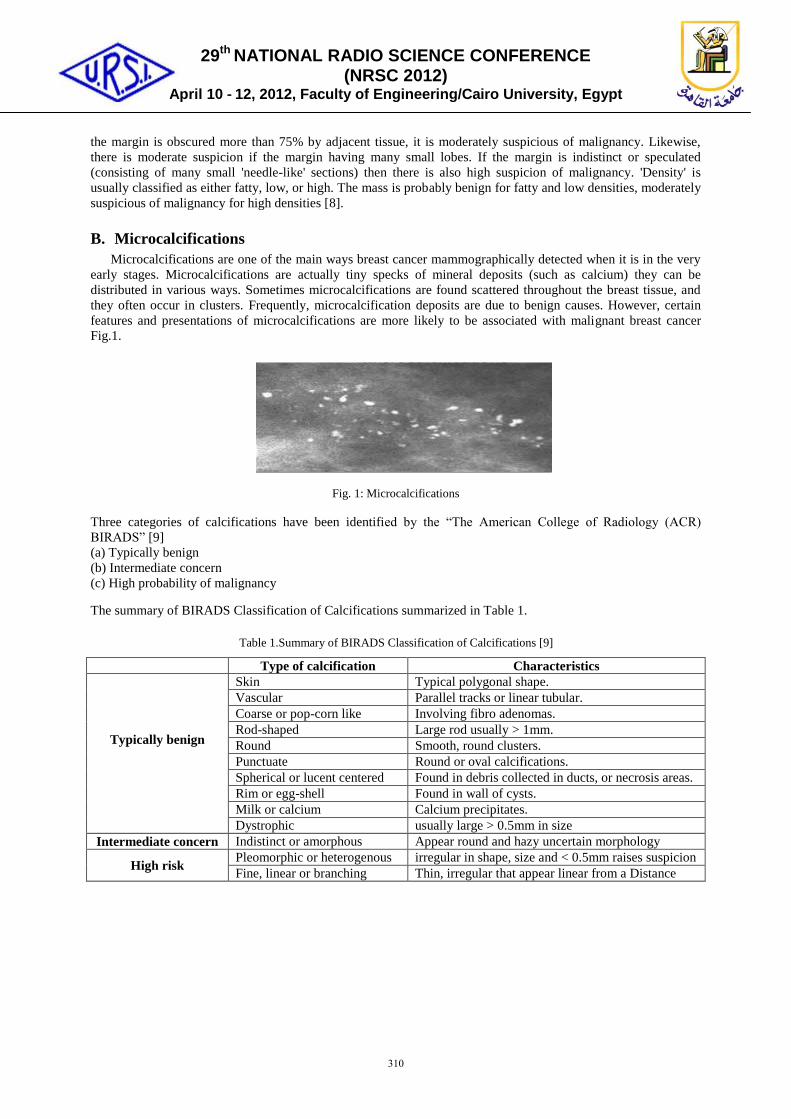
B. Microcalcifications
Microcalcifications are one of the main ways breast cancer mammographically detected when it is in the very
early stages. Microcalcifications are actually tiny specks of mineral deposits (such as calcium) they can be
distributed in various ways. Sometimes microcalcifications are found scattered throughout the breast tissue, and
they often occur in clusters. Frequently, microcalcification deposits are due to benign causes. However, certain
features and presentations of microcalcifications are more likely to be associated with malignant breast cancer
Fig.1.
Fig. 1: Microcalcifications
Three categories of calcifications have been identified by the “The American College of Radiology (ACR)
BIRADS” [9]
(a) Typically benign
(b) Intermediate concern
(c) High probability of malignancy
The summary of BIRADS Classification of Calcifications summarized in Table 1.
Table 1.Summary of BIRADS Classification of Calcifications [9]
Type of calcification Characteristics
Typically benign
Skin Typical polygonal shape.
Vascular Parallel tracks or linear tubular.
Coarse or pop-corn like Involving fibro adenomas.
Rod-shaped Large rod usually > 1mm.
Round Smooth, round clusters.
Punctuate Round or oval calcifications.
Spherical or lucent centered Found in debris collected in ducts, or necrosis areas.
Rim or egg-shell Found in wall of cysts.
Milk or calcium Calcium precipitates.
Dystrophic usually large > 0.5mm in size
Intermediate concern Indistinct or amorphous Appear round and hazy uncertain morphology
High risk Pleomorphic or heterogenous irregular in shape, size and < 0.5mm raises suspicion
Fine, linear or branching Thin, irregular that appear linear from a Distance
310
29th NATIONAL RADIO SCIENCE CONFERENCE
(NRSC 2012) April 10 - 12, 2012, Faculty of Engineering/Cairo University, Egypt
III. PROPOSED METHOD
A breast cancer CAD scheme separates suspicious regions that may contain masses from the background
parenchyma – the tissue characteristic of an organ, as distinguished from associated connective or supporting
tissues [10]. In other words, such schemes partition the mammogram into several nonintersecting regions and
extract regions of interest (ROIs) and suspicious mass candidates from the ultrasound image. While a suspicious
area is darker than its surroundings, it has a similar density, a regular shape of variable size. Thus, image
segmentation is essential to maintaining the sensitivity and accuracy of the entire mass detection and classification
system.
We have proposed an adaptive K-means segmentation method for detection of mass lesion in digital
mammograms. In the present work, we have made an attempt to improve the performance of existing K-means
approach by varying various values of certain parameters discussed in the algorithm [11, 12]. The K-means
algorithm is an iterative technique that is used to partition an image into K clusters. In statistics and machine
learning, k-means clustering is a method of cluster analysis which aims to partition n observations into k clusters
in which each observation belongs to the cluster with the nearest mean. The basic algorithm is:
Pick K cluster centers, either randomly or based on some heuristic.
Assign each pixel in the image to the cluster that minimizes the distance between the pixel and the cluster
center.
Re-compute the cluster centers by averaging all of the pixels in the cluster.
Repeat last two steps until convergence is achieved i.e. no pixel change its cluster.
For a given a set of observations 1 2 3
( , , , ..., )n
x x x x where each observation is a D-dimensional real vector. K-
means clustering aims to partition the “n” observations into k sets “S”, where 1 2 3
{ , , , ..., }k
S S S S S . Thus, the
algorithm aims to measure the sum of squared Euclidean distance from each sample to the nearest cluster.
2
1 1
( , )
k m
ij i j
i s
S U u x
(1)
Where 1
( ... )m
is a vector containing cluster centers which equal to the mean of points ini
S . U is a matrix
containing value 1 if a sample i
x belongs to cluster j and 0 otherwise.
A. Standard Algorithm
Given an initial set of k- means in which may be specified randomly or by some heuristic.
I. Assignment Step
Assign each observation to the cluster with closest mean, i.e. partition the observation according to the voroni
diagram generated by the means in equation (2)
*
*{ : 1, 2 , 3, ... }
t t
i j j i j iS x x m x m i k (2)
II. Update Step
Calculate the new means to be the centroid of the observations in the cluster in equation (3)
1
( )
1
j i
t
i jt
x S ti
m xs
(3)
B. Modified Algorithm “1st Modification”
The modifications in this algorithm can be achieved as follow: the histogram is summary graph showing a
count of data points falling in various ranges. The effect is rough approximation of the frequency distribution of
data. The group of data is called classes, and in context of histogram they are known as bins, because one can
311
29th NATIONAL RADIO SCIENCE CONFERENCE
(NRSC 2012) April 10 - 12, 2012, Faculty of Engineering/Cairo University, Egypt
think of them as containers that accumulate data and fill up at a rate equal to the frequency of that data class. The
shape of the histogram sometimes is particularly sensitive to the number of bins. In the widened bins, important
information might get omitted. By reducing the number of bins and then increasing the number of classes in the
K-means algorithm, the detection accuracy is found to be increasing. Quantization in terms of color histograms
refers to the process of reducing the number of bins by taking colors that are very similar to each other and putting
them in the same bin. By default the maximum number of bins one can obtain using the histogram function is 256.
The modification process can be summarized in the following points:
For every pixel, based on the neighbor hood value the histogram equalization is done, by copy the image
matrix in a new matrix and pad it with zero in all sides.
Tracing this new matrix by window size, starting from the position (1, 1).
Find the probability density function of each value inside the new matrix
Find the accumulative distribution function for each pixel and replace its value by the value in the middle
element in the window and repeat this process to whole element in the matrix. See Fig.1(c) for the
resultant histogram.
Now select the histogram bins in the traced image as number of bins and cluster in the k-means algorithm
discussed in [10, 13].
This process keep our modified algorithm convergence to find the optimal segmentation due t predefined
the number of clusters in the beginning of the algorithm.
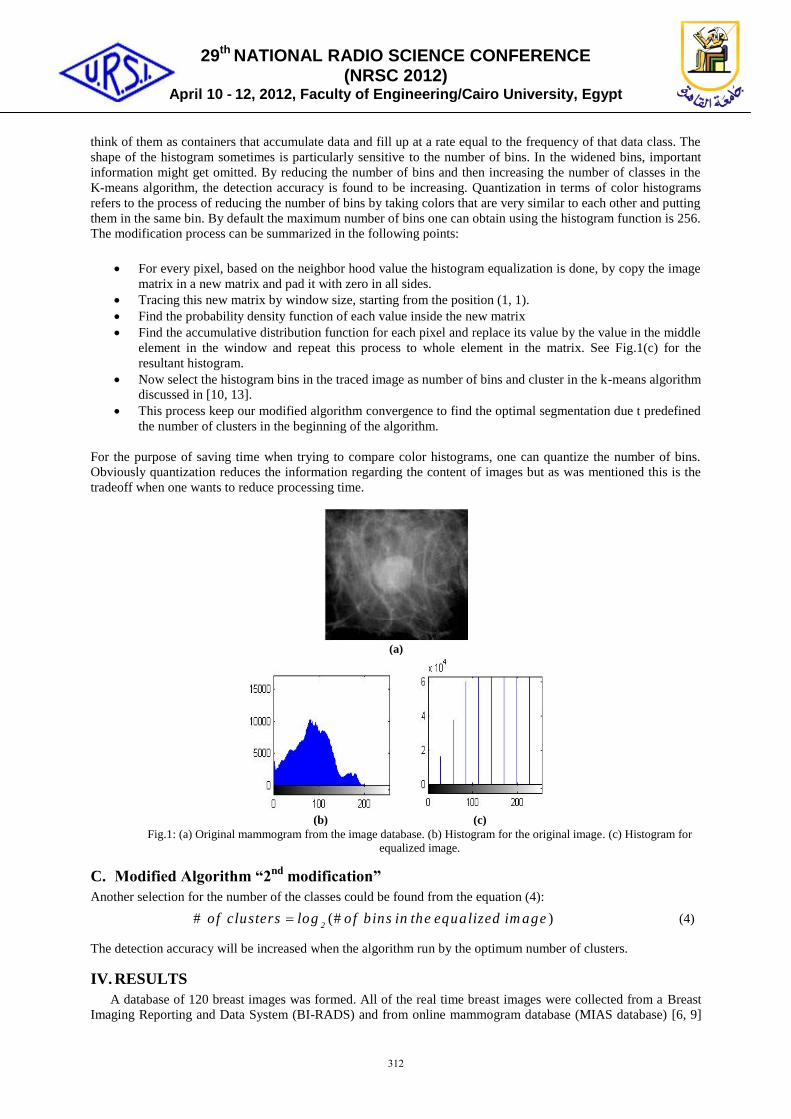
For the purpose of saving time when trying to compare color histograms, one can quantize the number of bins.
Obviously quantization reduces the information regarding the content of images but as was mentioned this is the
tradeoff when one wants to reduce processing time.
(a)
(b) (c)
Fig.1: (a) Original mammogram from the image database. (b) Histogram for the original image. (c) Histogram for
equalized image.
C. Modified Algorithm “2nd
modification”
Another selection for the number of the classes could be found from the equation (4):
# (# )2
of clusters log of bins in the equalized im age (4)
The detection accuracy will be increased when the algorithm run by the optimum number of clusters.
IV. RESULTS
A database of 120 breast images was formed. All of the real time breast images were collected from a Breast
Imaging Reporting and Data System (BI-RADS) and from online mammogram database (MIAS database) [6, 9]
312
29th NATIONAL RADIO SCIENCE CONFERENCE
(NRSC 2012) April 10 - 12, 2012, Faculty of Engineering/Cairo University, Egypt
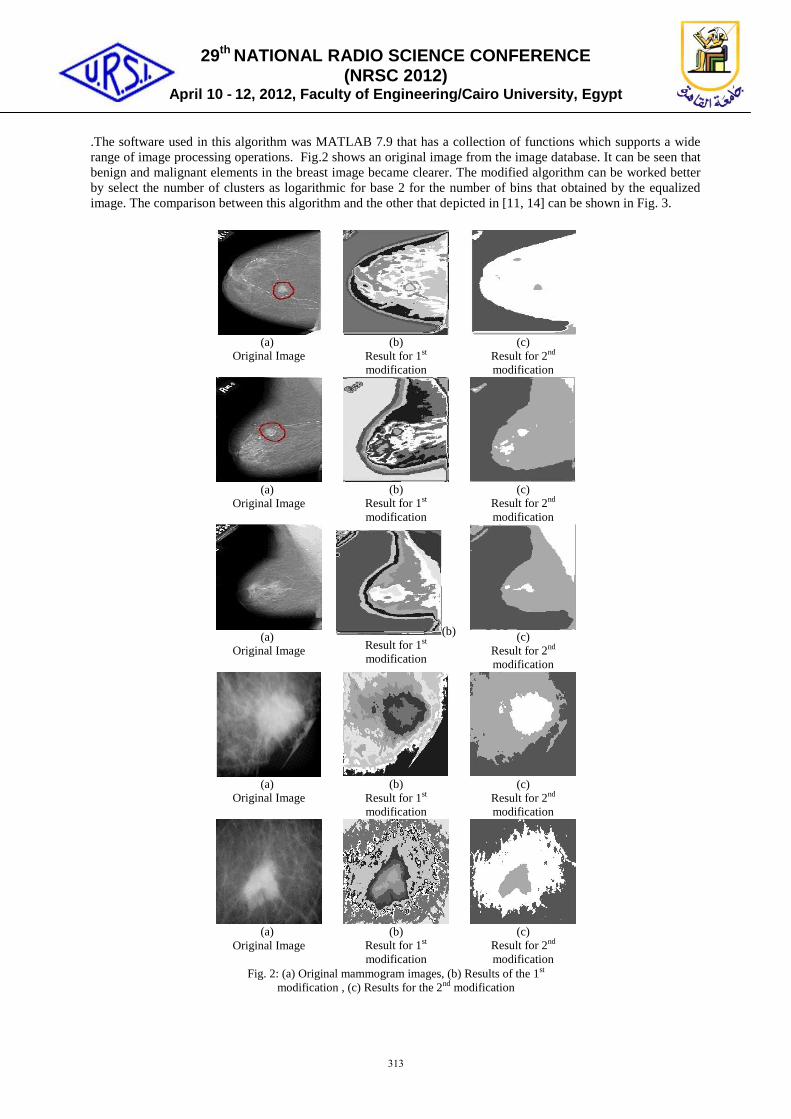
.The software used in this algorithm was MATLAB 7.9 that has a collection of functions which supports a wide
range of image processing operations. Fig.2 shows an original image from the image database. It can be seen that
benign and malignant elements in the breast image became clearer. The modified algorithm can be worked better
by select the number of clusters as logarithmic for base 2 for the number of bins that obtained by the equalized
image. The comparison between this algorithm and the other that depicted in [11, 14] can be shown in Fig. 3.
(a)
Original Image
(b)
Result for 1st
modification
(c)
Result for 2nd
modification
(a)
Original Image
(b)
Result for 1st
modification
(c)
Result for 2nd
modification
(a)
Original Image
(b)
Result for 1st
modification
(c)
Result for 2nd
modification
(a)
Original Image
(b)
Result for 1st
modification
(c)
Result for 2nd
modification
(a)
Original Image
(b)
Result for 1st
modification
(c)
Result for 2nd
modification
Fig. 2: (a) Original mammogram images, (b) Results of the 1st
modification , (c) Results for the 2nd modification
313
29th NATIONAL RADIO SCIENCE CONFERENCE
(NRSC 2012) April 10 - 12, 2012, Faculty of Engineering/Cairo University, Egypt
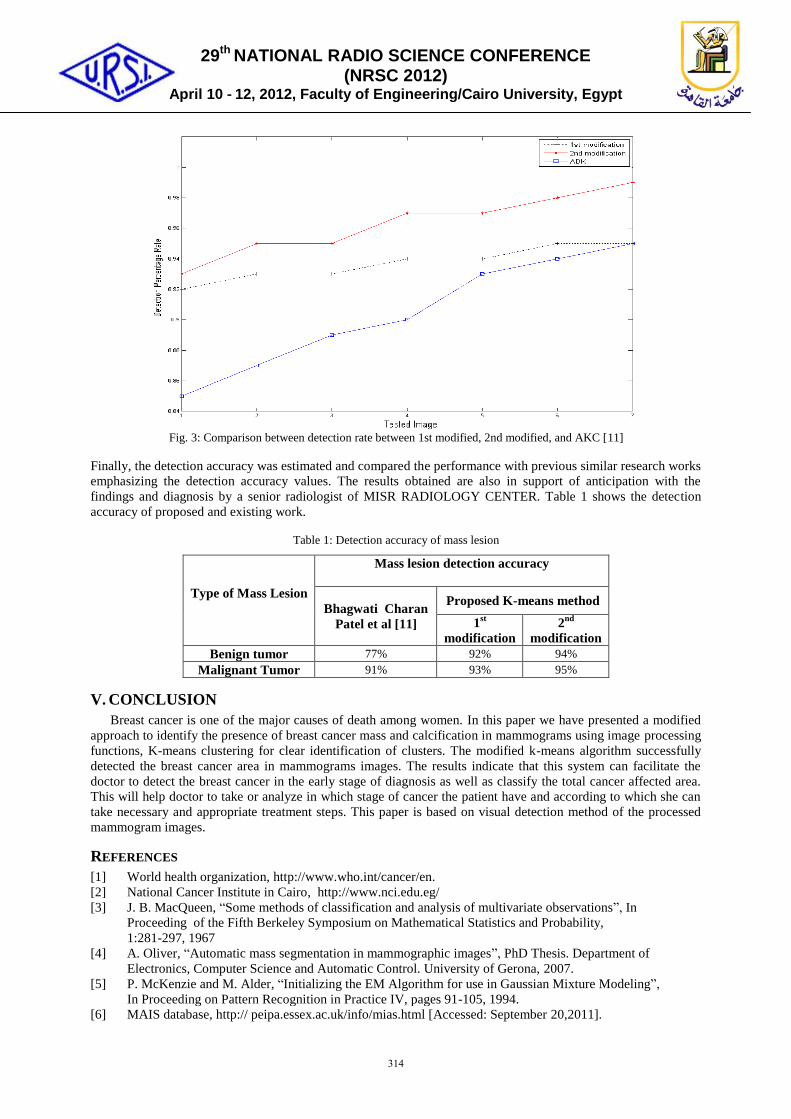
Fig. 3: Comparison between detection rate between 1st modified, 2nd modified, and AKC [11]
Finally, the detection accuracy was estimated and compared the performance with previous similar research works
emphasizing the detection accuracy values. The results obtained are also in support of anticipation with the
findings and diagnosis by a senior radiologist of MISR RADIOLOGY CENTER. Table 1 shows the detection
accuracy of proposed and existing work.
Table 1: Detection accuracy of mass lesion
Type of Mass Lesion
Mass lesion detection accuracy
Bhagwati Charan
Patel et al [11]
Proposed K-means method
1st
modification
2nd
modification
Benign tumor 77% 92% 94%
Malignant Tumor 91% 93% 95%
V. CONCLUSION
Breast cancer is one of the major causes of death among women. In this paper we have presented a modified
approach to identify the presence of breast cancer mass and calcification in mammograms using image processing
functions, K-means clustering for clear identification of clusters. The modified k-means algorithm successfully
detected the breast cancer area in mammograms images. The results indicate that this system can facilitate the
doctor to detect the breast cancer in the early stage of diagnosis as well as classify the total cancer affected area.
This will help doctor to take or analyze in which stage of cancer the patient have and according to which she can
take necessary and appropriate treatment steps. This paper is based on visual detection method of the processed
mammogram images.
REFERENCES
[1] World health organization, http://www.who.int/cancer/en.
[2] National Cancer Institute in Cairo, http://www.nci.edu.eg/
[3] J. B. MacQueen, “Some methods of classification and analysis of multivariate observations”, In
Proceeding of the Fifth Berkeley Symposium on Mathematical Statistics and Probability,
1:281-297, 1967
[4] A. Oliver, “Automatic mass segmentation in mammographic images”, PhD Thesis. Department of
Electronics, Computer Science and Automatic Control. University of Gerona, 2007.
[5] P. McKenzie and M. Alder, “Initializing the EM Algorithm for use in Gaussian Mixture Modeling”,
In Proceeding on Pattern Recognition in Practice IV, pages 91-105, 1994.
[6] MAIS database, http:// peipa.essex.ac.uk/info/mias.html [Accessed: September 20,2011].
314
29th NATIONAL RADIO SCIENCE CONFERENCE
(NRSC 2012) April 10 - 12, 2012, Faculty of Engineering/Cairo University, Egypt
[7] Bijay Ketan Panigrahi Assistant, Manas Ranjan “Feature Extraction for Classification of Micro-
calcifications and Mass Lesions in Mammograms”, IJCSNS International Journal of Computer
Science and Network Security, VOL.9 No.5, May 2009 255 Manuscript
[8] Sampat MP, Whitman GJ, Stephens TW, Broemeling LD, Heger NA, Bovik AC, Markey MK., “
The reliability of measuring physical characteristics of spiculated masses on mammography”, Br J
Radiol. Dec 2006; 79 Spec No 2:S134-40.
[9] American College of Radiology. The ACR breast imaging reporting and data system (BI-RADS) ,
http://www.acr.org/departments/stand_accred/birads/contents.html. [Accessed: September 20, 2011]
[10] Yanhui Guo “Computer-Aided Detection of Breast Cancer Using Ultrasound Images” , PhD in
computer Science , UTAH STATE UNVIVERSITY Logan, UT 2010.
[11] Bhagwati Charan Patel, G.R.Sinha , “An Adaptive K-means Clustering Algorithm for Breast Image
Segmentation”, International Journal of Computer Applications (0975 – 8887) Volume 10– N.4,
November 2010.
[12] Chris Solomon,SchToby Breckon " Fundamentals of Digital Image Processing A Practical Approach
with Examples in Matlab” , John Wiley & Sons, Ltd 2011.
[13] Ron Wehrens and Lutgarde M.C. Buydens , “Model-Based Clustering for Image Segmentation and
Large Datasets Via Sampling ”, Technical report no. 424, University of Washington, Feb.2003.
[14] Mencattini, A., Salmeri, M., Casti, P., Raguso, G. “ Automatic breast masses boundary extraction
in digital mammography using spatial fuzzy c-means clustering and active contour models”, IEEE
International Workshop on Medical Measurements and Applications (MeMeA) , Bari, Italy, pp.632-
637 , May 30-31, 2011.
315