Computer-Aided Detection of Architectural Distortion in Prior Mammograms of Interval Cancer
21
Computer-Aided Detection of Architectural Distortion in Prior Mammograms of Interval Cancer Rangaraj M. Rangayyan, 1,2 Shantanu Banik, 1 and J. E. Leo Desautels 1 Architectural distortion is an important sign of breast cancer, but because of its subtlety, it is a common cause of false-negative findings on screening mammograms. This paper presents methods for the detection of architectural distortion in mammograms of interval cancer cases taken prior to the detection of breast cancer using Gabor filters, phase portrait analysis, fractal analysis, and texture analysis. The methods were used to detect initial candidates for sites of architectural distortion in prior mammograms of interval cancer and also normal control cases. A total of 4,224 regions of interest (ROIs) were automatically obtained from 106 prior mammograms of 56 interval cancer cases, includ- ing 301 ROIs related to architectural distortion, and from 52 prior mammograms of 13 normal cases. For each ROI, the fractal dimension and Haralick’s texture fea- tures were computed. Feature selection was performed separately using stepwise logistic regression and step- wise regression. The best results achieved, in terms of the area under the receiver operating characteristics curve, with the features selected by stepwise logistic regression are 0.76 with the Bayesian classifier, 0.73 with Fisher linear discriminant analysis, 0.77 with an artificial neural network based on radial basis functions, and 0.77 with a support vector machine. Analysis of the performance of the methods with free-response receiver operating characteristics indicated a sensitivity of 0.80 at 7.6 false positives per image. The methods have good potential in detecting architectural distortion in mammo- grams of interval cancer cases. KEY WORDS: Breast diseases, computer-assisted detection, computer-aided diagnosis (CAD), digital image processing, image analysis, mammography CAD, pattern recognition, ROC-based analysis INTRODUCTION M ammography is the most effective screen- ing tool available for early detection of breast cancer. Early detection of breast cancer is crucial: mammographic screening has been shown to be effective in reducing mortality rates by 30% to 70%. 1 However, interpretation of screening mammograms is difficult, and the sensitivity of screening mammography is affected by image quality, the radiologist’s level of expertise, and the volume of the images to be assessed. Although double reading of screening mammograms has been shown to provide higher sensitivity than single reading, 2 the resources and expertise required for this purpose render such an approach impractical. Computer-aided diagnosis (CAD) could help in increasing the detection sensitivity and accuracy by providing a “second opinion” to the radiologist and could be almost as effective as double reading. 3,4 Architectural distortion, defined as distortion of the architecture of breast parenchyma without being accompanied by increased density or mass, 5 is the third most common mammographic sign of nonpalpable breast cancer 6 and is an important finding in interpreting the manifestation of breast cancer on mammograms. 7 However, due to its subtlety and variability in presentation, this sign of abnormality is often missed during screening. 6 The detection of architectural distortion is performed by a radiologist through the identification of subtle 1 From the Department of Electrical and Computer Engi- neering, Schulich School of Engineering, Calgary, AB, Canada T2N 1N4. 2 From the Department of Radiology, University of Calgary, Calgary, AB, Canada T2N 1N4. Correspondence to: Rangaraj M. Rangayyan, Department of Electrical and Computer Engineering, Schulich School of Engineering, Calgary, AB, Canada T2N 1N4; tel: +1-403- 220-6745; fax: +1-403-282-6855; e-mail: [email protected] Copyright * 2009 by Society for Imaging Informatics in Medicine Online publication 2 February 2010 doi: 10.1007/s10278-009-9257-x Journal of Digital Imaging, Vol 23, No 5 (October), 2010: pp 611Y631 611
Transcript of Computer-Aided Detection of Architectural Distortion in Prior Mammograms of Interval Cancer

Computer-Aided Detection of Architectural Distortion in PriorMammograms of Interval Cancer
Rangaraj M. Rangayyan,1,2 Shantanu Banik,1 and J. E. Leo Desautels1
Architectural distortion is an important sign of breastcancer, but because of its subtlety, it is a common causeof false-negative findings on screening mammograms.This paper presents methods for the detection ofarchitectural distortion in mammograms of intervalcancer cases taken prior to the detection of breastcancer using Gabor filters, phase portrait analysis,fractal analysis, and texture analysis. The methods wereused to detect initial candidates for sites of architecturaldistortion in prior mammograms of interval cancer andalso normal control cases. A total of 4,224 regions ofinterest (ROIs) were automatically obtained from 106prior mammograms of 56 interval cancer cases, includ-ing 301 ROIs related to architectural distortion, and from52 prior mammograms of 13 normal cases. For eachROI, the fractal dimension and Haralick’s texture fea-tures were computed. Feature selection was performedseparately using stepwise logistic regression and step-wise regression. The best results achieved, in terms ofthe area under the receiver operating characteristicscurve, with the features selected by stepwise logisticregression are 0.76 with the Bayesian classifier, 0.73with Fisher linear discriminant analysis, 0.77 with anartificial neural network based on radial basis functions,and 0.77 with a support vector machine. Analysis of theperformance of the methods with free-response receiveroperating characteristics indicated a sensitivity of 0.80at 7.6 false positives per image. The methods have goodpotential in detecting architectural distortion in mammo-grams of interval cancer cases.
KEY WORDS: Breast diseases, computer-assisteddetection, computer-aided diagnosis (CAD), digitalimage processing, image analysis, mammography CAD,pattern recognition, ROC-based analysis
INTRODUCTION
M ammography is the most effective screen-ing tool available for early detection of
breast cancer. Early detection of breast cancer iscrucial: mammographic screening has been shownto be effective in reducing mortality rates by 30%
to 70%.1 However, interpretation of screeningmammograms is difficult, and the sensitivity ofscreening mammography is affected by imagequality, the radiologist’s level of expertise, andthe volume of the images to be assessed. Althoughdouble reading of screening mammograms hasbeen shown to provide higher sensitivity thansingle reading,2 the resources and expertiserequired for this purpose render such an approachimpractical. Computer-aided diagnosis (CAD)could help in increasing the detection sensitivityand accuracy by providing a “second opinion” tothe radiologist and could be almost as effective asdouble reading.3,4
Architectural distortion, defined as distortion ofthe architecture of breast parenchyma withoutbeing accompanied by increased density or mass,5
is the third most common mammographic sign ofnonpalpable breast cancer6 and is an importantfinding in interpreting the manifestation of breastcancer on mammograms.7 However, due to itssubtlety and variability in presentation, this sign ofabnormality is often missed during screening.6 Thedetection of architectural distortion is performedby a radiologist through the identification of subtle
1From the Department of Electrical and Computer Engi-neering, Schulich School of Engineering, Calgary, AB, CanadaT2N 1N4.
2From the Department of Radiology, University of Calgary,Calgary, AB, Canada T2N 1N4.
Correspondence to: Rangaraj M. Rangayyan, Department ofElectrical and Computer Engineering, Schulich School ofEngineering, Calgary, AB, Canada T2N 1N4; tel: +1-403-220-6745; fax: +1-403-282-6855; e-mail: [email protected]
Copyright * 2009 by Society for Imaging Informatics inMedicine
Online publication 2 February 2010doi: 10.1007/s10278-009-9257-x
Journal of Digital Imaging, Vol 23, No 5 (October), 2010: pp 611Y631 611

signs of abnormality such as the presence ofspiculations and distortion of the normal oriented-textured pattern of the breast. CAD techniques andsystems have been shown to be effective indetecting masses and microcalcifications withsatisfactory performance, but have been found tofail in detecting architectural distortion with a highlevel of accuracy.8 Increasing the sensitivity andaccuracy in the detection of architectural distortioncould lead to an effective improvement in theprognosis of breast cancer patients9 and help inreducing the associated mortality rate.Although a substantial record of research exists
in the literature regarding CAD and classificationof masses and calcifications, not many works havebeen reported so far on the detection of architec-tural distortion.7,10–18 Furthermore, only a fewstudies have been reported on the detection ofsubtle abnormalities in mammograms acquiredbefore the detection of cancer16,19–22 to explorethe possibilities of detection of early signs ofbreast cancer. In the context of a screeningprogram, a mammogram on which cancer isdetected is referred to as a “detection mammo-gram,” whereas a mammogram acquired at the lastscheduled visit to the screening program prior tothe detection of cancer is referred to as a “priormammogram.”16 A case of cancer detected in ascreening program is referred to as “screen-detected cancer.” The term “interval cancer” isused to indicate a case where breast cancer isdetected outside the screening program in theinterval between scheduled screening sessions.Studies on prior mammograms of interval cancercases with the specific aim of detection ofarchitectural distortion21,22 could help in develop-ing strategies for the detection and treatment ofbreast diseases at their early stages and lead tosubstantial improvement in the prognosis.We hypothesize that screening mammograms
obtained prior to the detection of breast cancercould contain subtle signs of early stages of breastcancer, in particular architectural distortion. In thispaper, we present methods for the detection ofsites of architectural distortion in prior mammo-grams of interval cancer cases in a screeningprogram using several image processing andpattern classification methods,21,22 including theartificial neural network (ANN) and the supportvector machine (SVM). The image processingmethods are based upon Gabor filters,23 phase
portrait analysis,10–12,24 fractal analysis,16,25,26 andHaralick’s texture features.27,28
DETECTION OF ARCHITECTURAL DISTORTIONIN MAMMOGRAMS
Architectural Distortion
Architectural distortion is a common cause offalse-negative findings on screening mammogramsand is defined in BI-RADS29 as follows: “Thenormal architecture (of the breast) is distorted withno definite mass visible. This includes spiculationsradiating from a point and focal retraction ordistortion at the edge of the parenchyma. Architec-tural distortion can also be an associated finding.”Focal retraction is considered to be easier torecognize than spiculated distortion within thebreast parenchyma.5 Architectural distortion couldbe malignant or benign; the malignant categoryincludes cancer, and the benign category includesscar and soft tissue damage due to trauma.Architectural distortion has been found to beassociated with breast malignancy in one half totwo thirds of the cases in which it is present.7
Architectural distortion could appear at the initialstages of the formation of a breast mass or tumor.7
Because architectural distortion may mimic theappearance of normal breast tissue overlapped inthe projected mammographic image, its detectioncould be difficult. Specifically, architectural dis-tortion accounts for 12% to 45% of breast cancercases overlooked or misinterpreted in screeningmammography.30,31 In a study of cases of screen-ing interval breast cancer, it has been found thatarchitectural distortion is the most commonlymissed abnormality in false-negative cases.32
In a mammogram, the breast is seen as adirectionally oriented-textured image33 due to thepresence of several piecewise linear structuressuch as ligaments, ducts, and blood vessels. Thenormal oriented-texture pattern, which typicallyconverges toward the nipple, is changed in thepresence of architectural distortion. Mudigondaand Rangayyan34 explored the use of texture flowfield to detect architectural distortion based on thelocal coherence of texture orientation. Ayres andRangayyan11,12,24,35 and Rangayyan and Ayres10
proposed methods based on the application ofGabor filters and phase portrait modeling to
612 RANGAYYAN ET AL.

characterize subtle changes due to architecturaldistortion from a pattern recognition perspective.The methods were applied to two datasets, one setwith 19 cases of architectural distortion and 41normal mammograms from the MammographicImage Analysis Society (MIAS) database36 andanother set with 37 cases of architectural distor-tion. Sensitivity rates of 84% at 4.5 false positivesper image and 81% at 10 false positives per imagewere obtained from an analysis of the free-response receiver operating characteristics (FROC)for the two sets of images.12
Matsubara et al.7,37 used morphological imageprocessing techniques along with a concentrationindex to detect architectural distortion around theskin line and within the mammary gland; thesensitivity obtained was 94% with 2.3 false positivesper image and 84% with 2.4 false positives perimage, respectively. Ichikawa et al.38 presented anautomatic method for the detection of areas related tospiculated architectural distortion; suspicious areaswere detected by means of a concentration index oflinear structures obtained using the mean curvatureof the given image. Discriminant analysis wasperformed with the nine features obtained forclassification, and a sensitivity of 68% with 3.4 falsepositives per image was obtained. Hara et al.39 useddynamic range compression as a preprocessing stepbefore extracting the mammary gland by a combi-nation of mean curvature and shape index; asensitivity of 70% was achieved at 2 false positivesper image. Matsubara et al.40 proposed a modifica-tion of their previous method for the detection ofarchitectural distortion using the mean curvature ofimages with a combination of two levels of reso-lution after dynamic range compression andimproved the accuracy of extraction for thin mam-mary glands; at the final stage, they obtained asensitivity of 75% at 2.9 false positives per image.Guo et al.41 studied the characterization of
architectural distortion using the Hausdorff fractaldimension (FD) and an SVM to perform classi-fication of regions of interest (ROIs) exhibitingarchitectural distortion and those with normalmammographic patterns. A set of 40 ROIs wasselected from the MIAS database,36 including 19ROIs with architectural distortion and 21 ROIswith normal tissue patterns. The best classificationaccuracy obtained was 72.5%. Guo et al.17 alsoused five different methods to estimate the FD andan SVM to differentiate masses and architectural
distortion from normal parenchyma; using FD andlacunarity, the best result obtained for architecturaldistortion in terms of area under the receiveroperating characteristics (ROC) curve (area underthe curve, AUC) was 0.875±0.055.Sampat and Bovik42 and Sampat et al.15,43 applied
a linear filter to the Radon transform of the givenimage for the enhancement of spicules; the enhancedimage was filtered with radial spiculation filters todetect spiculated masses and architectural distortionmarked by converging lines or spiculation. Using aset of 45 images with spiculated masses and anotherset of 45 images with architectural distortion, thesensitivity achievedwas 91% at 12 false positives perimage and 80% at 14 false positives per image,respectively. Özekes et al.44 used several distancethresholds to detect architectural distortion andreported an accuracy of 89.02%.Tourassi et al.14 investigated the use of FD to
distinguish between normal tissue patterns andarchitectural distortion in mammographic ROIs.The FD was estimated using the circular averagepower spectrum technique.25,26 The method wasapplied to a dataset of 1,500 ROIs, including 112ROIs with architectural distortion and 1,388 ROIsexhibiting normal tissue patterns. The best perform-ance achieved was 0.89, in terms of AUC. Tourassiet al. observed that the presence of architecturaldistortion disrupts the self-similarity properties ofbreast parenchyma and that the average FD of theROIs with architectural distortion was significantlylower than that of normal ROIs.Eltonsy et al.45 developed a method to detect
masses and architectural distortion by locating pointssurrounded by concentric layers of image activity. Aset of 80 images was used to evaluate the technique,including 13 masses, 38 masses with architecturaldistortion, and 29 images with only architecturaldistortion. An overall sensitivity of 91.3% with 9.1false positives per image was obtained. A sensitivityof 93.1% was obtained in the detection of architec-tural distortion at the same rate of false positives.Nakayama et al.46 performed a multiresolution
analysis by decomposing the original digitizedimage into several sub-images at three scales by anovel filter bank based on wavelets and theHessian matrix. With six objective featuresobtained from automatically detected ROIs at threescales, the sensitivity and the number of falsepositives were 71.3% (57 out of 80 images) and3.01 per image, respectively.
CAD OF ARCHITECTURAL DISTORTION IN PRIOR MAMMOGRAMS 613

Nemoto et al.47 proposed a method to detectarchitectural distortion. Validation was performedusing 25 computed radiography digital mammo-grams, each of which had a single area witharchitectural distortion including radiating spicula-tion. The methods are based on the observationthat the lines corresponding to spiculation relatedto architectural distortion differ in characteristicsfrom lines in the normal mammary gland. Thelikelihood of spiculation was computed and amodified point convergence index weighted bythe likelihood was calculated to enhance architec-tural distortion. After the classification step, asensitivity of 80.0% was obtained at 0.80 falsepositive per image.
Detection of Architectural Distortion by CADSystems
A few studies have been reported on analysis ofthe performance of commercial CAD systems inthe detection of architectural distortion. Burhenneet al.48 studied the performance of a commercialCAD system for mammography and obtained asensitivity of 75% in the detection of masses andarchitectural distortion at 1 false positive perimage. Evans et al.49 investigated the ability of acommercial CAD system to mark invasive lobularcarcinoma of the breast and obtained a sensitivityof 91% with screening mammograms demonstrat-ing biopsy-proven cancer and 77% with thecorresponding prior mammograms. Birdwell etal.50 studied the performance of a commercialCAD system used for marking the signs of cancerthat were overlooked by radiologists; the systemwas able to detect five out of six cases ofarchitectural distortion and 77% of the previouslymissed lesions at 2.9 false positives per image.Baker et al.8 evaluated the performance of twocommercial CAD systems in detecting architec-tural distortion; fewer than 50% of the 45 cases ofarchitectural distortion were detected, with a lowerimage-based sensitivity of 38%, or 30 out of 80images, at 0.7 false positive per image.
Analysis of Mammograms Acquired Priorto the Detection of Breast Cancer
Screening mammography has limited sensitiv-ity51; it has been observed that subtle signs ofabnormality can be identified in a significant portion
of prior mammograms of screen-detected16 or inter-val cancer cases.19–22 Such cases of abnormalityinclude subtle or hard-to-detect features or patternsthat can indicate early signs of breast cancer. Only afew studies have been reported on the analysis ofprior mammograms to explore the possibilities ofdetection of early signs of breast cancer.Rangayyan et al.16 used phase portraits, FD, and
texture features for the detection of architecturaldistortion in prior mammograms of screen-detectedcancer and achieved a sensitivity of 79% at 8.4false positives per image with a set of 14 priormammograms.Sameti et al.52 evaluated the structural differences
between regions related to subsequent developmentof malignant masses and other normal areas in thelast screening mammograms prior to the detection oftumors. Circular ROIs were manually identified andtransformed into their optical density equivalentimages. The selected ROIs were further divided intothree types of regions representing low, medium, andhigh optical density, and photometric and texturefeatures were extracted. In 72% of the 58 cases ofbreast cancer studied, differences were observedbetween regions related to malignant tumors andnormal tissues in the prior mammograms. Sameti etal.20 also reported an average classification rate of72% using six selected texture and photometricfeatures computed from manually marked regionson the last screening mammograms prior to thedetection of breast cancer.Burnside et al.53 evaluated the effect of the
availability of prior mammograms on the clinicaloutcomes of diagnostic and screening mammogra-phy and reported that incorporating prior mammo-grams improved the specificity of screeningmammography significantly but did not improvethe sensitivity. However, the approach increased thesensitivity of diagnostic mammography. Sumkin etal.54 assessed and compared the benefit of usingimages acquired 1 or 2 years previously during theinterpretation of current mammograms; it was foundthat the sensitivity was not significantly affected bythe availability of the prior mammograms, but thespecificity was improved. Varela et al.55 found thatthe use of prior mammograms as reference couldsignificantly increase the accuracy of classificationbetween benign and malignant masses.Zheng et al.56 analyzed a method for the
detection of masses in current and prior mammo-grams in two situations: one with the algorithm
614 RANGAYYAN ET AL.

optimized using the current mammograms and theother with the algorithm optimized using therelated prior mammograms. The method includedthree steps: difference of Gaussian filtering andthresholding for the initial selection of potentialsites of lesions; adaptive region growing andtopological analysis of the suspicious regions toeliminate false positives; and feature extraction(including shape, histogram, and texture features)and classification using an ANN. A database of260 pairs of consecutive mammograms was usedwhere the latest image showed one or two masses,and the prior image had been originally classifiedas negative or probably benign. The first two stepsof the method were applied to both the latest andprior images, resulting in a set of 1,449 suspiciousROIs which were classified according to the truemass location in the corresponding latest mammo-grams. The ROIs were classified into the normaland mass categories using the third step of featureextraction and classification. Training the ANNwith the latest mammograms resulted in AUC=0.89±0.01 and 0.65±0.02 when classifying ROIsfrom the latest and prior mammograms, respec-tively. When the ANN was trained with ROIs fromthe prior mammograms, the classification perform-ance was AUC=0.81±0.02 and 0.71±0.02 withROIs from the latest and prior mammograms,respectively. The results demonstrate the impor-tance of incorporating knowledge about the partic-ular features of early signs of breast cancer.Petrick et al.57 studied the effectiveness of their
method for the detection of benign and malignantmasses as applied to the related regions in priormammograms. A set of 92 images, including 54malignant and 38 benign lesions from 37 cases (22malignant and 15 benign), was used. The methodsachieved a “by film” mass detection sensitivity of51% with 2.3 false positives per image; a slightlybetter accuracy of 57% was achieved in thedetection of malignant tumors. The detectionscheme segmented salient densities via regiongrowing after contrast enhancement; such inten-sity-based segmentation algorithms may not beadequately robust to detect developing densitieswith poor contrast in prior mammograms.Garvican and Field58 evaluated the performance
of a commercial CAD system with prior mammo-grams of interval cancer cases; the system wasfound to over-prompt normal areas and under-prompt cancer in the difficult cases analyzed.
Ikeda et al.59 analyzed the performance of acommercial CAD system using prior mammo-grams of 172 cases of cancer with subtle findings;the system was able to detect 42% of the findings.Ciatto et al.60 compared single, double, and CAD-assisted reading of negative prior mammograms incases of interval cancer and concluded that CAD-assisted reading is significantly more specific andalmost as sensitive as double reading. However, ina study conducted on CAD-assisted analysis ofcases of interval cancer by Moberg et al.,61 it wasfound that despite the high sensitivity of the CADsystem on its own, the system had no effect on thesensitivity or the specificity of the radiologists.Simultaneous analysis of current and prior
mammograms is recommended for use by radiol-ogists in the detection of breast cancer;54,55,62 thesame approach could enhance the performance ofCAD systems. Complementary to systemsdesigned for the detection of well-developedmasses or calcifications, the development ofCAD systems designed specifically for the detec-tion of subtle signs of breast cancer, such asarchitectural distortion in prior mammograms, isimportant and could improve the prognosis byfacilitating the detection of breast diseases at theirearly stages.
METHODS
Detection of Potential Sites of ArchitecturalDistortion
The methods proposed in the present workinclude the analysis of oriented-texture patternswith the application of Gabor filters and phaseportrait models12 for the detection of architecturaldistortion in prior mammograms. At first, thebreast portion of a given mammogram wassegmented by applying Otsu’s thresholdingmethod.63 The morphological opening filter64 witha disk-shaped structuring element of radius 25 pix-els (5 mm at 200 μm per pixel) was used forsmoothing the edges. The method for the detectionof architectural distortion was applied to thesegmented breast portion in a given mammogram,including the stages of extraction of the orientationfield using Gabor filters, selection of curvilinearstructures (CLS), filtering and downsampling ofthe orientation field, modeling of phase portraits,
CAD OF ARCHITECTURAL DISTORTION IN PRIOR MAMMOGRAMS 615

and detection of potential sites of architecturaldistortion.12,16
Gabor Filters for the Detection of OrientedPatterns
Gabor filters are a category of filters obtained bythe modulation of a sinusoidal function (real orcomplex) by a Gaussian envelope.65 The Gaborfunction has been recognized as a useful tool incomputer vision and image processing, especiallyfor texture analysis, due to its optimal localizationproperties in both the spatial and frequencydomains. In image processing applications, Gaborfilters may be used as line detectors or detectors oforiented features.10,23,33,66,67
The real Gabor filter kernel oriented at the angle� ¼ ��=2 is given as10,23:
g x; yð Þ ¼ 1
2p�x�yexp � 1
2
x2
�2x
þ y2
�2y
!" #cos 2pfoxð Þ;
ð1Þwhere σx and σy are the standard deviation valuesin the x and y directions and fo is the frequency ofthe modulating sinusoid. Kernels at other anglesare obtained by rotating this kernel using coor-dinate transformation as:
x0
y0
" #¼ cos a sin a
� sin a cos a
" #x
y
" #;
where (x′, y′) is the set of coordinates rotated by theangle α. We use a set of 180 kernels with anglesspaced evenly over the range � ¼ ��=2; �=2½ �. Theparameters in Eq. 1 were derived by taking intoaccount the size of the lines or CLS to be detected,as follows10:
� Let τ be the full width at half-maximum of theGaussian term in Eq. 1 along the x-axis. Then,�x ¼ τ= 2
ffiffiffiffiffiffiffiffiffiffiffi2 ln 2
p� � ¼ τ=2:35.� Let the period of the cosine term be τ; then,
f=1/τ.� The value of σy is defined as σy=lσx, where l
determines the elongation of the Gabor filterin the y direction as compared to the extent ofthe filter in the x direction.
� In the present work, we use τ=4 pixels(corresponding to a thickness of 0.8 mm atthe pixel size of 200 μm) and l=8.
For each image, a magnitude response and anorientation field were obtained using the responseand angle of the Gabor filter with the highestresponse at each pixel. The CLS of interest(spicules and fibroglandular tissue) were separatedfrom confounding structures (edges of the pectoralmuscle and parenchymal tissue, breast boundary,and noise) using the orientation field, the gradientfield, the nonmaximal suppression technique, andadditional conditions.12 The selected core CLSpixels and the orientation field were filtered with aGaussian filter and downsampled by a factor of 4,to an effective resolution of 800 μm/pixel, toreduce noise and further computational require-ments.10,23,24
Phase Portrait Analysis
The phase portrait diagram of a system of twolinear, first-order differential equations depicts thepossible trajectories of the state variables fordifferent initialization values.68 Rao and Jain69
developed a method for the analysis of orientedtexture which relies on the association of an imagepresenting an oriented-texture pattern with theappearance of a phase portrait diagram.Let p(t) and q(t), t 2 R , denote two differ-
entiable functions of time t, related as:
p�tð Þ ¼ F p tð Þ; q tð Þ½ �
q�tð Þ ¼ G p tð Þ; q tð Þ½ �;
ð2Þ
where p�tð Þ and q
�tð Þ indicate the first-order
derivatives with respect to time and F and Grepresent functions of p and q.10 Given initialconditions p(0) and q(0), the solution (p(t), q(t))can be viewed as a parametric trajectory orstreamline of a hypothetical particle in the (p, q)plane placed at (p(0), q(0)), at time t=0, andmoving through the (p, q) plane with the velocityðp� tð Þ; q� tð ÞÞ. The (p, q) plane is referred to as thephase plane of the system; the phase portrait is agraph of the possible streamlines in the phaseplane. A fixed point is a point in the phase planewhere p
�tð Þ ¼ 0 and q
�tð Þ ¼ 0; a particle left at a
fixed point remains stationary. When the system isaffine, we have:
p�tð Þ
q�tð Þ
!¼ A
p tð Þq tð Þ
!þ b; ð3Þ
616 RANGAYYAN ET AL.

where A is a 2×2 matrix and b is a 2×1 columnmatrix. The center (p0, q0) of the phase portrait isgiven by the fixed point as:
p�tð Þ
q�tð Þ
!¼ 0 )
p0
q0
!¼ �A�1b: ð4Þ
Associating the functions p(t) and q(t) with the xand y coordinates of the Cartesian (image) plane,we can define the orientation field as:
f x; y A;bjð Þ ¼ arctanq�tð Þ
p�tð Þ
!; ð5Þ
which is the angle of the velocity vectorðp� tð Þ; q� tð ÞÞ with the x-axis at (x, y)=(p(t), q(t)).In the model described above, there are three
types of phase portraits: node, saddle, and spiral;the type of phase portrait is determined by thenature of the eigenvalues of A.10,23,68,69 Theorientation field of a textured image can bedescribed by determining the type of the phaseportrait that is most similar to the orientation field.Because spiral patterns are not of interest in thepresent work, matrix A was constrained to besymmetric, resulting in only two phase portraitmaps: node and saddle. Further conditions werealso placed on the distance between the fixed pointand the position of the corresponding analysiswindow. Because a mammogram could exhibitseveral patterns, a sliding analysis window of size10×10 pixels (at 800 μm/pixel) was used with1 pixel per step. For each position of the window,a vote was cast at the node position given by thecorresponding fixed point. Instances of matrix Awith the condition number 93.0 were rejected so asto ignore patterns not associated with architecturaldistortion.12 The peaks in the node map areexpected to indicate potential sites of architecturaldistortion. Hence, the node map was analyzed todetect peaks related to the sites of architecturaldistortion; however, the procedure also results inthe detection of a number of false-positive sites.The results of application of the methods are
illustrated in Figure 1 for a prior mammogram ofan interval cancer case. In part a, the rectangleshows the area of architectural distortion identifiedby a radiologist (J.E.L.D.). The magnitude imageand the orientation field resulting from the Gaborfilters are shown in parts b and c, respectively. The
node map is shown in part a of Figure 2; the mostdominant peak is evident within the site ofarchitectural distortion.
Feature Extraction
The statistical measures of texture proposed byHaralick et al.27,28 were used in the present workfor the analysis of texture and feature extraction.Haralick’s texture measures are based upon themoments of a joint probability density functionthat is estimated using the joint occurrence or co-occurrence of gray levels, known as the gray levelco-occurrence matrix (GCM), and may be com-puted for various directions and distances.33
The GCM P(d,θ)(l1, l2) represents the probabilityof occurrence of the pair of gray levels (l1, l2)separated by the given distance d at the angle θ. Inthe present work, four normalized GCMs werecomputed with unit pixel distance for the angles of0°, 45°, 90°, and 135°. The four GCMs wereaveraged to obtain a single GCM for computationof Haralick’s 14 texture features, as listed inTable 1.Although many measures or estimates of fractal
properties have been proposed,17,70 FD is the mostfrequently used measure in medical imaging; seeRangayyan and Nguyen.71 In diagnostic imaging,the power spectrum estimation method has gainedattention because it appears to provide the mostaccurate and robust estimate of FD.25,26 Aguilar etal.26 proposed a new frequency analysis method,known as fractal analysis by circular average, andan image replication procedure to produce accuratemeasurements of FD of surfaces and profiles.To estimate FD, the 2D Fourier power spectrum of
the ROI being processed was obtained, including theapplication of the von Hann window and zeropadding to the size of 256×256 pixels. The 2Dspectrum was mapped to the radial (f, θ) space fromthe Cartesian (u, v) space by resampling and takingweighted average of the four neighbors of each pointfor radial distances ranging from zero to half thesampling frequency and over the range of angles[0, 179°]. Then, the 2D spectrum in the (f, θ) spacewas transformed into a 1D function S(f) by averagingas a function of the radial distance or frequency f fromthe zero frequency point over the range [0, 179°] inangle. The spectrum S(f) is considered to be related tothe radial frequency f according to the modelS fð Þ / 1=fð Þ�.72–75 Linear regression was applied
CAD OF ARCHITECTURAL DISTORTION IN PRIOR MAMMOGRAMS 617

to a limited frequency range of the 1D spectrum on alog–log scale, excluding points in selected low-frequency and high-frequency regions, to estimatethe slope β of the fitted line. The estimated slope isrelated to FD as14,16,25,26 FD=(8−β)/2. Selected low-and high-frequency regions were excluded so as toremove the effects of the low-frequency componentsrelated to the overall appearance of the image and thelarge structures present in the image, as well as toprevent the effects of high-frequency noise. In thepresent work, the range of f used to fit the linear
model is [6, 96] pixels or [0.117, 1.875] mm−1,where the range of [1, 128] pixels corresponds to thediscrete representation of the frequency range[0, 2.5] mm−1.
Feature Analysis, Selection,and Classification
Feature selection76–78 can be performed byevaluating the performance of each feature orcombinations of several features based on the p
(a) (b) (c)
(d) (e) (f)
Fig. 1. a Prior mammogram of an interval cancer case. The rectangle is of size 65×39 mm and indicates the region of architecturaldistortion identified by a radiologist. The size of the full image is 1,372×675 pixels at 200 μm per pixel. b Magnitude response obtainedusing a bank of 180 real Gabor filters. c Orientation field angle superimposed on the mammographic image; needles are drawn for every12th pixel. d Zoomed view of the rectangular area shown in a. e Magnitude response zoomed. f Orientation field zoomed; needles aredrawn for every sixth pixel for clarity.
618 RANGAYYAN ET AL.

values,79 AUC values,80,81 statistical or distancemeasures, deviation or error measures, discrimi-nant analysis, genetic programming or algorithms,classification accuracy using a training set,77,82 orthrough exhaustive search. The conventional sta-tistic for measuring the significance of a differenceof means is the Student’s t test.79,83 Once a t valueis determined, a p value can be found using thetable of values from Student’s t distribution. Thesmaller is the p value, the stronger is the evidenceagainst the null hypothesis.ROC analysis80,81 is commonly used to assess
the performance of a radiologist or a CAD systemin detecting abnormalities in medical images. TheROC curve depicts the sensitivity versus the false-positive rate (complement of the specificity) forvarious values of the decision threshold. The AUC
1
2 3
4
5
6
7
8
9
1011
12
13
14
15
16
17
18
1920
21
22
23
24
25
26
27
28
29
(a)
1
2 3
4
5
6
7
8
9
1011
12
13
14
15
16
17
18
1920
21
22
23
24
25
26
27
28
29
(b)
Fig. 2. a Node map at 800 μm/pixel for the mammogram in Figure 1a. Each asterisk mark corresponds to a peak position detectedautomatically in the node map. The numbers next to the asterisk marks indicate the peaks in descending order of magnitude. b The 29 ROIsobtained automatically using the peaks detected in the node map. The size of each ROI is 128×128 pixels at 200 μm per pixel (except atthe edges).
Table 1. List of Features Used
Feature type Feature number Feature name
Haralick’s texture 1 Energy2 Contrast3 Correlation4 Sum of squares5 Inverse difference moment6 Sum average7 Sum variance8 Sum entropy9 Entropy10 Difference variance11 Difference entropy12 and 13 Information theoretic measures
of correlation14 Maximal correlation coefficient
Fractal measure 15 Fractal dimensionNode map 16 Node value
CAD OF ARCHITECTURAL DISTORTION IN PRIOR MAMMOGRAMS 619

(or Az) could be used as a measure of performanceof the decision-making system or individual. InFROC analysis,84,85 the sensitivity is plotted on theordinate, and the mean number of false-positiveresponses per image is shown on the abscissa.Logistic classification is a statistical technique
based on a logistic regression model that estimatesthe probability of occurrence of an event.33,86 Thetechnique is designed for problems where patternsare to be classified into one of two classes. When theresponse variable is binary, theoretical and empiricalconsiderations indicate that the response functionis often curvilinear. The typical response function isshaped as a forward or backward tilted “S” and isknown as a sigmoidal function. The function hasasymptotes at 0 and 1. The main approaches oflogistic classification are: forward selection, whichinvolves starting with no variables in the model,trying out the variables one by one, and includingthem if they are statistically significant; backwardselection, which involves starting with all candidatevariables, testing them one by one for statisticalsignificance, and deleting those that are not signifi-cant; and methods that are a combination of theabove, testing at each stage for variables to beincluded or excluded. Stepwise logistic regressionincludes regressionmodels in which the choice of thepredictive variables is carried out by an automaticprocedure.86 Each step consists of one step offorward selection and one step of backward elimi-nation. These two tasks are repeated until no featurescan be added or removed.Feature selection through stepwise regression
iteratively varies the number of features used in theclassification step by entering features into orremoving features from the group of selected featuresbased on a selection criterion using F statistics.77
Fisher linear discriminant analysis (FLDA) isbased on linear projection of the given L-dimensionalfeature data onto a line.76 The expectation is thatsuch projections onto a line will be well separated byclass. Thus, the line is oriented to maximize classseparation.87 Bayesian decision theory is a funda-mental statistical approach to the problem of patternclassification76 based on quantifying the trade-offsbetween various classification decisions using priorprobabilities, likelihood functions, and the costs thataccompany the decisions.In many practical problems, we may have no
knowledge of the prior probabilities of patternsbelonging to one class or another. In such situations,
conventional pattern classification methods may notbe well suited for the classification of pattern vectors.ANNs could be effective in solving such classificationproblems.88 In general, three fundamentally differentclasses of network architecture can be identified assingle-layer feedforward (SLFF), multilayer feedfor-ward, and recurrent networks. The training of anANNclassifier is typically achieved by the back-propaga-tion algorithm.88
The radial basis function (RBF) neural network88
is a major class of neural network models in whichthe activation of a hidden unit is determined by thedistance between the input vector and a prototypevector. RBF neural networks can be viewed as anonlinear mapping between a set of inputs and a setof outputs. Because the mapping functions arenonlinear, it is not necessary to have more than onehidden layer to model any function: a sufficientnumber of RBF units will approximate the targetfunction. To combine the outputs of the hidden radialunits into the network’s outputs, a linear combinationof the outputs (i.e., a weighted sum of the GaussianRBFs) may be used to model any nonlinear function.The standard RBF has an output layer containingdot-product units with identical activation func-tions.88 RBF neural networks can be regarded aslinear-in-the-parameters models which have someunique computational advantages over other archi-tectures of neural networks.A generalized regression neural network (GRNN)89
has a radial basis layer and a special linear layer and isoften used to approximate a regression function. It isusually faster to train a GRNN than a multilayerperceptron (MLP) network. A GRNN is often moreaccurate than an MLP; a GRNN is also relativelyinsensitive to outliers in the data provided.The SVM is a learning tool based on modern
statistical learning theory90 and gives usefulbounds on the generalization capacity of machinesfor learning tasks. The SVM algorithm constructs aseparating hypersurface in the input space; it mapsthe input space into a higher dimensional featurespace through a nonlinear mapping operation.90–93
SVMs are a set of related supervised learningmethods used for classification and regression.Viewing input data as two sets of vectors in an n-dimensional space, an SVM constructs a separat-ing hyperplane in that space so as to maximize themargin between the two datasets. To calculate themargin, two parallel hyperplanes are constructed,one on each side of the separating hyperplane.
620 RANGAYYAN ET AL.

Intuitively, a good separation is achieved by thehyperplane that has the largest distance to theneighboring data points of both classes. In general,the larger is the margin, the lower is the general-ization error of the classifier.
EXPERIMENTAL SETUP AND DATABASE
Database of Mammograms
For the present study, mammographic imageswere obtained from a database of 1,745 digitizedmammograms of 170 subjects from Screen Test:Alberta Program for the Early Detection of BreastCancer.94,95 Ethics approval of the project wasobtained from the Conjoint Health Research EthicsBoard, Office of Medical Bioethics, University ofCalgary and the Calgary Regional Health Author-ity. The film mammograms were digitized at thespatial resolution of 50 μm and grayscale reso-lution of 12 bits per pixel using the Lumiscan 85laser scanner (Lumisys, Sunnyvale, CA).94
All cases of interval cancer in the database forwhich prior mammograms are available areincluded in the present study. Mammogramsacquired in the last scheduled visit to the screeningprogram prior to the detection of cancer wereincluded in the dataset for the present study andlabeled as prior mammograms. The mammogramson which cancer was detected (i.e., detectionmammograms) were not available for the presentstudy. In this manner, a total of 106 priormammographic images of 56 individuals diag-nosed with breast cancer were obtained. All buttwo of the 106 prior mammograms had beendeclared to be free of signs of breast cancer atthe time of their original acquisition and interpre-tation in the screening program; the two mammo-grams had been referred for biopsy although therewere no signs of malignancy. The time spanbetween the detection and prior mammogramsranged from 1.5 to 24.5 months, with an averageof 15 months and standard deviation of 7 months.The 106 prior mammograms of interval cancer
cases were reviewed independently by a radiologistspecialized in screening mammography (J.E.L.D.).The radiologist indicated that 38 of the 106 priormammographic images had visible architectural dis-tortion, and the remaining 68 images had questionableor no visible architectural distortion; regardless, all of
the 106 images have been included in the presentstudy. Parts of the images related to or suspected tocontain architectural distortion were marked usingrectangular boxes based on the reports available onsubsequent imaging, biopsy, or by detailed inspectionof the prior mammograms. One rectangular part perimage was marked by the radiologist. The averagewidth, height, and area of the 106 parts of imagesmarked by the radiologist are 56 mm, 39 mm, and2,274 mm2, with standard deviation of 11.8 mm,11.6 mm, and 1073.9 mm2, respectively.Biopsy and other reports of subsequent imaging
were available only for 33 out of the 56 cases ofinterval cancer. According to the subsequentimaging or biopsy reports, 23 cases were detectedwith masses occasionally accompanied by archi-tectural distortion, calcification, or other signs ofcancer, and ten cases were detected with calcifica-tion occasionally accompanied by architecturaldistortion or other signs of cancer.No BI-RADS ranking29 of breast density or
subtlety of the lesions was provided in the reportsfrom the screening program or the diagnostic clinics.In addition to the above, all normal cases in the
database with at least two visits to the screeningprogram were identified. The mammograms of thepenultimate screening visits of the normal cases atthe time of preparation of the database wereobtained and labeled as prior mammograms ofthe normal cases. In this manner, 52 prior mammo-graphic images of 13 normal control cases wereobtained for the study.
Detection of ROIs
The image processing methods proposed byAyres and Rangayyan12 for the detection ofarchitectural distortion (see “Detection of PotentialSites of Architectural Distortion”) were applied tothe 158 images obtained as described in “Databaseof Mammograms.” The images were filtered anddownsampled to 200 μm/pixel and 8 bits/pixelbefore applying Gabor filters for the detection andanalysis of oriented patterns. The resulting orien-tation field was filtered and downsampled to aneffective resolution of 800 μm/pixel to facilitateefficient phase portrait modeling. From the 158mammograms in the study, a total of 4,224 ROIs(2,821 ROIs from the 106 prior mammograms ofinterval cancer cases with 301 ROIs related to theparts with architectural distortion and 1,403 ROIs
CAD OF ARCHITECTURAL DISTORTION IN PRIOR MAMMOGRAMS 621

from the 52 normal prior mammograms) of size128×128 pixels at 200 μm/pixel (except at theedges of the images) were automatically obtained.ROIs were labeled at the locations indicated by thepeaks in the node maps, in decreasing order of thevalue of the peak, up to a maximum of 30 ROIsper mammogram. The automatically detected ROIswith their centers within the parts of architecturaldistortion identified by the radiologist were labeledas true-positive ROIs; the others were labeled asfalse-positive ROIs. Phase portrait analysis did notdetect any true-positive ROI in one prior mammo-
gram of the interval cancer cases; the radiologisthad indicated that the corresponding image had novisible architectural distortion.Figure 2b shows the ROIs obtained for the
image illustrated in Figure 1. Figure 3 showsexamples of true-positive and false-positive ROIsobtained from several cases included in the study.Table 2 gives the details of the dataset prepared forfurther analysis.In order to reduce the number of false positives,
first, ROIs were selected from each mammo-graphic image using the peak positions in the
(a) (b) (c) (d) (e)
(f) (g) (h) (i) (j)
(k) (l) (m) (n) (o)
(p) (q) (r) (s) (t)
Fig. 3. Examples of true-positive (a–j) and false-positive (k–t) ROIs detected. Each ROI is of size 128×128 pixels at 200 μm/pixel, or25.6×25.6 mm.
622 RANGAYYAN ET AL.
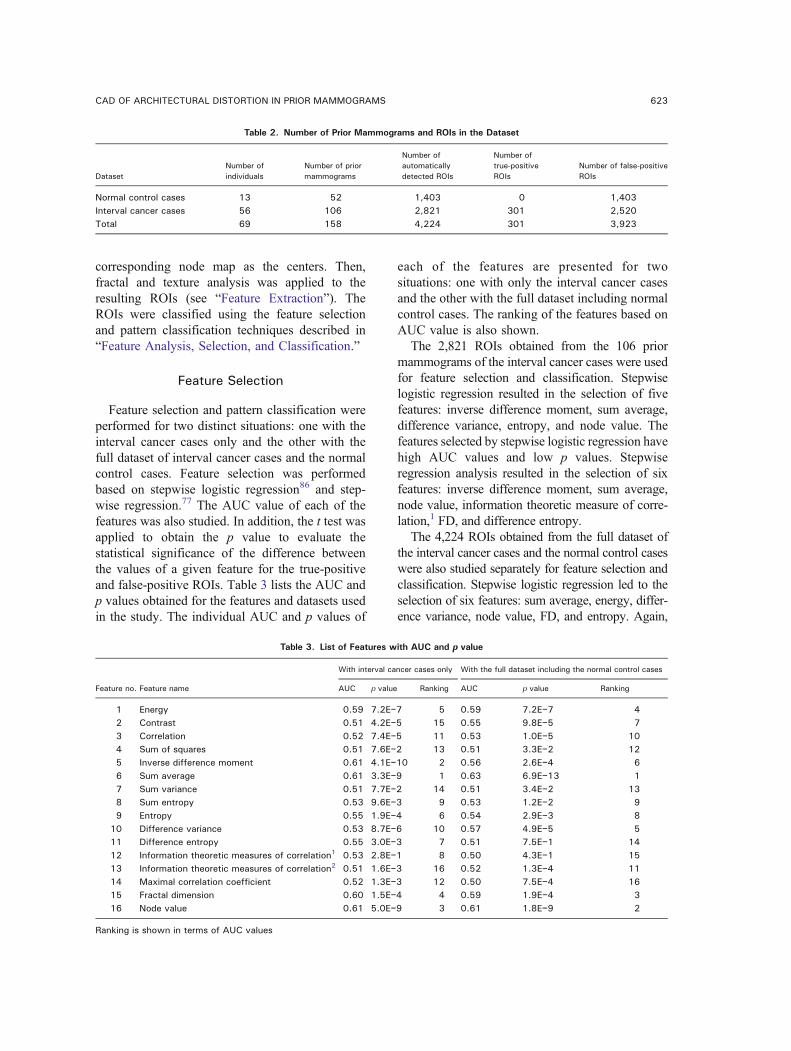
corresponding node map as the centers. Then,fractal and texture analysis was applied to theresulting ROIs (see “Feature Extraction”). TheROIs were classified using the feature selectionand pattern classification techniques described in“Feature Analysis, Selection, and Classification.”
Feature Selection
Feature selection and pattern classification wereperformed for two distinct situations: one with theinterval cancer cases only and the other with thefull dataset of interval cancer cases and the normalcontrol cases. Feature selection was performedbased on stepwise logistic regression86 and step-wise regression.77 The AUC value of each of thefeatures was also studied. In addition, the t test wasapplied to obtain the p value to evaluate thestatistical significance of the difference betweenthe values of a given feature for the true-positiveand false-positive ROIs. Table 3 lists the AUC andp values obtained for the features and datasets usedin the study. The individual AUC and p values of
each of the features are presented for twosituations: one with only the interval cancer casesand the other with the full dataset including normalcontrol cases. The ranking of the features based onAUC value is also shown.The 2,821 ROIs obtained from the 106 prior
mammograms of the interval cancer cases were usedfor feature selection and classification. Stepwiselogistic regression resulted in the selection of fivefeatures: inverse difference moment, sum average,difference variance, entropy, and node value. Thefeatures selected by stepwise logistic regression havehigh AUC values and low p values. Stepwiseregression analysis resulted in the selection of sixfeatures: inverse difference moment, sum average,node value, information theoretic measure of corre-lation,1 FD, and difference entropy.The 4,224 ROIs obtained from the full dataset of
the interval cancer cases and the normal control caseswere also studied separately for feature selection andclassification. Stepwise logistic regression led to theselection of six features: sum average, energy, differ-ence variance, node value, FD, and entropy. Again,
Table 2. Number of Prior Mammograms and ROIs in the Dataset
DatasetNumber ofindividuals
Number of priormammograms
Number ofautomaticallydetected ROIs
Number oftrue-positiveROIs
Number of false-positiveROIs
Normal control cases 13 52 1,403 0 1,403Interval cancer cases 56 106 2,821 301 2,520Total 69 158 4,224 301 3,923
Table 3. List of Features with AUC and p value
Feature no. Feature name
With interval cancer cases only With the full dataset including the normal control cases
AUC p value Ranking AUC p value Ranking
1 Energy 0.59 7.2E−7 5 0.59 7.2E−7 42 Contrast 0.51 4.2E−5 15 0.55 9.8E−5 73 Correlation 0.52 7.4E−5 11 0.53 1.0E−5 104 Sum of squares 0.51 7.6E−2 13 0.51 3.3E−2 125 Inverse difference moment 0.61 4.1E−10 2 0.56 2.6E−4 66 Sum average 0.61 3.3E−9 1 0.63 6.9E−13 17 Sum variance 0.51 7.7E−2 14 0.51 3.4E−2 138 Sum entropy 0.53 9.6E−3 9 0.53 1.2E−2 99 Entropy 0.55 1.9E−4 6 0.54 2.9E−3 8
10 Difference variance 0.53 8.7E−6 10 0.57 4.9E−5 511 Difference entropy 0.55 3.0E−3 7 0.51 7.5E−1 1412 Information theoretic measures of correlation1 0.53 2.8E−1 8 0.50 4.3E−1 1513 Information theoretic measures of correlation2 0.51 1.6E−3 16 0.52 1.3E−4 1114 Maximal correlation coefficient 0.52 1.3E−3 12 0.50 7.5E−4 1615 Fractal dimension 0.60 1.5E−4 4 0.59 1.9E−4 316 Node value 0.61 5.0E−9 3 0.61 1.8E−9 2
Ranking is shown in terms of AUC values
CAD OF ARCHITECTURAL DISTORTION IN PRIOR MAMMOGRAMS 623

the features selected by stepwise logistic regressionhave high AUC values and low p values. Stepwiseregression analysis resulted in the selection of fivefeatures: sum average, sum entropy, node value,difference variance, and FD. The features selectedby logistic regression and stepwise regression wereused independently to perform classification.
Pattern Classification
The ROC and the FROC procedures were used totest and evaluate the classification accuracy usingseveral classifiers. For ROC analysis, FLDA, theBayesian classifier, the ANN based on an SLFFneural network with a single neuron in the hidden
layer and a logistic activation function, theMLPwithtwo hidden layers (the first hidden layer with threeneurons and the second with one neuron) and thetangent sigmoid activation function, and the RBFwere used. In addition, the SVMwith an RBF kernelwas also used to obtain a discriminant value. Intraining and testing the FLDA and Bayesian classi-fiers, the leave-one-out (LOO)method was used. TheROI to be classified was excluded from the trainingset. For classification using ANNs with the SLFF,MLP, and RBF and the SVM with an RBF kernel,50% of the true-positive and 50% of the false-positive ROIs were randomly selected to generate thetraining and the testing sets, and the procedure wasrepeated 100 times. The flowchart shown in Figure 4
Mammographic Image
Classification of ROIs
Detection of Potential Sites of
Feature Selection
Detected Sites of Architectural Distortion
of the Orientation Field
Selection of CLS
Extraction of the
Orientation Field
Filtering and Downsampling
Architectural Distortion
Feature Extraction
Selection of ROIs
Phase Portrait Modeling
Application of Gabor Filters
(a)
SVM
Selection of ROIs
Radial von Hann Window
2D Fourier Spectrum
1D Fourier Spectrum
Fractal Dimension
Texture
Haralick’s Measures of
Extracted Features
FLDA(RBF Kernel)
Selected Features
Feature Extraction
Feature Selection
Classification of ROIs
Detected Sites of Architectural Distortion
Logistic RegressionStepwise
Regression Stepwise
(SLFF, MLP, RBF)ClassifierBayesian ANN
(b)
Fig. 4. Flowchart of the procedures used to detect architectural distortion in prior mammograms. The steps in the dashed box labeledin a are shown in detail in b. The connecting lines and the boxes in dotted lines indicate options to be selected. CLS curvilinear structure,ROI region of interest, FLDA Fisher linear discriminant analysis, ANN artificial neural network, SLFF single-layer feedforward network,MLP multilayer perceptron, RBF radial basis function, SVM support vector machine.
624 RANGAYYAN ET AL.

gives an overview of the whole procedure describedabove.FROC analysis was used to assess the false-
positive rate for a given level of sensitivity whenclassification of the ROIs was placed in the contextof detection of architectural distortion in fullmammograms. The GRNN and the ANN basedon the SLFF, MLP, and RBF were used forclassification using the leave-one-image-outmethod: the features of all ROIs belonging to theimage being analyzed were removed from thedataset during the training step of the classifier.For implementation of the SVM with an RBF
kernel, the MATLAB® Bioinformatics Toolbox(The MathWorks, Natick, MA) was used. Thediscriminant values of the SVM91–93 were obtainedusing quadratic programming optimization.Because the GRNN is fast in function approxima-tion, it was also used for FROC analysis. All theparameters required for the classifiers used in thepresent study were selected empirically; because ofdependence on the specific datasets, they are notreported in the present paper. The AUC valueswere obtained using ROCKIT, a widely usedsoftware package developed at the University ofChicago, IL.96 The p values were obtained byusing the two-tailed t test79 in MATLAB.
RESULTS
The classification performance of the node valueand FD was evaluated using ROC analysis. Withthe node value, the AUC obtained was 0.61 withthe interval cancer mammograms; the same AUCvalue was obtained with the full dataset includingthe normal control cases. The AUC obtained withthe FD was 0.60 with the interval cancer mammo-grams and 0.59 with the normal control casesincluded. The results indicate that the node valueand FD, on their own, are not adequate forefficient detection of architectural distortion inprior mammograms; regardless, node analysisserves as an important preprocessing step to selectcandidate ROIs for further analysis.
Interval Cancer Cases Only
With the interval cancer cases only, the featuresselected by stepwise logistic regression and withthe leave-one-ROI-out method, the same AUC
value of 0.73 was obtained using FLDA and theBayesian classifier. The features selected by step-wise regression resulted in AUC values of 0.73and 0.74 using FLDA and the Bayesian classifier,respectively. The use of all the 16 features (seeTable 1) resulted in poorer performance with AUCvalues of 0.67 with FLDA and 0.52 with theBayesian classifier.The results of FROC analysis with the selected
features obtained by stepwise logistic regression andstepwise regression are illustrated in Figure 5 for theANN-RBF classifier with the leave-one-image-outmethod. The FROC curve obtained using the nodevalue only (i.e., the starting point of this study) is alsoshown for reference. The selected features demon-strate considerable improvement of performanceover the node value. With 80% sensitivity as thereference point, the ANN-RBF classifier with theselected features based on stepwise logistic regres-sion and stepwise regression resulted in lower false-positive rates of 8.6 and 7.5 per image, respectively;on the contrary, the node value produced 9.6 falsepositives per image at the same level of sensitivity.
Interval Cancer Cases and Normal ControlCases
The results obtained using several classifiers withthe selected features based on stepwise logisticregression and stepwise regression are shown inTable 4 for the whole dataset including normal
0 5 10 15 200
0.2
0.4
0.6
0.8
1
False positives per image
Sen
sitiv
ity
StepwiseLogisticNode
Fig. 5. FROC curves for the dataset of only the prior mammo-grams of the interval cancer cases with the selected featuresusing the ANN-RBF classifier and the leave-one-image-outmethod. The FROC curve generated using the node value onlyis also shown for reference. Sensitivity=true-positive fraction.
CAD OF ARCHITECTURAL DISTORTION IN PRIOR MAMMOGRAMS 625

control cases. An SVMwith the RBF kernel resultedin an average AUC value of 0.77 over 100 trialsusing the features selected by stepwise logisticregression and stepwise regression. The ANN-RBFresulted in an average AUC value of 0.77 using thefeatures selected by stepwise logistic regression and0.76 using the features selected by stepwise regres-sion. The classification performance of the full set of16 features was also evaluated in terms of ROCanalysis, with FLDA and the Bayesian classifier andusing the leave-one-ROI-out procedure; the corre-sponding AUC values obtained were 0.68 and 0.57,respectively.The results of FROC analysis are presented in
Table 5 for several classifiers with the leave-one-image-out method. The FROC curves using fourclassifiers with the features obtained by stepwiselogistic regression and stepwise regression areshown in parts a and b of Figure 6. With thesensitivity of 0.8 as the reference point, theselected features based on stepwise logistic regres-sion showed the best performance at 7.6 falsepositives per image using the SLFF-ANN and 7.7false positives per image using an ANN-RBF.To facilitate further detailed comparative analy-
sis, the results of FROC analysis with the selectedfeatures obtained by stepwise logistic regressionand stepwise regression are illustrated in Figure 7for the ANN-RBF classifier with the leave-one-image-out method; the FROC curve obtained usingthe node value (i.e., the starting point of this study)is also shown for reference. At 80% sensitivity, thenode value produced 10.3 false positives per
image, whereas the selected features using step-wise logistic regression with the ANN-RBF clas-sifier provided better performance with a lowerfalse-positive rate of 7.7 per image.
DISCUSSION AND CONCLUSION
Referring to the ROC performance presented inTable 4 using the features selected by stepwiselogistic regression and stepwise regression, theresults were expected to be better with ANN-basedclassification as compared to FLDA and theBayesian method. However, because of randomsubsampling for cross-validation, the results arebiased and dependent on the sample size, therandomly selected samples, and their statisticaldistribution.77 Furthermore, the AUC valuesobtained with the ANN-based classifiers arepessimistically biased because the ratio of the totalnumber of available samples per class to thenumber of available features is 95.77 The resultscould be improved by using the LOO method withthese classifiers; however, the associated computa-tional requirements are high.In a related previous study,16 ROC analysis with
FD of the 14 prior mammograms of seven screen-detected cases provided good classification per-formance with AUC=0.74. Texture measuresresulted in a poorer performance of AUC=0.70with the prior mammograms. Using feature selec-tion and the Bayesian classifier, the best classi-fication performance achieved was AUC=0.80 forthe prior mammograms. In addition, FROC anal-ysis with the detection mammograms indicated asensitivity of 0.79 at 13.7 false positives per image
Table 4. Results Obtained in Terms of AUC Using the SelectedFeatures Based on Stepwise Logistic Regression and Stepwise
Regression
ClassifierSix features from stepwiselogistic regression
Five features from stepwiseregression
FLDA 0.73 0.72Bayesian 0.76 0.76SLFF Mean 0.75, SD 0.03 Mean 0.74, SD 0.04MLP Mean 0.73, SD 0.11 Mean 0.72, SD 0.13RBF Mean 0.77, SD 0.01 Mean 0.76, SD 0.02SVM Mean 0.77, SD 0.03 Mean 0.77, SD 0.03
The dataset includes the prior mammograms of the intervalcancer cases as well as the normal control cases. The mean andSD values are presented for 100 trials in each case of the ANNsand SVMFLDA Fisher linear discriminant analysis, SLFF single-layerfeedforward neural network, MLP multilayer perceptron, RBF
radial basis function, SVM support vector machine
Table 5. Results Obtained Using Several Classifiers and theLeave-One-Image-Out Method with FROC Analysis
ClassifierSix features from stepwiselogistic regression
Five features fromstepwise regression
SLFF 7.6 8.3MLP 11.4 11.3GRNN 7.7 7.8RBF 7.7 8.0
The dataset includes the prior mammograms of the intervalcancer cases as well as the normal control cases. The results arein terms of false positives per image at 80% sensitivitySLFF single-layer feedforward neural network, MLP multilayerperceptron, RBF radial basis function, GRNN generalized regres-sion neural network
626 RANGAYYAN ET AL.

with the selected features. The same sensitivity of0.79 was achieved at a lower rate of 8.4 falsepositives per image using the selected set offeatures with the prior mammograms. The datasetused was small, with only 14 prior mammogramsand 14 detection mammograms and with nonormal control cases. Contrary to the presentstudy, the detection mammograms were availablefor reference to the radiologist when labeling the
parts with architectural distortion on the priormammograms.However, in the present study on interval cancer
cases, including normal control cases, the detectionor diagnostic mammograms were not available toaid the process of localization of the sites ofarchitectural distortion on the prior mammograms.Biopsy and other reports of subsequent imagingwere available only for 33 out of the 56 cases ofinterval cancer. These factors could have affectedthe size and positional accuracy of the rectangularparts drawn by the radiologist to delineate thesuspicious areas on the prior mammograms.Although some of the automatically detected ROIswere ranked low in the step of node map analysis,they were marked as true positives (if their centerswere within the related area delineated by theradiologist) and contained only small portions ofthe spiculations due to architectural distortion;such ROIs could increase the ambiguity andcomplexity in pattern classification. Moreover,there exist as many as 68 images with questionableor no visible architectural distortion (as determinedby the radiologist) in the dataset used in thepresent study. Even with a larger dataset, increasedambiguity, and a number of normal control casesincluded, the rates of sensitivity obtained in thepresent study are comparable to those obtained in arelated previous study16 without a substantialincrease in the number of false positives per
0 5 10 15 200
0.2
0.4
0.6
0.8
1
False positives per image
Sen
sitiv
ity
SLFFMLPGRNNRBF
(a)
0 5 10 15 200
0.2
0.4
0.6
0.8
1
False positives per image
Sen
sitiv
ity
SLFFMLPGRNNRBF
(b)
Fig. 6. FROC curves: a using four classification techniques with the leave-one image-out method and the features obtained bystepwise logistic regression, b using four classification techniques with the leave-one-image-out method and the features selected bystepwise regression analysis. The dataset includes the prior mammograms of the interval cancer cases as well as the normal controlcases.
0 5 10 15 200
0.2
0.4
0.6
0.8
1
False positives per image
Sen
sitiv
ity
StepwiseLogisticNode
Fig. 7. FROC curves for the full dataset including the priormammograms of the interval cancer cases and normal controlcases. The curves are shown for the ANN-RBF classifier and theleave-one-image-out method using the features obtained bystepwise logistic regression and stepwise regression. The FROCcurve generated using the node value only is also shown forreference. Sensitivity=true-positive fraction.
CAD OF ARCHITECTURAL DISTORTION IN PRIOR MAMMOGRAMS 627

image. The proposed methods have demonstratedthe ability to detect early signs of breast cancer15 months ahead of the time of clinical diagnosis,on average, for interval cancer cases, with asensitivity up to 99%, albeit at a high false-positiverate of 18 per image; at a lower but still substantialsensitivity of 80%, the false-positive rate iscorrespondingly lower, at 7.7 per image. In thecontext of the results of the works on architecturaldistortion reviewed in “Detection of ArchitecturalDistortion in Mammograms,” the results obtainedin the present work on prior mammograms ofinterval cancer cases including normal controlcases are comparable and encouraging. However,detailed comparative analysis is difficult becauseof variation in the datasets used.The results of FROC analysis in the present
study indicate that the false-positive rate in thedetection of architectural distortion in prior mam-mograms, at a given level of sensitivity, may bereduced by the application of a trained ANN-basedclassifier. The SLFF, GRNN, and RBF classifiershave all provided comparable results, with sub-stantial reduction in the false-positive rate ascompared to the particular MLP architecture usedand phase portrait analysis. Establishment of thestatistical significance of the differences betweenthe several FROC curves derived is beyond thescope of the present study. Reliable techniques fortesting the significance of differences betweenFROC curves are not yet well established.97
Although some methods have been proposed forthis purpose,98 their robustness has not beenestablished.97 Future studies should include detailedand objective analysis of FROC curves.The programs for Gabor filtering, phase portrait
modeling, fractal analysis, and texture analysiswere written in MATLAB and took about 70 minto process a mammogram, on average (with anaverage size of 1,300×800 pixels at 200 μm/pixelresolution). The classification time using theseveral classifiers studied was not recorded. Thecomputer used is a Dell workstation with dual IntelXeon processors operating at 1.50 GHz, with 2 GBof RAM. Conversion of the code to the C or C++language and the use of multiple processors inparallel could lead to faster computation of theresults for application in a practical setting.The results obtained in the present study with
the prior mammograms are important and encour-aging and indicate that Gabor filters, phase
portraits, fractal analysis, and texture features canbe used to achieve early detection of subtle signsof breast cancer in mammograms, specificallyarchitectural distortion. Further reduction in thefalse-positive rate is desirable; detection andremoval of the pectoral muscle99 in mediolateraloblique views and additional conditions at theedges of the fibrograndular disk100 could reducethe number of false positives. Nonlinear phaseportrait analysis101 and multifractal analysis102
could be explored to derive features with improveddiscriminant capability.The development of CAD techniques for the
detection and localization of architectural distor-tion in prior mammograms may lead to efficientdetection of early signs of breast cancer.
ACKNOWLEDGMENTS
This project was funded by grants from the Canadian BreastCancer Foundation: Prairies/NWT Chapter, the Alberta HeritageFoundation for Medical Research (AHFMR), and the NaturalSciences and Engineering Research Council (NSERC) of Canada.
REFERENCES
1. Jemal A, Clegg LX, Ward E, Ries LAG, Wu X, JamisonPM, Wingo PA, Howe HL, Anderson RN, Edwards BK: Annualreport to the nation on the status of cancer, 1975–2001, with aspecial feature regarding survival. Cancer 101(1):3–27, 2004
2. Blanks RG, Wallis MG, Moss SM: A comparison of cancerdetection rates achieved by breast cancer screening programmesby number of readers, for one and two view mammography:Results from the UK National Health Service Breast ScreeningProgramme. J Med Screen 5(4):195–201, 1998
3. Doi K: Computer-aided diagnosis in medical imaging:Historical review, current status and future potential. ComputMed Imaging Graph 31:198–211, 2007
4. Doi K: Diagnostic imaging over the last 50 years:Research and development in medical imaging science andtechnology. Phys Med Biol 51:R5–R27, 2006
5. Homer MJ: Mammographic Interpretation: A PracticalApproach, 2nd edition. New York: McGraw-Hill, 1997
6. Knutzen AM, Gisvold JJ: Likelihood of malignant diseasefor various categories of mammographically detected, non-palpable breast lesions. Mayo Clin Proc 68:454–460, 1993
7. Matsubara T, Ichikawa T, Hara T, Fujita H, Kasai S, EndoT, Iwase T: Novel method for detecting mammographicarchitectural distortion based on concentration of mammarygland. Int Congr Ser 1268:867–871, 2004
8. Baker JA, Rosen EL, Lo JY, Gimenez EI, Walsh R, SooMS: Computer-aided detection (CAD) in screening mammog-raphy: Sensitivity of commercial CAD systems for detectingarchitectural distortion. Am J Roentgenol 181:1083–1088, 2003
9. Broeders MJM, Onland-Moret NC, Rijken HJTM, HendriksJHCL, Verbeek ALM, Holland R: Use of previous screening
628 RANGAYYAN ET AL.

mammograms to identify features indicating cases that would havea possible gain in prognosis following earlier detection. Eur JCancer 39:1770–1775, 2003
10. Rangayyan RM, Ayres FJ: Gabor filters and phaseportraits for the detection of architectural distortion in mammo-grams. Med Biol Eng Comput 44:883–894, 2006
11. Ayres FJ, Rangayyan RM: Detection of architecturaldistortion in mammograms via analysis of phase portraits andcurvilinear structures. In: Hozman J, Kneppo P Eds. Proceed-ings of EMBEC’05: 3rd European Medical & BiologicalEngineering Conference, volume 11. Prague, Czech Republic,November 2005, pp 1768–1773
12. Ayres FJ, Rangayyan RM: Reduction of false positivesin the detection of architectural distortion in mammograms byusing a geometrically constrained phase portrait model. Int JComput Assist Radiol Surg 1:361–369, 2007
13. Rangayyan RM, Ayres FJ, Desautels JEL: A review ofcomputer-aided diagnosis of breast cancer: Toward the detec-tion of subtle signs. J Franklin Inst 344:312–348, 2007
14. Tourassi GD, Delong DM, Floyd Jr, CE: A study on thecomputerized fractal analysis of architectural distortion in screen-ing mammograms. Phys Med Biol 51(5):1299–1312, 2006
15. Sampat MP, Markey MK, Bovik AC: Measurement anddetection of spiculated lesions. IEEE Southwest Symposium onImage Analysis and Interpretation. IEEE Computer Society,March 2006, pp 105–109
16. Rangayyan RM, Prajna S, Ayres FJ, Desautels JEL:Detection of architectural distortion in mammograms acquiredprior to the detection of breast cancer using Gabor filters, phaseportraits, fractal dimension, and texture analysis. Int J ComputAssist Radiol Surg 2(6):347–361, 2008
17. Guo Q, Shao J, Ruiz VF: Characterization and classi-fication of tumor lesions using computerized fractal-basedtexture analysis and support vector machines in digital mammo-grams. Int J Comput Assist Radiol Surg 4(1):11–25, 2009
18. Tang J, Rangayyan RM, Xu J, Naqa IE, Yang Y:Computer-aided detection and diagnosis of breast cancer withmammography: Recent advances. IEEE Trans Inf TechnolBiomed 13(2):236–251, 2009
19. van Dijck JAAM, Verbeek ALM, Hendriks JHCL,Holland R: The current detectability of breast cancer in amammographic screening program. Cancer 72(6):1933–1938,1993
20. Sameti M, Ward RK, Morgan-Parkes J, Palcic B: Imagefeature extraction in the last screening mammograms prior todetection of breast cancer. IEEE J Select Topics Signal Process3(1):46–52, 2009
21. Rangayyan RM, Banik S, Prajna S, Desautels JEL:Detection of architectural distortion in prior mammograms ofinterval-cancer cases. Proceedings of the 23rd InternationalCongress and Exhibition: Computer Assisted Radiology andSurgery, Berlin, Germany, June 2009, pp S171–S173
22. Banik S, Rangayyan RM, Desautels JEL: Detection ofarchitectural distortion in prior mammograms of interval-cancercases with neural networks. Proceedings of the 31st AnnualInternational Conference of the IEEE Engineering in Medicineand Biology Society, Minneapolis, MN, September 2009, pp6667–6670
23. Ayres FJ, Rangayyan RM: Design and performanceanalysis of oriented feature detectors. J Electron Imaging 16(2):023007, 1–12, 2007
24. Ayres FJ, Rangayyan RM: Characterization of architec-tural distortion in mammograms. IEEE Eng Med Biol Mag24(1):59–67, 200525. Anguiano E, Pancorbo MA, Aguilar M: Fractal charac-
terization by frequency analysis: I. Surfaces. J Microsc172:223–232, 199326. Aguilar M, Anguiano E, Pancorbo MA: Fractal charac-
terization by frequency analysis: II. A new method. J Microsc172:233–238, 199327. Haralick RM: Statistical and structural approaches to
texture. Proc IEEE 67:786–804, 197928. Haralick RM, Shanmugam K, Dinstein I: Textural
features for image classification. IEEE Trans Syst Man Cybern3(6):610–622, 197329. American College of Radiology (ACR): Illustrated
Breast Imaging Reporting and Data System (BI-RADS), 4thedition. Reston: American College of Radiology, 200330. Yankaskas BC, Schell MJ, Bird RE, Desrochers DA:
Reassessment of breast cancers missed during routine screeningmammography: A community based study. Am J Roentgenol177:535–541, 200131. Burrell H, Evans A, Wilson A, Pinder S: False-negative
breast screening assessment: What lessons we can learn? ClinRadiol 56:385–388, 200132. Burrell HC, Sibbering DM, Wilson ARM, Pinder SE,
Evans AJ, Yeoman LJ, Elston CW, Ellis IO, Blamey RW,Robertson JFR: Screening interval breast cancers: Mammo-graphic features and prognostic factors. Radiology 199(4):811–817, 199633. Rangayyan RM: Biomedical Image Analysis, Boca
Raton: CRC, 200534. Mudigonda NR, Rangayyan RM: Texture flow-field
analysis for the detection of architectural distortion in mammo-grams. In: Ramakrishnan AG Ed. Proceedings of Biovision,Bangalore, India, December 2001, pp 76–8135. Ayres FJ, Rangayyan RM: Characterization of architec-
tural distortion in mammograms. Proceedings of the 25thAnnual International Conference of the IEEE Engineering inMedicine and Biology Society (CD-ROM), Cancún, Mexico,September 2003, pp 886–88936. Suckling J, Parker J, Dance DR, Astley S, Hutt I, Boggis
CRM, Ricketts I, Stamakis E, Cerneaz N, Kok S-L, Taylor P,Betal D, Savage J: The Mammographic Image Analysis Societydigital mammogram database. In: Gale AG, Astley SM, DanceDD, Cairns AY Eds. Digital Mammography: Proceedings of the2nd International Workshop on Digital Mammography. York:Elsevier, 1994, pp. 375–37837. Matsubara T, Ichikawa T, Hara T, Fujita H, Kasai S,
Endo T, Iwase T: Automated detection methods for architec-tural distortions around skinline and within mammary gland onmammograms. In: Lemke HU, Vannier MW, Inamura K,Farman AG, Doi K, Reiber JHC Eds. Proceedings of the 17thInternational Congress and Exhibition on Computer AssistedRadiology and Surgery (CARS2003). London: Elsevier, 2003,pp. 950–95538. Ichikawa T, Matsubara T, Hara T, Fujita H, Endo T,
Iwase T: Automated detection method for architectural dis-tortion areas on mammograms based on morphological pro-cessing and surface analysis. In: Fitzpatrick JM, Sonka M Eds.Proceedings of SPIE Medical Imaging 2004: Image Processing.San Diego: SPIE, 2004, pp. 920–925
CAD OF ARCHITECTURAL DISTORTION IN PRIOR MAMMOGRAMS 629

39. Hara T, Makita T, Matsubara T, Fujita H, Inenaga Y,Endo T, Iwase T: Automated detection method for architecturaldistortion with spiculation based on distribution assessment ofmammary gland on mammogram. In: Astley SM, Brady M,Rose C, Zwiggelaar R Eds. Digital Mammography/IWDM,volume 4046 of Lecture Notes in Computer Science Man-chester, UK, June 2006, pp 370–375,40. Matsubara T, Hara T, Fujita H, Endo T, Iwase T:
Automated detection method for mammographic spiculatedarchitectural distortion based on surface analysis. Proceedingsof the 22nd International Congress and Exhibition on ComputerAssisted Radiology and Surgery (CARS2008), volume 3(1),Barcelona, Spain, June 2008, pp S176–S17741. Guo Q, Shao J, Ruiz V: Investigation of support vector
machine for the detection of architectural distortion in mammo-graphic images. J Phys: Conf Ser 15:88–94, 200542. Sampat MP, Bovik AC: Detection of spiculated lesions in
mammograms. Proceedings of the 25th Annual InternationalConference of the IEEE Engineering in Medicine and BiologySociety (CD-ROM), Cancún,Mexico, September 2003, pp 810–81343. Sampat MP, Whitman GJ, Markey MK, Bovik AC:
Evidence based detection of spiculated masses and architecturaldistortion. In: Fitzpatrick JM, Reinhardt JM Eds. Proceedings ofSPIE Medical Imaging 2005: Image Processing, volume 5747,San Diego, CA, 2005, pp 26–3744. Özekes S, Osman O, Çamurcu AY: Computerized
detection of architectural distortions in digital mammograms.Proceedings of the 19th International Conference on ComputerAssisted Radiology and Surgery (CARS 2005), volume 1281,Berlin, Germany, 2005, p 139645. Eltonsy N, Tourassi G, Elmaghraby A: Investigating
performance of a morphology-based CAD scheme in detectingarchitectural distortion in screening mammograms. In: LemkeHU, Inamura K, Doi K, Vannier MW, Farman AG Eds.Proceedings of the 20th International Congress and Exhibitionon Computer Assisted Radiology and Surgery (CARS 2006).Osaka: Springer, 2006, pp. 336–33846. Nakayama R, Watanabe R, Kawamura T, Takada T,
Yamamoto K, Takeda K: Computer-aided diagnosis scheme fordetection of architectural distortion on mammograms usingmultiresolution analysis. Proceedings of the 21st InternationalCongress and Exhibition on Computer Assisted Radiology andSurgery (CARS 2008), volume 3(1), Barcelona, Spain, June2008, page S418–S41947. Nemoto M, Honmura S, Shimizu A, Furukawa D,
Kobatake H, Nawano S: A pilot study of architectural distortiondetection in mammograms based on characteristics of lineshadows. Int J Comput Assist Radiol Surg 4(1):27–36, 200948. Burhenne LJW, Wood SA, D’Orsi CJ, Feig SA, Kopans
DB, O’Shaughnessy KF, Sickles EA, Tabar L, Vyborny CJ,Castellino RA: Potential contribution of computer-aided detec-tion to the sensitivity of screening mammography. Radiology215(2):554–562, 200049. Evans WP, Burhenne LJW, Laurie L, O’Shaughnessy
KF, Castellino RA: Invasive lobular carcinoma of the breast:Mammographic characteristics and computer-aided detection.Radiology 225(1):182–189, 200250. Birdwell RL, Ikeda DM, O’Shaughnessy KF, Sickles
EA: Mammographic characteristics of 115 missed cancers laterdetected with screening mammography and the potential utilityof computer-aided detection. Radiology 219(1):192–202, 2001
51. Bird RE, Wallace TW, Yankaskas BC: Analysis ofcancers missed at screening mammography. Radiology 184(3):613–617, 1992
52. Sameti M, Morgan-Parkes J, Ward RK, Palcic B:Classifying image features in the last screening mammogramsprior to detection of a malignant mass. In: Karssemeijer N,Thijssen M, Hendriks J, van Erning L Eds. Proceedings of the4th International Workshop on Digital Mammography. Nijme-gen, The Netherlands, 1998 pp 127–134
53. Burnside ES, Sickles EA, Sohlich RE, Dee KE: Differ-ential value of comparison with previous examinations indiagnostic versus screening mammography. Am J Roentgenol179:1173–1177, 2002
54. Sumkin JH, Holbert BL, Herrmann JS, Hakim CA,Ganott MA, Poller WR, Shah R, Hardesty LA, Gur D: Optimalreference mammography: A comparison of mammogramsobtained 1 and 2 years before the present examination. Am JRoentgenol 180:343–346, 2003
55. Varela C, Karssemeijer N, Hendriks JHCL, Holland R:Use of prior mammograms in the classification of benign andmalignant masses. Eur J Radiol 56:248–255, 2005
56. Zheng B, Good WF, Armfield DR, Cohen C, HertzbergT, Sumkin JH, Gur D: Performance change of mammographicCAD schemes optimized with most-recent and prior imagedatabases. Acad Radiol 10:283–288, 2003
57. Petrick N, Chan HP, Sahiner B, Helvie MA, PaqueraultS: Evaluation of an automated computer-aided diagnosis systemfor the detection of masses on prior mammograms. Proceedingsof SPIE Volume 3979, Medical Imaging 2000: Image Process-ing, 2000, pp 967–973
58. Garvican L, Field S: A pilot evaluation of the R2 ImageChecker System and users’ response in the detection of intervalbreast cancers on previous screening films. Clin Radiol 56:833–837, 2001
59. Ikeda DM, Birdwell RL, O’Shaughnessy KF, SicklesEA, Brenner RJ: Computer-aided detection output on 172 subtlefindings on normal mammograms previously obtained inwomen with breast cancer detected at follow-up screeningmammography. Radiology 230:811–819, 2004
60. Ciatto S, Del Turco MR, Burke P, Visioli C, Paci E, ZappaM: Comparison of standard and double reading and computer-aideddetection (CAD) of interval cancers at prior negative screeningmammograms: Blind review. Br J Cancer 89:1645–1649, 2003
61. Moberg K, Bjurstam N, Wilczek B, Rostgård L, Egge E,Muren C: Computer assisted detection of interval breastcancers. Eur J Radiol 39:104–110, 2001
62. Majid AS, de Paredes ES, Doherty RD, Sharma NR,Salvador X: Missed breast carcinoma: Pitfalls and pearls.RadioGraphics 23:881–895, 2003
63. Otsu N: A threshold selection method from gray-levelhistograms. IEEE Trans Syst Man Cybern 9(1):62–66, 1979
64. Gonzalez RC, Woods RE: Digital Image Processing, 2ndedition. Upper Saddle River: Prentice-Hall, 2002
65. Gabor D: Theory of communication. J Inst Electr Eng93:429–457, 1946
66. Ferrari RJ, Rangayyan RM, Desautels JEL, Frère AF:Analysis of asymmetry in mammograms via directional filteringwith Gabor wavelets. IEEE Trans Med Imag 20(9):953–964, 2001
67. Manjunath BS, Ma WY: Texture features for browsingand retrieval of image data. IEEE Trans Pattern Anal MachIntell 18(8):837–842, 1996
630 RANGAYYAN ET AL.

68. Rao AR: A Taxonomy for Texture Description andIdentification, New York: Springer, 1990
69. Rao AR, Jain RC: Computerized flow field analysis:Oriented texture fields. IEEE Trans Pattern Anal Mach Intell 14(7):693–709, 1992
70. Peitgen H-O, Jürgens H, SaupeD: Chaos and Fractals: NewFrontiers of Science, 2nd edition. New York: Springer, 2004
71. Rangayyan RM, Nguyen TM: Fractal analysis of con-tours of breast masses in mammograms. J Digit Imaging 20(3):223–237, 2007
72. Bak P, Tang C, Wiesenfeld K: Self-organized criticality:An explanation of 1/f noise. Am Phys Soc 59:381–384, 1987
73. Lowen SB, Teich MC: Fractal renewal processesgenerate 1/f noise. Am Phys Soc 47:992–1001, 1993
74. Billock VA, De Guzman GC, Kelso JAS: Fractal timeand 1/f spectra in dynamic images and human vision. PhysicaD: Nonlinear Phenomena 148:136–146, 2001
75. Fortin C, Kumaresan R, Ohley W: Fractal dimension inthe analysis of medical images. IEEE Eng Med Biol Mag11:65–71, June 1992
76. Duda RO, Hart PE, Stork DG: Pattern Classification, 2ndedition. New York: Wiley-Interscience, 2001
77. Sahiner B, Chan H-P, Petrick N, Wagner RF, HadjiiskiL: Feature selection and classifier performance in computer-aided diagnosis: The effect of finite sample size. Med Phys 27(7):1509–1522, 2000
78. Nandi RJ, Nandi AK, Rangayyan RM, Scutt D:Classification of breast masses in mammograms using geneticprogramming and feature selection. Med Biol Eng Comput44:683–694, 2006
79. Ware JH, Mosteller F, Delgado F, Donnelly C, Ingel-finger JA: P values. In: Bailar III, JC, Mosteller F Eds. MedicalUses of Statistics. 2nd edition. Boston: NEJM Books, 1992, pp.181–200
80. Metz CE: ROC methodology in radiologic imaging.Invest Radiol 21:720–733, 1986
81. Metz CE: Basic principles of ROC analysis. Semin NuclMed VIII(4):283–298, 1978
82. Mu T, Nandi AK, Rangayyan RM: Classification ofbreast masses using selected shape, edge-sharpness, and texturefeatures with linear and kernel-based classifiers. J Digit Imaging21(2):153–169, 2008
83. Press WH, Teukolsky SA, Vetterling WT, Flannery BP:Numerical Recipes in C, 2nd edition. New Delhi: CambridgeUniversity Press, 1988
84. Bornefalk H, Hermansson AB: On the comparison ofFROC curves in mammography CAD systems. Med Phys 32(2):412–417, 2005
85. Miller H: The FROC curve: A representation of theobserver’s performance for the method of free response. JAcoust Soc Am 46(6B):1473–1476, 1969
86. Ramsey FL, Schafer DW: The Statistical Sleuth: ACourse in Methods of Data Analysis, Belmont: Duxbury Press,1997
87. Schalkoff R: Pattern Recognition: Statistical, Structuraland Neural Approaches, New York: Wiley, 199288. Haykin S: Neural Networks: A Comprehensive Founda-
tion, 2nd edition. Upper Saddle River: Prentice Hall, 199989. Wasserman PD: Advanced Methods in Neural Comput-
ing, New York: Van Nostrand Reinhold, 199390. Vapnik V: Statistical Learning Theory, New York:
Wiley, 199891. Schölkopf B, Smola AJ: Learning with Kernels—
Support Vector Machines, Regularization, Optimization, andBeyond, Cambridge: MIT Press, 200292. Fransens R, Prins JD, Gool LV: SVM-based nonpara-
metric discriminant analysis, an application to face detection.Proceedings of the Ninth IEEE International Conference onComputer Vision (ICCV 2003), volume 2. IEEE ComputerSociety, October 2003, pages 1289–129693. Burges CJC: A tutorial on support vector machines for
pattern recognition. Data Min Knowl Discov 2(2):121–167,199894. Alto H, Rangayyan RM, Paranjape RB, Desautels JEL,
Bryant H: An indexed atlas of digital mammograms forcomputer-aided diagnosis of breast cancer. Ann Télécommun58(5–6):820–835, 200395. Alberta Cancer Board, Alberta, Canada. Screen Test:
Alberta Program for the Early Detection of Breast Cancer—2001/03 Biennial Report, 2004. http://www.cancerboard.ab.ca/screentest96. ROCKIT: Kurt Rossmann Laboratories for Radiologic
Image Research. ROC Software. http://www-radiology.uchicago.edu/krl/roc_soft6.htm. Last accessed on July 20, 200997. Kundel HL, Berbaum K, Dorfman D, Gur D, Metz CE,
Swensson RG Eds. Journal of the ICRU. ICRU Report 79:Receiver Operating Characteristic Analysis in Medical Imaging,volume 8(1), Chapter 5. Extensions to Conventional ROCMethodology: LROC, FROC, and AFROC. Oxford: OxfordUniversity Press, April 2008, pp 31–3598. Chakraborty DP: Statistical power in observer-perform-
ance studies: Comparison of the receiver operating character-istic and free-response methods in tasks involving localization.Acad Radiol 9(2):147–156, 200299. Ferrari RJ, Rangayyan RM, Desautels JEL, Borges RA,
Frère AF: Automatic identification of the pectoral muscle inmammograms. IEEE Trans Med Imag 23:232–245, 2004100. Ferrari RJ, Rangayyan RM, Borges RA, Frère AF:
Segmentation of the fibroglandular disc in mammograms usingGaussian mixture modeling. Med Biol Eng Comput 42:378–387, 2004101. Li J, Yau WY, Wang H: Constrained nonlinear models
of fingerprint orientations with prediction. Pattern Recogn 39(1):102–114, 2006102. Kinsner W: A unified approach to fractal dimensions.
Proceedings of the Fourth IEEE International Conference onCognitive Informatics (ICCI), Irvine, CA, August 2005. IEEEComputer Society, pp 58–72
CAD OF ARCHITECTURAL DISTORTION IN PRIOR MAMMOGRAMS 631