Digitized Speech Transmission at VHF Using Existing FM Mobile Radios
Upload
independentCategory
view
4download
0
International Journal of Artificial Intelligence & Applications (IJAIA), Vol.1, No.3, July 2010
DOI : 10.5121/ijaia.2010.1301 1
AN EFFICIENT AUTOMATIC MASS CLASSIFICATION
METHOD IN DIGITIZED MAMMOGRAMS USING
ARTIFICIAL NEURAL NETWORK
Mohammed J. Islam1, Majid Ahmadi
2 and Maher A. Sid-Ahmed
3
{islam1l, ahmadi, ahmed}@uwindsor.ca
Department of Electrical and Computer Engineering, University of Windsor,
401 Sunset Avenue, Windsor, ON N9B 3P4, Canada
ABSTRACT
In this paper we present an efficient computer aided mass classification method in digitized
mammograms using Artificial Neural Network (ANN), which performs benign-malignant classification on
region of interest (ROI) that contains mass. One of the major mammographic characteristics for mass
classification is texture. ANN exploits this important factor to classify the mass into benign or malignant.
The statistical textural features used in characterizing the masses are mean, standard deviation, entropy,
skewness, kurtosis and uniformity. The main aim of the method is to increase the effectiveness and
efficiency of the classification process in an objective manner to reduce the numbers of false-positive of
malignancies. Three layers artificial neural network (ANN) with seven features was proposed for
classifying the marked regions into benign and malignant and 90.91% sensitivity and 83.87% specificity
is achieved that is very much promising compare to the radiologist's sensitivity 75%.
KEYWORDS
Artificial Neural Network, Digitized Mammograms, Texture Features
1. INTRODUCTION
Breast cancer continues to be a public health problem in the world specifically in western and
developed countries. In the European Union and the United States, it is the leading cause of
death for women in their 40’s [1] and second in Canada after lung cancer. In 2009, an estimated
22,700 Canadian women and 170 men were diagnosed with breast cancer and 5,400 women and
50 men died from it. Therefore, 1 in 9 women (11%) is expected to develop breast cancer during
her lifetime (by age 90) and 1 in 28 will die from it. Although the breast cancer occurrence rates
have increased over the years, breast cancer mortality has declined among women of all ages
[1]. This positive trend in mortality reduction may be associated with improvements made in
early detection of breast cancer, treatment at an earlier stage and the broad adoption of x-ray
mammography [1]. However, there still remains significant room for improvements to be made
in x-ray mammography since they are predominantly based on the ability of expert radiologists
in detecting abnormalities.
Mammography has been one of the most reliable methods for early detection of breast
carcinomas. X-ray mammography is currently considered as standard procedure for breast
cancer diagnosis. However, retrospective studies have shown that radiologists can miss the
detection of a significant proportion of abnormalities in addition to having high rates of false
positives. The estimated sensitivity of radiologists in breast cancer screening is only about 75%
[2]. Double reading has been suggested to be an effective approach to improve the sensitivity.
International Journal of Artificial Intelligence & Applications (IJAIA), Vol.1, No.3, July 2010
2
But it becomes costly because it requires twice as many radiologists' reading time. This cost will
be quite problematic considering the ongoing efforts to reduce costs of the health care system.
Cost effectiveness is one of the major requirements for a mass screening program to be
successful. The ultimate diagnosis of all types of breast disease depends on a biopsy. In most
cases the decision for a biopsy is based on mammography findings. Biopsy results indicate that
65-90% of suspected cancer detected by mammography turned out to be benign [3]. Therefore,
it would be valuable to develop a computer aided method for mass classification based on
extracted features from the region of interests (ROI) in mammograms. This would reduce the
number of unnecessary biopsies in patients with benign disease and thus avoid patients’
physical and mental suffering, with an added bonus of reducing healthcare costs. The principal
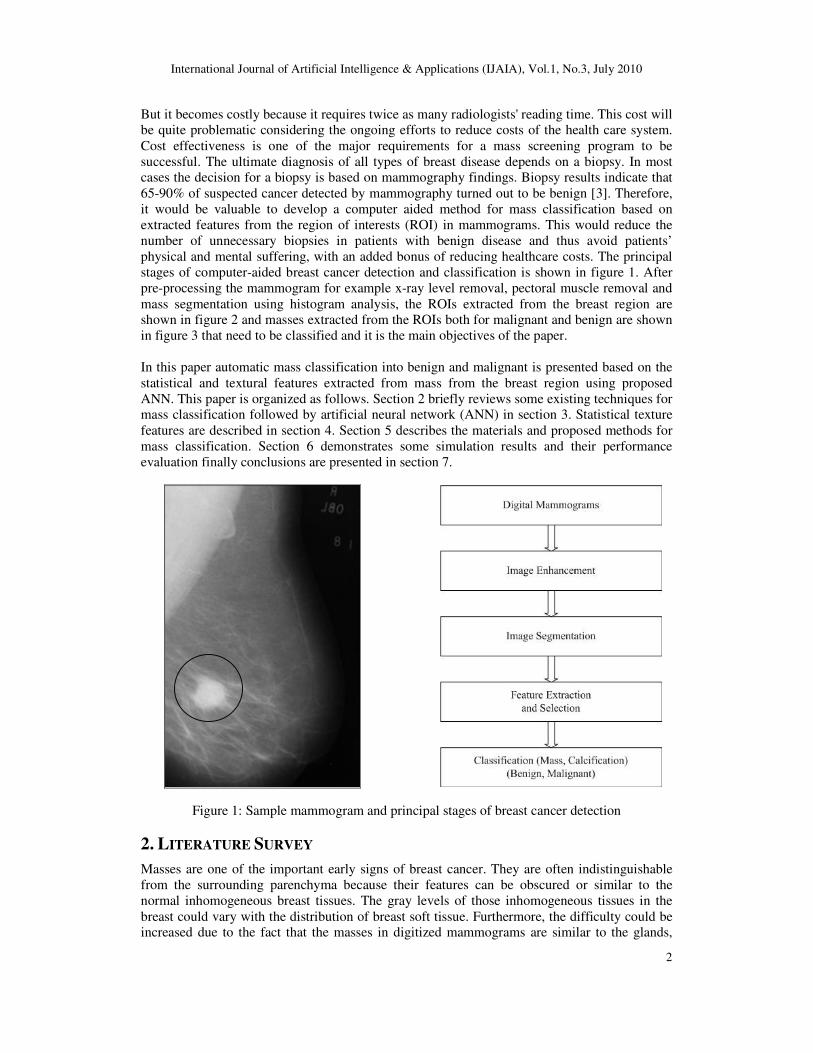
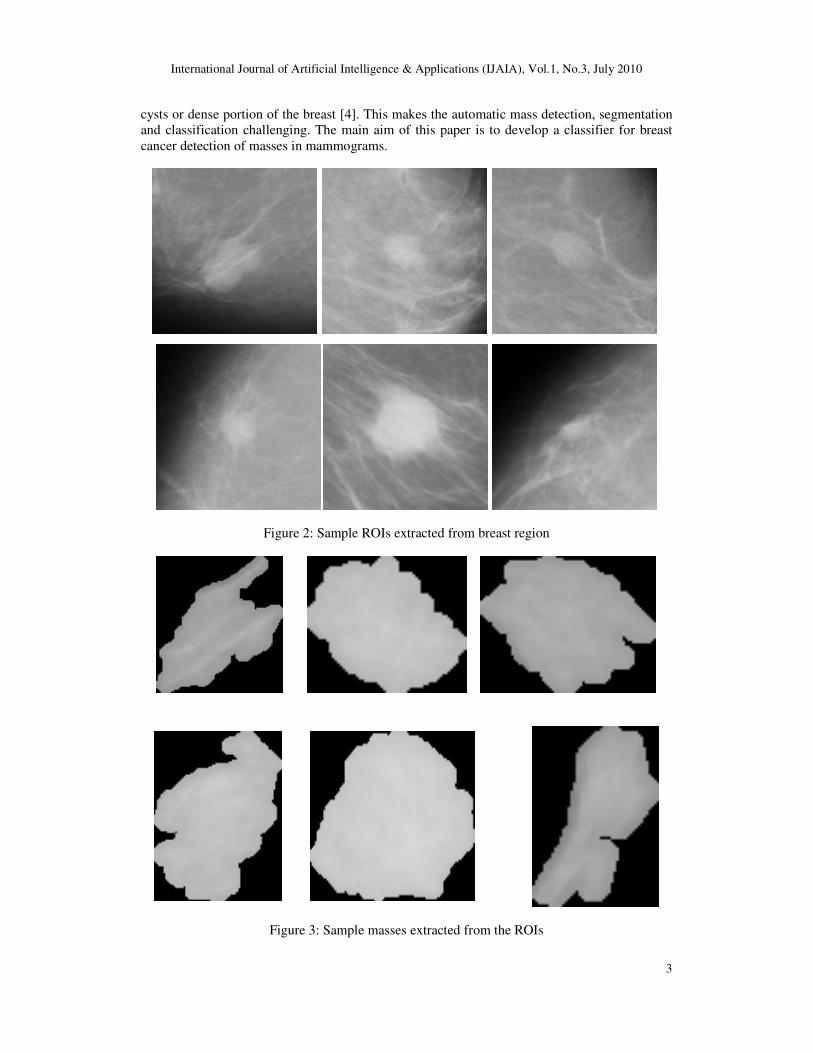
stages of computer-aided breast cancer detection and classification is shown in figure 1. After
pre-processing the mammogram for example x-ray level removal, pectoral muscle removal and
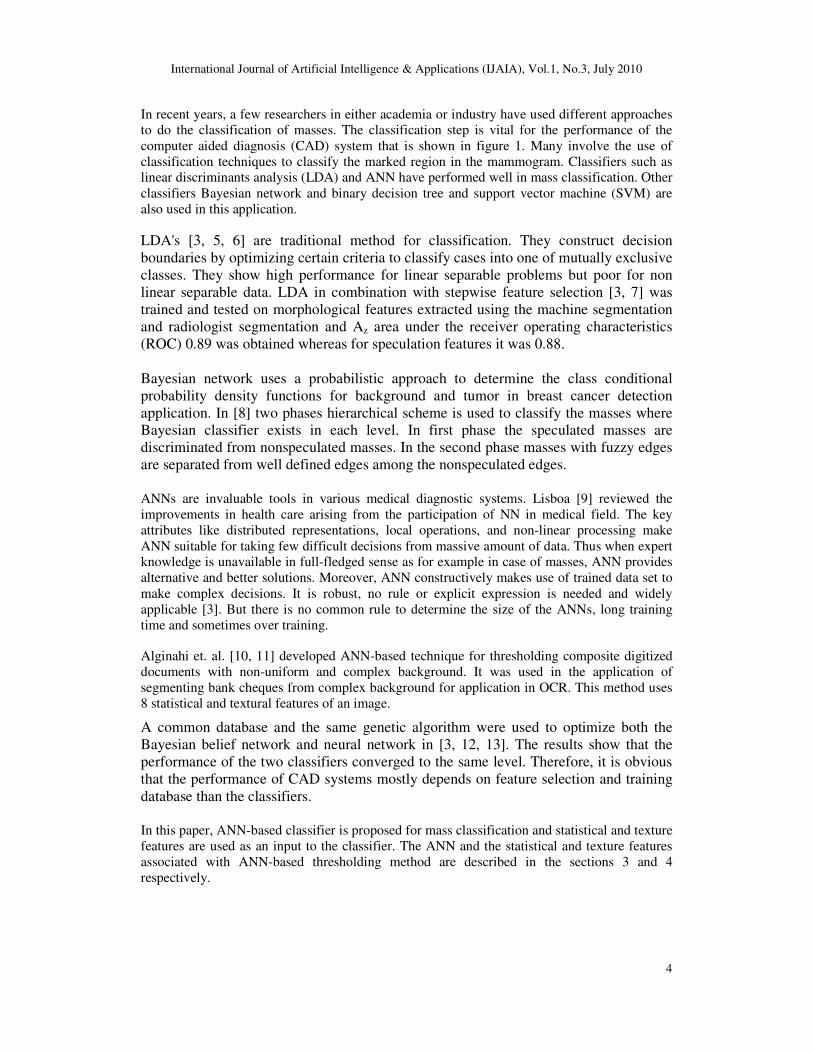
mass segmentation using histogram analysis, the ROIs extracted from the breast region are
shown in figure 2 and masses extracted from the ROIs both for malignant and benign are shown
in figure 3 that need to be classified and it is the main objectives of the paper.
In this paper automatic mass classification into benign and malignant is presented based on the
statistical and textural features extracted from mass from the breast region using proposed
ANN. This paper is organized as follows. Section 2 briefly reviews some existing techniques for
mass classification followed by artificial neural network (ANN) in section 3. Statistical texture
features are described in section 4. Section 5 describes the materials and proposed methods for
mass classification. Section 6 demonstrates some simulation results and their performance
evaluation finally conclusions are presented in section 7.
Figure 1: Sample mammogram and principal stages of breast cancer detection
2. LITERATURE SURVEY
Masses are one of the important early signs of breast cancer. They are often indistinguishable
from the surrounding parenchyma because their features can be obscured or similar to the
normal inhomogeneous breast tissues. The gray levels of those inhomogeneous tissues in the
breast could vary with the distribution of breast soft tissue. Furthermore, the difficulty could be
increased due to the fact that the masses in digitized mammograms are similar to the glands,
International Journal of Artificial Intelligence & Applications (IJAIA), Vol.1, No.3, July 2010
3
cysts or dense portion of the breast [4]. This makes the automatic mass detection, segmentation
and classification challenging. The main aim of this paper is to develop a classifier for breast
cancer detection of masses in mammograms.
Figure 2: Sample ROIs extracted from breast region
Figure 3: Sample masses extracted from the ROIs
International Journal of Artificial Intelligence & Applications (IJAIA), Vol.1, No.3, July 2010
4
In recent years, a few researchers in either academia or industry have used different approaches
to do the classification of masses. The classification step is vital for the performance of the
computer aided diagnosis (CAD) system that is shown in figure 1. Many involve the use of
classification techniques to classify the marked region in the mammogram. Classifiers such as
linear discriminants analysis (LDA) and ANN have performed well in mass classification. Other
classifiers Bayesian network and binary decision tree and support vector machine (SVM) are
also used in this application.
LDA's [3, 5, 6] are traditional method for classification. They construct decision
boundaries by optimizing certain criteria to classify cases into one of mutually exclusive
classes. They show high performance for linear separable problems but poor for non
linear separable data. LDA in combination with stepwise feature selection [3, 7] was
trained and tested on morphological features extracted using the machine segmentation
and radiologist segmentation and Az area under the receiver operating characteristics
(ROC) 0.89 was obtained whereas for speculation features it was 0.88.
Bayesian network uses a probabilistic approach to determine the class conditional
probability density functions for background and tumor in breast cancer detection
application. In [8] two phases hierarchical scheme is used to classify the masses where
Bayesian classifier exists in each level. In first phase the speculated masses are
discriminated from nonspeculated masses. In the second phase masses with fuzzy edges
are separated from well defined edges among the nonspeculated edges.
ANNs are invaluable tools in various medical diagnostic systems. Lisboa [9] reviewed the
improvements in health care arising from the participation of NN in medical field. The key
attributes like distributed representations, local operations, and non-linear processing make
ANN suitable for taking few difficult decisions from massive amount of data. Thus when expert
knowledge is unavailable in full-fledged sense as for example in case of masses, ANN provides
alternative and better solutions. Moreover, ANN constructively makes use of trained data set to
make complex decisions. It is robust, no rule or explicit expression is needed and widely
applicable [3]. But there is no common rule to determine the size of the ANNs, long training
time and sometimes over training.
Alginahi et. al. [10, 11] developed ANN-based technique for thresholding composite digitized
documents with non-uniform and complex background. It was used in the application of
segmenting bank cheques from complex background for application in OCR. This method uses
8 statistical and textural features of an image.
A common database and the same genetic algorithm were used to optimize both the
Bayesian belief network and neural network in [3, 12, 13]. The results show that the
performance of the two classifiers converged to the same level. Therefore, it is obvious
that the performance of CAD systems mostly depends on feature selection and training
database than the classifiers.
In this paper, ANN-based classifier is proposed for mass classification and statistical and texture
features are used as an input to the classifier. The ANN and the statistical and texture features
associated with ANN-based thresholding method are described in the sections 3 and 4
respectively.
International Journal of Artificial Intelligence & Applications (IJAIA), Vol.1, No.3, July 2010
5
3. ARTIFICIAL NEURAL NETWORK
ANN is a powerful classifier that represents complex input/ output relationships. It resembles
human brain in acquiring knowledge through learning and storing knowledge within inter-
neuron connection strengths. Commonly, ANN's synaptic weights are adjusted or trained so that
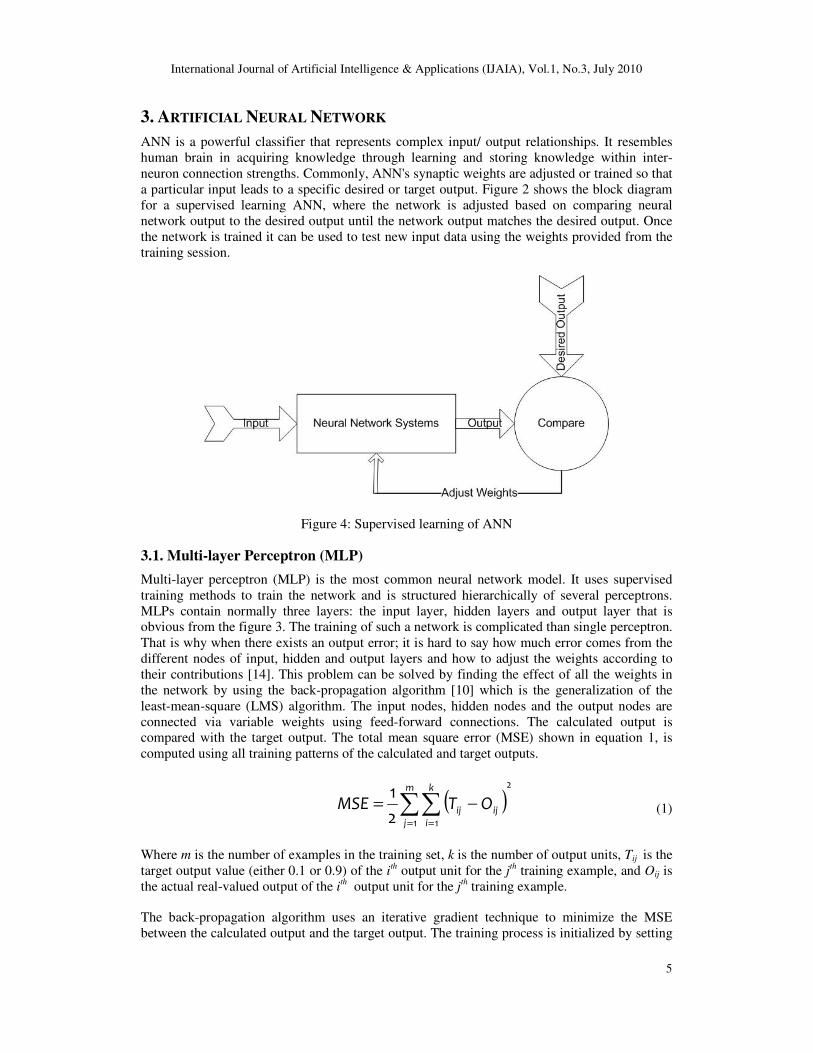
a particular input leads to a specific desired or target output. Figure 2 shows the block diagram
for a supervised learning ANN, where the network is adjusted based on comparing neural
network output to the desired output until the network output matches the desired output. Once
the network is trained it can be used to test new input data using the weights provided from the
training session.
Figure 4: Supervised learning of ANN
3.1. Multi-layer Perceptron (MLP)
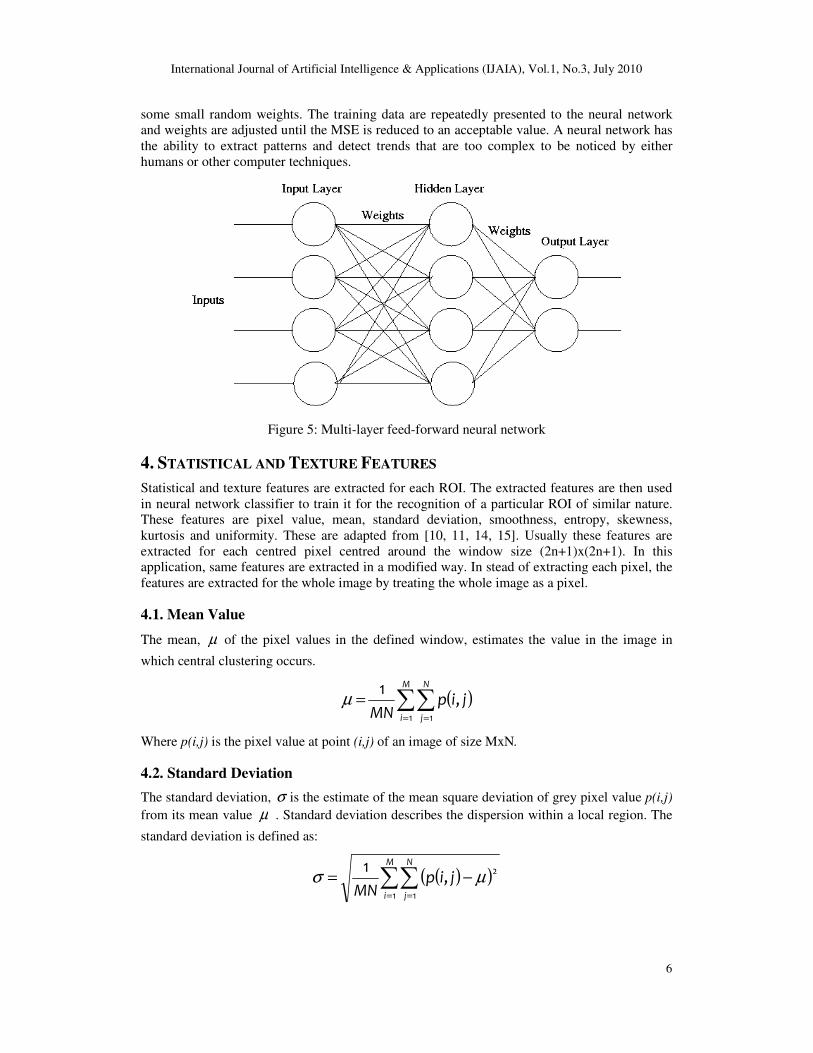
Multi-layer perceptron (MLP) is the most common neural network model. It uses supervised
training methods to train the network and is structured hierarchically of several perceptrons.
MLPs contain normally three layers: the input layer, hidden layers and output layer that is
obvious from the figure 3. The training of such a network is complicated than single perceptron.
That is why when there exists an output error; it is hard to say how much error comes from the
different nodes of input, hidden and output layers and how to adjust the weights according to
their contributions [14]. This problem can be solved by finding the effect of all the weights in
the network by using the back-propagation algorithm [10] which is the generalization of the
least-mean-square (LMS) algorithm. The input nodes, hidden nodes and the output nodes are
connected via variable weights using feed-forward connections. The calculated output is
compared with the target output. The total mean square error (MSE) shown in equation 1, is
computed using all training patterns of the calculated and target outputs.
( )2
1 12
1∑∑
= =
−=m
j
k
i
ijij OTMSE (1)
Where m is the number of examples in the training set, k is the number of output units, Tij is the
target output value (either 0.1 or 0.9) of the ith output unit for the jth training example, and Oij is
the actual real-valued output of the ith output unit for the j
th training example.
The back-propagation algorithm uses an iterative gradient technique to minimize the MSE
between the calculated output and the target output. The training process is initialized by setting
International Journal of Artificial Intelligence & Applications (IJAIA), Vol.1, No.3, July 2010
6
some small random weights. The training data are repeatedly presented to the neural network
and weights are adjusted until the MSE is reduced to an acceptable value. A neural network has
the ability to extract patterns and detect trends that are too complex to be noticed by either
humans or other computer techniques.
Figure 5: Multi-layer feed-forward neural network
4. STATISTICAL AND TEXTURE FEATURES
Statistical and texture features are extracted for each ROI. The extracted features are then used
in neural network classifier to train it for the recognition of a particular ROI of similar nature.
These features are pixel value, mean, standard deviation, smoothness, entropy, skewness,
kurtosis and uniformity. These are adapted from [10, 11, 14, 15]. Usually these features are
extracted for each centred pixel centred around the window size (2n+1)x(2n+1). In this
application, same features are extracted in a modified way. In stead of extracting each pixel, the
features are extracted for the whole image by treating the whole image as a pixel.
4.1. Mean Value
The mean, µ of the pixel values in the defined window, estimates the value in the image in
which central clustering occurs.
( )∑∑= =
=M
i
N
j
jipMN 1 1
,1
µ
Where p(i,j) is the pixel value at point (i,j) of an image of size MxN.
4.2. Standard Deviation
The standard deviation, σ is the estimate of the mean square deviation of grey pixel value p(i,j)
from its mean value µ . Standard deviation describes the dispersion within a local region. The
standard deviation is defined as:
( )( )∑∑= =
−=M
i
N
j
jipMN 1 1
2,1
µσ

International Journal of Artificial Intelligence & Applications (IJAIA), Vol.1, No.3, July 2010
7
4.3. Smoothness
Relative smoothness, R is a measure of grey level contrast that can be used to establish
descriptors of relative smoothness.
21
11
σ+−=R
Where, σ is the standard deviation of the image.
4.4. Entropy
Entropy, h can also be used to describe the distribution variation in a region. Overall entropy of
the image can be calculated as:
( )∑−
=
−=1
02 PrlogPr
L
k
kkh
Where, kPr is the probability of the k-th grey level, which can be calculated as MxN
Zk , kZ is
the total number of pixels with the k-th grey level and L is the total number of grey levels.
4.5. Skewness
Skewness, S characterizes the degree of asymmetry of a pixel distribution in the specified
window around its mean. Skewness is a pure number that characterizes only the shape of the
distribution.
( )∑∑
= =
−=
M
i
N
j
jip
MNS
1 1
3,1
σ
µ
Where, ),( jip is the pixel value at point (i,j), µ and σ are the mean and standard deviation
respectively.
4.6. Kurtosis
Kurtosis, K measures the peakness or flatness of a distribution relative to a normal distribution.
The conventional definition of kurtosis is:
( )3
,1
1 1
4
−
−= ∑∑
= =
M
i
N
j
jip
MNK
σ
µ
Where, ),( jip is the pixel value at point (i,j), µ and σ are the mean and standard deviation
respectively. The -3 term makes the value zero for a normal distribution.
4.7. Uniformity
Uniformity, U is a texture measure based on histogram and is defined as:
∑−
=
=1
0
2PrL
k
kU
Where, kPr is the probability of the k-th grey level. Because the kPr have values in the range [0,
1] and their sum equals 1, U is maximum in which all grey levels are equal, and decreases from
International Journal of Artificial Intelligence & Applications (IJAIA), Vol.1, No.3, July 2010
8
there. Before computing any of the descriptive texture features above, the pixel values of the
image were normalized by dividing each pixel by 255 in order to achieve computational
consistency.
5. PROPOSED METHODS
ANN exploits the major mammographic characteristics texture to classify the mass into benign
or malignant. To fulfil the objectives of this paper ANN uses mean, standard deviation, entropy,
skewness, kurtosis and uniformity that is described in section 4. These 7 features are used in
preparing the training data for multi-layer perceptron (MLP) neural network which are obtained
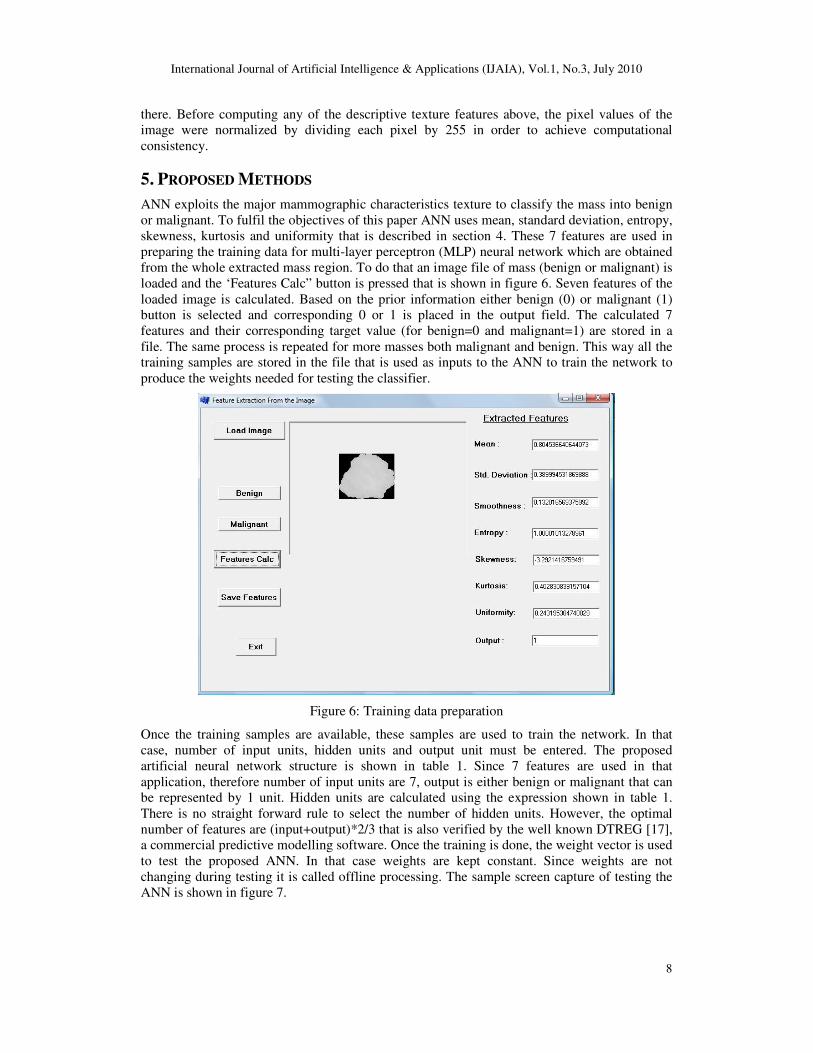
from the whole extracted mass region. To do that an image file of mass (benign or malignant) is
loaded and the ‘Features Calc” button is pressed that is shown in figure 6. Seven features of the
loaded image is calculated. Based on the prior information either benign (0) or malignant (1)
button is selected and corresponding 0 or 1 is placed in the output field. The calculated 7
features and their corresponding target value (for benign=0 and malignant=1) are stored in a
file. The same process is repeated for more masses both malignant and benign. This way all the
training samples are stored in the file that is used as inputs to the ANN to train the network to
produce the weights needed for testing the classifier.
Figure 6: Training data preparation
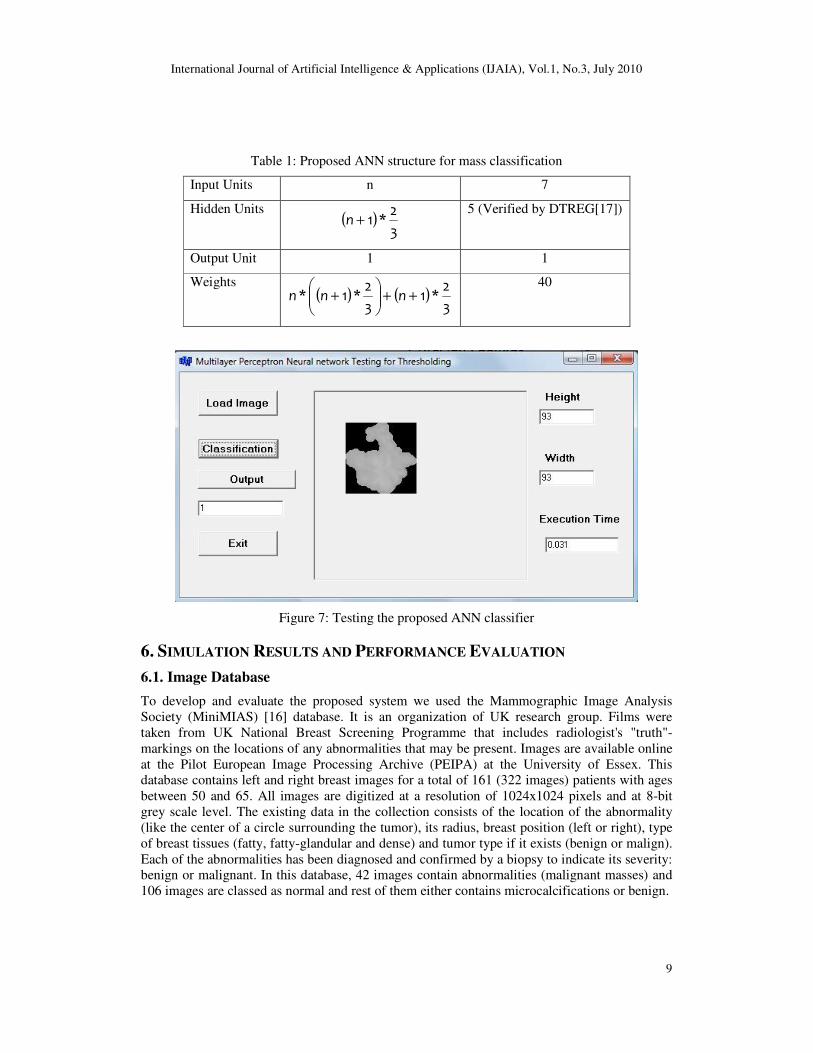
Once the training samples are available, these samples are used to train the network. In that
case, number of input units, hidden units and output unit must be entered. The proposed
artificial neural network structure is shown in table 1. Since 7 features are used in that
application, therefore number of input units are 7, output is either benign or malignant that can
be represented by 1 unit. Hidden units are calculated using the expression shown in table 1.
There is no straight forward rule to select the number of hidden units. However, the optimal
number of features are (input+output)*2/3 that is also verified by the well known DTREG [17],
a commercial predictive modelling software. Once the training is done, the weight vector is used
to test the proposed ANN. In that case weights are kept constant. Since weights are not
changing during testing it is called offline processing. The sample screen capture of testing the
ANN is shown in figure 7.
International Journal of Artificial Intelligence & Applications (IJAIA), Vol.1, No.3, July 2010
9
Table 1: Proposed ANN structure for mass classification
Input Units n 7
Hidden Units ( )
3
2*1+n
5 (Verified by DTREG[17])
Output Unit 1 1
Weights ( ) ( )
3
2*1
3
2*1* ++
+ nnn
40
Figure 7: Testing the proposed ANN classifier
6. SIMULATION RESULTS AND PERFORMANCE EVALUATION
6.1. Image Database
To develop and evaluate the proposed system we used the Mammographic Image Analysis
Society (MiniMIAS) [16] database. It is an organization of UK research group. Films were
taken from UK National Breast Screening Programme that includes radiologist's "truth"-
markings on the locations of any abnormalities that may be present. Images are available online
at the Pilot European Image Processing Archive (PEIPA) at the University of Essex. This
database contains left and right breast images for a total of 161 (322 images) patients with ages
between 50 and 65. All images are digitized at a resolution of 1024x1024 pixels and at 8-bit
grey scale level. The existing data in the collection consists of the location of the abnormality
(like the center of a circle surrounding the tumor), its radius, breast position (left or right), type
of breast tissues (fatty, fatty-glandular and dense) and tumor type if it exists (benign or malign).
Each of the abnormalities has been diagnosed and confirmed by a biopsy to indicate its severity:
benign or malignant. In this database, 42 images contain abnormalities (malignant masses) and
106 images are classed as normal and rest of them either contains microcalcifications or benign.
International Journal of Artificial Intelligence & Applications (IJAIA), Vol.1, No.3, July 2010
10
6.2. Results and Performance
The table 1 shows the proposed ANN structure. The proposed structure has 3 layers comprised
of 7 units in input layer, 5 units in hidden layer and 1 unit in the output layer. 5 units in hidden
layer are optimal number of hidden layers that is verified by the DTREG commercial software
[17]. Therefore, the total weights become 40. Total 69 correctly segmented masses are used for
classification where 25% images are used for training and 75% are used for testing purpose and
the overall classification for benign is 83.87% and for malignant 90.91% that is shown in table
2.
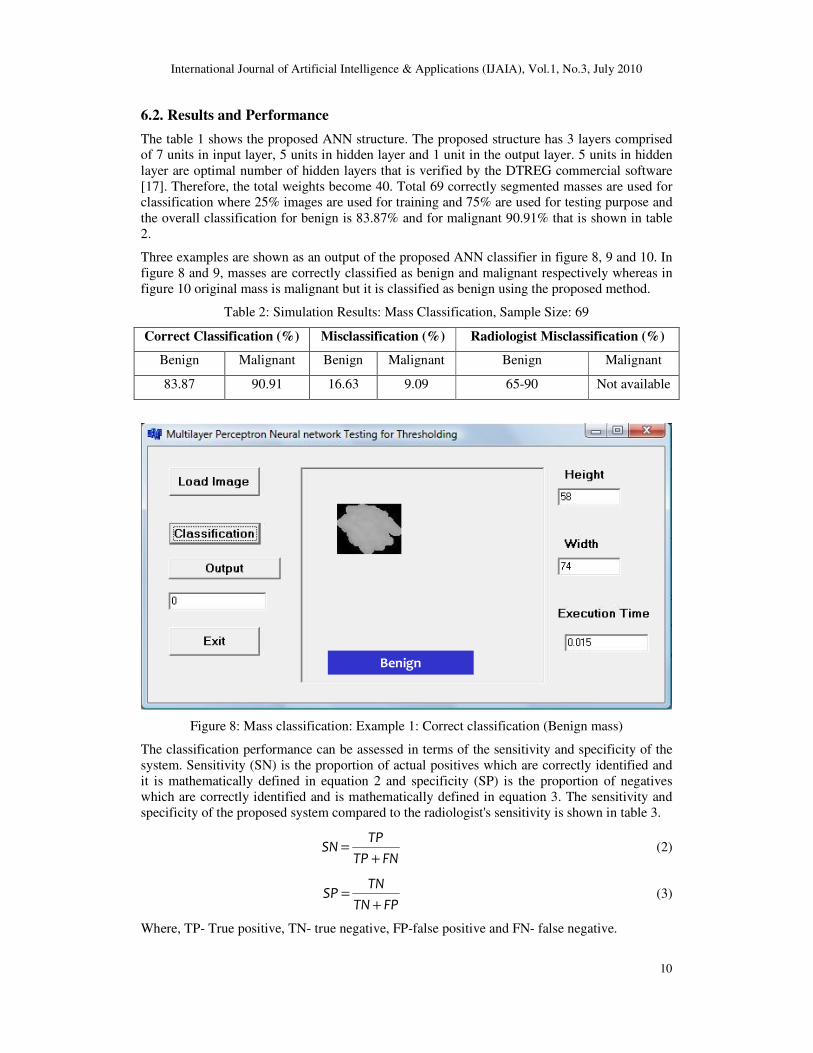
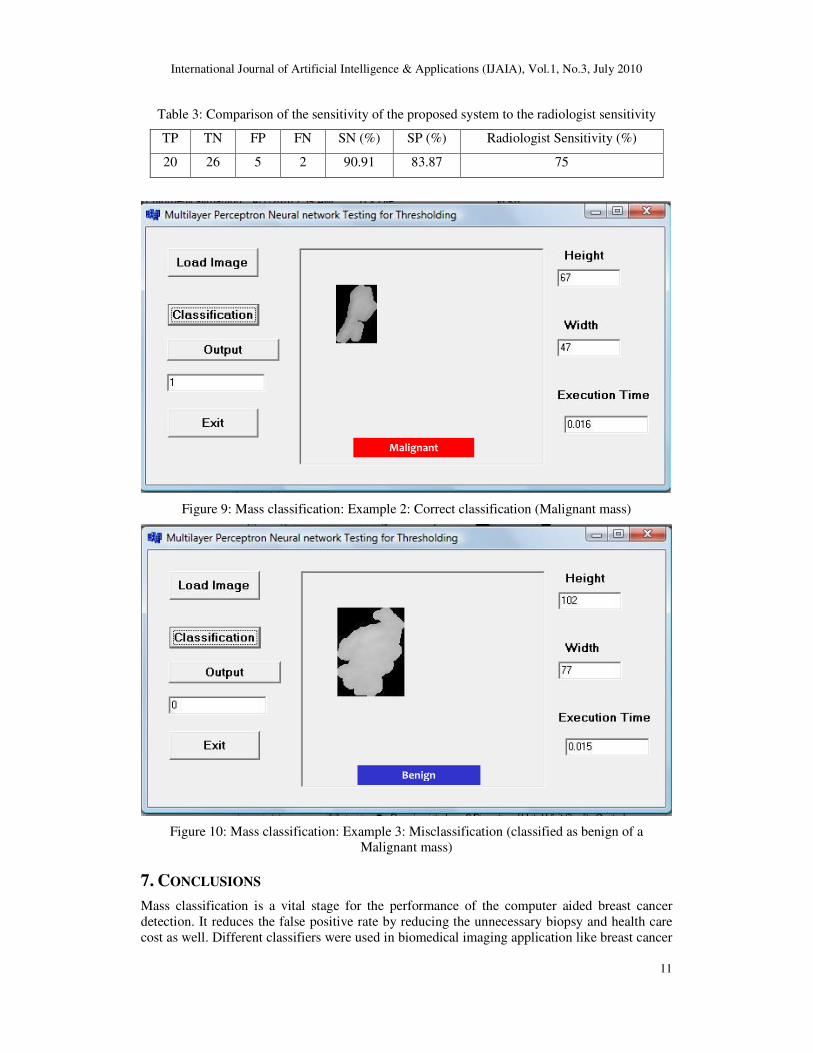
Three examples are shown as an output of the proposed ANN classifier in figure 8, 9 and 10. In
figure 8 and 9, masses are correctly classified as benign and malignant respectively whereas in
figure 10 original mass is malignant but it is classified as benign using the proposed method.
Table 2: Simulation Results: Mass Classification, Sample Size: 69
Correct Classification (%) Misclassification (%) Radiologist Misclassification (%)
Benign Malignant Benign Malignant Benign Malignant
83.87 90.91 16.63 9.09 65-90 Not available
Figure 8: Mass classification: Example 1: Correct classification (Benign mass)
The classification performance can be assessed in terms of the sensitivity and specificity of the
system. Sensitivity (SN) is the proportion of actual positives which are correctly identified and
it is mathematically defined in equation 2 and specificity (SP) is the proportion of negatives
which are correctly identified and is mathematically defined in equation 3. The sensitivity and
specificity of the proposed system compared to the radiologist's sensitivity is shown in table 3.
FNTP
TPSN
+= (2)
FPTN
TNSP
+= (3)
Where, TP- True positive, TN- true negative, FP-false positive and FN- false negative.
Benign
International Journal of Artificial Intelligence & Applications (IJAIA), Vol.1, No.3, July 2010
11
Table 3: Comparison of the sensitivity of the proposed system to the radiologist sensitivity
TP TN FP FN SN (%) SP (%) Radiologist Sensitivity (%)
20 26 5 2 90.91 83.87 75
Figure 9: Mass classification: Example 2: Correct classification (Malignant mass)
Figure 10: Mass classification: Example 3: Misclassification (classified as benign of a
Malignant mass)
7. CONCLUSIONS
Mass classification is a vital stage for the performance of the computer aided breast cancer
detection. It reduces the false positive rate by reducing the unnecessary biopsy and health care
cost as well. Different classifiers were used in biomedical imaging application like breast cancer
Malignant
Benign
International Journal of Artificial Intelligence & Applications (IJAIA), Vol.1, No.3, July 2010
12
detection from mammograms. However, ANN shows very good performance in medical
diagnostic systems. In this paper, an artificial neural network of 3 layers is proposed for mass
classification. The performance of the proposed structure is evaluated in terms of efficiency,
adaptability and robustness. Computational time is around 15~20 ms for each mass
classification. It was evaluated on 69 images containing malignant and benign masses with
different size, shape and contrast. The algorithm works properly in all cases and the proposed
structure was evaluated with and without preliminary denoising steps. In both cases results are
found to be comparable. Using the proposed ANN classifier, 90.91% sensitivity and 83.87%
specificity is achieved which is very much encouraging compare to the radiologist's sensitivity
75%.
ACKNOWLEDGEMENT
This research has been financially supported by Ontario Student Assistance Program through
Ontario Graduate Scholarship (OGS), Casino Windsor Cares/Gail Rosenblum Memorial Breast
Cancer Research Scholarships and Research Centre for Integrated Microsystems (RCIM) of
University of Windsor. The financial support of these organizations is greatly acknowledged
with appreciation.
REFERENCES
[1] A. Oliver, J. Freixenet, R. Marti, J. Pont, E. Perez, E.R.E. Denton, R. Zwiggelaar, (2008) “A novel
breast tissue density classification methodology”, IEEE Transactions on Information Technology in
Biomedicine, Vol. 12, No.1, pp. 55-65.
[2] R.E. Bird (1990) “Professional quality assurance for mammography screening programs”, Journal of
Radiology, Vol. 175, pp. 587-605.
[3] H.D. Cheng, X.J. Shi, R. Min, L.M. Hu, X.P. Cai, H.N. Du (2006) “Approaches for automated
detection and classification of masses in mammograms”, Pattern Recognition, Vol. 39, pp. 646-668.
[4] S.C. Yang, C.M. Wany et.al. (2005) “A Computer-aided system for mass detection and classification
in digitized mammograms”, Journal of Biomedical Engineering- Applications, Basis and
Communications, Vol. 17, pp. 215-228.
[5] R. O. Duda, P. E. Hart, D. G. Stork (2001), Pattern Classification, John Wiley and Sons, second
edition.
[6] H.P. Chan, D. Wei, M.A. Helvie, B. Sahiner et.al. (1995) “Computer-aided classification of
mammographic masses and normal tissue: linear discriminant analysis in texture feature space”,
Journal of Physics in Medicine and Biology, Vol. 40, pp. 857-876.
[7] B. Sahiner, N. Petrick, H.P. Chan (2001) “Computer-aided characterization of mammographic
masses: accuracy of mass segmentation and its effects on characterization”, IEEE Trans. Med.
Imaging, Vol. 20, No. 12, pp. 1275–1284.
[8] J.L. Viton, M. Rasigni, G. Rasigni, A. Liebaria (1996) “Method for characterizing masses in digital
mammograms”, Opt. Eng., Vol. 35, No. 12, pp. 3453–3459.
[9] P.J.G. Lisboa, (2000) “A review of evidence of health benefits from artificial neural networks in
medical intervention”, Neural Networks, Vol. 15, pp. 11-39.
[10] Y. Alginahi (2004) “Computer analysis of composite documents with non-uniform background”,
PhD Thesis, Electrical and Computer Engineering, University of Windsor, Windsor, ON, Canada.
[11] Y. Alginahi (2008) “Thresholding and character recognition in security documents with watermarked
background”, Proc. Int. Conf. on Digital Image Computing: Techniques and Applications, pp. 220-
225.
[12] B. Zheng, Y.H. Chang, X.H. Wang, W.F. Good (1999) “Comparison of artificial neural network and
Bayesian belief network in a computer assisted diagnosis scheme for mammography”, IEEE
International Conference on Neural Networks, pp. 4181–4185.
[13] B. Sahiner, H.P. Chan, N. Petrick, M.A. Helvie, M.M. Goodsitt (1998) “Design of a high-sensitivity
classifier based on a genetic algorithm: application to computer-aided diagnosis”, Phys. Med. Biol.
Vol. 43, No. 10, pp. 2853–2871.
[14] M.A. Sid-Ahmed (1995) “Image processing theory, algorithms and architectures”, McGraw-Hill,
New York, 1st edition.
International Journal of Artificial Intelligence & Applications (IJAIA), Vol.1, No.3, July 2010
13
[15] Y. Alginahi, M.A. Sid-Ahmed and M. Ahmadi (2004) “Local thresholding of composite documents
using Multi-layer Perceptron Neural Network”, in 47th
IEEE International Midwest Symposium on
Circuits and Systems, pp. 209-212.
[16] J. Suckling et al. (1994) “The Mammographic Image Analysis Society Digital Mammogram
Database Excerpta Medica”, International Congress Series, Vol. 1069, pp. 375-378.
[17] DTREG, http://www.dtreg.com
Mohammed J. Islam was born in Comilla, Bangladesh on June 1, 1975. He
received the BSc. (Hon's) and MSc. in Electronics and Computer Science in 1995
and 1996 respectively from Shahjalal University of Science and Technology, Sylhet,
Bangladesh. He received MASc in Electrical and Computer Engineering from
Ryerson University, Toronto, ON, Canada, in 2003. Currently he is doing PhD in
Electrical and Computer Engineering at University of Windsor, Windsor, ON,
Canada. The author is the IEEE student member and the member of International
Association of Engineers (IAENG) and member of Professional Engineers Ontario
(PEO). His research interests include but not limited to machine learning and
computer vision, image processing and document image analysis.
Majid Ahmadi received the B.Sc. degree in electrical engineering from Arya Mehr
University, Tehran, Iran, in 1971 and the Ph.D. degree in electrical engineering from
Imperial College of London University, London, UK, in 1977. He has been with the
Department of Electrical and Computer Engineering, University of Windsor,
Windsor, Ontario, Canada, since 1980, currently as University Professor and
Director of Research Center for Integrated Microsystems. His research interests
include digital signal processing, machine vision, pattern recognition, neural network
architectures, applications, and VLSI implementation, computer arithmetic, and
MEMS. He has co-authored the book Digital Filtering in 1 and 2 dimensions; Design
and Applications (New York: Plennum, 1989) and has published over 400 articles in these areas. He is the
Regional Editor for the Journal of Circuits, Systems and Computers and Associate Editor for the Journal
of Pattern Recognition, and the International; Journal of Computers and Electrical Engineering.
Maher A. Sid-Ahmed was born in Alexandria, Egypt, in March 1945. He received
the BASc. degree in Electrical Engineering from the University of Alexandria, Egypt,
in 1968 and the Ph.D. degree in Electrical Engineering from the University of
Windsor, Windsor, Ontario, Canada, in 1974. After graduation, he worked at the
Alberta Government telephones and the University of Alexandria, Egypt. He joined
University of Windsor in 1978 as a faculty member and is presently the department
head for the ECE program. Dr. Sid-Ahmed holds four US patents, published a book
on Image processing with McGraw-Hill and authored and co-authored over 100
papers. His areas of interest include image processing, robotic vision, pattern recognition and Improved
Definition Television
Copyright © 2022 FDOKUMEN