Green citrus detection using ‘eigenfruit’, color and circular Gabor texture features under...
10
Green citrus detection using ‘eigenfruit’, color and circular Gabor texture features under natural outdoor conditions Ferhat Kurtulmus a , Won Suk Lee b,⇑ , Ali Vardar a a Department of Biosystems Engineering, Faculty of Agriculture, Uludag University, 16059 Bursa, Turkey b Department of Agricultural and Biological Engineering, Rogers Hall, Museum Road, University of Florida, Gainesville, FL 32611, USA article info Article history: Received 17 December 2010 Received in revised form 28 June 2011 Accepted 1 July 2011 Keywords: Computer vision Eigenfruit Fruit detection Green citrus Precision agriculture Yield mapping abstract A machine vision algorithm was developed to detect and count immature green citrus fruits in natural canopies using color images. A total of 96 images were acquired in October 2010 from an experimental citrus grove in the University of Florida, Gainesville, Florida. Thirty-two of the total 96 images were selected randomly and used for training the algorithm, and 64 images were used for validation. Color, cir- cular Gabor texture analysis and a novel ‘eigenfruit’ approach (inspired by the ‘eigenface’ face detection and recognition method) were used for green citrus detection. A shifting sub-window at three different scales was used to scan the entire image for finding the green fruits. Each sub-window was classified three times by eigenfruit approach using intensity component, eigenfruit approach using saturation com- ponent, and circular Gabor texture. Majority voting was performed to determine the results of the sub- window classifiers. Blob analysis was performed to merge multiple detections for the same fruit. For the validation set, 75.3% of the actual fruits were successfully detected using the proposed algorithm. Ó 2011 Elsevier B.V. All rights reserved. 1. Introduction Florida is the number one citrus producing state in the United States, and the citrus industry is a major part of Florida’s agricul- tural economy. In 2007–2008, Florida accounted for 70% of the to- tal US citrus production (USDA-NASS, 2008). Due to in-field spatial variability such as tree size, soil type, soil fertility and water con- tent, citrus growers encounter unpredictable costs for managing crop production. Precision agriculture techniques can help them by coping with these in-field spatial variabilities. Yield mapping is considered to be the first technology or tool to be implemented for adopting precision agriculture. Yield maps are very useful, since they can provide many benefits to citrus growers such as adjusting site-specific management practices. Currently most yield maps are created at the mature stage of the citrus fruits when or after they are harvested. Earlier estimation of citrus yield can provide many advantages to citrus producers, such as adjusting site-specific management practices to increase yield and planning harvesting operations well in advance to reduce harvesting costs. However, immature citrus fruits are green and it is difficult to distinguish them from background green canopies because the leaves and fruits have very similar color. In natural canopies, occlusion of fruit by leaves, branches, and other fruits, and non-uniform illumination in outdoor conditions are major obstacles for on-tree green citrus detection by machine vision. Computer vision and image processing techniques are com- monly used to recognize fruits for yield mapping systems. Many researchers worked on citrus and other fruit detection systems using these techniques. Parrish and Goksel (1977) investigated the feasibility of an automated apple robot harvesting system based on pattern recognition techniques using a black-and-white TV cam- era. They used gelatin color filters in front of the TV camera lens to gain red and green color dimensions. Pla et al. (1993) worked on detecting spherical objects using an artificial light source, and tested their detection method for citrus fruits. They used flash lamps and a black–white camera to take an intensity image of the scene that must have concave surfaces where a fruit was present. They reported that their system recognized oranges at the initial stages of maturity. Under artificial illumination conditions, their system yielded 75% and 8% of success and false detection rates, respectively. Stajnko et al. (2004) used thermal imaging method, and developed an algorithm to estimate number and diameter of apple fruits. They calculated normalized difference index and per- formed histogram based pixel separation. They evaluated results of their algorithm via regression analysis between manually counted fruits and fruit count by the algorithm. In their experi- ments, correlation coefficients were between 0.83 and 0.88. Regu- nathan and Lee (2005) developed a machine vision system using color information for detecting mature oranges. Using hue and sat- uration, they performed Fisher’s discriminant analysis, neural 0168-1699/$ - see front matter Ó 2011 Elsevier B.V. All rights reserved. doi:10.1016/j.compag.2011.07.001 ⇑ Corresponding author. Tel.: +1 352 392 1864x227; fax: +1 352 392 4092. E-mail address: wslee@ufl.edu (W.S. Lee). Computers and Electronics in Agriculture 78 (2011) 140–149 Contents lists available at ScienceDirect Computers and Electronics in Agriculture journal homepage: www.elsevier.com/locate/compag
Transcript of Green citrus detection using ‘eigenfruit’, color and circular Gabor texture features under...

Computers and Electronics in Agriculture 78 (2011) 140–149
Contents lists available at ScienceDirect
Computers and Electronics in Agriculture
journal homepage: www.elsevier .com/locate /compag
Green citrus detection using ‘eigenfruit’, color and circular Gabor texture featuresunder natural outdoor conditions
Ferhat Kurtulmus a, Won Suk Lee b,⇑, Ali Vardar a
a Department of Biosystems Engineering, Faculty of Agriculture, Uludag University, 16059 Bursa, Turkeyb Department of Agricultural and Biological Engineering, Rogers Hall, Museum Road, University of Florida, Gainesville, FL 32611, USA
a r t i c l e i n f o a b s t r a c t
Article history:Received 17 December 2010Received in revised form 28 June 2011Accepted 1 July 2011
Keywords:Computer visionEigenfruitFruit detectionGreen citrusPrecision agricultureYield mapping
0168-1699/$ - see front matter � 2011 Elsevier B.V. Adoi:10.1016/j.compag.2011.07.001
⇑ Corresponding author. Tel.: +1 352 392 1864x227E-mail address: [email protected] (W.S. Lee).
A machine vision algorithm was developed to detect and count immature green citrus fruits in naturalcanopies using color images. A total of 96 images were acquired in October 2010 from an experimentalcitrus grove in the University of Florida, Gainesville, Florida. Thirty-two of the total 96 images wereselected randomly and used for training the algorithm, and 64 images were used for validation. Color, cir-cular Gabor texture analysis and a novel ‘eigenfruit’ approach (inspired by the ‘eigenface’ face detectionand recognition method) were used for green citrus detection. A shifting sub-window at three differentscales was used to scan the entire image for finding the green fruits. Each sub-window was classifiedthree times by eigenfruit approach using intensity component, eigenfruit approach using saturation com-ponent, and circular Gabor texture. Majority voting was performed to determine the results of the sub-window classifiers. Blob analysis was performed to merge multiple detections for the same fruit. For thevalidation set, 75.3% of the actual fruits were successfully detected using the proposed algorithm.
� 2011 Elsevier B.V. All rights reserved.
1. Introduction
Florida is the number one citrus producing state in the UnitedStates, and the citrus industry is a major part of Florida’s agricul-tural economy. In 2007–2008, Florida accounted for 70% of the to-tal US citrus production (USDA-NASS, 2008). Due to in-field spatialvariability such as tree size, soil type, soil fertility and water con-tent, citrus growers encounter unpredictable costs for managingcrop production. Precision agriculture techniques can help themby coping with these in-field spatial variabilities. Yield mappingis considered to be the first technology or tool to be implementedfor adopting precision agriculture. Yield maps are very useful, sincethey can provide many benefits to citrus growers such as adjustingsite-specific management practices. Currently most yield maps arecreated at the mature stage of the citrus fruits when or after theyare harvested. Earlier estimation of citrus yield can provide manyadvantages to citrus producers, such as adjusting site-specificmanagement practices to increase yield and planning harvestingoperations well in advance to reduce harvesting costs. However,immature citrus fruits are green and it is difficult to distinguishthem from background green canopies because the leaves andfruits have very similar color. In natural canopies, occlusion of fruitby leaves, branches, and other fruits, and non-uniform illumination
ll rights reserved.
; fax: +1 352 392 4092.
in outdoor conditions are major obstacles for on-tree green citrusdetection by machine vision.
Computer vision and image processing techniques are com-monly used to recognize fruits for yield mapping systems. Manyresearchers worked on citrus and other fruit detection systemsusing these techniques. Parrish and Goksel (1977) investigatedthe feasibility of an automated apple robot harvesting system basedon pattern recognition techniques using a black-and-white TV cam-era. They used gelatin color filters in front of the TV camera lens togain red and green color dimensions. Pla et al. (1993) worked ondetecting spherical objects using an artificial light source, andtested their detection method for citrus fruits. They used flashlamps and a black–white camera to take an intensity image of thescene that must have concave surfaces where a fruit was present.They reported that their system recognized oranges at the initialstages of maturity. Under artificial illumination conditions, theirsystem yielded 75% and 8% of success and false detection rates,respectively. Stajnko et al. (2004) used thermal imaging method,and developed an algorithm to estimate number and diameter ofapple fruits. They calculated normalized difference index and per-formed histogram based pixel separation. They evaluated resultsof their algorithm via regression analysis between manuallycounted fruits and fruit count by the algorithm. In their experi-ments, correlation coefficients were between 0.83 and 0.88. Regu-nathan and Lee (2005) developed a machine vision system usingcolor information for detecting mature oranges. Using hue and sat-uration, they performed Fisher’s discriminant analysis, neural

F. Kurtulmus et al. / Computers and Electronics in Agriculture 78 (2011) 140–149 141
networks, and Bayesian classification to find fruit pixels. Watershedtransformation and blob analysis were conducted to determinefruit count and sizes. Chinchuluun and Lee (2006) also developeda machine vision system based on color separation to detect maturecitrus fruits as a part of their citrus yield mapping system. Usingred–green–blue (RGB) and hue-saturation-intensity (HSI) colormodels, K-means clustering was used to classify fruit pixels. Theyalso performed gamma correction to decrease the effect of unevenillumination conditions. They evaluated success of the proposedalgorithm by using regression analysis between manually countedfruits and the fruits counted by their algorithm. The correlationcoefficient was 0.83 between the number of fruits counted and hu-man observation. Hannan et al. (2009) used color segmentation andcircle detection methods for identifying mature oranges. They con-ducted color thresholding and perimeter-based circle detection todetect fruits. Using relatively distinctive color features of the ma-ture fruits, their algorithm could detect more than 90% of the fruitsin the images with a false detection rate of 4%.
Some studies have been reported for the green fruit detection.Annamalai and Lee (2004) conducted a research to distinguishgreen citrus fruits from leaves according to their spectral differ-ences using a spectrophotometer in a laboratory. They measureddiffuse reflectance of the green citrus fruit and leaf samples to findcritical wavelengths for developing a real-time spectral-basedyield mapping system. Zhao et al. (2005) developed a machine vi-sion system using a pair of stereo cameras, color and texture fea-tures for detecting green and red apples. They applied circledetection methods to the blobs obtained by redness color datafor increasing detection rate. They did not report success rate ofthe proposed algorithm. Kane and Lee (2007) used multi-spectralimaging, and developed image processing system based on pixelclassification for green citrus detection. Using a NIR camera, theycaptured images at different wavelengths and carried out an indexcalculation method to merge those images. They could successfullyclassify 84.5% of the fruit pixels using multi-spectral imaging.Okamoto and Lee (2009) used hyperspectral imaging method todetect green fruits on tree. Using index calculation of the imagesat different wavebands, detection success of the developed systemwas about 89%. Wachs et al. (2009) also conducted a research fordetecting green and red apples using color and thermal imagingtechniques. They used Haar-like features and Viola-Jones classifier(Viola and Jones, 2004) to detect fruit sub-windows. Most of thesestudies investigated mature or green fruits detection using multi-spectral, hyperspectral and thermal imaging techniques, whichuse high-priced equipments. It is necessary to develop a moreaffordable method for immature green citrus detection using con-ventional color images.
Within computer vision and image processing research activi-ties and applications, many studies focused on detection and rec-ognition of objects such as human faces, pedestrians, handgestures and license plates. Eigenface approach was developed bySirovich and Kirby (1987) and used by Turk and Pentland (1991)for human face classification. This approach was one of the firstsuccessful methods for face detection and recognition. They imi-tated human visual system for recognizing human faces using prin-cipal component analysis (PCA). Texture plays a key role in humanvision. Gabor texture features are mostly used in the field of tex-ture analysis. Zhang et al. (2002) proposed rotation invariant circu-lar Gabor filters for texture analysis by expanding regular Gaborfilters. By inspiring those approaches, ‘eigenfruit’ term for fruitdetection was presented in this study, and rotation invariant circu-lar Gabor texture features were used as part of the green citrusdetection algorithm.
The goal of this study was to develop a computer vision methodto detect green citrus fruits in natural outdoor tree canopies usingconventional color images. This study proposed the use of color,
shape and texture features together to detect immature green cit-rus fruits, including scanning an image using a sub-window, andmerging results of different classifiers with majority voting.
2. Material and method
2.1. Image acquisition
For developing and testing proposed algorithm, images were ac-quired in the natural daylight illumination conditions using a typ-ical digital camera (Powershot SD880IS, Canon) with a resolutionof 3648 � 2736 pixels from citrus trees. At the green stage of theimmature citrus fruits, a total of 96 images were taken in 1 weekperiod at various times in October 2010 from an experimental cit-rus grove in the University of Florida, Gainesville, Florida. The vari-ety used in this study was Orlando Tangelo. The fruit scenes wererandomly selected from natural citrus canopy on the sunny side oftrees and also shadow side. Size of the actual scene of the capturedimages was approximately 33 � 25 cm. The purpose of this studywas to demonstrate the concept of green citrus detection algo-rithm using only color images, so image samples were resized to800 � 600 pixels for computational convenience. For resizingimages, a bicubic interpolation method was used in this study.
2.2. Overview of the proposed algorithm
The fruit detection algorithm proposed in this research con-sisted of scanning a citrus tree image by a square sub-window atthree different sizes. In the training set, fruit diameters varied fromabout 130–210 pixels, so 130 � 130, 180 � 180 and 210 � 210 pix-els of sub-window sizes were selected in order to identify all fruitsizes in the canopy scenes. A sub-window was a square sub-regionto take any local part of an entire image. The scanning process wascarried out by shifting the sub-window over an entire image. Theshifting step in the experiments was a 20 pixel increment for hor-izontal and vertical directions due to computational convenience.This value was an acceptable increment not to skip any distinctivefruit regions for the used image sets.
Color thresholding-based background elimination was per-formed before the sub-window identification. The classifiers ofthe proposed algorithm were eigenfruit of intensity component,eigenfruit of saturation component, and circular Gabor textureanalysis. Each sub-window was tested separately by these threeclassifiers, which were described in detail in the following sections.Majority voting approach was used for merging results of the clas-sifiers. Two positive votes were enough to determine the sub-win-dow to be a fruit. After decision by the majority voting, a binaryimage was used to locate detection centers. The identified centersof positive detections were marked using blobs on the binary im-age. These blobs were solid circles representing detection centers.For merging multiple detections for the same fruit and countingthe number of fruits, blob analysis was performed. The blob anal-ysis included finding final blobs created by touching circular blobsrepresenting detection centers. It also determined new centers ofthe final blobs by its major axis. After blob analysis, connectedblobs were treated as a single blob and the total number of theblobs provided the number of fruits in the image. Flow diagramof the proposed algorithm is shown in Fig. 1.
2.3. Illumination enhancement
To cope with illumination change in natural outdoor scenes andto enhance image illumination, histogram equalization and loga-rithm transform were applied to intensity component in HSI colorspace as pre-processing. The logarithm transform is a well-known

Fig. 1. Flow diagram of the proposed green citrus detection algorithm.
142 F. Kurtulmus et al. / Computers and Electronics in Agriculture 78 (2011) 140–149
method in image processing, and many researcher used this tech-nique for illumination enhancement (Savvides and Kumar, 2003;Vishwakarma et al., 2009; Cheng et al., 2010). As stated by Chenet al. (2006), the logarithm transform expands the dark pixelvalues. The mathematical expression of the logarithm transformis given by:
I0 ¼ logðI0Þ ð1Þ
where I0 and I’ represent the input image and logarithm image,respectively.
2.4. Background elimination using color histogram
Even though there are not so much distinctive color differencesbetween green fruits and natural canopy (background), histogram

F. Kurtulmus et al. / Computers and Electronics in Agriculture 78 (2011) 140–149 143
distributions of different color components were investigated forfruit and background samples in HSI, luminance-chrominance inblue-chrominance in red (YCbCr), and RGB color models. Forobserving histograms of the samples, fruit and background sam-ples were manually cropped from images in the training set, andtwo mosaic images were separately created for fruit and back-ground samples by sorting the samples in the image. Backgroundcolor of the mosaic images was black. Samples for backgroundwere selected randomly including leaves, twigs, soil and sky pixels.In Cb, Cr and H components, a little color differences were found.Using histograms of the mosaic images, thresholds for backgroundpixels were found, and a binary mask image (1 for background, 0for fruit pixels) representing background pixels was created. Sinceelimination of the sub-window was based on number of back-ground pixels, value 1 was used to represent background pixels.
In scanning process, a pixel ratio of the number of white pixelsto the number of all pixels in the sub-window was used to deter-mine whether the sub-window was fruit or background, and there-by to eliminate that sub-window. A circular region of interest (ROI)was defined as a maximum circle inside the square sub-window,and was used for excluding background pixels at the corners ofthe sub-window due to circular shapes of the fruits. Namely, thepixels at the corners of the sub-window were not taken into con-sideration when calculating the pixel ratio. Sub-windows whosepixel ratio exceeded a threshold were eliminated.
2.5. Eigenfruit approach
Due to its similarity to human perception, the eigenface ap-proach based on PCA, is a well-known method for face recognitionand detection. Since it had been proposed by Turk and Pentland(1991), many studies were conducted in face detection–recogni-tion using this approach (Wong et al., 2001; Bae and Kim, 2005;Sharma et al., 2010). Usually, the human perception can easily dis-tinguish any pre-known face in spite of viewing conditions, aging,and some occlusions such as glasses, beards or changes in hairstyle. Fruit detection tasks also have similar obstacles due to occlu-sion. In any natural outdoor canopy scene, it can be seen that a lotof fruits are occluded by leaves, twigs and other fruits. In this re-gard, it was considered that this approach could provide robust-ness for fruit detection. In this study, this approach was called‘eigenfruit’ instead of eigenface. Its mathematical background isexplained below.
In this study, the method proposed by Turk and Pentland (1991)was followed to develop eigenfruit classifier which was a part ofthe fruit detection algorithm based on the eigenface approach.The eigenfruit method represents a fruit image as a linear combi-nation of ortho-normal vectors called eigenfruits. The eigenfruitsare eigenvectors of covariance matrix in a training set consistedof fruit images. Let I be N� N fruit image. Any image can be consid-ered as N2 � 1 vector, and let’s illustrate it with C. Suppose wehave a training set C1, C2, ..., CM. Then the average of the set is de-fined by:
W ¼ 1M
XM
n¼1
Cn: ð2Þ
The difference from the mean image can be calculated by Eq. (3)for each fruit image. An example mean fruit image and eigenfruitare shown in Fig. 2.
Ui ¼ Ci �W; ð3Þ
where Ui is a vector including differences of all training imagesfrom the mean. And, number of these vectors are M. If these vectorsare concatenated horizontally, the matrix A = [U1, U2, . . ., UM ] can beobtained. The PCA can help find N ortho-normal vectors, un, best
representing the distribution of the data. The kth vector, uk, is cho-sen such that:
kk ¼1M
XM
n¼1
ðuTkUnÞ2 ð4Þ
is a maximum, subject to:
uTl uk ¼
1; if l ¼ k
0; otherwise
�ð5Þ
where uk and kk are the eigenvectors and eigenvalues of the covari-ance matrix C, respectively. The covariance matrix is calculated by:
C ¼ 1M
XM
n¼1
UnUTn ¼ AAT
: ð6Þ
The eigenvectors of C = AAT were calculated according to Turkand Pentland (1991). The eigenvectors create a fruit space, andprojection given any fruit image C into this fruit space can be de-scribed by Eqs. (7) and (8).
xk ¼ uTkðC�WÞ ð7Þ
Uf ¼XK
i¼1
xiui; ð8Þ
where xk is the weight of the image, and each fruit Ui in the train-ing set can be represented as a linear combination of K eigenvectors,and Uf is a projected image in the fruit space.
Illustration of the fruit space and projection concept can be seenin Fig. 3.
As illustrated in Fig. 3, the distance from fruit space (dffs) wasused for deciding whether any given image was fruit or not. Thedffs is a similarity measurement between the images in the train-ing set and the fruit candidate image. In this study, Euclidean dis-tance, given by Eq. (9), was calculated to measure magnitude ofthis similarity.
ed ¼ kU�Uf k ð9Þ
For a given image C, it is expected that the dffs must be a smal-ler value for fruit images. If ed was smaller than a threshold, the im-age C was accepted as a fruit for the eigenfruit classifier of theproposed algorithm. In this study, a training set was used to findthresholds for both eigenfruit classifier of the intensity componentand eigenfruit classifier of the saturation component. For finding athreshold, different thresholds values were tried and found foreach image in the training set. An average of those thresholdswas the threshold of the eigenfruit classifier.
2.6. Training of the eigenfruit classifiers
In the preliminary works of this study, citrus tree images cap-tured in natural outdoor conditions were observed by decompos-ing them to different color components in different color spacessuch as HSI, YCbCr, and RGB. It was found that saturation compo-nent in HSI color space provided a distinctive feature for fruits par-tially saturated by sunlight as shown in Fig. 4.
In the proposed algorithm, two types of eigenfruit classifierswere used. The first one was an eigenfruit approach using intensitycomponent (representing gray level image) in HSI color space, andthe other was an eigenfruit approach using saturation componentin HSI color space. That means that training process was performedfor these two classifiers separately using intensity and saturationcomponents in the same manner. The following are common stepsexplaining both eigenfruit classifiers.
As mentioned in previous section, it can be understood that theeigenfruit approach does not require training samples for leaves

Fig. 2. Illustration of mean fruit image and eigenfruit image: (a) mean fruit image and (b) eigenfruit image representing the first eigenvector.
Fig. 3. Projection of an image into fruit space and distance from fruit space.
144 F. Kurtulmus et al. / Computers and Electronics in Agriculture 78 (2011) 140–149
and branches. It measures the similarity of the given sample totraining samples only for fruit. While the eigenfruit approach is arobust method for detecting occluded objects, it does not requireoccluded training samples because of the fact that the detectingprocess is based on similarity to ideal fruit shape. For training ofthe eigenfruit classifiers, 72 non-occluded fruit images from 32natural citrus canopy images were manually cropped and centered.All training images were resized to a resolution of 36 � 36 pixelsand normalized by intensity range of the pixels to provide similarillumination conditions. The eigenfruit calculation steps were per-formed for training samples, and eigenvectors, means and imageweights were stored for testing of the algorithm.
Fig. 4. A citrus tree canopy image and its sa
2.7. Circular Gabor texture analysis for texture classifier
Texture plays an important role for human perception. There-fore, we also used a texture classifier for green citrus detection.In computer vision research, there are many feature extractionmethods for texture. Gabor texture analysis has been developedand used by many researchers since Gabor (1946) proposed a 1-D Gabor function (Weldon et al., 1996; Li and Staunton, 2008;Xiaohua et al., 2009). Zhang et al. (2002) proposed rotation invari-ant texture segmentation by expanding traditional 2-D Gabor fil-ters. They modified traditional Gabor filter into a circularsymmetric version. Example illustrations of the traditional andthe circular Gabor functions are shown in Fig. 5.
In this study, rotation invariant texture segmentation was usedsimilarly to the method in Zhang et al. (2002). The construction ofthe circular Gabor function and its differences from its traditionalversions was not the focus of this paper, and more informationabout Gabor functions can be found in Zhang and Lu (2000),Arivazhagan et al. (2006), and Han and Ma (2007). Following arethe definitions of the circular Gabor filter:
Gðx; yÞ ¼ gðx; yÞ expð2piFðffiffiffiffiffiffiffiffiffiffiffiffiffiffiffix2 þ y2
pÞÞ ð10Þ
gðx; yÞ ¼ 12pr2 expð�ðx2 þ y2Þ=2r2Þ; ð11Þ
turation component in HSI color space.

Fig. 5. Example illustrations of: (a) the traditional and (b) the circular Gabor functions (Zhu et al., 2004).
F. Kurtulmus et al. / Computers and Electronics in Agriculture 78 (2011) 140–149 145
where g(x, y) is a Gaussian function, x and y are matrix indices, r is ascale parameter, F is frequency of the function, and i is imaginaryunit. In this study, the parameter selection was made similarly toZhang et al. (2002). By convolving the input image with the circularGabor function, filtered image was obtained as described in Eq. (12).
/ ¼ Gðx; yÞ � I; ð12Þ
where U is the filtered image, G(x, y) is the circular Gabor function,� is a convolution operator, and I is an input image. Once thefiltered image was obtained, it contained complex numbers.
Fig. 6. Images having different illumination conditions: (a) an image from sun
Fig. 7. Effect of illumination enhancement method used in this study: (a)
Magnitude of the output was found by taking its absolute values.And by taking its standard deviation, the circular Gabor texture fea-ture rG was calculated by Eq. (13).
rG ¼ffiffiffiffiffiffiffiffiffiffiffiffiffiffiffiffiffiffiffiffiffiffiffiffiffiffiffiffiffiffiffiffiffiffiffiffiffiffiffiffiffiffiffiffiffiffiffiffiffiffiffiffiffiffiffiffiffiffiffiffiffiffiffiffiffiffiffiffiffiffi
1m� n� 1
Xx
Xy
ðj/ðx; yÞj � /Þ2s
ð13Þ
The x and y are matrix indices, and m and n are matrix sizes.Fruit detection decision was made by thresholding. If the rG waslower than the threshold, the sub-window was accepted as a fruitby circular Gabor texture classifier.
ny side of the canopy and (b) an image from shadow side of the canopy.
before and (b) after logarithm transform and histogram equalization.

146 F. Kurtulmus et al. / Computers and Electronics in Agriculture 78 (2011) 140–149
2.8. Adaptive thresholding for the circular Gabor texture feature
In this study, a constant threshold was investigated for theGabor texture feature. However, it was observed that an optimalGabor texture threshold was different for each image. A regressionanalysis was performed to find an adaptive threshold equationrelated with standard deviation of an entire filtered natural canopyimage. By observing texture features of fruit regions in the trainingset, appropriate texture thresholds were found for each image, andcorresponding standard deviations were calculated. A linear equa-tion was obtained between standard deviations of the filteredimages and texture thresholds.
2.9. Experiments
In this study, all algorithm development steps and experimentswere performed on MATLAB version 7.10.0.499 (R2010a) with a
Fig. 8. Histogram plots of Cb, Cr and H components, respectively.
32-Bit Intel� Core™ 2 Duo P8400 2.26 GHz CPU. In order to developand train the proposed algorithm, 32 randomly selected imagesfrom the total 96 images were used as a training set. To train theeigenfruit classifiers, 72 fruit images were manually prepared fromthe training set. Experiments were conducted on the training set toobtain thresholds and aforementioned parameters (scale parame-ter r and frequency of the function F) of the algorithm. To testthe algorithm, 64 images were used as a validation set, to whichthe proposed algorithm was applied. Detection results were evalu-ated by correct fruit identification. While total number of fruit,false positives (mistakes) and missing fruits were manuallycounted and recorded, the proposed algorithm was able to providethe number of fruits automatically.
3. Results and discussions
3.1. Illumination variabilities and enhancement
The images acquired for this study had different illuminationconditions. Example images taken from two different conditions(shadow and sunny sides of a tree canopy) are shown in Fig. 6. Aresulting image of the logarithm transform and histogram equal-ization is shown in Fig. 7. As seen in Fig. 7, darker areas in the ori-ginal image have better illumination after the logarithm transformand histogram equalization, and more details can be observed.
3.2. Results for color separation
The histogram-based color analysis provided some differencesbetween fruit and background samples in Cb, Cr, and H color com-ponents. The histograms of those color components are shown inFig. 8. Although the histogram curves of the fruit and backgroundsamples are highly overlapped, some distinctive areas under thebackground curves at the left and right sides of the graphs canbe observed. The thresholds values for background in Cb, Cr, andH components were 132, 102 and 86, respectively. An example bin-ary image which was created using these small differences isshown in Fig. 9. Illustration of the circular ROI used for counting in-side background pixels are also shown.
3.3. Circular Gabor texture filter and adaptive thresholding
Using the circular Gabor texture filter, a texture classifier forsub-windows was developed according to relatively homogenous
Fig. 9. An example binary image representing background pixels, sub-window andcircular ROI.
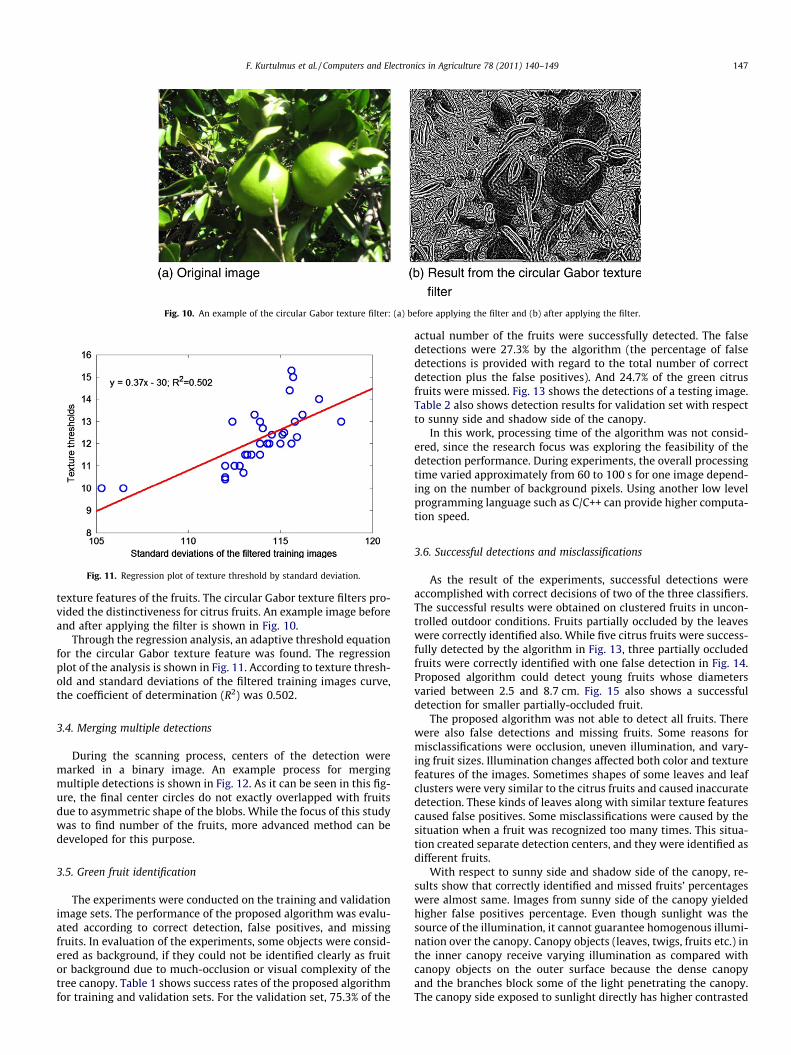
Fig. 10. An example of the circular Gabor texture filter: (a) before applying the filter and (b) after applying the filter.
Fig. 11. Regression plot of texture threshold by standard deviation.
F. Kurtulmus et al. / Computers and Electronics in Agriculture 78 (2011) 140–149 147
texture features of the fruits. The circular Gabor texture filters pro-vided the distinctiveness for citrus fruits. An example image beforeand after applying the filter is shown in Fig. 10.
Through the regression analysis, an adaptive threshold equationfor the circular Gabor texture feature was found. The regressionplot of the analysis is shown in Fig. 11. According to texture thresh-old and standard deviations of the filtered training images curve,the coefficient of determination (R2) was 0.502.
3.4. Merging multiple detections
During the scanning process, centers of the detection weremarked in a binary image. An example process for mergingmultiple detections is shown in Fig. 12. As it can be seen in this fig-ure, the final center circles do not exactly overlapped with fruitsdue to asymmetric shape of the blobs. While the focus of this studywas to find number of the fruits, more advanced method can bedeveloped for this purpose.
3.5. Green fruit identification
The experiments were conducted on the training and validationimage sets. The performance of the proposed algorithm was evalu-ated according to correct detection, false positives, and missingfruits. In evaluation of the experiments, some objects were consid-ered as background, if they could not be identified clearly as fruitor background due to much-occlusion or visual complexity of thetree canopy. Table 1 shows success rates of the proposed algorithmfor training and validation sets. For the validation set, 75.3% of the
actual number of the fruits were successfully detected. The falsedetections were 27.3% by the algorithm (the percentage of falsedetections is provided with regard to the total number of correctdetection plus the false positives). And 24.7% of the green citrusfruits were missed. Fig. 13 shows the detections of a testing image.Table 2 also shows detection results for validation set with respectto sunny side and shadow side of the canopy.
In this work, processing time of the algorithm was not consid-ered, since the research focus was exploring the feasibility of thedetection performance. During experiments, the overall processingtime varied approximately from 60 to 100 s for one image depend-ing on the number of background pixels. Using another low levelprogramming language such as C/C++ can provide higher computa-tion speed.
3.6. Successful detections and misclassifications
As the result of the experiments, successful detections wereaccomplished with correct decisions of two of the three classifiers.The successful results were obtained on clustered fruits in uncon-trolled outdoor conditions. Fruits partially occluded by the leaveswere correctly identified also. While five citrus fruits were success-fully detected by the algorithm in Fig. 13, three partially occludedfruits were correctly identified with one false detection in Fig. 14.Proposed algorithm could detect young fruits whose diametersvaried between 2.5 and 8.7 cm. Fig. 15 also shows a successfuldetection for smaller partially-occluded fruit.
The proposed algorithm was not able to detect all fruits. Therewere also false detections and missing fruits. Some reasons formisclassifications were occlusion, uneven illumination, and vary-ing fruit sizes. Illumination changes affected both color and texturefeatures of the images. Sometimes shapes of some leaves and leafclusters were very similar to the citrus fruits and caused inaccuratedetection. These kinds of leaves along with similar texture featurescaused false positives. Some misclassifications were caused by thesituation when a fruit was recognized too many times. This situa-tion created separate detection centers, and they were identified asdifferent fruits.
With respect to sunny side and shadow side of the canopy, re-sults show that correctly identified and missed fruits’ percentageswere almost same. Images from sunny side of the canopy yieldedhigher false positives percentage. Even though sunlight was thesource of the illumination, it cannot guarantee homogenous illumi-nation over the canopy. Canopy objects (leaves, twigs, fruits etc.) inthe inner canopy receive varying illumination as compared withcanopy objects on the outer surface because the dense canopyand the branches block some of the light penetrating the canopy.The canopy side exposed to sunlight directly has higher contrasted

Fig. 13. Detected fruits by the proposed algorithm.
Fig. 15. A detection result for smaller partially-occluded fruit.
Fig. 12. Steps of merging multiple detections: (a) multiple detections, (b) binary image representing detection centers and (c) resulting image.
Fig. 14. Some detections of occluded fruits, missing fruits and one false positive.
Table 1Results of the proposed algorithm with respect to detection performance.
Fruitcount
Correctlyidentified
False positives Missed
Amount % Amount % Amount %
Trainingset
83 68 81.9 4 5.5 15 18.1
Validationset
166 125 75.3 47 27.3 41 24.7
Table 2Results for the validation set with respect to sunny side and shadow side of thecanopy.
Fruitcount
Correctly identified(%)
False positives(%)
Missed(%)
Sunny side 61 75.4 40.3 24.6Shadow
side105 75.2 16.8 24.8
148 F. Kurtulmus et al. / Computers and Electronics in Agriculture 78 (2011) 140–149
regions rather than shadow side of the canopy. For this reason,false negative rate was a higher value (40.3%) at the sunny sideof the canopy.
In the experiments, some fruits could not be detected as a resultof negative votes of the classifiers. At least two incorrect negativevotes of the classifiers were enough to skip a fruit sub-window.Besides, some fruit surfaces had regions highly similar to leaves’
color. Therefore, some fruit sub-windows were recognized as back-ground, and they were skipped. One of the reasons for missingfruits was the blob analysis. For some images including fruits soclose or occluded by each other, the blobs representing more thanone fruit touched each other. These touching blobs were identifiedas one fruit.
While the proposed algorithm yielded successful results formost fruits occluded by leaves and twigs, some much-occluded

F. Kurtulmus et al. / Computers and Electronics in Agriculture 78 (2011) 140–149 149
fruit regions could not be detected successfully. In Fig. 14, some oc-cluded missing and true positives are shown.
The images captured in natural outdoor conditions had sometexture differences which were difficult to control due to visualcomplexity of the background and varying sizes of the fruits. Dueto the illumination change, the texture classifier misclassifiedsome sub-windows. In training of the circular Gabor texture classi-fier, optimal thresholds were determined subjectively based on thetraining set.
Using proposed algorithm, 75.3% of the actual number of thefruits were correctly identified. Okamoto and Lee (2009) were ableto find about 89% of the fruits using a hyperspectral fruit identifi-cation method which uses more expensive equipment.
According to results of the experiments, correct detection rateswere not enough to estimate yield of the fruit. However, resultshave a great importance for showing possibility of green citrusdetection using regular color images. Despite of higher false posi-tive rates of sunny side of the canopy, percentages of correctlyidentified fruits were almost same for both sides. It also shows fea-sibility of green citrus detection under outdoor conditions.
4. Conclusions
A green citrus detection algorithm using color images wasdeveloped. To use color, texture and shape information by histo-gram based separation, circular Gabor texture features and eigen-fruit approaches were implemented in the proposed algorithm.Majority voting method was used for combining the results ofthe classifiers. Multiple detections were merged using blob analy-sis technique. Using natural canopy images, experiments were con-ducted and the results were evaluated.
In this study, used feature extraction methods were novel forgreen citrus detection using just color images. The eigenfruit ap-proach has a potential for extracting shape information of thegreen fruits in natural canopy which has confused visual featuresdue to complex structure of the leaves. It can be also concludedthat circular Gabor texture can be a useful method for identifyingfruit texture regions in the natural canopy.
This research is conducted to explore the feasibility of detectinggreen citrus using just regular color images. According to the pro-posed algorithm and the results, using color images for green citrusdetection in outdoor conditions is promising although successrates were not enough to constitute an entire yield mapping sys-tem. The developed algorithm was able to yield number of thegreen fruits in the canopy image. A more advanced algorithm canalso yield the size of the fruits detected. Further studies are neededto develop a real application with sensors installed in a mobileplatform and images taken continuously. Future work will includeenhanced detection rates, reducing the processing time, andaccommodating more varied outdoor conditions.
Acknowledgements
This study was funded by The Council of Higher Education ofthe Republic of Turkey (YOK) within the scope of doctoral researchabroad fellowship program.
References
Annamalai, P., Lee,W.S., 2004. Identification of green citrus fruits using spectralcharacteristics. ASAE Paper No. FL04-1001. St. Joseph, Mich.: ASAE.
Arivazhagan, S., Ganesan, L., Priyal, S.P., 2006. Texture classification using Gaborwavelets based rotation invariant features. Pattern Recognition Letters 27,1976–1982.
Bae, H., Kim, S., 2005. Real-time face detection and recognition using hybrid-information extracted from face space and facial features. Image and VisionComputing 23, 1181–1191.
Chen, W., Er, M.J., Wu, S., 2006. Illumination Compensation and Normalization forRobust Face Recognition Using Discrete Cosine Transform in Logarithm Domain.IEEE Transactions on Systems, Man, and Cybernetics B, 458–466.
Cheng, Y., Hou, Y., Zhao, C., Li, Z., Hu, Y., Wang, C., 2010. Robust face recognitionbased on illumination invariant in nonsubsampled contourlet transformdomain. Neurocomputing 73, 2217–2224.
Chinchuluun, R., Lee, W.S., 2006. Citrus yield mapping system in natural outdoorscenes using the watershed transform. ASABE Paper No. 063010. St. Joseph,Mich.: ASABE.
Gabor, D., 1946. Theory of communication. Journal of the Institution of Electronicsand Engineers 93, 429–457.
Han, J., Ma, K.K., 2007. Rotation-invariant and scale-invariant Gabor features fortexture image retrieval. Image and Vision Computing 25, 1474–1481.
Hannan, M.W., Burks, T.F., Bulanon, D.M., 2009. A machine vision algorithmcombining adaptive segmentation and shape analysis for orange fruit detection.Agricultural Engineering International: The CIGR Ejournal, Manuscript 1281,vol. XI.
Kane, K.E., Lee W.S., 2007. Multispectral imaging for in-field green citrusidentification. ASABE Paper No. 073025. St. Joseph, Mich.: ASABE.
Li, M., Staunton, R.C., 2008. Optimum Gabor filter design and local binary patternsfor texture segmentation. Pattern Recognition Letters 29, 664–667.
Okamoto, H., Lee, W.S., 2009. Green citrus detection using hyperspectral imaging.Computers and Electronics in Agriculture 66, 201–208.
Parrish Jr., E.A., Goksel, A.K., 1977. Pictorial pattern recognition applied toharvesting. Transactions of the ASAE 20, 822–827.
Pla, F., Juste, F., Ferri, F., 1993. Feature extraction of spherical objects in imageanalysis: an application to robotic citrus harvesting. Computers and Electronicsin Agriculture 8, 57–72.
Regunathan, M., Lee, W.S., 2005. Citrus yieldmapping and size determination usingmachine vision and ultrasonic sensors. ASAE Paper No. 053017. ASAE, St. Joseph,MI, USA.
Savvides, M., Kumar, V., 2003. Illumination normalization using logarithmtransforms for face authentication. In: Proc. IAPR AVBPA, 549–556.
Sharma, A., Dubey, A., Tripathi, P., Kumar, V., 2010. Pose invariant virtual classifiersfrom single training image using novel hybrid-eigenfaces. Neurocomputing 73,1868–1880.
Sirovich, L., Kirby, M., 1987. Low-dimensional procedure for the characterization ofhuman faces. Journal of the Optical Society of America A: Optics, Image Science,and Vision 4, 519–524.
Stajnko, D., Lakota, M., Hoevar, M., 2004. Estimation of number and diameter ofapple fruits in an orchard during the growing season by thermal imaging.Computers and Electronics in Agriculture 42, 31–42.
Turk, M., Pentland, A., 1991. Eigenfaces for recognition. Journal of CognitiveNeuroscience 3, 71–86.
United States Department of Agriculture-National Agricultural Statistics Service(USDA-NASS), 2008. Florida Agricultural Statistical Directory: 2007–2008.Florida Department of Agriculture and Consumer Service. http://www.florida-agriculture.com/index.htm. Accessed 28 October 2010.
Viola, P., Jones, M.J., 2004. Robust real-time face detection. International Journal ofComputer Vision 57, 137–154.
Vishwakarma, V.P., Pandey, S., Gupta, M.N., 2009. Adaptive histogram equalizationand logarithm transform with rescaled low frequency DCT coefficients forillumination normalization. International Journal of Recent Trends inEngineering, Issue on Computer Science 1, 318–322.
Wachs, J., Stern, H.I., Burks, T., Alchanatis, V., 2009. Apple detection in natural treecanopies from multimodal images. In: Proceeding of the Joint InternationalAgricultural Conference, JIAC, pp. 293–302.
Weldon, T.E., Higgins, W.E., Dunn, D.E., 1996. Efficient Gabor filter design for texturesegmentation. Pattern Recognition 29, 2005–2015.
Wong, K.W., Lam, K.M., Siu, W.C., 2001. An efficient algorithm for human facedetection and facial feature extraction under different conditions. PatternRecognition 34, 1993–2004.
Xiaohua, L., Lam, K.M., Lansun, S., Jiliu, Z., 2009. Face detection using simplifiedGabor features and hierarchical regions in a cascade of classifiers. PatternRecognition Letters 30, 717–728.
Zhang, D.S., Lu, G., 2000. Content-based image retrieval using gabor texturefeatures. In Proceedings of First IEEE Pacific-Rim Conference on Multimedia392, 395.
Zhang, J., Tan, T., Ma, Li., 2002. Invariant texture segmentation via circular Gaborfilters. Proceedings of the 16th International Conference on Pattern Recognition,2002, 2, pp. 901–904.
Zhao, J., Tow, J., Katupitiya, J., 2005. On-tree fruit recognition using textureproperties and color data. IEEE/RSJ International conference on IntelligentRobots and Systems 263, 268.
Zhu, Z., Tang, M., Lu, H., 2004. A new robust circular Gabor based object matchingby using weighted Hausdorff distance. Pattern Recognition Letters 25, 515–523.