Weed image classification using Gabor wavelet and gradient field distribution
9
Computers and Electronics in Agriculture 66 (2009) 53–61 Contents lists available at ScienceDirect Computers and Electronics in Agriculture journal homepage: www.elsevier.com/locate/compag Original paper Weed image classification using Gabor wavelet and gradient field distribution Asnor Juraiza Ishak, Aini Hussain ∗ , Mohd Marzuki Mustafa Department of Electrical, Electronic and Systems Engineering, Faculty of Engineering and Built Environment, Universiti Kebangsaan Malaysia, Bandar Baru Bangi, 43600 UKM Bangi, Selangor, Malaysia article info Article history: Received 8 April 2008 Received in revised form 25 September 2008 Accepted 4 December 2008 Keywords: Image processing Feature extractions Single layer perceptron Weed classification abstract This paper presents an image analysis technique that utilizes a combination of a Gabor wavelet (GW) and gradient field distribution (GFD) techniques to extract a new set of feature vectors based on their direc- tional texture properties for the classification of weed types. The feature extraction process involves the use of GW to enhance the directional feature of the images, followed by GFD implementation to produce histogram gradient orientation angles and additional steps to generate the histogram envelope. Next, curve fitting technique is used to estimate the envelope function to determine its quadratic polynomial equation, y = ax 2 + bx + c and by taking the second derivative, the curvature value, a, is determined and used as a single input feature vector. The proposed technique was compared with another technique that also uses a single input feature obtained via GW algorithm implementation only. The overall classification accuracy utilizing the proposed technique is 94%, whereas using a GW only feature obtained 84% accuracy. The results obtained showed that this proposed technique is effective in performing weed classification. © 2008 Elsevier B.V. All rights reserved. 1. Introduction Precision agriculture offers the promise of increased produc- tivity and decreased production costs with the optimum use of resources and minimized environmental impact (Daggupati, 2007). Nowadays, various techniques and systems for automatic weed identification by machine vision have been proposed. Machine vision for selective weeding or selective herbicide spraying strongly relies on the ability of the system to analyze weed images and process extracted information for decision-making prior to imple- mentation of identified control actions. The machine vision system guided precision sprayer was developed and tested by Tian et al. (1999). This research integrated a real time machine vision sensing system with an automatic herbicide sprayer to create an intel- ligent sensing and spraying system. The accuracy of the sprayer was 75% in weed zone detection. Thus, the image recognition component is critical for machine vision. Typically, three main steps are involved in image recognition for weed classification : preprocessing, feature extraction and classification. Preprocess- ing involves image enhancement to simplify classification and yield optimal results. This may involve normalization which includes filtering, cropping, and resizing of images to produce uniformity. The goal of feature extraction is to characterize an object to be ∗ Corresponding author. Tel.: +603 89216300/89216102/89216699; fax: +603 89216146. E-mail addresses: asnor [email protected] (A.J. Ishak), [email protected], [email protected] (A. Hussain), [email protected] (M.M. Mustafa). recognized using measurements that exhibit very similar val- ues for objects in the same category and very different values for objects in different categories (Kyrki et al., 2004). To achieve good classification, suitable selection of feature needs to be con- sidered. Feature selection is related to dimensionality reduction and efficient data representation. The aim of feature selection is to improve the classification effectiveness and computational efficiency. Various species of weed that can be found within certain plan- tation, but as far as commercially available chemical for weed treatment, it is only necessary to distinguish between broad and narrow leave weed. A quick glance at various images of grasses and broadleaves weed will reveal that a more robust technique for weed classification should be based on a texture property of the images. The texture analysis is an important role in human vision since the textural properties of images appear to carry useful infor- mation for discrimination purposes. Texture is a measure of the variation of the intensity of the surface, quantifying properties such as smoothness, coarseness and regularity. Features that have been used to describe texture image include occurrence matrix, wavelet- based features, Gabor transform, Fourier transform and gradient field. Texture features of weed species have been applied in distin- guishing weed species by Meyer et al. (1998). The texture analysis approach of Kubo et al. (2003) is based on gray level co-occurrence matrix (GLCM). This texture feature is used for classifying tree species in the forest. Wavelet analysis has been utilized in machine vision system. Brosofske et al. (1999) used wavelets to reveal rela- tionships between landscape features and plant diversity indices at different imagery spatial resolution. Reum and Zhang (2007) have 0168-1699/$ – see front matter © 2008 Elsevier B.V. All rights reserved. doi:10.1016/j.compag.2008.12.003
-
Upload
independent -
Category
Documents
-
view
6 -
download
0
Transcript of Weed image classification using Gabor wavelet and gradient field distribution

Computers and Electronics in Agriculture 66 (2009) 53–61
Contents lists available at ScienceDirect
Computers and Electronics in Agriculture
journa l homepage: www.e lsev ier .com/ locate /compag
Original paper
Weed image classification using Gabor wavelet and gradient field distribution
Asnor Juraiza Ishak, Aini Hussain ∗, Mohd Marzuki MustafaDepartment of Electrical, Electronic and Systems Engineering, Faculty of Engineering and Built Environment,Universiti Kebangsaan Malaysia, Bandar Baru Bangi, 43600 UKM Bangi, Selangor, Malaysia
a r t i c l e i n f o
Article history:Received 8 April 2008Received in revised form25 September 2008Accepted 4 December 2008
Keywords:Image processing
a b s t r a c t
This paper presents an image analysis technique that utilizes a combination of a Gabor wavelet (GW) andgradient field distribution (GFD) techniques to extract a new set of feature vectors based on their direc-tional texture properties for the classification of weed types. The feature extraction process involves theuse of GW to enhance the directional feature of the images, followed by GFD implementation to producehistogram gradient orientation angles and additional steps to generate the histogram envelope. Next,curve fitting technique is used to estimate the envelope function to determine its quadratic polynomialequation, y = ax2 + bx + c and by taking the second derivative, the curvature value, a, is determined and
Feature extractionsSingle layer perceptronWeed classification
used as a single input feature vector. The proposed technique was compared with another technique thatalso uses a single input feature obtained via GW algorithm implementation only. The overall classificationaccuracy utilizing the proposed technique is 94%, whereas using a GW only feature obtained 84% accuracy.
ed t
1
trNivrpmg(slwcs:iofiT
f
d
0d
The results obtained show
. Introduction
Precision agriculture offers the promise of increased produc-ivity and decreased production costs with the optimum use ofesources and minimized environmental impact (Daggupati, 2007).owadays, various techniques and systems for automatic weed
dentification by machine vision have been proposed. Machineision for selective weeding or selective herbicide spraying stronglyelies on the ability of the system to analyze weed images androcess extracted information for decision-making prior to imple-entation of identified control actions. The machine vision system
uided precision sprayer was developed and tested by Tian et al.1999). This research integrated a real time machine vision sensingystem with an automatic herbicide sprayer to create an intel-igent sensing and spraying system. The accuracy of the sprayeras 75% in weed zone detection. Thus, the image recognition
omponent is critical for machine vision. Typically, three mainteps are involved in image recognition for weed classificationpreprocessing, feature extraction and classification. Preprocess-
ng involves image enhancement to simplify classification and yieldptimal results. This may involve normalization which includesltering, cropping, and resizing of images to produce uniformity.he goal of feature extraction is to characterize an object to be
∗ Corresponding author. Tel.: +603 89216300/89216102/89216699;ax: +603 89216146.
E-mail addresses: asnor [email protected] (A.J. Ishak), [email protected],[email protected] (A. Hussain), [email protected] (M.M. Mustafa).
168-1699/$ – see front matter © 2008 Elsevier B.V. All rights reserved.oi:10.1016/j.compag.2008.12.003
hat this proposed technique is effective in performing weed classification.© 2008 Elsevier B.V. All rights reserved.
recognized using measurements that exhibit very similar val-ues for objects in the same category and very different valuesfor objects in different categories (Kyrki et al., 2004). To achievegood classification, suitable selection of feature needs to be con-sidered. Feature selection is related to dimensionality reductionand efficient data representation. The aim of feature selectionis to improve the classification effectiveness and computationalefficiency.
Various species of weed that can be found within certain plan-tation, but as far as commercially available chemical for weedtreatment, it is only necessary to distinguish between broad andnarrow leave weed. A quick glance at various images of grassesand broadleaves weed will reveal that a more robust technique forweed classification should be based on a texture property of theimages. The texture analysis is an important role in human visionsince the textural properties of images appear to carry useful infor-mation for discrimination purposes. Texture is a measure of thevariation of the intensity of the surface, quantifying properties suchas smoothness, coarseness and regularity. Features that have beenused to describe texture image include occurrence matrix, wavelet-based features, Gabor transform, Fourier transform and gradientfield. Texture features of weed species have been applied in distin-guishing weed species by Meyer et al. (1998). The texture analysisapproach of Kubo et al. (2003) is based on gray level co-occurrence
matrix (GLCM). This texture feature is used for classifying treespecies in the forest. Wavelet analysis has been utilized in machinevision system. Brosofske et al. (1999) used wavelets to reveal rela-tionships between landscape features and plant diversity indices atdifferent imagery spatial resolution. Reum and Zhang (2007) have
54 A.J. Ishak et al. / Computers and Electronics in Agriculture 66 (2009) 53–61
) broa
ittwo
micgGfiltatsttciobdvafigcwa
daiboaeTaiafio
eta
Fig. 1. Images weed of (a
mplemented the wavelet pack transform to find specific patternshat correspond to crop nitrogen stress. The machine vision sys-em guided precision sprayer was developed, tested using discreteavelet transformation (DWT) approach by Tian et al. (1999) andbtained 75% accuracy for weed detection.
With the increasing use of innovative computer technology,achine vision systems have become a possibility for weed
dentification. Tang et al. (1999) performed texture-based weedlassification using a GW to classify images into broadleaf andrass categories for real time selective herbicide application. TheW functions were used to construct spatial domain filters. Theltering output was the modulation of the average of the convo-
ution output real and imaginary filter masks. The results showedhat the method is capable of performing texture-based broadleafnd grass classification effectively with perfect classification buthe sample images are limited only to 40 sample images with 20amples from each class. The processing time on feature extrac-ion had taken quite some time because each weed image needso perform four frequency levels. Mustapha and Mustafa (2005)onstructed a GW to extract texture-based features from fieldmages consisting of broad and narrow leaf weeds. The resultsbtained from real time testing revealed 87.14% and 88.17% forroad and narrow weeds, respectively. Next, GW was applied toetect crop rows on the vegetation image. To obtain the featureectors, the gain (G(x,y)) of each pixel was computed then refer ton accurate thresholding. The gain is the module of the point afterltering (pg(x,y)) dividing the point before filtering (pv(x,y)). If theain is near 1 and near 0, indicates that the point belongs to therop and weed classes, respectively. As reported, both plants areell classified without figuring out the percentage of classification
ccuracy.The purpose of data filtering is to enhance the image data
irectly processed by the GW. Some data may not be useful. Thedvantages of data filtering are to reduce processing time andmprove the detection rate. Several mathematical methods haveeen conducted to extract the features from GW image. These meth-ds extract the feature by computing the energy, mean, square,bsolute of filter and amount of all weed pixels. The features, how-ver, do not sufficiently represent information of the real image.herefore, to extract feature vector from 2D filtered image requiresn efficient feature which can represent a direct link with the phys-cal interpretation. In this paper we introduce the idea of creatingquality set of features by applying the GFD technique to the GWltered images to further enhance the directional texture property
f the images.The objective of this paper is to present new features set ofach weed classes constructed by using combination of two fea-ure extraction techniques. The specific objectives implemented toccomplish this were as follows:
dleaves and (b) grasses.
1. to normalize the weed images through image preprocessing;2. to filter the image using the GW method;3. to determine directional texture features utilizing the GFT for
each image;4. to create a model to reduce feature data and determine the
classification accuracies using a artificial neural network (ANN)classifier.
2. Image acquisition and preprocessing
Color digital image of weed were captured by a video cameraunder natural lighting conditions on sunny day which was aroundnoon. The camera was set to automatic exposure and focus. Then,the camera was mounted on a tripod at height of 1.5 m and thecapturing distance from the image plane to upper portion of theplant canopy is set at approximately 1.5 m or less. The lens cam-era has approximately 45◦ horizontal viewing angle. The camerawas provided with a Carl Zeiss lens. The camera had a pixel reso-lution 640 × 480 and the image resolution measures 1 mm × 1 mmper pixel. The images were sent to the data acquisition system viathe USB port, processed by MATLAB program. Presently, all imagesas shown in Fig. 1 were resized to 150 × 150 pixels. The most dom-inant weeds in plantation are grasses and broadleaves weed. Thescientific names of common broadleaf weeds which are found in oilpalm plantations are Ageratum convzoides and chromolaenaodoratawhile grass weed is known as Imperata cylindrica. In this paper, theimages need to be converted to a modified excess green (MExG)level and then analyzed to extract suitable features to representthe images in a compact form. Meyer et al. (1998) applied excessgreen (ExG) to distinguish between plants and soil regions in theidentification of weed species. MExG is defined in the followingequation
MExG = 2 × G − R − B (1)
Using this technique, the images need to be converted to the cor-responding MExG level by removing red and blue. MExG conversionof RGB data involves background segmentation that separates weedregions from the background and internal voids. Weeds normallyhave a greater intensity of green than of blue or red. The informa-tion from a MExG image is then sent for processing using the GWalgorithm followed by the GFT algorithm.
3. Gabor wavelet
GWs have been used efficiently in various computer visionapplications. A filter design method is needed for selecting filterparameters to maximize the discriminating power of the filters.The computational process involves two variables, the frequency
A.J. Ishak et al. / Computers and Electronics in Agriculture 66 (2009) 53–61 55
dient
ayfp
nopssw
h
everca
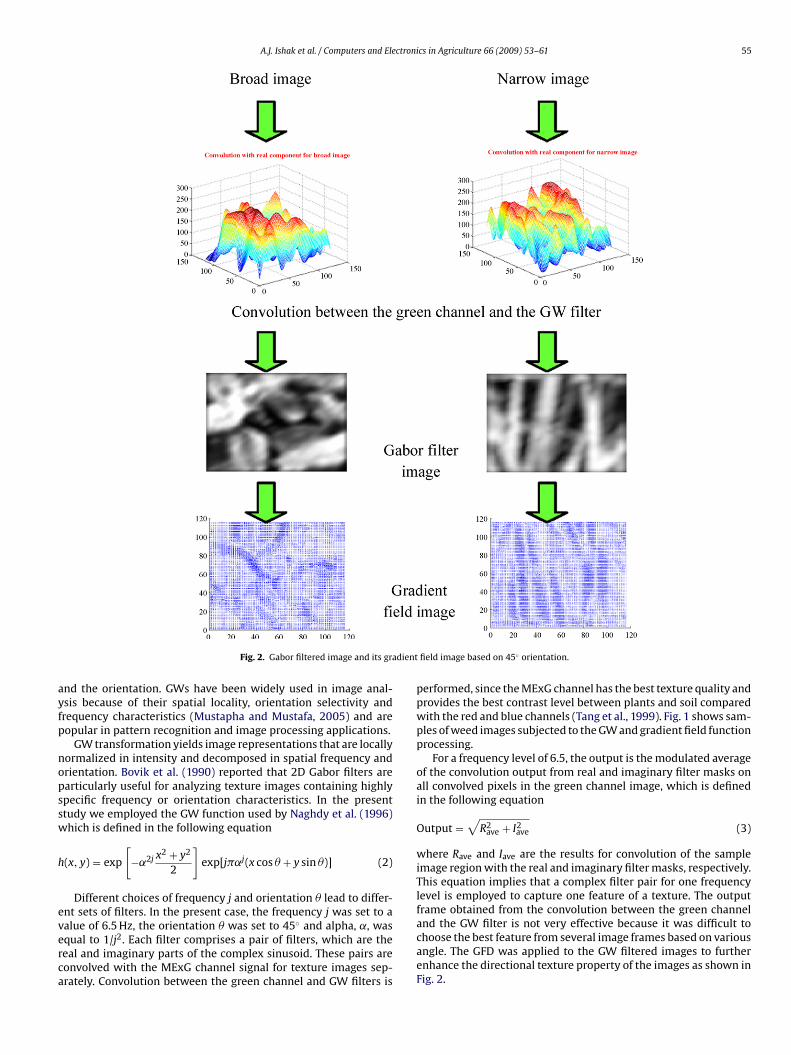
Fig. 2. Gabor filtered image and its gra
nd the orientation. GWs have been widely used in image anal-sis because of their spatial locality, orientation selectivity andrequency characteristics (Mustapha and Mustafa, 2005) and areopular in pattern recognition and image processing applications.
GW transformation yields image representations that are locallyormalized in intensity and decomposed in spatial frequency andrientation. Bovik et al. (1990) reported that 2D Gabor filters arearticularly useful for analyzing texture images containing highlypecific frequency or orientation characteristics. In the presenttudy we employed the GW function used by Naghdy et al. (1996)hich is defined in the following equation
(x, y) = exp
[−˛2j x2 + y2
2
]exp[j�˛j(x cos � + y sin �)] (2)
Different choices of frequency j and orientation � lead to differ-nt sets of filters. In the present case, the frequency j was set to a
alue of 6.5 Hz, the orientation � was set to 45◦ and alpha, ˛, wasqual to 1/j2. Each filter comprises a pair of filters, which are theeal and imaginary parts of the complex sinusoid. These pairs areonvolved with the MExG channel signal for texture images sep-rately. Convolution between the green channel and GW filters isfield image based on 45◦ orientation.
performed, since the MExG channel has the best texture quality andprovides the best contrast level between plants and soil comparedwith the red and blue channels (Tang et al., 1999). Fig. 1 shows sam-ples of weed images subjected to the GW and gradient field functionprocessing.
For a frequency level of 6.5, the output is the modulated averageof the convolution output from real and imaginary filter masks onall convolved pixels in the green channel image, which is definedin the following equation
Output =√
R2ave + I2
ave (3)
where Rave and Iave are the results for convolution of the sampleimage region with the real and imaginary filter masks, respectively.This equation implies that a complex filter pair for one frequencylevel is employed to capture one feature of a texture. The outputframe obtained from the convolution between the green channel
and the GW filter is not very effective because it was difficult tochoose the best feature from several image frames based on variousangle. The GFD was applied to the GW filtered images to furtherenhance the directional texture property of the images as shown inFig. 2.
56 A.J. Ishak et al. / Computers and Electronics in Agriculture 66 (2009) 53–61
Fig. 3. Process for determining the gradient distribution space.
Fig. 4. Flip previous gradient orientation to first quadrature orientation.

A.J. Ishak et al. / Computers and Electronics in Agriculture 66 (2009) 53–61 57
rging
4
naiabdiefitaeHsitt
Fig. 5. Feature reduction process to produce me
. Gradient field transformation
Several recent researchers have utilized gradient field tech-ique to register images by transforming each image to rotationsnd translations in a computationally efficient manner by comput-ng the gradient field for each image. Scharstein (1994) identified
simple powerful method to perform point-to-point matchingetween two gradient distribution spaces. Gluckman (2003) intro-uced a method capable of handling large rotations and translations
n a computationally efficient manner by computing the gradi-nt field for each image. In discrete domains, residual gradientelds and curl-form linear systems were used to achieve a bet-er surface reconstruction by Amit et al. (2006). Hongcheng etl. (2006) reconstructed enhanced images from modulated gradi-nt fields with least square errors by solving a Poisson equation.
aber and Modersitzki (2006) described a particular distance mea-ure based on a regularized normalized gradient field to extractmage contents from intensity values. In the present study, wehus selected a GFD technique to perform the weed classificationask.
Fig. 6. Angle (◦) direction in
gradient bar for (a) broad and (b) narrow weed.
4.1. Gradient field distribution
The GFD technique produces the orientation direction indicatesas edges of the filtered images. These directional textures have sim-ilarity with the filtered images which illustrate these features aresufficient and more meaningful in interpreting images. Once thenormalization is completed, each filter image is transformed to agradient distribution space. Let F(x,y) be a function of two variablesdefined by the filter image plane. The gradient of F is the vectorfunction whose first component is the partial derivative of F withrespect to x and whose second component is the partial derivative ofF with respect to y. The gradient field �F is defined in the followingequation
∇F = ∂Fi + ∂F
j (4)
∂x ∂ySince the gradient is the vector, it has both direction and magnitude.�F points in the direction of the steepest slope uphill, as shown inFig. 2. The direction of the gradient vector illustrates which func-tion is increasing most rapidly, and relates to the orientation of the
various orientation.
5 ctron
tie
|
�
erecrcwestt
5
idfft
5
s
8 A.J. Ishak et al. / Computers and Ele
angent plane, as indicated below. Meanwhile, the magnitude of �Fs the modulated gradient field, which is computed in the followingquations
∇| =
√(∂F
∂x
)2
+(
∂F
∂y
)2
(5)
= tan−1
(∂Fx
∂Fy
)(6)
For example, in Fig. 3 the coordinate (r,c) was selected as a refer-nce coordinate. Values for ∂F/∂x and ∂F/∂x were determined withespect to (r,c) as 0.23495 and 0.04761, respectively. Then the ori-ntation � of the tangent plane was computed as � = 11.455◦ wasalculated, from which the slope direction can be determined. Theesulting gradient field vector was then translated to a histogramonsisting of bins with various groups of gradients. The histogramas a summary of repeating orientations that occur on the gradi-
nt field of each image. To use the same bin size for the histogramcale, the gradient field must be scaled by �. This gradient his-ogram represents the feature set of each image. Feature selectionhen involves choosing the best feature subset.
. Feature selection process
The objective of feature extraction was to represent a raw imagen its reduced and compact form to facilitate and speed up theecision-making process for classification. In the present study,eature selection was performed to further optimize the extractedeature sets. The following subsection describes the feature selec-ion procedure.
.1. Gradient bar
In the present study, we describe an efficient approach forelecting the most discriminative and informative features. Fea-
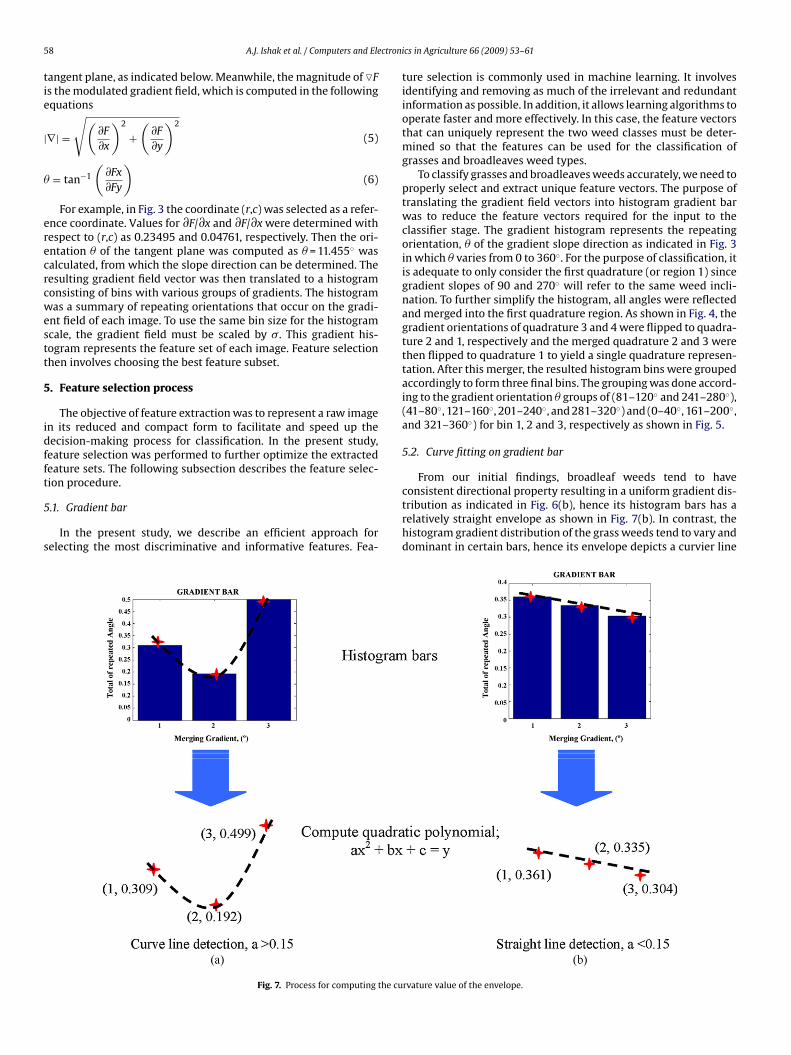
Fig. 7. Process for computing the cu
ics in Agriculture 66 (2009) 53–61
ture selection is commonly used in machine learning. It involvesidentifying and removing as much of the irrelevant and redundantinformation as possible. In addition, it allows learning algorithms tooperate faster and more effectively. In this case, the feature vectorsthat can uniquely represent the two weed classes must be deter-mined so that the features can be used for the classification ofgrasses and broadleaves weed types.
To classify grasses and broadleaves weeds accurately, we need toproperly select and extract unique feature vectors. The purpose oftranslating the gradient field vectors into histogram gradient barwas to reduce the feature vectors required for the input to theclassifier stage. The gradient histogram represents the repeatingorientation, � of the gradient slope direction as indicated in Fig. 3in which � varies from 0 to 360◦. For the purpose of classification, itis adequate to only consider the first quadrature (or region 1) sincegradient slopes of 90 and 270◦ will refer to the same weed incli-nation. To further simplify the histogram, all angles were reflectedand merged into the first quadrature region. As shown in Fig. 4, thegradient orientations of quadrature 3 and 4 were flipped to quadra-ture 2 and 1, respectively and the merged quadrature 2 and 3 werethen flipped to quadrature 1 to yield a single quadrature represen-tation. After this merger, the resulted histogram bins were groupedaccordingly to form three final bins. The grouping was done accord-ing to the gradient orientation � groups of (81–120◦ and 241–280◦),(41–80◦, 121–160◦, 201–240◦, and 281–320◦) and (0–40◦, 161–200◦,and 321–360◦) for bin 1, 2 and 3, respectively as shown in Fig. 5.
5.2. Curve fitting on gradient bar
From our initial findings, broadleaf weeds tend to have
consistent directional property resulting in a uniform gradient dis-tribution as indicated in Fig. 6(b), hence its histogram bars has arelatively straight envelope as shown in Fig. 7(b). In contrast, thehistogram gradient distribution of the grass weeds tend to vary anddominant in certain bars, hence its envelope depicts a curvier linervature value of the envelope.

ctroni
aeb
pwtiou
A.J. Ishak et al. / Computers and Ele
s shown in Fig. 7(a). For this reason, the envelope of the gradi-nt histogram bars can be used to discriminate between grass androadleaf weed.
Curve fitting technique was used to determine the quadraticolynomial equation of the envelope of function y = ax2 + bx + c
here coefficient ‘a’ represents the curvature value. This value ishen used as the feature input which is computed by simply tak-ng the second derivative of the polynomial function y. Based onur observations, it was found that a suitable threshold that can besed to discriminate the grasses and broadleaves weeds is 0.15 as
Fig. 8. Weed classific
cs in Agriculture 66 (2009) 53–61 59
indicated in Table 1. Fig. 8 describes the steps required to implementthe weed image classification using the method described earlier.
6. Results and discussion
In this work, weed classification involves assigning weeds tograsses and broadleaves categories. ANN is a popular classifier and ithas been applied for training and testing purpose in this work. In thetraining process, two categories of database were assigned basedon only using GW feature without computing GFD and coefficient
ation process.

60 A.J. Ishak et al. / Computers and Electronics in Agriculture 66 (2009) 53–61
Table 1Results of the vector based on gradient bar.
GW Merge gradient bar Curvature value, a
0.2232
0.3044
0.0220
0.0343
GW only feature and (b) using curvature value, a.
fdwTutgicewtiAwntec
Table 2Weed recognition results.
Techniques Recognition accuracy (%) SLP test
GW approach GW and GFD approaches
Fig. 9. Scatter plots of training results for (a)
eature with similar image sizes of 120 × 120 pixels. Two hun-red images consisting of 100 grasses and 100 broadleaves weedsere used to train the efficacy of the proposed feature vectors.
he classifier was trained with the proposed new feature vectorssing a single layer perceptron (SLP) model. Once the model wasrained, the net was subjected to the classification task to distin-uish between grasses and broadleaves weed. During testing, annput image is presented to the system and subjected to the prepro-essing and feature extraction processes. Once the feature vector isxtracted, it is fed to the SLP classifier. If the test input is a broadleafeed, the net returns ‘0’ as output for correct classification. If the
est input is a grass weed, the net returns ‘+1’ as output for correctdentification. Otherwise, the classification is considered incorrect.
total of 400 images of 200 grasses and 200 broadleaves weeds
ith different lighting conditions were used to test the effective-ess of the feature vector. In addition, to investigate robustness ofhe weed classification, different lighting conditions were consid-red using two sets of data. The first dataset consists of imagesaptured at two separate time period that is in the morning andBroadleaves 87 93Grasses 81.5 94Overall 84.25 93.75
afternoon and during sunny and cloudy conditions. The seconddataset can be regarded as a synthetic dataset since it consists ofedited images using conventional photo editor to produce variouslighting effects and conditions by adjusting the luminance. Fig. 9(a)and (b) displays the scatter plots of the extracted feature vector of
(a) the GW algorithm and (b) the curvature value, a.The classification results are tabulated in Table 2. The classifi-cation accuracy for using the curvature value feature vector is 94%.In contrast, using the GW only feature we obtained 84% accuracy.Clearly, these results proved that the proposed single representa-

A.J. Ishak et al. / Computers and Electroni
tbIctaaipCpfr
7
tiidci
572–575.
Fig. 10. Scatter plot of classification results for GW and GFD techniques.
ion using the curvature value is an effective method to distinguishetween broadleaf weed type and grasses as shown in Fig. 10.
t is also noted that the misclassifications were found in imagesonsisting of highly densed grass weed population that causedhe leaves to overlap each other and concealed the grass char-cteristics. As a result, a weed grass image is wrongly classifieds a broadleaf category. On the other hand, certain broadleavesmages might have stems or branches of the weed visible which canotentially cause misclasssification of broadleaves weed as grass.onsequently, further development is required to overcome theseroblems. Nevertheless, the findings indicate that the proposed
eature extraction algorithm has great potential for feature vectorepresentation of weed images in this classification task.
. Conclusions
In this study we have considered the use of a single fea-ure vector, which we called the curvature value and compared
t against another single feature vector obtained from the GWmplementation for a weed classification task. The results obtainedemonstrated that the proposed feature vector could be used tolassify weed groups with overall accuracy rate of 93.75%, whichs very encouraging. Ongoing work is currently being carried outcs in Agriculture 66 (2009) 53–61 61
to further improve the system performance, with a particularemphasis on classifier development. In addition, more images andcategories of image will be executed and used during testing todetermine the best configuration for an intelligent weed detectionand classification system.
References
Amit, A., Ramesh, R., Chellappa, R., 2006. Edge suppression by gradient fieldtransformation using cross-projection sensors. In: Proceedings of the IEEE Com-puter Society Conference on Computer Vision and Pattern Recognition (CVPR),pp. 1–8.
Brosofske, K.D., Chen, J., Crow, T.R., Saunders, S.C., 1999. Plant diversity at multi-ple scales across a northern Wisconsin pine barren landscape. Plant Ecol. 143,203–218.
Bovik, A.C., Clark, M., Geisler, W., 1990. Multichannel texture analysis using localized.Trans. IEEE Pattern Anal. Mach. Intel. 12, 55–73.
Daggupati, N.P., 2007. Assessment of the varitarget nozzle for variable rate applica-tion of liquid crop protection products. M.Sc. Dissertation. University of KansasState, Department of Biological and Agricultural Engineering College of Engi-neering, Manhattan, Kansas.
Gluckman, J., 2003. Gradient field distributions for the registration of images. In:Proceedings of the IEEE International Conference on Image Processing, vol. 3,pp. 691–694.
Haber, E., Modersitzki, J., 2006. Multi-Image registration based on normal-ized gradient fields. In: Proceedings of 9th International Conference onMedical Image Computing and Computer-Assisted Intervention, vol. 4191,pp. 726–733.
Hongcheng, W., Yunqiang, C., Tong, F., Jason, T., Narendra, A., 2006. Gradient adaptiveimage restoration and enhancement. In: Proceedings of the IEEE InternationalConference on Image Processing (ICIP).
Kubo, M., Kanda, F., Muramoto, K., 2003. Textural feature extraction of tree usingco-occurrence matrix from aerial images. In: Proceedings of the SICE AnnualConference, Japan, pp. 52–57.
Kyrki, V., Kamarainen, J.K., Kalviainen, H., 2004. Simple Gabor feature space forinvariant object recognition. J. Pattern Recogn. Lett., 311–318.
Meyer, G.E., Mehta, T., Kocher, M.F., Mortensen, D.A., 1998. Textural imaging anddiscriminant analysis for distinguishing weeds for spot spraying. Trans. ASAE 41(4), 1189–1197.
Mustapha, A., Mustafa, M.M., 2005. Development of a real-time site sprayer sys-tem for specific weeds using gabor wavelets and neural networks model. In:Proceedings of the Malaysia Science and Technology Congress, Malaysia, pp.406–413.
Naghdy, G., Wang, J., Ogunbona, P., 1996. Texture analysis using Gabor Wavelets.In: Proceedings of the IS&T/SPIE Symposium on Electronic Imaging 2657,pp. 74–85.
Reum, D., Zhang, Q., 2007. Wavelet based multi-spectral image analysis of maize leafchlorophyll content. J. Comput. Electron. Agric. 56, 60–71.
Scharstein, D., 1994. Matching images by comparing their gradient fields. In: Pro-ceedings of the 12th IAPR International Conference on Pattern Recognition, pp.
Tang, L., Tian, L.F., Steward, B.L., Reid, J.F., 1999. Texture-based weed classificationusing gabor wavelets and neural network for real-time selective herbicide appli-cation. Trans. ASAE, St. Joseph, MI, No. 99-3036.
Tian, L., Reid, J., Hummel, J., 1999. Development of a precision sprayer for site-specificweed management. Trans. ASAE 42 (4), 893–900.