The morphologies and masses of extremely red galaxies in ...
19
Mon. Not. R. Astron. Soc. 414, 2246–2264 (2011) doi:10.1111/j.1365-2966.2011.18541.x The morphologies and masses of extremely red galaxies in the Groth Strip A. Hempel, 1,2 D. Crist´ obal-Hornillos, 3,4 M. Prieto, 1,2 I. Trujillo, 1,2 M. Balcells, 1,2,5 C. L´ opez-Sanjuan, 1,2,6 D. Abreu, 1,2 M. C. Eliche-Moral 7 and L. Dom´ ınguez-Palmero 1,2 1 Instituto de Astrof´ ısica de Canarias, C./V´ ıa L ´ actea s/n, 38200 La Laguna, Spain 2 Universidad de La Laguna, C./Francisco S´ anchez s/n, 38206 La Laguna, Spain 3 Instituto de Astrof´ ısica de Andaluc´ ıa (CSIC), Camino Bajo de Huetor 50, 18008 Granada, Spain 4 Centro de Estudios de F´ ısica del Cosmos de Arag´ on, C. General Pizarro, 1-3, 44001 Teruel, Spain 5 Isaac Newton Group of Telescopes, Apartado de Correos 321, E-38700 Santa Cruz de la Palma, Islas Canarias, Spain 6 Laboratoire d’Astrophysique de Marseille, Pˆ ole de l’Etoile Site de Ch ˆ ateau-Gombert 38, rue Fr´ ed´ eric Joliot-Curie, 13388 Marseille, France 7 Departamento de Astrof´ ısica y Ciencias de la Atm ´ osfera, Facultad de C.C. F´ ısicas, Universidad Complutense de Madrid, 28040 Madrid, Spain Accepted 2011 February 14. Received 2011 February 14; in original form 2009 November 13 ABSTRACT We present a new catalogue of EROs from the Groth Strip and study the relation between their morphology and mass. With a selection criterion F814W−K s ≥ 4 and K s ≤ 21.0 we find 102 EROs, over a survey area of 155 arcmin 2 , leading to a surface density of 0.66 arcmin −2 . The photometric data include U,B,F 606W,F 814W,J,K s bands. Morphologies are based on a by eye classification and we distinguish between three basic classes: compact objects, targets with a disc and/or a bulge component and irregular or merger candidates. An additional group consists of the few objects which could not be classified. The majority of our targets has either a very compact morphology (34 ± 6 per cent), or show more or less distinct disc components (43 ± 6 per cent). 14 ± 4 per cent are merger or irregulars and seven objects (approximately 9 per cent) could not be classified. We also study the dependence of structural parameters (effective radius: r eff , S´ ersic index: n) on morphological appearance. As expected, EROs that are either compact or show a distinct bulge component have smaller median effective radii (1.22 ± 0.14 kpc and 3.31 ± 0.53 kpc) than disc dominated (5.50 ± 0.51 kpc) or possible irregular galaxies or merger candidates (4.92 ± 0.14 kpc). More importantly, the S´ ersic index changes from 2.30 ± 0.34 and 3.24 ± 0.55, to 1.03 ± 0.24 and 1.54 ± 0.40, respectively. As found in previous studies, most the EROs in our sample have redshifts between z = 1 and 2; however, compact EROs in our sample are found at redshifts as low as z = 0.4 and as high as z = 2.8; the latter qualify as well as distant red galaxies (DRGs). Disc-like EROs are also found up to z = 2.8; however, those with a bulge-disc structure are only seen at z < 1.5. For each of these EROs we determined the stellar mass and mean population age by fitting synthetic Bruzual (2007) spectra to the photometric spectral energy distributions, via χ 2 mini- mization. Mass estimates were obtained by assuming an exponentially declining star formation rate with a wide set of parameters, e.g. decay time, redshift of last star formation, metallicity and optical depth. Total stellar masses for our sample are in the range 9.1 < log(M/M ) < 11.6. We cannot detect significant differences between the stellar mass distribution of the morphological classes. EROs with masses of log(M/M ) > 11.0 dominantly show compact morphologies, but also include a significant number of sources with a disc morphology. Key words: galaxies: evolution – galaxies: high-redshift – galaxies: photometry – galaxies: star formation – galaxies: stellar content – galaxies: structure. E-mail: [email protected] 1 INTRODUCTION It has been 20 yr since the first discovery of a population of galaxies with optical to near-infrared (NIR) colours quite different from typical field sources (Elston, Rieke & Rieke 1988, 1989; Hu & C 2011 The Authors Monthly Notices of the Royal Astronomical Society C 2011 RAS Downloaded from https://academic.oup.com/mnras/article/414/3/2246/1039390 by guest on 05 July 2022
-
Upload
khangminh22 -
Category
Documents
-
view
0 -
download
0
Transcript of The morphologies and masses of extremely red galaxies in ...

Mon. Not. R. Astron. Soc. 414, 2246–2264 (2011) doi:10.1111/j.1365-2966.2011.18541.x
The morphologies and masses of extremely red galaxies in the Groth Strip
A. Hempel,1,2� D. Cristobal-Hornillos,3,4 M. Prieto,1,2 I. Trujillo,1,2 M. Balcells,1,2,5
C. Lopez-Sanjuan,1,2,6 D. Abreu,1,2 M. C. Eliche-Moral7 and L. Domınguez-Palmero1,2
1Instituto de Astrofısica de Canarias, C./Vıa Lactea s/n, 38200 La Laguna, Spain2Universidad de La Laguna, C./Francisco Sanchez s/n, 38206 La Laguna, Spain3Instituto de Astrofısica de Andalucıa (CSIC), Camino Bajo de Huetor 50, 18008 Granada, Spain4Centro de Estudios de Fısica del Cosmos de Aragon, C. General Pizarro, 1-3, 44001 Teruel, Spain5Isaac Newton Group of Telescopes, Apartado de Correos 321, E-38700 Santa Cruz de la Palma, Islas Canarias, Spain6Laboratoire d’Astrophysique de Marseille, Pole de l’Etoile Site de Chateau-Gombert 38, rue Frederic Joliot-Curie, 13388 Marseille, France7Departamento de Astrofısica y Ciencias de la Atmosfera, Facultad de C.C. Fısicas, Universidad Complutense de Madrid, 28040 Madrid, Spain
Accepted 2011 February 14. Received 2011 February 14; in original form 2009 November 13
ABSTRACTWe present a new catalogue of EROs from the Groth Strip and study the relation between theirmorphology and mass. With a selection criterion F814W−Ks ≥ 4 and Ks ≤ 21.0 we find 102EROs, over a survey area of 155 arcmin2, leading to a surface density of 0.66 arcmin−2. Thephotometric data include U,B, F606W,F814W,J ,Ks bands. Morphologies are based on aby eye classification and we distinguish between three basic classes: compact objects, targetswith a disc and/or a bulge component and irregular or merger candidates. An additional groupconsists of the few objects which could not be classified.
The majority of our targets has either a very compact morphology (34 ± 6 per cent), orshow more or less distinct disc components (43 ± 6 per cent). 14 ± 4 per cent are merger orirregulars and seven objects (approximately 9 per cent) could not be classified.
We also study the dependence of structural parameters (effective radius: reff , Sersic index:n) on morphological appearance. As expected, EROs that are either compact or show a distinctbulge component have smaller median effective radii (1.22 ± 0.14 kpc and 3.31 ± 0.53 kpc)than disc dominated (5.50 ± 0.51 kpc) or possible irregular galaxies or merger candidates(4.92 ± 0.14 kpc). More importantly, the Sersic index changes from 2.30 ± 0.34 and 3.24 ±0.55, to 1.03 ± 0.24 and 1.54 ± 0.40, respectively.
As found in previous studies, most the EROs in our sample have redshifts between z = 1and 2; however, compact EROs in our sample are found at redshifts as low as z = 0.4 and ashigh as z = 2.8; the latter qualify as well as distant red galaxies (DRGs). Disc-like EROs arealso found up to z = 2.8; however, those with a bulge-disc structure are only seen at z < 1.5.
For each of these EROs we determined the stellar mass and mean population age by fittingsynthetic Bruzual (2007) spectra to the photometric spectral energy distributions, via χ2 mini-mization. Mass estimates were obtained by assuming an exponentially declining star formationrate with a wide set of parameters, e.g. decay time, redshift of last star formation, metallicityand optical depth. Total stellar masses for our sample are in the range 9.1 < log(M/M�) <
11.6. We cannot detect significant differences between the stellar mass distribution of themorphological classes. EROs with masses of log(M/M�) > 11.0 dominantly show compactmorphologies, but also include a significant number of sources with a disc morphology.
Key words: galaxies: evolution – galaxies: high-redshift – galaxies: photometry – galaxies:star formation – galaxies: stellar content – galaxies: structure.
�E-mail: [email protected]
1 INTRODUCTION
It has been 20 yr since the first discovery of a population of galaxieswith optical to near-infrared (NIR) colours quite different fromtypical field sources (Elston, Rieke & Rieke 1988, 1989; Hu &
C© 2011 The AuthorsMonthly Notices of the Royal Astronomical Society C© 2011 RAS
Dow
nloaded from https://academ
ic.oup.com/m
nras/article/414/3/2246/1039390 by guest on 05 July 2022

The morphologies and masses of EROs 2247
Ridgway 1994). Usually defined by R − K >= 5..7 or I − K >= 4..6colours (in the Vega system), extremely red galaxies are a subsetof extremely red objects (EROs) and we will use this more generalterm throughout this paper.
As diverse as the selection criteria are the stellar populationswhich produce such red spectral energy distributions. Today, theclassification as ERO is beyond the two classic galaxy types, namelyold evolved galaxies with no or very limited recent star formation ordusty galaxies with star formation rates (SFR) associated with star-bursts, typically with redshift between 1 and 2. The ERO populationalso comprises normal spiral galaxies (Gilbank et al. 2003; Yan &Thompson 2003; Moustakas et al. 2004) at slightly lower redshifts.The latter contains a large fraction of edge-on galaxies, where in-clination puts a reasonable amount of dust into our line of sightand reddens the spectral energy distribution (SED). Also galaxiesharbouring an active galactic nucleus (AGN, Alexander et al. 2002;Brusa et al. 2005), and starburst/AGN combinations (Afonso et al.2001) are found among the ERO samples. In addition, several otherred galaxy populations have been found, e.g. IR-detected galaxies(Yan et al. 2004), distant red galaxies (DRGs, Labbe et al. 2005; Pa-povich 2006) and BzK selected galaxies (Daddi et al. 2005; Hayashiet al. 2007).
EROs are relevant because they allow to explore the abundance ofmassive old ellipticals, which in turn poses a strong test for the twocompeting scenarios of elliptical galaxy formation: early assem-bly (zf > 2–3), e.g. by monolithic collapse, and passive luminosityevolution thereafter (PLE models, Tinsley & Gunn 1976; Pozzettiet al. 1996), or hierarchical merging of smaller sized objects (White& Rees 1978; Kauffmann, White & Guiderdoni 1993; Somerville,Primack & Faber 2001). Observational evidence has been foundfor both scenarios: several surveys have detected a deficit of ellip-ticals at z > 1, supporting the hierarchical merging models (Roche,Dunlop & Almaini 2003; Kitzbichler & White 2006), while oth-ers are consistent with PLE (Cimatti et al. 2002; Im et al. 2002;Somerville et al. 2004).
In recent years the hierarchical merging scenario in a �CDMuniverse has been established as the favoured model. Nevertheless,the vast number of different renditions leaves room for dramaticallydifferent predictions regarding critical parameters like the numberdensity of massive galaxies at specific times (Fontana et al. 2004;Treu et al. 2005, and references therein).
As a whole, extremely red galaxies are among the more massivegalaxies (M � 1011 M�) (Glazebrook et al. 2004; Gonzalez-Perezet al. 2009) and the existence of such galaxies with evolved stellarpopulations at high redshifts is one of the challenges to the hier-archical galaxy formation model (White & Rees 1978; Kauffmannet al. 1993; Somerville et al. 2001). However, stellar ages do notnecessarily correlate with the build-up of the galaxy mass throughmerging (Conselice 2006; De Lucia et al. 2006; Trujillo et al. 2006;Eliche-Moral et al. 2010).
In the local universe, masses can be determined accurately bystudying the dynamical mass of galaxies and obtaining scalingrelations such as the Fundamental Plane for early-type galaxies(Dressler et al. 1987; Reda, Forbes & Hau 2005; La Barbera et al.2008) and dwarf irregulars (Vaduvescu & McCall 2008) and theTully–Fisher relation for spiral galaxies (Tully & Fisher 1977;Kassin et al. 2007). Those relations have been used successfullyout to z ∼ 1.3, but the most active area of mass assembly, z > 1.5, isnot accessible at current times, although first steps have been takenby e.g. Cenarro & Trujillo (2009) and Cappellari et al. (2009). Athigher redshifts, the baryonic mass derived from broad-band pho-tometry is comparable to the predictions of stellar population mod-
els, like Bruzual & Charlot (2003), Maraston (2005) and Bruzual(2007).
In this paper we present an analysis of the ERO population inthe Groth Strip (Prieto et al. 2005), based on optical and NIR pho-tometry from the Galaxy Origins and Young Assembly (GOYA)photometric survey and Hubble Space Telescope (HST) imaging.We describe the morphology, stellar masses and ages, derived frombroad-band photometry. Specifically we address, first whether allEROs fit in the classic morphological types, and second whetherthe typical stellar mass of the ERO population changes with cosmictime, and finally, whether at a given redshift the different morpholo-gies of the ERO population correlate with the stellar mass.
The paper is structured as follows. In Section 2 we describebriefly the data available from the GOYA Survey and the sampleselection. Section 3 describes the morphological classification, andSection 4 gives an overview, how stellar masses were derived usingmultiband photometry. Section 5 gives details on the morphologyand mass estimates for each ERO class.
All magnitudes are given in the Vega system and we assume�M = 0.3, �� = 0.7 and H0 = 70 km s−1 Mpc−1 throughout thiswork.
2 DATA AND SAMPLE SELECTION
We have selected a sample of extremely red galaxies (EROs) fromthe GOYA Survey (Balcells et al. 2002). This is a combined Ks se-lected catalogue covering the Groth-Westphal strip (≈155 arcmin2)in four optical bands, U, B, F606W and F814W, as well as J, Ks inthe NIR.
The U and B imaging were taken with the Wide Field Camera(WFC) at the prime focus of the 2.5-m Isaac Newton Telescope(INT); data reduction and catalogue generation are described inEliche-Moral et al. (2006) and Domınguez-Palmero et al. (2008);50 per cent detection efficiencies are 24.8 mag in U and 25.5 mag inB. The F606W and F814W data originate from the Wide Field andPlanetary Camera (WFPC2) on-board HST , as part of the originalGroth Strip Survey (Groth et al. 1994), that was later analysed forthe Medium Deep Survey (MDS: see, e.g. Ratnatunga, Griffiths& Ostrander (1999), and by the Deep Extragalactic EvolutionaryProbe (DEEP; see, e.g., Simard et al. 2002).
The NIR JKs data were obtained with the 1024 × 1024 pixelINGRID camera at the Cassegrain focus of the 4.2-m William Her-schel Telescope (WHT). Data processing and catalogue generationare described in Cristobal-Hornillos et al. (2003). The 50 per centdetection efficiencies range between Ks = 21.2 and 20.2 mag, de-pending on the seeing of the individual pointings.
The EROs selection is done by running SEXTRACTOR on the originalKs-band images, and photometry on all bands, including Ks, isobtained on apertures of 2.6 arcsec FWHM, in double-image mode,on the images convolved to 1.3 arcsec FWHM. All sources whichwere classified as stellar objects, based on stellarity greater than0.8 (given by SEXTRACTOR) in the I band (F814W) were excludedfrom our sample. Fig. 1 shows the colour–magnitude diagram ofthe whole GOYA catalogue and the final ERO sample.
All our EROs have colours redder than F814W − Ks ≥ 4.0.Our initial sample contains 114 objects which we have studied byeye to exclude sources close to the edge of either the F814W orKs-band image where we have a lower image quality. As result wehave excluded six objects from our original catalogue. Additionalobjects have been excluded due to their unresolved morphology(see Section 5.2).
C© 2011 The Authors, MNRAS 414, 2246–2264Monthly Notices of the Royal Astronomical Society C© 2011 RAS
Dow
nloaded from https://academ
ic.oup.com/m
nras/article/414/3/2246/1039390 by guest on 05 July 2022

2248 A. Hempel et al.
Figure 1. Colour–magnitude diagram for the full Ks selected catalogue(black) in the Groth strip and the final ERO sample (red). The horizontalline represents our colour threshold, the upper envelope is the result ofthe detection limit in F814W. Black dots above the colour threshold showobjects which were excluded from our sample during the morphologicalclassification due to their bad image quality.
Several surveys have obtained spectroscopic redshifts for dif-ferent galaxy populations in the Groth Strip (Weiner et al. 2005;Sarajedini et al. 2006).1 However, the paucity of emission lines inERO spectra, plus the lack of prominent emission lines in the visiblerange at redshifts above 1.4, result in very few EROs having spec-troscopically determined redshifts. We therefore used photometricredshifts available from the GOYA catalogue. These were derivedusing Hyperz (Bolzonella, Miralles & Pello 2000), redshift errorswere estimated from σzphot = σδz × (1 + zphot) with σδz = 0.07(Lopez-Sanjuan et al. 2009).
Based on our photo-z we can see that the used colour thresholdof F814W −Ks ≥ 4 is fairly efficient at selecting galaxies in a red-shift range of 1 ≤ z ≤ 2. However, this specific colour selection isnot very stringent, due to the large variety of star-forming historiesgalaxies may have followed. Fig. 2 shows the redshift distributionof our final ERO sample, compared to the whole K-selected cat-alogue. As expected, most EROs have redshifts between 1 and 2,although exceptions at lower and higher redshifts exist. The redshiftdistribution of our ERO sample peaks at z = 1.32 ± 0.02, which isin good agreement with Conselice et al. (2008) who find an averageredshift for an I − K > 4 selected sample of 〈z〉 = 1.43 ± 0.32(Conselice et al. 2008).
3 MORPHOLOGICAL CLASSIFICATIONOF EROS
Morphologies were classified by visual inspection of the F814Wimage of each individual galaxy (Yan & Thompson 2003;
1 http://deep.berkeley.edu
Figure 2. Histograms of the distribution of photometric redshifts, zphot, forour 102 EROs. The inset shows the result for the full Ks selected catalogueof the Groth Strip.
Moustakas et al. 2004). Sometimes down-valued for being sub-jective, visual classification has a long history and is in fact themethod employed to establish the morphological classification ofnearby galaxies (de Vaucouleurs 1948; Ellis, Abraham & Dickinson2001; Desai et al. 2007). We compare this visual classification withthe results of a machine-based method based on fitting 2D surface-brightness Sersic profiles (Roche et al. 2002; Simard et al. 2002; Fu,Stockton & Liu 2005; Stockton, McGrath & Canalizo 2006), usinggalfit (Peng et al. 2002). The later avoid human subjectivity but arealso subject to limitations, e.g. when galaxy isophotes are not con-centric, aligned ellipses or galaxies with large inclinations. We didnot base our classification on automatic determined concentration-asymmetry indices (Abraham et al. 1996; Conselice et al. 2008;Huertas-Company et al. 2008). Concentration and asymmetry in-dices are difficult to interpret in EROs which tend to be compactand hence have few pixel where to measure the indices. Further-more, important systematic errors may occur above z ∼ 1 where theF814W filter samples the rest-frame UV.
Compared to both methods, a visual inspection can pick up themore subtle morphological details and the sample size is smallenough to allow detailed inspection of each of the images.
With a mean redshift of 1.32 for the ERO sample, the WFPC2 datasample a rest-frame wavelength of 3500 Å and thus the F814W im-age is sensitive to star formation and to patchy dust extinction. Ourmorphologies may thus suffer from a ‘morphological K -correctionbias’. We partially compensate for any such biases by inspecting theground-based K-band image together with the HST /WFPC2 NIRchannel.
Each galaxy in our sample of 102 EROs was classified individ-ually by four of the authors (A. Hempel, M. Prieto, I. Trujillo andM. Balcells). Sources for which at least three classifications agreeare considered as ‘secure’. Besides the HST /F814W image, in afew cases we used either the radial profile or the surface bright-ness isophotes to refine our classification. Initially, we aimed at
C© 2011 The Authors, MNRAS 414, 2246–2264Monthly Notices of the Royal Astronomical Society C© 2011 RAS
Dow
nloaded from https://academ
ic.oup.com/m
nras/article/414/3/2246/1039390 by guest on 05 July 2022

The morphologies and masses of EROs 2249
Figure 3. HST WFPC2 F814W images of the different morphological classes. The panels are 7.0 arcsec in size, N is up and E left.
classifying three different morphological types: compact for early-type galaxies; extended for disc types and irregular and merging.However, the second class proved to be quite diverse, containingboth galaxies with a bulge and a disc component and galaxies whichshow no clear bulge component. An examples for each class whichshow a distinct morphology can be seen in Fig. 3.
Finally we differentiate between six classes:
(i) class 1: objects with very compact morphology, like expectedfor early-type galaxies;
(ii) class 2a: objects with bulge and disc component (early-typediscs);
(iii) class 2b: disc galaxies with no clear bulge component, in-cluding edge-on discs (late-type discs);
(iv) class 2c: extended objects with bulge and/or disc component,for which no clear classification as either class 2a or class 2b waspossible;
(v) class 3: irregular or merger candidates;(vi) class 4: no clear classification at all.
We complemented the visual classification with a 2D surface-brightness fit of each source in our EROs sample, in order to com-pare the result of both methods, to determine physical sizes and toexplore the mass-size correlation between the different morpholog-ical classes.
The structural parameters were estimated with the GALFIT package(Peng et al. 2002), using the HST /WFPC2 F814W. GALFIT simul-taneously fits several parameters of an analytic light distribution,thereby minimizing χ 2, the residual between the original imageand the model. As a result we can describe the global morphologyof our objects in terms of structural parameters, like sizes (givenas half-light radius or effective radius reff along semimajor axis ae)and Sersic index n.
All our targets were modelled with a Sersic profile [I (r) ∝exp(−(r/reff )1/n)]. Despite our morphological classification, wekeep also the Sersic index as free parameter, hence not forcing a purede Vaucouleurs profile (n = 4) on ‘elliptical’ EROs or exponential
disc profiles (n = 1) on objects with bulge and disc components.All models were convolved with a PSF obtained from unsaturatedstars in the image and extremely bright close-by neighbours weremasked. The initial values for the parameters to be fitted were de-rived by SEXTRACTOR. For objects where derived parameters likemagnitude, size or position seemed extremely off, the models weretuned by keeping either Imag or the position fixed. Fig. 4 presentsexamples of the results, using a single Sersic profile.
Results of the morphological classification are presented in para-graph 5.1.
Figure 4. Examples of the HST /WFPC2 surface brightness modelling withgalfit. For one galaxy of class 1, class 2a and class 2b we modelled a singleSersic profile (middle column), the panels on the right show the residualimage. Each panel is 5.5 arcsec in size.
C© 2011 The Authors, MNRAS 414, 2246–2264Monthly Notices of the Royal Astronomical Society C© 2011 RAS
Dow
nloaded from https://academ
ic.oup.com/m
nras/article/414/3/2246/1039390 by guest on 05 July 2022

2250 A. Hempel et al.
4 DETERMINING STELLAR MASSESAND AGES
Stellar masses are estimated by fitting the photometric data to syn-thetic spectra convolved by the filter transmission function, assum-ing a known photometric redshift. We use magnitudes corrected foraperture effects and scaled to the best-fitting spectral energy dis-tribution, which also provides the value for photometric redshift.For five objects this procedure produces K-band magnitudes fainterthan the detection limit and hence were excluded at this point.
EROs with a compact morphology are considered to be oldevolved systems, whose stellar population formed in a burst likeevent over a time span much shorter than their age. As such, popula-tion models comprising a single stellar population (SSP) or compos-ite population ‘τ -models’ with rapidly declining SFR (∝ exp (−t/τ ))should be adequate. For morphologically extended EROs, for theirsimilarities with galaxy discs, τ -models with more extended valuesof τ should provide a reasonable approximation to their star for-mation history. The masses presented here are therefore estimatedusing τ -models. Clearly, the true SFH of these galaxies may bemore complex, and we have fitted each galaxy SED with compositepopulations comprising a SSP and a τ -model. However, consider-ing the small number of available bands, these models suffer fromtoo much degeneracy.
The model predictions are based on the models from Charlot andBruzual (Bruzual 2007), and both stellar mass and age for variousstar formation histories were derived (see Section 4.1). The term‘age’ indicates the time between the start of the last episode ofstar formation (zf ) and the time these galaxies were observed, andtherefor represents a ‘upper’ limit. To simplify, we use ‘mass’ assynonym for ‘stellar mass’ throughout the paper.
4.1 Models
Independent of morphology, we have modelled all EROs with thesame set of models and parameters, described in Table 1.
The extinction was modelled with the Calzetti extinction law(Calzetti et al. 2000), assuming an average inclination, i.e. orienta-tion effects were not included.
The fitting procedure determines which combination of mass andage produces the best fit to the photometric data.
From all models (624 models for each ERO) we selected the onewith the lowest χ 2 as best fit. Fig. 5 shows an example for the χ 2
values obtained for one specific ERO (ero_141715.09+522142.6),one of the EROs with a compact morphology.
The shaded area (upper left plot) identifies the models withχ 2 − χ 2
best ≡ χ 2 ≤ 2.3, representing a confidence interval of68.3 per cent assuming two free parameter, stellar mass and age.The majority of models fit the available data poorly, but 10 modelsresult in χ 2 values similar to the best solution (for two pairs of
Table 1. Model parameter for mass estimates.
Parameter Range
IMF SalpeterRedshift of last SF a zf = 3–8, z = 1Age limit (Gyr) 0.01 – ageuniverse at zExponential decay time (Gyr) 0.05, 0.1, 0.5, 1.0, 4.0, 7.0Metallicity /Z� 0.2, 0.4, 1, 2.5AV (Calzetti extinction law) 0.6, 1.0, 2.0, 3.0
aRedshift at which the last episode of extended star formation started.
Figure 5. Example for the variation of χ2 as result of template fitting(ERO: ero_141715.09+522142.6). The dotted line represents the minimalχ2 value. The masses have been normalized to the mass of the best solutionMbest. Upper left: lower χ2 values for all possible parameter settings. Theshaded region indicates the mass range where χ2
min −χ2 ≤ 2.3, representinga confidence interval of 68.3 per cent with 2 degrees of freedom (mass andage of the stellar population). Upper right: The symbols represent differentformation redshifts: zf = 4 and 8 (cross, open circles). The colours showdifferent values of Av: red: Av = 0.6, green: Av = 1.0 and blue: Av = 2.0.The metallicity and exponential decay time cover the whole range. Lowerleft: Av = 0.6, τ = 0.5 Gyr, zf = 4, 6 and 7 (cross, diamond, open circles).Lower right: models with zf = 7, maximal or minimal decay times (τ = 0.5Gyr: black), τ = 7 Gyr: red), metallicity: not restricted.
models the χ 2 values can not be separated in this plot). The stellarmass for these models ranges from 0.7 × Mbest up to 1.8 × Mbest.
In the remaining three panels we kept some of the model pa-rameters fixed, in order to better separate the influence of specificparameters on χ 2. The upper right plot shows the influence offormation redshift (symbols) and dust content (colour), while theother parameters (metallicity and exponential decay time) cover thewhole range. For this specific object, models with higher formationredshifts and low extinction show significant better results. Never-theless, the quality of these models does not improve very muchby varying additional parameters like metallicity and exponentialdecay time. The combination of these parameters might change thestellar mass considerably (as seen in the upper left panel), withoutimproving the quality of already ‘good’ fits.
In the lower left panel we compare only models with an extinctionof Av = 0.6 and τ = 0.5 Gyr. We can see, that for zf = 6, themetallicity improves the fit quality significantly, while the stellarmass increases only slightly. A formation redshift zf = 7 providesbetter results in general, however, changing the metallicity does notlead to a lower χ 2. In general, the initial metallicity becomes lessinfluential if the object has been formed at earlier times. The lowerright panel in this figure shows models with zf = 7, τ = 0.5, 7.0 Gyrand Av = 0.6, 1.0. All models shown by the same symbol and samecolour vary only in their initial metallicity. It becomes clear thatfor longer exponential decay times, the initial metallicity becomes
C© 2011 The Authors, MNRAS 414, 2246–2264Monthly Notices of the Royal Astronomical Society C© 2011 RAS
Dow
nloaded from https://academ
ic.oup.com/m
nras/article/414/3/2246/1039390 by guest on 05 July 2022

The morphologies and masses of EROs 2251
Figure 6. Redshift distribution for all classes. The second panel shows the result for all objects with bulge and disc component, disc-dominated objects andobjects which could not be clearly classified as belonging to either of those.
more important. The χ 2 values for τ = 0.5 Gyr and Av = 0.6 and1.0 vary noticeable less than for τ = 7.0 Gyr.
This plot clearly illustrates that all the parameters influence eachother in non-linear way, e.g. the effect of one parameter on χ 2 doesnot have to be constant, if one of the remaining parameters changes.
At the moment we have not calculated the error in age and mass,however, the plot shows that the later can vary by a factor of 2.5with almost constant χ 2, depending on the specific SED template.At the same time, the age for this object will vary by less than30 per cent. Such uncertainties in stellar mass agree well with theresults of Elsner, Feulner & Hopp (2008), who estimated that errorsin redshift, M/LK ratio, photometry and errors attributed to templatefitting can add up to a mean uncertainty of about σ log M = 0.33 dex.For an extensive study of stellar mass estimators, their limitationsand uncertainties see Longhetti & Saracco (2009).
5 RESULTS
In this section we present our results regarding morphologies, stel-lar masses, ages and their evolution. Our catalogue is presentedin tabular form in the Appendix in Tables A1 and A2, where welist both photometric, morphological, structural and stellar popu-lation parameters. Fig. 6 shows the redshift distribution for eachmorphological class (see Section 3). The sample of compact ob-jects (class 1, upper left panel in Figs 12 and 13) and EROs withbulge and/or disc component (class 2a,b,c, upper right panels inFigs 12 and 13) show the clearest redshift distributions, with a peakbetween redshift 1 and 2. The large number of compact objectswith redshifts of 0.9 ≤ zphot ≤ 1.0 can not be explained by purelow number statistics, hence we looked at the spatial distribution ofcompact EROs in this region (Fig. 7). Four of the compact objectslie within a field of 1.1 arcmin radius (0.5 Mpc at z = 0.95). Thelarge number of such EROs in a very narrow redshift bin hints atan overdensity of compact objects, as we find only a total of eightsuch galaxies in the whole 155 arcmin2 field. The resulting surfacedensity is 20 times higher than the average value. However, the fourEROs lie in an interval zphot = zmax − zmin = 0.07 which, givenour typical zphot errors, is consistent with zero. In order to proofthe physical association of these EROs, spectroscopic redshifts arerequired.
In Fig. 8 we show a summary of the photometric properties[colour versus apparent magnitude (Ks), absolute magnitude (MK)
Figure 7. Spatial distribution of EROs in a section of Groth Strip. The blacksymbols show all EROs in this section of the field, red circles mark compactobjects (class 1) with redshifts of 0.9 ≤ zphot ≤ 1.0. The black circle with aradius of 1.1 arcmin, corresponds to 0.5 Mpc at redshift 0.95.
and redshift] of our EROs sample. We detect EROs from the detec-tion limit of our survey, Ks ∼ 21, up to Ks ≈ 18. In Fig. 8, left-handpanel, the distribution in colour-apparent magnitude has an apparenttriangular shape, such that the reddest EROs are only found at inter-mediate apparent magnitudes. On the faint side of this distribution,this is due to an observational bias given by the detection limit inF814W. On the bright side, the trend is real. It originates from thefact that the reddest EROs are among the most intrinsically lumi-nous of the sample, as portrayed in the central panel of Fig. 8, whichshows observed colour against K-band absolute magnitude. We de-tect a mild colour–absolute magnitude relation, but no significanttrend of colour with redshift (right-hand panel of Fig. 8).
All morphological classes are found at all magnitudes andcolours, nevertheless, most of the faint objects with irregularof merger characteristics have bluer colours than their brighter
C© 2011 The Authors, MNRAS 414, 2246–2264Monthly Notices of the Royal Astronomical Society C© 2011 RAS
Dow
nloaded from https://academ
ic.oup.com/m
nras/article/414/3/2246/1039390 by guest on 05 July 2022

2252 A. Hempel et al.
Figure 8. Photometric properties of the complete EROs sample: dependency of F814W − Ks colour on Ks, MK and redshift. The same symbols and coloursare used in all three panels, the sloped line indicates the colour limit assuming a detection limit of F814W lim = 25.8.
Figure 9. Ks-magnitude distribution (left-hand panel) and F814W−Ks colour distribution (right-hand panel) for our EROs sample, The colours are based onthe magnitudes derived from the best-fitting SED, and not aperture magnitudes. The red histograms represent EROs of class 1, green indicates objects of class 2a,b and c, i.e. EROs with discs. Irregular galaxies or merging candidates and not classified objects are shown in blue and black.
counterparts. Brighter EROs (Ks ≤ 19.5) are slightly dominatedby disc-like morphologies and EROs with an undetermined mor-phology are found at the fainter magnitudes (see also Fig. 9). Basedon our data set, we see no clear distinction of the photometric prop-erties between the morphological classes.
5.1 Morphology
From the visual classification of our sample we find that 34 ± 6 percent of our EROs have a compact morphology and 43 ± 6 per centhave a disc component. Irregular galaxies and merger candidatescontribute 14 ± 4 per cent, while 9 ± 3 per cent are not classifiabledue to low image quality. The uncertainties are quoted solely onthe basis of the statistical error of the number of EROs in thismorphological class.
Our result agrees well with Gilbank et al. (2003), who also findan almost equal fraction of spheroidal/compact EROs and disc-likeobjects among a sample of 224 EROs (K < 20, I814 − K) ≥ 4.0), 30and 35 per cent, respectively. 15 per cent of their EROs show a dis-turbed/irregular morphology. Nevertheless, this result is in contra-diction to Yan & Thompson (2003) and Moustakas et al. (2004). Theformer performed a visual classification of 115 EROs (F814W −Ks ≥ 4, 5σ median limiting Ks magnitude of ≈18.7) into four
broad categories: spheroids or pure bulge galaxies, bulge-dominatedgalaxies, disc-like systems with some evidence of a bulge and discswhich show no obvious bulge component. Yan and Thompson usethe same data set (MDS) as Gilbank et al. and find that approxi-mately 66 per cent of their EROs are discs or disc dominated andonly 34 per cent have morphologies consistent with bulges or arebulge dominated. These numbers refer to a total of 101 EROs (outof 115) for which the visual classification is either bulge, bulgedominated, discs or disc dominated. However, our results agree inregard to a large fraction of edge-on spirals, 57 ± 11 per cent ofEROs with discs show such an orientation, compared to 40 per centin the Yan et al. sample. Moustakas et al. find a combination of36 per cent early-type galaxies, 55 per cent late-type and 5 per centirregulars.
The most secure classifications of our sample (i.e. at least threeout of four classifiers agree) have been obtained for the objectsin class 1 (34 of 35), class 2a (13 of 13) and class 2b (25 of25). The classification for the members of class 2c and class 4is the least reliable, almost no object in either class (5/5 and 8/9 forclass 2c and class 4, respectively) shows an easy to distinguish orunique morphology. For class 3, consisting of irregular and mergercandidates, the classification is secure in about 50 per cent (8 of 14)of the sample.
C© 2011 The Authors, MNRAS 414, 2246–2264Monthly Notices of the Royal Astronomical Society C© 2011 RAS
Dow
nloaded from https://academ
ic.oup.com/m
nras/article/414/3/2246/1039390 by guest on 05 July 2022

The morphologies and masses of EROs 2253
Figure 10. Distribution of effective radius (for different morphologicalclasses). The black solid line in the central panel shows the result for thetotal of class 2.
5.2 Structural parameters
In Table A1. we list effective radii, Sersic index, axis ratios andmodel magnitudes, with their errors, for all of the EROs as pro-duced by galfit (if not stated otherwise, the effective radii are notcircularized), Fig. 10 shows the results of the structural analysis forthe different morphological classes. For six objects with a compactor undetermined morphology (5+1 objects of class 1 and class 4,respectively), the effective radii are extremely small, �0.1 kpc. Thevisual inspection of the original images revealed, that these EROsare barely resolved and although the overall quality of the fit iscomparable to the other targets, all parameters show large errorsand are very likely faint stars instead of galaxies (these objects havebeen marked in Table A1). On this basis we excluded these objectsfrom our analysis.
The EROs with compact morphology show the smallest medianeffective radii (1.19 ± 0.14 kpc), followed by EROs of mixed mor-phology (bulge+disc) and disc dominated, 3.31 ± 0.53 kpc and5.38 ± 0.50 kpc, respectively. Objects which could belong to eitherof the last two classes (objects with class 2c morphology) havemedian sizes of 4.91 ± 0.14 kpc. Sources which appear irregularor might be part of an ongoing merger and hence show a disturbedmorphology have median sizes of about 4.92 ± 1.06 kpc. The me-dian size of objects with no discernible morphology (class 4) is2.59 ± 0.69 kpc.
The median Sersic index for our compact EROs (class 1),n = 2.30 ± 0.34, is within the errors, in the range for quiescentgalaxies, n ≥ 2.5, used by Trujillo et al. (2007), based on the com-parison with local galaxies. EROs which appear to be pure discs or atleast disc dominated are best fitted with a Sersic index of n = 1.03 ±0.24, compared to a Sersic index of 1 for exponential profiles. Ob-jects with bulge and disc components have a median Sersic index ofn = 3.24 ± 0.55. This implies that the light distribution seems to bedominated by the bulge component, similar to the compact objects
Figure 11. Comparison of the axis ratios (derived with galfit), for all mor-phological classes. Colours are assigned to morphological class as in Fig. 10.
in class 1. The result for irregulars or merger candidates (n = 1.54 ±0.40) lies between compact EROs and disc dominated objects, aswe have seen for the effective radius. A median Sersic index ofn = 5.06 ± 1.61 would imply a very steep surface brightness profilefor objects with an unclassified morphology, however, the imageshave either a low quality and/or the targets are almost unresolved.
In our visual classification we consider ‘edge-on’ disc dominatedas separate morphological class (class 2b) and we would expect thatthese objects show smaller axis ratios (semiminor axis/semimajoraxis) than the other morphological types. The plot in Fig. 11 con-firms this expectation, showing an increasing axial ratio from anapparent ‘edge-on’ morphology, to ‘disc+bulge’ morphologies andthe more compact elliptical EROs (0.3 ± 0.03, 0.45 ± 0.06 and0.62 ± 0.04, respectively).
Using the masses determined in Section 4, we show in Fig. 17the stellar mass–size relation for EROs. The dot–dashed line showsthe relations for early-type galaxies (n ≥ 2.5) and the dashed linefor late-type galaxies (n < 2.5), based on the analysis of SDSSgalaxies by Shen et al. (2003). This figure shows that compactgalaxies deviate more clearly from the local relation than the othermorphological types, supporting the strong evolution of the stellarmass–size relation, as described by Trujillo et al. (2007) for themost massive galaxies.
5.3 Stellar masses
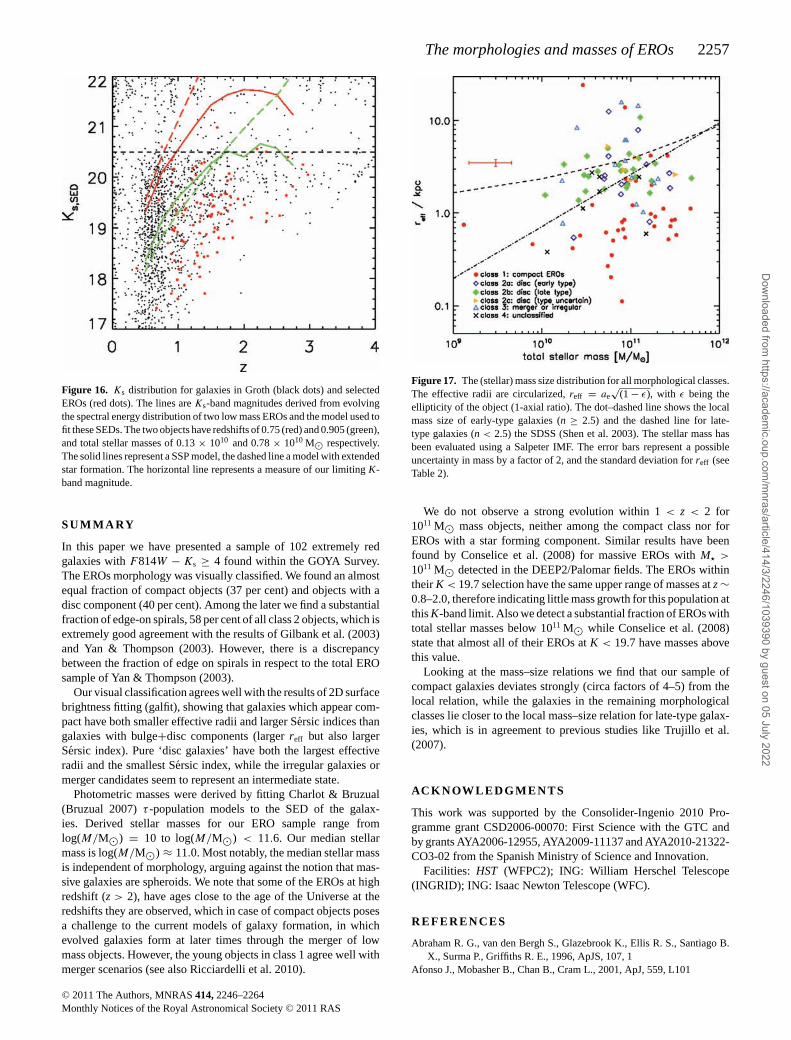
We now present stellar masses for 97 EROs in our sample, computedas outlined in Section 4. The output of the mass code, namely stellarmass and population age, are shown against redshift in Figs 12 and13, respectively (see also Table A2). The vertical error bar in thetop-left panel of Fig. 12 indicates the typical uncertainty of 0.3 dex.In Fig. 13, where ages are shown against redshift, lines correspondto formation redshifts as detailed in the legend. The median andrms of the total stellar mass of each morphological class are givenin Table 2, and displayed in Fig. 14. Stellar masses for our ERO
C© 2011 The Authors, MNRAS 414, 2246–2264Monthly Notices of the Royal Astronomical Society C© 2011 RAS
Dow
nloaded from https://academ
ic.oup.com/m
nras/article/414/3/2246/1039390 by guest on 05 July 2022

2254 A. Hempel et al.
Figure 12. Total (stellar) masses for all morphological classes. The error bar in the upper left panel indicates the uncertainties in the mass estimates based onthe SED fitting (Mmax/Mmin = 2).
sample range from log(M/M�) = 10.0 to log(M/M�) = 11.8. Me-dian stellar masses lie between log(M/M�) = 10.7 and 11.0. Themedian masses change little from one morphological class to an-other. Such independence of stellar mass with morphological class isthe main result of this paper. This result was not expected. The com-mon understanding that the most massive galaxies are ellipticals ledus to expect EROs with disc or (major) merger morphologies to havesignificantly lower masses than EROs with compact morphologies.One third of the EROs with a disc dominated morphology (24 EROsin class2b) have masses above 1011M� suggests a mechanism tobuild up massive galaxies that does not involve dissipationless merg-ers. Such galaxies may have grown through cold accretion (Dekelet al. 2009); alternatively, massive disc-shaped EROs, which mustcontain vast amounts of dust, are also candidates for remnants ofvery gas rich major mergers (Hopkins et al. 2009). That EROs in-clude disc-shaped objects with a range of bulge prominence may
indicate that the build-up of bulge components in disc galaxies be-tween redshifts 2 and 1 (e.g. Dekel, Sari & Ceverino 2009) includesimportant dusty phases.
Due to the large scattering in mass between the members ofeach class and the low numbers, no significant difference in medianstellar mass is evident, including the EROs belonging to class 4,whose mean stellar mass [log(M/M�) = 10.7] differs by approx.1σ from the other morphological classes (see Fig. 14).
Below we discuss each morphological class in more detail.
(i) Class 1: compact EROs. The compact morphology of theseobjects is rather distinct and closely resembles those of an ellipticalgalaxy with a dominant old stellar population and no or very lowongoing star formation. For most EROs (21 of 34) in this sample thedecay times are 100 Myr and less, i.e. the period of star formation isextremely short and on first look resembles a single burst. However,
C© 2011 The Authors, MNRAS 414, 2246–2264Monthly Notices of the Royal Astronomical Society C© 2011 RAS
Dow
nloaded from https://academ
ic.oup.com/m
nras/article/414/3/2246/1039390 by guest on 05 July 2022

The morphologies and masses of EROs 2255
Figure 13. Stellar ages based on an exponential declining star formation. The lines correspond to the maximal possible age for a galaxy formed at zf = 8, 6,4, 3, if observed at the given redshift (from top to bottom, red line corresponds to zf = 6).
Table 2. Median of total stellar mass, size (ae) and Sersic index (n) for each morphological class.The results for reff ) and Sersic index consider only the EROs for which also masses are available. Wehave excluded objects which diver more than 3 standard deviations from the median value.
Morphological class log(M�) σ log(M�) size (ae) σae n σn(kpc) (kpc)
Class 1 : compact 10.99 0.07 1.22 0.14 2.30 0.34Class 2a : disc + bulge 10.95 0.09 3.31 0.53 3.24 0.55Class 2b : pure (edge-on) disc 10.93 0.08 5.50 0.51 1.03 0.24Class 2c : disc + bulge (unclassified) 10.93 0.07 4.91 0.14 1.72 0.40Class 3 : irregular or merger 10.98 0.07 4.92 1.06 1.54 0.40Class 4 : unclassified 10.69 0.13 2.59 0.69 3.89 1.56
All: 10.66 0.04 3.48 0.29 2.07 0.20
C© 2011 The Authors, MNRAS 414, 2246–2264Monthly Notices of the Royal Astronomical Society C© 2011 RAS
Dow
nloaded from https://academ
ic.oup.com/m
nras/article/414/3/2246/1039390 by guest on 05 July 2022

2256 A. Hempel et al.
Figure 14. Distribution of total stellar mass for distinct morphologies. Thevertical lines show the median of each distribution (see Table 2).
Fig. 15 illustrates that for some objects the ratio between t(zf ) − t(z)and τ is rather small, indicating that these EROs might still forma certain amount of stellar mass. Using a threshold of age/τ = 6(Fontana et al. 2009) to separate active and quiescent galaxies, 67 ±14 per cent (23/34) of our compact galaxies qualify as quiescent.The fraction of quiescent galaxies among the ‘bulge+disc’ galaxiesis 84 ± 25 per cent (11/13), and drops to 58 ± 15 per cent (14/24) fordisc dominated galaxies. Combining the galaxies which are eitherpure bulges (class 1) or show bulge+disc structure (class 2a), wefind that approximately 72 per cent (34/47) of this subsample wouldqualify as quiescent galaxies.
Nevertheless, we find that more than 50 per cent of the entirecompact ERO sample have ages of less than 1 Gyr. The youngestobject in this class has an apparent age of 0.1 Gyr.
The deficiency of low-mass objects (M < 5 × 10¹⁰ M�) at higherredshifts is result of the limited depth of our survey. This impressionis largely caused by two z ∼ 1 objects with masses log(M/M�) <
10. We have tested the detectability of these two low-mass objectsat higher redshifts by simulating their appearance as a function ofz, assuming passive evolution (Fig. 16). The simulations show thatthe lack of low-mass objects at higher redshift is the result of thelimited depth of our survey.
(ii) Class 2a, 2b and 2c: EROs with disc component. In thisclass we find no objects with masses below log(M/M�) < 10.Contrary to the compact class, objects with disc components andwith masses between 10.2 < log(M/M�) < 11.5 are found in thewhole redshift range, up to redshift 2.5. This behaviour is clearly
Figure 15. Ratio between population age at the time of observation and theexponential decay time τ against redshift, for EROs with compact morphol-ogy (red), bulge+disc (purple) and disc dominated (green).
visible in panels assigned to class 2 objects in Fig. 12. The massdistributions of the three subclasses differ due to the limited redshiftintervals where objects of each class are found, the mean stellar ofall morphological types (with disc component) agree well withintheir accuracy (see Table 2).
Similar to compact EROs, we find a significant number of objectswith stellar populations of more than 1 Gyr of age, both amongEROs with and without bulge component. However, no object seemsto be younger than 0.3 Gyr, although we would expect these to havelower ages than the compact EROs. For approximately 2/3 of thispopulation, the last star formation event started not later that zf = 3(see also Fig. 13).
(iii) Class 3: irregular/merging EROs. The majority of objectsin this class have masses of approximately 1011 M�, similar to themasses of compact objects or disc-like systems. For none of theseobjects the last episode of star formation started later than redshift4, suggesting that population ages of less than 1 Gyr are the resultof continuous star formation.
(iv) Class 4: unclassified. The median stellar mass of this class isslightly lower, 4.6 × 10¹⁰ M�. Like the irregular or merging EROs,the members of this class started forming their stellar mass veryearly, at redshift 4 and higher. With one notable exception, the EROat redshift 2.98 (ero_141755.44+522928.5), the stellar populationin this group is older than 1 Gyr.
Considering that the mass estimates can vary by factors of 2, wefind no dependency of average total mass on the morphological typeof our ERO sample. The stellar mass–size relation (Fig. 17) showsa clear dependence on morphological type, with compact galaxies(class 1) having significant smaller sizes than EROs with differentmorphologies.
C© 2011 The Authors, MNRAS 414, 2246–2264Monthly Notices of the Royal Astronomical Society C© 2011 RAS
Dow
nloaded from https://academ
ic.oup.com/m
nras/article/414/3/2246/1039390 by guest on 05 July 2022
The morphologies and masses of EROs 2257
Figure 16. Ks distribution for galaxies in Groth (black dots) and selectedEROs (red dots). The lines are Ks-band magnitudes derived from evolvingthe spectral energy distribution of two low mass EROs and the model used tofit these SEDs. The two objects have redshifts of 0.75 (red) and 0.905 (green),and total stellar masses of 0.13 × 10¹⁰ and 0.78 × 10¹⁰ M� respectively.The solid lines represent a SSP model, the dashed line a model with extendedstar formation. The horizontal line represents a measure of our limiting K-band magnitude.
SUMMARY
In this paper we have presented a sample of 102 extremely redgalaxies with F814W − Ks ≥ 4 found within the GOYA Survey.The EROs morphology was visually classified. We found an almostequal fraction of compact objects (37 per cent) and objects with adisc component (40 per cent). Among the later we find a substantialfraction of edge-on spirals, 58 per cent of all class 2 objects, which isextremely good agreement with the results of Gilbank et al. (2003)and Yan & Thompson (2003). However, there is a discrepancybetween the fraction of edge on spirals in respect to the total EROsample of Yan & Thompson (2003).
Our visual classification agrees well with the results of 2D surfacebrightness fitting (galfit), showing that galaxies which appear com-pact have both smaller effective radii and larger Sersic indices thangalaxies with bulge+disc components (larger reff but also largerSersic index). Pure ‘disc galaxies’ have both the largest effectiveradii and the smallest Sersic index, while the irregular galaxies ormerger candidates seem to represent an intermediate state.
Photometric masses were derived by fitting Charlot & Bruzual(Bruzual 2007) τ -population models to the SED of the galax-ies. Derived stellar masses for our ERO sample range fromlog(M/M�) = 10 to log(M/M�) < 11.6. Our median stellarmass is log(M/M�) ≈ 11.0. Most notably, the median stellar massis independent of morphology, arguing against the notion that mas-sive galaxies are spheroids. We note that some of the EROs at highredshift (z > 2), have ages close to the age of the Universe at theredshifts they are observed, which in case of compact objects posesa challenge to the current models of galaxy formation, in whichevolved galaxies form at later times through the merger of lowmass objects. However, the young objects in class 1 agree well withmerger scenarios (see also Ricciardelli et al. 2010).
Figure 17. The (stellar) mass size distribution for all morphological classes.The effective radii are circularized, reff = ae
√(1 − ε), with ε being the
ellipticity of the object (1-axial ratio). The dot–dashed line shows the localmass size of early-type galaxies (n ≥ 2.5) and the dashed line for late-type galaxies (n < 2.5) the SDSS (Shen et al. 2003). The stellar mass hasbeen evaluated using a Salpeter IMF. The error bars represent a possibleuncertainty in mass by a factor of 2, and the standard deviation for reff (seeTable 2).
We do not observe a strong evolution within 1 < z < 2 for1011 M� mass objects, neither among the compact class nor forEROs with a star forming component. Similar results have beenfound by Conselice et al. (2008) for massive EROs with M� >
1011 M� detected in the DEEP2/Palomar fields. The EROs withintheir K < 19.7 selection have the same upper range of masses at z ∼0.8–2.0, therefore indicating little mass growth for this population atthis K-band limit. Also we detect a substantial fraction of EROs withtotal stellar masses below 1011 M� while Conselice et al. (2008)state that almost all of their EROs at K < 19.7 have masses abovethis value.
Looking at the mass–size relations we find that our sample ofcompact galaxies deviates strongly (circa factors of 4–5) from thelocal relation, while the galaxies in the remaining morphologicalclasses lie closer to the local mass–size relation for late-type galax-ies, which is in agreement to previous studies like Trujillo et al.(2007).
ACKNOWLEDGMENTS
This work was supported by the Consolider-Ingenio 2010 Pro-gramme grant CSD2006-00070: First Science with the GTC andby grants AYA2006-12955, AYA2009-11137 and AYA2010-21322-CO3-02 from the Spanish Ministry of Science and Innovation.
Facilities: HST (WFPC2); ING: William Herschel Telescope(INGRID); ING: Isaac Newton Telescope (WFC).
REFERENCES
Abraham R. G., van den Bergh S., Glazebrook K., Ellis R. S., Santiago B.X., Surma P., Griffiths R. E., 1996, ApJS, 107, 1
Afonso J., Mobasher B., Chan B., Cram L., 2001, ApJ, 559, L101
C© 2011 The Authors, MNRAS 414, 2246–2264Monthly Notices of the Royal Astronomical Society C© 2011 RAS
Dow
nloaded from https://academ
ic.oup.com/m
nras/article/414/3/2246/1039390 by guest on 05 July 2022

2258 A. Hempel et al.
Alexander D. M., Vignali C., Bauer F. E., Brandt W. N., Hornschemeier A.E., Garmire G. P., Schneider D. P., 2002, AJ, 123, 1149
Balcells M., Cristobal-Hornillos D., Prieto M., Guzman R., Gallego J.,Serrano A., Cardiel N., Pello R., 2002, Newsletter Isaac Newton GroupTelesc., 6, 11
Bolzonella M., Miralles J.-M., Pello R., 2000, A&A, 363, 476Brusa M. et al., 2005, A&A, 432, 69Bruzual A. G., 2007, in Vazdekis A., Peletier R. F., eds, Proc. IAU Sym-
posium 241, On TP-AGB Stars and the Mass of Galaxies, CambridgeUniv. Press, Cambridge p. 125
Bruzual G., Charlot S., 2003, MNRAS, 344, 1000Calzetti D., Armus L., Bohlin R. C., Kinney A. L., Koornneef J., Storchi-
Bergmann T., 2000, ApJ, 533, 682Cappellari M. et al., 2009, ApJ, 704, L34Cenarro A. J., Trujillo I., 2009, ApJ, 696, L43Cimatti A. et al., 2002, A&A, 391, L1Conselice C. J., 2006, ApJ, 638, 686Conselice C. J., Bundy K., U V., Eisenhardt P., Lotz J., Newman J., 2008,
MNRAS, 383, 1366Cristobal-Hornillos D., Balcells M., Prieto M., Guzman R., Gallego J.,
Cardiel N., Serrano A., Pello R., 2003, ApJ, 595, 71Daddi E. et al., 2005, ApJ, 631, L13De Lucia G., Springel V., White S. D. M., Croton D., Kauffmann G., 2006,
MNRAS, 366, 499Dekel A. et al., 2009, Nat, 457, 451Dekel A., Sari R., Ceverino D., 2009, ApJ, 703, 785Desai V. et al., 2007, ApJ, 660, 1151de Vaucouleurs G., 1948, Ann. Astrophys., 11, 247Domınguez-Palmero L., Balcells M., Erwin P., Prieto M., Cristobal-
Hornillos D., Eliche-Moral M. C., Guzman R., 2008, A&A, 488, 1167Dressler A., Lynden Bell D., Burstein D., Davies R. L., Faber S. M., Terlevich
R., Wegner G., 1987, ApJ, 313, 42Eliche-Moral M. C., Balcells M., Prieto M., Garcıa-Dabo C. E., Erwin P.,
Cristobal-Hornillos D., 2006, ApJ, 639, 644Eliche-Moral M. C. et al., 2010, A&A, 519, A55+Ellis R. S., Abraham R. G., Dickinson M., 2001, ApJ, 551, 111Elsner F., Feulner G., Hopp U., 2008, A&A, 477, 503Elston R., Rieke G. H., Rieke M. J., 1988, ApJ, 331, L77Elston R., Rieke M. J., Rieke G. H., 1989, ApJ, 341, 80Fontana A. et al., 2004, A&A, 424, 23Fontana A. et al., 2009, A&A, 501, 15Fu H., Stockton A., Liu M., 2005, ApJ, 632, 831Gilbank D. G., Smail I., Ivison R. J., Packham C., 2003, MNRAS, 346, 1125Glazebrook K. et al., 2004, Nat, 430, 181Gonzalez-Perez V., Baugh C. M., Lacey C. G., Almeida C., 2009, MNRAS,
398, 497Groth E. J., Kristian J. A., Lynds R., O’Neil E. J., Jr, Balsano R., Rhodes J.,
1994, BAAS, 26, 1403Hayashi M., Shimasaku K., Motohara K., Yoshida M., Okamura S.,
Kashikawa N., 2007, ApJ, 660, 72Hopkins P. F. et al., 2009, MNRAS, 397, 802Hu E. M., Ridgway S. E., 1994, AJ, 107, 1303Huertas-Company M. et al., 2008, A&A, 478, 971Im M. et al., 2002, ApJ, 571, 136Kassin S. A. et al., 2007, ApJ, 660, L35
Kauffmann G., White S. D. M., Guiderdoni B., 1993, MNRAS, 264, 201Kitzbichler M. G., White S. D. M., 2006, MNRAS, 366, 858La Barbera F., Busarello G., Merluzzi P., de la Rosa I. G., Coppola G.,
Haines C. P., 2008, ApJ, 689, 913Labbe I. et al., 2005, ApJ, 624, L81Longhetti M., Saracco P., 2009, MNRAS, 394, 774Lopez-Sanjuan C. et al., 2009, ApJ, 694, 643Maraston C., 2005, MNRAS, 362, 799Moustakas L. A. et al., 2004, ApJ, 600, L131Papovich C., 2006, New Astron. Rev., 50, 134Peng C. Y., Ho L. C., Impey C. D., Rix H., 2002, AJ, 124, 266Pozzetti L., Bruzual A. G., Zamorani G., 1996, MNRAS, 281, 953Prieto M., Balcells M., Domınguez-Palmero L., Cristobal-Hornillos D.,
Erwin P., Eliche-Moral C., Abreu D., 2005, Revista Mexicana Astron.Astrofis. Conf. Ser., 24, 270
Ratnatunga K. U., Griffiths R. E., Ostrander E. J., 1999, AJ, 118, 86Reda F. M., Forbes D. A., Hau G. K. T., 2005, MNRAS, 360, 693Ricciardelli E., Trujillo I., Buitrago F., Conselice C. J., 2010, MNRAS, 406,
230Roche N. D., Almaini O., Dunlop J., Ivison R. J., Willott C. J., 2002,
MNRAS, 337, 1282Roche N. D., Dunlop J., Almaini O., 2003, MNRAS, 346, 803Sarajedini V. L. et al., 2006, ApJS, 166, 69Shen S., Mo H. J., White S. D. M., Blanton M. R., Kauffmann G., Voges
W., Brinkmann J., Csabai I., 2003, MNRAS, 343, 978Simard L. et al., 2002, ApJS, 142, 1Somerville R. S., Primack J. R., Faber S. M., 2001, MNRAS, 320, 504Somerville R. S. et al., 2004, ApJ, 600, L135Stockton A., McGrath E., Canalizo G., 2006, ApJ, 650, 706Tinsley B. M., Gunn J. E., 1976, ApJ, 203, 52Treu T. et al., 2005, ApJ, 633, 174Trujillo I. et al., 2006, MNRAS, 373, L36Trujillo I., Conselice C. J., Bundy K., Cooper M. C., Eisenhardt P., Ellis
R. S., 2007, MNRAS, 382, 109Tully R. B., Fisher J. R., 1977, A&A, 54, 661Vaduvescu O., McCall M. L., 2008, A&A, 487, 147Weiner B. J. et al., 2005, ApJ, 620, 595White S. D. M., Rees M. J., 1978, MNRAS, 183, 341Yan L., Thompson D., 2003, ApJ, 586, 765Yan H. et al., 2004, ApJ, 616, 63
APPENDIX A: TABLE A1
Summary of photometric, morphological and structural parameters[(1) target name, (2) photometric redshift, (3) visual classification,(4) security of the vote, (5) aperture magnitude F814W, (6) aperturemagnitude – Ks, (7) colour, (8) size – ae (half-light radius alongsemimajor axis), (9) Sersic index, (10) axial ratio (b/a), (11) F814Wmagnitude from galfit, (12) reduced χ 2 by galfit]. Objects markedwith ∗ fulfil also the colour criteria for DRGs: J − K > 2.3. Thesmall photometric errors are SEXTRACTOR errors only. Objects markedwith # show extremely low effective radii (reff ≤ 0.01 kpc) and wereexcluded from our final target list.
C© 2011 The Authors, MNRAS 414, 2246–2264Monthly Notices of the Royal Astronomical Society C© 2011 RAS
Dow
nloaded from https://academ
ic.oup.com/m
nras/article/414/3/2246/1039390 by guest on 05 July 2022

The morphologies and masses of EROs 2259
Tabl
eA
1.Su
mm
ary
ofph
otom
etri
c,m
orph
olog
ical
and
stru
ctur
alpa
ram
eter
s.Fo
ran
expl
anat
ion
ofth
eco
lum
nspl
ease
see
the
text
inth
isse
ctio
n.
Nam
ez p
hot
Cla
ssV
ote
F814
WK
sF8
14W
−Ks
a en
Axi
alra
tioF8
14W
GA
LFI
Tχ
2 GA
LFI
T(m
ag)
(mag
)(m
ag)
(kpc
)(m
ag)
(1)
(2)
(3)
(4)
(5)
(6)
(7)
(8)
(9)
(10)
(11)
(12)
ero_
1415
20.4
3+52
0300
.80.
92±
0.13
1Se
cure
23.8
7±
0.08
19.8
2±
0.14
4.05
0.69
±0.
176.
86±
3.99
0.37
±0.
1223
.50
±0.
080.
720
ero_
1415
21.6
7+52
0358
.00.
97±
0.14
1Se
cure
23.6
7±
0.03
19.6
6±
0.89
4.01
1.32
±0.
181.
75±
0.63
0.85
±0.
1624
.13
±0.
000.
720
ero_
1415
21.7
2+52
0354
.21.
04±
0.14
3U
nsec
ure
23.7
4±
0.01
18.9
7±
0.01
4.77
1.34
±0.
191.
75±
0.63
0.85
±0.
1624
.13
±0.
000.
720
ero_
1415
24.8
0+52
0419
.00.
95±
0.14
1Se
cure
23.6
1±
0.03
19.3
2±
0.03
4.29
2.76
±0.
351.
70±
0.38
0.71
±0.
0723
.36
±0.
080.
716
ero_
1415
26.1
2+52
0555
.91.
61±
0.18
2cU
nsec
ure
24.1
5±
0.02
19.2
4±
0.03
4.91
4.66
±1.
021.
53±
0.49
0.31
±0.
0523
.97
±0.
140.
709
ero_
1415
26.2
9+52
0417
.52.
34±
0.23
2bSe
cure
25.1
2±
0.01
20.6
5±
0.53
4.47
3.56
±0.
350.
33±
0.25
0.15
±0.
0524
.48
±0.
100.
734
ero_
1415
26.5
4+52
0258
.11.
75±
0.19
1Se
cure
24.9
5±
0.02
20.4
2±
0.95
4.53
1.72
±0.
412.
58±
1.81
0.24
±0.
1324
.46
±0.
120.
733
ero_
1415
26.6
5+52
0405
.00.
91±
0.13
1Se
cure
24.9
4±
0.02
20.8
2±
0.27
4.12
0.54
±0.
140.
13±
2.51
0.75
±0.
3624
.95
±0.
080.
755
ero_
1415
28.8
9+52
0415
.9#
2.00
±0.
211
Secu
re24
.49
±0.
4620
.46
±0.
514.
030.
01±
0.56
9.09
±17
4.96
0.99
±3.
9324
.16
±12
.95
0.74
2er
o_14
1530
.47+
5205
04.3
0.68
±0.
122b
Secu
re21
.76
±0.
0017
.73
±0.
034.
0320
.17
±1.
881.
50±
0.13
0.29
±0.
0120
.55
±0.
081.
591
ero_
1415
31.9
1+52
0339
.01.
52±
0.18
1U
nsec
ure
23.9
8±
0.37
19.7
4±
0.61
4.24
0.51
±0.
073.
29±
1.66
0.98
±0.
2223
.55
±0.
040.
715
ero_
1415
32.1
9+52
0438
.61.
40±
0.17
1Se
cure
24.0
7±
0.03
20.0
6±
0.13
4.01
0.44
±0.
2612
.81
±17
.93
0.21
±0.
1423
.84
±0.
380.
718
ero_
1415
34.6
3+52
0303
.02.
67±
0.26
2bSe
cure
24.9
9±
0.01
20.4
5±
0.26
4.54
2.60
±0.
610.
07±
0.60
0.40
±0.
1425
.07
±0.
251.
959
ero_
1415
41.3
4+52
0749
.71.
09±
0.15
3Se
cure
22.7
5±
0.02
18.5
0±
0.02
4.25
10.3
8±
1.68
2.02
±0.
280.
66±
0.04
21.8
8±
0.13
0.74
4er
o_14
1541
.93+
5206
39.0
1.70
±0.
191
Secu
re23
.52
±0.
0319
.24
±0.
434.
271.
64±
0.15
1.58
±0.
470.
46±
0.06
23.4
8±
0.04
0.73
0er
o_14
1542
.14+
5206
43.8
0.94
±0.
142b
Secu
re23
.71
±0.
0119
.43
±0.
014.
288.
26±
0.57
0.15
±0.
080.
10±
0.04
23.7
1±
0.16
1.09
6er
o_14
1544
.23+
5207
31.9
1.09
±0.
152b
Secu
re24
.13
±0.
0120
.00
±0.
014.
138.
34±
10.2
40.
04±
0.12
0.16
±0.
0424
.50
±0.
000.
776
ero_
1415
46.6
0+52
0921
.11.
77±
0.19
4U
nsec
ure
24.8
7±
0.01
20.4
4±
0.78
4.43
3.19
±6.
060.
05±
0.48
0.29
±0.
0824
.91
±0.
130.
718
ero_
1415
47.5
7+52
0653
.51.
52±
0.18
2bSe
cure
24.2
0±
0.02
20.1
5±
0.87
4.05
3.03
±0.
742.
37±
0.99
0.44
±0.
0923
.88
±0.
150.
740
ero_
1415
47.8
1+52
0912
.0∗
1.83
±0.
203
Uns
ecur
e23
.15
±0.
0319
.10
±0.
074.
0530
.80
±94
.13
19.7
3±
18.0
80.
22±
0.04
22.3
6±
0.92
0.76
4er
o_14
1550
.16+
5207
06.3
1.60
±0.
182b
Secu
re23
.80
±0.
0119
.44
±0.
424.
374.
46±
0.42
0.74
±0.
160.
59±
0.04
23.4
4±
0.06
0.73
2er
o_14
1551
.31+
5209
54.3
0.97
±0.
141
Secu
re24
.00
±0.
0319
.73
±0.
044.
280.
71±
0.19
5.83
±4.
200.
66±
0.17
23.7
3±
0.15
0.72
3er
o_14
1551
.59+
5210
30.1
1.06
±0.
142a
Secu
re23
.56
±0.
0319
.20
±0.
024.
367.
25±
4.61
6.28
±2.
620.
32±
0.05
22.8
8±
0.29
0.72
7er
o_14
1552
.93+
5207
01.4
1.54
±0.
181
Secu
re23
.67
±0.
0319
.36
±0.
544.
311.
75±
0.20
2.36
±0.
740.
48±
0.07
23.4
2±
0.06
0.73
6er
o_14
1552
.95+
5207
39.5
1.79
±0.
201
Secu
re24
.35
±0.
0320
.01
±0.
164.
340.
86±
0.22
3.80
±2.
790.
70±
0.17
24.0
0±
0.13
0.76
4er
o_14
1553
.33+
5207
18.4
1.32
±0.
163
Secu
re23
.81
±0.
0119
.27
±0.
024.
553.
08±
1.84
0.05
±0.
210.
62±
0.08
24.0
9±
0.09
0.80
8er
o_14
1557
.80+
5210
52.2
0.90
±0.
132b
Secu
re23
.08
±0.
0018
.82
±0.
374.
256.
08±
0.43
0.82
±0.
110.
46±
0.02
22.7
8±
0.05
0.71
9er
o_14
1559
.96+
5210
57.4
0.98
±0.
141
Secu
re22
.53
±0.
0318
.48
±0.
074.
0515
.23
±15
.24
11.1
1±
4.07
0.83
±0.
0621
.42
±0.
400.
756
ero_
1416
00.3
8+52
0846
.21.
71±
0.19
2bSe
cure
24.2
6±
0.00
20.0
8±
0.68
4.17
4.67
±0.
350.
28±
0.14
0.37
±0.
0423
.95
±0.
080.
749
ero_
1416
00.9
7+52
0908
.01.
34±
0.16
2bSe
cure
24.4
0±
0.02
20.2
1±
0.68
4.19
3.13
±0.
260.
31±
0.20
0.30
±0.
0424
.24
±0.
070.
711
ero_
1416
01.2
2+52
1101
.4∗
0.94
±0.
142c
Uns
ecur
e23
.44
±0.
0318
.97
±0.
024.
475.
14±
0.91
2.15
±0.
470.
32±
0.03
23.1
3±
0.11
0.75
8er
o_14
1603
.15+
5211
40.8
1.05
±0.
143
Secu
re24
.10
±0.
0019
.20
±0.
014.
904.
40±
7.03
0.04
±0.
150.
71±
0.10
24.2
1±
0.00
0.75
0er
o_14
1604
.29+
5209
25.9
2.74
±0.
261
Secu
re24
.57
±0.
0220
.29
±0.
054.
280.
99±
0.12
0.72
±0.
600.
46±
0.10
24.3
2±
0.06
0.72
0er
o_14
1605
.16+
5209
03.5
0.90
±0.
134
Secu
re24
.52
±0.
0120
.41
±0.
444.
116.
81±
3.76
3.08
±1.
640.
17±
0.04
24.0
2±
0.31
0.74
3er
o_14
1608
.87+
5211
32.3
2.35
±0.
233
Uns
ecur
e23
.92
±0.
0319
.87
±0.
824.
0538
.01
±98
.69
11.7
0±
10.4
00.
17±
0.03
22.7
2±
1.01
0.72
5er
o_14
1611
.77+
5213
16.9
1.28
±0.
161
Secu
re23
.95
±0.
7219
.91
±0.
044.
030.
34±
82.8
30.
02±
99.0
00.
61±
99.0
024
.67
±99
.00
1.05
2er
o_14
1617
.81+
5214
13.4
#1.
75±
0.19
1Se
cure
24.1
4±
0.31
19.8
5±
0.93
4.29
0.01
±0.
067.
03±
17.2
30.
79±
11.8
623
.90
±0.
000.
781
ero_
1416
20.2
3+52
1317
.22.
20±
0.22
2bSe
cure
25.3
2±
0.01
21.1
7±
0.49
4.15
3.97
±0.
440.
08±
0.29
0.21
±0.
0524
.83
±0.
120.
723
ero_
1416
28.3
3+52
1419
.31.
80±
0.20
2bSe
cure
24.2
7±
0.01
20.2
4±
0.19
4.03
6.52
±1.
841.
99±
0.72
0.19
±0.
0423
.93
±0.
180.
704
ero_
1416
29.5
2+52
1507
.61.
27±
0.16
2aSe
cure
24.8
6±
0.02
20.5
5±
0.81
4.31
1.24
±0.
170.
85±
0.71
0.19
±0.
1724
.57
±0.
070.
743
C© 2011 The Authors, MNRAS 414, 2246–2264Monthly Notices of the Royal Astronomical Society C© 2011 RAS
Dow
nloaded from https://academ
ic.oup.com/m
nras/article/414/3/2246/1039390 by guest on 05 July 2022

2260 A. Hempel et al.
Tabl
eA
1–
cont
inue
d
Nam
ez p
hot
Cla
ssV
ote
F814
WK
sF8
14W
−Ks
a en
axia
lrat
ioF8
14W
GA
LFI
Tχ
2 GA
LFI
T(m
ag)
(mag
)(m
ag)
(kpc
)(m
ag)
(1)
(2)
(3)
(4)
(5)
(6)
(7)
(8)
(9)
(10)
(11)
(12)
ero_
1416
31.8
7+52
1739
.00.
71±
0.12
3Se
cure
23.9
8±
0.02
19.9
2±
0.05
4.05
4.73
±0.
410.
64±
0.21
0.23
±0.
0323
.79
±0.
070.
706
ero_
1416
33.3
6+52
1639
.72.
12±
0.22
1Se
cure
24.7
6±
0.09
19.9
3±
0.94
4.83
0.52
±0.
120.
69±
1.42
1.00
±0.
3924
.60
±0.
060.
711
ero_
1416
34.2
3+52
1722
.71.
23±
0.16
2cU
nsec
ure
23.5
5±
0.01
19.4
8±
0.45
4.08
8.44
±1.
741.
85±
0.39
0.39
±0.
0423
.03
±0.
150.
712
ero_
1416
34.7
5+52
1728
.82.
54±
0.25
1Se
cure
24.0
0±
0.03
19.7
2±
0.96
4.27
1.14
±0.
243.
22±
1.86
0.53
±0.
1124
.01
±0.
110.
738
ero_
1416
35.7
4+52
1451
.01.
40±
0.17
1Se
cure
23.0
6±
0.03
18.8
7±
0.08
4.19
1.24
±0.
102.
99±
0.60
0.54
±0.
0522
.69
±0.
030.
709
ero_
1416
36.3
2+52
1805
.91.
22±
0.16
4U
nsec
ure
24.8
6±
0.01
20.6
2±
0.54
4.25
2.76
±2.
604.
08±
3.73
0.99
±0.
3424
.35
±0.
510.
729
ero_
1416
36.4
1+52
1449
.01.
65±
0.19
2bSe
cure
24.1
5±
0.02
20.0
1±
0.27
4.14
4.87
±0.
500.
51±
0.14
0.25
±0.
0323
.81
±0.
070.
717
ero_
1416
36.6
7+52
1806
.81.
35±
0.16
2aSe
cure
23.7
6±
0.03
19.1
3±
0.67
4.63
5.32
±1.
001.
88±
0.44
0.40
±0.
0423
.33
±0.
120.
731
ero_
1416
39.5
7+52
1810
.21.
71±
0.19
2bSe
cure
23.9
7±
0.01
19.8
8±
0.13
4.09
5.98
±0.
240.
16±
0.09
0.17
±0.
0223
.65
±0.
060.
722
ero_
1416
42.0
5+52
1601
.71.
49±
0.17
2bSe
cure
24.0
8±
0.00
19.8
5±
0.26
4.22
9.08
±0.
680.
26±
0.11
0.23
±0.
0223
.69
±0.
070.
707
ero_
1416
42.2
0+52
1641
.70.
92±
0.13
2bSe
cure
25.1
7±
0.01
20.2
5±
0.82
4.93
2.24
±0.
320.
76±
0.37
0.48
±0.
0924
.55
±0.
100.
801
ero_
1416
42.2
5+52
1820
.20.
90±
0.13
2cU
nsec
ure
25.2
8±
0.01
20.9
3±
0.56
4.35
1.53
±0.
351.
47±
1.09
0.62
±0.
1724
.72
±0.
140.
734
ero_
1416
43.7
9+52
1915
.41.
82±
0.20
1Se
cure
23.9
6±
0.03
19.7
7±
0.22
4.18
2.84
±0.
492.
34±
0.72
0.50
±0.
0723
.56
±0.
110.
719
ero_
1416
44.2
9+52
1828
.41.
50±
0.17
2aSe
cure
23.8
5±
0.03
19.6
6±
0.89
4.18
3.85
±1.
814.
92±
2.19
0.44
±0.
0823
.34
±0.
230.
749
ero_
1416
45.1
8+52
1650
.70.
67±
0.12
2aSe
cure
22.0
2±
0.03
17.9
0±
0.51
4.12
12.2
5±
1.79
3.04
±0.
320.
42±
0.01
21.0
7±
0.10
0.72
1er
o_14
1646
.01+
5218
33.1
#1.
47±
0.17
1Se
cure
24.1
8±
0.30
20.0
2±
0.85
4.15
0.01
±0.
2612
.13
±11
4.81
1.00
±2.
4523
.69
±6.
930.
710
ero_
1416
50.0
5+52
2119
.61.
29±
0.16
2cU
nsec
ure
22.9
8±
0.03
18.9
3±
0.59
4.05
3.44
±0.
100.
33±
0.06
0.43
±0.
0222
.78
±0.
030.
728
ero_
1416
50.6
5+52
1825
.5#
1.67
±0.
194
Uns
ecur
e24
.45
±0.
4420
.07
±0.
494.
380.
01±
0.03
8.94
±7.
390.
99±
3.79
24.1
3±
0.00
0.73
6er
o_14
1659
.11+
5219
20.7
1.25
±0.
162a
Secu
re23
.09
±0.
0318
.82
±0.
034.
283.
22±
0.41
1.64
±0.
410.
41±
0.05
23.2
0±
0.08
1.04
9er
o_14
1705
.04+
5223
06.0
0.37
±0.
101
Secu
re22
.86
±0.
0318
.73
±0.
024.
1329
.96
±59
.30
14.3
9±
7.56
0.65
±0.
0621
.29
±0.
740.
708
ero_
1417
05.1
5+52
2212
.40.
99±
0.14
1Se
cure
22.2
6±
0.03
18.1
4±
0.03
4.12
4.48
±0.
724.
80±
0.64
0.87
±0.
0421
.58
±0.
080.
698
ero_
1417
06.8
4+52
2225
.90.
90±
0.13
2bSe
cure
22.3
6±
0.04
18.1
8±
0.02
4.18
5.95
±0.
422.
35±
0.20
0.23
±0.
0121
.97
±0.
040.
767
ero_
1417
09.1
9+52
2135
.31.
34±
0.16
3U
nsec
ure
23.5
8±
0.07
19.5
7±
0.56
4.01
3.42
±0.
521.
84±
0.36
0.96
±0.
0923
.16
±0.
100.
721
ero_
1417
09.7
0+52
2449
.31.
55±
0.18
2bSe
cure
23.9
8±
0.02
19.3
2±
0.68
4.65
4.93
±0.
350.
34±
0.15
0.20
±0.
0323
.84
±0.
070.
729
ero_
1417
10.6
2+52
2109
.62.
01±
0.21
1Se
cure
23.7
5±
0.23
19.6
3±
0.55
4.12
0.17
±0.
1712
.29
±16
.25
0.46
±0.
2223
.37
±0.
350.
721
ero_
1417
11.4
2+52
2111
.41.
21±
0.15
1Se
cure
24.4
8±
0.11
20.3
6±
0.51
4.12
0.67
±0.
143.
10±
2.39
0.87
±0.
2724
.18
±0.
100.
725
ero_
1417
14.0
3+52
2332
.61.
01±
0.14
3Se
cure
22.8
1±
0.03
18.6
5±
0.15
4.16
2.97
±0.
121.
15±
0.11
0.51
±0.
0222
.53
±0.
020.
694
ero_
1417
14.1
4+52
2538
.91.
79±
0.20
1Se
cure
24.4
1±
0.03
19.8
1±
0.14
4.60
1.44
±2.
1010
.87
±11
.18
0.46
±0.
2024
.01
±0.
330.
747
ero_
1417
15.0
9+52
2142
.62.
65±
0.26
1Se
cure
24.7
3±
0.28
20.0
6±
0.58
4.67
3.45
±4.
4810
.88
±11
.37
0.06
±0.
0724
.18
±0.
450.
723
ero_
1417
16.6
9+52
2549
.11.
91±
0.20
4U
nsec
ure
24.7
1±
0.01
20.1
1±
0.66
4.60
0.87
±0.
212.
19±
1.97
0.48
±0.
2224
.66
±0.
001.
046
ero_
1417
21.0
2+52
2343
.51.
43±
0.17
1Se
cure
23.4
4±
0.03
19.2
9±
0.79
4.16
1.18
±0.
102.
06±
0.56
0.46
±0.
0623
.19
±0.
030.
703
ero_
1417
22.5
5+52
2345
.61.
41±
0.17
1Se
cure
22.3
3±
0.05
18.1
3±
0.12
4.20
0.78
±0.
065.
50±
0.93
0.86
±0.
0522
.01
±0.
020.
704
ero_
1417
23.6
1+52
2555
.2∗
1.28
±0.
163
Secu
re23
.45
±0.
0218
.94
±0.
014.
5111
.01
±0.
630.
23±
0.06
0.32
±0.
0223
.11
±0.
060.
748
ero_
1417
26.6
8+52
2415
.11.
12±
0.15
2aSe
cure
24.1
2±
0.29
19.9
1±
0.09
4.21
3.77
±1.
213.
22±
1.33
0.29
±0.
0623
.75
±0.
180.
711
ero_
1417
26.9
5+52
2449
.6∗
1.17
±0.
152b
Secu
re22
.99
±0.
0018
.76
±0.
024.
2311
.26
±0.
600.
13±
0.08
0.12
±0.
0123
.34
±0.
000.
765
ero_
1417
27.7
3+52
2411
.61.
47±
0.17
2aSe
cure
23.9
2±
0.03
19.6
6±
0.30
4.26
1.74
±0.
151.
33±
0.44
0.21
±0.
0623
.66
±0.
040.
717
ero_
1417
28.3
5+52
2606
.02.
35±
0.23
1Se
cure
24.8
0±
0.03
19.7
5±
0.17
5.04
1.35
±0.
301.
54±
1.28
0.18
±0.
1924
.79
±0.
080.
714
ero_
1417
30.6
4+52
2823
.81.
27±
0.16
3U
nsec
ure
24.8
4±
0.02
20.7
7±
0.30
4.07
0.88
±0.
323.
52±
3.63
0.79
±0.
2624
.59
±0.
200.
720
ero_
1417
31.3
1+52
2507
.02.
90±
0.27
3U
nsec
ure
24.8
1±
0.50
20.7
9±
0.52
4.02
10.2
1±
20.3
25.
34±
5.76
0.37
±0.
1423
.91
±1.
040.
740
ero_
1417
35.4
9+52
2554
.41.
45±
0.17
1Se
cure
23.7
7±
0.13
18.9
2±
0.02
4.84
1.42
±0.
213.
16±
1.22
0.62
±0.
0723
.48
±0.
080.
778
C© 2011 The Authors, MNRAS 414, 2246–2264Monthly Notices of the Royal Astronomical Society C© 2011 RAS
Dow
nloaded from https://academ
ic.oup.com/m
nras/article/414/3/2246/1039390 by guest on 05 July 2022

The morphologies and masses of EROs 2261
Tabl
eA
1–
cont
inue
d
Nam
ez p
hot
Cla
ssV
ote
F814
WK
sF8
14W
−Ks
a en
Axi
alra
tioF8
14W
GA
LFI
Tχ
2 GA
LFI
T(m
ag)
(mag
)(m
ag)
(kpc
)(m
ag)
(1)
(2)
(3)
(4)
(5)
(6)
(7)
(8)
(9)
(10)
(11)
(12)
ero_
1417
39.0
7+52
2843
.80.
91±
0.13
2aSe
cure
23.7
5±
0.03
19.5
0±
0.03
4.25
2.05
±0.
171.
90±
0.46
0.60
±0.
0623
.25
±0.
060.
720
ero_
1417
40.2
2+52
2905
.91.
65±
0.19
1Se
cure
24.7
4±
0.03
19.4
9±
0.03
5.25
5.16
±2.
194.
28±
1.36
0.65
±0.
0823
.88
±0.
230.
930
ero_
1417
40.8
4+52
2649
.41.
75±
0.19
1Se
cure
24.4
4±
0.02
19.7
4±
0.03
4.71
2.24
±7.
7619
.99
±46
.59
1.00
±0.
3523
.57
±1.
250.
702
ero_
1417
42.3
8+52
3034
.41.
08±
0.15
2aSe
cure
24.2
5±
0.02
19.6
6±
0.90
4.60
24.3
8±
59.4
78.
71±
8.13
0.26
±0.
0723
.09
±1.
080.
725
ero_
1417
42.3
9+52
2811
.50.
99±
0.14
2bSe
cure
23.6
1±
0.00
19.3
6±
0.03
4.26
9.30
±0.
900.
66±
0.13
0.29
±0.
0223
.13
±0.
070.
713
ero_
1417
44.0
8+52
2631
.2#
1.99
±0.
211
Secu
re25
.07
±0.
3620
.52
±0.
064.
550.
05±
6.60
3.15
±33
3.19
0.78
±9.
0424
.86
±10
.73
0.72
1er
o_14
1744
.28+
5229
25.0
0.75
±0.
121
Secu
re25
.33
±0.
0320
.71
±0.
014.
620.
91±
0.23
3.57
±2.
430.
67±
0.18
25.1
5±
0.14
0.93
6er
o_14
1745
.13+
5230
45.9
1.40
±0.
174
Uns
ecur
e25
.02
±0.
0020
.83
±0.
524.
193.
50±
0.72
0.99
±0.
340.
50±
0.09
24.3
5±
0.14
0.73
3er
o_14
1746
.71+
5228
57.8
1.59
±0.
182b
Secu
re25
.43
±0.
0221
.18
±0.
024.
262.
58±
0.22
0.29
±0.
190.
53±
0.05
25.1
9±
0.07
0.92
4er
o_14
1749
.11+
5227
59.6
0.93
±0.
141
Secu
re24
.26
±0.
0620
.22
±0.
014.
040.
91±
0.09
2.15
±0.
680.
52±
0.06
24.1
5±
0.03
1.07
1er
o_14
1749
.24+
5228
11.0
1.08
±0.
153
Secu
re23
.11
±0.
1619
.04
±0.
034.
081.
65±
0.10
5.70
±0.
690.
39±
0.04
23.1
1±
0.00
1.25
5er
o_14
1749
.59+
5228
06.2
1.51
±0.
182b
Secu
re24
.34
±0.
0320
.16
±0.
034.
194.
46±
0.30
0.62
±0.
160.
28±
0.02
24.1
1±
0.05
1.37
1er
o_14
1751
.29+
5230
40.3
1.51
±0.
182a
Secu
re23
.84
±0.
0319
.65
±0.
814.
192.
73±
0.26
1.15
±0.
210.
73±
0.06
23.4
9±
0.06
0.71
0er
o_14
1751
.38+
5230
49.8
1.54
±0.
183
Secu
re24
.88
±0.
0119
.79
±0.
475.
094.
94±
0.34
0.16
±0.
150.
23±
0.04
24.3
4±
0.09
0.71
2er
o_14
1751
.76+
5231
36.8
1.33
±0.
162a
Secu
re23
.26
±0.
0318
.54
±0.
084.
723.
16±
0.44
2.48
±0.
500.
73±
0.06
22.9
3±
0.09
0.71
6er
o_14
1754
.50+
5230
23.4
4.60
±0.
391
Secu
re24
.93
±0.
2320
.46
±0.
464.
470.
35±
0.19
6.95
±12
.99
0.78
±0.
5124
.61
±0.
370.
723
ero_
1417
55.4
4+52
2928
.52.
98±
0.28
4U
nsec
ure
24.7
0±
0.04
20.4
3±
0.62
4.27
0.81
±0.
111.
26±
1.10
0.22
±0.
1624
.47
±0.
070.
708
ero_
1417
56.7
4+52
3157
.21.
32±
0.16
2cU
nsec
ure
23.0
4±
0.03
18.6
4±
0.14
4.40
4.92
±0.
511.
33±
0.17
0.65
±0.
0422
.87
±0.
070.
726
ero_
1417
56.9
1+52
3118
.11.
48±
0.17
4U
nsec
ure
24.2
9±
0.01
20.2
4±
0.47
4.04
2.72
±3.
116.
12±
6.92
0.54
±0.
2024
.31
±0.
540.
718
ero_
1417
57.1
5+52
3242
.61.
61±
0.18
1Se
cure
24.2
7±
0.07
19.6
9±
0.16
4.58
0.80
±0.
296.
34±
5.66
0.47
±0.
2024
.14
±0.
140.
721
ero_
1417
57.2
7+52
3224
.5#
1.34
±0.
161
Secu
re24
.29
±0.
6019
.49
±0.
714.
800.
01±
17.8
74.
81±
3912
.27
0.83
±11
9.26
24.0
0±
738.
060.
719
ero_
1417
57.6
6+52
2910
.31.
33±
0.16
2bSe
cure
24.0
4±
0.00
19.8
5±
0.00
4.19
4.48
±1.
552.
30±
0.86
0.56
±0.
1023
.68
±0.
220.
739
ero_
1418
00.8
7+52
3203
.01.
59±
0.18
2aSe
cure
23.9
3±
0.03
19.0
7±
0.03
4.86
2.07
±0.
362.
96±
1.00
0.81
±0.
0823
.42
±0.
110.
720
ero_
1418
02.0
3+52
3015
.51.
64±
0.18
2bSe
cure
24.0
5±
0.03
19.7
0±
0.08
4.35
2.69
±0.
170.
07±
0.32
0.29
±0.
0524
.41
±0.
080.
711
ero_
1418
02.5
7+52
3251
.81.
73±
0.19
4U
nsec
ure
25.0
0±
0.01
19.8
6±
0.59
5.14
5.82
±2.
041.
56±
0.78
0.18
±0.
0524
.52
±0.
220.
719
ero_
1418
03.0
0+52
3033
.91.
35±
0.16
4U
nsec
ure
24.9
7±
0.01
20.9
2±
0.49
4.05
1.21
±0.
340.
11±
1.06
0.85
±0.
2124
.81
±0.
080.
736
ero_
1418
03.3
4+52
3228
.41.
10±
0.15
1Se
cure
24.6
2±
0.08
19.9
7±
0.52
4.65
1.21
±0.
547.
08±
6.38
0.08
±0.
1224
.29
±0.
180.
717
ero_
1418
09.2
6+52
3112
.50.
84±
0.13
2bSe
cure
23.4
6±
0.02
19.1
9±
0.01
4.27
6.68
±0.
541.
10±
0.17
0.20
±0.
0122
.94
±0.
050.
726
C© 2011 The Authors, MNRAS 414, 2246–2264Monthly Notices of the Royal Astronomical Society C© 2011 RAS
Dow
nloaded from https://academ
ic.oup.com/m
nras/article/414/3/2246/1039390 by guest on 05 July 2022
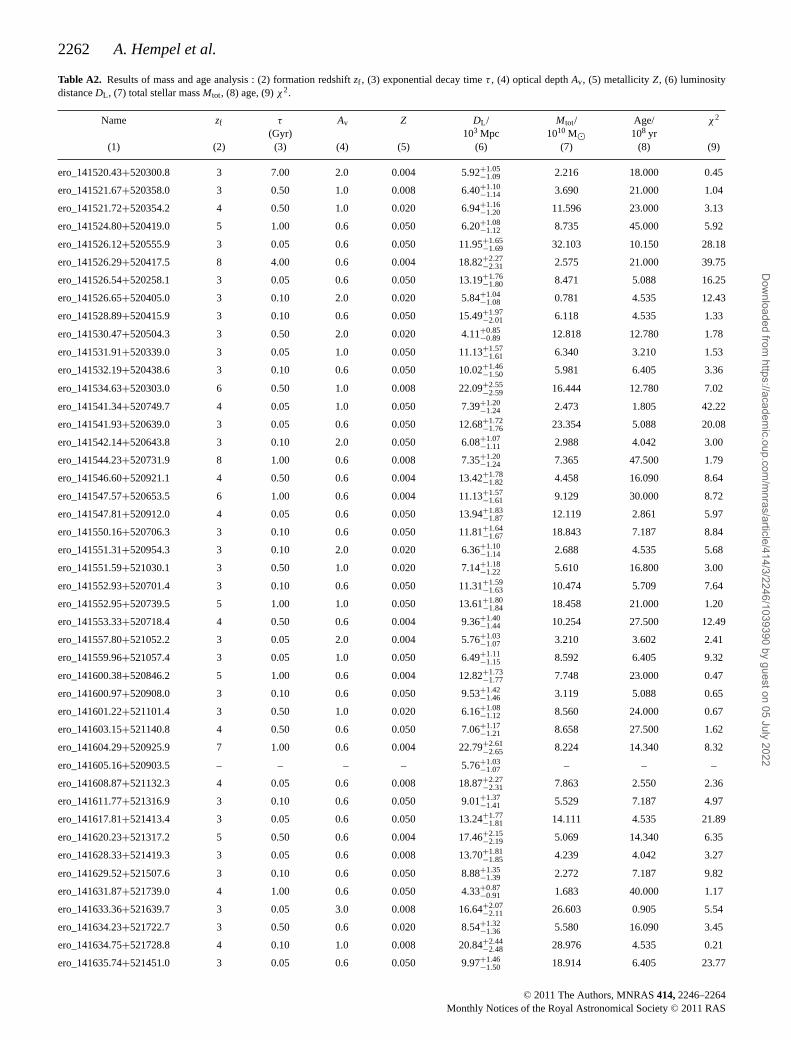
2262 A. Hempel et al.
Table A2. Results of mass and age analysis : (2) formation redshift zf , (3) exponential decay time τ , (4) optical depth Av, (5) metallicity Z, (6) luminositydistance DL, (7) total stellar mass Mtot, (8) age, (9) χ2.
Name zf τ Av Z DL/ Mtot/ Age/ χ2
(Gyr) 103 Mpc 1010 M� 108 yr(1) (2) (3) (4) (5) (6) (7) (8) (9)
ero_141520.43+520300.8 3 7.00 2.0 0.004 5.92+1.05−1.09 2.216 18.000 0.45
ero_141521.67+520358.0 3 0.50 1.0 0.008 6.40+1.10−1.14 3.690 21.000 1.04
ero_141521.72+520354.2 4 0.50 1.0 0.020 6.94+1.16−1.20 11.596 23.000 3.13
ero_141524.80+520419.0 5 1.00 0.6 0.050 6.20+1.08−1.12 8.735 45.000 5.92
ero_141526.12+520555.9 3 0.05 0.6 0.050 11.95+1.65−1.69 32.103 10.150 28.18
ero_141526.29+520417.5 8 4.00 0.6 0.004 18.82+2.27−2.31 2.575 21.000 39.75
ero_141526.54+520258.1 3 0.05 0.6 0.050 13.19+1.76−1.80 8.471 5.088 16.25
ero_141526.65+520405.0 3 0.10 2.0 0.020 5.84+1.04−1.08 0.781 4.535 12.43
ero_141528.89+520415.9 3 0.10 0.6 0.050 15.49+1.97−2.01 6.118 4.535 1.33
ero_141530.47+520504.3 3 0.50 2.0 0.020 4.11+0.85−0.89 12.818 12.780 1.78
ero_141531.91+520339.0 3 0.05 1.0 0.050 11.13+1.57−1.61 6.340 3.210 1.53
ero_141532.19+520438.6 3 0.10 0.6 0.050 10.02+1.46−1.50 5.981 6.405 3.36
ero_141534.63+520303.0 6 0.50 1.0 0.008 22.09+2.55−2.59 16.444 12.780 7.02
ero_141541.34+520749.7 4 0.05 1.0 0.050 7.39+1.20−1.24 2.473 1.805 42.22
ero_141541.93+520639.0 3 0.05 0.6 0.050 12.68+1.72−1.76 23.354 5.088 20.08
ero_141542.14+520643.8 3 0.10 2.0 0.050 6.08+1.07−1.11 2.988 4.042 3.00
ero_141544.23+520731.9 8 1.00 0.6 0.008 7.35+1.20−1.24 7.365 47.500 1.79
ero_141546.60+520921.1 4 0.50 0.6 0.004 13.42+1.78−1.82 4.458 16.090 8.64
ero_141547.57+520653.5 6 1.00 0.6 0.004 11.13+1.57−1.61 9.129 30.000 8.72
ero_141547.81+520912.0 4 0.05 0.6 0.050 13.94+1.83−1.87 12.119 2.861 5.97
ero_141550.16+520706.3 3 0.10 0.6 0.050 11.81+1.64−1.67 18.843 7.187 8.84
ero_141551.31+520954.3 3 0.10 2.0 0.020 6.36+1.10−1.14 2.688 4.535 5.68
ero_141551.59+521030.1 3 0.50 1.0 0.020 7.14+1.18−1.22 5.610 16.800 3.00
ero_141552.93+520701.4 3 0.10 0.6 0.050 11.31+1.59−1.63 10.474 5.709 7.64
ero_141552.95+520739.5 5 1.00 1.0 0.050 13.61+1.80−1.84 18.458 21.000 1.20
ero_141553.33+520718.4 4 0.50 0.6 0.004 9.36+1.40−1.44 10.254 27.500 12.49
ero_141557.80+521052.2 3 0.05 2.0 0.004 5.76+1.03−1.07 3.210 3.602 2.41
ero_141559.96+521057.4 3 0.05 1.0 0.050 6.49+1.11−1.15 8.592 6.405 9.32
ero_141600.38+520846.2 5 1.00 0.6 0.004 12.82+1.73−1.77 7.748 23.000 0.47
ero_141600.97+520908.0 3 0.10 0.6 0.050 9.53+1.42−1.46 3.119 5.088 0.65
ero_141601.22+521101.4 3 0.50 1.0 0.020 6.16+1.08−1.12 8.560 24.000 0.67
ero_141603.15+521140.8 4 0.50 0.6 0.050 7.06+1.17−1.21 8.658 27.500 1.62
ero_141604.29+520925.9 7 1.00 0.6 0.004 22.79+2.61−2.65 8.224 14.340 8.32
ero_141605.16+520903.5 – – – – 5.76+1.03−1.07 – – –
ero_141608.87+521132.3 4 0.05 0.6 0.008 18.87+2.27−2.31 7.863 2.550 2.36
ero_141611.77+521316.9 3 0.10 0.6 0.050 9.01+1.37−1.41 5.529 7.187 4.97
ero_141617.81+521413.4 3 0.05 0.6 0.050 13.24+1.77−1.81 14.111 4.535 21.89
ero_141620.23+521317.2 5 0.50 0.6 0.004 17.46+2.15−2.19 5.069 14.340 6.35
ero_141628.33+521419.3 3 0.05 0.6 0.008 13.70+1.81−1.85 4.239 4.042 3.27
ero_141629.52+521507.6 3 0.10 0.6 0.050 8.88+1.35−1.39 2.272 7.187 9.82
ero_141631.87+521739.0 4 1.00 0.6 0.050 4.33+0.87−0.91 1.683 40.000 1.17
ero_141633.36+521639.7 3 0.05 3.0 0.008 16.64+2.07−2.11 26.603 0.905 5.54
ero_141634.23+521722.7 3 0.50 0.6 0.020 8.54+1.32−1.36 5.580 16.090 3.45
ero_141634.75+521728.8 4 0.10 1.0 0.008 20.84+2.44−2.48 28.976 4.535 0.21
ero_141635.74+521451.0 3 0.05 0.6 0.050 9.97+1.46−1.50 18.914 6.405 23.77
C© 2011 The Authors, MNRAS 414, 2246–2264Monthly Notices of the Royal Astronomical Society C© 2011 RAS
Dow
nloaded from https://academ
ic.oup.com/m
nras/article/414/3/2246/1039390 by guest on 05 July 2022
The morphologies and masses of EROs 2263
Table A2 – continued
Name zf τ Av Z DL/ Mtot/ Age/ χ2
(Gyr) 103 Mpc 1010 M� 108 yr(1) (2) (3) (4) (5) (6) (7) (8) (9)
ero_141636.32+521805.9 5 1.00 0.6 0.020 8.45+1.31−1.35 3.656 35.000 2.26
ero_141636.41+521449.0 3 0.05 0.6 0.050 12.27+1.68−1.72 11.295 5.088 14.06
ero_141636.67+521806.8 4 0.50 0.6 0.004 9.62+1.43−1.47 15.017 30.000 3.09
ero_141639.57+521810.2 3 0.10 0.6 0.004 12.78+1.73−1.76 3.340 4.042 0.28
ero_141642.05+521601.7 3 0.10 0.6 0.050 10.82+1.54−1.58 9.549 7.187 7.50
ero_141642.20+521641.7 3 0.10 2.0 0.050 5.92+1.05−1.09 1.086 4.535 12.90
ero_141642.25+521820.2 – – – – 5.80+1.04−1.08 – – –
ero_141643.79+521915.4 3 0.10 2.0 0.050 13.84+1.82−1.86 17.196 2.273 0.52
ero_141644.29+521828.4 3 0.05 0.6 0.008 10.91+1.55−1.59 5.097 5.088 0.30
ero_141645.18+521650.7 3 0.50 2.0 0.004 4.04+0.84−0.88 12.094 22.000 0.32
ero_141646.01+521833.1 3 0.05 0.6 0.050 10.64+1.52−1.56 14.935 10.150 125.76
ero_141650.05+522119.6 3 0.05 0.6 0.050 9.10+1.38−1.41 10.042 5.088 7.84
ero_141650.65+521825.5 4 0.10 0.6 0.004 12.45+1.70−1.73 7.379 9.048 9.01
ero_141659.11+521920.7 3 0.05 0.6 0.004 8.71+1.34−1.38 9.050 11.390 3.01
ero_141705.04+522306.0 3 2.00 2.0 0.020 1.98+0.58−0.62 2.888 70.000 3.37
ero_141705.15+522212.4 3 0.10 2.0 0.008 6.57+1.12−1.16 16.754 5.088 16.63
ero_141706.84+522225.9 3 0.10 2.0 0.020 5.76+1.03−1.07 8.713 4.535 6.68
ero_141709.19+522135.3 4 0.10 0.6 0.020 9.53+1.42−1.46 6.695 7.187 1.41
ero_141709.70+522449.3 4 0.50 0.6 0.020 11.41+1.60−1.64 17.260 21.000 1.14
ero_141710.62+522109.6 3 7.00 2.0 0.050 15.63+1.99−2.02 7.967 1.805 11.11
ero_141711.42+522111.4 6 1.00 0.6 0.008 8.37+1.30−1.34 5.265 40.000 1.65
ero_141714.03+522332.6 6 1.00 0.6 0.008 6.73+1.14−1.18 18.328 47.500 4.06
ero_141714.14+522538.9 3 0.10 0.6 0.050 13.61+1.80−1.84 16.819 7.187 14.47
ero_141715.09+522142.6 7 0.50 1.0 0.004 21.84+2.53−2.57 31.400 16.090 5.68
ero_141716.69+522549.1 6 1.00 1.0 0.004 14.69+1.90−1.94 14.913 23.000 2.68
ero_141721.02+522343.5 3 0.05 1.0 0.050 10.28+1.49−1.53 8.020 3.210 1.14
ero_141722.55+522345.6 3 0.05 0.6 0.020 10.06+1.47−1.51 28.027 6.405 3.96
ero_141723.61+522555.2 4 0.10 0.6 0.050 9.01+1.37−1.41 8.897 6.405 4.12
ero_141726.68+522415.1 5 1.00 1.0 0.004 7.60+1.23−1.27 7.882 40.000 2.70
ero_141726.95+522449.6 3 0.05 1.0 0.020 8.02+1.27−1.31 12.238 6.405 1.32
ero_141727.73+522411.6 3 0.05 0.6 0.050 10.60+1.52−1.56 16.332 9.048 77.89
ero_141728.35+522606.0 4 0.10 0.6 0.050 18.92+2.28−2.32 32.707 6.405 2.68
ero_141730.64+522823.8 4 0.05 1.0 0.050 8.88+1.35−1.39 1.711 3.602 7.15
ero_141731.31+522507.0 6 0.50 0.6 0.004 24.41+2.75−2.79 8.577 11.390 21.13
ero_141735.49+522554.4 6 0.50 0.6 0.020 10.46+1.51−1.55 47.326 32.500 13.43
ero_141739.07+522843.8 4 1.00 0.6 0.050 5.88+1.05−1.09 7.750 45.000 0.08
ero_141740.22+522905.9 4 0.05 0.6 0.020 12.27+1.68−1.72 26.014 20.000 21.29
ero_141740.84+522649.4 3 0.05 1.0 0.050 13.24+1.77−1.81 11.417 3.602 3.72
ero_141742.38+523034.4 3 0.50 0.6 0.050 7.27+1.19−1.23 5.637 25.000 5.11
ero_141742.39+522811.5 3 1.00 0.6 0.020 6.53+1.11−1.15 5.522 35.000 1.00
ero_141744.08+522631.2 3 0.10 0.6 0.050 15.40+1.96−2.00 6.521 5.088 1.80
ero_141744.28+522925.0 3 7.00 0.6 0.050 4.64+0.91−0.95 0.131 37.500 10.83
ero_141745.13+523045.9 4 0.50 0.6 0.050 10.02+1.46−1.50 4.447 18.000 1.46
C© 2011 The Authors, MNRAS 414, 2246–2264Monthly Notices of the Royal Astronomical Society C© 2011 RAS
Dow
nloaded from https://academ
ic.oup.com/m
nras/article/414/3/2246/1039390 by guest on 05 July 2022

2264 A. Hempel et al.
Table A2 – continued
Name zf τ Av Z DL/ Mtot/ Age/ χ2
(Gyr) 103 Mpc 1010 M� 108 yr(1) (2) (3) (4) (5) (6) (7) (8) (9)
ero_141746.71+522857.8 4 0.50 0.6 0.050 11.77+1.63−1.67 8.992 23.000 3.39
ero_141749.11+522759.6 6 1.00 1.0 0.050 6.04+1.06−1.10 7.208 50.000 8.95
ero_141749.24+522811.0 5 1.00 0.6 0.008 7.31+1.20−1.24 13.825 42.500 0.73
ero_141749.59+522806.2 5 0.50 0.6 0.050 11.00+1.56−1.60 48.593 30.000 1.70
ero_141751.29+523040.3 3 0.05 0.6 0.004 11.00+1.56−1.60 5.025 6.405 8.02
ero_141751.38+523049.8 4 0.10 0.6 0.050 11.31+1.59−1.63 20.260 16.090 32.35
ero_141751.76+523136.8 3 0.10 0.6 0.050 9.40+1.41−1.44 27.221 11.390 18.94
ero_141754.50+523023.4 – – – – 42.29+4.22−4.27 – – -
ero_141755.44+522928.5 4 7.00 0.6 0.004 25.17+2.81−2.85 1.144 3.602 18.40
ero_141756.74+523157.2 3 0.05 0.6 0.004 9.36+1.40−1.44 11.389 11.390 2.64
ero_141756.91+523118.1 – – – – 10.73+1.53−1.57 – – –
ero_141757.15+523242.6 3 0.05 1.0 0.050 11.90+1.64−1.68 8.622 3.602 2.93
ero_141757.27+523224.5 7 0.50 0.6 0.020 9.49+1.41−1.45 29.389 37.500 15.33
ero_141757.66+522910.3 3 0.05 0.6 0.004 9.40+1.41−1.44 1.768 3.602 2.56
ero_141800.87+523203.0 3 0.05 0.6 0.050 11.77+1.63−1.67 27.766 8.064 16.26
ero_141802.03+523015.5 – – – – 12.18+1.67−1.71 – – –
ero_141802.57+523251.8 4 0.50 0.6 0.050 12.96+1.74−1.78 12.385 20.000 2.95
ero_141803.00+523033.9 4 0.50 0.6 0.020 9.62+1.43−1.47 2.889 16.800 1.33
ero_141803.34+523228.4 4 1.00 1.0 0.020 7.48+1.21−1.25 6.106 32.500 0.39
ero_141809.26+523112.5 6 1.00 0.6 0.050 5.37+0.99−1.03 10.680 55.000 1.14
This paper has been typeset from a TEX/LATEX file prepared by the author.
C© 2011 The Authors, MNRAS 414, 2246–2264Monthly Notices of the Royal Astronomical Society C© 2011 RAS
Dow
nloaded from https://academ
ic.oup.com/m
nras/article/414/3/2246/1039390 by guest on 05 July 2022