The austerity of time Jordan Patrick Vieira - LSE Theses Online
Upload
khangminh22Category
view
1download
0
1
The London School of Economics and Political Science
Power of the Masses
Group Size, Attribution, and the Politics of
Export Bans in Africa
Daniel Nicolai Schulz
A thesis submitted to the Department of International Development of the
London School of Economics for the degree of Doctor of Philosophy,
London, November 2019

2
Declaration
I certify that the thesis I have presented for examination for the PhD degree of the
London School of Economics and Political Science is solely my own work other
than where I have clearly indicated that it is the work of others (in which case the
extent of any work carried out jointly by me and any other person is clearly
identified in it).
The copyright of this thesis rests with the author. Quotation from it is permitted,
provided that full acknowledgement is made. This thesis may not be reproduced
without my prior written consent.
I warrant that this authorisation does not, to the best of my belief, infringe the rights
of any third party.
I declare that my thesis consists of 97,373 words.

3
Abstract
This thesis sets out to answer the question why African governments aiming to
industrialize their economies introduce export bans on some processable
commodities and not on others. It makes the argument that policy-makers avoid
imposing export bans on commodities produced by a large share of the population
because bans create a context in which politically dangerous producer mobilization
is very likely. Export bans severely reduce producer prices. Since these are imposed
at the border, beyond producers’ usual field of vision, producers normally struggle
to see the origin of these price distortions. Equally negatively affected by bans, raw
commodity traders, however, have the knowledge, motivation, and capacity to
inform producers about the ban and organize their protest against it, therefore
making mass mobilization likely. Traders and producers react to high export taxes
in similar ways, but protests do not tend to arise in reaction to low export taxes. In
the latter case, traders are usually able to pass price distortions on to producers.
They, therefore, have a lesser incentive to engage in the costly endeavour of setting
up cross-group defence coalitions. Seeing how producer mobilization is less likely
in reaction to the imposition of low export taxes, imposition, even on large groups,
poses no significant risk to policy-makers. To test my argument against competing
explanations, I employ a mixed-method design. First, I conduct a large-N analysis
based on an original dataset covering all export bans and taxes employed in 36
African states in the last three decades. Holding a range of competing political and
economic variables constant, the analysis finds robust support for the core
hypothesis: the larger the share of the population producing a commodity, the less
likely governments will impose export bans on them. As expected, this also holds
for high but not for low export taxes. Second, based on eight months of fieldwork,
my comparative analyses of six country-commodities in Ghana, Kenya, and
Tanzania further substantiate these results and mechanisms. Overall, these findings
provide new insights into the critical role politics play in industrial policy-making
in Africa and show that African mass producer groups can overcome collective
action problems to oppose policies adverse to their interests in certain
circumstances.

4
Acknowledgements
My first thanks must go to my supervisors Catherine Boone and Ken Shadlen. Their
dedication and precision consistently pushed me to dig deeper, think further, and
write sharper. I am truly grateful to them for going above and beyond by
commenting rapidly and constructively on uncountable stages and versions of the
thesis. Their work was and remains an inspiration for my thesis and future projects.
I am grateful to the numerous other people who provided me with helpful feedback
and advice throughout my time at LSE, particularly Elliott Green, Kate Meagher,
James Putzel, Diana Weinhold, Joachim Wehner, Kai Spiekermann, Ryan
Jablonski, David Keen, and Robert Wade. I also want to thank Tim Forsyth for
giving me the opportunity to teach with him as well as Susan Hoult, Nina Craven,
and the PhD Academy for their fantastic job at guiding us through the PhD.
I would also like to thank the participants at workshops and conferences that
commented on my drafts, and the reviewers and editors that provided feedback on
those parts of the thesis that are in the process of publication. Particular appreciation
is due to Andy Harris, Martha Johnson, Henry Thomson, Nicolas van de Walle, Jan
Pierskalla, Jacob Hensing, and participants at the European WGAPE meeting, the
DSA Annual Meetings, the APCG Online Colloquium, the ASA-UK Biennial
Meeting and the APSA Annual Meeting.
I am indebted to my brilliant colleagues in Manchester at the Effective States and
Inclusive Development Research Centre, above all Tim Kelsall, Sam Hickey, Julia
Brunt, and Kunal Sen. Their belief in my work has allowed me to pursue my
longstanding academic dream to measure many previously unmeasured political
economy variables across much of the Global South in parallel to writing this thesis.
I am very grateful for each person that I met during my fieldwork in Ghana, Kenya,
Tanzania and beyond, who took the time to talk to me. By sharing their views, they
shaped my way of thinking and set the basis for this thesis. I am indebted to the
many people that have hosted me throughout these eight months, shared contacts
with me, and made my fieldwork a beautiful experience that I will cherish for the
rest of my life. In Ghana, particular appreciation is due to Abdul-Gafaru Abdulai,
Maike and Silas Ewunto, the staff at the African Cashew Initiative and the African

5
Cashew Alliance, my friends Priscilla Addison, Manuel Sampson, Alexander
Afram, as well as Maxwell Amponsah and my other wonderful flatmates at the
Africa House. In Tanzania, I want to express a special thanks to Emmanuel S.
Kigadye, Thabit Jacob, Michaela Collard, the staff at the ESRF, Hazel Gray, Dan
Paget and the Fathers and fellow lodgers at the Passionist’s Fathers Guest House.
Lastly, in Kenya, I am particularly indebted to the Mbates, Mara Köberle, Matt
Tyce, Julia and Diego Hakspiel, Geoffrey Lugano, George Ndungu’u, Nasirudin
Elias as well as members and staff at the British Institute in East Africa.
This research project and the resulting thesis were a special time of my life and I
would like to thank my friends who were part of this journey and the people I met
on the way. Particularly the community of PhD students at LSE has been a constant
source of solidarity and inspiration. I owe special thanks to Max Gallien, Jan
Stuckatz, Carolin Dieterle, Allison Benson, Musa Kpaka, McDonald Lewanika, and
Florian Weigand, who had to endure numerous conversations on my dissertation,
helped me through more than one crisis, and were incredibly hospital in hosting me
in between fieldwork stints. It was also a pleasure to learn from and walk the PhD
journey with Guoer, Konstantinos, Michael and Kara as well as Benjamin, Portia,
Camille, Yuezhou, Maria, Eduardo, Claudia, Hosna, Isaac, and Liz in other cohorts.
Lastly, the fellows in the department have always been a great source of inspiration
and advice for me, particularly Eyob Gebremariam, Florian Schäfer, and, most
importantly, Pritish Behuria, a friend and advisor inside and outside of academia.
I dedicate this thesis to those who have suffered me the longest – my family. I
cannot thank my parents enough for their unconditional love, unwavering faith in
me, always standing by my side, and never losing interest in my stories. I am
particularly grateful to my brother, Johannes, who has been my role model in
academia and beyond. His testing of and guidance through the sometimes rough
and uncertain waters of academe have made my PhD journey so much more
enjoyable. And I could not agree more with him when he says that the last four
years have felt as if we were walking this path together. My greatest debt of
gratitude is owed to my partner in life, Alexandra. Thank you for your love, your
friendship, your kindness, for tolerating my terrible working hours (and the many
bad jokes), supporting my long travels, and always being there when I needed you.
I could not have written this thesis without you.

6
Table of Contents
Declaration ...................................................... 2
Abstract ........................................................... 3
Acknowledgements ......................................... 4
Table of Contents ............................................ 6
List of Figures ............................................... 11
List of Tables ................................................ 13
List of Abbreviations .................................... 14
Chapter 1. Introduction ....................................................................................... 20
Chapter 2. Literature Review, Export Ban Patterns, and Commodity
‘Bannability’ ......................................................................................................... 28
2.1. A Short Review of the Literature on Export Restrictions .......................... 28
2.2. Introducing the Export Prohibition and Taxation in Africa Dataset .......... 31
2.3. Export Bans in Africa: Trends and Patterns ............................................... 33
2.4. Export Bans and Economic Feasibility: Narrowing the Scope .................. 42
Chapter 3. Theoretical Argument and Alternative Explanations ................... 54
3.1. The Politics of Survival and the Power of Interest Groups ........................ 54
3.1.1. Are Export Bans Olsonian? .................................................................. 59
3.1.2. What the Eye Sees, the Heart Grieves Over: Policy Visibility, Severity,
Cross-Group Defence Coalitions and Mass Mobilization ............................. 60
3.2. Alternative Explanations ............................................................................ 70
3.2.1. Further Domestic Political Economy Explanations ............................. 70
3.2.2. International Political Economy Explanations ..................................... 75
3.2.3. Additional Economic Considerations .................................................. 78
Chapter 4. Large-N Analysis ............................................................................... 93
4.1. Large-N Research Design .......................................................................... 93
4.1.1. Units of Analysis .................................................................................. 93

7
4.1.2. Data and Operationalization ................................................................. 94
4.1.3. Model Specifications .......................................................................... 101
4.2. Results of the Large-N Analysis .............................................................. 104
4.2.1. Descriptive Results ............................................................................ 104
4.2.2. Regression Results ............................................................................. 108
4.2.3. Robustness Checks ............................................................................. 113
4.3. Large-N Analysis Discussion and Conclusion ......................................... 115
Chapter 5. Case Study Research Design .......................................................... 117
5.1. Case Selection and Preliminary Medium-N Analysis .............................. 117
5.2. A Joint Method Comparison of Nut Export Bans in Ghana and Kenya .. 122
5.3. A Most-Different-Systems Comparison of Export Bans on Timber, Metal
Waste, and Raw Hides in Ghana and Tanzania .............................................. 126
Chapter 6. Export Bans in a Nutshell: A Comparison of Cashew and
Macadamia Nut Export Bans in Ghana and Kenya ....................................... 128
6.1. Contentious Cashews and the Withdrawal of the 2016 Export Ban in Ghana
......................................................................................................................... 135
6.1.1. Processors’ Plight and Farmers’ Delight: Soaring RCN Prices, the End
of the Ivorian Cashew Stream, and Growing Demands for Processor Protection
...................................................................................................................... 140
6.1.2. The 2016 Implementation and Withdrawal of the Export Ban .......... 145
6.1.3. The Politics of the Ban Withdrawal – Testing the Theoretical Argument
...................................................................................................................... 147
6.1.4. Conclusion of the Ghanaian Cashew Case......................................... 162
6.2. Calm Cashews: The Introduction and Maintenance of the Raw Cashew
Export Ban in Kenya ....................................................................................... 162
6.2.1. Disease, Cronyism, and Liberalization: The End of the Golden Era . 168
6.2.2. New Processors, Same Problems: The Beginning of Lobbying for an
Export Ban ................................................................................................... 173
6.2.3. The Politics of the Kenyan Cashew Ban Maintenance ...................... 179

8
6.2.4. Conclusion of the Kenyan Cashew Case ........................................... 185
6.3. Mixed but Mostly Mild Macadamias: The Introduction and Defence of the
Kenyan Export Ban on In-Shell Macadamia Nuts .......................................... 187
6.3.1. Post-Liberalization and Pre-Chinese Entry (1992-2004) ................... 192
6.3.2. The 2004 Entry of Chinese In-Shell Exporters .................................. 195
6.3.3. Introduction of the 2009 Export Ban ................................................. 200
6.3.4. The Politics of the Kenyan Macadamia Ban Maintenance ................ 203
6.3.5. Conclusion of the Kenyan Macadamia Case ..................................... 212
6.4. Chapter Conclusion .................................................................................. 213
Chapter 7. Different Commodities, Same Policy: Why Rough Wood, Metal
Wastes, and Raw Hides are Prone to Banning ................................................ 215
7.1. Transforming Timber: The Political Economy of the 1995 Ghanaian Rough
Log Export Ban ............................................................................................... 221
7.1.1. 1891-1957: The Colonial Timber Economy in Ghana ....................... 222
7.1.2. 1957-1966: The Nkrumah Post-Independence Years ........................ 225
7.1.3. 1966-1982: The Post-Nkrumah Crisis Period .................................... 227
7.1.4. 1983-1994: The Economic Recovery Programme and the Revitalization
of the Ghanaian Timber Industry ................................................................. 231
7.1.5. The 1994/5 Export Ban on All Rough Timber Logs.......................... 232
7.1.6. The Politics of the Ghanaian Log Ban Maintenance ......................... 239
7.1.7. Conclusion of the Ghana Log Export Ban Case Study ...................... 243
7.2. Worthwhile Waste: The Politics of the 2013 Ghanaian Ferrous Waste and
Scrap Export Ban ............................................................................................ 245
7.2.1. The Ghanaian Steel Industry in the 20th Century ............................... 246
7.2.2. The Ghanaian Steel Industry in the 21st Century and the Road to a Ban
...................................................................................................................... 248
7.2.3. The 2013 Legislative Export Ban ...................................................... 256
7.2.4. The Politics of the 2013 Ferrous Scrap Metal Ban ............................ 259
7.2.5. Conclusion of the Ghanaian Ferrous Scrap Ban Case Study ............. 265

9
7.3. Many Producers, Few Losers: The 2012 De Facto Ban on Raw Hides and
Skins Exports in Tanzania ............................................................................... 268
7.3.1. The Rise and Fall of the Tanzanian Leather Industry in the 20th Century
...................................................................................................................... 270
7.3.2. The 2003 20% RHS Export Tax and the Renaissance of the Tanzanian
Leather Industry in the 21st Century ............................................................ 273
7.3.3. The Tanzanian Leather Sector Crisis and the 2012 De Facto Ban .... 278
7.3.4. The Politics of the 2012 RHS 90% Export Tax ................................. 281
7.3.5. Conclusion of the Tanzanian Raw Hides and Skins Export Tax Case
...................................................................................................................... 284
7.4. Chapter Conclusion .................................................................................. 286
Chapter 8. Conclusion ....................................................................................... 288
8.1. Summary of Empirical Findings .............................................................. 291
8.2. Scholarly Contributions ......................................................................... 2933
8.3. Policy Implications .................................................................................. 294
8.4. Areas for Further Research ...................................................................... 296
References ........................................................................................................... 299
Appendix ............................................................................................................. 356
Appendix for Chapter 2 ................................................................................... 356
Appendix 2.1. List of All Export Bans Imposed Since 1988 ....................... 356
Appendix 2.2. Total Annual Introduction of New Export Bans in 36 African
WTO Member States by Commodity Type and for ‘Named’ Products Only
...................................................................................................................... 363
Appendix 2.3. The Cost of Setting Up Commodity Processing Industries (Full
Table) ........................................................................................................... 364
Appendix for Chapter 3 ................................................................................... 367
Appendix 3.1. Main Sources for Tables 3.2 as well as 2.1 and 2.2 ............. 367
Appendix for Chapter 4 ................................................................................... 368

10
Appendix 4.1. Overview of Commodity-Based Population Share Imputation
Factors .......................................................................................................... 368
Appendix 4.2. The Description of Imputation Factor Creation for Diamonds,
Gemstones, and Metal Wastes and Scraps ................................................... 373
Appendix 4.3. Frequency Distribution of Country-Commodities by Working
Share Cut-Off and Commodity Type ........................................................... 374
Appendix 4.4. Exclusion of Commodities I ................................................. 375
Appendix 4.5. Exclusion of Commodities II ............................................... 377
Appendix 4.6. Full Model 2, Additional Lags, and State Control Exclusion
...................................................................................................................... 379
Appendix 4.7. Guinea Exclusion and Democracy Interaction Effects ......... 381
Appendix 4.8. List of State-Controlled Country-Commodity-Years ........... 382
Appendix for Chapter 6 ................................................................................... 389
Appendix 6.1. List of Interviews on Cashew and Macadamia .................... 389
Appendix 6.2. Kenya RCN Production Estimates and Cashew NIS-Equivalent
Exports (based on mirror data), 1990-2017 ................................................. 393
Appendix 6.3. Collection of Farm gate Prices by Region and Source for
Macadamia in Kenya.................................................................................... 394
Appendix for Chapter 7 ................................................................................... 397
Appendix 7.1. Calculation of Ghanaian Domestic Log Price Development
Between 1993 and 1996 for Eight Species Not Banned Prior to 1995 ........ 397
Appendix 7.2. Calculation of Ghanaian Domestic Log Price Development
Between 1993 and 1996 Across all Species Types/Grades ......................... 398
Appendix 7.3. Destinations of Ghana’s Ferrous Scrap Exports over Time . 399
Appendix 7.4. Exports of Raw Hides and Skins and (Semi-)Processed Leather
from Tanzania as Declared by Tanzania from 1965-2017 ........................... 400
Appendix 7.5. Destination of Raw Hide and Skin Exports (Left) and (Semi-)
Processed Hide and Skin Exports (Right) from Tanzania in 2011 .............. 401
Appendix 7.6. Questionnaire for Tanzanian Livestock Keepers ................. 402
Appendix 7.7. List of Interviews on Ghanaian Timber ............................... 404
Appendix 7.8. List of Interviews on Ghanaian Metal Waste and Scrap ...... 405
Appendix 7.9. List of Interviews on Tanzanian Leather Sector .................. 406

11
List of Figures
Figure 2.1. Total Annual Introduction of Export Bans in 36 African WTO Member
States by HS-Six-Digit Level and by ‘Name in Document’, 1960-2017 .............. 34
Figure 2.2. Bans Introduced by Country and Named Product, 1960-2017 ........... 35
Figure 2.3. Number of Export Bans by HS-Sector-Level, 1960-2017.................. 37
Figure 3.1. A Simplified Model of a Typical Raw Commodity Trade Chain in Post-
Structural Adjustment Africa ................................................................................ 56
Figure 3.2. Theoretical Argument Illustrated as Path Diagram ............................ 62
Figure 3.3. Import Tariff Escalation for African commodities in the EU, USA,
China and India ..................................................................................................... 77
Figure 3.4. Average Export Share and Market Power per Country-Commodity-Year
in Data Sample (in %), 1988-2017 ........................................................................ 82
Figure 3.5. Average African Producer Prices Across Export Crops as well as Import
Price Data for Fertilizer and Pesticide Imported to Africa, 1990-2016 ................ 86
Figure 4.1. Number of Export Bans Introduced by Country and Commodity Type
since 1988 ........................................................................................................... 106
Figure 4.2. Predictive Margins of Population Shares on Export Bans, 1988-2017
............................................................................................................................. 112
Figure 6.1. Map of Ghana and the Main Cashew Area in Brong-Ahafo Region 136
Figure 6.2. Ghana Total RCN Production, 1994-2016 ....................................... 137
Figure 6.3. RCN Price Per Ton (FOB Tema) in US$ ......................................... 141
Figure 6.4. Average Farmgate Prices in West Africa 2017 ................................ 143
Figure 6.5. The Cashew Value Chain in Ghana, in 2015/2016........................... 150
Figure 6.6. Presidential Election Results in Brong Ahafo Region in 2012 and 2016
............................................................................................................................. 160
Figure 6.7. Development of NDC Vote Shares Over Time Across Brong-Ahafo
Constituencies disaggregated by Cashew Growing and Non-Cashew Growing
Constituencies ..................................................................................................... 161
Figure 6.8. Map of Cashew and Macadamia Nut Growing Areas in Kenya ...... 164
Figure 6.9. The Cashew Value Chain in Kenya Prior to 1992 ............................ 166
Figure 6.10. The Cashew Value Chain in Kenya After Liberalization. .............. 171

12
Figure 6.11. Share (%) of Processed Nuts in Total Kenyan Cashew Exports (based
on mirror data), 2001-2017 ................................................................................. 174
Figure 6.12. Macadamia Value Chain in Kenya Prior to Liberalization ............ 189
Figure 6.13. The Macadamia Production Chain After Liberalization ................ 194
Figure 6.14. Kenyan NIS Macadamia Production 1992-2015 ............................ 195
Figure 6.15. The Main Macadamia Growing Region Around Mt Kenya ........... 198
Figure 6.16. The Area Under Macadamia by County in Kenya in 2014 ............ 199
Figure 6.17. Total Production and Farmgate Prices in Kenya 2001-2015 .......... 199
Figure 6.18. US$/Kg Farmgate Prices for Northeastern & Southwestern Mt. Kenya
............................................................................................................................. 200
Figure 7.1. Administrative and Vegetation Zone Maps of Ghana ...................... 222
Figure 7.2. Flow Diagram of Key Timber Products ........................................... 224
Figure 7.3. Timber export m³ from Gold Coast Colony and Ashanti 1946-‐1957
(combined logs and sawn timber) ....................................................................... 225
Figure 7.4. Total Wood Exports by Volume of Product Groups, 1972-96 ......... 228
Figure 7.5. The Ghanaian Timber Product Chain Prior to the 1995 Log Export Ban
............................................................................................................................. 234
Figure 7.6. The Development of Ghanaian Raw Log Exports by Destination, 1991-
1996 ..................................................................................................................... 237
Figure 7.7. The Volume of Ferrous Scrap Exports from Ghana between 1962 and
2018, Based on Data Declared at Export from Ghana and Declared at Import in the
Destination Countries .......................................................................................... 250
Figure 7.8. Destinations for Ghana’s Ferrous Scrap Exports in 2012 ................ 251
Figure 7.9. The Ghanaian Ferrous Scrap Product Chain Prior to the 2013 Ban . 252
Figure 7.10. Map of Tanzania Highlighting the Three Main Tanning Centres .. 269
Figure 7.11. Exports of Raw Hides and Skins and (Semi-)Processed Leather from
Tanzania as Declared by Importers from 1965-2017 .......................................... 272
Figure 7.12. The Tanzanian Leather Product Chain since 2000 ......................... 275

13
List of Tables
Table 2.1. An Overview of Major Processable Commodities in Africa Determined
as Unbannable ....................................................................................................... 47
Table 2.2. An Overview of Major Processable Commodities in Africa Determined
as Bannable ........................................................................................................... 48
Table 2.3. The Cost of Setting Up Commodity Processing Industries ................. 49
Table 3.1. Different Price Distortive Measures and their Likelihood of Being
Imposed on Mass Groups ...................................................................................... 63
Table 3.2. Value Chain Characteristics Across Bannable Commodities .............. 89
Table 4.1. Summary Statistics by Commodity...................................................... 98
Table 4.2. Summary Statistics for Variables Included in the Large-N Analysis 100
Table 4.3. Summary of Export Ban Introductions by Commodity Type and
Population Share (1988-2017) ............................................................................ 105
Table 4.4. Summary of Export Ban Introductions by Commodity and Population
Share (1988-2017) ............................................................................................... 107
Table 4.5. Results of the Main Large-N Analysis ............................................... 110
Table 4.6. Results of the Multinomial Logit Regression Model ......................... 111
Table 5.1. Overview of Comparing Employment Size Against Export Ban
Imposition Across Export Sectors (last 10 years) ............................................... 119
Table 5.2. List of Commodities in Which Field Research Was Conducted ....... 121
Table 5.3. Overview of Interviews Conducted for the Timber, Metal Waste, and
Raw Hides and Skins Case Studies ..................................................................... 127
Table 6.1. Overview of the Joint Method Design and Competing Explanations 130
Table 6.2. List of Cashew Processors in Ghana and their Status in 2015 ........... 138
Table 6.3. Vote Margins for Parliamentary Seats in 2012 of Key Cashew Producing
Districts in the Brong-Ahafo Region .................................................................. 157
Table 7.1. Overview of the Most Different Systems Design Including Most
Commonly Banned Commodities ....................................................................... 217
Table 7.2. Installed and Utilized Capacity of Ghana’s Steel Mills in 2012 ........ 257
Table 7.3. List of Tanneries in Tanzania in 2010 ............................................... 279
Table 8.1. Comparative Overview of Main Case Study Findings ...................... 290

14
List of Abbreviations
ACA African Cashew Alliance
ACET African Centre for Economic Transformation
ACi African Cashew initiative
AFA Agriculture and Food Authority
AFFA Agriculture, Fisheries and Food Authority Act
AGOA African Growth and Opportunity Act
ASM Artisanal and Small-Scale Mining
ATP African Timber Products Limited
BMGF Bill and Melinda Gates Foundation
BMZ Bundesministerium für Entwicklungszusammenarbeit (Germany)
BUSAC The Business Sector Advocacy Challenge Fund
CCM Chama Cha Mapinduzi
CNRTF Cashew Nut Revival Task Force (Kenya)
CDP Cashew Development Project
CEO Chief Executive Officer
CIA Central Intelligence Agency
CIAG Cashew Industry Association of Ghana
CRIG Cocoa Research Institute of Ghana
DANIDA Danish International Development Agency
DESA United Nations Department for Economic and Social Affairs
DIT Dar es Salaam Institute of Technology
DPI Database of Political Institutions
DRC Democratic Republic of the Congo
EAC East African Community

15
EBS Equity Building Society
EPA Economic Partnership Agreement
EPR Ethnic Power Relationship Dataset
EPTA Export Prohibition and Taxation in Africa Dataset
EQN Equatorial Nut Processors
ERP Economic Recovery Programme
EU European Union
FAO Food and Agriculture Organization of the United Nations
FE Fixed Effects
FOB Free on Board
FOCIGC Fugian Overseas Chinese Industrial Group Corporation
FPIB Forest Products Inspection Bureau
GAP Good Agricultural Practices
GASDA Greater Accra Scrap Dealers Association
GATT General Agreement on Tariffs and Trade
GBP Great British Pound
GDP Gross Domestic Product
GHC Ghanaian Cedi
GIHOC Ghana Industrial Holding Corporation
GMO Genetically Modified Organism
GNI Gross National Income
GSP Generalized System of Preferences
GTA Ghana Timber Association
GTMO Ghana Timber Millers Organisation
GWA Gliksten West African Limited
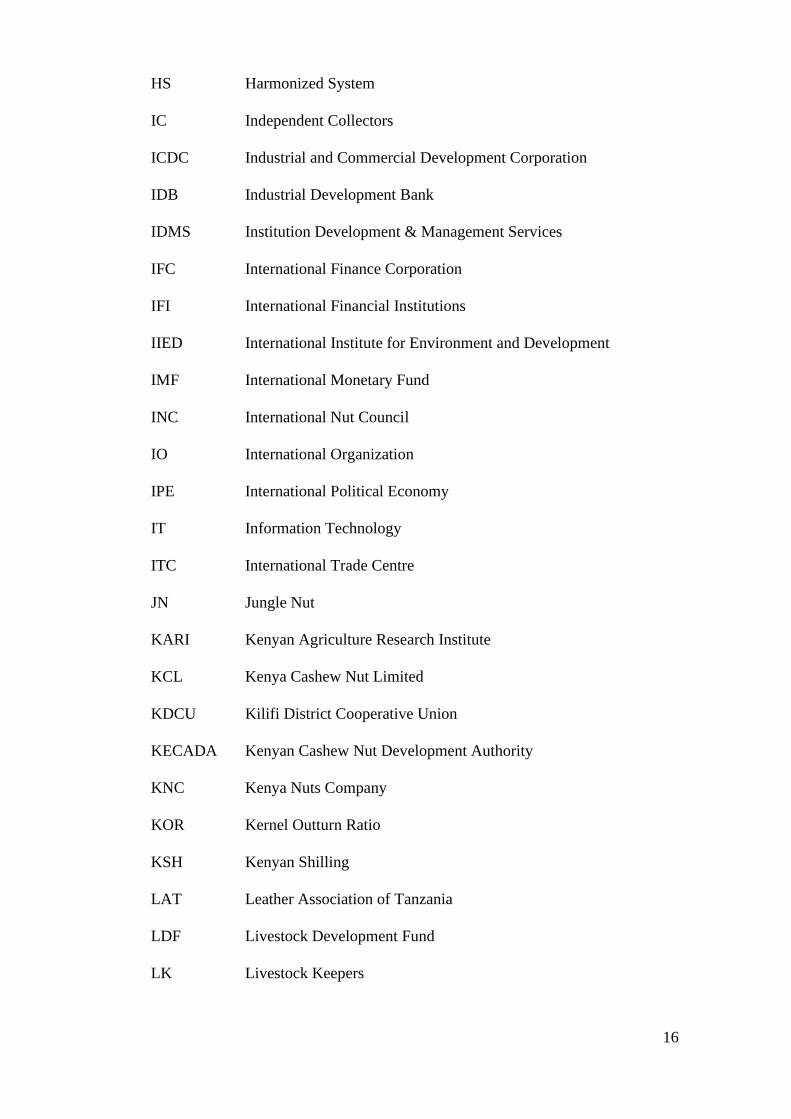
16
HS Harmonized System
IC Independent Collectors
ICDC Industrial and Commercial Development Corporation
IDB Industrial Development Bank
IDMS Institution Development & Management Services
IFC International Finance Corporation
IFI International Financial Institutions
IIED International Institute for Environment and Development
IMF International Monetary Fund
INC International Nut Council
IO International Organization
IPE International Political Economy
IT Information Technology
ITC International Trade Centre
JN Jungle Nut
KARI Kenyan Agriculture Research Institute
KCL Kenya Cashew Nut Limited
KDCU Kilifi District Cooperative Union
KECADA Kenyan Cashew Nut Development Authority
KNC Kenya Nuts Company
KOR Kernel Outturn Ratio
KSH Kenyan Shilling
LAT Leather Association of Tanzania
LDF Livestock Development Fund
LK Livestock Keepers

17
LSM Large-Scale Mining
MD Managing Director
MDSD Most-Different-Systems-Design
MGAK Macadamia Growers Association of Kenya
MML Millennium Management Limited
MoA Ministry of Agriculture of Kenya
MoFA Ministry of Food and Agriculture of Ghana
MoIT Ministry of Industry and Trade of Tanzania
MoLF Ministry of Livestock and Fisheries
MoTI Ministry of Trade and Industry of Ghana
MP Member of Parliament
NA Not Available
NAFCO National Buffer Stock Company
NARCO National Ranching Company
NCPB National Cereals and Produce Board
NDC National Democratic Congress
NEDP National Export Development Programme
NGO Non-Governmental Organization
NIS Nut In-Shell
NNPC Nigerian National Petroleum Corporation
NOCD Nuts and Oil Crops Directorate (Kenya)
NPP New Patriotic Party
NUTAK Nuts Traders Association of Kenya
NUTPAK Nut Processor Association of Kenya
ODA Official Development Assistance

18
OECD Organisation for Economic Co-Operation and Development
PL Plantations
PMD Powdery Mildew Disease
PNDC Provisional National Defence Council
PNP People's National Party of Ghana
PRPC Parastatal Reform Programme Committee
PSA Political Settlement Analysis
QCA Qualitative Comparative Analysis
RCN Raw Cashew Nut
RE Random Effects
RHS Raw Hides and Skins
REWB Within-Between Random Effects Model
RTAs Regional Trade Agreements
SAP Structural Adjustment Programme
SD Standard Deviation
SED Socialist Unity Party of Germany
SIC Standard Industrial Classification
SITC Standard International Trade Classification
SH Small-Holders
SK Slaughter Houses
SKR Sound Kernel Recovery Rate
SMAG Steel Manufacturers Association of Ghana
SSNIT Ghanaian Social Security and National Insurance Trust
SY Scrap Yard
TEDB Timber Export Development Board

19
TF Tea Farms
TIMBOD Ghana Timber Marketing Board
TPR Trade Policy Review
TRA Tanzania Revenue Authority
TSDEA Tema Scrap Dealer and Exporter Association
TSH Tanzanian Shilling
TTA Tanzania Tanneries Association
UK United Kingdom
UN United Nations
UNCTAD United Nations Conference on Trade and Development
UNECA United Nations Economic Commission for Africa
UNIDO United Nations Industrial Development Organization
UNSD United Nations Statistics Division
US United States of America
USA United States of America
USAID United States Agency for International Development
USGS United States Geological Survey
WDI World Development Indicator
WTO World Trade Organization

20
In recent years, industrial commodity processing1 has increasingly been identified
by academics and policy-makers alike as one of the most promising routes to
reviving economic transformation on the African continent. Correspondingly,
virtually all African governments have put commodity processing promotion at the
forefront of their national development plans and numerous continental policy
initiatives have emerged to support them (UNECA 2013). Resource-based
industrialization, however, faces bottlenecks in Africa, such as poor energy and
road infrastructure, difficult political environments, and a lack of adequate
technical, financial, and human capital. Processing is therefore often more
competitive outside of Africa, foreign processors can outcompete domestic
processors in buying domestic raw produce, and both foreign and domestic
investors shy away from processing in African countries of origin.
Governments across the developing world, above all in Africa, have increasingly
reverted to export bans on unprocessed or semi-processed commodities to solve
these problems. Export prohibitions increase the domestically available supply of
raw materials, eventually leading to a fall in domestic prices. While domestic raw
producers (e.g. farmers, loggers, and miners), middlemen, and exporters are likely
to lose income, processing in the country of origin becomes more competitive vis-
à-vis raw exportation and foreign processing, hereby incentivizing domestic and
foreign capitalists to invest in country of origin processing. Notably, export
restrictions are particularly popular industrial policy tools among African
governments because – in contrast to other measures like subsidies, loan schemes,
or building training institutes – they do not require significant bureaucratic capacity
or funding (both scarce resources on the continent).
Intriguingly, however, developing country governments tend to employ export bans
very differently across commodities. My analysis of an original dataset – the Export
Prohibition and Taxation in Africa (EPTA) panel dataset – as well as previous
1 Industrial commodity processing can span both primary and secondary processing stages. It differs
from primary farm-level-based processing in that it occurs in factories and employs machinery. In
the following, industrial commodity processing is abbreviated processing.

21
research on export restrictions2 more broadly (Estrades et al. 2017; OECD 2014:
24; Solleder 2013: 47) show that among commodities which could sensibly be
banned, some tend to be much more restricted at export than others. On average,
African governments do not tend to prohibit exports of unprocessed agricultural
crops, such as tea, cashew, cocoa, cotton or sesame, as well as unrefined gold. In
contrast, they do tend to frequently impose export bans on commodities such as
timber logs, raw hides and skins, metal wastes and scraps, as well as precious stones
and chromite in some instances. The central aim of this thesis is to understand why
governments restrict certain economically ‘bannable’ commodity exports more
frequently than others.
I argue that group size of producers is fundamental to explaining the observed
pattern. Specifically, it contends that due to a perceived or actual increased risk to
their political survival, policy-makers are less likely to prohibit the export of
commodities the larger the share of the population that gains significant income
from producing them. Export bans on raw commodities tend to harm raw producers
(and traders) as they effectively redistribute parts of their income to processors. For
product sectors that employ a large share of the population (such as most
agricultural product-sectors but also gold mining), politicians striving for political
survival will avoid imposing export bans for fear of producers’ retaliation. In
contrast, product sectors in which only a small part of the population earns a
significant part of their income – typically logging, certain gemstone mining
sectors, metal waste and scrap collection, chromite mining, as well as raw hide and
skin production – do not have this political weight and are therefore more likely to
experience export bans.
Though this association might appear intuitive, it contradicts some of the most
influential and widely-accepted scholarship on public policy and collective action.
In ‘The Logic of Collective Action’, Olson (1965) argued that smaller groups were
more likely to engage in collective action than larger groups (such as peasants) as
2 Export restrictions are trade policy instruments applied by exporting countries, with the aim of
controlling or banning exports of certain products (Estrades et al. 2017: 3). The key export
restrictions are export taxes, export quotas, reference or minimum prices on exports, non-automatic
export licenses, and export bans. The analytical focus of this thesis lies on export taxes and
prohibitions, the most relevant form of export restrictions.

22
they have higher per capita stakes and lower costs of transaction and mobilization.
This model has not only found ample application and confirmation in the study of
industrialized economies (Destler 1995; Gawande and Bandyopadhyay 2000;
Grossman and Helpman 1994; Hillman 1982; Peltzman 1976), but also in the
analysis of policy outcomes in the developing world. The perception of African
peasants as incapable of mobilizing for their interests and posing a threat to their
governments was shaped, in particular, by Robert Bates’s (1981) argument that the
mass of African peasants was disadvantaged by their governments to satisfy the
interests of smaller urban and large-scale farmers’ groups.
I argue that the fact that export bans severely harm both producers and traders is
critical in understanding how mass producer groups can overcome their collective
action problems. Implemented at the port or border and not at the farm or mine gate,
export measures like export bans are not directly visible to producers. This makes
it difficult for producers to attribute any resulting price distortions to government
action and to hold governments accountable. Traders, however, directly observe the
implementation of export bans. Since export bans are extremely damaging to their
business, they have the incentive to employ their comprehensive networks and
financial resources to inform producers on and organize them against bans. Given
the common sharp price reductions resulting from export bans, these mobilization
attempts are likely to be successful among producers who stand to lose a significant
share of their incomes. Facing the high risk of creating a dangerously large and
agitated group that knows who to blame, policy-makers are very likely, therefore,
to abstain from introducing export bans on commodities produced by a large share
of the population. While this logic should hold for high export taxes as well (which
often serve as de facto bans), I argue that it differs for low export taxes. Traders can
usually pass through price distortions resulting from low export taxes to producers
and therefore have a lesser incentive to engage in the costly endeavour of setting up
cross-group defence coalitions between themselves and producers. Producer
mobilization is thus less likely and imposing low export taxes even on large groups
poses a low risk to policy-makers.
To test these arguments against competing explanations, the study employs a
mixed-method strategy. First, it runs different multi-level logit regression models
on a panel dataset of over 3,000 country-commodity-year observations

23
(representing 12 ‘bannable’ commodities in 36 African countries from 1988 to
2017). Primarily using WTO Trade Policy Reviews and agricultural census data,
country-commodity-specific export ban, tax, and labour share data have been
collected for this study. Holding a range of competing variables constant, its
findings provide strong and robust evidence for the hypothesis that larger shares of
the population gaining income from producing a commodity reduces the odds that
governments will impose an export ban (as well as high export taxes) on that
commodity. Critically, these results are robust to several alternative model
specifications, including running the models with simultaneous fixed effects for
commodities, countries and years, as well as excluding state-controlled, low-
volume, and each commodity in turn. Furthermore, by showing in a multinomial
logit regression that the reverse association holds for low – and hence less hurtful
and visible – export taxes, it provides evidence that the severity and attributability
of a policy’s impact is of importance.
Second, the study presents two qualitative case comparisons of six commodity
sectors in Ghana, Kenya, and Tanzania. Based on eight months of fieldwork and
over 250 interviews with key actors in these six and eleven further commodity value
chains, the core goal of these two comparisons is to examine the explanatory power
of competing explanations, mechanisms, and condition variables that could not be
operationalized in the large-N. In this regard, the first comparative analysis of the
Ghanaian raw cashew export ban withdrawal and the maintained Kenyan export
ban on raw cashew and macadamia nuts is particularly useful. The ban on raw
cashew exports in Ghana is one of the very rare cases where a government
introduced a ban on a commodity and withdrew it (almost instantly). This allows to
trace which events and actions by relevant players in the sector led to the withdrawal
of the ban, and thus to demonstrate the risk of implementing a ban on a large group
of producers, and why most governments avoid doing so in the first place. Overall,
the comparative analysis of these three nut sectors provides strong support for the
theoretical argument. In each case, exporters and middlemen were critical in
informing farmers about the bans and successfully mobilizing them against them.
However, only in Ghana, where nut growers were many (around 100,000), did
politicians perceive this mobilization as highly threatening and felt it necessary,
therefore, to withdraw the ban immediately. In Kenya, where cashew and

24
macadamia nut farmers were few (about 10,000 respectively), the nut bans remain
till this day, despite farmers’ initial trader-organized protest.
The second comparative analysis takes a closer look at the three most commonly
banned processable commodities in Africa: raw timber logs, metal waste and
scraps, as well as raw hides and skins. More specifically, I study the explanatory
power of the thesis argument in relation to the 1995 raw log and the 2013 ferrous
waste and scrap export bans in Ghana as well as the 2012 de facto export ban on
raw hides and skins in Tanzania. Given that these commodities strongly shape the
empirical pattern motivating the thesis and to a significant extent the findings
derived in the large-N regression analysis, it is critical to study whether the thesis
argument does indeed hold here as well or whether alternative factors can explain
their difference to other (especially agricultural) commodities. Fruitfully, being
rather different on confounding variables yet similar on the outcome and key
explanatory variable, the three commodity cases lend themselves rather neatly to a
most different systems design comparison. This allows me to preclude certain
alternative explanatory factors as necessary causes of export bans.
The three cases provide further support to the theoretical argument of the thesis. In
Ghanaian timber, the government implemented an export ban on all raw logs
(except for teak) in 1995 to promote and protect the domestic processing industry.
As in the case of the Ghanaian and Kenyan nut export bans, domestic log prices for
most species dropped by around 50% within one year of the ban. Dedicated logging
industries were furious about the ban and many of them closed shop (helping larger
foreign-owned integrated timber processors to consolidate the market). Given their
small size (less than 5,000 loggers, i.e. less than 0.03% of the population) and
organizational weakness, they failed to organize any meaningful protest or pose any
significant threat to the government, however. Importantly, since most timber
exporters in Ghana were accustomed to trading both raw logs and semi-processed
timber, the ban was less of a shock to them and presented no strong motivation to
lobby against the ban or try to lead a defence coalition against it. Similarly,
following strong lobbying from the steel industry, the Ghanaian government
decided to legally ban all exports of ferrous waste and scrap in 2013. Producer
prices dropped significantly, and scrap collectors organized by scrap traders (also
known as dealers) intensively lobbied and protested the ban – again to no avail. As

25
in timber, the number of collectors was too low (likely around 15,000 collectors in
the whole country) to be of significant political concern to policy-makers. Finally,
the context in raw hides and skins is similar, yet different at the same time. Although
there are several million livestock keepers in Tanzania, only a minuscule share of
the population earns a significant income from raw hides and skin production and
trade. The reason is that, because the actual value of a raw hide or skin constitutes
only around 1% of the value of a whole cow, goat, or sheep, African livestock
keepers de facto do not receive any income from the commodity (i.e. they are part
of the production but not value chain). The only actors gaining a significant share
of their income from working with raw hides and skins – apart from tanners of
course – are hides and skins collectors and traders, which in Tanzania represent less
than 2,500 people (or 0.005% of the population). As such, when the Tanzanian
government in 2012 decided to impose a 90% export tax (intended as a de facto
ban) on raw hides and skins, the only people agitated were hide collectors and
traders. Knowing they did not have the numerical clout to sway the government to
lift the policy, traders have mainly attempted to circumvent it by smuggling a
significant share of the national raw hide production to Kenya and overseas.
Overall, this thesis makes five key theoretical and empirical contributions. In recent
years, significant advances have been made in improving our understanding of how
industrial policy has shaped and is actively shaping development across the globe
(Lin and Chang 2009; Mazzucato 2013; Rodrik 2009; Stiglitz and Lin 2013). Much
of this literature, however, neglects the important role domestic politics play in how
and when industrial policies are implemented. This thesis builds on and enriches a
growing literature that brings back politics into the study of industrial policy
(Altenburg and Lütkenhorst 2015; Behuria 2015; Doner et al. 2005; Gray 2018;
Kelsall 2013; Khan 2013; Tyce 2019; Whitfield et al. 2015). In contrast to much of
this literature, however, it moves beyond small-N comparisons and (often useful)
emphasis on context-specificity by demonstrating that generating and testing
parsimonious theories with broad external validity remains possible in this research
field. Second, the thesis contributes to recent research emphasizing that the severity
and attributability of a policy can shape both the collective action capacity of those
affected and thus the policy’s attractiveness to politicians (Batley and Mcloughlin
2015; Harding 2015; Harding and Stasavage 2014). Moreover, it adds to a growing

26
literature demonstrating that rural mass interests can, under certain circumstances,
become a credible threat to both democratic and authoritarian governments (Boone
2003; Kjaer 2015; Pierskalla 2016; Thomson 2018). Specifically, it shows that the
building of synergetic defence coalitions along the value chain with traders can help
producers overcome their informational and organizational weaknesses, a finding
that resonates with the importance attributed to cross-group coalitions in other
recent studies (Esteban and Ray 2008; Fairfield 2011; Johnson 2011; Junk 2019;
Schrank 2019). Fourth, with the creation of the EPTA dataset, the most
comprehensive export prohibition and taxation dataset to date, it helps clear the
road for future research into the politics and economics of industrial and trade
policy in Africa, and particularly into an increasingly important, albeit greatly
under-researched topic: export restrictions. And finally, it conducts novel and
detailed political economy analyses of value chain and industrial policy dynamics
in a range of highly under-researched yet important African commodity sectors.
The thesis generates tentative policy implications for governments, industry
associations and donors keen on promoting processing. It suggests that where many
raw producers would be negatively affected through a ban, these actors should
consider policies which are less damaging economically and less risky politically.
Concretely, moderate export taxes (e.g. below 10 or 20%) could be one such
alternative. They are not only less severe and visible but also generate revenues that
can be used to support both producers and processors. If export bans are introduced
nevertheless, they should be accompanied by measures that reduce the impact on
producers (such as fair minimum prices). The lack of doing so has led to extreme
economic and political outcomes in the Kenyan and Ghanaian cashew sectors,
among others.
The thesis proceeds as follows. Chapter 2 provides further detail on the observed
export ban patterns in Africa and explains how economic feasibility conditions
shape the study’s scope of analysis. Chapter 3 first specifies the theoretical
argument of the thesis and then pits it against potential competing explanations for
the observed cross-commodity export ban patterns. Representing the first part of
the empirical analysis, Chapter 4 presents the large-N research design and its core
findings. Subsequently, Chapter 5 describes the case selection of the two
qualitative case study comparisons, and the key methodological choices made. In

27
Chapter 6, the analysis and findings of the Joint Method comparison of the
Ghanaian cashew and Kenyan cashew and macadamia sectors are discussed, before
Chapter 7 presents the second comparative analysis, comparing the Tanzanian
leather with the Ghanaian timber and metal waste industries. The thesis is
concluded in Chapter 8 with a final review of the study’s main findings,
contributions, and policy implications, as well as an outlook on future research.

28
Before venturing into debates on why certain commodities are banned more than
others in Chapter 3, this chapter discusses in four parts why this question matters in
the first place. In Section 2.1, I review the scholarship on export bans and export
restrictions more broadly. I conclude that significant work has been done on the
effects of export restrictions on diverse economic outputs, but less time has been
invested in mapping and explaining patterns of export restrictions, particularly
export bans in Africa. I argue that this is due primarily to a lack of data, a gap that
I close with the Export Prohibition and Taxation in Africa (EPTA) dataset,
presented in Section 2.2. Using the dataset, Section 2.3 illustrates key trends and
patterns in the imposition of export bans across African commodities in the last
three decades. In the final section, I present five economic factors that can explain
a large part of the variation, specifically why many commodities do not tend to be
banned. In doing so, I identify 14 commodities which can be considered bannable
and form the core units of interests for the remainder of the thesis. Critically,
significant variation in their propensity to being banned at export remains among
these 14 commodities, motivating the eventual narrower research question of the
thesis: why are African governments more likely to ban the export of some
‘bannable’ commodities more than others?
2.1. A Short Review of the Literature on Export Restrictions
While limited, the study of export restrictions has grown steadily in the last decade.
Much of this scholarship was motivated by the surge of export taxes and bans on
agricultural food products during global food prices hikes in the late 2000s as well
as high-profile disputes between China and OECD member states before the WTO
in recent years. Many of these studies have tried to understand in particular how
export restrictions on commodities have affected their international trade volumes

29
and prices and how international trade agreements could limit them (Anania 2013;
Beckman et al. 2019; Estrades et al. 2017; Fliess et al. 2012; Karapinar 2010;
Korinek and Bartos 2012; Liapis 2013; Mitra and Josling 2009). More related to
the topic of this thesis, a second scholarship has focused the economic effectiveness
and efficiency as well as the social impact of export taxes and bans to promote
commodity processing industries. Despite exceptions (Bouët et al. 2014; Ramdoo
and Bilal 2014), overall, findings are rather sobering. Studies on the use of export
taxes and bans on such varied commodities as raw cotton in Pakistan (Piermartini
2004), timber logs in Indonesia (Lindsay 1989; Resosudarmo and Yusuf 2006) and
Gabon (Morris et al. 2012; Terheggen 2011a), unprocessed oilseeds in Malawi
(Aragie et al. 2016), uncut gemstone in Madagascar (Kyngdon-McKay et al. 2016),
and different unprocessed minerals in Southern Africa (Fliess et al. 2017) have
found that overall these measures tend to be welfare-reducing both in the short- and
long-term.
Critically, little work has been conducted on uncovering and explaining patterns of
export restrictions. This is largely because collecting data on export bans and taxes
is difficult and requires considerable effort. In contrast to import tariffs,
governments do not have to notify the WTO of new export restrictions. Although
governments have information on export restrictions, they often do not make them
public. Nevertheless, three important efforts have been undertaken to collect data
on export restrictions. Since 2010, OECD researchers (Fliess et al. 2012; OECD
2014) have been collecting data on export restrictions for the top five producers of
most industrial raw materials (i.e. metals, minerals, and wood). In their analyses of
the data, they found that the use of export restrictions was on the rise, that industrial
policy concerns were a particularly common motivation behind this, and that metal
waste and scraps and wood products were especially prone to facing severe export
restrictions like export bans. Relatedly, in her thesis covering 20 developing
countries across the globe, Solleder (2013) finds that developing country
governments tend to employ export restrictions very differently across
commodities. Whereas typical cash crops (such as coffee, tea, or edible nuts) are
rarely heavily taxed, severe restrictions on food staples, timber, metal waste and
scrap, as well as raw hides and skins are much more common. Moreover, Solleder
(2013: 54) in a more superficial survey of export taxation usage around the globe

30
finds that African countries are the most extensive employees of export taxes in the
world (91% of African countries employing them), with 76% and 71% Asian and
Latin American countries respectively employing export taxes. Similarly, in their
global coverage of all major export restrictions on raw agricultural commodities
implemented in between 2004 and 2015, Estrades et al. (2017) also find that
whereas cash crops are generally rarely heavily restricted, food staples are banned
relatively frequently in times of global food crises.
Although the three described data collection efforts have added significantly to the
knowledge on the cross-commodity patterns of export restrictions, they have
significant limitations. Most importantly, none of the three research projects has
attempted to explain why governments tend to impose export restrictions more on
some commodities than others. Rather than seeing export restrictions as an outcome
variable, it is used to explain other outcomes, like global commodity prices, while
mostly ignoring the potential role played by domestic and international politics.
This is unfortunate. As I argue in this thesis, particularly the impositions of export
bans are an outcome that provides a novel and relevant lens to analysing the politics
of industrial policy-making in developing countries.
Second, all three studies have significant data constraints. Whereas Solleder finds
Africa to be the most export restrictive continent, her core dataset only covers four
African countries and focusses exclusively on export taxes. Similarly, the OECD
dataset only covers export restrictions on 12 African countries and limits itself to
industrial raw materials. Finally, while Estrades et al. (2017) have a global country
coverage across export restriction types, they focus only on agricultural
commodities, thereby severely limiting the potential scope of analysis. Thus, in
order to study the economics and politics of export restrictions in Africa, a more
comprehensive dataset is required.
Four major conclusions can be drawn from the discussion of the literature. Most
economists are sceptical about the use of export restrictions and export bans in
particular. Nevertheless, governments across the Global South (and particularly in
Africa) appear to increasingly use them in their pursuit of industrialization.
Importantly, however, governments restrict the export of some raw commodities
more than others. Yet, little research has been invested in explaining such patterns,

31
partially due to the lack of adequate datasets. The following section thus introduces
a dataset that allows addressing these gaps.
2.2. Introducing the Export Prohibition and Taxation in Africa
Dataset
Considering the identified gaps in the literature and given that no ready-made
export restriction dataset covering Africa exists, I constructed the Export
Prohibition and Taxation in Africa (EPTA) panel dataset for this study. It includes
data on export taxes and prohibitions for 36 sub-Saharan African WTO member
states3 covered by the WTO Trade Policy Reviews (TPRs), with the earliest date of
coverage 1988 (for some countries) and the latest 2017. The TPRs provide the
largest volume of information on export measures (WTO 2018). They are compiled
by WTO country experts, who spend several months in a country summarizing all
trade relevant policies, including export bans. Given that member countries are not
compelled to notify the WTO when they implement an export restriction, these in-
depth reviews constitute the most detailed and reliable source on this trade policy
instrument. Global Trade Alert (2016) has been a further common source for export
restriction datasets and constitutes the second most used source for the database.
Finally, I cross-checked the data, particularly the exact year a measure was
introduced, against information collected from government websites and legal
databanks, newspaper articles (if verifiable by official sources), and direct inquiries
with relevant government agencies.
Government export prohibitions and the reporting thereof often do not follow
common international trade statistic standards. Rather than indicating the exact
trade product code(s), governments and TPRs will be more general and indicate,
3 The 36 countries are: Angola, Benin, Botswana, Burkina Faso, Burundi, Cameroon, Central
African Republic, Congo Dem. Rep., Congo, Rep., Cote d'Ivoire, Djibouti, Gabon, Ghana, Guinea,
Guinea-Bissau, Kenya, Lesotho, Madagascar, Malawi, Mali, Mauritania, Mauritius, Mozambique,
Namibia, Niger, Nigeria, Rwanda, Senegal, Sierra Leone, South, Africa, Swaziland, Tanzania,
Togo, Uganda, Zambia, Zimbabwe.

32
for example, the ban of ‘all round logs’, ‘metal waste and scraps’, or ‘unprocessed
cashew nuts’ (which in the following I refer to ‘as named in the document’).
However, most relevant trade data in the world – such as that on a product’s trade
value, volume, or the import tariffs it faces elsewhere – is nowadays captured via
the so-called ‘Harmonized System’ (HS), which is the internationally standardized
system of names and numbers to classify traded products maintained by the World
Customs Organization. According to the HS, goods can be classified and
disaggregated into sections (e.g. ‘vegetable products’), chapters (e.g. chapter 10:
‘Cereals’), headings (e.g. heading 10.06: ‘Rice’), and sub-headings (e.g. sub-
heading 100630: ‘Semi-milled or wholly milled rice, whether or not polished or
glazed’). To be able to relate the EPTA dataset to other trade databases and
variables, all banned and taxed products mentioned in the original sources were
translated to their six-digit sub-heading product level equivalents.4 For example,
‘unprocessed cashew nuts’ translate very directly to code ‘080131: Nuts, edible;
cashew nuts, fresh or dried, in shell’. For other products, translations might be more
complex. There are, for example, ten different six-digit level codes relevant to the
description of ‘round logs’:
440310 Wood in the rough..., treated with paint, stain
440320 Untreated coniferous wood in the rough...
440331 Dark Red Meranti, Light Red Meranti and Meranti (excl. treated)
440332 White Lauan, White Meranti, White Seraya (excl. treated)
440333 Keruing, Ramin, Kapur, Teak, Jongkong, Merbau (excl. treated)
440334 Okoume, Obeche, Sapeli, Sipo, Acajou d'Afrique (excl. treated)
440335 Tiama, Mansonia, Ilomba, Dibetou, Limba and Azo (excl. treated)
440391 Oak (Quercus spp.) wood in the rough, (excl. treated)
440392 Beech (Fagus spp.) wood in the rough, (excl. treated)
440399 Wood, nes in the rough..., (excl. treated)
In such cases, only those products which were actually exported (i.e. showed up as
such in trade databases prior to the ban) were marked as banned in the dataset. For
4 Doing so the HS0 or HS1988 version of the system was used. Since 1988, there have been six
updated versions of the classification. The HS1988 version – rather than the newest HS2017 – was
used because it is much easier to convert the new classifications back into older ones, but very
difficult (if not often impossible) to convert old classifications into new ones. Accordingly, most
trade data are available in one go until 1988 with the HS0/1988 version, but only until 2017 for the
newest version, or 2007 for the HS4/2007 version. To make the most out of the TPR data that can
go back to 1988, it made most sense to use the original HS0 version. Only one exception was made
to this rule in the dataset: cashew. Because the HS0 version does not disaggregate between in-shell
and shelled cashew nuts, the HS1/1996 version was used which does.

33
example, Gabon never exported oak logs (code 440391) because it never produced
oak trees5. Claiming it also banned the export of oak logs when it banned the export
of ‘all round logs’ would not make much sense, and as such, only those log types it
did actually export are listed in the dataset.
2.3. Export Bans in Africa: Trends and Patterns
With the help of the EPTA dataset and these classifications the phenomenon of
export bans in Africa can be described in more detail. First, we shall track how
many commodities were banned according to the TPRs and other sources in 36
African countries in the last three decades, and when these bans were first
implemented. We can do this in at least two ways. One, we can look at the number
HS six-digit-level product categories which saw the imposition of a ban in a certain
year and country. This way is somewhat problematic as an indicator of quantity. As
outlined above, whereas some commonly understood commodities like ‘raw
cashews’ correspond to only one HS product code, others like ‘unprocessed timber
logs’ correspond to ten. As such, if ten countries decided to ban unprocessed
cashews in the same year, on an HS-six-digit-level-based measure this would show
up no different than if one country had banned the export of all raw logs (if they
exported all raw log types). Therefore, certain product bans would appear as
massively overrepresented in aggregated statistics. Though to a lesser extent, the
same problem persists when going up to the HS-four-digit-level. Whereas all round
log six-digit-level products belong to the same HS-four-digit level, ‘metal waste
and scraps’, for example, the 32 potential metal waste and scrap HS-six-digit level
products belong to 21 different HS-four-digit ‘headings’. An alternative is to go up
to the HS-two-digit chapter-level (which still suffers partly from this rather arbitrary
weighting). Easier and arguably closer to the original understanding and intentions
of the policy-makers implementing the ban is to simply go by the name or
5 Note that it does produce Oldfieldia africana, also known as the African oak, which however is
different from the ‘Quercus’ species referred to in the product code.

34
commodity used in their decrees or in the data source (e.g. TPR, Global Trade Alert,
etc.).
Figure 2.1. Total Annual Introduction of Export Bans in 36 African WTO Member
States by HS-Six-Digit Level and by ‘Name in Document’, 1960-2017
Source: Own illustration based on EPTA dataset
Figure 2.1 attempts to chart these two variables over time. Specifically, it looks at
all the HS-six-digit-level products and products as named in the primary sources
that were affected by export bans in the time of the TPR (i.e. post-1988) and
indicates in which years they were introduced. In line with the previous discussion,
we see that many more HS-six-digit-level products are banned than products named
in the primary sources. This is also reflected in a few different peaks, such as in
2007 where the Guinean government introduced a rare blanket ban on food staple
exports, fishery products, as well as timber (which all together translate into
hundreds of HS-six-digit level products, but only a handful of ‘names in the
0
5
10
15
20
25
30
0
50
100
150
200
250
1960
1963
1966
1969
1972
1975
1978
1981
1984
1987
1990
1993
1996
1999
2002
2005
2008
2011
2014 B
ans
per
Pro
duct
as
'Nam
ed i
n D
ocu
men
t'
Ban
s p
er H
S-S
ix-D
igit
Lev
el
Year
Bans per HS-Six-Digit Level
Bans per Product as 'Named in Document'

35
document’) in an effort to combat the starting food crisis in the late 2000s. A full
list of all implemented bans by country, year of introduction, processing stage, and
commodity type can be found in Appendix 2.1. In Appendix 2.2. Figure 2.1 is
recreated, however, this time disaggregating the introductions by commodity group.
Figure 2.2. Bans Introduced by Country and Named Product, 1960-2017
Source: Own illustration based on EPTA dataset

36
In general, however, the patterns of the two measures are strikingly similar. Barely
any of the bans captured by the dataset were implemented prior to the first SAPs in
the 1980s. In fact, out of the 986 HS-six-digit level products that have experienced
a ban in the last 30 years, 869 (88%) faced the introduction of a ban post-1990 and
789 (80%) post-2000. Looking at products as named in the original documents,
these number translate to a total of 129, of which 110 (85%) were introduced post-
1990 and 95 (74%) post-2000. Overall, this pattern is broadly consistent with the
argument that bans were often implemented in a post-marketing board and state
monopsony period where few means are available besides bans and high taxes to
divert raw production to domestic processors (or consumers). Peaks in the charts
tend to reflect years in which countries (or regional unions) decided to implement
bans on a range of commodities (e.g. Nigeria in 1988; the ECA in 2005, or Mali in
2015 [also illustrated in Figure 2.2]) or periods of continent-wide food price crisis
during which many countries implement short bans on food staples, such as during
the 2007-2009 global food price crisis. Importantly, bans on non-food staples are
very rarely withdrawn.
Having established since when export bans have been mostly employed, we can
determine what they actually ban. Figure 2.3 below illustrates the number of ban
introductions on products named in the original documents summarized by sector,
i.e. the HS’s highest level of aggregation. On a more superficial level, we find that
products belonging to the wood, vegetable, and metal sectors are banned most
frequently, each with over 30 named products banned at export. Animal, hides and
skins, as well as stone and glass exports, are also commonly though less frequently
banned. There are a few instances of export bans on machines and electronics, food
products, minerals, as well as one each on products belonging to the rubber and fuel
sectors. In contrast, no bans were imposed on exports of chemicals, textiles,
footwear, or transportation products (e.g. cars, bicycles, etc.).
To understand exactly what products are banned, these sectoral boxes need to be
further unpacked. Appendix 2.1 details all country-product bans, sorted by sector.
The three most commonly banned sectors are wood, vegetables, and metals. With
46 bans, wood products are the most commonly banned products in the dataset.
Over half of these (26 bans) exclusively concern “raw” or “unprocessed” timber
logs. Three countries (Cote d'Ivoire, Madagascar, and Nigeria) have banned semi-

37
processed timber in addition to log exports. In eight cases bans have affected the
export of some or all wood species independent of their degree of processing. And
bans on charcoal exports accounted for 10 of the 46 bans.
Figure 2.3. Number of Export Bans by HS-Sector-Level, 1960-2017
Source: Own illustration based on EPTA dataset
Importantly, processing promotion is not always the rationale for bans on wood
products. Bans on charcoal, for example, tend to be implemented to secure domestic
supply (with the majority of African producers relying on wood charcoal for
cooking) or to reduce illegal logging. In general, environmental concerns can be an
important factor in explaining bans. In those instances where governments ban all
wood products irrespective of their degrees of processing this is arguably always to
conserve forests. Accordingly, as with the recent wave of rosewood export bans
0 10 20 30 40 50
Transportation
Miscellaneous
Footwear
Textiles and Clothing
Chemicals
Minerals
Fuels
Plastic or Rubber
Food Products
Mach and Elec
Stone and Glass
Hides and Skins
Animal
Metals
Vegetable
Wood
All W/O Food Staples and Metal Waste

38
across Africa6, such interventions are usually accompanied by complete timber
harvesting and transportation bans. The primary rationale for export bans
exclusively on unprocessed logs tends to be different. Although environmental
concerns can be a partial motivator (but also often serve as a pretext to justify/cloud
industrial objectives),7 interviewed forestry experts8, as well as scholarship and
reports on timber export bans, agree that the primary reason for bans on raw logs
is to promote domestic processing industries (Amoah et al. 2009; EIA 2018; Kishor
et al. 2004; Resosudarmo and Yusuf 2006; Schaap and Canby 2018; Treue 2001).
The explicit use of log export bans as an industrial policy tool has been and remains
very common not only in Africa but throughout the northern and southern
hemisphere.9 In line with the aim of this thesis to understand bans imposed for
processing promotional reasons, the remainder of this study (i.e. Chapter 3 to
Chapter 8) focusses only on those wood product bans that were exclusively targeted
at the lower end of the value chain, thus the 26 raw log export bans as well as the
three export bans that have also banned roughly sawn logs10. Thus, bans on charcoal
6 Rosewood (which describes a range of different species of tropical wood) is particularly popular
in China, having led to its massive overlogging and African governments wanting to protect it.
7 Some argue that an export ban can at least in theory make it more difficult for illegal loggers to
“cut-and-run” with raw logs stolen from a country’s forests, because logs must be transported to a
domestic mill, where nearby roads and checkpoints can be more closely monitored (Schaap and
Canby 2018: 5). Numerous empirical studies, however, have found that raw log exports bans often
have the opposite effect, leading to more illegal logging and forest deterioration, deriving from
increased demand from more inefficient and poorly-controlled local sawmills (Barbier and
Rauscher 1994; Deacon 1995; Dean 1995; Dudley 2004; Kishor et al. 2004; Resosudarmo and Yusuf
2006).
8 Interview with senior trade and policy Analyst at Forest Trends, 16.05.2019, per email; interview
with senior trade and legality expert at the World Resource Institute’s Forest Legality Initiative,
16.05.2019, per email. Respectively, the interviewees stated ‘I would share the hypothesis that the
driving force behind the majority of log export bans are for the promotion of domestic value-added
process, rather than true environmental protection’ and ‘(…) log export bans are mainly established
to promote domestic timber processing industries, not to achieve environmental objectives such as
combatting illegal logging’. This shows that raw log export bans are indeed imposed primarily for
purposes of promoting timber industries and justifies including such bans in further analysis of this
dissertation focused on processing promotion.
9 Lists of timber export bans throughout the globe have been compiled by Forest Trends (2019) and
World Resource Institute (Noguerón et al.).
10 Côte d’Ivoire, Madagascar, and Nigeria (as detailed in Appendix 2.1) have all banned both the
export of raw and sawn logs. At the same time, they explicitly allow the export of further processed
goods such as veneers or plywood, stating processing promotion as key motivation for the ban.

39
or bans imposed on wood products independent of their degree of processing are
excluded from the large-N analysis that appears in Chapter 4.11
In contrast to most wood products, vegetable products are rarely banned for the
purpose of promoting processing. Out of 34 vegetable products banned, 29 concern
food staples, specifically cereals, rice, and tubers. Food staples are usually (and
often explicitly) banned to protect domestic food supply and oppose domestic food
price inflation (this is obviously also true for the five bans covered under the ‘Food
products’ category in Figure 1.3).12 One indication that processing promotion is not
the aim of food product bans is the fact that rather than explicitly saying only
‘unprocessed’ or ‘raw’ rice, maize, wheat, etc. should be prohibited from export,
they more generally address all kinds of ‘cereal products’ or ‘maize products’, or
as in Guinea in 2007 ‘any export and re-export of farm produce which are part of
the people’s staple food’ (APA News). Given the focus on processing promotion,
these commodities are thus excluded from the analysis in subsequent chapters. As
described in Chapter 3.1.2, however, the theoretical argument can also explain
politically why bans on food staple exports are so frequent in times of international
food crisis. In contrast, the remaining five vegetable product bans – on ‘Raw
Macadamia Nuts’ and ‘Raw cashew nuts’ (Kenya, 2009), ‘raffia and bamboo in its
raw state’ (Mali, 2015) and ‘Seed Cotton’ (Niger, 1998) – have been explicitly
introduced to promote processing.13 Thus importantly, as Figure 1.3 indicates,
particularly African cash crops, such as nuts, coffee, cocoa, or tea are barely ever
banned.
The third most commonly banned product group are metals. Crucially, however,
this label hides that these bans exclusively target one specific sub-group of metals:
metal waste and scrap. Essentially, all 31 metal products banned concern specific
11 Relatedly a ban on copper waste and scrap exports in Mauritius is also not included. Mauritius
has no industrial capacity to process copper scrap. The measure was introduced to curb the theft of
copper (which is much more likely than that of the more commonly banned ferrous scrap, because
it is much more valuable per kilogram).
12 Note again that bans are rarely withdrawn once implemented. Bans on food staples imposed in
times of food crisis – and withdrawn once they are over – are rather exceptional in this regard (and
further demonstrate that they were not implemented to promote processing).
13 Having lasted less than a month (a week, to be precise), the ban on raw cashew nuts in Ghana is
not included in the dataset.

40
metal waste and scraps (particularly ferrous or copper) or metal waste and scraps in
general. In stark contrast, with the exception of on-and-off bans on chromium ore
in Zimbabwe between 1996 to 2015, no country covered in the EPTA dataset has
imposed a ban on more classical mineral products, such as iron, copper, or
aluminum ores, gold products, or any other kind of metal products. Importantly, the
five bans indicated in the machines and electronics sectoral category all concern
used automobile batteries, which are also considered a domestically recyclable
metal waste product. Although in some cases governments also name the protection
of public infrastructure against theft as a reason to ban the export of metal wastes
and scraps, arguably the core rationale behind these bans are the protection of local
metal smelting industries. This is both supported by my study of the TPRs and the
Ghanaian metal waste ban case study, but is also in line with Fliess et al.’s (2012:
11) analysis of a global OECD survey on export restrictions, finding that the rational
governments banning metal waste cite most frequently is safeguarding domestic
supply and protecting the local (smelting) industry.
The sixteen animal products that have been banned can be clustered in three groups.
First, six of these concern fresh unprocessed fish, specifically Nile Perch and
Tilapia (found in Lake Victoria) which have been banned by the five East African
Community countries Kenya, Tanzania, Uganda, Rwanda and Burundi under the
EAC Customs Management Act (2005). Importantly, no other fish is concerned by
the ban in those countries. Furthermore, no other African country has ever banned
the export of fish, with the exception of Guinea, which in its 2007 temporary blanket
ban on food products also banned the export of all fish products. This ban in itself
constitutes the second general group under the animal sector, with Guinea also
having prohibited all cattle, pig, and dairy produce exports to quash the food price
crisis. Finally, there are five bans on live cattle, donkeys,14 and goats. These are not
banned to promote processing of any sort but to prevent cattle rustling (hereby
protecting the mass of livestock keepers) and secure livestock populations,
especially in times of food crises, and are therefore excluded from further analysis
14 According to the BBC (07.10.2017), Uganda, Tanzania, Botswana, Niger, Burkina Faso, Mali,
and Senegal have banned donkey exports to China in the last years. This is the result of high demand
from China for African donkeys, where the donkey skins are boiled, producing a brown gelatine,
which is the essential ingredient in Chinese ‘ejiao’ products, popular health foods and traditional
medicines.

41
in subsequent chapters. This stands in contrast to the prohibition of raw hides and
skins. Apart from the five ECA member states15, Botswana, Burkina Faso, Nigeria
and Zambia have banned the export of raw hides and skins with the explicit aim to
promote their respective leather industries.
The final product sector among the relatively frequently banned sectors are stones
and glass. In total, six countries have prohibited exports belonging to this sector.
Angola and Mali have allegedly banned the export of rough diamonds to promote
downstream industries in 2011 and 1989 (when Mali also allegedly banned the
export of natural gold16), although I could find no supporting evidence that these
have actually been implemented and enforced at all. Zimbabwe had also banned the
export of all diamonds (irrespective of the degree of processing) in between 2010
and 2011, however, not to promote processing, but as a counter-reaction to one of
the state mines losing its Kimberly certification due to alleged atrocities committed
there by the army (Dzirutwe 2010). This ban is thus not included in the large-N
analysis. In contrast, Botswana, South Africa, and Tanzania have imposed bans on
all or some unprocessed semi- and precious stones to promote the development of
national cutting industries and are thus included in the further analysis.
Finally, the rubber and fuel sectors display one ban each. In 1988, directly at the
beginning of its Structural Adjustment Program, Nigeria prohibited the export of
‘unprocessed rubber latex and rubber lumps’ (alongside 11 other commodities). As
discussed shortly in the next section, this is somewhat surprising given that trade in
unprocessed latex and rubber lumps is almost inexistent, as primary processing of
rubber into intermediate products (like latex concentrate, block rubber, smoked
sheets, or crepe rubber) almost always happens near origin, a process that according
15 These have actually introduced an 80% export tax, which is intended to serve as a de facto export
ban (Interview with Leather Promotion Officer (MoIT), Per Telephone, 11.07.2017).
16 Gold producing countries (or rather, gold miners) usually do not export ‘natural gold’, that is gold
dust, but independent of state policy usually process it to gold bars with a purity of around 70-90%.
The next step in the value chain requires the refining of such gold. In 2013 the Malian Minister of
Mining has indeed indicated he wants to impose a ban on unrefined gold, which has not yet realized
(Africa Intelligence 17.12.2013). The theoretical framework of this thesis would imply that the fact
that around one million small-scale gold miners in Mali would likely be negatively affected by that
policy plays a role in this non-implementation, although this would require more in-depth case study
research and testing. Similarly, it appears that the Zimbabwean government never realized its plan
to impose a ban on unrefined gold. Again, several hundred thousand Zimbabweans work in gold
mining (Bulawayo 24 News 20.12.2013).

42
to rubber experts interviewed17 does not need to be protected (i.e. banned). The ban
of the fuel product corresponds to a prohibition to export subsidized petroleum
products in Guinea in the late 2000s. Hence, this ban was not on crude oil produced
in Guinea (i.e. for processing purposes), but on refined oil to secure domestic supply
for consumers. As detailed below, given the close control governments have on
crude oil production, banning their exports would be a superfluous measure.
Concluding, a range of stylized facts can be derived from this discussion.
Essentially all products banned are commodities and the vast majority of them
target raw materials specifically, which usually have the explicit goal to promote
processing. Putting food staples and animal products aside (which are banned for
purposes other than processing, the focus of this thesis), unprocessed timber and
metal waste and scraps are the most banned commodities. Though less frequently,
a sizable number of countries also ban the export of raw hides and skins as well as
unprocessed stones to promote their processing. Other than that, export bans are
rare. With only a handful of exceptions, African cash crop exports are not
prohibited. Similarly, it seems crude oil or natural metal exports are never banned,
with the rare exception of unprocessed chrome ban in Zimbabwe. In the following
section, I will try to unpack basic economic factors that promise to explain a large
part of this variation.
2.4. Export Bans and Economic Feasibility: Narrowing the Scope
Why do African governments ban certain commodities more than others? Are there
factors which would make the utilization of bans on certain commodities
nonsensical? To study this, I created a list of all commodities (or commodity
groups) exported from Africa, and excluded all classical food staples18,
17 Interview with a senior executive of the rubber division at Olam International, 06.07.2018, per
email; Interview with senior Liberian rubber consultant, 05.07.2018, per telephone; Interview with
researcher and expert of the Thai rubber value chain, 06.07.2018, per telephone.
18 To ensure that this analysis on the relationship between export bans and commodity processing is
not tarnished by food security considerations, I follow Solleder (2013: 89) in omitting all domestic

43
commodities which are already in their final consumable stage (e.g. cloves), and
commodities that did not reach a minimum annual export value of US$ 100
million19 in my 36 sample countries in 2011 (the year with most observations in the
EPTA dataset). From this, we derive a list of 36 raw commodities that could be
processed and might be relevant enough for governments to consider banning to
promote processing.
In a second step, based on an extensive literature review and eight months of
fieldwork (described in Chapter 5), I determine to what extent banning these
commodities to promote processing would be economically sensible. Or to put it
differently, how ‘bannable’ each commodity is. I conclude that 22 out of the 36
commodities should be considered ‘unbannable’ in the context of this study, and
that five factors explain why. The list of commodities and the degree to which they
are affected by these factors is summarized in Table 2.1 (for those determined
unbannable) and Table 2.2 (for those considered bannable) below. Importantly,
these 22 commodities are excluded from the theoretical discussions and empirical
analysis pursued in subsequent chapters of the thesis.20
staple food items from the analysis. That being said, as detailed in Chapter 3.1.2 food staples’ higher
propensity to be banned (relative to other agricultural crops) also observed by other studies
(Anderson 2013; Bouët et al. 2014) is in line with the thesis argument, despite food staple producers
being many.
19 The rationale is two-fold. First, commodities which account for less than this value are unlikely
to be major commodities in the African countries under study. Policy-makers are therefore unlikely
to believe they are interesting bases for processing promotion. Second, for practical reasons.
Collecting data on the variables studied in this section takes a lot of time per commodity. Doing so
for one hundred or more commodities would be infeasible (and of little use) in the range of this
study, thus, the decision to set a threshold for commodities studied in this section.
20 The alternative of keeping all 22 commodities throughout the remainder of thesis, I argue, would
not be theoretically necessary, practically feasible, and methodologically sensible. As discussed in
much detail below, there is strong economic reasoning as to why governments do not impose export
bans on these 22 commodities. Including them would therefore threaten to significantly bias the
analysis. What is more, empirically, there would be no benefit to adding them to the large-N analysis
in Chapter 4. In theory, they could be along with all five factors identified and discussed below as
dummy variables. These new commodities, however, would simply be dropped by the statistical
software (i.e. Stata) from the regression, since they would have a 0% likelihood for a ban and be a
‘1’ on the dummy, thus predicting ‘failure’ (i.e. ‘no ban’) perfectly. Yet practically, including the
22 commodities would come at a high cost. Provided it can be found, collecting data on all major
variables for takes around one to two weeks per commodity (which is likely the reason why the two
key political economy of commodity taxation studies to date [Kasara 2007; McMillan 2001] have
only focused on five and seven commodities respectively, whereas this study looks at over 12). Thus,
for 22 extra commodities we are talking at least 22 weeks of work, which I argue is excessive for
commodities which have little to no theoretical or empirical reason to be accounted for more
thoroughly.

44
Taking a closer look at these five factors we first find that some raw commodities
are highly unlikely to be banned because they need to be processed close to
consumption. A classic example is coffee. Whereas green beans can be stored for
several years, roasted coffee rapidly goes stale and loses its flavour. As a
consequence, almost all of global coffee trade occurs in its unroasted form, and only
about 0.24% in roasted form (Hetzel 2016; International Trade Centre 2011;
Roemer 1979; Talbot 2002; UNECA 2013: 101). Iron ore is another example. Many
steel-using manufacturing industries (such as the car industry) need to heat the steel
during or close to manufacturing. As such, it is economically much more efficient
to smelt and process the iron ore to steel close to the factory, rather than having to
go through the costly process of re-melting it (Östensson and Löf 2017: 10).21
Animals produced for meat consumption also tend to be traded alive within Africa
and butchered near consumption. Given the lack of adequate cooling systems and
markets for cut meat, it is much more economical and sanitary to trade live animals
rather than processed meat within Africa. Thus, in all three cases, a ban on the raw
material would massively disrupt the trade and production viability of that
commodity. Somewhat differently, African uranium ore can only be enriched in
consumer markets, though not for economic reasons, but to comply with the
Nuclear Proliferation Treaty. Clearly, all this might change with technological
innovations in the future. However, in the period under study, these characteristics
have been highly consistent.
Second and in direct contrast to the preceding point, some commodities can only
be exported once processed or are much cheaper to transport once processed, hence
do not demand a processing promotion policy. This is true for numerous soft
commodities such as rubber, sisal, palm kernels, or fish (Cordes et al. 2016: 21;
Radetzki 2008; Talbot 2002; UNECA 2013). It is also true for natural gas, which
needs to be liquified prior to transport, or in some instances copper. Given the high
capital cost (see also factor five below) of processing copper and the tremendous
copper smelting overcapacities created in China (since the early 2000s), creating
and running copper smelters and refineries is very difficult economically in Africa.
21 Interview with metal processing consultant, 13.02.2018, per telephone; Interview with former
London Metal Exchange Policy Executive, 30.04.2019, per telephone; Interview with metal
processing and trading policy consultant, 09.05.2019, per telephone.

45
However, given that transport cost in landlocked countries or regions like Zambia
or eastern DRC is extremely high, and that processing copper ore can massively
reduce its weight and thus its transport cost, refining in these two countries is
actually more economical than exporting raw ore, which is why – to the extent that
the energy provision allows – all copper is refined domestically (Östensson and Löf
2017).22 As such, in all these cases it again would not make much sense to impose
a ban on the raw commodity, simply because it is not required.
A third relevant factor is that many commodities can be consumed in their raw state
and often have higher profit margins in this form compared to being processed.
Most horticultural products such as fruits and vegetables fall into this category.
Pineapple processors in Ghana, for example, largely process those pineapples
which in their raw state do not meet the requirements of the foreign consumers
(because they are too small, patchy, etc.).23 Therefore, while a farmer sells
pineapples appropriate for raw export for around 0.25 $/kg, those suitable for
processing will only fetch 0.16 $/kg. The same is true for groundnuts. The profit
margin for unprocessed peanuts that can be used in the confectionery industry is
significantly higher than that for peanut oil or butter, which is why only rejects from
the snack export are used in processing oil (Arnoldus 2019). Restricting the export
of the raw commodity under these circumstances would be unreasonable as it
implies reducing the revenue and overall value-added in the industry.
Fourth, governments will be less inclined to impose export bans on commodities
whose production chain it closely controls. Remember that export bans imposed for
processing promotion purposes become relevant when processors struggle to
compete against exporters in sourcing raw materials from producers. In situations,
however, where the government is the producer or closely controls the production
it would make more sense for it to simply oblige itself (or the producer) to supply
enough raw materials to processors, rather than indirectly restricting exports. A
typical sector where this pattern comes to bear is the petroleum sector (e.g. in
22 Some copper ore includes arsenic that can only be handled economically in around five specialized
copper refineries in the world (Östensson and Löf 2017).
23 Industrial pineapple processor, Accra (Ghana), 14.05.2017. Senior advisor on fruit processing at
Market Oriented Agriculture Programme (GIZ), Accra (Ghana), 18.05.2017.

46
Nigeria where the government via the NNPC owns the majority shares and controls
the business decisions of both extraction and refining industries). In those rare
instances – such as in Botswana – where the government (co-)controls all diamond
mining, obliging itself (and/or its co-owner, usually De Beers) to cut and polish
some of its production domestically is easier (Mbayi 2011). Similarly, export bans
were effectively redundant during the governmental reign of agricultural
commodity chains through marketing boards prior to SAPs, which is why they were
rarely employed on these commodities.
A fifth crucial and more complex factor explaining why African governments are
unlikely to ban the export of certain commodities is the capital investment required
for setting up certain processing industries. When governments ban the export of a
raw commodity – and local processing capacity is not existent or sufficient to
supply all local produce – new processing factories need to be built. This could be
done by three groups: foreign investors, local private investors, or the state. If a
country’s production volume (its ‘market power’) of a commodity is not significant
enough, foreign investors (particularly current foreign processors) might simply opt
to give up on the country and source their raw supply elsewhere, rather than setting
up shop in the country.24 In that case, the government itself or domestic private
investors would have to step into the breach and finance the expansion of the
processing industry. Critically, however, the capital expenditure required to set up
processing plants varies significantly across commodities, and for many
commodities it is simply unlikely that the state or local investors could carry the
financial burden. As such, in cases where the capital expenditure required vastly
exceeds the apparent domestic financial ability and market power is limited,
imposing an export ban to promote processing would be extremely risky and
unlikely.
24 As discussed in Chapter 3.2.3.1, a commodity‘s market power might affect the success of
promoting its processing using export bans for most commodities. Generally, the higher the market
power of a commodity, the more likely a ban would incentivize companies to set up processing in
the country. To account for this more generally, a market power variable is included as control in
the large-N analysis.

47
Table 2.1. An Overview of Major Processable Commodities in Africa Determined as Unbannable
Raw Commodity Potential Processed Product % of Producing
Countries (‘N’)
Banning in 2011
1. Process.
Close to
Consumption
2. Process.
Prior
Transport
3. Partial
Value
Reduct.
4. Close
Control
5. High
Capital
Intensity
Green coffee beans Roasted coffee 0% (N: 35) Yes No No No No
Felspar Glass Production, Ceramics. 0% (N: 3) Yes No No No No
Iron ore Pig Iron 0% (N: 26) Yes No No No Yes
Uranium Enriched Uranium 0% (N: 8) Yes No No No Yes
Live animals Processed Meat 0% (N: 22) Mixed Mixed No No No
Raw/semi-processed rubber Processed rubber 3% (N: 30) No Yes No No No
Fresh fish Semi/-processed fish 14% (N: 36) No Yes No No No
Natural gas Liquified natural gas 3% (N: 31) No Yes No Mixed Mixed
Coal Coke 0% (N: 23) No No Yes Mixed Mixed
Fresh fruits Cut fruits, juice 0% (N: 36) No No Yes No No
Groundnuts Peanut Oil / Butter 0% (N: 29) No No Yes No No
Crude oil Refined oil 4% (N: 25) No No No Yes Yes
Bauxite Alumina 0% (N: 14) No No No No Yes
Lead ore Refined lead 0% (N: 11) No No No No Yes
Manganese ore Ferro-manganese, silicomanganese 0% (N: 18) No No No No Yes
Phosphate ore Phosphoric acid / fertilizer 0% (N: 19) No No No No Yes
Nickel ore Pure nickel or ferronickel 0% (N: 7) No No No No Yes
Tin ore Refined tin 0% (N: 9) No No No No Yes
Titanium ores Titanium pigment 0% (N: 8) No No No No Yes
Zinc ores Zinc oxide and refined zinc (ingots) 0% (N: 11) No No No No Yes
Cobalt ores Refined cobalt 0% (N: 16) No Mixed No No Yes
Copper ores Refined copper 0% (N: 11) No Mixed No No Yes

48
Table 2.2. An Overview of Major Processable Commodities in Africa Determined as Bannable
Raw Commodity Potential Processed Product % of Producing
Countries (‘N’)
Banning in 2011
1. Process.
Close to
Consumption
2. Process.
Prior
Transport
3. Partial
Value
Reduc-
tion
4. Close
Control
5. High
Capital
Intensity
Raw Hides and Skins Wet-Blue or Final Leather 9% (N: 33) No No No No No
Base Metal Waste and Scrap Base Metal Product 33% (N: 36) No No No No No
Unpolished clrd. gemstones Polished coloured gemstones 8% (N: 25) No No No No No
Unrefined gold Refined gold 0% (N: 25) No No No No No
Unpolished diamonds Polished diamonds 11% (N: 18) No No No Mixed No
Unrefined Chromite Ferro-Chrome or Pure Chrome 9% (N: 11) No No No No No
Raw cotton Cotton yarn 0% (N: 28) No No No No Mixed
Raw cashew nuts Shelled cashew nuts 5% (N: 19) No No No No No
Tea in Bulk Packed Tea 0% (N: 35) No No No No No
Raw macadamia Shelled macadamia 20% (N: 5) No No No No No
Sesamum seeds Sesame oil 0% (N: 23) No No No No No
Unmanufactured tobacco Cigars, cigarillos, cigarettes, etc. 0% (N: 24) No No No No No
Cocoa beans Cocoa paste, liquid, butter 0% (N: 21) No No No No Mixed
Wood in the rough Semi/-Processed Wood 52% (N: 33) No No No No No
Note: Both in Table 2.1 and Table 2.2 ‘Producing Countries’ refers to every country that in 2011 has exported at least US$ 1 worth of a commodity or banned its
exports (in which case it might export US$ 0 of a commodity, although it produces it). Sources are listed in the text above or in Appendix 2.3 and Appendix 3.1.

49
Table 2.3. The Cost of Setting Up Commodity Processing Industries
Commodity Country Capital
Expenditure
Required (in
million US$)
Market
Power
Capex /
Annual
Budget
Mining
Bauxite Guinea (1) 12,488 5.5% 781.0%
Copper Concentrate DRC (1) 3,787 4.4% 117.0%
Manganese Ore Gabon (2) 2,737 12.8% 87.7%
Metal Waste and Scrap Nigeria (1) 780 0.7% 5.6%
Nickel Ore Madagascar (2) 2,730 2.0% 211.3%
Coloured Gemstones Tanzania (2) 91 1.1% 1.2%
Unpolished diamonds Botswana (1) 131 20.5% 2.3%
DRC (3) 29 4.5% 0.9%
Unrefined Chromite Zimbabwe (2) 88 1.8% 2.4%
Unrefined Gold Ghana (2) 36 2.5% 0.4%
Tanzania (3) 20 1.4% 0.3%
Agricultural/Non-Mining
Cocoa beans Côte d'Ivoire (1) 1,302 37.5% 18.3%
Ghana (2) 623 17.9% 6.7%
Nigeria (3) 219 6.3% 1.6%
In-Shell Macadamia Kenya (2) 8 15.1% 0.1%
Raw Cashews Côte d'Ivoire (1) 284 17.9% 4.0%
Tanzania (2) 66 4.1% 0.8%
Raw cotton Burkina Faso (1) 478 1.1% 18.1%
Côte d'Ivoire (3) 228 0.5% 3.2%
Raw Hides and Skins Tanzania (2) 108 0.8% 1.4%
Sesamum seed Tanzania (1) 224 14.6% 2.8%
Tea in Bulk Kenya (1) 9 7.2% 0.1%
Unmanufactured
Tobacco
Zimbabwe (1) 73 2.8% 2.0%
Unprocessed Roundwood Nigeria (2) 687 0.5% 4.9%
DRC (3) 316 0.2% 9.8%
Source: Own research based on different sources detailed in Appendix 2.3.
Notes: The number in parentheses behind the country names indicates the country’s
rank in that commodity’s production among the 36 countries. A more detailed list
including these and more figures for the top three producers for each commodity
can be found in Appendix 2.3.

50
The Indonesian 2014 export ban on unprocessed metals provides a good illustration
of this logic (Amir 2013; Grey 2017; IGF 2018; USGS 2015a, 2015b; Warburton
2017). Motivated to add more value domestically to its rich mineral resources prior
to export, already in 2009, the Indonesian government had made the very rare25
announcement that it would ban all unprocessed mineral exports starting 2014,
giving local mining companies and foreign smelters five years to set up smelters
and refineries in Indonesia. Unphased by the fact that companies had not taken this
announcement seriously and did not invest in adding mineral processing capacity,
the government went ahead to impose a full ban on most key metals – including
bauxite and nickel – in January 2014. Foreign investors, however, reacted to this
ban very differently across commodities. In nickel, where Indonesia is not only the
largest producer in the world (ca. 17% of world production) but also produces
particularly sought-after high-quality ore, the ban seemed to work. Especially
Chinese smelters (where the ore was exported too) could not find good alternative
sources, and to secure the metal, invested billions of US$ in new smelters in
Indonesia. This was very different from bauxite. Though Indonesia did produce a
sizeable 11% of world bauxite prior to the ban, Chinese smelters found alternative
sources in Malaysia, Australia, and Guinea, and simply stopped their sourcing
operations in Indonesia. Domestic investors were not able to fill the financing gap,
and bauxite production during the ban in Indonesia practically came to a standstill,
implying a loss of billions of US$. Given these issues, the Indonesian government
decided to lift the ban in 2017, replacing it with a differential tax system. Thus, a
large and diversified economy, with a large annual budget of over US$ 130 billion,
and a significant market power in bauxite production, did not prove able to induce
mining companies and foreign processors to invest in domestic processing, could
not fill the financial gap itself, and eventually gave up its policy in the face of severe
economic losses.
Studying this dynamic in the African context clarifies why banning unprocessed
metals is rarely economically feasible. For 18 different commodities and some of
its largest African producing countries, Table 2.3 summarizes the capital
25 To the best of my knowledge, only four countries have imposed bans on unprocessed mineral
exports: China on rare earths and other metals in the 2000s, Indonesia in 2014, Zimbabwe on
unprocessed chrome in 2007 and 2011, and Tanzania on unprocessed mineral sands in 2017.

51
expenditure required to set up processing industries that could process the total
annual production of that commodity. Furthermore, it sets this value in relation to
the states’ annual budget (in 2017) as well as the market power they hold in a
commodity. A more detailed table with all underlying figures, all three most
important producing countries, and references for data sources can be found in
Appendix 2.3. Looking at this table, we find stark variation regarding the capital
cost involved in processing, and the ability of domestic investors to finance it,
should foreign investors bail. Critically, on average, particularly base metal
processing is extremely expensive. Take the case of bauxite processing in Guinea.
If Guinea wanted to refine its total annual bauxite production into alumina, nearly
US$ 12.5 billion would need to be invested. This corresponds to nearly eight times
the country’s total annual budget. At the same time, Guinea produces only 5.5% of
the world’s bauxite, half of what Indonesia produced prior to the ban. It appears
unrealistic to assume that a country with considerably lower market power, no
financial means to fill the investment gap, and dependent on bauxite mining to
finance one-third of its annual revenue would dare to ban the export of bauxite ore.
Importantly, all of this does not yet even incorporate the fact that the processing of
most metals is extremely energy-intensive, requires massive economies of scales,
operates on particularly slim and erratic profit margins, is highly damaging to the
environment, and creates very little employment (Östensson and Löf 2017: 5;
UNECA 2013: 102–103). In sum, the risks of imposing a ban on many unprocessed
mineral exports strongly outweigh the benefits.
Although very similar patterns hold for most mineral commodities (see the figures
for copper, manganese or nickel in Table 2.3), there are notable exceptions. First,
setting up lapidaries to cut and polish gemstones like diamonds, sapphires, rubies,
or tanzanite is relatively cheap, given the labour-intensive character of processing.
Second, re-smelting metal wastes and scraps is much less expensive both in capital
investment and running costs than smelting the same metal ores, which is arguably
part of the reason why we see many countries using export bans on metal scraps to
promote processing. And third, among the classical metallic minerals, chrome and
gold are exceptional in the sense that setting up smelters and refineries is relatively
affordable. It would only cost about US$ 36 million to set up a refining industry
that could process all of Ghana’s considerable annual gold production. Smelting all

52
of Zimbabwe’s chromite into ferrochrome, would also only require a capital
investment of US$ 88 million – still, significantly cheaper than the over US$ 12
billion that Guinea would have to invest to create enough capacity to refine its
annual bauxite production. Accordingly, it is notable that chromite is the only
African metal ore that has faced an export ban (and interestingly unrefined gold –
often produced by significant shares of the population – has not).
Importantly, given their similarity on these five critical economic factors, one might
expect the likelihood of African governments to impose bans to be comparable
across these fourteen ‘bannable’ commodities. This is, however, not the case. As
discussed in the previous section and also summarized in Table 2.2, timber logs and
metal waste and scraps are much more likely to be banned than most agricultural
cash crops. In 2011, none of the countries producing cocoa, tobacco, sesame, or tea
had imposed a ban on these commodities. Similarly, raw cashew nuts and cotton
had only been banned in one producing country respectively. The same is true for
macadamia nuts, although given that there are only five macadamia producing
countries in the sample, this translates to sizable ban propensity of 20% in Table
2.2. In contrast, the 8% ban propensity for raw hides and skins in 2011 is arguably
a bit too low, with the five East African Community member states imposing de
facto bans on raw hides and skin exports in 2015 (increasing the per cent of banning
countries to 28%). Finally, whereas unpolished and uncut diamond and gemstone
exports have occasionally been banned, unrefined gold exports have never been
banned (both Mali and Zimbabwe have considered doing so in recent years, yet
have not seen it through, potentially having to do with the significant size of gold
mining employment in both countries). Given this remaining variation, the research
question raised at the beginning of this section can be refined: Across and within
African countries, why have governments in the last three decades been more likely
to impose bans on some ‘bannable’ commodities than on others?
Another important economic factor that can impact ‘export bannability’ needs to be
mentioned, however: economies of scale. In contrast to the five factors discussed
above, no commodity is spared by this factor. Specifically, to make industrial
processing of any commodity economically feasible, there needs to be a minimum
domestic supply. If this supply is not given, processing is unprofitable with existing
technology, and governments are highly unlikely to believe that banning the export

53
of that commodity for processing purposes is an attractive policy option. In cocoa,
for example, the usual estimate is that a modern factory requires a minimum of
30,000 tons of raw beans input to be profitable (Simpson 2012). In cashew, it is rare
to find governments interested in actively promoting processing if annual
production stands below 20,000 tons. This does not hold only in rather exceptional
cases – like Kenya26 – where production as well as processing used to be strong
historically, and the government tried to protect a declining – but already existing
– industry from collapse. Thus, ideally, one would be able to define these
production-based feasibility thresholds across commodities, and simply exclude
country-commodity-years from any further analysis if production falls below them.
Unfortunately, however, doing so consistently and credibly is extremely difficult,
requiring in-depth expert knowledge for each commodity and country-historical
context. Not only do these thresholds vary across commodities but also for the same
commodity across space and time, given technological change and different cost
and marketing dynamics in different countries. Moreover, setting thresholds at
which data is excluded from the analysis will invite accusations of fraudulent
selection on the dependent variable. Therefore, the large-N analysis deals with this
in two ways. First, it runs the core models of the analysis without excluding any
data on economies of scale grounds, which should if at all bias it against the
theoretical argument.27 Second, it shows that the main findings are robust to
excluding the lowest quartile of country-commodity-years in terms of production
volume for each commodity.
26 Kenya in the year of the export ban (2009) produced around 10,000 tons of raw cashew nuts.
27 The argument is that country-commodity-years with fewer producers as a percentage of the
population are more likely to face a ban. However, in African agricultural commodities (and in
contrast to most non-agricultural commodities) having few producers usually corresponds to having
low production volumes. Thus, agricultural commodities produced by few producers usually lack
economies of scale and accordingly reason for governments to impose a ban. Take the example of
Tanzanian cocoa. In 2011, around 5,000 Tanzanian farmers produced less than 10,000 tons of raw
cocoa beans (FAO 2018a). In line with the core thesis argument, we should expect the Tanzanian
government to ban the export of raw cocoa, because this low number of producers is unlikely to
pose a serious threat to the government. Of course, however, the production volume produced by
these few farmers if far from the minimum 30,000 tons estimated to be required to set up a cocoa
processing plant. Therefore, the government would be irrational if it were to impose a ban on raw
cocoa, likely killing this infant sector. Therefore, including such ‘unfeasible’ or ‘unbannable’
country-commodity-years (with low producer numbers) nevertheless, will lead, if at all, to a
significant underestimation of the effect of the thesis’ commodity population share variable.

54
From an economic standpoint, governments should not starkly differ in their
imposition of export bans on the highlighted 14 bannable commodity categories.
Yet they do, both within and across countries. In its first part, this chapter proposes
that politics need to be factored into the equation. Like any policy, export bans
create winners and losers, and policy-makers arguably take their opinions and
particularly power to disrupt their rule into consideration. In contrast to Olson’s
classical collective action theory, however, I argue that in the context of export bans
larger commodity producer groups pose a greater threat to governments. Export
bans severely reduce producer prices. Since these are imposed at the border beyond
producers’ usual field of vision, they normally struggle to see the origin of these
price distortions. Equally negatively affected by bans, raw commodity traders,
however, have the knowledge, motivation, and capacity to inform producers about
the ban and organize their protest against it. As such, dangerous mass group
mobilization is particularly likely in the context of export bans, which is why
policy-makers less likely to impose them on commodities produced by large
producer groups, such as agricultural cash crops or gold. In the second part of this
chapter, I contrast this thesis against alternative economic, domestic and
international political economy explanations.
3.1. The Politics of Survival and the Power of Interest Groups
Where economic models struggle to deliver explanations, political economy
approaches must be considered. And indeed, in the last three decades numerous
approaches have emerged highlighting how politics can explain patterns of
industrial and trade policy as well as of commodity taxation in Africa and beyond.
Fundamentally and discussed in more detail below, these approaches all share the
tenet that governments’ policy decisions are shaped by their desire to stay in office,

55
and that to do so they must appease (or at least not agitate) powerful interest groups
that could endanger their political survival.28 Accordingly, political economy
approaches would argue that commodities are restricted at exports when its losers
are politically weak in absolute terms or relative to winners; whereas the opposite
is true where commodities are not restricted. Hence, the first step in these
approaches would be to understand which groups benefit and lose from export bans.
In the case of export bans of raw commodities, four economic interest groups appear
relevant in the domestic political economy: producers, independent middlemen,
exporters, and processors. Figure 3.1 illustrates in simplified terms how these actors
relate to each other in typical post-SAP African commodity value chains.
Importantly, prior to SAPs, marketing of most commodities was controlled by
monopsony marketing boards and parastatals, directly buying from producers, and
often selling for below-market prices to processors to support them (Abbott 1967;
Bates 1981; Gardner 2012; Williams 1985). Accordingly, export bans were often
redundant and rare as an industrial policy tool.
Nowadays, there are four main channels through which raw producers and final
consumers are typically connected. First, exporters buy the raw product directly
from raw producers and export it to foreign processors who then sell the processed
commodity to consumers29. Second, raw producers can sell directly to domestic
processors who then export the processed product to consumers. In the third and
fourth channel, raw producers sell their produce to independent middlemen. These
middlemen then sell the raw produce to exporters or domestic processors who yet
again export it either in raw or processed form. In most African countries (without
or prior to export bans) the most common marketing channels are those were
exporters buy directly from raw producers or indirectly through middlemen. The
reason for this is, as introduced above, that foreign processors tend to operate more
profitably, hence, can offer farmers via exporters and independent middlemen more
than domestic processors can. The result is that most of the produce will be exported
28 See Whitfield et al. (2015) for an excellent introduction to much of this literature.
29 Consumers could also include companies that further process a good. For example, domestic and
foreign processors could shell cashews (in say Ghana or India), and then sell it to nut roasters and
packers in Germany.

56
raw rather than processed and domestic processors either run under capacity or fail
to emerge.
Figure 3.1. A Simplified Model of a Typical Raw Commodity Trade Chain in Post-
Structural Adjustment Africa
Source: Own Illustration
It is in this context then that processors are the biggest beneficiaries of an export
ban, whereas exporters, middlemen, and producers stand on the losing end. Not
only does an export ban completely extinguish the business of exporters; it hereby
also eliminates raw producers’ and middlemen’s best buyers. At the cost of the other
interest groups, domestic processors experience a real reversal of fortune. With their
dominant competitors – exporters – eliminated, they can often collude among each
other and dictate prices to middlemen and producers. As a result, producer prices
can easily drop by 50% or lower (as recently witnessed in the Kenyan and Ghanaian
cashew sectors where export bans were introduced in 2009 and 2016 respectively,
and as discussed in more detail in Chapter 6).
Based on this discussion, political economy approaches would likely agree on a
core logic: African governments will impose export bans on commodities when the
losers – producers and traders (i.e. exporters and middlemen) – are relatively
unthreatening politically; and they will abstain from imposing them when the
reverse is true. Where political economy approaches differ fundamentally,

57
however, is when and which interest groups are powerful. In the following two
sections I will discuss two approaches – the Olsonian and my own – how the relative
group size of the winners and losers might shape their respective power. Section
3.2 will further present approaches emphasizing ethnicity or elite-clientelism of
sources of power as well as those arguing that democratization can empower larger
groups.
Before venturing into the discussion of distinct political economy approaches,
however, one critical question needs to be addressed: is the understanding correct
that existing processors of the commodity in question are the key constituency
interested in an export ban? Or might other actors within the same value chain,
neighbouring value chains, or without value chain also be or become interested in
an export ban? Specifically, could it be that producers or traders of the commodity
in question might be interested in entering processing? Perhaps successful domestic
processors of a related commodity might want to venture into processing of this
commodity and lobby for an export ban to facilitate their expansion? Or might
governments even impose export bans independent of existing processors, with the
aim to transform potential supporters into processors, hereby ideally gaining
economically and politically?
Overall, the analyses of commodity processing attempts across commodities in
Africa conducted for this study suggest that such dynamism is rare. To better
demonstrate this, I will discuss above-raised questions in turn. First, could growers
push for export bans, as they might be interested to move up into processing?
Generally, it is possible for producers to move into processing, yet very rare as this
tends to be extremely difficult and often not particularly interesting for producers.
It is difficult for many producers because processing requires massive financial
capital and especially know-how, something the average farmer, logging enterprise,
or miner does not own. As described shortly in the analysis of the macadamia sector
in Chapter 6.3, even after the introduction of an export ban the only group of
farmers that tried to move into processing failed before it ever cracked a single nut.
Essentially, the farmers lacked the capital, the managerial, technical, and tacit
knowledge to run a factory, and had no contacts to shelled nut buyers. It is also
uninteresting as a business for most growers. Prior to a ban, processing is
unprofitable, so most non-processors (particularly farmers) do not see the point in

58
moving into processing in the first place. You are better off buying land and
planting more. One must thus ask: Why would a producer that does not have the
capital or capacity to move into processing invest precious time into lobbying for a
ban that would certainly hurt her current business? In addition, we must keep in
mind that an export ban implies and overall well-fare loss for the sector. Processors
that already have their factory are going to win, but whether the net benefit for a
farmer that has moved into processing is positive is also questionable. There is thus
neither theoretically nor empirically a strong case for producers pushing for
processing.
The possibility of horizontal movement between distinct commodity processors is
more interesting. Indeed, there are factors that successful processors of one
commodity could bring to the other, such as the general knowledge of how to run a
factory, dealing with international customers, and potentially having access to
financial capital. Crucially, their lack of commodity-specific tacit knowledge and
technology, however, will most strongly hinder horizontal movement (Grynberg
2013; Morris et al. 2012; Terheggen 2011a; UNECA 2013). Although knowing
how to run a factory in general is crucial, the processes and technologies behind
processing sisal, palm oil, rubber, cashew, fish, copper ore, wood or hides are
completely different. Similarly, knowing how to build a car does not imply you
know how to build microchips. Accordingly, one would not expect a car producer
to lobby the government massively to create a space for micro-chip production,
knowing it will be extremely difficult to become competitive and make strong
profits despite government intervention. Rather, car producers would ask for
protection/support for what they are already good at: producing cars. What is more,
a processor cannot be certain whether the ban will hold or whether producers will
circumvent processors through smuggling, making the switch to and lobbying for
another industry even less attractive. For similar reasons, governments banning the
export of a commodity will find it difficult to offer the created space to outside
actors (processors or not) as a credible benefit. The tanzanite gemstone sector is a
case in point. In 2010, the Tanzanian government introduced an export ban on
unprocessed tanzanite. In the absence of a relevant lapidary industry that could have
lobbied for this, it appears the ban was indeed derived from the government’s desire
to promote domestic value addition. Interestingly, however, eight years after the

59
introduction of the ban, still no real lapidary industry has emerged, with no actor
willing to invest, given the high cost of acquiring adequate skilled labour as well as
due to the poor implementation of the ban, with the vast majority of stones
smuggled over the Kenyan border.
Concluding, my research suggests that growers or other commodity processors are
extremely unlikely to be lobbying for export bans. Neither is it likely that
governments will impose bans as a tool to satisfy potential political consumers. The
key interest groups in favour of a ban are existing processors as well as African
governments who are often honestly interested in industrial development, whether
for ideological convictions or for bolstering long-term political survival. The
potential losers are producers, middlemen, and exporters. The core question is thus
when either side is politically more powerful and how this aligns with the observed
cross-commodity pattern on export bans.
3.1.1. Are Export Bans Olsonian?
In ‘The Logic of Collective Action’ Olson (1965) addressed the question of why
some economic interests are more able to impose their preferences on government
policy than others. He argued that those interest groups least able to overcome
collective action problems were most likely to stand on the losing end of policy-
making. Importantly, Olson contended that group size was perhaps the most
relevant explanator of collective action capacity. Specifically, he argued that
smaller groups were more likely to engage in collective action than larger groups.
His rationale for this is twofold. First, the benefits or costs of a policy are shared by
fewer people, hence, the stakes are higher per capita. Second, the transaction or
organizational costs are lower for small groups because communication,
coordination, and the disciplining of deviators and free riders is easier. The
incentives and capacity for group action, thus, diminish as group size increases.
Most conceptual frameworks in the study of trade politics – above all Grossman
and Helpman’s (1994) “Protection for Sale” approach as well as earlier scholarship
(Hillman 1992; Peltzman 1976) – have explicitly built their theory on Olson’s idea
of collective action and the role of group size. Smaller groups, they argue, are most
likely to successfully lobby governments to design policies in their favour.

60
Pioneering the application of collective action theory to policy outcomes in the
developing world, Robert Bates (1981) has drawn similar conclusions. In his
analysis of African agricultural trade and marketing policy, Bates argued that for
the reasons Olson described the minority of urbanites, processors, and large-scale
farmers were advantaged at the cost of the mass of small-scale farmers. Specifically,
he described how harsh price controls on agricultural outputs administered by
monopsony marketing boards and overvalued exchange rates massively squeezed
the income of farmers while indirectly subsidizing urban food consumers and
processors. Overall, Bates’ description of the rural masses in Africa strongly echoes
Marx’ (1852) description of French peasants during the Napoleonic era resembling
a ‘sack of potatoes’.
Importantly, however, it appears that Olson’s framework and Bates’ findings
cannot explain the patterns of export bans in Africa described in Table 2.2. If
applicable, we should see commodities produced by masses of small-scale
producers frequently banned, and those produced by the few rarely. Intriguingly,
however, the empirical pattern appears diametrically opposed to these predictions:
commodities usually providing income to the few (e.g. timber logs, metal wastes,
or raw hides) are frequently banned at exports, whereas those usually providing
income to the many (e.g. cash crops or gold) are rarely banned. What then could
qualify Olson’s classic assumptions and provide a more adequate explanation?
3.1.2. What the Eye Sees, the Heart Grieves Over: Policy Visibility,
Severity, Cross-Group Defence Coalitions and Mass Mobilization
I propose that the missing pieces to explaining the above-identified puzzle are found
in a policy’s visibility, severity, and whether it creates cross-group defence
coalitions. Specifically, I argue that because export bans severely and sharply affect
both producers and traders, they are very likely to become visible to producers and
equip them with the motivation as well as the capacity to mobilize against them.
Given the serious risks inherent in mass mobilization, African governments avoid
imposing export bans on commodities providing a significant income to a large
share of the population, explaining the pattern observed in Table 2.2. Vice versa, I
argue that where the price distortive impact of a policy is less severe on producers
and traders (such as with low export taxes), mobilization is less likely and so is

61
governments’ tendency to avoid imposing them on large producer groups.
Illustrated in Figure 3.2 and summarized in Table 3.1 for key price distortive
policies used to promote commodity processing, the theoretical argument is
explained in more detail in the following.
Most measures imposed on commodities for processing promotion are not directly
visible to producers. Unlike taxes or fees collected at the farm gate, mine site, or
forest concession, price distortive policies such as export bans or export taxes are
imposed at ports and land borders, usually far beyond producers’ field of vision.
And though marketing boards pay prices directly to producers, the extent to which
this price has been reduced by government surplus extraction usually remains
opaque to producers as they rarely know the actual FOB or world market prices for
their commodities eventually received by the government. While producers might
suffer from low or lower prices because of such policies, it is eventually difficult
for them to know whether they are due to government action or, for example, low
or reducing world market prices.30 Fundamentally, this raises the question of
whether producers that are unable to attribute price distortions to government action
would or could ever mobilize against them. Or to put it differently: What the eye
does not see, the heart does not grieve over. Supporting this notion, a growing
literature on public service provision in the Global South has shown that when
policy outcomes are less visible and attributable to government action, citizens are
less likely to hold politicians accountable for them (Batley and Mcloughlin 2015;
Harding 2015; Harding and Stasavage 2014; Keefer and Khemani 2003; Mani and
Mukand 2007; Persson and Tabellini 2000). Thus, governments face a limited
political risk in implementing policies with low visibility and attributability.
I argue, however, that indirect price distortive measures can become visible to
producers when they sharply affect both producers and traders. The logic behind
this is two-fold. First, as the actors usually directly affected by measures such as
export taxes or bans, traders are fully aware of them. And when such measures are
so severe that they might put their operation into question, they have a strong
30 Timber presents a notable exception. Rather than selling to middlemen who sell to exporters,
independent loggers sell directly to export traders. In the context of an export ban, exporters will
have to reject loggers’ harvest, hereby likely making it very clear to loggers that a ban is in power.

62
incentive to inform producers about them. Second, when the price distortion of a
measure on producers is particularly severe and rapid, producers are more likely to
be sensitive to traders’ information campaigns.
Figure 3.2. Theoretical Argument Illustrated as Path Diagram
Source: Own illustration.

63
Table 3.1. Different Price Distortive Measures and their Likelihood of Being Imposed on Mass Groups
Export
Ban
High Export
Tax
Medium Export
Tax
Low Export
Tax
Marketing
Boards
High Direct
Taxes
Does the state directly and
transparently enforce the
price distortion on
producers?
No No No No Mostly Not Yes
Is the price distortion
noticeable and are there
actors likely to inform
producers about
government responsibility?
Yes
(Sharp price
drops likely &
traders motivated
to agitate)
Yes
(Sharp price
drops likely &
traders motivated
to agitate)
Maybe
(Medium price
drops likely &
traders may be
motivated to let
producers know)
No
(Minor price drop
& traders can
pass through, less
motivated to
agitate)
No
(Usually high
distortion, but
incremental & no
traders that can
agitate/inform)
Yes
Realization & attribution of
distortion likely?
Yes Yes Maybe No No Yes
Do Producers likely
perceive the distortion as
severe?
Yes Yes Maybe No Yes, IF they realized it
existed.
Yes
Are producers organized?
(by themselves or by
someone else)
Likely, if not by
themselves, then
through traders
Likely, if not by
themselves, then
through traders
Maybe by
themselves, maybe
by traders
Unlikely, even IF
they perceive
distortion, traders
unlikely to
organize.
Perhaps, IF they
perceive distortion,
‘cooperative-like’
structures might help.
Perhaps, unlikely by
traders; possibly
through other
structures.
Mobilization of producers
likely?
Yes Yes Maybe No No Maybe (depends on
organizational
capacity)
Implementation on mass
group likely?
No No Maybe Yes Yes Rather not (depends
on organizational
capacity)

64
Importantly, price distortive measures differ significantly in whether they sharply
affect both traders and producers. As explained in Section 3.1 above, export bans
on raw commodities shut down the business of exporters of these commodities
completely, and unlike some taxes, cannot simply be passed on to producers.31
Exporters are, therefore, extremely agitated by bans. Although they do not export
themselves, middlemen too are highly aware of bans (as exporters cannot buy their
produce anymore) and negatively affected by them. Whereas middlemen could
theoretically cooperate with domestic processors, in practice they face the risk of
being pushed out of the marketing chain by processors or at least receiving worse
deals, given the reduced number of buyers. Both exporters and middlemen are
therefore motivated to mobilize against bans. As detailed in the case study chapters
6 and 7, traders can use their extensive and deep marketing networks to inform
producers and their usually greater financial means to launch media campaigns.
And since export bans tend to very rapidly and severely reduce producers’ prices
(e.g. by nearly 50% within one day in the case of Ghanaian cashew nuts in 2016)
they are particularly receptive and sensitive to traders’ information campaigns and
attributing the price drop to government action.
Depending on their level, export taxes differ or resemble export bans. High export
taxes (e.g. above 30%) tend to provoke very similar reactions by traders and
producers. Their tax level is usually too high for the former to feasibly pass on to
latter, and as such, like export bans put traders’ business at risk and motivate them
to inform producers about the government’s action. Producers again are more
receptive to such information, given the sharpness of the price drop going in hand
with high export taxes.
Low export taxes (e.g. below 10%) differ significantly. Exporters can usually
relatively easily pass on the price distortion to producers and as such have limited
motivation to engage in the potentially very costly process of informing producers.
Producers are therefore unlikely to become aware of the introduction of low export
taxes and unlikely to mobilize against them. Therefore, we should expect
governments to be less careful in avoiding imposing low export taxes even on
31 One of the few exceptions to this is the trade in timber, were exporters tend to export both raw
logs and lumber. This is explained more detail in Chapter 7.

65
commodities providing a significant income to larger shares of the population. If at
all, we might see governments to be more likely to impose low export taxes on such
commodities, since the special conditions under which large group size collective
action problems can be overcome are not given. In line with Olson’s and Bates’
original arguments, policy-makers should take advantage of this. Staying with
cashew nuts, the Ivorian and Beninese 2017 imposition of low specific export taxes
(translating to 7% to 10% of the producer price) are cases in point. Both
governments actively sought to promote their cashew processing industries. Yet,
both faced even larger cashew farmer populations than in Ghana and knew from
their neighbour’s experience how politically dangerous imposing export bans or
higher export taxes on large producer populations was (as described in detail for the
Ghanaian case in Chapter 6.1). Their decision to choose a less obtrusive measure
paid off. Neither producers nor traders protested noticeably against the policy. What
is more, the tax’ revenue could be used to finance additional processing promotion
activities like loan schemes and subsidies.
Price distortions by marketing boards are equally difficult for producers to notice
and attribute to the government. First, by definition, independent traders are usually
forbidden and thus absent in the context of monopsonist marketing boards. Even if
producers noticed a significant price drop or distortion, they therefore often lacked
the informants telling them that the government was to blame for this. Marketing
boards were also extremely skilful at hiding the severity of their price distortions.
Usually implemented during colonial times, commodity chains controlled by
marketing boards in Africa often saw produces get as little as 30% of the world
market price (Boone 1992, 2003; Gardner 2012; Helleiner 1977; Hopkins 1973;
Lele and Christiansen 1989; Williams 1985). Critically, however, these massive
distortions were hardly noticeable to producers during and after colonial times for
several reasons. For one, marketing boards had already inherited the pass-through
of low prices to farmers from oligopolistic colonial traders. And thereafter, if at all,
marketing boards only very incrementally increased producer prices from this low
base, even when global commodity prices increased rapidly, or inflation would have
required a higher price adjustment to maintain real prices. Marketing boards were
therefore very efficient at ‘maintaining an illusion of rising [or at least stable]

66
prices’ (Boone 2003: 226)32 whereas farmers’ real incomes and share of the actual
export price often declined sharply. The ability of marketing boards to maintain this
illusion, I argue, is a key reasons why African governments could without
significant political risk massively distort the prices of commodities produced by
rural masses prior to SAPs (Bates 1981); and why following marketing boards’
widespread abolition, African governments have struggled to do so in the last three
decades (Anderson 2010).
Even if producers realize that they are negatively affected by government policy,
whether they will think it is worth mobilizing against it depends on its perceived
severity. Scholars researching protest against government policy in such different
contexts as Latin American economic crises (Frieden 1991), East Germany’s 1953
revolt (Thomson 2018) or industrial upgrading attempts in the Ugandan dairy
industry (Kjaer 2015; Whitfield et al. 2015) have found that the more severe the
impact of a policy, the greater the likelihood that the policy’s (potential) losers will
mobilize against it. As already described above, in the case of export bans and high
export taxes the stakes involved for producers is extremely high, and so is their
incentive to mobilize. In contrast, even if producers realized that a low export tax
was imposed on them, their incentive to protest it would be significantly lower,
given its milder impact.
Lastly, while producers might realize they are negatively affected by policy and
want to mobilize against it, whether they can also depend on their organizational
capacity. Linking back to Olson (1965) and Bates (1981), particularly large rural
mass producer groups have historically been argued to struggle to engage in
collective action due to low organizational capabilities and high organizational
costs. Importantly, however, a growing scholarship has found that where cross-
group coalitions can form around a policy, lobbying becomes particularly
effective.33 The core reason for this is that the groups’ respective and distinct
32 To be precise, Boone in this quote is referring to the Ivorian Caisse de Stabilisation, which set
cocoa prices in the country.
33 In Argentina, the organizationally capable but few agrarian oligarchs organizing protests against
the introduction of high taxes on soy exports required the support of the mass of small-scale farmers
to become an electoral threat as well as appear sympathetic to the broader public (Fairfield 2011:
450). Similarly, in Uganda traders helped organize hundreds of thousands dairy producers (Kjaer
2015). And in her comparison of Cameroonian, Ghanaian, and Senegalese poultry producers’

67
strengths can compensate for their respective weaknesses, that is, their cooperation
is synergetic. Or to use Marx’ metaphor, where enough pressure, heat, and spice is
added to a sack of potatoes by an able chef, the sack of potatoes can be turned into
a rich mash that can nourish strong protest. In different contexts, the role of a chef
can be played by different actors. In Argentina in 2008, for example, the country’s
wealthy and well-organized agrarian oligarchs organized the mass of small-scale
farmers against the introduction of an extremely high tax on soy exports and only
then were they able to generate the political pressure to force the government to
revert the policy (Fairfield 2011: 450). In the African context where large-scale
landowners are rarer than in Latin America, traders become more important. A case
in point is Uganda, where traders were crucial in organizing hundreds of thousand
relatively unconnected dairy producers against adverse government policy (Kjaer
2015). And as demonstrated in Chapter 6 and Chapter 7 of this thesis, such
otherwise unlikely powerful and large synergistic defence coalitions between
producers and traders are particularly likely in the context of export bans as well as
high export taxes. Traders are highly motivated and able (through their smaller size,
wider networks, and deeper pockets) to help organize producers. Equally-motivated
producers can bring the numerical power to the table – that traders by themselves
are lacking –, which because it increases the threat to the government is likely to
make the protest more successful.
To conclude, in this thesis I argue that African governments avoid imposing export
bans on commodities produced by a large share of the population because they
create a context in which dangerous producer mobilization is very likely. While
equally negatively affected traders are motivated and capable to inform and
organize producer protest, the severity of bans makes producers more receptive to
the idea of protest. Whereas the same logic transpires with high export taxes, low
export taxes differ. Traders can usually pass on the low-price distortions to
producers and therefore have lesser incentive to engage in the costly endeavour of
lobbying attempts for protection against EU poultry imports, Johnson (2011) shows that these were
only successful when they managed to convince the mass of consumers of the (unproven) health
threats of imported chicken. Mirroring the idea that the respective strengths and weaknesses of
producers and traders complement each other, Esteban and Ray (2008: 2199) argue that ethnic
conflict is more common than class conflict in the developing world as ethnic alliances profit from
a synergy where within an ethnic group ‘the elite contribute financial resources, while the masses
contribute conflict labour’.

68
informing and mobilizing mass producer groups. Governments thus face a low
political risk of imposing low export taxes on commodities independent of the share
of the population their production provides significant income to. Accordingly, the
core hypothesis of the thesis is that:
H: All else equal, African governments are less likely to impose bans or
higher taxes on the export of commodities the larger the share of the
population earning a significant income from producing it. Low export
taxes, however, are if at all more likely to be implemented on larger
producer groups.
Lastly, as promised in the preceding chapter, a word about the frequent bans on
food crop exports, and second, a word on the relevance of political settlement
research for this thesis.34 Food crops tend to be the most labour-intensive
commodities in Africa. Prima facie this appears to run counter to my theoretical
argument since I hypothesize that commodities produced by large shares of the
population should rarely be banned. On a closer look, food crops’ propensity of
being banned is well-explained by my theoretical model. To assess the empirical
validity of the model, three related questions should be asked. Does the ban create
clear losers? Are these losers many? And if so, are the losers more numerous than
the winners? Regarding export bans on food staples in times of food crises, the
answer to these questions is less straightforward than one might expect.
Perhaps surprisingly, food staple producers are not necessarily losers of a ban on
food staple exports. First, as indicated in Chapter 2.3, export bans on food staples
are almost always implemented during national, regional or global food price crises
with the aim of keeping food prices affordable. Thus, their aim is not to press
producer prices below the level that was acceptable to producers prior to the food
crisis. Rather, it is to press them down to the acceptable pre-crisis level or at least
towards that direction. One might, therefore, argue that export bans on food staples
during food crises do not produce abnormal distortions domestically but rather
34 For more in-depth studies on the politics of food prices compare Hoffman (2013); Watson (2013);
Olper et al. (2013); Resnick et al. (2015); Babu (2013); and Chapoto (2012).

69
reduce them. Second, and importantly, most food staple producers in Africa are also
food consumers. While they might get higher prices for one food crop they sell,
they are also likely to pay higher prices for another one they need to buy. As such,
it is not clear whether the masses of food crop producers are losers of food staple
bans and perceive them as severe and contemptible. In fact, arguably the only clear-
cut losers of food staple export bans are food staple traders and speculators, and to
a lesser degree the limited number of large-scale food staple farmers in Africa.
Thus, export bans on food staples do not create many losers as would those on cash
crops for example. It is therefore in line with the theoretical argument that they are
banned relatively frequently.
Even if we perceived the mass of food staple producers as losers, however, the
theoretical argument would still not necessarily predict a low propensity for an
export ban during food crises. As detailed above, governments are more likely to
fear losers if they are many. What, however, if the winners are even more? Though
in the average African country there might be a couple million commercial maize
producers profiting from elevated prices (and thus losing from a ban), there are
likely several million more consumers negatively affected by these prices (and thus
profiting from a ban). Thus, where there are relatively more winners from a ban –
such as with food staples – it becomes secondary to policy-makers, if there are many
losers in absolute terms. Ignoring the winners of a ban (and losers of high prices)
might be politically much more costly than ignoring its losers.
Importantly, in the case of the 14 commodities studied in the remainder of this
thesis, the relative population share ratio of ban losers and winners does not matter
much. The reason is that commodity processing usually does not employ many
people, usually far less than 10,000 people.35 Given that the population share of the
winners is consistently low, in the context of the commodities under study, it is
theoretically and empirically36 parsimonious to focus exclusively on the population
share of the producers.
35 The exception is timber, which can have larger numbers of employment in processing. However,
given that producer numbers in timber are so low, it is not necessary to proceed to the ratio variable.
36 It is significantly harder to find and calculate employment numbers for processing industries
across countries and commodities. Moreover, adding this measure would necessitate building a

70
3.2. Alternative Explanations
Having set out the core theoretical argument to explain the empirical puzzle
identified in Chapter 2, this section presents and discusses a range of potential
alternative explanations. First, staying on the level of domestic politics, it discusses
how democratization, ethnicity, and elite-clientelism might shape the observed
pattern. Moving up one level to international political economy, the potential
explanatory power of international trade agreements, commodity tariff escalation,
and governments’ economic ideologies is reviewed. Finally, the chapter returns to
discussing a range of economic factors that might matter in shaping African
governments’ trade decisions, in addition to those identified in Chapter 2.4
3.2.1. Further Domestic Political Economy Explanations
As discussed in the previous section, most political economy of trade scholars agree
that policy-makers seek to secure their political survival and that in doing so they
avoid opposing powerful interest groups. In the following, three additional theories
are reviewed on which groups tend to be powerful and how this might affect the
imposition of export bans.
3.2.1.1. Regime Type and Mass Empowerment
Despite pioneering Olson’s theory in the developing world, Bates and others have
argued that the disadvantageous effect of groups size is weakened in electoral
democracies (Bates 1981; Bates and Block 2013; Milner and Kubota 2005;
Varshney 1998). Specifically, they advance the argument that in autocracies money
(e.g. through bribes) and violence potential (e.g. through revolts) are the two only
currencies that governments respect, and that rural masses own neither.
Democratization, however, they contend, changes this fundamentally. Bates and
Block (2013: 374) write: “Where representation is achieved through electoral
channels and where rural dwellers constitute a large segment of the voting
population, then politicians have an incentive to cater to the interests of farmers.
The very factors that render farmers weak lobbyists — that they are numerous and
relatively complex composite indicator of the absolute and relative population share measures,
significantly complicating interpretation.

71
spatially dispersed — render them attractive to those competing for an electoral
majority.”
Indeed, a range of studies has claimed to find a correlation between democratization
and more mass-sensitive policies in Africa. In line with Kasara’s (2007) finding that
African democracies tax farmers less than autocracies, Bates and Block (2013) find
in their analysis that decreases in (negative) agricultural price distortions have been
the result of democratization in Africa. Although in a different policy area,
Stasavage (2005) finds that democratically elected African governments have spent
more on primary education (benefiting the masses) than autocracies, whereas
Harding and Stasavage (2014) find a similar pattern regarding the abolition of
school fees. In all cases, the authors suggest that this results from democratic
governments’ need to obtain electoral majorities and hence cater the masses. If true,
these arguments translate into a clear hypothesis relating to export bans: democratic
governments are less likely (and autocratic governments more likely) to ban the
export of commodities the larger the share of the population they are produced by,
that is, particularly agricultural commodities.
This thesis agrees with the regime type literature that large group size can be a
significant source of power and that commodities produced by larger shares of the
population are less likely to be restricted at export. It deviates, however, from the
assumption that this occurs primarily in the context of democratic regimes. While
elections can be an important channel for rural mass grievances, it is not the only
one. Large-scale peasant protests and revolts throughout global and African history
have demonstrated that even in highly authoritarian contexts peasants could
mobilize and pose a threat to governments. What was common to many or most of
these revolts, however, was that they were sparked by severe and highly visible
grievances that could be directly attributed to the government (Isaacman 1990). The
Maji Maji and Mau Mau peasant rebellions in Tanzania and Kenya, for example,
were incited by German and British colonialists’ highly visible, severe, and
attributable ‘agricultural policies’ of forced labour, large-scale land dispossessions,

72
the introduction of high head taxes, and forced or prohibited37 production of certain
crops (Alam 2007; Elkins 2005; Iliffe 1967; Newsinger 1981). Similarly, the violent
Agbekoya Parapo Revolt of 1968–1969 in Western Nigeria was initiated by Yoruba
cocoa peasants fed up primarily with the Nigerian government’s frequent and often
brutal raids enforcing a debilitatingly high flat-rate tax, which at least initially led
to the government conceding to most of the peasants’ demands (Adeniran 1974;
Eades 1980). And more recently, the 2013 Tanzanian cashew riots demonstrate how
sensitive farmers can be to price shocks and aggressive towards the government
when they deem it responsible, even in non-democratic contexts.38 That being said,
this argument will be tested more rigorously in the large-N analysis of this study in
Chapter 4.
3.2.1.2. Executive Coethnicity: Blessing or Curse?
Much study of African politics has focused on the importance of ethnic favouritism.
Usually based on the theoretical argument that most presidents in Africa are reliant
upon their coethnics for political support, a large literature has shown how
presidents appear to reward this support by providing their coethnics with preferred
access to public and private goods, such as schools, roads, health clinics, subsidized
fertilizer, or state employment (Banful 2011; Burgess et al. 2015; Franck and
Rainer 2012; Francois et al. 2015; Kramon and Posner 2016). Bates and Block
(2010) have observed similar dynamics in the area of agriculture taxation in sub-
Saharan Africa. Using data spanning from 1955 to 2005 from the World Bank’s
“Agricultural Distortions Dataset” (Anderson and Valenzuela 2011), they find that
the government is less likely to intervene in ways that would lower the income
generated from cash crops grown in the president’s home region. Translating this
37 Whereas Tanganyikans were forced to produce cotton for export, Kenyans (particularly Kikuyus
in central Kenya) were prohibited to grow cash crops like coffee or tea as to reduce the competition
for European settlers.
38 When in April 2013 state-led cooperatives offered only half or less of the pre-agreed farm gate
price for raw cashews, peasants started to protest first in their southern Tanzanian villages and then
started to riot in the town of Liwale, burning 20 houses (most of which belonged to the ruling party,
CCM, and its representatives) until the police intervened heavy-handedly, employing teargas and
helicopters (24.04.2013).

73
to the context of commodity export bans we should hypothesize that commodities
mainly produced by the ruler’s co-ethnics are less likely to be restricted at export.
This narrative, however, is contested. Employing similar indicators (though from a
different source [Jaeger 1992] and covering a shorter period, namely 1970 to 1987),
Kasara (2007) finds that cash crops produced primarily in the ruling ethnicity‘s
home area face higher tax rates than those produced outside it. This startling
finding, she argues, is the result of how rulers in Africa have historically secured
support in the countryside. In line with a larger literature on the power of brokers
in African politics (Beck 2008; Boone 2003; Koter 2013; Stokes et al. 2013),
Kasara makes the case that African leaders have used local intermediaries to exert
control of peasants. However, intermediaries “at home”, she argues, are easier to
select and monitor than they are “abroad”, reducing the risk of alternative leaders
emerging in a leader’s home region. As result, leaders face a lower threat to their
political survival from coethnics and hence find it easier to tax them (Kasara 2007:
160). The corresponding hypothesis would read that commodities mainly produced
by the ruler’s co-ethnics are more likely to be banned at export.
Ideally, one should also study the relative ethnic affiliation of processors versus that
of producers and traders, as it might equally be an important explanator of relative
threat or power. For example, one might imagine that governments are more likely
to restrict a commodity’s export if processors are coethnics and producers and
traders are not (or vice versa). Unfortunately, however, data on the ethnic affiliation
of processors and traders is not readily available (reflected in the absence of
research on this topic) and extremely hard to collect across time and space. Whereas
geographical commodity production data is a readily available and valid proxy for
producers’ settlement (and can be matched with ethnic settlement data), no such
data is available for traders and processors. Given the lack of and difficulty to
collect cross-country-commodity-specific data on trader and processor ethnic
affiliation, the quantitative analysis must limit itself to studying the ethnic
affiliation of producers. The hypothesis will, however, be addressed in the
qualitative case comparisons in Chapter 6 and Chapter 7.

74
3.2.1.3. Elite-Clientelism or the Power of the Political Aristocracy
One of the most scathing criticisms of the usefulness of interest group approaches
in the African context comes from van de Walle (2001).39 In his analysis of the
politics of partial structural reform implementation in Africa during the last quarter
of the 20th century, he argues that much of the academic literature on African
political economy has critically overestimated the influence from broader societal
pressure groups, including ethnic groups (van de Walle 2001: 20). Although he
acknowledges that “there is plenty of evidence of lobbying, strikes, work stoppages,
and other forms of interest group participation” in Africa, “These actions are
ineffective, however, in persuading governments to change course” (van de Walle
2001: 26). Except for civil servants and their ability to shut down government
services, he argues that due to amalgam of geographical features, historical
legacies, and active political strategies by the state it is “it is difficult to think of a
constituency in Africa that is capable of exerting similar social power in the absence
of organization” (van de Walle 2001: 48).
Nevertheless, Van de Walle also argues that African rulers have interests to
appease, only that these look different than those discussed before. Citing Callaghy
(1984), he argues that a small “political aristocracy” close to the centre of the state
apparatus (that may not total more than a couple of hundred people) dominates
policy-making (van de Walle 2001: 54). Importantly, these elites are often rather
fragmented and to keep them together and hence securing political survival,
requires presidents at the top of this aristocracy to allow and even foster their
systematic appropriation of public resources (van de Walle 2001: 52).
It is in light of these patron-client relationships that van de Walle as well as others
(Bhagwati and Krueger 1973; Bienen 1990) see the creation of trade bans. The
underlying assumption is that governments deviate from ‘welfare-enhancing free
trade’ to create the rents required to appease members of the political aristocracy.
39 In the last 10 years, van de Walle’s and others’ work particularly on neo-patrimonialism has
received strong critique. (Pitcher et al. 2009: 125) for example argue that “Current usages of the
terms patrimonial and neopatrimonial in the context of Africa are conceptually problematical and
amount to a serious misreading of Weber.” Mkandawire (2015: 563) further claims that “the concept
of neopatrimonialism has little analytical content and no predictive value with respect to economic
policy and performance.”

75
Accordingly, highly distorting trade interventions such as heavy export bans on
commodities must be the result of powerful rent-seeking political aristocracies. A
plausible channel of rent-seeking in export bans could be the windfall gains earned
by a client processor. However, it could also be that traders or farmers – rather than
processors – are part of the political aristocracy, and hence, will pressure the
government to leave their businesses untouched by export bans. Summarizing, the
hypothesis generated from this discussion would state that if processors of a
commodity more politically connected than traders and/or producers, the more
likely a ban. Vice versa, if producers and traders are more connected, the propensity
of a ban should decrease.
A critical question to ask is whether this relative political connectedness aligns with
the export patterns uncovered. Are producers and traders of frequently banned
commodities less well connected than processors? Is this different in rarely banned
commodities? Looking at our fourteen commodities, there seems to be no clear
pattern. Whereas timber license holders tend to be well-connected and organized
(Terheggen 2011a), this is not necessarily the case for metal scrap collectors.
Similarly, whereas many small-holder farmers lack close ties to politicians, tobacco
leaf companies or tea plantations often do (Smith and Lee 2018). Whether and how
this matters will be analysed in more depth in the case study chapters of this thesis.
3.2.2. International Political Economy Explanations
One level higher, four potential explanations can be derived from the International
Political Economy (IPE) literature. The first hypothesis is that international
agreements might be responsible for African governments’ export ban policy
choices. Melamed (2006) for example contends that international trade agreements
leave African governments with few policy options. Shadlen (2005) illustrates in
more detail how regional-bilateral trade agreements (RTAs) tend to restrict and
shape developing country governments’ policy space more than do multilateral
trade agreements. And indeed, although GATT Art XI prohibits export bans, it
neither monitors their usage nor does it require governments to notify the WTO
when new export bans are introduced (Espa 2015; Korinek and Bartos 2012;
Mendez Parra et al. 2016; WTO 2004; Wu 2013). Up until now, only a handful of
cases regarding export measures were brought before the GATT/WTO Dispute

76
Settlement Body (specifically, concerning Canadian Salmon and Japanese Semi-
Conductors in 1988, Argentinian bovine hides in 1999, and Chinese rare earths in
2015). No case complaint against any of the numerous bans maintained or
introduced by African states was ever raised. What is more, all 36 countries in my
sample are part of the WTO and bound to the same rules. Hence empirically
speaking, membership in the WTO should not be able to explain variation in the
outcome.
Whether, however, this is different for RTAs in the case of export bans in Africa is
questionable. By far the most relevant RTAs in Africa are concluded with the EU.
Whereas the Cotonou Agreement had no provisions for export bans, all new
Economic Partnership Agreements (EPAs) clearly state that on entry into force all
export prohibitions affecting trade between the parties shall be eliminated. The
potential effect of these agreements on the observed pattern is put in question by
two observations, however. First, by the end of 2015 (corresponding relatively well
with the data coverage of the EPTA dataset) only in five out of 38 countries in the
sample had an EPA entered into force: South Africa in 2000; Madagascar,
Mauritius, and Zimbabwe in 2012; and Cameroon in 2014 (in the last quarter of
2016 EPAs entered into force in Côte d’Ivoire, Ghana, Botswana, Lesotho,
Mozambique, and Namibia as well). Moreover, adherence to the EPAs appear
weak: in opposition to the agreement, all countries upheld their previous export
bans. More strikingly, both Mauritius and Mozambique introduced new export bans
(on metal waste and timber respectively) after the EPAs came into force. Hence, it
appears that – for now at least – international trade agreements have not shaped the
observed export ban pattern.
Influence by international interests on African policy-makers might be more direct
and less legal. Mkandawire (1999) for example contends the imposition of stringent
conditionalities attached to aid and loans constrains African governments’
independent policy power. In the context of this analysis, international donors might
employ aid as a leverage to dissuade African governments from restricting the
export of raw materials which they have interests. Specifically, as part of the SAPs,
international donors and lenders had put emphasis on strengthening the agricultural
sector (Krueger et al. 1988; Mosley and Smith 1989; World Bank 1981). As such,
it could be that African governments tend to spare agricultural export crops from

77
bans because of donor pressure. If true, we should see that particularly donor-
dependent government should abstain from restricting agricultural commodities,
something that can and will be tested in the empirical chapters of this thesis.
Figure 3.3. Import Tariff Escalation for African commodities in the EU, USA,
China and India
Source: Own illustration, based on data from UNCTAD’s (2018) Trade Analysis
Information System.
Perhaps tariff escalation in consumer markets or current key processing countries
can explain why certain raw material exports are restricted more than others
(Estrades et al. 2017). For example, high tariff escalation (that is, higher import
tariffs on processed and finished goods in the consumer countries) could motivate
raw producing country governments to explicitly counteract foreign barriers by
imposing an export ban “de-escalation” (with processed and finished exports not
being banned). To eye-ball this argument, Figure 3.3 illustrates the extent of
average tariff escalation in the EU, the USA, China and India on imports of the
main commodities studied in this thesis. Following the logic above, we should see

78
raw commodities frequently restricted (compare Table 2.2 above) – that is, wood,
hides, precious stones and diamonds, as well as metal wastes – to be more affected
by tariff escalation by these four major importers. If at all, the opposite appears true:
tariff escalation on the named products appears to be relatively neutral. In contrast,
some rarely heavily restricted commodities like cotton, cashew, or tobacco have
experienced greater tariff escalation in the past. Nevertheless, the argument needs
to more rigorously tested through regression analysis.
Finally, transgressing the boundary to domestic politics, the ideological orientation
of governments tends to impact their position on active and selective industrial and
trade policies such as export bans, with the common perception being that more left
governments will be more positive towards economic interventionism. However,
ideology might also play a role how governments view the necessity to abstain from
harming agricultural production. Some scholars of African agriculture have argued
that more centrist or right-leaning governments – e.g. those of Kenyatta in Kenya
or Houphouët-Boigny in Côte d’Ivoire – have had a more productive laissez-faire
attitude to agriculture than more socialist governments – such as Nkrumah in Ghana
or Nyerere in Tanzania – heavily taxing agricultural commodities (Bates 1983;
Bates and Block 2009; Widner 1993). To the extent such orientations still play a
role in post-SAP Africa, it would make sense to analyse whether they at least
partially drive the export ban patterns observed.
3.2.3. Additional Economic Considerations
Although economic factors have determined the 14 bannable commodities40 to be
analysed in the remaining chapters of this thesis, there are further economic factors
that could explain export ban variation across them. These are potential differences
in their importance to the government and the likelihood to suffer from a ban;
variation in the structure of their value chains and export circuits; as well as a
potential association with levels of industrial and economic development. Each will
be discussed in turn.
40 And 12 in the large-N analysis, as described in Chapter 4.

79
3.2.3.1. The Fear of Killing the Goose that Lays the Golden Eggs
Taxation on commodities and their trade have historically been one of the most
important sources of revenue for African governments (Anderson 2010a; Bates
1981; Cooper 2002).41 Moreover, maintaining a stable export base is key to earning
foreign exchange and to avoiding balance of payment (and thus potential political)
crises. One could, therefore, expect African governments to avoid policies that
would risk draining or disturbing these important streams.
Export bans could threaten revenue and foreign exchange streams in two ways.
First, directly, by banning the export of a raw commodity, any export tax or foreign
exchange earned from that raw commodity would be foregone. This needs to be
qualified however. Ideally, the loss in foreign exchange should be short-termed. If
markets for the higher-valued processed commodity can be found, the ban should
increase the total foreign exchange earned from that commodity. Yet the risk
remains that processing is not up to the task and cannot export competitively despite
the ban, at which point the foreign exchange earned originally from raw commodity
exports would be lost (at least temporarily). Similarly, losses in tax revenues from
raw exports could be balanced by taxing processed goods. Yet, this again might
stand in opposition to the industrial policy goal of making processors export
competitive. As such, at least in the short to medium term, export bans do have
significant direct risks for crucial revenue streams.
Second and more indirectly, policy-makers might hesitate to impose export bans in
a fear that these might kill the goose that lays the golden egg. That is, prohibiting
the export of a commodity might reduce profitability of raw production to such an
extent that raw producers will reduce or even abort production. Thus, governments
might want to safeguard those commodity streams particularly dear to them and
particularly prone to be hurt through export bans.
What then are the characteristics that are likely to make a government perceive a
commodity as a golden goose and believe that an export ban is likely to kill it? Four
factors appear particularly relevant. Arguably the most obvious factor is the export
41 Mendez Parra et al. (2016: 28) however find that export taxes on commodities constitute no or
only a very small share of developing country governments’ revenues nowadays.

80
share of a commodity. Commodities which account for a large share of the total
export value of a country constitute a critical foreign exchange source and likely of
other revenues as well. As such, one could expect governments to be less likely to
ban the export of such commodities.
Relatedly, the degree of market power a country holds in a commodity might also
play a role. If a country’s production of a commodity accounts for a critical share
of global production of that commodity, both domestic and foreign investors
seeking to secure that share will be willing to invest in domestic processing. As
such, in the context of great market power bans promise to promote processing
expansion more strongly.42 The flip side is that the original importers of that raw
commodity might resent this policy and commence a trade war, hence, governments
might be particularly warry of imposing bans on such commodities.43 Thus, it is
difficult to hypothesize whether market power would increase or decrease a
commodity’s export ban propensity.
Another relevant factor might be producer profit margins. If profit margins from
producing a commodity are very slim, governments might fear these commodities
to be too feeble to weather a ban. Yet again, processor might act irrationally and
only have their short-term survival or profits in mind. Accordingly, one could
hypothesize that governments would be less likely to impose export bans on raw
commodities which generate low profit margins for their producers.
Finally, the factor mobility inherent to a commodity could play an important role.
Specifically, the easier it is to put the means of producing a commodity (i.e. land,
labour, and capital) to a different use, the more likely it is that producers will
abandon that commodity if its export is banned. Governments wanting to avoid
killing the goose that lays the golden egg might, therefore, be more likely to spare
commodities that are produced through highly mobile factors. In fact, this speaks
directly to the work of Besley (1997) and McMillan (2001), who theorized and
42 The Kenyan nut industry is a case in point. The government introduced a ban on both macadamia
and cashew nut exports in June 2009. Given the great importance of Kenyan macadamia in the world
market – and the irrelevance of Kenyan cashew – macadamia prices followed increasing world
market prices, whereas cashew did not (reflected also in diverging production volumes).
43 This is a possibility tea producers and government officials in Kenya in interviews indicated as a
possibility that would make banning bulk tea somewhat less attractive.

81
found that crops with particularly high sunk costs (such as perennial crops like
cocoa), and therefore lower factor mobility, are taxed higher than crops with lower
sunk costs and easier ways to opt-out of production.
Given that the variation in export bans runs strongly along agricultural versus non-
agricultural commodity lines, one should ask whether these three factors covary
across these two commodity types. Figure 3.4 below illustrates the export share and
market power of the commodities (whether raw or processed) included in the
quantitative analysis conducted in Chapter 4. Specifically, these measures are the
averages across the producing countries and the period covered in the large-N
sample. We see that overall agricultural crops appear to account for higher export
shares in African countries that export at least some amount of this commodity. As
such, on first sight, the assumed correlation between high export share and rarely
banned appears to hold. On a closer look, one can also find clear exemptions from
this correlation. Rarely banned sesame does not appear to account for high export
shares on average. Similarly, the most frequently banned commodity, wood,
accounts for relatively high export shares. Moreover, if we average export shares
by whether a commodity was banned or not banned in 2011, we will find that the
two shares are relatively close, at 3% and 2% respectively. The pattern in market
power is even more ambiguous. Some agricultural commodities like cocoa, cashew
or tea appear to have relatively high market powers, whereas others like sesame,
cotton, or tobacco have relatively low market power. This also holds for
commodities that are not agricultural crops.44 Thus, whether these variables matter
in explaining export patterns and whether they put into question alternative
explanations discussed in this thesis can and must be tested more rigorously using
quantitative methods.
44 Chromite has exceptionally high market power in Africa due to South Africa and Zimbabwe
producing and exporting large quantities of global chromite.

82
Figure 3.4. Average Export Share and Market Power per Country-Commodity-
Year in Data Sample (in %), 1988-2017
Note: The export share is defined as the percentage a country-commodity’s exports
accounts out of the total value of exports from a country in a year. Market power is
the share of the total global volume traded in a commodity that a country accounts
for in a year. The values presented in the graphic is derived by averaging all
country-commodity-year values for the two measures respectively.
Source: Own Illustration based on export weight and value data from the UN
Comtrade database (DESA/UNSD 2019).
If the size of producer profit margins might affect governments’ propensity to
impose export prohibitions, we must ask whether these correlate across commodity
types. Answering this question is extremely difficult however. Calculating profit
margins requires knowing both the prices received and costs incurred for producing
a unit of a commodity, preferably across countries and time. For Africa, such data
is patchy at best, and non-existent at worst. The only relatively comprehensive
effort to collect producer price data across commodities, countries, and time stems
from the FAO (2018b) which created a database of farm gate prices across a range
0 1 2 3 4 5 6 7 8 9
(Semi-)Precious Stones
Chromite
Hides and Skins
Sesame
Metal Waste and Scrap
Tea
Wood
Tobacco
Diamonds
Cocoa
Cashew
%
Market Power Export Share

83
of commodities. This data, however, is very incomplete for key commodities.45
However, I could not find credible producer price data for non-agricultural
commodities. Yet, even if I did, calculating profit margins would still be extremely
challenging given the lack of production cost data by commodity in Africa, whether
for agricultural or non-agricultural commodities.46 This lack of data makes it
difficult to assess whether profit margins for uncommonly banned processable
goods (like agricultural commodities or gold) are significantly slimmer than for
more commonly banned goods such as timber, metal wastes, hides, chromite or
certain precious stones. It thus also makes it impossible to test the power of this
variable to explain export ban patterns through large-N analysis. This is arguably a
significant limitation of the large-N analysis.
There are two further potential methods to address the empirical power of this
variable. First, analysing the variable through qualitative comparison in a smaller
range of cases. As detailed in Chapter 6, the comparison of raw cashew nut export
bans in Ghana and Kenya provides tentative evidence against the explanatory
primacy of this variable. Ghanaian cashew farmers at the time of the ban (2016)
enjoyed much larger profit margins than Kenyan farmers did when the government
imposed a ban in 2009. In fact, due to lacking profitability, Kenyan cashew farmers
had been exiting the second for over a decade by the time of the ban. Based on the
profit margin hypothesis we would expect two things. First, the Kenyan
government, if indeed worried by low profit margins, should have never imposed a
ban in the first place – yet it did. Second, if at all it should have been the Kenyan
government that would have withdrawn the ban out of realization that their
producers would be much more likely to exit cashew farming. Yet, the opposite was
the case, with the Ghanaian government withdrawing the ban after one week, and
the Kenyan ban remaining in place and strongly implemented one decade after its
45 Cashew fam gate prices are a case in point. The FAO has only collected data on cashew farm gate
prices in the last years from Kenya and Senegal. Given that Kenya has massively distorted farm gate
prices as an outcome of a 2009 export ban on raw cashew nuts, the average cashew producer prices
in Africa illustrated in Figure 2.2. below, massively misrepresent actual developments.
46 This assessment is based primarily on discussions with leading rural statisticians at the FAO and
FAO consultants who spend several years on building a framework to support agricultural ministries
and statistics offices in Africa to generate agricultural production cost estimates in the first place.
Compare also (Lys 2010) and (FAO 2014a). Until this point, no comprehensive dataset has been
built, given the extreme complexity and difficulty of attaining this data.

84
imposition. Moreover, as detailed in Chapter 7, producers of more frequently
banned (i.e. non-agricultural) commodities do also appear to be sensitive to the
price decreases created by bans. In Ghana, for example, many loggers and scrap
collectors had to give up their business due to export bans. The same appears true
in Zimbabwe, where many smaller scale chromite miners stopped operating as a
consequence of the chromite export ban (Parliament of Zimbabwe 2013: 7–8). A
further case is the Malagasy gemstone sector, which saw a massive recession and
closure of mines after the government had banned unprocessed gemstones in 2008,
and only slowly recovered when it withdrew over one year later (Kyngdon-McKay
et al. 2016: 83). As discussed in Chapter 2.4, similar patterns held in Indonesia’s
timber and mining industries, where many logging firms and mines closed due to
raw commodity bans. This anecdotal evidence warrants some scepticism that there
is a strong covariation in between the likelihood of certain industries to collapse
under a ban and their propensity to face one.
A second way to at least partially assess the potential power of the margin variable
is by analysing the covariation of producer profit margins and state-led commodity
price distortions for one group of commodities over time. Given at least some crude
availability of data, agricultural commodities lend themselves for this exercise.
Specifically, if the hypothesis holds, we should see governments distorting prices
of agricultural commodities less, the lower the profit margins of a commodity.
Critically, a large qualitative and quantitative scholarship has provided ample
evidence that during the first three decades after independence African
governments taxed export crops significantly higher than today (Anderson 2010b;
Bates 1981; Jaeger 1992; Jaffee and Morton 1995; Krueger et al. 1988; McMillan
2001). Looking at cocoa, for example, Kolavalli and Vigneri (2011: 208) find that
the ‘share of the net f.o.b. price received by cocoa farmers in Ghana has increased
to nearly 80 per cent after having fallen below 20 per cent before the economic
reforms of the 1980s’. Similarly, whereas Ivorian cocoa farmers received only
around 25% of the world market price prior to the implementation of SAPs (Boone
2003: 226), this share has now increased to over 60% (Laven et al. 2016). Critically,
several of these studies have found that this taxation was often higher than the
estimated revenue-maximizing tax rate, that is, the rate that maximizes revenue

85
while keeping farmers planting.47 This by itself tells us that historically African
governments have often not been impressed by the potential of their policies to push
farmers to keep producing and begs the question why this should be different in the
last two decades.
Deriving from the margin hypothesis, the fact that African governments distort the
prices of agricultural commodities less nowadays should be because their profit
margins have declined over time. As indicated above, calculating exact profit
margins across commodities and time is extremely difficult given a lack of data on
exact cost composition, as well as input and output prices. A tentative
approximation can be made however by looking at the relative price developments
in Figure 3.5 of farm gate prices for ‘bannable’ agricultural commodities and those
of three critical inputs, food (proxied by wheat), fertilizer, and pesticides.
Importantly, whereas farm gate prices for the studied export crops (rows 1 and 2 in
Figure 3.5) have increased strongly over time – with the fraudulent exception of
cashew48 – the price of wheat (at the farm gate) as well as fertilizer and input (at
import) has grown significantly slower or remained constant. We, therefore, have
tentative evidence that over time the income side of African smallholders’ business
equations has grown faster than the cost side49, indicating that profit margins have
more likely increased than decreased over time. As such, it appears unlikely that a
reduction in profit margins has motivated African governments to distort
agricultural prices less and hereby also raises some doubt that African governments
would now see low profit margins as a crucial inhibitor to banning the export of
processable agricultural crops. Concluding, while the difficulty to assess this
47 See McMillan 2001 for a more comprehensive overview.
48 Note that the average FAO data seems to be incorrect for cashew. As the data in Chapter 5 details,
prices in cashew doubled in the last ten years, reaching the same per kg price (ca. US$ 1.5) as cocoa
in Ghana, for example. This is the result of farm gate price data only being available for Kenya in
the last two years (and Kenya and Senegal in the last five years. As described in detail in Chapter
5.3.2, because of an export ban, Kenya has by far the lowest prices in Africa (two to three times as
low as the African Average), therefore, not holding as good representative for African average
producer prices. As such, with normal data we should see a strong upward slope in cashew, crossing
an African average US$ 1.3 in 2017. For reasons of data consistency, however, this illustration relies
only on the FAO data.
49 Land and labour are obviously further important inputs for farming. Given that these factors of
production are usually held by the farm owners over time in the studies African export crops, one
might consider them as relatively constant in this equation.

86
question more rigorously quantitatively is a clear limitation of this dissertation, the
presented anecdotal and descriptive statistical evidence should reduce concerns of
strong omitted variable bias.
Figure 3.5. Average African Producer Prices Across Export Crops as well as
Import Price Data for Fertilizer and Pesticide Imported to Africa, 1990-2016
Source: Own illustration. Country-year-commodity producer price data was
derived from FAO (2018b) and aggregated for Africa. Per Kg prices were
calculated from import value and weight data from the UN Comtrade database
(DESA/UNSD 2019), where ‘Fertilizer’ refers to the ‘Manufactured Fertilizer’ as
per SITC150 code 561 and ‘Pesticides’ refer to ‘Agricultural Pesticides’ as per
SIC51 code 2879. Note also for producer prices that: ‘Prices in US Dollars are
equal to producer prices in local currency times the exchange rate of the selected
year. The main exchange rates source used is the IMF. Where official and
commercial exchange rates differ significantly, the commercial exchange rate may
be applied’ (FAO 2018b).
50 The first revision of the Standard International Trade Classification.
51 The United States Standard Industrial Classification (SIC).

87
Finally, looking at the fourth factor, does the production of agricultural goods differ
systematically from non-agricultural commodities with regard to factor mobility?
In general, assessing the factor mobility of producing certain goods is not
straightforward. Is it easier to switch from forestry and logging, mining diamonds
and gemstones, or collecting metal wastes and hides to another occupation than it
is to switch from farming say cashew or cotton? This partially depends on who
controls the means of producing a commodity. Forest or mining pit (license) owners
might not find it easy to simply transfer their land to another use or sell it, given
that its value has likely decreased. Similarly, they will have invested significant
capital in their enterprises, which might be fixed to logging or mining. Their
workers might be more mobile however, being able to switch to another job when
their employers cannot pay adequate salaries anymore due to the ban. In small-
holder agriculture – the typical modus of producing most of the discussed crops in
Africa – the three means of production are usually unified within a family. While
possible (e.g. through rural-urban migration), it is arguably more difficult for
farming families to simply change location or jobs. And while they could shift to
other crops, this is often inhibited through high sunk costs invested in the crop
(McMillan 2001) or due to the lack of suitable alternative crops. Hence, although
complex, if at all, it appears that on average the factors of producing agricultural
export crops are less mobile than those of more frequently banned commodities.
This stands in direct opposition to the hypothesis generated above that the higher
the factor mobility, the lower the incentive for governments to ban them.
Concluding, the explanatory direction and power of these four conditions
(commodity export shares and market power, producer profit margins, and factor
mobility) is not straight forward. They will thus be tested more rigorously in both
the quantitative (apart from the profit margin variable) and qualitative analyses.
3.2.3.2. Differences in Commodity Value Chains
In the introductory chapter I proposed that the 14 commodities identified for further
analysis in this thesis should be broadly comparable regarding the degree that
imposing an export ban to promote their processing is economically sensible.
Nevertheless, these commodities do undoubtedly differ in further regards, which
might explain differences in export ban policy-making. One key area is the
88
character of their respective value chains. Table 3.2 below provides an overview of
some of the key and typical value chain characteristics of the commodities studied,
ordered by the frequency of being banned. If any of these characteristics does
systematically shape governments’ decision to impose export bans, we should find
that it covaries with the frequency of that commodity being banned. That is,
commodities more (or less likely) to be banned should be similar on that
characteristic.
Following the value chain, we start assessing the production side of our 14
commodities. And indeed, a relatively clear pattern emerges. Whereas the
production of agricultural export crops tends to be dominated by many small-
holders, more frequently banned commodities like timber logs, metal scraps, or
precious stones tend to be produced by relatively few people and owned by even
less. Notably, on the first look, the production of raw hides and skins appears to
resemble that of agricultural crops, given that hundreds of thousands of people are
involved in the production. In contrast to agricultural crops, however, the
production of raw hides and skin provide a significant income to only a very small
part of African populations. The reason is that because the actual value of a raw
hide or skin constitutes only around 1% of the value of a whole cow, goat, or sheep,
African livestock keepers de facto do not receive any income from the commodity
(as described in more detail in Chapter 7.3). The only players gaining a significant
share of their income from working with raw hides and skins – apart from tanners
of course – are hides and skins buyers and traders. In the second-largest livestock
producing country in sub-Saharan Africa, Tanzania, however, less than 2,500
people are employed as hide and skin traders, a minuscule share of the over 50
million Tanzanians. Overall, this pattern – relatively frequently banned
commodities providing significant incomes to only relatively few people, whereas
rarely banned commodities tend to provide significant incomes for many producers
– appears strong for the 14 bannable commodities. As indicated in the introduction
and further detailed in section four of this chapter, I claim that this is the key
variable explaining variation in export bans across those commodities. Crucially,
however, I argue that the mechanism behind this association is political and not
economic.
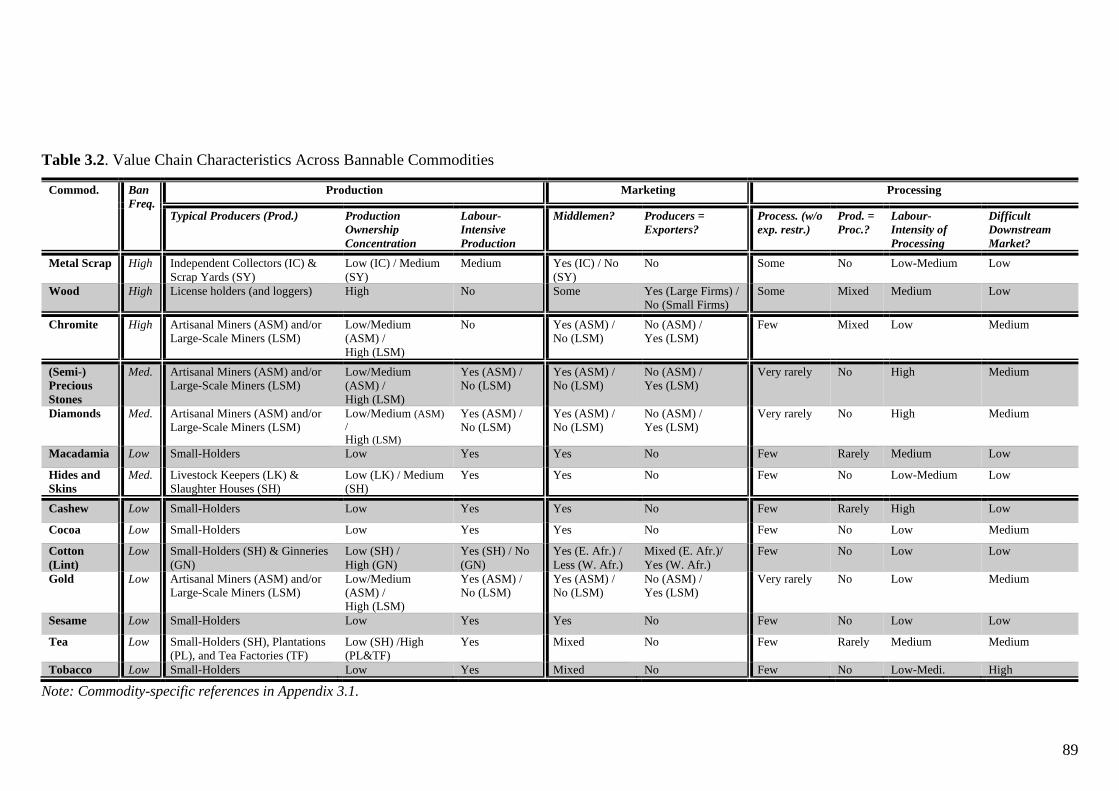
89
Table 3.2. Value Chain Characteristics Across Bannable Commodities
Commod. Ban
Freq.
Production Marketing Processing
Typical Producers (Prod.) Production
Ownership
Concentration
Labour-
Intensive
Production
Middlemen? Producers =
Exporters?
Process. (w/o
exp. restr.)
Prod. =
Proc.?
Labour-
Intensity of
Processing
Difficult
Downstream
Market?
Metal Scrap High Independent Collectors (IC) &
Scrap Yards (SY)
Low (IC) / Medium
(SY)
Medium Yes (IC) / No
(SY)
No Some No Low-Medium Low
Wood High License holders (and loggers) High No Some Yes (Large Firms) /
No (Small Firms)
Some Mixed Medium Low
Chromite High Artisanal Miners (ASM) and/or
Large-Scale Miners (LSM)
Low/Medium
(ASM) /
High (LSM)
No Yes (ASM) /
No (LSM)
No (ASM) /
Yes (LSM)
Few Mixed Low Medium
(Semi-)
Precious
Stones
Med. Artisanal Miners (ASM) and/or
Large-Scale Miners (LSM)
Low/Medium
(ASM) /
High (LSM)
Yes (ASM) /
No (LSM)
Yes (ASM) /
No (LSM)
No (ASM) /
Yes (LSM)
Very rarely No High Medium
Diamonds Med. Artisanal Miners (ASM) and/or
Large-Scale Miners (LSM)
Low/Medium (ASM)
/ High (LSM)
Yes (ASM) /
No (LSM)
Yes (ASM) /
No (LSM)
No (ASM) /
Yes (LSM)
Very rarely No High Medium
Macadamia Low Small-Holders Low Yes Yes No Few Rarely Medium Low
Hides and
Skins
Med. Livestock Keepers (LK) &
Slaughter Houses (SH)
Low (LK) / Medium
(SH)
Yes Yes No Few No Low-Medium Low
Cashew Low Small-Holders Low Yes Yes No Few Rarely High Low
Cocoa Low Small-Holders Low Yes Yes No Few No Low Medium
Cotton
(Lint)
Low Small-Holders (SH) & Ginneries
(GN)
Low (SH) /
High (GN)
Yes (SH) / No
(GN)
Yes (E. Afr.) /
Less (W. Afr.)
Mixed (E. Afr.)/
Yes (W. Afr.)
Few No Low Low
Gold Low Artisanal Miners (ASM) and/or
Large-Scale Miners (LSM)
Low/Medium
(ASM) /
High (LSM)
Yes (ASM) /
No (LSM)
Yes (ASM) /
No (LSM)
No (ASM) /
Yes (LSM)
Very rarely No Low Medium
Sesame Low Small-Holders Low Yes Yes No Few No Low Low
Tea Low Small-Holders (SH), Plantations
(PL), and Tea Factories (TF)
Low (SH) /High
(PL&TF)
Yes Mixed No Few Rarely Medium Medium
Tobacco Low Small-Holders Low Yes Mixed No Few No Low-Medi. High
Note: Commodity-specific references in Appendix 3.1.

90
The next relevant segment of the value chain is marketing. Two interrelated
questions appear particularly interesting: on average, do middlemen organize most
marketing between producers and exporters or processors? And do producers
sometimes export their commodities themselves? We do not find strong (co-)
variation among the commodities analysed. Overall, middlemen are common
throughout all value chains. Independent of the propensity of being banned at
export, some commodities do have sub-chains, however, where middlemen do not
play an active role. Generally, this is the case when there are particularly large
(often international) producing firms that also export the produce themselves.
Examples are large European logging companies, large plantations owned by tea
giants like Unilever, or large underground diamond mines run by De Beers, the
leading diamond producer and trader in the world. Similarly, where contract
farming is dominant (e.g. in certain West African cotton industries or Eastern and
Southern African tobacco sectors), there is less need for middlemen. In general,
given the lack of relevant covariation, however, marketing structures do not appear
to be a critical determinant of the export prohibition pattern under study.
Finally, variations in the character of processing across the value chains might
matter. The four key characteristics discussed here are: the existence of processing
companies (independent of export restrictions); whether producers also process; the
labour-intensity of processing; and whether it is difficult for processors to enter
international markets for their goods. Overall, as for marketing, there is no coherent
covariation between these characteristics and the propensity to be banned across the
commodities analysed. In general, without direct state support, said commodity
sectors rarely produce processing companies. Where some processing companies
do exist, this can be the result of different reasons. In the 20th century, for example,
metal scrap was rarely exported from Africa, given low demand from other
continents. As such, metal mills did not face any competition in sourcing scrap and
emerged relatively naturally with demand coming from the local market. This
changed with the rise of China as a global steel giant constantly looking for scrap
to feed its massive production overcapacities. The resulting competition for African
scrap puts processors under significant pressure and hence put industry protection
on the table. The case of tropical timber is somewhat more complicated. In some
African countries, like Ghana, a milling industry emerged even before the
91
government started to promote it more actively. This is primarily the result of a
divided demand structure in Europe. The smaller part of Western wood
manufacturers did not possess their own sawmills and as such demanded (semi-
)processed timber from Africa. The larger part did have its own sawmills and was
thus more interested in raw logs. As such, countries like Ghana saw the existence
of both semi-processed timber and raw log exports, and accordingly, and industry
with both processors and pure loggers. The increasing demand from China for only
raw logs starting in the 1990s, however, put pressure on domestic processors in the
competition for sourcing raw logs, motivating many African governments to
employ export bans, quotas and high taxes as protective measures. Looking at Table
3.2 there thus appears to be at least a tentative correlation between the existence of
processing industries and the likelihood of governments to impose protective bans
(which is something I will study in more detail in Chapters 6 and 7). That being
said, this does not appear to be a necessary condition for bans, as there are cases
where governments impose bans even where processors barely existed in the first
place (e.g. the Tanzanian, Malagasy, South African, and Botswanan bans on some
or all gemstone exports or the Mozambican and Sierra Leonean bans on raw log
exports).
Given that one of the key goals of promoting processing industries is creating
employment, one might argue that governments would be more likely to ban the
export of commodities that are more labour-intensively processed. Empirically, this
does not appear to be a necessary condition, with labour-intensively processed
cashew rarely banned, and metal scrap, for example, that requires relatively little
labour to process frequently banned. A further factor that likely matters to
governments is how difficult it will be for processors to access foreign markets. Yet
again, there is no noticeable correlation between this variable and the propensity of
a commodity to be banned. Overall, most processing sectors have relatively easy or
medium-difficult access to markets, with these manifestations equally spread across
ban frequency categories. One exception that has particularly high barriers to entry
is tobacco. This is due to the extreme concentration to a handful of buying
companies in the world that control all major brands and retail markets. Trying to
enter such markets is nearly impossible. Accordingly, the key regressions in
Chapter 4 will be run both with and without tobacco. Finally, there is also no

92
noticeable covariation in the existence of a processor or the degree to which they
are also involved in the production.
To conclude, from a bird’s eye perspective, neither differences in marketing and
processing between the commodities under study appear to systematically covary
with and thus potentially explain export ban patterns. In contrast, differences in the
number of people earning significant income from (working in) producing
commodities appear strongly correlated with the propensity to ban their export: the
larger the number, the less likely are export bans.
93
To analyse and test the above-derived hypotheses against competing explanations,
the study employs a combination of quantitative and qualitative methods. Whereas
Chapters 5 through 7 present the qualitative analyses of this thesis, this chapter
presents the quantitative analysis. After elaborating on the research design of the
analysis in Section 4.1, Section 4.2 highlights its key findings. Section 4.3
concludes with a summarizing discussion thereof.
4.1. Large-N Research Design
The following section details the large-N research design in three steps. First, I
present the key units of analysis of the study. Then I discuss the operationalization
of the key dependent and independent variables and the respective data sources.
And finally, I detail the main model specifications for the regression analysis.
4.1.1. Units of Analysis
The core unit of analysis is the country-commodity-year. As detailed in Chapter 2,
the EPTA dataset covers information on export bans and taxes on 36 sub-Saharan
African WTO member states, with the earliest year of temporal coverage being
1988 (the earliest date of WTO accession and thus the earliest date for a Trade
Policy Review) and 2017 being the latest. Most countries, however, have
significantly shorter coverages, given later accession or writings of TPRs. Except
for gold and macadamia, data was collected on all other 1252 bannable commodities
in Chapter 2.4. Gold is excluded from the analysis because the HS-code system
does not clearly distinguish between refined and unrefined gold making subsequent
variable operationalizations impossible. The same is true for macadamia, for which
there is only a general macadamia category, rather than one for shelled and one for
52 Cashews, cocoa, cotton, chromite, diamonds, metal waste and scraps, precious and semi-precious
stones, raw hides and skins, sesame, tea, timber, and tobacco

94
unshelled macadamia nuts. Overall, the final regression dataset covers 7,846
country-commodity-years, in essence, every country-commodity-year that
witnessed at least some exports as measured by the UN Comtrade database (2019).
This is unless a country restricted the export of a commodity in a certain year, in
which case it was included even if no exports were registered (since the restriction
might have repressed the exports completely). Given missing observations across
explanatory variables as well as certain coding choices, the typical number of
observations in the large-N analysis ranges between 1,400 and around 3,000.
4.1.2. Data and Operationalization
4.1.2.1. Dependent Variables: Export Prohibitions and Export Taxes
Using the data from the EPTA dataset described in Chapter 2.2, the key dependent
variable of the study is whether a government has introduced an export ban in a
given year.53 It is coded dichotomously: 1 for the year an export ban was introduced
and 0 for years in which a commodity was not affected by an export prohibition.
To deal with the problem of serial dependence in the data, I follow standard practice
in quantitative conflict onset research and code all country-commodity-years after
the introduction of an export ban as missing as long as they were affected by a ban
(Buhaug and Rød 2006; Schulz 2015; Thomson 2018).54 Similarly, all country-
commodity-years for which no clear year of introduction was identified, or which
had already been restricted at the outset of the first year of available data were also
dropped from the analysis. This does not solve the problem for temporal correlation
entirely because periods without a ban (coded as ‘0’) will still be correlated over
time. I account for this temporal dependency by using the simple, yet effective cubic
approximation method endorsed by Carter and Signorino (2010). First, I generate a
control variable measuring the number of years without an export ban since the
beginning of the data or a pre-existent export ban. This variable is then included as
53 Note that if a ban lasted less than a month, that year was not coded as having had an export ban.
Such cases are extremely rare however (the Ghanaian one-week cashew ban being the only one that
I came across in the composition of the EPTA dataset).
54 Coding years after the introduction of a ban (and prior to withdrawal) as ‘1’ would falsely be
counted by the model as introduction, hereby artificially increasing the statistical weight of variable
attributes of this observation. The same would be true if it were coded ‘0’.

95
a regressor in all models together with its squared and cubed equivalents (the so-
called polynomials).
Second, I generate an ordinal taxation and ban variable to test Hypothesis 2 that
lower export taxes are more likely to be imposed on larger population groups.
Specifically, this variable is disaggregated into five categories, measuring whether
a country commodity year was affected by no export tax or ban, a low export tax
(less than 10%), a medium export tax (between 10% and 30%), a high export tax
(greater than 30%), or an export ban. Importantly to reduce the complexity of the
operationalization and estimation strategy, rather than measuring the introduction
of these policies (as is the case for the dichotomous export ban introduction variable
above), this variable simply measures their presence or absence.
The export ban introduction and categorical export tax and ban variables are kept
as distinct in the analysis for two reasons. Conceptually, export bans are much more
likely to be imposed for processing promotion reasons55 (the explicit focus of this
study) than export taxes, where revenue-generation is often a core motive. Second,
the distinct export ban introduction dummy allows me to calculate significantly
more complex and robust models. Overall, the distinct analysis should thus enhance
the analytical rigour of the study and the substantial implications that can be drawn
from it.
4.1.2.2. Independent Variable: The Commodity Population Share
Operationalizing the proportion of the population that generates a significant share
of their income producing a specific commodity requires country-commodity-
specific employment numbers. Unfortunately, however, there are no readily
available cross-country datasets on producer group sizes, which has to do with the
fact that there are rarely detailed and credible assessments of producer group sizes
conducted in sub-Saharan Africa (Cordes et al. 2016). This study attempts to
55 Note that cases were excluded where bans were clearly not imposed for processing promotion
reasons. This is essentially true for all export bans that cover all wood products independent of
processing stage, as well as an explicit ban on copper waste and scrap in Mauritius (which does and
cannot economically operate a copper smelter), implemented to stop stealing of public copper wires.
96
overcome this hurdle by collecting employment data for some country-commodity-
years, and from there extrapolate to other country-years belonging to the same
commodity. Although not ideal, the imputation factors should serve as relatively
good proxies, and given the relatively large variation between labour share numbers
between commodities in real life, I am optimistic that re-running the analysis with
only slightly different exact measures (if they became available) would not
significantly alter findings.
The generation of the population share variable was done in three main steps. First,
for each commodity, information on the size of producer groups in as many country-
commodity-years as possible (86 in total) was collected.56 Together with production
output numbers for these country-commodity-years, for each a ratio of the labour
required to produce one unit of the commodity could be calculated (the country-
commodity-year specific imputation factor). For example, the Tanzanian
Government’s 2014/2015 Annual Agricultural Sample Survey Report indicates that
345,370 farm operators57 produced 178,546 tons of cashews. Thus, one ton of
cashew is produced by 1.93 farm operators on average in Tanzania. Averaging this
with country-commodity-year specific imputation factors from other country-
cashew-years creates a commodity-specific imputation factor. The employment and
production numbers as well as the resulting country-commodity-year- and
commodity-specific imputation factors are detailed in Appendix 4.1 for all 86
country-commodity-years that I managed to find labour data on.
56 Key sources for country-commodity-specific labour numbers were rigorous surveys by
international organizations, agricultural censuses and sample surveys by national governments,
detailed studies conducted by donors or NGOs, or in the case of (semi-) precious stones as well as
raw hides and skins own field research in Tanzania in 2017.
57 In general, agricultural censuses count the number of farm operators or households producing a
commodity in a country (except for tea, where many people also work on major plantations, thus
both these plantation workers and smallholders are counted). They do not usually depict the number
of additional workers (including family) required to create and maintain the farm. In contrast, for
commodities like timber, metal scrap, or mining the numbers of total employees are normally
provided in reports and studies. I stick with the operationalization of censuses, thus counting the
number of farm owners for agricultural crops (except for tea) and the number of employees for the
other commodities. Clearly, this implies that the number of people working in producing an
agricultural crop will be systematically underestimated. Yet, like the decision to include agricultural
country-commodity-years where production volumes were likely too low to allow for feasible
processing (see Chapter 2.4), underestimating agricultural employment numbers will tilt the playing
field against the thesis argument. Thus, if it passes the quantitative tests nevertheless, the argument
should gain further credence. For a more in-depth discussion of the challenges of using households
and related units of analyses in development studies see Oya (2015).

97
In a second step, this commodity-specific imputation factor is multiplied by
country-commodity-year specific production data. Hereby estimates for the number
of people producing a certain commodity in each country and year are generated.58
For example, if we know that Benin produced around 100,000 tons of raw cashew
nuts in 2010, we can estimate with the help of the cashew-specific imputation factor
of 1.94 that there were likely around 194,000 farm operators producing cashew in
Benin that year.59 While not optimal, the imputation factors can be relatively
temporally dynamic with some of them based on labour data from different years.
That being said, the example of chromite employment-production ratios in South
Africa from 2007 to 2017 (in Appendix 4.1), shows that these ratios tend to be
relatively stable.
Finally, these calculated country-commodity labour numbers were divided by the
size of the working-age (15-65 years) population in each country to generate the
commodity population share variable (measured in % and abbreviated as population
share). While the working-age population size is perceived as more validly
capturing the potentially politically active population in a country, it correlates at
0.98 with the normal population size and it thus makes no difference to the results
which operationalization is used.
Concluding the discussion of the core dependent and explanatory variables, Table
4.1 provides summary statistics for both by commodity.
58 Commodity output data was primarily sourced from the FAO (2018a), the British Geological
Survey (2017), and the UN Comstrade database (DESA/UNSD 2019). Both output and imputed
labour numbers are cross-checked against all findable estimates (including my own field research
on 9 of these 12 commodities in Ghana, Kenya, and Tanzania throughout the year 2017).
59 Note that the methodology was slightly amended for three of the 12 commodities, diamonds,
gemstones, and metal waste and scrap. Specifically, country-diamond imputation factors were
differentiated by whether a countries sector is dominate by ASM, LSM, or mix thereof, given their
different labor intensities. Given a lack of comparable production data, the imputation factor basis
for gemstones was build using a country’s gemstone export value. Comparable data on metal waste
production is similarly lacking and given that it is often processed domestically for the domestic
market, it is difficult to use export shares as proxy. Rather I estimated production numbers as a
function of a country’s population size and level of economic development. Each method is
discussed in more detail in Appendix 4.2.

98
Table 4.1. Summary Statistics by Commodity
Categorical Export Restriction Variable
Export
Ban
Introd.
1. No
Tax or
Ban
Present
2. Low
Export
Tax
Present
3. Med.
Export
Tax
Present
4. High
Export
Tax
Present
5.
Export
Ban
Present
Pop.
Share
Gemstones 0.011
(0.1)
0.86
(0.35)
0.08
(0.28)
0
(0)
0
(0)
0.06
(0.23)
0.05
(0.13)
Cashew 0.007
(0.08)
0.74
(0.44)
0.11
(0.31)
0.11
(0.32)
0
(0)
0.03
(0.18)
2.72
(6.53)
Chromite 0.017
(0.13)
0.79
(0.41)
0.14
(0.35)
0.01
(0.09)
0
(0)
0.06
(0.25)
0.04
(0.04)
Cocoa 0.003
(0.06)
0.68
(0.47)
0.26
(0.44)
0.06
(0.24)
0
(0)
0
(0.06)
2.19
(4.95)
Cotton 0.005
(0.07)
0.79
(0.41)
0.15
(0.36)
0.02
(0.15)
0.04
(0.2)
0
(0.05)
1.61
(2.23)
Diamonds 0.004
(0.06)
0.53
(0.5)
0.31
(0.46)
0.12
(0.32)
0.02
(0.14)
0.02
(0.14)
1.71
(3.06)
Hides and
Skins
0.019
(0.14)
0.74
(0.44)
0.01
(0.1)
0.06
(0.24)
0.09
(0.29)
0.1
(0.3)
0.01
(0.01)
Metal
Waste
0.034
(0.18)
0.7
(0.46)
0.01
(0.11)
0.05
(0.21)
0.08
(0.28)
0.15
(0.36)
0.2
(0.27)
Sesame 0.003
(0.05)
0.95
(0.23)
0.05
(0.22)
0
(0)
0
(0)
0
(0.05)
1.28
(2.27)
Tea 0.002
(0.05)
1
(0.05)
0
(0)
0
(0)
0
(0)
0
(0.05)
0.41
(0.58)
Tobacco 0.003
(0.05)
0.94
(0.23)
0.06
(0.23)
0
(0)
0
(0)
0
(0.05)
0.37
(0.79)
Wood 0.059
(0.24)
0.44
(0.5)
0.03
(0.17)
0.03
(0.18)
0.06
(0.23)
0.44
(0.5)
0.15
(0.27)
N (%) 3,496
(76%)
392
(9%)
172
(4%)
144
(3%)
424
(9%)
Note: All cells in commodity rows include means and standard deviations (in
parentheses). The final row describes the number of observations for each category
of the categorical export restriction variable described in the previous section.

99
4.1.2.3. Competing Explanations
Following the order of discussion in Chapter 3, the operationalization of key
competing explanations is described. First, the level of democracy is measured by
Marshall et al.’s (2017) Polity2 scores, running from -10 (autocratic) to 10
(democratic). I also interact two dichotomized Polity2 variables (with cut-off points
at scores of 5 and 6 respectively) with the population share variable to test whether
larger populations unfold their power primarily in democracies. Measuring political
connectedness of processors, producers, or traders is not pursued in the large-N part
of this thesis, due to the lack of adequate data across commodities, countries, and
time.
To test the importance of ethnic producer affiliation, I add a measure of whether a
crop is predominantly produced in the ruling ethnicity’s home region. I follow
Kasara (2007) in coding a coethnicity dummy, which takes the value of “1” if more
than 60% of a country’s commodity is produced in the leadership’s ethnic home
region. When this is not the case, or ethnicity is either not politically salient (i.e. in
Tanzania, Lesotho, Swaziland, Burkina Faso, and Madagascar after 2002) or
geographically strongly overlapping (i.e. in Rwanda, Burundi, and Mauritius) than
the dummy is coded as “0”. Fortunately, better and more transparent data to
construct this variable are available now than were available at the time of Kasara’s
study. To measure which ethnicity dominates the executive, I rely on the geo-
referenced Ethnic Power Relationship (Vogt et al. 2014; Wucherpfennig et al.
2011) dataset. Ethnicities identified in the EPR as holding a “senior partner”,
“dominant” or “monopoly” position in the executive are coded as the dominant
ethnicity in a country. A range of sources were used to locate where a commodity
is predominantly produced in a country. Geo-coded production data for cocoa,
cotton, sesame, tea, tobacco, and livestock were taken from Harvest Choice (2016).
Data on the sub-national distribution of cashew production across African countries
is derived from Rabany et al. (2015). Geo-coded forest occurrence data was
obtained from the FAO GeoNetwork (2018a) website and is described in more
detail in van Velthuizen (2007). Details on the number and geographic location of
diamond and gemstone mining sites and areas in Africa was collected from the U.S.
Geological Survey (Eros and Candelario-Quintana 2006; Taylor et al. 2009).

100
International Political Economy scholars, in contrast, would likely stress that
commodity-specific tariff escalations, international donor influence or the
economic orientation of governments should largely explain the observed variation.
To accommodate these hypotheses, I first construct a commodity-specific tariff
escalation variable which measures the average relative import tariffs on raw versus
(semi-) processed HS-6-level commodities across the four main African trading
partners: the EU, the USA, China and India. Data is sourced from UNCTAD’s
(2018) Trade Analysis Information System. The impact of donors and aid is
measured with WDI (2018) data on the ratio of ODA to GNI in a country. African
governments’ economic orientation is operationalized via the DPI’s (2001)
“Largest Government Party Orientation” variable (coded: 1 = right; 2 = centre; and
3 = left). Government parties coded by the DPI as ‘0’, (= party’s platform does not
focus on economic issues, or there are competing wings), which represents most
cases in the sample, are also coded as ‘2’.
Table 4.2. Summary Statistics for Variables Included in the Large-N Analysis
VARIABLES N Mean SD Min Max Exp.
Sign
Dependent Variables
Export Ban Introduction 4,184 0.0141 0.118 0 1
Ordinal Export Tax & Ban 4,628 1.619 1.264 1 5
Independent Variables
Population Share 5,771 0.786 2.483 0.000001 31.84 -
Polity2 7,665 1.639 5.440 -9 10 -
Executive Match 5,527 0.151 0.358 0 1 +/-
Tariff Escalation 7,642 1.136 5.971 -20 100.9 +
ODA (% of GNI) 7,552 10.10 9.594 -0.260 94.95 -
Ideology 6,676 2.196 0.613 1 3 +
Export Share 4,707 2.557 8.532 0 92.98 -
Processed-Raw Export
Ratio
4,595 969.7 60,593 0 4105170 +
Market Power 6,646 1.653 5.724 0 86.95 +/-
Factor Mobility 7,846 1.273 0.813 0 2 -
Industry (% of GDP) 7,734 25.06 11.16 4.556 77.41 +/-
GDP p.c. 7,654 1,674 2,175 161.8 11,926 +/-

101
Using export value data from the Economic Complexity Observatory (Simoes and
Hidalgo 2011) and trade volume and weight data (observed by importers) from the
UN Comtrade database (DESA/UNSD 2019), I create both country-commodity-
year-specific export share and market power variables. As indicated above, both
variables are lagged for one year throughout all models. Moreover, it might be that
governments tend to promote processing industries more if their economic
importance is comparable to that of raw producers. Specifically, I include a lagged
ratio of a processed commodity’s export share versus its raw export share. Note,
however, that this somewhat too simplistic a measure, given that African steel
factories (that feed on metal waste and scrap) usually produce for the domestic
market and as such in this measure would always appear weak economically, even
though they might be sizable. Unfortunately, in lack of a better alternative, this
variable will be used nevertheless. To account for different degrees to which the
factors invested intro producing a commodity are mobile, I include a simple
categorical variable, partly building on McMillan’s (2001) much more
sophisticated operationalization. The perennial tree crops cashew and cocoa
arguably have the lowest factor mobility and are thus coded as ‘0’. The production
of tea, tobacco, raw hides and skins, cotton is assessed as having medium levels of
factor mobility and thus coded as ‘1’. And lastly, switching from the production of
metal waste, timber, chromite, sesame, gemstones, and diamonds is arguably
comparatively feasible and coded as ‘2’. Finally, to test whether the level of
economic development of a country affects governments’ ability and motivation to
promote processing I include the World Development Indicator’s (World Bank
2018) measures for GDP per capita at constant 2010 levels in dollars as well as the
industrial value-added as a share of total GDP. Concluding, Table 4.2 presents
summary statistics and expected signs for all variables included in the analysis.
4.1.3. Model Specifications
Accounting for the binary structure of the core dependent variable, I estimate my
main models using logit regressions. To reflect the multi-level60 structure of the
60 Country-commodity-years are nested in country-commodities, which themselves are nested in
countries.

102
data, I run different types of models. First, as base models, I run simple bivariate
and multiple binary logit regression models with standard errors clustered at the
country-commodity level, respectively taking the form:
𝑙𝑜𝑔𝑖𝑡(𝑦𝑐𝑖𝑡) = 𝛽0 + 𝛽1𝑥𝑐𝑖𝑡−1 + 𝑒𝑐𝑖𝑡 (1)
𝑙𝑜𝑔𝑖𝑡(𝑦𝑐𝑖𝑡) = 𝛽0 + 𝛽1𝑥𝑐𝑖𝑡−1 + 𝛽2𝑧𝑐𝑖𝑡−1 + 𝛽3𝑧𝑐𝑡 + 𝑒𝑐𝑖𝑡 (2)
where 𝑦𝑐𝑖𝑡 is the introduction of an export ban on commodity 𝑐 in country 𝑖 in year
𝑡; 𝑥𝑐𝑖𝑡−1 is the country-commodity-year specific population share lagged61 by one
year; 𝑧𝑐𝑖𝑡−1 are country-commodity-year specific competing explanatory variables
(where adequate, lagged by one year); 𝑧𝑐𝑡 are country-year specific competing
variables; and 𝑒𝑐𝑖𝑡 is the country-commodity-year-specific error term.
Second, I run a more complex within-between random effects model (abbreviated
REWB), building on the work of Rabe-Hesketh and Skrondal (2011: 153), Allison
(2009), and Bell et al. (2019). The core idea is to separately estimate independent
variables’ within-unit (as done by fixed effects) and between-unit effects by simply
including the unit-specific means and deviations for all time-varying variables. Four
advantages speak for this approach. First, whatever covariation between time-
varying variables and potential unobserved time-invariant confounders may exist is
now accounted for. Second, this comes without the (methodologically heavily
opposed62) loss of units of analysis without temporal variation, as would be the case
when fixed effects are applied to rare events – such as export bans. Third, it allows
us to observe whether within- and between unit effects differ from each other
(whereas unit fixed effects would ignore between unit effects). Finally, it provides
the ability to include random intercepts for various levels of clustering, hereby
accounting for the multi-level structure of the data and resolving problems of
unobserved heterogeneity and heteroskedasticity that might come with it. In short:
61 The commodity population share variable was lagged by one year (as well as two and five years
in the robustness checks). This is to counteract a potential problem of reversed causality, because
commodity output might drop in the year of an export ban, falsely letting us to believe that a smaller
working population share was associated with the introduction of the ban.
62 See (Beck and Katz 2001) for a longer discussion.

103
it combines the strengths of fixed- and random-effects models, while at least
partially compensating for their respective weaknesses. The model is specified as:
𝑙𝑜𝑔𝑖𝑡(𝑦𝑐𝑖𝑡) = 𝛽0 + 𝛽1(𝑥𝑐𝑖𝑡−1 − �̅�𝑐𝑖) + 𝛽2�̅�𝑐𝑖 + 𝛽3(𝑧𝑖𝑡−1 − 𝑧�̅�) + 𝛽4𝑧�̅�𝑖 + 𝛽5𝑧𝑐𝑖 +
𝛽6𝑧𝑖 + +𝑣𝑐𝑖 + 𝑢𝑖 + 𝑒𝑐𝑖𝑡 (3)
where 𝑦𝑐𝑖𝑡 is the introduction of an export ban on commodity 𝑐 in country 𝑖 in year
𝑡; 𝑥𝑐𝑖𝑡−1 is a series of time-variant independent variables measured at the country-
commodity-year-level; 𝑧𝑖𝑡−1 are time-variant independent variables measured at the
country-year-level; 𝑧𝑐𝑖 and 𝑧𝑖 are time-invariant variables measured at the country-
commodity and country-level respectively; 𝛽1 is the within-unit effect for country-
commodity variables (thus relying on variation within country-commodities over
time) and 𝛽2 is the between-unit effect (relying on cross-sectional variation across
country-commodities); 𝛽3 and 𝛽4 perform the same functions, yet for variables
measured on the country-level; 𝛽5 and 𝛽6 are the between-country-commodity and
between-country effects for each time-invariant variable 𝑧𝑐𝑖 and 𝑧𝑖 respectively; and
𝑣𝑐𝑖 is the random intercept for the country-commodity-level, 𝑢𝑖 the random
intercept for the country-level, and 𝑒𝑐𝑖𝑡 is country-commodity-year-specific error
term.
Furthermore, to show that the findings are also robust to fixed effects specifications,
I calculate a model including separate commodity-, country-, and year-fixed effects.
The commodity and country fixed effects control for any time-invariant
commodity-specific and country-specific characteristics respectively, whereas the
year-fixed effects control for any year-specific shock that might have affected all
country-commodities equally. The model takes the following form:
𝑙𝑜𝑔𝑖𝑡(𝑦𝑐𝑖𝑡) = 𝛽0 + 𝛽1𝑥𝑐𝑖𝑡−1 + 𝛽2𝑧𝑐𝑖𝑡−1 + 𝛽3𝑧𝑐𝑡 + 𝛿𝑐 + 𝜄𝑖 + 𝜆𝑡 + 𝑒𝑐𝑖𝑡 (4)
which is identical to model 2, with the addition of commodity fixed effects (𝛿𝑐),
country fixed effects (𝜄𝑖), and year fixed effects (𝜆𝑡). It also includes standard errors
clustered at the country-commodity level.
Finally, to test that commodities produced by larger shares of the population are
more likely to witness lower export taxes, and less likely to witness higher export
taxes and bans, I run a multinomial model:

104
𝑙𝑜𝑔𝑖𝑡(𝑦𝑐𝑖𝑡,𝑘) = 𝛽0,𝑘 + 𝛽1𝑥𝑐𝑖𝑡−1,𝑘 + 𝛽2𝑧𝑐𝑖𝑡−1,𝑘 + 𝛽3𝑧𝑐𝑡,𝑘 + 𝑒𝑐𝑖𝑡,𝑘 (5)
Which is identical to the multiple binary logit regression in Model 2, except that
each regression is run for four of the five categories of the export tax and ban
variable (with the exception of the ‘no tax’ variable, which serves as the base
category).
All models in the robustness checks are based either on model 2 or model 3,
depending on the complexity of the specifications.
4.2. Results of the Large-N Analysis
Based on the research design and data described in the previous section, this chapter
presents the results of the large-N analysis. It proceeds in three steps. The first
section shortly provides and discusses some descriptive statistics of the data. The
second section presents the main regression results. Thereafter the robustness of the
results is tested with a range of additional checks.
4.2.1. Descriptive Results
In addition to the descriptive statistics provided in the previous section, this section
will summarize some further key correlations and patterns in the dataset covering
the 12 bannable commodities. In doing so, two aggregations of the data are made.
First, commodities are divided into ‘agricultural crops’ and ‘other commodities’.
Second, I divide commodities into whether they account for a ‘low’ or ‘high’
commodity population share. As a cut-off point, I chose the producer population
share variable’s mean of 0.8%. Thus – on average across all available years for a
country-commodity – less than 0.8% of a country’s working-age population was
actively engaged in producing ‘low population share’ commodities, and more than
0.8% for ‘high population share variables’.

105
Table 4.3. Summary of Export Ban Introductions by Commodity Type and
Population Share (1988-2017)
Agricultural Commodities Other Commodities # of
Country-
Commod.
Low Pop.
Share
# of Ban Introductions: 7
# of Country-Commod.: 105
% of possible banned: 6.6
# of Banning countries: 3
# of Ban Introductions: 43
# of Country-Commod.: 153
% of possible banned: 28.1
# of Banning countries: 22
N = 258
(19.4%
banned)
High
Pop.
Share
# of Ban Introductions: 0
# of Country-Commod.: 35
% of possible banned: 0
# of Banning countries: 0
# of Ban Introductions: 3
# of Country-Commod.: 11
% of possible banned: 27.27
# of Banning countries: 3
N = 46
(6.5%
banned)
# of
Country-
Commod.
N = 140
(5% banned)
N = 164
(28% banned)
N = 304
(17.4%
banned)
Source: Own illustration based on EPTA dataset and own collection and estimation
of country-commodity-year population shares. For a full list of all export bans
covered by the data set see Appendix 2.1.
In Table 4.3, we count the number of country-commodities (e.g. tea in Kenya or
cocoa in Ghana) that fall into each of the categories as well as the number and
percentage of those that experienced an export ban over the last three decades. This
produces a range of interesting patterns. First, over 84% of country-commodities in
the sample have low population shares. This is partly due to the result of a relatively
broad sampling method. In this study of the sub-sample of 12 bannable
commodities, every country-commodity that was captured by the UN Comtrade
database as having been exported in the study-period was kept in the sample. With
the database usually picking up even very small export quantities, many country-
commodities some might not deem relevant (because they do not reach the
economies of scale to be profitably processed) were captured here nevertheless. For
an illustration of the frequency distribution of country-commodities across different
degrees of the population share variable for the four categories depicted in Table
4.3, see Appendix 4.3.

106
Figure 4.1. Number of Export Bans Introduced by Country and Commodity Type
since 1988
Source: Own illustration based on EPTA dataset.
Second, 46 out of the 53 total introduced export bans on the country-commodities
under study were imposed on commodities other than agricultural crops. Only
seven agricultural crops were thus banned in the last 30 years. As illustrated in
Figure 4.1, one of these is the Kenyan cashew ban, another a ban on seed cotton
export in Niger, and the remaining five are the consequence of a blanket ban on
agricultural exports in Guinea in 2007.63 This highlights again how rare bans on
agricultural crops are.64
63 The findings of the subsequent regression analysis stay robust to excluding Guinea from the
analysis. Compare Model 23 in Appendix 4.7, using a multilevel within-between RE model.
64 Given the theoretical argument, why are there not more cases of bans of processable agricultural
crops with low population shares? The answer, in my view, has to do with the covariation of
production volume, economic feasibility, and employment in agriculture, and how this differs from
other commodities. As detailed in Chapter 2.4, to be economically viable, processing industries
require a certain amount of raw supply. Given that raw production is very labour-intensive in the six
agricultural commodities under study, usually by default agricultural crops that have crossed the
production volume required to even think about promoting an industry (e.g. via a ban) also have a
high labour share. Or to put it differently: agricultural commodities that account for a low share of
the population are usually too small to allow viable processing. Thus, it does not make sense to
impose a ban on them. This is different particularly for the very heavily restricted commodities, like
timber, metal waste, or hides, that generally do not employ many people (also compare Table 4.4 or
Table 2.2). Whereas 30,000 small holders produce barely enough cocoa to run one single cocoa
factory sustainably, less than 5,000 loggers can successfully feed around a dozen sawmills. The
political argument of the thesis together with the economic feasibility criteria set out in Chapter 2.4
provide a clear explanation why (1) the vast majority of bans are imposed on commodities produced

107
Table 4.4. Summary of Export Ban Introductions by Commodity and Population
Share (1988-2017)
Pop. Share Nr. of Countries
that Introduced a
Ban
Nr. of
Producing
Countries
% of
Producers
that Banned
Cashew Low 2 17 11.76
Cashew High 0 5 0
Chromite Low 1 6 16.66
Chromite High 0 0 NA
Cocoa Low 1 13 7.69
Cocoa High 0 5 0
Cotton Low 2 20 10
Cotton High 0 10 0
Diamonds Low 0 14 0
Diamonds High 0 7 0
Hides & Skins Low 7 35 20
Hides & Skins High 0 0 NA
Metal Waste Low 12 34 35.29
Metal Waste High 2 2 100
Sesame Low 1 14 7.14
Sesame High 0 6 0
Prec. Stones Low 3 32 9.37
Prec. Stones High 0 1 0
Tea Low 0 17 0
Tea High 0 5 0
Tobacco Low 1 24 4.16
Tobacco High 0 4 0
Wood Low 19 32 53.12
Wood High 1 1 100
Note: The threshold between a low and a high population share is set as in Table
4.2, namely that more or less than 0.78% of the working population produces a
country-commodity.
Source: Own illustration based on EPTA dataset.
Finally, looking at Table 4.3. one might notice that three of the 11 commodities
falling into the ‘other commodities’ and ‘high population share’ categories are
banned, going against the logic of the thesis. Neither of these three cases – bans on
metal waste and scrap in Angola and South Africa, and the previously discussed
by a small share of the population and in turn (2) why the vast majority of these bans are imposed
on commodities other than agricultural crops.

108
2010 export ban on raw logs in Gabon – should, however, be considered
prototypical high population share commodities. Importantly, the population shares
of these commodities do not exceed the 0.8% sample mean and threshold by much,
accounting for 0.85%, 1.08%, and 0.95% respectively. This, on average, is four
times lower than the average population share (4.2%) of the 35 ‘high population
share’ agricultural country-commodities in the sample.
Concluding, this descriptive overview substantiates two patterns and arguments
from previous chapters in the thesis: first, agricultural crops are much less likely to
be banned than other processable commodities; second, and highly correlated,
commodities that account for a low population share are much more likely to be
banned at export than those that account for high shares. Table 4.2 further confirms
this pattern, however, disaggregated by commodity. The subsequent section will
then provide for more rigorous testing of these correlations, controlling for potential
confounding variables and operationalizing the population share variable
continuously rather than dichotomously.
4.2.2. Regression Results
The first part of the large-N regression analysis is devoted to assessing the power
of the core independent variable – the country-commodity-year-specific population
share (hereafter population share) – in explaining variation in export ban
introduction propensity, holding other variables constant.
First, to analyse whether there is a bivariate relationship between a commodity’s
population share and the propensity of facing an export ban, Model 1 (Table 4.5)
includes only these two variables. And indeed, we find that governments are
significantly (at the 1%-level of significance) less likely to impose an export ban
on a commodity the higher the share of the population producing it. Holding all
eleven control variables constant, Model 2, strongly supports this finding.
Specifically, transforming logit coefficients into odds ratios for easier
interpretation, we find that a one percentage point increase in the population share
variable highly significantly decreases the odds of an export ban introduction by
75.3%. This result contrasts strongly with the complete lack of significance of all

109
but two of the competing variables (factor mobility65 and industry as a share of
GDP).
Figure 4.2 helps to further illustrate this pattern by graphing the relationship
between a commodity’s population share and the propensity of witnessing the
introduction of an export ban (while holding all other variables constant at their
means). Apart from the finding that export bans are introduced relatively rarely, we
can see that the propensity of facing an export ban is declining rapidly with an
increasing share of the population affected. Whereas the probability of an export
ban introduction stands at around 1.6% for commodities produced by groups that
constitute a less than 0.1% population, the probability tends to zero after a
commodity employs more than 3.5% of the population.
The most rigorous test of the thesis argument, the multilevel within-between RE
model, provides strong evidence in its favour but also nuance towards its
functioning. Specifically, as depicted in Model 3, whereas the between-unit effect
of the population share variable on the likelihood of an export ban introduction is
negative (as predicted) and significant at the 5%-level of significance, the within-
unit effect (while also negative) is very low and distant from any acceptable level
of significance. Arguably, this should be expected. The share of the population
producing a certain commodity does not usually change strongly over time,
especially not in a span of fewer than twenty years that the data covers for most
variables. Accordingly, and in line with the cross-commodity patterns outlined in
Chapter 2, we should expect the association between the population share and the
two export measures to be driven by between-commodity rather than within-
commodity variation. Overall, the population share’s power of explaining export
ban variation between country-commodities is striking: the odds of the government
to introduce an export ban on a commodity are 79.9% lower for a commodity that
is produced by a one percentage point larger share of the population than that of
another commodity.
65 Against expectation, higher factor mobility in producing a commodity is associated with a higher
risk of a commodity facing an export ban significant at the 1%-level of significance. It could be – in
line with the thesis argument – that producers of commodities with lower factor mobility have
particularly high stakes in its production (as they are stuck with it), would be especially aggravated
by a ban, and thus more likely to oppose it vehemently, which governments fear and will avoid.

110
Table 4.5. Results of the Main Large-N Analysis
(1) (2) (3) (4)
Bivariate
Binary
Multiple
Binary
Between-
Within
RE
Three-
Way FE
Population Share -1.25***
(0.40)
-1.40***
(0.47)
-1.31*
(0.74)
Population Share
(Between)
-1.60**
(0.77)
Population Share
(Within)
-0.09
(0.81)
Export Share 0.01
(0.03)
0.07
(0.04)
Processed-Raw Export
Ratio
-0.00
(0.00)
0.00
(0.00)
Market Power -0.00
(0.02)
-0.09*
(0.05)
Factor Mobility 1.06***
(0.27)
1.02***
(0.31)
2.61
(2.16)
Industry (% of GDP) 0.03***
(0.01)
0.13*
(0.07)
GDP p.c. -0.00
(0.00)
-0.00
(0.00)
Tariff Escalation 0.01
(0.02)
0.06**
(0.03)
ODA (% of GNI) 0.02
(0.03)
0.06
(0.06)
Ideology -0.26
(0.30)
-0.13
(-0.68)
Executive Match -0.57
(0.93)
0.61
(1.17)
Polity2 -0.05
(0.04)
-0.15
(0.15)
Constant -6.51***
(1.17)
-7.77***
(1.45)
-8.65***
(1.83)
-12.70*
(6.68)
lnsig2u
sigma_u
-1.35
(5.97)
CountID:
sd(_cons)
-0.78
(0.63)
ComID:
sd(_cons)
-12.33
(191665)
Observations 3170 2169 2169 1337
Pseudo R2 0.072 0.169 Robust standard errors clustered at the country commodity level in parentheses for
Models 1, 2, and 4. * p < 0.10, ** p < 0.05, *** p < 0.01. Time Polynomials are included
in all regressions. The between and within coefficients for competing explanations in
Model 3 can be found in Model 18 in Appendix 4.6.

111
Table 4.6. Results of the Multinomial Logit Regression Model
(5)
Multinomial Logit Model
Low Tax
(< 10%)
Medium
Tax (10-
30%)
High
Tax
(>30%)
Export
Ban
Population Share 0.18*
(0.10)
0.08
(0.18)
-2.39*
(1.37)
-3.37***
(1.22)
Export Share -0.00
(0.02)
0.01
(0.03)
0.03
(0.03)
-0.11
(0.08)
Processed-Raw Export
Ratio
-0.01
(0.01)
-0.00
(0.00)
-0.00
(0.00)
0.00
(0.00)
Market Power 0.05**
(0.03)
0.04
(0.03)
0.03
(0.03)
-0.01
(0.03)
Factor Mobility -0.08
(0.28)
0.16
(0.44)
0.96*
(0.50)
2.06***
(0.49)
Industry (% of GDP) 0.03
(0.02)
0.02
(0.02)
0.00
(0.02)
0.06***
(0.02)
GDP p.c. -0.00
(0.00)
-0.00
(0.00)
-0.00***
(0.00)
-0.00
(0.00)
Tariff Escalation -0.00
(0.02)
-0.01
(0.02)
-0.04
(0.03)
0.01
(0.01)
ODA (% of GNI) -0.07*
(0.04)
-0.03
(0.05)
-0.08*
(0.05)
-0.03
(0.03)
Ideology -1.16**
(0.48)
0.83**
(0.42)
-0.44
(0.59)
-0.27
(0.49)
Ethnicity 0.44
(0.53)
0.54
(0.76)
-0.37
(0.98)
-0.83
(0.64)
Polity2 -0.05
(0.05)
0.03
(0.07)
-0.02
(0.08)
-0.00
(0.05)
Constant 0.03
(1.19)
-5.17***
(1.03)
-1.78*
(1.01)
-4.72***
(1.55)
Observations 2244
0.177 Pseudo R2 Robust standard errors clustered at the country commodity level in parentheses. * p < 0.10,
** p < 0.05, *** p < 0.01. Category 1 ‘No Export Tax or No Export Ban’ serves as the base
or reference category.

112
Figure 4.2. Predictive Margins of Population Shares on Export Bans, 1988-2017
Source: Own illustration.
To provide a further test that these findings are not biased by omitted time-invariant
country and commodity variables, as well as year-specific shocks, Model 4
recalculates Model 2 with fixed effects for all three levels. Despite being unkind to
the number of observations – dropping from 2169 to 1337 – the coefficient remains
strong in the expected direction and significant at the 10%-level of significance.
Thus far, the empirical findings strongly support the core argument of the thesis:
African governments are less likely to impose export bans on commodities
produced by a larger share of their populations. A second hypothesis of the thesis
was that export bans were imposed less on larger producer populations than for
example low export taxes because they are much more visible and attributable in
their impact. More specifically, I hypothesized in Chapter 3 that trade policies more
obscure in their impact to producers, like low export taxes, should have a higher
propensity to be implemented on commodities the larger their population share. The
multinomial logit regression in Model 5 presented in Table 4.6 provides tentative
evidence that this is true. Holding all other variables constant, significant at the

113
10%-level of significance, a 1% increase in the population share producing a
commodity multiplies the odds of facing a low export tax rather than no tax or ban
at all by 19.5%. As expected, this effect decreases the higher – and thus more visible
for producers and less transferable for traders – a tax becomes. Operating in the
grey area of visibility, medium taxes of 10% to 30% are still more likely imposed
on larger groups, but with a low coefficient lacking statistical significance. High
taxes (over 30%), however, are significantly less likely to be imposed on large
producer groups. This provides tentative evidence that high export taxes behave
similarly to export bans: they are too visible (and thus risky) to be imposed on large
potentially threatening producer groups.
4.2.3. Robustness Checks
The findings thus far are consistent with the core hypothesis of the thesis. African
governments avoid imposing export bans the larger the group. The reverse appears
true for the introduction of low export taxes. To further substantiate this finding,
Appendixes 4.4 to 4.7 present a range of robustness checks employed on the basis
of the within-between RE model (3). First, to ensure that the results are not driven
by individual commodities, Models 6 through 17 (summarized in Appendix 4.4 and
4.5) each exclude one of the twelve commodities in the large-N analysis.
Importantly, the main association studied remains significant throughout all
models. Second, Models 19 and 20 in Appendix 4.6 lag the population share
variable by two and five years respectively, to provide a stronger control on the
threat of reversed causality. In both cases, the between-unit effect of the population
share variable remains strong and significant at the 5%-level of significance.
The possibility remains that the findings in Table 4.5 are driven not by the character
of the policy per se, but by regime type. In line with Bates and Blocks’ (2013)
argument, it could be that commodities produced by larger groups are banned less
only in democracies because of their empowerment through the presence or
introduction of the vote. I test this counter-hypothesis in Model 24 in Appendix 4.7
by interacting the population share variable with the Polity2 dummy that
distinguishes between non-democracies and democracies, with values of six and
higher indicating the latter. If correct, we should see that the interaction effect
coefficient is negative and significant when regressed on the introduction of export

114
bans in Model 23. We do not, however, with the interaction effect distant from any
acceptable level of significance.66
Chapters 2.4 and 4.2.1 also raised the point that low raw commodity production
volumes make processing less feasible due to low economic scales. Accordingly,
governments are likely to find banning country-commodities with low production
volumes less attractive. In the above-analyses, in principle, every commodity that
was exported at all (even if only US$ 1 worth of it) is included in the study. To
account for the above argument, in Model 22 in Appendix 4.6. I exclude the lowest
quartile of country-commodity-years in terms of production volume for each
commodity. Despite the significant loss in observations, the negative association
between the population share and export introduction propensity remains
significant at the 10%-level of significance.
Finally, I have argued in Chapter 2.4 that export bans are less sensible when the
government has strong control of a commodity’s production and/or marketing. This
is the case when the state produces all of a country’s commodity (e.g. via a
monopoly parastatal) or operates a monopsonistic marketing board, buying (and/or
selling) all of a commodity’s production. To account for this, I’ve created a list
(detailed in Appendix 4.8) of all country-commodity-years in which either situation
was a case, and excluded them from the regression in Model 21, Appendix 4.6.
Critically, the negative association between the population share and export
introduction propensity remains robust at the 5%-level of significance.
Overall, these findings provide strong empirical evidence for the assumption that
African governments are less likely to introduce highly visible export bans (and
heavy export taxes) on commodities produced by a larger share of the population;
and more likely to introduce less attributable low export taxes on commodities
produced by a larger share.
66 This finding is highly robust to replacing the Polity2 dummy with a continuous Polity2 variable
or choosing a different cut-off point for the dichotomization (i.e. five rather than six), as presented
in Appendix 4.7, Models 25 and 26.

115
4.3. Large-N Analysis Discussion and Conclusion
This thesis set out to answer the question why African governments introduce
export bans on some bannable commodities but not others. It advances the
hypothesis that governments fear imposing export bans on commodities produced
by a larger share of the population. Importantly, the impact of export bans is
extremely attributable, harsh, and affecting plural interests, and therefore carries the
threat that even larger population groups overcome their collective action problems
to unleash their numerical power. Vice-versa, I argued that low export taxes will be
more likely imposed on commodities produced by a larger share of the population,
as they are less visible to producers, and hence the conditions to overcome their
collective action problems are not in place.
To test this argument, data on country-commodity-specific export prohibitions and
employment were collected, allowing for a large-N comparative analysis of over
3,000 country-commodity-years, representing 12 commodities in 36 countries from
1988 to 2017 (depending on the country-commodity). Holding a large vector of
control variables constant and employing a range of different estimation strategies,
this analysis found strong and robust empirical support for the core hypothesis: a
one percentage point increase in the share of the working population gaining
significant income from producing a commodity, decreases the odds that the
government introduces an export ban on that commodity by over 75%. In contrast,
commodities produced by a larger population share are more likely to face a low
(and less visible) export tax. Together, these results provide robust evidence for the
argument that governments fear agitating producers who have more to lose and that
know who to blame.
Moreover, the analysis finds that this association between commodity population
shares and export measures is largely independent of the types of regimes they are
implemented by. Bates and Block (2013), among others, argued that larger
population groups are more likely to be spared from hurtful policies in democracies,
as they constitute important voting blocks that governments cannot afford to agitate.
In autocracies, by extension, the ‘urban biased’ policies – including raw commodity
export bans – are assumed to persist. Insignificant interaction coefficients between
the population share and three different Polity2 variables, however, provide no

116
support for this assumption – at least not in the context of export bans or low export
taxes for the 12 bannable commodities in this analysis.
Concluding, the thesis’ large-N findings suggest that large group size can indeed be
a source of power for interest groups. Yet, whether it is deployed depends on the
character (particularly the attributability and severity) of the policy affecting them,
rather than the type of the political regime they function in. The scope of the data
and robustness of these findings for my sub-sample provide confidence in the
validity of this theoretical argument. Arguably, however, only careful, in-depth, and
preferably comparative process-tracing of specific case studies will allow to truly
unpack the mechanisms of the associations evidenced in this study, as well as shed
more light on the relative role of interest groups, particularly processors and traders.
Such an approach also allows covering for gaps in large-N data, such as for the
political connectedness of sectoral actors or the relevance of producer profit
margins. Accordingly, the next two chapters will test the theoretical argument on
six case studies employing two distinct qualitative comparative logics.

117
In addition to the quantitative design, two in-depth structured comparisons of six
distinct commodity sectors in three countries were conducted, accompanied by the
analysis of a range of other sectoral cases in the visited countries. The core function
of these two main comparisons is to provide an illustration of the theoretical
argument and deeper study of the key underlying mechanisms. Whereas the large-
N analysis demonstrates the external validity of the argument and allows to run
partial correlations to control the effect of specific omitted variables, a more
qualitative comparative approach allows to study and trace assumed mechanisms
closely, as well as being able to study the analytical power of omitted variables that
could not be operationalized for large-N research (Gerring 2007; Lijphart 1971;
Slater and Ziblatt 2013; Tarrow 2010; van Evera 1997). Finally, as detailed below,
a range of further commodities were studied during, before, and after fieldwork.
Although not presented in this dissertation as detailed structured tests of the thesis
argument, these were crucial in defining the economic scope conditions outlined in
Chapter 2.4. This chapter proceeds as follows. First, it describes the rationale
behind the case selection as well as the results of a preliminary medium-N analysis
conducted in that vain. Second, I present the key methodology of the two respective
cross-country-commodity comparisons.
5.1. Case Selection and Preliminary Medium-N Analysis
To identify potentially relevant cases, a rough preliminary medium-N comparison
of 45 country-commodities that had an export share of at least 0.01% in Côte
d’Ivoire, Ghana, Kenya, and Tanzania was conducted. The reasons for choosing
Côte d’Ivoire, Ghana, Kenya, and Tanzania were five-fold. First, the four countries
together contain all relevant commodity groups identified in initial analyses of the
EPTA dataset and summarized in Chapter 2.4. Second, they contained a range of
particularly promising cases for conducting paired comparisons, such as the failed
cashew ban in Ghana and the successful cashew ban in Kenya. Third, given the
Ghana and Côte d’Ivoire’s as well as Kenya and Tanzanian’s similar geographical
structure and commodity spectrum, interesting most-similar system design

118
comparisons were anticipated. Fourth, the countries’ economies are among the most
dynamic and diverse on the continent, hence, are particularly relevant for the
analysis of economic transformation in Africa. Finally, and most practically, given
their dynamism and good coverage, rough labour statistics for preliminary analysis
do exist for most product sectors, which is not self-evident in most African
countries.
The results of this rather crude medium-N exercise are summarized in Table 5.1.
Importantly, it focused exclusively on the correlation between the thesis’ core
independent variable (the ‘commodity producer population share’) and dependent
variable (export bans), rather than performing a more sophisticated medium-N
analysis such as a Qualitative Comparative Analysis (QCA). The reason for this
was two-fold. One, data on competing explanations was not yet collected for this
range of cases. Second, the idea of this analysis was primarily to be able to eye-ball
potential outliers that needed to be explained, and to identify which countries would
permit to study interesting cases that might allow rigorous comparative designs.
Commodities in the analysis were originally coded as to whether they employ over
0.5% of the total population and if the government had imposed an export ban or at
least relatively high export tax (>=20%) on them. “On-the-line” or typical cases
(coloured in black) are those where commodities employing more than 0.5% of the
population are not restricted or where those employing less than 0.5% of the
population are restricted. The reverse cases are coded as “Off-the-line” or deviant
cases (coloured in grey). Overall, out of 45 relevant export commodities 39 are on
the line and only six off the line.
Based on the medium-N analysis and preliminary desk research on the sectors
across the four countries, Ghana, Kenya, and Tanzania were chosen as fieldwork
sites for three reasons. First, the three countries covered all six outlier cases.
Second, as discussed above, these three cases covered all particularly frequently
restricted commodities – timber, metal waste, and hides. Third, the comparison of
the Ghanaian failed attempt to introduce an export ban on raw cashew in 2016 with
the successfully implemented and maintained ban on cashew and macadamia
exports in Kenya appeared to be a particularly suitable candidate for a most-similar
systems design comparison.

119
Table 5.1. Overview of Comparing Employment Size Against Export Ban Imposition Across Export Sectors (last 10 years)
Unprocessed Product Côte d’Ivoire Ghana Kenya Tanzania
Cashews Low Tax – High Pop % No Restr. – High Pop % Prohibition – Few Prod. Low Tax – Many Prod
Cocoa beans Low Tax – High Pop % Low Tax – High Pop % Irrelevant No Restr. – Few Prod.
Coffee Low Tax – High Pop % Irrelevant No Ban No Restr. – High Pop %
Cotton No Restr. – High Pop % No Restr. – High Pop % Irrelevant No Restr. – High Pop %
Fish No Restr. – High Pop % No Restr. – High Pop % Prohib – High Pop % Prohib – High Pop %
Gemstones Irrelevant Irrelevant Irrelevant Prohibition – Few Prod.
Diamonds Irrelevant No Restr. – High Pop % Irrelevant No Restr. – Few Prod.
Gold No Restr. – High Pop % No Restr. – High Pop % Irrelevant No Restr. – High Pop %
Hides and Skins Irrelevant Irrelevant High Tax – Low Pop %. High Tax – Low Pop %
Horticulture No Restr. – High Pop % No Restr. – High Pop % No Restr. – High Pop % No Restr. – High Pop %
Macadamia Irrelevant Irrelevant Prohibition – Low Pop % Irrelevant
Metal Waste and Scrap Prohibition – Low Pop %. Prohibition – Low Pop % Prohibition – Low Pop % Prohibition – Low Pop %
Oil No Restr. – Low Pop % No Restr. – Low Pop % Irrelevant Irrelevant
Fruits: Pineapple & Mango No Restr. – Low Pop % No Restr. – Low Pop % Irrelevant Irrelevant
Palm Oil No Restr. – High Pop % No Restr. – High Pop % Irrelevant Irrelevant
Timber Prohibition – Low Pop % Prohibition – Low Pop % Prohibition – Low Pop % Prohibition – Low Pop %
Tea Irrelevant Irrelevant No Restr. – High Pop % No Restr. – High Pop %
Tobacco Irrelevant Irrelevant Irrelevant No Restr. – High Pop %
LEGEND Fit Misfit Irrelevant (export share <
0.01%

120
Consequently, I conducted eight months of fieldwork in these three countries
throughout 2017. Specifically, from March to May in Ghana, July and August in
Tanzania, and October to December in Kenya. As summarized in Table 5.2 below,
out of a total potential analysable 34 country-commodity sectors at least two
interviews were conducted on 18 of them and more than 10 interviews in nine of
them.
In general, interviewees were the main source of information and chosen from eight
groups: producers, traders (middlemen and exporters), processors, donors and
NGOs, government officials, consultants, and journalists. In total, over 250
interviews were conducted. Key sectoral actors among these groups were identified
and contacted by email prior to arrival in the respective countries. Emails were
rarely replied and once in the country potential interviewees were therefore called
or offices visited where these were available. Otherwise, snow-balling from
different entry points – preferably starting from distinct industry association CEOs
– was extremely effective in achieving large, relevant, and balanced67 sectoral
coverage in the more deeply studied cases. Apart from interviews, several hundred
newspaper articles – often among the few resources at hand apart from interviews
– were evaluated during this study. Particularly helpful were the rare academic
papers on country sectors and particularly the occasional donor, consultancy, or
NGO reports. Data sources for the respective case comparisons are discussed in
more detail below.
In each country stay first all outlier commodity cases were studied until clarity on
their deviance was achieved. These specific findings were crucial elements to
inform the economic feasibility scope conditions in Chapter 2.4. The analysis of
petroleum oil helped me to understand that close state control of a commodity pre-
empts the necessity to employ a ban on it. The relatively higher profit margins of
good-looking raw pineapples versus them being cut informed the third factor in the
feasibility discussion. Cocoa bean production in Tanzania is at an extremely low
67Running the risk of sampling from specific networks rather than the larger population, snowballing
can be prone to selection bias (Biernacki and Waldorf 1981). Therefore, in each major case study I
targeted several and unrelated starting points and referral chains, hereby, reducing the risk of
network specific selection bias.

121
5,000 tons a year, far below running a profitable processing company (at least
30,000 tons utilization). This informed the economies of scale argument.
The case for diamonds illustrates the role of market power in processing success.
Tanzania could ban the export of diamonds and set-up a lapidary. This, however,
would be extremely expensive and – as we know from the now struggling
Botswanan diamond sector case – uncompetitive. Tanzania, in contrast to
Botswana, is such a small diamond producer that given its poor cutting quality at
much higher prices would simply be ignored on the international market. Here,
banning would imply a decades-spanning if not a permanent loss of revenue and
foreign exchange, which is the reason the diamond lapidary program was given up
in Tanzania initially in the early 1990s (and one reason why the market power
variable was included in the large-N analysis).
Table 5.2. List of Commodities in Which Field Research Was Conducted
Country Sector Nr. Of
Interviews
Travel to Sub-National
Region (outside Capital)
Ghana Cashew 42 Brong-Ahafo
Cocoa 15 Tema
Metal Waste & Scrap 9 Tema
Timber 11 Brong-Ahafo, Kumasi
Gold 2
Oil (Outlier) 2
Fruits: Pineapple &
Mango (Outlier)
2
Kenya Cashew 32 Coast
Macadamia 26 Central & Eastern Province
Tea 15 Central Province & Mombasa
Tanzania Hides and Skins 39 Mwanza & Moshi
Gemstones/Tanzanite 30 Arusha & Merelani
Fish (Outlier) 10 Mwanza
Gold 10 Mwanza
Cashew 5
Diamonds (Outlier) 5 Arusha
Cocoa beans (Outlier) 2
Total 257

122
Finally, the ban on fish in Tanzania. At the outset this ban appeared puzzling in
light of the theoretical argument, as many Tanzanians fished. The field research in
Dar es Salaam and Mwanza uncovered however that the ban was placed exclusively
on unprocessed Nile perch exports from Lake Victoria. The reason for the ban was
to stop Kenyan fishing boats from fishing in Tanzanian waters for the new Nile-
perch processing factories on the Kenyan side of the lake and to create a processing
industry in Tanzania instead. Importantly, Nile perch fishing at that point in
Tanzania was minimal, with less than 5,000 people fishing for a small domestic
market – not exports. As such, the ban did not target or negatively affect them. In
fact, it is only through the demand of the processing factories created through the
ban that the now large68 Nile perch fishing sector emerged in Tanzania. As such,
this case as well is consistent with the theoretical argument of the thesis:
governments ban commodities for processing promotion reasons if this does not
negatively affect the incomes of large producer groups.
5.2. A Joint Method Comparison of Nut Export Bans in Ghana and
Kenya
Presented in Chapter 6, the first major structured comparison conducted is that of
Ghanaian cashew and Kenyan cashew and macadamia. This comparison is a
particularly good test of my argument for two reasons. First, the Ghanaian cashew
ban is one of the few cases where a government introduced a ban on a commodity
and withdrew it (almost instantly). This allows for a much clearer and dynamic
analysis of export ban policy-making. Had the Ghanaian government never
implemented the ban (for the same reasons it eventually withdrew it), it would have
been much harder to distil exactly what it was that prevented them from doing so.
Explaining non-events is difficult in general. Was it really the potential of mass
protest, or perhaps other economic or political factors? One would have to rely
68 In fact, the sector is now decreasing due to overfishing (particularly due to the use of close-meshed
nets that catch fish before they can breed).

123
wholly on the perceptions of policy-makers and other potential actors. Gladly, in
this case we have several visible events that shape the eventual outcome of the
withdrawal of the export ban. This gives us a clear indication that economic factors
likely did not prevent the government from imposing the ban in the first place. More
importantly, it allows me to trace exactly which events and actions by relevant
players in the sector led to the withdrawal of the ban, providing a rare opportunity
to demonstrate the risk of implementing a ban on a large group of producers, and
why most governments avoid doing so.
Second, although the Ghanaian case study is powerful by itself, the Kenyan nut
sector ban provides a good comparison for further testing. The cases differ on their
independent and dependent variables: Ghanaian cashew producers have a relatively
high population share – Kenyan do not; The Ghanaian government withdrew the
ban on cashews – the Kenyan did not. Looking at the same commodity, a large
range of potential competing explanations and confounders are held constant.
However, usually, most paired comparisons are not perfectly similar on all potential
competing explanations, thereby reducing the strength of the test and credibility of
the findings. For example, given that cashew production in Ghana is higher than in
Kenya, the former also has more global market power in that commodity than the
latter. Although the difference is not large and theoretically it is ambiguous whether
this factor matters, it could, which opens a weak spot for the test. Although process
tracing and basic reasoning could potentially compensate for this weakness, Mill’s
‘Joint Method’ provides an additional correlational strategy. Specifically, Mill in
such cases recommends that one should add another case that is identical to one of
the two cases on the independent and dependent variables yet differs on (the)
potential confounder(s). These criteria hold for the Kenyan macadamia sector.
Employment is similarly limited as in cashew; the ban was implemented for both
cashew and macadamia at the same time. Importantly, however, as one of the three
largest macadamia producers in the world, unlike Kenyan cashews, the sector has
considerable global market power. Thus, following the logic of a Most-Different-
Systems-Design (MDSD), the variation in the potential market power confounder
across the two Kenyan nut cases cannot explain the non-variation in their dependent
variables (the ban) and can therefore logically be precluded as a necessary

124
condition. Taken together, these three cases thus represent a good small-N method
for probing the explanatory power of hypotheses.
Semi-structured interviews, particularly elite-interviews, were the key source of
data for this chapter. Overall, over 105 formal semi-structured interviews were
conducted, with most of them (100) in the Ghanaian and Kenyan nut sectors. As
depicted in Table 3.5 below, interviews were conducted relatively evenly across 12
distinct groups (see Appendix 6.1 for a more detailed list of interviews in the three
sectors). Similarly, newspaper articles and often-detailed donor, government, and
consultancy reports have been crucial sources for data triangulation.69
Third, I further triangulated the interview- and document-based sources with
statistics from internationally recognized data banks like the UN Comtrade dataset
(2019) or FAOSTAT (2018a). These sources provide relatively fine-grained
statistics on trade, production, and prices of raw commodities. If available, they
prove to be of high value. Mirror trade data is particularly powerful. African
countries often face significant problems with reporting their commodity exports,
making domestic and global value chain analyses difficult. Importing countries,
however, tend to fare much better in this regard. Accordingly, looking at the global
import statistics for Kenyan cashews, for example, allows us to estimate trade
patterns (especially of raw versus processed) and production trends despite lacking
domestic numbers.70
69 Among these, reports and statistics from responsible government agencies (like the Nuts and Oil
Crops Directorate in Kenya) as well as donor reports (particularly by the GIZ ComCashew project
in Ghana) were of importance. Academic journal articles on these sectors are extremely rare and
when they do exist, often published in journals of questionable quality (sometimes only consisting
of one volume). As such, the often-detailed unpublished reports and surveys of some donors or
consultants have been the most important secondary source material employed throughout this
chapter. Of similar importance are newspaper articles. While of varying quality, through
interviewing several actors on the ground across space and time, they often provide important
insights into and snapshots of price and production patterns where government agencies or
interviewee’s memories fail to do so.
70 Unfortunately, however, international data bases tend to be patchy for many commodities. For
example, trade data on macadamia disaggregated by processing step only exists since 2007 or 2012
(depending on the data source), given its neglect in previous versions of the Harmonized System.
Similarly, FAOSTAT lacks price data for more country-commodity-years than it can offer, and
production data can be highly inaccurate, which – as researched in the Kenyan cashew case – is
often due to inexistent or understaffed government agencies in the reporting countries.
Consequently, price, production, and trade data has also been collected through the above-named
data sources. Comparing the numbers and their credibility, the most adequate data sources were

125
Table 3.5: Overview of the Interviews Conducted for the Nut Case Studies
Country Sector Type of Interviewee Nr. of Interviews
Ghana Cashew Donor/IO 6
Farmer 4
Farmer Association 1
Government 6
Politician 2
Processor 5
Processor Association 1
Researcher 4
Trader Association 1
Trader/Exporter 5
Umbrella Association 7
Total in Cashew Sector in Ghana 42
Kenya Cashew Consultant 1
Farmer 3
Farmer Association 3
Government 7
Journalist 1
Trader/Exporter 1
Processor 3
Researcher 1
Cashew &
Macadamia
Government 4
Processor 7
Processor Association 1
Macadamia Consultant 1
Farmer 4
Farmer Association 5
Government 2
Trader/Exporter 4
Politician 4
Processor 5
Researcher 1
Total Across Nut Sectors in Kenya 58
Australia Macadamia Umbrella Association 1
Malawi Macadamia Consultant 2
Farmer Association 1
South
Africa
Macadamia Processor 1
Total Across Australia, Malawi, & South Africa 5
Total Across Nut Sectors and Countries 105
selected for presentation in this chapter. All are referenced, and as for price and production data in
the Kenyan nut sectors, detailed comprehensively in the Appendix.

126
5.3. A Most-Different-Systems Comparison of Export Bans on
Timber, Metal Waste, and Raw Hides in Ghana and Tanzania
Presented in Chapter 7, the motivation for the second comparison differs from the
preceding one. Whereas the nut comparison tries to explain why three very similar
country-commodity cases had such different outcomes in regard to the maintenance
or withdrawal of export bans; this comparison tries to explain why three very
different commodities – raw logs, metal wastes, and raw hides and skins (RHS) –
face the common outcome of being banned relatively frequently by African
governments. In fact, they represent the three most commonly banned commodities
in the EPTA dataset. Given that these commodities strongly shape the empirical
pattern motivating the thesis and to a significant extent the findings derived in the
large-N regression analysis, it is critical to study whether the thesis argument does
indeed hold here as well or whether alternative factors can explain their difference
to other (especially agricultural) commodities. For that purpose, I studied the
explanatory power of the thesis argument in relation to the 1995 raw log and the
2013 ferrous waste and scrap export bans in Ghana as well as the 2012 de facto
export ban (a 90% export tax) on raw hides and skins in Tanzania.
As for the nut comparison, semi-structured interviews were the key source of data
for this chapter (summarized in Table 5.3 and detailed in Appendixes 7.7 to 7.9).
Importantly, out of the 59 interviews, 25 were part of a structured survey with
livestock keepers in Northern Tanzania. The survey’s aim was to understand to
what extent livestock keepers in Tanzania (and sub-Saharan Africa more broadly)
receive money for the production of hides (and thus to what extent they are even
aware of and affected by severe export restrictions on raw hides and skins. The 25
livestock keepers were interviewed in five wards in northern Tanzania. I sampled
the wards by relatively randomly choosing villages on Google Maps that were
located within 30 to 60 minutes from my accommodation in Mwanza, Arusha, and
Moshi (also mapped in Figure 7.10 in Chapter 7.3). I picked two wards near Arusha
and Moshi each, and one near Mwanza (where I had stayed shorter). Together with
a local translator I drove to the respective wards and contacted every person with
livestock until I had conducted five interviews. All five wards taken together, only
seven people approached in this way were not available for an interview. The

127
interviews were usually conducted in Swahili and lasted around 20 minutes on
average. A copy of the interview guide in English can be found in Appendix 7.6.
The list of all interviews and the names of the wards can be found in Appendix 7.9.
Table 5.3. Overview of Interviews Conducted for the Timber, Metal Waste, and
Raw Hides and Skins Case Studies
Country Sector Type of Interviewee Nr of
Interviews
Ghana Timber Researcher 2
Consultant 1
Government 1
Processor 3
Trader/Exporter 2
Logger Association 1
Miller Association 1
Total in Ghana Timber Sector 11
Metal Waste Government 2
Dealer Association 2
Processor 3
Producer 2
Total in Ghana Metal Waste Sector 9
Tanzania Raw Hides
and Skins
Government 3
Leather Manufacturer 2
Leather Training School and Tannery 1
Livestock Keeper 25
Raw Hide Trader Association 2
Tanner 3
Tanner & Manufacturer Association 3
Total in Tanzania Raw Hides and
Skins Sector
39
Total Across Sectors and Countries 59

128
On 15 March 2016, the Ghanaian Minister of Industry and Trade imposed a
temporary export ban on raw cashew nuts (RCN) with the proclaimed aim of
supporting the processing industry. After only five days characterized by heavy
protest in the core cashew growing region as well as by his own party colleagues in
parliament, the Minister withdrew his ban. Seven years earlier, on the other side of
the continent, the Kenyan Minister of Agriculture shared a similar idea: he
prohibited all raw cashew and macadamia nut exports to protect the struggling
domestic nut processing industry. Despite these similarities, the two cases differ in
one fundamental aspect: the ban in Kenya remains in good order. This raises the
question: Why did the Minister of Trade and Industry withdraw the ban in Ghana
after only five days, whereas the Kenyan ban pertained so long? If political pressure
was crucial in the Ghanaian case, what was its basis and why did it not emerge or
succeed in Kenya?
This chapter utilizes the in-depth comparative analysis of this puzzling divergence
to test the explanatory power of the theoretical framework and the validity of
hypothesized mechanisms. It traces the processes that led to the implementation of
the two bans as well as the dynamics around the divergent outcomes in the three
cases. Intriguingly, the actual implementation and withdrawal of the ban in Ghana
provides a rare opportunity to study not only why a ban was never implemented,
but to trace the more tangible actions that led to a ban being withdrawn.
Overall, this comparative analysis based on six months of fieldwork and over 100
interviews conducted in Ghana and Kenya finds strong support for the thesis
argument. Throughout all three cases, traders informed and organized farmers
against the ban, which were very receptive to these campaigns given the severity of
the ban. Importantly, however, only in Ghana did this collective action translate
into a serious threat to politicians and policy-makers, leading them to withdraw the
ban. I show that the crucial difference between the three cases is the relative number
of people that were affected by the ban. Whereas the actual and potential agitation
129
of 100,000 cashew farmers in Ghana created a significant electoral threat to ruling
party politicians during an election year, the less than 10,000 farmers in the
respective Kenyan nut sectors failed to generate any tangible concern for
politicians, which thus have consistently ignored their concerns.
As discussed in Chapter 5.2, a further significant advantage of the comparative
analysis of these three cases is that together they correspond near-ideally to a ‘Mill’s
Joint Method’ design. Combining elements from a most-similar systems design and
a most-different systems design, this comparison provides a useful test of the
argument, as it can preclude the explanatory power of most competing variables by
construction. Table 5.1 provides an overview of the cases and the design below.
First, we see that the condition variables hold through all cases as expected: export
bans caused high price depression, traders informed producers this should be
attributed to the government and helped organize them to protest against it. Second,
only where the share of the population gaining a significant share of their income
was high (i.e. in Ghana) did producers succeed in having the ban withdrawn.
Throughout the rest of the table we can see that competing variables are either very
similar between Ghanaian cashew and one or both Kenyan nut cases, thus not being
able to explain the variation in outcome; or they vary between the Kenyan nut cases,
thus not being able to explain the same outcome in those two cases. In the following,
we will give a short overview of the explanatory power of the key competing
variables, before moving on to the in-depth analysis of the cases and the core
mechanisms.
Let us begin with the potential explanatory power of the economic variables
discussed in Chapter 3.2. First, we assumed that governments might spare
commodities from export bans (or withdraw them) the higher their export share as
well as market power and the lower their profit margins and factor mobility, in a
fear that these characteristics would increase the risk of killing the goose that lays
the golden eggs. None of these factors appear to hold much explanatory power.

130
Table 6.1. Overview of the Joint Method Design and Competing Explanations
Variables
Ghana Kenya
Cashew
(2016)
Cashew
(2009)
Macadamia
(2009)
Dependent Variable Ban
Withdrawal ✓ – –
Independent Variable High Comm.
Pop. Share ✓ – –
Condition Variables Producer
Mobilization
✓ ✓ (✓)
High
Attributability
✓ ✓ (✓)
High Price
Depression
✓ ✓ (✓)
Trader
Facilitation
✓ ✓ ✓
Competing
Expla-
nations
Economic71 High Export
Share
– – –
High Market
Power (-) – ✓
High Profit
Margins (✓) – (✓)
High Factor
Mobility
– – –
High
Development
(–) (–) (–)
IPE Trade
Agreement
WTO/No
EPA
WTO/No
EPA
WTO/No
EPA High Donor
Influence ✓ ✓ ✓
High Tariff
Escalation (✓) (✓) –
Left Gov.
Econ. Ideology
(–) – –
Politics Co-Ethnic
Pres. Region
– – ✓
High Relative
Political
Connection of
Processors
(✓) (✓) ✓
Democratic ✓ ✓ ✓
71 The nine differences in commodity value chain characteristics discussed in Chapter 2.1.2 should
also be incorporated here. I have not done so here because given that the three commodities are
identical or at least extremely similar, so are their value chain characteristics.

131
First, all commodities constituted for very low export shares in their respective
countries prior to the ban. Although production of cashew in Ghana is significantly
larger than that in Kenya, its export share is only at 2%, given the high export values
of oil and gold in Ghana. In step with these production differences, Ghana obviously
has higher market power in cashew than Kenya (4% vs 0.5%). However, it is neither
large, and more importantly, Kenyan macadamia at nearly 20% had a much larger
market power than Kenyan cashew, thus, precluding it as an explanation for a ban.
Factor mobility is also constant across these three commodities, all being tree crops
and all having producers relatively fixed to producing them. Finally, the pattern of
profit margins across the three cases strongly opposes the assumption that
governments are less likely to introduce (or maintain) a ban on commodity the
lower the profit margins. A relatively large Kenyan cashew farmer’s net profit from
growing cashews stood at only US$ 150 prior to the ban, over six times less than
the US$ 950 earned by the average cashew farmer in Ghana from cashew prior to
the 2016 ban imposition.72 Consequently, if the assumption were true that
governments were more likely to spare producers from hurtful export restrictions
on their produce the tighter their profit margins, we should have seen Kenya – not
Ghana – reversing its decision to implement the ban. In fact, the season after the
ban, producer prices dropped to levels close to US$ 0.2 per kg, at which profits
would have evaporated completely. And indeed, as described in more detail in
section 6.2, many Kenyan cashew farmers have therefore abandoned their trees,
72 For this exercise, let us compare two cashew farmers in Ghana and Kenya with 100 trees each.
Let us further assume that their average yields are at around 10kg per tree, which according to
different reports, appears as a solid average across time and space in these two countries (IDMS
2009; Kilifi County 2016; Muigai 2017; Kenyan Ministry of Agriculture 2009; ACi 2010, 2013;
ACi et al. 2015). The same is true for production cost. Based on said reports and interviews with
farmers, it is fair to say that the average annual production cost per tree in the last decade in the two
countries stood at around US$ 2. As such, the total annual production cost for a farmer with 100
trees in either country is around US$ 200. There was a significant difference on per kg farm gate
price between the two countries during the respective periods prior the ban however. In Kenya, the
average price stood at around US$ 0.35 in the 2008/9 season (FAO 2018b); in Ghana at US$ 1.15
in the weeks prior to the ban. Assuming 1,000 kg of total production in both cases, the average
annual gross income from cashew was US$ 350 in Kenya in 2008 and US$ 1,150 in Ghana in 2016.
Subtracting the production cost, the net income of a relatively large cashew farmer for Kenyan
relations was only US$ 150 prior to the ban, over six times less than the US$ 950 earned by the
average farmer in Ghana prior to the temporal ban. Note also that living costs at the (touristy) Coast
in Kenya are by no means cheaper than in the (rural) Ghanaian Brong-Ahafo region, if at all the
reverse is true. This is partly, although not proportionally, reflected in the cost of land: according to
interviewees in Brong-Ahafo, one acre of farm land there costs around US$ 125 – and around US$
1,000 at the Kenyan Coast according to interviewees there.

132
cutting them or leaving them to waste away. Nevertheless, the export ban on RCN
in Kenya remains in place – as do low prices and production. In contrast, in Ghana,
margins were as good as never before, confirming what ministerial policy-makers
said. And even a permanent drop to US$ 0.63 (as in the days after the ban) would
have still implied nearly three times the net income of Kenyan farmers prior to the
ban. Considering this comparison, it becomes difficult to see the explanatory power
of a margins-based argument.
The second set of explanations are generated from the IPE literature. First, with
both countries being part of the WTO and neither having signed an EPA with the
EU at the time of their ban introductions, trade agreements cannot have played a
differential role (which was confirmed by interviews with numerous government
officials in both countries). Second, it is unlikely that donors influence can explain
why Ghana withdrew its ban. First, on a more general comparative level, Kenya
and Ghana in 2009 and 2015 respectively had almost identical (and not extremely
high) shares of ODA in their GNIs (4.82% and 4.85%). This, therefore, does not fit
to the variation on the (non-)maintenance of the ban. Second, and more important,
the key donor-funded projects in the sector – ComCashew/ACi (GIZ) and the ACA
(USAID), which both actively push for cashew processing promotion across Africa
– were generally in favour of the temporal export ban, and disappointed by its quick
demise.73 Similarly, tariff escalation does not seem to have played any role in the
two country’s processing-related considerations. Apart from not having been
mentioned by any interviewee as a decisive factor, it is also important that key target
markets for Kenyan and Ghanaian kernels do not escalate tariffs. The EU has for
long eliminated tariffs for African nut imports (whether in-shell or shelled). The
US, it appears had a minimal specific 5 cents per kilogram duty on kernel imports
(equivalent to only 0.3% tax), which was however eligible for duty free tax
preference under AGOA (USAID 2012: 5), and appears to be abolished now
(Department of Agriculture, Forestry and Fisheries (Republic of South Africa)
2016: 32). Finally, and yet again highly implausibly, the Ghanaian withdrawal of
the ban might be the result of an ideological change of mind. As discussed in
Chapter 3.2.2, more left-leaning countries – more open to statist intervention in the
73 Officer at ComCashew (GIZ), Accra, 23.03.2017; Senior Manager of ComCashew (GIZ), Accra,
22.05.2017; Senior Technical Officer of African Cashew Alliance, Accra, 11.04.2017.

133
economy – are more likely to implement severe export restrictions. Vice versa, less
left-leaning countries might be more prone to withdraw them. This, however, does
not fit the observed pattern. The economically relatively conservative Kibaki- and
later Kenyatta-led governments maintained the ban, whereas the social-democratic
and Nkrumahist NDC-led government in Ghana withdrew it. Moreover, the very
same government successfully implemented and maintained full export bans before
(e.g. on timber and metal waste and scrap exports implemented in the early 1990s
and in 2013 in Ghana).
There are three final political economy explanations which the joint method design
at least partially helps to preclude. First, as both countries are relatively stable
African democracies, this variable cannot explain variation in the two cases
(although democracy in these cases can be a relevant intermittent variable as I will
show in later sections). Similarly, the variation in outcomes does not fit the
similarity that both Ghanaian and Kenyan cashew farmers were and are not co-
ethnics of the president. What is more, macadamia farmers have been for the last
17 years, yet are equally banned as the non-co-ethnic coastal cashew farmers,
hereby precluding, that this variable is a necessary condition to explain export ban
patterns.
Finally, the discussion of a more elite-clientelist understanding of politics in
Chapter 3.2.1.3 generated the hypothesis that governments would be more (less)
likely to introduce a ban the more (less) connected processors are to them relative
to traders and producers. Applied to the cases at hand, we might assume that (a) the
ban in Ghana was withdrawn because producers and traders were more politically
connected to government officials than processors, and (b) that the bans in Kenya
were maintained because processors were more politically connected to the
government than producers and traders. There is some truth to this in the Kenyan
cases. Several cashew and macadamia processors are among the richest Kenyans
(e.g. Pius Ngugi and Peter Munga) and hold close personal relations with the current
and former presidents (Kenyatta and Kibaki, both Kikuyus, as are Munga and
Ngugi). As described in sections 6.2 and 6.3, these processors have used their
personal connections to both lobby for the ban and defend against attempts to
withdraw it. Although especially Chinese macadamia in-shell traders have likely
tried to influence politicians via informal means (as detailed in Section 6.3.4)
134
overall it is true that neither traders or producers in the Kenyan nut sectors were as
well-connected to government officials as processors. As such, it is certainly fair to
say that this can be a relevant variable. I argue, however, that it is not the most
important one. It is critical to note that lobbying attempts by fairly-well connected
raw cashew nut exporters in Ghana failed to thwart the ban in the first place. As
such, it is unlikely that political connectedness of traders suddenly explained why
the government withdrew the ban in the country. Following the same logic, it is
difficult to understand why a possible relative weakness of processors in Ghana
would explain the withdrawal of the ban, although they had originally out-lobbied
traders and producers (when successfully lobbying for the imposition of a ban).
Most importantly, through process-tracing, I show that the ban was withdrawn in
Ghana not due to the massive lobbying from traders or for a lack of processors
trying to protect it, but through the mobilization of producers by traders, which
consequently posed a threat to the electoral and thus political survival of the ruling
party.
This chapter proceeds in four parts. First, section 6.1 discusses the introduction and
rapid withdrawal of the export ban on cashew in Ghana. Section 6.2 then compares
this to the maintenance of the 2009 export ban on raw cashew in Kenya, whereas
section 6.3 does the same for Kenyan macadamia. All case studies follow a similar
structure. They first provide a short historical introduction into the origins of
production and processing, before discussing why the desire for a ban emerged.
After describing how the ban was implemented, detailed analysis and test of the
theoretical framework against the political processes following the ban is
conducted. Section 6.4 concludes with a summary of the findings and potential
policy implications.

135
6.1. Contentious Cashews and the Withdrawal of the 2016
Export Ban in Ghana
The cultivation of cashew in Ghana began in the early 1960s, around 400 years later
than in Kenya. Motivated by the creation of a further potential cash crop next to
cocoa which had the co-benefit of preventing desertification, the Nkrumah
government sporadically introduced cashews seeds in the Greater Accra and
Central regions, later spreading to the centre-north of the country, particularly to
the Brong-Ahafo region (see Figure 6.1 below). Low producer prices,
underdeveloped market structures, inadequate extension services, and the absence
of a clear sectoral policy plan, however, had made failed to make the crop attractive
to most farmers. By the 1970s and 1980s, the few farmers that had planted it became
disillusioned by the crop and cut down their trees to make way for cocoa and other
food crops or simply abandoned them, leaving them to be destroyed by bushfires or
fuel collectors (Agbley 2016: 27). In contrast to the thriving cashew production and
processing sector in East Africa (particularly Mozambique, Tanzania, and Kenya),
low volumes in Ghana foreclosed any public or private attempts of setting up a
cashew processing industry.
The desire of the PNDC-Rawlings government to diversify the export base of the
economy led to a renewed interest in cashew in the late 1980s. The coincidence of
three trends – the massive increase in global demand for cashew nut as snack food;
the establishment and liberalization of commodity markets in Ghana through the
PNDC’s Economic Recovery Programme (ERP); as well as the recurrent losses of
cocoa plantations in the Brong-Ahafo region to bush fires – increasingly motivated
farmers in the region to re-invest their labour, time, and money into the
rehabilitation or expansion of their low-maintenance and more drought-resistant
cashew plantations (ACi et al. 2015: 10; Parliament of Ghana 17.03.2016).
Moreover, it is noteworthy that cashews are sold in the “hungry season” when no
other crops are available, hereby being a particularly important and attractive
income stream. As a result, Ghana recorded its first export of 15 tons in 1991,
quickly expanding to 3,000 tons in 1995 and 5,000 tons at the turn of the
millennium.

136
Figure 6.1. Map of Ghana and the Main Cashew Area in Brong-Ahafo Region
Source: Own Illustration based on Map from Central Intelligence Agency (2019)
This relatively rapid expansion of cashew cultivation encouraged the Ministry of
Food and Agriculture (MoFA) to initiate and implement the six-year Cashew
Development Project (CDP) in 2002, supported with a credit of US$ 13.32 million
by the African Development Bank (Ministry of Food and Agriculture of Ghana
2010: 23). Overall, during the time of the project, the area under cultivation

137
increased from 18,000 ha to 70,000 ha and RCN production increased from 5,000
tons to an estimated 27,000 tons (Ministry of Food and Agriculture of Ghana 2013).
Figure 6.2. Ghana Total RCN Production, 1994-2016
Source: Own Illustration based on FAO (2018a).
As illustrated in Figure 6.2, cashew production continued growing beyond the end
of the CDP. Apart from soaring global cashew prices, particularly the GIZ-led
African Cashew initiative (ACi, now ComCashew) played a significant role in
promoting the sector thereafter. The initiative represents a multi-million effort to
boost cashew production and processing in Ghana, Benin, Côte d’Ivoire, Burkina
Faso and Mozambique. Launched in 2009, the ACi trained over 40,000 farmers in
Ghana and extended regular technical and business advice to five cashew
processing plants in the Brong-Ahafo region, among many other activities (ACi
2013: 2). In parallel, the USAID-funded African Cashew Alliance (ACA) – the

138
African cashew industry’s umbrella organization also based in Accra74 – has closely
advised the government and leading actors across the Ghanaian cashew value chain.
Table 6.2. List of Cashew Processors in Ghana and their Status in 2015
Nr. Company
Name
Installed
Capacity
(tons per
year in
RCN)
Utilized
Capacit
y in
2015
Location Ownership Status
May
2015
1 USIBRAS
Ghana Limited
35000
Prampram,
Greater
Accra
Brazilian Yet to
start
2 Rajkumar
Implex Ltd
15000
Techiman,
Brong-Ahafo
Indian Closed
3 Mim Cashew
and Agricultural
Products
Limited
7000 5000 Mim, Brong-
Ahafo
Danish/
Norwegian
Operat
ing
4 Chinese Factory 3000
Sampa,
Brong-Ahafo
Chinese Closed
5 Kona Agro
Processing Ltd
2000 1300 Awisa,
Brong-Ahafo
Ghanaian Closed
6 Muskaan Ghana
Limited
1500
Techiman,
Brong-Ahafo
Ghanaian Closed
7 Cashnut Foods
Ltd.
750
Faaman,
Brong-Ahafo
Ghanaian Closed
8 Innovative
Organic Cashew
600 200 Brong-Ahafo Ghanaian Closed
9 Winker
Investment Ltd.
500 250 Afienya,
Brong Ahafo
Ghanaian Closed
10 Kabile Coops
Cashew Farmers
& Processing
220 165 Kabile,
Brong-Ahafo
Ghanaian Closed
11 Nafana Agro
Processing Ltd.
120 81 Sampa,
Brong-Ahafo
Ghanaian Closed
12 Cocoa Research
Institute of
Ghana (CRIG)
100 50 Bole,
Northern
Region
Ghanaian Operat
ing
13 NASAKA
Cashew
Farmers' Coops
100
Nsawkaw,
Brong-Ahafo
Ghanaian Closed
Total 65890 7046
Source: Based on own research as well as Olympio and ComCashew (2015: 22).
74 The ACA describes itself as ‘platform and facilitator for advocacy, information exchange,
investment promotion and market linkages in the African cashew sector’ (Senior Communications
Officer of African Cashew Alliance, Accra, 11.04.2017).

139
As part of its facilitative role, it hosts the office of the Ghanaian cashew sector
umbrella association, the Cashew Industry Association of Ghana (CIAG). Spurred
by a combination of these donor and government efforts as well as increasing global
cashew prices, cashew production had risen to nearly 80,000 tons in 2016, with
around 90,000 to 100,000 farmers (mostly small-holders) producing it (Addaquay
2016: 7)
In line with rising volumes, cashew processing in Ghana experienced a steady rise.
In 2008, 11 small-scale and one medium-scale processor operated in the country,
with a small total installed processing capacity of 2,136 tons of RCN per year, of
which they utilized only around 362 tons (17%) in 2009 (ACi 2010; Heinrich 2012:
4). Seven years later, in 2015, installed capacity had exploded to 65,890 tons per
year. Two large-scale processors, Raj Kumar (15,000 tons) and USIBRAS (35,000
tons), had set up shop in Techiman (Brong-Ahafo) and Prampram (close to Accra
and the Tema port) respectively. Moreover, most local processors had increased
their installed capacities, especially processing pioneers and long-term champions
of the sector, Mim Cashew Ltd., from 1,000 tons in 2008 to 7,500 tons today
(compare Table 6.2 for a list of all processors and their capacities in 2015). While
utilized capacity remained low at around 20% in the early 2010s, processors in
Ghana appeared optimistic.
This optimism and interest in processing in Ghana was based primarily on two
factors. First, Ghana was having a relatively good and stable business environment,
in which assets would be secure (USIBRAS’ state of the art factory cost around
USD 25 million). Second and perhaps more importantly, Ghana is a major trade
hub for cashews in West Africa. Whereas the country produced around 42,000 tons
a year, it exported an estimated 200,000 tons in 2013 through its ports in Tema and
Takoradi (Frimpong 2016).75 Up to 2013, this stream of goods was becoming larger
every year, due primarily to the stellar increase of the crop in Côte d’Ivoire from an
estimated 80,000 tons in 2003 to over 500,000 tons in 2013, of which up to 150,000
tons was exported through Ghana (ACi et al. 2015: 52). While most of this stream
(as well as of the domestic Ghanaian production) was bought by raw exporters in
Ghana (mostly right at the border), it was widening to such a rapid and strong extent
75 This is part of the reason why it is so difficult to estimate the size of the Ghanaian RCN crop.

140
that these exporters could not keep up with building warehouses and recruiting
buyers to buy all the incoming crop.76 Through this steadily increasing oversupply
or remainder of mainly Ivorian crop Ghanaian processors were able to source
cashews, making them confident of a sustainable future for their factories in Ghana.
Consequently, neither the processors nor the government saw a need to implement
any radical protective measures for the industry, such as an export ban. As long as
the Ivorian cashew stream was flowing and growing, there was room for processors
in Ghana.
6.1.1. Processors’ Plight and Farmers’ Delight: Soaring RCN Prices, the
End of the Ivorian Cashew Stream, and Growing Demands for
Processor Protection
The optimism of Ghanaian processor, however, was quickly displaced by dismay
in December 2013. As part of a grand restructuring and strengthening of cashew
sector governance, the Ivorian government in form of its new regulatory agency
(the Conseil du Coton et de l’Anacarde), banned all exports of RCN by road.77
Hereby, the Ivorian RCN oversupply the Ghanaian processing industry was living
from was cut off. Instead, Ghanaian processors had to compete against raw
exporters for the limited and expensive (because of its better quality) domestic crop.
What is more, the Ivorian road export ban coincided with a massive and ongoing
surge of world prices created by an insatiable global demand. Figure 6.3 illustrates
the doubling of FOB RCN prices from 2013 to 2017, whereas the 2017 farm gate
RCN prices sketched in Figure 6.4 demonstrate that cashew farmers in Ghana are
among the best earners in West Africa, particularly compared to their direct
76 Senior Executive of Major Cashew Processor, Mim, Brong-Ahafo Region, 25.04.2017; Senior
Manager for Olam International (Ghana), Accra, 20.05.2017; Medium-Scale Cashew Processor and
Senior Official of CIAG, Accra, 19.04.2017
77 Note though that it did not ban the exports by port. Thus, the goal of this cross-border ban was to
stop the frequent smuggling (and thus also loss of tax revenue) rather than promoting processing at
large. If that was the goal, a total export ban would have been required. That being said, this was
considered in Côte d’Ivoire as well, although actors that also work in the Ivorian cashew sector told
me the government abstained from this for the very reason that it feared a potential backlash of such
a severe policy from the around one million people in Côte d’Ivoire farming cashews.

141
neighbours in Côte d’Ivoire and Burkina Faso (which helps to explain ongoing
RCN smuggling to Ghana).
Figure 6.3. RCN Price Per Ton (FOB Tema) in US$
Source: Data is derived from (ACi et al. 2015: 12) and (N'Kalo 2016, 31.05.2017,
17.08.2017, 30.05.2018)
The direct competition with exporters for the limited Ghanaian crop as well as the
massive increase of prices blatantly revealed the structural weaknesses of the
Ghanaian cashew processing industry. Above all the inability to finance the
(increasingly expensive) purchase of stock for one year within only three to four
months; higher production costs; no access to by-product markets; and no industrial
policy support from the government prior to the ban – domestic processors were
eventually outcompeted by exporters in buying RCN. Not only were exporters
through their extensive network of middlemen able to offer better prices than
processors, they would usually also pre-finance farmers and at certain times even
pick up the crop directly from the farm gate rather than from collection centres in
650750
550 575 575
800900
1350
950820
1000
1350 1400
2000
2004 2005 2006 2007 2008 2009 2010 2011 2012 2013 2014 2015 2016 2017
US
$/T
on
ne
Year
RCN Price per tonne (FOB Tema) in US$

142
villages and towns.78 In contrast, pre-financing was not an option for processors.
Constrained by the lack of financeable working capital and facing the high risk of
“cash and carry” exporters – that is, mostly individual Indian exporters that arrive
to Ghana on a tourist visa with the cash to fill up one container with RCN, buying
RCN directly at the farm gate at higher prices than most other buyers, given their
lack of major overhead costs – simply buying their pre-financed crop from
‘contract-breaking’ farmers, processors could not bear the cost of pre-financing.79
As a result of processors’ incapacity to access sufficient RCN, only two out of the
twelve Brong-Ahafo based factory’s (Mim Cashew and the Cocoa Research
Institute of Ghana’s small factory) were still operating by late 2015 (compare Table
6.2 above).
Given the dire situation of processors, a policy debate raged among key players in
the industry on how processors could be supported. When the attempt in March
2015 by a newly set-up “Pricing Committee” (headed by the Crop Directorate of
MoFA) failed to set a reference price for RCN trading at GHC 2,70 (US$ 0.75),
calls from bureaucrats, processors, and donors for export restrictions emerged.80 A
critical event was the meeting of all major actors of the Ghanaian cashew value
chain at a workshop on the development of a Masterplan for cashew production in
Ghana in late November 2015, organized by MoFA as well as the Ministry of Trade
and Industry (MoTI), and supported by ComCashew and the DANIDA-, USAID,
and EU-funded Business Sector Advocacy Challenge (BUSAC) Fund. At the
workshop, some processors suggested implementing an export window for RCN
from January to March in which exporting RCN would be prohibited, as well as
taxes on RCN exports and more rigorous trader licensing (ComCashew 2016: 11;
Diplomatic Call Online).
78 Manager of Cashew Trader Collection Centre, Techiman (Brong Ahafo Region), 26.04.2017;
Collection Centre Manager for Large Trading House, Wenchi, Brong Ahafo Region, 24.04.2017;
Senior Manager of Trade House Cashew Bulking Centre, Techiman (Brong Ahafo Region),
26.04.2017.
79 Senior Executive of Major Cashew Processor, Mim, Brong-Ahafo Region, 25.04.2017; Medium-
Scale Cashew Processor and Senior Official of CIAG, Accra, 19.04.2017
80 Senior Official of Ministry of Food and Agriculture, Crop Directorate, Accra, 13.04.2017; Former
Deputy Minister of MoTI and NDC MP, Accra, 29.03.2017; Crops Officer at Ministry of Trade and
Industry (MoTI), Accra, 06.05.2017

143
Figure 6.4. Average Farmgate Prices in West Africa 2017
Source: Data for Burkina Faso, Côte d’Ivoire, and Senegal is taken from N’Kalo
(31.05.2017). Price data for Ghana is based on ComCashew (2017: 11)
triangulated with price data generated from interviews and media articles from
March, April, and May 2017.
However, already diverging interests and opinions regarding such export measures
were clearly observable. Whereas processors, bureaucrats of MoTI and MoFA, as
well as the core donors involved in cashew were in favour of all three proposed
measures – which is evidenced by the policy documents they prepared for the event
(ACi et al. 2015; Olympio and ComCashew 2015) and was unequivocally
reaffirmed in interviews81 – farmers and traders (i.e. both middlemen and exporters)
were not82. Calls by processors for an outright ban of RCN exports was met by
vehement rejection from farmer leaders, such as in August 2015, when the president
81 Officer at ComCashew (GIZ), Accra, 23.03.2017; Senior Official of Ministry of Food and
Agriculture, Crop Directorate, Accra, 13.04.2017; Former Deputy Minister of MoTI and NDC MP,
Accra, 29.03.2017; Senior Official for Industrial Development at MoTI, Accra, 06.05.2017; Senior
Executive of Major Cashew Processor, Mim, Brong-Ahafo Region, 25.04.2017; Medium-Scale
Cashew Processor and Senior Official of CIAG, Accra, 19.04.2017; Senior Technical Officer of
African Cashew Alliance, Accra, 11.04.2017.
82 Mid-Scale Farmer, Wenchi, Brong Ahafo Region, 24.04.2017; Chairman of large cashew farmer
cooperative, Brong Ahafo Region, 24.04.2017.
1
1.1
1.2
1.3
1.4
1.5
1.6
1.7
1.8
1.9
2
28.
FEBRUARY
31. MARCH 30. APRIL 31. MAY
US
$/K
G
MONTH
Burkina Faso Côte d'Ivoire Ghana Senegal

144
of the National Cashew Farmers Association, Anthony Kwaku Adu, argued that
such a restriction would give processors the authority to monopolize bargaining
power to their detriment and described the “current keen competition in the
purchase of RCN presents a fair opportunity for farmers to make their desired
profit” (Frimpong 04.08.2015). Similarly, meetings between farmers and the
Minister of Trade and Industry at the time, Dr Ekow Spio-Garbrah, were far from
amicable. According to interviewed farmers who were present at a meeting in the
cashew stronghold Wenchi (Brong-Ahafo) in early 2016, Spio-Garbrah allegedly
accused farmers of being greedy because they were opposing a temporary export
ban.83 Prof. Gyan-Baffour, NPP MP of Wenchi, supported this story and the
infuriation of farmers, stating in parliament:
“I had a chance to be at the meeting where the Hon Minister for Trade and
Industry and his officials met with the cashew farmers. The farmers were
vehemently against this order [an export window, i.e. a temporary export
ban], but the arrogance that came from that Ministry was such that I even
got angry when they said that they had to find a way to process local raw
materials, therefore they were going to create what they referred to as the
export window” (Parliament of Ghana 17.03.2016).
The position of other actors regarding such an export window was less clear. On
the one hand, some argue that local processors were not united on this topic.84 They
alleged that Ghanaian processors were not as keen on restrictive export measures
as those processors in Ghana with foreign origin, as the later would be able to
outmuscle the former financially in the acquisition of RCN (just as exporters have
outmuscled both). Domestic processors themselves, however, clearly contradicted
this statement, saying that they favoured the temporary export ban and did not see
themselves in direct competition with other processors.85 Simultaneously, the
position of the Cashew Industry Association of Ghana (CIAG) was and remains
unclear. Some members within the association stated that CIAG clearly lobbied
against an export window86, while others said that they were not fundamentally
83 Mid-Scale Farmer, Wenchi, Brong Ahafo Region, 24.04.2017; 84 Senior Executive of CIAG, Per Telephone, 12.04.2017 85 Medium-Scale Cashew Processor and Senior Official of CIAG, Accra, 19.04.2017 86 Senior Executive of CIAG, Per Telephone, 12.04.2017

145
opposed to it and that in certain circumstances it might be acceptable.87 Part of the
reason for these different opinions within CIAG might simply reflect the very
different positions in the value chain that different members have.
6.1.2. The 2016 Implementation and Withdrawal of the Export Ban
At the beginning of the 2016 cashew season in February, RCN prices started off
even higher than the record 2015 prices, hence, ever-worsening the situation of local
processors. As a response and despite the negative feedback from farmers and
exporters in previous meetings, on Monday 14 March 2016, MoTI in a surprise
move issued a temporary export ban. Specifically, the administrative directive
stated that “Any raw cashew nuts that are brought to the ports or borders of Ghana
for export between March 31 and May 31, 2016 shall be confiscated to [sic] the
state” (Vinokor 2016). Legally, the ministry justified the administrative directive
with its oversight responsibilities for trade regulations and controls under the Import
and Export Law (Act 503 Section 13) of 1995 as amended in 2000. Substantially,
it justified the export window by stating the National Export Development
Programme’s (NEDP 2016 – 2020) objective of promoting value addition and non-
traditional exports and that “the survival of the industry which is processing cashew
in Ghana is on the brink of collapse and will only survive on the availability of
adequate supply of raw cashew nuts for processing” (Vinokor 2016).
This de facto export ban88 came as complete surprise to most observers and players
in the sector. Whereas the option of an export window had been discussed in
87 Senior Executive of CIAG, Accra, 12.04.2017
88 The general rational for introducing an export window is to make RCN more available and cheaper
for local processors. The functional logic underpinning an export window, or temporary export ban,
is different however from an outright export ban. In contrast to an outright export ban, exporters can
still buy and store the RCN and export them once the window has closed. Practically, given the
shelf-life of well-dried RCN of over one year this is feasible and in fact has been done at points by
producers and exporters during the temporary export bans in Benin and Burkina Faso (ComCashew
2017: 12; Olympio and ComCashew 2015: 6).
However, buying and storing the crop until the end of the window implies significantly greater costs
for exporters in three ways. First, physically storing RCN for two months creates additional
warehousing costs. Moreover, where an export window was introduced unexpectedly and in or
shortly before the season, exporters might not have the chance to create more space, thus, having to
sell straight to local processors. Second, the financing and re-financing costs for traders (i.e.
middlemen and exporters) are significantly increased. Cashew traders rapidly refinance their RCN
buying with each sale. When having to store the RCN, however, cashew traders must look for other
costlier options – such as high-interest bank loans – to finance their working capital. Small traders

146
workshops, according to interviews with political, bureaucratic, and economic
actors as well as donors, MoTI had not consulted or informed anybody outside of
the ministry before issuing the directive – apparently, even the president was kept
in the dark.89
Perhaps even more surprisingly, the export ban was withdrawn before it had
officially opened. Five days after its implementation, on Saturday 19 March, the
Minister of Trade and Industry, Dr Spio-Garbrah (NDC), issued a statement
declaring the “temporal withdrawal” of the export window, saying it was ill-timed
and “should have been issued at the beginning of the year to enable farmers, agents
and traders plan for the management of the impact” (Spio Garbrah 2016). He further
added that MoTI would seek broader consultation (particularly with CIAG) in its
next steps to support the sector, which should include building a cashew marketing
board, establish a credit scheme for cashew farmers, and have the National Buffer
Stock Company (NAFCO) purchase RCN so that they could secure enough supply
to local processors. By the change of government in December 2016, neither had
the decision to implement an export window been reinstated, nor any of the
proposed measures been implemented.
Why did Minister Spio-Garbrah withdraw the ban? As described above, in his own
statement he indicated the ban was ill-timed and that producers and traders should
have been given earlier warning. The sincerity of this statement, however, is
are expected to be more heavily affected by this than large traders, because of their inability to
absorb the increased financing cost, again incentivizing them to sell directly to local processors
(Olympio and ComCashew 2015: 14–15). Finally, an export window significantly increases the
economic risk for traders. Within the course of the four to five-month lasting cashew season in
Ghana, prices change dramatically. The usual trend are relatively low prices at the beginning of the
season (January/February in Ghana), which double by late February and then tend to go down by
the end of the season (because more supply comes in from other West African countries and with
the beginning of the rain season the RCN quality decreases). Hence, if a trader buys RCN in March
and can only sell them end of May, the propensity of receiving lower sales than buying prices is
high. This risk is even higher given that cashew prices can react very harshly to potential abrupt
demand or supply shocks, which could be positive, but generally make cashew trading extremely
unforeseeable and risky. It is due to these three factors that the cost for trading can increase
significantly for traders, hereby not only decreasing their direct cost competitiveness to local
processors, but also incentivizing them to avoid buying in the implementing country directly, which
decreases the demand and hence prices for RCN at the farm gate.
89 Senior Manager of ComCashew (GIZ), Accra, 22.05.2017; Chairman of large cashew farmer
cooperative, Brong Ahafo Region, 24.04.2017; Senior Official of Ministry of Food and Agriculture,
Crop Directorate, Accra, 13.04.2017; Former Deputy Minister of MoTI and NDC MP, Accra,
29.03.2017; Crops Officer at Ministry of Trade and Industry (MoTI), Accra, 06.05.2017; Brong-
Ahafo MP (NDC), Accra, 30.05.2017; Senior Executive of CIAG, Per Telephone, 12.04.2017.

147
doubtful. Both former and current staff within the MoTI detailed in interviews that
they and the Minister saw the degree and timing of the export window as necessary
and appropriate.90 Specifically, they were hoping that the swiftness and covertness
of the policy introduction would be particularly powerful in preventing traders from
preparing for the ban, thus, increasing the available supply for processors.
According to them, senior officials within MoTI and MoFA wanted to uphold the
export window if it had not been for political pressure from the top NDC leadership
and Brong-Ahafo MPs in parliament. Moreover, in line with Spio-Garbrah’s
question to cashew farmers in Wenchi prior to the directive why they were so
greedy, bureaucrats in MoTI and MoFA argued that the potential income loss of
cashew farmers should not be taken too seriously, as cashew prices had been
increasing massively over the years and were too high in Ghana anyway.
Concluding, if not altruism and respect for farmers’ and traders’ interest, what
drove the withdrawal of the ban? In the following, the case material is contrasted
and applied to the theoretical argument of this thesis to provide a viable explanation.
6.1.3. The Politics of the Ban Withdrawal – Testing the Theoretical
Argument
As outlined in Chapter 3.1.2, the theoretical argument is connected through three
core mechanisms. First, because export bans are also highly damaging to traders,
they are motivated to inform producers about their existence and origin. Producers,
by contrast, are very receptive to these practices given the severity of the ban and
will likely be able to attribute it to the government. Second, again with the help of
traders and motivated by the high stakes involved, producers will likely mobilize
against the ban. Three, when producers are many, this mobilization poses a
significant political threat to policy-makers, which is why they will withdraw the
ban (if they made the rare mistake to implement it in the first place). In the
following, these mechanisms will be tested against the Ghanaian case.
90 Senior Official of Ministry of Food and Agriculture, Crop Directorate, Accra, 13.04.2017; Former
Deputy Minister of MoTI and NDC MP, Accra, 29.03.2017; Crops Officer at Ministry of Trade and
Industry (MoTI), Accra, 06.05.2017; Senior Official for Industrial Development at MoTI, Accra,
06.05.2017; Senior Officer for Industrial Development at MoTI, Accra, 06.05.2017.

148
6.1.3.1. Arsonist Traders, Price Shocks, and Attribution
Throughout the thesis, I have argued that the severity and sharpness of export bans’
impact is the heat and pressure required to ‘mash’ producers together to a cohesive
mass, and that traders act as cooks, stirring the mash and adding spice to it. As I
will show below, this holds true for the Ghanaian case as well. Traders immediately
after the announcement of the ban stopped buying from farmers, knowing this
would make the ban’s price distortion particularly sharp and visible. They started
to inform farmer cooperative leaders, farmers that wanted to sell to them, and ran
major radio campaigns in the region putting out the word that the sharp price drop
was the result of government intervention. Moreover, traders then helped organize
and finance farmer protest, which eventually led to the withdrawal of the ban.
Before delving into the details of traders’ actions, it makes sense to unpack who
they are. As illustrated in Figure 6.5 below, the term traders summarizes a range of
related actors. RCN exporters stand at the upper end of the raw cashew marketing
chain. Overall, there are about 60 cashew export companies registered by the Ghana
Export Promotion Authority (ACi et al. 2015: 56), although around a hand full of
foreign and domestic companies dominate the market. The most important are the
international commodity trade and processing giants Olam (Indian) and
ECOM/Unicom (Spanish), as well as 3F Ghana Ltd. (Indian), West Africa Market
Link (Ghanaian91), Kingdom Exim (Ghanaian), and Greenland Commodities
(Ghanaian).92 Export companies tend to have collection and bulking centres in the
main producing area towns (like Sampa, Techiman, or Wenchi), where containers
are filled, transported to Tema port, and shipped off to India or Vietnam (accounting
for 47% and 35% of total RCN exports in 2015 respectively). To source cashew
nuts, exporters utilize a large network of local traders. On the one hand, exporters
operate own buying centres in most major cashew districts. Here, farmers can either
91 Owned by the president of the Cashew Industry Association of Ghana (CIAG), Winfred Osei
Owusu.
92 Senior Executive of Wenchi Cashew Trader Association, Wenchi, Brong Ahafo Region,
24.04.2017; Manager of Cashew Trader Collection Centre, Techiman (Brong Ahafo Region),
26.04.2017; Collection Centre Manager for Large Trading House, Wenchi, Brong Ahafo Region,
24.04.2017; Senior Manager for Olam International (Ghana), Accra, 20.05.2017; Senior Manager
of Trade House Cashew Bulking Centre, Techiman (Brong Ahafo Region), 26.04.2017; Senior
Manager of Trade House Cashew Bulking Centre, Techiman (Brong Ahafo Region), 26.04.2017.

149
directly deliver their crop, or buying agents from the centres will pick the crop from
the farm gate. Much more commonly (around 68% of the crop), producers sell their
raw cashew nuts to village buyers, who are mix of local traders, shop keepers,
speculators and others that operate small buying centres.93 These village buyers will
then sell the RCN to exporter buying or bulking centres. Overall, it is likely that a
couple of thousand Ghanaians work in trading raw cashew nuts. Around one
thousand of them are organized in cashew trader associations, like the Techiman
Cashew Traders Association or the Wenchi Traders Association (with around 100
members each).94
Timed in the middle of the harvesting season, MoTI’s export directive would have
intentionally, immediately, and negatively affected the operations of exporters and
middlemen. While traders could have continued to buy the crop, they would have
needed to store it for over two months, until the end of the temporary ban. Doing
so, however, was not an option for traders. For one, exporters’ warehouses were not
designed to store large amounts of crops for a long time (but only until a container
was filled) and building them would take too long and cost too much. Secondly, the
high profits from the business comes from the quick turn-over of the crops,
something the export ban would have inhibited. Obviously, those middlemen not
selling to exporters or exporters that were not linked to a foreign processor could
have decided to sell to domestic processors. Switching to domestic processors,
however, would not only have meant lower profit margins (given processors new
oligopolistic market power), but was also uncertain, as processors such as Mim
Cashew Ltd had often used their own employees rather than brokers to source the
nuts. Similarly, switching to another crop was not a viable option for local trader
networks given that cashew is the only major cash crop in the Northern Brong-
Ahafo region. Finally, although large trading houses like Olam would probably
have grudgingly overcome losing out on the Ghanaian RCN, the risk that this could
interfere with RCN export trade from other countries going through Ghana made
93 Senior Executive of Wenchi Cashew Trader Association, Wenchi, Brong Ahafo Region,
24.04.2017; Collection Centre Manager for Large Trading House, Wenchi, Brong Ahafo Region,
24.04.2017.
94 Senior Manager of Trade House Cashew Bulking Centre, Techiman (Brong Ahafo Region),
26.04.2017; Senior Manager of Trade House Cashew Bulking Centre, Techiman (Brong Ahafo
Region), 26.04.2017

150
this unacceptable (as well as the possibility this would turn out to be a successful
precedent for other African governments).
Figure 6.5. The Cashew Value Chain in Ghana, in 2015/2016
Source: Own Illustration.
Given the significant threat the introduction of the export window posed both to
exporters and traders, they wasted no time to move against it. According to buying
agents interviewed, within the same day of the introduction of the ban, they received
the order from their superiors in Accra and Tema to stop buying from farmers
immediately.95 Officially, the ban would have started only two weeks later on 31
95 Senior Executive of Wenchi Cashew Trader Association, Wenchi, Brong Ahafo Region,
24.04.2017; Collection Centre Manager for Large Trading House, Wenchi, Brong Ahafo Region,

151
March, hence, in theory they could have continued buying nuts in the field for at
least another week. Traders, however, knew that it was crucial to have farmers see
and be hurt by the ban for them to clearly attribute it to the government’s directive
and be mobilizable against it.
Traders’ withdrawal from the market was highly effective. With over 95% of
farmers normally selling their crop to middlemen and buying agents, farm gate
prices dropped harshly, rapidly and clearly visible to farmers. In the week of the
ban several newspapers – citing farmers, middlemen, politicians or their own price
surveys – reported that prices had fallen by 44% from around GHC 4.5 (US$ 1.15)
to GHC 2.5 (US$ 0.63) per kilogram within only two days (Frimpong 2016;
Vinokor 2016). This was confirmed during my fieldwork in around two dozen
interviews with cashew farmers, traders as well as independent market analyst, and
some farmers, middlemen and even cottage processors I interviewed without prior
notice of my arrival or my topic (hence, when they could not have prepared for my
visit), could show the dip in farm gate prices in their business records.96 Relatedly,
the managing director of Mim Cashew Ltd., Joseph Yeung, was quoted in a
newspaper article as saying that “(…) the effect of the directive was very clear to
us. We got ten times the intake of raw cashew nuts than before the directive (…)”
(Eduku 2016).
Simultaneously, traders started a campaign to inform farmers about the party at fault
for the price drop: the NDC-government. First, regional and district-level meetings
among buying agents, farmer cooperative society chiefs (where existent, such as
Wenchi) and traditional chiefs were immediately organized at the offices of traders,
to which journalists were explicitly invited and came.97 Secondly, traders together
with the informed actors at the meeting contacted radio stations (widely listened to
in rural areas), which after the day of the imposition of the ban, informed those
24.04.2017; Senior Manager of Trade House Cashew Bulking Centre, Techiman (Brong Ahafo
Region), 26.04.2017
96 CEO of Cashew Cottage Processor, Techiman (Brong Ahafo Region), 26.04.2017; Mid-Scale
Farmer, Techiman, Brong Ahafo Region, 24.04.2017; Collection Centre Manager for Large Trading
House, Wenchi, Brong Ahafo Region, 24.04.2017.
97 Chairman of large cashew farmer cooperative, Brong Ahafo Region, 24.04.2017; Journalist
covering Cashew Sector, Sunyani, Brong-Ahafo Region, 25.04.2017; Senior Executive of Wenchi
Cashew Trader Association, Wenchi, Brong Ahafo Region, 24.04.2017.

152
farmers that had not yet heard from the ban or not been able to make the link
between the price fall and MoTI’s directive about its origins. Parallel, the agents
directly interacting with farmers – i.e. farm gate agents or the trade houses’
collection centre managers in Brong-Ahafo market towns like Wenchi, Techiman
or Sampa – also let farmers know about the directive when explaining why they
would or could not buy anymore produce. As such, the ban and who to blame for it
became extremely clear to producers. Interestingly, processors (especially Mim
Cashew) tried to counter this strategy with own announcements on the radio that
the ban was beneficial and that they would pay up to GHC 4, eventually to no avail
however.98
6.1.3.2. Mobilization of the Masses
The previous section established that the export ban in Ghana was indeed damaging
and highly perceptible to cashew smallholders. Moreover, it showed that traders
played a significant role in making sure it did. The next question, however, is
whether this realization by farmers that the government had imposed an extremely
damaging ban on their crop translated into their active mobilization? Again, the
answer is a clear yes.
The withdrawal of the ban on Saturday 19 March had been preceded by severe
protests by farmers, brokers, and parliamentarians, heavily covered in the Ghanaian
media. Particularly the farmer associations – usually associated in Ghana with poor
collective action capacity99 – became very active and visible the days directly after
the ban. Anthony Kwaku Addu, president of the National Cashew Farmer
Association as well as Chairman of the Wenchi Cooperative Cashew Farmers and
Marketing Union, for example spoke on several radio shows and to several
98 Senior Executive of Major Cashew Processor, Mim, Brong-Ahafo Region, 25.04.2017; Medium-
Scale Cashew Processor and Senior Official of CIAG, Accra, 19.04.2017.
99 The 80,000 to 100,000 (mostly small-scale) farmers that produce cashew nuts live in around 389
farming communities throughout the country, but mostly Brong-Ahafo region (ACi 2010). Through
the CDP, these are further organized into 1,549 production groups, 156 co-operative societies, and
11 more or less functional District Cashew Farmers’ Unions. Despite their wide existence, co-
operative societies are barely involved in marketing: it is estimated that farmers sell less than 2.5%
of their nuts to producer groups, cooperatives, or district unions (ACi et al. 2015: 56). Experts of the
sector and especially of the cooperatives state that these do not tend to have high collective action
capacity. Members tend to avoid active participation out of the fear of being taken advantage of by
the often more educated and traditionally powerful association heads (ACi et al. 2015: 25).

153
newspapers, heavily criticizing the directive and the minister, and announced a
demonstration against the ban for Thursday 24 March 2016 in Wenchi as well as
marching to the Presidency if these protests were not successful (Boateng 2016).
Similarly, Anane Yaw Kwarteng, the Chairman of the Cashew Farmers Association
in the Dormaa Central Municipality (a further district in the Brong-Ahafo cashew
cultivating area) in an interview on Friday 18 March gave MoTI-Minister Spio-
Garbrah a three-day ultimatum to withdraw his “wicked directive before we
descend on him” (Boateng 2016). According to MPs interviewed100 from the region,
in the core cashew districts near the Ivorian border (Jaman South, Jaman North,
Tain and Banda), farmers protested in large numbers directly in front of NDC
offices and homes of NDC MPs the days after the directive had been issued. In
other parts of Brong-Ahafo, farmers bombarded their MPs with phone calls. Yaw
Afful (NPP), MP from Jaman South, for example, stated in parliament that within
one day (Wednesday 16 of March 2016) over fifty farmers and buying agents had
called him asking him to do something against the ban (Parliament of Ghana
17.03.2016).
While less visible, buyers and exporters also publicly spoke out against the ban.
The acting chairman of the Cashew Buyers Association of Techiman, Mr. Mumuni
Issah, for example, told the Ghanaian chronicle that cashew nuts were rotting
because of the directive – which seems exaggerated given that dried RCN have a
shelf-life of over a year and the export window had not even been issued for a week
– and that they would demonstrate against minister Spio-Garbrah if the ban was not
lifted (Boateng 2016).
In general, however, traders and their associations took a more facilitative role
behind the scenes. Although the heads of the major export houses simultaneously
lobbied MoTI, MoFA and the presidency to withdraw the ban, they realized that as
their active lobbyism had failed to prevent the ban in the first place, they would
have to amplify their leverage. Similar to large-scale farmers in Argentina who used
small-scale farmers as the face of their campaign to garner public support (Fairfield
2011), Ghanaian traders knew that mobilizing the numerical power of smallholders
was their best chance to get rid of the ban. Consequently, employees of large traders
100 Brong-Ahafo MP (NPP), Accra, 01.05.2017; Brong-Ahafo MP (NDC), Accra, 30.05.2017.

154
reported in interviews that they actively coordinated and financed protests of
farmers and organized district level meetings with farmer association heads and
chiefs, at which MPs and other high officials were called and threatened.101 It was
this financing, hosting, and general organization through traders that allowed
farmers to conduct the protest that eventually pressured the government to withdraw
the ban.
6.1.3.3. Mass Threat and Policy-Maker Panic
The previous sections have illustrated how with the facilitation of traders the
implementation of the ban strongly agitated and mobilized farmers against the
governing party and its directive. The final and decisive question is, however,
whether it was the fear of mobilized farmers that led the government to withdraw
the ban. Yet again, the analysis of the case material allows a strongly positive reply.
Interestingly and surprisingly, MPs, particularly MPs from Brong-Ahafo belonging
to the ruling party, were very quick to react against the ban. Only three days after
the directive had been issued and two days before it was withdrawn, the then Deputy
Majority Chief Whip and MP of the cashew district Banda, Ahmed Ibrahim (NDC),
submitted an urgent motion against the ban. He described the directive as “very
weak and illegal,” arguing and quoting that the Export and Import Act on which the
directive was founded could only be made by legislative instrument, hence, the
approval of parliament, which had not occurred (Mubarik 2016; Parliament of
Ghana 17.03.2016). Other NDC MPs supported Ibrahim in his motion, such as the
MP of Tain (a further cashew constituency) and even majority leader, Alban
Bagbin, who stated that the “directive by the Hon Minister for Trade and Industry
has no legal basis and in fact, even though he is my very good friend, he just acted
as Don Quixote.”
It is important to notice that it is an extremely rare event that MPs belonging to the
ruling party in Ghana (or most countries, for that matter) criticize ministers or
101 Chairman of large cashew farmer cooperative, Brong Ahafo Region, 24.04.2017; Senior
Executive of Wenchi Cashew Trader Association, Wenchi, Brong Ahafo Region, 24.04.2017;
Collection Centre Manager for Large Trading House, Wenchi, Brong Ahafo Region, 24.04.2017;
Senior Manager of Trade House Cashew Bulking Centre, Techiman (Brong Ahafo Region),
26.04.2017; Senior Executive of CIAG, Accra, 12.04.2017.

155
policies of their own governments. Most newspaper articles and interview partners
(including MPs) could not recollect a moment when this had happened in the past.
Usually, if partisans have an issue with a policy, they will discuss this within the
party behind closed doors, rather than so publicly and even in parliament as in this
case. Given the fact that Minister Spio-Garbrah is a top NDC heavyweight,102 these
heavy attacks against him came as a particular surprise. Moreover, it is extremely
rare to see majority and minority MPs to agree on the same motion, as occurred
here. Not one single MP spoke in favour of the ban however. All MPs, whether
from the NDC or NPP condemned the illegality of the directive as well as the
negative economic and social effects it would have on cashew farmers. The only
points of dissent between the two groups was how Minister Spio-Garbrah should
be put under pressure – the NPP minority leader, Osei Kyei-Mensah-Bonsu, arguing
he should be threatened with impeachment, whereas NDC members remained quiet
on this point – and the NPP accusing the NDC of going against the directive only
for electoral considerations, or as NPP MP Dominic Nitiwul put it:
“(…) the Majority side have every channel to solve this problem with the
Executive arm of Government, without necessarily dragging Hon Members
of Parliament into this issue. What is this Statement seeking to achieve? Is
it to appease the farmers in the Brong Ahafo Region or it is to fight for the
people there because it is an election year?” (Parliament of Ghana
17.03.2016)
Eventually, following the bipartisan attack of MPs on the directive, sources within
MoTI and the NDC state that top leaders of the party – among them President
Mahama himself, majority leader Alban Bagbin,103 and NDC general secretary
Johnson Aseidu Nkatia – contacted Spio-Garbrah to tell him he should reverse the
directive immediately.104 Little later the Minister folded and withdrew the ban.
102 Starting in the 1990s, Spio-Garbrah served for years as Minister in different portfolios, as
ambassador to the United States, came second in the NDC leadership election in 2006, and was one
of the key contenders for the NDC’s presidential candidacy in 2019.
103 Interestingly, Mahama, Bagbin, and Spio-Garbrah were among the top contenders to become the
presidential candidates for NDC in 2020.
104 Former Deputy Minister of MoTI and NDC MP, Accra, 29.03.2017; Brong-Ahafo MP (NDC),
Accra, 30.05.2017.

156
What led partisan NDC MPs from Brong-Ahafo and party leaders to attack their
own minister and his directive? I argue that these politicians feared that the mass of
cashew farmers would translate their anger against the ban into votes for the
opposition in the December 2016 presidential and parliamentary elections,
seriously threatening their political survival. Two aspects are particularly
noteworthy in this regard: cashew farmers are many and elections in Ghana are
particularly close-fought.
Most sources see the number of cashew farm operators in Ghana between 80,000
and 100,000 around 2016 (Addaquay 2016: 7).105 Adding spouses, children,
potential workers, and traders, it becomes obvious that several hundred thousand
potential voters have a strong interest in strong and stable cashew prices. This
comes against the backdrop of the previous presidential and parliamentary elections
in 2012. Then, NDC presidential candidate and John Mahama had won the election
with 50.63%, only 310,286 votes in front of his competitor from the NPP, Nana
Akufo-Addo. Keeping in mind Ghanaian voters’ tendency to change the
government every two terms and the general dissatisfaction with the NDC’s second
term, the potential loss of several hundred thousand votes from cashew farmer votes
was a critical and direct threat to president Mahama’s political survival.
What is more, in the Brong-Ahafo region – home to around 90% of Ghanaian
cashew farmers (Adombila 2015) – close elections and swing-voting are at their
most extreme in Ghana. Within the last five presidential elections, presidential
majorities had changed three times in the region, while having the smallest margins
in the country (around 4% in 2012). The exact same pattern holds true for the
national (first-past-the-post) parliamentary elections, with the NDC having
garnered 16 seats and NPP 13 seats in 2012. Moreover, no region has more districts
(four exactly, of which three are in the core cashew region) in which most voters
voted for a different presidential than parliamentary candidate (a phenomenon
Ghanaians term “skirt and blouse districts”). Margins get even closer when looking
at the typical cashew districts in the region. In the cashew hub Jaman North, for
example, the NPP candidate Stevens Siaka won his seat with only 202 more votes
than his opponent. Similarly, in Banda district, the issuer of the motion against the
105 Senior Official of Ministry of Food and Agriculture, Crop Directorate, Accra, 13.04.2017.
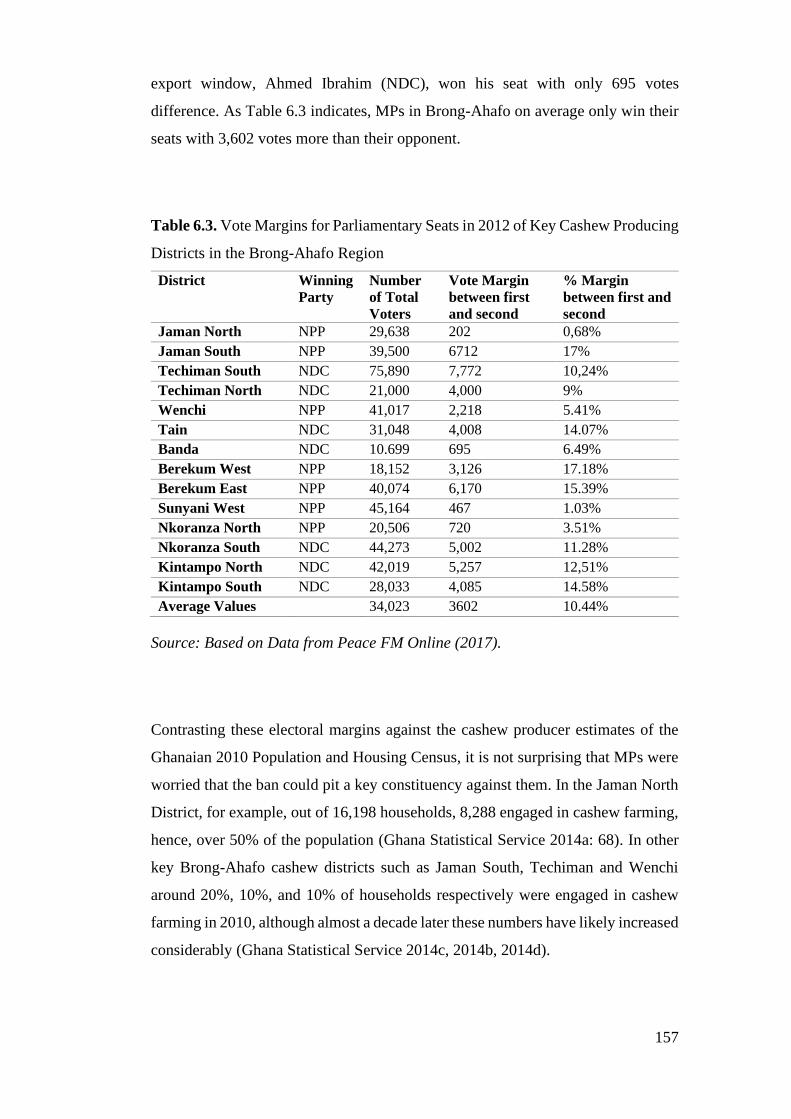
157
export window, Ahmed Ibrahim (NDC), won his seat with only 695 votes
difference. As Table 6.3 indicates, MPs in Brong-Ahafo on average only win their
seats with 3,602 votes more than their opponent.
Table 6.3. Vote Margins for Parliamentary Seats in 2012 of Key Cashew Producing
Districts in the Brong-Ahafo Region
District Winning
Party
Number
of Total
Voters
Vote Margin
between first
and second
% Margin
between first and
second
Jaman North NPP 29,638 202 0,68%
Jaman South NPP 39,500 6712 17%
Techiman South NDC 75,890 7,772 10,24%
Techiman North NDC 21,000 4,000 9%
Wenchi NPP 41,017 2,218 5.41%
Tain NDC 31,048 4,008 14.07%
Banda NDC 10.699 695 6.49%
Berekum West NPP 18,152 3,126 17.18%
Berekum East NPP 40,074 6,170 15.39%
Sunyani West NPP 45,164 467 1.03%
Nkoranza North NPP 20,506 720 3.51%
Nkoranza South NDC 44,273 5,002 11.28%
Kintampo North NDC 42,019 5,257 12,51%
Kintampo South NDC 28,033 4,085 14.58%
Average Values
34,023 3602 10.44%
Source: Based on Data from Peace FM Online (2017).
Contrasting these electoral margins against the cashew producer estimates of the
Ghanaian 2010 Population and Housing Census, it is not surprising that MPs were
worried that the ban could pit a key constituency against them. In the Jaman North
District, for example, out of 16,198 households, 8,288 engaged in cashew farming,
hence, over 50% of the population (Ghana Statistical Service 2014a: 68). In other
key Brong-Ahafo cashew districts such as Jaman South, Techiman and Wenchi
around 20%, 10%, and 10% of households respectively were engaged in cashew
farming in 2010, although almost a decade later these numbers have likely increased
considerably (Ghana Statistical Service 2014c, 2014b, 2014d).

158
What is more, Ghanaian cashew farmers are likely to leverage their electoral weight
if need be, given that eligible voters in Brong-Ahafo are generally known to vote
actively. In the 2012 presidential and parliamentary elections, the region recorded
the second-highest voter turnout with 81.07% (Ghana News Agency 2012).
Through their quick organization of angry large-scale demonstrations via radio and
call bombardments of MPs, cashew farmers and their associations were furthermore
able to make credible that they possessed the collective action capacity to turn their
numbers into votes against the ruling party at elections.
Overall, these factors combine to an extremely high electoral threat of cashew
farmers, and it appears that parliamentarians and leading NDC politicians were very
aware of this. A key piece of anecdotal evidence originates from an interview with
a participant106 of a meeting at the Wenchi Cashew Trader Association’s office the
day after the directive had been issued. The meeting consisted of the main
representatives of cashew farmers and traders in Wenchi. Together, on
speakerphone, the group called both Banda MP Ahmed Ibrahim as well as Speaker
of the House, Alban Bagbin, who would later lead the charge against the directive
in parliament. While both sides of the line shared their anger at the ban, Ahmed
Ibrahim explicitly emphasized that “I won’t lose my seat over this directive!”
Moreover, it appears that top NDC leaders were trying to appease cashew farmers
after the directive had been issued. President Mahama both during and after the
export window had been very accommodating in hosting cashew farmer
representatives on short notice in the presidential palace (Essabra-Mensah 2016),
and the NDC’s general secretary, Johnson Aseidu Nkatia, publicly condemned the
export window and the responsible minister during a meeting with chiefs and
citizens of the Jaman North district the day following the withdrawal of the ban
(Denkye 2016). Overall, the wish to appease voters also explains why NDC MPs
did not stick to the usual within party backroom talks to get the issue resolved but
used the first chance to publicly oppose the directive and depict themselves as
saviours of the cashew smallholder (although, to the best of my knowledge, never
before having introduced any motion to support them).
106 Journalist covering Cashew Sector, Sunyani, Brong-Ahafo Region, 25.04.2017.
159
Overall, the explanation that the ban was withdrawn primarily to calm mass
opposition from farmers and to avoid losing their support was strongly shared by
most interviewees. The corroboration by a former NDC MP that was in a leading
position in MoTI107 during the export window is revealing:
“I am saying it is all about politics. You see, in democratic societies, it
doesn’t matter who votes. At the end of the day, they count the number of
people who vote. No one is less important, you know. What is important is
your vote. When you risk losing the vote, you would want to chart a path
which will give you political leverage. And that is what informed the
decision of the reversal of the directive given by the minister. It was never
a decision that was abandoned on economic grounds – it was purely about
electoral politics. You know, it became a political issue. Everybody wanted
to win the sympathy and the love of the farmers. So, they all joined the band-
wagon blaming the minister. (…) The protest came mainly from NDC MPs
from Brong-Ahafo, because they knew electorally, if they did not do
anything, what was going to happen. So, they wanted to pre-empt a motion
the opposition was planning to do and show farmers themselves: “Hey! I am
fighting for your interests!” When in fact, it wasn’t their real interest, it was
only their political interest.”
Although the evidence is strong that the NDC withdrew the ban to appease a key
electorate, it is less clear whether it succeeded. Overall, its results in the presidential
and parliamentary election on 11 December 2016 were damning. Both president
Mahama, as well as NDC parliamentarians, had experienced a crushing defeat in
the cashew growing districts. Figure 6.6 maps and compares the electoral results of
the presidential elections in 2012 and 2016. Dark grey districts are those where John
Mahama won a majority, while white districts are those were Nana Akuffo-Addo
won most votes. The area highlighted by a dashed-lined circle in the centre of the
Brong-Ahafo maps denotes the key cashew cultivating districts. What we can see
is that the president’s losses in Brong-Ahafo occurred particularly strongly in the
107 Former Deputy Minister of MoTI and NDC MP, Accra, 29.03.2017

160
cashew growing area. Specifically, he lost the majority in seven out of 14 cashew
districts to Akuffo-Addo.
Figure 6.6. Presidential Election Results in Brong Ahafo Region in 2012 and 2016
Source: Own illustration based on data from Peace FM Online (2017)
Figure 6.7 below further illustrates this in more detail. It depicts the vote share of
the NDC presidential candidate in all elections since 2004. Importantly, it
aggregates the score of all different constituencies into two groups: whether the
2010 Population & Housing Census (Ghana Statistical Service 2014d) named
cashew to be one of the two most produced crops and/or stated that at least 5% of
farm households in the constituency grew cashew at the time of the census – or not.
What we can see is that the NDC had won in both areas in 2012, being 1.7% more
successful in non-growing Brong-Ahafo areas. In 2016, the NDC crashed in both
areas. Clearly, cashew was not the only topic at play. As indicated, there was a
general frustration with the NDC in Ghana and in Brong-Ahafo, where the named
Diamond Microfinance scandal had angered voters particularly. However, we do
see that the NDC’s vote share dropped stronger in the cashew growing areas (by
7.8%) than in the non-cashew growing areas (by 5.4%) in Brong-Ahafo.

161
Accordingly, although one should not go as far as saying that the failed ban alone
had cost the NDC the elections in cashew-growing areas in Brong-Ahafo, there is
some statistical evidence to substantiate the claim that it might have played a
significant part.
Figure 6.7. Development of NDC Vote Shares Over Time Across Brong-Ahafo
Constituencies disaggregated by Cashew Growing and Non-Cashew Growing
Constituencies
Source: Peace FM Online (2017)
Similarly, the NDC MPs lost four of their ten districts in the cashew area, with the
losses in Tain, Techiman North, and Nkoranza South being among the closest in
the country (with the winner and second only separated by 41 votes in Tain).
Accordingly, an interviewed NPP MP that won one of these close-fought seats
stated that he had seen the directive in two ways: as negative to his potential cashew
farming constituents, but also as positive, because he said it helped him win a seat
against an incumbent MP that had sat stably in his seat (at least in comparison to
47.4
48.8
52.1
44.3
46.1
47.6
53.8
48.4
2004 2008 2012 2016
ND
C P
resi
den
tial
Ele
ctio
n S
har
e (%
)
Election Year
Cashew Growing Constituencies
Non-Cashew Growing Constituencies

162
other districts in Brong-Ahafo). Indeed, many of my interview partners confirmed
that their decision or that of family, friends, and acquaintances not to vote for the
NDC in the 2016 election was strongly fuelled by its attempted imposition of an
export ban. An electoral outcome that is particularly noteworthy, however, is
Ahmed Ibrahim’s defence of his seat. Despite a relatively close winning margin of
635 votes, it appears that Ibrahim’s prominent and public resistance against the
export window has likely had its intended effect: securing cashew farmers’ vote by
showing them that he was on their side.
6.1.4. Conclusion of the Ghanaian Cashew Case
The case of the March 2016 Ghanaian cashew ban withdrawal provides perhaps the
most illuminating illustration of the thesis’ theoretical argument. Doing so it closely
traces its core mechanisms. First, traders were central in making the ban and its
origin visible to farmers, as well as aggravating its impact. Facilitated and riled up
by traders, this attributable damage motivated thousands of small-holders (usually
plagued by weak collective action) to mobilize against the ban and stage protests
across the cashew region. Regional MPs and national political leaders from the
governing party (NDC) became immediately aware of the significant threat to their
political survival. Considering tight electoral margins, the risk was high that the
critical mass of cashew farmers could shift votes to the opposition, massively
diminishing the chances to remain in office after the 2016 presidential and
parliamentary elections. Interviewees confirm that it was this pressure from
threatened NDC politicians that eventually forced Trade and Industry Minister
Spio-Garbrah to withdraw the ban.
6.2. Calm Cashews: The Introduction and Maintenance of the
Raw Cashew Export Ban in Kenya
Besides coconut, cashew nut has historically been one of the few major cash crops
in the Kenyan coastal region. While some cashew is grown in Tana River, Taita

163
Taveta, and Tharaka Nithi counties, over 90% of the crop is grown in the three
counties of Kwale, Kilifi and Lamu along a 15-kilometre-wide coastal strip
spanning from the Tanzanian to the Somali border (see Figure 6.8 below). The vast
majority of cashew is farmed by small-holders owning no more than one acre of
land on average (Agriculture, Fisheries & Food Authority 2016; IDMS 2009).
Introduced by the Portuguese in the 16th century, active cultivation and processing
of cashew emerged in Kenya in the 1930s. Originally pan-roasted and cracked with
sticks by coastal farmers, following a visit to India in 1935, British settler William
Gilbert Lilywhite introduced a primitive type of drum roaster to Kilifi through
which shelling, peeling and grading was done by hand in an open shed (Malhotra
2008: 273). Lilywhite also showed local smallholders how to cultivate cashews,
provided them with the seeds, and collected the nuts when ripe. The installation of
an improved drum roaster and new drying ovens in 1950 allowed his company to
process around 400 tons per year, using converted petrol tin cans to ship the kernels.
After Lilywhites passing, processing was taken over by the large shipping baron
Mitchell Cotts between 1960 and 1963, and processing capacity was further
increased to 800 tons per year (Malhotra 2008: 273).
After independence, the new Kenyatta-Government took control of the cashew
sector. In 1964, it nationalized Cotts’ factory, placing it under the ownership of the
National Cereals and Produce Board (NCPB), joined later by the Industrial and
Commercial Development Corporation (ICDC), the Industrial Development Bank
(IDB) and the Kilifi District Cooperative Union (KDCU). At the same time, the
Ministry of Agriculture (MoA) considerably increased extension services to cashew
farmers, provoking a quick expansion of cashew production. Although the factory
was able to increase its processing capacity to 1,500 tons annually (employing 385
workers), this was not enough to match the significant increase in production, with
nearly 70% of nuts exported raw to India (Malhotra 2008: 273). To process more
locally, the government on 11th September 1975 opened Kenya Cashew Nut Limited
(KCL), a large-sized factory with the capability to process 15,000 tons RCN

164
annually. Located in Kilifi town, the ownership structure of the company remained
similar to its predecessor’s.108
Figure 6.8. Map of Cashew and Macadamia Nut Growing Areas in Kenya
Source: Own illustration based on map from Lewis (2016).
Marketing and regulation of the cashew sector closely resembled that of many other
statist African countries during the time. Smallholders were organized by the
Ministry of Cooperatives into dozens of cooperatives and cooperative unions across
108 The NCPB owned 31.42% of the shares, the ICDC 24.38%, the IDB 9.2%, and the KDCU acted
as largest shareholder with 35% of the shares (Kenyan Ministry of Agriculture 2009: 12).
Main Cashew
Growing Area
Main Macadamia
Growing Area
165
the Coast, such as the KDCU or the large Kikuyu Lake Kenyatta Cooperative.
Importantly, the NCPB through the cooperatives owned the legal monopoly to
purchase the RCN from farmers. Pre-financed by the NCPB, the cooperatives
would grade and buy their members’ produce, and bulk them for collection among
other commodities, mainly maize. The NCPB would then collect the nuts and
transport them to their main storage houses, particularly to those in Kilifi and
Mombasa (Kenyan Ministry of Agriculture 2009: 12).109 At this point, the CEO of
the KNC factory (the only processor in the country) had the full decision power
over what amount of the crop collected by the NCPB could be shipped off raw to
India, and what amount was required to run the factory at full capacity.110 Usually,
the CEO would wait to give the RCN export clearance until the beginning of the
next season (around October/November), so that he could assess from the extent of
flowering whether the new season would provide sufficient supply. Importantly,
the KCL only had to pay the NCPB for the RCN supply once it received payment
for the processed shipment, the NCPB thus carrying the risk and relieving the KCL
from the high liquidity requirements African cashew processors today suffer
under.111 Figure 6.9 below, illustrates the cashew value chain prior to liberalization.
Importantly, not only was the KCL assured of sufficient supply, it received it
significantly below world market rates. Given the lack of exact farm gate price,
FOB price, and KCL purchase price data from these times, it is difficult to assess
exactly how much below world market prices the KCL paid and farmers were paid.
A former senior executive of KCL, however, claims that the FOB prices received
by the NCPB were up to three times higher than those they charged the KCL.112
Assuming the NCPB did not directly subsidize the KCL, it is likely that prices to
producers were relatively close to those paid by the KCL, and as such, significantly
below what they would have likely received under free-market conditions.
109 Former Senior Executive of KCL, Kilifi County, 18.10.2017; Senior official at Ministry of
Agriculture, Nairobi, 04.11.2017.
110 Former Senior Executive of KCL, Kilifi County, 18.10.2017.
111 Senior official at Ministry of Agriculture, Nairobi, 04.11.2017.
112 Former Senior Executive of KCL, Kilifi County, 18.10.2017;

166
Figure 6.9. The Cashew Value Chain in Kenya Prior to 1992
Source: Own Illustration
In sum, the marketing board structure in Kenya prior to liberalization performed the
same functions an export ban should: it secured affordable supply for processors.
At the same time, it came at a similar cost as export bans, significantly reducing the
prices and thus the income of farmers. Yet, there is not a single account of Kenyan
cashew farmers protesting in those times. Quite the opposite, former and current
cashew farmers at the Kenyan coast will often refer to this phase as the golden era
of cashew. This puzzle is well explained by the thesis’ theoretical framework. As
discussed in Chapter 3.1.2, the extraction of agricultural surplus through marketing
boards differs fundamentally from export bans in being much less transparent to
producers. Whereas prior to export bans, producers know what actual market prices
are and therefore have a clear contrast to the rapid fall of prices (as seen in Ghana),
farmers that have only farmed under a marketing board setting prices, rarely know
whether they are receiving significantly less than they ought to under free-market
conditions. And even if they felt prices were low, given the absence of informed
and informing traders, this was difficult for them to attribute to government action.
Farmer
Cooperative
NCPB
KCL
Foreign
Roaster
Foreign
Processor
Export

167
Moreover, in contrast to export bans, marketing boards also perform positive
functions for producers. Apart from making marketing more structured and
predictable, they often provide extension services, inputs such as pesticides, crop
financing, and other support. This was true for the Kenyan cashew sector: both the
Ministry of Agriculture and the KCL strongly supported farmers in maintaining
their trees through numerous extension officers, the Kenyan Agriculture Research
Institute (KARI, then named Coast Agricultural Research Station and founded in
Mtwapa, in 1957), as well as KCL’s own research department with five
agriculturalists trained at Eggerton University. 113 As such, whereas export bans
appear wholly destructive to farmers, marketing boards and cooperatives have a
highly visible positive side, while effectively hiding the disproportionate costs of
these benefits to farmers. This, I argue, explains how the Kenyan government (as
well as many other African governments) at the time could depress farm gate prices
to support cashew processing without having to fear any serious backlash from
farmers.
Overall, this period in the history of the Kenyan cashew industry was characterized
by successes in both production and processing. RCN production had increased
from around 5,000 tons in the mid-1960s to over 36,000 tons (Market Insider 2014)
in the late 1970s and 1980s, with a former employee of KCL claiming that
production had reached 50,000 tons in 1985.114 At the time, cashew presented the
key income source for Coastal farmers, still credited today by current and former
farmers for having been the reason many children in the region could be sent to
school.115 Paralleling the success in cashew cultivation, the KCL steadily increased
its profits and importance. The company could run at full capacity throughout the
year (except for a yearly one-month-maintenance period in December), allowing
the company to employ almost 4,000 people at its peak. As such, the company
almost single-handedly fuelled the growth of what is today Kilifi Town, the capital
113 Former Senior Executive of KCL, Kilifi County, 18.10.2017; Senior Manager of Lake Kenyatta
Cooperative Society, Per Telephone (Mpeketoni), 30.11.2012.
114 Former Senior Executive of KCL, Kilifi County, 18.10.2017;
115 Former Senior Executive of KCL, Kilifi County, 18.10.2017; Senior Cashew Cultivation Expert,
Kilifi County, 18.10.2017. Small-Scale Cashew Farmer, Kilifi County, 23.11.2017; Small-Scale
Cashew Farmer, Kilifi County, 23.11.2017.

168
of Kilifi County (Kilifi County 2016: 4). Exporting kernel primarily to the United
States, Europe, Japan and small amounts to the Middle East, KCL was able to
increase its net profit six-fold from Ksh 3 million (US$ 408,719) in 1975 to Ksh 26
million (US$ 2.38 million) in 1982, according to newspaper reports (Kithi 2004).
6.2.1. Disease, Cronyism, and Liberalization: The End of the Golden Era
The industry’s golden era ended abruptly in the late 1980s. Commonly referred to
as a period of ‘grand corruption’ (Branch 2010; Mwangi 2008: 278), the period was
characterized by President Arap Moi allowing his cronies to actively seek rents
from parastatals in order to hold his crumbling ruling coalition together. KCL was
one of the many parastatals affected. Interviewees argue that by around 1987, close
associates of Moi beset the company’s as well as the NCPB’s management to hand
over their profits and partake in export fraud.116 By 1989, KCL started experiencing
severe financial problems and in February 1990 it had to lay off the majority of its
employees (Kenyan Ministry of Agriculture 2009: 12).
At the same time, the cashew industry was hit by the harshest ecological crises it
had ever witnessed: the powdery mildew disease (PMD). PMD is a fungal disease
that attacks the young panicles and flowers of the cashew tree, and untreated can
completely eradicate a tree’s yield (Kenyan Ministry of Agriculture 2009: 25).
Generally, it can be treated relatively effectively and economically by blowing
Sulphur powder on affected trees several times during the flowering period, as has
been shown successfully in Tanzania (Smith and Cooper 1997). In the context of
an imploding governmental support structure, however, farmers who had been used
to receiving dedicated support in the form of advice and material by extension
officers, the KNC, NCPB, and KARI, were now stranded alone, shell-shocked by
the disease, which according to interviews destroyed up to 80% of the crop in some
years in the late 1980s. Cashew had turned from miracle to nightmare within only
a few years.117
116 Former Senior Executive of KCL, Kilifi County, 18.10.2017; Senior official at Ministry of
Agriculture, Nairobi, 04.11.2017; Senior Cashew Cultivation Expert, Kilifi County, 18.10.2017.
117 Senior Cashew Cultivation Expert, Kilifi County, 18.10.2017.

169
During its deepest crises, the Kenyan government decided to completely liberalize
the cashew sector. As part of the general implementation of SAPs that had started
in the 1980s and the privatization of all parastatals that were deemed non-strategic,
the Parastatal Reform Programme Committee (PRPC) recommended the
government in November 1992 to sell the 65% shares it held via the NCPB, ICDC,
and IDB (Kenyan Ministry of Agriculture 2009: 12). At the same time, it lifted the
marketing monopoly of the NCPB, which in the same year completely withdrew
from marketing cashew, and with it the key functions of financing cooperatives,
organizing transport, and reliably supplying KCL with affordable below-market
price RCN.
Perceived by many as one of the most damaging legacies of cashew liberalization
reforms, was the fraudulent privatization and eventual collapse of the KCL. In
compliance with the joint ownership agreement, the PRPC had recommended
granting the owner of the remaining 35% of the shares, the Kilifi District
Cooperative Union (KDCU), the pre-emptive right to buy the government’s 65%
share. Partly due to the high cost involved in buying the company and likely partly
due to greed,118 however, the three main directors of the KDCU119 had decided to
strike a deal with some of President Moi’s closest business friends.120 Allegedly
covered by close Moi-aide Lawi Kiplagat, the cooperative directors had bought the
remaining KCL shares with money from the private investors,121 and then without
the knowledge of their members immediately transferred them to the latter
(National Assembly of Kenya 07.12.1999, 11.07.2000, 30.10.2003, 11.04.2007).
By 1996, only three years after fraudulently acquiring 65% of the shares, the new
118 Valued at Ksh 141.2 per share, the 65% share of the government cost Ksh 78 million (US$ 1.34
million). Debts acquired by the KCL in previous years and due to the NCPB, ICDC, the Treasury,
and the Italian government amounted to over Ksh 118 million (US$ 2.03 million). Finally, the
company owed Ksh 33 million (US$ 0.56 million) in redundancy payments to former employees,
an amount never recorded during the transfer of the factory. In total, the KDCU would have had to
invest roughly US$ 4 million to finance the acquisition of the company – money it did not possess
(Kenyan Ministry of Agriculture 2009: 12).
119 General Manager D. Runya, Chairman Japheth Kahuku, and the Vice Chairman Gunga.
120 Joshua Kulei, and four other associates (C. Desai, N. Korir, ELK. Rotich, W.K. Sambu, and the
later managing director P.K.Shah).
121 Specifically, these investors were represented by Kenya Plantations and Products Limited
(receiving 51% of the factory shares) and Cashew Development Investment Limited (receiving
15%).

170
investors had managed to take over most of the remaining shares, management, and
eventually to oust the KDCU completely from the ownership of the company.122
Soon after, the KCL collapsed. From the beginning of the fraudulent share
acquisition in 1993, the factory had been facing heavy financial and operational
problems, leading to its temporary shut down on 28 February 1995. Eventually, in
1997, KCL collapsed under its financial and operational burden. Unable to service
an outstanding loan of about Ksh 95 million (Kenyan Ministry of Agriculture 2009:
13), Barclays bank put the company under KPMG managed receivership in 2000,
and on 8 May 2002 sold all assets, plant and machinery to Millennium Management
Limited (MML) for the comparatively small sum of Ksh 58 million (US$ 0.97
million).123
122 To maintain the appearance that the KDCU was in full ownership, the actual majority
shareholders had the KDCU appoint themselves as the management agents of the factory (Kenyan
Ministry of Agriculture 2009: 13). Now under the new name of Kilifi Cashew Nut Factory Limited,
the owners under the Management of P.K. Shah took complete de facto control of the day to day
business of the factory. Despite the KDCU still owning 35% of the shares, they had no representation
on its board. Soon after, the private investors than took over total de jure control as well. In 1996,
the KDCU received a loan of Ksh 2 million (US$ 35,000) from main owner Kenya Plantations and
Products Limited. Allegedly intended to purchase RCN, it had put 197,426 of its KCL shares -
equalling 23% of total shares and valued at a much higher Ksh 28.07 million in 1992 – as collateral
for the loan. When it failed to pay it back, these shares were transferred to the private investors. At
the same time, the KDCU also failed to pay back its loan to the Co-operative bank, which held and
thus received the remaining 12% of the shares as collateral (Kenyan Ministry of Agriculture 2009:
13).
123 The Kenyan-Asian owner of MML, Charanjit Singh Hayer, had no prior experience in the agro-
industrial sector, but led the major civil and structural engineering contractor ‘Hayer Bishan Singh
and Sons Limited’, raising initial suspicions that the company only sought the factory grounds to
expand their operations to the Coast, rather than for processing cashew. Kenya National Assembly
debate records show that both parliamentarians and KDCU members vehemently criticized the
auction, arguing that as long as the factory’s ownership was uncertain it could not be sold (National
Assembly of Kenya 30.10.2003: 3468). Instead, they demanded in parliament and at meetings in
Kilifi that the Attorney General should prosecute the persons involved in the fraud and that all shares
of the factory should be revered back to the KDCU (Thoya 24.06.2000; Mwaka 23.10.1999). Neither
demand was met. In the meantime, the new owner, MML, was accused by the Minister of
Cooperative Development and Management of further cannibalizing the company and therefore took
over the factory’s premises for a short while in October 2003 (National Assembly of Kenya
30.10.2003: 3468). As of 2017 it appears that MML is conducting cashew processing, although some
interviewees wondered aloud whether this is for profit or rather to cover other businesses and keep
down the occasional protest by Kilifi Town locals to return the factory to the KDCU (Jared
05.07.2015) and interviews with Senior Director of Ministry of Agriculture, Livestock, and
Fisheries, Kilifi County, 23.10.2017; Former Senior Official of Coast Provincial Directorate for
Agriculture, Nairobi, 06.11.2017; Former Senior Executive of KCL, Kilifi County, 18.10.2017;
Senior official at Ministry of Agriculture, Nairobi, 04.11.2017; Senior Cashew Cultivation Expert,
Kilifi County, 18.10.2017.

171
Figure 6.10. The Cashew Value Chain in Kenya After Liberalization.
Source: Own Illustration
The questionable intentions and management of the new KCL ownership – best
characterized by its cannibalization of the factory124 – was undoubtedly important
to its eventual demise. Yet, interviewees claim that the inability of the KDCU and
124 As described by the head of the parliamentary committee that had investigated the case, Kipipiri
MP Mwangi Githiomi, the Moi cronies transferred large parts of the company’s machinery and
equipment to their sister companies in Kenya (Kenya Bixa Limited) and Tanzania (National
Assembly of Kenya 07.12.1999: 2829–2830).
Farmer
Village-
Shop
Mid-Level
Agent
Top-Level
Agent
Collection
Centre
Processor
Bicycle
Traders
Foreign
Roaster
Local
Consumer
Foreign
Processor
Export
Exporters

172
KCL to acquire enough raw supply was perhaps even more damaging.125 Two
factors conjointly explain this inability. First, the liberalization of the marketing
system exposed the KDCU and KCL to competition it could not equal. As described
above, the NCPB carried all financial risk, solved common liquidity and transport
problems by pre-financing cooperatives and the KCL and organizing storage and
logistics. With the exit of the NCPB from the sectors, cooperatives – particularly
the KDCU – had to assume these functions. However, it largely failed to do so. The
cooperatives lacked the financial means to pre-finance farmers, bank loans were
expensive, slow or not forthcoming, and the KCL now facing its own increased
financing cost was not able to actively pre-finance cooperatives. With the Ministry
of Cooperative Development and Management also reducing its attention on the
cooperatives after liberalization, mismanagement of cooperatives by its directors
increased, leading to farmers being paid late or not at all, and attempts at copying
NCPB’s logistical infrastructure to miscarry (Malhotra 2008).126
Weakened by the dismantling of the state marketing system, cooperatives and the
KCL failed to compete with the entrants on the now liberalized market. Shortly
after liberalization in 1992, particularly Indian and Kenyan Asian traders entered
the market to purchase and export RCN, with strong demand from Indian
processors. To purchase the nuts from farmers, these exporters relied on local
traders (or brokers).127 Soon after liberalization, brokers and exporters started to
dominate marketing (compare Figure 6.10 for an illustration of the typical Value
Chain between 1992 and 2009). Able to offer significantly higher and faster
payments traders rapidly outcompeted cooperatives and most had dissolved by the
125 Former Senior Executive of KCL, Kilifi County, 18.10.2017; Senior Cashew Cultivation Expert,
Kilifi County, 18.10.2017
126 Senior Director of Ministry of Agriculture, Livestock, and Fisheries, Kilifi County, 23.10.2017;
Former Senior Official of Coast Provincial Directorate for Agriculture, Nairobi, 06.11.2017; Former
Senior Executive of KCL, Kilifi County, 18.10.2017; Senior official at Ministry of Agriculture,
Nairobi, 04.11.2017; Senior Cashew Cultivation Expert, Kilifi County, 18.10.2017.
127 Local cashew traders were mostly former cooperative officials, former tourism sector employees
in search of work when the sector crashed after the 1998 US Embassy bombings, former field agents
of processors, and traders of other commodities. Information required through interviews with:
Senior Cashew Consultant, Nairobi, 06.12.2017; Top-Level Cashew Agent, Per Telephone,
13.12.2017; Senior Officer at the NOCD, Per Telephone, 01.12.2017.

173
late 1990s.128 With KCL’s collapse in 1997, in-shell exporters and traders (and a
hand-full of micro-processors) were the only relevant buyers on the market.
6.2.2. New Processors, Same Problems: The Beginning of Lobbying for an
Export Ban
After the closure of KLC in 1997, it took three years for the next larger cashew
processing factory to open shop. In 2000, Bobby Thomas, who had been exporting
raw cashew nut from Mombasa since 1998, decided to open his own cashew
processing factory next to KLC in Kilifi Town. Three years later, the macadamia
processing giants from Central province, Kenya Nut Company (KNC, owned by
Pius Ngugi) and Equatorial Nuts (owned by Peter Munga), expanded their business
into processing cashews. With KLC partially revived under MML and the later
entry of another central province macadamia processor, Jungle Nuts (founded by
former KNC employee and now MP, Peter Wainaina), the number of active cashew
processors in Kenya had expanded to five by the mid-2000s. The entrance of these
players in the industry is traced nicely in Figure 6.11 below, detailing the share of
processed in total cashew exports (based on import data from importers). From only
5% processed exports in 2000, by 2006 over 40% of exports were shelled.
Essentially, processors had profited from stagnating world demand and resulting in
lower RCN buying prices in the first half of the 2000s.129
128 Whereas cooperatives would generally pay farmers with some delay, brokers paid directly. As a
lead cashew procurer of a major processors as well as a senior manager of Lake Kenyatta
Cooperative Society remembers that brokers in the 1990s could offer up to double the price of
cooperatives, with prices regularly pushed above the Ksh 70 (US$ 1.20) mark (and according to
some even above the Ksh 100 mark), a far cry from the prices after KLC had collapsed the first time
in 1990 or those offered by cooperatives even after liberalization (Onsongo 2006; Kihara
03.05.2016; Malhotra 2008). The most detailed survey of the sector to date, the “Cashew Nut Tree
Census and Baseline Survey in the Coast Province”, in short “the 2008 Tree Census” (IDMS 2009:
26), describes that in 2008 only 9.8% of cashew farmers remained members in farmer organizations.
Without the support of the cooperatives, KCL too failed to compete with exporters. As a result, the
majority of the crop was exported in-shell even prior to KCL’s collapse.
129 Lower global demand translated in less demand (and thus competition) from Indian processors.
Second, lower RCN buying costs imply lower financial costs for Kenyan processors, hence, reducing
one of the competitive advantages Indian processors have (i.e. lower interest rates). Thus, world
market conditions made Kenyan processors more competitive in a period of decreased competition,
allowing them to process a greater share.

174
Figure 6.11. Share (%) of Processed Nuts in Total Kenyan Cashew Exports (based
on mirror data), 2001-2017
Source: Own Illustration, based on data from the UN Comtrade database
(DESA/UNSD 2019). Mirror data is the data provided by Kenya’s trade partners.
That is here, the nuts-in-shell equivalent processed volume in tons divided by the
nuts-in-shell equivalent total volume in tons imported from Kenya as reported by
all countries in the world.
In the 2007/8 season, however, Indian raw exporters re-entered the market more
aggressively. As Figure 6.11 illustrates, domestic processing lost competitiveness
versus raw exports, with the share of processed exports dropping over 20% within
one year. Essentially, during the time Kenyan processors could only hope to fetch
for their factories what Indian exporters would not buy. Normally, Indian exporters
would enter the market only for the main season (from early January to end of
March) aiming to quickly fill up containers for ships headed to India. This left
domestic processors with the earlier low season to buy nuts from middlemen (mid-
October to end of December), representing around 30% of the total crop, as well as

175
the periods in the main season where no ship to India had harboured in Mombasa.130
Depending on the risk middlemen would want to take and the finances they owned,
these could, however, store nuts in their own warehouse and wait for new Indian
exporters to sell it for around double price, rather than sell it to processors. As a
consequence, all five major nut processors in Kenya at the time were facing closure,
as later explained by Wondernut owner, Bobby Thomas (Kathuri 2014).
It is in this context that Kenyan nut processors actively and successfully started
lobbying the government for a raw nut export restriction (Daily Nation 2008;
Kathuri 2014).131 Heavily internally divided (due primarily to competition among
them for macadamia supply), the processors, however, managed to pull together in
light of a common enemy and created the Nut Processor Association of Kenya
(NutPAK) in 2009. Then Minister of Agriculture (and current Deputy President of
Kenya), William Ruto, both in August 2008 and April 2009 stated his intention to
ban the export of RCN, naming value addition as well as employment protection
and creation as core rationale (Oyuke 2009). After a meeting of Ruto with cashew
actors at Pwani University in Kilifi on 28 March 2009, the minister ordered a
Cashew Nut Revival Task Force (CNRTF) on 9 April 2009 to come up with
recommendations on how to revive the cashew industry and submit a report by the
end of April, i.e. de facto within less than two weeks (Kenyan Ministry of
Agriculture 2009). As summarized in the final Task Force Report (Kenyan Ministry
of Agriculture 2009), Ruto appointed four members to the task force: John Safari
Mumba, former Managing Director of KCL (1982-1987), former MP for Bahari
Constituency, and current Chairman of the Kenyan Cashew Growers Association,
as chairman of the task force; as well as Francis Muniu from KARI; Nancy Abisai
from the NGO Policy Advocacy Shelter; and Margaret Kavenge Masaku, an
Assistant Director in MoA.
As traced in the CNRTF’s report, in the last week of April 2009, the task force
conducted several meetings with members of the key cashew interest groups along
the Coast: farmers, processors, exporters, agricultural officials, politicians, donors,
130 Lead Cashew Procurer for Big Five Processor, Per Telephone, 08.12.2017; Top-Level Cashew
Agent, Per Telephone, 13.12.2017.
131 Senior official at Ministry of Agriculture, Nairobi, 04.11.2017.

176
and NGOs. The core positions of the main actors in the cashew value chain were
summarized in the same report and confirmed in interviews by former
participants.132 Unsurprisingly, processors that focused only on processing cashews
(such as KNC or Equatorial Nut), pushed for an immediate ban of RCN export and
suggested the creation of a fixed price system. Processors which did some RCN
exporting as means of meeting liquidity requirements (i.e. Wondernut), preferred
an export levy over an outright ban of RCN exports. Exporters (arguably
underrepresented in meetings, with brokers completely absent according to a former
senior official of the Coast Provincial Directorate for Agriculture)133 argued
strongly against a ban, claiming local processing was not viable given high local
costs of processing compared to competitors abroad. Former and current
agricultural officials working on cashew, however, appeared to be wholly in favour
of a ban.134
Perhaps the most interesting position was that of farmer representatives. Initially,
farmers were sceptical of the idea of an export ban. Interviewees who had attended
the meetings reported that several farmers raised the warranted concerns that the
ban would ostracize exporters from the market and with them, the significantly
better prices they paid.135 At the same time, farmers emerged from a ten-year period
of relatively low136 and volatile prices, disillusioned with the decline of the sector,
which in their minds coincided with the liberalization of the market, identifying the
decline of the sector with the onset of liberalization. Correspondingly, according to
the three interviewees, many farmers and officials conflated the more stable golden
132 Former 2009 Cashew Task Force Member, Kilifi County, 18.10.2017; Senior Manager of Lake
Kenyatta Cooperative Society, Per Telephone (Mpeketoni), 30.11.2012; Former Senior Official of
Coast Provincial Directorate for Agriculture, Nairobi, 06.11.2017.
133 Former Senior Official of Coast Provincial Directorate for Agriculture, Nairobi, 06.11.2017.
134 Former 2009 Cashew Task Force Member, Kilifi County, 18.10.2017; Senior official at Ministry
of Agriculture, Nairobi, 04.11.2017; Former Senior Official of Coast Provincial Directorate for
Agriculture, Nairobi, 06.11.2017.
135 Former 2009 Cashew Task Force Member, Kilifi County, 18.10.2017; Senior Manager of Lake
Kenyatta Cooperative Society, Per Telephone (Mpeketoni), 30.11.2012; Former Senior Official of
Coast Provincial Directorate for Agriculture, Nairobi, 06.11.2017.
136 Indeed, 74.8% of farmers had indicated in the 2008 Tree Census that low prices were their
primary issue with the current marketing system. Only 6.3% of farmers identified unpredictable
prices as the key concern (IDMS 2009: 29).

177
era of the industry from 1975 to 1987 with a more restricted state-controlled market.
Moreover, the members of the task force actively tried to enforce that perception,
making the economically questionable case that an export ban would increase and
stabilize farm gate prices. Eventually, most farmers present at the meeting agreed
to the idea of an export ban, under the explicit condition that a functioning and fair
minimum farm gate price system was implemented by the Government beforehand
as had been the case in the earlier period of the state-regulated market (Kenyan
Ministry of Agriculture 2009: 22).
Based on these discussions, the task force formulated seven clear recommendations
in its report (Kenyan Ministry of Agriculture 2009). First, MoA should establish a
cashew nut revitalization desk with immediate effect to co-ordinate the report’s
recommendations. Second, MoA should with immediate effect establish a
regulatory apex body for the development of the cashew nut industry, to be named
the Kenyan Cashew Nut Development Authority (KECADA). Third, KECADA
should initiate the process of formulating a Cashew Nut Policy independent from
other crops. Fourth, immediately following the formation of KECADA, regulation
for minimum farm gate price should be put in place. Fifth, the government in
conjunction with KECADA should establish funds to support farm input subsidies
as well as guarantees for public-private partnerships financing cashew farmers.
Sixth, the Ministry of Cooperative should reconstitute and revive former farmers’
cooperatives. Finally, and most importantly, only once these other
recommendations have been put in place (particularly the minimum price) should
the government consider implementing an export ban on RCN. Moreover, this ban
should be reviewed regularly regarding its effects.
On 16 June 2009, barely one month after the report had been submitted and to the
big surprise of the CNRTF137, Minister Ruto published138 “The Agriculture
(Prohibition of Exportation of Raw Nuts) Order, 2009”, banning the export of raw
cashew and macadamia nuts (William Ruto, Minister of Agriculture 17.07.2009).
137 Former 2009 Cashew Task Force Member, Kilifi County, 18.10.2017; Senior Cashew Cultivation
Expert, Kilifi County, 18.10.2017.
138 Minister Ruto, however, only publicly announced it on 30 July in Nairobi, stating “Why we are
imposing the ban is to protect farmers from exploitation by middlemen” (Muiruri 30.07.2009).

178
In clear contravention of the CNRTF’s explicit instructions, the MoA had
implemented none of the six recommendations prior to the ban. No revitalization
desk or apex body was built, no cashew policy formulation started, no funds
established, and most importantly, no minimum price was set. Moreover, his
proclamation that the NCPB would resume its original monopoly marketing
function in the market was never realized, with NCPB officials telling The Daily
Nation and Business Daily that MoA never allocated the required funds (Kihara and
Bocha 2010; Wachira 2009). Participants of the process remember that the
progression from launching the task force to publishing the order seemed extremely
short and rushed.139 Given Minister Ruto’s clear statements in favour of a ban
months prior to setting up the task force, as well as with the knowledge of active
lobbying by processors for a ban starting around 2008, several interviewees (who
were generally in favour of a ban) have raised the suspicion that he set up the task
force to quickly and with a semblance of consensus impose a raw export ban to
rescue processors, rather than the sector at large.140
Up to this point, the Kenyan cashew ban story strongly resembles the Ghanaian
previously discussed. Processors struggled to source enough supply against foreign
competitors and started lobbying for a ban. Government officials were generally
supportive of the idea and held meetings across the growing area to float it.
Exporters reacted with strongly negative feedback and farmers were sceptical. And
eventually, a raw nut export ban was surprisingly rapidly introduced,
unaccompanied by any measures that could have eased its impact on farmers.
Despite the similarities between the Kenyan and Ghanaian cashew cases, there is a
fundamental difference: the ban in Kenya is still in place. Whereas it took farmers
and traders less than a week to put so much pressure on the government that it
withdrew it, ten years after its introduction the ban in Kenya stands. What explains
this significant divergence?
139 Former 2009 Cashew Task Force Member, Kilifi County, 18.10.2017; Former Senior Official of
Coast Provincial Directorate for Agriculture, Nairobi, 06.11.2017; Senior Cashew Cultivation
Expert, Kilifi County, 18.10.2017.
140 Former Senior Official of Coast Provincial Directorate for Agriculture, Nairobi, 06.11.2017;
Senior Cashew Cultivation Expert, Kilifi County, 18.10.2017; CEO of Big Five Nut Processor,
Nairobi, 07.11.2017.
179
6.2.3. The Politics of the Kenyan Cashew Ban Maintenance
The Ghanaian cashew case findings support the mechanisms and hypotheses related
to this thesis. How does this compare to the Kenyan cashew case? Did traders
ensure that producers were informed and organized against the ban? Did producers
eventually protest the severity of it? And if so, was it, as the theoretical argument
would imply, that the government did not take their opposition seriously since
farmers lacked the numbers to pose a political threat? The following two sections
will address these questions in detail.
6.2.3.1. Active Traders and Late Attribution
As in Ghana, agitated raw cashew traders in Kenya actively tried to inform farmers
about the ban. At the forefront was Samuel Varghase, the chairman of the
Cashewnut Exporters and Processors Association (the name of the organization is
a bit deceptive: it does not represent any processors, but only exporters and leading
brokers). Soon after Minister Ruto’s official announcement of the ban in July 2009,
in an interview at his office in Mombasa, Varghase complained to the Daily Nation
that the ban would disillusion farmers and lead to massive price drops (Mwajefa
2009). In the same interview, Varghase also had a farmer from Lamu speak, who
claimed that he had come to Mombasa to sell Ksh 200,000 (US$ 2,600) worth of
raw cashew nut, but no exporter – including Varghase – was willing to buy it. This
story is rather unlikely to be true, given that no cashew is produced in July (and
such quantities are unlikely to be stored by farmers or bought by exporters at that
time of the year). Moreover, in the same interview, Varghase claimed that a ban
had been implemented some years prior that had allegedly caused production ‘to
drop from 10,000 tons to 4,000 tons in the region’ and when exporter came back
into the market prices increased by 40% and ‘production shot to 12,000 tons’. While
I could not find a single document or person in three months of fieldwork in Kenya
that would corroborate this statement (and many experts that vehemently denied its
truth), this interview makes clear that as in Ghana, raw cashew exporters in Kenya
actively and rapidly tried to convey the message to farmers that a ban was a serious
threat to their livelihoods. Furthermore, senior managers at Lake Kenyatta
cooperative in Lamu confirmed that it was Varghase himself that first informed

180
them of the ban, indicating that traders actively tried to inform farmers through
other means than the national media.141
Importantly, however, during the first months of the ban, the traders’ information
campaign failed to gain traction among producers. The key reason for this was its
timing respective to the cashew season. In contrast to the imposition of the ban in
Ghana, which happened right during the main season, the Kenyan cashew ban was
introduced four months prior to the beginning of the season. As such, farmers were
not able to experience the effect of the ban immediately and therefore were without
a reason to notice or care about it, despite attempts by traders to inform them.
Similarly, traders were not able to pull the rug out under the marketing of the nut,
as was possible for traders in Ghana. And even after the first smaller season began,
it took most farmers some time to even become receptive to traders’ information
campaigns. As indicated above, it was normal for exporters to enter the market
towards the main season, hence around December/January. Accordingly, prices –
paid primarily by processors – in the first smaller season were always a bit lower.
As such when prices in the low season did not exceed Ksh 20 (US$ 0.26) per kg in
October 2009 (with many brokers offering as low as Ksh 10 per kg142), this
appeared very low to farmers, but not completely inexplicable.
According to Daily Nation reports at the time, when prices failed to cross the Ksh
20 per kg mark despite the advancement of the season, more farmers got
increasingly wary. This was particularly true for farmers with direct connections to
larger and thus more informed and informing traders. Initially, directors of the
relatively well-organized Kikuyu Lake-Kenyatta cooperative, with direct marketing
connections to Varghase and other exporters, started to smell trouble in mid-
November 2009 and listen more closely to Varghase’s warnings. Accordingly, in a
Daily Nation interview, former Lake Kenyatta Cooperative chairman Julius
Ndegwa is quoted as saying that producers were only getting Ksh 20 per kilo
compared to Ksh 50 to 60 during the previous year, stating that Lamu farmers “want
the ban to be lifted to encourage competition so farmers can earn better prices”
141 Senior Manager of Lake Kenyatta Cooperative Society, Per Telephone (Mpeketoni), 30.11.2012.
142 Senior Manager of Lake Kenyatta Cooperative Society, Per Telephone (Mpeketoni), 30.11.2012.

181
(Beja 2009). Nevertheless, at that point, most less organized and trader-connected
farmers remained uninformed according to interviewees.143
When at the beginning of the main season in January prices were still not increasing
significantly, most farmers started to feel that something was different and became
more receptive to trader information. Spurred on by traders, farmers increasingly
started to contact the responsible authorities in MoA and the Coast Provincial
Directorate of Agriculture, as well as former members of the cashew ban Task
Force, particularly chairman John Mumba about whether it was true that the
government was to blame for the price drop.144 As a result – and also because they
themselves were shocked by severity of the price drop – the responsible officer in
the MoA Horticulture Department, Patrick Onchieku, and the Coast Provincial
Director of Agriculture, Phoebe Odhiambo, called in a meeting of the major actors
in the value chain to put these issues to discussion. According to a Lake Kenyatta
farmer leader, it was through this meeting and the explicit discussion of the ban and
prices that many of his peers in other areas of the coast conclusively linked the
severe price drop to an intervention of the government.145
Although most major cashew farmers had likely become aware by the end of that
meeting of the imposition of a ban, a large part of cashew farmers likely had not.
This is explained by two factors. First, most cashew farmers (if defined as having
at least one tree) in Kenya were barely interested in the crop anymore at that point.
In its 2008 ‘Tree Census’, the IDMS (2009) surveyed that in in 2008 68,954 farms
in Kenya owned at least one cashew tree. Importantly, however, only 5% (4,054
farmers) of these owned over 100 trees, which is the average number of trees
Ghanaian smallholders own (ACi et al. 2015). In contrast, 75% of Kenyan “cashew
farmers” own fewer than 20 trees (with almost 45% owning fewer than ten trees).
Such a farmer, owning fewer than 20 trees prior to the ban in Kenya would have
made a maximum profit of less than US$ 30 a year, assuming yields higher than
143 Former 2009 Cashew Task Force Member, Kilifi County, 18.10.2017; Senior Manager of Lake
Kenyatta Cooperative Society, Per Telephone (Mpeketoni), 30.11.2012.
144 Former 2009 Cashew Task Force Member, Kilifi County, 18.10.2017; Senior official at Ministry
of Agriculture, Nairobi, 04.11.2017; Former Senior Official of Coast Provincial Directorate for
Agriculture, Nairobi, 06.11.2017.
145 Senior Manager of Lake Kenyatta Cooperative Society, Per Telephone (Mpeketoni), 30.11.2012.

182
such farmers normally make.146 Accordingly, even farmers that owned one hundred
trees did not make a net profit of more than US$ 150 prior to the ban (in contrast,
the average Ghanaian cashew farmer received more than six times that profit, US$
950). The bottom line is that back then, the vast majority of so-called cashew
farmers in Kenya could barely be considered as such. Therefore, most of them did
not care much for price drops, nor were they organized in cooperatives anymore
(only 9.8% of the 69,954 farmers were still members in farmer organizations
according to the IDMS survey), whose leaders (possible present at the above-
discussed meeting) could have informed them. In line with this, two of the smaller
cashew producers I talked to in Kilifi eight years after the ban had still not realized
that a ban was introduced.
Concluding, traders again played a crucial role in informing farmers about the ban,
but it took many farmers longer than in Ghana to fully realize and care about it
given its introduction in the off-season. Moreover, most farmers had such low
stakes in cashew given low prices and yields that they simply did not care much
what happened to the crop, thus also did not realize it happened. Overall, this case
exemplifies well why it is usually not sufficient for traders to want to inform
producers, but that it is often necessary for producers to realize that an issue is really
occurring.
6.2.3.2. Limited Farmer Mobilization and the Lack of a Political Threat
The previous section established that the export ban in Kenya had indeed become
perceptible to active cashew farmers with the help of traders. The next question is
whether this realization by some farmers that the government had imposed an
extremely damaging ban translated into their active mobilization? And if so, to what
extent was this perceived as relevant or even threatening by politicians?
Collective action and protest against the ban did occur. In line with the fact that
only a limited number of more serious and thus organized cashew farmers cared (to
146 Assuming the maximum of 19 trees owned in that category, an optimistic 10kg/tree yield, as well
the average price of US$ 0.35 per kg in the 2008/9 season (FAO 2018b), the total revenue from
cashew would have stood at US$ 66. Given an estimated production cost of around US$ 2 per tree,
we would have to subtract $US 38 to receive the net profit of US$ 28. While such farmers are
unlikely to invest as much in in production, the consequence would also be yields closer to 5kg, and
as such, on balance, this net profit appears a fair estimation for a farmer owning that few trees.

183
know) about the ban, the number of people mobilized was limited. Throughout the
main season in the first quarter of 2010, it was primarily Lake Kenyatta Cooperative
directors147, particularly chairman David Gikaru, who complained in the media
about persistently low prices, the lack of support (unsuccessfully pushing for the
NCPB to resume its role), and the lack of information on the ban (Kihara 2010;
Kihara and Bocha 2010).
The most significant moment of farmer and trader collective action occurred during
the 2010 main season. According to one of the leading cashew brokers at the Coast,
local brokers with the support of exporter association chairman Varghase organized
three relatively small and short protests in March 2010.148 Organizers describe the
protests as having occurred for half an hour each with around 100 participants on
average in the three area capitals Mpeketoni (Lamu), Kilfi Town, and Kwale.149
Crucially, however, these protests appeared to have had little traction, particularly
in convincing local or national politicians that this issue was important. The top-
level Kenyan cashew agent150 that organized the protest described his experience
as follows:
‘Us brokers we knew immediately that the ban had happened. Varghase
organized us. And then in 2010, we protested a bit. It was in the media twice.
We did it in all three counties. Around 100 people participated in each
protest. To be honest, it wasn't very powerful. The notice to make the protest
was relatively short. I was the one that mobilized most people, I was the
central organizer of the protests. But I couldn't manage to bus many people
there. Garsen [Tana River County] MP Mungatana supported us a bit, but
147 Given their greater organizational capacity and quality of nuts, Lamu Cooperative farmers tended
to get higher prices (easily above US$ 0.7, provided Asian buyers were in the market), and higher
margins (as well as cashew usually being their key cash crop), hence, also had higher stakes.
Accordingly, it is coherent that Lamu farmers were those that voiced their concerns and led farmer
protests most actively among all Coastal cashew farmers. Why this might not, however, have been
enough to constitute a significant threat to Kenyan politicians will be discussed in the next section.
148 This was confirmed in interviews with participants, including a journalist covering the story,
though these could not remember the exact date of the protests and the journalist’s articles were not
available anymore.
149 Top-Level Cashew Agent, Per Telephone, 13.12.2017.
150 Top-Level Cashew Agent, Per Telephone, 13.12.2017

184
he was the only Coast politician. No other politician cared for us. Mungatana
promised us to talk to Ruto, but nothing happened. We only protested once
for one hour each. The media could take some photos and then it was done.
Afterwards, nothing was done. The farmers were too weak. We really tried
to contact many politicians, but nobody was really listening. Coming from
the Minister, the directive was very powerful.’
The sentiment that Coastal and Nairobi-based politicians did not care about cashew
farmers was strong throughout my interviews with actors in the sector. As a senior
officer of the Nuts and Oil Crops Directorate151 (the government body responsible
since 2014 to regulate the cashew and macadamia sector) put it:
‘Politicians at the Coast do not care for the cashew farmers. We made a
meeting in 2014 with the MPs of the Coast to coordinate lobbying more
funds for the Coast. Not one single MP showed up. They are not for the
welfare of the Coastal people, but only their own familiar welfare. Compare
it to coffee [one of the largest, most employment-intensive sectors in the
country, historically known to be a relevant political constituency]. The
coffee farmers are given loans. And if they defer, it doesn't matter, because
the politicians will write-off their loans. The MPs of Central Region know
how to lobby the different state institutions to support their farmers.
And indeed, in nine years since the introduction of the ban, only two politicians
have publicly opposed the ban in the national media. In both cases, these were
politicians from Lamu (MP Julius Ndegwa and Women Representative Shakilla
Abdalla); and in both cases these statements were made shortly before the 2017
elections (Praxides 2017; Praxides 2017).
Given previous discussions, it should not come as a big surprise that politicians
seeking to stay in office are not particularly phased by the concerns of cashew
farmers. As described above, significantly less than 10,000 farmers on the coast can
be considered seriously interested in the crop. This is not only a minimal number
of potential voters in national terms (with over 22 million Kenyans in 2009 having
151 Senior Officer at the NOCD, Per Telephone, 01.12.2017.

185
been older than 18 years [World Bank 2018]), but even just concentrating on the
Coast, with 1.86 million potential voters in Kilifi, Kwale, and Lamu (Kenya
National Bureau of Statistics 2018). Simply eye-balling these numbers already
provides a tangible feeling that, in contrast to Ghanaian cashew farmers, serious
cashew growers in Kenya could not bring sufficient numbers to the elections or be
of any other significant threat. Thus, it is understandable that policy-makers saw no
political danger in introducing the ban and no need to withdraw it.
6.2.4. Conclusion of the Kenyan Cashew Case
The Kenyan cashew case strongly resembles the Ghanaian in many aspects. Traders
actively sought to inform producers about the ban. Producers only really became
receptive to this when the price distortion became clearly noticeable. Once it did,
traders helped to organize peasant and trader protest. Critically, however, this
protest did not have the same effect in Kenya as it did in Ghana. Overall, it is highly
likely that given the minimal share of the population gaining a significant part of
its income from cashew, policy-makers perceived no significant political threat
from imposing and maintaining the ban. Given that the share of active producers is
not increasing in Kenya – in fact, it is decreasing each year – it is unlikely that this
will change.
It needs to be noted that the Kenyan cashew case is a special one in the broader
context of this thesis. As emphasized in Chapter 2.4 and Chapter 4, when production
volumes are low, governments have little incentive to ban the export of a
commodity, as the economies of scale for feasible processing or processors who
would lobby for a ban are unlikely to exist. Yet, despite having very low production
volumes at the time of the ban,152 the government implemented a ban nevertheless.
The reason is that the Kenyan cashew sector is a rare case in the sense that
production numbers used to be high, allowing a significant processing industry to
emerge, which (even or especially when production numbers were lower) needed
protection. This uncommon combination of a processing industry needing
protection and few producers explains why Kenya has been the only cashew
152 Around 10,000 tons. Compare Appendix 6.2 for an illustration of RCN production estimates from
1990 to 2017.

186
producing country in Africa which was both interested in and able to implement a
cashew export ban thus far.
The Kenyan cashew case is also interesting regarding its history with a state
monopsonist marketing structure. The evidence appears to indicate that the cashew
marketing board and parastatal significantly paid producers under market value.
Producers, however, were largely unaware of this price distortion, I argue mostly
because the actors (e.g. traders) that could have informed them were absent. This
provides an initial window of analysis into the secondary thesis argument that this
opacity of marketing boards’ price distortive mechanism was what allowed African
governments to massively distort producer prices during the three decades
following independence.
Lastly, it is worth noting that Kenyan cashew farmers do not seem to realize how
severe the long-term price effect of the ban has been. Whereas most farmers had
realized and noticed the effect of the ban during the first months of its
implementation, during my visit in late 2017 none of the farmers I had interviewed
(not even the more organized ones) were aware that cashew farm gate prices across
the border in Tanzania have grown to be nearly three times higher (US$ 1.4 versus
US$ 0.5 at the time of study). This demonstrates how poor farmers’ knowledge of
world market prices can be – even in times where this knowledge is literally one
Google search away. This not only helps to further clarify why the ban’s price shock
itself is a critical factor in explaining when producers become aware of a ban and
its relative price effect, but it also further supports the assumption that farmers were
very unlikely to be aware of world market prices in times of marketing boards.

187
6.3. Mixed but Mostly Mild Macadamias: The Introduction and
Defence of the Kenyan Export Ban on In-Shell Macadamia
Nuts
As in cashew, Europeans played a central role in the early history of Macadamia in
Kenya. The first macadamia trees cultivated in Kenya were introduced from
Australia in 1944 by European settler Bob Harries at his 500,000-acre Karamaini
estate near Thika town, around one-hour drive northeast of Nairobi (Gitonga et al.
2009: 49–50). At the time, the nuts produced on the farm had no commercial value
and served only ornamental and household consumption purposes (Sato and
Waithaka 1998: 1–2). In 1964, Harries founded Bob Harries Ltd. and decided to
invest in the wide-spread expansion of the crop. First, further seeds of the two key
macadamia types M. Integrifolia and M. Tetraphylla (as well as hybrids thereof)
were introduced from Australia, Hawaii and California, and in 1968 Harries grafted
his own first seedlings (Gitonga et al. 2009: 49–50). Building large seedling
nurseries, he started to propagate and supply macadamia seedlings as a
complimentary cash crop to non-African estates and particularly African
smallholder farmers mostly in the Central Kenyan coffee-growing zone,
particularly Embu, Meru, Kirinyaga and Thika districts (Muthoka et al. 2008; Sato
and Waithaka 1998: 1–2). By 1974, Harries had already supplied 800,000 (mostly
ungrafted) seedlings to farmers in central and eastern provinces (Gitonga et al.
2009: 49–50), leading to a steady rise of production.
Struggling to do so himself on a larger scale, Harries initiated a campaign in 1969
to convince the Kenyan Government to commercialize macadamia nut growing and
establish processing and marketing (Sato and Waithaka 1998: 1–2). Motivated by
this and supported by a positive FAO feasibility study, in 1974 the government (and
particularly macadamia researcher Dr Waithaka) facilitated a joint venture153 of
Japanese investors (primarily Yoshiyuki Sato) and Kenyan Pius Ngugi in setting up
the Kenya Nuts Company (KNC) in Thika. Whereas Sato had founded and run a
153 The exact distribution of shares between Ngugi, Sato, and other investors at the time are
unknown. As of 2017, according to an interviewed senior executive at KNC Ngugi owns over 90%
of the shares, with Sato retired from working as MD since 2007 likely still owning around 5%.

188
textile factory in Nairobi in the 1960s, Ngugi was a large-scale macadamia and
coffee farmer from Thika who was in search of a market for his nuts.
In the decades to come, as Kenya Cashew Limited (KCL), KNC would prove to be
the dominant actor in the sector. The company built a modern processing plant
(directed by Sato), established its own macadamia plantations (directed by Ngugi),
starting with about 400ha, and set up a nursery for the propagation of adapted and
grafted cultivars to supply out-growers (Vandenabeele 5: Sec1:22). By 1975, the
company commenced to purchase, process and market the nuts from farmers (Sato
and Waithaka 1998: 2). Like the NCPB in cashew, KNC had the monopoly
purchase right for in-shell nuts and, apart from its own plantation, sourced 90% of
its supply farmers, through 140 small-holder coffee cooperative societies as well as
47 additional buying centres (Sato and Waithaka 1998: 2). In contrast to KCL,
however, interviewees at the Ministry of Agriculture describe that KNC did not
require support from the government to finance the marketing system, largely
explained by Ngugi’s own significant wealth.154 Once farmers had delivered their
produce at the cooperative collection centre, they would get a receipt with a pre-
agreed price per kg. KNC would then collect the nuts when enough quantity had
been accumulated and after some days transfer the payments to the cooperative
banks, which farmers could collect by producing their receipts. For the service, the
cooperatives would receive a 10% commission (Sato and Waithaka 1998: 3). Figure
6.12 below provides a simplified illustration of the macadamia value chain prior to
liberalization.
154 Despite being one of the wealthiest people in Kenya, very little about the origin of his initial
wealth is known. What we do know is that his ability to invest in KNC came from the large tracts
of land he owned around Thika (probably the most expensive rural land in East Africa). What we
do not know, however, is the origin of this landownership. Some interviewees speculate that Ngugi
was close to the presidential (Kenyatta) family and as other co-ethnic leaders from the region got
transferred large pieces of land. Historically this speculation is plausible and strengthened by the
fact that even today Ngugi has close contacts to Uhuru Kenyatta, current president and son of first
post-independence president Jomo Kenyatta.

189
Figure 6.12. Macadamia Value Chain in Kenya Prior to Liberalization
Source: Own Illustration.
In the previous section, I have argued that the marketing board-based system in
Kenyan cashew prior to liberalization covered the economic functions of an export
ban. It protected the sole processor, KCL, from outside competition for raw nuts
and further depressed prices – without farmers realizing. The Kenyan macadamia
sector corresponded to this in large parts, but also differed in significant respects.
First, and in stark contrast to the global cashew industry, prior to the entry of
Chinese in-shell macadamia consumers in the early 2000s, macadamia processors
anywhere in the world did not have to fear outside competition. Given global
patterns of macadamia processing, production, and consumption in the 20th century,
processing had always occurred at origin, in-shell macadamia was factually
inexistent, as was the risk for foreign processors to seek domestic in-shell
production. 155 Thus, in a narrow sense, KNC’s monopoly purchase right did not
155 There are three main reasons for this. First, commercial farming of macadamia nut and its
processing emerged jointly in industrially advanced countries (primarily the USA and Australia).
Therefore, large gaps in industrial capacity as seen in the cashew industry were uncommon, and thus
the ability of processors in one country to outcompete processors in another for local production
highly unlikely. This was further strengthened by the fact that large-scale plantations have
dominated the cultivation of macadamia across all major macadamia producers (apart from Kenya).
These plantations – or cooperatives thereof – usually create(d) their own processing facilities. Thus,
farmers have a share and say in processing, increasing their stakes and trust in domestic processing,
Farmer
Cooperative
KNC
KNC Collection
Centre
Foreign
Roaster/Packer
Export

190
have the exact same function as an export ban as there was no need for protection
from foreign processors in the first place. In a broader sense, however, it did
perform a comparable function. Rather than from foreign processors the aim of the
monopoly purchase right was to protect KNC from potential local processing
competitors. As such, KNC received the exact same benefits as the KLC: secured
supply at prices it could determine, without farmers being able to know whether
and how much they receive under free-market value. And again, although we do
not have exact statistics from this time, the likelihood is that KNC too significantly
depressed prices paid to farmers. There are two indications of this. First, compared
to macadamia farm gate prices in the world, farm gate prices in Kenya were at an
extremely low level prior to liberalization in 1992. Whereas farmers in Hawaii and
Australia in the late 1980s received around US$ 2 per kg (McGregor 1996: 143;
USDA 2015: 3), interviewed farmers and traders indicate that farmers received only
one-tenth of this (US$ 0.2) during the same time.156 Second, following
liberalization and the entrance of a new processing competitor (Farm Nut) in 1994,
prices tripled from Ksh 5 per kg in 1993 to Ksh 15 in 1994, and Ksh 23 by 1995.157
motivating them to sell locally, hence, securing and simplifying domestic sourcing for factories, and
making attempts to ‘poach’ foreign producers futile. Third, the key processing and consuming
countries at the time (the United States, Australia, Japan, and Europe) had no interest in importing
in-shell. Specifically, these importers perceived the cost of importing in-shell as relatively high,
whereas the benefits of processing at home relatively low. Importing in-shell has two major
disadvantages. First, transportation costs are three to four times higher, given the weight difference
between in-shell and kernel nuts. Second, keeping nuts in-shell makes it more difficult to access
their quality and maturity. Consequently, the import of in-shell nuts strongly increases the likelihood
of low-quality nuts affected by mould, something importers wanted to avoid as much as possible.
On the other hand, the benefits of importing raw nuts was seen as minimal. First, in contrast to
China, there was never a mass market for self-cracking the nuts in these countries. Second, the profit
margins in the global value chain laid primarily in further processing (i.e. roasting, coating, etc.),
packing, and retailing the nuts, all of which happened in the countries of consumption. In contrast,
these advanced industrial economies did not have a comparative advantage in performing the
relatively labour-intensive, tedious, and low-margin processing step of sorting the cracked
macadamia. Indeed, the Japanese government rather supported the construction and functioning of
the Kenya Nut Company than setting up their own factories in Japan (after they had also been the
leading force in developing macadamia cultivation in Kenya). This is in stark contrast to cashew,
where India did have a comparative advantage and interest in growing labour-intensive industries,
and hence in importing in-shell nuts. Concluding, even if Kenyan macadamia small-holders would
have wanted to export raw nuts, they would not have found the demand. And indeed, after marketing
was liberalized in 1992 Kenya continued to exclusively export macadamia kernels – until 2004,
when Chinese brokers entered the market.
156 Top-level Macadamia Agent, Embu Town, 16.11.2017; Small-Scale Macadamia Farmer,
Kiambu County, 13.11.2017.
157 Senior Executive of MGAK, Kiambu County, 13.11.2017; Top-level Macadamia Agent, Embu
Town, 16.11.2017.

191
As in cashew, interviewed farmers indicate they did not realize that KNC was likely
depressing their prices, thus none of them thought to protest this.158 Depressed
prices, however, did likely have negative consequences for KNC: despite the
distribution of over one million seedlings as well as strong financial and especially
technical aid from the Japanese government159, expansion of macadamia production
remained slow. By 1992, only 2,000 macadamia farmers were estimated to produce
roughly 2,000 tons of in-shell macadamia on an area of 2,300 hectares (Nuts & Oil
Crop Directorate 2016; U.S. International Trade Commission 1992). In comparison,
Australia in the same year had managed to grow its production to over 12,000 tons
from a similar base in 1970. Consequently, the KNC’s US$ 10 million state-of-the-
art processing factory with a capacity of processing 10,000 tons mostly operated at
below 25% capacity (Sato and Waithaka 1998: 2). Moreover, sound kernel recovery
rates (SKRs) ranged from a very low 12% to 17% in 1992, with Australian and
South African nuts reaching over 30% (U.S. International Trade Commission 1992:
4-1). Thus, one can speculate that the KNC likely made significant per-unit profit
margins given depressed prices paid to farmers, but had they paid higher prices,
more farmers would have arguably produced more and better nuts, perhaps leading
to higher overall profits.
158 Small-Scale Macadamia Farmer, Kiambu County, 13.11.2017; Medium-Scale Macadamia
Farmer, Embu County, 16.11.2017; Senior Executive of MGAK, Kiambu County, 13.11.2017.
159 For over twenty years, support by the Japanese government had been crucial in promoting the
sector. In 1977, the Kenyan government on KNC’s behalf requested the Japanese government for
financial support and technical assistance to further develop the industry (Gitonga et al. 2009: 50).
The request was accepted, and the Japanese International Cooperation Agency (JICA) first built the
National Horticultural Research Centre (the centre was led by Mr Waithaka and part of the Kenyan
Agricultural Research Institute) and sent Japanese agronomists for further capacity building.
Specifically, the agronomists at the centre developed and identified particularly promising new
grafted seedling varieties. KNC multiplied these in their nurseries and by the time the Japanese had
left in 1997, had distributed over 1.5 million of them at subsidized prices (Sato and Waithaka 1998:
2). Moreover, the centre played the leading role in researching and developing crop protection as
well as training farmers, KNC employees and field extension officers. The close relationship
between Kenyans and Japanese in production was also shared in consumption: Japan was by far the
largest consumer of Kenyan nuts, an KNC Japan’s largest supply, accounting for around 44% of the
Japanese macadamia market in 1989 (U.S. International Trade Commission 1992: 10). The United
States and Germany accounted for much of the remainder of Kenya’s exports (U.S. International
Trade Commission 1992: 4-1).

192
6.3.1. Post-Liberalization and Pre-Chinese Entry (1992-2004)
Like cashew, the marketing of macadamia nuts was fully liberalized in 1992. The
effects, however, were different to certain extents. First, given that KNC was
already a private enterprise, it did not need to be privatized, and the internal decay
witnessed with KCL avoided. Second, given that there was no international trade
in in-shell nuts during the time, KNC did not face competition from external raw
exporters. Nevertheless, liberalization unleashed domestic competition for KNC
which would lead to changes in marketing paralleling those in cashew.
In 1994, Peter Munga opened the macadamia processing factory “Farm Nut Co.”
in Maragua, Muranga district (also in Central Kenya). Munga was a highly
successful career bureaucrat (who had occupied a range of top-level positions in the
Ministries of Agriculture, Tourism, and Water, as well as the Office of the
President) and an even more successful entrepreneur, in 1984 founding the Equity
Building Society (EBS) and later Equity Bank (Africa’s largest bank in terms of the
number of customers), hereby becoming one of the top ten richest persons in Kenya.
First buying coffee from farmers, Munga realized that they were also selling
macadamia at low prices and decided to venture into marketing and processing the
nuts.160
Since Farm Nut neither had the logistical infrastructure nor the relationship with
cooperatives that KNC had, it had to rely on brokers in large parts. Prior to
liberalization, brokers had a very marginal but useful position. In the rare cases
where farmers were not within cooperatives or too distant, middlemen could reach
them and sell the product at KNC collection centres. However, with Farm Nut’s
entry into the market and their necessity for middlemen that would source for them,
they grew from marginal to dominant. Eventually, as in cashew, brokers would
outcompete and hereby lead to the death of cooperatives161. Essentially, brokers
160 Senior official at Ministry of Agriculture, Nairobi, 04.11.2017; CEO of Big Five Nut Processor,
Nairobi, 07.11.2017.
161 There is a general question whether this is a case of brokers free-riding or poaching off the
investment and services provided by the cooperatives and the related network, that is, a kind of
concurrence déloyale or asset mining that undermines the sector in the long run. There is likely
some truth to this and exactly what KNC accused Farm Nut for years. Specifically, they argued that
they had provided seedlings and support to farmers for years. There is some doubt that this claim is
fair, however. Most of the support given to farmers prior to liberalization was financed by and

193
would circumvent the societies, go directly to the farmer, offer him/her a shilling
or two more than the cooperative did, while at the same time paying directly in cash
and transporting the nuts, hereby, massively reducing farmers’ transaction costs of
bringing nuts to collection centres and collecting their payments from banks.162
Over time, with more cooperative members selling to farmers and less volume
handled by the cooperatives, their transaction costs increased while at the same time
foregoing the commissions that financed their operations. Similarly, with
processors having less to buy from cooperatives, sending their own vehicles there
for collection became less profitable as well. In contrast, middlemen would deliver
the crop straight to the factory gate, also from areas KNC had barely reached before,
and at better conditions. By the early 2000s, the last cooperative had become
redundant. Middlemen had become the kings of macadamia marketing in large parts
of the country, particularly those more distant from the processors (i.e. Embu and
Meru).163 Figure 6.13 provides a simplified illustration of what the macadamia
value chain looked like at the time.
The harsh competition between Ngugi’s KNC and Munga’s Farm Nut Co. had two
key implications. As described before, farm gate prices increased significantly.
Moreover, hoping to utilize its excess capacity from not being able to source
sufficient cashews, KCL entered macadamia processing shortly before its collapse
in 1997, leading farm gate prices to pass the Ksh 30 (US$ 0.5) mark (U.S.
International Trade Commission 1998: 105). Second, driven by this rapid price
increase in macadamia (and the parallel decline of coffee prices), farmers in Central
Kenya became more interested in the crop. Consequently, as illustrated in Figure
6.14 below, production multiplied five-fold within six years only, crossing the
10,000 tons threshold in 1998.
partially implemented by the Japanese government. In general, any work the cooperatives, the state,
or KNC did was usually paid for by the Japanese or cooperative members themselves through
receiving below world-market prices. In that sense, this might not be a real case of asset mining.
162 Top-level Macadamia Agent, Embu Town, 16.11.2017.
163 Top-level Macadamia Agent, Embu Town, 16.11.2017.

194
Figure 6.13. The Macadamia Production Chain After Liberalization
Source: Own illustration.
Throughout the decade following liberalization, KNC not only challenged Farm
Nuts entry in the market but also legally. Arguing that it had invested more than
anyone to promote the production of macadamia in the country and that Farm Nut
was not involved in any crop development activities of its own (Sato and Waithaka
1998: 1–2), KNC attempted to stall Farm Nut by dragging it to the courts. When
this did indeed inhibit the operations of Farm Nut, owner Munga decided to rename,
or rather “re-found”, the company under the name Equatorial Nut Processors Ltd,
under which it could operate freely.164 Showing that the power of KNC could be
broken, Wondernut and former KNC employee Patrick Wainaina (Jungle Nuts Ltd.)
entered the market in 2004 and 2005 respectively, further increasing competition.
164 Senior official at Ministry of Agriculture, Nairobi, 04.11.2017.
Farmer
Cooperative
Processor
Processor
Collection
Centre
Foreign
Roaster/Packer
Export
Farm gate
Agent
Mid-Level
Agent
Top-Level
Agent
Raw
Exporter
Chinese
Retailers
Domestic
Consumer

195
Crucially, however, Kenyan macadamia was still only processed in Kenya, and no
need for an export ban had materialized.
Figure 6.14. Kenyan NIS Macadamia Production 1992-2015
Source: Own Illustration. Production data for Kenya was derived from the Nuts &
Oil Crop Directorate (2016).
6.3.2. The 2004 Entry of Chinese In-Shell Exporters
Arguably the largest development in the global and Kenyan macadamia industry
has been the entrance of China as a mass consumer of the nut in the early 2000s.
The emergence of a growing middle-class in China with an appetite for in-shell
nuts165 (as well as container ships increasingly docking in Mombasa, demanding to
165 Though culturally a nut-eating country, at first, only the wealthier Hong Kong could afford
broader consumption of the expensive nuts. In the later 1990s, the island consumed around 7% of
the world production , in fifth position after the United States, Japan, Australia, and the European
Union, in that order (U.S. International Trade Commission 1998: 26). However, with the rapid
emergence of an upper middle-class in the early 2000s, the demand for macadamia on the mainland
surged as well. Importantly, in contrast to most “Western” and Japanese consumers, Chinese prefer
buying macadamia nuts in shell (crackable by inserting and twisting a metal key in a pre-sawn slit
0
5,000
10,000
15,000
20,000
25,000
30,000
35,000
40,000
1992
1993
1994
1995
1996
1997
1998
1999
2000
2001
2002
2003
2004
2005
2006
2007
2008
2009
2010
2011
2012
2013
2014
2015
To
ns
(NIS
)
Year

196
be filled for the way back), created a serious competitor for Kenyan processors. The
first Chinese in-shell exporter, Mr Yang, started contacting and hiring brokers in
2004 in Embu town.166 Much to the displeasure of processors and pleasure of
farmers, his brokers would roam around the county in vans, using loudspeakers to
offer prices above Ksh 40 (US$ 0.48) – twice what processors had offered in the
two seasons before (compare Figure 6.18 below). Prior to his cousin’s, Mr. Zhang
Pei’s, arrival around the time of the ban, Mr Yang was apparently the key – if not
only – Chinese macadamia in-shell exporter in Kenya.167
One crucial factor to understanding the politics of the export ban in macadamia, is
understanding Chinese regional marketing preferences in Kenya. As indicated
above, Mr Yang first entered the market in Embu county (and later Meru), rather
than the processing hubs of Thika and Muranga. And until this day, Chinese in-
shell buyers prefer to work in the counties east and north of Mt. Kenya, rather than
those in its South and West (hence, primarily the counties of Kiambu, Muranga,
Kirinyaga, and Nyeri). There are three main reasons for this. First, the size of the
crop. As illustrated in Figure 6.16 below, almost 40% of production concentrated
in the two northeastern counties of Embu and Meru. This is argued by some to be
the result of larger plots available in the area for macadamia planting.168 Secondly,
the quality of Embu and Meru nuts are considered particularly good (with most
trees belonging to more easily hand-crackable M. Integrifolia varieties) and nuts
are relatively large, hence more desirable to Chinese consumers. Third and perhaps
most importantly, it is significantly easier for Chinese exporters to enter the
northeastern market given strong differences compared to the southwestern
macadamia region. The key macadamia processors in Kenya are from the Kikuyu
ethnicity and their firms mostly located in the Southern-Central Kiambu (Thika)
and Muranga counties. Given social and geographical proximity, processors set-up
more collection centres in these and adjacent (southwestern) counties, maintained
in the shell) rather than the kernel. Accordingly, almost 60% of macadamia imports in 2010 were
in-shell (USAID 2012).
166 Senior Official of NUTAK, Kiambu County, 13.11.2017.
167 Other brokers in Embu have argued that Yang and Zhang arrived at the same time, initially
worked together, but in 2005 split business. Top-level Broker, Embu Town, 16.11.2017.
168 Senior Executive at Kenya Nut Company, Per Telephone, 29.11.2017.

197
close connections to farming communities, and employed significant parts of the
population. In contrast, Embu and Meru were the core producing countries most
distant from the processors in Thika and Muranga, both geographically and
ethnically. No processing plants existed in these areas that could employ people,
collection centres were relatively rare, as was contact to field or other direct agents
of the processors. In fact, macadamia marketing in no other area was and remains
dominated as strongly by brokers as is the case in Embu and Meru. While large
volumes and decent quality made the northeastern Mt. Kenya region attractive to
the Chinese exporters, it was the weak grip by processors in the area and the ability
to rely on brokers – that do not care whether the crop is exported shelled or in-shell,
if the pay is good – that allowed them to work there smoothly.169
The strong entrance of Chinese exporter Yang had two major consequences for the
Kenyan macadamia sector. Fist, farm gate prices increased further and in step
production (as illustrated in Figure 6.17 below). However, as illustrated in Figure
6.18 below, prices were significantly higher in the eastern region, that is, where the
Chinese exporters operated predominantly. Secondly, as in cashew, processors
increasingly struggled to source enough macadamia considering increased
competition with Chinese exporters and among themselves. Estimates by the USDA
Foreign Agricultural Service indicate that nearly 60% of macadamia had been
exported in-shell in 2008, implying that exporters had been able to purchase most
of the northeastern crop and were spreading towards the South-West (Onsongo
2009a). In addition, the first half of 2009 had seen a significant drought in Kenya,
signifying a smaller crop to be fought over. According to managers in two of the
largest processing companies at the time, most processors were on the edge of
closing their business, and, like KNC, kept alive mainly through the production of
169 Officer at Nuts and Oil Crops Directorate, Nairobi, 02.11.2017; Senior Executive at Kenya Nut
Company, Per Telephone, 29.11.2017; CEO of Second-Tier Nut Processor, Nairobi, 19.12.2018;
Senior Executive of MGAK, Muranga Town, 13.11.2017; Senior Executive of MGAK, Per
Telephone, 11.12.2017; Senior Official of NUTAK, Kiambu County, 13.11.2017; Top-level
Macadamia Agent, Embu Town, 16.11.2017; Head of Operations of Major Processor, Embu Town,
15.11.2017

198
their own orchards.170 It is in this context that from 2008 on, parallel to cashew, the
discussion of an export ban on raw nuts became salient.
Figure 6.15. The Main Macadamia Growing Region Around Mt Kenya
Source: Own illustration based on map from Lewis (2016).
170 Senior Executive at Kenya Nut Company, Per Telephone, 29.11.2017; Head of Operations of
Major Processor, Embu Town, 15.11.2017.
Main Cashew Growing Area
Main Macadamia Growing Area
Nairobi
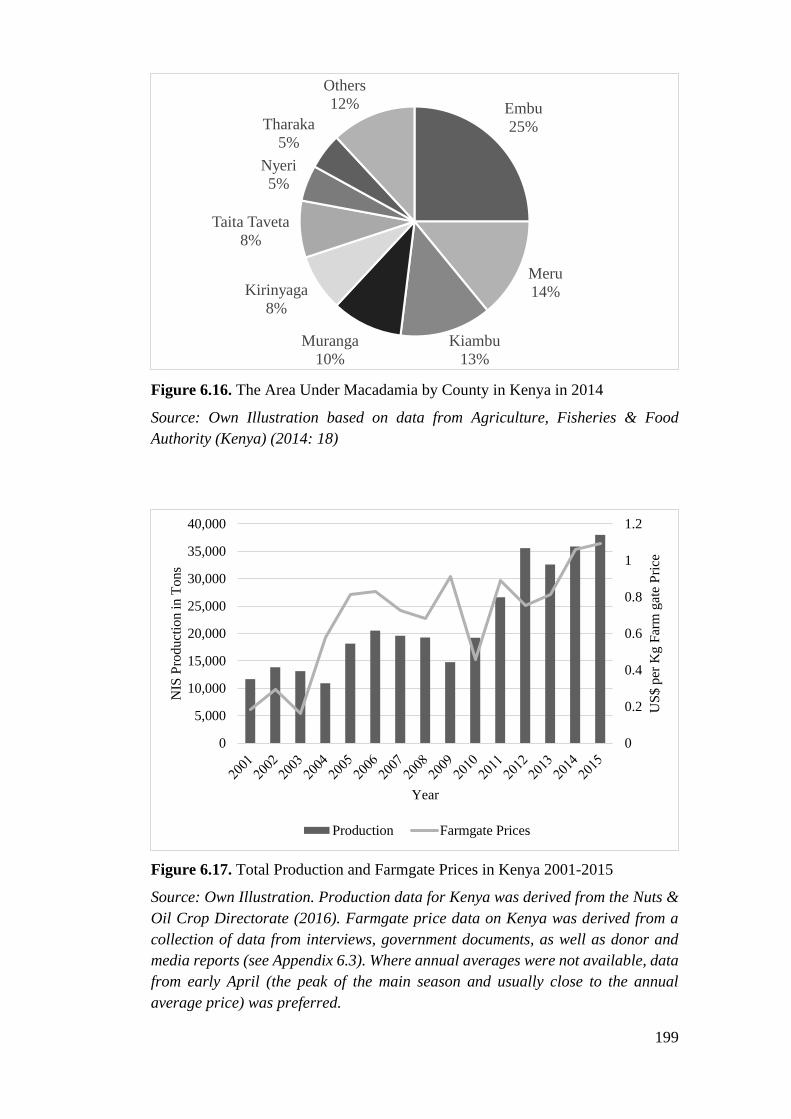
199
Figure 6.16. The Area Under Macadamia by County in Kenya in 2014
Source: Own Illustration based on data from Agriculture, Fisheries & Food
Authority (Kenya) (2014: 18)
Figure 6.17. Total Production and Farmgate Prices in Kenya 2001-2015
Source: Own Illustration. Production data for Kenya was derived from the Nuts &
Oil Crop Directorate (2016). Farmgate price data on Kenya was derived from a
collection of data from interviews, government documents, as well as donor and
media reports (see Appendix 6.3). Where annual averages were not available, data
from early April (the peak of the main season and usually close to the annual
average price) was preferred.
Embu
25%
Meru
14%
Kiambu
13%
Muranga
10%
Kirinyaga
8%
Taita Taveta
8%
Nyeri
5%
Tharaka
5%
Others
12%
0
0.2
0.4
0.6
0.8
1
1.2
0
5,000
10,000
15,000
20,000
25,000
30,000
35,000
40,000
US
$ p
er K
g F
arm
gat
e P
rice
NIS
Pro
duct
ion in T
ons
Year
Production Farmgate Prices
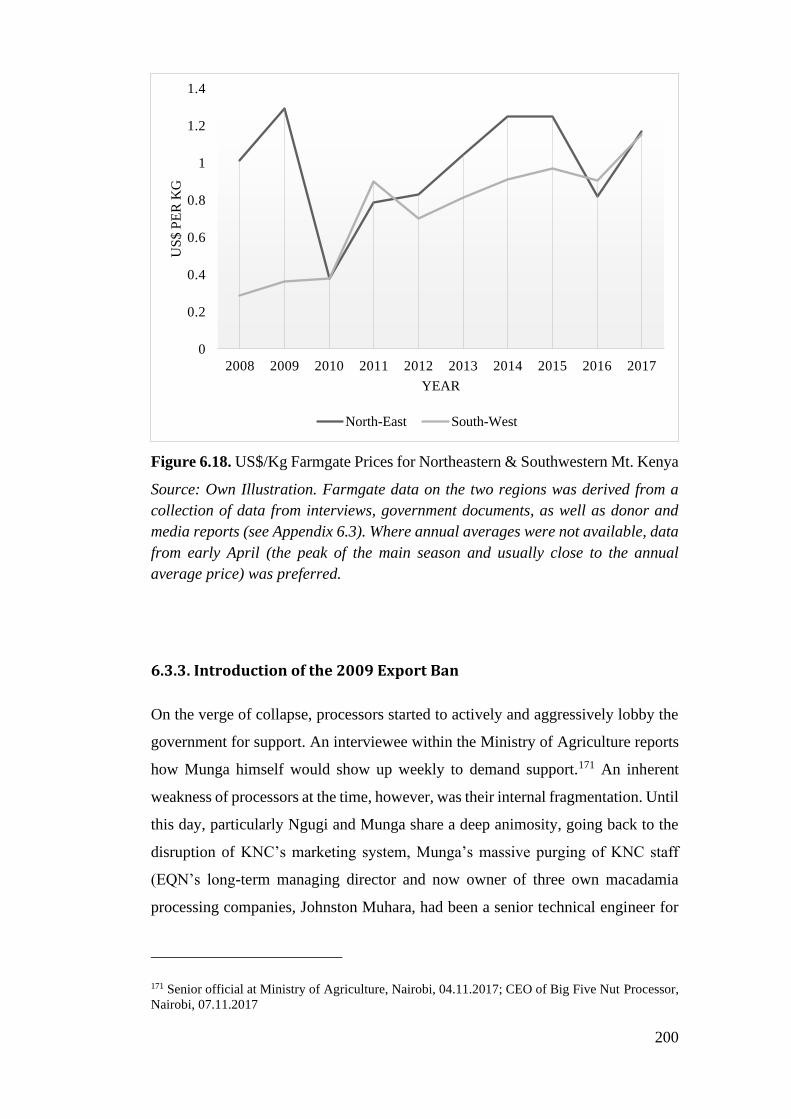
200
Figure 6.18. US$/Kg Farmgate Prices for Northeastern & Southwestern Mt. Kenya
Source: Own Illustration. Farmgate data on the two regions was derived from a
collection of data from interviews, government documents, as well as donor and
media reports (see Appendix 6.3). Where annual averages were not available, data
from early April (the peak of the main season and usually close to the annual
average price) was preferred.
6.3.3. Introduction of the 2009 Export Ban
On the verge of collapse, processors started to actively and aggressively lobby the
government for support. An interviewee within the Ministry of Agriculture reports
how Munga himself would show up weekly to demand support.171 An inherent
weakness of processors at the time, however, was their internal fragmentation. Until
this day, particularly Ngugi and Munga share a deep animosity, going back to the
disruption of KNC’s marketing system, Munga’s massive purging of KNC staff
(EQN’s long-term managing director and now owner of three own macadamia
processing companies, Johnston Muhara, had been a senior technical engineer for
171 Senior official at Ministry of Agriculture, Nairobi, 04.11.2017; CEO of Big Five Nut Processor,
Nairobi, 07.11.2017
0
0.2
0.4
0.6
0.8
1
1.2
1.4
2008 2009 2010 2011 2012 2013 2014 2015 2016 2017
US
$ P
ER
KG
YEAR
North-East South-West

201
KNC before joining EQN), as well as the competition for sought-after contracts,
especially with Kenyan and British Airways. Given the heightened severity of the
threat affecting both macadamia and cashew processing, processors agreed to look
past their differences in favour of jointly lobbying the government for a ban.
As described in the previous section on cashew, Agricultural Minister Ruto directed
the ban on the export of both raw cashew and macadamia nuts on 16 June 2009. It
is difficult to say whether interests regarding one commodity were more important
in lobbying for the ban than the other. Although there was a group within in the
Horticultural Crops Development Authority that investigated the effects of the ban
and consulted with actors in the macadamia value chain,172 in contrast to cashew,
there was no clear task force or report nor was the idea of a ban ever discussed or
justified in the media in relation to macadamia. The formality and transparency of
the cashew ban process might imply that this commodity was more important in the
overall introduction of the ban. At the same time, however, two aspects attribute
more importance to macadamia. First, although Ngugi’s KNC and Munga’s EQN
also processed some cashew, their main-stay was always macadamia. Accordingly,
there is little doubt that for them protecting macadamia was crucial and protecting
cashew a positive side-effect, something managers from both companies confirmed
in interviews.173 Clearly, for Bobby Thomas, the owner of Wondernut and largest
cashew processor at the time, the reverse was true. However – despite (unproven)
claims of a close personal connection to Minister Ruto himself – some interviewees
judged that Thomas does not have the political clout the two Kikuyu millionaires
and alleged close friends of the presidential Kenyatta and Kibaki families hold.174
Secondly, it appears that processors were already pushed out in macadamia two
months before the official directive of the ban and even before a task force had been
created in cashew. As a top-level Embu broker175 describes, Chinese buyers had
172 Senior official at Ministry of Agriculture, Nairobi, 04.11.2017; Senior Official of NUTAK,
Kiambu County, 13.11.2017.
173 CEO of Big Five Nut Processor, Nairobi, 07.11.2017
174 Senior official at Ministry of Agriculture, Nairobi, 04.11.2017; Top-level Macadamia Agent,
Embu Town, 16.11.2017.
175 Top-level Macadamia Agent, Embu Town, 16.11.2017.

202
already entered the market in January 2009176 offering around Ksh 80 (US$ 1.04)
per kg. In March 2009, processors were opening their marketing also with a starting
price of around Ksh 80 per kg. Chinese buyers, by the time, had however already
raised prices to over Ksh 100, hereby again outcompeting processors. According to
the same Embu broker, then in the last week of March, the two main Chinese buyers
(Yang and Zhang) were summoned to the Ministry of Agriculture.177 He also claims
that according to the Chinese, they were told by the Ministry they had three days to
clear their stores and business with agents and would then be prohibited to further
buy in the market. And indeed, after three days in the market they had closed their
shops and left. The legal basis of the government’s intervention is unclear, although
the broker alleges that threats of deportation were made. Interviewed officials
responsible for the sector either claimed they did not remember the exact timing the
ban was factually introduced or did not react to subsequent inquiries.178 This
episode has two major implications. First, that the government was very responsive
to processors’ concerns an wanted to help them as quickly as possible, even before
a formal ban could be introduced. Second, the covertness of the process could
indicate that the government wanted to avoid that farmers noticed or linked the
Chinese expulsion to the government’s action, in line with the argument that policy
attribution is a key concern to policy-makers.
Concluding, as Kenyan cashew, up to this point, the Kenyan macadamia strongly
resembles that of the Ghanaian ban on raw cashew exports. Processors were in
danger of collapse due to strong foreign competition and lobbied for an export ban.
The government supported it and extremely rapidly (and in this case even pre-
emptively) introduced, unaccompanied by any measures that could have eased its
impact on farmers. Yet again, as with Kenyan cashew, the Kenyan macadamia ban
differs fundamentally from the Ghanaian cashew ban in the sense that it is still in
place nine years after its introduction.
176 Which should normally be avoided as it increases the risk of collecting immature nuts.
177 Top-level Macadamia Agent, Embu Town, 16.11.2017.
178 Senior official at Ministry of Agriculture, Nairobi, 04.11.2017;

203
6.3.4. The Politics of the Kenyan Macadamia Ban Maintenance
Both in the Ghanaian and Kenyan cashew sectors the export ban drastically reduced
farm gate prices and with the help of traders, this mobilized farmers against it.
Whereas the sheer size and significance of the Ghanaian cashew farmer
constituency posed a strong threat to the political survival of the ruling party and
was therefore central to the withdrawal of the ban, the small number of cashew
farmers in Kenya that cared about the ban was unable to pose a significant threat to
policy-makers, who therefore saw no need to withdraw the ban. In this section, I
argue that the Kenyan macadamia ban experience corresponds closely to that of
Kenyan cashew. Interestingly, yet in line with my argument, the effect of the ban
and the respective mobilization of farmers occurred only in the eastern macadamia
growing areas where Chinese raw exporters had operated mostly. As in Kenyan
cashew, however, the number of farmers was too limited to pose a political threat
to policy-makers.
6.3.4.1. All Quiet on the Western Front: Regional Patterns of Visibility and
Mobilization
As described in previous sections, Chinese exporters employing domestic brokers
mainly operated in Macadamia growing areas east of Mt Kenya, and barely in the
areas southwest of it. Their ability and willingness to pay higher prices than
domestic processors translated into significantly higher average farm gate prices in
the eastern growing areas like Embu and Meru compared to those in southwestern
counties like Kiambu, Muranga, Nyeri or Kirinyaga.
Given this distinct regional price pattern created by foreign buyers, the removal of
the very same from the market thus also impacted the two regions very differently.
Expectedly, in the southwestern areas where Chinese buyers had not operated and
thus not increased farm gate prices, the ban barely had an impact. As illustrated in
Figure 6.18 above, prices in the year prior and after the ban remained relatively
equal, hovering around the US$ 0.3 mark. As such, when the ban was implemented
and, in the years, thereafter, southwestern farmers did not notice it. In my research,
I could find no media article that quoted farmers from this area saying anything
about the ban. Similarly, and except for members of the Macadamia Grower

204
Association (MGAK) directorate, the farmers I talked to about the ban in Kiambu
and Muranga counties had never heard of the ban or noticed any price drop during
its implementation.179
In stark contrast, the ban caused a strong price shock in the eastern Mt Kenya
growing areas. In Embu, for example, brokers and current processors report that in
April, after Chinese buyers had left, prices dropped from around Ksh 100-130 to
around Ksh 40-60 – at a time in the season when prices should normally be
increasing.180 Only in November 2009, prices shortly increased to Ksh 80 when a
broker with a pick-up truck – likely working for a Chinese buyer (by then smuggler)
– came to Embu from Nairobi with a significant amount of cash to buy raw nuts.
According to a high-level broker that has been working in the industry for over 20
years, prices in Meru even dropped to Ksh 30 in 2009.181
Whereas brokers in the southwest had no connection to Chinese buyers and hence
no incentive to mobilize against the ban, this was different in the northeast.
According to a high-level Embu broker, brokers from the region attempted to set
up a large-scale protest in April 2009 in Mutunduri (near Embu town) against the
ejection of Chinese.182 In that vein, brokers tried to win over the support and
attendance of farmers by informing them about the expulsion of Chinese exporters
and the effect it was having on prices. Despite the price drop, producers were not
very responsive and only a couple dozen farmers joined the April protest in Embu.
There are several reasons why farmer mobilization was not as effective as brokers
had initially hoped. First, as discussed above, the ban was informally implemented
several months before its formal announcement, making it more difficult for
179 Small-Scale Macadamia Farmer, Kiambu County, 13.11.2017; Small-Scale Macadamia Farmer,
Kiambu County, 13.11.2017; Senior Executive of MGAK, Muranga Town, 13.11.2017; Senior
Executive of MGAK, Kiambu County, 13.11.2017.
180 Top-level Macadamia Agent, Embu Town, 16.11.2017; Head of Operations of Major Processor,
Embu Town, 15.11.2017.
181 Top-level Macadamia Agent, Embu Town, 16.11.2017.
182 Top-level Macadamia Agent, Embu Town, 16.11.2017.

205
farmers to pin it to government action initially and perhaps seeing this as a serious
long-term measure.
Second, processors tried to actively create a counter-narrative that blamed the
brokers (and thus the Chinese) for the price drop, hid any mentioning of a ban, and
framed themselves as saviours. According to an executive of the Macadamia
Grower Association of Kenya from the eastern region,183 when farmers in the area
during the 2009 main season demanded to know from processors why prices had
declined so much they were told this was the result of high share of immature nuts
and that if they started selling to processors directly – rather than via brokers – good
prices would return. While in hindsight factually wrong, at the time it was difficult
for farmers to challenge this narrative.184
Third, it was arguably not easy for brokers to find good points of application for
their mobilization attempts. At the time of the introduction of the ban there was no
formal association of macadamia farmers. Only in the summer of 2009 did MoA
initiate the creation of the weak and largely nonfunctional Macadamia Grower
Association of Kenya (MGAK).185
A final factor that adds to explaining why brokers were not as successful with their
initial protests was a lack of cohesiveness and commitment in their own ranks,
fuelled by uncertainty. According to a high-level Embu broker that co-organized
the protest, many brokers (including himself) were unsure whether the Chinese
would return given their abrupt departure and doubtful that they would be able to
183 Senior Executive of MGAK, Per Telephone, 08.12.2017.
184 Key interviewees – including processors – confirm that nut immaturity was not a particular issue
during that season and rate this explanation as clearly pretextual and made with the intention to
confuse farmers. At the time, however, this was a relatively successful strategy, as in the 1999 season
(before the Chinese had entered the market) vast immaturity of nuts had been the cause of major
payment defaults by processors and subsequent price drops. As such, during the pre-formal
implementation of the ban, it was difficult for producers to untangle the real reason for the price
drop.
185 Up to this date, the association has no office, no constitution, and no actual budget. It is essentially
made up of only twelve active members, that is, the board of directors, each representing a
macadamia growing county, which were handpicked by MoA based on their achievements in a prior
good agricultural practice program. Crucially, since its inception in 2009, no annual general meeting
has been held and the few workshops or measures conducted by it have been either funded by
personal means, MoA, or the processor association (NUTPAK). Its capacity to promote collective
action among farmers is thus very limited and was completely in-existent at the time of the ban.

206
organize farmers and pose a credible threat against the government and well-
connected processors. 186 Accordingly, some brokers had already started to make
new arrangements with processors prior to the protests, further reducing their
commitment to the cause.
As in the Kenyan cashew case, however, by the beginning of the 2010 main season,
the ban had become visible to many farmers. This was due to continued trader
information, low prices, and the formalization of the ban. In March 2010, for
example, Meru farmers were actively complaining to the media that their crop “goes
for Sh20 per kilogram of unshelled nuts down at Sh100 per kilo a year ago, before
the ban” (Ithula et al. 2010).187 And although not covered in the anglophone media,
farmers, brokers and processors confirmed that at the start of the 2010 harvesting
season more farmers started protesting alongside brokers near Embu Town against
low prices and the ban.188
6.3.4.2. The Congruent Lack of a Political Threat and Political Support
Critically, not a single politician was willing to join the protests in 2009 or 2010.
As in the Kenyan cashew case, the high-level brokers that co-organized the events
told me that they had contacted several local MPs, but to no avail.189 And yet again,
as in the case of coastal cashew farmers, politicians’ disinterest does not come as a
surprise. Overall, only roughly 8,600 farmers190 east of Mt Kenya were seriously
186 Top-level Macadamia Agent, Embu Town, 16.11.2017.
187 In the same news story, the purchasing manager of EQN confirmed that they would not offer
more than Ksh 45 to farmers at collection centres, obviously translating to much less where centres
were sparse and brokers required (Ithula et al. 16.03.2010).
188 Senior Official of NutPAK, Nairobi, 09.11.2017; Head of Operations of Major Processor, Embu
Town, 15.11.2017.
189 Top-level Macadamia Agent, Embu Town, 16.11.2017; Senior Official of NUTAK, Kiambu
County, 13.11.2017.
190 This number is calculated from a ranger of figures and numbers. First, based on historical
accounts of national production volumes and the number of farmers, and corroborated by yield
statistics in the area and own interviews with farmers in Embu county (U.S. International Trade
Commission 1992: 4-1); (Nuts & Oil Crop Directorate 2016), we know that the average farmer
produces around one tonne of in-shell macadamia per year. Accordingly, knowing that in 2008
around 19,290 tons of in-shell macadamia was produced in Kenya, and that around 45% of this was
produced east of Mt Kenya, we can derive that there must have been around 8,680 farmers in the
area.

207
invested in macadamia cultivation at the time of the ban – less than one-tenth of the
mobilizable cashew farming population in Ghana during the ban. This is not only a
minimal number of potential voters in national terms but even in regard to the nearly
1.2 million potential voters in Embu and Meru alone (Kenya National Bureau of
Statistics 2018). Simply eye-balling these numbers provides a tangible feeling that,
in contrast to Ghanaian cashew farmers, serious macadamia growers in Kenya
could not bring significant numbers to elections or be of any other significant threat.
Thus, it is understandable that policy-makers saw no political danger in introducing
the ban and no need to withdraw it.
Disappointed by the failure of farmer protests to gain political traction, Chinese
exporters also attempted to fight the ban using backroom politics – eventually
losing out to processors. Interviewed brokers, processors, and officials in MoA
indicate that the Chinese had actively191 – and initially successfully – lobbied new
Agricultural Minister Sally Kosgei to lift the ban on raw nut exports for three
months on 28 May 2010, around one year after the introduction of the ban. The
official rationale for the lift was “to facilitate the mop-up of the excess raw nuts
with farmers” (Minister of Agriculture 31.05.2010). At this point processors did not
oppose this lifting, arguably because of its temporal limitation and timing (both
cashew and macadamia main seasons had ended by the time), and because MoA
public relations officer clearly stated that “the government will not extend the
window and the ban on export of raw nuts will remain in force”, indicating it was
happy with the size of processing capacity of processors (Kihara 2010).
Despite promises not to, on 15 December 2010 Minister Kosgei yet again decided
to lift the ban (Gazette notice No. 16229) quoting the same rationale, namely to
‘mop up’ excess raw nuts, this time however for a period of over six months until
30 June 2011. This time, the big five processors organized under NutPAK acted
directly and applied to the High Court in Nairobi to suspend the government’s
notice to lift the ban and instead order the government to actively enforce it and
191 To be more specific, whereas processors and some government officials believe Minister
Kosgei’s decision to lift the ban a second time was the result of bribes offered to her by exporters.
While those allegations are difficult to prove, it is worth noting that Minister Kosgei is one of the
few Kenyan’s showing up in the Panama Paper Offshore Scandal website (Offshore Leaks Database
2018).

208
arrest anyone who breached it, arguing there were no excess raw nuts at farms
(Kenyan High Court 05.07.2013). And indeed, already on 21 December 2010, the
High Court surprisingly192 ruled in favour of the processors‘ pleas, hereby
prohibiting the government to suspend the ban. Simultaneously, NutPAK played its
political contacts, moving the chairman of the Parliamentary Committee on
Agriculture, MP John Mututho, to investigate Minister Kosgei’s action, as well as
several MPs from macadamia growing areas to claim they would introduce a
motion in Parliament seeking a full legal ban approved by parliament on the
exportation of unprocessed nuts (in contrast to the less binding Ministerial directive
the ban was to that point) (Gaitho 2011). This shows clearly that at the time of the
ban MPs were protecting the interests of processors rather than that of farmers and
brokers.
The events around a surprising motion tabled in parliament in 2016 further
illustrates this lack of interest from MPs. On 29 August 2016, Maragua (in Muranga
County, southwest of Mt Kenya) MP Peter Kamange Mwangi out of the blue
introduced a motion against the ban in parliament, arguing it was hurting farmers.
This was the first time a Kenyan politician ever opposed the ban and as such on first
sight appears to be proof that politicians did and could care about farmers’ interest.
And indeed, Mwangi even brought six farmers with him to parliament to support
the motion. Critically, however, the reaction of Kenyan parliamentarians was very
different from that of their Ghanaian peers. As a Daily Nation report summarizes:
‘Parliament threw out the petition to have the ban on the sale and export of raw
macadamias lifted. The House’s agriculture committee rejected the petition on the
grounds that it is not in the interests of the industry’ (Wanzala 2016). This rejection
is one of the clearest pieces of evidence that most MPs (despite sitting in the
agricultural committee) did not care much for the concerns of farmers. Moreover,
192 The legal basis for Justice Gacheche’s ruling was highly dubious. As representatives of MoA
stated at later points (Kenyan High Court 05.07.2013), Minister Ruto’s original directive in no aspect
mentioned that the ban was permanent, and the legal mandate inherent in her role as Minister of
Agriculture should have undoubtedly allowed Minister Kosgei to lift the ban. Interviewed brokers
suggest that Justice Gacheche has been bribed by processors to reach her judgement. Again, while
such claims are extremely difficult to prove, it is notable that in August 2012 she was the first High
Court justice in Kenya’s history to have been determined unfit to continue serving on the bench,
after the Judges and Magistrates Vetting Board had found her to have “inappropriately” used her
judicial powers (Kiplangat 03.08.2012; International Justice Monitor 2012).

209
having interviewed the key parties involved in the politics around the motion, it
appears relatively clear, however, that it was driven by a single powerful top-level
broker from Thika and now the Chairman of the Nut Trader Association of Kenya
(NUTAK), Johnson Kihara, rather than the constituency of the MP, where only a
minority of the population actually cultivates macadamia.193 The timing of Kihara’s
effort had to do with a crackdown on Chinese smugglers shortly before and himself
being one of the first and main brokers to work with Chinese exporters.194
6.3.4.3. Increasing Protest and Political Support
Interestingly, however, more serious protests against the ban and the suppression
of Chinese buyers have become more common in the northeastern Mt Kenya region
in recent years. This derives on the one hand from the rapid gain in the relevance
of macadamia throughout the central region, with production (and thus the number
of producers) having more than doubled since the introduction of the ban. And on
the other, from the continued activity and suppression of Chinese buyers in
northeastern Kenya. First, without any political support, in May 2014, farmers
organized by brokers in Meru and Embu protested a move to restrict marketing to
certain buyers (processors). According to a Kenya News Agency interview, farmers
complained “the move was meant to keep China out of the trade and reduce
competition from the local companies who previously offered very low prices for
the produce. (…) since the entrance of China into the trade, the price per kilo of
macadamia has shot up from shs.50 to the current shs.120” (Mwangi 2014).
Then, on 23 February 2017, following hints from NutPAK informants, seven
Chinese macadamia buyers were arrested in Meru for allegedly doing business in
the country without the required licenses and documents (Githinji 2017). After
several days in jail and a subsequent severe price drop with Chinese out of the
193It appears that Kamange’s opposition to the ban and processors did not pay off. Processors,
especially Muranga country native, Peter Munga, apparently supported an opponent of Kamange in
the Jubilee Party primaries, according to sources within EQN, with the intend to neutralize
Kamange. Although Munga’s candidate did not win the primaries, neither did Kamange. This
section is based on interviews with: Senior Executive of MGAK, Muranga Town, 13.11.2017;
Senior Official of NUTAK, Kiambu County, 13.11.2017; Former Central Kenyan MP, Jubilee Party,
Kiambu County, 13.11.2017.
194 Top-level Macadamia Agent, Embu Town, 16.11.2017.

210
market, mainly brokers but also farmers started to protest heavily in Embu and Meru
against the ban on 1 March 2017. Timed during the gubernatorial party primaries
for the 2017 election, gubernatorial candidate for Embu, Senator Lenny Kivuti used
the chance and joined the protests in Mutunduri (Embu North sub-county) accusing
his opponent and current governor, Martin Wambora, of colluding with the
domestic processor Privam nuts and saying it was wrong for the police to “harass
the foreigners because the latter were offering a better price to the farmers”, and
promising he would see to them released (Githinji 2017).195
Protest against the ban directly linked to the demand that Chinese buyers should be
allowed to buy freely intensified throughout 2018. In late January 2018 (prior to the
legal opening of the harvesting season on 20 February), the government (in form of
the Nuts and Oil Crop Directorate) had yet again arrested and deported eleven
Chinese macadamia buyers in Meru, buying at a stellar price of Ksh 170 (US$ 1.7)
per kg (Marete 2018; Wanzala 2018). This time supported by several Meru MPs,
farmers and brokers started protesting for their release in front of the governor’s
office in early May. This protest was interesting in three regards. First, it shows that
eastern MPs are becoming increasingly sensitive to macadamia brokers’ and
farmers’ concerns, which I argue has to do with their increasing number. Second,
at these protests some farmers started to explicitly demand the repeal of section 43
of the AFFA Act196, which prohibits the export of raw nuts, and – in contrast to
195 Observers and participants of the protests at the time, however, perceive Senator Kivuti’s support
as relatively insincere. They believe that Kivuti – who comes from the lower Mbeere part of Embu,
which does not grow macadamia – happened to be in the area at the time and in the highly contested
gubernatorial party primaries saw a chance to poach some votes from the incumbent.
196 In 2013, the Kenyan parliament passed Agriculture, Fisheries and Food Authority Act (The
Republic of Kenya 2013a). Two aspects of this law were of particular importance. First, the act
merged all former 24 independent state corporations and boards associated with agriculture into one
consolidated entity, the Agriculture and Food Authority (AFA), which should eliminate overlaps in
regulatory, research, licensing, processing and marketing functions and serve as an adjustment to
devolution and the requirements by the new constitution for a leaner government ((Kilifi County
2016: 13). Crops were merged into a range of different directorates within AFA. Since 2014, cashew
(as macadamia) falls under AFA’s Nuts and Oil Crops Directorate. The directorate was essentially
a merger of the Coconut Development Board and sections of the Horticultural Crops Development
Authority working on nuts and split geographically in the two organizations’ seats in Mombasa and
Nairobi. The second important change of the AFFA Act was writing down the export ban on nuts in
a parliamentary law. Specifically, article 43 of the act states that “A person shall not export raw
cashew nuts, raw pyrethrum, raw bixa or raw macadamia except with written authority of the
Cabinet Secretary issued with the approval of the National Assembly” (The Republic of Kenya

211
coastal cashew farmers – showed their ability to inform themselves (or be informed
by traders) about global market prices, stating that: “Australian and South African
producers get a basic price of Aus$5 per kilogram, which translates to about
Sh413.50.(…) The Chinese buyers were our saviours, not villains” (Muchui 2018).
Relatedly, farmers demonstrated their growing taste for politics, blaming Jungle
Nut CEO and freshly elected Thika MP, Patrick Wainaina, for allegedly plotting
the arrest (Kirimi 2018; Muthethia 2018).
These increased protests were again driven by traders. In 2018, Johnson Kihara –
the Thika broker behind the 2016 motion against the ban – together with other
brokers founded the macadamia trader association NUTAK and intensified his
opposition to the ban. Initially, NUTAK followed a two-pronged strategy: first, it
moved before the Nairobi High Court, hoping it would lift the ban; and second, it
petitioned the Parliamentary Committee for Agriculture to do the same. However,
according to reports in the Daily Nation, both attempts were futile, and only four
out of 29 members of the Agricultural Committee voted in their favour, to which
Kihara commented that “lawmakers had been compromised by cartels” (Thairu
2018). On the back of these failures, NUTAK leaders Kihara and Muguu then met
on 9 August 2018 with former Prime Minister and opposition leader Raila Odinga,
who according to the two promised he would discuss the matter with President
Uhuru Kenyatta. At the same time, NUTAK organized a range of further farmer
protests in Embu and Meru (Kamau 2018), rants against the ban in the Meru County
Assembly (Dibondo 2018), as well as the Embu High Court’s (rather dubious)
temporary order to prohibit the Attorney General and MoA to interfere with the
unshelled macadamia exports of one Embu macadamia trader (Muhindi 2018).
Withstanding the pressure, however, former initiator of the ban, current Deputy
President, and a likely favourite for becoming the next Kenyan President, William
Ruto, stated on 29 October 2018 in Embu that the government would not give up
on protecting the ban and hereby create processing jobs, adding that he would deal
firmly with brokers, and deport any Chinese macadamia buyer found in the market
2013b). As such, in contrast to the previous ministerial directive, the ban can only be lifted with the
approval of the National Assembly, thus seriously lifting the bar for that to happen.

212
(Muchiri 2018). It remains to be seen whether the opponents of the ban can break
this resolve.
To conclude, protests and farmer support of individual MPs have been picking up
in step with the strong increase of macadamia production and growers in recent
years. Overall, however, the number of producers has not nearly reached the mass
level of cashew producers in Ghana, or even bigger, tea growers in Kenya. As such,
it is in line with the argument that most MPs, as well as the government, do not
currently see a need to withdraw the ban. Should the rise of macadamia production
continue at the current pace, and with it the number of people producing it, I would
not be surprised if by the 2027 presidential and parliamentary elections the ban on
macadamia fell.
6.3.5. Conclusion of the Kenyan Macadamia Case
The introduction and maintenance of the ban on Kenyan macadamia strongly
resemble that of the domestic sister crop, cashew. Although confined in the eastern
Mt Kenya region, where Chinese exporters had operated and spiked prices, the ban
massively dropped farm gate prices. Given attempts by the government and
processors to obscure the introduction of the ban, it took macadamia farmers nearly
a year to realize it had been implemented despite traders’ information campaigns.
Once they did, however, farmers organized by brokers protested the ban. Yet, as at
the coast, politicians remained largely unphased by this and did not care to support
their protest. In fact, in several instances, MPs and members of the government
actively opposed attempts to remove it. Overall, the number of macadamia farmers
significantly hurt by the ban is too small to pose a serious political threat to policy-
makers and legislators. Given rapidly increasing numbers of farmers starting to
farm macadamia seriously, however, in a few years they might have reached a
critical mass large enough to put policy-makers under significant pressure.

213
6.4. Chapter Conclusion
This chapter set out to study the question what motivated the Ghanaian government
to withdraw its ban on raw cashew nut exports within less than a week of its
announcement, and why this motivation did not apply to the Kenyan government
which has maintained a ban on raw cashew and macadamia nut exports for over
nine years. Based on the theoretical framework of this thesis, it proposed three
general hypotheses. First, because export bans are also highly damaging to traders,
they would be motivated to inform producers about their existence and origin.
Producers, by contrast, would be receptive to this information campaign and
perceive the ban, if the ban’s price distortion itself was particularly visible. Second,
again with the help of traders and motivated by the high stakes involved, producers
would likely mobilize against the ban. Three, only when producers are many – and
this mobilization posed a significant political threat to policy-makers – would the
government withdraw the ban.
All three hypothesized mechanisms hold in the studied cases. Whereas the quick
and coordinated withdrawal of in-shell traders, the implementation of the ban in the
middle of the season, as well as an organized information campaign by traders
allowed for an almost immediate realization of Ghanaian farmers what had hit them,
it took farmers in Kenya longer to comprehend the ban. Whereas in Kenyan cashew
this was the result of the ban being imposed several months before the beginning of
the main season, in macadamia the attempts by the government and processors to
obscure the existence of the ban was more relevant. Eventually, with the help of
traders and significant price drops of up to 50%, farmers in all three cases
apprehended the introduction of the ban. Although the awareness of the ban and the
active mobilization through traders motivated farmers to protest the ban in all three
cases, the protests conducted by Ghanaian cashew farmers were undoubtedly the
most potent, reflecting their large group size. In line with this potency of Ghanaian
cashew farmers, ruling party MPs for the fear of their political survival within three
days of the ban introduced a motion against their own Minister and his directive.
Another two days later, having succumbed to the pressure of MPs and leading party
officials, the Minister had withdrawn the ban. In contrast in Kenya, local MPs and
other politicians could not be motivated to attend rallies against the ban, and even
voted against farmers’ and brokers’ motions to withdraw the ban in parliament.

214
Being produced by less than ten thousand farmers respectively, politicians
perceived them as no significant threat to their political survival, and hence saw no
reason to withdraw the ban. Yet, growing farmer numbers and renewed trader-
organized protests in the Kenyan macadamia areas might put the ban under stress
in the coming decade.
The comparison of the three cases also presents interesting policy implications.
Reiterating the cashew case conclusion, export bans can not only be extremely
damaging politically and economically in the short-term, but they can also close the
space for less extreme industrial policies in the longer term. Once producers are
sensitized to potential adverse policy-making they might also perceive less obvious
policy measures like export taxes. Secondly, if governments want to introduce a
ban nevertheless, they should make sure it is accompanied by a range of measures.
For example, governments should specify minimum farm gate prices and
institutions to monitor their adherence to ensure that farmer prices do not drop to
economically and politically unsustainable levels.

215
The motivation for this final empirical thesis chapter differs from the preceding one.
Chapter 6 tried to explain why three very similar country-commodity cases had such
different outcomes regarding the maintenance or withdrawal of export bans. In this
chapter, however, we try to explain why three very different commodities – raw
logs, metal wastes, and raw hides and skins (RHS) – face the common outcome of
being banned relatively frequently by African governments. In fact, they represent
the three most commonly banned commodities in the EPTA dataset. Given that
these commodities strongly shape the empirical pattern motivating the thesis and to
a significant extent the findings derived in the large-N regression analysis, it is
critical to study whether the thesis argument does indeed hold here as well or
whether alternative factors can explain their difference to other (especially
agricultural) commodities. For that purpose, I studied the explanatory power of the
thesis argument in relation to the 1995 raw log and the 2013 ferrous waste and scrap
export bans in Ghana as well as the 2012 de facto export ban (a 90% export tax) on
raw hides and skins (RHS) in Tanzania.
Fundamentally, each case demonstrates the assumed association between group
size and ban implementation (and maintenance). Governments imposed the bans to
protect the local processing industries, and in each case the losers from that policy
were so few that the governments had no reason to abstain from introducing it or
even withdraw it. What is more, in all three cases the bans considerably hurt those
that earned a significant share of their income from producing or dealing with the
unprocessed commodity, and in each case these policy-losers knew clearly to
attribute it to their governments’ decisions. Interestingly, although policy-losers in
the three country-commodity cases attempted to lobby against the respective policy
bans, only in the case of Ghanaian ferrous waste did they also stage notable protests,
organized by traders. Both in Ghanaian timber and Tanzanian RHS, independent
loggers and RHS traders did not feel that they had the numerical power to stage
significant protests and as such decided it most effective to concentrate on lobbying
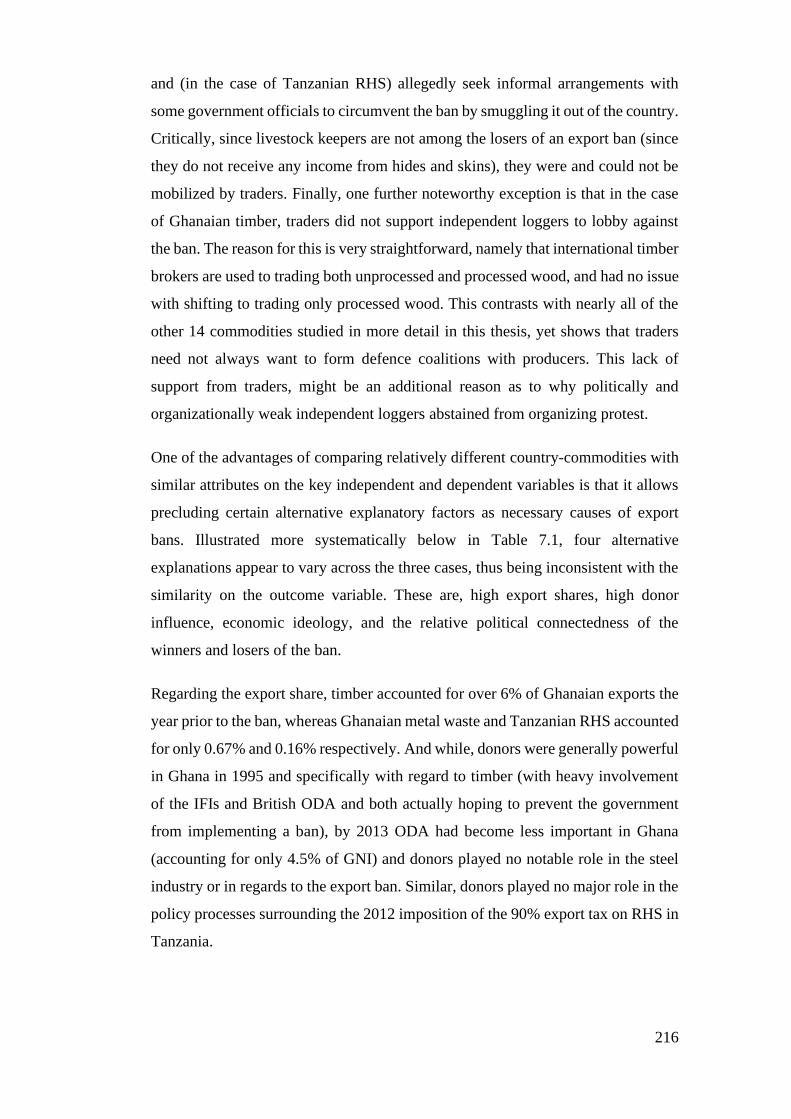
216
and (in the case of Tanzanian RHS) allegedly seek informal arrangements with
some government officials to circumvent the ban by smuggling it out of the country.
Critically, since livestock keepers are not among the losers of an export ban (since
they do not receive any income from hides and skins), they were and could not be
mobilized by traders. Finally, one further noteworthy exception is that in the case
of Ghanaian timber, traders did not support independent loggers to lobby against
the ban. The reason for this is very straightforward, namely that international timber
brokers are used to trading both unprocessed and processed wood, and had no issue
with shifting to trading only processed wood. This contrasts with nearly all of the
other 14 commodities studied in more detail in this thesis, yet shows that traders
need not always want to form defence coalitions with producers. This lack of
support from traders, might be an additional reason as to why politically and
organizationally weak independent loggers abstained from organizing protest.
One of the advantages of comparing relatively different country-commodities with
similar attributes on the key independent and dependent variables is that it allows
precluding certain alternative explanatory factors as necessary causes of export
bans. Illustrated more systematically below in Table 7.1, four alternative
explanations appear to vary across the three cases, thus being inconsistent with the
similarity on the outcome variable. These are, high export shares, high donor
influence, economic ideology, and the relative political connectedness of the
winners and losers of the ban.
Regarding the export share, timber accounted for over 6% of Ghanaian exports the
year prior to the ban, whereas Ghanaian metal waste and Tanzanian RHS accounted
for only 0.67% and 0.16% respectively. And while, donors were generally powerful
in Ghana in 1995 and specifically with regard to timber (with heavy involvement
of the IFIs and British ODA and both actually hoping to prevent the government
from implementing a ban), by 2013 ODA had become less important in Ghana
(accounting for only 4.5% of GNI) and donors played no notable role in the steel
industry or in regards to the export ban. Similar, donors played no major role in the
policy processes surrounding the 2012 imposition of the 90% export tax on RHS in
Tanzania.

217
Table 7.1. Overview of the Most Different Systems Design Including Most
Commonly Banned Commodities
Variables
Ghana
Tanzania
Timber
(1994/5) Metal
W&S
(2013)
Raw
Hides and
Skins
(2012)
Dependent Variable Ban
Withdrawal
– – –
Independent Variable High Comm.
Pop. Share – – –
Condition Variables
Producer
Mobilization (-) (✓) –
High
Attributability ✓ ✓ (✓)
High Price
Depression ✓ ✓ (✓)
Trader
Facilitation
– ✓ ✓
Competing
Explanations
Economic197 High Export
Share ✓ – –
High Market
Power – – –
High Profit
Margins
(–) (–) –
High Factor
Mobility ✓ ✓ (✓)
High
Developm.
(–) (–) (–)
IPE Trade
Agreement
WTO/No
EPA
WTO/No
EPA
WTO/No
EPA
High Donor
Influence ✓ – (✓)
High Tariff
Escalation
– (✓) –
Left Gov. Econ.
Ideology
(–) – (✓)
Politics Primarily
Produced in
President’s
Ethnic Region
– – –
High Relative
Political
Connection of
Processors
✓ ✓ (-)
Democratic (✓) ✓ (✓)
197 The nine differences in commodity value chain characteristics discussed in 3.2.3.2 could also be
incorporated here. I have not done so because of space constraints.

218
In terms of government ideology, we assumed that more left-leaning governments
would be more likely to impose export bans. Neither the 1995 or 2013 Ghanaian
governments that imposed bans on logs and ferrous waste can be considered
particularly left-leaning however (although the NDC used to have a more economic
leftist policy stance prior to its rigorous implementation of SAPs). Similarly,
Tanzania’s ruling party CCM has a long socialist history, however, by the time of
the de facto ban in 2012 under President Kikwete, CCM had been practising a more
centrist economic approach (although perhaps slightly more on the left of Ghana’s
NDC government).
Looking at the relative political connectedness of export bans’ winners (processors)
and losers (producers and traders) we find some variation across the three
commodities. Whereas Ghanaian timber and steel millers were significantly better
connected than independent loggers and scrap collectors and dealers, in Tanzania
there is evidence that RHS traders had substantial political connections into
responsible government authorities, on par with tanners. As such, processors having
better political connections than raw commodity traders and producers is not a
necessary condition for a ban, but it is likely to increase the probability of
processors receiving the government’s support. Similarly, the mere existence of
processors that can lobby and might need protection is likely to increase the
likelihood of a ban. Although, as discussed in Chapter 3, there are cases where
governments have implemented bans without the existence of a notable processing
industry (e.g. in Tanzanite in 2010), in the six country-commodity cases studied in-
depth in this thesis processors were always critical to pushing the agenda of
protection via export bans.
On the face of it, there also appears to be some variation in tariff escalation across
the three commodities. On average, the EU, the United States, China and India
imposed (in the years of the bans) 1.43% higher import taxes on semi-processed
logs versus unprocessed logs, only 0.05% higher import tariffs on semi-processed
hides and skins versus RHS, and nearly 3% higher import tariffs on intermediate
steel goods versus ferrous waste and scraps. Overall, none of these three tariff
escalations is remotely high, thus, not contributing to the hypotheses that
governments impose export bans as a reaction to tariff escalation in potential
importing countries. Moreover, the 3% import tariff for intermediate steel goods is

219
relatively insignificant, given that African steel industries usually produce for the
domestic rather than export market, and hence any degree of tariff escalation is not
likely to phase them.
Simultaneously, there are several alternative explanations which are relatively
constant across the three cases. As such, on the first look, they could be potential
explanators. Some of them, however, appear to have opposing correlations to what
one might expect. In Chapter 3 we hypothesized that a commodity having high
factor mobility should likely induce the government not to impose a ban on it, given
that this increases the likelihood of killing (or rather, chasing off) the goose that
lays the golden eggs. All three relatively frequently banned commodities, however,
have relatively high factor mobilities in comparison with the agricultural
commodities studied. Similarly, all three country-commodities had low levels of
global market power. Hence, the hypothesis that governments would be less daring
to ban a commodity if it does not have high market power (and thus foreign
investors would be more likely to flock into processing) does not seem to apply
here.
As indicated in Chapter 3, getting good data on producer profit margins is difficult.
This is especially true when pre-ban profit margins lie back as far as 1994 (as in
Ghanaian timber) or producers (or traders) are unwilling to share any data on profits
(such as RHS traders in Tanzania). What can be said, however, is that across the
three commodities198 many producers and traders closed shop due to the bans (or
shifted to smuggling the commodity to avoid its impact). Showing that producers
and traders are affected by the bans to the point that they cannot continue to conduct
business provides some evidence against the hypothesis that profit margins in those
commodities are so high that governments do not avoid banning them as much for
the fear of them exiting business.
Other alternative variables also do not appear to generate substantial explanatory
traction. As discussed above, being a developing country cannot explain the
198 Arguably less so in Ghanaian ferrous scrap collection, because collectors also collect and trade
non-ferrous scraps, allowing many of them to make a living despite significant drops in part of their
income. This, however, is less a reflection of the profit margins made with collecting that commodity
and more with income alternatives in this case.

220
variation we see across commodities regarding export ban propensity within the
same country. The same holds for the democracy and trade agreement variables.
Finally, it is true that none of the three commodities is primarily (>60%) produced
in the president’s co-ethnic region. One could take this as support for Bates and
Block’s (2009) argument that presidents are less likely to distort prices of
commodities produced by their own coethnics. Though it should be noted that
ethnicity does not play a significant role in Tanzanian politics (thus all commodities
are not primarily produced in the president’s region), yet not all commodities are
banned. Similarly, Ghanaian cashew was also not produced primarily (or even to a
significant extent) in the president’s home region, yet nevertheless, he decided to
withdraw the ban. As such, the case comparisons conducted in this thesis do not
provide any significant comparative or anecdotal evidence to support this potential
association between ethnicity and export bans. Whether, however, this is true for
commodity price distortions more broadly speaking is not addressed in this thesis
and deserves further research.
This chapter proceeds in four parts. First, section 7.1 discusses the introduction on
the comprehensive export ban on logs of all species (except for teak) in Ghana in
1995. Section 7.2. discusses the imposition of the 2013 export ban on ferrous waste
and scrap in Ghana. The Tanzanian government’s introduction of several high
export taxes on RHS in the 21st century, culminating in the imposition of a 90%
export tax in 2012 is discussed in Section 7.3. The case studies follow the same
structure as those in Chapter 6. They first provide a short historical introduction
into the origins of production and processing, before discussing why the desire for
a ban emerged. After describing how the ban was implemented, analysis and test of
the theoretical framework against the political processes following the ban is
conducted. Section 7.4. concludes with a comparative overview of the key case
study findings.

221
7.1. Transforming Timber: The Political Economy of the 1995
Ghanaian Rough Log Export Ban
Nearly all productive forests, and with them the Ghanaian timber industry, is
concentrated in the so-called high forest zone. Located in the south-west of the
country, it covers almost one-third (85,000 km²) of Ghana’s total land area and
spans five of its most populous regions: Ashanti, Eastern, Central, Western, and
Brong-Ahafo (compare Figure 7.1). The majority of today’s productive forests are
located in 216 so-called forest reserves covering around 20% of the high forest
zone, primarily established in 1927 century by the British colonialists to protect
around 25% of the then-existing forest (Birikorang 2001; Treue 2001). In contrast,
areas outside of the reserves (so-called ‘off-reserves’) were officially intended and
encouraged by the 1948 Forest Policy to be converted to other uses such as
agricultural development (particularly cocoa farming) and gold mining.
Accordingly, the vast majority of Ghana’s early 20th-century forest stand has now
been deforested.199
The history and development of Ghana’s timber industry leading to the 1995 rough
log ban can be divided into four distinct periods. First, the pre-independence era
saw the genesis of the sector under colonial rule in the late 19th century as well as
the rapid expansion of a foreign-dominated timber processing industry in Ghana
from the 1930s on and particularly after World War II. Thereafter, the first decade
of independence under Nkrumah saw a further expansion of the processing
industry. Fourth, Nkrumah’s ousting was followed by nearly two decades of stark
crisis throughout the Ghanaian timber (and national) economy. And finally, the
recovery of the Ghanaian timber sector (including processing) under the IFI-
promoted 1983 Economic Recovery Programme. Before discussing the immediate
events leading to the 1995 export ban and the politics surrounding it, the next
sections will summarize the sectors industry along these four periods.
199 It is estimated that during the period of 1955-72 alone about one-third of the forests in Ghana
have disappeared (Treue 1999: 45).

222
Figure 7.1. Administrative and Vegetation Zone Maps of Ghana
Source: Landkarten und Stadtplan Index (2019) and Owusu (2012: 25).
7.1.1. 1891-1957: The Colonial Timber Economy in Ghana
The genesis of Ghana’s formal timber industry is generally dated to 1891, when the
first consignment of 3,000 m³ of mahogany was exported (Oduro et al. 2011: 20).
Thereafter, the industry rapidly expanded. Dominated by foreign-owned logging
companies, primarily extracting mahogany (Khaya and Entandrophragma spp) and
exporting to the European market, timber exports increased to over 35,000 m³ by
1898 and to 90,000 m³ by 1913 (Hansen and Lund 2017). Reflecting its priority on
agriculture over forest productivity at the time, however, the colonial government
in 1909 established the Forestry Department and Forest Policy with the main goal
of ensuring that this expansion would not interfere with the viability of agriculture,
particularly the cultivation of cocoa (Oduro et al. 2011: 16–18).
Until the 1930s, exports were almost exclusively in log form and processing of
timber occurred mostly in very basic saw-pits for the domestic market. Thereafter,
however, import demand for semi-processed tropical timber in Europe increased
and with it the space for more advanced sawmills in Ghana. It is critical to note that

223
throughout modern history there have been two distinct types of demand from
Western importers for tropical timber200. Critically, however, manufacturers in the
West differ(ed) in whether they own their own sawmills or not (or whether they
owned sawmills with the capacity to cut large diameter tropical logs). When they
did – which was arguably true for most buyers in Europe – they would be more
interested in importing rough logs and saw them themselves. When they did not,
they would be keen to import already semi-processed timber, such as sawn lumber,
veneer or plywood (compare Figure 7.2 below for a flow diagram of key timber
products).201 With growing demand from the latter, foreigners (particularly British)
started to set up larger-scale sawmills in Ghana (particularly in Western Ghana and
at the port city of Takoradi) in the 1930s. By 1939, Owusu (2012) describes that 15
sawmills produced and exported a total of around 140,000 feet of mill sawn timber.
202
Due to increased resource needs, the necessity to save foreign currency, and the
lack of domestic labour during World War II, the British significantly boosted their
demand for timber processed in Ghana.203 This led to the direct establishment of
new processing mills but also the creation of new export markets for the previously
rather little-known West African woods (compare Figure 7.3). With the European
post-war reconstruction demanding ever-increasing amounts of timber, this market
200 Tropical timber usually refers to a range of hardwoods grown in the tropics, which given their
high durability, workability, and attractive grain and colour patterns were used particularly to build
high-quality cabinets, flooring, furniture or music instruments.
201 Ghana Timber Scholar 1, Per Telephone, 11.06.2019.
202 Specifically, Owusu (2012) describes that there was a wide variety in technological development
between these 15 companies, and that two British-owned companies dominated, specifically Messrs.
Thompson, Moir, and Galloway and the West African Mahogany Company.
203 This was caused by three main factors. For one, the war effort required unpreceded amounts of
resources, leading the UK government to demand from its colonial governments in Western Africa
to step up the export of timber and rubber in particular (Oduro et al. 2011: 21). This military
requirement for timber is evidenced by the fact that an estimated half of all exported Ghanaian timber
went directly to the British and American Armed forces (Owusu 2012). Second, while the UK could
likely have sourced its increased hardwood requirements from the USA during the war, its lack of
foreign currency made it much more attractive to source hardwood from its own colonies. Finally,
given the lack of labour and processing capital in the UK during the war, the UK government was
keen to receive lumber rather than rough logs from the colonies. Much of this increased demand
needed to be covered by low-technology saw-pit mills, which between 1944-1945 produced as much
as 1 million ft³ of lumber for the colonial government. At the same time, the Forestry Department
actively encouraged the setting up of more large-scale sawmills and had established its own sawmill
in Kumasi (Wood Supply Ghana Limited) from rather derelict machinery.
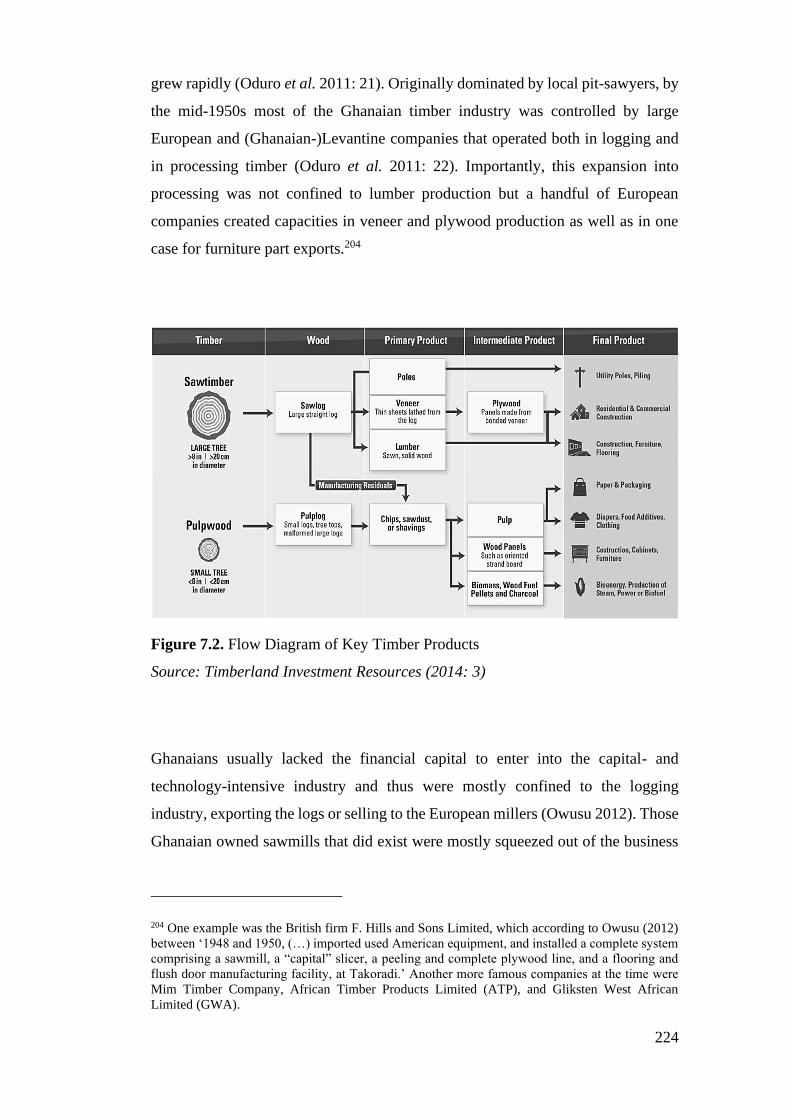
224
grew rapidly (Oduro et al. 2011: 21). Originally dominated by local pit-sawyers, by
the mid-1950s most of the Ghanaian timber industry was controlled by large
European and (Ghanaian-)Levantine companies that operated both in logging and
in processing timber (Oduro et al. 2011: 22). Importantly, this expansion into
processing was not confined to lumber production but a handful of European
companies created capacities in veneer and plywood production as well as in one
case for furniture part exports.204
Figure 7.2. Flow Diagram of Key Timber Products
Source: Timberland Investment Resources (2014: 3)
Ghanaians usually lacked the financial capital to enter into the capital- and
technology-intensive industry and thus were mostly confined to the logging
industry, exporting the logs or selling to the European millers (Owusu 2012). Those
Ghanaian owned sawmills that did exist were mostly squeezed out of the business
204 One example was the British firm F. Hills and Sons Limited, which according to Owusu (2012)
between ‘1948 and 1950, (…) imported used American equipment, and installed a complete system
comprising a sawmill, a “capital” slicer, a peeling and complete plywood line, and a flooring and
flush door manufacturing facility, at Takoradi.’ Another more famous companies at the time were
Mim Timber Company, African Timber Products Limited (ATP), and Gliksten West African
Limited (GWA).

225
by the mid-1950s given their lack of access to the kind of technology and capital
that the foreign-owned companies could command (Oduro et al. 2011: 21–22). That
being said, Owusu (2012) describes that the technology employed by European and
Levantine companies was often second-hand equipment bought from different
sources in the West. This had the consequence that the machinery required more
repairs and that at the same time it was difficult to build a homogenous and efficient
market for spare parts given the diverse makes and specifications of the equipment.
Nevertheless, at least during the 1950s and 1960s, the companies remained
profitable.
Figure 7.3. Timber export m³ from Gold Coast Colony and Ashanti 1946-‐1957
(combined logs and sawn timber)
Source: Hansen and Lund (2017)
7.1.2. 1957-1966: The Nkrumah Post-Independence Years
When Ghana attained independence in 1957, the country already had a sizable
timber logging and processing industry – much earlier than other leading centres of
tropical timber like Indonesia or Malaysia. The industry had also become one of the
most relevant, in 1965 accounting for 6.2% of the country’s GDP (Repetto and

226
Gillis 1988: 316–319). Importantly, however, both logging and processing was
almost completely in the hands of foreigners. According to Oduro et al. (2011: 24),
at Independence, 96% of all timber concessions in the country were held by
expatriate companies. Moreover, log exports at the time were highly concentrated,
with four large foreign corporations and one domestic firm together accounting for
about 80% of log exports (Repetto and Gillis 1988: 313). And in general, although
a respectable processing industry had been established, most timber was still
exported as rough logs (ca. 77% of the total timber export volume in 1960), even
by those companies with processing units (Huq 1989).
Faced with this context and driven by his own political ideologies and interests,
independence leader and prime minister Kwame Nkrumah had four overarching
and to some extent competing goals for the timber sector: decreasing the dominance
of foreign companies and increasing the share of processed timber exports, while
making sure that his existing and potential political opponents – traditional Ashanti
chiefs and domestic capitalists – were not strengthened (Boone 2003; Owusu 2012).
To do so, Nkrumah implemented a range of legislations. Regarding forest land he
implemented two landmark pieces of legislation in which he withdrew the stool
lands and their income from the stools and that gave him the power to limit and
redistribute land owned by expatriates.205 And in the context of processing, his
205 As indicated above, the two main profiteers of the pre-independence concession system were
foreigners that could acquire huge swathes of forest at relatively low royalties; and traditional
‘Stools’ possessing their own forests who receive these royalties, which to them were still an
important source of income (Owusu 2012). In line with its goals to reduce both foreign and
traditional leaders’ influence in the sector, in 1962 the Nkrumah government implemented two
landmark pieces of legislation. First, the promulgation of the Administration of Lands Act of 1962
(Act 123) vested the stool lands in the office of the President (created and assumed by Nkrumah in
1960), making Nkrumah (and all his successors) the trustee of all such lands. As such, the president
(or the Forestry Department in his stead) received the right to manage all forestry concessions,
starving local communities – and Stools in particular – of an important income source. Moreover,
the act allowed a reformulation of the limits relating the duration and size of a concession.
Specifically, a timber concession was not to exceed 30 years in duration and a single grant was not
to exceed 40 square miles, and an aggregate of grants of timber rights was limited to 240 square
miles (Owusu 2012). This combined with the Concessions Act of 1962 (Act 124) – which
empowered the Head of State to cancel concessions if they were deemed to be “prejudicial to public
safety or interests” – allowed the government to significantly redistribute concessions and thus
reduce the overall and average concessions owned by expatriates (Owusu 2012). Martin (1991: 135)
describes that out of around 100 concessions granted in Ghana from 1961-1971, only two went to
foreign companies. Moreover, the average size of concessions decreased from 686 km² to 41 km²
during the same period, showing the effectiveness of the legislations. Although it needs to be said
that in many cases the new and redistributed concessions effectively went to existing and new

227
preferred policy was to create state-owned timber processing enterprises, such as
the Kumasi Furniture and Joinery Company opened in 1960. However, Nkrumah
had soon realized the technological, capital, and managerial problems206 the state-
owned companies faced and decided that the goal of promoting industrialization
was greater than the desire to reduce foreign influence. As such, his government
eventually encouraged the entry of foreign entrepreneurs (preferably but not only
in joint ventures with the state, such as Mim or Saoud Timbers Limited) by granting
them tax concessions (Owusu 2012). Ghanaian-owned companies thus remained
mostly confined to smaller and less-capital intensive processing operations.
7.1.3. 1966-1982: The Post-Nkrumah Crisis Period
In 1966, Nkrumah was deposed by a military coup staged in his absence. What
followed were 16 years of economic and political volatility and crisis, with over six
presidents, five successful coup d’états, and a severe economic downturn. As
illustrated in Figure 7.4 below, this crisis was felt in the timber industry. From 1973
to 1982 the volume of total exports fell from over 1,2 million m³ to around 100,000
m³, its value from US$ 130 million to just US$ 15 million, and the industry’s share
in exports from around 18% to 2% (Clark 1994; Oduro et al. 2011: 24). During the
same year, the capacity utilization of the country’s 164 sawmills stood at only 25%
(Huq 1989: 105). The timber industry was close to collapse.
foreign companies that would use Ghanaians as a front, which also gave rise to corruption in the
sector, with Forest Department officers paid bribes to look to the other way (Owusu 2012).
206 Summarized by Owusu (2012) as follows: ‘On the whole, most of the state-owned operations
tended to be overequipped and operated below capacity. Problems with administration and financial
management were compounded by difficulties in production management maintenance and working
capital for spare parts. Many machines tended to be cannibalized to provide spare parts for other
operating machines. The government was not effective in managing most of these companies and
some managers lost or stole millions of dollars through loans and price fixing (Barker et al., 1991,
p. 9). The joint state-foreign and wholly foreign-owned companies, on the other hand, tended to be
more technically sophisticated, capital-intensive enterprises which also possessed expert
management’.

228
Figure 7.4. Total Wood Exports by Volume of Product Groups, 1972-96
Source: Treue (1999: 47)
Three factors are commonly named in the literature as the causes for the Ghanaian
timber industry’s severe crisis. In general, the period from 1972 to 1981 –
specifically under the rule of Colonel I.K. Acheampong (January, 1972 to July,
1978) and the People’s National Party, under Hilla Limann (September, 1979 to
December, 1981) – was said to have been characterized by ‘complete
mismanagement’ (Huq 1989: 16). Economically, particularly the high currency
overvaluation, poor infrastructure, and the companies’ consequent inability to
source adequate spare parts resulted in an explosion of transport costs for the
Ghanaian timber industry.207 Second, the general public sector mismanagement of
207 Apart from general macro-economic imbalance, part of this mismanagement was a severe
overvaluation of the Ghanaian Cedi. This overvaluation made Ghanaian goods significantly more
expensive for international buyers and as such was part of decreasing the competitiveness of the
Ghanaian export industry, including the timber sector. At the same time, infrastructure like roads,
railroads, and ports also suffered severely from mismanagement and lacking investment in the
economy. Given the weight and volume of timber logs, the timber industry is highly reliant on a
functional transport infrastructure. However, the infrastructure at the time was anything but
functional. Rather, Oduro et al. (2011: 24) summarize the environment then as follows: ‘Aging
sawmills gradually came to a standstill, trucks fell idle, road and rail facilities to the ports fell into

229
the country at the time was also felt directly into the Ghanaian timber sector.
Specifically, set up to regulate the marketing and export of all timber products, the
Ghana Timber Marketing Board (TIMBOD) was perceived by actors in the sector
at the time largely as a bothersome industry-inhibiting and rent-seeking agency
(Owusu 2012: 67–69).208 Third, the post-Nkrumah governments had taken their
policy of indigenization and nationalization the timber industry to an arguably
unhealthy extreme. High indigenous staffing quotas and requests to surrender 55%
of equity shares put foreign firms under serious operational stress and by 1981 most
of them had left the country and with them their experience and international
competitiveness.209
despair, while those companies that managed to reach the port in Takoradi found the loading
facilities had collapsed too.’
208 Prior to export, the contracts of nearly 94% of all timber exports had to be approved as
corresponding to a minimum price level TIMBOD set in relation to trends on the world market
(Owusu 2012: 67–69). This process, however, was extremely cumbersome and destructive for a
couple of reasons. First, exporting companies and TIMBOD had to go through a process of thirty-
two steps until the timber could be exported (Owusu 2001: 71). Consequently, it usually took
TIMBOD three to four weeks to approve a contract. Prospective buyers who urgently needed timber
turned elsewhere for their supplies, leading to a massive loss of business for domestic companies.
Secondly, the board set minimum prices based on prices in the previous quarter. Thus, when prices
decreased regarding the previous quarter, local companies were bound to unrealistically high
minimum prices and could not compete on the world market. And when prices were rising, exporters
could ship their wood at artificially low prices and keep their excess profits overseas, thus causing
the government to lose foreign revenue. And more generally, the board rarely checked the quality,
species, and quantity of the logs, thus – often with the support of a bribe – exporters could easily
have their contracts approved with prices far below the official minimum.
209 Regarding indigenization – or ‘Ghanaianization’ as the National Liberation Council that had
toppled Nkrumah termed it – the entry of Ghanaians into both logging and wood processing was
strongly encouraged and facilitated. Large-scale European companies like Mim lost part of their
timber rights to small-scale enterprises favoured by the government (Martin 1991: 137). In the late
1960s and 1970s, the government actively granted more forest concessions and loans (sometimes at
negative real interest rates) for capital equipment purchases to numerous Ghanaian logging
contractors (Repetto and Gillis 1988: 313–314). Moreover, to increase the share of Ghanaian
employees in industry, the 1970 Ghana Business Promotion Act (Act 334) established quotas
limiting the number of non-Ghanaians who could be employed in certain industries and occupations,
among them many positions within wood-processing enterprises. These policies were clearly
successful in increasing the number of Ghanaian operators in the timber industry. From a nearly
completely foreign-owned industry at the advent of independence, by 1981 more than the majority
of accumulated investment in the Ghanaian forest sector was owned by locals (Repetto and Gillis
1988: 314). On the flipside, economically most of these new local-owned companies struggled to
survive given the extremely high costs of operations and technological demands (without sufficient
foreign experts remaining in the country to assist them) and the dwindling profits (Martin 1991).
The success of post-Nkrumah governments’ nationalization strategies was equally questionable. In
October 1973, the Archeampong government directed all foreign natural resource firms to surrender
55 % of their equity to the government. Consequently, many companies left soon thereafter. Two to
three years later, the four remaining multinational timber firms sold their entire shares to the
government and left Ghana's timber industry for good. As described by Owusu (2012: 46) – quoting

230
Although they were largely responsible for the hardship the timber processing
industry was facing, Ghanaian governments in the 1970s actively tried to promote
processing using species-specific log export bans. Given the context that in the early
1970s rough logs still constituted around 78% of all timber exports (Huq 1989;
Owusu 2012: 47–48), the government in 1972 initiated a move to ban the export of
14 major species210. However, it was not until January 1979 under the rule of
Lieutenant General Akuffo that the ban came effectively into force (Huq 1989). As
detailed by Asamoah Adam et al. (2006: 285), Repetto and Gillis (1988: 338), Huq
(1989), and Birikorang (2001: 38), the core aims of the ban were to promote
domestic processing, generate jobs, and secure the log supply of species in regular
demand by domestic processing plants. Simultaneously, the government abolished
all export taxes on sawn timber. Overall, Repetto and Gillis (1988: 338) perceived
these industrial policy measures as largely ‘meaningless given the deep
overvaluation of the cedi’ and noted that by 1984 the share of logs in total wood
exports had remained about the same as in 1970. Apart from the overvaluation, it
needs to be noted that while the banned species were indeed among the most
important, the fact that the ban was not imposed on all species made it relatively
easy, according to one interviewee, to export the banned species with or without the
support of timber and port officials.211 And as such it is difficult to assess for the
1979 ban whether protest by loggers against the policy was absent because they
were weak or because the ban was not implemented well and they were not really
negatively affected. In contrast, we have more information on the outright 1995 raw
log export ban discussed in detail below.
Gyimah-Boadi (1991: 195) – the takeovers were not planned well, lacked any feasibility studies and
soon the companies were ‘plagued by shortages of critical staff, overstaffing, inadequate
capitalization, undue political interference, mismanagement, corruption and inefficiency. (…)
Government ownership of the major firms therefore tended to seriously undermine the industry’. By
1981, all four former major multinationals ran at a significant loss (Repetto and Gillis 1988: 313–
314).
210 In total, Ghanaian forests host 730 tree species, of which 680 attain a diameter of 5cm or more at
breast height, the absolute minimum to be processable (Treue 1999: 33). Out of these, only around
66 species had been exploited on a commercial scale by 1973, and 12 species accounted for 80% of
stems felled (Asamoah Adam et al. 2006: 287).
211 Ghana Timber Scholar 1, Per Telephone, 11.06.2019; Ghana Timber Consultant, Accra,
12.05.2017.

231
7.1.4. 1983-1994: The Economic Recovery Programme and the
Revitalization of the Ghanaian Timber Industry
Following a period of severe recession, the timber industry witnessed its revival
starting in 1983. Unhappy with the economic progress of the Nkrumahist PNP
government, the leader of the successful 1979 coup d’état – flight lieutenant Jerry
Rawlings – again putsched away the government on 31 December 1981, putting
himself and his Provisional National Defence Council in power. Faced with this
severe crisis, Rawlings – as many African leaders at the time – was forced to accept
economic assistance from the international community and IFIs, on the condition
that an SAP was implemented.212
A central part of the so-called government-launched and IFI-guided 1983 to 1988
Economic Recovery Program (ERP) was the revitalization of the timber industry.
The overriding purpose of the ERP was to reduce Ghana's debts and to improve its
trading position in the global economy. A key strategy to do so was to promote
economic sectors that could quickly increase the production of exportable goods
(which was part of the ERPs Export Rehabilitation Programme). Seen as ‘a goose
that could quickly lay golden eggs’ (Owusu 2012: 99), the timber sector became
the beneficiary of the second-highest capital infusion in the context of the ERP.213
And in contrast to other instances like the much-discussed case of Mozambican
cashew processing (Aksoy and Yagci 2012; Cramer 1999; McMillan et al. 2003;
Pitcher 2002), the IFIs explicitly saw a purpose in promoting processing and
212 At first, however, Rawlings pursued economic interventionist, urban biased, and anti-free trade
policies like his predecessors. Rather than solving the economy’s woes, it appeared these policies
only worsened them (as did the simultaneous severe drought and forced return of a million young
men from Nigeria). By 1983, annual inflation had spiraled to 123%, the national debt had reached
US$1.5 billion and external reserves could barely cover a few days’ imports (Oduro et al. 2011: 24–
25).
213 The sector received a total US$ 157 million in World Bank loans (Owusu 2001: 59–60). Particular
crucial was a US$ 52 million loan scheme implemented in 1985 and 1986.
232
actively supported it (World Bank 1987: 22).214 In parallel, the government engaged
in a range of further activities to restructure the sector.215
Overall, the ERP was highly successful in reviving the timber sector. As the curve
in Figure 7.4 above indicates, the timber industry responded very quickly to the
ERP’s incentives. From 1982 to 1988, the annual recorded timber harvest increased
from approximately 400,000 m³ to 1.2 million m³, whereas export increased from
around 100,000 m³ to 530,000 m³ during the same time (Treue 1999: 47–49).
Relatedly, the number of log exporters grew from 90 to around 300 by the end of
the 1990s (Oduro et al. 2011: 24–25). Processing also saw a major boost. Whereas
capacity utilization stood at only 20% in 1982, by 1988 this had increased to a
respectable 70% (Owusu 2001: 63). And as illustrated in Figure 7.4, in 1990, around
as much timber was exported in processed as in rough log form. After almost two
decades of near-collapse, by the end of the 1980s, the timber industry had returned
to the heights reached during the early post-independence days.
7.1.5. The 1994/5 Export Ban on All Rough Timber Logs
Between 1979 and 1988 the export of raw logs of 19 major timber species had
already be banned, in each case processing promotion having served as the core
214 Looking at the distribution of credits by project type (Owusu 2012: 101), we see that the IFIs
were particularly keen on financing access to new logging equipment to integrated mills and non-
integrated concessionaires (53% of all loans), but also in providing credits for sawmills to invest in
rebuilding and improving their sawmills (30%).
215 First, the government privatized many of the former state-owned companies that had always
struggled to be economical (Owusu 2012: 100). Second, it disbanded TIMBOD in 1986 and replaced
it with the Timber Export Development Board (TEDB), and the Forest Products Inspection Bureau
(FPIB), which were to perform TIMBOD’s functions more efficiently separately. Third, showing it
was willing to use the stick if need be, in 1987 the PNDC started a massive investigation of, and
crack-down on the industry for ‘irregular activities’ such as smuggling, tax evasion, non-payment
of timber royalties and fraudulent invoicing, leading to the indictment of a number of firms by the
National Investigations Committee (Owusu 2001: 53). However, the government also used carrots
to promote export-oriented processing. As part of the 1985 Ghana Investment Code of 1985,
sawmillers would be granted tax rebates based on volumes exported, and could retain 20–35 per
cent of the export earnings in an external account at the Ghana Commercial Bank in London, that
could be used to purchase spare parts, equipment and other materials, as well as for debt servicing
and payment of profits, dividends and expatriate staff (Owusu 2001: 61–62). Relatedly, processing
firms were granted full exemption for import duties on necessary inputs required for the enterprises.
Finally, in January 1988 a further five species were added to the list of banned rough logs to further
promote processing (Asamoah Adam et al. 2006: 285). The dip in log exports and slight increase in
processed timber exports following the ban illustrated in Figure 7.4 above, might be an indication
for the effectiveness of the ban.

233
motivation. In 1994, however, the government gazetted the directive that it would
implement a ban on all rough timber logs (except for teak logs), starting in 1995. In
the following sections I will analyse what events led to this policy and provide a
short overview of the general economic and organizational context of the timber
sector at the time.
7.1.5.1. Structure of the Ghanaian Timber Sector Before the 1995 Log Export Ban
Both before and after the 1995 export ban, the Ghanaian timber industry can be
separated into two major spheres: the domestic and export market. The domestic
market216 is dominated by illegal loggers.217 Since illegal loggers do not pay any
tax or concession royalties, they can provide timber at much cheaper rates to the
domestic market than formal processors could, explaining formal processors’
almost exclusive focus on the export market.
The formal export-oriented timber industry – the focus of this study and illustrated
in Figure 7.5 – was characterized by five key players. First, up to 350 mostly
Ghanaian-owned firms usually with less than 10 employees were dedicated entirely
to logging (Birikorang 2001: 29).218 Although employing less than 5,000 people in
total, these independent logging companies and small-scale concession holders
likely accounted for 50-70% of all timber harvest at the time (Mayers et al. 1996:
19).219
216 Accounting for 75% and 24% respectively of the domestic market, the furniture and construction
industries are the biggest sources of local demand for wood (Sutton and Kpentey 2012: 293)..
217 Around 53% of this demand is supplied locally by the informal sector, followed by imports (34%)
and the formal milling sector, accounting for only 13% (Sutton and Kpentey 2012: 293). The
dominant informal sector is characterized by illegal chainsawmiller operations, which have
overtaken the domestic market since the crisis of the timber sector in and the widespread
introduction of chainsaws in the 1980s. These consist mostly of small groups of Ghanaian villagers
in the High Forest Zone, that using chainsaws illegally log and both mill trees directly at the logging
site (Hansen and Treue 2008; Illegal Logging Portal 2006). Chain-sawn timber is then transported
and sold to urban wood markets – most prominently the Kumasi or Anloga Wood Market -, from
where the lumber is sold on to the construction and informal manufacturing firms.
218 In 1994 there were only 260 active concession holders left in total (Mayers et al. 1996: 19), thus
making it unlikely that there were still 350 independent loggers plus a sizable number of integrated
processors left in the year before the ban.
219 Birikorang (2001: 34) states that in 1999 only 1,089 people were employed by 70 independent
logging firms. Given his (perhaps somewhat too high) estimation that the independent logging sector

234
Figure 7.5. The Ghanaian Timber Product Chain Prior to the 1995 Log Export Ban
Source: Own Illustration
Second, around 110 sawmills, nine plywood mills, and 15 veneer mills were active
in processing logs (Mayers et al. 1996: 19). Importantly, these were split into
dedicated processors and integrated processors, which also harvested logs on their
own usually large concessions. Whereas dedicated processors were usually
Ghanaian and focussed on smaller-scale sawmilling, integrated loggers were
mainly foreign-owned, large-scale, and often also ventured into more complex
processing steps, such as veneer, plywood, flooring, mouldings, and/or furniture
part production. In terms of processing volumes, large-scale integrated players
counted around 350 firms prior to the ban, we can estimate that there were likely no more than 5,000
people employed by independent logging companies.
Integrated
Processors
Dedicated
Formal
Loggers
Foreign
Buyers /
Processors
Export
Informal
Chainsawmille
rs
Local
(Informal)
Manufacturers
Local
Consumers
Dedicated
Sawmills
Foreign
Agents /
Traders
Lumber Lumbe
r
Lumbe
r
Final
Products
Final
Products
Logs
ikkk
Logs
ikkk
Logs
ikkk
Lumbe
r
All kind of
products
(logs,
lumber,
veneer,
plywood,
furniture
parts, etc.)

235
clearly dominated. According to Birikorang (2001: 16), the ten largest lumber
exporters accounted for nearly half (46%) of all lumber exports in 1992. In terms
of employment, processing was significantly larger than independent loggers.
Overall, up to 50,000 people likely worked in processing prior to the ban.220 As
such, it is critical to state that there were ten times more people in Ghana that would
benefit from a ban (i.e. all people that in one way or the other work for processing
companies) than those that would lose out from it (i.e. those working in dedicated
logging firms).
Lastly, wood export agents. These were often young Europeans send by large
Western timber trading houses to buy and export timber coming from the High
Forest Zone at the two key ports (Takoradi and Tema).221 Although some larger
logging and processing firms would be able to export directly to foreign customers
or in certain cases their parent companies in Europe (Owusu 2012: 43), 222 Asumadu
(2004: 24) estimates that even post-ban nearly 95% of timber exporting firms in
Ghana relied on foreign agents and brokers to arrange their exports. What is critical
to note, however, is that these traders are apt to trading in logs, lumber, and other
wood products simultaneously, and can easily change both customers and suppliers
(Asumadu 2004: 24). This contrasts to traders in most other African commodities,
where commodity exporters mainly export the raw commodity, and processors tend
to have an exclusive hold on processed exports. Thus, in the case of timber, traders
would not be particularly shocked by a log export ban, as they still have enough
market for lumber and other processed timber products. Critically, independent
loggers were thus the only real losers of an export ban.
220 With the firm numbers for integrated and independent processors not having changed as starkly
over time, we can assume that the export-oriented processing industry in total employed around as
many people as in 1999, namely 47,797 people (Birikorang 2001: 34). These numbers compare
nicely to figures produced by other sources from other decades, like from the (FAO 2014b: 97;
World Bank 1987: 5; Owusu 2001: 69; Repetto and Gillis 1988: 318).
221 Ghana Timber Scholar 1, Per Telephone, 11.06.2019.
222 The Naja David Group of Companies for example, which contributes nearly 20% of Ghana’s
total export trade, operates its own plywood sales and distribution outlet in Kumasi and is affiliated
directly to timber companies in Australia, the UK, and Germany (Sutton and Kpentey 2012: 297).

236
7.1.5.2. The 1990s Log Export Boom and the Case for the 1995 Log Export Ban
As indicated above, in 1994 the now democratically elected Rawlings government
decreed that all exports of raw logs (except for teak)223 would be suspended in
1995.224 The reason for this particular date lies in a log export boom that occurred
between 1993 and 1994. As illustrated in Figure 7.4, between 1992 and 1994, the
export volume of raw logs tripled from around 200,000 m³ to nearly 600,000 m³,
whereas the export value more than doubled from US$ 35.7 million to US$ 75.6
million. As further depicted in Figure 7.6, this increased demand came wholly from
Southern and Eastern Asia, and particularly South Korea. Whereas in 1992
Ghanaian logs were almost exclusively exported to Europe, by 1994 Asian
countries’ demand had exploded, importing 85% of Ghana’s logs, with South Korea
alone accounting for 40% of them.
The increased demand from Asia was primarily the result of industrial policy
decisions across the globe. In 1992, the two major Malaysian sub-regions of Sabah
and Sarawak respectively banned and imposed quotas on their exports of raw logs
to promote processing (Tachibana 2019), whereas Malaysia peninsula had already
banned all log exports in 1985. Being the second-largest tropical timber producer
in the world with a world production share of 16% (Morris et al. 2012: 74), these
bans send shock waves through the Asian log buyer markets, particularly South
Korea, Taiwan, China, India and Japan (Sizer and Plouvier 2000: 87). Whereas
South Korea imported US$ 288 million worth of tropical logs from Malaysia in
1992, this value dropped to US$ 122 million in 1994. To satisfy their processing
needs, Asian buyers looked towards Africa.
223 The reason why teak was excluded from the ban is because the diameters of teak trees are very
small, falling far below the minimum diameter requirements of Ghanaian processors. More
specifically, the sawing technology adopted for larger diameter logs (such as tropical timbers) are
unsuitable for small diameter logs (like teak) and would result in uneconomical lumber recovery
(Ayarkwa and Addae-Mensah 1999) Given processors unwillingness or inability to engage with new
technologies, the government decided not to ban the export of teak logs (Boadu 20.04.2018;
Asumadu 2004: 10).
224 Formally, the ban or rather suspension was temporary, however, never contained an end date and
persists until this day (3 July 2019).

237
Figure 7.6. The Development of Ghanaian Raw Log Exports by Destination, 1991-
1996
Source: Own Illustration based on data from Simoes and Hidalgo (2011).
Faced with this increased demand for raw logs, the government in 1994 decided
that a ban on all unprocessed log exports would be enforced the next year.225
Donors, especially the World Bank (who had previously opposed the
implementation of further export bans), only grudgingly accepted it given the
context of the log export boom.226 While naming environmental next to industrial
concerns in their decision, most analysts of the ban and the industry agree that the
225 As the suspension was an administrative action, there is no law that could be referred to.
226 In fact, in light of the Ghanaian governments’ decision to ban the log export of an additional five
species in January 1988 against its explicit concerns, the World Bank in November 1988 conditioned
the release of the second tranche of its US$ 64 million Forest Resource Management Project on the
government’s promise not to institute any further log export bans until the completion of a study on
the matter (World Bank 1988: 4) These studies however only confirmed donors in their scepticism,
arguing that their processing promotional effect was negligible, and that the industry already had
overcapacities. For a more detailed discussion see Treue (2001, 1999: 147–151).
0
10
20
30
40
50
60
70
80
1991 1992 1993 1994 1995 1996
Exp
ort
Valu
e in
Mil
lion
US
$
Year
Africa Asia (excl. S. Korea)Australasia EuropeS. Korea Noth America
Europe
Asia
S. Korea

238
government’s interest in the ban was primarily a mixture of strong lobbying by
processors as well as its own goals of generating as well as protecting employment
and industry.227
And indeed, in contrast to independent loggers, processors228 are considered by
sector insiders as having a strong influence on government policy (Birikorang 2001:
20; Mayers et al. 1996: 23; Owusu 2012: 181; Treue 1999: 151–152).229 This, they
argue, is the result of their greater organizational capacity, financial clout, and
importance in employment generation.230
Yet, that processors would lobby for a ban was not as obvious as perhaps in other
processing contexts. This is due to the fact that most processors in Ghana were both
loggers and processors and thus both log and lumber exporters. As described by
Treue (1999: 221) and Birikorang (2001: 28) many processors contributed to and
profited from the log export boom throwing ‘all their resources into harvest and
export of logs’ and happily engaging with the situation where they could earn quick
profits and clear old debts. Thus, one might wonder why they would want to put an
end to this and lobby for a ban in the first place. Treue (1999: 221), as well as
processors and other sector experts interviewed,231 argue that the key point is that
227 To quote a 1996 IIED report (Mayers et al. 1996: 16): ‘It is likely that the major pressure for the
bans comes not from environmental considerations but from the sawmilling lobby and from those
with macro-economic objectives.’
228 Sometimes rreferred to as the ‘timber men’.
229 Ghana Timber Scholar 1, Per Telephone, 11.06.2019; Ghana Timber Consultant, Accra,
12.05.2017; Senior Official at the Ghana Forestry Commission, Accra, 11.05.2017; Senior
Executive of Ghana Timber Association, Per Telephone, 15.05.2017; Senior Executive of Ghana
Timber Millers Organisation, Per Telephone, 10.05.2017.
230 First, since 1981, when processors exited the Ghana Timber Association (GTA, which is now
only made up of independent loggers) to form their own Ghana Timber Millers Organisation
(GTMO), they have been well-organized and represented by a capable and well-staffed secretariat.
Second, Treue (1999: 151-152) as well as Mayers et al. (1996: 16) argue that the importance the
sector has for the economy as a whole and formal employment creation (creating some 50,000 jobs),
gave processors significant clout and favour with the government, which ensured that forest fees
remained low and that they could even engage unpunished in illegal actions like subletting logging
concessions from other holders. Last but not least, many scholars of the sector allege that due their
economic muscle, particularly larger integrated processors could bribe officials up to the highest
levels to work in their favour (Birikorang 2001: 39; Treue 1999: 167; Owusu 2012: 181)..
231 Ghana Timber Scholar 1, Per Telephone, 11.06.2019; Senior Official at the Ghana Forestry
Commission, Accra, 11.05.2017; Managing Director of Leading Integrated Processor, Kumasi,
23.04.2017; Senior Executive of Ghana Timber Millers Organisation, Per Telephone, 10.05.2017.

239
the mid- to long-term benefits of a ban trump the short-term benefits (and costs) of
the log boom. Processors were wary that a too rapid harvest (especially by
independent loggers) would prove unsustainable and could eventually lead to
premature depletion of their own supply. More importantly, however, they
anticipated a ban would allow them to force independent loggers into selling them
logs at cheaper prices and eventually squeeze them out of the market completely
(both of which eventually came true). Given these strong interests, Treue (1999:
221) hypothesizes that processors not only lobbied the government but also
intentionally fuelled the log export boom to push both the government and donors
to agree to a complete log export ban.
Characterizing the export ban solely as the result of strong processor lobbying
would be incorrect, however. First, sector analysts agree that policy-makers were
sincerely interested in promoting processing and employment in the sector, and also
genuinely worried the log export boom might put this into doubt (Amoah et al.
2009: 168; Mayers et al. 1996: 16).232 Secondly, the Rawlings government has
shown prior and post-ban that it could and would implement policies at odds with
processors’ interests.233 Thus, it appears likely that the 1995 raw log export ban was
in the joined interest of processors and policy-makers, who used the extreme
situation of the 1993/4 log export boom to convince donors of its necessity.
7.1.6. The Politics of the Ghanaian Log Ban Maintenance
In contrast to the export ban on raw cashew nuts, the ban on timber logs was never
withdrawn in Ghana. In the following sections, I will argue that this was the result
of independent loggers’ political weakness. Independent loggers were clearly aware
and negatively affected by the ban. Because loggers directly sell their logs to export
agents (rather than through middlemen as in most other commodities), the fact that
these could not buy their logs anymore was enough to become aware of the export
232 Ghana Timber Scholar 1, Per Telephone, 11.06.2019; Ghana Timber Consultant, Accra,
12.05.2017; Senior Official at the Ghana Forestry Commission, Accra, 11.05.2017.
233 . Examples are the PNDC’s 1987 crack-down of ‘irregular activities’ in the industry (Owusu
2001: 53), the large increase of stumpage fees in 1999 (Treue 1999: 223), or the 1994 introduction
of higher export taxes on lower-value air-dried lumber (which processors produced dominantly at
the time) versus higher-value-added kiln-dried lumber (Treue 1999: 222).

240
ban (even without a greater information campaign by export agents). Despite the
attribution of severe price distortions to government action, independent loggers
did not actively mobilize against it and the government. This was due on the one
hand to their organizational weakness, the fact that traders had no incentive to
compensate it, and most importantly, a general feeling of loggers that they were too
few to successfully challenge the government.
7.1.6.1. Attribution Despite Indifferent Traders
In the previous chapter, I have argued that traders played a crucial role in producers
attributing price distortions to government action. This was different in the context
of timber. Timber export agents at no point tried to stir up loggers against the ban
or lobby against it in any other way. In fact, interviewed export agents and scholars
of the timber trading sector confirmed that traders had actively stayed away from
any debates and politics surrounding the policy.234 Given the description of timber
export agents above, this does not come at a surprise. Since they are not dependent
on log exports, but also engage in (and can shift relatively easy to) trading processed
timber, export agents have little incentive to inform or mobilize independent
loggers.
Nevertheless, independent loggers had become aware of the ban relatively
immediately after its imposition.235 Whereas producers in most other commodities
are dependent on middlemen (that stand in contact with exporters) to inform that a
ban was imposed, timber loggers sell their logs directly to exporters. As such, when
they attempted to sell their logs at the port and export agents would not have them,
the implementation of a ban was obvious. In addition, given the relatively small
number of independent loggers and a closer interaction between timber companies
and government agencies (e.g. during the regular processes of paying concessional
fees and submitting documents), many loggers had also become aware of the ban
directly from government sources.
234 Treue, Representative of a Danish international timber trading Company
235 Senior Executive of Ghana Timber Association, Per Telephone, 15.05.2017.

241
7.1.6.2. No Mobilization Despite Attribution and Grievance
Despite being fully aware of the ban, independent loggers never staged any
noticeable protest. This is not for a lack of motivation. As in the analysed nut
sectors, the ban rapidly and severely dropped domestic log prices by between 38%
and 46%,236 arguably as a result of increased marketing power of processors.237 This
had highly damaging consequences for independent loggers. As indicated by a
senior official of the Ghana Timber Association, whereas around 20% of loggers
had the financial capacity to move into processing following the ban, most had to
close shop.238 This is supported by Treue’s (1999: 182) calculations that for many
species the stumpage fees independent loggers could pay were negative, that is,
their production was unprofitable. And whereas Mayers et al. (1996: 18) had found
independent loggers to control over 50% of the timber market prior to the ban,
Birikorang (2001: 23) observed in 1999 that their contribution to the (formal239)
national harvest had dropped down to only 4%. This crowding out of independent
236 The two most comprehensive studies of these dynamics are Thorsten Treue’s PhD thesis (1999)236
and Gene Birikorang’s (2001) ‘Ghana Wood Industry & Log Export Ban Study’ written for the
Forestry Commission and the Ministry of Lands and Forestry. Both notice that domestic log prices
significant depressed following the 1995 log export suspension. Whereas Birikorang (2001: 39-40)
calculates that in 1999 domestic log prices stood at only around 38% of what they would get on
other more liberalized tropical timber markets (with most of the difference flowing in the pockets
of processors), Treue (1999: 138) collected data on species-specific domestic and FOB prices for
logs in 1993 and 1996. Looking at the 12 species for which data was available in both years and that
had not been banned prior to 1995, we can see that between 1993 and 1996 their average domestic
log price had fallen by 52.5%, from 101.5 Deutsche Mark to 48.1 Deutsche Mark (compare
Appendix 7.1 for the underlying data). Looking at prices across all species for which data was
available, we see an overall drop of around 46% (also compare Appendix 7.2). Note however that
this figure is likely somewhat overestimated due to a lack of exact export volume data for each
species, and thus an inability to weight this average figure by export volume. If we could, particularly
frequently traded species (the so-called ‘scarlet stars’) would be weighted more, and since the price
drop here was lower (41.8%), so would the calculated average value be. That being said, we have to
keep in mind that the log prices for most scarlet star species were already artificially depressed in
1993, as most of them had already been banned in 1979 or 1988.
237 Both Treue and Birikorang argue strongly that this price drop is the result of an increased
marketing power of processors. Specifically, Treue (1999: 139) writes that ‘there are also indications
that the bigger integrated wood industries are suppressing the domestic log prices through cartel-
like arrangements’ and that ‘the log export bans must account for a major part of this price distortion
and that the bans have greatly strengthened the bargaining power of processing companies over
logging companies.’ In the same vain, Birikorang (2001: 34) summarizes that ‘the low domestic
price of logs is one consequence of the log export ban and export suspension imposed in 1995’,
which further is due to the fact that ‘processors generally have market power over independent
loggers’.
238 Senior Executive of Ghana Timber Association, Per Telephone, 15.05.2017.
239 That is excluding the significant illegal harvest through chainsawmillers.

242
loggers is further substantiated by the number of independent loggers dropping
from 350 firms in 1990 to only 70 in 1999 (Birikorang 2001: 29).240
Given these strong and clearly attributable grievances, why did loggers not mobilize
against the ban? One factor commonly mentioned is the relative weakness of the
GTA. Since most processors left the GTA to found their own organization in 1981,
the association lacks funds, staff, and infrastructure (Birikorang 2001: 34).241 This
contrasts’ with the millers’ well-structured and -funded GTMO. What is more,
whereas traders were motivated to organize the equally poorly organized producers
in the above-discussed nut sectors in Ghana and Kenya, this was not the case in
Ghanaian timber. As such, the inability to overcome organizational weaknesses
might have been one reason why independent loggers did not mobilize protest.
An interviewed senior executive of the GTA argued that another factor was more
relevant, however.242 While he admits that the GTA was and remains a weak
association, he claims it was capable enough to organize protests. Why they did not,
he argues, is because they knew they and their protests would not have been able to
create any significant political pressure. In his words, ‘it was not difficult to
organize the members. But even if we had, we’d still have no leverage. We did not
have the numbers. Processors are many more.’ Specifically, what he referred to was
that whereas independent loggers accounted for only around 5,000 employees at
the time, processors accounted for approximately ten times as many. As such, not
only was their own number small, it was also much smaller than that of those
winning from the ban. Going against such numbers, independent loggers felt that
240 Simultaneously, a relatively high factor mobility in timber logging might have reduced the stakes
and grievances of independent loggers. Specifically, some interviewees have argued that it was
relatively feasible for independent loggers that could not move into processing or continue on
reduced margins to take their machines (mainly trucks and tractors) to other uses, such as agriculture
or the transport industry, whereas chainsaws could be sold to illegal loggers (or become an illegal
logger oneself). As such, in contrast to Ghanaian cashew farmers, the stakes were perhaps not high
enough for them to engage in a costly and unpromising battle.
241 Take, for example, the view of an interviewed senior executive of the GTMO: ‘They [the GTA]
weren't well organized. They were never well organized. That is why the millers broke up from them
in 1981. The millers are much better organized. The millers are able to hire more qualified staff. The
loggers could never hire someone like himself – they couldn’t pay the salary. Pay better salaries, the
loggers could not do that. The law requires hiring professional foresters. But however not even the
professional loggers could hire a professional forester. The millers can. They can comply with the
laws and the relevant economic conditions.’
242 Senior Executive of Ghana Timber Association, Per Telephone, 15.05.2017.

243
that the odds of their protest being successful were far too low to justify the costs.
I argue that this dynamic is not only why loggers did not protest, but also why the
government knew to implement the ban would not pose any political risk.
A further factor the GTA executive mentioned is that at the time of the ban, the hold
of Rawlings’ government was still very strong and that the GTA was warry of going
against his government, perceiving it as a ‘military dictatorship’. This statement
needs to be qualified a bit, however. First, by 1995 the country had been formally
governed as a democracy for three years (although the 1992 election was largely
boycotted), opposition parties could operate freely, an independent supreme court
was created, free media allowed, and the 1996 election was considered the first
completely free and fair election in the nation. Loggers thus likely would not have
faced significant repression had they protested against the ban. What is more, when
asked whether loggers have tried to protest against the ban in the two decades
following the ban (probably two of the most democratic decades in African history),
the association executive replied that they had not because they still felt that they
lacked the numerical leverage.
In conclusion, the reason why the government was not afraid to implement or
maintain the 1995 export ban is the same why loggers never protested against it:
they knew that loggers did not have the numbers or means to pose any threat to
them. In contrast, not imposing the ban could imply endangering the processing
industry, a prospect more economically and politically threatening to policy-
makers.
7.1.7. Conclusion of the Ghana Log Export Ban Case Study
Throughout history, the Ghanaian government actively tried to promote its timber
processing industry. Next to generous loan programs and tax cuts, it had banned the
export of raw logs from 18 tree species in 1979 and 1988. When planning to ban all
raw logs, however, powerful donors (or rather, the lords of the loans) expressed
their clear scepticism against log export bans and conditioned the government to
refrain from using them. The government and powerful processors used the partly
self-created and -enforced mayhem of the 1993/4 log export boom as a pretext to
convince donors that a temporary suspension of all raw log exports was required to

244
safeguard both forest and industry sustainability. The ‘temporary suspension’
remains active until this day – whereas the industry is close to collapse due to
excessive harvesting by processors.
I argued that the imposition and maintenance of the ban was primarily the result of
weak and few producers as well as the low likelihood that traders would help them.
In timber, international brokers are adapted to trading both logs and processed
wood, and as such did not much mind the export ban. This shows that traders need
not always want to form defence coalitions against bans. If they had, however,
loggers would have been a very unformidable ally. Apart from being poorly
organized (although probably better than Ghanaian cashew farmers, who barely had
a national association to speak of), they were unable to bring numbers to the table.
Not only were their numbers extremely small – likely not more than 5,000 people
worked for independent logging firms – but they were also ten times smaller than
the estimated 50,000 employees of the processing companies working in the
country. Despite loggers being aware and strongly aggrieved by the ban, they,
therefore, felt that their numbers were too limited to successfully protest against the
ban. Not surprisingly then, the government had little cause to be afraid of
implementing and maintaining the ban against their will.

245
7.2. Worthwhile Waste: The Politics of the 2013 Ghanaian
Ferrous Waste and Scrap Export Ban
Metal waste and scrap is a commodity unlike the others discussed in this thesis. It
does not occur naturally in certain fixed sites like minerals and is not actively grown
or cultivated like agricultural crops. Furthermore, processed metal waste and scrap
usually serves domestic rather than export markets. Nevertheless, it shares
significant similarities to discussed commodities regarding its value and production
chain. Though not naturally occurring, the collection of metal wastes in Africa is
closely attached to certain areas in a country, primarily urban areas. And while not
cultivated, metal waste also has to be actively collected, which is sometimes
referred to as ‘urban mining’ (Grant and Oteng-Ababio 2012, 2016). Furthermore,
as in most agricultural commodities in Africa, there are brokers and dealers buying
scrap from collectors/producers. And while metal waste and scrap processed
domestically by steel mills tends to be sold domestically, whether the scrap itself is
sold to domestic or foreign steel mills is very much based on the economic decisions
of these dealers. Yet, importantly, as with the other commodities discussed in this
thesis, foreign processors often offer better prices for scrap than local processors,
leaving the latter starved of supply and creating the demand for metal scrap export
bans. This is particularly true for the 2000s, when Asian steel mills have created
huge overcapacities and thus strong demand for ferrous scrap, making it extremely
tough for steel mills throughout Africa and beyond to compete with them.
Hosting one of the oldest scrap-based steel milling industries in Africa, the
Ghanaian government in 2013 reacted to this increased pressure from Asia with a
legislative ban on all ferrous waste and scrap exports. Doing so, it is among 16
countries in my sample that have banned the export of metals scraps in one form or
the other. Like the previously discussed case studies, this has led to significant price
drops for Ghanaian scrap collectors and dealers and resulted in their active
opposition to the measure. Yet, as producers in Ghanaian timber and Kenyan nuts,
they too failed to pose a numerical threat to the government, helping to explain why
the ban has been implemented and maintained with relative ease. Before discussing
the politics of this ban in more detail, I will first introduce the history of the sector
leading up to the ban.

246
7.2.1. The Ghanaian Steel Industry in the 20th Century
The first steel mill, Tema Steel Company Ltd., was constructed in the early 1960s
as part of President Nkrumah’s vision to industrialize the country. Built in what was
to be Ghana’s new industrial hub (Tema), in his speech during the ground-breaking
ceremony in June 1962, he justified the mill’s construction by saying that: ‘I have
always held the very strong opinion that to expedite our industrialisation, Ghana
must go in for the basic industries so as to forge the machines and tools for building
other industries’ (Reuters 1962). Constructed and financed by the British, the GBP
1.65 million mill was to employ at least 300 people, operate on ferrous scrap metal
collected in Ghana, and produce up to 30,000 tons of steel per year for the domestic
market, starting in 1964 (Fourie 1968; Ghana Office of the Planning Commission
1964: 100; Reuters 1962). Overall, the aim of West Africa’s first steel mill was to
supply sufficient steel to local steel manufacturers that could substitute foreign
imports of simpler steel products (Ghana Office of the Planning Commission 1964:
100).
As discussed in Chapter 2.4 of this thesis, creating a steel milling industry ‘from
scrap’ is relatively economical even where capital and energy supply is low.
Making steel ‘from scratch’ requires pure iron ore in large volumes (which Ghana
possesses, but never mined), massive capital investments, and tremendous amounts
of electricity (both of which was lacking in Ghana). Re-smelting ferrous scrap,
however, requires only scrap and no actual iron ore and requires much less capital
and electricity to process,243 explaining why scrap-based steel mills are a relatively
common sight in Africa.
Despite the supposed relative simplicity and viability of running a scrap-based steel
mill, by August 1966 (six months after Nkrumah’s ouster) the Tema steel mill lay
idle, struggling to receive sufficient ferrous scrap (Fourie 1968). Scrap iron is
derived mainly from waste produced by households, industry, and public
infrastructure. At the time, however, all these sectors had been making relatively
243 Studies estimate that in producing one ton of steel via recycling scrap rather than making it from
scratch, one saves up to 75% of the energy cost, one ton of iron ore, 600 kg of coal and 54 kg of
limestone (Emery et al. 2000; Broni-Sefah 2012). Furthermore, this cheaper production also comes
with environmental benefits, scrap-based milling causing 86% less air pollution, 76% less water
pollution, and a 40% reduction in water used.
247
little use of steel and thus could not produce much scrap. Hence, while the steel mill
was cleverly built within the new Tema industrial zone, factories were too new to
create much scrap for the mill. Moreover, today’s significant private scrap
collection sector was if at all in its infancy. In the first years of its existence, thus,
little to no steel had been produced from the mill (Fourie 1968).
During the next two decades, the situation of the Tema Steel Mill remained difficult.
Incorporated into the state’s Ghana Industrial Holding Corporation (GIHOC) in
1968, the mill still struggled to source scrap, as private scrap collection and
industrial scrap production remained limited. One year after the first wood log
export bans in 1979, the Ministry of Trade and Industry (MoTI) placed an
administrative ban on the exportation of all ferrous scrap metals as an ‘attempt to
protect the local steel industry’ (Amoah 2013). Otherwise very little is known about
the ban and the exact history of the steel industry at the time. In general, however,
it is somewhat surprising that the government sought a ban to help the industry. As
illustrated in Figure 7.7 below, exports of ferrous scrap were near inexistent at the
time and a fraction244 of the export volume in 2012 (the year before the legislative
export ban of scrap iron). As such, it is difficult to reconstruct why the government
at the time thought an export ban would make much of a difference to the industry.
Along with the general recovery of the economy from the mid-1980s, demand for
steel and a domestic steel industry also recovered. The first sign of this was the
entrance of new major players to the industry. In 1987, the IFC supported Ghana-
based Taiwanese popsicle manufacturer Allan Chou to open Wahome Steel Ltd. in
Tema. With a production capacity of over 70,000 tons of steel per year, the mill
became the largest in the country (Chou 2019). Furthermore, at the eve of
democratization in the early 1990s, two further mills entered the Tema steel
industry, Western Steel & Forging245 and Ferro Fabrik, adding 60,000 and 30,000
tons of steel production capacity to the country (OECD 2011: 135; My Joy Online
2016).
244 The volume of ferrous scrap exports in 2012 was over 2,500 times larger than in that 1980.
245 The company is today named Western Steel and appears to be operated together with Western
Castings Ltd., a firm that has manufactured water pipes and other steel-based products since the
early 1970s.

248
Tema (now GIHOC) Steel, however, was still faring poorly. Instead of producing
30,000 tons of steel per year as originally planned, it had produced only 4,500 tons
per year on average throughout the 1980s. And rather than employing over 300
people, it employed only 130 (Dassah 2017). Consequently, and in line with the
policy climate at the time, in 1991 the Rawlings government sought private
investors to lead the company as a joint venture with the state. These were found in
Manubhai Patel and Prasad Motaparti, a Kenyan Asian and an Indian that have built
a conglomerate of companies in steel, transport, logistics, IT, trade and particularly
cement (WACEM) throughout West Africa, Kenya, DRC, and Madagascar (Le
Monde Afrique 2016). Overall, the privatization of the Tema Steel Company can
be considered successful. By 1999, the annual steel production had increased to
30,000 tons (Ghana Web 1999; Dassah 2017). In the same year, over 500 people
worked in the mill – four times the 1991 number – and pay increasing significantly.
Although the industry appeared to have better prospects than ever before, the new
steel mill owners lobbied actively for more government protection. In October
1997, they called on President Rawlings to increase the import duty on iron rods to
30% from 20%, to give ‘halt to the dumping of steel products in the country from
abroad’ (Ghana Web 1997). Steel coils, iron rods, and steel balls for the
construction and mining industries are the steel mill’s key outputs, yet foreign
manufacturers were and are often able to supply them significantly more cheaply.
While the fact that the government increased the tariffs to 25% in 1998 showed that
it was sensitive to steel millers’ well-being, the fact that millers did not ask for any
additional measures regarding scrap exports shows that prior to the 1990s export
competition for unprocessed scrap iron was not an issue to them.
7.2.2. The Ghanaian Steel Industry in the 21st Century and the Road to a
Ban
After the turn of the millennium, however, export competition exploded. This was
primarily the result of the massive economic boom in Eastern Asia, creating a
tremendous demand for steel, and thus Asian steel mills seeking ferrous scrap
beyond their borders. Interviewees also indicate that this boom might have to do
with the increased amount of manufactured imports from this region, which create
empty containers that could be filled relatively cheaply (potentially with ferrous
249
scrap) for the way back to Asia.246 Figure 7.7 illustrates nicely how before the 2000s
export of ferrous scrap was minimal, rarely crossing the 5,000 tons mark. In 2005,
exports, however, reached more than 20,000 tons, and just three years later
exceeded 100,000 tons. Figure 7.8 further illustrates that this demand for Ghanaian
scrap came almost exclusive from Asia, with India and Vietnam being particularly
important buyers. In 2012, the year before the legislative export ban, Vietnam and
India alone accounted for over 87% of Ghana’s scrap imports, the remainder
primarily going to other Southeast Asian countries like Malaysia, Thailand, and
Indonesia. Appendix 7.3 traces the destinations of Ghanaian scrap iron over time.
This scrap export boom had two important consequences for the Ghanaian steel
industry. On the one hand, it massively boosted the businesses of small-scale scrap
collectors and dealers. On the other, is made it significantly harder for steel mills to
source enough input.
Starting in the 1990s, informal scrap collectors and dealers have become
increasingly important for the industry. Prior to those days, the key sources for steel
mills were industrial scrap (i.e. scrap produced by larger manufacturers working
with steel) as well as much larger-scale capital scrap (e.g. decommissioned power
stations, ships, or old government vehicles). These were, and still are, usually sold
directly to the steel mills. Following the economic recovery program of the 1980s
and the general rise of wealth in the country (particularly in urban centres), ferrous
scrap from household appliances, smaller workshops or the demolition of houses
turned into a more relevant source of scrap in the economy (Amoah 2013; Broni-
Sefah 2012: 8–9; Nkansah et al. 2015). Importantly, this source was first tapped
and remains controlled almost exclusively by informal scrap collectors and dealers.
Since this is where most scrap can be found, scrap collectors and dealers operate
almost exclusively in Ghana’s urban centres. Apart from other industrial centres
like Kumasi or Takoradi, the Greater Accra and Tema area hosts the greatest
number of scrap collectors and dealers in the country.247 If one takes e-waste as a
246 An interviewed steel miller claims that whereas the cost of shipping one ton from India to Ghana
is US$ 62, the cost falls to US$ 15 for the return. (General Manager of one of Ghana's Oldest Steel
Mills, Tema, 17.05.2017).
247 Senior Executive of the Greater Accra Scrap Dealer Association, Accra, 04.05.2017.

250
proxy – which is usually collected by the same people – it appears sensible to
assume that around 50% of Ghana’s total annual scrap production occurs in the
greater Accra area (Grant and Oteng-Ababio 2012: 14). One particularly important
location for the trade is the notorious Agbobloshie dumpsite right next to the city
centre of Accra. The area around is mainly inhabited by Northerners who fled ethnic
clashes in the 1980s and poor urbanites who had been pushed out of the city centre
to make room for new buildings for the 1992 No-Aligned Movement Conference
(Amankwaa 2013: 556–557). In the following two decades Agbobloshie became
the centre of the Ghanaian recycling industry, and most famously of e-waste,
perhaps being one of the most-covered- and -researched e-waste sites on the globe
(Amankwaa 2013; Grant and Oteng-Ababio 2012; Prakash and Manhart 2010).
Figure 7.7. The Volume of Ferrous Scrap Exports from Ghana between 1962 and
2018, Based on Data Declared at Export from Ghana and Declared at Import in the
Destination Countries
Source: Own illustration based on data from the UN Comtrade database
(DESA/UNSD 2019).
2013 Legislative
Export Ban
1980
Administrative
Export Ban

251
Figure 7.8. Destinations for Ghana’s Ferrous Scrap Exports in 2012
Source: Own illustration based on data from the UN Comtrade database
(DESA/UNSD 2019).
As shown in several studies and surveys, the great majority of scrap collectors in
Ghana are young males with fairly low levels of education that have migrated from
the North of the country248 (Amankwaa 2013: 559; Grant and Oteng-Ababio 2012:
16). Although hard and unsteady work, these young Northern men get involved in
the business because the average pay is often considerably above the Ghanaian
minimum wage and they simply do not have many better-paying alternatives
(Amankwaa 2013: 551; Broni-Sefah 2012: 30–31; Grant and Oteng-Ababio 2012:
12–13; Prakash and Manhart 2010: 11). Unless they are directly employed by scrap
dealers – which is often the case249 – scrap collectors usually rent handcarts and
248 It is estimated that around two-thirds of scrap collectors, also known as Kaya Bola, are
Northerners.
249 According to Broni-Sefah’s survey of Kumasi’s scrap metal trade, scrap dealers employed and
average of people, with some employing up to 35 (Broni-Sefah 2012: 35). Yeboah and Atoklo
(12.10.2018) describe the case Yakubu Andani, a man who has dealt with scrap metals for over 25
years, writing that he ‘has 26 employees, owns about 90 load-carriers commonly called ‘troks’, and
five (5) tricycles. In his yard are his workers, who are assigned different roles. Some of them collect
scrap with the troks and deposits it at the yard. Others are dismantlers; and some load the goods into
trucks for delivery.’
India
39.50%
Other Asia
11.42%Europe
0.65%
Vietnam
48.31%
Africa
0.12%

252
trucks for a small amount from dealers and pull or drive them through the city,
hoping to buy or collect from households, mechanic shops, market centres, offices,
etc., before heading back to the main scrapyard area (e.g. Agbobloshie), where they
will sell their produce to local scrap dealers (Amankwaa 2013: 560–561).250 These
dealers will then sort the scrap into different categories (e.g. ferrous versus non-
ferrous) and then sell it to the highest bidder, which could be steel mills, but prior
to the 2013 ban was mostly Indian, Vietnamese, and Singaporean export-traders
located in Tema close to the port.251 An illustration of the typical pre-ban value
chain can be found in Figure 7.9 below.
Figure 7.9. The Ghanaian Ferrous Scrap Product Chain Prior to the 2013 Ban
Source: Own Illustration
250 Scrap Collector 1, Central Accra, 04.05.2017; Scrap Collector 2 in Central Accra, 04.05.2017.
251 Senior Executive of the Tema Scrap Dealer Association, Per Telephone, 18.05.2017.
Scrap
Collectors
Foreign Steel
Mills
Export/
Import
Larger
Industrial &
Capital Scrap
Steel Mills
Consumers
(mining,
construction,
manufacturing)
Scrap Dealers
Foreign Export-
Traders
Scrap
Iron
Rods, balls, coils
Scrap
Iron
Scrap
Iron
Scrap
Iron
Scrap
Rods, balls, coils

253
In comparison to other commodity sectors – cashew for example – scrap collectors
and dealers are not only economically more closely connected but also socially and
politically. A good example is the Greater Accra Scrap Dealers Association
(GASDA). Officially registered by Agbobloshie-based scrap dealers in 1997,
GASDA is Ghana’s largest scrap collector and dealer association, with most of its
1,000 registered and 3,000 ‘unregistered’ members being scrap collectors.252 The
association provides its members with numerous social benefits (such as ‘temporary
shelter’, defence against physical abuse, and micro-finance schemes) but is also the
key political voice of the profession (Grant and Oteng-Ababio 2012: 15). Although
there is no national scrap dealers and collectors association, only several urban
based ones (the Kumasi Scrap Dealer Association and the Tema Scrap Dealer and
Exporter Association [TSDEA]253 being the next biggest), the leaders of GASDA
usual represent the national sector in talks with the government. Although it is
difficult to estimate the total number of Ghanaians operating as dealers and
collectors given the informality and fluctuation in the sector, interviewed leaders of
GASDA and TSDEA254 found MoTI’s (2017) estimate of 17,000 people to be
plausible.255
As indicated above, scrap collectors and dealers profited from the scrap export
boom. Prior to the boom, local steel mills represented the only real buyers. The four
steel mills could (and allegedly would) discuss prices among themselves, leading
to relatively depressed prices for collectors and dealers (Bediako 2012).256 With the
influx of Asian traders, however, competition and prices for Ghanaian scrap
252 Senior Executive of the Greater Accra Scrap Dealer Association, Accra, 04.05.2017.
253 Which fittingly took out the ‘Exporter’ from their name after the ban.
254 Senior Executive of the Greater Accra Scrap Dealer Association, Accra, 04.05.2017; Senior
Executive of the Tema Scrap Dealer Association, Per Telephone, 18.05.2017.
255 Given estimations that around 4,000-6,000 people work in collecting scrap in the Greater Accra
area, and this might account for 50% of the national scrap production, one can estimate around
12,000 people being involved in the sector throughout the country (Amankwaa 2013: 560). Others
furthermore estimate that there are between 6,300-9,600 people working in e-waste collection in
Ghana (Prakash and Manhart 2010: 11). With e-waste and scrap metal collection usually done by
the same people, these numbers provide further support for the estimation that there were not more
than 17,000 people involved in scrap metal production before the ban in 2013.
256 Senior Executive of the Greater Accra Scrap Dealer Association, Accra, 04.05.2017; Senior
Executive of the Tema Scrap Dealer Association, Per Telephone, 18.05.2017.

254
increased rapidly, as did collectors’ and dealers’ incomes. Scrap dealers also
describe that local steel mills would not only offer lower prices but would often also
want to buy on credit and be very picky in the scrap they bought, usually declining
cast iron. Asian traders, in contrast, would pay cash and buy anything, while being
much less demanding.257
Whereas collectors and dealers profited from the scrap export boom, local steel
mills were hit hard by it. Already in 2007, steel millers called on the government to
impose a legislative ban on scrap metal exports. During a visit of parliamentarians
at his plant, then Managing Director of Wahome Steel, Isaac Yeboah, described
how they were ‘struggling to compete for supplies because scrap metal exporters
are prepared to pay more to attract material from local dealers’, specifying that the
company was only able to source around 45% of what was needed to operate at full
capacity (Recycling International 2007: 14).258 Importantly, this was before 2008,
when exports of ferrous scrap nearly tripled from around 42,000 tons to over
111,000 tons. Thus, the scarcity of scrap worsened significantly over time.
It is critical to state that at least in theory the 1980 administrative export ban was
still in place. On 20 May 2002, the Ministry of Trade and Industry (MoTI) had even
issued a notice reminding the industry and customs authority of the ban (Ghana
News Agency 2013). Practically, however, it was largely ineffective. The main
reason for this was that exporters could easily misdeclare the content of containers
and that even in the unlikely case that customs officers would find the ferrous scrap
(and could not be bribed), the administrative ban provided no serious punishments
to offenders. One of the easiest ways to misdeclare ferrous scrap was to declare it
as non-ferrous scrap or to just mix it in with non-ferrous scrap (Bediako 2012).259
Custom officers also noted that they lacked the resources to check containers
thoroughly, and when they did, research suggests that a bribe would often be
257 Senior Executive of the Greater Accra Scrap Dealer Association, Accra, 04.05.2017; Senior
Executive of the Tema Scrap Dealer Association, Per Telephone, 18.05.2017.
258 Yeboah also estimated that between 600 to 1,000 tons of ferrous scrap were exported per day,
which given mirror data numbers above is likely somewhat exaggerated.
259 Senior Officer for Industrial Promotion at MoTI, Accra, 03.05.2017; Senior Executive of the
Greater Accra Scrap Dealer Association, Accra, 04.05.2017; Senior Executive of the Tema Scrap
Dealer Association, Per Telephone, 18.05.2017.

255
sufficient to let the illegal consignments be exported nevertheless (The Enquirer
2013; Grant and Oteng-Ababio 2016: 14).260 The administrative ban was legally so
weak that smugglers would not face any significant fines or criminal prosecution,
nor face any confiscation of their consignments (Grant and Oteng-Ababio 2016:
14).261 To look at the extent of smuggling one only needs to take a second look at
Figure 7.7 above. It shows the massive discrepancy between the ferrous scrap
exports officially declared as such in Ghanaian ports, and the declared imports of
ferrous scraps from Ghana at the ports of arrival (and provides another example for
the importance of using ‘mirror data’).
Aware of these issues, particularly of the misdeclaration of ferrous as non-ferrous
scrap, parliament in 2010 passed the Exportation of Non-Ferrous Metal Regulations
(L.I. 1969) drafted by MoTI (2010). As described by the Minister of Finance in his
annual budget statement to parliament, the legislative instrument was passed ‘to
ensure that exporters do not misclassify ferrous scrap [needed] for local production’
(Duffuor 2011).262 This was done by massively increasing the requirements for
being allowed to export non-ferrous scrap (for example, an export permit would
only be granted if the Ghana Standards Board had demonstrably checked the
consignment) and by including that a person adding iron or carbon steel scrap to
nonferrous scrap would be committing an offence, face conviction to a fine, and
have their consignments confiscated by the state.
260 A good example for the degree of corruption at the port is the 2013 case of 31 containers of
ferrous scrap seized at Tema port, but one year later when they were supposed to be sold to a
domestic steel mill had simply vanished (The Enquirer 2013).
261 Senior Officer for Industrial Promotion at MoTI, Accra, 03.05.2017; Senior Executive of the
Greater Accra Scrap Dealer Association, Accra, 04.05.2017. Moreover, during the 2013
parliamentary debate leading to the imposition of a legislative export ban, the MP of Madina, Alhaji
Sorogho, stated that a further reason for the poor enforcement of the ban was that ‘in 2008, after a
series of complaints from dealers, the then Government under the New Patriotic Party (NPP) decided
to relax the laws and to allow selected scraps to be exported through Ghana. Mr Speaker, scrap from
Burkina Faso, a land-locked country had to pass through our ports and by so, doing, it allowed
unscrupulous dealers to smuggle a lot of the scraps from Ghana, pass them as if they were coming
from Burkina Faso and at the end of the day, what the law intended to achieve, Mr Speaker, could
not materialize’ (Parliament of Ghana 2013: 2919).
262 Importantly, non-ferrous scrap exports were not banned because Ghana has no refinery to recycle
copper, one of the key non-ferrous scraps. Rather, copper scrap is usually exported to foreign copper
plants, mostly in the Middle East via Dubai and Asia via Hong Kong (Prakash and Manhard 2010:
54).

256
Yet, as shown by the high export figures from 2010 to 2012, this policy too
remained largely ineffective. One reason for this was arguably the unchanged
weakness of customs authorities. The other was that if exporters added the ferrous
scrap to or misdeclared it as commodities other than non-ferrous scrap (e.g. cashews
or lumber), the policy and thus its much severer punishments would not hold. In
line with this, the chief customs officer responsible for exports out of Tema
estimated that in 2010 alone, as many as 5,000 shipping containers of ferrous scrap
labelled as shea nuts, cashews, teak wood or other commodities had left the country
(McLure 2011).
7.2.3. The 2013 Legislative Export Ban
As a result of the government’s inability to enforce the administrative ban, steel
millers remained deeply troubled. As depicted in Table 7.2 below, in the year prior
to the ban, the country’s five steel mills ran at only 36% of their total installed
capacity. Intermittent and permanent shutdowns had become normal in the industry
(Bediako 2012), with Ferro Fabrik and Western Steel and Forging Ltd. remaining
closed for most of 2012. Wahome Steel Ltd., which had been struggling under
several different private and state ownerships for over a decade, closed completely
and was subsequently partially sold by the State to Chinese investors in the same
year (who renamed the factory Sentuo Steel263). Relatedly, in their research on the
Ghanaian steel industry, Sutton and Kpentey (2012: 335) found that the mills
perceived the illegal export of ferrous scrap as the greatest threat to their economic
survival at the time.
Faced with the failure of the 2010 regulation and permanent lobbying from steel
mills,264 MoTI started to work more seriously on a legislative export ban on ferrous
scrap. During 2011 and 2012, the Ministry had set up several consultative meetings
with actors across the sector, and by mid-2012 first reports that a legislative ban
263 Fugian Overseas Chinese Industrial Group Corporation (FOCIGC) owns 74% of the shares,
whereas the Ghanaian Social Security and National Insurance Trust (SSNIT) owns 26%.
264 General Manager of one of Ghana's Oldest Steel Mills, Tema, 17.05.2017. A statement by the
steel miller’s association in 2019 demanding more protection from import competition also showed
that they would threaten the government that their own demise ‘could lead to labour unrest’ ((Ohene
21.02.2019).

257
had been drafted circulated in the media (Bediako 2012).265 Yet until the end of the
year, no ban had been passed on to parliament and on 30 January 2013 MoTI only
reminded Ghanaians about the existence of the administrative ban.
Table 7.2. Installed and Utilized Capacity of Ghana’s Steel Mills in 2012
Name Installed Capacity
(tons)
Actual Production
(tons)
Tema Steel Co. Ltd. 55,000 23,198
Special Steel Ltd.266 60,000 34,977
Western Steel and Forging Ltd. 60,000 1,500
Ferro Fabrik Ltd. 30,000 0
Sentuo Steel Ltd. (former
Wahome Steel Ltd.)
72,000 42,555
Total 277,000 102,230
Sources: Ministry of Trade and Industry (Ghana) (2017) and OECD (2011).
This changed only one week later when Northern NDC MP Haruna Iddrisu took up
the post as Minister of Trade and Industry. Only a few hours after being sworn-in
on 7 February 2013, Minister Iddrisu called in a twenty-minute meeting with the
leaders of the Steel Manufacturers Association of Ghana (SMAG), the Greater
Accra Scrap Dealers Association (GASDA), and the media, telling them that within
the same month he would lay the bill banning the export of ferrous scrap before
parliament. The key differences between this legislative ban, the 1980
administrative ban as well as the 2010 non-ferrous scrap regulation was that
individuals or companies found smuggling ferrous scrap would be committing an
offence, face conviction to a fine (of up to Ghana Cedi five million, or around US$
2.5 million at the time), and have their consignments confiscated by the state,
265 Senior Officer for Industrial Promotion at MoTI, Accra, 03.05.2017.
266 Special Steel joined the industry in 2008 and is run by Indians.

258
independent of whether the container was declared as non-ferrous scrap or any other
content. As such, it filled the legal loopholes left by previous policies.
On 22 February 2013, MoTI laid ‘The Ferrous Scrap Metals (Prohibition of Export)
Regulations, (L.I.2201) 2013’ before parliament. And after the positive review by
a parliamentary committee, the law was passed on 26 March 2013 without any
notable opposition (Parliament of Ghana 2013). During the hearing of the motion,
the chair of the committee, Osei Asamoah, clearly stated the rationale for the ban,
saying that ‘a ban on the exportation of ferrous scrap metals would ensure that local
companies would have the required quantities of the scrap metals for their
operations. This would also enhance the profitability of the companies and increase
their capacity to create employment and also reduce the foreign exchange expended
on the importation of billets as raw materials for steel mills in the country’
(Parliament of Ghana 2013). Similarly, Minister Idrissu agreed that the legislative
ban was ‘a giant step that Government is taking to protect our steel industry and to
assure them of the availability of raw materials, so that they stay in production,
create employment and also easy access to the things that they would produce.’267
An important part of the story, however, is that MoTI had promised parliament it
would make sure scrap collectors and dealers would be treated fairly despite the
ban. Already in January 2013, the Ministry had put out the statement that it wanted
to impose a ban to protect steel mills ‘provided that they do not engage in price-
fixing activities and are ready to pay the market value for the scrap’ (Ghana News
Agency 2013). To convince parliament of this, MoTI told the relevant committee
that it was consulting with the major ‘stakeholders’ to come up with fair minimum
prices for scrap dealers that would be ‘internationally competitive’ (Parliament of
Ghana 2013: 2918). Furthermore, the implementation of the ban and minimum
prices were planned to be overseen by a newly established Scrap Metal Monitoring
267 Idrissu provided a further nice quote as to why the ban was needed some months later: ‘The
policy intention is very clear - to support and protect the steel industry in Ghana and to assure them
of the availability of raw materials to process scrap into iron rods; to provide employment to
Ghanaians, provide reduced iron rods and more at prices cheaper than those imported outside the
country. We need to build a strong manufacturing sector in the country and that is why we are taking
measures to protect those we have while doing all we can to help the new ones’ (Obour 2013). Also,
importantly, the ban was not imposed because of vandalization of public infrastructure, which
Idrissu expressed was a different matter more related to copper scrap dealings. The largest issue in
this regard is theft of copper cables, which are much more valuable per kg than steel scrap (Buechel
2019; Parliament of Ghana 2013: 2924).

259
Committee, consisting of representatives from MoTI, the Ghana Revenue
Authority, the Ghana Ports and Harbours Authority and the Standards Authority, as
well as the Ghana Association of Industries, SMAG, and GASDA (Parliament of
Ghana 2013: 2918).
7.2.4. The Politics of the 2013 Ferrous Scrap Metal Ban
In the four case studies conducted so far in this thesis we have seen that export bans
on raw commodities rapidly and severely reduced producer and trader prices. Apart
from Ghanaian timber, this has led to producers to realizing the imposition of a ban
and mobilizing against it, informed and organized by commodity traders. However,
only where producers were many (that is, in the Ghanaian cashew case) did they
manage to credibly threaten the government, and thus only there was the ban
withdrawn. How does this compare to the 2013 legislative ban on ferrous scrap
exports? Did it cause prices to drop? Did producers and dealers realize what had
happened and did they mobilize against the ban? And finally, did they fail to get
the ban withdrawn, as would be expected by their limited numerical power? The
answer to all these questions is a clear yes.
7.2.4.1. Severity, Visibility, and Lobbying Dealers
Although promised by MoTI, neither at the beginning of the ban in late March 2013
or at the time of my research in Ghana in Spring 2017 had a minimum price system
been implemented. The idea of the system was and remains that Ghana Standards
Board officers should be positioned at the factory gates of every steel mill and
monitor the grading of the ferrous scrap brought by dealers into four distinct
grades268, for each of which the Scrap Metal Monitoring Committee would have
negotiated acceptable minimum prices at the beginning of every year.269 Analogous
to the case of Kenyan cashews, the government never implemented this system.
And like in Kenya, steel mills actively shunned and some say tried to sabotage its
268 The more general differentiation is between light and more valuable heavy scrap. The imposed
system would have categorized these into three grades from A-C, as well as a mixed grade,
composed of different grade scraps that could not be separated by dealers.
269 Senior Executive of the Greater Accra Scrap Dealer Association, Accra, 04.05.2017; General
Manager of one of Ghana's Oldest Steel Mills, Tema, 17.05.2017.

260
introduction knowing they could likely fix lower prices to be paid to dealers without
it.270
At the same time, the implementation of the ban was enforced as never before
(which is also reflected in the significant post-ban drop in exports illustrated in
Figure 7.7 above). For around one month after the ban Accra, Tema, and Kumasi
dealers joined forces and refused to sell to steel mills and attempted to continue
smuggling their scrap via export agents based in Tema.271 MoTI, however, reacted
to this relatively rapidly and strictly, and at the beginning of May 2013 sent police
to seal and closely monitor the premises of previously known scrap exporters.
According to senior scrap dealers, this effectively shut down Tema exports for
them, many dealers losing dozens of containers to police raids.272 Being a cash-
dependent business and many collectors living on what they earn on a day-by-day
basis, the inability to make cash from exporting scrap also pulled the plug on
dealers’ resolve not to sell to steel mills anymore.
The combination of a robust enforcement of the ban and no enforcement of a
minimum price system strongly tilted the playing field in favour of still mills. In the
weeks and months following the ban, scrap dealers complained strongly inside and
outside of the Scrap Monitoring Committee about steel mills ‘exploiting’ them
(Daily Guide 2013). Importantly, they also made sure that every scrap collector
selling to them or part of their associations knew that a ban had impacted them.
Dealers specifically expressed four grievances. First, a general price drop. One
senior representative of the GASDA alleges that prices after the ban dropped by
nearly half, from around Ghana Cedi 700 down to around Ghana Cedi 400.273
Although it is difficult to check these claims against more reliable figures given the
informality of the sector, without naming exact numbers, senior managers of two
270 Senior Officer for Industrial Promotion at MoTI, Accra, 03.05.2017; Senior Executive of the
Greater Accra Scrap Dealer Association, Accra, 04.05.2017; Senior Executive of the Tema Scrap
Dealer Association, Per Telephone, 18.05.2017.
271 Senior Executive of the Tema Scrap Dealer Association, Per Telephone, 18.05.2017; General
Manager of one of Ghana's Oldest Steel Mills, Tema, 17.05.2017.
272 Senior Executive of the Greater Accra Scrap Dealer Association, Accra, 04.05.2017; Senior
Executive of the Tema Scrap Dealer Association, Per Telephone, 18.05.2017.
273 Senior Executive of the Greater Accra Scrap Dealer Association, Accra, 04.05.2017.

261
leading steel firms, as well as a senior government official responsible for the
sector, confirmed that prices after the ban had dropped drastically.274 What was
more, however, was that steel mills returned to their pre-boom habits of forcing
scrap dealers to accept payment on credit. This in itself is not only extremely
negative for dealers that need permanent liquidity to pay their collectors, but mills
often delayed payment months beyond the agreed date. This led the MoTI to rule
that payments should not be done later than 21 days after delivery of the scrap, yet
millers rarely abode.275 Perhaps even graver, at the beginning of the ban, the steel
mills were overwhelmed by the supply of scrap, and not having the capital to buy
it all, declined much of it at the factory gate (The Herald 2013). And although the
companies’ capacity to buy scrap increased over the coming months, often they
would still not buy certain types of scrap,276 because they did not have the
equipment to process them (Daily Guide 2013).277 With the profitability of the
collector and dealer business brutally hit by the ban, according to sector analysts,
many dealers278 had to lay off their collectors and workers (The Herald 2013; Daily
Guide 2013).279
7.2.4.2. Limited Political Threat Despite Scrap Producer and Dealer Mobilization
The price-distorting effects of the ban were thus rapidly, clearly and harshly felt by
the scrap collector and dealer industry. Analogous to the previous case studies,
274 General Manager of one of Ghana's Oldest Steel Mills, Tema, 17.05.2017; Senior Manager of
one of Ghana's largest steel mills, Tema, 17.05.2017; Senior Officer for Industrial Promotion at
MoTI, Accra, 03.05.2017.
275 Senior Officer for Industrial Promotion at MoTI, Accra, 03.05.2017; Senior Executive of the
Greater Accra Scrap Dealer Association, Accra, 04.05.2017; Senior Executive of the Tema Scrap
Dealer Association, Per Telephone, 18.05.2017.
276 According to the President of the Tema Scrap Dealer Association this is true for example for
‘steel balls, ductile steel, manganese, among others, which the local steel manufacturers cannot melt’
(Daily Guide 2013).
277 Senior Officer for Industrial Promotion at MoTI, Accra, 03.05.2017; Senior Executive of the
Greater Accra Scrap Dealer Association, Accra, 04.05.2017; Senior Executive of the Tema Scrap
Dealer Association, Per Telephone, 18.05.2017.
278 Since most dealers and collectors also trade in non-ferrous scraps, the ban did not affect all of
their business, yet arguably one of their core pillars.
279 Senior Officer for Industrial Promotion at MoTI, Accra, 03.05.2017; Senior Executive of the
Greater Accra Scrap Dealer Association, Accra, 04.05.2017; Senior Executive of the Tema Scrap
Dealer Association, Per Telephone, 18.05.2017.

262
dealers and collectors consequently actively and jointly opposed the ban. As
indicated above, dealers at first tried to boycott traders and continue smuggling via
Tema, which after a month failed as a strategy due to the government’s enforcement
of the ban. Thereafter, collectors and dealers (with the latter clearly in the driving
seat) attempted a mix of demonstrations, media campaigns, formal complaints to
MoTI, and eventually smuggling via Togo rather than Tema.
According to senior representatives of GASDA and TSDA as well as steel mill
managers interviewed, in the month following the ban but particularly after its
increased enforcements, scrap dealers organized several demonstrations of dealers
and collectors in Tema and Accra (near Agbobloshie).280 Usually, however, these
demonstrations were quickly dispersed by the police, given their alleged lack of
permits. While not covered in the print media, organizers say that the protests were
covered via radio and TV (which was difficult for me to verify). One potential
reason for the concentration on non-written media is that many collectors are
illiterate, tend to listen more to the radio and as such are more reachable and
mobilizable in that way. The same, however, could be said for cashew farmers, yet,
nevertheless the ban saw massive print-media coverage. Thus, overall, the lack of
print-media coverage appears to imply that the demonstrations were not as
significant as in cashew for example (despite being at the heart of Accra and Tema,
two of the country’s largest and best-covered cities).
In parallel to the demonstrations, scrap dealers formally appealed to the government
to entirely withdraw or at least relax the ban. At the end of May, two months after
the imposition of the ban, the leaders of the Tema Scrap Dealers Association
petitioned the government to rethink the ban, arguing that it would worsen the issue
of youth unemployment and forwarded the issue that mills were rejecting many
kinds of ferrous scrap (The Herald 2013). Similar protests earlier in the months had
fallen largely on deaf ears at the MoTI. On 16 May 2013, Minister Idrissu had stated
that ‘Government has no intention of reviewing the ban on the export of ferrous
scrap, and will enforce LI2201 its letter and script religiously’ (Kunateh 2013). By
280 Senior Executive of the Greater Accra Scrap Dealer Association, Accra, 04.05.2017; Senior
Executive of the Tema Scrap Dealer Association, Per Telephone, 18.05.2017; General Manager of
one of Ghana's Oldest Steel Mills, Tema, 17.05.2017; Senior Manager of one of Ghana's largest
steel mills, Tema, 17.05.2017.

263
the summer, the minister’s views had softened. Idrissu, who had promised
parliament that scrap collectors would be treated fairly, was concerned that mills
allegedly continued to reject significant amounts of scrap. In July 2013, he thus told
the media in an interview that ‘the monitoring committee chaired by the chief
director of the ministry is to do a strong monitoring on the ground and if there is
evidence that the product is not needed by the steel companies, the government will
consider an option out’ (Obour 2013). Later, scrap dealers also alleged that he had
promised to lay before parliament an amendment bill to the ban that would allow
the export of certain types of ferrous scrap once it resumed in October (Mensah
2013).
Before parliament resumed and was able to amend the bill, steel millers in form of
SMAG actively – and it appears successfully – lobbied the government to abort any
plans of relaxing the ban. In August, SMAG heavyweights Patel (Tema Steel Co
Ltd.), Xu (Sentuo Steel Ltd.), and Kumar (Special Steel Ltd.) had set up a press
conference in which they went against these considerations. Specifically, they
complained about heavy lobbying from exporters as well as dealers and claimed
that acceptance of scrap at factory gates had normalized and that they had ordered
equipment that would allow them to melt cast iron and other more difficult to
process ferrous scraps (Abubakar 2013). Following the conference and the promises
by the steel millers, it appeared Minister Idrissu put to rest his amendment plans.
Despite further complaints by scrap dealers via the media in late October and in the
monthly Scrap Monitoring Committee meetings that the situation had remained
unchanged,281 that millers were still rejecting large amounts and that collectors were
being unemployed by the day, MoTI laid no amendment bill before parliament
(Daily Guide 2013; Mensah 2013). Although some scrap dealers allege that
corruption played a role in this, most observers appear to think that the Minister had
been convinced that relaxing the ban could re-open those loopholes which had
rendered previous legislations toothless tigers.282 As such, it seems that the well-
281 In 2015, the president of the Forum of National Equity (a rather unknown organization it seems),
Prince Bagnaba-Mba, supported dealers and nicely summarized their common standpoint: ‘Much as
we agree that there is the need to protect local industries, we are of the view that you don’t kill an
elephant to get maggots’ (Graphic Online 05.02.2015).
282 Senior Officer for Industrial Promotion at MoTI, Accra, 03.05.2017; Senior Executive of the
Greater Accra Scrap Dealer Association, Accra, 04.05.2017; Senior Executive of the Tema Scrap

264
being of the steelmaking industry and the approximately 3,000 people formally
employed in it were put above that of scrap dealers and collectors.
Having faced defeat in the formal arena, some dealers returned to smuggling.
Although some smuggling appeared to still have been possible via Tema port at
times (The Herald 2013), in interviews processors and dealers themselves said that
they increased smuggling via Togo.283 This, however, did not provide the outlet
Tema port had been prior to the ban, with transport costs significantly higher and
the government also trying to enforce its monitoring at the border once it became
aware of this new route. As illustrated by the mirror-data export figures in Figure
7.7 above, after 2014 exports have hovered at one-tenth of the level prior to the
export ban.
Arguably the most important question is, however, why dealers and collectors failed
to build the pressure that Ghanaian cashew farmers and traders had managed to just
three years later. One common argument about scrap dealers and collectors is that
they have weak collective action capacity. It is argued that they lack a common
national association, that the city-based associations struggle to collect membership
fees, and that collectors rely on quick profits, making it difficult to hold out in a
strike for example.284 This, however, was true to a large degree for cashew farmers
in Ghana. They too lacked a national association worth mentioning, those
cooperatives and farmer groups that did exist rarely collected membership fees, and
farmers too were highly dependent on selling their crop as quickly as possible.
One thing that really differentiates Ghanaian cashew farmers and scrap collectors,
however, is their group size. Whereas an estimated 100,000 Ghanaians make most
of their income from cashew, arguably less than 17,000 are involved in collecting
scrap, ferrous scrap likely not being the most important source of their income. In
line with the argument that smaller groups are less threatening to the government,
Dealer Association, Per Telephone, 18.05.2017; General Manager of one of Ghana's Oldest Steel
Mills, Tema, 17.05.2017.
283 Senior Executive of the Tema Scrap Dealer Association, Per Telephone, 18.05.2017; General
Manager of one of Ghana's Oldest Steel Mills, Tema, 17.05.2017.
284 Senior Officer for Industrial Promotion at MoTI, Accra, 03.05.2017; Senior Executive of the
Greater Accra Scrap Dealer Association, Accra, 04.05.2017.

265
a senior executive of the Greater Accra Scrap Dealer Association summarized their
inability to be heard by the government as follows:
The government wasn’t scared of us because we didn’t have electoral
power. We are scattered all over the place and not many. If we were 300,000
and concentrated in Accra and Kumasi (and all NDC men) they would have
never implemented the ban on us. But many of our men don’t even vote,
and when they do, they are all mixed up between NPP and NDC.285
Validated by a senior MoTI official, this suggests that given the lack of numerical
power of collectors and dealers, the government had no reason to fear their
opposition and thus could implement and enforce the ban without much worry.286
And although it did consider the well-being of collectors at some point, it discarded
it in favour of steel millers and industrialization when push came to shove.
7.2.5. Conclusion of the Ghanaian Ferrous Scrap Ban Case Study
To conclude, the case study of the 2013 Ghanaian legislative export ban on ferrous
scraps provides further evidence for the thesis argument. As expected, the ban led
to a significant, rapid, and visible decline of prices for and income from ferrous
scrap for many dealers and collectors. Informed and organized by dealers, scrap
collectors and dealers united to oppose the ban through demonstrations, boycotts
against selling to local mills, and formal appeals to the government covered by the
media. Yet, although it did consider relaxing the ban for a moment, the government
consequently enforced and maintained the ban. What is more, it did not enforce
measures – such as minimum prices or limits to payment delays by mills to dealers
– that would have reduced the impact of the ban on dealers and collectors. As
confirmed by actors across the sector, the core reason behind scrap dealers and
collectors’ failure to replicate the pressure that Ghanaian cashew farmers had built
on the government, was that they lacked the numbers. Counting less than 17,000
285 Senior Executive of the Greater Accra Scrap Dealer Association, Accra, 04.05.2017.
286 Senior Officer for Industrial Promotion at MoTI, Accra, 03.05.2017.

266
people collectors posed no electoral or other threat that would have motivated the
government to question the legislative ban from the outset or thereafter.
Economically, the ban has arguably helped the steel milling industry considerably.
Most existing companies have massively expanded their steel-making capacity (for
example Sentuo Steel from 72,000 to 300,000 tons287 and Ferro Fabrik from 30,000
to 100,000 tons) and three new steel makers have entered the market in recent years
(United Steel Company, Rider Steel Ltd., and Fabrimetal Ghana Ltd.).
Nevertheless, mills have continued to complain to MoTI that they were not
receiving enough protection. Despite the ferrous scrap export ban and a 20% import
duty on iron rods, foreign competitors allegedly sell their rods and related products
at much cheaper rates on the Ghanaian market. In a May 2016 position paper to the
government, the Steel Manufacturers Association complained that due to increasing
electricity tariffs (which next to scrap supply is their highest cost) their products
would be over 50% more expensive than those of their foreign importing
competition (The Finder Online 2016). As a consequence, they called for ‘the
imposition of 25% special levy on imported finished steel products, in addition to
20% import duty, to protect the local industry’ and warned that if these ‘remedial
measures are not taken immediately, it would lead to total collapse of the steel
sector in Ghana’ (The Finder Online 2016).
It appears, however, that this and similar later calls by SMAG (Ohene 2019) fell on
deaf ears, with the government not imposing any further tariff measures. Looking
at the theoretical argument of this thesis, this should not come as entirely surprising.
When it comes to import tariffs on iron rods and other intermediate steel products
the steel mills are not competing with a limited group of scrap collectors but with
actors that are deemed equally important for industrialization (e.g. manufacturers
using steel and needing cheap input to compete) but also those accounting for a
large share of the population (e.g. construction workers, as well as consumers
buying steel manufactured products or houses, and that again, would not be content
with a massive price increase). Thus, the political logic of large group size could
also be fruitfully applied to this area of contention in the steel value chain. From an
287 Apparently in 2013, Sentuo had stocked up its capacity to 800,000 tons, wanting to buy much of
its input in billet form from Europe and the US (05.06.2015).

267
economic viewpoint, however, it is rather sobering to see that despite massive
protection at the cost of scrap collectors and consumers, steel mills in Ghana still
have not achieved to be competitive within the international market. Industry and
government need to ask themselves whether and what tools exist that can achieve
this.

268
7.3. Many Producers, Few Losers: The 2012 De Facto Ban on Raw
Hides and Skins Exports in Tanzania
The last case study analysed in this thesis is that of the imposition of a 90% export
tax on raw hides and skins (RHS) in Tanzania in 2012. Intended as a de facto ban
that would protect the domestic tanning industry against foreign processors
overbidding them in the pursuit of domestic RHS, this case is interesting because it
appears on the first look to be a strong outlier to the thesis argument. Over 1,7
million households in Tanzania keep livestock and as such, one would assume,
should be opposed to a policy that would reduce RHS prices, if implemented
effectively. On a closer look, however, this assumption proves to be mistaken. As
evidenced in several government, donor, and academic reports, as well as
interviews and a medium-N survey of 25 livestock keepers in Northern Tanzania,
RHS are of no value to livestock keepers. Economically speaking, RHS account for
around 1% of the value of a cow, goat, or sheep, yet practically, when selling their
animals, producers do not receive any separate payment or valuation for the quality
of the animal’s skin or hide. Consequently, livestock keepers not only treat the RHS
of their animals poorly (leading to significant problems for the domestic leather
industry), they also do not care and know about policies affecting the value of raw
hides and skins. Or to put it in the wording of the thesis argument: they do not
constitute a share of the population that earns a significant income from producing
that commodity. And while abattoirs do make money from selling RHS, this
accounts for no more than 1% of their income, yet again being the reason why they
invest minimal care in protecting the quality of hides.
The only group in the Tanzanian – and for that matter African – leather industry
that would truly be hurt and agitated by such a severe export restrictive measure are
RHS traders. This group, however, is extremely small. Constituting only around
2,500 people in Tanzania (and likely less in most other countries in Africa, except
for Ethiopia and Sudan, the only countries with a comparable livestock population
on the continent), they lack any numerical power. Thus, in line with the thesis
argument, the government could implement and maintain the 90% export tax
without fearing any serious consequences. That being said, traders do have
considerable connections into the leading ministries – the Ministry of Livestock and

269
Fisheries (MoLF) and the Ministry of Industry and Trade (MoIT) – that allowed
them to often circumvent the enforcement of the policy (smuggling mostly to
Kenya) and some argue prevent that an actual export ban was implemented, which
would be harder to circumvent and was called for by tanners.
Figure 7.10. Map of Tanzania Highlighting the Three Main Tanning Centres
Source: Own illustration based on a map from Tim Best Direct (2019).
In the following sections, I start by describing the origins of the Tanzanian leather
sector and its demise in the late 1980s. Then, I describe how export taxes on RHS

270
were employed to promote its revival. Before concluding, I take a closer look at the
politics surrounding the 2012 imposition of a 90% export tax on RHS.
7.3.1. The Rise and Fall of the Tanzanian Leather Industry in the 20th
Century
The cornerstone of Tanzania’s modern leather industry was set by the Tanzanian
government in the late 1960s and 1970s.288 In 1967, Tanzania’s charismatic father
of the nation and long-term president Julius Nyerere had guided the ruling party to
the Arusha Declaration, which called for the rapid industrialization of the country.
Home to Africa’s third-largest livestock population, Nyerere realized that the
leather industry boasted tremendous potential to substitute leather goods imports as
well as increase manufactured exports in the form of tanned leather (Mhando 2019).
During the 20-year period between the Arusha Declaration and economic
liberalization, the Tanzanian state with the strong financial and technical289
assistance from international donors had invested around US$ 100 million in setting
up a domestic and state-run290 leather tanning and shoe production industry
(International Business Publications 2015: 219). In 1968, Tanzania Tanneries was
built in a joint venture between the Tanzanian and Swedish government in Moshi,
in north-eastern Tanzania (compare Figure 7.10 below). And in 1974, two major
tanneries in Morogoro (relatively close to the capital Dar es Salaam) and Mwanza
(at Lake Victoria in the Northwest) were built with financial assistance from the
Bulgarian government and the World Bank respectively (Ministry of Industry and
288 The only tannery that had existed prior to independence was Himo Tanneries and Planters Ltd.
that was set-up already in 1895 by the Gujarati immigrant Sharif Jiwa close to Moshi, at the foot of
the Kilimanjaro (Sutton and Olomi 2012: 131-132).
289 During the mid-1980s, UNIDO had also supported the Tanzanian government in establishing the
Tanzanian Institute of Leather Technology in Mwanza, a training centre for the domestic leather and
leather goods industry. Due to the state of collapse of the leather industry in the later 80s, however,
the institute had never offered any trainings, was privatized in 1994 and only in 2010 opened as the
Mwanza branch of the Dar es Salaam Institute of Technology, preparing students for work in the
leather industry ((DIT Mwanza 2019).
290 Originally run by the state-owned National Development Cooperation, ownership of the
companies was transferred to Tanzania Leather Associated Industries, the state-owned holding
corporation for all government-owned businesses in the leather and leather products industry (Sutton
and Olomi 2012: 137).

271
Trade and ITC 2015: 43; Shrewsbury 2007: 13; Sutton and Olomi 2012: 131).291
Combined, the three factories had a sizeable installed annual capacity of producing
2.8 million m² of leather.
During the same time, two large state-run shoe factories were in operation. After
the Arusha Declaration, the Tanganyika Bata Shoe Company set up in 1958 was
nationalized by the government renamed Tanzania Shoe Company (Bora). And in
1980, financed by a US$ 40 million by the World Bank, the Morogoro Shoe
Company was set up next to the Morogoro Tannery. The two companies had a
combined installed capacity to produce 7 million pairs of shoes per annum (Sutton
and Olomi 2012: 131).
Initially, the leather industry performed reasonably well. In between 1980 and 1985,
the three tanneries reached their peak level of output, operating close to full capacity
(International Business Publications 2015: 228; Sutton and Olomi 2012: 137).
Critical to this early success was strong industry protection by the state. Whereas
RHS trade after independence had been controlled by four private companies and
their buying agents, in 1973 the Tanzanian government took over the trade of RHS
with the creation of an authority called Tanzania Hides and Skins (Ministry of
Livestock Development and Fisheries 2011). Similar to the role of the NCPB in the
Kenyan pre-liberalization cashew industry, to assure sufficient supply for the
emerging tanning industry Tanzania Hides and Skins was given the monopsony
right to buy RHS and would only export RHS surpluses.292 As illustrated in Figure
7.11 below, with the expansion to three factories in the mid-1970s and the creation
of Tanzanian Hides and Skins the export of RHS dropped towards zero. Similarly,
high tariffs were imposed on manufactured leather imports to protect the domestic
leather industry (FAO 1998). And although Tanzania did increase its exports in
processed (i.e. finished) and semi-processed (i.e. wet-blue and crust) leather, most
of the output produced by the local leather industry was geared towards the
domestic market and import substitution (Board of External Trade 2004: 2).
291 Morogoro Tanneries Ltd. started operations in 1978 and Mwanza Tanneries Ltd. in 1979.
292 Senior Executive of Leather Association of Tanzania, Dar es Salaam, 11.07.2017.

272
Figure 7.11. Exports of Raw Hides and Skins and (Semi-)Processed Leather from
Tanzania as Declared by Importers from 1965-2017
Source: Own illustration based on SITC1 data from the UN Comtrade database
(DESA/UNSD 2019). A figure illustrating export numbers as declared by Tanzania
– rather than by the exporters – can be found in Appendix 7.4. Moreover, Appendix
7.5 provides an overview of exports of RHS and semi-processed leather by export
destination.
Despite its initial success, the Tanzanian leather industry fell into a deep crisis in
the second half of the 1980s. This was caused on the one hand by the overall adverse
economic conditions at the time, characterized by foreign exchange shortages that
hampered the tanneries and shoe factories to import required chemical and machine
parts (Sutton and Olomi 2012: 137). Yet, on the other hand, scholars and donors
argued that the companies were run inefficiently due to over-ambitious project
conception, implementation inexperience, insufficient professional expertise, lack
of working capital and overall a greater focus on employment generation and
commercial viability and international competitiveness (Board of External Trade
2004: 2; Mhando 2019). Moreover, as part of the SAP that had started in Tanzania
1973
State RHS Buying
Monopoly
1987
RHS Buying
Liberalization
2003
20%
Export
Tax
2007
40%
Export
Tax
2012
90%
Export
Tax

273
1986, the government partially liberalized the trade of RHS and manufactured
leather goods in 1987. This lead to a rapid increase of RHS exports and foreign
leather goods imports, making it difficult for tanneries to source RHS competitively
and local leather manufacturers to compete against cheaper imports (FAO 1998).
As a consequence, by the end of the 1980s, the tanneries were achieving less than
10% capacity utilization and the Morogoro shoe factory even less than 4% (Erixon
2005; International Business Publications 2015: 219).
By the early 1990s, most tanneries had shut down and in 1992 the Tanzanian
government guided by the IFIs decided to privatize all leather parastatals and fully
liberalize RHS trade (FAO 1998; International Business Publications 2015: 219).
While Morogoro Tanneries Ltd. and Mwanza Tanneries Ltd. were sold to the
owners of Africa Trade Development, among them Rostam Aziz (one of two
Tanzanian billionaires and long-term political heavy-weight in the ruling party
CCM), Moshi Tanneries Ltd. was sold to a subsidiary of the Agha Khan Group
(International Business Publications 2015: 229; Sutton and Olomi 2012: 137). Yet,
despite significant investments by the new owners of these companies in the
refurbishment of the tanneries and shoe factories, they failed to regain
competitiveness in the liberalized market and most had ceased to operate by the
turn of the millennium (International Business Publications 2015: 220; Mhando
2019; Ministry of Industry and Trade 2011; Sutton and Olomi 2012).
7.3.2. The 2003 20% RHS Export Tax and the Renaissance of the
Tanzanian Leather Industry in the 21st Century
In the early 2000s, the situation of Tanzanian tanneries was dire. Out of seven
existing tanneries only two were operating and that a very low level (International
Trade Centre 2005). 293 As a consequence, already in the late 1990s, the tanneries
had started to lobby the government for an export tax on RHS (International
Business Publications 2015: 221). In 2003, this bore fruit. In line with a larger
293 Next to the larger tanneries in Morogoro, Moshi, and Mwanza, there were four smaller tanneries
in the country. Himo Leather Ltd., the oldest tannery in the country, close to Moshi. JAE(T) on the
grounds of what was supposed to be the Tanzania Institute of Leather Technology in Mwanza. As
well as Afro Leather Ltd. and Lake Trading Tannery (Kibana) in Dar es Salaam.

274
UNIDO-sponsored strategy to revive the leather industry, 294 in 2003 the
government introduced a 20% export tax on RHS.295 In addition to disincentivizing
exports of RHS, the revenue generated by the tax was transferred into the Livestock
Development Fund (LDF) set up ‘to improve training, extension and inspection
services in the leather sector, and to promote value addition’ (Board of External
Trade 2004: 4–5; Curtis 2010: 7; Dinh and Monga 2013: 65–66).
As illustrated in Figure 7.11 above, the export tax was successful in increasing the
number of semi-processed hides and skin exports. Exports rose from nearly zero in
2003 to over 5,000 tons in 2008, over twice the exports achieved in the golden era
of the industry in the early 1980s. One crucial aspect of this success was that the
Leather Association of Tanzania (LAT) – i.e. the umbrella association of leather
tanneries and manufacturers founded in 1991 – was allowed to monitor the exports
of RHS through Dar es Salaam starting in May 2004 (Board of External Trade 2004:
4). Importantly, according to a former senior executive of LAT, it could use part of
the LDF’s funds to enforce the tax. What this meant is that members of the LAT
would pay customs officials at the Dar es Salaam and Tanga ports US$ 50 per every
miss- or underdeclared container they could catch and confiscate, hereby aiming to
give customs officials an incentive to resist bribes by potential smugglers.296
Despite the 20% export tax by 2007 still more than twice as much RHS was
exported than processed hides and skins. Given the initial success of the 20% export
tax and in line with the new 2007 ‘Leather Sector Development Strategy’, the
government decided to increase the export tax to 40% the same year (Curtis 2010;
Ministry of Industry and Trade and ITC 2015: 38).
294 This strategy was put to paper in ‘A Blueprint for the African Leather Industry’ by UNIDO (2004)
Some of its core initiatives were ‘the creation of the Meat Board to improve slaughtering and abattoir
facilities; the establishment of common production and training centres for small scale leather
footwear and leather goods producers; and the implementation, in partnership with the Common
Fund for Commodities (CFC), of a programme to increase the quality of hides and leather through
improved extension services, inspection and grading’ (Board of External Trade 2004: 4–5).
295 To quote the Tanzanian Ministry of Industry and Trade and the ITC (2015: 38), the ‘levy of 20
% of the free on board value of exports was introduced in 2003 with the aim of increasing the local
supply of raw materials so that local tanneries could benefit from their low cost.’
296 Former Senior Executive of LAT, Mwanza, 02.08.2017.

275
Figure 7.12. The Tanzanian Leather Product Chain since 2000
Source: Own Illustration
Critically, both during the initial imposition of the 20% export tax in 2003 as well
as the increase to 40% in 2007 there was never any notable protest against the
policies. This is surprising at first, given that there are over 1.7 million households
in Tanzania keeping livestock that should stand to lose from such export taxes.297
297 According to the government’s 2005 Livestock Sample Survey, the livestock sector provides
livelihood support to a total of 1,745,776 households in Tanzania (Ministry of Livestock and
Fisheries Development 2011: 3; Ministry of Industry and Trade and ITC 2015: 21) An estimated
95% of cattle production – the core source for RHS – is produced by (agro-)pastoralists and only
Livestock
Keepers
Foreign
Leather
Manufacturers
Export/
Import
RHS
Traders
Slaughter
Slabs/Houses,
Abattoirs
Domestic
Tanneries
RHS
RHS
Livestock
ikkk
RHS
ikkk
Wet-Blue
Leather
Finished Leather
Foreign
Tanneries
Domestic
Leather
Manufacturers
Domestic
Consumers
Finished
Leather
Finished
Leather
RHS Leather
Goods
Leather
Goods

276
In reality, however, RHS prices are of no relevance to nearly all livestock keepers
in Tanzania (or elsewhere in Africa for that matter). The clearest statement in this
regard comes from the Tanzanian Government’s Board for External Trade’s 2004
analysis of the sector:
‘Indeed, from the perspective of the herdsman/farmer and rural butcher,
there is currently no value chain for leather [emphasis added]. Leather
remains part of the value chain for meat, where the value obtained from
selling an animal with a good quality hide is exactly the same as one with a
poor hide – specifically zero’ (Board of External Trade 2004: 3).
This is assessment is supported by others (International Trade Centre 2005; Rolence
and Suleiman 2016; UNIDO 2004: 26), my own survey of 25 northern Tanzanian
Livestock keepers (all of which replied that they did not receive any value from
RHS), and simple economic analysis. Overall, the economic value of a cow’s hide
represents less than 1% of its total value.298 Even if livestock keepers were to
receive that 1% – which they do not – it would in no way constitute a significant
share of their income. As such, the millions of Tanzanian livestock keepers do not
– as per the definition of my population share variable – constitute a share of the
population that earns a significant income from producing a commodity (RHS in
this case), and thus, are not affected if its export is restricted. This also helps to
explain the extremely poor quality of RHS in Tanzania (and most African
countries), with livestock keepers having no incentive to take care of it.299
around 5% is produced by larger ranches, mostly by the National Ranching Company (NARCO), a
parastatal (Kilimo Trust 2009: i).
298 In 2017, the average Tanzanian cow would produce 12 kg worth of hide and a minimum of 100
kg of meat. At a price of Tsh 400 (US$ 0.25) per kg of raw hide, the cow’s hide has a total value of
Tsh 4,800. At a price of Tsh 6,000 per kg of meat, the cow’s meat has a total value of Tsh 600,000
(compare Wilson [2013: 40] for detailed meat prices in Tanzania for 2013). Thus, the hides total
value is equal to less than 0.8%.
299 Since hides and skins are of no value to livestock keepers, they do not invest in their quality. The
most dominant problem is the branding of animals. Interviewed tanners estimate that over 80% of
all animals are branded, which reduces the value of a hide by 10% to 40%, depending on the position
of the branding on the skin (Mwangosi 2014: 48–49). Branding is an essential tool to prevent
livestock rustling and not doing so would pose a considerable risk for livestock keepers, especially
if there is no value to not doing so. Marking ears of animals with tags, for example, has also failed
because rustlers could simply cut them off. Further major issues are that animals are not dipped and
their skins are thus damaged by parasites, that they have scars from being whipped, running through
thorny bushes, and not having horns being taken or grinded off, as well as culling occurring at old

277
Although slaughter slabs, slaughterhouses, and abattoirs do receive payment for
RHS, it is so insignificant to their total income that like livestock keepers they do
not care much about RHS price developments or quality.300 Given that, again, hides
only constitute less than 1% of the value of the slaughtered animals, meat processors
(a) can neither be considered as population group that would be affected by an
export restriction on RHS and (b) invest little to no care in assuring good RHS
quality. As a consequence, 60% of hide defects are attributed to poor flaying during
slaughtering (Mhando 2019).301
The only group seriously negatively affected by RHS export restrictions are RHS
buyers and traders. According to two interviewed senior executives of the Union of
Tanzanian Hide and Skin Traders and Developers (UWANGOTA302), the
association of Tanzanian RHS traders, there are around 80 major RHS traders which
each employ 20 to 30 collectors or buyers.303 Thus, overall, they estimate that there
are likely less than 2,500 RHS buyers and traders in Tanzania. Collectors buy RHS
from slaughterhouses, slabs, and abattoirs, bring them to the senior traders, where
the RHS are salted or dried for preservation and transport. As confirmed by the two
interviewed trader association executives and supported by the findings of
Mwangosi’s (2014: 42) survey of RHS traders in Mwanza, nearly all RHS collected
by independent traders is exported, legally and increasingly illegally since the
introductions of RHS export taxes. Given that RHS traders and buyers are less than
age (Board of External Trade 2004: 7; Sutton and Olomi 2012: 133; Mwangosi 2014: 49; UNIDO
2004: 24).
300 Around 85% of Tanzania’s processing of cattle and small ruminants is conducted in around 1150
small- and medium-scale community-owned slaughter slabs and slaughter houses, with the
remainder conducted in 27 larger scale abattoirs situated in the country’s largest cities (Ministry of
Industry and Trade and ITC 2015: 22; Kilimo Trust 2009: 24).
301 (Rolence and Suleiman 2016) estimate that 99% of flaying is done by knife, which is extremely
prone to cutting and damaging the skins, especially when done quickly (Mwangosi 2014: 39;
Ministry of Industry and Trade and ITC 2015: 43). The alternative of hand or machine-based flaying
by pulling the skin off would be much gentler to the skin, yet takes around 10 minutes per animal
versus seven minutes required for knife-flaying, which would lead to a massive increase in labour
cost unjustifiable given the little value added of better hides to abattoirs (Interview with Senior
Executive of Major Tannery, Moshi, 17.08.2017).
302 UWANGOTA stands for Umoja wa Wazalisha Ngozi Tanzania. UWANGOTA was founded in
2016 in Dar es Salaam, thus after the implementation of the 2012 90% export tax on RHS.
303 Senior Executive of the Union of Tanzanian Hide and Skin Traders and Developers 1, Dar es
Salaam, 14.07.2017; Senior Executive of the Union of Tanzanian Hide and Skin Traders and
Developers 2, Dar es Salaam, 14.07.2017.

278
2,500 people in a country of over 40 million inhabitants, the share of the population
that stands to lose from a severe export restriction like a heavy export tax or ban
and might resist it is extremely marginal. From the perspective of this thesis’
theoretical argument it is therefore plausible that the government would implement
heavy export taxes on RHS without much concern about any significant political
backlash.
7.3.3. The Tanzanian Leather Sector Crisis and the 2012 De Facto Ban
The rise of the Tanzanian tanning industry induced by the export tax came to an
abrupt stop in 2008, caused by two major factors. First, a massive global price drop
for tanned hides and skins due to a general global decrease in demand for leather
products in the years of the 2008/9 Global Financial crisis (Sutton and Olomi 2012:
138; UNECA 2013: 195). Second, the end of the LDF-financed and LAT-conducted
RHS export monitoring scheme. In 2008, the chair position of the LDF’s steering
committee rotated to the Ministry of Livestock and Fisheries (MoLF). To the
surprise and shock of tanners, the new chair decided to stop LAT from monitoring
the port and utilizing funds from the LDF for that purpose. According to a former
senior executive of LAT, tanners argued the new chair’s change of direction to be
the result of him being involved with RHS traders or in RHS trade himself.304 In
fact, current tanners and members of LAT argue that evidence for the chair’s
conflict of interest was eventually identified in 2014 (APLF 2014) and that the chair
was subsequently transferred to a minor post in the countryside as punishment for
inhibiting the industry’s growth in favour of RHS trading.305 Simultaneously, the
leadership of LAT had changed to a president much less actively involved in the
steering committee and the work of LAT, and who in this critical time was allegedly
not fit to protect tanners. According to tanners, the result of the LAT export
monitoring scheme’s end was increased smuggling and miss-declaration of RHS
304 Former Senior Executive of Leather Association of Tanzania, Mwanza, 02.08.2017.
305 Senior Executive of Leather Association of Tanzania, Dar es Salaam, 11.07.2017.

279
exports and thus an increased difficulty to source RHS for their factories, a claim
confirmed by Sutton and Olomi (2012: 136) in their analysis of the sector.306
Table 7.3. List of Tanneries in Tanzania in 2010
Tannery Location Installed
Capacity in
ft² (2010)
Utilized
Capacity in
ft² (2010)
Degree of
Processing
East Hides
Tanzania
Ltd.307
Morogoro 29,000,000 19,000,000 Wet Blue
Moshi Leather
Industries Ltd.
Moshi 10,000,000 2,450,000 Wet Blue,
Crust
Himo Tanners
and Planters
Ltd.
Himo 4,000,000 4,000,000 Wet Blue,
Crust, Finished
Afro Leather
Industries Ltd.
Dar es
Salaam
3,000,000 1,500,000 Wet Blue
Lake Trading
Co. Ltd.
Kibaha 5,160,000 3,096,000 Wet Blue,
Crust, Finished
SALEX
Tanneries Ltd.
308
Arusha 4,050,000 3,040,000 Wet Blue
Total 55,210,000 33,086,000
Sources: Dinh and Monga 2013: 67; Ministry of Industry and Trade 2011; Ministry
of Livestock Development and Fisheries 2011: 76
By 2011, the situation for the countries six tanneries had worsened significantly
(see Table 7.3 for an overview of the six tanneries). Increasingly struggling to
306 Senior Executive of Leather Association of Tanzania, Dar es Salaam, 11.07.2017; Senior
Executive of Large-Scale Tannery, Dar es Salaam, 11.07.2017; Owner of Medium-Scale Tanning
and Leather Manufacturer, Mwanza, 02.08.2017; Senior Executive of Major Tannery, Himo,
18.08.2017
307 Formerly known as Morogoro Tanneries Ltd. Now named ACE Leather Ltd., under the same
management of Onorato Garavaglia.
308 Capacity numbers for 2009 from (Ministry of Industry and Trade 2011).

280
source RHS on the market due its smuggling, capacity utilization decreased from
around 60% in 2010 to less than 50% the year after (Trade Mark Southern Africa
2011), and as illustrated in Figure 7.11 exports of processed hides witnessed a
significant dip. Consequently, tanners – who had formed the Tanzania Tanneries
Association (TTA) after LAT had weakened – started to lobby the government for
an intensification of the RHS export restrictions. Under the chairmanship of East
Hides Tanzania Ltd.’s (formerly Morogoro Tanneries Ltd.) Italian Managing
Director Onorato Garavaglia, TTA had several meetings throughout 2011 with the
Government to discuss further support (APLF 2011). More specifically, tanners
asked the government to increase the export tax immediately from 40% to 90%,
eventually transform it to a complete export ban, and to do more to curb smuggling.
By March 2012, the TTA had changed the goal post. Claiming that tanners were
increasingly failing to compete with Asian (mostly Pakistani) RHS
exporters/smugglers, TTA and Garavaglia shifted towards demanding an
immediate and outright ban on RHS exports without a prior increase of the export
tax (The Citizen 2012; Juma 2012). Then Minister of Livestock and Fisheries,
David Mathayo David, reacted by setting up a monitoring committee composed of
officials from MoLF, MoIT, and the Tanzania Revenue Authority (TRA), set with
the task to assess the tanners’ complaints and potential policy options.
Rather than imposing a ban, the government, however, decided to go with the
TTA’s initial demand and in June 2012 increase the export tax on RHS from 40%
to 90% (Machira 2013; WTO 2012). The aim of the tax, according to the Minister
of Finance in his 2012 budget speech (2012: 66), was ‘to promote local processing
of hides and skins as well as value addition to our exports’. Asked why they had
not directly imposed a ban, interviewed officials at MoIT and MoLF replied that
the 90% tax was intended as a de facto ban,309 with the export tax so high that no
exporter should have been able to export RHS with a profit after the tax.310
Moreover, they indicated that they had planned to impose an export ban but wanted
309 Which is why it is listed as a ban in Appendix 2.1 and treated as such in binomial models in the
large-N analysis in Chapter 4.
310 Senior Industry Officer in the Ministry of Industry and Trade, Dar es Salaam, 12.07.2017; Leather
Promotion Officer (MoIT), Per Telephone, 11.07.2017; Livestock Officer (MoLF), Dar es Salaam,
14.07.2019.

281
to coordinate this with the other members of the East African Community. These
talks, they claim, stalled given disagreement among members over whether an RHS
export ban should only affect exports from the EAC (especially Kenya’s preferred
option, which imported and smuggled many RHS from Tanzania) or also within the
EAC (which Tanzania preferred to protect its industry from Kenyan competition).
Interestingly, interviewed leather sector leaders assert that the government had told
them that the WTO’s rules against export bans was the reason they could impose a
ban.311 If this assertion is true, it would be surprising. In the decade before, under
the same set of global trade rules (and lax enforcement thereof in Africa), and by
the same government and/or ruling party, Tanzania had imposed bans on several
raw commodities to promote their domestic processing: in 2004 on raw logs, in
2005 on metal waste and scrap, and just in 2010 on unprocessed tanzanite (a rare
gemstone). Notably, none of the interviewed MoIT and MoLF staff could confirm
that WTO rules had played a significant role in their decision-making. Moreover,
the interviewed leather sector leaders shared that they had perceived the WTO
reasoning as a false pretence. Rather, they felt, the non-imposition of a ban was the
result of successful counter-lobbying by RHS traders, who anticipated that an
outright export ban would make fraudulent exports of RHS more difficult.312
7.3.4. The Politics of the 2012 RHS 90% Export Tax
In the five case studies conducted so far in this thesis we have seen that export bans
on raw commodities rapidly, severely, visibly, and with the help of traders
attributable to the government reduced producer prices. Apart from timber, this has
led to traders organizing producer protest against the bans. However, only where
311 Senior Executive of Leather Association of Tanzania, Dar es Salaam, 11.07.2017; Senior
Executive of Large-Scale Tannery, Dar es Salaam, 11.07.2017.
312 There are a number of reasons a ban might be more efficient in curbing exports than a high tax
(even if intended to factually cut exports to zero). First, under the tax, many RHS traders would still
‘legally’ export RHS via the port, yet would massively underdeclare the amount of RHS (aided by
overwhelmed or corrupt customs officials), thus, pushing the real tax down to levels allowing to
make a profit. With a ban you simply would not be able to export any RHS anymore (RHS exporters
would not even get export licenses anymore), thus also not to underclare (although you might still
misdeclare it – however, misdeclared goods are easier to detect than underdeclared ones, with
character of the good easier to assess than the volume). Second, export bans make it easier to
confiscate the smuggled good, whereas tax-avoidance might only bring with its fees (albeit hefty
ones).

282
producers were many (that is, in the Ghanaian cashew case) did they manage to
credibly threaten the government, and thus only there was the ban withdrawn. How
does this compare to the 2012 90% export tax imposition on RHS in Tanzania? As
already detailed in this chapter, RHS differ in significant aspects to previously
studied commodities and hence also in relation to the assumed mechanisms. These
differences render this final analysis relatively short.
Since there are no prices for producers (livestock keepers) the tax had no effect on
them and thus they had no reason to (be) mobilize(d) against it. To further
substantiate this claim, I rely on the replies from 25 Northern Tanzanian Livestock
keepers that I surveyed throughout August 2017 in five wards in Mwanza, Arusha,
and Moshi regions (see Appendix 7.6 for a copy of the survey questionnaire).
Critically, all 25 interviewees replied that they did not receive any (dedicated)
payment for (the quality of) their animals’ hides and skins and actually indicated
explicitly that when selling their livestock that the quality of the raw hides and skins
makes no difference in the sales value. Moreover, only two out of the 25
interviewees were aware that an export tax on RHS was even in place (one, because
his brother in law happened to be a hides collector; the other because he had lived
in Holili near the border to Kenya for some time, where smuggling of hides had
come up as a debate topic every once in a while). Neither of the two, however, saw
the tax as reason for political action (whether via protest or the ballot) because they
did not feel affected by it. Combined with the information provided in Section 7.3.2,
these survey results provide strong evidence that livestock keepers could not be
affected by the tax and explains why they could not be mobilized against it.
As indicated in Section 7.3.2, the only group that would really lose out from an
export tax in Tanzania are the less than 2,500 Tanzanians involved in RHS trade
and export. Whether RHS traders received lower prices on the domestic market is
difficult to assess, because both prior and after the imposition of the 90% tax they
had rarely sold their RHS on the domestic market, that is to Tanzanian tanneries
(who sourced RHS themselves). What we do know, however, is that more than
doubling the export tax to 90% massively reduced the formal export of RHS. As
illustrated in Figure 7.11, whereas over 6,000 tons of RHS had been exported in
2011, this had halved to around 3,000 tons in 2013, and further dropping to around
1,000 tons by 2017. This has two reasons. On the one hand, several exporters exited

283
the Tanzanian RHS market due to the imposition of the higher export tax, leaving
a greater share of the RHS pie to local tanners. And indeed, following the two years
after the tax increase, Tanzanian tanners experienced their most successful period,
with processed hides and skin exports more than doubling from around 4,000 tons
in 2012 to around 9,000 tons in 2014 (compare Figure 7.11). On the other hand,
many exporters – rather than just under- or misdeclaring RHS exports at Tanzanian
ports – switched to smuggling RHS across the border to Kenya,313 according to
interviewed officials and tanners.314 Given that Kenyan tanners likely do not pay as
well as Asian tanneries and that some RHS traders closed shop, it is likely that RHS
traders were negatively affected by the tax increase. Given, however, that they
could mostly switch to the Kenyan market, the impact on their profit margins is
likely considerably smaller than that of producers in the other commodities studied
in this thesis.
RHS traders did not publicly protest the ban, neither via the media or on the streets.
There are two major reasons for this. One, the ability to smuggle RHS to Kenya
buffered the impact of the tax. Second, even if they had been impacted more, traders
likely realized that they did not have the numerical power to be a threat to the
government. With livestock keepers uninterested, traders would have had to rely on
their own, counting less than 2,500 people. Amounting to only 0.005% of the
population and spread throughout a country nearly four times the size of the United
Kingdom, their protest would not have been anything but a drop in the bucket of
Tanzanian politics.
313 Kenyan tanners can offer higher prices to Tanzanian RHS traders than Tanzanian tanners for
three reasons. First, they are slightly more advanced. Second, Kenyan hides and skins have a better
reputation on the international market than Tanzanian giving them a premium on the international
market. Consequently, they can buy Tanzanian hides for lower prices, mix them in with Kenyan
hides, and receive the premium nevertheless. Thirdly, since June 2015 Tanzania has implemented a
10% export tax on wet-blue hides and skins to encourage local tanners to upgrade to crusted and
finished leather. Since Kenyan tanners do not face this tax, they have competitive advantage in
exporting wet-blue hides and can thus offer Tanzanian RHS traders higher prices. Importantly, since
the RHS are smuggled from Tanzania, they are not registered with Kenyan customs and thus do not
show up in Figure 6.X. Thus, although exports of RHS overall from Tanzania might not have
reduced massively in recent years, the replacement of Asian importers that register imports to
Kenyan importers that to not, makes it appear as if exports of RHS had dropped massively.
314 Senior Executive of Leather Association of Tanzania, Dar es Salaam, 11.07.2017; Senior
Executive of Tanzania Tanners Association, Dar es Salaam, 11.07.2017; Leather Promotion Officer
(MoIT), Per Telephone, 11.07.2017; Livestock Officer (MoLF), Dar es Salaam, 14.07.2019; Senior
Executive of Major Tannery, Himo, 18.08.2017.

284
Given this numerical weakness of RHS, the government relatively unconcernedly
increased the tax on RHS and saw no pressure to withdraw it.315 That being said,
RHS traders seem relatively well-connected to relevant Ministry officials and
border officials, helping them to circumvent the ban. Hence, while the argument
appears to gain further traction that primarily large groups can thwart policy
legislation, this case study also shows that smaller groups can sometimes effectively
undermine policy implementation and hereby defend themselves against negative
impacts.
7.3.5. Conclusion of the Tanzanian Raw Hides and Skins Export Tax Case
To conclude, this final case study of the 2012 Tanzanian 90% export tax on RHS
provides further evidence for the thesis argument: African governments are
relatively likely to impose severe export restrictions on ‘bannable’ commodities
which provide a significant income to only a small share of the population. The
claim that RHS production provides a significant income to only a small share of
the Tanzanian population appears surprising at first, given that nearly two million
Tanzanians earn a significant share of their income from keeping livestock. As
evidenced by other studies’ findings and my own survey of 25 Northern Tanzanian
livestock keepers, they do not, however, earn any income from selling RHS (or for
taking care of them). At this stage of the production chain, the commodity RHS is
not yet valued. The actual value chain starts in slaughterhouses and abattoirs.
However, given that the sales of RHS on average account for less than 1% of
slaughterhouses’ and abattoirs’ total sales values, neither can this group be
considered as one gaining significant income from producing that commodity.
The only group in the Tanzanian leather industry that would truly be hurt and
agitated by such a severe export restrictive measure are RHS traders. Counting only
around 2,500 people in Tanzania they posed no numerical threat to the government,
315 It needs to be said, however, that in 2014 the government had shortly reduced the tax back to
60%. According to interviewed government officials, the reason was that they had the feeling the
tax increase had not benefited processors sustainably (due to increased smuggling), while
significantly reducing the revenue from the export tax. Some tanners suggested that this might have
been the result of trader lobbying, although no clear (anecdotal or other) evidence or logic was
provided to support this. In 2015, however, the government together with all EAC member states
decided to re-increase the tax to 80%.

285
however, which could thus implement and maintain the 90% export tax without
fearing any serious consequences. Yet, traders do have considerable connections
into responsible government authorities allowing them to often circumvent the
enforcement of the policy. This demonstrates that the politics of policy-making,
implementation, and enforcement can be very different things and that smaller
groups can in certain cases avoid the fallout of adverse export measures.

286
7.4. Chapter Conclusion
This chapter set out to take a closer comparative look at the three most commonly
banned processable commodities: raw timber logs, metal waste and scraps, and raw
hides and skins. Given that these commodities strongly shape the empirical pattern
motivating the thesis and to a significant extent the findings derived in the large-N
regression analysis, it is critical to study whether the thesis argument does indeed
hold here as well or whether alternative factors can explain their difference to other
(especially agricultural) commodities. More specifically, I studied the explanatory
power of the thesis argument in relation to the 1995 raw log and the 2013 ferrous
waste and scrap export bans in Ghana as well as the 2012 de facto export ban on
raw hides and skins in Tanzania.
As the previous case studies, these too appear to support the theoretical argument
of the thesis. In Ghanaian timber, the government in 1995 implemented an export
ban on all raw logs (except for teak) to promote and protect the domestic processing
industry. As in the case of the Ghanaian and Kenyan nut export bans, domestic log
prices for most species dropped by around 50% within one year of the ban. With
export agents not buying their produce anymore, dedicated logging industries were
clearly aware of and furious about the ban and many of them closed shop (helping
larger foreign-owned integrated timber processors to consolidate the market).
Feeling that they lacked the numerical power to seriously threaten the government,
independent loggers, however, failed to organise any protest against the ban.
Moreover, they were – in stark contrast to all other studied sectors – not supported
by traders. Given that timber export agents were accustomed to trading both raw
logs and semi-processed timber, the ban was less of a shock to them and thus had
no strong motivation to lobby against the ban or try to lead a coalition against it.
The ban is still in power today.
Similarly, following strong lobbying from the steel industry, the Ghanaian
government in 2013 decided to legally ban all exports of ferrous waste and scrap.
Producer and dealer prices dropped significantly, motivating the latter to intensively
lobby and organize collector protest against the ban – again to no avail. As in
timber, the number of collectors was too low (likely around 15,000 collectors in the
whole country) to be of significant political concern to policy-makers.

287
Finally, while similar, the context in raw hides and skins was different at the same
time. Although there are several million livestock keepers in Tanzania, only a
minuscule share of the population earns a significant income from raw hides and
skin production and trade. The reason is that because the actual value of a raw hide
or skin constitutes only around 1% of the value of a whole cow, goat, or sheep,
African livestock keepers de facto do not receive any income from the commodity.
The only actors gaining a significant share of their income from working with raw
hides and skins – apart from tanners of course – are hides and skins collectors and
traders, which in Tanzania represent less than 2,500 people (or 0.005% of the
population). As such, when the Tanzanian government in 2012 decided to impose
a 90% export tax (intended as a de facto ban) on raw hides and skins the only people
(that could be) agitated were hide collectors and traders. Knowing they did not have
the numerical clout to sway the government to lift the policy, traders have mainly
attempted to circumvent it by smuggling a significant share of the national RHS
production to Kenya and overseas.
To conclude, as Kenyan cashew and macadamia nuts, ‘bannable’ commodities that
provide a significant income share to only a small percentage of the population are
prone to banning at export. Consequently, African governments are unlikely to face
the popular backlash faced when banning mass-produced commodities like
Ghanaian cashew, and as such will relatively frequently ban them in the quest to
promoting domestic processing.
288
This thesis set out to study why sub-Saharan African governments restrict certain
economically ‘bannable’ commodity exports more frequently than others. In the
last three decades, governments on the continent have increasingly reverted to
export bans on raw commodities to promote their domestic processing. Out of 36
sub-Saharan African WTO member states covered in my EPTA dataset, 32 had
implemented bans on commodity exports in the time period between 1988 and
2017. And out of a total of 129 commodity export bans, 74% were implemented
after 2000, indicating the recency of this policy tool. Interestingly, however, when
focusing only on the 14 relatively frequently exported African commodities for
which no obvious economic reasons exist why they would or could not be banned
to promote their processing industries (that is, they are ‘bannable’), we still find
significant variation in their propensity to be banned at export. Whereas certain raw
commodities are particularly frequently banned (i.e. timber logs, metal waste and
scrap, as well as raw hides and skins), others like agricultural export crops (e.g.
cashew, cocoa or tea), as well as gold, are barely ever banned.
In this study, I advanced the argument that the group size of producers as well as
the extreme rapidity, severity, and attributability of an export ban’s producer and
trader price distortions are fundamental to explaining the observed empirical
puzzle. Like any industrial or trade policy, export bans essentially distribute income
from one group to another, in this case from producers and traders to processors.
The critical question, however, is whether potential policy losers are likely to
realize an adverse policy has been imposed on them and if so, whether they have
the power to keep the government from doing so. This is often not the case. Many
African farmers, for example, arguably struggled to grasp the extreme degrees to
which their farm gate prices were distorted through marketing boards and
monopsonies in the first decades after independence. Governments were extremely
skilled at maintaining an illusion of stable prices while real prices were decreasing,
and independent traders were barred from marketing and therefore could not inform
producers about the degree of distortions. Export bans, I argue, are different in that
they rapidly and harshly affect both producers and traders. Having the capabilities
and interest to inform producers about the ban and mobilize them against it,

289
producers and traders can build synergetic defence coalitions, balancing their
respective strengths and weaknesses. Crucially, however, I argue that whether the
high likelihood of producers and traders mobilizing against export bans incentivizes
policy-makers to avoid imposing them depends primarily on the numerical power
of producers. Specifically, I claim that where producers constitute a large share of
the population, their protest would pose a considerable threat to the government.
Therefore, I expect policy-makers to avoid targeting mass-produced commodities
– such as most cash crops as well as gold. In contrast, I hypothesized that
governments will be less worried and more likely to ban the export of commodities
that provide a significant income to only a small share of the population – e.g. the
commonly banned commodities like timber logs, metal waste, and raw hides and
skins.
And lastly, while I expected similar mechanisms to hold for high export taxes, I
proposed they would not for low export taxes. Traders can usually pass through the
price distortions resulting from low export taxes to producers and therefore have a
lesser incentive to engage in the costly endeavour of setting up cross-group defence
coalitions between themselves and producers. Producer mobilization is thus less
likely and imposing low export taxes even on large groups poses a low risk to
policy-makers.
The remainder of this conclusion proceeds as follows. First, I will summarize the
key findings from my empirical analysis of the thesis argument. After, I highlight
the key scholarly contributions this thesis makes and suggest possible
considerations for policy-makers that can be derived from it. I conclude by
highlighting areas for further research.

290
Table 8.1. Comparative Overview of Main Case Study Findings
Variables
Chapter 6 Comparison Chapter 7 Comparison
Ghana Kenya Ghana Tanzania
Cashew
(2016)
Cashew
(2009)
Macadamia
(2009)
Timber
(1995)
Metal W&S
(2013) Raw Hides and Skins
(2012)
Condition
Variables
1. High Price
Depression ✓ ✓ (✓) ✓ ✓ (✓)
2. Trader
Facilitation ✓ ✓ ✓ – ✓ ✓
3. High
Attributability ✓ ✓ (✓) ✓ ✓ (✓)
4. Producer
Mobilization ✓ ✓ (✓) (-) ✓ –
Independent
Variable
5. High Comm. Pop.
Share ✓ – – – – –
Dependent
Variable
6. Ban Withdrawal ✓ – – – – –
Source: Own illustration based on findings in Chapter 6 and 7.

291
8.1. Summary of Empirical Findings
To test the thesis argument against competing explanations, the study employed a
mixed-method strategy. First, data on country-commodity-specific export
prohibitions and employment were collected, allowing for a large-N comparative
analysis of over 3,000 country-commodity-years, representing 12 commodities in
36 countries from 1988 to 2017 (depending on the country-commodity). Holding
a large vector of control variables constant and employing simple binary, multilevel
within-between random effect, and three-way fixed effects logit regression models,
this analysis found strong and robust empirical support for the core hypothesis.
Specifically, a one percentage point increase in the share of the working population
gaining significant income from producing a commodity decreases the odds that
the government introduces an export ban on that commodity by at least 75%. In
contrast, an additional multinomial regression analysis of the propensity of facing
different degrees of export taxes and export bans shows that an increase in the
population share increases the odds that the government introduces a low export
tax on a commodity. This is in line with the argument that export taxes are not
visible to producers and that governments are therefore less warry of imposing them
even on larger population groups. Together, these results provide robust evidence
for the argument that governments fear agitating producers who have more to lose
and that know who to blame. Finally, in contrast to recent findings in the regime
type literature, the negative associations between group size and export bans are not
larger in democracies. This supports a growing scholarship arguing that mass
mobilization – even in the rural countryside – is possible in autocracies.
Second, I conducted six in-depth country-commodity case studies employing two
distinct qualitative comparative logics. Chapter 6 compared the 2016 Ghanaian raw
cashew export ban withdrawal with the 2009 Kenyan export ban on raw cashew
and macadamia nuts that persists to this day. Methodologically, this comparison is
interesting as it allowed to hold several potential competing explanations constant
due to the high similarity of the three country-commodities. Moreover, the
Ghanaian cashew ban is one of the very rare cases where a government introduced
a ban on a commodity and withdrew it (almost instantly). This allowed to trace
which events and actions by relevant players in the sector led to the withdrawal of
the ban, and thus to demonstrate the risk of implementing a ban on a large group of

292
producers, and why most governments avoid doing so in the first place. Given that
they strongly shape the empirical pattern motivating the thesis and to a significant
extent the findings derived in the large-N regression analysis, Chapter 7 took a
closer comparative look at the three most commonly banned processable
commodities, namely raw timber logs, metal waste and scraps, and raw hides and
skins. It did so in the context of the bans on raw logs and ferrous scrap in Ghana in
1995 and 2013 respectively, as well as in the context of the 90% export tax
imposition on raw hides and skins in Tanzania in 2012. In sum, all six studied
country-commodities experienced (de facto) export bans, yet only in the Ghanaian
cashew case, the government withdrew it.
As illustrated in Table 8.1 above, each case study probed the key mechanisms
assumed in the theoretical argument. First, it studied whether export bans indeed
severely and rapidly decreased producer (and trader) prices, whether these
decreases were attributed to the government’s doing, whether producers mobilized
against the bans, and whether traders assist them in doing so. Second, each case
analysis also studied whether differences in outcomes – that is, whether a
government withdrew or maintained a ban (as well as implementing it in the first
place) – covaries with the size of the population earning a significant income from
producing or trading the respective raw commodities.
Overall, the comparative analysis of these six commodity sectors provides strong
support for the theoretical argument. In all six cases, the ban led to a severe and
rapid fall of producer prices, usually by around 50%. Except for Ghanaian timber
(where traders also export processed timber and therefore are less incentivized to
agitate loggers), traders in all other five commodities actively helped inform and
collectivize producers against the ban. And again, in each case, the losers of the ban
clearly held the government responsible for the severe price distortions and in four
out of six cases producers mobilized against its policy. Whereas dedicated timber
loggers in Ghana still became aware of the ban since exporters would not buy from
them anymore, they eventually decided not to mobilize against the ban because they
were so few and felt so powerless that they thought to protest was a lost cause. Since
livestock keepers do not lose from restriction of raw hides and skins exports – as
they do not make an income from producing them – they also had no rationale to
protest against the 2012 de facto ban. In contrast, the real losers of the policy – raw

293
hides and skins traders – decided that, given their small group size, lobbying and
bribing relevant officials to avoid the ban was the more promising strategy.
Critically, although each ban saw opposition from producers and/or traders, only in
the case of Ghanaian cashew nuts the ban was withdrawn – within one week of its
implementation. What distinguishes the Ghanaian cashew case from the other five
is that Ghanaian cashew nut growers form a sizeable share of the population, which
demonstrated that their numerical power could pose a significant threat to the
government’s and local politicians’ political survival. The withdrawal of the ban
was thus an attempt by the government to minimize losses at the subsequent
election.
8.2. Scholarly Contributions
The thesis makes significant contributions to the broader political economy of
development literature. First, it joins a growing scholarship bringing back politics
into the renewed study of industrial policy in the Global South, and particularly the
African continent. Importantly, however, while much of this literature is
conceptually and empirically very context-specific (with single or dual case studies
the norm), this thesis adds a more generalized theory and analysis. Context-specific
and in-depth case study work and theorization is indispensable for research on the
politics of industrial policy – and cherished in this study. Nevertheless, it remains
important to also generate more broadly applicable theories going beyond specific
country-sectoral contexts.
The thesis makes three further key theoretical and empirical contributions to
political science. First, it enriches recent research emphasizing that the severity and
attributability of a policy can shape both the collective action incentive and capacity
of those affected and thus the policy’s attractiveness to politicians. Second, it adds
to a growing literature showing that rural mass interests can under certain
circumstances become a credible threat to both democratic and authoritarian
governments. Importantly, these circumstances usually entail the implementation

294
of policies very harsh and visible to the masses. Not only does this further push the
first point regarding the relevance of policy attributability and severity. It also raises
the question of whether severe price distortions pre-SAPs were possible because
they were induced by less visible policy tools such as marketing boards, which are
less available to policy-makers today. The thesis makes this argument and provides
anecdotal evidence, for example from the Kenyan nut case studies to support it.
And finally, the finding that usually competing commodity traders and producers
coalesce to overcome their respective weaknesses and collective action problems
adds significantly to a growing literature showing the importance of cross-actor
coalitions in the politics of successful group mobilization.
Finally, the thesis also contributes to our understanding of the economics of
development. Most importantly, the EPTA dataset promises to open doors into
more rigorous quantitative research on the economics of export prohibitions and
taxes in Africa. This has already allowed creating the first comprehensive overview
of the economic feasibility and sensibility of implementing export bans, a starting
point for further research along these lines. And lastly, the thesis provides a rich
documentation of six attempts by African governments to promote commodity
processing industries, furthering our understanding of the opportunities as well as
obstacles they face in doing so.
8.3. Policy Implications
The policy implications that can be derived directly from the core thesis findings
are limited. Essentially, the main implication for policy-makers and those
consulting them would be not to impose bans on raw commodities if they are
produced by many, as this poses significant political risks. Obviously, this
recommendation is rather redundant. Policy-makers already heed this advice, hence
the observed pattern across bannable commodities that motivated this thesis in the
first place.

295
Nevertheless, the dissertation more generally does generate several important
economic policy implications. First, export bans can be made more socially
sustainable. To assure that domestic processors do not overexploit the power
obtained through a ban and pay producers only very low prices, governments need
to set up a relevant regulatory framework prior to implementing bans. Apart from
supporting producers to set up their own representative associations and building
consultative committees with key actors across the value-chain, governments
should implement fair minimum producer prices. Negotiated between producer and
processor representatives and mediated by state officials in said committees, these
prices need to be oriented towards international prices. If they are not, then the
Kenyan cashew case shows how processors might keep on paying the same
minimum price for a decade, although global prices have more than tripled in the
same period (a strategy also successfully implemented by marketing boards).
Moreover, governments need to build strong mechanisms to monitor adherence to
the minimum price and implement transparent punishments when processors do
not. The thesis’ case studies also show, however, that were producers are relatively
weak (and thus more likely to face export bans in the first place) governments are
also less likely to enforce minimum prices.
Second, the thesis raises concerns about the adequacy of export bans as a processing
promotion tool. In the six studied country-commodity sectors export bans have
clearly led to the increase of processing activities. The question is, however,
whether they can do so sustainably. Against their initial promises, governments
rarely monitor and adjust bans and other export measures over time. Once locked-
in, bans are rarely loosened or scrapped. And while it is important to provide infant
industries with a protective space in which they can prosper and become globally
competitive, if they are not given the incentive or means to do so, it is questionable
they will. Specifically, many of the constraints that hinder competitiveness – such
as high-interest loans, inadequate human capital, or marketing difficulties – will not
be solved through a ban. They require more targeted industrial policies. African
governments tend to avoid these, however, as they require significant funding and
state capacity – scarce resources which export bans do not require.
Low to medium export taxes might be a more sensible alternative in many cases.
Apart from being more feasible politically, they also have attractive potential
296
economic effects. On the one hand, they provide processors with some protection,
but not so much as to get too complacent. On the other, they generate revenues that
can be used for supporting both producers and processors. Cashew processors in
Côte d’Ivoire, for example, are paid direct subsidies per shelled volume and granted
access to subsidized loans via export tax-generated funds. Furthermore, capable
regulatory boards that can organize trainings and help seek foreign markets could
be funded. And since raw commodities are the key inputs for processing, producers
could also be supported through subsidized inputs, extension services, or improved
infrastructure, all funded by the tax revenue. This could potentially create a win-
win rather than a zero-sum game for all parties involved. Obviously, however,
whether such funds will be adequately used rather than getting lost in unrelated
venues is critical to the attractiveness of this approach. While initial evidence from
the Ivorian cashew case appears to show that such funds can be productively used,
the same does not appear to hold for revenue generated by the 15% export tax
imposed on Tanzanian cashews. Arguably, however, it is still significantly less
damaging to producers than an outright export ban would be (though also not as
beneficial to processors).
8.4. Areas for Further Research
The thesis sets the ground for further research in several areas. Perhaps the most
obvious next step would be to expand the EPTA dataset beyond Africa and test the
thesis argument across a wider set of cases. Before doing so, it might, however, also
be sensible to use the dataset in its current scope to analyse the economic
implications of export bans more thoroughly. When and where do they successfully
promote domestic processing? How strongly do they affect prices (also in
comparison to export taxes) and do such effects vary systematically across
commodities? And when do such price distortions push producers to abandon
production? The EPTA dataset allows and motivates addressing these and related
questions.

297
Simultaneously, it is also worth looking more into the import side of manufacturing
promotion. Import substitution is experiencing a renaissance among African
governments and it would be interesting to study how the thesis argument fares in
explaining patterns thereof. Preliminary anecdotal thesis evidence indicates that it
might. Specifically, the Tanzanian government has been considering imposing
more restrictive import tariffs on (primarily Asian) shoe imports to promote the
domestic leather manufacturing industry for several years. However, the clear
losers of such a policy would be the mass of shoe consumers, which far exceeds the
number of its potential winners. Warry of the wrath of consumers, the government
has to date refrained from imposing more severe import restrictions. Whether this
represents a more general pattern needs to be studied in more depth and breadth.
Moreover, the thesis motivates more research into the politics of rural mobilization
and agricultural price distortions. Other than in the context of export bans, under
what conditions can African peasants overcome their collective action problems
and pose a threat to their governments? While the case studies provide first
important evidence, more research needs to be conducted on how well-known the
degree of price distortions was among farmers prior and past SAPs, and whether
the low visibility thereof through marketing boards was in fact key to explaining
why peasants did not revolt against them. This also applies to food staples and
export bans more specifically. I have argued in Chapter 3.1.2 that food staples are
frequently banned despite having many producers: first, because these producers
cannot be considered real losers from export bans, second, because real losers
(traders and speculators) are few, third, because even if commercial food staple
producers were losers, they are still significantly fewer in numbers than food staple
consumers, the winners of such a policy. These arguments deserve more rigorous
analysis.
Similarly, the importance of policy attribution and severity requires broader
research. Recent analyses of the politics of public service provision – and now this
study on industrial and trade policy – have provided strong evidence that these
characteristics have a significant impact on policy-making and feedback thereto. In
the future, political economist should test whether similar patterns hold in other
policy domains and past research should be actively re-assessed considering these
variables.

298
Lastly, future research could help overcome some of this thesis’ limitations. Ideally,
the quantitative analysis should be replicated with profit margin data as control and
more precise labour statistics as a basis for the population share variable, provided
these are generated soon. Second, more case study work on export taxes is required.
Given the thesis’ primary focus on export bans, export taxes were neglected in its
qualitative comparative analysis. The short discussion in Chapter 3.1.2 of the
Beninese and Ivorian imposition of low export taxes on raw cashew nuts shows that
the theoretical argument might have traction there, but this requires deeper analysis.
Specifically, the questions need to be studied whether traders really abstain from
informing producers because they can pass through price distortions and whether
producers really did not mobilize against low export taxes, either because they did
not realize its introduction or because they saw it as acceptable.
To conclude, this thesis has contributed to bringing more clarity to the complex
politics of industrial policy in the Global South. Using mixed-methods, it
demonstrated that even large groups can, under extreme policy severity and through
cross-group coalitions, successfully engage in collective action. Hereby, it
illustrated that generating relatively parsimonious and generalist theories remains
possible and valuable in a literature that in recent years has (often rightly) heralded
the context-sensitivity and idiosyncrasy of the politics of industrial and trade policy
in the Global South. Furthermore, through its new theoretical arguments and an
original dataset on export bans and taxes in Africa, the thesis has paved the road for
more rigorously theorized and measured future research on the economics and
politics of industrial policy. Considering Africa’s and arguably the globe’s
industrial policy renaissance, the need for such research is great.

299
References
The Finder Online (24.05.2016) ‘9,000 to lose jobs in steel manufacturing
companies’. Found at:
https://www.ghanaweb.com/GhanaHomePage/business/9-000-to-lose-jobs-in-
steel-manufacturing-companies-441486. Last checked on 29.05.2019.
La Conceria (24.09.2018) ‘A public tannery to open in Kenya to save hides: a 10
million euro investment’. Found at: https://www.laconceria.it/en/tannery/a-
public-tannery-to-open-in-kenya-to-save-hides-a-10-million-euro-investment/.
Last checked on 24.11.2019.
Abbott, J.C. (1967) ‘Agricultural Marketing Boards in the Developing Countries’,
Journal of Farm Economics 49(3): 705. DOI: 10.2307/1236903.
Abebe, T.N. (2016) ‘Review of Sesame Value Chain in Ethiopia’, International
Journal of African and Asian Studies 19.
Abubakar, R.M. (28.08.2013) ‘Steel Manufacturers Appeal To Ministry’, Daily
Guide. Found at: https://www.modernghana.com/news/485511/steel-
manufacturers-appeal-to-ministry.html. Last checked on 29.05.2019.
ACET The Agro-Processing Opportunity in Cotton.
ACi (2010) A Value Chain Analysis of the Cashew Sector in Ghana. Found at:
http://africancashewinitiative.org/imglib/downloads/ACI_Ghana_high.pdf.
Last checked on 02.12.2018.
ACi (2013) Ghana - Country Report 2013. Promoting Competitiveness of African
Cashew Farmers. Found at:
http://www.africancashewinitiative.org/imglib/downloads/130724_BMZ%20C
ountry%20Report_GH_EN.pdf. Last checked on 02.12.2018.
ACi; DANIDA; Ministry of Food and Agriculture of Ghana (2015) Background
Information for Stakeholder Workshop on Cashew Master Plan Development.
Found at: Unpublished, available from author on request.

300
Adagba, M. A. (2014) Expanding Export Of Sesame Seed And Sheanut/Butter
Through Improved Sps Capacity Building For Public And Private Sector.
Socio-Economic Characterisation Of Sesame Value Chain In Nigeria. Found
at: http://www.standardsfacility.org/sites/default/files/PG_172_Annex_C-
_Socio-eco_characterisation_of_sesame_seed_value_chain_in_Nigeria.pdf.
Last checked on 26.02.2019.
Addaquay, John (2016) 10-Yr Cashew Development Plan. Draft Concept.
Adeniran, T. (1974) ‘The Dynamics of Peasant Revolt’, Journal of Black Studies
4(4): 363–375. DOI: 10.1177/002193477400400401.
Adombila, M.A. (07.01.2015) ‘Ghana targets 150,000 tonnes of cashew nuts —
By 2025’, Graphic Online [Accra, Ghana. Found at:
http://www.graphic.com.gh/business/business-news/ghana-targets-150-000-
tonnes-of-cashew-nuts-by-2025.html. Last checked on 02.12.2018.
Africa Intelligence (17.12.2013) ‘Shake-up in unrefined gold exports in 2015’,
Africa Intelligence. Found at:
https://www.africaintelligence.com/ama/exploration--
production/2013/12/17/shake-up-in-unrefined-gold-exports-in-
2015,107999693-eve. Last checked on 17.05.2019.
Afrochine Smelting P/L (2019) ‘Overview’.
Agbley, G. (2016) ‘The Challenges Faced by Ghana Cashew Processing and the
Ways to Resolve It’, in Special edition to celebrate the 10th ACA Conference
(September 19-22, 2016), Guinea Buissa, 27–29.
Agriculture, Fisheries & Food Authority (2016) Rapid Urbanization and Upsurge
in Mosquito Vectors: A Market Opportunity for Innovative Pyrethrum
Products. Nairobi.
Agriculture, Fisheries & Food Authority (Kenya) (2014) AFFA Year Book of
Statistics 2014. Found at: http://www.agricultureauthority.go.ke/wp-
content/uploads/2016/03/AFFA-Year-Book-of-Statistics-2014.pdf. Last
checked on 08.10.2017.

301
Aksoy, M.A. and Yagci, F. (2012) ‘Mozambique Cashew Reforms Revisited’, in
Aksoy, M.A. (ed) African agricultural reforms. The role of consensus and
institutions. Washington, D.C.: World Bank, 177–218.
Alam, S. M. Shamsul (2007) Rethinking Mau Mau in colonial Kenya. New York,
N.Y: Palgrave Macmillan.
Allison, Paul D. (2009) Fixed effects regression models. Los Angeles, London,
New Delhi, Singapore, Washington DC: Sage.
Altenburg, Tilman; Lütkenhorst, Wilfried (2015) Industrial policy in developing
countries. Failing, markets, weak states. Cheltenham, UK: Edward Elgar
Publishing.
Amankwaa, E.F. (2013) ‘Livelihoods in risk: exploring health and environmental
implications of e-waste recycling as a livelihood strategy in Ghana’, The
Journal of Modern African Studies 51(4): 551–575. DOI:
10.1017/S0022278X1300058X.
Amir, H. (2013) ‘Export Restrictions on Critical Minerals and Metals: A CGE
Approach’, The International Journal of Economic Policy Studies 8(1).
Amoah, M., Becker, G. and Nutto, L. (2009) ‘Effects of log export ban policy and
dynamics of global tropical wood markets on the growth of timber industry in
Ghana’, Journal of Forest Economics 15(3): 167–185. DOI:
10.1016/j.jfe.2008.04.001.
Amoah, Osei Bonsu (2013) ‘Report of the Committee on Subsidiary Legislation
on the Ferrous Scrao Metals (Prohibition of Export Regulations, 2013 (L.I.
2201)) 25th March, 2013’. Found at: http://ghanatrade.com.gh/Stock-
News/report-of-the-committee-on-subsidiary-legislation-on-the-ferrous-scrao-
metals-prohibition-of-export-regulations-2013-li-2201-25th-march-2013.html.
Anania, Giovanni (2013) Agricultural Export Restrictions and the WTO. What
Options do Policy-Makers Have for Promoting Food Security?
Anderson, K. (ed) (2009) Distortions to agricultural incentives in Africa.
Washington DC: World Bank.

302
Anderson, K. (2010a) ‘Introduction’, in Anderson, K. (ed) The political economy
of agricultural price distortions. Cambridge: Cambridge University Press.
Anderson, K. (ed) (2010b) The political economy of agricultural price distortions.
Cambridge: Cambridge University Press.
Anderson, Kym; Valenzuela, Ernesto (2011) ‘Estimates of Distortions to
Agricultural Incentives (EDAI) 1955-2007’. Found at:
http://microdata.worldbank.org/index.php/catalog/388/study-
description#page=accesspolicy&tab=study-desc.
APA News (01.02.2017) ‘Guinea suspends export of foodstuffs’ [Dakar. Found
at: http://www.thepatrioticvanguard.com/guinea-suspends-export-of-foodstuffs.
Last checked on 15.04.2019.
APLF (2011) ‘Africa: Hide and skin export policy divided in East African
Community’. Found at: http://www.aplf.com/en-us/leather-fashion-news-and-
blog/news/8227/africa-hide-and-skin-export-policy-divided-in-east-african-
community.
APLF (2014) ‘Tanzania - Raw material export ban requested to protect tanners’.
Aragie, Emerta; Pauw, Karl; Pernechele, Valentina (2016) Achieving food
security and industrial development in Malawi: Are export restrictions the
solution?
Arnoldus, Michiel (2019) ‘Peanut Industry in Africa’. Found at:
http://timeforsense.com/our-work-sense/peanut-industry-in-africa/.
Asamoah Adam, K., Pinard, M. and Swaine, M.D. (2006) ‘Nine Decades of
Regulating Timber Harvest from Forest Reserves and the Status of Residual
Forests in Ghana’, International Forestry Review 8. DOI: 10.1505/ifor.8.3.280.
Asmarini, W. (23.12.2014) ‘Freeport should build two new Indonesia copper
smelters by 2020 -govt’, Reuters. Found at:
https://www.reuters.com/article/indonesia-freeport/freeport-should-build-two-
new-indonesia-copper-smelters-by-2020-govt-idUSL3N0U71ZD20141223.
Last checked on 25.04.2019.

303
Asumadu, K. (2004) Development Of Wood-Based Industries In Sub-Saharan
Africa. East Brighton, Australia. Found at:
http://www.afforum.org/sites/default/files/English/English_126.pdf. Last
checked on 28.05.2019.
Ayarkwa, J. and Addae-Mensah, A. (1999) ‘Processing Of Small Diameter Logs:
Effect Of Log Diameter, Sawing Pattern And Some Bole Variables On Lumber
Recovery’, Ghana Journal of Forestry 8.
Babu, Suresh Chandra (2013) ‘Policy Process and Food Price Crisis’. Helsinki,
Finland: UNU-WIDER2013(070).
Banful, A.B. (2011) ‘Old Problems in the New Solutions?: Politically Motivated
Allocation of Program Benefits and the “New” Fertilizer Subsidies’, World
Development 39(7): 1166–1176. DOI: 10.1016/j.worlddev.2010.11.004.
Barbier, E.B. and Rauscher, M. (1994) ‘Trade, tropical deforestation and policy
interventions’, Environmental & Resource Economics 4(1): 75–90. DOI:
10.1007/BF00691933.
Bargawi, Hannah; Ferrigno, Simon; G Ratter, Saro; Ton, Peter; Vodouhe,
Simplice; Williamson, Stephanie; Wilson, John (2019) The Institutional
Challenge in Tanzania's Cotton Sector. Lessons from Southern India, Burkina
Faso and from History. Found at:
https://www.researchgate.net/publication/265265050_The_Institutional_Challe
nge_in_Tanzania's_Cotton_Sector_Lessons_from_Southern_India_Burkina_Fa
so_and_from_History. Last checked on 26.02.2019.
Barry, James (2019) The Mineral Industry of Zimbabwe 2015. Found at:
https://prd-wret.s3-us-west-
2.amazonaws.com/assets/palladium/production/atoms/files/myb3-2015-zi.pdf.
Bassett, T.J., Koné, M. and Pavlovic, N.R. (2018) ‘Power Relations and
Upgrading in the Cashew Value Chain of Côte d'Ivoire’, Development and
Change 49(5): 1223–1247. DOI: 10.1111/dech.12400.

304
Bates, R. and Block, S. (2010) ‘Agricultural Trade Interventions in Africa’, in
Anderson, K. (ed) The political economy of agricultural price distortions.
Cambridge: Cambridge University Press.
Bates, R.H. and Block, S.A. (2013) ‘Revisiting African Agriculture: Institutional
Change and Productivity Growth’, The Journal of Politics 75(2): 372–384.
DOI: 10.1017/S0022381613000078.
Bates, Robert; Block, Steven (2009) Political Economy of Agricultural Trade
Interventions in Africa.
Bates, Robert H. (1981) Markets and States in Tropical Africa. The Political Basis
of Agricultural Policies. Berkeley: University of California Press.
Bates, Robert H. (1983) Essays on the political economy of rural Africa.
Cambridge [U.K.], New York: Cambridge University Press.
Batley, R. and Mcloughlin, C. (2015) ‘The Politics of Public Services: A Service
Characteristics Approach’, World Development 74: 275–285. DOI:
10.1016/j.worlddev.2015.05.018.
Beck, Linda Jane (2008) Brokering democracy in Africa. The rise of clientelist
democracy in Senegal. New York: Palgrave Macmillan.
Beck, N. and Katz, J.N. (2001) ‘Throwing Out the Baby with the Bath Water: A
Comment on Green, Kim, and Yoon’, International Organization 55(2): 487–
495. DOI: 10.1162/00208180151140658.
Beck, T., Clarke, G., Groff, A., Keefer, P. and Walsh, P. (2001) ‘New Tools in
Comparative Political Economy: The Database of Political Institutions’, The
World Bank Economic Review 15(1): 165–176.
Beckman, J., Estrades, C. and Aguiar, A. (2019) ‘Export taxes, food prices and
poverty: A global CGE evaluation’, Food Security 40(1): 36. DOI:
10.1007/s12571-018-0876-2.
Bediako, J. (30.07.2012) ‘Local steel industry collapsing…as illegal export of
ferrous scrap booms …and new legislation to stem tide goes AWOL’,

305
Ghanaian Chronicle. Found at:
https://www.modernghana.com/news/408733/1/local-steel-industry-
collapsingas-illegal-export-o.html. Last checked on 31.05.2019.
Behuria, P. (2015) ‘Between Party Capitalism and Market Reforms:
Understanding Sector Differences in Rwanda’, The Journal of Modern African
Studies 53(3): 415–450. DOI: 10.1017/S0022278X15000403.
Beja, P. (18.11.2009) ‘Nut farmers earnings drop after minister bans exports’,
Standard Digital [Nairobi, Kenya. Found at:
https://www.standardmedia.co.ke/article/1144028585/nut-farmers-earnings-
drop-after-minister-bans-exports. Last checked on 07.11.2018.
Bell, A., Fairbrother, M. and Jones, K. (2019) ‘Fixed and random effects models:
making an informed choice’, Quality & Quantity 53(2): 1051–1074. DOI:
10.1007/s11135-018-0802-x.
Bermúdez-Lugo, Omayra (2018) The Mineral Industry of Ghana 2015. Found at:
https://prd-wret.s3-us-west-
2.amazonaws.com/assets/palladium/production/atoms/files/myb3-2015-gh.pdf.
Last checked on 19.09.2019.
Besley, T. (1997) ‘Monopsony and Time-Consistency: Sustainable Pricing
Policies for Perennial Crops’, Review of Development Economics 1(1): 57–70.
DOI: 10.1111/1467-9361.00005.
Bhagwati, J.N. and Krueger, A.O. (1973) ‘Exchange Control, Liberalization, and
Economic Development’, The American Economic Review 63(2): 419–427.
DOI: 10.2307/1817105.
Bienen, H. (1990) ‘The politics of trade liberalization in Africa’, Economic
Development & Cultural Change 38(4): 713.
Birikorang, Gene (2001) Ghana Wood Industry & Log Export Ban Study.
Forestry Commission Report to the Ministry of Lands and Forestry. Available
from author on demand.

306
Boadu, K.A. (20.04.2018) ‘Save timber industry from collapse - GTMO cautions
gov't’, Graphic Online. Found at:
https://www.graphic.com.gh/business/business-news/save-timber-industry-
from-collapse-gtmo-cautions-gov-t.html. Last checked on 27.05.2019.
Board of External Trade (2004) Tanzania Export Development Strategy Leather
Sector. Found at:
https://www.google.com/url?sa=t&rct=j&q=&esrc=s&source=web&cd=1&cad
=rja&uact=8&ved=0ahUKEwjgkJWTsvXUAhXIMhoKHUszB3sQFggmMAA
&url=http%3A%2F%2Fwww.intracen.org%2FWorkarea%2FDownloadAsset.a
spx%3Fid%3D69238&usg=AFQjCNEcKQpEgt0GGs1u1ppa41CZ6L0Azg.
Last checked on 06.07.2017.
Boateng, M. (21.03.2016) ‘Spio Garbrah Galls Cashew Farmers’, Ghanaian
Chronicle [Accra, Ghana. Found at:
http://allafrica.com/stories/201603220805.html. Last checked on 02.12.2018.
Boone, Catherine (1992) Merchant capital and the roots of state power in Senegal,
1930-1985. Cambridge: Cambridge University Press.
Boone, Catherine (2003) Political topographies of the African state. Territorial
authority and institutional choice. Cambridge: Cambridge University Press.
Bouët, A., Estrades, C. and Laborde, D. (2014) ‘Differential Export Taxes along
the Oilseeds Value Chain: A Partial Equilibrium Analysis’, American Journal
of Agricultural Economics 96(3): 924–938. DOI: 10.1093/ajae/aau011.
Branch, D. (ed) (2010) Our turn to eat. Politics in Kenya since 1950. London, UK:
Lit Verlag.
British Geological Survey (2017) ‘World Mineral Production 2012-2016’. Found
at: http://www.bgs.ac.uk/mineralsUK/statistics/worldStatistics.html.
Broni-Sefah, Kwasi (2012) A Study Of The Scrap Metal Trade In The Kumasi
Metropolitan Area. Kumasi, Ghana.
Brooks, Jonathan; Croppenstedt, Andre; Aggrey-Fynn, Emmanuel (2007)
Distortions to Agricultural Incentives in Ghana. Found at:

307
http://siteresources.worldbank.org/INTTRADERESEARCH/Resources/544824
-1146153362267/Ghana_0708.pdf. Last checked on 22.09.2019.
Buechel, Virigina (2019) ‘The Basics of Recycling Scrap Metal for Money’.
Found at: https://earth911.com/eco-tech/basics-recycling-scrap-metal-money/.
Buhaug, H. and Rød, J.K. (2006) ‘Local determinants of African civil wars, 1970–
2001’, Political Geography 25(3): 315–335. DOI:
10.1016/j.polgeo.2006.02.005.
Bulawayo 24 News (20.12.2013) ‘Zimbabwe bans unrefined gold exports,
introduce 'heavy' tax on minerals’. Found at: https://bulawayo24.com/index-id-
business-sc-economy-byo-40507-article-
Zimbabwe+bans+unrefined+gold+exports,+introduce+'heavy'+tax+on+mineral
s.html. Last checked on 17.05.2019.
Burgess, R., Jedwab, R., Miguel, E., Morjaria, A. and Padró i Miquel, G. (2015)
‘The Value of Democracy: Evidence from Road Building in Kenya’, American
Economic Review 105(6): 1817–1851. DOI: 10.1257/aer.20131031.
CAADP (2013) Zambia Agriculture Investment Opportunities Brief. Found at:
https://www.abghq.com/downloads/Zambia.pdf. Last checked on 22.09.2019.
Callaghy, Thomas M. (1984) The State-Society Struggle. Zaire in comparative
perspective. New York: Columbia University Press.
Camara, O. (27.11.2018) ‘Guinea Bauxite Miner to Build New Railway in $3
Billion Deal’, Bloomberg. Found at:
https://www.bloomberg.com/news/articles/2018-11-26/guinea-bauxite-miner-
to-build-rail-refinery-in-3-billion-deal. Last checked on 24.11.2019.
Reuters (04.11.2008) ‘Cargill opens Ghana cocoa processing plant’. Found at:
https://www.reuters.com/article/cocoa-ghana-cargill/cargill-opens-ghana-
cocoa-processing-plant-idUSL43880620081104. Last checked on 24.11.2019.
Carter, D.B. and Signorino, C.S. (2010) ‘Back to the Future: Modeling Time
Dependence in Binary Data’, Political Analysis 18(03): 271–292. DOI:
10.1093/pan/mpq013.

308
Central Intelligence Agency (2019) ‘Library: Ghana’. Found at:
https://www.cia.gov/library/publications/resources/cia-maps-
publications/Ghana.html.
Centre d'Echange d'Informations du Burundi (2014) ‘Compagnie de Gérence du
Coton (COGERCO)’. Found at: http://bi.chm-
cbd.net/implementation/programmes-thematiques/biodiversite-agricole-
1/institutions-agricoles-au-burundi/institutions-etatiques/compagnie-de-
gerence-du-coton-cogerco.
Chapoto, Antony (2012) The Political Economy of Food Price Policy. Helsinki,
Finland. Found at: https://www.wider.unu.edu/project/political-economy-food-
price-policy. Last checked on 02.12.2018.
China, C.R. and Ndaro, M.S. (2015) ‘A Study on Leather Sector Investment
Status in Tanzania’, African Journal of Science and Research 4(6): 19–22.
Chou, Allan (2019) ‘Allan Chou: 37 Years in Ghana’. Found at: https://chou.net/.
Ciuri, S. (13.07.2015) ‘Thika macadamia nuts processor pays Sh350m bonus to
farmers Search’, Business Daily Africa [Nairobi, Kenya. Found at:
http://www.businessdailyafrica.com/corporate/Thika-macadamia-nuts-
processor-pays-Sh350m-bonus-to-farmers-/539550-2787878-
58daqdz/index.html. Last checked on 28.10.2017.
Clark, Nancy (1994) Forestry in Ghana. A Country Study: Ghana. Found at:
https://www.loc.gov/collections/country-studies/about-this-collection/. Last
checked on 26.06.2019.
Coakley, George (1995a) The Mineral Industry of Ghana. Found at: https://s3-us-
west-2.amazonaws.com/prd-wret/assets/palladium/production/mineral-
pubs/country/1995/9213095.pdf. Last checked on 19.09.2019.
Coakley, George (1995b) The Minieral Industry of Madagascar. Found at:
https://s3-us-west-2.amazonaws.com/prd-
wret/assets/palladium/production/mineral-pubs/country/1995/9223095.pdf.
Last checked on 19.09.2019.

309
Cocks, T. and Aboa, A. (17.08.2010) ‘Ivory Coast eyes position as top cocoa
grinder’, Reuters. Found at: https://www.reuters.com/article/cocoa-ivorycoast-
grinding-idAFCOC74169820100817. Last checked on 24.11.2019.
ComCashew (2016) The ComCashew News Bulletin. Cashew Policies and
Review of Harvest Season. Found at:
http://africancashewinitiative.org/imglib/ComCashew_Newsbulletin_Edition%
206_September%202016_Eng_Print.pdf. Last checked on 02.12.2018.
ComCashew (2017) The ComCashew News Bulletin. Cashew Harvest Season and
Sector Organisation. Found at:
http://afrika.brainbooking.com///imglib/downloads/ComCashew%20News%20
Bulletin%20Edition%208.pdf. Last checked on 02.12.2018.
Cooper, Frederick (2002) Africa since 1940. The past of the present. Cambridge:
Cambridge University Press.
Cordes, Kaitlin; Östensson, Olle; Toledano, Perrine (2016) Employment from
Mining and Agricultural Investments. How Much Myth, How Much Reality?
Found at: http://ccsi.columbia.edu/files/2016/07/Jobs-Paper-Aug-2.pdf. Last
checked on 05.08.2018.
Cramer, C. (1999) ‘Can Africa Industrialize by Processing Primary
Commodities?: The Case of Mozambican Cashew Nuts’, World Development
27(7): 1247–1266. DOI: 10.1016/S0305-750X(99)00053-4.
CTGN (2015) ‘Chinese company brings Ethiopia’s leather industry to life’. Found
at: https://www.youtube.com/watch?v=qkdSR2m8vzs.
Curnow, R. (29.10.2010) ‘Refinery leads Uganda's plans to clean up gold
exports’, CNN. Found at:
http://edition.cnn.com/2010/WORLD/africa/10/28/uganda.gold/index.html.
Last checked on 24.11.2019.
Curtis, Mark (2010) Developing the Leather Sector in Kenya through Export
Taxes: The Benefits of Defying the EU. Found at: http://www2.weed-

310
online.org/uploads/case_study_leather_sector_in_kenya.pdf. Last checked on
23.12.2016.
The Enquirer (12.02.2013) ‘Customs scandal; seized metals missing’. Found at:
https://www.ghanaweb.com/GhanaHomePage/NewsArchive/Customs-scandal-
seized-metals-missing-264787. Last checked on 29.05.2019.
Daily Nation (24.08.2008) ‘Kenya: Ban Cashew Nut Exports, State Told’
[Nairobi, Kenya. Found at: https://allafrica.com/stories/200808250382.html.
Last checked on 07.11.2018.
Daily Nation (13.09.2016) ‘Macadamia farmers in Embu protest delay in payment
by a local nuts buying company’. Found at:
https://www.youtube.com/watch?v=ZCDeC2zPHfY.
Daly, T. (06.09.2018) ‘UPDATE 2-China's Western Mining to launch Qinghai
copper smelter next month -chairman’, Reuters. Found at:
https://af.reuters.com/article/africaTech/idAFL3N1VS1UP. Last checked on
24.11.2019.
Dassah, M.O. (2017) ‘New Public Management Issues in Ghana’, in Basheka,
B.C. and Tshombe, L.-M. (eds) New Public Management in Africa. Emerging
Issues and Lessons. Milton: Taylor and Francis.
Deacon, R.T. (1995) ‘Assessing the Relationship between Government Policy and
Deforestation’, Journal of Environmental Economics and Management 28(1):
1–18. DOI: 10.1006/jeem.1995.1001.
Dean, J.M. (1995) ‘Export Bans, Environment, and Developing Country Welfare’,
Review of International Economics 3(3): 319–329. DOI: 10.1111/j.1467-
9396.1995.tb00074.x.
Delpeuch, C. and Leblois, A. (2013) ‘Sub-Saharan African Cotton Policies in
Retrospect’, Development Policy Review 31(5): 617–642. DOI:
10.1111/dpr.12028.
Denkye, K.B. (20.03.2016) ‘Ban on cashew export not govt policy – Asiedu
Nketia’, Adom News. Last checked on 30.06.2017.

311
Department of Agriculture, Forestry and Fisheries (Republic of South Africa)
(2016) A Proflie of the South African Macadamia Nut Market Value Chain.
2016. Found at:
http://www.nda.agric.za/doaDev/sideMenu/Marketing/Annual%20Publications
/Commodity%20Profiles/field%20crops/MACADAMIA%20NUTS%20MAR
KET%20VALUE%20CHAIN%20%20PROFILE%202016.pdf. Last checked
on 30.10.2017.
DESA/UNSD (2019) ‘UN Comtrade Database’. Found at:
https://comtrade.un.org/.
Destler, I. M. (1995) American Trade Politics. Washington, D.C.: Peterson
Institute for International Economics.
Development Studies Associates (2008) Project Profile on the Establishment of
Cotton Yarn Marking Plant. Addis Ababa, Ethiopia. Found at:
https://www.academia.edu/4626368/Cotton_Yarn?auto=download. Last
checked on 24.11.2019.
Dibondo, D. (17.08.2018) ‘Meru Macadamia Farmers Want to Sell Their Nuts to
Chinese’, The Star [Nairobi, Kenya. Found at: https://www.the-
star.co.ke/news/2018/08/17/meru-macadamia-farmers-want-to-sell-their-nuts-
to-chinese_c1789706. Last checked on 09.09.2018.
Dinh, Hinh T.; Monga, Célestin (2013) Light Manufacturing in Tanzania. A
Reform Agenda for Job Creation and Prosperity. Washington D.C. Found at:
http://documents.worldbank.org/curated/en/908331468120869324/pdf/808930
PUB0Ligh00Box374313B00PUBLIC0.pdf. Last checked on 18.07.2019.
Diplomatic Call Online (03.12.2015) ‘Cashew Farmers Call For The Protection
Of Cashew Processing Industry’.
DIT Mwanza (2019) ‘About DIT Mwanza Campus’. Found at:
http://webcache.googleusercontent.com/search?q=cache:http://www.ditmwanz
acampus.ac.tz/page13.html.

312
Dodoo, K. (09.05.2018) ‘China partners Ghana to construct $60m cocoa
processing factory’, Joy Online. Found at:
https://www.myjoyonline.com/business/2018/May-9th/china-partners-ghana-
to-construct-60m-cocoa-processing-factory.php. Last checked on 24.11.2019.
Doner, R.F., Ritchie, B.K. and Slater, D. (2005) ‘Systemic Vulnerability and the
Origins of Developmental States: Northeast and Southeast Asia in Comparative
Perspective’, International Organization 59(2): 327–361. DOI:
10.1017/S0020818305050113.
Dudley, R. (2004) ‘Modeling the Effects of a Log Export Ban in Indonesia’,
System Dynamics Review 20. DOI: 10.1002/sdr.288.
Duffuor, Kwabena (2011) Budget Statement and Economic Policy of the
Government of Ghana for the 2011 Financial Year Presented to Parliament on
18th November, 2010. Accra, Ghana. Found at:
https://www.mofep.gov.gh/sites/default/files/budget-
statements/2011_Budget_Speech.pdf. Last checked on 10.07.2019.
Dzirutwe, M. (27.05.2010) ‘Zimbabwe bans diamond exports, Rio affected’,
Reuters. Found at:
https://af.reuters.com/article/investingNews/idAFJOE64Q0RN20100527. Last
checked on 17.05.2019.
Eades, Jeremy S. (1980) The Yoruba Today. Cambridge: Cambridge University
Press.
Ebia, Beletchei (2018) West African Cotton and Global Value Chains. From
Production to Textiles. Durham, North Carolina, USA.
Eduku, P.A. (23.03.2016) ‘Cashew export ban: Processors warn of massive drop
in profits’, citibusinessnews.com.
MUBADALA (11.04.2019) ‘EGA starts production at UAE’s first alumina
refinery in major milestone for industrial sector’. Found at:
https://www.mubadala.com/en/news/ega-starts-production-uae-first-alumina-
refinery. Last checked on 24.11.2019.

313
EIA (2018) African Log Bans Matter. Reforming Chinese Investment and Trade
in Africa’s Forest Sector. Found at: https://content.eia-
global.org/posts/documents/000/000/770/original/AfricanLogBansMatter_High
Res.pdf?1536259188. Last checked on 16.05.2019.
Elkins, Caroline (2005) Britain's gulag. The brutal end of empire in Kenya.
London: Pimlico.
Emery, A.; Gibbs, A.; Griffiths, A.; Myrddin, S.; Williams, K. (2000) Analysis of
Waste Entering a Typical Small Landfill Site in the South Wales Valleys -
Phase 2. Found at:
http://www.resol.com.br/bibliografia/bibliografia3.php?id=2139298629. Last
checked on 09.07.2019.
Engineer Live ‘Chrome production picks up in Madagascar’, Engineer Live.
Found at: https://www.engineerlive.com/content/chrome-production-picks-
madagascar. Last checked on 19.09.2019.
Engwicht, N. (2018) ‘The local translation of global norms: The Sierra Leonean
diamond market’, Conflict, Security & Development 18(6): 463–492. DOI:
10.1080/14678802.2018.1532639.
Business Daily Africa (23.07.2014) ‘EPZ firm eyes second nut factory in Athi
River’ [Nairobi, Kenya. Found at: http://www.businessdailyafrica.com/EPZ-
firm-eyes-second-nut-factory-in-Athi-River/539546-2394978-
11o9c6i/index.html. Last checked on 28.10.2017.
Erixon, Fredrik (2005) Aid and development. Will it work this time? Found at:
https://sarpn.org/documents/d0001461/P1804-
Aid_Development_Erixon_June2005.pdf. Last checked on 16.07.2019.
Eros, J. M.; Candelario-Quintana, Luissette (2006) ‘Mineral Facilities of Africa
and the Middle East’. Found at: https://pubs.usgs.gov/of/2006/1135/.
Espa, Ilaria (2015) Export restrictions on critical minerals and metals. Testing the
adequacy of wto disciplines. Cambridge, United Kingdom: Cambridge
University Press.

314
Essabra-Mensah, E. (03.05.2016) ‘President Mahama vows to support cashew
sector’, B&FT Online [Accra, Ghana. Found at:
http://thebftonline.com/business/economy/18779/presidentmahamavowstos
upportcashewsector.html. Last checked on 02.12.2018.
Esteban, J. and Ray, D. (2008) ‘On the Salience of Ethnic Conflict’, American
Economic Review 98(5): 2185–2202. DOI: 10.1257/aer.98.5.2185.
Estrades, Carmen; Flores, Manuel; Lezama, Guillermo (2017) The Role of Export
Restrictions in Agricultural Trade. Found at:
https://ageconsearch.umn.edu/record/256421/files/IATRC%20CP20%20-
%20Estrades%20%20Flores%20%20Lezama.pdf. Last checked on 05.08.2018.
Evans, Julian (1992) Plantation forestry in the tropics. Tree planting for industrial,
social, environmental, and agroforestry purposes. Oxford: Clarendon Press.
Fairfield, T. (2011) ‘Business Power and Protest: Argentina’s Agricultural
Producers Protest in Comparative Context’, Studies in Comparative
International Development 46(4): 424–453. DOI: 10.1007/s12116-011-9094-z.
FAO (1998) ‘Trade Restrictions on Hides and Skins’. Found at:
http://www.fao.org/unfao/Bodies/CCP/hs/98/w9682e.htm.
FAO (2014a) Agricultural cost of production statistics update on the recent expert
group meeting in Rome and next milestones. Found at:
http://www.fao.org/fileadmin/templates/ess/documents/apcas25/APCAS-14-
13.1-Cost-of-Production.pdf. Last checked on 23.02.2019.
FAO (2014b) State of the World’s Forests. Enhancing the socioeconomic benefits
from forests. Found at: http://www.fao.org/3/a-i3710e.pdf. Last checked on
11.03.2018.
FAO (2015) World statistical compendium for raw hides and skins, leather and
leather footwear 1998-2014. Rome.
FAO (2016) Analyse des incitations par les prix pour le the au Burundi pour la
periode 2005-2014. Série de notes techniques. Found at:
http://www.fao.org/3/a-i5156f.pdf. Last checked on 22.09.2019.

315
FAO (2018a) ‘Data’. Found at: http://www.fao.org/faostat/en/#data.
FAO (2018b) ‘Producer Prices - Annual’. Found at:
http://www.fao.org/faostat/en/#data/PP.
Kenya News Agency (28.06.2016) ‘Farmers petition the government to lift the
export ban of raw macadamia nuts’. Found at:
http://kenyanewsagency.go.ke/en/farmers-petition-the-government-to-lift-the-
export-ban-of-raw-macadamia-nuts/. Last checked on 30.10.2017.
Fliess, Barbara; Gou, Haiying; Mard, Tarja (2012) Taking Stock of Measures
Restricting the Export of Raw Materials. Analysis of OECD Inventory Data.
Fliess, Barbara; Idsardi, Ernst; Rossouw, Riaan (2017) Export controls and
competitiveness in African mining and minerals processing industries. Found
at: https://www.oecd-ilibrary.org/trade/export-controls-and-competitiveness-in-
african-mining-and-minerals-processing-industries_1fddd828-en. Last checked
on 24.09.2019.
FMO (2019) ‘Project Detail - Olam Cocoa Processing Cote D'Ivoire SA’. Found
at: https://www.fmo.nl/project-detail/32467.
Fold, N. (2002) ‘Lead Firms and Competition in 'Bi-polar' Commodity Chains:
Grinders and Branders in the Global Cocoa-chocolate Industry’, Journal of
Agrarian Change 2(2): 228–247. DOI: 10.1111/1471-0366.00032.
Forest Trends (2019) Known Log Export Bans, as of February 2019. Found at:
https://www.forest-trends.org/known-log-export-bans/. Last checked on
16.05.2019.
Forintek Canada Corp. (2007) Community Sawmill Opportunities Study.
Vancouver, Canada. Found at:
https://www.enr.gov.nt.ca/sites/enr/files/reports/community_sawmill_opportun
ities_study.pdf. Last checked on 24.11.2019.
Fourie, Deon (1968) War Potentials of the African States South of the Sahara.
Found at: https://www.africaportal.org/publications/war-potentials-of-the-
african-states-south-of-the-sahara/. Last checked on 09.07.2019.

316
Franck, R. and Rainer, I. (2012) ‘Does the Leader's Ethnicity Matter?: Ethnic
Favoritism, Education, and Health in Sub-Saharan Africa’, American Political
Science Review 106(02): 294–325. DOI: 10.1017/S0003055412000172.
Francois, P., Rainer, I. and Trebbi, F. (2015) ‘How Is Power Shared in Africa?’,
Econometrica 83(2): 465–503. DOI: 10.3982/ECTA11237.
Frieden, Jeffry A. (1991) Debt, development, and democracy. Modern political
economy and Latin America, 1965 - 1985.
Frimpong, E.A. (21.03.2016a) ‘Farmers & buyers mad at new cashew export
directive’, B&FT Online [Accra, Ghana. Found at:
http://thebftonline.com/business/agribusiness/18018/farmers-buyers-mad-at-
new-cashew-export-directive-.html. Last checked on 27.06.2017.
Frimpong, E.A. (29.03.2016b) ‘Cashew price up after revocation of export ban _’,
B&FT Online [Accra, Ghana. Found at:
http://thebftonline.com/business/economy/18150/cashew-price-up-after-
revocation-of-export-ban-.html. Last checked on 30.06.2017.
Fundi, M. (15.07.2014) ‘Macadamia the new green gold for farmers’, The Star.
Found at: https://www.the-star.co.ke/news/2014/07/15/macadamia-the-new-
green-gold-for-farmers_c970449. Last checked on 28.10.2017.
Gaitho, M. (30.05.2011) ‘Ban on export of nuts was meant to exploit farmers, so
why is it still on?’, Daily Nation [Nairobi, Kenya. Found at:
https://www.nation.co.ke/oped/blogs/Ban-on-export-of-nuts-was-meant-to-
exploit-farmers/446672-1172048-dclm5bz/index.html. Last checked on
09.09.2018.
Gardner, Leigh (2012) Taxing colonial Africa. The political economy of British
imperialism. Oxford: Oxford University Press.
Gawande, K. and Bandyopadhyay, U. (2000) ‘Is Protection for Sale?: Evidence
on the Grossman-Helpman Theory of Endogenous Protection’, Review of
Economics and Statistics 82(1): 139–152. DOI: 10.1162/003465300558579.

317
Gebre, S. and Nyambura-Mwaura, H. (24.4.2018) ‘China Macadamia Appetite
Makes Kenya Coffee Farmers Go Nuts’, Bloomberg. Found at:
https://www.bloomberg.com/news/articles/2018-04-24/kenyan-coffee-farmers-
going-nuts-yields-record-macadamia-output. Last checked on 08.09.2018.
Gerring, J. (ed) (2007) Case study research. Principles and practices. Cambridge,
UK, New York: Cambridge University Press.
Ghana News Agency (13.12.2012) ‘Ashanti Recorded the Highest Voter
Turnout’. Found at: http://www.ghananewsagency.org/politics/ashanti-
recorded-the-highest-number-of-voter-turn-out-53844. Last checked on
19.06.2017.
Ghana News Agency (30.01.2013) ‘Ministry remind Ghanaians of ban on ferrous
scrap metal export’. Found at:
http://www.ghananewsagency.org/economics/ministry-remind-ghanaians-of-
ban-on-ferrous-scrap-metal-export-
55704http://www.ghananewsagency.org/economics/ministry-remind-
ghanaians-of-ban-on-ferrous-scrap-metal-export-55704. Last checked on
29.05.2019.
Ghana Office of the Planning Commission (1964) Seven-Year Development Plan.
1964/4 to 1969/70. Found at: https://s3-us-west-2.amazonaws.com/new-ndpc-
static1/CACHES/PUBLICATIONS/2017/11/03/SevenYearDevtPlan.pdf. Last
checked on 09.07.2019.
Ghana Statistical Service (2014a) 2010 Population and Housing Census. District
Analytical Report: Jaman North.
Ghana Statistical Service (2014b) 2010 Population and Housing Census. District
Analytical Report: Jaman South District.
Ghana Statistical Service (2014c) 2010 Population and Housing Census. District
Analytical Report: Techiman North.
Ghana Statistical Service (2014d) 2010 Population and Housing Census. District
Analytical Report: Wenchi. Found at:
318
http://www.statsghana.gov.gh/docfiles/2010_District_Report/Brong%20Ahafo/
WENCHI.pdf.
Ghana Web (09.10.1997) ‘Steel Companies In Tema Appeal To President To
Save Them From Collopsing’. Found at:
https://www.ghanaweb.com/GhanaHomePage/NewsArchive/Steel-Companies-
In-Tema-Appeal-To-President-To-Save-Them-From-Collopsing-2197. Last
checked on 29.05.2019.
Business World (14.10.2017) ‘Ghana’s gold refinery producing below capacity’.
Found at: http://www.businessworldghana.com/ghanas-gold-refinery-
producing-capacity/. Last checked on 24.11.2019.
Ghana News Agency (05.06.2015) ‘Ghana's Steel Industry to Receive Major
Boost’. Found at: http://www.ghana.gov.gh/index.php/media-
center/news/1370-ghana-s-steel-industry-to-receive-major-boost. Last checked
on 29.05.2019.
Githinji, R. (01.03.2017) ‘Kivuti leads protests over Chinese arrests’, The Star.
Found at: https://www.the-star.co.ke/news/2017/03/01/kivuti-leads-protests-
over-chinese-arrests_c1515171. Last checked on 07.11.2017.
Gitonga, L.N., Muigai, A.W.T., Kahangi, E.M., Ngamau, K. and Gichuki, S.T.
(2009) ‘Status of macadamia production in Kenya and the potential of
biotechnology in enhancing its genetic improvement’, Journal of Plant
Breeding and Crop Science 1(3): 49–59.
Gitonga, M. (22.08.2011) ‘Nuts may knock coffee off the high table’, Daily
Nation [Nairobi, Kenya. Found at:
http://www.nation.co.ke/lifestyle/smartcompany/Nuts-may-knock-coffee-off-
the-high-table-/1226-1223332-2lievw/index.html. Last checked on 28.10.2017.
Global Trade Alert (2016) ‘Global Trade Alert’. Found at:
http://www.globaltradealert.org/.
Goger, Annelies; Bamber, Penny; Gereffi, Gary (2014) The Tobacco Global
Value Chain in Low-Income Countries. Found at:

319
https://www.researchgate.net/publication/281749748_The_Tobacco_Global_V
alue_Chain_in_Low-Income_Countries. Last checked on 26.02.2019.
iMPACT NEWS (Kenya) (12.03.2016) ‘Going nuts:Taita-Taveta farmers set to
reap big from macadamia’. Found at: Going nuts:Taita-Taveta farmers set to
reap big from macadamia. Last checked on 28.10.2017.
Grant, R. and Oteng-Ababio, M. (2012) ‘Mapping the Invisible and Real
"African" Economy: Urban E-Waste Circuitry’, Urban Geography 33(1): 1–21.
DOI: 10.2747/0272-3638.33.1.1.
Grant, R. and Oteng-Ababio, M. (2016) ‘The Global Transformation of Materials
and the Emergence of Informal Urban Mining in Accra, Ghana’, Africa Today
62(4): 3. DOI: 10.2979/africatoday.62.4.01.
Graphic Online (05.02.2015) ‘Lift ban on scrap metal exports – Forum’. Found at:
https://www.ghanaweb.com/GhanaHomePage/business/Lift-ban-on-scrap-
metal-exports-Forum-345385. Last checked on 29.05.2019.
Gray, Hazel (2018) Turbulence and order in economic development. Institutions
and economic transformation in Tanzania and Vietnam. Oxford: Oxford
University Press.
Grey, Eva (2017) ‘Arrested development: why Indonesia lifted its mining export
ban’. Found at: https://www.mining-technology.com/features/featurearrested-
development-why-indonesia-lifted-its-mining-export-ban-5760809/.
Grossman, G.M. and Helpman, E. (1994) ‘Protection for Sale’, The American
Economic Review 84(4): 833–850.
Grynberg, Roman (2013) Some Like Them Rough:. The future of Diamond
Beneficiation in Botswana. Found at: http://ecdpm.org/publications/future-of-
diamond-benefication-in-botswana/. Last checked on 29.09.2017.
Gulf Manganese Corporation Limited (2015) Gulf Manganese – Timor Smelter
Update – Licensing. Found at: https://gulfmanganese.com/wp-
content/uploads/2016/07/220615-ASX-Timor-Smelter-Update.pdf. Last
checked on 24.11.2019.

320
Hansen, C.P. and Lund, J.F. (2017) ‘Imagined Forestry: The History of the
Scientific Management of Ghana's High Forest Zone’, Environment and
History 23(1): 3–38. DOI: 10.3197/096734017X14809635325548.
Hansen, C.P. and Treue, T. (2008) ‘Assessing illegal logging in Ghana’,
International Forestry Review 10(4): 573–590. DOI: 10.1505/ifor.10.4.573.
Harding, R. (2015) ‘Attribution and Accountability: Voting for roads in Ghana’,
World Politics 67(04): 656–689. DOI: 10.1017/S0043887115000209.
Harding, R. and Stasavage, D. (2014) ‘What Democracy Does (and Doesn’t Do)
for Basic Services: School Fees, School Inputs, and African Elections’, The
Journal of Politics 76(1): 229–245. DOI: 10.1017/S0022381613001254.
HarvestChoice (2016) Crop Production: SPAM. Found at:
https://harvestchoice.org/products/data-rescue/data. Last checked on
05.08.2018.
Heinrich, Melina (2012) Case study of the African Cashew Initiative – Focus:
Ghana.
Helleiner, G.K. (1977) ‘The Fiscal Role of Marketing Boards in Nigeria's
Economic Development 1947-1961’, in Konczacki, Z.A. and Konczacki, J.M.
(eds) An economic history of tropical Africa. Volume Two : The Colonial
Period. London: Cass.
Herbling, D. (05.03.2012) ‘Trucks impounded in Nairobi for smuggling nuts’,
Business Daily Africa [Nairobi, Kenya. Found at:
http://www.businessdailyafrica.com/corporate/Trucks-impounded-in-Nairobi-
for-smuggling-nuts-/539550-1360164-n0rolw/index.html. Last checked on
31.10.2017.
Hetzel, Andrew (2016) Timor-Leste Coffee Industry Association Analysis. Found
at: https://coffeestrategies.com/wp-content/uploads/2015/12/timor-report-final-
may-16.pdf. Last checked on 10.11.2017.
Hillman, A.L. (1982) ‘Declining Industries and Political-Support Protectionist
Motives’, The American Economic Review 72(5): 1180–1187.
321
Hillman, A.L. (1992) ‘International trade policy: Benevolent dictators and
optimizing politicians’, Public Choice 74(1): 1–15.
Hoffman, Barak (2013) Political Economy of Rice in Sierra Leone (AAAE
conference draft).
Hopkins, Anthony Gerald (1973) An economic History of West Africa. New
York: Columbia University Press.
Hu, T.-w. and Lee, A.H. (2015) ‘Tobacco control and tobacco farming in African
countries’, Journal of public health policy 36(1): 41–51. DOI:
10.1057/jphp.2014.47.
Hub Rural (2006) Côte d'Ivoire Youth Reinsertion Opportunities Study. Cashew
Value Chain Analysis. Found at:
http://hubrural.org/IMG/pdf/ci_cashew_analysis_06.pdf. Last checked on
24.11.2019.
Huq, M. Mozammel (1989) The Economy of Ghana. The first 25 years since
independence. Basingstoke: Macmillan.
Husband, Charles; McMahon, Gary; van der Veen, Peter (2009) The Aluminum
Industry in West and Central Africa. Lessons Learned and Prospects for the
Future. Washington, D.C. Found at:
http://siteresources.worldbank.org/EXTOGMC/Resources/336929-
1266963339030/eifd13_wa_aluminum.pdf. Last checked on 19.04.2019.
Huynh, Emma; Ji, Preston; Ntim, Charlotte; Redenbach, Kyle; Sarpong, Maame
(2017) Team 20: The Golden Oil Project Proposal and Feasibility Study. Found
at: http://engr.calvinblogs.org/17-18/srdesign20/wp-
content/uploads/2018/03/PPFS-JVA-comments.pdf. Last checked on
24.11.2019.
IDE-JETRO (2019) Kraomita Malagasy(Kraoma Sa). Found at:
https://www.ide.go.jp/English/Data/Africa_file/Company/madagascar06.html.
Last checked on 19.09.2019.

322
IDMS (2009) Cashew Nut Sub-Sector in Kenya. Findings of the Cashew Nut Tree
Census and Baseline Survey in the Coast Province. Found at: Unpublished,
available from author on request.
IGF (2018) Indonesia: Downstream Linkages. Using Export Restriction Policies
to Move Downstream. Winnipeg. Found at:
https://www.iisd.org/sites/default/files/publications/case-study-indonesia-
downstream-linkages.pdf.
Iliffe, J. (1967) ‘The Organization of the Maji Maji Rebellion’, The Journal of
African History 8(3): 495–512. DOI: 10.1017/S0021853700007982.
Illegal Logging Portal (2006) Chain Saw Logging and Milling in Ghana.
Background study report. Found at: https://www.illegal-
logging.info/content/chain-saw-logging-and-milling-ghana-background-study-
report?page=63. Last checked on 02.07.2019.
Indian Ministry of Mines (2009) Public Sector Enterprises & Disinvested
Companies. Annual Report 2008-2009. Found at:
https://mines.gov.in/writereaddata/UploadFile/Chapter_X-
Public_Sector_Enterprises.pdf. Last checked on 24.11.2019.
The Herald (29.05.2013) ‘Indian Nationals Take Over Scrap Export Business’.
Found at: https://www.newsghana.com.gh/indian-nationals-take-over-scrap-
export-business/. Last checked on 05.06.2019.
International Business Publications, Usa (2015) Tanzania Business Law
Handbook Volume 1. Strategic Information and Basic Laws. Washington,
D.C.: USA International Business Publications.
International Justice Monitor (2012) ‘Kenyan vetting board clears Three High
Court judges, declares another unfit for office’. Found at:
https://www.ijmonitor.org/2012/08/kenyan-vetting-board-clears-three-high-
court-judges-declares-another-unfit-for-office/.

323
International Trade Centre (2005) ‘Leatherline African Platform: United Republic
of Africa’. Found at: http://www.intracen.org/leatherline-portal/african-
platform/tanzania/.
International Trade Centre (2011) The coffee exporter's guide. Geneva:
International Trade Centre (ITC).
Isaacman, A. (1990) ‘Peasants and Rural Social Protest in Africa’, African Studies
Review 33(2): 1. DOI: 10.2307/524470.
Ithula, M., Beja, P., Masha, J. and Gikandi, B. (16.03.2010) ‘Hard nut to crack for
poor farmers who earn peanuts’, Standard Digital [Nairobi, Kenya. Found at:
https://www.standardmedia.co.ke/business/article/2000005740/hard-nut-to-
crack-for-poor-farmers-who-earn-peanuts. Last checked on 06.09.2018.
Jaeger, William (1992) The effects of economic policies on African agriculture.
Found at:
http://documents.worldbank.org/curated/en/333731468741600297/The-effects-
of-economic-policies-on-African-agriculture. Last checked on 29.07.2018.
Jaffee, Steven; Morton, John (1995) Marketing Africa's high-value foods.
Comparative experiences of an emergent private sector. Dubuque, IA:
Kendall/Hunt Pub.
The New Humanitarian (20.10.2004) ‘Japanese-backed company signs deal to
build $2 billion alumina plant’. Found at:
http://www.thenewhumanitarian.org/fr/node/219456. Last checked on
24.11.2019.
Jared, T. (05.07.2015) ‘Kilifi County to revive cashew nut industry’, Citizen
News (Kenya) [Nairobi, Kenya. Found at: https://citizentv.co.ke/news/kilifi-
county-to-revive-cashew-nut-industry-92840/. Last checked on 31.10.2017.
Johnson, M.C. (2011) ‘Lobbying for trade barriers: A comparison of poultry
producers' success in Cameroon, Senegal and Ghana’, The Journal of Modern
African Studies 49(04): 575–599. DOI: 10.1017/S0022278X11000486.

324
Juma, A. (03.03.2012) ‘Ban Hide Exportation to Save Local Industries -
TTA Advises’, HabariLeo. Found at: https://habarileo.co.tz/habari/ban-hide-
exportation-to-save-local-industries-tta-advises.aspx. Last checked on
19.07.2019.
Jungle Nuts Limited (Different Times) ‘Price Receipts from Kiambu Farmers
Selling to Junge Nut’.
Junk, W.M. (2019) ‘When Diversity Works: The Effects of Coalition
Composition on the Success of Lobbying Coalitions’, American Journal of
Political Science 63(4): 1191. DOI: 10.1111/ajps.12437.
Kamau, W. (29.07.2018) ‘Macadamia farmers, traders complain of harassment by
AFA officers’, County Review [Nairobi, Kenya. Found at:
https://www.countyreview.co.ke/business/macadamia-farmers-traders-
complain-harassment-afa-officers. Last checked on 09.09.2018.
Kaplinsky, Raphael (2004) Competitions Policy and the Global Coffee and Cocoa
Value Chains. Found at:
http://hubrural.org/IMG/pdf/rkaplinskycocoacoffee05.pdf. Last checked on
04.07.2019.
Karapinar, Baris (2010) Export restrictions on natural resources: policy options
and opportunities for Africa. Bern. Found at: http://www.nccr-
trade.org/fileadmin/user_upload/nccr-
trade.ch/news/TRAPCA%20Paper%20(Submitted1711)_BK.pdf. Last checked
on 25.02.2019.
Kasara, K. (2007) ‘Tax Me If You Can: Ethnic Geography, Democracy, and the
Taxation of Agriculture in Africa’, American Political Science Review
101(01): 159. DOI: 10.1017/S0003055407070050.
Kathuri, B. (02.09.2014) ‘Nuts export ban opens the way for Sh400m factory’,
Daily Nation [Nairobi, Kenya. Found at:
http://www.nation.co.ke/business/enterprise/Nuts-export-ban-opens-the-way-
for-Sh400m-factory/1954166-2439322-wl0lsk/index.html. Last checked on
01.10.2017.

325
Keefer, Philip; Khemani, Stuti (2003) Democracy, Public Expenditures and the
Poor. Washington, D.C. Found at: http://bit.ly/1A9OUxU. Last checked on
14.07.2018.
Kelsall, Tim (2013) Business, Politics, and the State in Africa. Challenging the
Orthodoxies on Growth and Transformation. London, New York: Zed Books.
Kenya National Bureau of Statistics (2018) 2009 Population and Housing Census.
Population Distribution By Sex, Number Of Households, Area And Density By
County And District. Found at: https://www.knbs.or.ke/download/population-
distribution-by-sex-number-of-households-area-and-density-by-county-and-
district/. Last checked on 18.11.2018.
Kenyan High Court (05.07.2013) ‘Republic v Minister of Agriculture & another
Ex -Parte Equitorial Nuts Processors Limited & 3 others [2013] eKLR’. Found
at: http://kenyalaw.org/caselaw/cases/view/89601.
Kenyan Ministry of Agriculture (2009) The Revitalization of the Cashew Nut
Industry in Kenya. Report of the Cashew Nut Revival Task Force.
Khan, M.H. (2013) ‘Technology Policies and Learning with Imperfect
Governance’, in Stiglitz, J.E. and Lin, J.Y. (eds) The Industrial Policy
Revolution I. The Role of Government Beyond Ideology. Basingstoke: Palgrave
Macmillan, 79–115.
Kihara, G. (07.04.2010a) ‘Nut farmers count losses as ban on raw exports bite’,
Business Daily Africa [Nairobi, Kenya. Found at:
https://www.businessdailyafrica.com/Company%20Industry/Nut%20farmers%
20count%20losses%20as%20ban%20on%20raw%20exports%20bite/-
/539550/893940/-/item/0/-/lq9nhv/-/index.html. Last checked on 07.11.2018.
Kihara, G. (26.08.2010b) ‘Ban on nuts export to resume next week’ [Nairobi,
Kenya. Found at: https://www.nation.co.ke/business/Ban-on-nuts-exports-to-
resume-next-week/996-997368-xqqmmaz/index.html. Last checked on
09.09.2018.

326
Kihara, G. (03.05.2016) ‘Of aging cashew nut trees and silver lining on dark
clouds’, Standard Media. Found at:
https://www.standardmedia.co.ke/article/2000200400/of-aging-cashew-nut-
trees-and-silver-linings-on-dark-clouds. Last checked on 15.10.2017.
Kihara, G. and Bocha, G. (12.01.2010a) ‘State ban on exports hurts cashew nut
prices’, Business Daily Africa [Nairobi, Kenya. Found at:
https://www.businessdailyafrica.com/corporate/539550-840794-
5ia3jtz/index.html. Last checked on 07.11.2018.
Kihara, G. and Bocha, G. (13.01.2010b) ‘Cereals board snub leaves cashew nut
farmers desperate’, Business Daily Africa [Nairobi, Kenya. Found at:
https://www.businessdailyafrica.com/Corporate-News/539550-841518-view-
printVersion-b25q8nz/index.html. Last checked on 07.11.2018.
Kilifi County (2016) Program for Enhancing Production and Productivity of
Cashew Nut in Kilifi County. Found at: Unpublished, available from author on
request.
Kilimo Trust (2009) Livestock Product Value Chains in East Africa. A Scoping
and Preliminary Mapping Study. Dar es Salaam, Tanzania.
Kiplangat, J. (03.08.2012) ‘Board sacks first High Court judge’, Daily Nation
[Nairobi, Kenya. Found at: https://www.nation.co.ke/news/Board-sacks-first-
High-Court-judge-/1056-1470656-pcu9w9z/index.html. Last checked on
14.11.2018.
Kirimi, M. (10.03.2018) ‘Meru leaders want AFA laws amended to favor
Macadamia farmers’, Eastern Post [Meru, Kenya. Found at:
http://easternpost.co.ke/meru-leaders-want-afa-laws-amended-to-favor-
macadamia-farmers/. Last checked on 08.09.2018.
Kishor, N., Mani, M. and Constantino, L. (2004) ‘Economic and Environmental
Benefits of Eliminating Log Export Bans – The Case of Costa Rica’, The
World Economy 27(4): 609–624. DOI: 10.1111/j.0378-5920.2004.00616.x.

327
Kithi, N. (20.12.2004) ‘Cashew Nuts Collapse Devastated Kenya's Coastal
Farmers’, Daily Nation [Nairobi, Kenya. Found at:
http://www.theeastafrican.co.ke/business/2560-245308-uuxw67/index.html.
Last checked on 06.09.2018.
Kjaer, A.M. (2015) ‘Political Settlements and Productive Sector Policies:
Understanding Sector Differences in Uganda’, World Development 68: 230–
241. DOI: 10.1016/j.worlddev.2014.12.004.
Kolavalli, S. and Vigneri, M. (2011) ‘Cocoa in Ghana: Shaping the Success of an
Economy’, in Chuhan-Pole, P. and Angwafo, M. (eds) Yes Africa Can. Success
Stories from a Dynamic Continent. Washington, D.C., 201–2018.
Kolavalli, S., Vigneri, M., Maamah, H. and Poku, J. (2012) ‘The Partially
Liberalized Cocoa Sector in Ghana: Producer Price Determination, Quality
Control, and Service Provision’, SSRN Electronic Journal. DOI:
10.2139/ssrn.2198609.
Konings, Piet (2012) Gender and plantation labour in Africa. The story of tea
pluckers' struggles in Cameroon. Bamenda, Cameroon: Langaa Research &
Publishing.
Korinek, Jane; Bartos, Jessica (2012) Multilateralising Regionalism: Disciplines
on Export Restrictions in Regional Trade Agreements .
Koter, D. (2013) ‘King Makers: Local Leaders and Ethnic Politics in Africa’,
World Politics 65(02): 187–232. DOI: 10.1017/S004388711300004X.
KPMG Global Mining Institute (2014) Ghana. Country mining guide. Found at:
https://assets.kpmg/content/dam/kpmg/pdf/2014/04/ghana-mining-guide.pdf.
Last checked on 24.11.2019.
Kramon, E. and Posner, D.N. (2016) ‘Ethnic Favoritism in Education in Kenya’,
Quarterly Journal of Political Science 11(1): 1–58. DOI:
10.1561/100.00015005.

328
Krueger, A.O., Schiff, M. and Valdes, A. (1988) ‘Agricultural Incentives in
Developing Countries: Measuring the Effect of Sectoral and Economywide
Policies’, World Bank Economic Review 2(3): 255–271.
Kunateh, M.A. (16.05.2013) ‘Government won't lift scrap metal exports ban -
Iddrisu’, The Chronicle. Found at:
https://allafrica.com/stories/201305171010.html. Last checked on 29.05.2019.
Kyngdon-McKay, Yolande; Jorns, Angela; Wheat, Barbara; Cushman, Tom
(2016) The Commercial Potential of Ethiopia’s Coloured Gemstone Industry.
Found at: http://www.estellelevin.com/wp-content/uploads/2016/09/20160921-
ELL-FINAL-Ethiopia-report.pdf. Last checked on 09.07.2017.
Labonté, R., Lencucha, R., Drope, J., Packer, C., Goma, F. and Zulu, R. (2018)
‘The institutional context of tobacco production in Zambia’, Globalization and
Health 14. DOI: 10.1186/s12992-018-0328-y.
Lac Hotel (2019) ‘Théicole’. Found at: https://www.lachotel.com/en/theicole/.
Landkarten und Stadtplan Index (2019) ‘Politische Landkarte von Ghana
(Englisch, 2002)’. Found at:
https://www.landkartenindex.de/weltatlas/?attachment_id=4482.
Laven, Anna; Oomes, Nienke; Tieben, Bert; Ammerlaan, Ties; Appelman, Romy;
Biesenbeek, Cindy; Buunk, Eelco (2016) Market Concentration and Price
Formation in the Global Cocoa Value Chain.
Le Monde Afrique (27.07.2016) ‘"Panama Papers": How the wealth of Indian
tycoons of Togo ends up in tax havens’. Found at:
https://www.lemonde.fr/afrique/article/2016/07/27/panama-papers-comment-
la-fortune-de-magnats-indiens-du-togo-finit-dans-les-paradis-
fiscaux_4975374_3212.html. Last checked on 03.06.2019.
Lele, Uma; Christiansen, Robert (1989) Markets, Marketing Boards, adn
Cooperatives in Africa. Washington, D.C. Found at:
http://documents.worldbank.org/curated/en/203971468742806155/pdf/multi-
page.pdf. Last checked on 13.06.2019.

329
Lemnge, F. (2011) ‘Supply Chain Management Challenges in Scrap Based Steel
Industry: A Case of Trishalla Rolling Mills (Arusha)’, THE ACCOUNTANCY
AND BUSINESS REVIEW 8.
Business Report ‘Leviev starts Africa's biggest diamond plant in Namibia’. Found
at: https://www.iol.co.za/business-report/international/leviev-starts-africas-
biggest-diamond-plant-in-namibia-755185. Last checked on 24.11.2019.
Lewis, Martin (2016) ‘Customizable Maps of Kenya, Ghana, Ethiopia, Belgium,
and South Korea’. Found at:
http://www.geocurrents.info/cartography/customizable-maps-kenya-ghana-
ethiopia-belgium-south-korea.
Liapis, Peter (2013) How Export Restrictive Measures Affect Trade of
Agricultural Commodities.
Lijphart, A. (1971) ‘Comparative Politics and the Comparative Method’,
American Political Science Review 65(03): 682–693. DOI: 10.2307/1955513.
Lin, J. and Chang, H.-J. (2009) ‘Should Industrial Policy in Developing Countries
Conform to Comparative Advantage or Defy it?: A Debate Between Justin Lin
and Ha-Joon Chang’, Development Policy Review 27(5): 483–502. DOI:
10.1111/j.1467-7679.2009.00456.x.
Lindsay, H. (1989) ‘The Indonesian Log Export Ban: An Estimation of Foregone
Export Earnings’, Bulletin of Indonesian Economic Studies 25(2): 111–123.
DOI: 10.1080/00074918812331335599.
Lys, Peter (2010) The Current State of Cost of Production Estimates. A review of
Country Practices in Ethiopia, Mali and Zambia. Found at:
http://www.fao.org/fileadmin/templates/ess/ess_test_folder/Workshops_Events
/production_cost/Lys_Report_on_country_case_studies_on_CoP.pdf. Last
checked on 23.02.2019.
Machira, P. (06.06.2013) ‘Leather Sector Limps Despite State Bid to Make it
Vibrant’, The Citizen. Found at:

330
https://www.thecitizen.co.tz/magazine/Leather-sector-limps-despite-/1840564-
1873996-yukkdpz/index.html. Last checked on 20.07.2019.
Maigua, J., Maina, L. and Ndegwa, C. (2017) ‘Challenges and Opportunities in
Kenya’s Macadamia Nuts Industry: A Gender Perspective’, Bridges Africa
6(4).
Malhotra, S. P. (2008) World edible nuts economy. New Delhi: Concept Pub.
Mani, A. and Mukand, S. (2007) ‘Democracy, visibility and public good
provision’, Journal of Development Economics 83(2): 506–529. DOI:
10.1016/j.jdeveco.2005.06.008.
Marete, G. (05.03.2018) ‘Check macadamia movement, agency now tells
counties’, Business Daily Africa [Nairobi, Kenya. Found at:
https://www.businessdailyafrica.com/economy/Check-macadamia-movement-
agency-now-tells/3946234-4329388-98y5ecz/index.html. Last checked on
07.09.2018.
Market Insider (2014) ‘Kenya: Cashew Sector Developments’. Found at:
http://www.intracen.org/itc/blogs/market-insider/Kenya-cashew-sector-
developments/.
Marshall, Monty; Gurr, Ted; Jaggers, Keith (2017) POLITY™ IV PROJECT
Political Regime Characteristics and Transitions, 1800-2015 Dataset Users’
Manual. Found at: http://www.systemicpeace.org/inscr/p4manualv2016.pdf.
Last checked on 12.03.2018.
Martin, Claude (1991) The Rainforests of West Africa. Ecology - Threats -
Conservation. Basel, s.l.: Birkhäuser Basel.
Marx, Karl (1852) ‘The Eighteenth Brumaire of Louis Bonaparte’. Found at:
https://www.marxists.org/archive/marx/works/1852/18th-brumaire/index.htm.
Mason, Carl (2004) Sawmill Financial Aspects.
Mayers, James; Howard, Caroline; Nii, E.; Kotey, Ashie; Prah, Edward; Richards,
Michael (1996) Incentives for Sustainable Forest Management: A study in

331
Ghana. Found at: https://pubs.iied.org/pdfs/7510IIED.pdf. Last checked on
24.05.2019.
Mazzucato, Mariana (2013) The Entrepreneurial State. Debunking the Public vs.
Private Myth in Risk and Innovation: Anthem Press.
Mbayi, Letsema (2011) Linkages in Botswana’s Diamond Cutting and Polishing
Industry. Open University, Milton Keynes, UK. Found at:
http://commodities.open.ac.uk/8025750500453F86/(httpAssets)/1C5D9129D1
9324A28025787E003A693D/$file/Linkages%20in%20Botswana%E2%80%99
s%20Diamond%20Cutting%20and%20Polishing%20Industry.pdf. Last
checked on 09.03.2018.
Mburu, N. (03.08.2011) ‘Macadamia farmers turn fortunes with change in
strategy’, Business Daily Africa [Nairobi, Kenya. Found at:
http://www.businessdailyafrica.com/Macadamia-farmers-turn-fortunes-with-
change-in-strategy/-/539546/1212268/-/item/0/-/3l5f2fz/-/index.html. Last
checked on 28.10.2017.
McGregor, A. (1996) ‘Macadamia: A Tropical Nut Industry Example’, in South
Pacific Indigenous Nuts, 140–49.
McLure, J. (21.02.2011) ‘Illegal Scrap Exports Cost Ghana 60 Million Cedis,
Times Reports’, Bloomberg. Found at:
https://www.bloomberg.com/news/articles/2011-02-21/illegal-scrap-metal-
exports-cost-ghana-40-1-million-last-year-times-says. Last checked on
31.05.2019.
McMillan, M. (2001) ‘Why Kill the Golden Goose?: A Political-Economy Model
of Export Taxation’, Review of Economics and Statistics 83(1): 170–184. DOI:
10.1162/003465301750160135.
McMillan, M.S., Welch, K.H. and Rodrik, D. (2003) ‘When Economic Reform
Goes Wrong: Cashew in Mozambique’, Brookings Trade Forum 2003(1): 97–
151. DOI: 10.1353/btf.2004.0012.

332
Melamed, C. (2006) ‘Briefing: Wrong Questions, Wrong Answers: Trade, Trade
Talks and Africa’, African Affairs 105(420): 451–460.
Menard, Jamey; Jensen, Kim; English, Burton; Barefield, Alan (2000) Growth in
the Value-Added Wood Products Industry:. An Economic Feasibility Study for
the Clinch-Powell Enterprise Community Counties. Found at:
https://web.utk.edu/~aimag/pubs/clinchpowell.pdf. Last checked on
24.11.2019.
Mendez Parra, Maximiliano; Schubert, Samuel R.; Brutschin, Elina (2016) Export
taxes and other restrictions on raw materials and their limitation through free
trade agreements. Impact on developing countries. Brussels: European
Parliament.
Mensah, C. (04.11.2013) ‘Scrap Dealers Appeal To Harruna Iddrissu’, The
Herald. Found at: http://theheraldghana.com/scrap-dealers-appeal-harruna-
iddrissu/. Last checked on 29.05.2019.
Mhando, Peter C. (2019) Corporate governance in Tanzania. Ethics and
accountability at the crossroads. Abingdon, Oxon, New York, NY: Routledge.
Milner, H.V. and Kubota, K. (2005) ‘Why the Move to Free Trade?: Democracy
and Trade Policy in the Developing Countries’, International Organization
59(01): 833. DOI: 10.1017/S002081830505006X.
Minister of Agriculture (31.05.2010) Gazette Notice No. 6208, The Agriculture
Act (Cap. 318), Lift of Ban. *G.N. 6208/2010. Found at:
http://kenyalaw.org/kl/index.php?id=3794. Last checked on 14.11.2018.
Minister of Finance of Tanzania (2012) Speech by the Minister for Finance Hon.
Dr. William Augustao Mgimwa (Mp.), Introducing to the National Assembly,
the Estimates of Government Revenue and Expenditure for the Fiscal Year
2012/2013. Found at:
http://www.mof.go.tz/mofdocs/budget/speech/HOTUBA%20YA%20BAJETI
%202012-13%20%20-%20%20ENGLISH.pdf. Last checked on 20.08.2019.

333
Ministry of Food and Agriculture of Ghana (2010) Ghana: Project Completion
Report for the Cashew Development Project. Found at: Unpublished, available
from author on request.
Ministry of Food and Agriculture of Ghana (2013) Tree Crops Policy. Found at:
https://drive.google.com/file/d/0B4fn1Fz6J8K9OVBQQTY0UWVYdXM/view
. Last checked on 02.12.2018.
Ministry of Industry and Trade (2011) Integrated Industrial Development
Strategy. 2025. Found at:
http://www.tzdpg.or.tz/fileadmin/_migrated/content_uploads/IIDS_Main_Repo
rt.pdf. Last checked on 18.07.2019.
Ministry of Industry and Trade; ITC (2015) Leather Sector Development Strategy.
2016-2020. Found at:
http://www.mit.go.tz/uploads/files/Tanzania%20Leather%20Strategy.pdf. Last
checked on 07.07.2017.
Ministry of Livestock and Fisheries Development (2011) Livestock Sector
Development Programme. Dar es Salaam, Tanzania. Found at:
https://www.tanzania.go.tz/egov_uploads/documents/Livestock_Programe_sw.
pdf. Last checked on 06.07.2017.
Ministry of Livestock Development and Fisheries (2011) Study on the Structure,
Conduct and Performance of the Hide, Skins and Leather Sub-Sectors in
Tanzania. First Draft Report. Available from author on demand.
Ministry of Trade and Industry (Ghana) (2010) Exportation of Non-Ferrous Metal
Regulations, 2010. Found at:
http://images.mofcom.gov.cn/gh/accessory/201212/1354894926335.pdf. Last
checked on 03.06.2019.
Ministry of Trade and Industry (Ghana) (2017) Background on Steel Milling in
Ghana. Available from author on demand.
Miraza, Tato (30.11.2012) Challenges and Opportunities in Indonesia Mining and
Mineral Industries in the Future. Bali, Indonesia.

334
Mitra, Siddhartha; Josling, Tim (2009) Agricultural Export Restrictions: Welfare
Implications and Trade Disciplines.
Mkandawire, T. (1999) ‘The political economy of financial reform in Africa’,
Journal of International Development 11(3): 321–342. DOI:
10.1002/(SICI)1099-1328(199905/06)11:3<321::AID-JID594>3.0.CO;2-V.
Mkandawire, T. (2015) ‘Neopatrimonialism and the Political Economy of
Economic Performance in Africa: Critical Reflections’, World Politics 67(03):
563–612. DOI: 10.1017/S004388711500009X.
Morris, Michael L.; Kaplinsky, Raphael; Kaplan, David E. (2012) One thing leads
to another. Promoting industrialisation by making the most of the commodity
boom in Sub-Saharan Africa. Cape Town: Centre for Social Science Research.
Mosley, P. and Smith, L. (1989) ‘Structural adjustment and agricultural
performance in Sub-Saharan Africa 1980-87’, Journal of International
Development 1(3): 321–355. DOI: 10.1002/jid.3380010302.
Mubarik, Abu (2016) Cashew Ban. Cashew Exports Ban Suspended.
Muchiri, J. (29.07.2014) ‘Kenyan farmers lobby to make macadamia new green
gold’, The Standard. Found at:
https://www.standardmedia.co.ke/business/article/2000129781/kenyan-
farmers-lobby-to-make-macadamia-new-green-gold. Last checked on
15.10.2017.
Muchiri, J. (29.10.2018) ‘DP Ruto: Ban on exportation of raw nuts to remain’,
Standard Digital [Nairobi, Kenya. Found at:
https://www.standardmedia.co.ke/business/article/2001300732/ban-on-raw-
nuts-export-to-remain. Last checked on 15.11.2018.
Muchui, D. (11.02.2018) ‘Low prices and export ban rule drive macadamia
farmers nuts’, Daily Nation [Nairobi, Kenya. Found at:
https://www.nation.co.ke/business/Low-prices-and-export-ban-rule-drive-
macadamia-farmers-nuts/996-4300044-k301p5/index.html. Last checked on
08.09.2018.

335
Muhindi, S. (25.07.2018) ‘DP Ruto has monopolised macadamia sector – farmer’,
The Star [Nairobi, Kenya. Found at: https://www.the-
star.co.ke/news/2018/07/25/dp-ruto-has-monopolised-macadamia-sector-
farmer_c1792163. Last checked on 09.09.2018.
Muigai, Charles (2017) Investigating the Potential of Agriculture & Catering
Value Chain Development in Lamu County. A Value Chain Prioritization for
GIZ Employment and Skilly for Eastern Africa (E4D/SOGA) - Keny Lamu
County. Found at: Unpublished, available from author on request.
Muinde, A. (29.07.2013) ‘Scramble for nuts push farmers back to cultivation’,
Standard Digital [Nairobi, Kenya. Found at:
https://www.standardmedia.co.ke/business/article/2000089612/scramble-for-
nuts-push-farmers-back-to-cultivation. Last checked on 30.10.2017.
Muiruri, J. (30.07.2009) ‘Kenya bans cashew nuts export’, Daily Nation [Nairobi,
Kenya. Found at: https://www.nation.co.ke/news/1056-632252-
jn7kpkz/index.html. Last checked on 07.11.2018.
Munyua, Bernard; Orr, Alastair; Okwadi, J. (2013) Open Sesame. A Value Chain
Analysis of Sesame Marketing in Northern Uganda.
Murioga, W.M., Amutabi, M., Mbugua, C. and Ajuoga, M. (2016) ‘Efficiency of
Agrifood Marketing Systems in Kenya: The Case Study of Macadamia Nuts in
the Central Kenya Highlands’, Journal of Business and Management 18(7):
91–104. DOI: 10.9790/487X-18070491104.
Murioga, Wilfred M. (31.07.2013) Agrifood Efficiciency Marketing System. A
Case Study on Macadamia Nuts Value Chain In Five Selected Counties of
Central Kenya Highlands. Found at:
https://www.google.com/url?sa=t&rct=j&q=&esrc=s&source=web&cd=2&cad
=rja&uact=8&ved=0ahUKEwjH3e_zjY_XAhWLIcAKHZZZC5EQFggsMAE
&url=http%3A%2F%2Fir-
library.ku.ac.ke%2Fbitstream%2Fhandle%2F123456789%2F11114%2FAgrifo
od%2520efficiency%2520marketing%2520system.pptx%3Bsequence%3D1&u
sg=AOvVaw1amSj9-ZqlaKIGeMrc_iFm. Last checked on 26.10.2017.

336
Murithi, F. (April 2016) ‘Macadamia farmers cry foul over poor nut prices’,
Kenya Star [Nairobi, Kenya. Found at:
https://issuu.com/contentnews/docs/mt._kenya_star_issue_20. Last checked on
08.09.2018.
Muthethia, G. (07.02.2018) ‘Food authority denies involvement in macadamia
price wars as Meru farmers protest’, The Star [Nairobi, Kenya. Found at:
https://www.the-star.co.ke/news/2018/02/07/food-authority-denies-
involvement-in-macadamia-price-wars-as-meru_c1709806. Last checked on
08.09.2018.
Muthoka, N.M., Kiuru, P.D., Mbaka, J., Nyaga, A.N., Muriuki, S.J.N. and
Waturu, C.N. (2008) ‘Macadamia Nut Production and Research in Kenya’, The
African Journal of Plant Science and Biotechnology 2(2): 46–48.
Mwajefa, M. (31.07.2009) ‘Govt ban set to reduce cashew nut output’, Daily
Nation [Nairobi, Kenya. Found at: https://www.nation.co.ke/mombasa/519978-
632886-122ys2yz/index.html. Last checked on 07.11.2018.
Mwaka, F. (23.10.1999) ‘Moi aide faces farmers wrath’, Daily Nation [Nairobi,
Kenya. Found at: https://www.nation.co.ke/news/1056-382402-
l7d20qz/index.html. Last checked on 04.10.2018.
Mwangi, I. (22.05.2014) ‘Meru farmers protest against a planned move to
monopolize the sale of macadamia’, Kenya News Agency [Nairobi, Kenya.
Found at: http://kenyanewsagency.go.ke/en/?p=23915. Last checked on
08.09.2018.
Mwangi, O.G. (2008) ‘Political corruption, party financing and democracy in
Kenya’, The Journal of Modern African Studies 46(02): 69. DOI:
10.1017/S0022278X08003224.
Mwangosi, Issa Lupakisyo (2014) Analysis of Leather Value Chain in Tanzania.
The Case of Mwanza City. Dar es Salaam, Tanzania.

337
Mwinuka, L. & Maro, F. (2013) Analysis of incentives and disincentives for
cotton in the United Republic of Tanzania. Rome. Found at:
http://www.fao.org/3/a-at480e.pdf. Last checked on 26.02.2019.
Namutowe, J. (10.03.2014) ‘Lusaka Cigarette Plant Gets $8m’, Times of Zambia.
Found at:
http://www.times.co.zm/?p=13699;%20https://www.africaoutlookmag.com/out
look-features/roland-imperial-tobacco. Last checked on 24.11.2019.
National Assembly of Kenya (07.12.1999) ‘Parliamentary Hansard: Adoption of
the Eighth PIC Report’. Found at:
https://books.google.de/books?id=KlYkWvChEjcC&pg=PT17&lpg=PT17&dq
=Cashewnut+Company+githiomi&source=bl&ots=nJ5aQJ2adR&sig=wuOepJ
QOGiNC6hZnlAQZInS9nWI&hl=de&sa=X&ved=2ahUKEwiQ4uHOtuzdAh
Uh_CoKHW_6B0MQ6AEwCXoECAMQAQ#v=onepage&q=Cashewnut%20
Company%20githiomi&f=false.
National Assembly of Kenya (11.07.2000) ‘Parliamentary Hansard: Transfer of
the Kenya Cashewnuts Shares’. Found at:
https://books.google.de/books?id=MB1WH6DK07IC&pg=PT14&lpg=PT14&
dq=Transfer+of+the+Kenya+Cashewnuts+Shares+2000&source=bl&ots=CB1
S5JDwp1&sig=7PSZ7jAj2FBLYB-
XEK39mbrn_Jw&hl=de&sa=X&ved=2ahUKEwi3qN-
zuezdAhVKqIsKHUddDdMQ6AEwAHoECAkQAQ#v=onepage&q=Transfer
%20of%20the%20Kenya%20Cashewnuts%20Shares%202000&f=false.
National Assembly of Kenya (30.10.2003) ‘Parliamentary Hansard: Ministerial
Statements: Fate of the Kilif Cashewnuts Factory’. Found at:
https://books.google.de/books?id=BRj5JfA_cZgC&pg=PT17&lpg=PT17&dq=
Transfer+of+the+Kenya+Cashewnuts+Shares+2000&source=bl&ots=SCwjH_
j9IB&sig=alAMRkLwL1iuMRv6zkfCjy_o9d4&hl=de&sa=X&ved=2ahUKEw
i3qN-
zuezdAhVKqIsKHUddDdMQ6AEwA3oECAYQAQ#v=onepage&q&f=false.
National Assembly of Kenya (11.04.2007) ‘Parliamentary Hansard:
Motions: Select Committee on Collapse of Kilifi Cashewnut Factory’. Found

338
at:
https://books.google.de/books?id=wsVD7yZlvR4C&pg=PT12&lpg=PT12&dq
=select+committee+of+collapse+kilifi+cashewnut+april+11&source=bl&ots=4
LFTrl3Igv&sig=hbcqbY4_F_fRdojNlPXxGiADKG8&hl=de&sa=X&ved=2ah
UKEwjblsPKvOzdAhVEmYsKHW_ADTwQ6AEwCnoECAgQAQ#v=onepag
e&q=select%20committee%20of%20collapse%20kilifi%20cashewnut%20april
%2011&f=false.
National Assembly of Kenya (04.05.2016) ‘Official Report: Review of AFFA Act
to Allow Sale of Raw Produce’. Found at:
http://info.mzalendo.com/hansard/sitting/national_assembly/2016-05-04-14-
30-00#entry-657848.
NEDBANK (2018) Capital Expenditure Project Listing. 1 January 1993 to 30
June 2018. Found at:
https://nedbankprivatewealth.com/content/dam/nedbank/site-
assets/AboutUs/Economics_Unit/Research/EconomicResearch/CAPEX%20-
%20H1%202018.pdf. Last checked on 24.11.2019.
Neupane, Prabhat; Regmi, Prabesh; Subedi, Pushpa; Shah, Pramita; Acharya,
Pratikshya (2016) Feasibility Study On Green Tea. Found at:
https://www.academia.edu/30038717/Feasibility_study_of_green_tea. Last
checked on 24.11.2019.
Newsinger, J. (1981) ‘Revolt and Repression in Kenya: The "Mau Mau"
Rebellion, 1952-1960’, Science & Society 45(2): 159–185.
Ngaruko, D. and Mbilinyi, B. (2014) ‘Value Chain Analysis of the Cotton Market
in Tanzania: Application of Structure-Connduct-Performance (SCP) Model’,
Developing Country Studies 4(15).
N'Kalo (2016) ‘Bulletin sur le marché de l’anacarde’. Found at:
http://nkalo.com/blog/?s=kenya&submit=Recherche.
N'Kalo (31.05.2017) ‘Bulletin sur le marché de l’Anacarde’. Found at:
http://nkalo.com/blog/anacarde/.

339
N'Kalo (17.08.2017) Cashew Market Report. Found at:
https://docs.wixstatic.com/ugd/d6c806_59c3be8403fb4042b1732cef514ff904.p
df. Last checked on 06.09.2018.
N'Kalo (30.05.2018) Cashew Market Bulletin. Found at:
http://media.wix.com/ugd/d6c806_a79bcb9c9ae24e68b5fa3064fc2e1215.pdf.
Last checked on 06.09.2018.
Nkansah, A., Attiogbe, F. and Kumi, E. (2015) ‘Nkansah, A., Attiogbe, F., and
Kumi, E. (2015). Scrap metals’ role in Circular Economy in Ghana, using
Sunyani as case study, African journal of Environmental Science and
Technology. Manuscript number, AJEST/27.08.15/2000’, African Journal of
Environmental Science and Technology 9(11): 793–799. DOI:
10.5897/AJEST2015.2000.
Noguerón, Ruth; Cheung, Loretta; Mason, Jonathan; Li, Bo Sourcing Legally
Produced Wood. A Guide for Businesses - 2018 Edition. Found at:
https://wriorg.s3.amazonaws.com/s3fs-public/sourcing-legally-produced-
wood.pdf?_ga=2.58056042.1512081786.1557925697-295750650.1557925697.
Last checked on 16.05.2019.
Nuts & Oil Crop Directorate (2016) Brief on the Macadamia Industry in Kenya,
September 2016. Nairobi, Kenya. Found at: Unpublished, available from
author on request.
Obour, S. (10.07.2013) ‘Committee to assess impact of ban on scrap metal’,
Graphic Online. Found at: https://www.graphic.com.gh/business/business-
news/committee-to-assess-impact-of-ban-on-scrap-metal.html. Last checked on
29.05.2019.
Oduro, K.A., Marfo, E., Agyeman, V.K. and Gyan, K. (2011) ‘One Hundred
Years Of Forestry in Ghana: A Review Of Policy And Regulatory Discourses
of Timber Legality’, Ghana Journal of Forestry 27(3): 15–32.
OECD (2011) Developments in Steelmaking Capacity of Non-OECD Economies
2010: OECD.
340
OECD (2014) Export Restrictions in Raw Materials Trade Facts, fallacies and
better practices. Found at: http://www.oecd.org/tad/benefitlib/export-
restrictions-raw-materials-2014.pdf. Last checked on 05.08.2018.
OECD (2017) MAPPING SUPPORT FOR PRIMARY AND SECONDARY
METAL PRODUCTION. Found at:
http://www.oecd.org/officialdocuments/publicdisplaydocumentpdf/?cote=ENV
/EPOC/WPRPW(2016)2/FINAL&docLanguage=En. Last checked on
26.02.2019.
Offshore Leaks Database (2018) ‘Sally Kosgei’. Found at:
https://offshoreleaks.icij.org/stories/sally-kosgei.
Ohene, S. (21.02.2019) ‘Local steel industry touted as backbone of Ghanaian
economy’, Joy Online. Found at:
https://www.myjoyonline.com/business/2019/February-21st/local-steel-
industry-touted-as-backbone-of-ghanaian-economy.php. Last checked on
31.05.2019.
Olper, Alessandro; Falkowski, Jan; Swinnen, Johan F. M. (2013) Political
Reforms and Public Policy. Evidence from Agricultural and Food Policies.
Olson, Mancur (1965) The logic of collective action. Public goods and the theory
of groups. Cambridge, Mass.: Harvard University Press.
Olympio, John; ComCashew (2015) Options Analysis for RCN Trade Measures.
Found at: Unpublished, available from author on request.
Onsongo, Mary (2006) Kenya Tree Nut Update Report 2006. GAIN Report.
Found at: https://apps.fas.usda.gov/gainfiles/200601/146176690.doc. Last
checked on 29.10.2017.
Onsongo, Mary (2009a) Kenya Macadamia Annual Report. Nairobi. Found at:
https://gain.fas.usda.gov/Recent%20GAIN%20Publications/TREE%20NUTS
%20ANNUAL_Nairobi_Kenya_10-1-2009.pdf. Last checked on 30.10.2017.

341
Onsongo, Mary (2009b) Kenya Tree Nuts Macadamia Update Report 2008.
Nairobi. Found at: https://apps.fas.usda.gov/gainfiles/200802/146293799.pdf.
Last checked on 30.10.2017.
Östensson, Olle; Löf, Anton (2017) Downstream activities: The possibilities and
the realities. Found at: http://hdl.handle.net/10419/163089. Last checked on
26.09.2017.
Owusu, J.H. (2001) ‘Determinants of export-oriented industrial output in Ghana:
the case of formal wood processing in an era of economic recovery’, The
Journal of Modern African Studies 39(1): 51–80. DOI:
10.1017/S0022278X01003524.
Owusu, John Henry (2012) Africa, tropical timber, turfs and trade. Geographic
perspectives on Ghana's timber industry and development. Lanham, Md:
Lexington Books.
Oya, C. (2015) ‘Who counts? Challenges and biases in defining ‘households’ in
research on poverty’, Journal of Development Effectiveness 7(3): 336–345.
DOI: 10.1080/19439342.2015.1068358.
Oyuke, J. (14.04.2009) ‘Renewed hope for cashew farmers’, The Standard Media.
Found at:
https://www.standardmedia.co.ke/business/article/1144011476/renewed-hope-
for-cashew-nut-farmers/?pageNo=2. Last checked on 01.10.2017.
Parliament of Ghana (2013) Parliamentary Debates Official Report. Tuesday, 26
March, 2013. Accra, Ghana. Found at:
https://www.parliament.gh/docs?type=HS&yr=2013&mon=3. Last checked on
11.07.2019.
Parliament of Ghana (17.03.2016) ‘Hansard: Debates of 17 Mar 2016’. Found at:
http://www.odekro.org/hansard/sitting/parliamenthouse/20160317111000.
Parliament of Zimbabwe (2013) Chrome Mining Sector in Zimbabwe. Found at:
http://www.veritaszim.net/sites/veritas_d/files/Chrome%20Mining%20Sector
%20in%20Zimbabwe.doc. Last checked on 17.05.2019.

342
Peace FM Online (2017) ‘Ghana Election Results’. Found at:
http://ghanaelections.peacefmonline.com/pages/2016/president/brongahafo/63/.
Peltzman, S. (1976) ‘Toward a More General Theory of Regulation’, The Journal
of Law and Economics 19(2): 211–240. DOI: 10.1086/466865.
Persson, Torsten; Tabellini, Guido Enrico (2000) Political economics. Explaining
economic policy. Cambridge, Mass.: MIT Press.
Piermartini, Roberta (2004) The role of export taxes in the field of primary
commodities. Geneva.
Pierskalla, J.H. (2016) ‘The Politics of Urban Bias: Rural Threats and the Dual
Dilemma of Political Survival’, Studies in Comparative International
Development 51(3): 286–307. DOI: 10.1007/s12116-015-9194-2.
Pitcher, A., Moran, M.H. and Johnston, M. (2009) ‘Rethinking Patrimonialism
and Neopatrimonialism in Africa’, African Studies Review 52(01): 125–156.
DOI: 10.1353/arw.0.0163.
Pitcher, M. Anne (2002) Transforming Mozambique. The politics of privatization,
1975-2000. Cambridge: Cambridge University Press.
PMMC (2019) ‘History’. Found at:
https://www.pmmc.gov.gh/pmmc/about/history.
Prakash, Siddarth; Manhart, Andreas (2010) Socio-economic assessment and
feasibility study on sustainable e-waste management in Ghana. Found at:
https://www.oeko.de/oekodoc/1057/2010-105-en.pdf. Last checked on
04.06.2019.
Praxides, C. (18.05.2017a) ‘Lift ban on raw cashew nuts exports, it has killed
farming in Lamu - MP Ndegwa’, The Star [Nairobi, Kenya. Found at:
https://www.the-star.co.ke/news/2017/04/18/lift-ban-on-raw-cashew-nuts-
exports-it-has-killed-farming-in-lamu-mp_c1541165. Last checked on
08.09.2018.

343
Praxides, C. (25.07.2017b) ‘Lift cashew export ban, farmers suffer - Abdalla’,
The Star. Found at: https://www.the-star.co.ke/news/2017/07/25/lift-cashew-
export-ban-farmers-suffer-abdalla_c1602969. Last checked on 01.10.2017.
Ghana News Agency (02.11.2017) ‘President Mahama inaugurates Gold Coast
Refinery’. Found at: http://www.ghana.gov.gh/index.php/news/3231-president-
mahama-inaugurates-gold-coast-refinery. Last checked on 24.11.2019.
Rabany, N.; Rullier, N.; Ricau, Pierre (2015) The African Cashew Sector in 2015.
General Trends and Country Profiles. Found at:
http://www.rongead.org/IMG/pdf/african_cashew_market_review_rongead_ica
_2015.pdf. Last checked on 05.08.2018.
Rabe-Hesketh, S.; Skrondal, Anders (2011) Multilevel and longitudinal modeling
using Stata. College Station, Tex.: Stata.
Rabenasolo, Tahiry (2019) ‘Ferrum Mining: KRAOMA's new obscure partner’.
Found at: https://malina.mg/en/article/ferrum-mining--kraoma-s-new-obscure-
partner.
Radetzki, Marian (2008) A Handbook of Primary Commodities in the Global
Economy. Cambridge: Cambridge University Press.
Ramdoo, Isabelle; Bilal, San (2014) Extractive Resources for Development.
Trade, fiscal and industrial considerations.
Recycling International (2007) Ghana struggles to retain scrap. Found at:
https://recyclinginternational.com/wp-content/uploads/2018/05/RI_4-2007.pdf.
Last checked on 10.07.2019.
Repetto, Robert; Gillis, Malcolm (1988) Public policies and the misuse of forest
resources. Cambridge: Cambridge University Press.
Resnick, Danielle; Babu, Suresh Chandra; Haggblade, Steven; Hendriks, Sheryl;
Mather, David (2015) Conceptualizing Drivers of Policy Change in
Agriculture, Nutrition, and Food Security. The Kaleidoscope Model (.

344
Resosudarmo, B.P. and Yusuf, A.A. (2006) ‘Is the Log Export Ban an Efficient
Instrument for Economic Development and Environmental Protection?: The
Case of Indonesia*’, Asian Economic Papers 5(2): 75–104. DOI:
10.1162/asep.2006.5.2.75.
Reuters (1962) ‘Ghana: President Nkrumah Inaugurates New Steel Works At
Tema.’. Found at:
https://www.britishpathe.com/video/VLVADQ4LB21UZWLWSXJ1LPD5YY
ZV8-GHANA-PRESIDENT-NKRUMAH-INAUGURATES-NEW-STEEL-
WORKS-AT-TEMA/query/Nkrumah.
Rodrik, D. (2009) ‘Industrial Policy: Don’t Ask Why, Ask How’, Middle East
Development Journal 1(1): 1–29. DOI: 10.1142/S1793812009000024.
Roemer, M. (1979) ‘Resource-based industrialization in the developing countries:
A survey’, Journal of Development Economics 6(2): 163–202. DOI:
10.1016/0304-3878(79)90012-9.
Rolence, C. and Suleiman, M. (2016) ‘A Review on Tanzanian Leather Value
Chain Status’, African Journal of Science and Research 5(4): 55.60.
Rungu, C. (09.06.2012) ‘Macadamia nut farmers getting robbed’, Daily Nation
[Nairobi, Kenya. Found at: http://www.theeastafrican.co.ke/business/2560-
1423704-15smpnxz/index.html. Last checked on 29.10.2017.
Sato, Yoshiyuki; Waithaka, John (1998) Macadamia Nut Industry in Kenya.
Found at: https://www.samac.org.za/wp-content/uploads/sites/6/2016/07/1.-
Macadamia-nut-industry-in-Kenya.pdf. Last checked on 30.10.2017.
Schaap, Brian; Canby, Kerstin (2018) China's Log Imports from Countries with
Log Export Bans. Trade Trends and Due Diligence Risks. Found at:
https://www.forest-trends.org/wp-content/uploads/2018/07/China-LEB-Policy-
Brief__FINAL_2018.pdf. Last checked on 16.05.2019.
Schrank, A. (2019) ‘Cross-Class Coalitions and Collective Goods: The Farmacias
del Pueblo in the Dominican Republic’, Comparative Politics 51(2): 259–274.
DOI: 10.5129/001041519X15647434969849.

345
Schulz, N. (2015) ‘Dangerous Demographics?: The Effect of Urbanisation and
Metropolisation on African Civil Wars, 1961–2010’, Civil Wars 17(3): 291–
317. DOI: 10.1080/13698249.2015.1100277.
Daily Guide (30.10.2013) ‘Scrap dealers want ban relaxed’. Found at:
https://www.ghanaweb.com/GhanaHomePage/business/Scrap-dealers-want-
ban-relaxed-290390. Last checked on 05.06.2019.
Shadlen, K.C. (2005) ‘Exchanging development for market access?: Deep
integration and industrial policy under multilateral and regional-bilateral trade
agreements’, Review of International Political Economy 12(5): 750–775. DOI:
10.1080/09692290500339685.
Shrewsbury, Linda (2007) Foreign aid and development. The leather industry in
Tanzania. Stillwater, Oklahoma.
Simoes, Alexander; Hidalgo, César (2011) The Economic Complexity
Observatory: An Analytical Tool for Understanding the Dynamics of
Economic Development. Found at: https://atlas.media.mit.edu/en/. Last
checked on 11.03.2018.
Simpson, C. (27.01.2012) ‘Liberia: The Cocoa Comeback’, All Africa. Found at:
http://allafrica.com/stories/201201271592.html. Last checked on 09.03.2018.
Sizer, Nigel; Plouvier, Dominiek (2000) Increased Investment And Trade By
Transnational Logging Companies In Africa, The Caribbean And The Pacific.
Implications for the Sustainable Management and Conservation of Tropical
Forests. Found at: http://pdf.wri.org/transnational_logging.pdf. Last checked
on 03.07.2019.
Slater, D. and Ziblatt, D. (2013) ‘The Enduring Indispensability of the Controlled
Comparison’, Comparative Political Studies 46(10): 1301–1327. DOI:
10.1177/0010414012472469.
Small and Medium Enterprises Development Authority (2013) Pre-Feasibility
Study Prime Minister’s Small Business Loan Scheme. Gemstone Lapidary.
Found at:

346
https://www.academia.edu/6621093/Gemstone_lapidary?auto=download. Last
checked on 24.11.2019.
Smith, D.N. and Cooper, J.F. (1997) ‘Control of powdery mildew on cashew in
Tanzania using sulphur dust — an audit of sulphur fate and a proposal for a
new dusting strategy’, Crop Protection 16(6): 549–552. DOI: 10.1016/S0261-
2194(97)00027-6.
Smith, J. and Lee, K. (2018) ‘From colonisation to globalisation: A history of
state capture by the tobacco industry in Malawi’, Review of African Political
Economy 45(156): 186–202. DOI: 10.1080/03056244.2018.1431213.
Sollazzo, Roberto (2018) Gold at the crossroads. Assessment of the supply chains
of gold produced in Burkina Faso, Mali and Niger. Found at:
http://mneguidelines.oecd.org/Assessment-of-the-supply-chains-of-gold-
produced-in-Burkina-Faso-Mali-Niger.pdf. Last checked on 29.04.2019.
Solleder, Olga (2013) Three Essays on Export Taxes. Geneva.
Southern Copper Corporation (2012) May, 2012. Found at:
http://www.southerncoppercorp.com/ENG/invrel/INFDLPresentations/pp1205
15.pdf. Last checked on 24.11.2019.
Spio Garbrah, Ekwow (2016) ‘A Temporary Withdrawal of the Administrative
Directive for the Exportation of Raw Cashew Nut (RCN)’.
Stasavage, D. (2005) ‘Democracy and Education Spending in Africa’, American
Journal of Political Science 49(2): 343–358. DOI: 10.1111/j.0092-
5853.2005.00127.x.
Stiglitz, J.E. and Lin, J.Y. (eds) (2013) The Industrial Policy Revolution I. The
Role of Government Beyond Ideology. Basingstoke: Palgrave Macmillan.
Stokes, Susan; Dunning, Thad; Nazareno, Marcelo; Brusco, Valeria (2013)
Brokers, voters, and clientelism. The puzzle of distributive politics. New York,
NY: Cambridge University Press.

347
Sutton, John; Kpentey, Bennet (2012) An Enterprise Map of Ghana. London, UK.
Found at: https://www.theigc.org/wp-content/uploads/2012/04/An-Enterprise-
Map-of-Mozambique-English.pdf. Last checked on 24.05.2019.
Sutton, John; Olomi, Donath (2012) An Enterprise Map of Tanzania. London,
UK.
Tachibana, Satoshi (2019) FOREST-RELATED INDUSTRIES AND TIMBER
EXPORTS OF MALAYSIA: POLICY AND STRUCTURE.
Talbot, J.M. (2002) ‘Tropical commodity chains, forward integration strategies
and international inequality: Coffee, cocoa and tea’, Review of International
Political Economy 9(4): 701–734. DOI: 10.1080/0969229022000021862.
Tang, Xiaoyang (2016) Chinese Investment in Ghana’s Manufacturing Sector.
Found at:
https://static1.squarespace.com/static/5652847de4b033f56d2bdc29/t/5890c894
9f7456cd34ce43f7/1485883542741/ghana+v6.pdf. Last checked on
24.11.2019.
BBC (24.04.2013) ‘Tanzania riots over cashew nut payments’. Found at:
https://www.bbc.com/news/world-africa-22282599. Last checked on
18.06.2019.
The Citizen (05.02.2012) ‘Tanzania: Uncertainty clouds future of local leather
sector’. Found at: https://www.sadocc.at/sadocc.at/news/2012/2012-028.shtml.
Last checked on 20.07.2019.
Tarrow, S. (2010) ‘The Strategy of Paired Comparison: Toward a Theory of
Practice’, Comparative Political Studies 43(2): 230–259. DOI:
10.1177/0010414009350044.
Taylor, C. D.; Schulz, K. J.; Doebrich, J. L.; Orris G.J.; Denning, P. D.;
Kirschbaum, M.J (2009) ‘Geology and nonfuel mineral deposits of Africa and
the Middle East’. Found at: https://pubs.usgs.gov/of/2005/1294/e/.

348
Ghana Web (29.09.1999) ‘Tema Steel Company’. Found at:
https://www.ghanaweb.com/GhanaHomePage/business/TEMA-STEEL-
COMPANY-47539. Last checked on 31.05.2019.
Terheggen, Anne (2011a) The Tropical Timber Industry in Gabon. A Forward
Linkages Approach to Industrialisation. Found at: https://mpra.ub.uni-
muenchen.de/37976/1/MPRA_paper_37976.pdf. Last checked on 25.02.2019.
Terheggen, Anne (2011b) The Tropical Timber Industry in Gabon. A Forward
Linkages Approach to Industrialisation. Found at: https://mpra.ub.uni-
muenchen.de/37976/1/MPRA_paper_37976.pdf. Last checked on 25.02.2019.
Tessmann, J. and Fuchs, M. (2016) ‘Loose coordination and relocation in a South-
South value chain: Cashew processing and trade in southern India and Ivory
Coast’, DIE ERDE 147(3): 209–218.
Thairu, N. (13.08.2018) ‘Macadamia farmers say cartels, rules lower prices and
ruin trade’, The Star [Nairobi, Kenya. Found at: https://www.the-
star.co.ke/news/2018/08/13/macadamia-farmers-say-cartels-rules-lower-prices-
and-ruin-trade_c1801045. Last checked on 09.09.2018.
Timber-Online.net (14.12.2018) ‘The new 1 million sm³ sawmill: Labe Wood to
be launched in 2020’. Found at: https://www.timber-
online.net/schnittholz/2018/12/the-new-1-million-sm3-sawmill.html. Last
checked on 24.11.2019.
The Republic of Kenya (2013a) Agriculture, Fisheries and Food Authority Act.
Found at: http://www.agricultureauthority.go.ke/wp-
content/uploads/2016/03/Agriculture-Fisheries-and-Food-Authority-Act-No.-
13-of-2013.pdf. Last checked on 11.11.2018.
The Republic of Kenya (2013b) The Agriculture, Fisheries and Food Authority
Act, 2013. Found at: http://nuts.agricultureauthority.go.ke/wp-
content/uploads/2017/02/AgricultureFisheriesandFoodAuthorityNo13of2013.p
df. Last checked on 08.10.2017.

349
The United Republic of Tanzania (2016) 2014/15 Annual Agricultural Sample
Survey Report. Found at:
http://www.nbs.go.tz/nbs/takwimu/Agriculture/Annual_Agricultural_Sample_
Survey_Report2014_15.pdf. Last checked on 14.02.2018.
Thomson, H. (2018) ‘Grievances, Mobilization, and Mass Opposition to
Authoritarian Regimes: A Subnational Analysis of East Germany’s 1953
Abbreviated Revolution’, Comparative Political Studies 1: 001041401875875.
DOI: 10.1177/0010414018758757.
Thoya, F. (24.06.2000) ‘MPs warn Wako on cashews collapse’, Daily Nation
[Nairobi, Kenya. Found at: https://www.nation.co.ke/news/1056-366016-
l8ifmiz/index.html. Last checked on 08.09.2018.
Hortfresh Journal ‘Tide change for Kenya Macadamia’. Found at:
http://hortfreshjournal.com/awstats/articles/Macadamia%20story.pdf. Last
checked on 30.10.2017.
Tim Best Direct (2019) ‘Tanzania’. Found at:
https://www.timbestdirect.com/destination/tanzania/.
Timberland Investment Resources (2014) The Global Supply Chain. An
Introduction to Global Wood Product Markets and Trade for Timberland
Investors. Found at: https://1nzy1a2az6m43b6rbr2f9hib-wpengine.netdna-
ssl.com/wp-content/uploads/2014/08/Global-Supply-Chain-Timber-2014-08-
14.pdf. Last checked on 25.05.2019.
Trade Mark Southern Africa (2011) ‘Tanzania Potential Hide and Skin Export
Ban’.
Treue, Thorsten (1999) Politics and Economic of High Forest Management in
Ghana. Copenhagen, Denmark.
Treue, Thorsten (2001) Politics and Economics of Tropical High Forest
Management. A case study of Ghana. Dordrecht: Springer Netherlands.
Tutwa Consulting Group (2017) The South African metal recycling industry in
focus. Available from author on demand.

350
Tyce, M. (2019) ‘The politics of industrial policy in a context of competitive
clientelism: The case of Kenya’s garment export sector’, African Affairs
118(472): 553–579. DOI: 10.1093/afraf/ady059.
U.S. International Trade Commission (1992) Macadamia Nuts: Economic and
Competitive Factors Affecting the U.S. Industry. Found at:
https://www.usitc.gov/publications/332/pub2573.pdf. Last checked on
30.10.2017.
U.S. International Trade Commission (1998) Macadamia Nuts: Economic and
Competitive Conditions Affecting the U.S. Industry. Found at:
https://www.usitc.gov/publications/docs/pubs/332/pub3129.pdf. Last checked
on 30.10.2017.
UN Comtrade Database (2019) ‘Data’. Found at: https://comtrade.un.org/data/.
UNCTAD (2011) An Investment Guide to Zambia. Opportunities and Conditions.
Found at: https://unctad.org/en/Docs/diaepcb201008_en.pdf. Last checked on
22.09.2019.
UNCTAD (2018) ‘Trade Analysis Information System (TRAINS)’. Found at:
http://unctad.org/en/Pages/DITC/Trade-Analysis/Non-Tariff-Measures/NTMs-
trains.aspx.
UNECA (2013) Economic report on Africa 2013. Making the most of Africa's
commodities: Industrializing for growth, jobs and economic transformation.
New York: United Nations Publication.
UNIDO (2004) A Blueprint for the African Leather Industry. A development,
investment and trade guide for the leather industry in Africa. Found at:
https://www.unido.org/resources/publications/creating-shared-
prosperity/agribusiness-and-rural-entrepreneurship/leather-industry. Last
checked on 20.07.2019.
UNIDO (2011) Feasibility study for a cotton spinning mill in 11 sub-Saharan
African countries. Found at:
https://open.unido.org/api/documents/4671535/download/Feasibility%20study

351
%20for%20a%20cotton%20spinning%20mill%20in%2011%20sub-
Saharan%20African%20countries. Last checked on 09.03.2018.
USAID (2002) Overview of the Nigerian Sesame Industry. Washington, D.C.
Found at:
https://www.agmrc.org/media/cms/sesame_subsector_overview_4CC9DED60
6F8A.pdf. Last checked on 26.02.2019.
USAID (2012) The Market for Macadamia Kernels. Found at:
http://pdf.usaid.gov/pdf_docs/PA00KC9B.pdf. Last checked on 29.10.2017.
USDA (2015) Hawaii Macadamia Nuts Final Season Estimates. Found at:
https://www.nass.usda.gov/Statistics_by_State/Hawaii/Publications/Fruits_and
_Nuts/2015/201507macadamia.pdf. Last checked on 30.10.2017.
USGS (2015a) 2015 Minerals Yearbook. Bauxite and Alumina. Found at:
https://s3-us-west-2.amazonaws.com/prd-
wret/assets/palladium/production/mineral-pubs/bauxite/myb1-2015-bauxi.pdf.
Last checked on 13.05.2019.
USGS (2015b) 2015 Minerals Yearbook. Nickel. Found at: https://s3-us-west-
2.amazonaws.com/prd-wret/assets/palladium/production/mineral-
pubs/nickel/myb1-2015-nicke.pdf. Last checked on 13.05.2019.
USGS (2015c) The Mineral Industry of Madagascar in 2015. Found at:
https://prd-wret.s3-us-west-
2.amazonaws.com/assets/palladium/production/atoms/files/myb3-2015-ma.pdf.
Last checked on 19.09.2019.
Vale (2008) ‘Vale has approved bauxite and alumina projects’. Found at:
http://www.vale.com/EN/investors/information-market/Press-
Releases/Pages/vale-aprova-novos-projetos-de-bauxita-e-alumina.aspx.
van de Walle, Nicolas (2001) African economies and the politics of permanent
crisis, 1979 - 1999. Cambridge: Cambridge University Press.
van Evera, Stephen (1997) Guide to methods for students of political science.
Ithaca N.Y, London: Cornell University Press.

352
van Velthuizen, Harrij (2007) Mapping biophysical factors that influence
agricultural production and rural vulnerability. Rome: Food and Agriculture
Organization of the United Nations.
Vandenabeele, J. (2010) ‘Which way for macadamia nuts?: John Waithaka sheds
some light on the potential and future of this food tree’, Miti. Found at:
https://issuu.com/mitimagazine/docs/miti-5. Last checked on 30.10.2017.
Varshney, Ashutosh (1998) Democracy, development, and the countryside.
Urban-rural struggles in India. Cambridge: Cambridge University Press.
Vinokor, M.A. (18.03.2016) ‘Ban on cashew nut export: Spio-Garbrah to face
vote of censure’, Graphic Online [Accra, Ghana. Found at:
http://ghana.ahk.de/news/single-view/artikel/ban-on-cashew-nut-export-spio-
garbrah-to-face-vote-of-
censure/?L=15&cHash=7c35ed9bfc7e7daa4e7fbccbb2701a7d. Last checked
on 02.12.2018.
Vogt, M., Bormann, N.-C., Rüegger, S., Cederman, L.-E., Hunziker, P. and
Girardin, L. (2014) ‘Integrating Data on Ethnicity, Geography, and Conflict’,
Journal of Conflict Resolution 59(7): 1327–1342. DOI:
10.1177/0022002715591215.
Wachira, M. (30.07.2009) ‘Kenya bans cashew nuts export’, Daily Nation
[Nairobi, Kenya. Found at: https://www.nation.co.ke/news/1056-632252-
jn7kpkz/index.html. Last checked on 07.11.2018.
Waithera, A. (02.03.2019) ‘Macadamia farmers to build Sh300m processing
plant’, The Star. Found at: https://www.the-star.co.ke/counties/central/2019-
03-02-macadamia-farmers-to-build-sh300m-processing-plant/. Last checked on
24.11.2019.
Wanzala, J. (29.08.2016) ‘To export or not to export? Why question h plagued
macadamia trade for years’, Standard Digital [Nairobi, Kenya. Found at:
https://www.standardmedia.co.ke/business/article/2000213866/to-export-or-
not-to-export-why-question-has-plagued-macadamia-trade-for-years. Last
checked on 27.10.2017.

353
Wanzala, O. (11.02.2018) ‘Nut processors want exporters barred by all means’,
Daily Nation [Nairobi, Kenya. Found at:
https://www.nation.co.ke/business/Nut-processors-want-exporters-barred-by-
all-means/996-4300050-14f3odhz/index.html. Last checked on 09.09.2018.
Warburton, E. (19.10.2017) ‘The life and death of Indonesia’s mineral export
ban’, Inside Indonesia. Found at: https://www.insideindonesia.org/the-life-and-
death-of-indonesia-s-mineral-export-ban-3. Last checked on 24.04.2019.
Watson, Derrill D. (2013) Political economy synthesis. The food policy crisis.
Helsinki: WIDER.
My Joy Online (05.01.2016) ‘Western Steel undergoes massive restructuring’.
Found at: https://www.myjoyonline.com/business/2016/January-5th/western-
steel-undergoes-massive-restructuring.php. Last checked on 10.07.2019.
Whitfield, Lindsay; Therkildsen, Ole; Buur, Lars; KjÆr, Anne Mette (2015) The
Politics of African Industrial Policy. A Comparative Perspective. New York:
Cambridge University Press.
(07.10.2017) ‘Why are donkeys facing their 'biggest ever crisis'?’. Found at:
https://www.bbc.com/news/world-africa-41524710. Last checked on
15.04.2019.
Widner, J.A. (1993) ‘The origins of agricultural policy in Ivory Coast 1960–86’,
Journal of Development Studies 29(4): 25–59. DOI:
10.1080/00220389308422294.
William Ruto, Minister of Agriculture (17.07.2009) The Agriculture (prohibition
Of Exportation Of Raw Nuts) Order, 2009 . Found at:
ftp://193.43.36.92/TC/CPF/Countries/Kenya/Export%20Ban-2009.pdf. Last
checked on 08.10.2017.
Williams, G. (1985) ‘Marketing without and with marketing boards: the origins of
state marketing boards in Nigeria’, Review of African Political Economy
12(34): 4–15. DOI: 10.1080/03056248508703647.

354
Wilson, Trevor (2013) The Red Meat Value Chain in Tanzania. A Report from
the Southern Highlands Food Systems Programme. Found at:
http://www.fao.org/fileadmin/user_upload/ivc/PDF/SFVC/Tanzania_Red_Mea
t.pdf. Last checked on 09.07.2017.
World Bank (1981) Accelerated Development in Sub-Saharan Africa. An Agenda
for Action. Washington, D.C. Found at:
http://documents.worldbank.org/curated/en/702471468768312009/Accelerated
-development-in-sub-Saharan-Africa-an-agenda-for-action. Last checked on
25.02.2019.
World Bank (1987) Ghana Forestry Sector Revie. Report No. 6817-G. Western
Africa Region. Found at:
http://documents.worldbank.org/curated/en/583391468249621283/pdf/multi-
page.pdf. Last checked on 29.05.2019.
World Bank (1988) Ghana - Forest Resource Management Project (English).
Washington, D.C. Found at:
http://documents.worldbank.org/curated/en/299061468030534536/Ghana-
Forest-Resource-Management-Project. Last checked on 03.07.2019.
World Bank (2011) Light Manufacturing in Africa: Focused Policies to Enhance
Private Investment and Create Millions of Productive Jobs. VOLUME II The
Value Chain and Feasibility Analysis Domestic Resource Cost Analysis.
Washington D.C. Found at:
http://siteresources.worldbank.org/DEC/Resources/FinalVolumeII.pdf. Last
checked on 20.07.2019.
World Bank (2018) ‘World Development Indicators’. Found at:
https://data.worldbank.org/products/wdi.
World Bank; ETG (2015) Kenya Leather Industry. Diagnosis, Strategy, and
Action Plan. Found at:
http://documents.worldbank.org/curated/en/397331468001167011/pdf/99485-
REVISED-Kenya-Leather-Industry.pdf. Last checked on 06.07.2017.

355
WTO (2004) ‘Export restrictions and taxes: Agriculture Negotions
Backgrounder’. Found at:
https://www.wto.org/english/tratop_e/agric_e/negs_bkgrnd09_taxes_e.htm.
WTO (2012) Trade Policy Review. East African Community (EAC). Found at:
https://www.wto.org/english/tratop_e/tpr_e/tp371_e.htm. Last checked on
18.08.2019.
WTO (2018) ‘Trade Policy Reviews’. Found at:
https://www.wto.org/english/tratop_e/tpr_e/tpr_e.htm.
Wu, C.-H. (2013) ‘Access to Raw Materials: The EU's Pursuit of New Trading
Rules on Export Control’, in van Vooren, B. (ed) The EU's role in global
governance. The legal dimension. Oxford: Oxford Univ. Press, 178–92.
Wucherpfennig, J., Weidmann, N.B., Girardin, L., Cederman, L.-E. and Wimmer,
A. (2011) ‘Politically Relevant Ethnic Groups across Space and Time:
Introducing the GeoEPR Dataset’, Conflict Management and Peace Science
28(5): 423–437. DOI: 10.1177/0738894210393217.
Yager, Thomas (2019) The Mineral Industry of Botswana 2015. Found at:
https://prd-wret.s3-us-west-
2.amazonaws.com/assets/palladium/production/atoms/files/myb3-2015-
botswana.pdf. Last checked on 19.09.2019.
Yeboah, O.A. and Atoklo, D. (12.10.2018) ‘The scrap-metal industry …a multi-
billion-dollar business left for the average Joe’, B&FT Online. Found at:
https://thebftonline.com/2018/editors-pick/the-scrap-metal-industry-a-multi-
billion-dollar-business-left-for-the-average-joe/. Last checked on 04.06.2019.

356
Appendix
Appendix for Chapter 2
Appendix 2.1. List of All Export Bans Imposed Since 1988
Sector Country Name in Document Year of Introduction Stage of Processing
Animal Burkina Faso
donkeys, horses, camels and their products
2016 raw, capital
Burundi fresh unprocessed fish (Nile Perch and Tilapia)
2009 raw
Guinea cattle products 2007 raw, capital
dairy products 2007 raw, intermediate, consumer
fish products 2007 raw, intermediate, consumer
pig products 2007 raw
Kenya fresh unprocessed fish (Nile Perch and Tilapia)
2005 raw
Madagascar
Live Cattle 2002 raw, capital
Mali young male bovine animals, five years old and less, and of non-sterile breeding females of the bovine species
1989-1998 capital
Niger Live Donkeys and Asses 2016 raw
Nigeria raw materials (except for cocoa beans)
1992 raw
Rwanda fresh unprocessed fish (Nile Perch and Tilapia)
2009 raw
Tanzania fresh unprocessed fish (Nile Perch and Tilapia)
2005 raw
Uganda fresh unprocessed fish (Nile Perch and Tilapia)
2005 raw
Uganda whole fresh fish 1995-2001 raw
Zimbabwe
Goats 2010 raw
Food Products
Guinea Sugar 2005-2011 intermediate, consumer
Madagascar
Sugar 2011 intermediate, consumer
Niger Cattle feed 2005 consumer
Nigeria Maize (and derivatives) 1988 raw
Zambia Maize corn 2012 raw
Fuels Guinea petroleum products 2005-2011 intermediate, consumer
Hides and Skins
Botswana Calf skins, skins and dry hides and wet salted hides
1939 raw

357
Burkina Faso
Raw Sheep and Goat Skin
1995 raw
Burundi Raw Hides and Skins 2015 raw
Kenya Raw Hides and Skins 2013 raw
Nigeria All unfinished leather (raw hides and skins, semi-processed hides and skins)
1988 raw, intermediate
Rwanda Raw Hides and Skins 2015 raw
Tanzania Raw Hides and Skins 2012 raw
Uganda Raw Hides and Skins 2015 raw
Zambia Raw Hides and Skins 2002-2009 raw
Mach and Elec
Burundi used automobile batteries, lead scrap, crude and refined lead and all forms of scrap metals
2010 capital
Kenya used automobile batteries, lead scrap, crude and refined lead and all forms of scrap metals
2010 capital
Rwanda used automobile batteries, lead scrap, crude and refined lead and all forms of scrap metals
2010 capital
Tanzania used automobile batteries, lead scrap, crude and refined lead and all forms of scrap metals
2010 capital
Uganda used automobile batteries, lead scrap, crude and refined lead and all forms of scrap metals
2010 capital
Metals Angola scrap metal 2013 raw
Burundi used automobile batteries, lead scrap, crude and refined lead and all forms of scrap metals
2010 raw
waste and scrap of ferrous cast iron;
2009 raw
Cameroon
scrap metal and ferrous and non-ferrous metal waste
2008 raw
Cote d'Ivoire
Ferrous waste and scrap 2009 raw
Ghana Ferrous Waste and Scrap
1988 raw

358
Ferrous Waste and Scrap
2013 raw
Kenya used automobile batteries, lead scrap, crude and refined lead and all forms of scrap metals
2010 raw
waste and scrap of ferrous cast iron;
2005 raw
Madagascar
Scrap of All kinds 2012 raw
Malawi Scrap metal 2008 raw
Mauritius copper, copper alloys, waste, and scrap
2012 raw
Nigeria Scrap metal 1988 raw
raw materials (except for cocoa beans)
1992 raw
Rwanda used automobile batteries, lead scrap, crude and refined lead and all forms of scrap metals
2010 raw
waste and scrap of ferrous cast iron;
2009 raw
Senegal scrap metal and ferrous by-products
2013 raw
South Africa
Metal Scrap (ferrous and non-ferrous)
2013 raw
Tanzania used automobile batteries, lead scrap, crude and refined lead and all forms of scrap metals
2010 raw
waste and scrap of ferrous cast iron;
2005 raw
Uganda used automobile batteries, lead scrap, crude and refined lead and all forms of scrap metals
2010 raw
waste and scrap of ferrous cast iron;
2005 raw
Zimbabwe
Scrap metal 2004 raw
Minerals Zimbabwe
Unprocessed chrome ore (including concentrate)
2007-2009; 2011-2015 raw
Plastic or Rubber
Nigeria unprocessed rubber latex and rubber lumps
1988 raw
Stone and Glass
Angola Rough Diamonds / Unworked Diamonds (unclear whether implemented)
2011 raw
Botswana unprocessed (uncut) semi-precious stones
2003-2009 raw
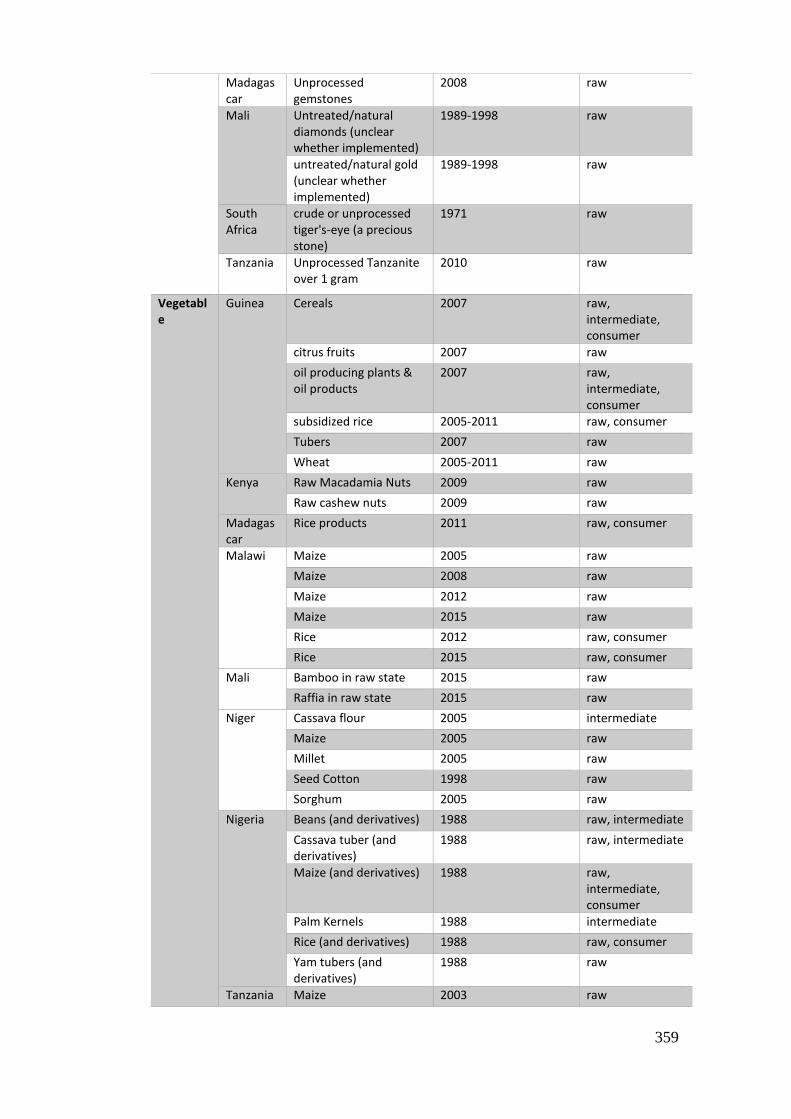
359
Madagascar
Unprocessed gemstones
2008 raw
Mali Untreated/natural diamonds (unclear whether implemented)
1989-1998 raw
untreated/natural gold (unclear whether implemented)
1989-1998 raw
South Africa
crude or unprocessed tiger's-eye (a precious stone)
1971 raw
Tanzania Unprocessed Tanzanite over 1 gram
2010 raw
Vegetable
Guinea Cereals 2007 raw, intermediate, consumer
citrus fruits 2007 raw
oil producing plants & oil products
2007 raw, intermediate, consumer
subsidized rice 2005-2011 raw, consumer
Tubers 2007 raw
Wheat 2005-2011 raw
Kenya Raw Macadamia Nuts 2009 raw
Raw cashew nuts 2009 raw
Madagascar
Rice products 2011 raw, consumer
Malawi Maize 2005 raw
Maize 2008 raw
Maize 2012 raw
Maize 2015 raw
Rice 2012 raw, consumer
Rice 2015 raw, consumer
Mali Bamboo in raw state 2015 raw
Raffia in raw state 2015 raw
Niger Cassava flour 2005 intermediate
Maize 2005 raw
Millet 2005 raw
Seed Cotton 1998 raw
Sorghum 2005 raw
Nigeria Beans (and derivatives) 1988 raw, intermediate
Cassava tuber (and derivatives)
1988 raw, intermediate
Maize (and derivatives) 1988 raw, intermediate, consumer
Palm Kernels 1988 intermediate
Rice (and derivatives) 1988 raw, consumer
Yam tubers (and derivatives)
1988 raw
Tanzania Maize 2003 raw

360
Maize 2008 raw
Zambia Maize 1995 raw
Maize 2002 raw
Zambia Maize corn 2012 raw
Zimbabwe
Maize and wheat seed, GMO-free maize grain, mealie meal, rapoko (grain, meal and malt), sunflower
2010 raw
Wood Benin Charcoal 1997 consumer
teak in the rough 1997 raw
All unprocessed timber 2005 raw
Burkina Faso
Charcoal 2004 consumer
Commercialization and Export of all lumber
2005 raw, intermediate, consumer
Burundi wood charcoal 2009 consumer
Round-wood timber 2009 raw
Cameroon
Ban on export of more than 20 species of raw logs
1999 raw
Congo, Dem. Rep.
Raw logs 2002 raw
Timber (rough/unprocessed)
2002 raw
Congo, Republic
Rough timber 2000 raw
Cote d'Ivoire
rough timber, (initially excluding teak, but since 1999 including all types)
1995 raw
wood square sawn and in boules, except for timber from plantations (for example teak) [export of further processed wood is allowed]
1995 intermediate
Ban on harvesting, transporting, and trading of Pterocarpus spp. (e.g., padauk, kosso or “bois de vêne")
2013 raw, intermediate, consumer
Djibouti All Wood (whether processed or not)
2004 raw, intermediate, consumer
Gabon All unprocessed logs 2010 raw
Ghana 14 species of commonly exported timber logs
1979 raw
All unprocessed timber logs
1994

361
A ban on felling, harvesting, and exporting of rosewood (independent of the degree of processing)
2014 Raw, intermediate, consumer
Guinea Logs 2005-2011 raw
Guinea-Bissau
A ban on felling, harvesting, and exporting any timber
2015 Raw, intermediate, consumer
Kenya Round-wood timber 2005 raw
wood charcoal 2005 consumer
Madagascar
semi-processed wood products [‘but authorizes exports in finished form’]
2007 intermediate
unprocessed wood products
2007 raw
Prohibition on logging, transport, and export of rosewood and ebony (independent of the degree of processing)
2010 raw, intermediate, consumer
Malawi Raw/round hardwood timber
2008 raw
Mali building wood in raw state
2015 raw
Charcoal 2015 consumer
fire wood in raw state 2015 raw
Timber in raw state 2015 raw
Mozambique
22 “1st class” species are banned from export in log form (2nd to 4th class not banned).
2002 raw
Expansion of export ban on most species in raw form
2007 raw
Ban on all species in raw form
2015 raw
Ban on the harvesting and collection (and therefore export) of timber of Pterocarpus tinctorius (Nkula), Swartzia madagascariensis (Ironwood), and Combretum imberbe (Mondzo)
2018 Raw, intermediate, consumer
Nigeria Timber Rough 1988 raw
Timber Sawn 1988 intermediate
Rwanda wood charcoal 2009 consumer
Round-wood timber 2009 raw

362
Senegal Ban of all rosewood product exports
1998 Raw, intermediate, consumer
Sierra Leone
raw timber logs 2008 raw
Tanzania Round-wood timber 2004 raw
wood charcoal 2005 consumer
Togo Charcoal 2011 consumer
Timber logs 2011 raw
Uganda Charcoal 1987 consumer
Timber 2003 raw
Timber 1987 raw Zambia Charcoal 1996 consumer
timber logs 1996 raw

363
Appendix 2.2. Total Annual Introduction of New Export Bans in 36
African WTO Member States by Commodity Type and for ‘Named’
Products Only
Source: Own Illustration based on EPTA dataset.
0
5
10
15
20
25
19
39
19
42
19
45
19
48
19
51
19
54
19
57
19
60
19
63
19
66
19
69
19
72
19
75
19
78
19
81
19
84
19
87
19
90
19
93
19
96
19
99
20
02
20
05
20
08
20
11
20
14
Cash Crops Wood Other

364
Appendix 2.3. The Cost of Setting Up Commodity Processing Industries (Full Table)
Commodity Capital Investment (US$ per Unit of Year. Prod.)
Unit Country Annual Production Country ('000)
World Production ('000)
Capital Cost to Process All ('000,000)
Market Power
Annual Budget ('000,000) (CIA 2017)
Capex/Budget
Sources for Capital Cost
Bauxite 766 tons of bauxite
Guinea 16,303 299,000 12,488.1 5.5% 1,599 781.0% (The New Humanitarian 2004; MUBADALA 2019; Camara 2018; Husband et al. 2009; Indian Ministry of Mines 2009; Vale 2008)
Sierra Leone 1,344 299,000 1,029.5 0.4% 684 150.5%
Ghana 1,026 299,000 785.9 0.3% 9,236 8.5%
Copper Concentrate
3,713 tons of refined copper
DRC 1,020 23,000 3,787.3 4.4% 3,238 117.0% (Asmarini 2014; Daly 2018; Southern Copper Corporation 2012) Zambia 712 23,000 2,643.7 3.1% 4,895 54.0%
South Africa 77 23,000 287.4 0.3% 92,380 0.3%
Manganese Ore
1,190 tons of refined manganese
South Africa 5,500 18,000 6,545.0 30.6% 92,380 7.1% (Gulf Manganese Corporation
Limited 2015; NEDBANK 2018)
Gabon 2,300 18,000 2,737.0 12.8% 3,122 87.7%
Ghana 850 18,000 1,011.5 4.7% 9,236 11.0%
Metal Waste and Scrap
195 tons of final metal
Nigeria 4,000 600,000 780.0 0.7% 13,970 5.6% (KPMG Global Mining Institute 2014; Ghana News Agency 2015; Tang 2016) South Africa 3,000 600,000 585.0 0.5% 92,380 0.6%
Kenya 1,000 600,000 195.0 0.2% 15,370 1.3%
Nickel Ore 60,000 tons of pure Nickel
South Africa 57 2,280 3,401.3 2.5% 92,380 3.7% (Miraza 30.11.2012)
Madagascar 46 2,280 2,730.0 2.0% 1,292 211.3%
Botswana 17 2,280 1,007.3 0.7% 5,609 18.0%
Coloured Gemstones
1.3 carat of polished stone
Zambia 124,000 6,448,000 161.2 1.9% 4,895 3.3% (Small and Medium Enterprises Development Authority 2013) Tanzania 70,000 6,448,000 91.0 1.1% 7,872 1.2%
Mozambique 60,000 6,448,000 78.0 0.9% 2,758 2.8%
9 Botswana 14,500 70,900 130.5 20.5% 5,609 2.3% (Business Report 2004)

365
Unpolished diamonds
carat of polished stone
South Africa 5,780 70,900 52.0 8.2% 92,380 0.1%
DRC 3,200 70,900 28.8 4.5% 3,238 0.9%
Unrefined Chromite
208 tons of chromite
South Africa 12,000 28,000 2,496.0 42.9% 92,380 2.7% (Afrochine Smelting P/L 2019)
Zimbabwe 425 23,700 88.0 1.8% 3,600 2.4%
Madagascar 198 28,000 41.0 0.7% 1,292 3.2%
Unrefined Gold
450,000 tons of refined gold
South Africa 0.14 3.12 65.0 4.6% 92,380 0.1% (Business World 2017; Ghana News Agency 2017; Curnow 2010) Ghana 0.08 3.12 35.6 2.5% 9,236 0.4%
Tanzania 0.05 3.12 20.3 1.4% 7,872 0.3%
Cocoa beans 725 tons of raw beans
Côte d'Ivoire 1,796 4,792 1,302.1 37.5% 7,121 18.3% (Reuters 2008; Cocks and Aboa 2010; Dodoo 2018; FMO 2019) Ghana 859 4,792 622.6 17.9% 9,236 6.7%
Nigeria 302 4,792 219.0 6.3% 13,970 1.6%
In-Shell Macadamia
333 tons in-shell
South Africa 47 158 15.6 29.6% 92,380 0.0% (Business Daily Africa 2014; Waithera
2019)
Kenya 24 158 8.0 15.1% 15,370 0.1%
Malawi 7 158 2.2 4.1% 1,298 0.2%
Raw Cashews
400 tons of in-shell nut
Côte d'Ivoire 711 3,971 284.4 17.9% 7,121 4.0% (Hub Rural 2006)
Tanzania 164 3,971 65.7 4.1% 7,872 0.8%
Benin 152 3,971 60.7 3.8% 1,372 4.4%
Raw cotton 1,708 tons of cotton lint
Burkina Faso 280 24,773 478.2 1.1% 2,635 18.1% (Development Studies Associates 2008; UNIDO 2011) Mali 252 24,773 430.1 1.0% 3,068 14.0%
Côte d'Ivoire 134 24,773 228.0 0.5% 7,121 3.2%
Raw Hides and Skins
1,682 tons of raw hides & skins
South Africa 89 8,126 150.5 1.1% 92,380 0.2% (CTGN 2015; La Conceria 2018)
Tanzania 64 8,126 108.4 0.8% 7,872 1.4%
Nigeria 62 8,126 104.3 0.8% 12,110 0.9%
Sesamum seed
278 Tanzania 806 5,532 224.0 14.6% 7,872 2.8% (Huynh et al. 2017)
Nigeria 550 5,532 152.9 9.9% 13,970 1.1%

366
tons of sesamum seed
Burkina Faso 164 5,532 45.5 3.0% 2,635 1.7%
Tea in Bulk 20 tons of bulk tea
Kenya 440 6,101 8.8 7.2% 15,370 0.1% Price study of tea packing machines on Alibaba Website. Plus Neupane et al. (2016)
Uganda 64 6,101 1.3 1.0% 4,019 0.0%
Burundi 54 6,101 1.1 0.9% 608 0.2%
Unmanufactured Tobacco
400 tons of tobacco
Zimbabwe 182 6,502 72.7 2.8% 3,600 2.0% (Namutowe 2014)
Zambia 132 6,502 52.6 2.0% 4,895 1.1%
Tanzania 104 6,502 41.8 1.6% 7,872 0.5%
Unprocessed Roundwood
69 sm³ of log
South Africa 13,762 1,906,769 942.7 0.7% 92,380 1.0% (Evans 1992; Timber-Online.net 2018; Forintek Canada Corp. 2007; Mason 2004; Menard et al. 2000)
Nigeria 10,022 1,906,769 686.5 0.5% 13,970 4.9%
DRC 4,611 1,906,769 315.9 0.2% 3,238 9.7%

367
Appendix for Chapter 3
Appendix 3.1. Main Sources for Tables 3.2 as well as 2.1 and 2.2
Metal Waste – own research in Ghana and Lemnge (2011), OECD (2017), Tutwa
Consulting Group (2017);
Wood – own research and Terheggen (Morris et al.; 2011b), Morris et al. (2012);
Chromite - Parliament of Zimbabwe (2013)
(Semi-)Precious Stones – own research and Kyngdon-McKay et al. (2016);
Diamonds – own research in Tanzania and Grynberg (2013), Mbayi (2011), Engwicht
(2018);
Hides and Skins – own research and China and Ndaro; Curtis; FAO; World Bank; World
Bank and ETG (2015; 2010; 2015; 2011; 2015);
Cashew – own research and ACi et al. (2015), Bassett et al. (2018), Tessmann and Fuchs
(2016); Cocoa – own research and Fold; Kaplinsky; Kolavalli et al.; Talbot (2002; 2004;
2012; 2002);
Cotton – ACET; Bargawi et al.; Ebia; Mwinuka, L. & Maro, F.; Ngaruko and Mbilinyi;
UNIDO (; 2019; 2018; 2013; 2014; 2011);
Gold – own research and Sollazzo (2018);
Macadamia – own research.
Sesame - Abebe; Adagba; Munyua et al.; USAID (2016; 2014; 2013; 2002);
Tea – own research and Talbot (2002);
Tobacco - Goger et al.; Hu and Lee; Labonté et al. (2014; 2015; 2018).

368
Appendix for Chapter 4
Appendix 4.1. Overview of Commodity-Based Population Share Imputation Factors
Crop Country Year Number
of Raw
Producer
s (,000)
Definition Used for Producers Producti
on (,000)
Pro-
duc-
tion
Unit
Country-
Year
Imputatio
n Factor
Final
Comm-
odity
Imputatio
n Factor
Sources (to
be added)
Cashew Tanzania
Mainland
2015 345 Farm Operator 179 tons 1.9343 1.940 The United
Republic of
Tanzania
(2016)
Tanzania
(Mtwara)
2008 124 Households 63 1.9461
Chromite Zimbabwe 2011 3 Employment in Chrome Mining 599 tons 0.0048 0.002
South Africa 2007 10 Number of Employees in South
African Chromite Mines
9647 0.0010
2008 12 9683 0.0013
2009 11 6865 0.0016
2010 14 10871 0.0013
2011 17 10721 0.0016
2012 20 11310 0.0017
2013 18 13645 0.0013
2014 19 14038 0.0013
2015 18 15684 0.0012
2016 15 14705 0.0011
2017 17 16587 0.0010

369
Madagascar 2008 0.4 Number of Employees at Kraomita
Malagasy (100% of Malagasy
production)
113 0.0034
Cocoa Ghana 2008 800 Farms 729 tons 1.0974 1.455
Côte d'Ivoire 800 1382 0.5787
Cameroon 400 149 2.6882
Cotton
(Seed
Cotton)
Tanzania
Mainland
2015 411 Farm Operator 336 tons 1.2212 0.925
Tanzania
(Shirinyaga)
2008 233 Households 304 0.7660
Benin 2004 325 Farms 426 0.7625
Burkina Faso 200 535 0.3736
Chad 350 233 1.5021
Mali 200 590 0.3391
Côte d'Ivoire 2017 120 Farms (producteurs sur des
exploitations de type familiales
d’environ 3 hectares en moyenne)
378 0.3172
Burkina Faso 2017 350 Farms 900 0.3887
Uganda 1991 72 Holdings 27 2.7003
Zambia 1990 46 Farm Holders 52 0.8781
Diamond
(ASM)
Central African
Republic
2012 80 Artisanal and Small-Scale Miners
involved in Diamond mining
366 carats 0.2186 0.130
Democratic
Republic of the
Congo
2007 700 28452 0.0246
Ghana 1995 60 623 0.0964
Sierra Leone 2005 120 669 0.1794
South Africa 2013 14 Average number of people in service 8168 carats 0.0017 0.002

370
Diamond
(LSM)
Namibia 2007 3 Employees of NamDeb 2266 0.0013
Botswana 2004 7 Employees of Debswana (which
accounts for 100% of Botswana
Diamond Production)
24658 0.0003
Lesotho 2012 2 Workers employed in Diamond mining
sector
479 0.0042
Diamond
(Mixed)
Zimbabwe 2009 25 Both illegal and formal workers in the
Marange Diamond fields
964 carats 0.0259 0.015
Angola 2007 110 Both employees at large-scale mine
sites (around 10,000) and another ca.
100,000 Artisanal)
9702 0.0113
Tanzania 2017 2 Employees at Williamson Mine and
Artisanal miners
253 0.0079
Metal
Waste
and Scrap
South Africa 2017 275 Metal Waste and Scrap Collectors 294,800,0
00,000
Popula
tion *
GDP
p.c.
0.000001 0.000001
Raw
Hides and
Skins
Tanzania 2013 3 Raw Hides and Skins Collectors 79 tons 0.0318 0.032
(Semi-)
Precious
Stones
Tanzania 2010 20 Employees in LSM and ASM 43000 USD
export
value
0.465 0.465
Sesame Tanzania
Mainland
2015 760 Farm Operator 149 tons 5.0999 3.965
Ethiopia 2015 867 Holders 289 3.0036
Uganda 2008 322 Households 85 3.7919
Tea Tanzania
Mainland
2015 9 Farm Operator 92 tons 0.0993 1.259
Uganda 2010 62 Farmers (and plantation employees) 50 1.2400

371
Rwanda 2008 23 Households 9 2.4129
Burundi 2018 60 Farmers (and plantation employees) 53 1.1385
Kenya 2016 660 Farmers (and plantation employees) 470 1.4043
Tobacco Tanzania
Mainland
2015 75 Farm Operator 77 tons 0.9757 1.878
Malawi 1995 157 Growers 129 1.2133
Zambia 2000 57 Tobacco Growing Households 10 5.9478
Zimbabwe 2011 57 Tobacco Growers 125 0.4550
Malawi 2012 58 73 0.7981
Wood Angola 2011 1 Formal Employment in Roundwood
Production
1092 m³ 0.0009 0.007
Benin 2 382 0.0052
Botswana 1 105 0.0095
Burkina Faso 2 1135 0.0018
Burundi 1 730 0.0014
Cameroon 11 1396 0.0079
Central African
Republic
4 520 0.0077
Congo 7 1231 0.0057
Côte d'Ivoire 21 1178 0.0178
Democratic
Republic of the
Congo
15 4447 0.0034
Gabon 14 750 0.0187
Ghana 8 1295 0.0062
Guinea 9 582 0.0155
Guinea-Bissau 1 131 0.0076
Kenya 1 660 0.0015

372
Madagascar 4 140 0.0285
Malawi 1 1300 0.0008
Mali 1 437 0.0023
Mozambique 19 1334 0.0142
Niger 1 701 0.0014
Nigeria 30 5849 0.0051
Rwanda 2 731 0.0027
Senegal 13 779 0.0167
Sierra Leone 1 122 0.0082
South Africa 63 8648 0.0073
Swaziland 2 502 0.0040
Tanzania 3 2079 0.0014
Togo 1 123 0.0081
Uganda 3 3166 0.0009
Zambia 2 1203 0.0017
Zimbabwe 1 347 0.0029
373
Appendix 4.2. The Description of Imputation Factor Creation for
Diamonds, Gemstones, and Metal Wastes and Scraps
The imputation factor methodology was amended for three commodities: diamonds, gemstones,
and metal waste and scrap. The employment created by diamond mining fluctuates heavily by
country. Alluvial diamond deposits (as found, for example, in Sierra Leone, Ghana or the DRC)
employ much more people (artisanal and small-scale miners, or ASM) than kimberlitic deposits
(as found in Botswana, Namibia, or South Africa), being mined mostly by large-scale and
capital-intensive mining companies (or LSM). Some countries (like Angola and Zimbabwe)
have a mix between the two deposit types, hence, employ fewer miners than the former and
more than the latter. Consequently, and as detailed in Appendix I, I have created three distinct
diamond-imputation factors for ASM-, LSM-, and mixed-diamond-mining countries.
Gemstones (other than diamonds) are a difficult category for two reasons. First, the commodity
is much less studied than diamonds and often very ASM-dominated, hence, there is little
reliable data on labour shares. Secondly and more critically, it is much harder to compare
gemstone production numbers across gemstone types and thus countries. For example, 20
thousand small-scale miners might produce ten tons of a precious gemstone a year, during the
same period a three large scale mines in another country, employing only 500 people might
produce more than ten-fold the volume in less precious stones (and being of much less value).
Given very complex mixes of diverse gemstones in one country, it is near-impossible to produce
an adequate imputation factor based on gemstone weight. A better basis for a gemstone
imputation factor would be a country’s gemstone export value. High-value gemstones tend to
employ many people, with high per-unit returns attracting many small-scale miners; whereas
the opposite is true for lower-value gemstones. Consequently, it appears reasonable to assume
that higher gemstone export values go in hand with higher employment numbers, and lower
export values with lower employment numbers.
The creation of the imputation factor for metal waste and scraps was arguably the hardest as no
reliable production numbers for metal waste and scrap exist across space and time. And since
metal waste and scrap is often domestically processed, it is difficult to take export figures as a
proxy for production. However, I make the point that the production of metal waste and scrap
can be seen as a function of a country’s population size and its economic development. Larger
populations produce more metal waste and scrap as do more developed economies. Thus, in
this imputation factor calculation production is proxied through a country’s population size
multiplied by its GDP per capita. Importantly, the estimates generated by this alternative
approach appear empirically valid, the pre-calculated number for Ghana closely matching that
given by scrap collector and dealer representatives during fieldwork in 2017.

374
Appendix 4.3. Frequency Distribution of Country-Commodities by
Working Share Cut-Off and Commodity Type
Source: Own illustration based on data from EPTA dataset. Note that working
population shares in % are the average value for all years of a country-
commodity.

375
Appendix 4.4. Exclusion of Commodities I
(6) (7) (8) (9) (10) (11)
No
Cashew
No
Chromit
e
No
Cocoa
No
Cotton
No
Diamond
s
No Hides &
Skins
Population
Share
(Between)
-1.60**
(0.80)
-2.00**
(0.91)
-1.70**
(0.81)
-1.76**
(0.86)
-1.42*
(0.74)
-1.58**
(0.79)
Population
Share
(Within)
-0.12
(0.84)
0.09
(0.77)
-0.15
(0.86)
-0.13
(0.86)
-0.03
(0.84)
-0.03
(0.78)
Ethnicity
(Between)
-1.34
(1.12)
-1.29
(1.12)
-1.33
(1.11)
-1.20
(1.12)
-0.74
(1.16)
-1.11
(1.14)
Ethnicity
(Within)
-2.02
(2.05)
-2.02
(1.80)
-2.65
(1.87)
-3.30*
(1.94)
-2.47
(1.81)
-2.51
(1.87)
Factor
Mobility
1.25***
(0.36)
1.12***
(0.32)
1.01**
*
(0.37)
1.07***
(0.32)
1.12***
(0.32)
1.13***
(0.38)
Polity2
(Between)
-0.07
(0.06)
-0.04
(0.06)
-0.06
(0.06)
-0.06
(0.06)
-0.06
(0.06)
-0.03
(0.06)
Polity2
(Within)
-0.04
(0.07)
-0.06
(0.07)
-0.04
(0.07)
0.02
(0.08)
-0.06
(0.07)
-0.05
(0.07)
Proc.-Raw
Exp. Ratio
(Between)
-0.00
(0.00)
-0.00
(0.00)
-0.00
(0.00)
-0.00
(0.00)
-0.00
(0.00)
-0.00
(0.00)
Proc.-Raw
Exp. Ratio
(Within)
-0.00
(0.00)
-0.00
(0.00)
-0.00
(0.00)
-0.00
(0.00)
-0.00
(0.00)
-0.00
(0.00)
Export
Share
(Between)
-0.13
(0.13)
-0.27*
(0.16)
-0.12
(0.12)
-0.11
(0.12)
-0.12
(0.13)
-0.14
(0.14)
Export
Share
(Within)
0.15*
(0.09)
0.13
(0.09)
0.13
(0.09)
0.14
(0.09)
0.14
(0.09)
0.17*
(0.09)
Market
Power
(Between)
0.04
(0.05)
0.24**
(0.10)
0.03
(0.05)
0.03
(0.05)
0.03
(0.05)
0.03
(0.05)
Market
Power
(Within)
-0.10
(0.10)
-0.09
(0.10)
-0.10
(0.09)
-0.11
(0.10)
-0.09
(0.10)
-0.10
(0.10)
Tariff
Escalation
(Between)
0.01
(0.07)
0.05
(0.07)
0.00
(0.06)
0.02
(0.06)
0.01
(0.06)
0.01
(0.06)
Tariff
Escalation
(Within)
0.01
(0.05)
0.01
(0.04)
0.02
(0.04)
0.03
(0.03)
0.02
(0.04)
0.03
(0.03)
Industry (%
of GDP)
(Between)
0.03
(0.03)
0.02
(0.03)
0.03
(0.03)
0.03
(0.03)
0.03
(0.03)
0.03
(0.02)
Industry (%
of GDP)
(Within)
0.07
(0.04)
0.08*
(0.04)
0.07*
(0.04)
0.08*
(0.04)
0.08*
(0.05)
0.08*
(0.04)

376
GDP p.c.
(Between)
-0.00
(0.00)
-0.00
(0.00)
-0.00
(0.00)
-0.00
(0.00)
-0.00
(0.00)
-0.00
(0.00)
GDP p.c.
(Within)
-0.00
(0.00)
-0.00
(0.00)
-0.00
(0.00)
-0.00
(0.00)
-0.00
(0.00)
-0.00
(0.00)
ODA (% of
GNI)
(Between)
0.06*
(0.04)
0.05
(0.04)
0.06
(0.04)
0.05
(0.04)
0.05
(0.04)
0.04
(0.04)
ODA (% of
GNI)
(Within)
0.02
(0.04)
0.01
(0.04)
0.02
(0.04)
0.02
(0.04)
0.02
(0.04)
0.04
(0.04)
Ideology
(Between)
-0.68
(0.44)
-0.48
(0.44)
-0.61
(0.43)
-0.61
(0.43)
-0.47
(0.48)
-0.63
(0.44)
Ideology
(Within)
0.84
(0.83)
0.81
(0.83)
0.88
(0.82)
0.94
(0.83)
1.10
(0.88)
1.02
(0.87)
Constant -
8.70***
(1.83)
-8.56***
(1.85)
-
8.42**
*
(1.83)
-8.46***
(1.81)
-9.20***
(1.93)
-9.03***
(1.93)
CountID:
sd(_cons)
-1.07
(1.03)
-0.84
(0.74)
-1.01
(0.96)
-0.99
(0.95)
-0.53
(0.48)
-1.95
(5.66)
ComID:
sd(_cons)
-11.68
(111204
)
-11.51
(110615)
-10.76
(33927
)
-16.27
(8266672
)
-13.41
(1130633)
-15.29
(2407843.30
)
Observation
s
2015 2131 2040 1887 2091 1879
* p < 0.10, ** p < 0.05, *** p < 0.01. Polynomials are included in all regressions.

377
Appendix 4.5. Exclusion of Commodities II
(12) (13) (14) (15) (16) (17)
No
Metal
Waste
No Prec.
Stones
No
Sesame
No
Tea
No
Tobacc
o
No
Wood
Population
Share
(Between)
-2.13**
(0.99)
-1.62**
(0.78)
-1.01*
(0.49)
-1.57**
(0.74)
-1.68**
(0.83)
-1.94*
(1.12)
Population
Share
(Within)
-0.81
(1.48)
-0.20
(0.85)
0.03
(1.00)
-0.09
(0.80)
-0.02
(0.83)
0.56
(0.84)
Ethnicity
(Between)
-1.61
(1.20)
-0.85
(1.16)
-1.23
(1.11)
-1.32
(1.12)
-1.64
(1.12)
-6.68
(14.32)
Ethnicity
(Within)
-3.37
(2.07)
-2.51
(2.05)
-2.74
(1.85)
-2.61
(1.88)
-2.04
(1.80)
-5.15
(14.45)
Factor
Mobility
1.01***
(0.34)
1.14***
(0.33)
1.02***
(0.31)
0.86***
(0.33)
0.99***
(0.31)
0.65*
(0.35)
Polity2
(Between)
0.01
(0.08)
-0.07
(0.07)
-0.05
(0.06)
-0.05
(0.06)
-0.02
(0.06)
-0.08
(0.08)
Polity2
(Within)
-0.07
(0.08)
-0.06
(0.07)
-0.03
(0.07)
-0.06
(0.07)
-0.05
(0.07)
-0.07
(0.09)
Proc.-Raw
Exp. Ratio
(Between)
-0.00
(0.00)
-0.00
(0.00)
-0.00
(0.00)
-0.00
(0.00)
-0.00
(0.00)
-0.00
(0.00)
Proc.-Raw
Exp. Ratio
(Within)
-0.00
(0.00)
-0.00
(0.00)
-0.00
(0.00)
-0.00
(0.00)
-0.00
(0.00)
-0.00
(0.00)
Export
Share
(Between)
-0.04
(0.13)
-0.19
(0.14)
-0.15
(0.13)
-0.13
(0.13)
-0.11
(0.12)
-0.46
(0.28)
Export
Share
(Within)
0.15
(0.11)
0.17*
(0.09)
0.13
(0.09)
0.14
(0.09)
0.12
(0.09)
0.13
(0.19)
Market
Power
(Between)
0.06
(0.07)
0.03
(0.05)
0.04
(0.05)
0.03
(0.05)
0.03
(0.05)
0.05
(0.14)
Market
Power
(Within)
-0.05
(0.11)
-0.08
(0.09)
-0.09
(0.09)
-0.10
(0.10)
-0.08
(0.09)
-0.29
(0.27)
Tariff
Escalation
(Between)
0.01
(0.07)
0.02
(0.06)
-0.03
(0.07)
-0.01
(0.06)
0.08
(0.10)
-0.01
(0.07)
Tariff
Escalation
(Within)
0.00
(0.05)
0.02
(0.04)
0.01
(0.05)
0.02
(0.04)
0.01
(0.06)
0.04
(0.04)

378
Industry (%
of GDP)
(Between)
0.05
(0.03)
0.04
(0.03)
0.03
(0.02)
0.03
(0.03)
0.04
(0.03)
0.03
(0.04)
Industry (%
of GDP)
(Within)
0.11*
(0.06)
0.06
(0.05)
0.07
(0.04)
0.07
(0.04)
0.07
(0.04)
-0.01
(0.06)
GDP p.c.
(Between)
-0.00
(0.00)
-0.00
(0.00)
-0.00
(0.00)
-0.00
(0.00)
-0.00
(0.00)
-0.00*
(0.00)
GDP p.c.
(Within)
-0.00**
(0.00)
-0.00
(0.00)
-0.00
(0.00)
-0.00
(0.00)
-0.00
(0.00)
0.00
(0.00)
ODA (% of
GNI)
(Between)
0.09*
(0.05)
0.08*
(0.04)
0.05
(0.04)
0.06
(0.04)
0.04
(0.04)
-0.01
(0.06)
ODA (% of
GNI)
(Within)
0.01
(0.04)
0.01
(0.04)
0.02
(0.04)
0.02
(0.04)
0.02
(0.04)
-0.02
(0.06)
Ideology
(Between)
-0.97*
(0.56)
-0.72
(0.49)
-0.61
(0.42)
-0.58
(0.45)
-0.68
(0.43)
-0.12
(0.60)
Ideology
(Within)
1.27
(1.25)
1.09
(0.92)
0.91
(0.79)
0.93
(0.84)
0.89
(0.78)
0.68
(0.99)
Constant -7.92***
(2.08)
-8.88***
(1.95)
-8.28***
(1.81)
-8.45***
(1.83)
-
10.0***
(2.19)
-
7.90***
(2.46)
CountID:
sd(_cons)
-0.49
(0.57)
-0.48
(0.46)
-1.29
(1.51)
-0.77
(0.62)
-1.72
(3.48)
-0.49
(0.59)
ComID:
sd(_cons)
-14.30
(251975
8)
-13.69
(109286
9)
-16.79
(1286622
3)
-16.10
(792112
6)
-9.62
(10910)
-12.92
(47748
3)
Observatio
ns
1856 2078 2004 1996 1914 1968
* p < 0.10, ** p < 0.05, *** p < 0.01. Polynomials are included in all regressions.

379
Appendix 4.6. Full Model 2, Additional Lags, and State Control Exclusion
(18) (19) (20) (21) (22)
Full
Model 2
Lag 2
Years
Lag 5
Years
Excl. State
Controlled
Excl. Low
Production
Population Share
(Between)
-1.60**
(0.77)
-1.50**
(0.75)
-1.58*
(0.83)
Population Share
(Within)
-0.09
(0.81)
-0.18
(0.85)
-0.08
(1.01)
Population
Share2 (Between)
-1.72**
(0.79)
Population
Share2 (Within)
0.56
(0.75)
Population
Share5 (Between)
-1.26**
(0.59)
Population
Share5 (Within)
-1.80**
(0.75)
Ethnicity
(Between)
-1.33
(1.12)
-1.31
(1.11)
-1.42
(1.14)
-1.42
(1.12)
-7.20
(13.42)
Ethnicity
(Within)
-2.58
(1.87)
-2.62
(1.87)
-2.45
(1.89)
-2.36
(1.85)
-5.08
(13.83)
Factor Mobility 1.02***
(0.31)
1.02***
(0.31)
1.11***
(0.32)
1.04***
(0.31)
1.00***
(0.36)
Polity2
(Between)
-0.05
(0.06)
-0.05
(0.06)
-0.06
(0.06)
-0.04
(0.06)
-0.11
(0.07)
Polity2 (Within) -0.05
(0.07)
-0.06
(0.07)
-0.06
(0.07)
-0.05
(0.07)
-0.02
(0.09)
Proc.-Raw Exp.
Ratio (Between)
-0.00
(0.00)
-0.00
(0.00)
-0.00
(0.00)
-0.00
(0.00)
-0.00
(0.00)
Proc.-Raw Exp.
Ratio (Within)
-0.00
(0.00)
-0.00
(0.00)
-0.00
(0.00)
-0.00
(0.00)
-0.00
(0.00)
Export Share
(Between)
-0.13
(0.13)
-0.12
(0.13)
-0.16
(0.13)
-0.13
(0.13)
-0.16
(0.14)
Export Share
(Within)
0.14
(0.09)
0.13
(0.09)
0.16*
(0.09)
0.14
(0.09)
0.17*
(0.10)
Market Power
(Between)
0.04
(0.05)
0.04
(0.05)
0.03
(0.05)
0.04
(0.05)
0.04
(0.06)
Market Power
(Within)
-0.09
(0.09)
-0.10
(0.09)
-0.10
(0.10)
-0.09
(0.09)
-0.10
(0.10)
Tariff Escalation
(Between)
0.01
(0.06)
0.00
(0.06)
0.02
(0.06)
0.01
(0.06)
0.00
(0.07)
Tariff Escalation
(Within)
0.02
(0.04)
0.03
(0.04)
0.02
(0.03)
0.02
(0.04)
0.04
(0.04)
Industry (% of
GDP) (Between)
0.03
(0.03)
0.04
(0.03)
0.03
(0.03)
0.03
(0.03)
0.03
(0.03)
Industry (% of
GDP) (Within)
0.07
(0.04)
0.07*
(0.04)
0.07
(0.05)
0.07
(0.04)
0.09
(0.05)

380
GDP p.c.
(Between)
-0.00
(0.00)
-0.00
(0.00)
-0.00
(0.00)
-0.00
(0.00)
-0.00
(0.00)
GDP p.c.
(Within)
-0.00
(0.00)
-0.00
(0.00)
-0.00
(0.00)
-0.00
(0.00)
-0.00
(0.00)
ODA (% of GNI)
(Between)
0.06
(0.04)
0.06
(0.04)
0.07*
(0.04)
0.06
(0.04)
0.08
(0.05)
ODA (% of GNI)
(Within)
0.02
(0.04)
0.02
(0.04)
0.02
(0.04)
0.02
(0.04)
0.02
(0.05)
Ideology
(Between)
-0.62
(0.45)
-0.66
(0.45)
-0.63
(0.47)
-0.65
(0.45)
-0.87
(0.54)
Ideology (Within) 0.95
(0.83)
1.02
(0.84)
0.92
(0.86)
1.00
(0.84)
0.98
(0.99)
Constant -8.65***
(1.83)
-8.53***
(1.82)
-8.67***
(1.85)
-8.60***
(1.84)
-8.19***
(2.23)
lns1_1_1
Constant
-0.78
(0.63)
-0.79
(0.64)
-0.57
(0.49)
-0.72
(0.59)
-0.41
(0.59)
lns2_1_1
Constant
-12.33
(191665)
-12.85
(341471)
-13.12
(544489)
-10.69
(39259)
-11.87
(151922)
Observations 2169 2156 2107 2092 1763
* p < 0.10, ** p < 0.05, *** p < 0.01. Polynomials are included in all regressions.

381
Appendix 4.7. Guinea Exclusion and Democracy Interaction Effects
(23) (24) (25) (26)
No
Guinea
Polity2(6)
Interaction
Polity2(5)
Interaction
Polity2(Cont.)
Interaction
Population Share -1.60**
(0.65)
-1.46***
(0.54)
-1.41***
(0.52)
-1.56***
(0.56)
Polity2 -0.06
(0.04)
-0.07
(0.05)
polity2dum6 -0.16
(0.44)
polity2dum6 #
Population Share
0.17
(1.18)
polity2dum5 -0.57
(0.43)
polity2dum5 #
Population Share
-0.03
(1.26)
Polity2 # Population
Share
0.07
(0.13)
Export Share 0.01
(0.04)
0.02
(0.03)
0.01
(0.03)
0.01
(0.03)
Processed-Raw Export
Ratio
-0.00
(0.00)
-0.00
(0.00)
-0.00
(0.00)
-0.00
(0.00)
Market Power -0.00
(0.02)
-0.00
(0.02)
-0.00
(0.02)
-0.00
(0.02)
Factor Mobility 1.48***
(0.34)
1.05***
(0.27)
1.09***
(0.28)
1.07***
(0.27)
Industry (% of GDP) 0.03**
(0.01)
0.04***
(0.01)
0.04***
(0.01)
0.04***
(0.01)
GDP p.c. -0.00
(0.00)
-0.00*
(0.00)
-0.00
(0.00)
-0.00
(0.00)
Tariff Escalation -0.01
(0.02)
0.01
(0.02)
0.01
(0.02)
0.01
(0.02)
ODA (% of GNI) 0.04
(0.03)
0.01
(0.03)
0.02
(0.03)
0.02
(0.03)
Ideology -0.21
(0.35)
-0.26
(0.31)
-0.23
(0.29)
-0.26
(0.30)
Executive Match -0.44
(0.99)
-0.60
(0.90)
-0.55
(0.95)
-0.58
(0.93)
Constant -9.47***
(1.60)
-7.87***
(1.52)
-7.91***
(1.46)
-7.80***
(1.45)
Observations 2096 2169 2169 2169
Pseudo R2 0.206 0.165 0.170 0.169 Robust standard errors clustered at the country commodity level in parentheses. * p <
0.10, ** p < 0.05, *** p < 0.01. Polynomials are included in all regressions.

382
Appendix 4.8. List of State-Controlled Country-Commodity-Years
Commodity Country Board/Parastatal Duration Sources
Cashew Kenya Until 1992 the National Produce Board had the monopsony of buying in-
shell from farmers (and their cooperatives) and the Kilifi Cashew Nut
Factory had the monopsony to buy from the NPB.
1975-1992 (IDMS 2009; Kenyan
Ministry of Agriculture
2009)
Chromite Madagascar Since 1975 the only chromite mining company (Kraomita Malagasy) has
been nationalized. Only in 2018 another South African mining company
entered the industry (APC) and 70% of Kraomita’s shares were sold to the
Russian Investor ‘Ferrum Mining’.
1975-2018 (Coakley 1995b; Engineer
Live 2018; IDE-JETRO
2019; Rabenasolo 2019;
USGS 2015c)
Cocoa Ghana Since 1979 the state-controlled Ghana Cocoa Board (COCOBOD) has had
a monopoly on marketing and exporting Ghanaian cocoa beans.
Liberalization of COCOBOD’s export monopoly started in 2000/01 and
LBCs can now export 30 per cent of their cocoa purchases directly to
external buyers. However, a minimum tonnage requirement has meant that
only 9 LBCs qualified so far to export, while none of them have actually
marketed externally.
Since 1979 (Brooks et al. 2007;
Kolavalli et al. 2012;
Kolavalli and Vigneri
2011)
Cameroon Office National de Commercialisation des Produits de Base (ONCPB) 1976-1991
Sierra Leone Until 1992 the Sierra Leone Produce Marketing Company (SLPMC) had a
monopoly on marketing cocoa.
Until 1992

383
Diamond
Ghana Until late 1991, the Ghanaian government was the sole owner of the only
commercial large-scale diamond mine, Ghana Consolidated Diamonds
(GCD) in Akwatia. The large number of artisanal and small-scale miners
were legally only allowed to sell diamonds to the Precious Minerals
Marketing Company Limited (PMMC), a parastatal. In late 1991, 80% of
GCD’s shares were privatized to Lazare Kaplan International (LKI) of the
United States and Inco Ltd. of Canada. When Inco dropped out of the
venture in early 1993, LKI continued to market the diamonds, previously
sold to the PMMC, while another operating partner was sought. In late 1993,
the Ghanaian Parliament approved a joint-venture option agreement
between LKI and De Beers Centenary AG of Switzerland. A new company,
Birim River Diamond Ltd, was to be formed with LKI and De Beers each
having 40% and the Government, 20%. After significant work at the mine,
De Beers withdrew from the project in 1995 and the government retook the
majority ownership. In between, 1991-1995 most artisanal production was
sold to the PMMC, but also to LKI and De Beers. After 1995, PMMC again
became the only legal buyer of Ghanaian diamonds.
Pre-1992, state-
controlled. 1992-1995
partly privatized; from
1996: mostly state
controlled
(Bermúdez-Lugo 2018;
Coakley 1995a)
Zimbabwe Since 2016 the Zimbabwe Consolidated Diamond Corp (50% government-
owned) should take control of the diamond sector. However, significant
ASM persists.
From 2016 (Barry 2019)

384
Botswana The Botswanan State owns a 50% share of the only diamond mining and
marketing company in Botswana, Debswana, with De Beers holding the
other 50% of shares. The government’s power is considerable, and as a
consequence had pushed through the decision against De Beers’ initial
resistance that a minimum amount of rough diamonds needed to be cut and
polished in Botswana.
1969 (Mbayi 2011; Yager 2019)
Precious
Stones
Ghana The Precious Minerals Marketing Company Limited (PMMC) is legally
bound to market all precious and semi-precious stones in Ghana since 1989.
1989- (PMMC 2019)
Cotton Burkina Faso From 1979-1999 the cotton monopsony buying company, SOFITEX, was
primarily state-owned. In 1999, the company was partially privatized by
giving a combined majority shares to the national cotton farmers union
(UNPCB) and French company DAGRIS (former CFDT). In 2003 private
ginneries were allowed to enter 15% of the market (in clearly allocated
zones).
1979-1999 (Delpeuch and Leblois
2013)
Mali Since 1975 the state-owned CMDT has the monopsony in buying cotton
from farmers
1975-
Côte d’Ivoire From 1974 until 1998 the state-owned CIDT had the monopsony in buying
cotton from farmers. Thereafter, it was split into three entities, two of which
were privatized.
1974-1998

385
Benin Until 1994, state-owned SONAPRA had the monopsony in buying cotton.
This ended in 1995, when other buyers and ginneries were allowed in the
marked
Until 1994
Tanzania Until 1994, the state-owned Tanzania Cotton Marketing Board had the
monopsony for buying cotton. This ended in 1995, with the complete
privatization and liberalization of the sector.
Until 1994
Cameroon Since 1974 the state-owned SODECOTON has the monopsony in buying
cotton from farmers
1974-
Zimbabwe Until 1993 the state-owned Cotton Company had the monopsony for buying
cotton. This ended in 1994 with the liberalization of the sector (and the
privatization of the parastatal in 1997).
Until 1993
Togo From 1974 to 1993 the state-owned SOTOCO had the monopsony on buying
cotton and monopoly on ginning it to lint. In 1994 the first private ginnery
entered the sector (SICOT), with further ginneries entering the sector
thereafter. The seed cotton monopsony, however, remained with SOTOCO.
1974-1993
Zambia From 1976 to 1993 the state-owned LINTCO had the monopsony on buying
cotton and the monopoly on ginning it to lint. The sector was privatized and
liberalized in 1994.
1976-1993
Malawi From 1972 (and other boards before that) until 1994 the Agricultural
Development and Marketing Corporation had the monopsony on buying
Until 1993

386
cotton and the monopoly on ginning it to lint. The sector was privatized and
liberalized in 1994.
Uganda Until 1993 the state’s Lint Board had the monopsony on buying cotton and
the monopoly on ginning it to lint. The sector was privatized and liberalized
in 1994.
Until 1993
Senegal From 1974 until 2002 the monopsony cotton buying and monopoly ginner
LINTCO was state-owned, and then partially privatized, with the French
company DAGRIS gaining majority ownership in 2003.
1974-2002
Guinea Until 2000 the state had a monopsony on buying and ginning cotton, before
the sector was completely privatized.
Until 2000
Madagascar Until 2003 the monopsony cotton buying and monopoly ginner HASYMA
was state-owned, and then privatized, with the French company DAGRIS
gaining majority ownership
Until 2003
Central
African
Republic
Until 1990 the state had a monopsony on buying and ginning cotton, before
the sector was then completely privatized.
Until 1990
Kenya Between 1962 and 1992, the state-owned Cotton Lint and Seed Marketing
Board had the monopsony for buying cotton. This ended in 1993, with the
complete privatization and liberalization of the sector.
1964-1992

387
Niger Until 1989 the state had a monopsony on buying and ginning cotton before
the parastatal was privatized. In 1998, further competition to the former
parastatal was introduced
Until 1989
Guinea-
Bissau
Until 1999 the state had a monopsony on buying and ginning cotton before
the parastatal was privatized in 2000. In 2002, further competition to the
former parastatal was introduced.
Until 1999
Burundi Since 1947 the Cotton Management Company (COGERCO) has a
monopoly on buying and ginning cotton in Burundi. This persists until this
day.
Since 1947 (Centre d'Echange
d'Informations du Burundi
2014)
Sesame Uganda Until 1989 the Produce Marketing Board had a monopoly on marketing
Sesame. This was abolished the same year.
Until 1989 (Anderson 2009)
Tea Burundi Since 1971 the Office du Thé du Burundi (OTB) had a monopoly on buying
and processing tea in Tanzania. This monopoly was formally liberalized in
2007, but only in 2011 the first private tea processing factory (PROTHEM)
opened in the country, breaking OTB’s de facto monopoly.
1971-2010 (FAO 2016)
Cameroon From 1977 until 2002 the state-owned Cameroon Development Cooperation
owned all tea estates in the country, giving them a monopoly. In October
2002, the CDC’s tea estates were privatized.
1977-2002 (Konings 2012)
Zambia From 1969 to 1995 the state-owned Kawambwa Tea Company was the only
tea producer and processor in Zambia. It was privatized in 1996 in line with
1969-1995 (CAADP 2013; UNCTAD
2011)

388
economic liberalization policies of the new regime of President Frederick
Chiluba and has been under different ownerships since.
Madagascar Since 1973, the only tea plantation and tea processing factory had been
under state-ownership (under the name SOTEMAD – Société Théicole de
Madagascar). In 1996, it was privatized and is now called SIDEXAM
Sahambavy.
1973-1995 (Lac Hotel 2019)

389
Appendix for Chapter 6
Appendix 6.1. List of Interviews on Cashew and Macadamia
Type of Interviewee
Nr Anonymized Positions Place of Interview Date of Interview
Country: Ghana
Sector: Cashew
Donor/IO 1 Project Manager of ComCashew Per Telephone 02.08.2016
2 Officer at ComCashew (GIZ) Accra 23.03.2017
3 Senior Officer for Sector Organization of ComCashew (GIZ)
Accra 05.04.2017
4 Senior Manager of ComCashew (GIZ)
Accra 05.04.2017
5 Senior Officer at ComCashew (GIZ)
Accra 06.04.2017
6 Senior Manager of ComCashew (GIZ)
Accra 22.05.2017
Farmer 7 Medium-Scale Cashew Farmer Accra 07.04.2017
8 Mid-Scale Farmer Techiman, Brong Ahafo
.04.2017
9 Mid-Scale Farmer Wenchi, Brong Ahafo 24.04.2017
10 Medium-Scale Cashew Farmer Per Telephone 27.04.2017
Farmer Association
11 Chairman of large cashew farmer cooperative
Brong Ahafo 24.04.2017
Government 12 Senior Executive of Ghana Investment Promotion Council
Accra 19.04.2017
13 Senior Official of Ministry of Food and Agriculture, Crop Directorate
Accra 13.04.2017
14 Former Deputy Minister of MoTI and NDC MP
Accra 29.03.2017
15 Crops Officer at Ministry of Trade and Industry (MoTI)
Accra 06.05.2017
16 Senior Official for Industrial Development at MoTI
Accra 06.05.2017
17 Senior Officer for Industrial Development at MoTI
Accra 06.05.2017
Politician 18 Brong-Ahafo MP (NPP) Accra 01.05.2017
19 Brong-Ahafo MP (NDC) Accra 30.05.2017
Processor 20 CEO of Cashew Cottage Processor
Techiman (Brong Ahafo)
26.04.2017
21 Senior Executive of Major Cashew Processor
Mim, Brong-Ahafo Region
25.04.2017
22 Chief Sourcing Manager of International Cashew Roaster
Sunyani, Brong-Ahafo Region
26.04.2017
23 Former CEO of large-scale cashew processor
Per Telephone 19.03.2017
24 CEO of large-scale cashew processor
Per Telephone 23.05.2017
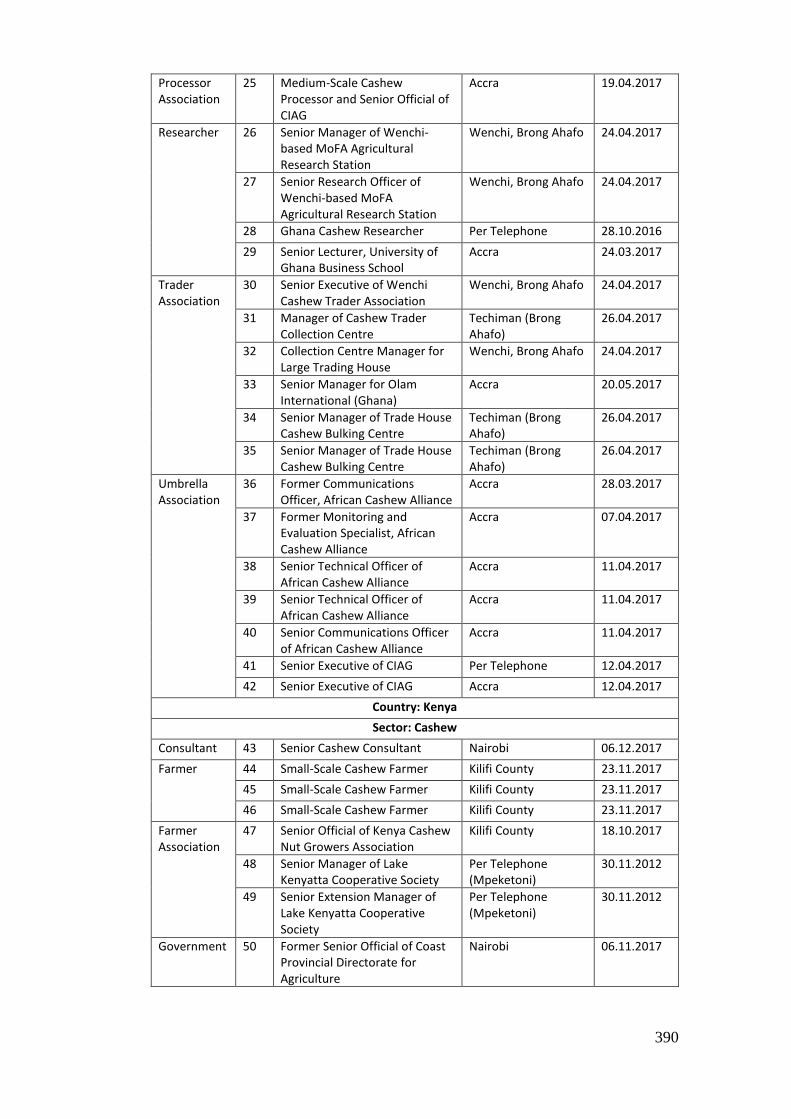
390
Processor Association
25 Medium-Scale Cashew Processor and Senior Official of CIAG
Accra 19.04.2017
Researcher 26 Senior Manager of Wenchi-based MoFA Agricultural Research Station
Wenchi, Brong Ahafo 24.04.2017
27 Senior Research Officer of Wenchi-based MoFA Agricultural Research Station
Wenchi, Brong Ahafo 24.04.2017
28 Ghana Cashew Researcher Per Telephone 28.10.2016
29 Senior Lecturer, University of Ghana Business School
Accra 24.03.2017
Trader Association
30 Senior Executive of Wenchi Cashew Trader Association
Wenchi, Brong Ahafo 24.04.2017
31 Manager of Cashew Trader Collection Centre
Techiman (Brong Ahafo)
26.04.2017
32 Collection Centre Manager for Large Trading House
Wenchi, Brong Ahafo 24.04.2017
33 Senior Manager for Olam International (Ghana)
Accra 20.05.2017
34 Senior Manager of Trade House Cashew Bulking Centre
Techiman (Brong Ahafo)
26.04.2017
35 Senior Manager of Trade House Cashew Bulking Centre
Techiman (Brong Ahafo)
26.04.2017
Umbrella Association
36 Former Communications Officer, African Cashew Alliance
Accra 28.03.2017
37 Former Monitoring and Evaluation Specialist, African Cashew Alliance
Accra 07.04.2017
38 Senior Technical Officer of African Cashew Alliance
Accra 11.04.2017
39 Senior Technical Officer of African Cashew Alliance
Accra 11.04.2017
40 Senior Communications Officer of African Cashew Alliance
Accra 11.04.2017
41 Senior Executive of CIAG Per Telephone 12.04.2017
42 Senior Executive of CIAG Accra 12.04.2017
Country: Kenya
Sector: Cashew
Consultant 43 Senior Cashew Consultant Nairobi 06.12.2017
Farmer 44 Small-Scale Cashew Farmer Kilifi County 23.11.2017
45 Small-Scale Cashew Farmer Kilifi County 23.11.2017
46 Small-Scale Cashew Farmer Kilifi County 23.11.2017
Farmer Association
47 Senior Official of Kenya Cashew Nut Growers Association
Kilifi County 18.10.2017
48 Senior Manager of Lake Kenyatta Cooperative Society
Per Telephone (Mpeketoni)
30.11.2012
49 Senior Extension Manager of Lake Kenyatta Cooperative Society
Per Telephone (Mpeketoni)
30.11.2012
Government 50 Former Senior Official of Coast Provincial Directorate for Agriculture
Nairobi 06.11.2017

391
51 Former 2009 Cashew Task Force Member
Kilifi County 18.10.2017
52 Senior Director of Ministry of Agriculture, Livestock, and Fisheries, Kilifi County
Kilifi County 23.10.2017
53 Senior Officer of Ministry of Agriculture, Livestock, and Fisheries, Kilifi County
Kilifi County 23.10.2017
54 Senior Officer of Ministry of Agriculture, Livestock, and Fisheries, Kilifi County
Kilifi County 23.10.2017
55 Senior Officer of Ministry of Agriculture, Livestock, and Fisheries, Kilifi County
Kilifi County 23.10.2017
56 Senior Officer at the NOCD Per Telephone 01.12.2017
Journalist 57 Journalist covering Cashew Sector
Kilifi County 19.10.2018
Middlemen 58 Top-Level Cashew Agent Per Telephone 13.12.2017
Processor 59 Lead Cashew Procurer for Big Five Processor
Per Telephone 08.12.2017
60 Former Senior Executive of KCL Kilifi County 18.10.2017
61 CEO of cottage cashew processor
Kilifi County 23.11.2017
Researcher 62 Senior Cashew Cultivation Expert
Kilifi County 18.10.2017
Sector: Cashew & Macadamia
Government 63 Senior official at Ministry of Agriculture
Nairobi 04.11.2017
64 Senior Executive of NOCD (AFA) Mombasa 18.10.2017
65 Officer at Nuts and Oil Crops Directorate
Nairobi 02.11.2017
66 Senior Officer at the NOCD Per Telephone 01.12.2017
Processor 67 CEO of Big Five Nut Processor Nairobi 07.11.2017
68 Head of Sales Top Five Nut Processor
Kiambu County 30.11.2017
69 Head of Operations Top Five Nut Processor
Kiambu County 30.11.2017
70 Head of Marketing Top Five Nut Processor
Kiambu County 30.11.2017
71 Senior Executive at Kenya Nut Company
Per Telephone 29.11.2017
72 CEO of Second-Tier Nut Processor
Nairobi 19.12.2018
73 CEO of Big Five Nut Processor Nairobi 09.11.2017
Processor Association
74 Senior Official of NutPAK Nairobi 09.11.2017
Sector: Macadamia
Consultant 75 Consultant of MGAK Per Telephone 04.12.2017
Farmer 76 Small-Scale Macadamia Farmer Kiambu County 13.11.2017
77 Small-Scale Macadamia Farmer Kiambu County 13.11.2017
78 Medium-Scale Macadamia Farmer
Embu County 16.11.2017

392
79 Medium-Scale Macadamia Farmer
Embu County 16.11.2017
Farmer Association
80 Senior Executive of MGAK Mombasa 18.10.2017
81 Senior Executive of MGAK Muranga Town 13.11.2017
82 Senior Executive of MGAK Kiambu County 13.11.2017
83 Senior Executive of MGAK Per Telephone 08.12.2017
84 Senior Executive of MGAK Per Telephone 11.12.2017
Government 85 County Extension Officer Embu Town 15.11.2017
86 Senior Officer at the Embu County, Department of Food and Agriculture
Embu Town 27.11.2017
Middlemen 87 Senior Official of NUTAK Kiambu County 13.11.2017
88 Top-level Macadamia Agent Embu Town 16.11.2017
89 Top-level Broker Embu Town 16.11.2017
90 Top-level Broker Embu Town 16.11.2017
Politician 91 Member of Municipal County of Embu
Embu County 17.11.2017
92 Former Central Kenyan MP, Jubilee Party
Kiambu County 13.11.2017
93 Former Embu County MP Embu Town 16.11.2017
94 Senior Politician Embu County Embu Town 16.11.2017
Processor 95 Managing Director of Second-Tier Macadamia Processor
Nairobi 09.11.2017
96 Chief of Operations of Second-Tier Macadamia Processor
Nairobi 09.11.2017
97 Senior Officer Major Processor Embu Town 15.11.2017
98 Senior Officer Major Processor Embu Town 15.11.2017
99 Head of Operations of Major Processor
Embu Town 15.11.2017
Researcher 100 Senior Macadamia Researcher Thika (Central Kenya) 07.12.2017
Country: Malawi
Sector: Macadamia
Consultant 101 Expert on Malawi Macadamia Industry
Per Telephone 22.10.2018
102 Former Consultant for the Highland Macadamia Cooperative Union Limited
Per E-Mail 22.10.2018
Farmer Association
103 Manager Ntchisi Macadamia Cooperative Union
Per E-Mail 26.10.2018
Country: South Africa
Sector: Macadamia
Processor 104 CEO of major South African Macadamia Processing Company
Per E-Mail 22.10.2018
Country: Australia
Sector: Macadamia
Umbrella Association
105 Senior Executive of Australian Macadamia Association
Per E-Mail 31.10.2018
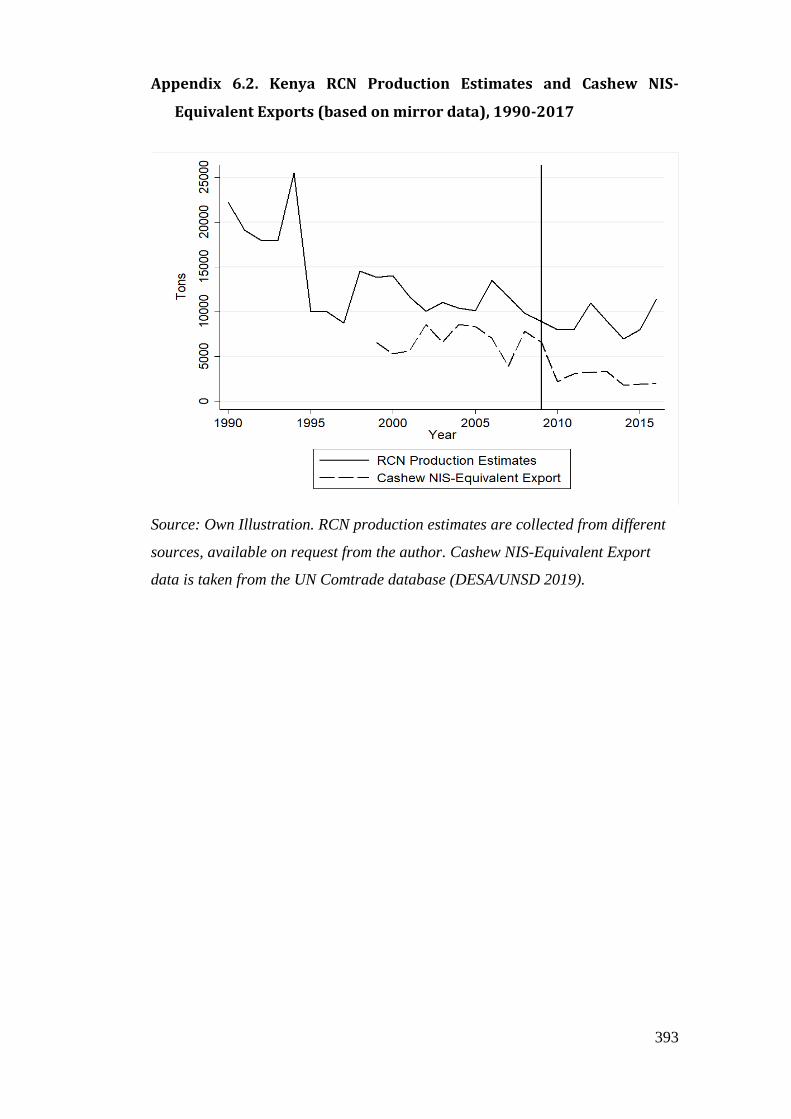
393
Appendix 6.2. Kenya RCN Production Estimates and Cashew NIS-
Equivalent Exports (based on mirror data), 1990-2017
Source: Own Illustration. RCN production estimates are collected from different
sources, available on request from the author. Cashew NIS-Equivalent Export
data is taken from the UN Comtrade database (DESA/UNSD 2019).

394
Appendix 6.3. Collection of Farm gate Prices by Region and Source for Macadamia in Kenya
Year (Muchiri) ALL
(Murioga et al. 2016: 97) West
(Murioga et al. 2016: 97) East
(Maigua et al. 2017) ALL
(National Assembly of Kenya 04.05.2016) ALL
(Gitonga 2011) WEST
(Ciuri 2015) ALL
(iMPACT NEWS (Kenya)) WEST
(Mburu 2011) WEST
(Fundi) EAST
(Rungu 2012) ALL
(Onsongo 2009b: 4) All
(Kenya News Agency) EAST/ALL
(Vandenabeele 5: 23) ALL
(Jungle Nuts Limited Different Times) WEST/KIAMBU
Senior Executive of MGAK, Mombasa, 18.10.2017 WEST
(Nuts & Oil Crop Directorate 2016) ALL
1992
1993
1994
1995
1996 (Hortfresh Journal)
1997
1998
1999
2000
2001 0.07 USD
2002 0.23 USD
2003
2004 50
2005 45
2006 60
2007

395
2008 20
2009 28
2010 27 30
2011 70 70 90 80
2012 68 70 80 50
2013
2014 90 110 80
2015 110 105 100 110
2016 120 50 65 70
2017 150
2018
Year Hortfresh ALl(Hortfresh Journal)
(Herbling 2012) All
(Ithula et al. 2010) EAST
(Murithi 2016: 33) EAST
(Gebre and Nyambura-Mwaura 2018) ALL
(Daily Nation 13.09.2016) East
County Extension Officer, Embu Town, 15.11.2017 EAST
Embu County Agric Officer 27.11.2017 EAST
Senior Executive of MGAK, Per Telephone, 08.12.2017 EAST
Top-level Macadamia Agent, Embu Town, 16.11.2017 EAST
Senior Executive of MGAK, Kiambu County, 13.11.2017 WEST
Senior Executive of MGAK, Muranga Town, 13.11.2017 WEST
Senior Official of NUTAK, Kiambu County, 13.11.2017 Kiambu
Head of Operations of Major Processor, Embu Town, 15.11.2017 EAST
(Murioga 31.07.2013) ALL
(Muinde) WEST
1992
1993
1994 15
1995
1996
1997
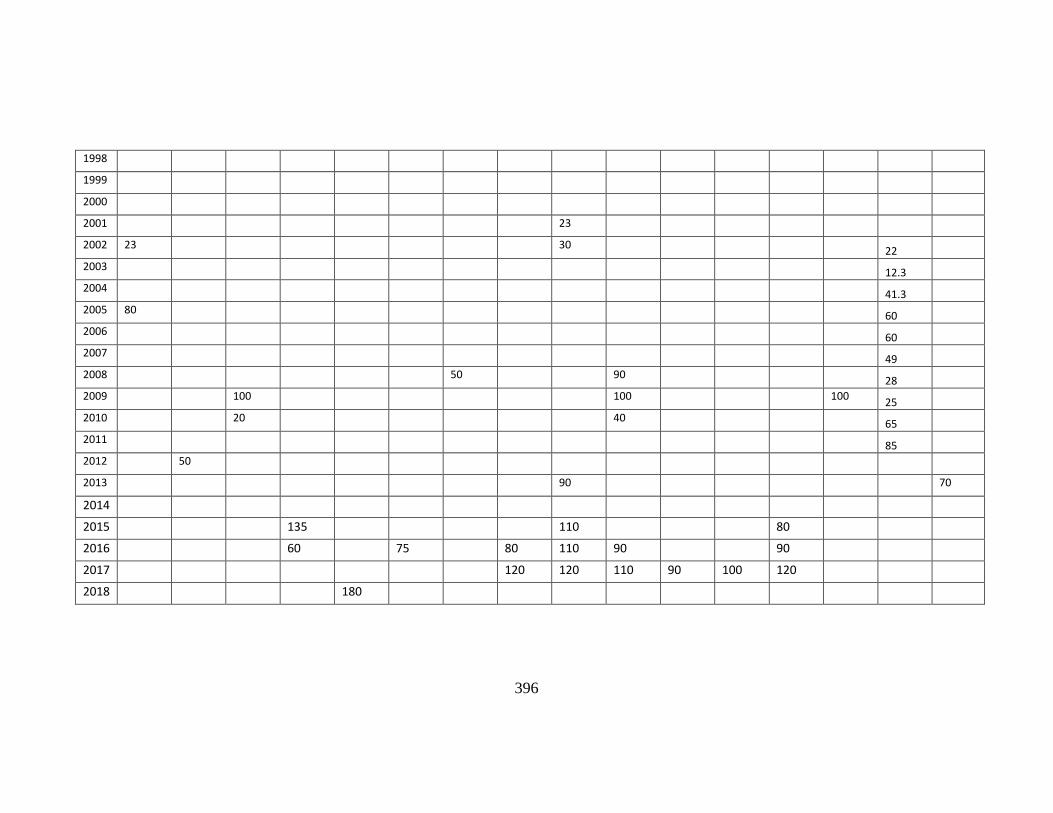
396
1998
1999
2000
2001 23
2002 23 30 22
2003 12.3
2004 41.3
2005 80 60
2006 60
2007 49
2008 50 90 28
2009 100 100 100 25
2010 20 40 65
2011 85
2012 50
2013 90 70
2014
2015 135 110 80
2016 60 75 80 110 90 90
2017 120 120 110 90 100 120
2018 180

397
Appendix for Chapter 7
Appendix 7.1. Calculation of Ghanaian Domestic Log Price Development
Between 1993 and 1996 for Eight Species Not Banned Prior to 1995
Species Trade Name
1993 Domestic Log Price in DM/m³
1996 Domestic Log Price in DM/m³
1996 Log Price as % of 1993 Price
Albizia 95 38 40.00
Kusia 81 42 51.85
Kyere 149 85 57.05
Kyenkyen 95 42 44.21
Ceiba 81 42 51.85
Alkasa 81 42 51.85
Bonsamdua/Ayan
81 38 46.91
Guarea 149 56 37.58
Average Price
101.5 48.125 47.41
Source: Own calculations based on Treue (1999: 138)

398
Appendix 7.2. Calculation of Ghanaian Domestic Log Price Development
Between 1993 and 1996 Across all Species Types/Grades
Species Grade
1993 Domestic Log Price in DM/m³
1996 Domestic Log Price in DM/m³
1996 Log Price as % of 1993 Price
Scarlet Stars
177 103 58.19
Red Stars 123 50 40.65
Pink Stars
84 54 64.29
Average Price
128 69 53.91
Source: Own calculations based on Treue (1999: 138)

399
Appendix 7.3. Destinations of Ghana’s Ferrous Scrap Exports over Time
Source: Own Illustration based on mirror data from the UN Comtrade database
(DESA/UNSD 2019).

400
Appendix 7.4. Exports of Raw Hides and Skins and (Semi-)Processed Leather
from Tanzania as Declared by Tanzania from 1965-2017
Source: Own illustration based on SITC1 data from the UN Comtrade database
(DESA/UNSD 2019).
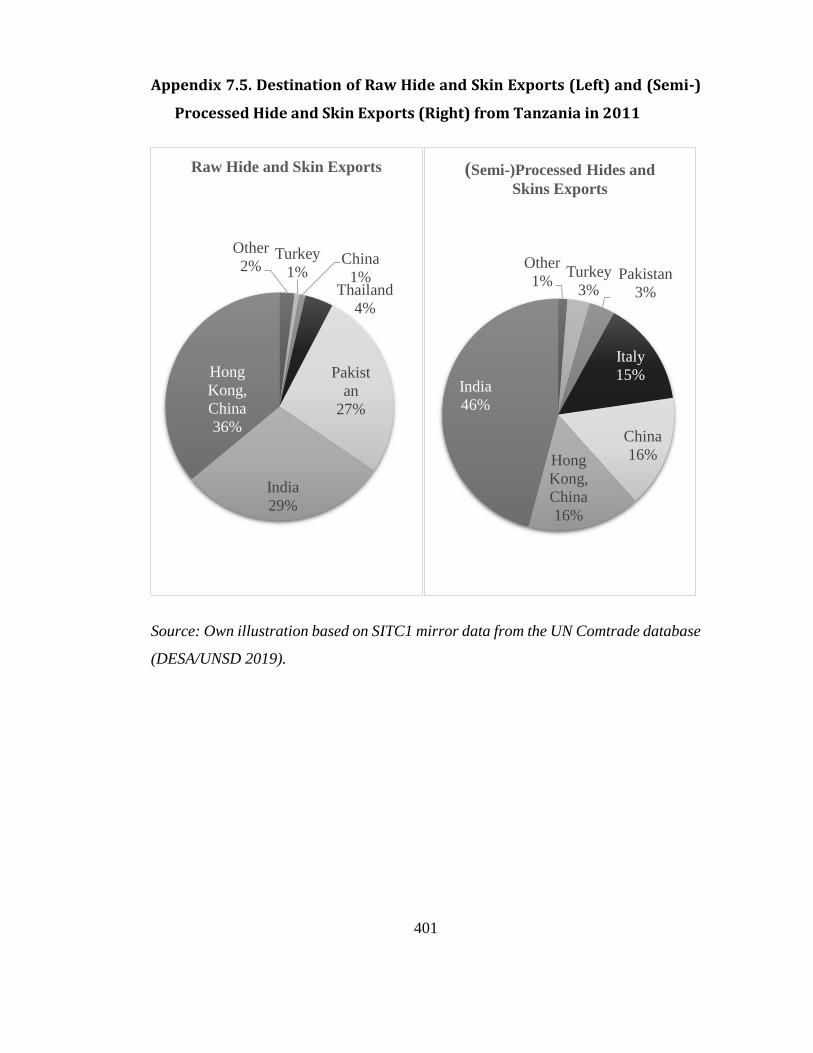
401
Appendix 7.5. Destination of Raw Hide and Skin Exports (Left) and (Semi-)
Processed Hide and Skin Exports (Right) from Tanzania in 2011
Source: Own illustration based on SITC1 mirror data from the UN Comtrade database
(DESA/UNSD 2019).
Other
2%Turkey
1%China
1%Thailand
4%
Pakist
an
27%
India
29%
Hong
Kong,
China
36%
Raw Hide and Skin Exports
Other
1%Turkey
3%Pakistan
3%
Italy
15%
China
16%Hong
Kong,
China
16%
India
46%
(Semi-)Processed Hides and
Skins Exports

402
Appendix 7.6. Questionnaire for Tanzanian Livestock Keepers
Demographic Data Interview #: Date:
1. Name:
2. Gender:
3. Age:
4. Municipality/District/Region
General Questions
5. How many cows, goats, and sheep do you keep?
a. Cows:
b. Goats:
c. Sheep:
6. On average, for what price do you sell your livestock?
a. Cows:
b. Goats:
c. Sheep:
7. Which number/percentage of your livestock do you sell/kill/”off-take”
annually?
a. Cows:
b. Goats/sheep:
Questions Regarding Raw Hides and Skins
8. When you sell your livestock, do you:
a. receive any money for the (quality of the) hides/skins? (yes/no)
i. If yes, which price on average for:
1. Cows:
2. Goats/sheep:
b. Or do you simply sell the animal as a whole, irrespective of the quality
of the hide/skin (that is, two cows which are completely similar –
except for the quality of their hides – would receive the same price)?
(yes/no)

403
9. Are you aware that healthy and unbranded hides and skins are an important
requirement for the leather industry? (yes/no)
10. Are you aware of good practices to maintain the good quality of raw hides and
skins, such as branding only on the legs or the head? (yes/no)
a. If yes, how have you become aware of this? (open)
b. If yes, do you implement such good practices? (yes/no)
i. If not, why not? (open)
Questions Regarding Export Tax
11. Have you ever heard of a tax on the export of raw hides and skins? (yes/no)
12. Is a high tax on the export of raw hides and skins something that affects you?
(yes/no)
a. Why/why not? (open)
Continue only if 11 = yes
13. Since when do you know of the export tax? (year)
14. How did you come to know of the export tax? (open)
15. Do you know how high the export tax is at the moment? (% number)
16. Did you complain (e.g. to a local politician or government official) or protest
against
17. the implementation or existence of the export tax? (yes/no & Why not & how
18. Did the implementation/increase/existence of the export tax alter your voting
choice? (yes/no & why not & how)

404
Appendix 7.7. List of Interviews on Ghanaian Timber
Type of Interviewee
Anonymized Positions
Place of Interview
Date of Interview
Researcher Ghana Timber Scholar 1 Per Telephone 11.06.2019
Ghana Timber Scholar 2 Per Email 15.06.2019
Consultant Ghana Timber Consultant Accra 12.05.2017
Government Senior Official at the Ghana Forestry Commission
Accra 11.05.2017
Processor Managing Director of Leading Integrated Processor
Kumasi 23.04.2017
Managing Director of Leading Integrated Processor
Per Telephone 12.05.2017
Senior Executive of Large Integrated Processing Mill
Mim, Brong-Ahafo Region
25.04.2017
Trader/Exporter
Director at Danish International Timber Trading Company
Per Telephone 03.05.2017
Area Manager at Major Global Timber Trading Company
Per Telephone 12.06.2019
Logger Association
Senior Executive of Ghana Timber Association
Per Telephone 15.05.2017
Miller Association
Senior Executive of Ghana Timber Millers Organisation
Per Telephone 10.05.2017

405
Appendix 7.8. List of Interviews on Ghanaian Metal Waste and Scrap
Type of Interviewee
Anonymized Positions
Place of Interview
Date of Interview
Government Senior Officer for Industrial Promotion at MoTI
Accra 03.05.2017
Senior Official for Industrial Development at MoTI
Accra 06.05.2017
Dealer Association
Senior Official of the Greater Accra Scrap Dealer Association
Accra 04.05.2017
Senior Official of the Tema Scrap Dealer Association
Per Telephone
18.05.2017
Processor General Manager of one of Ghana's Oldest Steel Mills
Tema 17.05.2017
Senior Manager of one of Ghana's largest steel mills
Tema 17.05.2017
Administrative Consultant to one of Ghana's largest steel mills
Tema 17.05.2017
Producer Scrap Collector 1 in Central Accra Accra 04.05.2017
Scrap Collector 2 in Central Accra Accra 04.05.2017

406
Appendix 7.9. List of Interviews on Tanzanian Leather Sector
Type of Interviewee
Anonymized Positions
Place of Interview
Date of Interview
Donor Economic Development Adviser for Dutch Development Agency
Dar es Salaam
01.07.2017
Government Senior Industry Officer in the Ministry of Industry and Trade
Dar es Salaam
12.07.2017
Leather Promotion Officer (MoIT) Per Telephone
11.07.2017
Livestock Officer (MoLF) Dar es Salaam
14.07.2019
Leather Manufacturer
Owner of Medium-Scale Leather Manufacturer
Dar es Salaam
04.07.2019
Leather Training School and Tannery
Senior Executive of Dar es Salaam Institute of Technology
Mwanza 02.08.2017
Raw Hide Trader Association
Senior Executive of the Union of Tanzanian Hide and Skin Traders and Developers 1
Dar es Salaam
14.07.2017
Senior Executive of the Union of Tanzanian Hide and Skin Traders and Developers 2
Dar es Salaam
14.07.2017
Tanner Senior Executive of Large-Scale Tannery Dar es Salaam
11.07.2017
Senior Executive of Major Tannery Moshi 17.08.2017
Senior Executive of Major Tannery Himo 18.08.2017
Leather Manufacturer
Owner of Medium-Scale Leather Manufacturer
Mwanza 02.08.2017
Tanner & Manufacturer Association
Senior Executive of Leather Association of Tanzania
Dar es Salaam
11.07.2017
Senior Executive of Tanzania Tanners Association
Dar es Salaam
11.07.2017
Former Senior Executive of Leather Association of Tanzania
Mwanza 02.08.2017
Livestock Keeper
Livestock Keeper 1 Bugogwa Ward (Mwanza Region)
03.08.2017
Livestock Keeper 2
Livestock Keeper 3
Livestock Keeper 4
Livestock Keeper 5
Livestock Keeper 6 Nkoanrua Ward (Arusha Region)
12.08.2017
Livestock Keeper 7
Livestock Keeper 8
Livestock Keeper 9

407
Livestock Keeper 10
Livestock Keeper 11 Moshono Ward (Arusha Region)
13.08.2017
Livestock Keeper 12
Livestock Keeper 13
Livestock Keeper 14
Livestock Keeper 15
Livestock Keeper 16 Kirua Vunjo Mashariki Ward (Kilimanjaro Region)
18.08.2017
Livestock Keeper 17
Livestock Keeper 18
Livestock Keeper 19
Livestock Keeper 20
Livestock Keeper 21 Machame Kusini Ward (Kilimanjaro Region)
19.08.2017
Livestock Keeper 22
Livestock Keeper 23
Livestock Keeper 24
Livestock Keeper 25
Copyright © 2022 FDOKUMEN