
Evaluation of extremely small horizontal emittance
10
PHYSICAL REVIEW SPECIAL TOPICS - ACCELERATORS AND BEAMS, VOLUME 2, 022801 (1999) Evaluation of extremely small horizontal emittance T. Okugi, 1 T. Hirose, 1 H. Hayano, 2 S. Kamada, 2 K. Kubo, 2 T. Naito, 2 K. Oide, 2 K. Takata, 2 Seishi Takeda, 2 N. Terunuma, 2 N. Toge, 2 J. Urakawa, 2 S. Kashiwagi, 3 M. Takano, 4 D. McCormick, 5 M. Minty, 5 M. Ross, 5 M. Woodley, 5 F. Zimmermann, 5 and J. Corlett 6 1 Faculty of Science, Tokyo Metropolitan University, 1-1 Minami-Osawa, Hachioji, Tokyo 192-0364, Japan 2 High Energy Accelerator Research Organization, 1-1 Oho, Tsukuba, Ibaraki 305-0801, Japan 3 The Graduate University for Advanced Studies, 1-1 Oho, Tsukuba, Ibaraki 305-0801, Japan 4 Faculty of Science, Toho University, 2-2-1 Miyama, Funabashi, Chiba 274-0072, Japan 5 Stanford Linear Accelerator Center, Stanford University, Stanford, California 94309 6 Lawrence Berkeley National Laboratory, Berkeley, California 94720 (Received 22 October 1998; published 25 February 1999) The KEK Accelerator Test Facility (KEK-ATF) was constructed to develop technologies for producing a low-emittance beam which will be required by future linear colliders. The KEK-ATF consists of an injector linac, a damping ring, and a beam extraction line. The basic optical structure of the damping ring is a FOBO lattice, which reduces the horizontal dispersion at the center of the bending magnets and, as a consequence, can produce an extremely small emittance beam. To verify the performance of such a unique, low-emittance lattice, it is crucial to measure the horizontal emittance. The horizontal emittance was measured using wire scanners in the beam extraction line. Since the horizontal beam position was not stable, we established a method to correct the measured beam size for position fluctuation (“jitter”) and we succeeded in the observation of the so far smallest horizontal emittance in any accelerator. The measured horizontal emittance was 1.37 6 0.03 nm at a beam energy of 1.285 GeV and a bunch population of s3 5d 3 10 9 , in agreement with the design value of 1.27– 1.34 nm at the beam energy and the bunch population. [S1098-4402(99)00026-9] PACS numbers: 29.27.Eg, 29.27.Fh, 41.75.Ht I. INTRODUCTION Third generation synchrotron light sources with small emittances have been constructed for use in physics appli- cations involving synchrotron orbit radiation. The basic optical structure of such accelerators is either a double- bend achromat lattice, for example, at ELETTRA, ESRF, APS, and SPring-8, or a triple-bend achromat lattice, in use at ALS and BESSY II. The natural emittance of the ESRF is 3.0 nm (for a low-emittance operation ), that of the ALS is 3.4 nm, and those of the others are slightly larger (see Table I). The emittance is defined as ´ x › q kx 2 lkx 0 2 l 2 kxx 0 l 2 , (1) where the bracket indicates an average over all of the par- ticles and the natural emittance is the steady state emittance in the ring. However, future linear colliders [1,2] will re- quire even smaller emittances than these synchrotron light sources in order to achieve the design luminosity. The damping ring of the KEK Accelerator Test Facility (KEK- ATF) has been constructed to develop the technologies for producing such beams of unprecedentedly low emittance [3]. The beam operation of the KEK-ATF damping ring began in January, 1997. The KEK-ATF damping ring em- ploys a FOBO lattice with defocusing combined function bending magnets, in order to reduce the horizontal disper- sion at the radiation source. The optics of a normal arc cell is shown in Fig. 1 [4]. The principal parameters of the KEK-ATF damping ring are listed in Table II. The design natural emittance of the damping ring is 1.12 nm, which is significantly smaller than that of the third generation syn- chrotron light sources listed in Table I. It is crucial to re- liably measure the horizontal emittance in order to verify the performance of such a unique, low-emittance lattice. It has been reported that a small beam emittance was measured at several light sources using synchrotron ra- diation. For example, at the ESRF horizontal and ver- tical emittances of 3.5 and 0.04 nm, respectively, were measured with an x-ray pinhole camera [11]. It is dif- ficult to accurately measure the horizontal emittance by utilizing the synchrotron radiation in the damping ring be- cause energy spread and dispersion can contribute signifi- cantly to the horizontal spot size at the location of the synchrotron light monitor. The KEK-ATF, however, has TABLE I. Natural emittances for the third generation syn- chrotron light sources of the world. Lattice type DBA means double-bend achromat lattice and TBA means triple-bend achromat lattice. Accelerator Lattice Beam Design name type energy ´ x ELETTRA (Italy) DBA 1.5–2.0 GeV 7.0 nm [5] ESRF (France) DBA 6.0 GeV 3.0–7.0 nm [6] APS (USA) DBA 7.0 GeV 8.2 nm [7,8] SPring-8 (Japan) DBA 8.0 GeV 5.5 nm [9] BESSY II (Germany) TBA 1.7 GeV 5.0 nm [10] ALS (USA) TBA 1.3–1.9 GeV 3.4 nm [7] 1098-4402y 99y 2(2) y022801(10)$15.00 © 1999 The American Physical Society 022801-1
Transcript of Evaluation of extremely small horizontal emittance
PHYSICAL REVIEW SPECIAL TOPICS - ACCELERATORS AND BEAMS, VOLUME2, 022801 (1999)
he
e
Evaluation of extremely small horizontal emittance
T. Okugi,1 T. Hirose,1 H. Hayano,2 S. Kamada,2 K. Kubo,2 T. Naito,2 K. Oide,2 K. Takata,2 Seishi Takeda,2
N. Terunuma,2 N. Toge,2 J. Urakawa,2 S. Kashiwagi,3 M. Takano,4 D. McCormick,5 M. Minty,5 M. Ross,5
M. Woodley,5 F. Zimmermann,5 and J. Corlett61Faculty of Science, Tokyo Metropolitan University, 1-1 Minami-Osawa, Hachioji, Tokyo 192-0364, Japan
2High Energy Accelerator Research Organization, 1-1 Oho, Tsukuba, Ibaraki 305-0801, Japan3The Graduate University for Advanced Studies, 1-1 Oho, Tsukuba, Ibaraki 305-0801, Japan
4Faculty of Science, Toho University, 2-2-1 Miyama, Funabashi, Chiba 274-0072, Japan5Stanford Linear Accelerator Center, Stanford University, Stanford, California 94309
6Lawrence Berkeley National Laboratory, Berkeley, California 94720(Received 22 October 1998; published 25 February 1999)
The KEK Accelerator Test Facility (KEK-ATF) was constructed to develop technologies forproducing a low-emittance beam which will be required by future linear colliders. The KEK-ATFconsists of an injector linac, a damping ring, and a beam extraction line. The basic optical structureof the damping ring is a FOBO lattice, which reduces the horizontal dispersion at the center of thebending magnets and, as a consequence, can produce an extremely small emittance beam. To verify tperformance of such a unique, low-emittance lattice, it is crucial to measure the horizontal emittance.The horizontal emittance was measured using wire scanners in the beam extraction line. Since thehorizontal beam position was not stable, we established a method to correct the measured beam sizfor position fluctuation (“jitter”) and we succeeded in the observation of the so far smallest horizontalemittance in any accelerator. The measured horizontal emittance was1.37 6 0.03 nm at a beam energyof 1.285 GeV and a bunch population ofs3 5d 3 109, in agreement with the design value of 1.27–1.34 nm at the beam energy and the bunch population. [S1098-4402(99)00026-9]
PACS numbers: 29.27.Eg, 29.27.Fh, 41.75.Ht
alppsicbleF
usRFLSse
paan-ligh-f
ncgmonpearhen
h isyn-e-rifye.was
ra-er-ereif-bye-
gnifi-theas
n-ns
end
]
I. INTRODUCTION
Third generation synchrotron light sources with smemittances have been constructed for use in physics acations involving synchrotron orbit radiation. The baoptical structure of such accelerators is either a doubend achromat lattice, for example, at ELETTRA, ESRAPS, and SPring-8, or a triple-bend achromat lattice, inat ALS and BESSY II. The natural emittance of the ESis 3.0 nm (for a low-emittance operation ), that of the Ais 3.4 nm, and those of the others are slightly larger (Table I). The emittance is defined as
´x q
kx2l kx02l 2 kxx0l2 , (1)
where the bracket indicates an average over all of theticles and the natural emittance is the steady state emittin the ring. However, future linear colliders [1,2] will require even smaller emittances than these synchrotronsources in order to achieve the design luminosity. Tdamping ring of the KEK Accelerator Test Facility (KEKATF) has been constructed to develop the technologiesproducing such beams of unprecedentedly low emitta[3]. The beam operation of the KEK-ATF damping rinbegan in January, 1997. The KEK-ATF damping ring eploys a FOBO lattice with defocusing combined functibending magnets, in order to reduce the horizontal dission at the radiation source. The optics of a normalcell is shown in Fig. 1 [4]. The principal parameters of tKEK-ATF damping ring are listed in Table II. The desig
1098-4402y99y2(2)y022801(10)$15.00
lli-
-,e
e
r-ce
hte
ore
-
r-c
natural emittance of the damping ring is 1.12 nm, whicsignificantly smaller than that of the third generation schrotron light sources listed in Table I. It is crucial to rliably measure the horizontal emittance in order to vethe performance of such a unique, low-emittance lattic
It has been reported that a small beam emittancemeasured at several light sources using synchrotrondiation. For example, at the ESRF horizontal and vtical emittances of 3.5 and 0.04 nm, respectively, wmeasured with an x-ray pinhole camera [11]. It is dficult to accurately measure the horizontal emittanceutilizing the synchrotron radiation in the damping ring bcause energy spread and dispersion can contribute sicantly to the horizontal spot size at the location ofsynchrotron light monitor. The KEK-ATF, however, h
TABLE I. Natural emittances for the third generation sychrotron light sources of the world. Lattice type DBA meadouble-bend achromat lattice and TBA means triple-bachromat lattice.
Accelerator Lattice Beam Designname type energy ´x
ELETTRA (Italy) DBA 1.5–2.0 GeV 7.0 nm [5]ESRF (France) DBA 6.0 GeV 3.0–7.0 nm [6APS (USA) DBA 7.0 GeV 8.2 nm [7,8]SPring-8 (Japan) DBA 8.0 GeV 5.5 nm [9]BESSY II (Germany) TBA 1.7 GeV 5.0 nm [10]ALS (USA) TBA 1.3–1.9 GeV 3.4 nm [7]
© 1999 The American Physical Society 022801-1

PRST-AB 2 T. OKUGI et al. 022801 (1999)
.nthtts
tegasn
n1ic
haseof
hetion.zero
leforcatededin
the
dly
theachlicaluntdne,ingithal
d-ern-am
t-
ea-re
o-el-
thehileed
ow
gleC)ni-5]
tions
-0.1
0
0.1
0.2
0 0.4 0.8 1.2 1.6 2 2.4
ηx [m]
ηy [m]
η [m
]
s [m]
QF
2R
SF
1R
SD
1R
BH
1R
ZV
1R
ZH
1R
QF
1R
0
1
2
3 √ β
x [ m1/2 ]
√ βy [ m1/2 ]
√ β
[ m
1/2 ]
FIG. 1. Normal FOBO cell of the KEK-ATF damping ringQF2R and BH1R are the main focusing quadrupole magand the combined function bending magnet. QF1R isquadrupole magnet to adjust the defocusing component ofBH1R. The initials “S” and “Z” denote the sextupole magneand the steering magnets, respectively.
a beam extraction line, whose purpose is to examineproperties of the beam. The beam diagnosis in thetraction line started in November, 1997. In the followinsections, we will discuss the emittance measurementparatus and technique and cures for several types oftematic measurement errors. Finally, we will evaluate adiscuss the measurement results.
II. KEK-ATF EXTRACTION LINE
Figure 2 depicts the layout of the KEK-ATF extractioline, which consists of five bending magnets andquadrupole magnets. The double kicker system, in wh
TABLE II. Design parameters of the ATF damping ring.
Parameter Symbol Value
Beam energy Ebeam 1.285 GeVRing circumference LC 138.6 mrf frequency fRF 713.996 MHzrf voltage VRF 283.6 kVHarmonic number h 330Synchrotron frequency fs 10.65 kHzMomentum compaction aM 2.141 3 1023
rf momentum acceptance sspypdRF 0.01246Natural emittance ´x 1.122 nmNatural bunch length sz 5.211 mmNatural momentum spread sEyE 5.434 3 1024
Average beta functions kbxl 3.869 mkbyl 4.459 m
022801-2
etehe
hex-
p-ys-d
6h
the kicker magnets are separated by a horizontal padvance of 180±, was chosen to study the suppressionbeam position jitter by such a kicker system [12]. At tend of the extraction line there is a beam diagnostic secThe system was designed such that the dispersion isin this diagnostic section.
An integrating current transformer (ICT) and 14 singpath strip-line-type beam position monitors (BPMs)beam current and beam position measurement are loin the extraction line. Clipping circuits [13,14] are usto read out the signals from all the BPMs, resultinga position resolution of approximately20 30 mm. TheBPM resolution was estimated from the noise ofreadout electronics. The resolution of20 30 mm wasverified in the beam diagnostic section by repeatemeasuring the jitter-free vertical orbit.
In order to measure the beam size and to evaluatebeam emittance, we installed four wire scanners. Ewire mount is placed at a 45± tilt angle to the horizontaplane, as shown in Fig. 3. Both the horizontal and vertbeam sizes were measured by sliding the wire moalong its axis and detecting theg rays that are scattereon the wires parallel to the vertical and horizontal plarespectively. The wire position is read out by measurthe wire mount position using a digital position gauge wa resolution of5 mm. This corresponds to a horizontbeam position of approximately3.5 mm. Assuming thebeam profile is a Gaussian distribution of rms sizesreal,the measured beam sizesmeas is given by
smeas
vuuts
2real 1
√dwire
4
!2
, (2)
where dwirey4 is the second-order moment of a rounshaped wire with a diameterdwire. Since each wire scannconsists of a50 mm diameter tungsten filament, the cotribution of the wire thickness to the measured rms besize is12.5 mm. The minimum beam size for all emitance measurements was approximately30 mm, 3 timeslarger than the wire contribution to the beam size msurement. Theg rays scattered from a wire scanner adetected by an airCerenkov detector followed by a photmultiplier (PMT), developed at the Stanford Linear Accerator Center (SLAC). The airCerenkov detector is fairlyimmune to the effects of the background photons, sincedetector’s threshold energy is set to be 21–22 MeV, wthe critical energy of the synchrotron radiation producby the bending magnets in the extraction line is very lat approximately 1 keV.
All of these beam monitors are read out on a sinbeam passage with analog-to-digital converter (ADCAMAC modules and the readout signals of each motor are simultaneously recorded in the VSYSTEM [1database, thus enabling us to examine any correlabetween these monitors.
022801-2

PRST-AB 2 EVALUATION OF EXTREMELY SMALL HORIZONTAL EMITTANCE 022801 (1999)
, and
ATF Beam Extraction Line
Ext Kicker 1
Ext Kicker 2
Beam Diagnostic Section
Screen Monitor MS3X( Momentum Spread Measurement)
Beam Dump QF
5XQ
D6X
QD
7X
QF
6X
QD
8X
QF
7X
QD
9XAir CerenkovDetector
ML
14X
MW
1X
MW
2X
MW
3X
MW
4X
ML
8X
ML
9X
ML
10X
ML
11X
ML
12X
ML
13X
FIG. 2. Layout of the KEK-ATF extraction line. The initial “Q” shows the quadrupole magnets, “MW” the wire scanners“ML” the strip-line-type BPMs.
,re
sEKth
ngth
thn iurrise
F.
rior
onforisst
wobe
fre-by
talhe
per-sion
dis-eso-nd
rfer-tionof
berith
III. HORIZONTAL DISPERSION CORRECTION
The general expression for the horizontal beam sizesx
is
sx
vuut´xbx 1
√hx
sp
p
!2
, (3)
with ´x the horizontal emittance,bx the horizontalbeta function, hx the horizontal dispersion functionand spyp the relative momentum spread. All wiscanners are located in the dispersion-free diagnosection mentioned above. However, because the KATF damping ring is a test accelerator, magnet strengespecially those of steering magnets, are often chafor various beam studies. This results in changes ofhorizontal dispersion in the damping ring as well as inextraction line. Since the residual horizontal dispersiothe beam diagnostic section contributes to the measbeam size and the longitudinal beam oscillation givesto additional horizontal position jitter proportional to th
50µm Tungsten Wire
Wire mount
Wire scanner chamber
Guide Stage
Pulse Motor Stage
Digital Position Gauge( MagneScale)
Front ViewSide View
FIG. 3. Schematic figure of wire scanner used in KEK-AT
022801-3
tic-
s,ede
enede
dispersion, we must correct the horizontal dispersion pto any beam diagnosis in the extraction line.
The horizontal dispersion function in the extractiline is evaluated by measuring the orbit differencesdifferent damping ring rf frequencies. When a beaminjected into the damping ring, the damping ring rf mube synchronized with the linac rf. However, between tsuccessive injections the damping ring rf frequency canchanged, in order to measure dispersion function. Thequency shift changes the energy of the extracted beam
Dpp
21
aM
DfRF
fRF, (4)
with aM the momentum compaction factor andfRF the rffrequency of the damping ring cavities. The horizonorbit difference is proportional to the magnitude of tenergy shift as
Dx hx
√Dpp
! 2
hx
aM
DfRF
fRF(5)
ignoring higher-order effects such as second-order dission. Therefore, we can evaluate the horizontal disperas
hx
aM 2fRF
DxDfRF
. (6)
Equation (6) demonstrates that the resolution of thepersion measurement is determined by the position rlution, due to orbit jitter and BPM readout resolution, aby the magnitude of the rf frequency change. A largefrequency change improves the resolution of the dispsion measurement even when the BPM readout resoluis poor or a large position jitter exists. The magnitudethe rf frequency change is limited by the vacuum chamdiameter of 24 mm and a large horizontal dispersion w
022801-3

PRST-AB 2 T. OKUGI et al. 022801 (1999)
het
t bfretethoyre
teylim
reit
eb
oir
int
rbites
pes
foris-
byfcsof
ag-siongths
e ofcor-ue
is-eamtua-i-
heonwon inion,
ns
ingntald byion.e
ize-
mtionthe
a maximum value of approximately 2.5 m. To allow tbeam through a vacuum chamber without beam loss inlarge dispersion region, the rf frequency change mussmaller than64.7 kHz. In addition, a linearity range o3 mm for the BPM readout electronics [13,14] furtherstricts the useful range of rf frequencies to approxima62 kHz. Abandoning the dispersion measurement inlarge dispersion region would improve the resolutionthe dispersion measurement at other BPM locations bfactor of 2 or more. However, the dispersion measument resolution forDfRF 62 kHz is 11 mm, even if weassume the beam position jitter of200 mm and 30 timesdata taking, and it corresponds to a beam size of6.8 mm.This is adequate for the dispersion correction becausetypical horizontal beam size in the beam diagnostic stion is30 100 mm. Therefore, the maximum rf frequencchange for the horizontal dispersion measurement wasited to62 kHz.
The horizontal dispersion measurement and its cortion were carried out as follows. First, the beam orbfor five rf frequency offsets,12 kHz, 11 kHz, 0 kHz,21 kHz, and22 kHz, were measured randomly by thBPMs pulse by pulse to reduce the systematic error
-0.1
0
0.1
26 28 30 32 34 36 38
(c) Dispersion at Wire Scanners (After Correction)
Hor
izon
tal D
ispe
rsio
n [m
]
s [m]
MW1X MW2XMW3X
MW4X
-3
-2
-1
0
1
2
3
0 5 10 15 20 25 30 35 40
(b) After Horizontal Dispersion Correction
Hor
izon
tal D
ispe
rsio
n [m
]
s [m]
-3
-2
-1
0
1
2
3
0 5 10 15 20 25 30 35 40
(a) Before Horizontal Dispersion Correction
Hor
izon
tal D
ispe
rsio
n [m
]
s [m]
FIG. 4. Horizontal dispersion (a) before the dispersion crection, (b) after the dispersion correction, and (c) at the wscanner location (after the dispersion correction). The poshow the measured dispersion for each BPM position andlines show the fitted results.
022801-4
hee
-lyefa-
hec-
-
c-s
e-
r-etshe
tween the measurement with each offset such as odrift. The position was measured approximately 30 timfor each rf frequency offset. We then evaluated the sloDxrampyDfRF by linear fitting using aMINUIT [16] soft-ware package and obtained the horizontal dispersioneach BPM position applying Eq. (6). The horizontal dpersion at the wire scanner locations was evaluatedfitting for the two parametershx , h0
x at the entrance othe extraction line. For the fit, we utilized a linear optimodel of the extraction line, which includes the effectfinite magnet thickness. Finally, we calculated the mnet settings required to suppress the horizontal disperin the beam diagnostic section and changed the strenof some quadrupole magnets accordingly. An examplthe measured horizontal dispersion before and afterrection is shown in Fig. 4. After the correction, the valof the horizontal dispersion is reduced within65 cm.
IV. POSITION JITTER CORRECTION
Since one of the extraction kickers suffered from dcharges, the horizontal beam position of the extracted bwas not stable. Because the magnitude of the orbit fluction of 50 200 mm was comparable to the typical horzontal beam size of30 100 mm, we applied a positionjitter correction method to infer the real beam size. Tposition correction was not carried out using all BPMsthe extraction line since the resolution obtained with tBPMs was adequate and allowed for a fast calculatiothe on-line control system. In a dispersion-free sectthe horizontal beam offset at an arbitrary positionx3 is cal-culated from the horizontal offsets at two other positiox1, x2 as follows:
x3 R12ss3, s1dR12ss2, s1d
x2 2R12ss3, s2dR12ss2, s1d
x1 . (7)
Here, R12ssj, sid is a transfer matrix component fromsi
to sj . The transfer matrix elements were obtained usthe measured magnetic field strengths. As the horizobeam offsets at more than two positions are measureBPMs, we can estimate the beam offset at any positThe expected position resolutionsx3 depends upon thBPM readout resolutionsx,BPM as
sx3
vuut√R12ss3, s1dR12ss2, s1d
!2
1
√R12ss3, s2dR12ss2, s1d
!2
sx,BPM
fss1, s2, s3dsx,BPM . (8)
While any set of two BPM readouts can be used forx1, x2
in Eq. (7), the set of BPMs should be chosen to minimthe resolution factorfss1, s2, s3d for each relevant location s3.
In preparation for the position correction of the beasize measurement using Eq. (7), the quality of the posiestimate was tested by applying the estimate to
022801-4
PRST-AB 2 EVALUATION OF EXTREMELY SMALL HORIZONTAL EMITTANCE 022801 (1999)
rth
pei
afotio
e
te
wM
as
teateio
foho
oning
het of
the
thetedith
di-
-ted
wsion-lts
Tt toireaticfithich
notc-
eualenteta
-s
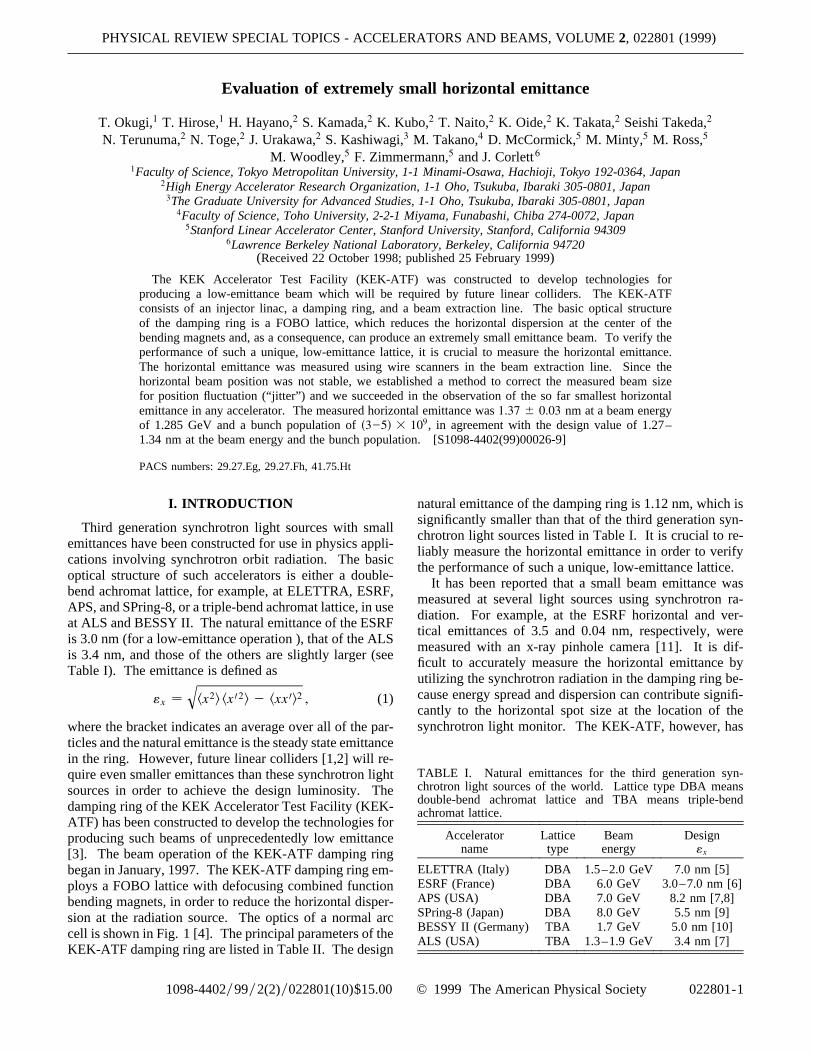
TABLE III. The list of resolution factors for each monitolocated at the beam diagnostic section. BPM1, BPM2 areset of BPMs for minimum resolution factors. The monitor tyBPM stands for a beam position monitor and WS means wscanner.
Monitor name Type BPM1 BPM2 fss1, s2, s3d
ML10X BPM ML14X ML8X 0.634ML11X BPM ML12X ML14X 0.293ML12X BPM ML14X ML8X 1.249ML13X BPM ML8X ML12X 0.196MW1X WS ML11X ML10X 0.758MW2X WS ML12X ML10X 0.432MW3X WS ML12X ML9X 0.868MW4X WS ML10X ML11X 0.370
BPM location, where it could be compared withdirect BPM measurement. The set of BPMs usedthe position estimation and the corresponding resolufactorfss1, s2, s3d for each BPM is listed in Table III. TheBPMs used for the position correction were chosen soto obtain the best resolution. Using Eq. (7), we definquantityXss3d as
Xss3d x3 2
√R12ss3, s1dR12ss2, s1d
x2 2R12ss3, s2dR12ss2, s1d
x1
!. (9)
Xss3d would ideally be zero for all BPM locations, buan off-center beam orbit at a quadrupole magnet betws1 ands3 might cause a finite value forXss3d, due to thekick of the quadrupole magnet. The fluctuation ofXss3d,however, should be given by
sX ss3d q
1 1 f2ss1, s2, s3d sx,BPM (10)
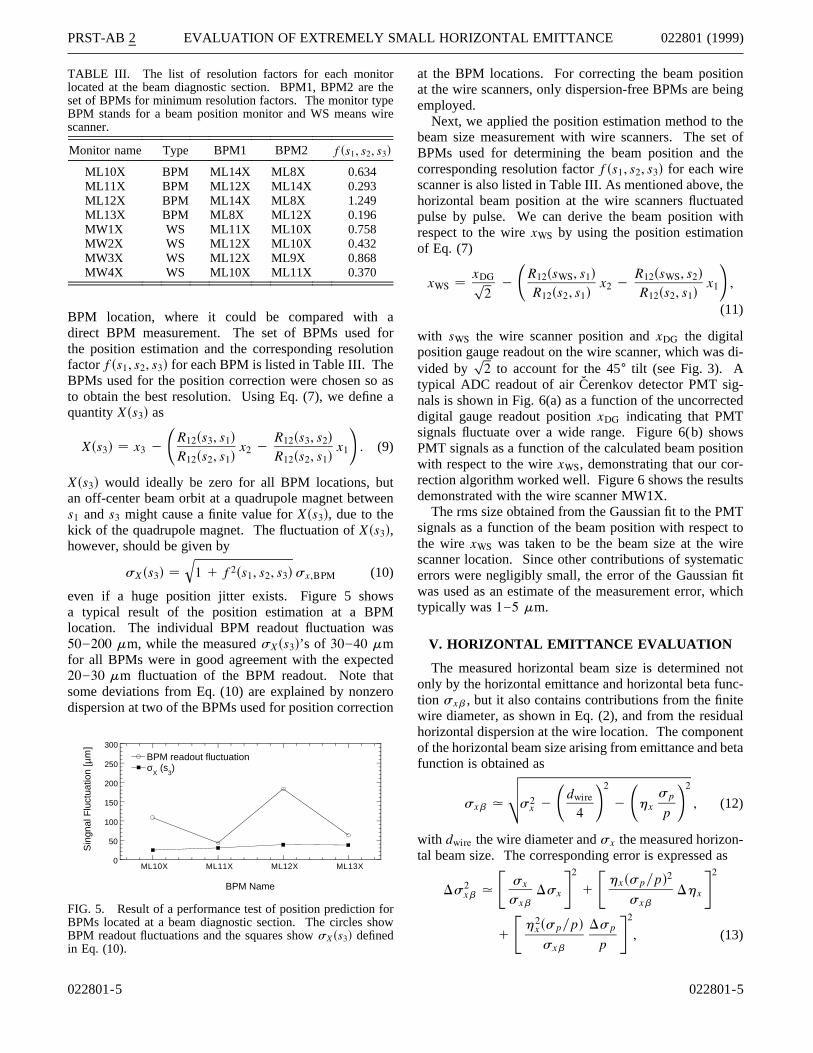
even if a huge position jitter exists. Figure 5 shoa typical result of the position estimation at a BPlocation. The individual BPM readout fluctuation w50 200 mm, while the measuredsXss3d’s of 30 40 mmfor all BPMs were in good agreement with the expec20 30 mm fluctuation of the BPM readout. Note thsome deviations from Eq. (10) are explained by nonzdispersion at two of the BPMs used for position correct
0
50
100
150
200
250
300
ML10X ML11X ML12X ML13X
BPM readout fluctuationσ
X (s
3)
Sin
gnal
Flu
ctua
tion
[µm
]
BPM Name
FIG. 5. Result of a performance test of position predictionBPMs located at a beam diagnostic section. The circles sBPM readout fluctuations and the squares showsXss3d definedin Eq. (10).
022801-5
e
re
rn
asa
en
s
d
ron
rw
at the BPM locations. For correcting the beam positiat the wire scanners, only dispersion-free BPMs are beemployed.
Next, we applied the position estimation method to tbeam size measurement with wire scanners. The seBPMs used for determining the beam position andcorresponding resolution factorfss1, s2, s3d for each wirescanner is also listed in Table III. As mentioned above,horizontal beam position at the wire scanners fluctuapulse by pulse. We can derive the beam position wrespect to the wirexWS by using the position estimationof Eq. (7)
xWS xDGp
22
√R12ssWS, s1dR12ss2, s1d
x2 2R12ssWS, s2dR12ss2, s1d
x1
!,
(11)
with sWS the wire scanner position andxDG the digitalposition gauge readout on the wire scanner, which wasvided by
p2 to account for the 45± tilt (see Fig. 3). A
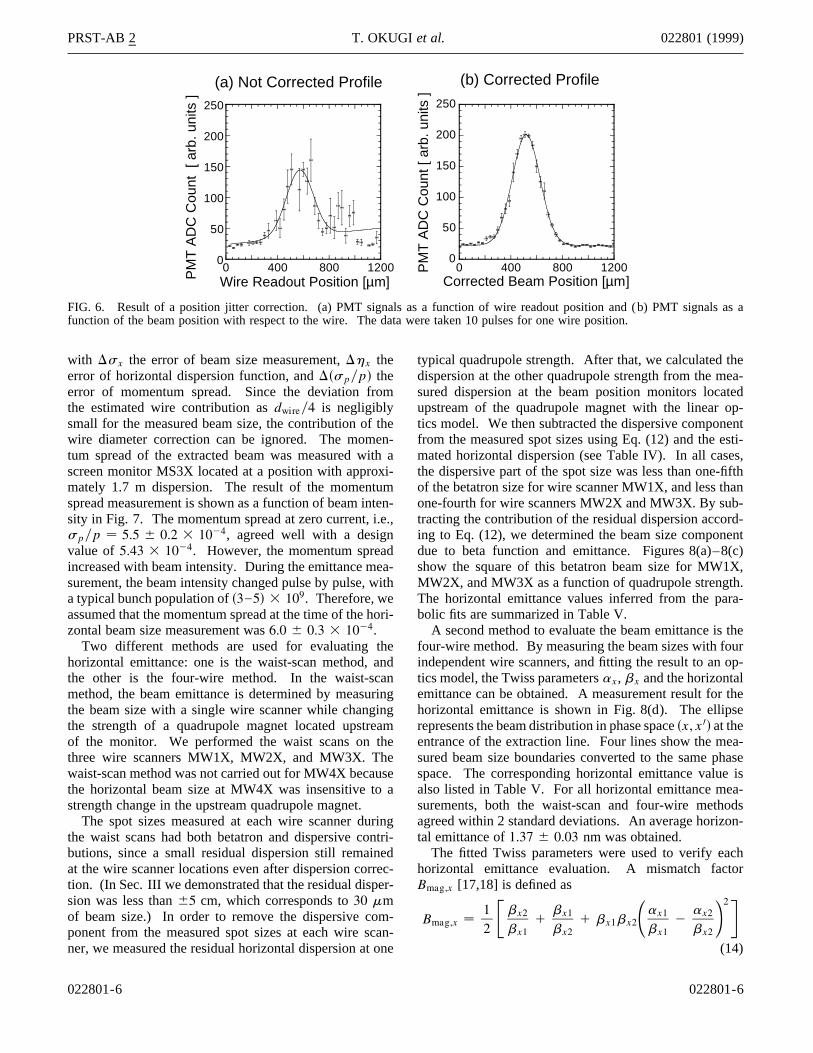
typical ADC readout of airCerenkov detector PMT signals is shown in Fig. 6(a) as a function of the uncorrecdigital gauge readout positionxDG indicating that PMTsignals fluctuate over a wide range. Figure 6(b) shoPMT signals as a function of the calculated beam positwith respect to the wirexWS, demonstrating that our correction algorithm worked well. Figure 6 shows the resudemonstrated with the wire scanner MW1X.
The rms size obtained from the Gaussian fit to the PMsignals as a function of the beam position with respecthe wire xWS was taken to be the beam size at the wscanner location. Since other contributions of systemerrors were negligibly small, the error of the Gaussianwas used as an estimate of the measurement error, wtypically was1 5 mm.
V. HORIZONTAL EMITTANCE EVALUATION
The measured horizontal beam size is determinedonly by the horizontal emittance and horizontal beta funtion sxb , but it also contains contributions from the finitwire diameter, as shown in Eq. (2), and from the residhorizontal dispersion at the wire location. The componof the horizontal beam size arising from emittance and bfunction is obtained as
sxb .
vuuts2
x 2
√dwire
4
!2
2
√hx
sp
p
!2
, (12)
with dwire the wire diameter andsx the measured horizontal beam size. The corresponding error is expressed a
Ds2xb .
"sx
sxb
Dsx
#2
1
"hxsspypd2
sxb
Dhx
#2
1
"h2
xsspypdsxb
Dsp
p
#2
, (13)
022801-5
PRST-AB 2 T. OKUGI et al. 022801 (1999)
ls as a
0
50
100
150
200
250
0 400 800 1200
(b) Corrected Profile
PM
T A
DC
Cou
nt [
arb.
uni
ts ]
Corrected Beam Position [µm]
0
50
100
150
200
250
0 400 800 1200
(a) Not Corrected Profile
PM
T A
DC
Cou
nt [
arb
. uni
ts ]
Wire Readout Position [µm]
FIG. 6. Result of a position jitter correction. (a) PMT signals as a function of wire readout position and (b) PMT signafunction of the beam position with respect to the wire. The data were taken 10 pulses for one wire position.
om
thenithxiumte
i.e
dew
ho
theananriin
eatheus
rinte
ree
mcao
theea-ted
op-nentesti-es,fifthan
b-rd-ent(c)X,
th.ra-
theourop-
lthe
se
ea-hasee isa-odson-
achtor
with Dsx the error of beam size measurement,Dhx theerror of horizontal dispersion function, andDsspypd theerror of momentum spread. Since the deviation frthe estimated wire contribution asdwirey4 is negligiblysmall for the measured beam size, the contribution ofwire diameter correction can be ignored. The momtum spread of the extracted beam was measured wscreen monitor MS3X located at a position with appromately 1.7 m dispersion. The result of the momentspread measurement is shown as a function of beam insity in Fig. 7. The momentum spread at zero current,spyp 5.5 6 0.2 3 1024, agreed well with a designvalue of 5.43 3 1024. However, the momentum spreaincreased with beam intensity. During the emittance msurement, the beam intensity changed pulse by pulse,a typical bunch population ofs3 5d 3 109. Therefore, weassumed that the momentum spread at the time of thezontal beam size measurement was6.0 6 0.3 3 1024.
Two different methods are used for evaluatinghorizontal emittance: one is the waist-scan method,the other is the four-wire method. In the waist-scmethod, the beam emittance is determined by measuthe beam size with a single wire scanner while changthe strength of a quadrupole magnet located upstrof the monitor. We performed the waist scans onthree wire scanners MW1X, MW2X, and MW3X. Thwaist-scan method was not carried out for MW4X becathe horizontal beam size at MW4X was insensitive tostrength change in the upstream quadrupole magnet.
The spot sizes measured at each wire scanner duthe waist scans had both betatron and dispersive cobutions, since a small residual dispersion still remainat the wire scanner locations even after dispersion cortion. (In Sec. III we demonstrated that the residual dispsion was less than65 cm, which corresponds to30 mmof beam size.) In order to remove the dispersive coponent from the measured spot sizes at each wire sner, we measured the residual horizontal dispersion at
022801-6
e-a
-
n-.,
a-ith
ri-
d
nggme
ea
ngri-dc-r-
-n-
ne
typical quadrupole strength. After that, we calculateddispersion at the other quadrupole strength from the msured dispersion at the beam position monitors locaupstream of the quadrupole magnet with the lineartics model. We then subtracted the dispersive compofrom the measured spot sizes using Eq. (12) and themated horizontal dispersion (see Table IV). In all casthe dispersive part of the spot size was less than one-of the betatron size for wire scanner MW1X, and less thone-fourth for wire scanners MW2X and MW3X. By sutracting the contribution of the residual dispersion accoing to Eq. (12), we determined the beam size compondue to beta function and emittance. Figures 8(a)–8show the square of this betatron beam size for MW1MW2X, and MW3X as a function of quadrupole strengThe horizontal emittance values inferred from the pabolic fits are summarized in Table V.
A second method to evaluate the beam emittance isfour-wire method. By measuring the beam sizes with findependent wire scanners, and fitting the result to antics model, the Twiss parametersax, bx and the horizontaemittance can be obtained. A measurement result forhorizontal emittance is shown in Fig. 8(d). The elliprepresents the beam distribution in phase spacesx, x0d at theentrance of the extraction line. Four lines show the msured beam size boundaries converted to the same pspace. The corresponding horizontal emittance valualso listed in Table V. For all horizontal emittance mesurements, both the waist-scan and four-wire methagreed within 2 standard deviations. An average horiztal emittance of1.37 6 0.03 nm was obtained.
The fitted Twiss parameters were used to verify ehorizontal emittance evaluation. A mismatch facBmag,x [17,18] is defined as
Bmag,x 12
"bx2
bx11
bx1
bx21 bx1bx2
√ax1
bx12
ax2
bx2
!2#(14)
022801-6

PRST-AB 2 EVALUATION OF EXTREMELY SMALL HORIZONTAL EMITTANCE 022801 (1999)
tea
h
sane
sfot
od.of
wissotherd as
sereof
en-pos-
s theofas
pu-on
ekby
esimeizedmoesanad.
eadyumesas a
entthen toen-tronalsothisK-
theated
theten-
ds to
umeam
atior-
isn
1.0
1.1
1.2
1.3
1.4
1.5
0 1 2 3 4 5 6 7 8
Exp
ecte
d H
oriz
onta
l Em
ittan
ce [n
m]
Bunch Population × 109
(c)
26
27
28
29
30
31
32
0 1 2 3 4 5 6 7 8Bem
a S
ize
at M
S3X
[ ar
b. u
nits
]
Bunch Population × 109
(b)
3
4
5
6
7
8
0 1 2 3 4 5 6 7 8
Mom
entu
m S
prea
d σ
p / p
Bunch Population
× 10-4
× 109
(a)
FIG. 7. Results of momentum spread measurement byscreen monitor MS3X. (a) The measured momentum sprwhich is evaluated to bes5.5 6 0.2d 3 1024 at zero currentand6.0 6 0.3 3 1024 at the bunch population ofs3 5d 3 109.A scaling error from the charge-coupled device pixel to tbeam size of35.4 6 1.6 mmypixel contributes to the largemomentum spread error. (b) Vertical axis is changed tomeasured beam size at the screen monitor. The curve showexpected momentum spread, which is assumed to be increby the intrabeam scattering while keeping a constant emittaratio ´xy´y 2.31%. (c) Expected horizontal emittance at themittance ratio of 2.31%.
for two different sets of Twiss parametersax , bx. Thebeam emittance was evaluated by assuming the tranmatrix from the quadrupole magnet to the wire scannerthe waist-scan method and assuming the transfer ma
022801-7
hed,
e
athesedce
ferr
rix
between the wire scanners for the four-wire methWe checked the optics error and the consistencyevaluated emittances by usingBmag,x . In the calculationof Bmag,x , each measurement was used as one set of Tparameters, and an average Twiss parameter for thethree measurements weighted by their errors was usethe second set. That allBmag,x were close to unity showthat the different horizontal emittance measurements wconsistent with each other. The extracted valuesBmag,x ’s are also shown in Table V.
VI. DISCUSSION
During the emittance measurement, an intensity depdence of the momentum spread was observed. Onesible source of the momentum spread enhancement imicrowave instability [19,20]. However, the thresholdthe microwave instability for 1.3 GeV beam energy wcalculated to be a bunch population of1.3 3 1010 [21].Since this threshold is 3 times higher than the bunch polation during the experiment, it is not a probable reasfor the energy spread enhancement.
A more likely reason would be the multiple Touscheffect (intrabeam scattering), which was investigatedBruck and Le Duff [22,23], in order to explain differencbetween the measured beam lifetime and the lifetexpected from the single Touschek effect, and generalby Piwinski [24]. They showed that small momentutransfer from a transverse to a longitudinal direction dnot contribute directly to particle losses but acts asadditional excitation source on the momentum spreAs a consequence, they showed it produced a new ststate of the momentum spread. Since the bunch volin the KEK-ATF damping ring is extremely small, it iexpected that an effect of the intrabeam scattering hstrong influence on the momentum spread enhancem[25]. Therefore, we regard it as the main source ofobserved momentum spread enhancement. In additioaffecting the momentum spread, the longitudinal momtum impulse at a dispersive position affects the betaoscillation and transverse equilibrium emittances areexpected to increase with the beam intensity throughintrabeam scattering process. The effect in the KEATF damping ring was evaluated by theSAD computercode [26] self-consistently taking into account bothmomentum spread and the emittances. The calculmomentum spread enhancement was compared tomeasured one shown in Fig. 7(b), and the measured insity dependence on the momentum spread corresponthe bunch volume with2.31 6 0.68% emittance coupledbeam. The curve in Fig. 7(b) shows the momentspread, which is assumed to be increased by the intrabscattering while keeping the constant emittance r´xy´y 2.31% through all the beam current. Futhermore, the corresponding horizontal emittanceexpected to be1.27 6 0.04 nm at the bunch populatio
022801-7

PRST-AB 2 T. OKUGI et al. 022801 (1999)
TABLE IV. The list of measured beam sizes and dispersions and estimated betatron beam sizes.
(a) MW1X waist scan
QF5X current Measured beam sizesx Dispersionhx Estimated betatron beam sizesxb
10.69 A 164.81 6 1.50 mm 0.58 6 1.01 cmb 164.30 6 1.51 mm12.69 A 128.53 6 0.93 mm 0.75 6 0.52 cma 127.84 6 0.94 mm14.69 A 87.70 6 0.58 mm 0.91 6 0.31 cmb 86.63 6 0.60 mm16.69 A 56.60 6 0.40 mm 1.07 6 0.69 cmb 54.83 6 0.64 mm18.69 A 39.85 6 0.48 mm 1.24 6 1.19 cmb 37.11 6 1.51 mm20.69 A 65.42 6 0.66 mm 1.40 6 1.70 cmb 63.66 6 1.51 mm22.69 A 101.12 6 1.43 mm 1.57 6 2.22 cmb 99.90 6 1.92 mm24.69 A 137.25 6 2.26 mm 1.73 6 2.74 cmb 136.28 6 2.60 mm26.69 A 178.31 6 1.22 mm 1.89 6 3.27 cmb 177.51 6 1.75 mm
(b) MW2X waist scan
QD7X current Measured beam sizesx Dispersionhx Estimated betatron beam sizesxb
5.18 A 115.91 6 1.69 mm 1.43 6 2.26 cmb 114.91 6 2.07 mm9.18 A 88.02 6 1.04 mm 1.41 6 2.22 cmb 86.71 6 1.68 mm
13.18 A 63.74 6 0.48 mm 1.39 6 1.82 cmb 61.95 6 1.55 mm17.18 A 38.49 6 1.77 mm 1.36 6 1.43 cmb 35.47 6 2.76 mm21.18 A 40.80 6 0.23 mm 1.34 6 1.04 cma 38.00 6 1.34 mm25.18 A 60.18 6 0.15 mm 1.31 6 0.68 cmb 58.34 6 0.57 mm29.18 A 86.79 6 0.77 mm 1.29 6 0.44 cmb 85.54 6 0.82 mm33.18 A 116.98 6 0.38 mm 1.26 6 0.53 cmb 116.06 6 0.44 mm37.18 A 149.31 6 1.45 mm 1.24 6 0.86 cmb 148.60 6 1.48 mm
(c) MW3X waist scan
QF6X current Measured beam sizesx Dispersionhx Estimated betatron beam sizesxb
13.85 A 177.00 6 1.24 mm 4.50 6 2.04 cmb 174.48 6 2.28 mm15.85 A 151.35 6 0.32 mm 4.14 6 2.28 cmb 148.77 6 2.32 mm17.85 A 114.78 6 0.13 mm 3.93 6 2.57 cmb 111.63 6 3.27 mm19.85 A 86.08 6 1.82 mm 3.43 6 2.91 cmb 82.64 6 4.75 mm21.85 A 88.03 6 1.07 mm 3.07 6 3.28 cma 85.16 6 4.40 mm23.85 A 111.84 6 0.73 mm 2.71 6 3.66 cmb 109.94 6 3.33 mm25.85 A 143.65 6 0.58 mm 2.35 6 4.05 cmb 142.41 6 2.48 mm27.85 A 189.68 6 0.67 mm 2.00 6 4.46 cmb 188.89 6 1.83 mm
(d) Four-wire method
Monitor name Measured beam sizesx Dispersionhx Estimated betatron beam sizesxb
MW1X 128.53 6 0.93 mm 0.75 6 0.52 cma 127.84 6 0.94 mmMW2X 40.80 6 0.23 mm 1.34 6 1.04 cma 38.00 6 1.34 mmMW3X 88.03 6 1.07 mm 3.07 6 3.28 cma 85.16 6 4.40 mmMW4X 55.50 6 0.48 mm 23.98 6 4.83 cma 48.52 6 13.70 mm
aMeasured horizontal dispersion.bEstimated horizontal dispersion from the dispersion with a linear optics model.
tere
threit
elyingthetelyineice.ts incennceek
of 3 3 109 and 1.34 6 0.05 nm at 5 3 109 by the mul-tiple Touschek effect [see Fig. 7(c)]. Thus the expechorizontal emittance at the beam intensity was in agment with that of1.37 6 0.03 nm inferred from the beamsize measurements.
VII. CONCLUSION
The KEK-ATF has been constructed to developtechnologies for producing the low-emittance beamquired by future linear colliders. The design natural em
022801-8
de-
e--
tance in the damping ring is extremely small, nam1.12 nm. The basic optical structure of the damping ris a FOBO lattice, with a small horizontal dispersion atcenter of the bending magnets. It is crucial to accuradetermine the horizontal emittance in order to examthe performance of such a unique, low-emittance lattFrom the position corrected beam size measurementhe extraction line, we inferred a horizontal emittanof 1.37 6 0.03 nm. This value is slightly larger thathe design natural emittance. However, the differeof 15%–20% can be attributed to the multiple Tousch
022801-8

PRST-AB 2 EVALUATION OF EXTREMELY SMALL HORIZONTAL EMITTANCE 022801 (1999)
result of a
0
1
2
3
4
10 20 30
(a) MW1X Waist Scan
σ x2 [ m
2 ]
QF5X Current [A]
× 10-8
-100
0
100
-200 0 200
x' [
µrad
]
x [ µm ]
MW1X
MW2X
MW3X
MW4X
(d) 4Wire Measurement
0
1
2
3
0 10 20 30 40
(b) MW2X Waist Scan
σ x2 [ m
2 ]
QD7X Current [A]
× 10-8
0
1
2
3
4
10 20 30
(c) MW3X Waist Scan
σ x2 [ m
2 ]
QF6X Current [A]
× 10-8
FIG. 8. Beam-size measurement result. (a), (b), and (c) are results of waist scans for each monitor, and (d) shows thefour-wire measurement.
ts
rethx
gs
soheh
o,-
tri-hi,e-ll,
ini-
rt
rtta,nd
n
7da,
TABLE V. The results of horizontal emittance measuremen“Average” is the data average weighted by the errors.
EmittanceMethod Monitor (nm) Bmag,x
Waist-scan MW1X 1.47 6 0.06 1.03 6 0.07Waist-scan MW2X 1.27 6 0.06 1.00 6 0.03Waist-scan MW3X 1.38 6 0.05 1.02 6 0.05Four-wire All monitors 1.29 6 0.11 1.06 6 0.34
Average 1.37 6 0.03 ax: 3.83; bx: 6.77
effect. For a bunch population of3 5 3 109, the hori-zontal emittance is expected to be 1.27–1.34 nm, in agment with the measured values. It was verified thatFOBO lattice is a valuable lattice for the generation of etremely small emittance beams.
ACKNOWLEDGMENTS
The authors express their thanks to Professor H. Suwara, Professor Y. Kimura, Professor M. Kihara, Profesor S. Iwata, Professor G. Loew, Professor E. PaterProfessor D. Burke, and Professor J. Sheppard for tcontinuous encouragement and support in this work. Tauthors would especially like to thank to Dr. M. AkemotDr. S. Araki, Dr. Y. Funahashi, Dr. F. Hinode, Dr. T. Ko
022801-9
.
e-e-
a--n,ire
rhonen, Dr. S. Sakanaka, and Dr. N. Sato for their conbution of the hardware development, and Dr. M. KikucDr. S. Kuroda, and Dr. T. Raubenheimer for their dsign works of KEK-ATF. Finally, the authors thank aother KEK-ATF Collaboration members in BINP, CERNDESY, IHEP, KEK, LBNL, PAL, SLAC, Kyoto Uni-versity, Science University of Tokyo, Tohoku-GakuUniversity, Tohoku University, Tokyo Metropolitan Unversity, and University of Tokyo.
[1] JLC Design Study Group, KEK Report No. 97-1, 1997.[2] The NLC Design Group, LBNL-PUB-524, SLAC Repo
No. 474, UCRL-ID-12416, 1996.[3] ATF Design and Study Report, KEK Internal Repo
No. 95-4, 1995, edited by F. Hinode, S. KawabaH. Matsumoto, K. Oide, K. Takata, Seishi Takeda, aJ. Urakawa.
[4] J. Urakawaet al., Int. J. Mod. Phys. A (Proc. Suppl.)2,124 (1993).
[5] Carlo J. Bocchetta, inProceedings of the Fifth EuropeaParticle Accelerator Conference, Barcelona, 1996(Insti-tute of Physics, Bristol, UK, 1996), p. 76.
[6] A. Ropert and L. Farvacque, inProceedings of the 199Particle Accelerator Conference, Vancouver, Cana1997(IEEE, Piscataway, NJ, 1998), p. 754.
022801-9

PRST-AB 2 T. OKUGI et al. 022801 (1999)
r-
le
a-
fer
on
aran,
ce),
gi,to,
ola
a,naenK
,
a,ce,or
E
ds
o,
ce,,
rs,a
a-se,
l74
0,
odeee,dno,
[7] Glenn Decker, inProceedings of the Fifth European Paticle Accelerator Conference, Barcelona, 1996(Instituteof Physics, Bristol, UK, 1996), p. 95.
[8] Glenn Decker, in Proceedings of the 1997 ParticAccelerator Conference, Vancouver, Canada, 1997(IEEE,Piscataway, NJ, 1998), p. 698.
[9] H. Kamitsubo,Proceedings of the 1997 Particle Accelertor Conference, Vancouver, Canada, 1997(IEEE, Piscata-way, NJ, 1998), p. 6.
[10] BESSY-II Project Team, E. Jaeschke, inProceedings othe 1997 Particle Accelerator Conference, VancouvCanada, 1997(IEEE, Piscataway, NJ, 1998), p. 713.
[11] P. Elleaume, C. Fortgang, C. Penel, and E. TarazJ. Synchrotron Radiat.2, 209 (1995).
[12] H. Nakayama, inProceedings of the SLAC/KEK LineCollider Workshop on Damping Ring, Tsukuba, Jap1992, KEK Proceedings 92-6(KEK, Tsukuba, Japan1992), p. 326.
[13] F. Hinode, J. Urakawa, and Y. Yoribayashi, inPro-ceedings of the 1997 Particle Accelerator ConferenVancouver, Canada, 1997(IEEE, Piscataway, NJ, 1998p. 578.
[14] M. Takano, H. Hayano, J. Urakawa, and T. OkuProceedings of the Sixth European Particle AcceleraConference, Stockholm, 1998(Institute of Physics, BristolUK, 1998), p. 1607.
[15] VSYSTEM is a commercial product of Vista-ContrSystems, Inc., Los Alamos, New Mexico; N. TerunumH. Hayano, E. S. Kim, K. Kubo, T. Naito, J. UrakawS. Kashiwagi, and T. Okugi, in Proceedings of the Intertional Conference on Accelerators and Large Experimtal Physics Control Systems, Beijing, China, 1997 (KETsukuba, to be published), KEK Report No. 97-233.
[16] MINUIT Reference Manual,edited by F. James (CERN
022801-10
,
a,
,
,
r
,
--
,
Geneva, 1994), Library Long Writeup D506.[17] M. Sands, SLAC Report No. SLAC-AP-085, 1991.[18] F. J. Decker, C. Adolphsen, W. J. Corbett, P. Emm
I. Hsu, H. Moshammer, J. T. Seeman, and W. L. Spenin Proceedings of the 1991 IEEE Particle AcceleratConference, San Francisco, 1991(IEEE, New York,1991), p. 905.
[19] H. G. Hereward, Proceedings of the 1975 ISABELLSummer Study, BNL, 1975(BNL, Upton, NY, 1975),p. 555.
[20] E. Messerschmid and M. Month, Nucl. Instrum. Metho136, 1 (1976).
[21] N. Terunuma, H. Hayano, E. S. Kim, K. Kubo, T. NaitJ. Urakawa, S. Kashiwagi, and T. Okugi, inProceedingsof the Sixth European Particle Accelerator ConferenStockholm, 1998(Institute of Physics, Bristol, UK, 1998)p. 481.
[22] H. Bruck and J. Le Duff, inProceedings of the 5thInternational Conference on High Energy AcceleratoFrascati, Italy, 1965(Comitato Nazionale per l’EnergiNucleare, Rome, 1966), p. 284.
[23] J. Le Duff, in Proceedings of the CERN Accelertor School, Fifth Advanced Accelerator Physics CourRhodes, Greece, 1993(CERN, Geneva, 1995), p. 573.
[24] A. Piwinski, in Proceedings of the Ninth InternationaConference on High Energy Accelerators, Stanford, 19(SLAC, Stanford, CA, 1974), p. 405.
[25] T. Raubenheimer, SLAC Report No. SLAC-PUB-5791992.
[26] SAD code is the accelerator design and simulation cdeveloped by KEK accelerator theoretical group. Sfor example, H. Hirata, inProceedings of the SeconAdvanced ICFA Beam Dynamics Workshop, LugaSwitzerland, 1988(CERN, Geneva, 1988), p. 62.
022801-10