Extremely metal-poor galaxies spectra (Filho+, 2013)
30
A&A 558, A18 (2013) DOI: 10.1051/0004-6361/201322098 c ESO 2013 Astronomy & Astrophysics Extremely metal-poor galaxies: The H content ⋆,⋆⋆ M. E. Filho 1 , B. Winkel 2 , J. Sánchez Almeida 3,4 , J. A. Aguerri 3,4 , R. Amorín 5,6 , Y. Ascasibar 7 , B. G. Elmegreen 8 , D. M. Elmegreen 9 , J. M. Gomes 1 , A. Humphrey 1 , P. Lagos 1 , A. B. Morales-Luis 3,4 , C. Muñoz-Tuñón 3,4 , P. Papaderos 1 , and J. M. Vílchez 5 1 Centro de Astrofísica da Universidade do Porto, 4150-762 Porto, Portugal e-mail: [email protected] 2 Max-Planck Institut für Radioastronomie (MPIfR), Auf dem Hügel 69, 53121 Bonn, Germany 3 Instituto de Astrofísica de Canarias, 38200 La Laguna (Tenerife), Spain 4 Departamento de Astrofísica, Universidad La Laguna, 38206 La Laguna (Tenerife), Spain 5 Instituto de Astrofísica de Andalucía, 18008 Granada, Spain 6 INAF – Osservatorio Astronomico di Roma, via di Frascati 33, 00040 Monte Porzio Catone, Rome, Italy 7 Universidad Autónoma de Madrid, 28049 Madrid, Spain 8 IBM, T. J. Watson Research Center, Yorktown Heights, NY 10598, USA 9 Vassar College, Department of Physics and Astronomy, Poughkeepsie, NY 12604, USA Received 18 June 2013 / Accepted 12 July 2013 ABSTRACT Context. Extremely metal-poor (XMP) galaxies are chemically, and possibly dynamically, primordial objects in the local Universe. Aims. Our objective is to characterize the H content of the XMP galaxies as a class, using as a reference the list of 140 known local XMPs compiled by Morales-Luis et al. (2011). Methods. We have observed 29 XMPs, which had not been observed before at 21 cm, using the Effelsberg radio telescope. This in- formation was complemented with H data published in literature for a further 53 XMPs. In addition, optical data from the literature provided morphologies, stellar masses, star-formation rates and metallicities. Results. Effelsberg H integrated flux densities are between 1 and 15 Jy km s -1 , while line widths are between 20 and 120 km s -1 . H integrated flux densities and line widths from literature are in the range 0.1–200 Jy km s -1 and 15–150 km s -1 , respectively. Of the 10 new Effelsberg detections, two sources show an asymmetric double-horn profile, while the remaining sources show either asymmetric (seven sources) or symmetric (one source) single-peak 21 cm line profiles. An asymmetry in the H line profile is system- atically accompanied by an asymmetry in the optical morphology. Typically, the g-band stellar mass-to-light ratios are ∼0.1, whereas the H gas mass-to-light ratios may be up to two orders of magnitude larger. Moreover, H gas-to-stellar mass ratios fall typically between 10 and 20, denoting that XMPs are extremely gas-rich. We find an anti-correlation between the H gas mass-to-light ratio and the luminosity, whereby fainter XMPs are more gas-rich than brighter XMPs, suggesting that brighter sources have converted a larger fraction of their H gas into stars. The dynamical masses inferred from the H line widths imply that the stellar mass does not exceed 5% of the dynamical mass, while the H mass constitutes between 20 and 60% of the dynamical mass. Furthermore, the dark matter mass fraction spans a wide range, but can account, in some cases, for over 65% of the dynamical mass. XMPs are found to be outliers of the mass – and luminosity – metallicity relation, whereby they lack metals for their estimated dynamical mass and luminosity, suggesting the presence of pristine gas. However, they generally follow the luminosity – and baryonic mass Tully-Fisher relation, indicating that the H gas is partly virialized and contains some rotational support. 60% of the XMP sources show a small velocity offset (10–40 km s -1 ) between the H gas and the stellar/nebular component, implying that, in these sources, the H gas is not tightly coupled to the stars and ionized gas. The effective yields provided by oxygen are often larger than the standard theoretical yields, suggesting that the observed H gas is relatively metal-free. 80% of the XMP sources present asymmetric optical morphology – 60 XMPs show cometary structure, 11 show two bright star-forming knots and 18 show multiple star-forming regions. Star-formation rates are found to be similar to those typically found in BCDs. However, specific star-formation rates are high, with timescales to double their stellar mass, at the current rate, of typically less than 1 Gyr. Conclusions. XMP galaxies are among the most gas-rich objects in the local Universe. The observed H component suggests kine- matical disruption and hints at a primordial composition. Key words. galaxies: fundamental parameters – radio lines: galaxies – techniques: spectroscopic 1. Introduction According to the hierarchical paradigm of structure formation, massive galaxies assemble through mergers and cannibalism of ⋆ Full Fig. 1, Tables 3–5 are available in electronic form at http://www.aanda.org ⋆⋆ Reduced spectra are only available at the CDS via anonymous ftp to cdsarc.u-strasbg.fr (130.79.128.5) or via http://cdsarc.u-strasbg.fr/viz-bin/qcat?J/A+A/558/A18 smaller systems. Interactions between galaxies and secular pro- cesses induce episodes of star-formation. Stellar winds and the death of stars chemically enrich both the interstellar medium and the subsequent stellar generations. In this scenario, extremely metal-poor dwarf galaxies (XMPs) should be common in the early Universe, whereas they should be very rare at low red- shift (York et al. 2000; Pustilnik et al. 2005; Guseva et al. 2007; Izotov et al. 2012; Mamon et al. 2012). Indeed, one of the most recent searches in the Sloan Digital Sky Survey (SDSS) Data Article published by EDP Sciences A18, page 1 of 30
Transcript of Extremely metal-poor galaxies spectra (Filho+, 2013)

A&A 558, A18 (2013)DOI: 10.1051/0004-6361/201322098c© ESO 2013
Astronomy&
Astrophysics
Extremely metal-poor galaxies: The H content⋆,⋆⋆
M. E. Filho1, B. Winkel2, J. Sánchez Almeida3,4, J. A. Aguerri3,4, R. Amorín5,6, Y. Ascasibar7, B. G. Elmegreen8,D. M. Elmegreen9, J. M. Gomes1, A. Humphrey1, P. Lagos1, A. B. Morales-Luis3,4, C. Muñoz-Tuñón3,4,
P. Papaderos1, and J. M. Vílchez5
1 Centro de Astrofísica da Universidade do Porto, 4150-762 Porto, Portugale-mail: [email protected]
2 Max-Planck Institut für Radioastronomie (MPIfR), Auf dem Hügel 69, 53121 Bonn, Germany3 Instituto de Astrofísica de Canarias, 38200 La Laguna (Tenerife), Spain4 Departamento de Astrofísica, Universidad La Laguna, 38206 La Laguna (Tenerife), Spain5 Instituto de Astrofísica de Andalucía, 18008 Granada, Spain6 INAF – Osservatorio Astronomico di Roma, via di Frascati 33, 00040 Monte Porzio Catone, Rome, Italy7 Universidad Autónoma de Madrid, 28049 Madrid, Spain8 IBM, T. J. Watson Research Center, Yorktown Heights, NY 10598, USA9 Vassar College, Department of Physics and Astronomy, Poughkeepsie, NY 12604, USA
Received 18 June 2013 / Accepted 12 July 2013
ABSTRACT
Context. Extremely metal-poor (XMP) galaxies are chemically, and possibly dynamically, primordial objects in the local Universe.Aims. Our objective is to characterize the H content of the XMP galaxies as a class, using as a reference the list of 140 known localXMPs compiled by Morales-Luis et al. (2011).Methods. We have observed 29 XMPs, which had not been observed before at 21 cm, using the Effelsberg radio telescope. This in-formation was complemented with H data published in literature for a further 53 XMPs. In addition, optical data from the literatureprovided morphologies, stellar masses, star-formation rates and metallicities.Results. Effelsberg H integrated flux densities are between 1 and 15 Jy km s−1, while line widths are between 20 and 120 km s−1.H integrated flux densities and line widths from literature are in the range 0.1–200 Jy km s−1 and 15–150 km s−1, respectively. Ofthe 10 new Effelsberg detections, two sources show an asymmetric double-horn profile, while the remaining sources show eitherasymmetric (seven sources) or symmetric (one source) single-peak 21 cm line profiles. An asymmetry in the H line profile is system-atically accompanied by an asymmetry in the optical morphology. Typically, the g-band stellar mass-to-light ratios are ∼0.1, whereasthe H gas mass-to-light ratios may be up to two orders of magnitude larger. Moreover, H gas-to-stellar mass ratios fall typicallybetween 10 and 20, denoting that XMPs are extremely gas-rich. We find an anti-correlation between the H gas mass-to-light ratioand the luminosity, whereby fainter XMPs are more gas-rich than brighter XMPs, suggesting that brighter sources have converteda larger fraction of their H gas into stars. The dynamical masses inferred from the H line widths imply that the stellar mass doesnot exceed 5% of the dynamical mass, while the H mass constitutes between 20 and 60% of the dynamical mass. Furthermore, thedark matter mass fraction spans a wide range, but can account, in some cases, for over 65% of the dynamical mass. XMPs are foundto be outliers of the mass – and luminosity – metallicity relation, whereby they lack metals for their estimated dynamical mass andluminosity, suggesting the presence of pristine gas. However, they generally follow the luminosity – and baryonic mass Tully-Fisherrelation, indicating that the H gas is partly virialized and contains some rotational support. 60% of the XMP sources show a smallvelocity offset (10–40 km s−1) between the H gas and the stellar/nebular component, implying that, in these sources, the H gas isnot tightly coupled to the stars and ionized gas. The effective yields provided by oxygen are often larger than the standard theoreticalyields, suggesting that the observed H gas is relatively metal-free. 80% of the XMP sources present asymmetric optical morphology –60 XMPs show cometary structure, 11 show two bright star-forming knots and 18 show multiple star-forming regions. Star-formationrates are found to be similar to those typically found in BCDs. However, specific star-formation rates are high, with timescales todouble their stellar mass, at the current rate, of typically less than 1 Gyr.Conclusions. XMP galaxies are among the most gas-rich objects in the local Universe. The observed H component suggests kine-matical disruption and hints at a primordial composition.
Key words. galaxies: fundamental parameters – radio lines: galaxies – techniques: spectroscopic
1. Introduction
According to the hierarchical paradigm of structure formation,massive galaxies assemble through mergers and cannibalism of
⋆ Full Fig. 1, Tables 3–5 are available in electronic form athttp://www.aanda.org⋆⋆ Reduced spectra are only available at the CDS via anonymous ftpto cdsarc.u-strasbg.fr (130.79.128.5) or viahttp://cdsarc.u-strasbg.fr/viz-bin/qcat?J/A+A/558/A18
smaller systems. Interactions between galaxies and secular pro-cesses induce episodes of star-formation. Stellar winds and thedeath of stars chemically enrich both the interstellar medium andthe subsequent stellar generations. In this scenario, extremelymetal-poor dwarf galaxies (XMPs) should be common in theearly Universe, whereas they should be very rare at low red-shift (York et al. 2000; Pustilnik et al. 2005; Guseva et al. 2007;Izotov et al. 2012; Mamon et al. 2012). Indeed, one of the mostrecent searches in the Sloan Digital Sky Survey (SDSS) Data
Article published by EDP Sciences A18, page 1 of 30

A&A 558, A18 (2013)
Release 7 (DR7; Abazajian et al. 2009) and in literature, hasyielded only 140 XMPs in the local Universe, corresponding to0.1% of the galaxies in the local volume (Morales-Luis et al.2011, hereinafter ML11). In this case, XMPs are defined as hav-ing ionized gas with an oxygen abundance smaller than a tenthof the solar value. These XMPs are thus the best local analogs ofthe first generation of low-mass galaxies formed early on, pos-sessing chemical abundances as close as possible to that of theprimordial Universe.
It has been found that local XMP galaxies are commonlystar-forming blue compact dwarfs (BCDs), which are character-ized by strong emission lines, blue colors, high surface bright-ness, low luminosity, compactness, and blue and faint opti-cal continuum (Sargent & Searle 1970; Thuan & Martin 1981;Papaderos et al. 1996a,b; Telles & Terlevich 1997; Kunth &Östlin 2000; Cairós et al. 2001a, 2003; Bergvall & Östlin 2002;Noeske et al. 2003; Gil de Paz & Madore 2005; Amorín et al.2007, 2009; ML11; Lagos et al. 2011; Bergvall 2012; Michevaet al. 2013).
Furthermore, in 75% of the cases, XMPs exhibit cometaryor multi-knotted asymmetric optical structures (Papaderos et al.2008; ML11). As a comparison, only 0.2% of the star-forming galaxies in the Kiso survey of UV-bright galaxies(Miyauchi-Isobe et al. 2010) are cometary (Elmegreen et al.2012).
There are various interpretations for the asymmetric opticalmorphology of these galaxies. They could be diffuse edge-ondisks in the early stages of evolution, with massive star-formingregions viewed from the side (Elmegreen & Elmegreen 2010),resulting from the spontaneous excitation of gravitational insta-bilities (Elmegreen et al. 2009). Alternatively, these structuresmay also arise from gravitational triggering due to a mergerwith a low-mass companion (Straughn et al. 2006) or it maybe self-propagation of the star-formation activity within an al-ready existing gas-rich galaxy or chemically pristine gas cloud(Papaderos et al. 1998, 2008). The large starburst that gives riseto the asymmetry could also be due to the infall of pristine ex-ternal gas (Sánchez Almeida et al. 2013).
In the few XMPs where the H has been investigated withinterferometric observations, the H spatial distributions and ve-locity profiles are found to be distorted (Ekta et al. 2008; Ekta& Chengalur 2010), indicating infall of external unenriched gasthat may feed the starburst and drop the metallicity (Kewley et al.2006) or gas stripping forced by an interaction with an externalmedium (Gavazzi et al. 2001; Elmegreen & Elmegreen 2010).In the latter case, the asymmetric starburst results from the ramcompression by the intergalactic medium: gas-rich disks withstar-formation at the leading edge and the rest of the disk visibleas the tail, or with star-formation at the leading edge and a tailof star-formation in the stripped gas. In any case, the study ofthe dynamical, stellar, ionized gas and neutral atomic gas struc-ture is crucial to disentangle the nature of the XMPs and theirassociation with a particular morphology.
Our team is involved in the full observational characteriza-tion of a representative sample of local XMP galaxies. TheirH gas content is particularly important, since these galaxiesare expected to have large gas reservoirs responsible for manyof their observational properties, including sustaining the cur-rent star-formation episode and even diluting the interstellar gasto yield their low metallicity. This work aims at describing andquantifying, for the first time, the H content of the XMPs as aclass.
In Sect. 2.1 we present a compilation of published H in-formation for the reference list of XMPs in ML11. The existing
data were completed with new observations obtained with the100-meter single-dish Effelsberg radio telescope. The observa-tions, data reduction (following a novel technique) and proper-ties of the detected sources are described in Sect. 2.2. Becausederived parameters, such as dynamical masses, rely on ancil-lary optical data, we have compiled this information from theSDSS optical images and spectra (Sect. 3). Global galaxy pa-rameters are derived combining the H and optical data, as ex-plained in Sect. 4. The results of our investigation, namely, thedescription of the H content of the XMP galaxies with respectto other physical properties, such as the Tully-Fisher relation,are described in Sect. 5. In Sect. 6 we describe properties thatrely exclusively on optical data, such as the morphology. Ourconclusions are summarized in Sect. 7.
Throughout this paper, we adopt the cosmological parame-ters Ωm = 0.27,ΩΛ = 0.73 and H0 = 73 km s−1 Mpc−1.
2. H radio data
The sources presented in this analysis were extracted from thework of ML11, which contains 140 extremely metal-poor galax-ies selected from the SDSS DR7 (Abazajian et al. 2009), includ-ing 11 new XMP candidates, and completed with all the galaxiesin literature having an oxygen metallicity less than a tenth of thesolar value (explicitly, 12 + log (O/H) ≤ 7.65).
The H gas data comes partly from literature (Sect. 2.1) andis complemented by new observations (Sect. 2.2).
2.1. Radio observations from literature
53 out of the 140 XMP galaxies possess published H lineobservations, 5 of which were non-detections. The H datawere primarily gathered from the Arecibo Legacy Fast ALFASurvey (ALFALFA; Giovanelli et al. 2007), H Parkes All-SkySurvey (HIPASS; Barnes et al. 2001) and The H Nearby GalaxySurvey (THINGS; Walter et al. 2008), as well as sources ob-served with the Nançay Radio Telescope (NRT; Pustilnik &Martin 2007), the Green Bank Telescope (GBT; Schneider et al.1992; Hogg et al. 2007), the Australia Telescope Compact Array(ATCA; Warren et al. 2006; O’Brien et al. 2010), the WesterborkSynthesis Radio Telescope (WSRT; Kovac̆ et al. 2009), the GiantMetrewave Radio Telescope (GMRT; Begum et al. 2006, 2008),the Effelsberg Radio Telescope (Huchtmeier et al. 2005) and theVery Large Array (VLA; Thuan et al. 2004).
These observations have yielded typical H integrated fluxdensities, S H , in the 0.1–200 Jy km s−1 range and line widths,at 50% of the peak flux density level, w50, in the 15–150 km s−1
range.
In Table 1 we list the compilation of H line observationsfrom literature. In addition to the H integrated flux density,which can be used to estimate the H mass (Eq. (4); Sect. 4),Table 1 includes the H diameter, dH , the systemic heliocen-tric or local group-corrected radial velocity (optical convention;Eq. (2); Sect. 4), vsys, and the line width, w50. The systemic ra-dial velocity is the midpoint of the H emission-line profile andcan be used to estimate a redshift distance using the Hubble law.The line width provides a measure of the Doppler broadeningand, together with the H diameter, can be used to estimate thedynamical mass (Eq. (3); Sect. 4). Original references and ob-servational facilities or surveys are also listed in Table 1.
A18, page 2 of 30
M. E. Filho et al.: Extremely metal-poor galaxies: The H content
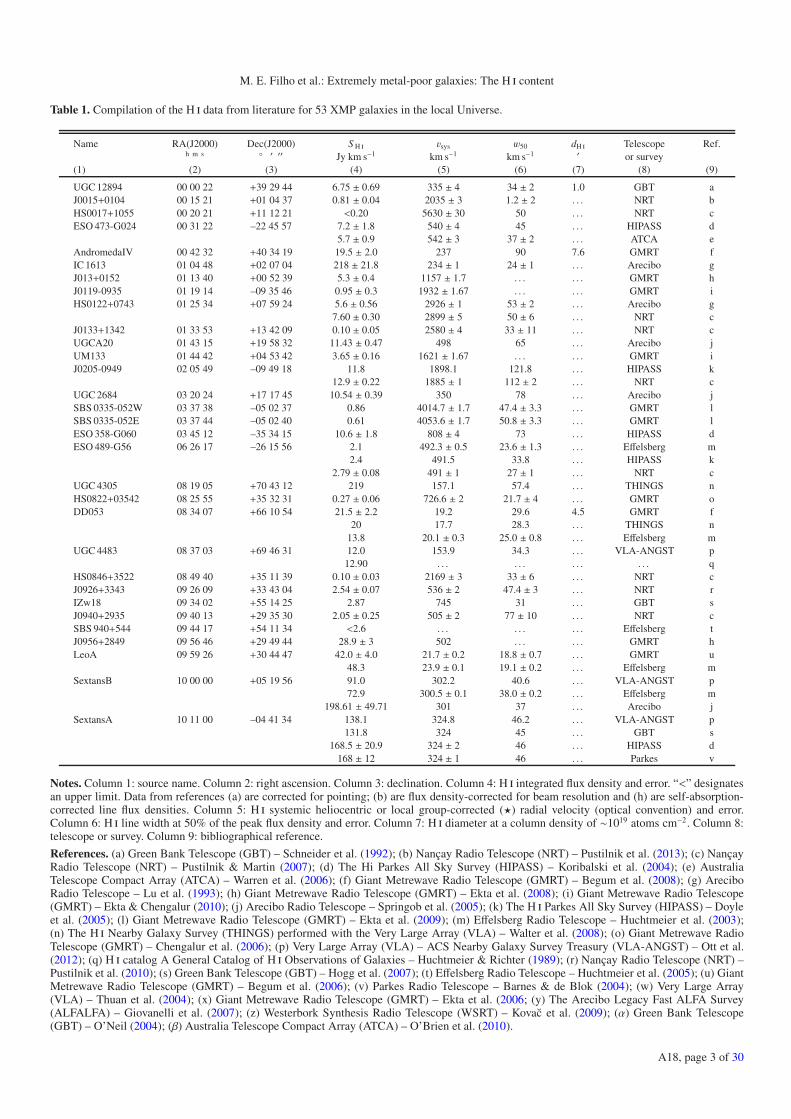
Table 1. Compilation of the H data from literature for 53 XMP galaxies in the local Universe.
Name RA(J2000) Dec(J2000) S H vsys w50 dH Telescope Ref.h m s ◦ ′ ′′ Jy km s−1 km s−1 km s−1 ′ or survey
(1) (2) (3) (4) (5) (6) (7) (8) (9)
UGC 12894 00 00 22 +39 29 44 6.75 ± 0.69 335 ± 4 34 ± 2 1.0 GBT aJ0015+0104 00 15 21 +01 04 37 0.81 ± 0.04 2035 ± 3 1.2 ± 2 . . . NRT bHS0017+1055 00 20 21 +11 12 21 <0.20 5630 ± 30 50 . . . NRT cESO 473-G024 00 31 22 –22 45 57 7.2 ± 1.8 540 ± 4 45 . . . HIPASS d
5.7 ± 0.9 542 ± 3 37 ± 2 . . . ATCA eAndromedaIV 00 42 32 +40 34 19 19.5 ± 2.0 237 90 7.6 GMRT fIC 1613 01 04 48 +02 07 04 218 ± 21.8 234 ± 1 24 ± 1 . . . Arecibo gJ013+0152 01 13 40 +00 52 39 5.3 ± 0.4 1157 ± 1.7 . . . . . . GMRT hJ0119-0935 01 19 14 –09 35 46 0.95 ± 0.3 1932 ± 1.67 . . . . . . GMRT iHS0122+0743 01 25 34 +07 59 24 5.6 ± 0.56 2926 ± 1 53 ± 2 . . . Arecibo g
7.60 ± 0.30 2899 ± 5 50 ± 6 . . . NRT cJ0133+1342 01 33 53 +13 42 09 0.10 ± 0.05 2580 ± 4 33 ± 11 . . . NRT cUGCA20 01 43 15 +19 58 32 11.43 ± 0.47 498 65 . . . Arecibo jUM133 01 44 42 +04 53 42 3.65 ± 0.16 1621 ± 1.67 . . . . . . GMRT iJ0205-0949 02 05 49 –09 49 18 11.8 1898.1 121.8 . . . HIPASS k
12.9 ± 0.22 1885 ± 1 112 ± 2 . . . NRT cUGC 2684 03 20 24 +17 17 45 10.54 ± 0.39 350 78 . . . Arecibo jSBS 0335-052W 03 37 38 –05 02 37 0.86 4014.7 ± 1.7 47.4 ± 3.3 . . . GMRT lSBS 0335-052E 03 37 44 –05 02 40 0.61 4053.6 ± 1.7 50.8 ± 3.3 . . . GMRT lESO 358-G060 03 45 12 –35 34 15 10.6 ± 1.8 808 ± 4 73 . . . HIPASS dESO 489-G56 06 26 17 –26 15 56 2.1 492.3 ± 0.5 23.6 ± 1.3 . . . Effelsberg m
2.4 491.5 33.8 . . . HIPASS k2.79 ± 0.08 491 ± 1 27 ± 1 . . . NRT c
UGC 4305 08 19 05 +70 43 12 219 157.1 57.4 . . . THINGS nHS0822+03542 08 25 55 +35 32 31 0.27 ± 0.06 726.6 ± 2 21.7 ± 4 . . . GMRT oDD053 08 34 07 +66 10 54 21.5 ± 2.2 19.2 29.6 4.5 GMRT f
20 17.7 28.3 . . . THINGS n13.8 20.1 ± 0.3 25.0 ± 0.8 . . . Effelsberg m
UGC 4483 08 37 03 +69 46 31 12.0 153.9 34.3 . . . VLA-ANGST p12.90 . . . . . . . . . . . . q
HS0846+3522 08 49 40 +35 11 39 0.10 ± 0.03 2169 ± 3 33 ± 6 . . . NRT cJ0926+3343 09 26 09 +33 43 04 2.54 ± 0.07 536 ± 2 47.4 ± 3 . . . NRT rIZw18 09 34 02 +55 14 25 2.87 745 31 . . . GBT sJ0940+2935 09 40 13 +29 35 30 2.05 ± 0.25 505 ± 2 77 ± 10 . . . NRT cSBS 940+544 09 44 17 +54 11 34 <2.6 . . . . . . . . . Effelsberg tJ0956+2849 09 56 46 +29 49 44 28.9 ± 3 502 . . . . . . GMRT hLeoA 09 59 26 +30 44 47 42.0 ± 4.0 21.7 ± 0.2 18.8 ± 0.7 . . . GMRT u
48.3 23.9 ± 0.1 19.1 ± 0.2 . . . Effelsberg mSextansB 10 00 00 +05 19 56 91.0 302.2 40.6 . . . VLA-ANGST p
72.9 300.5 ± 0.1 38.0 ± 0.2 . . . Effelsberg m198.61 ± 49.71 301 37 . . . Arecibo j
SextansA 10 11 00 –04 41 34 138.1 324.8 46.2 . . . VLA-ANGST p131.8 324 45 . . . GBT s
168.5 ± 20.9 324 ± 2 46 . . . HIPASS d168 ± 12 324 ± 1 46 . . . Parkes v
Notes. Column 1: source name. Column 2: right ascension. Column 3: declination. Column 4: H integrated flux density and error. “<” designatesan upper limit. Data from references (a) are corrected for pointing; (b) are flux density-corrected for beam resolution and (h) are self-absorption-corrected line flux densities. Column 5: H systemic heliocentric or local group-corrected (⋆) radial velocity (optical convention) and error.Column 6: H line width at 50% of the peak flux density and error. Column 7: H diameter at a column density of ∼1019 atoms cm−2. Column 8:telescope or survey. Column 9: bibliographical reference.
References. (a) Green Bank Telescope (GBT) – Schneider et al. (1992); (b) Nançay Radio Telescope (NRT) – Pustilnik et al. (2013); (c) NançayRadio Telescope (NRT) – Pustilnik & Martin (2007); (d) The Hi Parkes All Sky Survey (HIPASS) – Koribalski et al. (2004); (e) AustraliaTelescope Compact Array (ATCA) – Warren et al. (2006); (f) Giant Metrewave Radio Telescope (GMRT) – Begum et al. (2008); (g) AreciboRadio Telescope – Lu et al. (1993); (h) Giant Metrewave Radio Telescope (GMRT) – Ekta et al. (2008); (i) Giant Metrewave Radio Telescope(GMRT) – Ekta & Chengalur (2010); (j) Arecibo Radio Telescope – Springob et al. (2005); (k) The H Parkes All Sky Survey (HIPASS) – Doyleet al. (2005); (l) Giant Metrewave Radio Telescope (GMRT) – Ekta et al. (2009); (m) Effelsberg Radio Telescope – Huchtmeier et al. (2003);(n) The H Nearby Galaxy Survey (THINGS) performed with the Very Large Array (VLA) – Walter et al. (2008); (o) Giant Metrewave RadioTelescope (GMRT) – Chengalur et al. (2006); (p) Very Large Array (VLA) – ACS Nearby Galaxy Survey Treasury (VLA-ANGST) – Ott et al.(2012); (q) H catalog A General Catalog of H Observations of Galaxies – Huchtmeier & Richter (1989); (r) Nançay Radio Telescope (NRT) –Pustilnik et al. (2010); (s) Green Bank Telescope (GBT) – Hogg et al. (2007); (t) Effelsberg Radio Telescope – Huchtmeier et al. (2005); (u) GiantMetrewave Radio Telescope (GMRT) – Begum et al. (2006); (v) Parkes Radio Telescope – Barnes & de Blok (2004); (w) Very Large Array(VLA) – Thuan et al. (2004); (x) Giant Metrewave Radio Telescope (GMRT) – Ekta et al. (2006; (y) The Arecibo Legacy Fast ALFA Survey(ALFALFA) – Giovanelli et al. (2007); (z) Westerbork Synthesis Radio Telescope (WSRT) – Kovac̆ et al. (2009); (α) Green Bank Telescope(GBT) – O’Neil (2004); (β) Australia Telescope Compact Array (ATCA) – O’Brien et al. (2010).
A18, page 3 of 30

A&A 558, A18 (2013)
Table 1. continued.
Name RA(J2000) Dec(J2000) S H vsys w50 dH Telescope Ref.h m s ◦ ′ ′′ Jy km s−1 km s−1 km s−1 ′ or survey
(1) (2) (3) (4) (5) (6) (7) (8) (9)
KUG1013+381 10 16 24 +37 54 44 1.51 ± 0.39 1169 ± 4 86 ± 7 . . . NRT cUGCA211 10 27 02 +56 16 14 3.00 . . . . . . . . . . . . qHS1033+4757 10 36 25 +47 41 52 1.32 ± 0.15 1541 ± 9 86 ± 7 . . . NRT cHS1059+3934 11 02 10 +39 18 45 1.39 ± 0.06 3019 ± 3 59 ± 6 . . . NRT cJ1105+6022 11 05 54 +60 22 29 2.48 ± 0.18 1333 ± 3 48 ± 6 . . . NRT cJ1121+0324 11 21 53 +03 24 21 2.67 ± 0.16 1171 ± 3 89 ± 6 . . . NRT cUGC6456 11 28 00 +78 59 39 10.1 ± 1.0 –93.69 37.4 3.7 GMRT f
11.0 . . . 34.2 3.6a VLA w14.1 –103 ± 0.3 22.1 ± 0.8 . . . Effelsberg m
SBS1129+576 11 32 02 +57 22 46 3.9 1506 ± 3.3 67 ± 3.3 . . . GMRT x13.85 1559 ± 2 90 . . . Effelsberg t
J1201+0211 12 01 22 +02 11 08 0.96 ± 0.09 974 ± 3 29 ± 7 . . . NRT cSBS 1159+545 12 02 02 +54 15 50 <0.10 3560 ± 15 . . . . . . NRT cSBS 1211+540 12 14 02 +53 45 17 0.63 894 ± 7 47 . . . Effelsberg tJ1215+5223 12 15 47 +52 23 14 4.7 ± 0.5 159 26.6 2.6 GMRT f
5.24 ± 0.16 158 ± 1 27 ± 1 . . . NRT cTol1214-277 12 17 17 –28 02 33 <0.10 7785 ± 50 . . . . . . NRT cVCC0428 12 20 40 +13 53 22 0.65 ± 0.03 794 54 . . . ALFALFA yTol65 12 25 47 –36 14 01 2.13 ± 0.24 2790 ± 3 40 ± 6 . . . NRT cJ1230+1202 12 30 49 +12 02 43 1.03 ± 0.06 1227 40 ± 6 . . . ALFALFA yUGCA292 12 38 40 +32 46 01 12.9 308.3 25.2 . . . VLA-ANGST p
14.3 308.3 ± 0.1 26.9 ± 0.3 . . . Effelsberg m14.36 295.8⋆ 25.4 . . . WSRT z
GR8 12 58 40 +14 13 03 9.0 ± 0.9 217 ± 2.2 26 ± 1.2 4.3 GMRT f, u5.8 213.7 21.4 . . . VLA-ANGST p
8.97 ± 0.03 213 26 . . . ALFALFA y8.8 ± 0.09 213 ± 8 41 ± 16 . . . GBT α
DD0167 13 13 23 +46 19 22 3.7 ± 0.4 150.24 18.6 2.0 GMRT fSBS1415+437 14 17 01 +43 30 05 5.40 605 ± 2 49 . . . Effelsberg tHS1442+4250 14 44 13 +42 37 44 7.05 ± 0.16 647 ± 1 85 ± 2 . . . NRT cHS1704+4332 17 05 45 +43 28 49 0.24 ± 0.05 2082 ± 8 33 ± 15 . . . NRT cSagDIG 19 29 59 –17 40 41 23.0 ± 1.0 –78.5 ± 1 19.4 ± 0.8 . . . GMRT u
29.2 ± 4.9 –79 ± 1 28 . . . HIPASS dJ2104-0035 21 04 55 –00 35 2 2.0 1401 64 . . . GMRT hHS2134+0400 21 36 59 +04 14 04 0.12 ± 0.05 5090 ± 4 25 ± 9 . . . NRT cESO 146-G14 22 13 00 –62 04 03 16.5 ± 3.1 1693 ± 5 130 . . . HIPASS d
16.3 1692.1 129.4 . . . HIPASS k8.4 1691.1 140.4 . . . ATCA β
J2238+1400 22 38 31 +14 00 30 <0.15 6160 ± 20 50 . . . NRT cJ2354-0005 23 54 37 -00 05 02 0.50 ± 0.04 2310 ± 4 38.5 ± 7.3 . . . NRT b
Notes. (a) Quoted value is for the major axis diameter only.
2.2. Effelsberg HI observations
Of the 87 sources with no published H line observations, wechose the subsample of 29 targets, with declinations above−25◦,suitable for the latitude of Effelsberg, and observable during theperiod July through November 2012.
2.2.1. Observations and data reduction
To obtain measurements of the H flux density, S ν, at fre-quency ν, we performed pointed observations with the 100-msingle-dish Effelsberg radio telescope1 using the central feed ofthe 7-beam L-band receiver and the AFFTS backend. The latteris a field programmable gate array (FPGA)-based fast Fouriertransform (FFT) spectrometer (Klein et al. 2006), providing 16kspectral channels over a bandwidth of 100 MHz (spectral reso-lution of 7.1 kHz). This results in a velocity resolution at 21 cmof 1.5 km s−1.
1 http://www.mpifr-bonn.mpg.de/8964/effelsberg
Each of the candidate sources was observed for about onehour in on-off mode (effective observing time is ∼30 min persource). This position switching allows to remove the effect ofthe bandpass (i.e., frequency-dependent gain).
The L-band unfortunately features a lot of narrow-band radiofrequency interference (RFI) at the telescope site. However, dueto the high spectral resolution, the total fraction of each spectrumwhich is polluted is relatively low. To improve the data reductionfurther, we applied a simple, but in this case, effective RFI mit-igation strategy, where we median-filtered the spectra (5 chan-nel width) and searched for 8σ outliers in the residual (peaksin excess of 8 times the noise standard deviation or rms). Theassociated spectral channels in the spectrum were subsequentlyreplaced with the median-filtered values.
The spectra have been flux-calibrated using a novel tech-nique (Winkel et al. 2012), which accounts for the frequencydependence of the system temperature and, as such, provides anunbiased calibration over the full bandwidth. This new methodrequires good knowledge of the temperature of the calibration
A18, page 4 of 30

M. E. Filho et al.: Extremely metal-poor galaxies: The H content
J0014−0044
5"
Fig. 1. H Effelsberg spectra (left) and SDSS fields (right) of the detected (including marginal) XMP galaxies. The H spectra of J0014-0044 isdominated by the H gas of the nearby spiral galaxy UGC 139 (Sect. 2.2.2). In the spectra, the blue vertical solid lines mark the radial velocityfrom SIMBAD (heliocentric; converted from the optical to the radio convention), the blue vertical dashed lines mark the regions for the baselinecomputation and flux density integration, and the red lines represent a smoothed version of the spectrum, using a Gaussian kernel of widthσsm = 21.22 km s−1. The smoothing kernel was chosen such that the resulting spectral resolution becomes σres = 21.25 km s−1, which is optimallysuited to detect a (Gaussian) feature of line width
√8 ln 2σres = 50 km s−1 (FWHM). Note that the integrated flux densities and limits were derived
from the full-resolution spectra/rms.
diode, Tcal, which we have measured repeatedly using the cal-ibration sources NGC 7027, 3C 48 and 3C 147 during the ob-serving sessions in July and November 2012. For the most ac-curate absolute flux calibration, total-power measurements ofthe (Galactic) target S7 (Kalberla et al. 1982) were used to fixTcal at the frequency of 1420.1 MHz. The latter usually leads toan uncertainty of less than 3% for the 7-beam system (Winkelet al. 2010), while we find a scatter of the individually deter-mined Tcal spectra of about 5%, with respect to the average ofall Tcal spectra.
Using the SIMBAD Astronomical Database, we obtained theradial velocity (heliocentric, converted from the optical to the ra-dio convention; Eq. (2); Sect. 4) value for the sources, in orderto directly extract the relevant part of each spectrum. Residualbaselines were removed using a polynomial fit. For each re-sulting profile, the residual rms and integrated flux density of
the source, if detected, was determined. The baseline rms canalso be used to calculate a theoretical flux limit (σ) for a hypo-thetical source with a Gaussian-like H profile of width2 w50 =
50 km s−1 (equal to the full width at half maximum, FWHM, fora Gaussian).
Of the 29 observed sources, there were seven (excludingJ0014-0044; Sect. 2.2.2) detections (≫5σ), three marginal de-tections (>5σ), six uncertain detections (∼5σ) and 12 non-detections (≪5σ).
2.2.2. Effelsberg H properties
Figure 1 displays H spectra and SDSS Data Release 9 (DR9;Ahn et al. 2012) composite images of the 10 detected sources
2 For different widths the flux density limit scales with√w50.
A18, page 5 of 30

A&A 558, A18 (2013)
Table 2. The H parameters from our new Effelsberg observations for 29 XMP galaxies in the local Universe.
Name RA(J2000) Dec(J2000) t vlsrsys w50 S H 5σ Detection Profile
h m s ◦ ′ ′′ min km s−1 km s−1 Jy km s−1 Jy km s−1
(1) (2) (3) (4) (5) (6) (7) (8) (9) (10)
J0004+0025 00 04 21.6 +00 25 36 30 . . . . . . . . . 0.7 uncertain . . .J0014-0044a 00 14 28.8 –00 44 44 30 3915.17 320.07 15.3 0.7 yes d-symJ0015+0104 00 15 20.679 +01 04 36.99 30 2036.79 27.87 1.5 0.6 yes s-asymJ0016+0108 00 16 28.254 +01 08 01.92 60 . . . . . . . . . 0.5 no . . .J0029-0108 00 29 04.73 –01 08 26.3 30 . . . . . . . . . 0.7 uncertain . . .J0029-0025 00 29 49.497 –00 25 39.89 30 . . . . . . . . . 0.8 no . . .J0057-0022 00 57 12.603 –00 21 57.67 30 . . . . . . . . . 0.6 uncertain . . .J0107+0001 01 07 50.817 +00 01 28.42 30 . . . . . . . . . 0.6 no . . .J0113+0052 01 13 40.45 +00 52 39.2 30 1156.22 34.58 5.8 0.7 yes d-asymJ0126-0038 01 26 46.4 –00 38 39 30 1898.32 49.91 2.7 0.6 yes s-asymJ0135-0023 01 35 44.037 –00 23 16.89 30 . . . . . . . . . 0.6 uncertain . . .HKK97L14 02 00 09.9 +28 49 57 30 . . . . . . . . . 0.6 uncertain . . .J0204-1009 02 04 25.55 –10 09 36.0 30 1906 112.04 9.9 0.7 yes d-asymJ0254+0035 02 54 28.94 +00 35 50.4 30 . . . . . . . . . 0.7 no . . .J0301-0059 03 01 26.3 –00 59 26 30 . . . . . . . . . 0.6 no . . .J0301-0052b 03 01 49.03 –00 52 57.4 30 2107.85 110.2 2.1 0.7 yes s-asymJ0303-0109 03 03 31.3 –01 09 47 30 . . . . . . . . . 0.8 no . . .J0313+0010 03 13 01.57 +00 10 40.3 30 . . . . . . . . . 0.6 no . . .J0315-0024 03 15 59.9 –00 24 26 30 6649.89 91.71 1.3 0.6 marginal s-asymJ0341-0026 03 41 18.1 –00 26 28 30 . . . . . . . . . 0.6 no . . .J2053+0039 20 53 12.597 +00 39 14.25 30 3906.98 52.79 1.6 0.7 yes s-asymJ2104-0035 21 04 55.3 –00 35 22 30 1404.00 52.04 1.5 0.7 yes s-asymJ2105+0032 21 05 08.6 +00 32 23 30 . . . . . . . . . 0.7 no . . .J2120-0058 21 20 25.937 –00 58 26.53 30 . . . . . . . . . 0.6 uncertain . . .J2150+0033 21 50 31.957 +00 33 05.07 30 4382.42 64.45 1.1 0.6 marginal s-symPHL293B 22 30 36.8 –00 06 37 60 1590.99 44.84 0.7 0.5 marginal s-asymJ2238+1400 22 38 31.1 +14 00 29 30 . . . . . . . . . 0.5 no . . .J2259+1413 22 59 00.86 +14 13 43.5 30 . . . . . . . . . 0.6 no . . .J2302+0049 23 02 10.0 +00 49 39 30 . . . . . . . . . 0.6 no . . .
Notes. Column 1: source name. Column 2: right Ascension. Column 3: declination. Column 4: effective integration time on-source. Column 5:systemic local standard-of-rest radial velocity (radio covention). Column 6: H line width at 50% of the peak flux density. Column 7: H integratedflux density. Column 8: 5σ error in integrated flux density. Column 9: note on detection. Detections are≫5σ, non-detections are≪5σ, marginaldetections are >5σ and uncertain detections are ∼5σ. Column 10: profile of the H line, single (s)- or double (d)-peaked and symmetric (sym) orasymmetric (asym). (a) The H line is dominated by the H gas in the nearby spiral galaxy UGC 139 (Sect. 2.2.2). (b) Baseline problems.
(including marginal detections) ordered by right ascension, andalso of J0014-0044 in the field of UCG 139 (see below).
Table 2 contains the Effelsberg H parameters. In additionto the H integrated flux density and line width, Table 2 con-tains the effective observing time on-source, t, the systemic lo-cal standard-of-rest radial velocity (radio convention; Eq. (2);Sect. 4), vlsr
sys, the 5σ detection limit and a characterization of theH line profile shape.
The H integrated flux density, S H =∫
S ν dν, systemicradial velocities and line widths were derived from the 21 cmbaseline-subtracted profiles obtained with the single-dish obser-vations. Typically, the Effelsberg flux density errors are in therange 5–10%. In the cases where the H profile is double-horn(J0014-0044 in the field of UGC 139; Fig. 1 and see below;J0113+0052 and J0204-1009), we marked the positions of 50%of the peak on each side of the double-horn profile, and estimatedthe line width at these points (e.g., Springob et al. 2005).
Usually H sources are relatively isolated. However, giventhe large Effelsberg beam (∼9′), we have checked the fields inwhich the XMPs reside, in order to assess possible H contam-ination. For this, we have visually analyzed the SDSS DR9 im-ages (Fig. 1) in a field of view of about 6′. The results of thisinspection are detailed in the list below.
• J0014-0044 – The SDSS image (Fig. 1) shows a two-knotsource next to a large spiral (SBc) galaxy (UGC 139). TheNASA/IPAC Extragalactic Database (NED3) has flaggedthe brightest SDSS XMP knot as a Western H region ofUGC 139. Indeed, SDSS spectroscopy of the bright knotand UGC 139 put them at a similar redshift of ∼0.01.Furthermore, the H profile is double-horn symmetric,typical of ordered disk rotation, with a large line width(∼320 km s−1; Table 2). Therefore, the H line detectedwith Effelsberg is primarily associated with the spiral galaxyUGC 139 and the source has been excluded from the follow-ing analysis.• J0015+0104, J0113+0052, J0204-1009, J0301-0052,
J0315-0024 and PHL293B – The SDSS images (Fig. 1)show knotted or cometary structures in relatively cleanfields. Therefore, we are confident that the detected H fluxdensity is associated with the XMP galaxies.• J0126-0038 and J2104-0035 – These sources show
cometary structures (Fig. 1) and are found in fields withnearby stars and small red objects, the latter likely high red-shift galaxies. Therefore, it is unlikely that there is contami-nation of the H data.
3 http://ned.ipac.caltech.edu/
A18, page 6 of 30

M. E. Filho et al.: Extremely metal-poor galaxies: The H content
• J2053+0039 – This source (Fig. 1) is found in a SDSS fieldwith nearby stars and small red objects, likely to be high red-shift galaxies. However, there is a small blue cloud to theNorthwest of the original XMP position (top right-hand cor-ner; Fig. 1), with a SDSS photometric redshift of 0.17± 0.12.The main XMP source has a spectroscopic redshift of 0.01.The large error in the photometric redshift, the close prox-imity, the diffuse structures and similar colours, has led us toassociate these two sources with the XMP, whose morphol-ogy is classified as two-knot. The H data will likely containinformation from both these components.• J2150+0033 – In the SDSS image (Fig. 1), this symmetric
XMP shows a nearby galaxy in projection. The SDSS red-shifts for the XMP source and the galaxy are 0.02 and 0.06,respectively. Therefore, the H data is not likely to be af-fected by contamination.
3. Auxiliary optical data
In order to estimate physical parameters like dynamical andH gas masses, we have compiled from literature opticalsizes, inclinations, distances, g-band magnitudes, H gas-phasemetallicities and other relevant observables. These are includedin Tables 3–5.
3.1. Distance, size, inclination, magnitude and metallicity
Hubble flow distances (Table 5), D, are obtained from NED andare corrected for Virgocentric infall. The optical radii (Table 3),ropt, have been obtained from the SDSS data, as the radii contain-ing 90% of the galaxy light in the g-band. When these values arenot available, we use NED SDSS r-band Petrosian radii, or theaverage between the semi-major axis, θM , and the semi-minoraxis, θm, at the 25 mag arcsec−2 isophote. The inclination angleof the source (Table 3), i, is computed as:
sin i =
√
√
√
1 −(
θmθM
)2
1 − q20
, (1)
where q0 = 0.25, which implicitly assumes galaxies to be disksof intrinsic thickness q0 (e.g., Sánchez-Janssen et al. 2010).Absolute g-band magnitudes, Mg, have been obtained from theHubble flow Virgocentric infall-corrected distances (Table 5)and SDSS DR7 Petrosian g-band magnitudes (Table 3), includedin Tables 1 and 2 of ML11. The g-band luminosity has been ob-tained from the absolute magnitude, assuming a solar absoluteg-band magnitude of 5.124. Metallicity values are H gas-phasemetallicities (Table 3) taken from Tables 1 and 2 of ML11 (andreferences therein). They have been derived using the direct (Te)method or strong-line methods, based on empirical calibrationsconsistent with the direct method.
3.2. Morphology
We have adapted, completed and/or revised, using the SDSSDR9 composite images, the optical morphological classification,based on the simple scheme presented in ML11 – symmetric fora spherical, elliptical or disk-like symmetric structure, cometaryfor a head-tail structure, with or without a clear knot at the head,and a diffuse tail, two-knot for a structure with two knots, with
4 http://www.sdss.org/dr7/algorithms/
sdssUBVRITransform.html
or without a head-tail morphology, and multi-knot for a diffusestructure with multiple star-formation knots. In Fig. 2 we supplySDSS DR9 postage stamp images illustrating this scheme, whileTable 3 includes the individual morphological classification forthe XMPs.
We have also parametrized the asymmetric optical morphol-ogy, by measuring the degree of optical asymmetry or spatialoffset, ∆R/r, in the cometary galaxies (and in some cases, alsoin two-knot or multi-knot sources with cometary-like morphol-ogy) from the SDSS images. ∆R is the difference between theposition of the brightest star-formation region and the positionof the center of the galaxy (estimated from the outer isophote,measured at 25 mag arcsec−2) and r is the radius of the sameouter isophote. The results are included in Table 3.
3.3. Stellar and nebular parameters
The Max-Planck Institute for Astrophysics-Johns HopkinsUniversity (MPA–JHU) group provides a number of derivedphysical parameters5 for all galaxies in the SDSS (Kauffmannet al. 2003; Brinchmann et al. 2004). We include in Table 4the relevant parameters from this database: best-fit spectroscopicredshift, z (heliocentric, optical convention; Eq. (2); Sect. 4), ve-locity offset of the Balmer, ∆vBalmer, and forbidden, ∆vforbidden,emission lines, and the total stellar mass and star-formation rate(SFR). 1σ errors for the Balmer and fobidden emission-line ve-locity offsets, and the stellar masses are also provided in Table 4.
The best-fit spectroscopic redshift is measured using sev-eral nebular and stellar lines, via a code developed by DavidSchlegel6. The resulting radial velocity, vz = cz (heliocentric, op-tical convention; Eq. (2); Sect. 4; Table 5), is a measurement ofthe average nebular/stellar component radial velocity and shallbe designated hereinafter as the best-fit radial velocity.
The MPA-JHU group also provides measurements of theBalmer and forbidden emission-line shifts relative to the best-fit radial velocity, after removing the contribution of the stel-lar component from the spectra, via stellar population synthesismodels. Balmer and forbidden emission-line velocities (Table 5)have been calculated from the Balmer and forbidden line veloc-ity offsets relative to the best-fit radial velocity.
The stellar masses are the median of the distribution of thetotal mass estimates obtained using SDSS model photometry andinclude a correction for aperture effects and nebular emission7.However, we stress that the stellar mass values are uncertain, asthey are obtained by converting light into stellar mass via a mass-to-light (M/L) ratio that assumes a constant or exponentiallydecreasing star-formation history. This assumption is, however,not entirely appropriate for BCDs (and therefore also not forXMPs), since the young starburst component in these systemscontributes a significant amount to the total B-band luminosity(Papaderos et al. 1996b; also Cairós et al. 2001a; Gil de Paz &Madore 2005; Amorín et al. 2007, 2009). Consequently, stel-lar mass determinations based on the integrated luminosity anda standard M/L ratio are overestimated by, typically, a factorof 2 (0.3 dex). This, and the strong contribution of nebular(line and continuum) emission in most XMPs (e.g., Papaderoset al. 2008; also Papaderos & Östlin 2012) conspires, along with
5 http://www.sdss3.org/dr9/algorithms/galaxy_mpa_jhu.
php6 http://spectro.princeton.edu/#dm_spzbest7 http://www.mpa-garching.mpg.de/SDSS/DR7/Data/
stellarmass.html
A18, page 7 of 30

A&A 558, A18 (2013)
Fig. 2. SDSS images illustrating our optical morphology classification scheme: J1003+4504 (top left) showing symmetric, J0119-0935 (top right)showing cometary, J1151-0222 (also known as UM 461; bottom left) showing two-knot, and HS 0122+0743 (bottom right) showing multi-knotoptical morphology.
aperture effects, to produce large uncertainties in stellar massdeterminations.
In order to have an idea of the potential bias affecting thestellar mass estimates, we have also computed the stellar massesin an alternative way, using the correlations from Bell & de Jong(2001). We have adopted the calibration obtained by assum-ing a mass-dependent formation epoch model with bursts, anda scaled-down Salpeter initial mass function (IMF; see theirTable 1), using the SDSS g−r colours to estimate the stellar M/Lvalues, and therefore, the stellar masses. We note, however, thatthis method may also suffer from similar uncertainties as thosedescribed above, as well as those related to model assumptions.
The colour-determined stellar masses are compared with theMPA-JHU-determined stellar masses in Fig. 3. There appears tobe a break in the one-to-one relation at about log M⋆ = 7.5 M⊙.MPA-JHU stellar masses below this value are underestimatedaccording to the color-determined value, whereas stellar massesabove this value are overestimated. The differences betweenthese two methods of stellar mass determation is, however, rarelyabove 1 dex.
By default, we use the MPA-JHU-determined stellar massesin the subsequent analysis. However, we also present color-determined stellar mass results when the outcome may dependon the stellar mass determination, in order to have an idea ofpotential uncertainties.
The total SFRs are computed using the nebular emissionlines and galaxy photometry8. The specific star formation rate(sSFR) is the SFR divided by the total stellar mass.
8 http://www.mpa-garching.mpg.de/SDSS/DR7/sfrs.html
Fig. 3. The comparison between the MPA-JHU- and color-determinedstellar masses. The color code parametrizes the morphology as follows:red = symmetric, black = cometary, blue = two-knot, green = multi-knot and grey = no morphological information. The magenta line is theone-to-one relation.
4. Multi-wavelength analysis
Combining the H , SDSS and other online data, we derive globalgalaxy parameters for the XMP galaxies, including bulk veloci-ties and masses (Table 5).
When multiple H entries are available from literature(12 sources; Table 1), we preferably chose interferomet-ric values to provide better constraints on the H gas pa-rameters. Sources HS0122+0743, J0133+1342, J1105+6022,J1121+0324, J1201+0211, J1215+5223 and HS1442+4250 are
A18, page 8 of 30

M. E. Filho et al.: Extremely metal-poor galaxies: The H content
documented in Pustilnik & Martin (2008) as belonging to mergersystems or as having possible companions. This may producepossible H contamination and consequently (artifically) in-crease the value of the H mass.
We do not correct the Effelsberg H line widths (Table 2) forinstrumental effects, turbulence, inclination and redshift stretch-ing; these corrections are estimated to be small at low redshift(e.g., Springob et al. 2005). Indeed, even if line widths are smalland the sources faint (Table 2), the errors in the line widths aredominated by the much larger errors generated in the estimationof line widths from low signal-to-noise spectra.
The Effelsberg H systemic radial velocities (Table 2) havebeen converted from the local to the barycentric standard-of-rest using the coordinates of each galaxy. The corresponding ve-locity corrections range from –30 to 13 km s−1. The velocitieshave not been converted from the barycentric to the heliocentricstandard-of-rest, since this correction has a maximum amplitudeof 0.012 km s−1, much smaller than the H gas velocity and ve-locity offset errors. We further converted the Effelsberg systemicradial velocities from the radio to the optical convention, accord-ing to the formula:
vopt =vrad
1 − vrad/c, (2)
where vopt is the systemic radial velocity in the optical conven-tion, vrad is the systemic radial velocity in the radio conventionand c is the speed of light. The difference between the radio andoptical convention stems from the use of the frequency (radio)or the wavelength (optical) to infer the line shifts.
The H velocity offset, ∆vH , has been defined as the dis-placement of the H systemic radial velocity (heliocentric, op-tical convention; Tables 1 and 2) with respect to the best-fit ra-dial velocity, vz (heliocentric, optical convention; Sect. 3.3 andTable 4). The error in the H velocity offset contains the corre-sponding error in the H systemic radial velocity (Tables 1 and 2)and a 1 km s−1 error in the best-fit radial velocity determination.When the former is not available, we adopt a value of 5 km s−1
for the H systemic radial velocity error.In order to compute dynamical masses, we require H galaxy
sizes. From the H (Table 1) and optical (Table 3) radii, weestimate that, on average, the H -to-optical size ratio ∼3 forXMP galaxies in the local Universe, which is consistent withthe results from literature (Thuan & Martin 1981). We thereforeadopt a value of rH = 3 × ropt.
The dynamical mass, defined as the total baryonic plus non-baryonic mass contained within a certain radius, is estimated as-suming a spherical system in dynamical equilibrium. We havedetermined the dynamical mass using the formula9:
Mdyn
M⊙= 2.3 × 10⁵
(
w50
2
)2rH , (3)
where w50 is the (uncorrected) H line width in km s−1 (Tables 1and 2) and rH is the H radius in kpc (see above). We stress thatthe dynamical mass calculated in this way may be an underes-timation, since the H radius may not include the full extent ofthe galaxy.
The H mass estimate assumes the neutral atomic gas massto be optically thin (Wild 1952). The formula9 for deriving theH mass is:
MH
M⊙= 2.36 × 10⁵ D2 S H , (4)
9 http://www.cv.nrao.edu/course/astr534/HILine.html
where S H is the integrated flux density in Jy km s−1 (Tables 1and 2) and D is the Virgocentric infall-corrected Hubble flowdistance in Mpc (Table 5).
The dark matter mass has been estimated as:
MDM = Mdyn − M⋆ − MH − MHe, (5)
where MHe, the helium mass, is 0.34 × MH , the value typicalfor standard Big Bang nucleosynthesis (Alpher et al. 1948; Cocet al. 2012).
The error determination in the dynamical mass includes a20% error in rH and the corresponding error in the line width(Table 1). When the latter is not available, we have adopted aconservative error of 5 km s−1. For the H gas mass, the er-ror was estimated assuming a conservative error in integratedflux density (10%; Sect. 2.2.2) and the error in the Virgocentricinfall-corrected Hubble flow distance, as provided by NED. Inthe few cases when the latter is not available, we have attributeda conservative distance error of 10%. The helium mass error de-termination follows from the propogation of the error in H gasmass. We adopt the 1σ stellar mass errors (Sect. 3.3 and Table 4)which, typically, are of the order of 0.5 dex (Fig. 3). For the darkmatter mass, the final error estimation includes the error in dy-namical, H gas, helium and stellar mass.
All quoted velocities are in the heliocentric standard-of-restand in the optical convention. Correlations found in literaturefor absolute B-band magnitudes have been converted to absoluteg-band magnitudes using the standard SDSS conversion factors(e.g., Jester et al. 2005).
Unless otherwise explicitly stated, metallicities refer toH gas-phase metallicities (Table 3).
We call attention to the six sources with the lowest g-band lu-minosity – UGC 2684, DD053, LeoA, SextansB, UGCA292 andGR8. These are all nearby (D < 6 Mpc), low-surface brightnessgalaxies, that also turn out to be XMPs.
5. Results
In this section, and in Figs. 4–12, we present the properties ofthe XMP galaxy class, particularly the H content. All plots usea common color code to parametrize the morphology. The mor-phological color code is red for symmetric, black for cometary,blue for two-knot, green for multi-knot and grey for sources withno morphological information.
5.1. HI line profile – optical morphology relation
If we include the three marginal detections (and exclude J0014-0044), H Effelsberg integrated flux densities range from 1 to15 Jy km s−1 and (uncorrected) line widths range from 20 to120 km s−1 (Sect. 2.2 and Table 2). The line profile shapes arevaried (Fig. 1 and Table 2) – two sources show asymmetricdouble-horn profiles, one source shows a symmetric single-peakprofile and the remaining seven have asymmetric single-peakprofiles. Double-horn profiles are typical of disk rotation, whilesingle-peak profiles may arise from non-rotation, face-on diskrotation or preponderance of random motions (relative to or-dered motions) in the gas. An asymmetry in the line profile sug-gests an asymmetry in the kinematics or possible companions(Fig. 1, Tables 2 and 3). We have excluded the latter hypoth-esis in the case of the Effelsberg observations (Sect. 2.2.2). Inthe two double-horn sources, the highest intensity and/or widestpeak occurs on the (spectral) blue side (Fig. 1).
A18, page 9 of 30

A&A 558, A18 (2013)
Fig. 4. Mass-luminosity relation of the XMP galaxies. The color codeparametrizes the morphology as follows: red = symmetric, black =cometary, blue = two-knot, green = multi-knot and grey = no morpho-logical information. Top: the symbol code is � = Mdyn and × = M⋆.Bottom: the symbol code is • = MH and △ = MHe.
The optical morphology of the Effelsberg targets shows thevaried nature of the optical structures (Fig. 1 and Table 3) and anassociation with the H line profile (Table 2). The two asymmet-ric double-horn profile sources show cometary or multiple star-formation knots in the SDSS images. The remaining asymmet-ric single-peak sources are cometary (five sources), multi-knot(one source) or two-knot (one source), while the only single-peak symmetric source has a symmetric optical morphology. Wefind that an asymmetry in the H kinematics, as suggested by theH line shape, is systematically associated with an asymmetry inthe optical morphology.
5.2. Mass – luminosity relation
Figure 4 contains the relation between the mass of the differentXMP galaxy constituents and the absolute g-band magnitude.
Though the scatter is large, a trend is observed betweenthe (dynamical, H and stellar) mass and the luminosity, re-flecting that the more massive galaxies are more luminous.The largest deviations occur at low luminosities, in the low-surface brightness, nearby galaxies UGC 2684, DD053, LeoA,SextansB, UGCA292 and GR8. At a given stellar mass, thesegalaxies are significantly offset to lower luminosities comparedwith most XMPs.
5.3. Mass-to-light ratio
The XMP (H gas-phase) metallicity and absolute g-band mag-nitude are plotted as a function of the stellar (M⋆/Lg) and the
Fig. 5. H gas-phase metallicity and g-band magnitude of the XMPgalaxies as a function of the stellar and H gas M/L ratio. The colorcode parametrizes the morphology as follows: red = symmetric, black=cometary, blue = two-knot, green = multi-knot and grey = no morpho-logical information. The symbol code is • = MH /Lg and × = M⋆/Lg.Top: the plot includes a range of stellar mass-to-light ratios found in spi-rals (magenta line), lenticulares (cyan dashed line), dwarf irregulars (or-ange dashed line) and ellipticals (magenta dashed line), an upper limitfound in star-forming (cyan line) galaxies (Faber & Gallagher 1979)and an average value (orange line) found for BCDs (Papaderos et al.1996a). Bottom: we plot in cyan the H gas M/L ratio-to-luminositycorrelation found for dwarf galaxies (Staveley-Smith et al. 1992).
H gas (MH /Lg) M/L (g-band) ratio in Fig. 5, where we haveexcluded the dynamical M/L ratio for clarity.
The MH /Lg and M⋆/Lg ratios measured for the XMPs aretypically �10 and ∼0.1, respectively. The lowest luminosityXMPs – UCG 2684, DD053, LeoA, SextansB, UGCA292 andGR8 – have MH /Lg > 10. The estimated M⋆/Lg ratios likelyreflect the M/L ratios of the galaxy templates used as input in thephotometry fitting-based stellar mass determinations (Sect. 3.3).Papaderos et al. (1996b) have determined the average M/L ra-tio of the star-forming component in BCDs to be ∼0.5 (orangeline; top; Fig. 5). This ratio (and its large scatter) has been con-firmed in several subsequent studies (e.g., Cairós et al. 2001a;Gil de Paz & Madore 2005; Amorín et al. 2007, 2009). We recallthat nearby XMPs are commonly found to be BCDs (Sect. 1).These values can be compared to the typical stellar M/L ratiosobserved in star-forming galaxies (<1; cyan line; top; Fig. 5),spirals (4–6; magenta line; top; Fig. 5), lenticulars (∼10; cyandashed line; top; Fig. 5), dwarf irregulars (10–15; orange dashedline; top; Fig. 5) and elliptical (∼20; magenta dashed line; top;Fig. 5) galaxies (Faber & Gallagher 1979).
Regarding the absolute g-band magnitude versus the MH /Lgratio (bottom; Fig. 5), we confirm previous published results
A18, page 10 of 30

M. E. Filho et al.: Extremely metal-poor galaxies: The H content
Fig. 6. Mass fraction of the various XMP galaxy constituents. Top: thecolor code parametrizes the morphology as follows: red = symmetric,black = cometary, blue = two-knot, green = multi-knot and grey = nomorphological information. The symbol code is � = MDM, • = MH ,△ = MHe and × = M⋆. The magenta and cyan line are, respectively,the one-to-one and 0.1 × Mass relation. Middle: the distribution of themass fractions relative to the dynamical or H mass. The color code isblue = MH
Mdyn, red = M⋆
Mdynand green = M⋆
MH . Bottom: the distribution of the
dark matter and H mass fractions relative to the dynamical mass, inpercentage. The color code is blue = MH
Mdynand red = MDM
Mdyn. The magenta
and cyan dashed lines are, respectively, the range for dark matter massfractions in spiral and elliptical galaxies.
found for a sample of dwarfs (cyan line; bottom; Fig. 5;Staveley-Smith et al. 1992). We find an anti-correlation be-tween the MH /Lg ratio and the luminosity, whereby fainterXMPs are more gas-rich than brighter XMPs. The result sug-gests that the less luminous sources have converted a smallerfraction of their H gas into stars. However, our sources devi-ate from the observed correlation found for dwarf galaxies (cyanline; bottom; Fig. 5; Staveley-Smith et al. 1992) particularly at
Fig. 7. H -to-stellar mass relation of the XMP galaxies. The color codeparametrizes the morphology as follows: red = symmetric, black =cometary, blue = two-knot, green = multi-knot and grey = no mor-phological information. The symbol code is • =MPA-JHU-determinedstellar mass values and ◦ = color-determined stellar mass values. Themagenta line is the one-to-one relation.
low luminosities, which correspond to the low-surface bright-ness, nearby galaxies UGC 2684, DD053, LeoA, SextansB,UGCA292 and GR8. In this low luminosity regime, the XMPgalaxies appear to be 10 to 100 times more gas-rich than typicaldwarf galaxies.
5.4. Mass fraction and dark matter content
Figures 6 and 7 show the relation between the mass and the massfraction of the different XMP galaxy constituents. In the figures,we mark the one-to-one (magenta line; top; Fig. 6; Fig. 7) and0.1 ×Mass (cyan line; top; Fig. 6) relation for reference. We re-call that the dynamical mass estimation is a lower limit (Eq. (3);Sect. 4) and that the dark matter content is the fraction of dy-namical mass which is not stellar, H or helium mass (Eq. (4);Sect. 4). In 12 of the sources with H and dynamical mass deter-minations, MH > Mdyn by less than 0.5 dex (top; Fig. 6); thesesources shall be excluded from the following discussion.
Typically, the stellar component constitutes less than 5% ofthe total (baryonic and non-baryonic) mass in the XMP systems(middle; Fig. 6). The H gas mass fraction, relative to the dy-namical mass, falls typically between 20 and 60% (middle andbottom; Fig. 6), higher than the values found in late-type sys-tems (4–25%; Young & Scoville 1991). Moreover, the H gasmass is 10 to 20 times larger than the stellar mass (middle; Fig. 6;Fig. 7), denoting that XMPs are extremely gas-rich. As expected,this ratio depends on the stellar mass estimate. If we use thecolor-determined stellar masses (Sect. 3.3 and Fig. 3), the H -to-stellar mass ratios fall, typically, to about 5–10 (Fig. 7), whichare still large values. As a comparison, H gas-to-stellar massratios in excess of 100 are observed in some of the lowest metal-licity BCDs (Pustilnik et al. 2001), while ratios of less than 4are commonly observed in spirals and irregulars (Swaters 1999;Dalcanton 2007).
Although our statistics are poor (16 sources), the values forthe putative dark matter content in XMPs show a wide range,with a peak at 65% of the dynamical mass, and skewed to highervalues (bottom; Fig. 6). These latter estimates are typically largerthan those observed in the inner parts of spirals (10–15%; ma-genta dashed line; bottom; Fig. 6) and elliptical (30–50%; cyandashed line; bottom; Fig. 6) galaxies (Swaters 1999; Borrielloet al. 2003; Cappellari et al. 2006; Thomas et al. 2007; Williamset al. 2009).
A18, page 11 of 30

A&A 558, A18 (2013)
Fig. 8. Effective yield and the H -to-H metallicity ratio of theXMP galaxies as a function of the gas mass fraction. The color codeparametrizes the morphology as follows: red = symmetric, black =cometary, blue = two-knot, green = multi-knot and grey = no morpho-logical information. Top: the symbol code is • =XMPs with MPA-JHU-determined stellar masses, ◦ = XMPs with color-determined stellarmasses, � = spiral and � = irregular galaxies. The spiral and irreg-ular galaxy data were obtained from Pilyugin et al. (2004). The ma-genta line represents the theoretical yield limit for a closed-box model.Bottom: the symbol code is • = XMPs with MPA-JHU-determined stel-lar masses and ◦ = XMPs with color-determined stellar masses.
5.5. Effective yield
Supernova-driven outflows or accretion of external gas may bepartially responsible for the observed low metallicities in XMPgalaxies (e.g. Kunth & Östlin 2000) and in low-metallicity star-bursts (Amorín et al. 2010, 2012a). In a closed box model (noinflow or outflow), as the gas is converted into stars, the gas massfraction decreases and the gas metallicity increases. Deviationsfrom this model, signaling outflow or inflow, are investigated us-ing the effective yield (e.g., Dalcanton 2007):
yeff =Zgas
ln(1/ fgas), (6)
where Zgas is the fraction of the gas mass in metals and fgas isthe gas mass fraction, defined as the H , helium and metal massdivided by the total (H , helium, stellar and metal) mass.
For a galaxy that evolves as a closed box, the effective yieldmust coincide with the theoretical yield, y, derived from stellarevolution models (e.g., Edmunds 1990). Therefore, differencesbetween y and yeff provide a direct tool to diagnose gas inflowsand outflows.
Figure 8 (top) shows the effective yields of the XMPs as afunction of the gas fraction (as defined above), for MPA-JHU-and color-determined stellar masses (Sect. 3.3 and Fig. 3). Theyields were computed assuming the metallicity from the opticalemission lines (Table 3) to be the metallicity of the H gas, i.e.,Zgas ≃ 12 × O/H (e.g., Pilyugin et al. 2004). Figure 8 (top) alsoshows, for reference, the effective yields for the set of spiralsand dwarf irregular galaxies compiled by Pilyugin et al. (2004).The gas fraction from Pilyugin et al. (2004) includes molecularhydrogen, but its contribution is negligible.
The theoretical oxygen yield is log y ≃ −2.4 (magenta line;top; Fig. 8; Dalcanton et al. 2007; Meynet & Maeder 2002),which coincides with the average effective yield of the gas-poorgalaxies in the reference set, as is expected to happen in chem-ical evolution models, when the gas is exhausted (Köppen &Hensler 2005; Dalcanton 2007). However, many XMPs haveyields which largely exceed the theoretical limit. There are twoways in which this excess could be explained. Either the theoret-ical yield of our XMPs is significantly larger than that of regularspirals, or the metallicity of the H gas is much lower than themetallicity of the ionized H gas.
Regarding the former explanation, a dependence of the IMFon the metallicity may play a role (e.g., Bromm & Larson 2004).In particular, a top-heavy IMF will increase the oxygen yields bysignificant amounts (e.g., Meynet & Maeder 2002). The secondpossibility, which we explain below, is the extremely low metal-licity of the H gas, that must be much lower than the alreadylow metallicity measured in the H regions of the XMPs.
When the gas mass fraction is large, as is the case in XMPs,one can easily show the effective yield to be the ratio betweenthe mass of metals in the gas, Zgas Mgas, and the stellar mass:
yeff ≃Zgas Mgas
M⋆, (7)
where Mgas stands for the mass of the gas. This expression showshow difficult it is to increase the effective yield beyond the theo-retical yield because, taken at face value, yeff > y implies creat-ing more metals than those allowed by the stellar evolution thatproduced the mass in stars. However, if the gas metallicity hasbeen overestimated by a significant amount, this would artifi-cially increase the effective yields (Eq. (7)). In other words, thelarge effective yields that we infer may be easily explained if theH gas is mostly pristine (Thuan et al. 2005), with a metallicitymuch lower than the already low metallicity measured in the gasforming stars at present (H gas-phase metallicity; Table 3).
As a sanity check, we have also computed yeff using thecolor-determined stellar masses (Sect. 3.3 and Fig. 3; top;Fig. 8). Equation 6 shows how an increase in stellar mass de-creases yeff. However, it does not suffice to explain the observedyeff > y, in most cases.
The H gas metallicity reproducing both the theory and ob-servations can be estimated assuming that the mass of metalsin the H gas coincides with the mass of metals produced bythe stars, i.e., y = Zgas Mgas/M⋆. The ratio between the effec-tive yield and the true yield is then given by the ratio betweenthe metallicity measured in the H regions, ZH , used to com-pute yeff, and the true H gas metallicity, ZH (bottom; Fig. 8).Explicitly:
ZH /ZH ≃ yeff/y. (8)
The results show that the ratio ZH /ZH falls, typically, between1 and 10 (bottom; Fig. 8). This is in agreement with the find-ings of Lebouteiller et al. (2013) on the metallicity of the H gas
A18, page 12 of 30

M. E. Filho et al.: Extremely metal-poor galaxies: The H content
Fig. 9. Mass – and luminosity – H gas-phase metallicity relation of theXMP galaxies. The color code parametrizes the morphology as follows:red = symmetric, black = cometary, blue = two-knot, green = multi-knot and grey = no morphological information. Top: the symbol codeis � = Mdyn, • = MH and × = M⋆. The figure includes the empiricalcorrelation established for BCDs by Papaderos (2008; cyan line) and forgreen pea starburst galaxies (magenta line; Amorín et al. 2010). Bottom:the figure shows the luminosity – metallicity relation found for a sampleof dwarf irregular galaxies (magenta line; Skillman et al. 1989) and fora sample of SDSS star-forming galaxies (cyan line; Guseva et al. 2009).
in the XMP prototype, IZw18. The H region abundances werefound to be lower by a factor of ∼2 compared to the H regions,and it may contain pockets of pristine gas, with an essentiallynull metallicity.
5.6. Mass – and luminosity – metallicity relation
The mass – metallicity relation, or equivalently the luminos-ity – metallicity relation (for similar M/L ratios; Lequeux et al.1979), reflects the fundamental role that the mass plays in galaxychemical evolution. We recall that the metallicity pertains to theH gas-phase metallicity (Table 3).
Besides the mass – metallicity relation for the XMPs, Fig. 9(top) includes the empirical relations for extreme starburst galax-ies called green peas (magenta line; top; Fig. 9; Amorín et al.2010) and for extremely metal-poor BCDs (cyan line; top; Fig. 9;Papaderos et al. 2008). The latter is determined from the lumi-nosity of the underlying host, after the subtraction of the star-burst contamination using surface photometric techniques, andtherefore, refers to the stellar mass.
The XMP galaxies show a large scatter in the mass – lu-minosity relation, with a significant fraction of the stellar masspoints falling to the left of the correlations (top; Fig. 9). This is
similar to what is found in more distant low-metallicity galax-ies (e.g. z > 0.1; Kakazu et al. 2007; Amorín et al. 2010).Furthermore, for a given dynamical mass, the measured metal-licity is low, suggesting the presence of pristine material.
In the bottom figure (Fig. 9) we include the luminosity –metallicity relation for the XMPs, the correlation for a sample ofdwarf irregular galaxies (magenta line; bottom; Fig. 9; Skillmanet al. 1989) and for a sample of SDSS star-forming galaxies(cyan line; bottom; Fig. 9; Guseva et al. 2009), linearly extrapo-lated to fainter magnitudes and lower metallicities.
We observe that most XMPs follow a similar slope to thatobserved for dwarf irregular and SDSS star-forming galaxies(magenta and cyan line; bottom; Fig. 9; Skillman et al. 1989;Guseva et al. 2009), but are too metal-poor for their luminos-ity. The largest deviations from the correlation occur at low lu-minosities, corresponding to the low-surface brightness, nearbygalaxies UGC 2684, DD053, LeoA, SextansB, UGCA292 andGR8. In this low luminosity regime, the inverse situation occurs;the XMPs are underluminous for their metallicity.
5.7. Mass – and luminosity – Tully-Fisher relation
The Tully-Fisher (TF) relation (Tully & Fisher 1977) is an em-pirical correlation found for spiral galaxies, reflecting the factthat the bigger or brighter the galaxy, the faster it rotates. Indeed,all galaxies are found to follow the same baryonic mass – TF re-lation, including low-surface brightness (LSB) galaxies, thatcontain a large amount of H gas (e.g., van de Kruit & Freeman2011).
As pointed out in Kannappan et al. (2002), the dispersionin the TF relation, particularly regarding the dwarf galaxy pop-ulation, is mainly related to recent perturbations in their evolu-tion, which is consistent with Kassin et al. (2007) and de Rossiet al. (2012), who argue that the dispersion and residuals corre-late with the morphology and kinematical indicators.
Figure 10 (top) contains the luminosity – TF relation for theXMPs, together with the empirical relation found for early- andlate-type dwarf and giant galaxies (cyan and magenta line, re-spectively; top; Fig. 10; de Rijcke et al. 2007) and their 1σ er-rors (cyan and magenta dashed line, respectively; top; Fig. 10;de Rijcke et al. 2007), extrapolated to fainter and slower rotat-ing galaxies. We note that the 1σ lower limit for the late-typedwarf and giant luminosity – TF relation (magenta dashed line;top; Fig. 10; de Rijcke et al. 2007) falls almost on top of theearly-type dwarf and giant luminosity – TF relation (cyan line;top; Fig. 10; de Rijcke et al. 2007). We have converted the cir-cular velocity used in de Rijcke et al. (2007) to w50, assuming aGaussian shape for the line profile, such that vcirc = 1.52× w50/2(e.g., Gurovich et al. 2010).
The majority of the XMP galaxies follow the luminosity –TF relation (top; Fig. 10) within 1σ, with a wide spread in lumi-nosity. However, differences are particularly large in the lowestluminosity targets, which correspond to the low-surface bright-ness, nearby galaxies UGC 2684, DD053, LeoA, SextansB,UGCA292 and GR8. Indeed, for a given stellar luminosity, theline widths are too broad compared to late- and early-type giantand dwarf galaxies. In these sources, the main support againstgravity comes from random motions rather than from rotation(e.g., Carignan et al. 1990).
Figure 10 (bottom) contains the mass – TF relation for theXMPs, together with the mass – TF relation for the dwarf andgiant early- and late-type galaxy samples by de Rijcke et al.(2007), in terms of stellar mass (magenta line; bottom; Fig. 10)and gas plus stellar (baryonic) mass (cyan line; bottom; Fig. 10),
A18, page 13 of 30
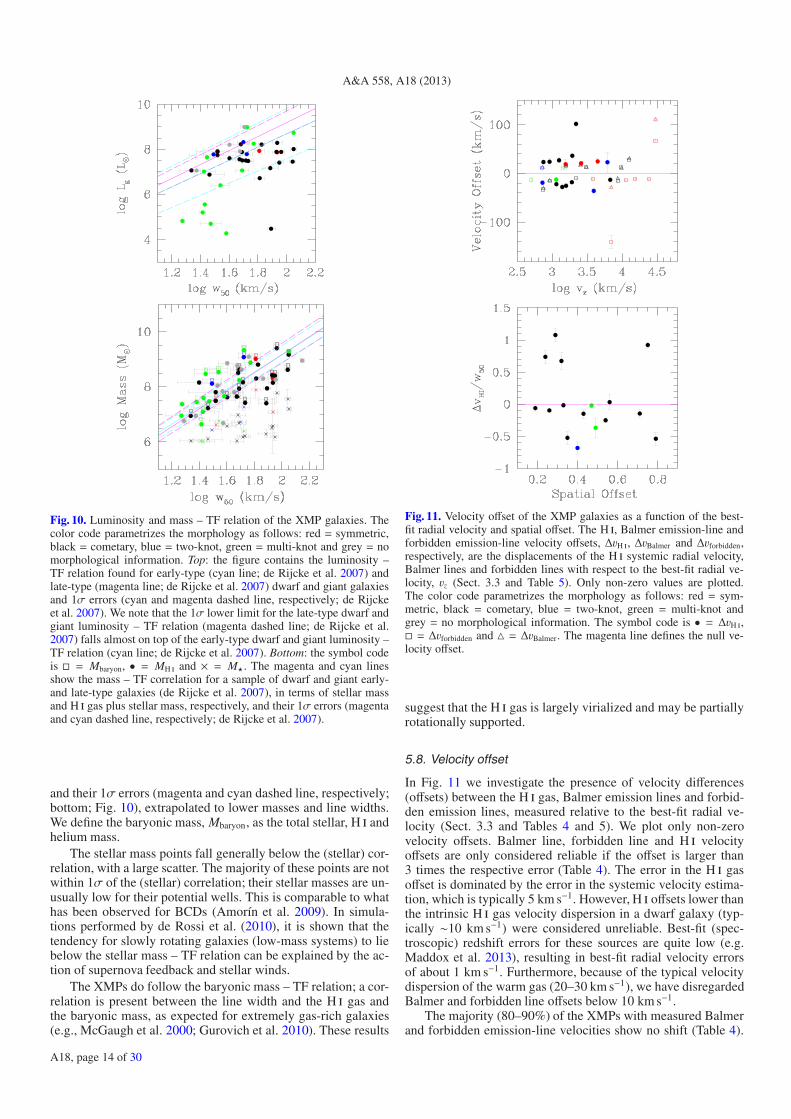
A&A 558, A18 (2013)
Fig. 10. Luminosity and mass – TF relation of the XMP galaxies. Thecolor code parametrizes the morphology as follows: red = symmetric,black = cometary, blue = two-knot, green = multi-knot and grey = nomorphological information. Top: the figure contains the luminosity –TF relation found for early-type (cyan line; de Rijcke et al. 2007) andlate-type (magenta line; de Rijcke et al. 2007) dwarf and giant galaxiesand 1σ errors (cyan and magenta dashed line, respectively; de Rijckeet al. 2007). We note that the 1σ lower limit for the late-type dwarf andgiant luminosity – TF relation (magenta dashed line; de Rijcke et al.2007) falls almost on top of the early-type dwarf and giant luminosity –TF relation (cyan line; de Rijcke et al. 2007). Bottom: the symbol codeis � = Mbaryon, • = MH and × = M⋆. The magenta and cyan linesshow the mass – TF correlation for a sample of dwarf and giant early-and late-type galaxies (de Rijcke et al. 2007), in terms of stellar massand H gas plus stellar mass, respectively, and their 1σ errors (magentaand cyan dashed line, respectively; de Rijcke et al. 2007).
and their 1σ errors (magenta and cyan dashed line, respectively;bottom; Fig. 10), extrapolated to lower masses and line widths.We define the baryonic mass, Mbaryon, as the total stellar, H andhelium mass.
The stellar mass points fall generally below the (stellar) cor-relation, with a large scatter. The majority of these points are notwithin 1σ of the (stellar) correlation; their stellar masses are un-usually low for their potential wells. This is comparable to whathas been observed for BCDs (Amorín et al. 2009). In simula-tions performed by de Rossi et al. (2010), it is shown that thetendency for slowly rotating galaxies (low-mass systems) to liebelow the stellar mass – TF relation can be explained by the ac-tion of supernova feedback and stellar winds.
The XMPs do follow the baryonic mass – TF relation; a cor-relation is present between the line width and the H gas andthe baryonic mass, as expected for extremely gas-rich galaxies(e.g., McGaugh et al. 2000; Gurovich et al. 2010). These results
Fig. 11. Velocity offset of the XMP galaxies as a function of the best-fit radial velocity and spatial offset. The H , Balmer emission-line andforbidden emission-line velocity offsets, ∆vH , ∆vBalmer and ∆vforbidden,respectively, are the displacements of the H systemic radial velocity,Balmer lines and forbidden lines with respect to the best-fit radial ve-locity, vz (Sect. 3.3 and Table 5). Only non-zero values are plotted.The color code parametrizes the morphology as follows: red = sym-metric, black = cometary, blue = two-knot, green = multi-knot andgrey = no morphological information. The symbol code is • = ∆vH ,� = ∆vforbidden and △ = ∆vBalmer. The magenta line defines the null ve-locity offset.
suggest that the H gas is largely virialized and may be partiallyrotationally supported.
5.8. Velocity offset
In Fig. 11 we investigate the presence of velocity differences(offsets) between the H gas, Balmer emission lines and forbid-den emission lines, measured relative to the best-fit radial ve-locity (Sect. 3.3 and Tables 4 and 5). We plot only non-zerovelocity offsets. Balmer line, forbidden line and H velocityoffsets are only considered reliable if the offset is larger than3 times the respective error (Table 4). The error in the H gasoffset is dominated by the error in the systemic velocity estima-tion, which is typically 5 km s−1. However, H offsets lower thanthe intrinsic H gas velocity dispersion in a dwarf galaxy (typ-ically ∼10 km s−1) were considered unreliable. Best-fit (spec-troscopic) redshift errors for these sources are quite low (e.g.Maddox et al. 2013), resulting in best-fit radial velocity errorsof about 1 km s−1. Furthermore, because of the typical velocitydispersion of the warm gas (20–30 km s−1), we have disregardedBalmer and forbidden line offsets below 10 km s−1.
The majority (80–90%) of the XMPs with measured Balmerand forbidden emission-line velocities show no shift (Table 4).
A18, page 14 of 30
M. E. Filho et al.: Extremely metal-poor galaxies: The H content
However, in 60% of the sources with H gas and optical data,we find a small offset (10–40 km s−1) between the systemicvelocity of the H gas and the best-fit radial velocity (top;Fig. 11; Table 5; e.g. Maddox et al. 2013). We have verified theSDSS DR9 images to find that the majority of these sources arecometary or knotted (Table 3) and that the SDSS fiber positionfor the spectra is generally located at the head or at the bright-est star-forming knot, not at the center of the XMP system. Werecall that the spatial offset we defined (Sect. 3.2 and Table 3)is a measurement of this displacement. Therefore, this could, inprinciple, explain the small velocity offsets observed betweenthe H gas and the nebular/stellar emission. However, we findno evidence for a correlation between the spatial offset and theH gas velocity offset (bottom; Fig. 11). The result suggests thatthe H gas and the nebular/stellar component are not tightly cou-pled in these XMPs.
In the three XMP sources where the H gas, Balmer line orforbidden line offsets are larger (>50 km s−1), we searched theSDSS DR9 and radio continuum (NVSS and FIRST; Condonet al. 1998; Becker et al. 1995) fields (6′ radius) for potentialgalaxy contaminants. We discuss these below.
• J0301-0052 – This cometary XMP (Table 3) has been ob-served with Effelsberg (Table 2) and shows a large H gasoffset (∼100 km s−1; Table 5). We had previously discardedH contamination (Sect. 2.2.2) by checking the SDSS spec-troscopic or photometric redshifts of the neighbours andfound no sources within 200 km s−1 of the target. In addition,the nearest radio continuum source (NVSS) present in thefield is about 1′ away and has a flux of 3.2 mJy. The SDSShas classified this source as a starburst at a redshift of 0.0073(Table 4). Indeed, the SDSS spectra of the source shows nar-row emission lines, with weak [O ] and [S ], typical ofa star-forming galaxy. This is consistent with the observed[N ]λ6584 Å/Hα and [O ]λ5007 Å/Hβ ratios and their lo-cation on the so-called BPT diagram (after Baldwin et al.1981). The fact that the SDSS spectra has been taken at thehead of the cometary structure could explain the large veloc-ity displacement relative to the H gas.• SDSSJ1025+1402 – This red symmetric (Table 3) source
shows Balmer and forbidden line offsets in excess of60 km s−1 (Table 4). The neighbouring sources in the SDSSfield show typically lower redshifts, which discards possibleH contamination, and the nearest radio continuum source(NVSS) lies 5′ away. The SDSS classifies this source asa broad-line quasar at a redshift of 0.1004 (Table 4). The[N ]λ6584 Å/Hα and [O ]λ5007 Å/Hβ ratios put thissource in the realm of star-forming galaxies in the BPT dia-gram. However, the red color, broad Hα line, large redshiftand large instrinsic luminosity indicate that the source mayhost an active galactic nuclei (AGN; Izotov et al. 2007). Theinteraction of the AGN jet with the narrow line region (NLR)may explain the Balmer and forbidden line offsets.• J1644+2734 – This disk-like symmetric (Table 3) source
shows a large forbidden line offset (–140 km s−1; Table 4).Sources in the SDSS field show higher radial velocities,which discards possible H contamination, and the nearestradio continnum source (NVSS) is at a distance of 3′. TheSDSS classifies this source as a quasar at a redshift of 0.0232(Table 4). The [N ]λ6584 Å/Hα and [O ]λ5007 Å/Hβ ra-tios put this source in the realm of composite galaxies in theBPT diagram. The disk-like morphology, associated with thepresence of broad Hα emission indicate that the source mayhost an AGN (Izotov et al. 2007). The large forbidden line
offset may be the result of cloud motion in the NLR, as aresult of the interaction with the AGN jet.
See Izotov et al. (2007) for a discussion on the presence of broad-line emission and AGN in XMP galaxies.
6. Complementary results from optical data
6.1. Optical morphology
Our optical morphological classification scheme (Sect. 3.2;Table 3; Figs. 1 and 2) has yielded 27 symmetric, 60 cometary,11 two-knot and 18 multi-knot galaxies. Of the 116 out of140 sources with SDSS DR9 information, ∼80% show asym-metric (cometary, two-knot or multi-knot) optical morphology.This result puts on a firm statistical base the association betweenXMP galaxies and cometary morphology, noted by Papaderoset al. (2008) and quantified by ML11.
From Figs. 4–12, we observe that the multi-knot sourcesshow the broadest range in galaxy properties, with the low-est/highest dynamical, H and stellar masses, (H gas and stel-lar) mass fractions and (H gas and stellar) mass-to-light ra-tios, faintest/brightest magnitudes and the narrowest/widest linewidths of the XMP galaxies.
6.2. Star-formation and specific star-formation rate
Figure 12 contains the SFR and sSFR as a function of the stellarmass.
The XMP SFRs (top; Fig. 12), which measure the globalstar-formation rate, are similar to those typically observed inBCDs (log SFR ∼ −3.6–0.4, for log M⋆ = 6–10 M⊙;Sánchez Almeida et al. 2009). However, more luminous BCDscan show SFRs up to 60 M⊙ yr−1 and sSFRs up to 10−7 yr−1
(Cardamone et al. 2009; Amorín et al. 2012b; also Izotov et al.2011). The XMPs SFR values are lower than the range of SFRsthat are typically observed in the disks of large spiral galax-ies (<20 M⊙ yr−1; magenta line; top; Fig. 12; Kennicutt 1998).Given the positive correlation between the SFR and the stellarmass (top; Fig. 12), this is expected, given the low masses of theXMPs.
Regarding the sSFR (bottom; Fig. 12), we observe a widerange of values. We find some high sSFRs compared to localSDSS samples (Tremonti et al. 2004; also Peeples et al. 2008,2009). The timescale to double their stellar mass, at the presentSFR, 1/sSFR, is typically lower than 1 Gyr, smaller than the ageof the galaxies, if we assume that they are about the age of theUniverse (∼14 Gyr; e.g., Caon et al. 2005; Amorín et al. 2007).This implies that XMPs are now undergoing a major starburstepisode, which can not be sustained for very long.
7. Conclusions
We have investigated the H content of local XMP galaxies as aclass, using the 140 sources compiled by ML11. These sourceswere selected either as showing negliglible [N ] lines in theSDSS DR7 (Abazajian et al. 2009) spectra, or H gas-phasemetallicities smaller than a tenth the solar value.
53 of these galaxies have published H data, provid-ing integrated flux densities and line widths in the range0.1−200 Jy km s−1 and 15–150 km s−1, respectively (Sect. 2.1and Table 1). We have also obtained new Effelsberg observationsfor 29 sources with no published 21 cm data, yielding 10 new de-tections (Sect. 2.2 and Table 2). Effelsberg integrated flux den-sities are in the range 1–15 Jy km s−1 and line widths cover a
A18, page 15 of 30

A&A 558, A18 (2013)
Fig. 12. SFR and sSFR of the XMP galaxies as a function of stellarmass. The color code parametrizes the morphology as follows: red =symmetric, black = cometary, blue = two-knot, green = multi-knot andgrey = no morphological information. Top: the magenta line providesthe upper limit to the SFRs typically observed in the disks of local spiralgalaxies.
wide spectrum (20–120 km s−1). The Effelsberg line profiles arevaried; one source shows a symmetric single-peak profile, sevenshow skewed single-peak profiles, demonstrating an asymme-try in the kinematics of the H gas, and two show asymmetricdouble-horn profiles (Fig. 1 and Table 2). Combining the opti-cal morphology with the H line profile shapes (Fig. 1, Tables 2and 3), we find that the double-horn sources are associated withmulti-knot or cometary optical morphology. Single-peak asym-metric profiles are associated with either cometary, two-knot ormulti-knot morphology, while the single-peak symmetric pro-file is associated with a symmetric source. We conclude that anasymmetry in the H gas line profile is systematically associ-ated with an asymmetry in the optical morphology (Sect. 5.1 andFig. 1).
When the new Effelsberg and literature data are taken to-gether, typically, the estimated dynamical, H and stellar massesare in the range 106.5−10.5, 106.5−9.5 and 106−9 M⊙, respectively(Sect. 5, Fig. 6 and Table 5). H gas-to-stellar mass ratios areabout 10–20 (Sect. 5.4, Figs. 6 and 7). We find that brighterXMPs have converted a larger fraction of their H gas into stars(Sect. 5.3 and Fig. 5). Moreover, M⋆/Lg ratios are found to beon average 0.1, whereas MH /Lg ratios may be up to 100 timeslarger (Sect. 5.3 and Fig. 5). Therefore, we conclude that localXMP galaxies are extremely gas-rich. The H gas and stellarmass constitute 20–60% and <5% of the dynamical mass, re-spectively (Sect. 5.4 and Fig. 6). Furthermore, dark matter masscontent (Sect. 5.4 and Fig. 6) spans a wide range of values for
XMP systems, but in some cases it accounts for over 65% ofthe dynamical mass, higher than the values determined for spi-rals and ellipticals (10–50%; Swaters 1999; Borriello et al. 2003;Cappellari et al. 2006; Thomas et al. 2007; Williams et al. 2009).
The global SFRs (Sect. 6.2, Table 4 and Fig. 12) in XMPsare found to similar to those found in typical BCDs (SánchezAlmeida et al. 2009). The apparent low SFRs are due to thelower stellar masses of the XMPs, because the sSFRs (SFR perunit mass) are high and are, on average, higher than those ob-served for local galaxies (Tremonti et al. 2004), with timescalesto double their stellar mass, at the current rate, of typically lessthan 1 Gyr.
XMPs are found to fall off of the mass – and luminos-ity – metallicity relations (Sect. 5.6 and Fig. 9) found for BCDs(Papaderos et al. 2008), extreme starburst galaxies (Amorínet al. 2010), SDSS star-forming galaxies (Guseva et al. 2009)and dwarf irregulars (Skillman et al. 1989), signaling the pres-ence of pristine material. XMPs generally uphold the baryonicmass – and luminosity – TF relation (Sect. 5.7 and Fig. 10)found for samples of late- and early-type dwarf and giant galax-ies (de Rijcke et al. 2007). The results suggest that the H gasis partly virialized and may contain some rotational support.However, for the lowest luminosity XMPs, most of the gravi-tational support comes from random motions.
The effective yield of oxygen in XMPs is often larger thanthe theoretical yield (Sect. 5.5 and Fig. 8). This is unusual andsuggests that either the theoretical yields are underestimating theproduction of oxygen in these low-metallicity environments, orthe H gas metallicity is 0.1–1 times that measured in the H re-gions. This second possibility is in agreement with the recentwork of Leboutellier et al. (2013) on the metallicity of the H gasof the XMP prototype, IZw18 (also Thuan et al. 2005).
We have also completed and/or revised the optical morpho-logical classification presented in ML11, bringing up to 83%the percentage of classified sources (Sects. 3.2, 6.1, Fig. 2 andTable 3). Of the 116 sources with SDSS imaging, ∼80% presentan asymmetric optical morphology, signature of asymmetricstar-formation. 27 galaxies show a symmetric spherical, ellip-tical or disk-like structure, 60 present a clear head-tail cometarymorphology, 11 show a two-knot structure, and 18 present a mul-tiple knot structure due to the presence of multiple star-formingregions.
Velocity offsets between the H gas and the nebular/stellarcomponent have also been investigated (Sect. 5.8, Table 5 andFig. 11). We find that in 60% of the XMPs with H and opticaldata, small displacements (10–40 km s−1) occur and these do notcorrelate with the morphology. This result suggests that, in thesesources, the H gas is not highly coupled to the nebular/stellarcomponent.
We conclude that XMP galaxies are extremely gas-rich, withevidence that the H component is kinematically disturbed andrelatively metal-free.
Acknowledgements. We would like to thank J. Brinchmann for his help regard-ing the MPA-JHU data and the anonymous referee for their suggestions and com-ments. M.E.F. is supported by a Post-Doctoral grant SFRH/BPD/36141/2007,by the Fundação para a Ciência e Tecnologia (FCT, Portugal). J.M.G. issupported by a Post-Doctoral grant SFRH/BPD/66958/2009 by the FCT(Portugal). P.L. is supported by a Post-Doctoral grant SFRH/72308/2010,funded by the FCT (Portugal). P.P. is supported by a Ciência 2008 Contract,funded by the FCT/MCTES and POPH/FSE (EC). A.H. is supported bya Marie Curie Fellowship, cofunded by the FCT and the FP7. Y.A. re-ceives financial support from project AYA2010-21887-C04-03, from the for-mer Ministerio de Ciencia e Innovación (MICINN, Spain), as well as
A18, page 16 of 30

M. E. Filho et al.: Extremely metal-poor galaxies: The H content
the Ramón y Cajal programme (RyC-2011-09461), now managed by theMinisterio de Economía y Competitividad (fiercely cutting back on theSpanish scientific infrastructure). P.P., J.M.G., P.L. and A.H. acknowledge sup-port by the FCT, under project FCOMP-01-0124-FEDER-029170 (ReferenceFCT PTDC/FIS-AST/3214/2012), funded by the FCT-MEC (PIDDAC) andFEDER (COMPETE). This work has been partly funded by the SpanishMinistery for Science, through project AYA 2010-21887-C04-04. The re-search leading to these results has received funding from the EuropeanCommission Seventh Framework Programme (FP/2007-2013) under grantagreement No. 283393 (RadioNet3). This work is based on observationsobtained with the 100-m telescope of the MPIfR (Max-Planck-Institut fürRadioastronomie) at Effelsberg. Funding for SDSS-III has been provided bythe Alfred P. Sloan Foundation, the Participating Institutions, the NationalScience Foundation, and the US. Department of Energy Office of Science.The SDSS-III web site is http://www.sdss3.org/. SDSS-III is managedby the Astrophysical Research Consortium for the Participating Institutions ofthe SDSS-III Collaboration including the University of Arizona, the BrazilianParticipation Group, Brookhaven National Laboratory, University of Cambridge,Carnegie Mellon University, University of Florida, the French ParticipationGroup, the German Participation Group, Harvard University, the Instituto deAstrofisica de Canarias, the Michigan State/Notre Dame/JINA ParticipationGroup, Johns Hopkins University, Lawrence Berkeley National Laboratory,Max Planck Institute for Astrophysics, Max Planck Institute for ExtraterrestrialPhysics, New Mexico State University, New York University, Ohio StateUniversity, Pennsylvania State University, University of Portsmouth, PrincetonUniversity, the Spanish Participation Group, University of Tokyo, University ofUtah, Vanderbilt University, University of Virginia, University of Washington,and Yale University.
References
Abazajian, K. N., Adelman-McCarthy, J. K., Agüeros, M. A., et al. 2009, ApJS,182, 543
Ahn, C. P., Alexandroff, R., Allende Prieto, C., et al. 2012, ApJS, 203, 21Amorín, R. O., Muñoz-Tuñón, C., Aguerri, J. A., Cairós, L. M., & Caon, N.
2007, A&A, 467, 541Amorín, R., Alfonso, J., Aguerri, J. A. L., Muñoz-Tuñón, C., & Cairós, L. M.
2009, A&A, 501, 75Amorín, R. O., Pérez-Montero, E., & Vílchez, J. M. 2010, ApJ, 715, 128Amorín, R. O., Vílchez, J. M., Hägele, G. F., et al. 2012a, ApJ, 754, 22Amorín, R., Pérez-Montero, E., Vílchez, J. M., & Papaderos, P. 2012b, ApJ, 749,
185Alpher, R. A., Bethe, H., & Gamow, G. 1948, Phys. Rev., 73, 80Baldwin, J. A., Phillips, M. M., & Terlevich, R. 1981, PASP, 93, 5Barnes, D. G., & de Blok, W. J. G. 2004, MNRAS, 351, 333Barnes, D. G., Staveley-Smith, L., de Blok, W. J. G., et al. 2001, MNRAS, 322,
486Becker, R. H., White, R. L., & Helfand, D. J. 1995, ApJ, 450, 559Begum, A., Chengalur, J. N., Karachentsev, I. D., et al. 2006, MNRAS, 365,
1220Begum, A., Begum, A., Chengalur, J. N., et al. 2008, MNRAS, 386, 1667Bell, E. F., & de Jong, R. S. 2001, ApJ, 550, 212Bergvall, N. 2012, Star-Forming Dwarf Galaxies, in Keys to Galaxy Formation
and Evolution, Astrophysics and Space Science, Proc., eds. P. Papaderos, S.Recchi, & G. Hensler (Berlin Heidelberg: Springer-Verlag), 175
Bergvall, N., & Östlin, G. 2002, A&A, 390, 891Borriello, A., Salucci, P., & Danese, L. 2003, MNRAS, 341, 1109Brinchmann, J., Charlot, S., White, S. D. M., Kauffmann, G., & Heckman, T.
2004, MNRAS, 351, 1151Bromm, V., & Larson, R. B. 2004, ARA&A, 42, 79Cappellari, M., Bacon, R., Bureau, M., et al. 2006, MNRAS, 366, 1126Cardamone, C., Schawinski, K., Sarzi, M., et al. 2009, MNRAS, 399, 1191Chengalur, J. N., Pustilnik, S. A., Martin, J.-M., et al. 2006, MNRAS, 371, 1849Cairós, L. M., Caon, N., Vílchez, J. M., et al. 2001a, ApJS, 136, 393Cairós, L. M., Vílchez, J. M., González Pérez, J. N., Iglesias-Páramo, J., & Caon,
N. 2001b, ApJS, 133, 321Cairós, L. M., Caon, N., Papaderos, P., et al. 2003, ApJ, 593, 312Caon, N., Cairós, L. M., Aguerri, J. A. L., et al. 2005, RMxAC, 24, 223Carignan, C., Beaulieu, S., & Freeman, K. C. 1990, AJ, 99, 178Coc, A., Goriely, S., Xu, Y., Saimpert, M., & Vangioni, E. 2012, ApJ, 744, 158Condon, J. J., Cotton, W. D., Greisen, E. W., et al. 1998, AJ, 115, 1693Dalcanton, J. 2007, ApJ, 658, 941de Rijcke, S., Zeilinger, W. W., Hau, George, K. T., et al. 2007, ApJ, 659, 1172de Rossi, M. E., Tissera, P. B., & Pedrosa, S. E. 2010, A&A, 519, A89de Rossi, M. E., Tissera, P. B., & Pedrosa, S. E. 2012, A&A, 546, A52Doyle, M. T., Drinkwater, M. J., Rohde, D. J., et al. 2005, MNRAS, 361, 34
Edmunds, M. G. 1990, MNRAS, 246, 678Ekta, B., & Chengalur, J. N. 2010, MNRAS, 403, 295Ekta, B., Chengalur, J. N., & Pustilnik, S. A. 2006, MNRAS, 372, 853Ekta, B., Chengalur, J. N., & Pustilnik, S. A. 2008, MNRAS, 391, 881Ekta, B., Pustilnik, S. A., & Chengalur, J. N. 2009, MNRAS, 397, 963Elmegreen, B. G., & Elmegreen, D. M. 2010, ApJ, 722, 1895Elmegreen, D. M., Elmegreen, B. G., Marcus, M. T., et al. 2009, ApJ, 70, 306Elmegreen, D. M., Elmegreen, B. G., Sánchez Almeida, J., et al. 2012, ApJ, 750,
95Faber, S. M., & Gallagher, J. S. 1979, ARA&A, 17Gavazzi, G., Zibetti, S., Boselli, A., et al. 2001, A&A, 372, 29Gil de Paz, A., & Madore, B. F. 2005, ApJS, 156, 345Giovanelli, R., Haynes, M. P., Kent, B. R., et al. 2007, AJ, 133, 2569Gurovich, S., Freeman, K., Jerjen, H., Staveley-Smith, L., & Puerari, I. 2010,
AJ, 140, 663Guseva, N. G., Izotov, Y. I., Papaderos, P., et al. 2007, A&A, 464, 885Guseva, N. G., Papaderos, P., Meyer, H. T., et al. 2009, A&A, 505, 63Hogg, D., Roberts, M. S., Haynes, M. P., et al. 2007, AJ, 134, 1046Huchtmeier, W. K., & Richter, O.-G. 1989, A&A, 210, 1Huchtmeier, W. K., Karachentsev, I. D., Karachentsev, D. E. 2003, A&A, 401,
48Huchtmeier, W. K., Krishna, G., & Petrosian, A. 2005, A&A, 434, 8873Izotov, Y. I., Thuan, T. X., & Guseva, N. G. 2007, ApJ, 671, 1297Izotov, Y. I., Guseva, N. G., & Thuan, T. X. 2011, ApJ, 728, 161Izotov, Y. I., Thuan, T. X., & Guseva, N. G. 2012, A&A, 546, A122Jester, S., Schneider, D. P., Richards, G. T., et al. 2005, AJ, 130, 873Kalberla, O. M. W., Mebold, U., & Reif, K. 1982, A&A, 106, 190Kakazu, Y., Cowie, L. L., & Hu, E. M. 2007, 668, 853Kauffmann, G., Heckman, T. M., White, S. D. M., et al. 2003, MNRAS, 341, 33Kannappan, S., Fabricant, D. G., & Franx, M. 2002, AJ, 123, 2358Kassin, S. A., Weiner, B. J., Faber, S. M., et al. 2007, ApJ, 660, L35Kennicutt, R. C. 1998, ApJ, 498, 541Kewley, L. J., Geller, M. J., & Barton, E. J. 2006, AJ, 131, 2004Klein, B., Philipp, S. D., Krämer, I., et al. 2006, A&A, 454, 29Köppen, J., & Hensler, G. 2005, A&A, 434, 531Koribalski, B. S. 2012, PASA, 29, 359Koribalski, B. S., Staveley-Smith, L., Kilborn, V. A., et al. 2004, AJ, 128, 16Kovac̆, K. Osterloo, T. A., & van der Hulst, J. M. 2009, MNRAS, 400, 743Kunth, D., & Östlin, G. 2000, A&ARv, 10, 1Lagos, P., Telles, E., Nigoche-Netro, A., & Carrasco, E. R. 2011, AJ, 142, 162Lebouteiller, V., Heap, S., Hubeny, I., & Kunth, D. 2013, A&A, 553, A16Lequeux, J., Peimbert, M., Rayo, J. F., et al. 1979, A&A, 80, 155Lu, N. Y., Hoffman, G. L., Groff, T., et al. 1993, ApJS, 88, 383Maddox, N., Hess, K. M., Blyth, S.-L., & Jarvis, M. J. 2013, MNRAS, 433, 2613Mamon, G. A., Tweed, D., Thuan, T. X., & Cattaneo, A. 2012, in Predicting
the Frequencies of Young and of Tiny Galaxies Dwarf Galaxies: Keys toGalaxy Formation and Evolution, Astrophysics and Space Science, Proc., eds.P. Papaderos, S. Recchi, & G. Hensler (Berlin, Heidelberg: Springer-Verlag),39
Mcgaugh, S. S., Schombert, J. M., Bothun, G. D., & de Blok, W. J. G. 2000,ApJ, 533, 99
Meynet, G., & Maeder, A. 2002, A&A, 390, 561Micheva, G., Östlin, G., Zackrisson, E., et al. 2013, A&A, 556, A10Miyauchi-Isobe, N., Maehara, H., & Nakajima, K. 2010, OPNAOJ, 13, 9Morales-Luis, S. A., Aguerri, & Muñoz-Tuñón, C. 2011, ApJ, 743, 77Noeske, K. G., Papaderos, P., Cairós, L. M., & Fricke, K. J. 2003, A&A, 410,
481O’Brien, J. C., Freeman, K. C., van der Kruit, P. C., et al. 2010, A&A, 515, A60O’Neil, K. 2004, AJ, 128, 2080Ott, J., Stilp, A. M., Warren, S., et al. 2012, AJ, 144, 123Papaderos, P., & Östlin, G. 2012, A&A, 537, A126Papaderos, P., Loose, H.-H., Thuan, T. X., et al. 1996a, A&AS, 120, 207Papaderos, P., Loose, H.-H., Fricke, K. J., et al. 1996b, A&A, 314, 59Papaderos, P., Izotov, Y. I., Fricke, K. J., Thuan, T. X., & Guseva, N. G. 1998,
A&A, 338, 43Papaderos, P., Guseva, N. G., Izotov, Y. I., et al. 2008, A&A, 491, 113Peeples, M., Pogge, R. W., & Stanek, K. Z. 2008, ApJ, 685, 904Peeples, M., Pogge, R. W., & Stanek, K. Z. 2009, ApJ, 695, 259Pilyugin, L. S., Vílchez, J. M., & Contini, T. 2004, A&A, 425, 849Pustilnik, S. A., & Martin, J.-M. 2007, A&A, 464, 859Pustilnik, S. A., Brinks, E., Thuan, T. X., et al. 2001, AJ, 121, 1413Pustilnik, S. A., Engels, D., Lipovetsky, V. A., et al. 2005, A&A, 442, 109Pustilnik, S. A., Tepliakova, A. L., Kniazev, A. Y., Martin, J.-M., & Burenkov,
A. N. 2010, MNRAS, 401, 333Pustilnik, S. A., Martin, J.-M., Lyamina, Y. A., & Kniazev, A. Y. 2013, MNRAS,
432, 2224Sánchez Almeida, J., Aguerri, J. A. L., Muñoz-Tuñón, C., & Vazdekis, A. 2009,
ApJ, 698, 1497
A18, page 17 of 30

A&A 558, A18 (2013)
Sánchez Almeida, J., Muñoz-Tuñón, C., Elmegreen, D. M., Elmegreen, B. G., &Méndez-Abreu, J. 2013, ApJ, 767, 74
Sánchez-Janssen, R., Méndez-Abreu, J., & Aguerri, J. A. L. 2010, MNRAS, 406,65
Sánchez-Janssen, R., Amorín, R., García-Vargas, M., et al. 2013, A&A, 554,A20
Sargent, W. L. W., & Searle, S. 1970, ApJ, 162, 155Schneider, S. E., Thuan, T. X., Mangum, J. G., et al. 1992, ApJS, 81, 5Skillman, E. D., Kennicutt, R. C., & Hodge, P. W. 1989, ApJ, 347, 875Springob, C. M., Haynes, M. P., Giovanelli, R., et al. 2005, ApJS, 160, 149Staveley-Smith, L., Davis, R. D., & Kinman, T. D. 1992, MNRAS, 258, 334Straughn, A. N., Cohen, S. H., Ryan, R. E., et al. 2006, ApJ, 639, 724Swaters, R. 1999, ASPC, 182, 369Telles, E., & Terlevich, R. 1997, MNRAS, 286, 183Thomas, J., Saglia, R. P., Bender, R., et al. 2007, MNRAS, 382, 657
Thuan, T. X., & Martin, G. E. 1981, ApJ, 247, 823Thuan, T. X., Hibbard, J. E., & Lévrier, F. 2004, AJ, 128, 617Thuan, T. X., Lecavelier des Etangs, A., & Izotov, Y. I. 2005, ApJ, 621, 269Tremonti, C. A., Heckman, T. M., Kauffmann, G., et al. 2004, ApJ, 613, 898Tully, R. B., & Fisher, J. R. 1977, A&A, 54, 661Walter, F., Brinks, E., de Blok, W. J. G., et al. 2008, AJ, 136, 2563Warren, B. E., Jerjen, H., & Koribalski, B. S. 2006, AJ, 131, 2056Williams, M. J., Bureau, M., & Cappellari, M. 2009, MNRAS, 400, 1665Wild, J. P. 1952, ApJ, 115, 206Winkel, B., Kalberla, P. M. W., Kerp, J., et al. 2010, ApJS, 188, 488Winkel, B., Kraus, A., & Bach, U. 2012, A&A, 540, A140van der Kruit, P. C., & Freeman, K. 2011, ARA&A, 49, 301York, D. G., Adelman, J., Anderson, J. E., Jr., et al. 2000, AJ, 120, 1579Young, J. S., & Scoville, N. Z. 1991, ARA&A, 29, 581
Pages 19 to 30 are available in the electronic edition of the journal at http://www.aanda.org
A18, page 18 of 30
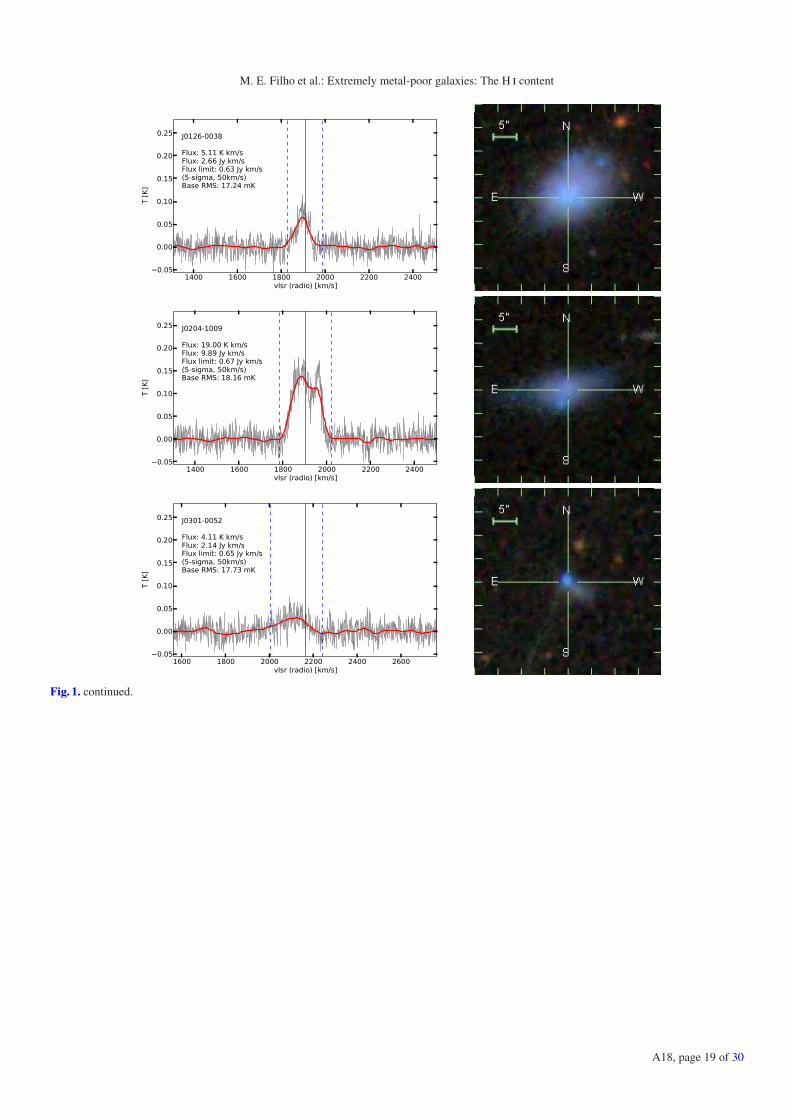
M. E. Filho et al.: Extremely metal-poor galaxies: The H content
Fig. 1. continued.
A18, page 19 of 30

A&A 558, A18 (2013)
Fig. 1. continued.
A18, page 20 of 30

M. E. Filho et al.: Extremely metal-poor galaxies: The H content
Fig. 1. continued.
A18, page 21 of 30

A&A 558, A18 (2013)
Table 3. The optical data for the 140 XMP galaxies in the local Universe.
Name RA(J2000) Dec(J2000) mg ropt sin i 12 + log (O/H) Optical Spatialh m s ◦ ′ ′′ mag ′′ morphology offset
(1) (2) (3) (4) (5) (6) (7) (8) (9)UGC 12894 00 00 22 +39 29 44 . . . 27.0⋆ . . . 7.64 . . . . . .J0004+0025 00 04 22 +00 25 36 19.4 5.23 0.70 7.37 symmetric∗ . . .J0014-0044a 00 14 29 –00 44 44 18.7 1.43⋆ 0.89⋆ 7.63 . . . . . .J0015+0104 00 15 21 +01 04 37 18.3 15.25 0.62 7.07 multi-knot∗ . . .J0016+0108 00 16 28 +01 08 02 18.9 4.54 0.57 7.53 symmetric∗ . . .HS0017+1055 00 20 21 +11 12 21 . . . . . . . . . 7.63 cometary∗ 0.2J0029-0108 00 29 05 –01 08 26 19.2 5.3 0.88 7.35 cometary∗ 0.4J0029-0025 00 29 49 –00 25 40 20.4 17.34⋆ 0.50⋆ 7.29 symmetric∗ . . .ESO 473-G024 00 31 22 –22 45 57 . . . 25.5† 0.89† 7.45 . . . . . .J0036+0052 00 36 30 +00 52 34 18.8 2.32 0.48 7.64‡ symmetric . . .AndromedaIV 00 42 32 +40 34 19 . . . 34.5† 0.68† 7.49 . . . . . .J0057-0022 00 57 13 –00 21 58 19.1 1.51⋆ 0.42⋆ 7.60 symmetric∗ . . .IC1613 01 04 48 +02 07 04 . . . 460.5† 0.48† 7.64 multi-knot∗ . . .J0107+0001 01 07 51 +00 01 28 19.4 1.30 0.63 7.23 cometary∗ 0.4AM0106-382 01 08 22 –38 12 34 . . . 17.1† 0.88† 7.56 . . . . . .J0113+0052 01 13 40 +00 52 39 20.1 3.23 0.42 7.24 multi-knot∗ 0.5J0119-0935 01 19 14 –09 35 46 19.5 2.04 0.61 7.31 cometary∗ 0.4HS0122+0743 01 25 34 +07 59 24 15.7 10.14 0.67 7.60 multi-knot 0.5J0126-0038 01 26 46 –00 38 39 18.4 3.36⋆ 0.78⋆ 7.51 cometary∗ 0.2J0133+1342 01 33 53 +13 42 09 18.1 5.64 0.81 7.56 symmetric∗ . . .J0135-0023 01 35 44 –00 23 17 18.9 2.23⋆ 0.94⋆ 7.38 symmetric∗ . . .UGCA20 01 43 15 +19 58 32 18.0 58.5† 1.03† 7.60 cometary∗ 0.7UM133 01 44 42 +04 53 42 15.4 . . . . . . 7.63 cometary∗ 0.8J0158+0006 01 58 09 +00 06 37 18.1 5.16 0.78 7.75‡ cometary . . .HKK97L14 02 00 10 +28 49 53 . . . 13.5† 0.92† 7.56 cometary∗ 0.5J0204-1009 02 04 26 –10 09 35 17.1 10.09 0.94 7.36 cometary∗ . . .J0205-0949 02 05 49 –09 49 18 15.3 21.39 0.98 7.61 multi-knot∗ . . .J0216+0115 02 16 29 +01 15 21 17.4 9.22 0.73 7.44 cometary∗ 0.6096632 02 51 47 –30 06 32 16.3 17.55† 0.74† 7.51 . . . . . .J0254+0035 02 54 29 +00 35 50 19.8 3.29 0.83 7.28 cometary∗ 0.3J0301-0059 03 01 26 –00 59 26 21.5 3.18⋆ 0.82⋆ 7.64 cometary∗ 0.1J0301-0052 03 01 49 –00 52 57 18.8 2.48⋆ 0.87⋆ 7.52 cometary∗ 0.8J0303-0109 03 03 31 –01 09 47 19.8 4.69 0.69 7.22 two-knot 0.7J0313+0006 03 13 00 +00 06 12 19.2 3.80 0.82 7.82‡ cometary 0.5J0313+0010 03 13 02 +00 10 40 18.9 4.35 0.43 7.44 symmetric∗ . . .J0315-0024 03 16 00 –00 24 26 20.2 1.48⋆ 0.59⋆ 7.41 cometary∗ 0.7UGC 2684 03 20 24 +17 17 45 22.8 2.47 0.77 7.60 cometary∗ 0.0SBS 0335-052W 03 37 38 –05 02 37 19.0 3.45† 0.68† 7.11 . . . . . .SBS 0335-052E 03 37 44 –05 02 40 16.3 6.45† 0.53† 7.31 . . . . . .J0338+0013 03 38 12 +00 13 13 24.4 4.31 0.84 7.64 cometary∗ 0.7J0341-0026 03 41 18 –00 26 28 18.8 1.72⋆ 0.97⋆ 7.26 cometary∗ 0.7ESO358-G060 03 45 12 –35 34 15 . . . 31.5† 1.04† 7.26 . . . . . .G0405-3648 04 05 19 –36 48 49 . . . 12.45† 0.73† 7.25 . . . . . .J0519+0007 05 19 03 +00 07 29 18.4 2.16 0.47 7.44 symmetric∗ . . .Tol0618-402 06 20 02 –40 18 09 . . . 10.5† 0.71† 7.56 . . . . . .
Notes. Column 1: Source name. Column 2: Right Ascension. Column 3: Declination. Column 4: SDSS g-band Petrosian magnitude, from ML11.Column 5: Optical radius containing 90% of the g-band galaxy light, from the SDSS. Otherwise, NED SDSS r-band Petrosian radius (⋆) or theaverage source size at isophote 25 mag arcsec−2 (†), is used. Column 6: Inclination angle of the source from the SDSS g-band data, NED SDSSr-band Petrosian data (⋆) or estimated from the NED source size (†). Column 7: Metallicity, 12 + log (O/H), from ML11. Tabulated values arebased on the direct method or strong-line method (‡; see ML11 for details). Column 8: SDSS optical morphology adapted from ML11 or obtainedfrom SDSS DR9 images (∗). Symmetric (spherical, elliptical or disk-like symmetric structure), two-knot (two-knot structure), multi-knot (multipleknot structure) and cometary (head-tail structure), are used. Column 9: Spatial offset, ∆R/r, where ∆R is the difference between the position of thebrightest star-formation region and the position of the center of the galaxy and r is the radius of the outer isophote. (a) Although this source hasbeen selected as an XMP galaxy in ML11, NED has flagged this as a Western H region of UGC 139 (Sect. 3.2.2).
A18, page 22 of 30

M. E. Filho et al.: Extremely metal-poor galaxies: The H content
Table 3. continued.
Name RA(J2000) Dec(J2000) mg ropt sin i 12 + log (O/H) Optical Spatialh m s ◦ ′ ′′ mag ′′ morphology offset
(1) (2) (3) (4) (5) (6) (7) (8) (9)
ESO 489-G56 06 26 17 –26 15 56 15.6 22.5† 0.80† 7.49 . . . . . .J0808+1728 08 08 41 +17 28 56 19.2 0.56⋆ 0.75⋆ 7.48 symmetric . . .J0812+4836 08 12 39 +48 36 46 16.0 13.10 0.89 7.28 cometary∗ 0.2UGC 4305 08 19 05 +70 43 12 . . . 213.0† 0.64† 7.65 . . . . . .J0825+1846 08 25 40 +18 46 17 19.0 2.16 0.58 7.75‡ symmetric . . .HS0822+03542 08 25 55 +35 32 31 17.8 4.45 0.92 7.35 cometary∗ 0.3DD053 08 34 07 +66 10 54 20.3 42.0† 0.53† 7.62 multi-knot∗ . . .UGC 4483 08 37 03 +69 46 31 15.1 31.5† 0.92† 7.58 . . . . . .HS0837+4717 08 40 30 +47 07 10 17.6 2.31 0.69 7.64 cometary∗ 0.3J0842+1033 08 42 36 +10 33 13 17.7 5.65 0.87 7.58‡ cometary 0.4HS0846+3522 08 49 40 +35 11 39 18.2 5.80 0.79 7.65 cometary∗ 0.2J0859+3923 08 59 47 +39 23 06 17.2 10.62 0.74 7.57 two-knot∗ . . .J0910+0711 09 10 29 +07 11 18 16.9 11.61 0.94 7.63 cometary∗ 0.5J0911+3135 09 11 59 +31 35 36 17.8 6.04 0.71 7.51 cometary∗ 0.3J0926+3343 09 26 09 +33 43 04 17.8 15.58 1.00 7.12 cometary∗ 0.9IZw18 09 34 02 +55 14 25 16.4 4.47 0.51 7.17 two-knot . . .J0940+2935 09 40 13 +29 35 30 16.5 16.44 0.95 7.65 cometary∗ 0.3J0942+3404 09 42 54 +34 04 11 19.1 2.29 0.68 7.67‡ cometary 0.4CGCG007-025 09 44 02 –00 38 32 16.0 9.47 0.82 7.65 multi-knot∗ . . .SBS940+544 09 44 17 +54 11 34 19.1 0.63⋆ 0.36⋆ 7.46 cometary 0.7CS0953-174 09 55 00 –17 00 00 . . . . . . . . . 7.58 . . . . . .J0956+2849 09 56 46 +28 49 44 15.9 32.05 0.97 7.13 multi-knot∗ . . .LeoA 09 59 26 +30 44 47 19.0 124.5† 0.86† 7.30 multi-knot∗ . . .SextansB 10 00 00 +05 19 56 20.5 129.0† 0.78† 7.53 multi-knot∗ . . .J1003+4504 10 03 48 +45 04 57 17.5 3.40 0.59 7.65‡ symmetric . . .SextansA 10 11 00 –04 41 34 . . . 162.0† 0.59† 7.54 . . . . . .KUG1013+381 10 16 24 +37 54 44 15.9 1.62 . . . 7.58 cometary 0.2SDSSJ1025+1402 10 25 30 +14 02 07 20.4 0.60⋆ 0.54⋆ 7.36 symmetric∗ . . .UGCA211 10 27 02 +56 16 14 16.2 2.11 0.38 7.56 cometary∗ 0.4J1031+0434 10 31 37 +04 34 22 16.2 6.08 0.70 7.70 cometary 0.3HS1033+4757 10 36 25 +47 41 52 17.5 6.92 0.67 7.65 symmetric∗ . . .J1044+0353 10 44 58 +03 53 13 17.5 4.16 0.86 7.44 cometary 0.4HS1059+3934 11 02 10 +39 18 45 17.9 7.89 0.71 7.62 multi-knot∗ . . .J1105+6022 11 05 54 +60 22 29 16.4 17.08 0.91 7.64 cometary∗ 0.4J1119+5130 11 19 34 +51 30 12 16.9 4.52 0.73 7.51 cometary∗ 0.2J1121+0324 11 21 53 +03 24 21 18.1 9.62 0.80 7.64 cometary∗ 0.5UGC6456 11 28 00 +78 59 39 . . . 33.0† 0.88† 7.35 . . . . . .SBS1129+576 11 32 02 +57 22 46 16.7 6.59⋆ 0.97⋆ 7.36 cometary∗ 0.5J1145+5018 11 45 06 +50 18 02 17.8 5.50 0.89 7.71‡ cometary 0.4J1151-0222 11 51 32 –02 22 22 16.8 11.30 0.52 7.78 two-knot 0.6J1157+5638 11 57 54 +56 38 16 16.9 10.39 0.61 7.83‡ cometary 0.5J1201+0211 12 01 22 +02 11 08 17.6 10.28 0.88 7.49 cometary 0.6SBS1159+545 12 02 02 +54 15 50 18.7 2.33 0.40 7.41 two-knot∗ 0.8SBS1211+540 12 14 02 +53 45 17 17.4 5.72 0.79 7.64 cometary 0.1J1215+5223 12 15 47 +52 23 14 15.2 24.67 0.85 7.43 multi-knot∗ . . .Tol1214-277 12 17 17 –28 02 33 . . . 2.4† . . . 7.55 . . . . . .VCC0428 12 20 40 +13 53 22 17.0 11.73 0.91 7.64 cometary∗ 0.1HS1222+3741 12 24 37 +37 24 37 17.9 2.19 0.47 7.64 symmetric∗ . . .Tol65 12 25 47 –36 14 01 17.5 6.0† . . . 7.54 . . . . . .J1230+1202 12 30 49 +12 02 43 16.7 4.88 0.86 7.73 cometary 0.3KISSR85 12 37 18 +29 14 55 19.9 3.16 0.56 7.61 cometary∗ 0.3UGCA292 12 38 40 +32 46 01 18.9 1.51 0.14 7.28 multi-knot∗ . . .HS1236+3937 12 39 20 +39 21 05 18.5 8.54 1.00 7.47 two-knot∗ 0.4J1239+1456 12 39 45 +14 56 13 19.8 1.47 0.56 7.65 symmetric∗ . . .SBS1249+493 12 51 52 +49 03 28 18.0 3.00 0.84 7.64 cometary∗ 0.7J1255-0213 12 55 26 –02 13 34 19.1 0.83⋆ 0.64⋆ 7.83 symmetric . . .GR8 12 58 40 +14 13 03 17.9 23.54 0.88 7.65 multi-knot∗ . . .KISSR1490 13 13 16 +44 02 30 19.0 5.60 0.85 7.56 cometary∗ 0.4DD0167 13 13 23 +46 19 22 . . . 19.64 0.82 7.20 multi-knot∗ 0.8HS1319+3224 13 21 20 +32 08 25 18.6 4.57 0.66 7.59 cometary∗ 0.2J1323-0132 13 23 47 –01 32 52 18.2 0.66⋆ 0.39⋆ 7.78 symmetric . . .J1327+4022 13 27 23 +40 22 04 19.0 2.83 0.46 7.67‡ symmetric . . .
A18, page 23 of 30
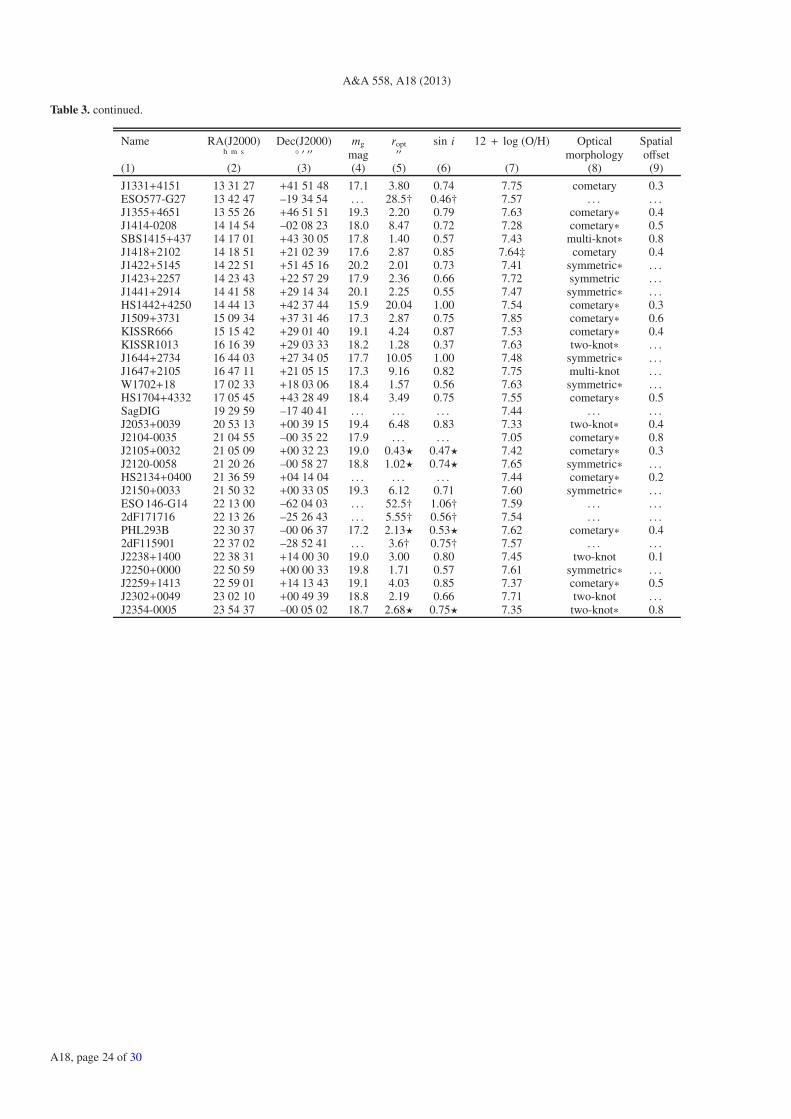
A&A 558, A18 (2013)
Table 3. continued.
Name RA(J2000) Dec(J2000) mg ropt sin i 12 + log (O/H) Optical Spatialh m s ◦ ′ ′′ mag ′′ morphology offset
(1) (2) (3) (4) (5) (6) (7) (8) (9)
J1331+4151 13 31 27 +41 51 48 17.1 3.80 0.74 7.75 cometary 0.3ESO577-G27 13 42 47 –19 34 54 . . . 28.5† 0.46† 7.57 . . . . . .J1355+4651 13 55 26 +46 51 51 19.3 2.20 0.79 7.63 cometary∗ 0.4J1414-0208 14 14 54 –02 08 23 18.0 8.47 0.72 7.28 cometary∗ 0.5SBS1415+437 14 17 01 +43 30 05 17.8 1.40 0.57 7.43 multi-knot∗ 0.8J1418+2102 14 18 51 +21 02 39 17.6 2.87 0.85 7.64‡ cometary 0.4J1422+5145 14 22 51 +51 45 16 20.2 2.01 0.73 7.41 symmetric∗ . . .J1423+2257 14 23 43 +22 57 29 17.9 2.36 0.66 7.72 symmetric . . .J1441+2914 14 41 58 +29 14 34 20.1 2.25 0.55 7.47 symmetric∗ . . .HS1442+4250 14 44 13 +42 37 44 15.9 20.04 1.00 7.54 cometary∗ 0.3J1509+3731 15 09 34 +37 31 46 17.3 2.87 0.75 7.85 cometary∗ 0.6KISSR666 15 15 42 +29 01 40 19.1 4.24 0.87 7.53 cometary∗ 0.4KISSR1013 16 16 39 +29 03 33 18.2 1.28 0.37 7.63 two-knot∗ . . .J1644+2734 16 44 03 +27 34 05 17.7 10.05 1.00 7.48 symmetric∗ . . .J1647+2105 16 47 11 +21 05 15 17.3 9.16 0.82 7.75 multi-knot . . .W1702+18 17 02 33 +18 03 06 18.4 1.57 0.56 7.63 symmetric∗ . . .HS1704+4332 17 05 45 +43 28 49 18.4 3.49 0.75 7.55 cometary∗ 0.5SagDIG 19 29 59 –17 40 41 . . . . . . . . . 7.44 . . . . . .J2053+0039 20 53 13 +00 39 15 19.4 6.48 0.83 7.33 two-knot∗ 0.4J2104-0035 21 04 55 –00 35 22 17.9 . . . . . . 7.05 cometary∗ 0.8J2105+0032 21 05 09 +00 32 23 19.0 0.43⋆ 0.47⋆ 7.42 cometary∗ 0.3J2120-0058 21 20 26 –00 58 27 18.8 1.02⋆ 0.74⋆ 7.65 symmetric∗ . . .HS2134+0400 21 36 59 +04 14 04 . . . . . . . . . 7.44 cometary∗ 0.2J2150+0033 21 50 32 +00 33 05 19.3 6.12 0.71 7.60 symmetric∗ . . .ESO 146-G14 22 13 00 –62 04 03 . . . 52.5† 1.06† 7.59 . . . . . .2dF171716 22 13 26 –25 26 43 . . . 5.55† 0.56† 7.54 . . . . . .PHL293B 22 30 37 –00 06 37 17.2 2.13⋆ 0.53⋆ 7.62 cometary∗ 0.42dF115901 22 37 02 –28 52 41 . . . 3.6† 0.75† 7.57 . . . . . .J2238+1400 22 38 31 +14 00 30 19.0 3.00 0.80 7.45 two-knot 0.1J2250+0000 22 50 59 +00 00 33 19.8 1.71 0.57 7.61 symmetric∗ . . .J2259+1413 22 59 01 +14 13 43 19.1 4.03 0.85 7.37 cometary∗ 0.5J2302+0049 23 02 10 +00 49 39 18.8 2.19 0.66 7.71 two-knot . . .J2354-0005 23 54 37 –00 05 02 18.7 2.68⋆ 0.75⋆ 7.35 two-knot∗ 0.8
A18, page 24 of 30

M. E. Filho et al.: Extremely metal-poor galaxies: The H content
Table 4. The SDSS MPA-JHU data for the 140 XMP galaxies in the local Universe.
Name z ∆vBalmer ∆vforbidden log M⋆ log SFR
km s−1 km s−1 M⊙ M⊙ yr−1
(1) (2) (3) (4) (5) (6)
UGC 12894 . . . . . . . . . . . . . . .J0004+0025 0.0126 2.4 ± 1.2 –11.0 ± 1.9 7.72 ± 0.36 –2.96J0014-0044 0.0136 –5.0 ± 0.4 –6.4 ± 0.4 7.61 ± 0.31 –1.31J0015+0104 0.0069 –3.4 ± 1.3 –3.1 ± 2.3 7.46 ± 0.34 . . .J0016+0108 0.0104 –0.5 ± 1.0 –4.7 ± 1.7 7.64 ± 0.34 . . .HS0017+1055 . . . . . . . . . . . . . . .J0029-0108 0.0132 1.3 ± 1.9 8.0 ± 4.0 7.88 ± 0.38 . . .J0029-0025 0.0141 5.1 ± 1.7 –3.4 ± 2.5 6.88 ± 0.30 . . .ESO 473-G024 . . . . . . . . . . . . . . .J0036+0052 0.0282 –1.2 ± 0.3 –5.1 ± 0.3 8.36 ± 0.33 –1.02AndromedaIV . . . . . . . . . . . . . . .J0057-0022 0.0094 –0.7 ± 0.8 –4.1 ± 1.0 7.46 ± 0.34 –2.45IC1613 . . . . . . . . . . . . . . .J0107+0001 0.0181 –5.4 ± 1.1 –5.0 ± 1.3 7.86 ± 0.33 –2.35AM0106-382 . . . . . . . . . . . . . . .J0113+0052 0.0038 1.1 ± 0.8 –1.9 ± 1.1 6.77 ± 0.32 . . .J0119-0935 0.0064 2.9 ± 0.3 –2.6 ± 0.3 6.06 ± 0.13 –2.14HS0122+0743 0.0097 9.3 ± 0.1 3.7 ± 0.2 6.39 ± 0.23 –1.17J0126-0038 0.0065 –0.1 ± 0.6 4.5 ± 1.2 7.63 ± 0.35 –2.93J0133+1342 0.0087 –6.6 ± 0.5 0.6 ± 0.4 6.60 ± 0.10 –1.39J0135-0023 0.0169 2.8 ± 1.1 –1.1 ± 2.0 8.16 ± 0.35 . . .UGCA20 . . . . . . . . . . . . . . .UM133 . . . . . . . . . . . . . . .J0158+0006 . . . . . . . . . . . . . . .HKK97L14 . . . . . . . . . . . . . . .J0204-1009 0.0063 1.9 ± 1.1 5.0 ± 2.1 7.20 ± 0.06 –1.54J0205-0949 . . . . . . . . . . . . . . .J0216+0115 0.0093 1.5 ± 1.0 –2.8 ± 1.3 8.20 ± 0.37 –2.71096632 . . . . . . . . . . . . . . .J0254+0035 0.0149 0.5 ± 1.2 0.5 ± 3.0 7.61 ± 0.33 . . .J0301-0059 0.0383 3.5 ± 1.0 –6.1 ± 1.3 8.96 ± 0.38 –0.05J0301-0052 0.0073 –8.4 ± 0.4 –10.2 ± 0.4 7.57 ± 0.33 –1.99J0303-0109 0.0304 0.5 ± 0.6 2.4 ± 0.6 8.33 ± 0.33 . . .J0313+0006 0.0292 –10.6 ± 0.8 –15.5 ± 0.4 7.67 ± 0.31 –1.02J0313+0010 0.0077 1.9 ± 1.0 –7.7 ± 1.8 7.57 ± 0.35 . . .J0315-0024 0.0226 –1.3 ± 1.1 0.2 ± 2.0 7.77 ± 0.34 . . .UGC 2684 . . . . . . . . . . . . . . .SBS 0335-052W . . . . . . . . . . . . . . .SBS 0335-052E . . . . . . . . . . . . . . .J0338+0013 0.0426 5.0 ± 0.4 3.4 ± 0.4 . . . . . .J0341-0026 0.0306 1.4 ± 0.7 –7.8 ± 1.1 8.38 ± 0.32 –1.92ESO358-G060 . . . . . . . . . . . . . . .G0405-3648 . . . . . . . . . . . . . . .J0519+0007 . . . . . . . . . . . . . . .Tol0618-402 . . . . . . . . . . . . . . .ESO 489-G56 . . . . . . . . . . . . . . .J0808+1728 0.0442 –2.0 ± 0.5 –3.0 ± 0.5 7.41 ± 0.07 –0.79J0812+4836 0.0017 0.6 ± 1.0 –4.4 ± 2.0 6.35 ± 0.05 –2.64UGC 4305 . . . . . . . . . . . . . . .J0825+1846 0.0380 –9.6 ± 0.3 –14.0 ± 0.3 7.35 ± 0.23 –0.22HS0822+03542 0.0025 –31.4 ± 0.3 –32.9 ± 0.2 6.04 ± 0.03 –1.99DD053 . . . . . . . . . . . . . . .UGC 4483 . . . . . . . . . . . . . . .HS0837+4717 0.0420 31.2 ± 0.3 28.3 ± 0.2 7.97 ± 0.24 0.55J0842+1033 0.0103 12.8 ± 0.3 13.8 ± 0.2 7.01 ± 0.08 –1.19HS0846+3522 . . . . . . . . . . . . . . .J0859+3923 . . . . . . . . . . . . . . .J0910+0711 . . . . . . . . . . . . . . .
Notes. Column 1: Source name. Column 2: Best-fit spectroscopic redshift, z = vz/c (heliocentric, optical convention). Column 3: Balmer emission-line velocity offset and error, measured relative to the best-fit radial velocity (vz). Column 4: Forbidden emission-line velocity offset and error,measured relative to the best-fit radial velocity (vz). Column 5: Logarithm of the stellar mass and 1σ error. Column 6: Logarithm of the star-formation rate.
A18, page 25 of 30

A&A 558, A18 (2013)
Table 4. continued.
Name z ∆vBalmer ∆vforbidden log M⋆ log SFR
km s−1 km s−1 M⊙ M⊙ yr−1
(1) (2) (3) (4) (5) (6)
J0911+3135 0.0025 –2.3 ± 0.8 –2.7 ± 1.5 6.14 ± 0.06 –2.73J0926+3343 0.0018 3.3 ± 4.0 18.0 ± 13.9 6.05 ± 0.07 –2.96IZw18 0.0024 12.9 ± 0.4 10.9 ± 0.7 6.43 ± 0.01 –1.74J0940+2935 0.0017 –0.6 ± 0.4 –1.8 ± 0.5 6.30 ± 0.15 –2.09J0942+3404 0.0225 5.0 ± 0.3 –1.7 ± 0.3 6.83 ± 0.11 –1.10CGCG007-025 0.0048 7.3 ± 0.2 12.0 ± 0.1 6.67 ± 0.16 –1.21SBS940+544 0.0054 0.3 ± 1.0 –4.2 ± 1.8 7.05 ± 0.05 –1.81CS0953-174 . . . . . . . . . . . . . . .J0956+2849 0.0017 –7.8 ± 1.3 –12.5 ± 3.3 6.73 ± 0.07 –1.89LeoA . . . . . . . . . . . . . . .SextansB . . . . . . . . . . . . . . .J1003+4504 0.0092 2.5 ± 0.3 –1.4 ± 0.2 7.03 ± 0.08 –1.17SextansA . . . . . . . . . . . . . . .KUG1013+381 0.0039 7.2 ± 0.3 9.4 ± 0.2 6.58 ± 1.00 –1.46SDSSJ1025+1402 0.1004 110.4 ± 3.0 67.4 ± 0.5 10.22 ± 0.14 1.57UGCA211 0.0028 1.2 ± 0.9 1.0 ± 1.4 7.18 ± 0.08 –2.20J1031+0434 0.0039 0.3 ± 0.5 –0.4 ± 0.4 6.61 ± 0.05 –1.53HS1033+4757 0.0052 –2.7 ± 0.4 –5.7 ± 0.4 7.08 ± 0.05 –1.89J1044+0353 0.0129 2.8 ± 0.2 3.7 ± 0.2 6.80 ± 0.24 –0.85HS1059+3934 . . . . . . . . . . . . . . .J1105+6022 0.0044 –1.5 ± 0.3 –2.7 ± 0.3 6.96 ± 0.08 –1.53J1119+5130 0.0045 –2.9 ± 0.3 –5.2 ± 0.3 6.48 ± 0.17 –1.75J1121+0324 0.0038 –0.3 ± 0.4 –6.2 ± 0.5 6.19 ± 0.16 –2.10UGC6456 . . . . . . . . . . . . . . .SBS1129+576 . . . . . . . . . . . . . . .J1145+5018 0.0056 –0.4 ± 0.4 –6.0 ± 0.3 6.71 ± 0.07 –1.90J1151-0222 0.0035 3.1 ± 0.3 –2.7 ± 0.2 6.65 ± 1.00 –1.88J1157+5638 0.0014 –6.8 ± 0.3 –7.5 ± 0.4 . . . –2.60J1201+0211 0.0032 –2.0 ± 0.3 –2.0 ± 0.3 6.09 ± 0.11 –1.99SBS1159+545 . . . . . . . . . . . . . . .SBS1211+540 0.0031 –14.9 ± 0.3 –14.6 ± 0.3 6.02 ± 0.08 –1.94J1215+5223 0.0005 –6.0 ± 0.4 –5.0 ± 0.4 6.01 ± 0.01 –2.82Tol1214-277 . . . . . . . . . . . . . . .VCC0428 0.0027 –0.9 ± 0.4 –1.9 ± 0.4 6.20 ± 0.05 –1.92HS1222+3741 0.0404 5.6 ± 0.3 5.5 ± 0.2 7.86 ± 0.14 –0.09Tol65 . . . . . . . . . . . . . . .J1230+1202 0.0042 4.6 ± 0.3 7.3 ± 0.2 6.56 ± 0.05 –1.69KISSR85 . . . . . . . . . . . . . . .UGCA292 . . . . . . . . . . . . . . .HS1236+3937 . . . . . . . . . . . . . . .J1239+1456 . . . . . . . . . . . . . . .SBS1249+493 . . . . . . . . . . . . . . .J1255-0213 0.0519 –8.2 ± 0.4 –11.0 ± 0.5 7.67 ± 0.22 –0.68GR8 0.0007 0.4 ± 0.6 –7.2 ± 1.1 6.02 ± 0.04 –3.16KISSR1490 . . . . . . . . . . . . . . .DD0167 . . . . . . . . . . . . . . .HS1319+3224 . . . . . . . . . . . . . . .J1323-0132 0.0225 –2.9 ± 0.2 –5.9 ± 0.2 7.04 ± 0.24 –0.73J1327+4022 0.0105 –4.2 ± 0.4 –6.6 ± 0.4 6.27 ± 0.13 –1.70J1331+4151 0.0117 –4.9 ± 0.2 –9.0 ± 0.2 7.16 ± 0.08 –0.89ESO577-G27 . . . . . . . . . . . . . . .J1355+4651 0.0281 3.8 ± 1.0 –1.7 ± 0.6 6.90 ± 0.21 –1.42J1414-0208 0.0052 0.4 ± 0.7 –1.1 ± 1.3 6.61 ± 0.12 –1.87SBS1415+437 . . . . . . . . . . . . . . .J1418+2102 0.0085 15.8 ± 0.2 19.8 ± 0.2 6.63 ± 0.15 –1.16J1422+5145 . . . . . . . . . . . . . . .J1423+2257 0.0328 –3.6 ± 0.3 –2.3 ± 0.3 7.65 ± 0.11 –0.19J1441+2914 . . . . . . . . . . . . . . .HS1442+4250 0.0021 –0.8 ± 0.6 –2.5 ± 0.7 6.52 ± 0.07 –2.08J1509+3731 0.0325 10.4 ± 0.3 14.2 ± 0.2 7.78 ± 0.18 0.33KISSR666 . . . . . . . . . . . . . . .
A18, page 26 of 30

M. E. Filho et al.: Extremely metal-poor galaxies: The H content
Table 4. continued.
Name z ∆vBalmer ∆vforbidden log M⋆ log SFR
km s−1 km s−1 M⊙ M⊙ yr−1
(1) (2) (3) (4) (5) (6)
KISSR1013 0.0249 3.1 ± 0.6 4.4 ± 0.5 8.41 ± 0.07 –0.93J1644+2734 0.0232 –28.6 ± 1.9 –140.9 ± 14.0 8.87 ± 0.08 –0.94J1647+2105 . . . . . . . . . . . . . . .W1702+18 . . . . . . . . . . . . . . .HS1704+4332 . . . . . . . . . . . . . . .SagDIG . . . . . . . . . . . . . . .J2053+0039 0.0131 3.7 ± 1.9 –1.5 ± 2.5 7.26 ± 0.10 –1.73J2104-0035 0.0046 –0.2 ± 0.6 1.0 ± 1.8 6.19 ± 0.05 –2.01J2105+0032 0.0142 –0.2 ± 0.9 –7.0 ± 1.2 7.23 ± 1.00 –1.63J2120-0058 0.0197 –0.4 ± 0.3 1.2 ± 0.4 7.43 ± 0.09 –1.15HS2134+0400 . . . . . . . . . . . . . . .J2150+0033 0.0149 0.4 ± 0.9 –2.1 ± 1.5 7.90 ± 0.34 . . .ESO 146-G14 . . . . . . . . . . . . . . .2dF171716 . . . . . . . . . . . . . . .PHL293B 0.0053 16.0 ± 0.3 15.2 ± 0.2 6.69 ± 0.06 –1.522dF115901 . . . . . . . . . . . . . . .J2238+1400 0.0206 8.6 ± 0.2 6.2 ± 0.2 6.72 ± 0.24 –0.77J2250+0000 0.0808 –8.8 ± 0.3 –11.9 ± 0.3 . . . 3.88J2259+1413 0.0939 8.5 ± 5.8 –20.2 ± 20.3 10.43 ± 1.00 –0.35J2302+0049 0.0331 –7.7 ± 0.3 –8.8 ± 0.3 8.39 ± 0.33 –0.56J2354-0005 0.0077 0.6 ± 1.9 –7.0 ± 3.9 7.33 ± 0.34 . . .
A18, page 27 of 30

A&A 558, A18 (2013)
Table 5. Global galaxy parameters for the 140 XMP galaxies in the local Universe.
Name vz vH ∆vH vBalmer vforbid D log Mdyn log MH log M⋆ log M⋆/Lgkm s−1 km s−1 km s−1 km s−1 km s−1 Mpc M⊙ M⊙ M⊙ M⊙/L⊙
(1) (2) (3) (4) (5) (6) (7) (8) (9) (10) (11)
UGC 12894 . . . 335.00 . . . . . . . . . 8.36 8.34 8.05 . . . . . .J0004+0025 3786.00 . . . . . . 3783.58 3797.03 52.30 . . . . . . 7.72 2.04J0014-0044 4077.00 . . . . . . 4081.96 4083.42 56.70 . . . . . . 7.61 1.58J0015+0104 2058.00 2050.02 7.98 2061.42 2058.00 28.80 8.46 8.47 7.46 1.86J0016+0108 3111.00 . . . . . . 3111.00 3115.66 42.80 . . . . . . 7.64 1.94HS0017+1055 . . . 5630.00 . . . . . . . . . 78.10 . . . . . . . . . . . .J0029-0108 3948.00 . . . . . . 3948.00 3939.95 53.90 . . . . . . 7.88 2.10J0029-0025 4236.00 . . . . . . 4230.90 4236.00 59.10 . . . . . . 6.88 1.50ESO 473-G024 . . . 542.00 . . . . . . . . . 7.15 8.32 7.84 . . . . . .J0036+0052 8469.00 . . . . . . 8470.20 8474.05 118.50 . . . . . . 8.36 1.73AndromedaIV . . . 237.00 . . . . . . . . . 6.30 9.17 8.26 . . . . . .J0057-0022 2811.00 . . . . . . 2811.00 2815.08 39.20 . . . . . . 7.46 1.91IC1613 . . . 234.00 . . . . . . . . . 0.74 8.21 7.45 . . . . . .J0107+0001 5439.00 . . . . . . 5444.38 5443.97 74.90 . . . . . . 7.86 1.87AM0106-382 . . . . . . . . . . . . . . . 7.50 . . . . . . . . . . . .J0113+0052 1143.00 1155.61 –12.61 1143.00 1143.00 15.80 7.71 8.53 6.77 2.41J0119-0935 1914.00 1932.00 –18.00 1911.15 1916.58 24.80 . . . 8.14 6.06 1.07HS0122+0743 2925.00 2926.00 –1.00 2915.68 2921.30 40.30 8.98 9.33 6.39 –0.54J0126-0038 1941.00 1904.70 36.30 1941.00 1936.53 25.80 8.24 8.63 7.63 2.17J0133+1342 2601.00 2580.00 21.00 2607.57 2601.00 36.10 8.27 7.49 6.60 0.72J0135-0023 5070.00 . . . . . . 5067.24 507. . . 69.50 . . . . . . 8.16 2.04UGCA20 . . . 498.00 . . . . . . . . . 8.63 9.25 8.30 . . . . . .UM133 . . . 1621.00 . . . . . . . . . 22.40 . . . 8.64 . . . . . .J0158+0006 . . . . . . . . . . . . . . . . . . . . . . . . . . . . . .HKK97L14 . . . . . . . . . . . . . . . 4.81 8.80 6.52 . . . . . .J0204-1009 1902.00 1907.72 –5.72 1902.00 1897.01 25.20 9.43 9.17 7.20 1.24J0205-0949 . . . 1885.00 . . . . . . . . . 25.30 9.76 9.29 . . . . . .J0216+0115 2802.00 . . . . . . 2802.00 2804.84 38.70 . . . . . . 8.20 1.98096632 . . . . . . . . . . . . . . . 12.90 . . . . . . . . . . . .J0254+0035 4458.00 . . . . . . 4458.00 4458.00 59.90 . . . . . . 7.61 1.98J0301-0059 11 484.00 . . . . . . 11 480.46 11 490.10 155.60 . . . . . . 8.96 3.18J0301-0052 2196.00 2094.29 101.71 2204.43 2206.18 29.00 8.87 8.62 7.57 2.17J0303-0109 9120.00 . . . . . . 9120.00 9117.65 124.00 . . . . . . 8.33 2.06J0313+0006 8748.00 . . . . . . 8758.57 8763.53 122.50 . . . . . . 7.67 1.17J0313+0010 2322.00 . . . . . . 2322.00 2329.65 31.10 . . . . . . 7.57 2.14J0315-0024 6774.00 6787.09 –13.09 6774.00 6774.00 90.90 8.98 9.40 7.77 1.93UGC 2684 . . . 350.00 . . . . . . . . . 5.95 7.88 7.94 . . . . . .SBS 0335-052W . . . 4014.70 . . . . . . . . . 53.80 8.54 8.77 . . . . . .SBS 0335-052E . . . 4053.60 . . . . . . . . . 54.00 8.88 8.62 . . . . . .J0338+0013 12 795.00 . . . . . . 12 790.03 12 791.60 173.60 . . . . . . . . . . . .J0341-0026 9186.00 . . . . . . 9186.00 9193.79 123.50 . . . . . . 8.38 1.72ESO358-G060 . . . 808.00 . . . . . . . . . 8.90 9.10 8.30 . . . . . .G0405-3648 . . . . . . . . . . . . . . . 9.00 . . . . . . . . . . . .J0519+0007 . . . . . . . . . . . . . . . 180.40 . . . . . . . . . . . .Tol0618-402 . . . . . . . . . . . . . . . 140.0 . . . . . . . . . . . .ESO 489-G56 . . . 492.30 . . . . . . . . . 4.23 7.65 6.95 . . . . . .J0808+1728 13 263.00 . . . . . . 13 265.01 13 266.03 181.40 . . . . . . 7.41 0.57J0812+4836 525.00 . . . . . . 525.00 529.39 9.44 . . . . . . 6.35 0.80UGC 4305 . . . 157.10 . . . . . . . . . 4.89 9.46 9.09 . . . . . .J0825+1846 11 388.00 . . . . . . 11 397.62 11 401.95 156.10 . . . . . . 7.35 0.56HS0822+03542 750.00 726.60 23.40 781.37 782.90 11.72 7.31 6.94 6.04 1.02DD053 . . . 19.20 . . . . . . . . . 2.42 7.87 7.47 . . . . . .UGC 4483 . . . . . . . . . . . . . . . 5.00 . . . 7.88 . . . . . .HS0837+4717 12 588.00 . . . . . . 12 556.84 12 559.68 174.30 . . . . . . 7.97 0.53
Notes. Column 1: Source name. Column 2: Best-fit radial velocity (vz = cz; heliocentric, optical convention). Column 3: H gas radial veloc-ity (heliocentric, optical convention). Column 4: H gas velocity offset relative to the best-fit radial velocity. Column 5: Radial velocity for theBalmer emission lines (heliocentric, optical convention). Column 6: Radial velocity for the forbidden emission lines (heliocentric, optical con-vention). Column 7: Hubble flow distance corrected for Virgocentric infall, from NED. Column 8: Logarithm of the dynamical mass, estimated
as Mdyn/M⊙ = 2.3 × 10⁵(
w502
)2rH , where w50 is the (uncorrected) H line width (Tables 1 and 2) in km s−1 and rH is the H radius (Table 1),
assumed to be 3× ropt (Table 3) in pc. Column 9: Logarithm of the H mass, estimated as MH /M⊙ = 2.36× 10⁵D2S H , where S H is the integratedline flux density (Tables 1 and 2) in Jy km s−1 and D is the Hubble flow distance corrected for Virgocentric infall in Mpc. Column 10: Logarithmof the stellar mass (Table 4). Column 11: Logarithm of the stellar M/L ratio in the g-band.
A18, page 28 of 30
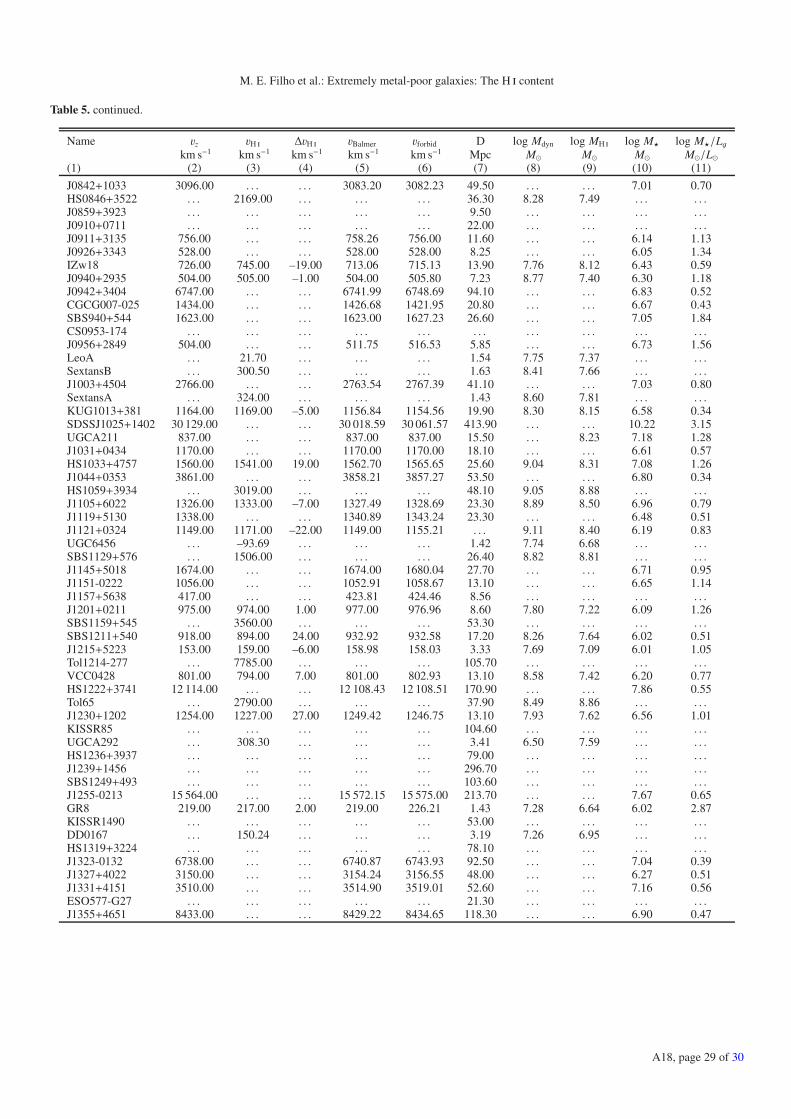
M. E. Filho et al.: Extremely metal-poor galaxies: The H content
Table 5. continued.
Name vz vH ∆vH vBalmer vforbid D log Mdyn log MH log M⋆ log M⋆/Lgkm s−1 km s−1 km s−1 km s−1 km s−1 Mpc M⊙ M⊙ M⊙ M⊙/L⊙
(1) (2) (3) (4) (5) (6) (7) (8) (9) (10) (11)
J0842+1033 3096.00 . . . . . . 3083.20 3082.23 49.50 . . . . . . 7.01 0.70HS0846+3522 . . . 2169.00 . . . . . . . . . 36.30 8.28 7.49 . . . . . .J0859+3923 . . . . . . . . . . . . . . . 9.50 . . . . . . . . . . . .J0910+0711 . . . . . . . . . . . . . . . 22.00 . . . . . . . . . . . .J0911+3135 756.00 . . . . . . 758.26 756.00 11.60 . . . . . . 6.14 1.13J0926+3343 528.00 . . . . . . 528.00 528.00 8.25 . . . . . . 6.05 1.34IZw18 726.00 745.00 –19.00 713.06 715.13 13.90 7.76 8.12 6.43 0.59J0940+2935 504.00 505.00 –1.00 504.00 505.80 7.23 8.77 7.40 6.30 1.18J0942+3404 6747.00 . . . . . . 6741.99 6748.69 94.10 . . . . . . 6.83 0.52CGCG007-025 1434.00 . . . . . . 1426.68 1421.95 20.80 . . . . . . 6.67 0.43SBS940+544 1623.00 . . . . . . 1623.00 1627.23 26.60 . . . . . . 7.05 1.84CS0953-174 . . . . . . . . . . . . . . . . . . . . . . . . . . . . . .J0956+2849 504.00 . . . . . . 511.75 516.53 5.85 . . . . . . 6.73 1.56LeoA . . . 21.70 . . . . . . . . . 1.54 7.75 7.37 . . . . . .SextansB . . . 300.50 . . . . . . . . . 1.63 8.41 7.66 . . . . . .J1003+4504 2766.00 . . . . . . 2763.54 2767.39 41.10 . . . . . . 7.03 0.80SextansA . . . 324.00 . . . . . . . . . 1.43 8.60 7.81 . . . . . .KUG1013+381 1164.00 1169.00 –5.00 1156.84 1154.56 19.90 8.30 8.15 6.58 0.34SDSSJ1025+1402 30 129.00 . . . . . . 30 018.59 30 061.57 413.90 . . . . . . 10.22 3.15UGCA211 837.00 . . . . . . 837.00 837.00 15.50 . . . 8.23 7.18 1.28J1031+0434 1170.00 . . . . . . 1170.00 1170.00 18.10 . . . . . . 6.61 0.57HS1033+4757 1560.00 1541.00 19.00 1562.70 1565.65 25.60 9.04 8.31 7.08 1.26J1044+0353 3861.00 . . . . . . 3858.21 3857.27 53.50 . . . . . . 6.80 0.34HS1059+3934 . . . 3019.00 . . . . . . . . . 48.10 9.05 8.88 . . . . . .J1105+6022 1326.00 1333.00 –7.00 1327.49 1328.69 23.30 8.89 8.50 6.96 0.79J1119+5130 1338.00 . . . . . . 1340.89 1343.24 23.30 . . . . . . 6.48 0.51J1121+0324 1149.00 1171.00 –22.00 1149.00 1155.21 . . . 9.11 8.40 6.19 0.83UGC6456 . . . –93.69 . . . . . . . . . 1.42 7.74 6.68 . . . . . .SBS1129+576 . . . 1506.00 . . . . . . . . . 26.40 8.82 8.81 . . . . . .J1145+5018 1674.00 . . . . . . 1674.00 1680.04 27.70 . . . . . . 6.71 0.95J1151-0222 1056.00 . . . . . . 1052.91 1058.67 13.10 . . . . . . 6.65 1.14J1157+5638 417.00 . . . . . . 423.81 424.46 8.56 . . . . . . . . . . . .J1201+0211 975.00 974.00 1.00 977.00 976.96 8.60 7.80 7.22 6.09 1.26SBS1159+545 . . . 3560.00 . . . . . . . . . 53.30 . . . . . . . . . . . .SBS1211+540 918.00 894.00 24.00 932.92 932.58 17.20 8.26 7.64 6.02 0.51J1215+5223 153.00 159.00 –6.00 158.98 158.03 3.33 7.69 7.09 6.01 1.05Tol1214-277 . . . 7785.00 . . . . . . . . . 105.70 . . . . . . . . . . . .VCC0428 801.00 794.00 7.00 801.00 802.93 13.10 8.58 7.42 6.20 0.77HS1222+3741 12 114.00 . . . . . . 12 108.43 12 108.51 170.90 . . . . . . 7.86 0.55Tol65 . . . 2790.00 . . . . . . . . . 37.90 8.49 8.86 . . . . . .J1230+1202 1254.00 1227.00 27.00 1249.42 1246.75 13.10 7.93 7.62 6.56 1.01KISSR85 . . . . . . . . . . . . . . . 104.60 . . . . . . . . . . . .UGCA292 . . . 308.30 . . . . . . . . . 3.41 6.50 7.59 . . . . . .HS1236+3937 . . . . . . . . . . . . . . . 79.00 . . . . . . . . . . . .J1239+1456 . . . . . . . . . . . . . . . 296.70 . . . . . . . . . . . .SBS1249+493 . . . . . . . . . . . . . . . 103.60 . . . . . . . . . . . .J1255-0213 15 564.00 . . . . . . 15 572.15 15 575.00 213.70 . . . . . . 7.67 0.65GR8 219.00 217.00 2.00 219.00 226.21 1.43 7.28 6.64 6.02 2.87KISSR1490 . . . . . . . . . . . . . . . 53.00 . . . . . . . . . . . .DD0167 . . . 150.24 . . . . . . . . . 3.19 7.26 6.95 . . . . . .HS1319+3224 . . . . . . . . . . . . . . . 78.10 . . . . . . . . . . . .J1323-0132 6738.00 . . . . . . 6740.87 6743.93 92.50 . . . . . . 7.04 0.39J1327+4022 3150.00 . . . . . . 3154.24 3156.55 48.00 . . . . . . 6.27 0.51J1331+4151 3510.00 . . . . . . 3514.90 3519.01 52.60 . . . . . . 7.16 0.56ESO577-G27 . . . . . . . . . . . . . . . 21.30 . . . . . . . . . . . .J1355+4651 8433.00 . . . . . . 8429.22 8434.65 118.30 . . . . . . 6.90 0.47
A18, page 29 of 30

A&A 558, A18 (2013)
Table 5. continued.
Name vz vH ∆vH vBalmer vforbid D log Mdyn log MH log M⋆ log M⋆/Lgkm s−1 km s−1 km s−1 km s−1 km s−1 Mpc M⊙ M⊙ M⊙ M⊙/L⊙
(1) (2) (3) (4) (5) (6) (7) (8) (9) (10) (11)
J1414-0208 1548.00 . . . . . . 1548.00 1548.00 24.90 . . . . . . 6.61 1.02SBS1415+437 . . . 605.00 . . . . . . . . . 11.66 7.52 8.24 . . . . . .J1418+2102 2565.00 . . . . . . 2549.16 2545.19 35.30 . . . . . . 6.63 0.57J1422+5145 . . . . . . . . . . . . . . . 163.70 . . . . . . . . . . . .J1423+2257 9855.00 . . . . . . . . . 9857.29 138.00 . . . . . . 7.65 0.53J1441+2914 . . . . . . . . . . . . . . . 191.60 . . . . . . . . . . . .HS1442+4250 639.00 647.00 –8.00 639.00 641.47 12.58 9.39 8.42 6.52 0.68J1509+3731 9765.00 . . . . . . 9754.56 9750.79 137.90 . . . . . . 7.78 0.42KISSR666 . . . . . . . . . . . . . . . 139.90 . . . . . . . . . . . .KISSR1013 7467.00 . . . . . . 7463.94 7462.61 106.30 . . . . . . 8.41 1.64J1644+2734 6966.00 . . . . . . 6994.60 7106.91 98.20 . . . . . . 8.87 1.97J1647+2105 . . . . . . . . . . . . . . . 41.90 . . . . . . . . . . . .W1702+18 . . . . . . . . . . . . . . . . . . . . . . . . . . . . . .HS1704+4332 . . . 2082.00 . . . . . . . . . 33.60 8.03 7.81 . . . . . .SagDIG . . . –78.50 . . . . . . . . . 1.02 . . . 6.75 . . . . . .J2053+0039 3936.00 3971.79 –35.79 3936.00 3936.00 56.40 8.93 9.08 7.26 1.52J2104-0035 1395.00 1422.81 –27.81 1395.00 1395.00 20.30 . . . 8.16 6.19 0.74J2105+0032 4266.00 . . . . . . 4266.00 4272.96 60.50 . . . . . . 7.23 1.27J2120-0058 5904.00 . . . . . . 5904.00 5902.77 82.70 . . . . . . 7.43 1.11HS2134+0400 . . . 5090.00 . . . . . . . . . 71.10 . . . 8.16 . . . . . .J2150+0033 4482.00 4457.28 24.72 4482.00 4482.00 63.30 9.13 9.02 7.90 2.02ESO 146-G14 . . . 1691.10 . . . . . . . . . 21.30 10.27 8.95 . . . . . .2dF171716 . . . . . . . . . . . . . . . 44.30 . . . . . . . . . . . .PHL293B 1581.00 1606.38 –25.38 1565.04 1565.81 22.70 7.99 7.93 6.69 0.862dF115901 . . . . . . . . . . . . . . . 162.90 . . . . . . . . . . . .J2238+1400 6183.00 6160.00 23.00 6174.38 6176.85 86.10 8.73 . . . 6.72 0.45J2250+0000 24 237.00 . . . . . . 24 245.75 24 248.88 332.20 . . . . . . . . . . . .J2259+1413 28 158.00 . . . . . . 28 158.00 28 158.00 123.60 . . . . . . 10.43 3.89J2302+0049 9936.00 . . . . . . 9943.73 9944.84 136.20 . . . . . . 8.39 1.64J2354-0005 2322.00 . . . . . . 2322.00 2322.00 32.20 . . . . . . 7.33 1.79
A18, page 30 of 30