Walter Leal Filho · Jelena Barbir Richard Preziosi Editors
406
Climate Change Management Walter Leal Filho · Jelena Barbir Richard Preziosi Editors Handbook of Climate Change and Biodiversity
-
Upload
khangminh22 -
Category
Documents
-
view
1 -
download
0
Transcript of Walter Leal Filho · Jelena Barbir Richard Preziosi Editors

Climate Change Management
Walter Leal Filho · Jelena Barbir Richard Preziosi Editors
Handbook of Climate Change and Biodiversity

Climate Change Management
Series editor
Walter Leal Filho, Faculty of Life Sciences, Research and Transfer Centre“Sustainable Development and Climate Change Management”, HamburgUniversity of Applied Sciences, Hamburg, Germany

More information about this series at http://www.springer.com/series/8740

Walter Leal Filho • Jelena BarbirRichard PreziosiEditors
Handbook of Climate Changeand Biodiversity
123

EditorsWalter Leal FilhoFaculty of Life Sciences, Research andTransfer Centre “SustainableDevelopment and Climate ChangeManagement”
Hamburg University of Applied SciencesHamburg, Germany
Jelena BarbirInternational Climate Change Informationand Research Programme
Hamburg, Germany
Richard PreziosiSchool of Science and the EnvironmentManchester Metropolitan UniversityManchester, UK
ISSN 1610-2002 ISSN 1610-2010 (electronic)Climate Change ManagementISBN 978-3-319-98680-7 ISBN 978-3-319-98681-4 (eBook)https://doi.org/10.1007/978-3-319-98681-4
Library of Congress Control Number: 2018950933
© Springer Nature Switzerland AG 2019This work is subject to copyright. All rights are reserved by the Publisher, whether the whole or partof the material is concerned, specifically the rights of translation, reprinting, reuse of illustrations,recitation, broadcasting, reproduction on microfilms or in any other physical way, and transmissionor information storage and retrieval, electronic adaptation, computer software, or by similar or dissimilarmethodology now known or hereafter developed.The use of general descriptive names, registered names, trademarks, service marks, etc. in thispublication does not imply, even in the absence of a specific statement, that such names are exempt fromthe relevant protective laws and regulations and therefore free for general use.The publisher, the authors and the editors are safe to assume that the advice and information in thisbook are believed to be true and accurate at the date of publication. Neither the publisher nor theauthors or the editors give a warranty, express or implied, with respect to the material contained herein orfor any errors or omissions that may have been made. The publisher remains neutral with regard tojurisdictional claims in published maps and institutional affiliations.
This Springer imprint is published by the registered company Springer Nature Switzerland AGThe registered company address is: Gewerbestrasse 11, 6330 Cham, Switzerland
Preface
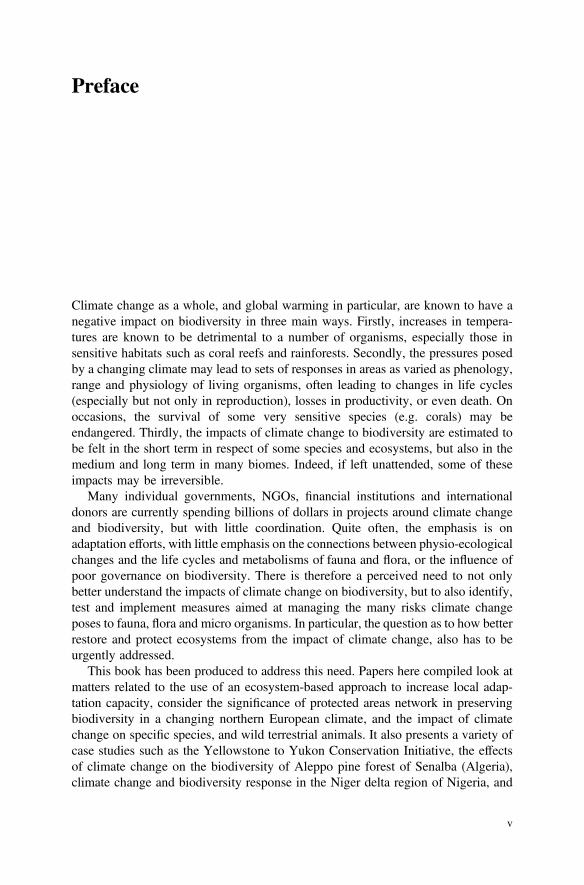
Climate change as a whole, and global warming in particular, are known to have anegative impact on biodiversity in three main ways. Firstly, increases in tempera-tures are known to be detrimental to a number of organisms, especially those insensitive habitats such as coral reefs and rainforests. Secondly, the pressures posedby a changing climate may lead to sets of responses in areas as varied as phenology,range and physiology of living organisms, often leading to changes in life cycles(especially but not only in reproduction), losses in productivity, or even death. Onoccasions, the survival of some very sensitive species (e.g. corals) may beendangered. Thirdly, the impacts of climate change to biodiversity are estimated tobe felt in the short term in respect of some species and ecosystems, but also in themedium and long term in many biomes. Indeed, if left unattended, some of theseimpacts may be irreversible.
Many individual governments, NGOs, financial institutions and internationaldonors are currently spending billions of dollars in projects around climate changeand biodiversity, but with little coordination. Quite often, the emphasis is onadaptation efforts, with little emphasis on the connections between physio-ecologicalchanges and the life cycles and metabolisms of fauna and flora, or the influence ofpoor governance on biodiversity. There is therefore a perceived need to not onlybetter understand the impacts of climate change on biodiversity, but to also identify,test and implement measures aimed at managing the many risks climate changeposes to fauna, flora and micro organisms. In particular, the question as to how betterrestore and protect ecosystems from the impact of climate change, also has to beurgently addressed.
This book has been produced to address this need. Papers here compiled look atmatters related to the use of an ecosystem-based approach to increase local adap-tation capacity, consider the significance of protected areas network in preservingbiodiversity in a changing northern European climate, and the impact of climatechange on specific species, and wild terrestrial animals. It also presents a variety ofcase studies such as the Yellowstone to Yukon Conservation Initiative, the effectsof climate change on the biodiversity of Aleppo pine forest of Senalba (Algeria),climate change and biodiversity response in the Niger delta region of Nigeria, and
v

the impact of forest fires on the biodiversity and the soil characteristics of tropicalpeatlands in Indonesia. Moreover the book also entails contributions on how topromote the climate agenda and biodiversity conservation at the local level.
It is a truly interdisciplinary publication, and we hope it will be useful toscholars, social movements, practitioners and members of governmental agencies,undertaking research and/or executing projects on climate change and biodiversityacross the world.
Hamburg, Germany Walter Leal FilhoHamburg, Germany Jelena BarbirManchester, UK Richard PreziosiWinter 2018/2019
vi Preface

Contents
Water Management and Climate Change in the Focus of InternationalMaster Programs in Latin America and the Carribian . . . . . . . . . . . . . 1Frido Reinstorf, Petra Schneider, Raymundo Rodriguez Tejeda,Leslie Santos Roque, Henrietta Hampel and Raul F. Vazquez
Mangrove Conservation Policies in the Gulf of Guayaquil . . . . . . . . . . . 25Daniel Ortega-Pacheco, Maria J. Mendoza-Jimenez and Paul Herrera
Biodiversity Issues Should Be Better Taken into Accountin the Energy Transition . . . . . . . . . . . . . . . . . . . . . . . . . . . . . . . . . . . . 45Agnès Hallosserie, Hélène Soubelet, Hélène Leriche, Patricia Savinand Jean-François Silvain
Approaches to Ecosystem Services and Biodiversity Assessmentin Belarus . . . . . . . . . . . . . . . . . . . . . . . . . . . . . . . . . . . . . . . . . . . . . . . . 61Siarhei Zenchanka and Nikolai Gorbatchev
Community Action for Biodiversity and Forest Conservationand Adaptation to Climate Change in the Wild CoffeeForests (CAFA) . . . . . . . . . . . . . . . . . . . . . . . . . . . . . . . . . . . . . . . . . . . 79Svane Bender and Mesfin Tekle
Impact of Climate Change on Sawfly (Suborder: Symphyta)Polinators in Andalusia Region, Spain . . . . . . . . . . . . . . . . . . . . . . . . . . 93Jelena Barbir, Luis Oscar Aguado Martín and Xavier Rodriguez Lloveras
Coffee, Climate and Biodiversity: Understanding the Carbon Stocksof the Shade Coffee Production System of India . . . . . . . . . . . . . . . . . . 113Nadesa Panicker Anil Kumar, Amsad Ibrahim Khan Saleem Khanand Vaniyan Balakrishnan
Implications for Biodiversity of Potentially Committed GlobalClimate Change (from Science and Policy) . . . . . . . . . . . . . . . . . . . . . . . 135Peter D. Carter
vii
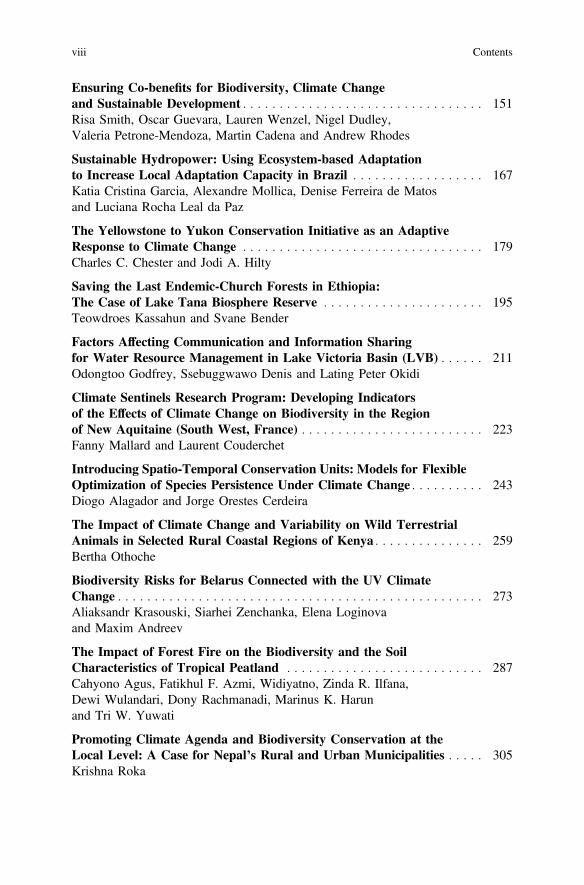
Ensuring Co-benefits for Biodiversity, Climate Changeand Sustainable Development . . . . . . . . . . . . . . . . . . . . . . . . . . . . . . . . . 151Risa Smith, Oscar Guevara, Lauren Wenzel, Nigel Dudley,Valeria Petrone-Mendoza, Martin Cadena and Andrew Rhodes
Sustainable Hydropower: Using Ecosystem-based Adaptationto Increase Local Adaptation Capacity in Brazil . . . . . . . . . . . . . . . . . . 167Katia Cristina Garcia, Alexandre Mollica, Denise Ferreira de Matosand Luciana Rocha Leal da Paz
The Yellowstone to Yukon Conservation Initiative as an AdaptiveResponse to Climate Change . . . . . . . . . . . . . . . . . . . . . . . . . . . . . . . . . 179Charles C. Chester and Jodi A. Hilty
Saving the Last Endemic-Church Forests in Ethiopia:The Case of Lake Tana Biosphere Reserve . . . . . . . . . . . . . . . . . . . . . . 195Teowdroes Kassahun and Svane Bender
Factors Affecting Communication and Information Sharingfor Water Resource Management in Lake Victoria Basin (LVB) . . . . . . 211Odongtoo Godfrey, Ssebuggwawo Denis and Lating Peter Okidi
Climate Sentinels Research Program: Developing Indicatorsof the Effects of Climate Change on Biodiversity in the Regionof New Aquitaine (South West, France) . . . . . . . . . . . . . . . . . . . . . . . . . 223Fanny Mallard and Laurent Couderchet
Introducing Spatio-Temporal Conservation Units: Models for FlexibleOptimization of Species Persistence Under Climate Change . . . . . . . . . . 243Diogo Alagador and Jorge Orestes Cerdeira
The Impact of Climate Change and Variability on Wild TerrestrialAnimals in Selected Rural Coastal Regions of Kenya . . . . . . . . . . . . . . . 259Bertha Othoche
Biodiversity Risks for Belarus Connected with the UV ClimateChange . . . . . . . . . . . . . . . . . . . . . . . . . . . . . . . . . . . . . . . . . . . . . . . . . . 273Aliaksandr Krasouski, Siarhei Zenchanka, Elena Loginovaand Maxim Andreev
The Impact of Forest Fire on the Biodiversity and the SoilCharacteristics of Tropical Peatland . . . . . . . . . . . . . . . . . . . . . . . . . . . 287Cahyono Agus, Fatikhul F. Azmi, Widiyatno, Zinda R. Ilfana,Dewi Wulandari, Dony Rachmanadi, Marinus K. Harunand Tri W. Yuwati
Promoting Climate Agenda and Biodiversity Conservation at theLocal Level: A Case for Nepal’s Rural and Urban Municipalities . . . . . 305Krishna Roka
viii Contents

Climate and Biological Diversity: How Should the Effects of ClimateChange on Biological Diversity Be Legally Addressed in Internationaland Comparative Law and Solutions? . . . . . . . . . . . . . . . . . . . . . . . . . . 325Sergio Peña-Neira
Is Adaptation to Climate Change Threatening Forest Biodiversity?A Comparative and Interdisciplinary Study Case of TwoFrench Forests . . . . . . . . . . . . . . . . . . . . . . . . . . . . . . . . . . . . . . . . . . . . 337Timothée Fouqueray, Antoine Charpentier, Michel Trommetterand Nathalie Frascaria-Lacoste
Hypotheses from Recent Assessments of Climate Impactsto Biodiversity and Ecosystems in the United States . . . . . . . . . . . . . . . 355Shawn L. Carter, Abigail J. Lynch, Bonnie J. E. Myers,Madeleine A. Rubenstein and Laura M. Thompson
Significance of Protected Area Network in Preserving Biodiversityin a Changing Northern European Climate . . . . . . . . . . . . . . . . . . . . . . 377Raimo Virkkala, Risto K. Heikkinen, Saija Kuusela, Niko Leikolaand Juha Pöyry
Wild Power, Biodiversity and Solar Farms: A Business Model toEncourage Climate Change Mitigation and Adaptation at Scale . . . . . . 391David Gazdag and Guy Parker
Handling the Impacts of Climate Change on Biodiversity . . . . . . . . . . . 403Walter Leal Filho
Contents ix
Water Management and Climate Changein the Focus of International MasterPrograms in Latin Americaand the Carribian
Frido Reinstorf, Petra Schneider, Raymundo Rodriguez Tejeda,Leslie Santos Roque, Henrietta Hampel and Raul F. Vazquez
Abstract Water is regional priority around the world but synthesis of water resourcemanagement aspects from local-to-global scales is currently not included in notcurrently included higher education curriculua of Latin American and the Caribbean(LAC) universities. This leaves local populations vulnerable to future shifts in climateat global scales and changes in land usage at regional scales. To close this gap, theproject “WATERMAS—Water Management and Climate Change in the Focus ofInternational Master Programs”, is financed by the European Union. The project willdevelop and establish a new standard of higher educational and scientific knowledgeexchange between Europe and Latin America as well as the Caribbean. This willbe done leveraging existing Master’s courses/programs of Water Management atthe various partner universities in Latin America (LA), respectively in Cuba andin Ecuador. The scope of the project is to enable the development of strategies
F. Reinstorf (B) · P. SchneiderUniversity of Applied Sciences Magdeburg-Stendal, Breitscheidstraße 2, 39114 Magdeburg,Germanye-mail: [email protected]
P. Schneidere-mail: [email protected]
R. R. Tejeda · L. S. RoqueUniversity of Holguin, Avenida XX Aniversario 4, 80100 Holguin, Cubae-mail: [email protected]
L. S. Roquee-mail: [email protected]
H. Hampel · R. F. VazquezUniversity of Cuenca, 12 of April Avenue, 01.01 Cuenca, Ecuadore-mail: [email protected]
R. F. Vazqueze-mail: [email protected]
© Springer Nature Switzerland AG 2019W. Leal Filho et al. (eds.), Handbook of Climate Change and Biodiversity,Climate Change Management, https://doi.org/10.1007/978-3-319-98681-4_1
1

2 F. Reinstorf et al.
for the adaptation of local water management facilities and the biodiversity withregard to future challenges in the partner countries targeting a Society-Education-Research Nexus. The project addresses sustainability under the Teaching-Research-Practice Nexus, particularly the UN Sustainability Development Goals (SDG) 4(Quality Education), 6 (Clean Water and Sanitation), 11 (Sustainable Cities andCommunities), and 13 (Climate Action). Besides the water management aspectsthe biodiversity guaranties the functionality of eco system services, which plays animportant role by considering the value of the nature for the mankind.
Introduction
Water is fundamental for the economyandquality of life in every country of theworld;however, this renewable resource is increasingly threatened by human activities (i.e.pollution, overexploitation). Further, due to this human influence on earth processes,the global climate is changing, affecting the availability and frequency of naturalrainfall. In Latin America (LA) long term prediction foresees more or less the sameamount of rain in the future but its distribution will change causing longer periods ofdrought and increased intensity and frequency of rainfall resulting in severe floodingand devastating consequences (IPCC-AR5 2014). Moreover, the hydrological cycleis influenced by complex meteorological phenomena such as “El Niño” and “LaNiña”, which produce extensive damage with regard to the local-to-global economyand can bring also significant human losses in the affected countries. In Europe,especially in the southern countries like Spain and Italy, water crisis is more andmore severe each summer, e.g. summer water crisis in 2008 when water needed to beimported to Spain. Only the retention of water in reservoirs, and even the re-use ofheavily salty wells, e.g. in Cataluña, can fairly satisfy the water demand (Maracchiet al. 2005).
Such climate change is exacerbated by coupled impacts of land use changes asso-ciated with, for instance, agricultural frontier expansion and related water use to feedgrowing populations and satisfy other urban needs. Moreover, in LA, especially inEcuador, in the last few years, aiming at securing and diversifying energy sources,several hydroelectric power stations started to function and many more are underconstruction, e.g. Paute Dam and Mazar Dam (WEC 2017). The lack of control onenvironmental flow results in strong impact on the river system functioning and itscapacity of recovery. Contamination due to the lack of control of industrial and agri-cultural activities and lack of water treatment plants prior river disposal (e.g. onlythree cities in Ecuador have adequate sewage treatment systems, in Cuba there areno norms for the design of waste water treatment plans) further aggravates the waterrelated problems. In addition, as the result of the last few years of strong economicdevelopment, water consumption increased dramatically reaching in average 200 Lper day in LA cities. Due to the above mentioned issues all countries globally willhave to face water related problems in the future. But these problems will be espe-cially severe in LAwhere countries are highly vulnerable due to the lack ofmitigation
Water Management and Climate Change in the Focus … 3
and adaptation strategies (WWDR 2015). In the most affected regions the economicdevelopment growth will be hindered promoting further growth of poverty and des-peration among inhabitants, with potential consequences on the rise of criminalityand other social issues.
In the EuropeanUnion (EU), theWater FrameworkDirective (WFD2000) aims toachieve good qualitative and quantitative status of all water bodies. Also, the new sta-tus of ecosystems, which considers not only the conservation of biodiversity but alsothe new aspect of improving the ability of ecosystems to deliver eco system services,plays an important role in the strategy of the EU (COM 2011, 244). However, in LA,where the proposed project will be executed, the focus is different. For instance, inEcuador exists the “Law of the use and exploitation of water resources” but this doesnot mention at all anything on the protection of water bodies but only guarantees“good” and enough water for the population. Strikingly, despite water’s recognitionas a very important regional priority, water conservation, protection, environmentalflow definition, and relation to good ecosystem functioning are very rarely consid-ered in legal regulations and decision-making. Even more significant as we lookto future generations of managers, these integral aspects of water resources are notincluded in the vast majority of curricula development for higher education acrossLA. Further, these curricula need to implement up-to-date scientific and technologi-cal knowledge, aiming at increasing the local skills and expertise of young studentsand professionals as multiplier on key water resources (WR) aspects such as optimi-sation of use, conservation and management; promoting at the same time, commonvalues, social integration, intercultural understanding and language/communicationskills, as a way of overcoming current educational deficiencies that constrain pro-fessionals to a narrow working environment. This is what the WATERMAS projecttargets.
The Project: “WATERMAS—Water Managementand Climate Change in the Focus of International MasterPrograms”
General Aspects
WATERMAS is a project financed by the European Union under the ERASMUS +program in the period 2017–2019. Partners are the University of Applied SciencesMagdeburg-Stendal (UAM, Germany), the Universities of Holguin (UHo, Cuba),Gent (UG, Belgium), Cuenca (UC, Ecuador), Stockholm (SU, Sweden) and thePolytechnical School of Litoral Guayaquil (ESPOL, Ecuador). As such, WATER-MAS focuses in the regional priority for boosting academic curricula in the field ofwater resources (WR) with the innovative goal of including perspectives of conser-vation and protection of WR leveraging management aspects from local-to-globalscales especially in the view of climate change.

4 F. Reinstorf et al.
Hence, the participating institutions have very high level teaching and/or researchexpertise in a broad range ofWR issues. Nevertheless, particularly the LA institutionshave the necessity of connecting to more modern knowledge, especially on waterconservation and management issues, as well as, language skills. In this respect,the exchange of students and teachers targeting an ability to share knowledge andtransfer research among universities in the LA and EU contexts will further providesupport to current and future decision makers and civil society in general. This willguarantee not only the successful execution of the project objectives but also thefuture sustainability of its outcomes.
The general approach is to include several important and unique aspects, such as(1) the transference of the EU view on WR management on the basis of the WaterFramework Directive (WFD) application; (2) the wide range ofWR related expertiseof the partners (e.g. hydrology, hydrogeology, hydraulics, water quality, water man-agement, river/lake monitoring/restoration, climate change, landscape/aquatic ecol-ogy, ecosystem functioning, environmental flow) will provide a complete overviewon water issues in the view of climate change; (3) the long teaching/research trajec-tory of the participantswill ensure effective knowledge transference; and (4) differentWRes problems from the participating countries (e.g. Belgium: severe reduction ofintertidal areas of rivers and related flood events; Germany: pollution vs. water usefrom transboundary rivers; Ecuador: lack of proper legislation for environmentalflow, severely increased water consumption) will be analysed and presented as casestudies, profiting from the significant expertise of the partners.
Currently, there exists already a student exchange program between Universityof Applied Sciences Magdeburg-Stendal (UAM, Germany) and University of Hol-guin (UHo, Cuba), through which lecturers/scientists from both universities workedtogether to create a jointly taught course given at the UHo and initiated commonresearch on WR applied on Cuba. Further, the universities of Gent (UG, Belgium),Cuenca (UC,Ecuador) and thePolytechnical School ofLitoral inGuayaquil (ESPOL,Ecuador) have a long term collaboration (20 years) through theVLIR (FlemishCoun-cil of Universities) program, which promoted mobility actions, technology transfer-ence and development of research projects and an interuniversity M.Sc. program inWR (while a related Ph.D. program is currently being planned). Hence, the integra-tion of these well stablished and fruitful networks gave birth to the current proposalthat in addition involves the collaboration of the University of Stockholm (SU) dueto its relevant complementary experience on WR and expertise on well-aligned cur-riculum development connecting research and application.
Climate Change in Latin America with Focus on Cubaand Ecudador
The climate of the Central and South American continent is extraordinarily complex.On the one hand, the long continent reaches from the tropics of the northern to thetundra climate of the southern hemisphere. On the other hand, the Andes and the

Water Management and Climate Change in the Focus … 5
Fig. 1 Location of the countries in the focus of WATERMAS
mountains of Central America cause great differences on the west and east sides ofthe continent. Cuba and Ecuador, the countries in the focus of the project, are locatedin the Latin American and Carribbean (LAC) LAC region, see Fig. 1.
The LAC countries are considered particularly vulnerable to climate change, onthe one hand by a possible increase in hurricane activity and on the other hand bythe rise in sea levels (IPCC 2007, 2013; UNEP 2010). While sea-level rise is morea global phenomenon, but particularly prone to Caribbean islands, the frequencyand intensity of Caribbean hurricanes are heavily controlled by the climate of thetropical Atlantic and the Caribbean itself (Pielke et al. 2013). The Caribbean climateis initially determined by the subtropical high above the Atlantic. It lies far to thesouth in winter and brings drought to the region. In the summer, it shifts to the northand makes room for east winds, causing rain from May to November. From June toNovember, when sea surface temperatures are above 26.5 °C, these easterly windsmay develop into tropical storms and hurricanes, bringing the bulk of precipitation.The whole system is under the influence of the El Niño Phenomenon in the SouthPacific and theNorthAtlanticOscillation (NAO). ElNiño years providemore drynessand less hurricane activity across the Caribbean, La Niña years for wetter conditions.A positive NAO phase intensifies the subtropical high pressure area and thus alsocauses a reduction in rainfall (IPCC 2007, 2013).
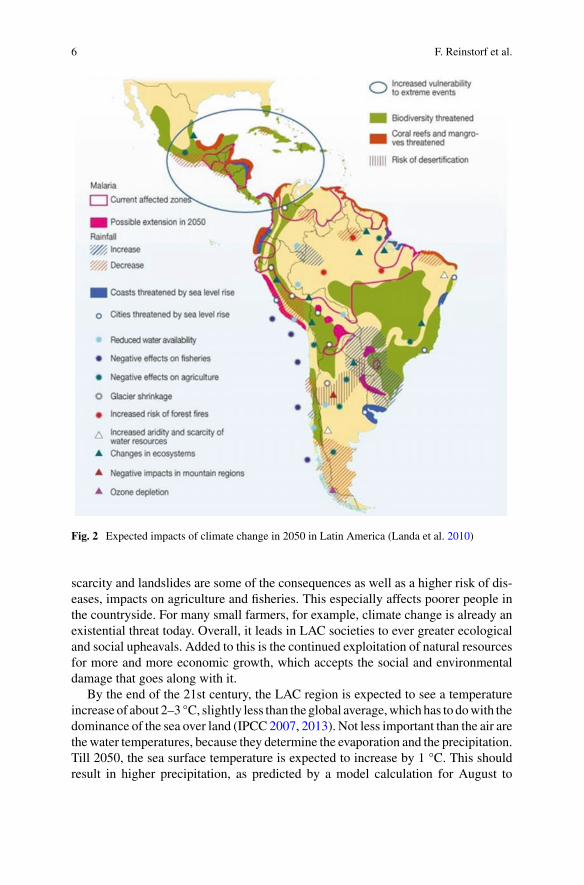
The devastating effects of climate change are already evident in LA today.Expected impacts of climate change in 2050 can be seen in Fig. 2. Regions withincreased vulnerability to weather extremes like storms, droughts and floods changesin biodiversity as well as the risk of desertification can be located. Crop failure, water
6 F. Reinstorf et al.
Fig. 2 Expected impacts of climate change in 2050 in Latin America (Landa et al. 2010)
scarcity and landslides are some of the consequences as well as a higher risk of dis-eases, impacts on agriculture and fisheries. This especially affects poorer people inthe countryside. For many small farmers, for example, climate change is already anexistential threat today. Overall, it leads in LAC societies to ever greater ecologicaland social upheavals. Added to this is the continued exploitation of natural resourcesfor more and more economic growth, which accepts the social and environmentaldamage that goes along with it.
By the end of the 21st century, the LAC region is expected to see a temperatureincrease of about 2–3 °C, slightly less than the global average,which has to dowith thedominance of the sea over land (IPCC 2007, 2013). Not less important than the air arethewater temperatures, because they determine the evaporation and the precipitation.Till 2050, the sea surface temperature is expected to increase by 1 °C. This shouldresult in higher precipitation, as predicted by a model calculation for August to

Water Management and Climate Change in the Focus … 7
October (Angeles et al. 2007).However, the IPCCassumes drier conditions inCentralAmerica and the Caribbean at the end of the 21st century. The reason is that in theEast Pacific, more El-Niño-like conditions are expected in the future, and an increasein the North Atlantic Oscillation (NAO). Both changes lead to less precipitation inthe Caribbean (IPCC 2007). An exception is only the northern Caribbean in thewinter months (IPCC 2013). A warming of the eastern tropical Pacific, from whichan El Niño develops, intensifies the subtropical jet stream, which in turn amplifiesvertical heavy winds across the Caribbean that obstruct the convection of humid air.A positive NAO phase increases the Atlantic subtropics high and the trade winds,causing the Caribbean Sea surface temperatures to cool (Angeles et al. 2007).
In addition, there are many problems and deficiencies that contribute to the vul-nerability of the LA countries in terms of climate change (Leal Filho and Mannke2014), as there are:
• poor or non-existing climate change governance systems,• limited awareness on the causes and consequences of climate change,• endemic poverty,• limited access to capital and global markets,• continuous ecosystem degradation,• complex disasters and conflicts,• unplanned urbanization,• limited capacity (personal and institutional) to address the problem and its manyramifications.
Conflicts due to climate change and environmental degradation, resource exploitationand scarcity of resources are exacerbated by the fact that they are directly linked tothe distribution problem—that is, the question of how benefits and risks are sociallydistributed. On the one hand, the LA example shows the connection of environ-mental and climate problems with social and economic issues; on the other, theglobal dimension of climate change and environmental conflicts becomes clear: thegap between the main causes of climate change and beneficiaries of the economicsystem in the Global North on the one hand and, on the other hand, people who aremarginalized are continuing to open up, partly because others can protect themselvesagainst the consequences of climate change. But looking at LA not only highlightsthe implications and inequalities surrounding the global climate change problem, italso opens up hopeful alternatives: In someLA countries, people are pioneeringwaysof reconciling human development, social justice and environmental sustainability.
Methodology
To increase the local expertise for optimising the management of WR, in LAC coun-tries academic curricula needs to incorporate the perspective of protection and con-servation of WR and their advantages, especially in the view of climate change, and

8 F. Reinstorf et al.
up-to-date scientific and technological knowledge. EU partners have a very diverseresearch/teaching/technological/management expertise on these WR issues, whichwill help solving local WR problems by increasing local expertise and, in the mid-term, could be incorporated into local/regional decision making systems, which inturn would represent a huge contribution to regional WR management. Further, col-laboration between EU and LAC countries will generate joint knowledge on WRissues, which will allow the establishment of thematic networks that will be sustain-able through common research projects, scientific publications and mobility actionsinvolving both students and researchers.
The main research questions of the project are:
• Which are the main contents to be included in curricula for teaching water man-agement and climate change in the focus of international master programs for theLAC region?
• How can a continuing education program for teachers contribute to curriculumdevelopment in the sense of higher education for climate adaptation and sustainabledevelopment?
• Which competencies are developed individually?• How can water management and climate change be integrated into the teach-ing routines in a transdisciplinary way? Which new and innovative pedagogicalapproaches are feasible to be implemented under LAC conditions?
• What contributions are there for the development of the university?• How does the program contribute to the dissemination of climate mitigation andadaptation as a cross-cutting issue in the university and outside?
The general approach of the project to provide answers to the above questions is theknowledge value chain according to Weggeman (1996), which provides a structuredapproach on the base of knowledge management routines. The knowledge valuechain represents a transfer of a technique to teaching, which has proven itself inpractice. The knowledge value chain is starting fromMVOS (mission—vision—ob-jectives—strategy), followed by Developing knowledge—sharing knowledge—Ap-plying knowledge—Evaluating knowledge, a process, which is under cyclicalrepetition (Weggeman 2000), as analogue to the Deming cycle (Deming 1982). Themethodology in the WATERMAS project is based on the creation of a commonknowledge base by cooperation, exchange and dissemination among the networkparticipants to promote curriculum development with the following key activities:
• Identification of the main topics of the curricula regarding water resources con-servation and management both from a regional and global perspective
• Collection of relevant information material (national standards, publicationsregarding regional and global water management aspects and land use impacts,examples of existing curricula, etc.) among the partners with subsequent assess-ment, summarization and distribution as presentations at workshops
• Assessing local and global scientific information relating to the project aims. Dis-cussion of the information, producing outlines of articles and decisions regardingthe implementation within the virtual data base
Water Management and Climate Change in the Focus … 9
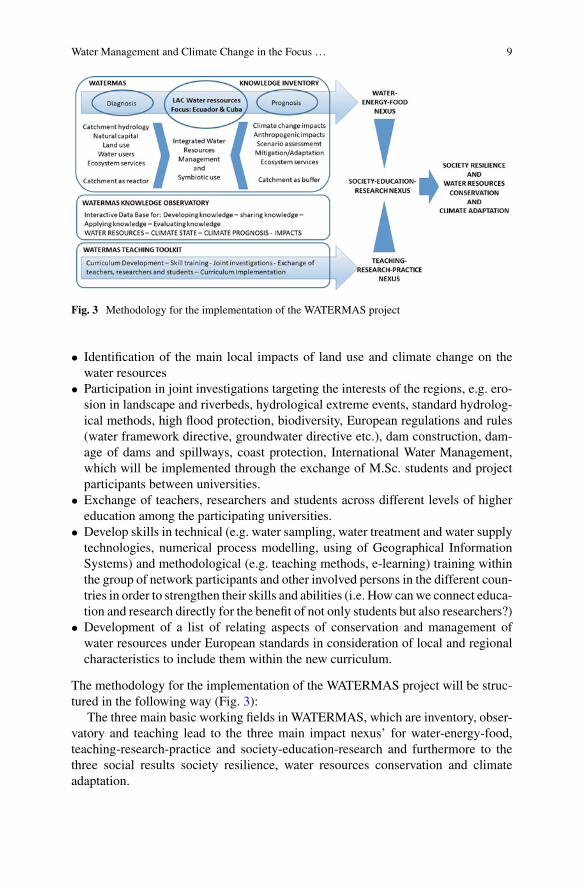
Fig. 3 Methodology for the implementation of the WATERMAS project
• Identification of the main local impacts of land use and climate change on thewater resources
• Participation in joint investigations targeting the interests of the regions, e.g. ero-sion in landscape and riverbeds, hydrological extreme events, standard hydrolog-ical methods, high flood protection, biodiversity, European regulations and rules(water framework directive, groundwater directive etc.), dam construction, dam-age of dams and spillways, coast protection, International Water Management,which will be implemented through the exchange of M.Sc. students and projectparticipants between universities.
• Exchange of teachers, researchers and students across different levels of highereducation among the participating universities.
• Develop skills in technical (e.g. water sampling, water treatment and water supplytechnologies, numerical process modelling, using of Geographical InformationSystems) and methodological (e.g. teaching methods, e-learning) training withinthe group of network participants and other involved persons in the different coun-tries in order to strengthen their skills and abilities (i.e. How canwe connect educa-tion and research directly for the benefit of not only students but also researchers?)
• Development of a list of relating aspects of conservation and management ofwater resources under European standards in consideration of local and regionalcharacteristics to include them within the new curriculum.
The methodology for the implementation of the WATERMAS project will be struc-tured in the following way (Fig. 3):
The three main basic working fields in WATERMAS, which are inventory, obser-vatory and teaching lead to the three main impact nexus’ for water-energy-food,teaching-research-practice and society-education-research and furthermore to thethree social results society resilience, water resources conservation and climateadaptation.
10 F. Reinstorf et al.
Teaching and Learning Contents to Be Addressed
Fundamentals and Definitions
The exacerbating impacts resulting on the changes of the climate system on thewater resources systems and the complexity based on interacting systems are issuesthat becoming increasingly importances. Damages and alterations in the atmosphere,global warming, impacts on the oceans, the cryosphere, changes in sea level, as wellas differences in carbon concentrations and other biogeochemical magnitudes areinescapable. These affect the normal balance of ecosystems and force humans toseek alternatives to adapt to new conditions and find immediate solutions. In thiscontext the understanding of the impacts requires the consideration of the interre-lations between water resources—water scarcity—water risk—water stress—watersecurity aswell aswater resources—water use—wastewater discharge—wastewatertreatment. These fundamental interrelations within theWater ResourceManagement(WRM) are necessary to implement in learning and teaching contents, including theinterrelations between WRM aspects and other natural resources like ecosystems.
Displaying the Scales of the Hydrological Cycleand the Impacts of Climate Change in the Curriculum
Scope of this part of the curriculum will be to get knowledge of the fundamentals ofhydrology, as well as to get knowledge of hydrological processes and methods forthe estimation of hydrological variables, which are relevant for the dimensioning ofhydraulic structures and for the use of water resources on all levels and scales. Theclassification of the spatial scales relevant for hydrology ranges from “micro” (up toabout 1 km2) via “meso” (up to 1000 km2) to “macro” (from 10,000 km2). To showhow the different scales of the hydrological cycle and the impacts of climate changecan be considered in curricula an understanding of the processes and known facts atthe different scales is required. For that, a differentiation into the global, regional,and local scales is needed. Using the concrete examples of Cuba and Ecuador, it willbe demonstrated how this content can be displayed in a curriculum.
Dimensions of WR Management to Be Consideredin the Curriculum
Water resources are sources of water that are potentially useful for uses like agricul-tural, industrial, household, recreational and environmental activities. Water avail-ability, including the security of water supply and sanitation, is essential to achieving

Water Management and Climate Change in the Focus … 11
the United Nations Sustainable Development Goals (SDG; United Nations 2015).Water availability, which UNESCO refers to as available fresh water resources (UN-Water 2006), indicates the amount of fresh water that is available to one personper year. According to Gerlak and Mukhtarov (2015), water security has emergedas a new discourse in water governance challenging the more traditional dominantdiscourse of Integrated Water Resources Management (IWRM) in the past decade.The definition of IWRM that is most widely accepted and of relevance today wasgiven by the Technical Committee (TEC, former Technical Advisory Committee,TAC), of the Global Water Partnership (GWP). It states that IWRM is “A processwhich promotes the co-ordinated development and management of water, land andrelated resources, in order to maximize the resultant economic and social welfare inan equitable manner without compromising the sustainability of vital ecosystems”(GWP 2000).
IWRM is based on amanagement approach for balancingwater demand and avail-ability under a spatial planning approach, practically combining water managementand water protection at catchment level (Grigg 2008). The formalised framework ofIWRM was developed from the Dublin Principles that were ratified during the 1992International Conference on Water and the Environment, through the following fourguiding principles:
• Principle 1: Fresh water is a finite and vulnerable resource, essential to sustainlife, development and the environment
• Principle 2: Water development and management should be based on a participa-tory approach, involving users, planners and policy-makers at all levels
• Principle 3: Women play a central part in the provision, management and safe-guarding of water
• Principle 4: Water has an economic value in all its competing uses and should berecognized as an economic good.
The Human Right to Water and Sanitation (HRWS) was recognised by the UnitedNations (UN) General Assembly on 28 July 2010 (UNEP 2010). A revised UNresolution in 2015 highlighted that the two rights were separate but equal (UnitedNations 2015). Through its focus on water, IWRM often neglects the needs of usersfrom agriculture and/or energy services. To consider a more holistic approach, theWater-Energy-Food Security Nexus (WEF) has been proposed, linking the decision-making processes of the competitive users and balancing the “trade-offs” betweenthem (Hoff 2011).
In the last decades, the awareness has grown that water is a scarce resource whichneeds to be managed also under the principles of environmental economics, particu-larly the water value chain, which takes the aspect of water being food into account.The “Water Footprint” (WF) is an indicator that shows the direct and indirect waterconsumption of a consumer or a producer (Hoekstra and Chapagain 2008). In con-trast to direct water consumption, the WF also includes indirectly used water. Theamount of water hidden in products is often referred to as “Virtual Water”. The WFdescribes the total amount of water that nations, businesses or consumers consume.
12 F. Reinstorf et al.
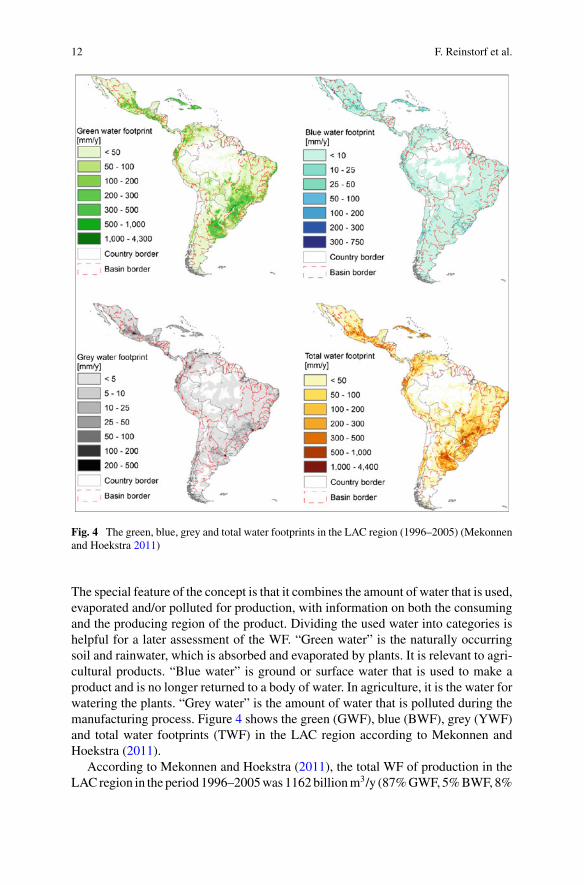
Fig. 4 The green, blue, grey and total water footprints in the LAC region (1996–2005) (Mekonnenand Hoekstra 2011)
The special feature of the concept is that it combines the amount of water that is used,evaporated and/or polluted for production, with information on both the consumingand the producing region of the product. Dividing the used water into categories ishelpful for a later assessment of the WF. “Green water” is the naturally occurringsoil and rainwater, which is absorbed and evaporated by plants. It is relevant to agri-cultural products. “Blue water” is ground or surface water that is used to make aproduct and is no longer returned to a body of water. In agriculture, it is the water forwatering the plants. “Grey water” is the amount of water that is polluted during themanufacturing process. Figure 4 shows the green (GWF), blue (BWF), grey (YWF)and total water footprints (TWF) in the LAC region according to Mekonnen andHoekstra (2011).
According to Mekonnen and Hoekstra (2011), the total WF of production in theLAC region in the period 1996–2005was 1162billionm3/y (87%GWF, 5%BWF, 8%
Water Management and Climate Change in the Focus … 13
YWF) (Mekonnen and Hoekstra 2011). About 21% of the WF within LAC is relatedto production for export. The gross virtual water export of the LAC region to the restof the world was 277 billion m3/y (Mekonnen et al. 2015). The LAC average WF ofconsumption was about 1769 m3/y per capita. In LA does exist the Latin AmericanWater Tribunal (Tribunal Latinoamericano del Agua, TLA), which is an autonomous,independent and international environmental justice organization created to helpsolve water related conflicts in LA and to support water management (Weaver 2011).The TLA work is based on the principles that the balanced coexistence with nature,respect for human dignity, and solidarity among peoples are are required for thepreservation of the region’s water systems. The TLA is committed to preservingthe water commons for future generations and to guaranteeing access to water as ahuman right. Its legitimacy derives from the moral nature of its resolutions and thejuridical fundamentals they are based on.
Climate Change—The Role of Biodiversity and EcosystemServices
Biodiversity plays a significant role in the frame of the climate change mitigationstrategy development and refers to the variability of living organisms and their eco-logical complexes. It includes (a) the diversity of ecosystemsor communities, habitatsand landscapes, (b) the biological diversity and (c) the genetic diversity within thedifferent species. Various forms of the use of the natural capital, including biodiver-sity, have been grouped together under the term ecosystem services, without payingparticular attention to the idea of nature conservation yet (Schröter 2017).
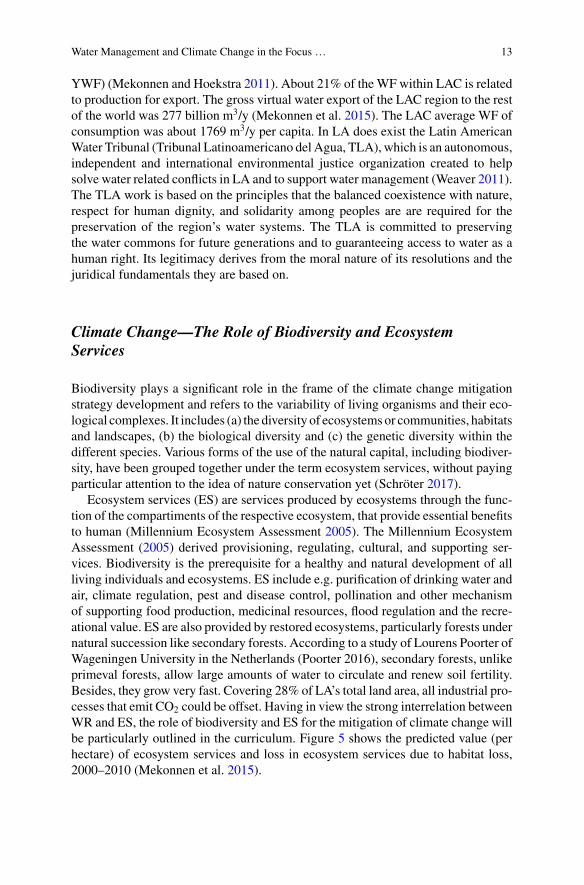
Ecosystem services (ES) are services produced by ecosystems through the func-tion of the compartiments of the respective ecosystem, that provide essential benefitsto human (Millennium Ecosystem Assessment 2005). The Millennium EcosystemAssessment (2005) derived provisioning, regulating, cultural, and supporting ser-vices. Biodiversity is the prerequisite for a healthy and natural development of allliving individuals and ecosystems. ES include e.g. purification of drinking water andair, climate regulation, pest and disease control, pollination and other mechanismof supporting food production, medicinal resources, flood regulation and the recre-ational value. ES are also provided by restored ecosystems, particularly forests undernatural succession like secondary forests. According to a study of Lourens Poorter ofWageningen University in the Netherlands (Poorter 2016), secondary forests, unlikeprimeval forests, allow large amounts of water to circulate and renew soil fertility.Besides, they grow very fast. Covering 28% of LA’s total land area, all industrial pro-cesses that emit CO2 could be offset. Having in view the strong interrelation betweenWR and ES, the role of biodiversity and ES for the mitigation of climate change willbe particularly outlined in the curriculum. Figure 5 shows the predicted value (perhectare) of ecosystem services and loss in ecosystem services due to habitat loss,2000–2010 (Mekonnen et al. 2015).

14 F. Reinstorf et al.
Fig. 5 Predicted value (per hectare) of ecosystem services and loss in ecosystem services due tohabitat loss, 2000–2010 (Mekonnen et al. 2015)
Structure of the Curriculum
The curriculum will be structured in modules, based on the data collected for theWATERMAS inventory. The general approach to the structure of the curriculum isbased on the following modules:
First semester (theoretical)
Module 1 Introduction to IWRM in the LAC regionModule 2 WR conservation and ecosystem servicesModule 3 Circularity: Multifunctional land use and reuseModule 4 Climate change, climate impact, climate adaptationModule 5 Engineered and nature-based solutions for sustainable water and land
management
Second semester (practical)
Workshop 1 Applying IWRM on catchment scale (project seminar)Workshop 2 Development of a climate adaptation strategy on catchment scale
(project seminar)Workshop 3 Water-Energy-Food Nexus and Public Participation
Water Management and Climate Change in the Focus … 15
Green Campus—The Living Lab
The universities campus should play a key role in the water management and climatechange master programs as it is part of the student’s real life system, and could beused as living lab for the development of the practical part of the curriculum. Aliving lab is a place-based research concept that utilizes the college campus as test-bed for innovation and knowledge generation, representing the campus as a pilot sitefor climate adaptation. A green campus is a challenge as it means using the builtenvironment to revitalize college education as a form of experimental learning. Afeasible guideline for such activity is the Greening Universities Toolkit of the UnitedNations Environment Programme (UNEP 2010).
Teaching and Learning Methodology
General Didactic Approach—Students Become Self-DirectedLearners
Three main goals characterize the approach to curriculum development in theWATERMAS project (in analogy to Leat 1998):
• the development of flexible, adaptive learning methods and types of tasks thattransform WR management into a challenging and exciting subject
• to help students to understand important key concepts of thinking in WRmanage-ment and develop cognitive skills that they can apply in a different context,
• To support the intellectual development of students so that they can better handlediverse and complex information in the study and beyond.
In order to achieve these goals, theWATERMAS project will develop learning meth-ods and exercises that will motivate students to reflect and think in a motivatingsystems thinking way. Decisive is always the thinking process, which leads to thesolution of the tasks. That is why each task has a reflection in which the studentsthemselves should become aware of this thought process (metacognitive learning;Ambrose et al. 2010; Barkley 2010). Working with learning methods also opens theway to a self-directed way of thinking that goes beyond the specialist content of WRlessons. The following thinking strategies play a central role in this context:
• Compare: Find similarities and differences• Link: Search internal and external connections• Locate: Map phenomena geographically and assign them• Change of scale: Consider phenomena on different scale levels• Change of perspectives: Analysis of phenomena in multiple perspectives• Deduce and induce: Connect the general and the specific.
16 F. Reinstorf et al.
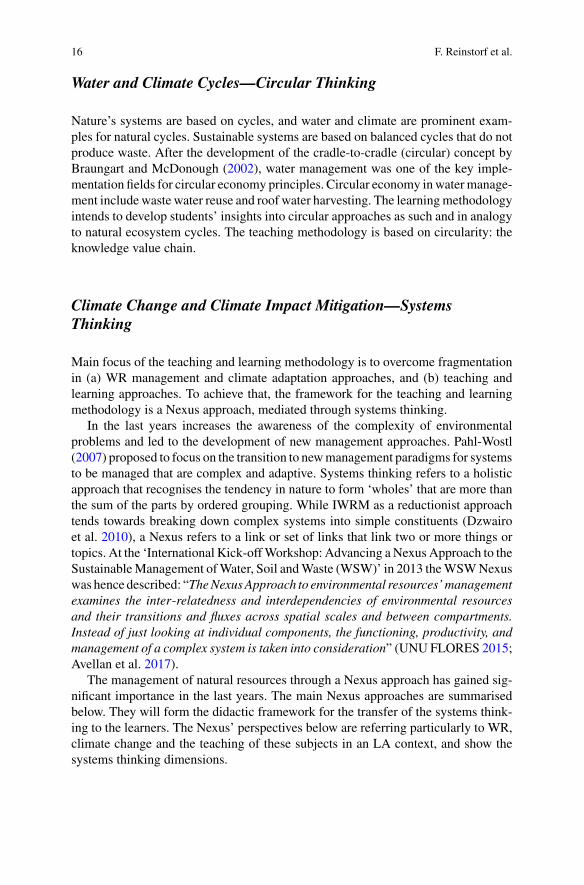
Water and Climate Cycles—Circular Thinking
Nature’s systems are based on cycles, and water and climate are prominent exam-ples for natural cycles. Sustainable systems are based on balanced cycles that do notproduce waste. After the development of the cradle-to-cradle (circular) concept byBraungart and McDonough (2002), water management was one of the key imple-mentation fields for circular economy principles. Circular economy inwatermanage-ment include waste water reuse and roof water harvesting. The learningmethodologyintends to develop students’ insights into circular approaches as such and in analogyto natural ecosystem cycles. The teaching methodology is based on circularity: theknowledge value chain.
Climate Change and Climate Impact Mitigation—SystemsThinking
Main focus of the teaching and learning methodology is to overcome fragmentationin (a) WR management and climate adaptation approaches, and (b) teaching andlearning approaches. To achieve that, the framework for the teaching and learningmethodology is a Nexus approach, mediated through systems thinking.
In the last years increases the awareness of the complexity of environmentalproblems and led to the development of new management approaches. Pahl-Wostl(2007) proposed to focus on the transition to newmanagement paradigms for systemsto be managed that are complex and adaptive. Systems thinking refers to a holisticapproach that recognises the tendency in nature to form ‘wholes’ that are more thanthe sum of the parts by ordered grouping. While IWRM as a reductionist approachtends towards breaking down complex systems into simple constituents (Dzwairoet al. 2010), a Nexus refers to a link or set of links that link two or more things ortopics. At the ‘International Kick-offWorkshop: Advancing aNexus Approach to theSustainableManagement ofWater, Soil andWaste (WSW)’ in 2013 theWSWNexuswas hence described: “The Nexus Approach to environmental resources’ managementexamines the inter-relatedness and interdependencies of environmental resourcesand their transitions and fluxes across spatial scales and between compartments.Instead of just looking at individual components, the functioning, productivity, andmanagement of a complex system is taken into consideration” (UNU FLORES 2015;Avellan et al. 2017).
The management of natural resources through a Nexus approach has gained sig-nificant importance in the last years. The main Nexus approaches are summarisedbelow. They will form the didactic framework for the transfer of the systems think-ing to the learners. The Nexus’ perspectives below are referring particularly to WR,climate change and the teaching of these subjects in an LA context, and show thesystems thinking dimensions.

Water Management and Climate Change in the Focus … 17
The WR dimension: Water-Energy-Food Nexus (Hoff 2011; Huelsmannand Ardakanian 2014; UNU-FLORES 2015)The Water-Energy-Food (WEF) Nexus assesses the interdependencies betweenwater, energy and food security for human well-being and intends to achieve allthree of them in an equitable manner. The Nexus approach is based on the under-standing of the synergies and the regulated negotiation of fair trade-offs betweencompeting uses of water, land and energy-related resources (Schneider et al. 2018a).A particular WEF approach for transboundary river basins was developed under theUNECE Water Convention for the 2013–2015 program, that is the TransboundaryRiver Basin Nexus Approach (TRBNA) (de Strasser et al. 2016).
The land use dimension: Water-Soil-Waste Nexus (Avellan et al. 2017)The Water-Soil-Waste (WSW) Nexus complements the WEF Nexus (UNU Flores2015), and asks how resources should bemanaged to tackle sustainablemanagement.The addition of waste as a resource dimension that often gets omitted in the sectorbased approaches shall arguably result in more effective and efficient solutions toproblems (Avellan et al. 2017).
The climate adaptation dimension: The Land—Climate—Energy Nexus (Daleet al. 2011)The Land—Climate—Energy Nexus focuses explicitly on the intersectoral depen-dencies of competitive land use, energy production and the related climate changeimpacts, based on an integrated analysis of climate change, land-use, energy andwater strategies for mitigation and for adaptation purposes.
The resources dimension: The Minerals—Energy Nexus (McLellan 2017)The Minerals-Energy Nexus according to McLellan (2017) describes the interlink-ages between the extraction and use of mineral resources and the necessary energysupply, underlining energy as necessary resource for the minerals production, butalso the necessary minerals to produce energy. The Minerals-Energy Nexus has alsoa WR dimension in the moment when minerals are extracted from catchments, andparticularly from rivers. This interlinkage was recently illustrated by Schneider et al.(2018a) using the example of the sand extraction from rivers in South East Asia andthe impact of water power stations as barriers for the sediment transport.
The educational dimension: Teaching-Reserch-Practice Nexus (Schneider et al.2018b)Like three-bottom-line of sustainability includes social, ecological and environmen-tal issues, the Teaching-Research-Practice Nexus (TRPN) describes the co-equalexistence of teaching, research and practice in institutions of Higher Education. As aframework for the implementation of sustainability in Higher Education, the TRPNis intended to lead to the integration of an intensive reference to practice in teachingand research.

18 F. Reinstorf et al.
The regional dimension: Spaces-Practices-Goods Nexus (Schneider and Popovici2018)The Spaces—Practises—Goods Nexus in the light of water resources refers to thesustainable consumption of locally produced goods representing the regional identity,which promotes the valorisation of regional value chains of sustainably producedgoods.
The project intends to open up a complementing Nexus dimension, the Soci-ety-Education-Research Nexus, which describes the socio-economic dimension ofsustainability implementation approaches, particularly through educational activi-ties. The Society-Education-Research Nexus describes the interlinkages between theconditions for the resilience and adaptive capacity of a society, promoted through for-mal and non-formal education for capacity building on water resources conservationand climate adaptation, based on state of the art research.
Integrated Water Resources Management—PracticalApplication
As mentioned above, the curriculum shall include teaching as well as a practicalapplication on IWRM, based on particular regional data bases for river basins in Cubaand Ecuador. The pilot catchments for practical education shall serve as modellingsite for water resources and conservation as well as for the stakeholder analysis tounderstand the real life problems of competing water uses. In the ideal case, thepilot catchments can be used for the stakeholder participation process under theWater-Energy-Food Nexus perspective.
Administrating Water Resources—The InstitutionalDimension
The conservation and sustainable use of water resources is based on the provisionthat water resources are managed and administrated properly in order to avoid over-exploitation and pollution. For a sustainable administration is the establishment ofreliable, transparent and functionable institutional settings, which includes a suffi-cient administrative structure acting under the requirements for good governance.WATERMAS will outline key aspects for the institutional dimension.

Water Management and Climate Change in the Focus … 19
Protecting Water and Biodiversity Resources—The SocialDimension
The protection of water and biodiversity resources that are essential for the long termprovision of water-related ecosystem services. Capacity building in terms of waterand biodiversity resources conservation can support the awareness development forthis problem. WATERMAS will outline key aspects for the social dimension andhow to prepare capacity building to rase awareness for the protection of water andbiodiversity resources.
Valorising Water and Biodiversity Resources—The EconomicDimension
Water is a good for nutrition, and the protection of water resources requires itsvalorisation in economic terms along the product value chain. Therefore, informationon water extraction and distribution investments, water treatment methodologies andtheir operational cost as well as on resulting tariffs for the water consumer must beincluded. Relevant are also innovative water conservation strategies like payment forecosystem services (PES). WATERMAS will outline key aspects for the economicdimension, under consideration of the environmental and institutional dimensions.
Engineered and Nature Based Solutions for the Mitigationof Climate Change Impacts and Disasters—The EngineeringPerspective
By now, the majority of solutions for mitigation of climate change extremes anddisasters are engineered solutions, like high tide reservoirs or dams. On the way tothe implementation of sustainable development solutions, the International Union forConservation ofNature andNatural Resources (IUCN) fosters nature-based solutions(NbS) to address global societal challenges (Cohen-Shacham et al. 2016). Accordingto Cohen-Shacham et al. (2016), nature-based solutions use ecosystems and theirservices to address challenges like climate change, food security or natural disasters.IUCN defines NbS as: “Actions to protect, sustainably manage and restore naturalor modified ecosystems that address societal challenges effectively and adaptively,simultaneously providing human well-being and biodiversity benefits.”
Examples of nature-based solutions for climate protection and adaptation includethe conservation of peatlands as important CO2 storage, the renaturation of flood-plains as retention areas to mitigate flood peaks, and the use of urban green to retentheavy rainfall events in cities. WATERMAS will provide key aspects for the imple-mentation of the engineering perspective in the curriculum.
20 F. Reinstorf et al.
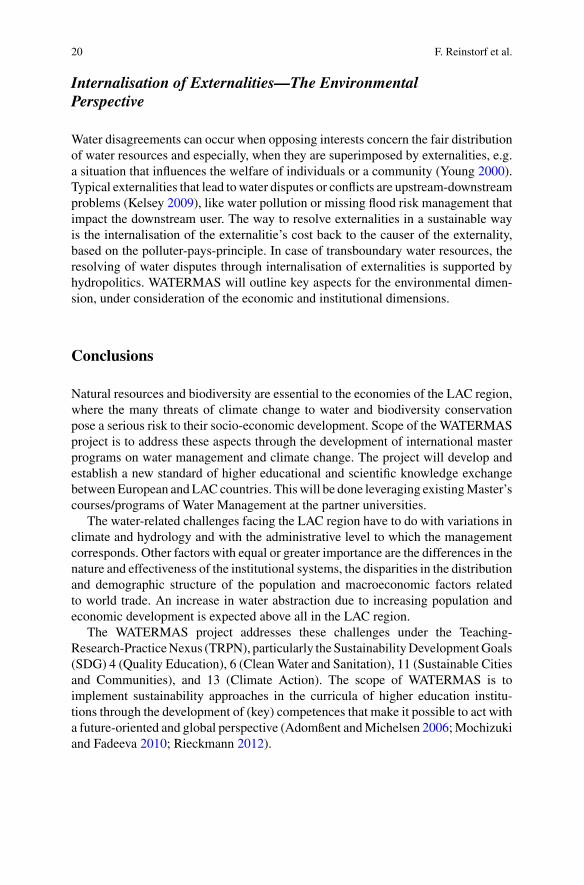
Internalisation of Externalities—The EnvironmentalPerspective
Water disagreements can occur when opposing interests concern the fair distributionof water resources and especially, when they are superimposed by externalities, e.g.a situation that influences the welfare of individuals or a community (Young 2000).Typical externalities that lead towater disputes or conflicts are upstream-downstreamproblems (Kelsey 2009), like water pollution or missing flood risk management thatimpact the downstream user. The way to resolve externalities in a sustainable wayis the internalisation of the externalitie’s cost back to the causer of the externality,based on the polluter-pays-principle. In case of transboundary water resources, theresolving of water disputes through internalisation of externalities is supported byhydropolitics. WATERMAS will outline key aspects for the environmental dimen-sion, under consideration of the economic and institutional dimensions.
Conclusions
Natural resources and biodiversity are essential to the economies of the LAC region,where the many threats of climate change to water and biodiversity conservationpose a serious risk to their socio-economic development. Scope of the WATERMASproject is to address these aspects through the development of international masterprograms on water management and climate change. The project will develop andestablish a new standard of higher educational and scientific knowledge exchangebetweenEuropean andLACcountries. Thiswill be done leveraging existingMaster’scourses/programs of Water Management at the partner universities.
The water-related challenges facing the LAC region have to do with variations inclimate and hydrology and with the administrative level to which the managementcorresponds. Other factors with equal or greater importance are the differences in thenature and effectiveness of the institutional systems, the disparities in the distributionand demographic structure of the population and macroeconomic factors relatedto world trade. An increase in water abstraction due to increasing population andeconomic development is expected above all in the LAC region.
The WATERMAS project addresses these challenges under the Teaching-Research-PracticeNexus (TRPN), particularly the SustainabilityDevelopmentGoals(SDG) 4 (Quality Education), 6 (CleanWater and Sanitation), 11 (Sustainable Citiesand Communities), and 13 (Climate Action). The scope of WATERMAS is toimplement sustainability approaches in the curricula of higher education institu-tions through the development of (key) competences that make it possible to act witha future-oriented and global perspective (Adomßent andMichelsen 2006;Mochizukiand Fadeeva 2010; Rieckmann 2012).
Water Management and Climate Change in the Focus … 21
Acknowledgements This project has been funded with support from the European Commission.This publication reflects the views only of the author, and theCommission cannot be held responsiblefor any use which may be made of the information contained therein.
References
Adomßent M, Michelsen G (2006) German Academia heading for sustainability? reflections onpolicy and practice in teaching, research and institutional innovations. Environ Educ Res 12(1),85–99. Link http://dx.doi.org/10.1080/13504620500527758
Ambrose S et al (2010) “How do students become self-directed learners?” How learning works: 7research-based principles for smart teaching. Jossey-Bass, San Francisco, CA
Angeles ME et al (2007) Predictions of future climate change in the Caribbean region using globalgeneral circulation models. Int J Climatol 27:555–569
Avellan T, Roidt M, Emmer A, von Koerber J, Schneider P, Raber W (2017) Making the water-soil-waste nexus work: framing the boundaries of resource flows. Sustainability 9, 1881 (MDPI AG,Basel, Switzerland). https://doi.org/10.3390/su9101881
Barkley EF (2010) Student engagement techniques: a handbook for college faculty. Jossey-Bass,San Francisco, CA
Braungart M, McDonough W (2002) Cradle to cradle. Remaking the way we make things. NorthPoint Press2002
Cohen-ShachamE,Walters G, Janzen C,Maginnis S (eds) (2016) Nature-based solutions to addressglobal societal challenges. IUCN, Gland, Switzerland (xiii + 97 pp). ISBN: 978-2-8317-1812-5,http://dx.doi.org/10.2305/IUCN.CH.2016.13.en
COM (2011, 244) Our life insurance, our capital: an EU biodiversity strategy to 2020. EuropeanCommission, Brussels
Dale VH, Efroymson RA, Kline KL (2011) The land use—climate change—energy nexus. Land-scape Ecol 26(6):755–773. https://doi.org/10.1007/s10980-011-9606-2
de Strasser L, Lipponen A, Howells M, Stec S, Bréthaut C (2016) A methodology to assess thewater energy food ecosystems nexus in transboundary river basins. Water 8:59. https://doi.org/10.3390/w8020059
Deming WE (1982) Out of the crisis. Massachusetts Institute of Technology, Cambridge S. 88.ISBN 0-911379-01-0
Dzwairo B, Otieno FAO, Ochieng’ GM (2010) Making a case for systems thinking approach tointegrated water resources management (IWRM). Int J Water Resour Environ Eng 1, 107–113
Gerlak AK,Mukhtarov F (2015) ‘Ways of knowing’ water: integrated water resources managementand water security as complementary discourses. Int Environ Agreements: Politics, Law andEcon, September 2015, vol 15, Issue 3, pp 257–272
Grigg NS (2008) Integrated water resources management: balancing views and improving practice.Water Int 33(3):279–292. https://doi.org/10.1080/02508060802272820gwp. Catalyzing change:a handbook for developing integrated water resources management (IWRM) and water effi-ciency strategies. Available online: http://www.un.org/esa/sustdev/csd/csd13/documents/bground_5.pdf. Accessed on 10 Jan 2017
GWP (2000) Integrated water resources management, TAC background papers No. 4, © GlobalWater Partnership SE—105 25 Stockholm, Sweden
Hoekstra AY, Chapagain AK (2008) Globalization of water: sharing the planet’s freshwaterresources. Blackwell Publishing, Oxford, UK
Hoff H (2011) Understanding the nexus. Background paper for the Bonn 2011 conference: Thewater, energy and food security nexus. Stockholm Environment Institute, Stockholm. http://sei-international.org/publications?pid=1977
22 F. Reinstorf et al.
Huelsmann S, Ardakanian R (eds) (2014) Advancing a nexus approach to the sustainable manage-ment of water, soil and waste (white book). UNU-FLORES, Dresden
IPCC (2007) Climate change 2007, Working group I: the science of climate change, 11.9.1.1IPCC (2013) Climate change 2013, Working group I: the science of climate change, 14.8.4IPCC-AR5 (2014) Climate change 2013, The physical science basis, Working group i contributionto the fifth assessment report of the intergovernmental panel on climate change. CambridgeUniversity Press, Cambridge, New York, Melbourne, Madrid, Cape Town, Singapore, São Paolo,Delhi, Mexico City. ISBN 978-1-107-66182-0
Kelsey J (2009) Upstream–downstream transactions and watershed externalities: experimental evi-dence from Kenya. Ecol Econ 68(6):1813–1824
LandaR, Flores BA,HernándezM (2010) CambioClimático yDesarrollo Sustentable paraAméricaLatina y el Caribe, Conocer para comunicar, British Council, PNUDMéxico, Cátedra UNESCO-IMTA, FLACSO México. México D.F., 140 pp
Leal Filho W, Mannke F (2014) Managing the impacts of climate change in Latin America: theneed for technology transfer. In: Leal Filho W, Alves F, Caeiro S, Azeiteiro U (eds) Internationalperspectives on climate change. Climate change management. Springer, Cham. https://doi.org/10.1007/978-3-319-04489-7_7
Leat D (1998) Thinking through Geography. CambridgeMaracchi et al (2005) Impacts of present and future climate variability on agriculture and forestryin the temperate regions: Europe, increasing climate variability and change: Reducing the vulner-ability of agriculture and forestry, pp 117–135. https://doi.org/10.1007/1-4020-4166-7_6, ISSN0165-0009
McLellan BC (2017) The minerals-energy nexus: past, present and future. In: M Matsumoto et al(eds) Sustainability through innovation in product life cycle design, EcoProduction, pp 619–631,Springer Japan, https://doi.org/10.1007/978-981-10-0471-1_42
Mekonnen MM, Hoekstra AY (2011) National water footprint accounts: the green, blue and greywater footprint of production and consumption. Delft, The Netherlands, UNESCO-IHE
Mekonnen MM, Pahlow M, Aldaya MM, Zarate E, Hoekstra AY (2015) Sustainability, efficiencyand equitability of water consumption and pollution in Latin America and the Caribbean. Sus-tainability 7, 2086–2112. https://doi.org/10.3390/su7022086
Millennium Ecosystem Assessment (2005) Ecosystems and human well-being: synthesis. IslandPress, Washington, DC. SBN 1-59726-040-1
Mochizuki Z, Fadeeva Z (2010) Competences for sustainable development and sustainability: Sig-nificance and challenges for ESD. Int J Sustain High Educ 11(4):391–403. https://doi.org/10.1108/14676371011077603
Pahl-Wostl C (2007) The implications of complexity for integrated resources management. EnvironModell Softw 22:561–569
Pielke RA Jr, Rubiera J, Landsea C, Fernandez ML, Klein R (2013) Hurricane vulnerability inLatin America and The Caribbean: normalized damage and loss potentials. Nat Hazards Rev4(3):101–114
RieckmannM (2012) Future-oriented higher education: which key competencies should be fosteredthrough university teaching and learning? Futures 44:127–135
Schneider P, Avellan T, Le Hung A (2018a) Security, sustainability and the water-energy-foodnexus. In: Leal W, de Andrade Guerra (eds) Encyclopedia of sustainability in higher education,section “Research and transformation”. Springer (invited chapter, submitted)
Schneider P, Folkens L, Busch M (2018b) The teaching-research-practice nexus as frameworkfor the implementation of sustainability in curricula in higher education. In: Leal Filho W(eds) Imple-menting sustainability in the curriculum of universities. World Sustainability Series,pp 113–136. Springer, Cham. https://doi.org/10.1007/978-3-319-70281-0_8, ISBN: 978-3-319-70280-3 (online first)
Schneider P, Popovici LD (2018) Approaches for the implementation of water-related culturalecosystem services in teaching programs on sustainable development. Handbook of sustainability

Water Management and Climate Change in the Focus … 23
and humanities: linking social values, theology and spirituality towards sustainability. In: WorldSus-tainability Series (in press)
Schröter M (2017) Do ecosystem services and sustainability fit together? ESP-DE Blog, http://www.esp-de.de/passen-oekosystemleistungen-und-nachhaltigkeit-zusammen/. Accessed 02 Dec2017
UNEP (2010) United Nations Environment Progamme (UNEP) Vital climate change graphics forLatin America and the Caribbean. UNEP/GRID-Arendal, Arendal
United Nations (2015) Transforming our world: the 2030 agenda for sustainable development,United Nations—Sustainable Development knowledge platform, 25 Sept 2015
UNU FLORES (2015) United Nations University Institute for Integrated Management of MaterialFluxes and of Resources (UNU-FLORES). The Nexus Approach to Environmental Resources’Management. Available online: https://flores.unu.edu/en/research/nexus. Accessed on 11 May2017
UN-Water (2006) The United Nations world water development report 2: water, a shared respon-sibility. World water assessment programme (WWAP). Doc. no. UN-WATER/WWAP/2006/3.UNESCO, Paris, France, and Berghahn Books, New York, USA. Available at http://unesdoc.unesco.org/images/0014/001444/144409e.pdf, Accessed 3 Nov 2017
Weaver AA (2011) “El Agua No Se Vende: Water is Not For Sale!” The Latin American watertribunal as a model for advancing access to water, 11 Pepp Disp Resol L J (3). Available at:https://digitalcommons.pepperdine.edu/drlj/vol11/iss3/12
WEC (2017) Hydropower in Ecuador, © World Energy Council 2018. https://www.worldenergy.org/data/resources/country/ecuador/hydropower/. Accessed 15 Mar 2017
WeggemanMCDP (1996) Knowledgemanagement: the modus operandi for a learning organizationon increasing the yield of the knowledge production factor. In: Schreinemakers JF (ed)Knowledgemanagement—organizational competence and methodology. Ergon-Verlag, Würzburg
Weggeman MCDP (2000) Kennismanagement: de praktijk. Scriptum, SchiedamWFD (2000) Directive 2000/60/EC of the European Parliament and of the Council of 23 October2000 establishing a framework for Community action in the field of water policy. EuropeanCommission, Brussels, p 2000
WWDR (2015) The UN world water development report 2015, Water for a sustainable world.Published in 2015 by the United Nations Educational, Scientific and Cultural Organization, 7,place de Fontenoy, 75352 Paris 07 SP, France, ISBN 978-92-3-100071-3
Young M (2000) Managing externalities: opportunities to improve urban water use, CSIRO UrbanWater Program, Folio 01/1324. www.myoung.net.au/water/publications/Managing_Externalities.pdf. Accessed on 10 Jan 2017
Mangrove Conservation Policiesin the Gulf of Guayaquil
Daniel Ortega-Pacheco, Maria J. Mendoza-Jimenez and Paul Herrera
Abstract In the last decade, the Ecuadorian government has designed and imple-mented a variety of policies to enhance the conditions of mangrove forests and theirability to provide ecosystem services. The present work aims to identify the differentpolicies related to mangrove conservation and evaluate the extent to which they pro-duce different outcomes to the population in the Gulf of Guayaquil, a coastal regionhosting more than 70% of mangroves in Ecuador. The main assumption underlyingthis effort is the notion that mangrove conservation might be critically linked to sub-jective measures of welfare improvement for populations that live in and depend onthis ecosystem, in addition to their original conservation purposes. Based on evidenceof recent studies, an institutional economic analysis using the Situation, Structure andPerformance framework is conducted. Results report evidence supporting the origi-nal assumption, as well as identified challenges to the continuity of current policiesand new but urgent avenues for future research.
Introduction
The Gulf of Guayaquil (GG) represents an exceptional case study whereby theneed for development meets the need for mangrove conservation. Around 71.4%of the Ecuadorian mangrove extension is located in this area (Bravo Cedeño 2010).Mangrove resource users deal with high levels of unsatisfied basic needs, poverty,
D. Ortega-Pacheco ·M. J. Mendoza-Jimenez (B)Centre for Public Policy Development, ESPOL Polytechnic University, Escuela SuperiorPolitécnica del Litoral, ESPOL, Faculty of Life Science, Campus Prosperina,Guayaquil, Ecuadore-mail: [email protected]
D. Ortega-Pachecoe-mail: [email protected]
P. HerreraFaculty of Life Science, ESPOL Polytechnic University, Escuela Superior Politécnicadel Litoral, ESPOL, Faculty of Life Science, Campus Prosperina, Guayaquil, Ecuadore-mail: [email protected]
© Springer Nature Switzerland AG 2019W. Leal Filho et al. (eds.), Handbook of Climate Change and Biodiversity,Climate Change Management, https://doi.org/10.1007/978-3-319-98681-4_2
25

26 D. Ortega-Pacheco et al.
inadequate housing and inadequate waste management (Herrera et al. 2017). Small-scale fishing is the main source of income in the communities and it is organized infishing associations. Around half of these products are sold to intermediaries and therest, in markets located in Guayaquil, Machala, and Playas. Mangrove extraction iscommonly destined to wood and carbon industries, construction and handcrafts (CI2016a). Tourism is another income source that demands food service, supplied bylocal fisheries, but generates considerable wastes (CI 2016b). Additionally, a greatnumber of commercial productive activities, especially those involving shrimp farm-ing (Bravo Cedeño 2010), take place around these populations, and they also facethe pressure of densely populated urban cities—with their associated pollution, suchas Guayaquil (Montaño and Robadue 1995).
There is an increasing necessity to generate valuable information to inform pol-icy design that allows tackling sustainability challenges in the GG, for it is also thesame location wheremost of the Ecuadorianmarine biodiversity seems to exist (Cruzet al. 2003). This area is being threatened by increasing rates of loss of species, suchas birds (Alava and Haase 2011), as well as ecological and socio-economic factors(Twilley et al. 2001), such as Urban, industrial, agricultural, as well as other aqua-culture development (Alvarez-Mieles et al. 2013). Environment and water qualityare particularly sensitive to changes in the use of land (Twilley et al. 1998). This factbecomes relevant considering that, according to (Cuesta et al. 2017), conservationsloopholes/voids have been identified precisely in zones located in the central andsouthern coastal areas.
Empowering and strengthening laws and regulations is necessary to achieve a legalprotection of endangered species and the conservation of the ecosystem. Decentraliz-ing the management of protected areas may contribute to this purpose, by improvingthe provision and impact of public services through an increased role of communi-ties and local governments in the decision-making (Wright et al. 2016). Accordingto official statements from organisms such as the Ministry of Environment (MAE),there is political will among Ecuadorian authorities to explore a decentralized man-agement system that transfers responsibilities and benefits as a mean to preserveenvironmental services that benefit the present and future users of the mangrove(MAE 2013). On this respect, there exist ongoing endeavours to design a network ofmarine protected areas that adapts to an institutional context and empowers differentgovernment levels to interconnect fragmented areas of the ecosystem and benefit userpopulations (CI 2016a, b). This must be evaluated in a double context, where (i) man-grove user communities continue living in considerable levels of poverty and theirincome via cash transfers will likely reduce due to budget restrictions. And (ii) thereis a growing interest in benefits that can be obtained from carbon sinks (Hamiltonand Lovette 2015) and protection against floods (Frappart et al. 2017)—particularlyin Guayaquil, the world’s third city with largest impact on GDP per capita due toclimate change (Hallegatte et al. 2013; Reguero et al. 2015). Both services (sink andprotection) could help develop a redistribution system of benefits in exchange forcompensations that weigh-off the opportunity cost of conservation, and help improvelife conditions of mangrove users and those who depend on that ecosystem, withinand outside the GG.

Mangrove Conservation Policies in the Gulf of Guayaquil 27
During the last decade, theEcuadorian government has designed and implementedset of public policies aiming to improve mangroves’ health and their capacity toprovide ecosystem services. The assumption underlying these actions is the idea thatmangrove conservation may be related to an improvement of local welfare withinthe population that lives and depends on this ecosystem. In particular, populationsthat cohabit with mangrove ecosystems execute actions that allow them to improvetheir life conditions, and thus their well-being. These actions are related (1) withresources that the policy claims to preserve and (2) the ways in which the communitycan organize in general to achieve their objectives, specifically, in relation to theimplementation of public policy (Andersson and Gibson 2007).
The extent to which policy objectives are met is the result of a dynamic wherethe subject of the policy, the community, plays a double role as both origin and des-tination. This, in turn, evidences the need for a careful analysis of experiences fromeach community in order to replicate the path obtained from successful case studies(Miteva et al. 2012). From this perspective, the present work attempts to answer therecent, yet global call (Brockington and Wilkie 2015) to further evaluation studiesthat pave the way for improving the understanding of how different political instru-ments produce distinct outcomes for populations. Based on locations in the GG, thispaper explores the relationship among three types of governance schemes [(i) cen-tralized, (ii) decentralized or communal, and (iii) decentralized or communal withcentralized incentives], different categories of protected areas, conservation prac-tices and their impacts in human welfare. The analysis derives from an exploratoryanalysis of secondary information. First, a critical revision of multiple sources thatinclude peer-reviewed publications, official and academic studies, as well as reportsand documentation on public policy. In addition, a recently completed study by Her-rera et al. (2017) provides updated input to understand the perspective from whichbeneficiaries of mangrove forests in the GG evaluate conservation policies. Thiswork has been designed as to provide baseline information that will allow deeperunderstanding of how public policy may impact human welfare, i.e. fishermen andcollectors in the GG.
The study continues with a second section in whichmangrove-related policies rel-evant to our area of study are presented chronologically. The third section describesthe different policies in consideration. The fourth section explores the state of imple-mentation of the policies froma critical perspective of the interaction of three spheres,by arranging the information collected so far into a Situation, Development and Per-formance scheme proposed by Schmid (2004), a tool that allows for the analyticalassessment of an institutional impact. Preliminary reflexionswill be procured in orderto identify future options for the design, implementation, evaluation and improve-ment of mangrove conservation policy in the area of study, which will be presented inthe end. The understanding derived from this analysis may inform policy-designersinvolved in mangrove conservation and welfare improvement in Ecuador.
28 D. Ortega-Pacheco et al.
Chronology of Policies Relevant to the Study Area
According the Ecuadorian Constitution of 2008, the population has the right to livein a safe and balanced environment (Art. 14), and the State should procure theconservation of nature by means of programs in which communities participate (Art.57). From a legal perspective, the State acknowledges and guarantees nature’s rights(Art. 71). Environmental legislation of 2003 reaffirms that mangrove conservation isin the public interest and thus, prohibits its destruction or exploitation. In addition,ancestral communities are allowed to request permission to serve as “mangroveguardians”.1
A chronological revision of the legal framework related tomangrove conservationin Ecuador identifies three periods relevant to this research. Each of them is charac-terized by the assigned role to mangrove land, the allocation of extraction rights andits assessed social value.
(1) 1970–1985: Between 1976 and 1979, unexploited lands were taken over, andthe redistribution of land forced the expansion of agricultural borders amidstlandowners, who did not want to lose their underused but biodiversity-rich terri-tories (IICA 1990). Furthermore, permissions were granted to shrimp farmers topromote the productive transformation of those territories (Coello et al. 2008).
(2) 1985–2010: In 1985 the conservation, protection and reposition of mangroveforests were declared “in the public interest”, via presidential decree and envi-ronmental law reforms. In 1999 the government conceded ancestral communi-ties the right to request “custodia” (Acuerdos de Uso Sustentable y Custodiadel Manglar) agreements. In 2000, the MAE communicated the guidelines toconcede custodias to ancestral communities and traditional users.
(3) 2010–present: A decade later in 2011 the MAE determined the economic costfor the loss of environmental goods and services—including restoration cost-s—provided by mangrove forests: $89,273.01/ha. In 2014, a new instrumentwith monetary incentives was introduced to promote the conservation and sus-tainable use of mangrove forests: Socio Manglar, an extension of the programSocioBosque. SocioManglar attempts to complement, consolidate and improvethe results achieved by the previous custodias in a way that guarantees conser-vation, while enhancing life conditions for users. By January 2017, 23 SocioManglar agreements were active in the coastal region.
The evolution of the Ecuadorian policy for mangrove conservation is marked byyear 2000 as the continuation of a neoliberal trend in the context of usage of naturalresources and ecosystem services (Beitl 2016), which in turn emerged like a potential
1During the final stage of the elaboration of this paper, the new Organic Code on the Environmentwas issued in Ecuador, motivated by the necessity of harmonizing and organizing the multifold andcomplex national legislation. The understanding of this dynamic is satisfactory: the unavoidablefact that this new legal framework will modify the competences of regulatory entities and guarantorsof mangrove conservation; as well as the interaction with user communities and subjects of publicpolicy.
Mangrove Conservation Policies in the Gulf of Guayaquil 29
solution to the conflict of land usage between shrimp farmers and mangrove custo-dias. The introduction of new policies implies the introduction of new systems ofincentives. The identification of these incentives is necessary to determine the extentto which results may be attributed to the objectives of the policy, which in additionto resource conservation, seek welfare improvement in the communities involved.
Stylized Facts of Policies Implemented in the Area of Study
In the present study, public policies are considered, according to Article no. 85 in theConstitution, as instruments oriented to implement the Ecuadorian rights, includingthe concept of “BuenVivir”. Such instruments include formal institutions (i.e. norms,regulations) that have been designed, implemented and evaluated by the organisationsinvolved in mangrove conservation.
The policieswere selected according to a criteria related to the impact or incidencecapacity of the policy in the selected mangrove areas. They have been applied todifferent levels, allowing for a comparison of their respective efficiency to alterhuman welfare. It must also be mentioned that this study has not considered policiesthat directly targeted welfare and could have additionally impacted the mangroveecosystem positively. In order to meet the objectives, the analysis will focus on thepolicy instruments described in Table 1.
The protected areas are managed by the government (centralized), represented bytheMAE and its local offices (State). Thus, they operate under prescriptive regulatorytools, known as command-and-control regulation. On the other hand,mangrove areasgranted as custodias belong to the State, but their administration has been delegatedto the organization that signed the agreement (decentralized). Upon approval of aproposed management plan, the government grants local mangrove users the accessto consumption and commercialization of mangrove resources, mainly crabs andclams. Thus, this is an instrument in which actors participate voluntarily in co-management with the governmental authority. Custodias are numerous but small interms of extension. Associations that have been granted a custodia are eligible forthe third type of policy: Socio Manglar program, which provides a monetary transferconditioned on the implementation of a yearly investment plan, in addition to themanagement plans.
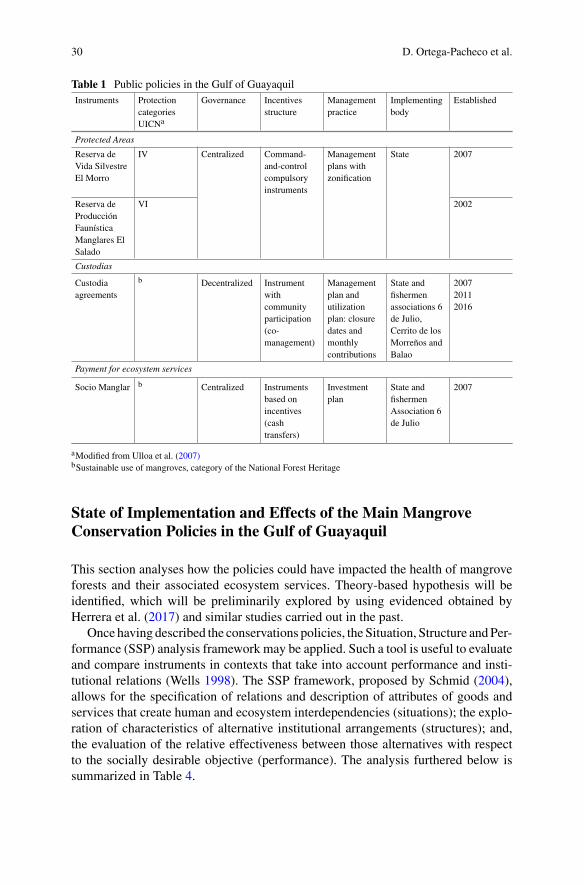
30 D. Ortega-Pacheco et al.
Table 1 Public policies in the Gulf of GuayaquilInstruments Protection
categoriesUICNa
Governance Incentivesstructure
Managementpractice
Implementingbody
Established
Protected Areas
Reserva deVida SilvestreEl Morro
IV Centralized Command-and-controlcompulsoryinstruments
Managementplans withzonification
State 2007
Reserva deProducciónFaunísticaManglares ElSalado
VI 2002
Custodias
Custodiaagreements
b Decentralized Instrumentwithcommunityparticipation(co-management)
Managementplan andutilizationplan: closuredates andmonthlycontributions
State andfishermenassociations 6de Julio,Cerrito de losMorreños andBalao
200720112016
Payment for ecosystem services
Socio Manglar b Centralized Instrumentsbased onincentives(cashtransfers)
Investmentplan
State andfishermenAssociation 6de Julio
2007
aModified from Ulloa et al. (2007)bSustainable use of mangroves, category of the National Forest Heritage
State of Implementation and Effects of the Main MangroveConservation Policies in the Gulf of Guayaquil
This section analyses how the policies could have impacted the health of mangroveforests and their associated ecosystem services. Theory-based hypothesis will beidentified, which will be preliminarily explored by using evidenced obtained byHerrera et al. (2017) and similar studies carried out in the past.
Once having described the conservations policies, the Situation, Structure andPer-formance (SSP) analysis framework may be applied. Such a tool is useful to evaluateand compare instruments in contexts that take into account performance and insti-tutional relations (Wells 1998). The SSP framework, proposed by Schmid (2004),allows for the specification of relations and description of attributes of goods andservices that create human and ecosystem interdependencies (situations); the explo-ration of characteristics of alternative institutional arrangements (structures); and,the evaluation of the relative effectiveness between those alternatives with respectto the socially desirable objective (performance). The analysis furthered below issummarized in Table 4.

Mangrove Conservation Policies in the Gulf of Guayaquil 31
Situation
Within this analytical framework, the elements that relate to each other in order tobuild up the situation, are identified as: transaction (unit of analysis), interdependen-cies and stakeholders (government, communal organization and users). A transactionis an interaction space between individuals and contexts in which costs are alwaysinvolved. In this case, the reference lies on the provision of mangrove conservationand its relation with ecosystem services to fishermen residing in the communitieswithin the area of study. Such services include reproduction and feeding of differentkinds of fish, molluscs and crustaceans of considerable importance for good nutritionand as a sustainable economic source.
Three key interdependencies that seem to emerge in fishing communities in theGG, as hinted by the characteristics of mangrove services and actors involved intransactions of conservation provision: (1) potential incompatible or alternative useof the mangrove for extractive purposes, reaching the point where the quantity andquality of the catches are affected; (2) price problems associated with the provisionof conservation services, where the marginal cost of additional users is too low whencompared to the very high cost of exclusion of extractive users from neighboringcommunities; and (3) lack of information regarding transaction costs.
A systematic analysis of the problem of incompatible use of the mangrove withregards to all economically relevant species according to the inhabitants of the com-munities, is out of the scope of this study.What is being discussed is the incompatibleor alternative use of the mangrove for extractive activities related to clam catching byaffiliatedmembers of the considered associations that have been granted a custodia. Itsuffices to mention that, first, the interdependencies emerging from the incompatibleuse of mangroves are linked to questions related to property rights over the extractedresource. Solutions to this problem, once the extraction rights have been allocatedand effectively restricted, will essentially depend on whether the continuous use ofmangrove for extraction purposes contributes more to members of the community(or external users) than the negative impact on the revenues of affiliated members.Consequently, associates might consider accepting a payment for discontinuing thenon-compliance of fishing closures and respecting extraction rights or implementingsurveillance activities in joint cooperation with the public force and environmentalauthorities, in such a way that private practices of a user do not affect others’.
Secondly, while the extraction of clams is a service subject to consumption rivalry(i.e. Fisherman man A may not share the catch obtained by Fisherman B), themarginal cost of admitting an additional member is virtually zero, once exclusiveextraction rights have been allocated, following an optimal distribution scheme thatrespects population dynamics of the resource. Additionally, a certain level of jointconsumption of the clams’ quality can be observed, i.e. all members should obtainthe same quality in a system of extraction rights. Allocating rights and identifyingthe optimal fishing level are characterized by high fixed costs and almost null costsof incorporating an additional user. For this reason, the price of extraction rightsshould allow for the distribution, among all users, of the—relatively—high fixed
32 D. Ortega-Pacheco et al.
costs associated with the design, implementation and administration of the systemof extraction rights.
Thirdly, incomplete information on mangrove conservation and its effect on thequantity and quality of the catch may hinder the service provision, as well as affectcosts of transaction. Although it is possible for fishermen associations to controlthe catches of its users by keeping track of the quantity and sizes of their catches,determining and monitoring the extraction of non-members and foreign fishermenis more complicated, if not impossible, or at least very costly. This is particularlyimportant when considering the lack of technical and scientific information relatedto optimization of the catch of clams and its population conditions. In many cases,associated and non-associated users ignore the specific steps that must be undertakenin order to achieve a certain quantity and quality of the catch, contributing to the levelof uncertainty and transaction costs associated to the de facto arrangements betweenthe association accountable for the custodia and its neighbors, including fishermenfrom other regions, also known as independents or pirates (i.e. free riders).
Structure
The alternative structures presented include: (i) command-and-control compulsoryinstruments of direct action as in the case of protected areas; (ii) indirect actioninstruments with decentralized governance schemes created to reconcile commu-nity development and conservation by promoting the sustainable use or alternativeincome sources such as custodias (i.e. co-management); (iii) direct instruments witheconomic incentives conditioned on assessable performance, which is presumablyable to achieve additional progress by linking conservation and development, as inthe case of Socio Bosque (i.e. co-management with cash payments as incentives).
Performance
In this section, the characteristics of the alternative institutional arrangements—-types of policy instruments for the management of mangrove areas—will be consid-ered in order to eventually make predictions about their likely outcomes. Followingthese predictions, a discussion regarding the expected future performance of thesestructures in the considered associations, will be furthered. Potential strengths andweaknesses of the policies will be identified, considering the recent data obtained byHerrera et al. (2017) and similar works in the past.
According to Miteva et al. (2012), the diversity of impacts caused by decen-tralized policies is explained by the ambiguity of the term “decentralization”. Theimplications of a decentralized policy may vary in terms of the policy’s scope, theperceived benefits, the rights granted to the different populations and also, the deci-sion power—increasing the authority of bureaucrats at lower levels or the authorityto local users (Larson and Soto 2008). Many developing countries have transitionedtowards decentralized forestry governance schemes during the last 25 years (Phelpset al. 2010), on the premise that rights and responsibilities of local actors wouldincrease (Agrawal and Ostrom 2008). In fact, decision-making autonomy at alocal level is associated with greater levels of ecosystem services (i.e. carbon)

Mangrove Conservation Policies in the Gulf of Guayaquil 33
and greater benefits to living conditions (Chhatre and Agrawal 2009). Despitesuccessful experiences, several authors state that the decentralized implementationstill faces big challenges: inefficiencies and weaknesses in the legal and institutionalframeworks have resulted in mismanagement and misappropriation; a high degreeof non-compliance; conflicts among users; and tension and lack of trust among thedifferent levels and sections of the government. These factors have resulted in theweakness or lack of empowerment of the poorest users in the system (Wever et al.2012). In a recent study, Wright et al. (2016) point out that decentralization maypositively impact deforestation while involving communities and local governments,by relating their interests with local political actors and their corresponding agendas.
In the case of Ecuador, Beitl (2017) argues that it is critical for the success ofcustodias to empower fishermen with administrative rights. Despite the fact thatthey promote quantitative and qualitative improvements of the catch, they could alsolimit access and mobility of fishermen, which could result in a reconfiguration offishing areas and displacement of non-members from their customary work space.In fact, current policies might not seem to introduce enough individual incentives toabide by the regulations, but they do seem to introduce enough incentives at grouplevel to safeguard the base of the resources, that is, the habitat. The improvement ofthe habitat’s conditions should cause indirect and positive effects in fishing activities(Barbier 2003). This way, explains Beitl, the policies seem to have promoted a notionof group appropriation that has fostered care for the environment.
An integral assessment of the results obtained by these policies is outside therange of this study, however there are a few available. Among these few, the studyof Coello et al. (2008) stands out for evaluating 26 custodias granted between 2000and 2004. Despite the problems outlined and the diversity of results, general positiveeffects were observed: empowerment of associations, increase of fishing output,enhancement of living conditions, decrease of mangrove deforestation and conflictresolution with shrimp farmers. Technical assistance provided by non-governmentalorganizational has been relevant in successful custodias.
The recent work of Herrera et al. (2017) provides updated data on the perceptionof the effectiveness of the three instruments, according to fishermen residing inthe Gulf of Guayaquil. Table 2 shows a detailed summary of the studied locationsand approximate population of fishermen and collectors, according to each policy.Figure 1 shows the geographic locations of the study.
The gathering of primary data involved the application of a questionnaire com-pleted by a sample of 435 individuals during February to November 2017; the esti-mated universe was 2138 fishermen and collectors. The elaboration of the surveywas previously designed and tested with input obtained from focus groups in whichkey actors (among others, local authorities, non-governmental actors, governmentalactors, fishermen, collectors) took part.
The study concludes that the policies have favoured the protection and restoringof mangroves in the GG (approximately 1515 ha) during the period 2002–2016,compared to locations in the GG where no policies were implemented. Table 3summarizes the results from the survey related to perceptions of the effectiveness ofthe policies under analysis.
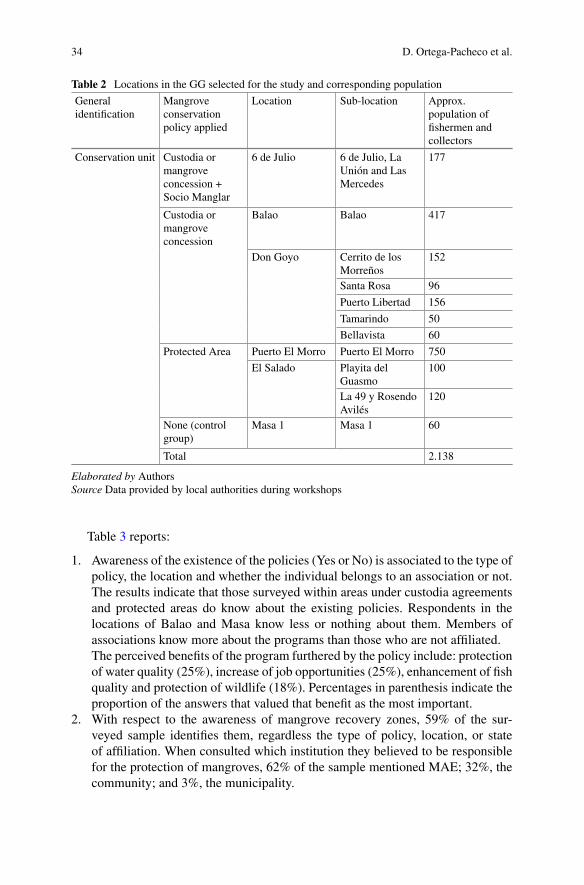
34 D. Ortega-Pacheco et al.
Table 2 Locations in the GG selected for the study and corresponding population
Generalidentification
Mangroveconservationpolicy applied
Location Sub-location Approx.population offishermen andcollectors
Conservation unit Custodia ormangroveconcession +Socio Manglar
6 de Julio 6 de Julio, LaUnión and LasMercedes
177
Custodia ormangroveconcession
Balao Balao 417
Don Goyo Cerrito de losMorreños
152
Santa Rosa 96
Puerto Libertad 156
Tamarindo 50
Bellavista 60
Protected Area Puerto El Morro Puerto El Morro 750
El Salado Playita delGuasmo
100
La 49 y RosendoAvilés
120
None (controlgroup)
Masa 1 Masa 1 60
Total 2.138
Elaborated by AuthorsSource Data provided by local authorities during workshops
Table 3 reports:
1. Awareness of the existence of the policies (Yes or No) is associated to the type ofpolicy, the location and whether the individual belongs to an association or not.The results indicate that those surveyed within areas under custodia agreementsand protected areas do know about the existing policies. Respondents in thelocations of Balao and Masa know less or nothing about them. Members ofassociations know more about the programs than those who are not affiliated.The perceived benefits of the program furthered by the policy include: protectionof water quality (25%), increase of job opportunities (25%), enhancement of fishquality and protection of wildlife (18%). Percentages in parenthesis indicate theproportion of the answers that valued that benefit as the most important.
2. With respect to the awareness of mangrove recovery zones, 59% of the sur-veyed sample identifies them, regardless the type of policy, location, or stateof affiliation. When consulted which institution they believed to be responsiblefor the protection of mangroves, 62% of the sample mentioned MAE; 32%, thecommunity; and 3%, the municipality.

Mangrove Conservation Policies in the Gulf of Guayaquil 35
Fig. 1 Locations included in the study. Source Herrera et al. (2017)
3. Respondents were asked to rank between 1 and 5, being 5 equivalent to “com-pletely agree”, how effective they considered governmental measures to be, interms of contribution to: the community, mangrove conservation, harvesting of
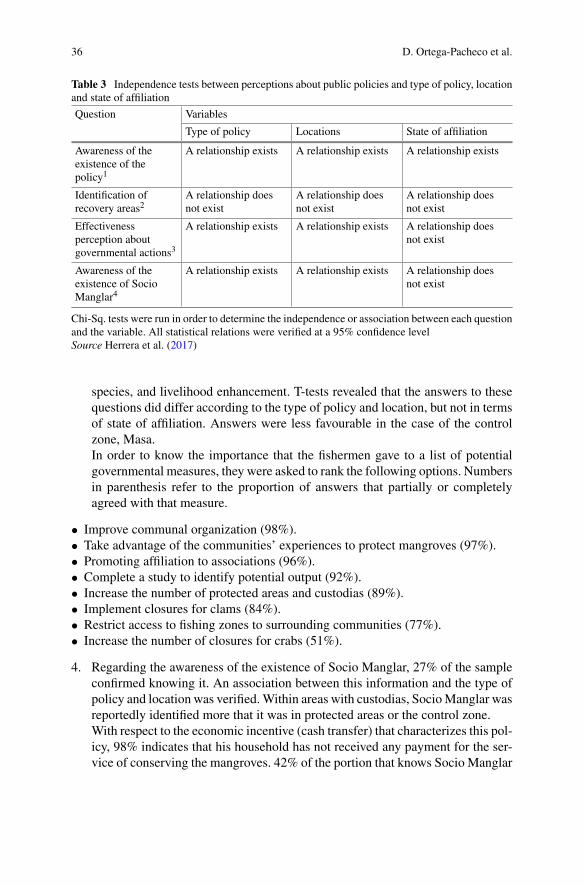
36 D. Ortega-Pacheco et al.
Table 3 Independence tests between perceptions about public policies and type of policy, locationand state of affiliation
Question Variables
Type of policy Locations State of affiliation
Awareness of theexistence of thepolicy1
A relationship exists A relationship exists A relationship exists
Identification ofrecovery areas2
A relationship doesnot exist
A relationship doesnot exist
A relationship doesnot exist
Effectivenessperception aboutgovernmental actions3
A relationship exists A relationship exists A relationship doesnot exist
Awareness of theexistence of SocioManglar4
A relationship exists A relationship exists A relationship doesnot exist
Chi-Sq. tests were run in order to determine the independence or association between each questionand the variable. All statistical relations were verified at a 95% confidence levelSource Herrera et al. (2017)
species, and livelihood enhancement. T-tests revealed that the answers to thesequestions did differ according to the type of policy and location, but not in termsof state of affiliation. Answers were less favourable in the case of the controlzone, Masa.In order to know the importance that the fishermen gave to a list of potentialgovernmental measures, they were asked to rank the following options. Numbersin parenthesis refer to the proportion of answers that partially or completelyagreed with that measure.
• Improve communal organization (98%).• Take advantage of the communities’ experiences to protect mangroves (97%).• Promoting affiliation to associations (96%).• Complete a study to identify potential output (92%).• Increase the number of protected areas and custodias (89%).• Implement closures for clams (84%).• Restrict access to fishing zones to surrounding communities (77%).• Increase the number of closures for crabs (51%).
4. Regarding the awareness of the existence of Socio Manglar, 27% of the sampleconfirmed knowing it. An association between this information and the type ofpolicy and location was verified.Within areas with custodias, SocioManglar wasreportedly identified more that it was in protected areas or the control zone.With respect to the economic incentive (cash transfer) that characterizes this pol-icy, 98% indicates that his household has not received any payment for the ser-vice of conserving the mangroves. 42% of the portion that knows Socio Manglar
Mangrove Conservation Policies in the Gulf of Guayaquil 37
reported a neutral stance when evaluating the argument “community resourcesare well administered”.
The information presented in Table 3. has been considered to complete the thirdcolumn of the SPP framework in Table 4. The performance ofmangrove conservationpolicies in the GG can be condensed with results obtained from the preliminaryanalysis. Basically, the performance effects reported are observed in the three typesof policies at different scales.
About the combined use of incentives to improve the performance of custo-dias. Empirical estimations based on field experiments in other Ecuadorian regions(Moreno-Sánchez et al. 2015) seem to support the notion that additional revenuesfrom Socio Manglar could be enough to incentivise appropriate behaviour by affili-ated users, and additionally pave the way for a collective impact on the ecosystem’shealth, i.e. program’s transfer payment equivalent to the opportunity cost of surveil-lance, administration, participation in meetings and other activities. Similar to Her-rera et al., Moreno-Sánchez’ study indicates that users’ behaviour is greatly impulsedby motifs such as the well-being of other members of the community—protectionof water quality, increase of job opportunities and improvement of fish quality, andin the same line as Beitl’s discussion, it was demonstrate that fishermen who wereallowed to coordinate actions (including the extension of fishing permits to third par-ties), extracted 20% less and invested almost twice in administration. Consequently,there seems to be a way to complement direct incentives by strengthening collec-tive action and communication capacities and coordination with the investment ofresources from Socio Manglar.
Herrera’s work further relates to Moreno-Sánchez, while both studies report evi-dence that supports the possibility of exploring hybrid systems in which more thanone tool or instrument could be combined, allowing the maximization of benefitswith the least additional financial resources. In particular, there exist potential bene-fits of combining custodias with SocioManglar agreements in communities that havebeen impacted by ministerial decrees declaring their territories as protected areas. Apotential challenge to these hybrid approaches might be transaction costs associatedto the identification and implementation of those alternative extraction practices thatcould result in provable changes in quantity and quality of fish in specific custodiaareas.
Previous studiesmight not compare toHerrera’swhen considering the effect intro-duced by large shrimp farms in neighbouring areas, both in ecosystems’ health dueto quality of the water they dispose and the incentives they represent to weaken com-munity organization, given the potential effect on the demand of collective benefits.The impact of large urban areas in the vicinity of mangrove forests is yet anotherthreat to a habitat’s health, which in turn threatens species in terms of quantity andquality. In this context, the positive effect of Socio Manglar may dissipate due tothe immediate access to alternative sources of income or disincentives by poachingactivities.

38 D. Ortega-Pacheco et al.
Table 4 SPP framework applied to mangrove conservation policies in the Gulf of Guayaquil
Situation Structure Performance
Transaction:Service—provision ofmangrove conservation and itsrelation with provisioningservice to affiliated fishermen.
Positive perception of theeffectiveness of policies andthe government
i. Centralized—protected areasunder state administrationProtected areas:
Perceived benefits in terms ofjob opportunities, water,fishing and wildlife protection
Interdependencies:• Incompatible use of theresource and consumptionrivalry
· Price problems (low marginalcost and high cost ofexclusion)• Lack of information oftransaction costs
– RPF Manglares El Salado– RVS Manglares El Morro
Positive perception withrespect to the importance offostering a high level ofempowerment andresponsibility over theresource
Perceived subjective measuresof well-being related tobenefits derived from living inmangrove ecosystems
Stakeholders ii. Decentralized—custodias inco-management between thestate and the community
Important scheme andwillingness to participate
• Government: complexadministrative attributionsand jurisdictions
• Communal organization:Fishermen associations
• Users
iii. Decentralized withcentralized incentives—SocioManglar in co-managementbetween the state and thecommunity
Relatively negative perceptionregarding the appropriatemanagement of funds (weaktrust)Unsatisfied basic needsindexes (NBI) have improved,due to the impact of otherpolicies
Characteristics ofparticipants in theinterdependencies:
• Income uncertainty Control Zone: Masa (Noassociation, custodiaagreements or direct influenceof a protected area)
Higher level ofacknowledgement
• Opportunist behaviour ofexternal actors
High level ofsolidarity—concern for thewell-being of other membersof the community

Mangrove Conservation Policies in the Gulf of Guayaquil 39
Future Perspectives of Conservation Policies in the GG
The chronological review of mangrove conservation policies, the arrangement ofthis information into the analytical SPP framework, and finally the comparison ofthe situation in the Gulf of Guayaquil to foreign experiences and previous nationalstudies, led to the formulation of the following recommendations. These proposalsderive from the perceived conflicts in the relations of interdependence between theecosystem and its users, as well as the identified weaknesses in the management ofprotected areas and associations as “custodios” of the mangrove, and of course, theavailability of information to researchers.
(1) Explore the REDD+ mechanism to provide financial sustainability and fis-cal surplus, while decentralizing management and distributing internationalresources to decentralized governments and communities. Connectivity couldbe further guaranteed through the Network of Marine Coastal Areas. This maybe institutionalized by incorporating it in the renewed management plans andsocio-ecological modelling for decision-making (Arias-Hidalgo et al. 2013;Busch et al. 2012; Frappart et al. 2017).
(2) Use of subsidies or tax systems as alternatives of funding for initiatives thathave achieved impact (Rode et al. 2016).
(3) Complement with hybrid systems and buffer areas where a sustainable useof aquaculture, geographic origin and improvement of conservation units arefurthered (i.e., carbon neutrality in protected areas and custodias) (Alava andHaase 2011; Egelyng 2014; Fisher et al. 2011).
(4) Effectiveness evaluation of each type of instrument (Brockington and Wilkie2015).
(5) Improve integral planning at an executive level to avoid power and jurisdictiondisputes (Wever et al. 2012).
(6) Strengthen the role of organizations that provide technical assistance, such thatit includes follow-ups to the agreements (Bravo 2013; Curzon and Kontoleon2016).
(7) Guarantee exclusive rights and reduce transaction costs by improving infor-mation for optimal extraction and implementing a registration system in asso-ciations (Aburto-Oropeza et al. 2008; Beitl 2014a).
(8) Facilitate the optimization of fishing portfolio and transfer payments to reduceincome uncertainty and high transaction costs (Moreno-Sánchez et al. 2015;Raes et al. 2016).
(9) Construct capacities that builds up confidence and maintain participation byconsidering the observed impact in the bettering of living conditions (Beitl2014b).
(10) Productive improvement and income diversification: access tomarkets withoutintermediaries and value-aggregation (Clements et al. 2014).
Regarding future perspectives, the financial sustainability of SocioManglar programis a concern. Especially considering the fiscal conditions of Ecuador in the following

40 D. Ortega-Pacheco et al.
years, in light of decreasing oil revenues and increasing foreign debt. Thus, it becomesrelevant to consider the exploration of alternative funding mechanisms for initiativesthat have proven to impact positively. An option might be the implementation ofsubsidies or tax systems. Typically, these instruments imply income redistributionamong the user sectors and beneficiaries of the healthy conditions of the mangroves,i.e. community collectors, shrimp farmers and urban populated centres.
In order to guarantee changes to human welfare and the ecosystem’s health, alter-native resources might be sought to maximize the benefits of optimal fishing extrac-tion. An alternative might be technical assistance that expose associations to betterpractices (e.g. food processing and preservation) along the value-chain, as well asassociative capacities for crab and clam extraction through commercial sales (aliveand pulp). Gender roles may be empowered considered that men extract and womenprocess, with a better distribution of benefits based on effort and knowledge. Productdiversification may involve the sales of decorative and crafty products with added-value.
Conclusions
The discussion presented supports the hypothesis that the impact ofmangrove conser-vation policies might happen by alternative mechanisms different than the provisionof larger fishing resources or catches, and instead, they might impact the subjectiveelements of welfare, such as the potential organizational capacities and increasedmember participation. Although this is the reality of communities in the GG, theycannot be extended to diagnose the general situation of all peoples under mangroveconservation policies. In this sense, a systematic analysis of a sample of custodiasis currently necessary to understand the cultural context in which these mechanismswere implemented, and also identify key factors that explain the resulting level ofcollaboration, whether it was higher or lower. Future research should also targetthe improvement of evaluation systems of the studied policies in a context of rela-tions of governances schemes, organization and socio-ecological modelling with afocus on scenery. The resulting information will likely render valuable input for thedesign of hybrid instruments that combine international resource flows, as well asthose from REDD +, and the articulation of management networks of conservationunits, deconcentrating responsibilities and benefits while at the same time approachthe sustainable use and development needs of user populations. Additionally, incor-porating risks and uncertainty in the decision-making process of mangrove usersmay allow for a better understanding of their relationship with the implementationand effectiveness of the policies under analysis, while at the same time increasingpublic funds that might be required to outweigh the total cost of mangrove conser-
Mangrove Conservation Policies in the Gulf of Guayaquil 41
vation. This measure demands a broad research agenda that is able to incorporateinstruments with external and internal validity, and that are replicable in order togeneralize findings, as well as explore specific space-time relationships. Overall, theavenue towards the development of appropriate environmental policies, in social andecological terms, depends on a better understanding of the context.
References
Aburto-Oropeza O, Ezcurra E, Danemann G, Valdez V, Murray J, Sala E (2008) Mangroves in theGulf of California increase fishery yields. In: Proceedings of the National Academy of Sciences,pp 10456–10459
Agrawal A,OstromE (2008) Decentralization and community-based forestry: learning from experi-ence. In: Decentralization, forests and rural communities: policy outcomes in South and SoutheastAsia. SAGE, Los Angeles
Alava J, Haase B (2011) Waterbird biodiversity and conservation threats in Coastal Ecuador andthe Galapagos Islands. In: Grillo O, Venora G (eds) Ecosystems biodiversity. Rijeka
Alvarez-MielesG, IrvineK,GriensvenAV,Arias-HidalgoM, TorresA,Mynett AE (2013) Relation-ships between aquatic biotic communities and water quality in a tropical river–wetland system(Ecuador). Environ Sci Policy 34:115–127
Andersson K, Gibson CC (2007) Decentralized governance and environmental change: local insti-tutional moderation of deforestation in Bolivia. J Policy Anal Manage. https://doi.org/10.1002/pam.20229
Arias-Hidalgo M, Bhattacharya B, Mynett AE, van Griensven A (2013) Experiences in using theTMPA-3B42R satellite data to complement rain gauge measurements in the Ecuadorian coastalfoothills. Hydrol Earth Syst Sci 17(7):2905–2915. https://doi.org/10.5194/hess-17-2905-2013
Barbier EB (2003) The role of natural resources in economic development. Aust Econ Pap42(2):253–272. https://doi.org/10.1111/1467-8454.00198
Beitl CM (2014a) Adding environment to the collective action problem: individuals, civil society,and the mangrove-fishery commons in Ecuador. World Dev 56:93–107. https://doi.org/10.1016/j.worlddev.2013.10.026
Beitl CM (2014b) Navigating over space and time: fishing effort allocation and the developmentof customary norms in an open-access mangrove estuary in Ecuador. Hum Ecol 42(3):395–411.https://doi.org/10.1007/s10745-014-9655-7
Beitl CM (2016) The changing legal and institutional context for recognizing nature’s rights inEcuador: mangroves, fisheries, farmed shrimp, and coastal management since 1980. J Int WildlLaw and Policy 19(4). http://doi.org/10.1080/13880292.2016.1248688
Beitl CM (2017) Decentralized mangrove conservation and territorial use rights in Ecuador’smangrove-associated fisheries. Bull Mar Sci 93(1). http://doi.org/10.5343/bms.2015.1086
BravoM (2013) Alianza público-privada para la gestión de los manglares del Ecuador: los acuerdospara el uso sustenible y custodia. Contrato No. EPP-I-00-06-00013-00. USAID Costas y BosquesSostenibles
Bravo Cedeño M (2010) Interpretación del estudio multitemporal (CLIRSEN 1969–2006) de lascoberturas de manglar, camaroneras y áreas salinas en la franja costera de Ecuador continental.Universidad de Guayaquil, Guayaquil
Brockington D, Wilkie D (2015) Protected areas and poverty. Philos Trans R Soc B: Biol Sci370(1681). https://doi.org/10.1098/rstb.2014.0271
Busch J, Lubowski RN, Godoy F, Steininger M, Yusuf AA, Austin K et al (2012) Structuringeconomic incentives to reduce emissions from deforestation within Indonesia. In: Proceedings ofthe National Academy of Sciences of the United States of America, vol 109, pp 1062–7. http://doi.org/10.1073/pnas.1109034109

42 D. Ortega-Pacheco et al.
Chhatre A, Agrawal A (2009) Trade-offs and synergies between carbon storage and livelihoodbenefits from forest commons. In: Proceedings of the National Academy of Sciences of theUnited States of America, vol 106, pp 17667–17670. http://doi.org/10.1073/pnas.0905308106
CI (2016a) GEF-6 PROJECT IDENTIFICATION FORM: implementation of the strategic plan ofEcuador’s Mainland Marine and coastal protected areas network
CI (2016b) Improving mangrove conservation across the Eastern Tropical Pacific Seascape (ETPS)through coordinated regional and national strategy development and implementation
Clements T, Suon S, Wilkie DS, Milner-Gulland EJ (2014) Impacts of protected areas on locallivelihoods in Cambodia. World Dev 64:S125–S134. https://doi.org/10.1016/j.worlddev.2014.03.008
Coello S,VinuezaD,AlemánR (2008)Evaluación del desempeño de los acuerdos de uso sustentabley custodia de manglar de la zona costera del Ecuador. MAE, pp 1–55
Cruz M, Gabor N, Mora E, Jiménez R, Mair J (2003) The known and unknown about marinebiodiversity in Ecuador (Continental e Insular). Revista Gayana 67(2):232–260
Cuesta F, Peralvo M, Merino-Viteri A, Bustamante M, Baquero F, Freile JF et al (2017). Priorityareas for biodiversity conservation in mainland Ecuador. Neotropical Biodiversity 3(1), 93–106
Curzon HF, Kontoleon A (2016) From ignorance to evidence? The use of programme evaluation inconservation: evidence from a Delphi survey of conservation experts. J Environ Manag. http://doi.org/10.1016/j.jenvman.2016.05.062
Egelyng H (2014) Informed markets as policy instrument for environmental governance of bufferzones around protected areas: a global context and European cases (ECPR Joint Sessions). Sala-manca, Spain
Fisher B, Edwards DP, Giam X, Wilcove DS (2011) The high costs of conserving Southeast Asia’slowland rainforests. Front Ecol Environ 8(9):329–334
Frappart F, Bourrel L, Brodu N, Riofrío Salazar X, Baup F, Darrozes J, Pombosa R (2017) Monitor-ing of the spatio-temporal dynamics of the floods in the Guayas Watershed (Ecuadorian PacificCoast) using global monitoring ENVISAT ASAR images and rainfall data. Water 9(1):1–20
Hallegatte S, Green C, Nicholls RJ, Corfee-Morlot J (2013) Future flood losses in major coastalcities. Nat Clim Change 3:802
Hamilton SE, Lovette J (2015) Ecuador’s Mangrove forest carbon stocks: a spatiotemporal analysisof living carbon holdings and their depletion since the advent of commercial aquaculture. PLoSONE 10(3)
Herrera P, Calles A, PozoM,Villa-CoxG,Ortega-PachecoD, Coronel J (2017) Políticas públicas deconservación de los manglares y bienestar de pescadores y recolectores en el Golfo de Guayaquil.Guayaquil
IICA (1990)Modernización de la agricultura enAméricaLatina y elCaribe. Instituto Interamericanode Cooperación para la Agricultura, San José
Larson AM, Soto F (2008) Decentralization of natural resource governance regimes. Annu RevEnviron Resour 33(1):213–239. https://doi.org/10.1146/annurev.environ.33.020607.095522
MAE (2013) Objetivos Estratégicos de Sociobosque. Retrieved from http://sociobosque.ambiente.gob.ec/node/173
Miteva DA, Pattanayak SK, Ferraro PJ (2012) Evaluation of biodiversity policy instruments: whatworks and what doesn’t? Oxford Rev Econ Policy 28(1):69–92. https://doi.org/10.1093/oxrep/grs009
MontañoM,RobadueD (1995)Monitoreo ymanejo de la calidad del agua costera. In: OchoaM (ed)Manejo Costero integrado en Ecuador. Guayaquil, Programa de Manejo de Recursos Costeros
Moreno-Sánchez R, Maldonado J, Campoverde D, Solís C, Gutiérrez, C, Bruner A (2015) Insumostécnicos para fortalecer las concesiones de manglar en Ecuador a través de Socio Bosque: com-binando técnicas de valoración económica y juegos experimentales (Serie Técnica No. 40)
Phelps JW, Webb EL, Agrawal A (2010) Does REDD+ threaten to recentralize forest governance?Science 328(5976):312–313

Mangrove Conservation Policies in the Gulf of Guayaquil 43
Raes L, D’Haese M, Aguirre N, Knoke T (2016) A portfolio analysis of incentive programmesfor conservation, restoration and timber plantations in Southern Ecuador. Land Use Policy51:244–259
Reguero BG, Losada I, Díaz-Simal P, Méndez F, Beck M (2015) Effects of climate change onexposure to coastal flooding in Latin America and the Caribbean. PLoS ONE 10(7)
Rode J, Wittmer H, Emerton L, Schröter-Schlaack C (2016) “Ecosystem service opportunities”: apractice-oriented framework for identifying economic instruments to enhance biodiversity andhuman livelihoods. J Nat Conserv 33:35–47. https://doi.org/10.1016/J.JNC.2016.07.001
Schmid A (2004) Conflict and cooperation: institutional and behavioral economics. BlackwellPublishing Ltd, Oxford
Twilley R, CárdenasW, Rivera-Monroy V, Espinoza J, Suescum R, Armijos M, Solórzano L (2001)The Gulf of Guayaquil and the Guayas River Estuary, Ecuador. In: Seeliger U, Kjerfve B (eds)Coastal marine ecosystems of Latin America, vol 144. Springer, Berlin
Twilley R, Rivera-Monroy VH, Chen R, Botero L (1998) Adapting an ecological mangrove modelto simulate trajectories in restoration ecology. Mar Pollut Bull 37:404–419
Ulloa R, Aguirre M, Camacho J, Cracco M, Dahik A, Factos M, Von Horstman E. et al. (2007)Situación Actual del Sistema Nacional de Áreas Protegidas. Informe Nacional - Ecuador . IICongreso Latinoamericano de Áreas Protegidas. Quito.
Wells MP (1998) Institutions and incentives for biodiversity conservation. Biodivers Conserv7(6):815–835. https://doi.org/10.1023/A:1008896620848
Wever L, Glaser M, Gorris P, Ferrol-Schulte D (2012) Decentralization and participation in inte-grated coastal management: policy lessons from Brazil and Indonesia. Ocean Coast Manage66:63–72
Wright GD, Andersson KP, Gibson CC, Evans TP (2016) Decentralization can help reducedeforestation when user groups engage with local government. Proc Natl Acad Sci USA113(52):14958–14963. https://doi.org/10.1073/pnas.1610650114
Biodiversity Issues Should Be BetterTaken into Account in the EnergyTransition
Agnès Hallosserie, Hélène Soubelet, Hélène Leriche, Patricia Savinand Jean-François Silvain
Abstract Climate and biodiversity issues cannot be considered onewithout the otherbecause of the multiple interactions and interdependencies between them. Solutionsfor climate mitigation relying on the evolution of the energy sector should takethis intertwining into account. The French Foundation for Research on Biodiversity(FRB) and ORÉE, a multi-stakeholder NGO advocating the sharing of good envi-ronmental practices among stakeholders, explored potential ways to approach thecomplexity of climate, energy and biodiversity issues in order to develop sustainablesolutions. They have been studying the links and interactions between renewableenergy and biodiversity through, among others, a conference organized by FRB anda book published by ORÉE. In both the conference and the book, energy producersand suppliers discussed their level of awareness on the issue and presented mea-
A. Hallosserie (B) · H. Soubelet · J.-F. SilvainFrench Foundation for Research on Biodiversity, 195 rue Saint Jacques, 75005 Paris, Francee-mail: [email protected]
H. Soubelete-mail: [email protected]
J.-F. Silvaine-mail: [email protected]
J.-F. SilvainInstitut de Recherche pour le Développement, 195 rue Saint Jacques, 75005 Paris, France
H. Leriche · P. SavinAssociation ORÉE, 75010 42 rue du Faubourg Poissonnière, Paris, Francee-mail: [email protected]
P. Savine-mail: [email protected]
P. SavinDS Avocats, 6 rue Duret, 75116 Paris, France
© Springer Nature Switzerland AG 2019W. Leal Filho et al. (eds.), Handbook of Climate Change and Biodiversity,Climate Change Management, https://doi.org/10.1007/978-3-319-98681-4_3
45

46 A. Hallosserie et al.
sures taken to avoid, reduce or offset biodiversity impacts when installing renewableenergy infrastructures. This experience sharing highlighted several ways forward inorder to reconcile biodiversity protection with the shift towards sustainable energy.Thus, the need to better take biodiversity into account in the energy transition wasvoiced both by businesses and the research community. This paper presents the firstoutcomes of the reflections led at the national level by multiple stakeholders, in orderto generate further ideas for research to support the design and implementation ofintegrated climate change and biodiversity policies.
Introduction
Climate change has numerous negative, well-established effects for human popula-tions (IPCC 2014). Solutions to mitigate climate change are now widely promotedacross the world, with an increasing urge in the wake of the adoption of the ParisAgreement in December 2015. Action is required in all areas of human lifestyle,including the energy we use and how we produce it. Many European countries,including France, have identified the energy sector as a strategic area to achieve theirtargets of reducing carbon emissions by developing renewables and phasing out fossilfuels (French Government 2015, 2017). This is known as the Energy Transition.
Biodiversity loss is the other key global challenge faced by our societies, andthe result of multiple and varied drivers, including climate change (Ceballos et al.2017; Crooks et al. 2017; Hallmann et al. 2017). The main driver however is land-use change, natural or semi-natural areas being converted into intensive agriculturallands or cities as global population grow (Tilman et al. 2017). Land is thereforeunder competition for different uses, including renewable energy production, foodproduction and biodiversity conservation.
In France, the Energy Transition for GreenGrowth Act aims to reduce GHG emis-sions and nuclear power, while increasing the share of renewables in the energy mix(French Government 2015). Three complementary courses of action should allow toreach these objectives: energy sobriety, which implies a change of behaviour through-out society; energy efficiency, which is achieved through technical improvement; anddevelopment of sustainable energy (Trommetter 2017). These goals, in line with theParis Agreement, led to the blooming of renewables. In 2015, they provided 10% ofenergy, including 40% from biomass (Cavaud et al. 2016), these figures highlightinga shift of the sector supported by major stakeholders. In parallel, the law for thereconquest of biodiversity, nature and landscapes (French Government 2016) setshigh ambitions in line with CBD Aichi Targets and the Sustainable DevelopmentGoals, acknowledging their contribution to human well-being, including for climatemitigation and adaptation.
This paper questions whether the benefits of the energy transition in terms ofclimate mitigation are not actually contributing to further accelerate the erosion ofbiodiversity. It first looks at the potential impacts of renewables on biodiversity, andthen shows how the recent developments of climate policy in France may reconcile

Biodiversity Issues Should Be Better Taken into Account in the … 47
biodiversity and climate policy. Finally, it presents several solutions to mainstreambiodiversity into the energy sector, building on science and stakeholders’ experience.It builds on existing literature, the proceedings of an event organised by the FrenchFoundation for Research on Biodiversity (FRB) in October 2017 and on OREE’sguide (Trommetter 2017).
The Impacts of Renewables on Biodiversity
Renewables differ greatly in the sources they rely on (wind, water, sun, biomass,earth) and the technologies they resort to (e.g. floating or fixed-bottom offshorewind turbines). They have smaller coverage than traditional energy (fissile or fuel)and generate less power per production unit. It means that most renewable energystructures require awide, dense installation network, affecting ecosystemswhere theyare settled. The energy transportation and storage network adds up to the resultingland-use change, a major cause of the erosion of biodiversity worldwide, and isbuilt with a range of non-renewable metals. Renewables depend on biodiversity forconstruction (provision of material), energy production, ecosystem services (e.g.water and wood provision), and inspiration through biomimicry. The materials tobuild the renewable energy infrastructures are transformed through the mining andmetallurgy industries which are heavy polluters for ecosystems (Trommetter 2017).The impacts of renewables on biodiversity will therefore vary along those linesthroughout their life cycle, and will also depend on the location of the infrastructure(in situ impacts). Ex situ impacts are for the larger part caused by the extraction ofmaterial for the construction of the infrastructures, including sand (e.g. for concrete,silicon), rare earths and copper, but also during operation phase when no-go areas(e.g. offshore wind farms) lead to the displacement and higher concentration ofpressures (e.g. fishing) elsewhere in the natural habitats. The dismantling of theseinfrastructures and the recycling of materials are often complex, costly and limited.They have therefore huge impacts at end-of-life (e.g. dams, wind turbines, solarpanels) (Trommetter 2017).
If all renewables have an impact on biodiversity, those with the highest onesare biomass energy, which may lead to the destruction of a whole ecosystem, andhydroelectricity, which may cut ecological continuums and prevent the circulationof species (Trommetter 2017). Hydroelectricity is expected to increase by 73% inthe next decades, with major dam projects planned on the Amazon, Mekong andCongo rivers. Their watersheds are among the most fragile ecosystems on earth andthe three rivers together represent 18% of freshwater fish biodiversity (Zarfl et al.2015). Solar, wind, tidal and geothermal energy mostly impact biodiversity at thespecies or individual level. Table 1 largely builds on the synthesis byGasparatos et al.(2017); Trommetter (2017) and UNEP (2016b) to present for each energy source theprocesses that could impact biodiversity.
As for nuclear power, France is still a major producer to meet its energy demand(75% of national electricity production), but the existing hot debate around that

48 A. Hallosserie et al.
Table 1 Potential negative and positive impacts of renewables on biodiversity
Energy source Potential negative effects Potential positive effect
Solar power • Pollution and damage of ex situecosystems during resource extraction,including lithium for storage
• Disruption during installation phase,operation noise and maintenance
• Habitat loss or fragmentation• Bird collisions with the farms• Burnings on birds exposed to intensesolar fluxes
• Pollution of river and water bodiesthrough runoff of chemicals used forsolar panel maintenance and herbicideson the site
• Increasing use of water (esp. in deserts)• Bird and insect disorientation throughabnormal concentration of light
• Ecological trap because of cumulativeattractions
• Change of local climate
• Nesting and feedingsources for someanimals (e.g. pasture)
Land-based wind power • Pollution and damage of ex situecosystems during resource extraction,including lithium for storage
• Disruption during installation phase,operation noise and maintenance
• Land-use change• Bird and bat collision• Bat trauma due to the change of airpressure around the blades
• Disruption of migratory routes for birdsand bats
• No-go areas belowturbines and adecrease of predators(raptors) favour someterrestrial species
Hydroelectricity • Worldwide effects of sand extraction forconcrete
• Disappearance of ecosystems, includingnatural reserves, and habitatfragmentation when dams are filled
• Disturbance of water flows up- anddownstream
• Disturbance of migratory routes forsome fish species
• Poorer water quality due to changes ofsediment quantity, turbidity andeutrophication
• GHG emissions from water tanks
• New habitats orecosystems
(continued)
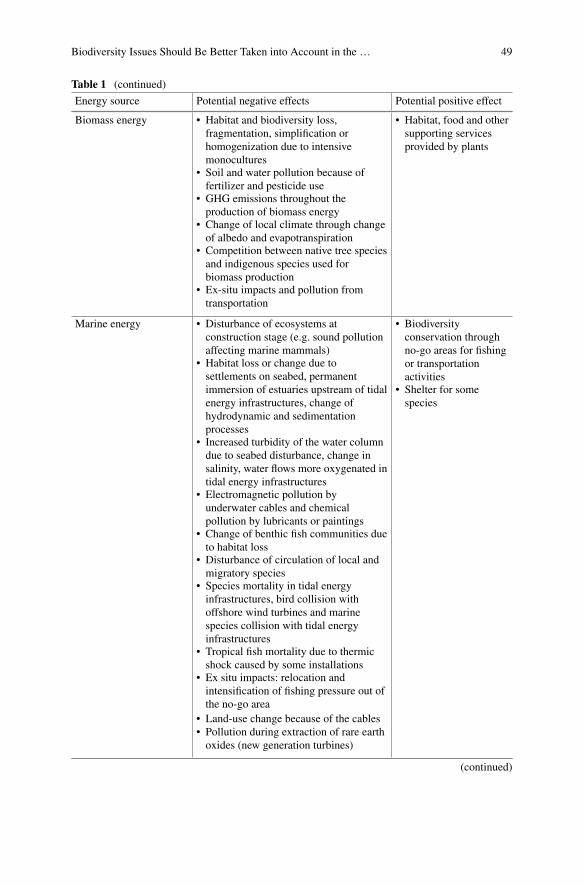
Biodiversity Issues Should Be Better Taken into Account in the … 49
Table 1 (continued)
Energy source Potential negative effects Potential positive effect
Biomass energy • Habitat and biodiversity loss,fragmentation, simplification orhomogenization due to intensivemonocultures
• Soil and water pollution because offertilizer and pesticide use
• GHG emissions throughout theproduction of biomass energy
• Change of local climate through changeof albedo and evapotranspiration
• Competition between native tree speciesand indigenous species used forbiomass production
• Ex-situ impacts and pollution fromtransportation
• Habitat, food and othersupporting servicesprovided by plants
Marine energy • Disturbance of ecosystems atconstruction stage (e.g. sound pollutionaffecting marine mammals)
• Habitat loss or change due tosettlements on seabed, permanentimmersion of estuaries upstream of tidalenergy infrastructures, change ofhydrodynamic and sedimentationprocesses
• Increased turbidity of the water columndue to seabed disturbance, change insalinity, water flows more oxygenated intidal energy infrastructures
• Electromagnetic pollution byunderwater cables and chemicalpollution by lubricants or paintings
• Change of benthic fish communities dueto habitat loss
• Disturbance of circulation of local andmigratory species
• Species mortality in tidal energyinfrastructures, bird collision withoffshore wind turbines and marinespecies collision with tidal energyinfrastructures
• Tropical fish mortality due to thermicshock caused by some installations
• Ex situ impacts: relocation andintensification of fishing pressure out ofthe no-go area
• Land-use change because of the cables• Pollution during extraction of rare earthoxides (new generation turbines)
• Biodiversityconservation throughno-go areas for fishingor transportationactivities
• Shelter for somespecies
(continued)
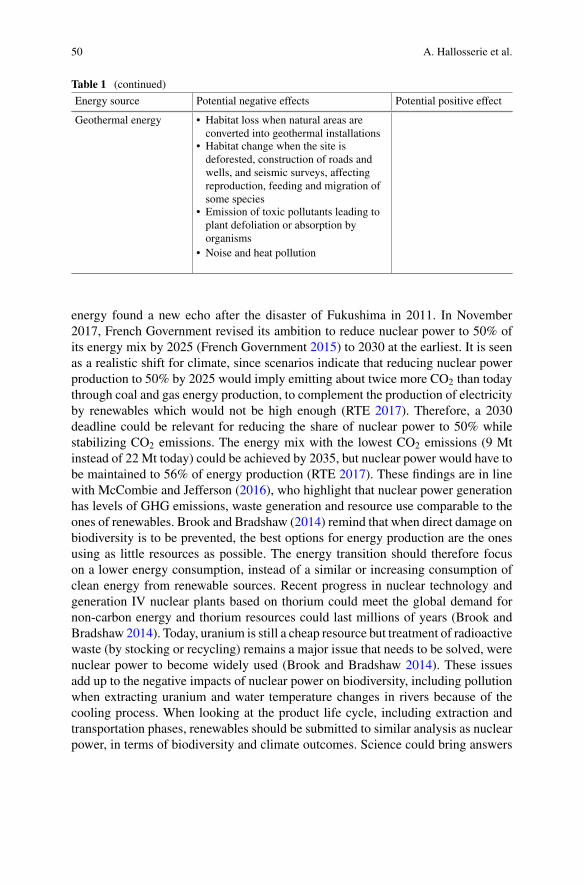
50 A. Hallosserie et al.
Table 1 (continued)
Energy source Potential negative effects Potential positive effect
Geothermal energy • Habitat loss when natural areas areconverted into geothermal installations
• Habitat change when the site isdeforested, construction of roads andwells, and seismic surveys, affectingreproduction, feeding and migration ofsome species
• Emission of toxic pollutants leading toplant defoliation or absorption byorganisms
• Noise and heat pollution
energy found a new echo after the disaster of Fukushima in 2011. In November2017, French Government revised its ambition to reduce nuclear power to 50% ofits energy mix by 2025 (French Government 2015) to 2030 at the earliest. It is seenas a realistic shift for climate, since scenarios indicate that reducing nuclear powerproduction to 50% by 2025 would imply emitting about twice more CO2 than todaythrough coal and gas energy production, to complement the production of electricityby renewables which would not be high enough (RTE 2017). Therefore, a 2030deadline could be relevant for reducing the share of nuclear power to 50% whilestabilizing CO2 emissions. The energy mix with the lowest CO2 emissions (9 Mtinstead of 22 Mt today) could be achieved by 2035, but nuclear power would have tobe maintained to 56% of energy production (RTE 2017). These findings are in linewith McCombie and Jefferson (2016), who highlight that nuclear power generationhas levels of GHG emissions, waste generation and resource use comparable to theones of renewables. Brook and Bradshaw (2014) remind that when direct damage onbiodiversity is to be prevented, the best options for energy production are the onesusing as little resources as possible. The energy transition should therefore focuson a lower energy consumption, instead of a similar or increasing consumption ofclean energy from renewable sources. Recent progress in nuclear technology andgeneration IV nuclear plants based on thorium could meet the global demand fornon-carbon energy and thorium resources could last millions of years (Brook andBradshaw 2014). Today, uranium is still a cheap resource but treatment of radioactivewaste (by stocking or recycling) remains a major issue that needs to be solved, werenuclear power to become widely used (Brook and Bradshaw 2014). These issuesadd up to the negative impacts of nuclear power on biodiversity, including pollutionwhen extracting uranium and water temperature changes in rivers because of thecooling process. When looking at the product life cycle, including extraction andtransportation phases, renewables should be submitted to similar analysis as nuclearpower, in terms of biodiversity and climate outcomes. Science could bring answers

Biodiversity Issues Should Be Better Taken into Account in the … 51
to those questions, and contribute to the public debate which is strongly marked bythe general wariness against radiations. Despite the positive outlook nuclear powercould bring on energy production and biodiversity protection, the risk of a majornuclear disaster remains unresolved.
Biodiversity Underlies the French Action Plan for Climate
Every measure aiming to decrease the demand for energy is very positive for bio-diversity, while the shift from one source to another, be it renewable, is not: anykilowatt per hour that is not produced is an impact avoided on climate and on biodi-versity. Biodiversity stakeholders could seize this approach to strengthen their actionsfurther. More generally, promoting a restraint consumption in energy promotes anoverall austerity regarding the consumption of other natural resources, such as meat,another major source of GHG and of land-use change (FRB 2017).
French Government released its Climate Plan in July 2017, describing how thecountry will implement the Paris Agreement. It contains several innovative guide-lines, and most actions refer, directly or not, to biodiversity, thus making this climatepolicy one of the most inclusive of biodiversity issues to date (Laurans and Rankovic2017). The seven first objectives are dedicated to energy efficiency and energy sav-ings, including an ambitious target to renovate old buildings for thermal efficiency.Objective 15 of the Climate Plan deals with the critical challenge of decreasingimported deforestation (Henders et al. 2015) in France. Reducing imported defor-estation, though often referring to the production of food commodities, would alsoapply for biomass imported in France for energy production.
The new French Climate Plan may contain some risks for biodiversity, mostlyrelated to two of its objectives. Objective 11 is about reaching carbon neutrality by2050, by limiting GHG emissions to the quantity that ecosystems on Earth are ableto absorb, acting as sinks. Given the current emission trends, this measure wouldput a tremendous pressure on ecosystems as this thirty-three-year timeframe is veryshort (Laurans and Rankovic 2017). Some questions need to be addressed if thisis to be achieved through afforestation: what is replaced by new forests? Whichtree species are planted? Carefully planned and implemented, this carbon policy canturn to an opportunity for biodiversity, only if it promotes the protection of existingcarbon-rich ecosystems. Objective 14 of the Climate Plan refers to speeding up thedevelopment of renewables, by simplifying procedures for setting up infrastructures.This reflects the well-spread idea that the development of renewables is hindered bycivil society’s actions resulting from a “not-in-my-backyard” behaviour (Mattmannet al. 2016), and that, for the energy transition to take place, appeal proceduresmust be streamlined. This measure of the Climate Plan could bear some threats tobiodiversity if it prevents local non-governmental organisations to question and stop,if needed, the development of renewable energy projects in biodiversity-sensitiveareas. As time goes, appeals are however less likely since developers come withmore sustainable cases, and this is indeed good news since appeals reveal a failure
52 A. Hallosserie et al.
of the consultation process. There are many tools to conduct local consultations,but they regularly fail because projects are not flexible once the format is approved.Changing the qualification, size and characteristics of projects after approval shouldbe simplified, and there would be a lesser need to change appeal procedures (Mermetet al. 2004).
The Climate Plan is a positive development to advance biodiversity conservationin parallel with climate mitigation and adaptation. It stresses out the contributions ofa rich biodiversity and functioning ecosystems to the climate change fight. However,it could go further in thinking forward the impacts, negative and positive, that someclimate policies, including the development of renewables, might have on biodiver-sity.
Mitigating the Impacts of Renewables on Biodiversityfor an Ecological Transition
So far, renewables have been promoted all as one, but this paper illustrates the vari-ety of impacts that different infrastructures relying on different power sources mayhave on biodiversity. Renewables should be prioritized, taking into account their effi-ciency and impacts (Laurans and Rankovic 2017). Biodiversity stakeholders shouldparticipate in this prioritization process, which would be led by the stakeholdersof each energy branch otherwise, with the risk for biodiversity and water-relatedissues to be overlooked. More generally, biodiversity research should better addressenergy-related issues and biodiversity stakeholders should be more active in plat-forms dealing with biodiversity and energy, such as the Strategic EnvironmentalAssessments of the Plurennial Programme for Energy or the Regional Schemes forClimate, Air and Energy. The decentralization implied by the energy transition setsit in a local ground which requires a systemic approach of the territory and energyissues (Trommetter 2017).
All participants to the event led by FRB on reconciling energy transition withbiodiversity preservation agreed on one obvious but primordial solution: to settlerenewable energy infrastructures in biodiversity-poor areas (FRB 2017). The othermajor point is to focus efforts on biodiversity mainstreaming in all sectors, includingenergy, as countries committed at the 13th Conference of Parties of the Conventionon Biological Diversity in 2016 (CBD 2016). This can be done for example bydeveloping biodiversity indicators for the energy transition, rather than looking onlyat carbon emissions. This would necessarily make the picture more complex, but it isnevertheless essential not to face unexpected and irreversible feedback throughout thebiosphere. These two guiding principles should then be complemented by a numberof approaches which were discussed at the conference organised by FRB and arepresented below.
Biodiversity Issues Should Be Better Taken into Account in the … 53
Spatial Planning
Renewable infrastructure would have lesser impacts on biodiversity if located farenough from protected areas (Marx 2017). Local studies are key to identify occurringspecies, their ecology and behaviour, which will in turn help understand the potentialimpacts of the infrastructure depending on its location or the time of year (e.g. duringthe migration period, about 60% of birds killed by wind turbines are sparrows, butthe species most vulnerable to turbines are birds of prey with very low numbersof individuals). A recent study from the French League for the Protection of Birds(LPO) reveals that twice more remains of birds are found by wind turbines settledwithin or nearby Natura 2000 protected areas than other turbines, and that the birdskilled are much more often listed on the IUCNRed List of Endangered Species or onthe European Union Bird Directive (Marx 2017). The most lethal wind turbines areoften the older and smaller ones, which were built before the Natura 2000 networkwas completed and at a time when environmental legislation was weaker. Majorenergy companies shared their experience on spatial planning during the conference,explaining that when biodiversity issues are factored early in the project designand budget process, they can be addressed more easily: through a small changeof location (e.g. the reorientation of the methane terminal of Dunkirk by EDF) orthe addition of specific device (e.g. coloured disks on power lines to increase theirvisibility for birds). However, LPO observed that as for wind turbines, none of theexisting devices such as on/off functions controlled by cameras are efficient enoughto remove the threat on birds, and that, for all kind of renewables, only avoidance ofkey biodiversity areas through spatial planning and ecological knowledge is a viablesolution to prevent negative impacts on biodiversity (FRB 2017).
When this is not possible to mitigate impacts, offsetting must be undertaken(French Government 2016). For example the company Engie creates hedge ecosys-tems to compensate the destruction of natural areas for the settlement of its infras-tructure. This is in line with the “Avoid Reduce Offset” triumvirate officialised bythe law on biodiversity of 2016, which is key to protect and restore biodiversity(Trommetter 2017).
Guidance and Monitoring
In order to minimize the impact of renewable energy infrastructure, such as windturbines, on biodiversity, French operators have tomonitor and report bat mortality tothe Muséum National d’Histoire Naturelle on a yearly basis. However, submissionrate is less than 5%, and data is heterogeneous due to a lack of harmonization ofmethods and metadata (FRB 2017). Monitoring is crucial to assess the adequacyof guidance and policies for mitigating biodiversity impacts: the European Unionprovides guidance for wind turbines to be set up 200 m away from woods or hedges,but research has shown that they should be at least 1000 m away for species not to
54 A. Hallosserie et al.
suffer sublethal effects. It is estimated that 2400 km of hedges became unsuitable forbat habitat in Brittany and Loire regions due to the avoidance of wind turbines by thebats (Coly et al. 2017). Enforcement of recommendations is also an issue, for it isestimated that about 90% of wind turbines in France do not follow them. Monitoringthrough citizen science, like the US eBird platform, may be very helpful to providedata to assess the potential impacts of infrastructure such as wind turbines, and haveproved useful to make cases for relocation when it threatened protected species suchas bald and golden eagles (Sullivan et al. 2017). Civil society can also support theprocess, such as LPO who launched a large programme to assess the impacts ofwind-turbines on birds and develop solutions to reduce them (Trommetter 2017).
Engineering
One of the main difficulty in introducing biodiversity concern into decision makingprocess is to assess the reality of the impacts. Product life cycle analysis (LCA)could become a key tool to understand a broad range of the impacts renewableinfrastructure may have, during all phases, and to develop solutions to avoid ormitigate negative impacts. LCA can look at land-use change impacts by taxa, takingalso into account species endemism and vulnerability, based on IUCN data. Theindicators of potential species loss and potentially disappeared fraction of speciesare useful in that regard, but sensitivity of ecosystems, ecosystem fragmentation, localimpacts and differences of practice on the ground and genetic diversity are not yetaddressed in LCAs (UNEP 2016a). At the current stage, LCAs help raise developers’awareness of key biodiversity issues, but the picture remains general. Research istherefore focusing on conceptualizing and operationalizing biodiversity into LCA.For example, LCAs could cover the five drivers of biodiversity loss identified inthe Millenium Ecosystem Assessment: while climate change, habitat change andpollution are factored in, invasive alien species and overexploitation are not. Suchnew approaches have not been used yet on renewable energy infrastructure (Veroneset al. 2015).
Mobilizing Research
On top of the impact assessments of infrastructure for renewable energy, sciencehas also a key role to play to assess the impact of energy policies, at the Europeanand national level. For example, a large field open for research is the viability of anenergy strategy relying on biomass. Biomass is a standalone source of energy sinceit is renewable only if the regeneration rate is higher than removal within a specifictimeframe (Trommetter 2017). Therefore, more research is needed on the key fea-tures of forest biodiversity in order to fully understand the effects that exploitation ofbiomass would have on French forests, including the relationship between tree age

Biodiversity Issues Should Be Better Taken into Account in the … 55
and biodiversity, the importance of deadwood, and biodiversity variations across for-est layers. Forest research could thus help improve the biodiversity potential of forestplantations for biomass exploitation, to avoid large, biodiversity-poor monocultureswithout undergrowth. However, the possibility for biomass-energy exploitation toremain within safe limits for biodiversity preservation will mostly depend on thescale of operation. Davi et al. (in prep.) studied the resilience of the social-ecologicalsystem around the biomass plant in Gardanne, Provence, which is the largest plantproducing energy from wood in France. They identified current biomass produc-tion levels in the plant’s wood-supply area, assessed the future production trends,evaluated existing ecosystem services and developed indicators on the status of theforest, while factoring in land property. Using a method of reverse engineering, theyfound that the plant would need 855,000 tons of wood by 2025, coming from a400 km radius, in order to be fully operational. This is twice more than the cur-rent volume of wood exploited in the administrative region of Provence-Alpes-Côted’Azur. The study shows that despite increasing forest area in France, current unex-ploited parcels are difficult to access; it is therefore likely that pressure intensifies incurrently exploited areas. Other factors such as climate change reinforce the vulner-ability of the Mediterranean forest and should be taken into account when assessingthe potential impacts of Gardanne plant. In this case, research helped mapping allstakeholders and supported consultation about the project, which was essential forminimizing the impacts of the plant on local biodiversity and quality of life, and forsocial acceptation.
Social sciences are crucial to understand the mechanisms of social acceptation ofthe renewable technologies, the share of biodiversity that societies would accept togive up, and how to increase awareness and trainings on issues closely interlinkedsuch as climate change and biodiversity, including in the field of energy. Humans arealso to be studied as part of the socio-ecosystems, with their efforts to maintain theresilience of this system through both biodiversity preservation and climate changemitigation (Trommetter 2017).
Scenarios and Models
Scenarios and models, calling on multiple research disciplines, can play a majorrole to explore the potential effects that energy policies may have on biodiversity.For example, models combining environmental and economic variables show thatbiomass, for biofuel or electricity production, is not as good for the environment asfirst thought, because of the overexploitation of forests and land-use change it mayinduce (Valin et al. 2015). Harvesting very often results in a reduction of biologicaland spatial diversity which weakens the forest ecosystem and the local biodiversitydynamics (Trommetter 2017). Specific impacts on biodiversity are difficult to modelthrough proxies such as carbon richness, widely used in climate models, because ofthe specificities of local contexts. Research has therefore been developing biodiver-sity indicators by combining landscape cover and land-use intensity with biodiversity
56 A. Hallosserie et al.
richness. The resulting indexes are a progress towards the integration of biodiver-sity variables into the models, but they still lack key information to assess habitatfragmentation, populations dynamics, interactions within ecosystems, changes ingenetic diversity etc. There is still progress to do to better understand the impacts ofmeeting the global objectives of carbon emission reductions. Models show that inorder to limit global warming to 2 °C, land conversion for biomass production on onehand and the necessary carbon sinks on the other hand would imply that about 500million hectares would be dedicated to agriculture for biomass (Havlík et al. 2015).The unavoidable ex situ biodiversity issues of one area being the in situ issues of theother, the question is whether one can be virtuous at home with a behavior harmfulelsewhere (Trommetter 2017): the impacts on biodiversity, especially in developingcountries where the large majority of land would be available for conversion, needto be particularly reflected upon.
Beyond studying future impacts and guiding policy development, scenarios andmodels can also be used for decision-making, for example through serious gameswhich help stakeholders to step into each other’s shoes and understand each other’skeymotivations. Such activities raise stakeholders’ awareness on themultiple aspectsthat are to be taken into account to meet different, sometimes opposing, objectives(e.g. biodiversity conservation vs resource exploitation) (Garcia andSpeelman2017).Modelling is also used to assess the resilience of social-ecological systems throughthe description of an area, its resources, stakeholders, institutions and issues, andalternative system developments showing whether the system is becoming more orless resilient (Resilience Alliance 2010). This was applied for example by Davi et al.(in prep.) to identify the potential impacts of the operation of the biomass plant inGardanne.
EU Countries Should Inspire the World for a More Cautious,Time-Taking Energy Transition for the Sake of Biodiversity
Themain observation from scientific literature and the feedback of energy stakehold-ers is that the push for renewables has led to a frantic development of the sector, withan ex post realization of the negative impacts it induces when not thought through.An illustrative case being the promotion at the European Union level of biomassenergy, which lead to the unexpected large importation of wood from the US andfromCanada which was unsustainably harvested (European Commission 2015). Theenergy transition should be operated at a slower pace to allow science to catch upwith it, and an energy mix based on renewables, fossil fuel and nuclear power couldallow to keep meeting energy demand while going for a wise zero-carbon energyproduction. On top of the impact assessments of infrastructures for renewable energy,science has also a key role to play to assess the impact of energy policies, such as theEuropean policy promoting biomass energy that may have indirect impacts beyondthe current players, as highlighted by Gazull in FRB 2017 and in Cuypers et al. 2013.
Biodiversity Issues Should Be Better Taken into Account in the … 57
Indeed, the EU is often looked up to by the world, and its endorsement of biomassenergy turns it into a good, clean, innovative source of energy that may provide anincentive for many developing countries to strengthen the exploitation of their forestsfor energy production, which is one of the main drivers of deforestation around urbanareas in the global South. To sum up, the energy transition whose use is local, butwhose resources and deployment are global, must be considered globally (in situ andex situ) when being assessed (Trommetter 2017).
Conclusion
Policy sectors such as energy and environment are dealt with independently in poli-tics and by stakeholders. Each stakeholder is therefore advancing its own policies toachieve its own objectives, ignoring the fact that some of these may be detrimentalto other policies and targets, or even counterproductive for their own objective sincemany issues influence each other.When looking at the impact of the energy transitionon biodiversity, it is observed that the question is hardly ever asked, be it in the policy,research or operational area. A few scattered studies analysed the potential or actualimpacts of energy infrastructures on biodiversity, but these impacts need to be betterfactored in by stakeholders of the renewable energy sector, by asking: “what may myimpacts bewhen it comes to biodiversity?”. This demandwould in turn boost researchon the topic, including the development of solutions to mitigate or offset the impactof renewable energy infrastructure. Research can also support decision-makers inbetter anticipating the effects of energy policies and measures on biodiversity, usingtools such as scenarios and models. Recent climate policy development in Francegave a positive signal for all stakeholders to better acknowledge and work on thesynergies between climate and biodiversity. While the energy transition addressesthe urgent need for climate change mitigation and aims to reduce CO2 emissions,literature increasingly documents examples of offsetting (rebalancing emissions tozero) or even a net removal of CO2 through biodiversity protection. The internationalresearch initiative 4‰ aims to identify farming practices promoting carbon storagein agricultural land so that it offsets part of human CO2 emissions. A territorial andsystemic approach is essential to overcome such challenges. Currently, it is mostlyon the scale of territories that the issues of sustainable development, including theimplementation of renewable energies, their side-effects, and the erosion of biodiver-sity, are perceived and it is probably also there that both fair and democratic solutionscan be found. Policy emphasis on such measures would help rebalance biodiversityversus climate objectives, highlighting the interlinkages between both issues.
Acknowledgements We thank Hugo Valin and Anne-Claire Asselin for their useful advice andprecisions regarding different parts of this paper. Special thanks to Michel Trommetter who con-tributed greatly to OREE’s work on renewables and biodiversity. Any misinterpretation or error isdue to the authors of the paper.
58 A. Hallosserie et al.
References
Brook BW, Bradshaw CJA (2014) Key role for nuclear energy in global biodiversity conservation.Conserv Biol 29(3):702–712. https://doi.org/10.1111/cobi.12433
CavaudD, Coléou Z, Guggemos F, ReynaudD (2016) Chiffres clés des énergies renouvelables. Edi-tion 2016. Document édité par le Service de l’observation et des statistiques. Collection Datalab.Ministère de l’Environnement, de l’Energie et de la Mer en charge des relations internationalessur le climat. La Défense, 76p
CBD (2016) The Cancun Declaration on mainstreaming the conservation and sustainable use ofbiodiversity for well-being. Accessed on 02/11/2017 at https://www.cbd.int/doc/meetings/cop/cop-13/official/cop-13-24-en.pdf
CeballosG,EhrlichPR,DirzoR (2017)Biological annihilation via the ongoing sixthmass extinctionsignaled by vertebrate population losses and declines. PNAS 114(30):E6089–E6096. https://doi.org/10.1073/pnas.1704949114
Coly R et al (2017) Études chiroptérologiques dans les dossiers réglementaires éoliens: disponibilitéde l’information et conformité avec les recommandations nationales et européennes. Naturae3:1–10
Crooks KR et al (2017) Quantification of habitat fragmentation reveals extinction risk in terrestrialmammals. PNAS 114(29):7635–7640. https://doi.org/10.1073/pnas.1705769114
Cuypers D et al (2013) The impact of EU consumption on deforestation: Comprehensive analysisof the impact of EU consumption on deforestation. Final report. Environment Commission.Technical Report—2013 – 063. European Union, 348 p. https://doi.org/10.2779/822269
Davi H et al (in preparation) Wood fuel boiler in provence as a case-study of Reverse engineeringto determine key research questions. In preparation for Ecology and Society
European Commission (2015) Environmental implications of increased Reliance of the EU onbiomass from the South East US. ENV.B.1/ETU/2014/0043. Report written by A. Strange Ole-sen, S.L. Bager (COWI, Denmark) & B. Kittler, F. Price & F. Aguilar (Pinchot Institute forConservation, USA)
FRB (2017) Compte-rendu «Journées FRB 2017. Biodiversité et transition énergétique: enquêtessur des liaisons dangereuses». Paris, 35p. Accessed on 02/11/2017 at http://www.fondationbiodiversite.fr/images/documents/Evenements/CR_JFRB.pdf
French Government (2015) LOI n° 2015-992 du 17 août 2015 relative à la transition énergétiquepour la croissance verte. Accessed on 2 Nov 2017 at https://www.legifrance.gouv.fr/affichTexte.do?cidTexte=JORFTEXT000031044385&categorieLien=id
French Government (2016) LOI n° 2016-1087 du 8 août 2016 pour la reconquête de la biodiversité,de la nature et des paysages. Accessed on 02 Nov 2017 at https://www.legifrance.gouv.fr/affichTexte.do?cidTexte=JORFTEXT000033016237&categorieLien=id
French Government (2017) Projet de loi mettant fin à la recherche ainsi qu’à l’exploitation deshydrocarbures conventionnels et non conventionnels et portant diverses dispositions relatives àl’énergie et à l’environnement. Accessed on 2 Nov 2017 at http://www.assemblee-nationale.fr/15/projets/pl0155.asp
Garcia C, Speelman EN (2017) Landscape approaches, wicked problems and role playing games.Tropenbos International ComMod Workshop. ForDev working papers, 1. 20 p
Gasparatos A et al (2017) Renewable energy and biodiversity: implications for transitioning to agreen economy. Renew Sustain Energy Rev 70:161–184. https://doi.org/10.1016/j.rser.2016.08.030
Hallmann CA et al (2017) More than 75 percent decline over 27 years in total flying insect biomassin protected areas. PLoS ONE 12(10):e0185809. https://doi.org/10.1371/journal.pone.0185809
Henders S, Persson UM, Kastner T (2015) Trading forests: land-use change and carbon emissionsembodied in production and exports of forest-risk commodities. Environ Res Lett 10(12):125012.https://doi.org/10.1088/1748-9326/10/12/125012
Biodiversity Issues Should Be Better Taken into Account in the … 59
Havlík P et al (2015) Climate change impacts and mitigation in the developing world: an integratedassessment of the agriculture and forestry sectors. Policy Research working paper; No. WPS7477. World Bank Group, Washington, D.C, 56p
IPCC (2014) Climate change 2014: impacts, adaptation, and vulnerability. In: Field CB et al (eds)Part A: Global and sectoral aspects. Contribution of working group II to the fifth assessmentreport of the intergovernmental panel on climate change.CambridgeUniversity Press, Cambridge,United Kingdom and New York, NY, USA, 1132 pp
Laurans Y, Rankovic A (2017) Un Plan climat français biodiversité-compatible? Iddri, Issue BriefNo 09/17, novembre 2017, 4p
Mattmann M, Logar I, Brouwer R (2016) Wind power externalities: a meta-analysis. Ecol Econ127:23–36. https://doi.org/10.1016/j.ecolecon.2016.04.005
Marx G (2017) Le parc éolien français et ses impacts sur l’avifaune. Etude des suivis de mortalitéréalisés en France de 1997 à 2015. LPO, Rochefort, p 92
McCombie C, JeffersonM (2016) Renewable and nuclear electricity: Comparison of environmentalimpacts. Energy Policy 96:758–769. https://doi.org/10.1016/j.enpol.2016.03.022
Mermet L et al (2004) Les porteurs de projets face à leurs opposants: six critères pour évaluer laconcertation en aménagement. Politiques et Management Publics 22(1):1–22. https://doi.org/10.3406/pomap.2004.2829
Resilience Alliance (2010) Assessing resilience in social-ecological systems: Workbook for prac-titioners. Version 2.0. Accessed on 02 Nov 2017 at http://www.resalliance.org/3871.php
RTE (2017) Bilan prévisionnel de l’équilibre offre-demande d’électricité en France. Edition 2017.Synthèse. La Défense, 44p
Sullivan BL et al (2017) Using open access observational data for conservation action: a case studyfor birds. Biol Conserv 208:5–14. https://doi.org/10.1016/j.biocon.2016.04.031
Tilman D et al (2017) Future threats to biodiversity and pathways to their prevention. Nature546:73–81. https://doi.org/10.1038/nature22900
Trommetter M (Coord) (2017) Climat et biodiversité. Concilier énergies renouvelables et biodiver-sité. ORÉE. Entreprises, territoires et environnement, Paris, France, 26p
UNEP (2016a) Global guidance for life cycle impact assessment indicators. Frischknecht R andJolliet O (eds) Volume 1, Guide produced by the UNEP/SETAC Life Cycle Initiative. UnitedNations Environment Programme, 2016. Paris, France, 166p. ISBN: 978-92-807-3630-4
UNEP (2016b) Summary for policy makers. Green energy choices: the benefits, risks and trade-offs of low-carbon technologies for electricity production. Hertwich EG et al (eds) Report of theInternational Resource Panel. United Nations Environment Programme, 2015. UNESCO, CLD,France, 48p. ISBN: 978-92-807-3490-4
Valin H et al (2015) The land use change impact of biofuels consumed in the EU: quantificationof area and greenhouse gas impact. Report for the European Commission by Ecofys, IIASA &E4tech. Utrecht, 261 p
Verones F et al (2015) Harmonizing the assessment of biodiversity effects from land and water usewithin LCA. Environ Sci Technol 49(6):3584–3592. https://doi.org/10.1021/es504995r
Zarfl C et al (2015) A global boom in hydropower dam construction. Aquatic Sci 77:161–170.https://doi.org/10.1007/s00027-014-0377-0

Approaches to Ecosystem Servicesand Biodiversity Assessment in Belarus
Siarhei Zenchanka and Nikolai Gorbatchev
Abstract Purpose—Sustainable economic development requires consideration ofeconomic, social and environmental factors. Since the last decade of the twentiethcentury, there has been a demand for statistical data reflecting the state of the natu-ral environment and the impact on it of human society. At the same time, statis-tics are required that reflect the impact of ecosystems on the economy. Due tohuman activities there is an increasing uncertainty about the amount of environ-mental assets that are currently available in any country. The goal of the work isto consider the world trends in the definition of ecosystem services, their evalua-tion and accounting, and implementation of ecosystem services in the Republic ofBelarus. Design/methodology/approach—Descriptions of trends related to quanti-fying the natural resources in EC countries andworldwide are provided. Comparativestudy of Belarus approaches to implementation of the best ecological practices wasdeveloped. Findings—Belarus has some unique practices in the field of ecosystemservices management, which also may be analyzed and disseminated as good prac-tices of ecosystem accounting and management, including forest resources manage-ment related with wild medical plants, berries and mushrooms, as well as cultivationof lands contaminated with radionuclides after Chernobyl disaster and monitoringof radioactive contamination and biodiversity, especially related with cross-boardercontamination between Belarus, Russia and Ukraine. Originality/value—The com-prehensive analysis of modern tendencies in natural capital and ecosystem servicesassessment and biodiversity was suggested.
Paper type—Research paper.
S. Zenchanka · N. Gorbatchev (B)Minsk Branch of Plekhanov, Russian University of Economics, 127/2 Mayakovskogo Str.,220028 Minsk, Belaruse-mail: [email protected]
S. Zenchankae-mail: [email protected]
© Springer Nature Switzerland AG 2019W. Leal Filho et al. (eds.), Handbook of Climate Change and Biodiversity,Climate Change Management, https://doi.org/10.1007/978-3-319-98681-4_4
61

62 S. Zenchanka and N. Gorbatchev
Introduction
Sustainable economic development requires consideration of economic, social andenvironmental factors. Since the last decade of the twentieth century, there has beena demand for statistical data reflecting the state of the natural environment and theimpact on it of human society. At the same time, statistics are required that reflectthe impact of ecosystems on the economy.
Agenda 21 (1992), adopted by the United Nations Conference on Environmentand Development in Rio de Janeiro, considers “Integrating Environment and Devel-opment in the Decision-Making Process” (Chapter “Implications for Biodiversityof Potentially Committed Global Climate Change (from Science and Policy)”) and“Conservation and rational use of resources for development” (Section “NaturalCapital and Ecosystem Services: International Approach”) as the main developmentpriorities.
Costanza and Daley (1992) considered the concept of “natural capital”, whichincludes “renewable or active natural capital” and “non-renewable or inactive naturalcapital”. At the same time, renewable capital is restored by solar energy. Ecosystemsin thiswork relate to renewable natural capital. They canproduce ecosystemproducts,such as wood, and also provide ecosystem services, for example, carbon dioxideabsorption. Examples of non-renewable capital are fossil fuels andmineral resources.
The ecosystem is defined as a dynamic complex of plant, animal and microor-ganism communities and non-living environment interacting as a functional unit(Millennium2003) and as the benefits that a personderives fromecosystems.Humansare an integral part of ecosystems.
The goal of the work is to consider the world trends in the definition of ecosystemservices, their evaluation and accounting, and implementation of ecosystem servicesin the Republic of Belarus.
The practical importance of the work lies in the analysis of the world trendsand policies of the European Union in the development of ecosystem services. Itis shown that Belarus has some unique practices in the field of ecosystem servicesmanagement, which also may be analyzed and disseminated as best practices ofecosystem accounting and management.
Natural Capital and Ecosystem Services: InternationalApproach
Natural Capital is considered as “the environmental stock or resources of Earth thatprovide goods, flows and ecological services required to support life. Examples ofnatural capital include: minerals; water; waste assimilation; carbon dioxide absorp-tion; arable land; habitat; fossil fuels; erosion control; recreation; visual amenity;biodiversity; temperature regulation and oxygen. Natural capital has financial value

Approaches to Ecosystem Services and Biodiversity Assessment … 63
as the use of natural capital drives many businesses” http://www.gdrc.org/sustdev/concepts/26-nat-capital.html. This defines the needs in natural capital accounting.
The first version of the System of Environmental and Economic Accounting(SEEA) was presented in 1993 (United Nations 1993). In 2000, the SEEA man-ual was published (United Nations 2000), providing practical recommendations forthe implementation of SEEA modules with maximum consistency with national sta-tistical standards.
In 2005, the report “Millennium Ecosystem Assessment” (Millennium 2005) waspublished, the results of which indicate that over the past 50 years, human activitieshave led to a huge loss of biodiversity and a decline in the volume of ecosystemservices. As noted in the proof, this will have a negative impact on the developmentprocesses in all countries, especially in developing countries.
The SEEA-2003 report (United Nations 2003) gave a consistent analysis of thecontribution of the environment to the economy and the impact of the economy onthe environment, the composition and functions of natural capital were examined.The report was the basis for the further development of the standard on accountingfor natural capital and ecosystem services.
Figure 1 shows an approximate structure of natural capital.As it is shown in Fig. 1, in the structure of natural capital the natural resources
and ecosystems are allocated. First of all the natural capital includes non-renewableand renewable capitals. Non-renewable capital consists of fossil fuels and min-eral resources which humanity consumes only changing the energy balance of theEarth. Greenhouse gas emissions accompanying the process of consumption of non-renewable resources also lead to a change in the energy balance of the Planet.
Renewable natural capital forms a different type of ecosystems which produceecosystem products and services. Renewable capital is restored by solar energy, butthere is a global trend towards deterioration in the quality of natural capital and evena decrease in its quantity.
It should be noted that the link between non-renewable resources and the ecosys-tem is necessary, since resources are part of ecosystems and their production in many
NATURAL CAPITAL
Non-renewable natural capital(natural resources)
Renewable natural capital(natural resources)
Fossil fuel Mineral resources
Ecosystems
Ecosystem products
Ecosystem services
Fig. 1 Approximate structure of natural capital

64 S. Zenchanka and N. Gorbatchev
cases leads to ecosystem disruption. For example, open mining of minerals not onlychanges the landscape, but also leads to disruption of underground aquifers.
The idea of natural capital structuring and accounting was initiated in the 1980s.However, it was generally adopted into above-like scheme in 2012: the UN Sta-tistical Committee approved the SEEA Central Framework (2012) as an interna-tional standard for environmental and economic accounting. In addition, guidelineshave been issued on the experimental recording of ecosystems (SEEA 2014), SEEAWater Accounting (2012), SEEA Energy Accounting (2012) and SEEA account-ing in agriculture, forestry and fisheries (SEEA AFF 2014). The system is basedon the integration of environmental and economic indicators. Internationally agreeddefinitions and classifications (renewable and non-renewable resources, ecosystems,etc.) are connected with corresponding statistical indicators. Ecosystem products’and services’ indicators provide analysis of specific resources sectors, such as water,fisheries, land, agriculture. The motivation for structuring the natural capital resultsfrom a variety of emerging demands for integration information on environmentalsustainability and human well-being.
Themain types of ecosystems andecosystemserviceswere considered in “Ecosys-tems and human well-being: a framework for assessment” (Millennium 2003) andby Haines-Young and Potschin (2013):
– Providing services—products that people get from ecosystems. These includecropping, livestock and game animals, seafood, food fromwild plants and animals;drinking water, water used for irrigation and industrial consumption; plants thatare sources for the creation of biopharmaceuticals, building materials and biomassused as a source of renewable energy. Products can be obtained from sustainablymanaged ecosystems, such as agriculture, aquaculture, forest plantations, naturaland semi-natural ecosystems (hunting, fishing, gathering wild plants and beards);
– Regulatory services—benefits derived from self-regulation of ecosystem pro-cesses (conservation of ecosystem assimilation capacity)—biogenic nutrientcycling, climate control, reduction of the negative consequences of natural dis-asters, pollination;
– Cultural services—cultural, educational and spiritual benefits received by peo-ple from ecosystems—visiting cultural, historical, spiritual and religious places;opportunities for recreation, for example, recreation, sports, hunting, fishing, eco-tourism; education and research;
– Supporting services—the natural processes necessary tomaintain other ecosystemservices, such as soil formation.
In April 2012, following the intergovernmental negotiations, which lasted sev-eral years and were convened under the auspices of UNEP, an IntergovernmentalScience and Policy Platform on Biodiversity and Ecosystem Services (IPBES) wasfounded (http://www.ipbes.net/about-us). The mission of IPBES is to strengthen thescience-policy interface for biodiversity and ecosystem services for the conservationand sustainable use of biodiversity, long-term human well-being and sustainabledevelopment (IPBES 2016).

Approaches to Ecosystem Services and Biodiversity Assessment … 65
The UNEP Ecosystem Economics and Biodiversity Initiative (TEEB) has under-taken a series of studies that highlight the importance of ecosystem services and theneed for assessments. The results of these studies are presented in the Guidelinesfor Countries on the Economics of Ecosystems and Biodiversity (TEEB 2013). “TheEconomics of Ecosystems and Biodiversity” is an international initiative aimed atdrawing attention to the benefits of biodiversity, covering ecosystems, species andgenes. This initiative covers existing data to emphasize the value of biodiversity andecosystem services, the increasing costs of biodiversity loss and ecosystem degra-dation and the benefits of overcoming these problems.
There are eleven proposals in this Guideline directed to reducing biodiversitylosses economically (TEEB 2013):
1. Make the values of nature visible, for example, by assessing the role of biodi-versity and ecosystem services and their impact on the economy and society;
2. Provide the assess to the value of ecosystem services and integrate them into thedecision-making process to improve the evidence base for decision-making;
3. Take risks and uncertainties into account, for example, by understanding andapplying minimum safety standards or principles of prevention;
4. Provide the future for sufficiently long periods of time to take into account theneeds of future generations and evaluate the cost and benefits of decisions andpolicies using different discount rates;
5. To manage better, i.e. invest in improving indicators of biodiversity and ecosys-tem services, in mapping ecosystems, and in integrating indicators into nationalaccounts that take into account the roles and values of nature;
6. Work with natural resources to reduce poverty, identify synergies betweennature, livelihoods and well-being, and target investments in public goods.Human dependence on ecosystem services and, in particular, their role as alife-saving circle for many poor households, should be fully integrated intopolicies, strategies and implementations;
7. Encourage the disclosure of corporate information to compensate for adverseeffects that cannot be avoided, to ensure that there is no “net loss”, includingthrough a natural form of compensation, achieving a net positive effect;
8. Change incentives through market reforms (subsidies, pricing, taxes, fees andpenalties), property rights, liability, intellectual property rights and other mea-sures that can make supply chains more “green”, encourage private investmentin the development and Sustainable use;
9. Identify protected areas, manage and invest in protected areas to ensure a com-prehensive, representative and efficient network managed on an equitable basis.Protected areas are a certain monetary value;
10. Invest in environmental infrastructure to support mitigation and adaptation toclimate change, water security and other policy objectives;
11. Introduce the issues of the economy of nature in various ministries, sectorsand relevant policies, i.e. in an economy and finance, trade and development,transport, energy and mining, agriculture, forestry, planning, etc.
66 S. Zenchanka and N. Gorbatchev
The above recommendations fully correspond to the trends in the development ofthe world economy.
“Green” and “Circular” Economies Concepts
The concept of a “green” economy was proposed more than 20 years ago (Pearceet al. 1989) and became widespread in the 21st century. In 2007, they submitted areport “Blueprint for a Green Economy” to the Shadow Cabinet (https://www.researchgate.net/publication/39015804_Blueprint_for_a_Green_Economy).
In 2008, the UN, in collaboration with many stakeholders, announced the “GreenEconomy Initiative” (http://www.greeneconomycoalition.org/content/un-environment-programmeE99s-greeni-economy-initiative) which consists of several compo-nents aimed at analyzing and politically supporting investments in “green” sectorsof the economy and involving other sectors in this process. Green Economy Report(UNEP 2011) considered investing in natural capital and investing in energy andresource efficiency and it has found that a “green” economy values and invests innatural capital. Report (UNEP 2015) considers the investment in ecosystem restora-tion and rebuilding of natural capital as an essential part of investments in environ-mental sustainability. This report suggests “to adopt the valuation of natural capitalin national accounts and development indexes, as it enables a country to developa sense of its “true wealth”; and value the natural capital degraded or used up ineconomic processes, as it provides a measure of “true income””.
The final document of the Rio+20 Conference “The future we want” empha-sizes that the “green” economy should improve the ability to rationally use naturalresources with less environmental impact, improve resource efficiency and reducewaste (Report 2012).
Key sectors of the “green” economy, such as agriculture, energy, fisheries andforestry,waste,water use, etc., are directly related to the receipt of ecosystemservices.
The development of the “green” economy led to the development of a “circular”economy, which received priority in making promising decisions to achieve eco-nomic development in the presence of environmental constraints. In the EuropeanUnion, this was reflected in the 7th Environmental Action Program, which aims toprotect, preserve and strengthen the natural capital of the EuropeanUnion. It also setsgoals for the development of a low-carbon, resource-efficient and “green” economy.The program assumes that the global eco-industrial market will double in the next10 years, and the European renewable energy sector will create more than 400,000jobs by 2020 (Programme 2014). In addition, European countries increasingly viewthe circular economy as a political priority.
A “circular” economy is a continuous positive development cycle that preservesand enhances natural capital, optimizes the profitability of resources, and minimizessystemic risks by managing finite stocks and renewable flows.
The Report of the European Environmental Agency (EEA 2016) notes that, withan existing population of the Earth of 7.2 billion people, some planetary boundaries

Approaches to Ecosystem Services and Biodiversity Assessment … 67
defining areas of safe living have already been violated. This refers to the integrityof the biosphere, the cycles of nitrogen and phosphorus, climate change, changes insoil cover, etc.
The “SustainableDevelopmentGoals 2030”, adopted in September 2015 (Agenda2015), noted that “We are determined to protect the planet from degradation, includ-ing through the introduction of rational consumption and production patterns, therational use of its natural resources and the adoption of urgent measures in connec-tion with climate change, so that the planet can meet the needs of this and futuregenerations”. Many of the 17 sustainable development goals are aimed at conservingnatural capital and using ecosystem services.
Methods and Limitations
The investigation is based on analyzing the legislative base of theRepublic ofBelarus,their comparison with international ones, analyzing of National strategies and pro-grams, scientific reports and articles.
The article must give an answer on next questions:
1. What ecosystem services are presented in Belarus?2. Which legislation governs ecosystem services in Belarus?3. What biodiversity measures have been taken?
Ecosystem Services in Belarus
Providing Services
Crop. Agriculture of Belarus is specialized in cultivating traditional for moderatebreadth of cultures. In the structure of plant growing a high proportion is occupied bygrain and leguminous crops, aswell as forage crops, which is due to the specializationof the republic’s agriculture,mainly in dairy andmeat cattle breeding. Themain cropsare barley, rye, triticale. A special place is occupied by potatoes and flax. The mainvegetable crops are carrots, beets, cabbage. In Belarus, about 16% of the world’s flaxis concentrated, or more than 20% of its crops of the European continent (Belagro2016; Digest 2016).
Livestock and game animals. In animal husbandry, mainly cattle are grown forthe production of milk and meat, as well as pigs and poultry (Belagro 2016; Digest2016).
Fish. Commercial fishing in inland waters is one of the directions of the fishingindustry in Belarus. River fishing is concentrated mainly in the southern regions,where the rivers Dnipro, Pripyat, Sozh, Berezina and their tributaries are being

68 S. Zenchanka and N. Gorbatchev
developed. The fishing value Neman river is much lower, r. Western Dvina for com-mercial fishing is practically not used.
About 56 species of fish live inwater bodies and rivers of Belarus but nomore than20fish species have definite commercial importance.Analysis of the statistical data ofcommercial catch from lakes, rivers and reservoirs over the past five years has shownthat about 75% of catches fall on three species—roach, bream and carp. Seafoodaccounts for no more than 0.2%, eel—1.9%, large predators—ichthyophagous (pike,catfish, pike perch, asp)—4.4%.
With the adoption of the lease law, fishing grounds were transferred to numeroustenants from state and non-state enterprises and individuals. This led to an increasein the number of water bodies and streams used for fishing. Currently, 281 tenants(including state fisheries) are exploiting for the purpose of fishing about 600 lakes andreservoirs, a total area of 1.2 thousand km2 and 2.1 thousand km of rivers (Belagro2016).
Water. Renewable freshwater resources of the Republic of Belarus are representedby river runoff and groundwater, the volume of which is formed in natural conditionsdue to precipitation on the territory of the country (internal runoff), as well as theinflow of river and groundwater from adjacent countries. The total annual flow ofrivers is determined on the basis of measurement of water levels and discharge.
The natural resource of fresh groundwater is the total flow of groundwater flow,which is provided by infiltration of atmospheric precipitation. The magnitude of theinfiltration feeding of aquifers in the zone of active water exchange is 10–20% of theaverage long-term value of atmospheric precipitation. In the general runoff of therivers of Belarus, the share of groundwater is 27%.
The main source of surface water resources of the country are medium and largerivers, the volume of water flow by which in average water years, as a rule, does notexceed 57,900 million cubic meters per year. During the high water years, the totalriver runoff increases to 92,400million cubic meters per year, and in low-water (95%of the supply) it is reduced to 37,200 million cubic meters per year. At the same time,the rivers of the Black Sea Basin account for 55% of the total annual flow, the BalticSea basin—45% (Report 2016).
Belarus ranks fourth in terms of water resources of rivers in Europe after Norway(376,000 million cubic meters per year), UK (152,000 million cubic meters per year)and Poland (85,400 million cubic meters per year). The natural resources of freshgroundwater are 15,900 million cubic meters per year, and the forecasted resourcesare 18,100 million cubic meters per year.
Wastewater treatment. The ecosystem function for assimilating water pollutionand waste processing is being regulated. Belarusian Research Center “Ecology”developed a technical code of good practice “Environmental Protection and NatureManagement. Procedure for Conducting a Valuation of Ecosystem Services andDetermining the Value of Biodiversity”. The proposed methods allow estimatingthe value of forest, marsh and meadow ecosystems and the cost of correspondingecosystem services on their basis (Code 2012).
Timber. Forests and forest resources of the Republic of Belarus are the mostimportant element of the national wealth of the country, which have a significant
Approaches to Ecosystem Services and Biodiversity Assessment … 69
impact on its sustainable social and economic development. If theRepublic ofBelarusoccupies the 13th place in the Europe, according to the area of land resources percapita, on such characteristics as the forest cover of the territory, the forest area andthe stock of growing timber per capita, our country is included in the first ten foreststates of the Europe. The average age of the Belarusian forests, which forms theforest fund of the country, is 54 years. According to experts’ estimates in 2015, thetimber reserves in our country amounted to 1714.3 million cubic meters, which isequal to the total reserves of Great Britain, Hungary and Italy combined (Belagro2016).
The forest gives valuable birch sap, gill, game and furs, and the integrated use offorest resources, including processing of such wastes as stumps, roots, bark, smalland low-grade wood raw materials, obtained from the crown and during cutting, andtechnical greens, allow produce dozens of valuable products.
The Republic of Belarus has a rich potential of low-value wood rawmaterials andwaste that can be used as boiler-furnace fuel. The development of small-scale energybased on the use of wood fuel is one of the most important directions, ensuringa reduction in the share of imported energy resources, raising the level of energysecurity of the country.
Wild medicinal plants. In addition to tree stocks, forest resources also includenon-wood forest products, which are represented by berries, fruits and mushrooms(wild plants). In the Belarusian forests, there are over 140 species and forms ofedible mushrooms, and the possible volumes of wild berry production reach up to200 thousand tons.
Currently, almost half of the domestic medicines are made from plant materials,including those grown in the forest. A large number of forest plants-honey-plants area solid fodder base for beekeeping (Report 2016).
Land and soil. Land resources include all types of land: agricultural, human set-tlements, industry, transport, resorts, reserves, state forest fund. The land fund of theRepublic of Belarus remains unchanged and at the beginning of 2016 it is 207.60thousand hectares. Agricultural lands occupy 41.3% (8581.9 thousand hectares),forest lands—8742.1 thousand hectares (42.1% of the total area).
As a result of the Chernobyl disaster, 23% of the territory of Belarus were con-taminated with radioactive pollutions, on which there were 3678 settlements. Themost affected territories of the Brest, Gomel and Mogilev regions. A quarter of thecountry’s forest fund has been subjected to radioactive contamination in Belarus(Chernobyl 2017).
A special authority, Department for Elimination of the Consequences of the Cher-nobyl Disaster subordinated to theMinistry of Emergency Situations of the Republicof Belarus, is responsible for rehabilitation of lands, forests, water bodies and pro-vision of safe living conditions for people in areas contaminated by radionuclidesReport (2016). Programme (2010).

70 S. Zenchanka and N. Gorbatchev
Regulatory Services
Climate change. In Belarus, as in the whole world, climate change mainly related toglobal processes. However, its share in the world budget of carbon emissions is lessthan 0.01% (Contributions 2015). During the period of 1995–2005 on average 1.6%of the GDP was spent on improving energy efficiency with increasing to 3.4% of theGDP in 2006–2010, and up to 5% of GDP in 2011–2015. However, the followingclimate change facts that influx on ecosystem services are registered in Belarus:
– Reducing the yield of traditional crops and growing new crops;– Climatic zone displacement;– Migrating animals, birds and insects;– Drying of forests, increase in fire hazard in forests;– Reducing the harvest of mushrooms and berries;– Unfavorable and dangerous hydro meteorological phenomena;– Increased growth of parasitic and infectious diseases, allergies;– The emergence of climate migrants due to famine and natural disasters.
For the second period of the obligations of the Kyoto Protocol, the Republicof Belarus has undertaken a number of voluntary commitments to reduce energyintensity of GDP and greenhouse gas emissions with target indicators up to 2020,which are reflected in the main program documents and normative legal acts of theRepublic of Belarus (Contributions 2015):
– The target for reducing greenhouse gas emissions in 2020 by 8% to the level of1990;
– Ensuring greenhouse gas emissions by 2020 at the level of not more than 110million tons.
Ecosystem effects of Chernobyl disaster. Formation of radioactive contaminationof the natural environment in the territory of Belarus began immediately after theexplosion of the reactor. The peculiarities of meteorological conditions in the periodApril 26-May 10, 1986, as well as the composition and dynamics of the accidentalrelease of radioactive substances, caused the complex nature of the contaminationof the territory of the republic.
Analysis of radioactive contamination of Europe with cesium-137 shows thatabout 35% of the Chernobyl fallout of this radionuclide on the European continentwas located on the territory of Belarus. The contamination of the territory of Belaruswith cesium-137 with a density of over 37 kBq/m2 accounted for 23% of the totalarea of Belarus (for Ukraine—5%, Russia—0.6%).
Surface water is the main factor that determines the migration of radionuclidesin ecosystems. Especially important is the assessment of the transitional role ofrivers, which are the main carriers of radionuclides and contribute, among otherthings, to their transboundary movement. The problem of radioactive contaminationof air masses remains relevant in the areas adjacent to the resettlement zone. It isdetermined by the content of radioactive dust in the surface layer of the atmosphere.

Approaches to Ecosystem Services and Biodiversity Assessment … 71
Dust formation significantly increases during agricultural and other works with anactive technogenic impact on the soil. On radioactive contamination of surface air, asignificant local influence is exerted by certain natural phenomena, primarily forestand peat fires.
The vegetation of the territories of radioactive contamination forms the basis of thefodder base of wild animals, in which there is an increased content of radionuclidesaccumulating in muscle tissue and bones. Hunting and commercial ungulates showa clearly expressed seasonal dependence of accumulation of radionuclides (increasein the summer-autumn period). The composition and structure of zoocenoses under-goes significant changes in the zones of alienation and resettlement. Currently, theecosystem development of contaminated areas is carried out mainly at the expenseof public funds (Chernobyl 2017).
Cultural Services
There are 2 national nature reserves, 4 national parks and 85 local nature reserves onthe territory of the Republic of Belarus. Specially protected natural areas to ensurethe preservation of the natural balance, the genetic fund and serve as centers for thereproduction of plants and animals, combined with limited and consistent use ofother natural resources. About 80% of rare and endangered wild plants and about90% of rare and endangered wild animals live within the boundaries of speciallyprotected natural areas. The conservation of rare and endangered species of wildanimals and wild plants is possible only with the protection of their habitat, takinginto account climatic, geophysical and other conditions. A special role is played bythe preservation of the environment-forming species of wild animals and wild plantsthat form the internal environment of the ecological system. Formation of an optimalsystem of specially protected natural areas of the Republic of Belarus is aimed atpreserving natural ecological systems, biological and landscape diversity, ensuringecological balance of natural systems and sustainable use of animal and plant, naturalterritories (National Strategy 2014).
Ecotourism is widely spread in Belarus. Tourists are offered routes to such naturalcomplexes as Belovezhskaya Pushcha, Berezinsky Biosphere Reserve, PripyatskyReserve and others.
A key tourist attraction of Belarus, Belovezhskaya Pushcha National Park, iswhat’s left of the primeval forest which used to stretch from the Baltic Sea to the BugRiver and from Odder to the Dnieper River. Belovezhskaya Pushcha National Parkwas made a UNESCOWorld Heritage Site in 1992. In 1993 it was granted UNESCOBiosphere Reserve status (http://www.belarus.by/en/travel/belarus-life/belovezhskaya-pushcha). The park is famous for its ancient named oak trees dating back morethan 500 years. In all there are almost 900 species of trees and flowers. It is also hometomore than 250 animal and bird species. The Belovezhskaya Pushcha National Parkalso boasts a zoo, library and a museum, and supports wood processing, handicraftsand various local industries.
72 S. Zenchanka and N. Gorbatchev
The Berezinsky Biosphere Reserve is the oldest and the only natural area of pro-tection in the Republic of Belarus of the highest rank. It is a real model of the naturalenvironment, one of very few undisturbed corners of European part of the south-ern taiga (http://www.berezinsky.by/en/ecotourism/routes/pedestrian/). This reservesuggests such routes as “Trail of discovery” (interactive excursion with many eco-logical games, “Along the forest wildlife path” (ecological track) and “KamennayaPlita” (Stone Plate).
Pripyatsky Park, one of the national parks of Belarus, is located between the riversPripyat, Stviga and Ubort. Special protection has been granted to about 190,000 hawith more than a third represented as a wildlife reserve (http://www.belarus.by/en/about-belarus/natural-history/pripyatsky-national-park). At present the National ParkPripyatsky is one of the most popular tourist attractions in Belarus. The nationalpark is home to 51 species of mammals: wild boar, deer, elk, doe, hare, fox, muskrat,raccoon dog, beaver, etc., including rare species: European bisons, European mink,European lynx, badger, garden dormouse, common dormouse, hazel dormouse. TheNational Park Pripyatsky has the international status of the key ornithological terri-tory. It is home to 256 species of birds (79% of all the birds in Belarus), including65 species in the Red Book of Belarus.
Supporting Services
In Belarus, biodiversity depends on the state of natural ecosystems, which occupyabout 50% of the country’s territory. These are mostly forested, and their conditionis the most sustainable. To conserve forest ecosystems, there is enough protectionand sustainable use. A strategy for adapting forestry to climate change by 2030 hasalso been developed.
Wetlands are another significant biosystem inBelarus. They occupy a smaller area,they are less sustainable. Now the wetland complexes occupy 863,000 ha, there aremore than 40%of theRedBook species of birds. InBelarus, for example, a significantpart of the populations of spiny reed lives, and the number of large spotted eagles isquite large. In accordance with the Strategy, an inventory of irrigation and drainagesystems will be conducted by the Institute of Experimental Botany together with theForest Institute. It will determine the fate of about 150 thousand ha of drained land.Some of them will re-swamp, and effective reclamation systems stabilize.
Polessky State Radiation Ecological Reserve is the largest (more than 215 thou-sand ha) in Belarus. The reserve was organized on July 18, 1988 in the Belarusianpart of the exclusion zone on the territory of the three most affected areas of theGomel region—Bragin, Narovlyansky and Khoiniki. On the territory there are 96abandoned settlements, where before the accident livedmore than 22 thousand inhab-itants. Belarusian scientists also observe natural phenomena in the exclusion zone onthe example of the Polessky State Radiation Ecological Reserve (PSRES), formedaround the Belarusian sector of the zone (http://www.zapovednik.by/).

Approaches to Ecosystem Services and Biodiversity Assessment … 73
Here there is an increase in the number of animal populations, the appearance ofrare species and species that were not previously observed in this area. In turn, thegrowth of wildlife populations is observed on a pan-European scale, and the increas-ing anthropogenic impact on the land around the exclusion zone forces animals tomove to contaminated areas. This does not negate the fact that in the absence ofeconomic activity of a person, such lands are now an excellent testing ground for thestudy of wild animals, reproduction of rare species such as bison, lynx, etc. Scientistsplan to use the unique conditions of Polessky State Radiation and Ecological Reserveto resume such species lost to Belarus as a European cat.
Legislation on Ecosystem Services and Biodiversityin Belarus
Legislative regulation of environment and ecosystem services is carried out usinginternational agreements, codes of Belarus and government regulations. Legislativeacts are grouped in codes: Water, Forest, Air, Code of Subsoil, Land Code. Addi-tionally, legislation adjusts the procedures related to state environmental expertise,strategic environmental assessment and environmental impact assessment (http://www.minpriroda.gov.by/ru/deistv_zakon-ru/).
The ecosystem services accounting in Belarus is distributed among 5 state bodiesand is connected with the collection and analysis of statistical data.
1. TheMinistry of Natural Resources and Environmental Protection—procurement(harvesting) of wild plants, use of water and natural resources, management ofwastes, emissions of pollutants and carbon dioxide.
2. TheMinistry of Forestry—harvesting, export ofwood and use of forest resources,protection of forests from pests and diseases, hunting activities.
3. The Ministry of Sport and Tourism—touristic activities.4. The Ministry of Agriculture and Food—fish resources, sowing of agricultural
plants by varieties and reproductions, special reports related to elimination ofconsequences of Chernobyl disaster.
5. The State Inspectorate for the Protection of Fauna and Flora is a specially autho-rized state body subordinate to the President of the Republic of Belarus that,within its competence, exercises state control over the protection and use of wildanimals related to hunting and fishing facilities, tree and shrub vegetation andother wild plants, forest resources.
Special reports related to elimination of consequences of Chernobyl disaster,which are collected by the Ministry of Agriculture and Food from local authori-ties and companies include information on the contamination of agricultural prod-ucts with radionuclides of cesium-137 and strontium-90. Upon analysis of collectedinformation it produces an annual report on the implementation of a set of specialprotective measures on agricultural lands contaminated with radionuclides.
74 S. Zenchanka and N. Gorbatchev
Environmental monitoring in Belarus is carried out within the framework of theNational System for Monitoring the Environment in the Republic of Belarus (abbre-viated asNSEM, http://www.nsmos.by), established in 1993. This systemhelpsmon-itor current ecological state and forecast their future status. Annual reports of thissystem are presented on the site http://www.nsmos.by/content/402.html.
Currently, theNSME includes 11organizational-independent types ofmonitoring,the environment, that analyses collected statistical and environmental data:
• Monitoring of land;• Surface water monitoring;• Groundwater monitoring;• Monitoring of atmospheric air;• Monitoring of the ozone layer;• Flora monitoring;• Forest monitoring;• Monitoring of wildlife;• Radiation monitoring;• Geophysical monitoring;• Local environmental monitoring.
NSMOS is a complex system developing over time and changing conditions. Inorder to ensure the normative legal basis for the functioning and development ofthe NSEM for 2011–2015, the President of the Republic of Belarus adopted DecreeNo. 244 of June 13, 2011 “On the Approval of the State Program for Ensuring theFunctioning and Development of the National Environmental Monitoring System inthe Republic of Belarus for 2011–2015” (NSMOS 2011).
The legislation of Belarus in the field of ecosystems and biodiversity protectionis sufficient to realize the main objectives: protection of species and habitats, main-tenance and restoration of ecosystems, achievement of more sustainable agricultureand forestry, to make fishing more sustainable and water resources healthier com-bating of invasive alien species help stop the loss of global biodiversity. Specialmeasures to collect and analyze data related to Chernobyl disaster are arranged.
In September 2015, the Council of Ministers of the Republic of Belarus approvedthe National Action Plan for the Conservation and Sustainable Use of BiologicalDiversity for 2016–2020 and updated the Strategy for the Conservation and Sustain-able Use of Biological Diversity (Strategy 2015). The Strategy provides the basisfor the formation of a national ecological network, as well as for announcements ofbiosphere reserves created to ensure sustainable economic development of regionstaking into account environmentally oriented use of natural resources and protectionof ecosystems. State programs for the development of the system of specially pro-tected natural areas, a scheme for a national ecological network, a scheme for therational allocation of specially protected natural areas of national importance andregional schemes for the rational allocation of specially protected natural areas oflocal importance are developed and implemented to conserve biodiversity (http://www.minpriroda.gov.by/ru/deistv_zakon-ru/).

Approaches to Ecosystem Services and Biodiversity Assessment … 75
Conclusion
The degradation of ecosystem services could grow significantly worse in the begin-ning of XXI century and is a barrier to achieving the Sustainable Development Goals2030. The challenge of reversing the degradation of ecosystems can be partially metunder some scenarios, but these involve significant changes in policies, institutions,and practices that are not currently under way. Many options exist to conserve orenhance specific ecosystem services in ways that reduce negative trade-offs or thatprovide positive synergies with other ecosystem services.
The green economy in the EU focuses on the second-generation environmentalproblems, which include problems of climate change and biodiversity loss, develop-ing generalized solutions to first-generation environmental problems, which includeair, water, soil, considered in the concept of sustainable development.
In 2015 the European Union has funded a project called “Technical Assistanceto Support the Development of Green Economy in Belarus”, which also includedreadiness of national legislation to implementation of ecosystem services (Project2014). The project suggests to identify the ecosystem service in national legal instru-ments, choose the scenario: which ecosystem services using market instruments willbe presented in the short and long term.
National Report (2015) “On Human Development in the Republic of Belarus—-Competitive advantages of the regions of Belarus” includes the strategy of ecosystemservices development, introduced by the Ministry of Economy of Belarus. The strat-egy includes main ecosystem services being developed in Belarus: provision of freshwater of normative quality, carbon uptake, preservation of biodiversity and aestheticproperties of landscapes. The formation of the sector of ecosystem services canbe considered as part of the national economy and the economy of regions inte-grated into international relations. In the domestic market, the ecosystem servicessector includes the following subsectors: trading in greenhouse gas emission quotas;Cultural ecosystem services; Wastewater treatment. However, it is stated that thedevelopment of a legislative base in the Republic of Belarus is necessary to createthe subsector “Trade in quotas for greenhouse gas emissions”.
Belarus has also some unique practices in the field of ecosystem services manage-ment, which also may be analyzed and disseminated as best practices of ecosystemaccounting and management:
– Forest resources management related to wild medicinal plants, berries and mush-rooms. This procedure adjusts with the Resolution (2016) “On the establishmentof the tax value for spurious forest management and harvesting of secondary forestresources”, which introduces a tax on the collection of mushrooms, berries, herbsand so on.
– Cultivation of lands contaminated with radionuclides after Chernobyl disasterand monitoring of radioactive contamination, especially related to transpondercontamination between Belarus, Russia and Ukraine.

76 S. Zenchanka and N. Gorbatchev
References
Agenda (2015) 2030 Agenda for Sustainable Development. Transforming our world. Available at:http://www.un.org/sustainabledevelopment/sustainable-development-goals/. Accessed 14 Dec2017
Agenda 21 (1992) United Nations Conference on Environment & Development, Rio de Janerio,Brazil, 3 to 14 June 1992. Available at: https://sustainabledevelopment.un.org/content/documents/Agenda21.pdf. Accessed 14 Dec 2017
Belagro (2016) Agriculture of the Belarus. Available at: http://aw.belal.by/russian/prof/prof.htm.Accessed 14 Dec 2017. (in Russian)
Chernobyl (2017) Pollution of the Territory of the Republic of Belarus and Zoning. Available at:http://www.chernobyl.gov.by/index.php?id=105&Itemid=54&option=com_content&. Accessed14 Dec 2017. (in Russian)
Code (2012) Technical code of installed practice on environmental protection environment andnature use the order of conducting the value estimation of ecosystem services and determinationof value of biological diversity, Ministry of Natural Resources of the Republic of Belarus, Minsk.Available at: http://tnpa.ecoinv.by/. Accessed 14 Dec 2017. (in Russian)
Costanza R, Daly HE (1992) Natural capital and sustainable development. Conserv Biol 6(1):37–46Contributions (2015) Intended Nationally Determined Contributions of the Republic of Belaruspursuant to paragraphs 13 and 14 of Decision 1/CP.20 adopted by the Conference of the Par-ties to UNFCCC. Available at: http://minpriroda.gov.by/uploads/files/Belarus-INDC-Eng.pdf.Accessed 14 Dec 2017
Digest (2016) Agriculture of the Republic of Belarus. Statistical digest, National Statistical Com-mittee of the Republic of Belarus, Minsk (in Russian)
EEA (2016) Circular economy in Europe: Developing the knowledge base, EEAReport No 2/2016.Publications Office of the European Environment Agency, Luxembourg
Haines-Young R, Potschin M (2013) Common international classification of ecosystem ser-vices (CICES). Consultation on Version 4, August-December 2012. (Report to the Euro-pean Environmental Agency, EEA Framework Contract no: EEA/IEA/09/003). Availableat: http://test.matth.eu/content/uploads/sites/8/2012/07/CICES-V43_Revised-Final_Report_29012013.pdf. Accessed 14 Dec 2017
IPBES (2016) Summary for policymakers of the assessment report of the intergovernmental science-policy platform on biodiversity and ecosystem services on pollinators, pollination and food pro-duction, In: Potts SG, Imperatriz-Fonseca VL, Ngo HT, Biesmeijer JC., Breeze TD, Dicks LV,Garibaldi LA, Hill R, Settele J, Vanbergen AJ, Aizen MA, Cunningham SA, Eardley C, FreitasBM, Gallai N, Kevan PG, Kovács-Hostyánszki A, Kwapong PK, Li J, Li X, Martins DJ, Nates-Parra G, Pettis JS, Rader R, Viana BF (eds) Secretariat of the Intergovernmental Science-PolicyPlatform on Biodiversity and Ecosystem Services, Bonn, Germany
Millennium (2003) Ecosystems and human well-being: a framework for assessment. MillenniumEcosystem Assessment. World Resources Institute, Island Press, Washington, Covelo, London
Millennium (2005)Millennium EcosystemAssessment, 2005. Ecosystems and HumanWell-being:Synthesis, Island Press, Washington, DC. Available at: http://www.millenniumassessment.org/documents/document.356.aspx.pdf. Accessed 14 Dec 2017
National Strategy (2014) National Strategy until 2030 for the Development of the System of Spe-cially Protected Natural Territories. Available at: http://www.pravo.by/upload/docs/op/C21400649_1405026000.pdf. Accessed 14 Dec 2017
NSMOS (2011) The State Program for Ensuring the Functioning and Development of the NationalSystem for Monitoring the Environment in the Republic of Belarus. Available at: http://www.nsmos.by/tmp/fckimages/Pologenie949.rtf. Accessed 14 Dec 2017
Pearce D, Markandya A, Barbier EB (1989) Blueprint for a green economy. Earthscan Publication,London

Approaches to Ecosystem Services and Biodiversity Assessment … 77
Programme (2010) State program for overcoming the consequences of the Chernobyl disaster for2011–2015 and for the period until 2020. Available at: http://www.pravo.by/pdf/2011-10/2011-10(015-069).pdf. Accessed 14 Dec 2017
Programme (2014) General Union Environment Action Programme to 2020. Living well, withinthe limits of our planet, Publications Office of the European Union, Luxembourg
Project (2014) Technical Assistance to Support the Development of Green Economy in Belarus.Available at: http://greenlogic.by/content/files/TechSupport/Green_economy_Belarus_Laevsskaya_110615.pdf. Accessed 14 Dec 2017
Report (2012) The Future we Want. Available at http://www.un.org/disabilities/documents/rio20_outcome_document_complete.pdf. Accessed 14 Dec 2017
Report (2015) National Report on Human Development in the Republic of Belarus. Competitiveadvantages of the regions of Belarus, Minsk (in Russian)
Report (2016) National Report on the State of the Environment of the Republic of Belarus. Availableat: http://www.greeneconomy.minpriroda.gov.by/ru/new_url_1467880245-ru/. Accessed 14 Dec2017. (in Russian)
Resolution (2016) On the establishment of the tax value for spurious forest management and har-vesting of secondary forest resources, Resolution of the Council of Ministers of the Republic ofBelarus November 17, 2016 No. 927. (in Russian)
SEEA (2014) System of environmental-economic accounting 2012: experimental ecosystemaccounting. United Nations, New York
SEEA AFT (2014) System of Environmental-Economic Accounting for Agriculture, Forestry andFisheries. Draft for global consultation. Available at: https://unstats.un.org/unsd/envaccounting/aff/GC_Draft.pdf. Accessed 14 Dec 2017
SEEA Central Framework (2012) System of Environmental-Economic Accounting 2012: centralFramework. United Nations, New York, p 2014
SEEA Energy Accounting (2012) System of Environmental-Economic Accounting for Energy,United Nations Statistics Division. Available at: https://unstats.un.org/unsd/envaccounting/energy.asp. Accessed 14 Dec 2017
SEEAWater Accounting (2012) System of Environmental-Economic Accounting forWater, UnitedNations, New York. Available at: https://unstats.un.org/unsd/envaccounting/seeaw/seeawaterwebversion.pdf. Accessed 14 Dec 2017
Strategy (2015) Belarus Strategy for the Conservation and Sustainable Use of Biological Diver-sity. Available at: http://www.minpriroda.gov.by/ru/news-ru/view/3-sentjabrja-2015-goda-postanovleniem-sovetom-ministrov-respubliki-belarus-743-utverzhden-natsionalnyj-plan-1752/.Accessed 14 Dec 2017. (in Russian)
TEEB (2013) The Economics of Ecosystems and Biodiversity (2013): Guidance Manual for TEEBCountry Studies. Version 1.0, United Nations Environment Programme
UNEP (2011) Towards a Green Economy: Pathways to Sustainable Development and PovertyEradication. Available at: www.unep.org/greeneconomy. Accessed 14 Dec 2017
UNEP (2015) Uncovering Pathway towards an Inclusive Green Economy. A Summary for leaders.Available at: http://drustage.unep.org/greeneconomy/sites/unep.org.greeneconomy/files/publications/ige_narrative_summary_web.pdf. Accessed 14 Dec 2017
United Nations (1993) Handbook of National Accounting: Integrated Environmental and Eco-nomic Accounting, Interim version, Studies in Methods, Series F, 1993.—No. 61. Sales No.E.93. XVII.12. Available at: (http://unstats.un.org/unsd/publication/SeriesF/SeriesF_61E.pdf.Accessed 14 Dec 2017
United Nations (2000) Handbook of National Accounting: Integrated Environmental and Eco-nomic Accounting. An Operational Manual, Studies in Methods, Series F, 2000—No. 78. SalesNo. E.00.XVII.17. Available at: http://unstats.un.org/unsd/publication/SeriesF/SeriesF_78E.pdf.Accessed 14 Dec 2017
United Nations (2003) Handbook of National Accounting: Integrated Environmental and EconomicAccounting 2003, Studies inMethods, Series F, No. 61, Rev. 1 (ST/ESA/STAT/SER.F/61/Rev.1).Available at: http://unstats.un.org/unsd/envaccounting/seea2003.pdf. Accessed 14 Dec 2017

78 S. Zenchanka and N. Gorbatchev
Zenchanka Siarhei is a professor of the chair of Management, Accounting and Finance of theMinsk Branch of the Plekhanov Russian University of Economics. He has a Ph.D. in Applied Sci-ence. His research focus is in the areas of the sustainable development and education for sustain-able development.
Gorbatchev Nikolai is Deputy Director for Research and Information Technologies of the Minskbranch of the Plekhanov Russian University of Economics. He is associate professor of theDepartment of Economics. He has a Ph.D. in Economics (“Mathematical and Instrumental Meth-ods of Economics”). He is the author of more than 50 scientific works on modeling of informationsystems, sustainable development, e-learning technologies.

Community Action for Biodiversityand Forest Conservation and Adaptationto Climate Change in the Wild CoffeeForests (CAFA)
Svane Bender and Mesfin Tekle
Abstract The Afromontane cloud forests of the Kafa Biosphere Reserve in south-west Ethiopia are considered to be the origin and centre of Coffea arabica’s geneticdiversity and home to many rare species. Together with the area’s numerous wet-lands, they form a carbon sink of superregional importance. However, studies haveshown that the habitats are threatened by overexploitation and climate change. Inaddition, the natural connectivity of the local population, in particular of young peo-ple to their natural environment and the loss of knowledge on traditional use andcultivation systems is notable. NABU, a German NGO, therefore started workingtowards climate and biodiversity conservation and supports the local population toindependently ensure the long-termconservation of key ecosystems and their servicesfor livelihoods. This paper gives an insight into Participatory Forest Management atthe wild coffee forests at Kafa Biosphere Reserve. The authors outline the proac-tive planning process, constraints and limitations for management as well as lessonslearned from practical implementation of the concept. The results may be used bypractitioners such as representatives from NGOs, administrations of protected areasand communities.
Introduction
Ethiopia is a world gene centre of origin (McKee 2007) and is considered to beone of world’s most biodiverse countries (BIDNTF 2010). The remnant highlandforests, althoughdeclining, harbour invaluable key ecosystems. The current 3% forestcover descended from a 40% forest cover since the 1970s and still continues to
S. Bender (B)The Nature and Biodiversity Conservation Union (NABU), Charitéstr, 3,10117 Berlin, Germanye-mail: [email protected]
M. TekleThe Nature and Biodiversity Conservation Union (NABU),NABU Project Office, Bonga, Ethiopiae-mail: [email protected]
© Springer Nature Switzerland AG 2019W. Leal Filho et al. (eds.), Handbook of Climate Change and Biodiversity,Climate Change Management, https://doi.org/10.1007/978-3-319-98681-4_5
79
80 S. Bender and M. Tekle
decrease at an annual rate of between 80,000 and 200,000 ha. If this trend continues,it can be assumed that the marvellous forests will have disappeared in 2020 (EFAP1994). Deforestation and degradation are key drivers attributed to population growth,firewood extraction, agricultural encroachment, illegal settlement and expansion ofinfrastructure and commercial farming.
Participatory Forest Management (PFM) in Ethiopia
FAO (2016) defines participatory forestry as “processes and mechanisms whichenable people with a direct stake in forest resources to be part of decision-makingin all aspects of forest management, including policy formulation processes”. InEthiopia, Participatory Forest Management (PFM) has been in practice since themid 1990s. The term PFM is used to describe forest management systems in whichcommunities (forest users and managers) and government services (forest depart-ment) work together to define rights of forest resource use, identify and developforest management responsibilities, and agree on how forest benefits will be shared(FARM-Africa and SOS Sahel Ethiopia 2007). According to MoA, the EthiopianMinistry of Agriculture (2012), practical experiences and lessons have proven thatthe communities in and around forested areas can be part of the solution for reduc-ing deforestation and regeneration of forest resources. These practical experiencesgained within Ethiopia, have repeatedly shown that the participation of the commu-nities in the negotiation and drafting of the forest management, conservation and useplans strongly contributes to create community ownership and ensures communityinvolvement at all stages of forest resourcemanagement (Befikadu andLuwiza 2014).Participation is believed to be the crucial element for sustainable forest management.
Essentially, the PFM process leads to the establishment of a forest user group(FUG), which enters into a PFM agreement with the district’s Woreda Office ofAgriculture. The agreement as well as a forest management plan set down the rightsand responsibilities of the forest user group and the Woreda Office of Agriculture.The management plan lays out the protection, utilization and development of thePFM area. Use rights usually involve the harvesting of Non-Timber Forest Products(NTFP) and limited amounts of firewood and construction wood. In return, the forestuser group commits to protecting and sustainably using the PFMareawith the supportfrom the district and communal administration. This should lead to a reduction ofillegal activities such as clearing for agricultural land, free livestock grazing, logging,firewood collection and charcoal production. PFM agreements may also involve therehabilitation of previously deforested or degraded land planting native tree species.
NABU’s Work in Ethiopia
Since 2006 NABU has been supporting people and nature in Ethiopia. NABU is aregistered international NGO and operates currently two offices in the capital AddisAbaba and four project offices in different part of the country, partly together with

Community Action for Biodiversity and Forest Conservation … 81
partners. Starting with the establishment of Kafa Biosphere Reserve, NABU pur-sued implementing large scale conservation projects in the area, funded by the Ger-man government. NABU’s current project comprises the following components: (i)adaptation of agriculture to climate change for soil protection and food security,(ii) improvement and fostering of Participatory Forest Management, (iii) introduc-tion of community-based wetland protection, (iv) local anchoring of community-based monitoring with nature rangers, (v) expansion and marketing of regional prod-ucts, (vi) Fostering capacity building and education and (vii) project-accompanyinginformation campaign. Upon the establishment of Kafa Biosphere Reserve, NABU,UNESCO and the Ministry of Science and Technology of the Federal DemocraticRepublic of Ethiopia signed aMemorandum of Understanding to establish a networkof biosphere reserves in Ethiopia. Since then NABU became one of the main stake-holders supporting UNESCO biosphere reserves in the country. NABU implementsprojects on biosphere reserve management, sustainable development and incomegeneration conservation, rehabilitation and adaptation to climate change. In particu-lar, NABUpromotes community-based resourcemanagement systems as an effectivetool against habitat fragmentation and degradation.
Implementation Practice of PFM in Kafa Biosphere Reserve
Forest fragmentation is a major cause of forest loss in Kafa Biosphere Reserve(Dresen 2011). Even at a low deforestation rate, fragmentation can lead to a reductionor even a complete loss of contiguous forest and create forest islands with seriousconsequences on biodiversity and ecosystem functions, thereby increasing people’svulnerability to climate change (Dresen 2011; De Vries and Herold 2014). A reviewon PFM effectiveness in Kafa Zone concluded that PFM has shown positive impactsboth on the state of the forest and living condition of participant households at leastwithin the project life time (Gobeze et al. 2009). PFM also (i) promotes awarenesson forests, (ii) facilitates institutionalization of increased community participationin forest management and regulates open access and (iii) contributes towards socialequity in terms of gender and ethnic minority groups.
Between December 2009 and February 2013, NABU supported the establishmentof 16 PFM sites covering more than 11,000 ha at the Kafa Biosphere Reserve. ThePFM sites are located in five of the ten Woredas (districts) of the reserve and wereselected according to criteria such as high pressure on the forest as well as recom-mendation from the local government and urgent demand from local community inthe face of losing the forest to agro-investments. The following methodology wasapplied by NABU in line with current practice (e.g. FARM-Africa and SOS SahelEthiopia 2007) for the establishment of the PFM sites:
i. Identification of potential PFM areas;ii. Consultation, awareness creation and data collection involving all forest users;
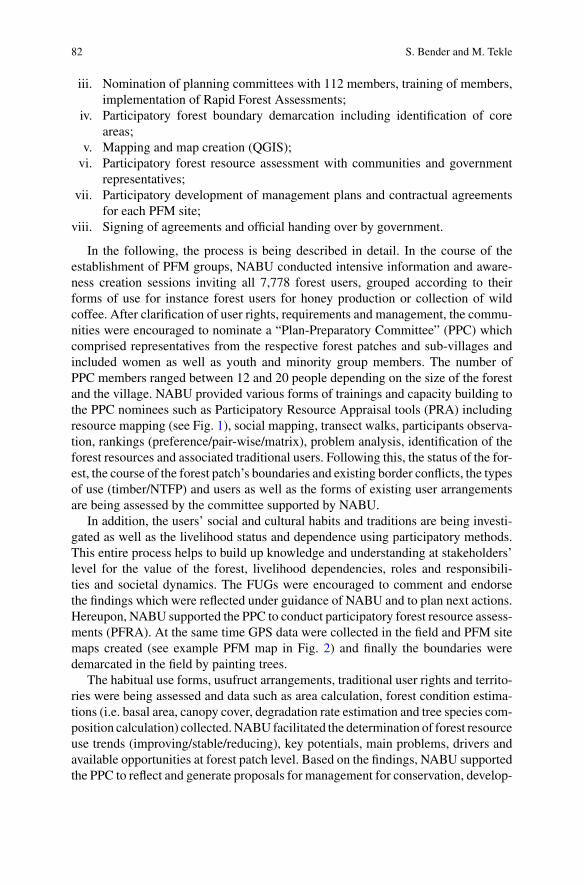
82 S. Bender and M. Tekle
iii. Nomination of planning committees with 112 members, training of members,implementation of Rapid Forest Assessments;
iv. Participatory forest boundary demarcation including identification of coreareas;
v. Mapping and map creation (QGIS);vi. Participatory forest resource assessment with communities and government
representatives;vii. Participatory development of management plans and contractual agreements
for each PFM site;viii. Signing of agreements and official handing over by government.
In the following, the process is being described in detail. In the course of theestablishment of PFM groups, NABU conducted intensive information and aware-ness creation sessions inviting all 7,778 forest users, grouped according to theirforms of use for instance forest users for honey production or collection of wildcoffee. After clarification of user rights, requirements and management, the commu-nities were encouraged to nominate a “Plan-Preparatory Committee” (PPC) whichcomprised representatives from the respective forest patches and sub-villages andincluded women as well as youth and minority group members. The number ofPPC members ranged between 12 and 20 people depending on the size of the forestand the village. NABU provided various forms of trainings and capacity building tothe PPC nominees such as Participatory Resource Appraisal tools (PRA) includingresource mapping (see Fig. 1), social mapping, transect walks, participants observa-tion, rankings (preference/pair-wise/matrix), problem analysis, identification of theforest resources and associated traditional users. Following this, the status of the for-est, the course of the forest patch’s boundaries and existing border conflicts, the typesof use (timber/NTFP) and users as well as the forms of existing user arrangementsare being assessed by the committee supported by NABU.
In addition, the users’ social and cultural habits and traditions are being investi-gated as well as the livelihood status and dependence using participatory methods.This entire process helps to build up knowledge and understanding at stakeholders’level for the value of the forest, livelihood dependencies, roles and responsibili-ties and societal dynamics. The FUGs were encouraged to comment and endorsethe findings which were reflected under guidance of NABU and to plan next actions.Hereupon, NABU supported the PPC to conduct participatory forest resource assess-ments (PFRA). At the same time GPS data were collected in the field and PFM sitemaps created (see example PFM map in Fig. 2) and finally the boundaries weredemarcated in the field by painting trees.
The habitual use forms, usufruct arrangements, traditional user rights and territo-ries were being assessed and data such as area calculation, forest condition estima-tions (i.e. basal area, canopy cover, degradation rate estimation and tree species com-position calculation) collected.NABU facilitated the determination of forest resourceuse trends (improving/stable/reducing), key potentials, main problems, drivers andavailable opportunities at forest patch level. Based on the findings, NABU supportedthe PPC to reflect and generate proposals for management for conservation, develop-

Community Action for Biodiversity and Forest Conservation … 83
Fig. 1 Participatory forest resource assessment with communities. Picture credit Angelika Berndt
Fig. 2 Example of PFM site boundaries in Kafa Biosphere Reserve (Sharada PFM). SourceNABU

84 S. Bender and M. Tekle
ment or enhancement and utilization. Alternative livelihood improvement activitieswere also being discussed. Finally, NABU closely supported the drafting of the for-est management plan focusing on three main activities and two cross-cutting tasks:forest conservation, forest development and/or enhancement and forest utilizationas main activities and forest monitoring and livelihood improvement activities ascross-cutting tasks. The draft plan was then presented to FUGs for discussion andapproval. Once endorsed by the community, the plan was submitted to the relevantoffices (agriculture or forest section) for assessment and approval. Meanwhile, thePPC also developed byelaws and agreement documents that were simultaneouslysubmitted to the offices. Finally, an agreement between the relevant governmentofficials and representatives of the FUGs was signed.
In general, the establishment process contributes to the following key aspects:(1) Understanding and knowledge building, (2) definition of territory and habitualresource use, (3) formalization of the rights of traditional users while compromisingthe emerging needs and shortage or dwindling of forest products through negotiat-ing and compromising, (4) determining forest management objectives for optimumutilization, protection and regeneration and forest/product enhancement.
This paper summarises methods, practical implementation and findings of a casestudy implementing Participatory Forest Management in Ethiopia. The authors drawlessons learned to be used by practitioners such as NGO representatives, adminis-tration of protected areas and communities.
Methods
Study Site: The Kafa Biosphere Reserve
TheKafaBiosphereReserve is situated in Southwest Ethiopia (latitude: 35°29′50.55′′to 36°47′33.78′′ North/longitude: 35°48′50.57′′ to 35°44′34.30′′ East, see Fig. 3). Itwas designated as UNESCO biosphere reserve in 2010. Its planning and establish-ment as one of the first biosphere reserves of Ethiopia, was a widely appreciated suc-cess under the technical guidance of NABU and within the framework of a GermanPublic-Private-Partnership project. It has a forest cover of 47% with 4% (28,172 ha)being core zone serving as a refuge for endemic or endangered species (Dresen 2011).Administratively, the reserve comprises ten Woredas (districts), 250 rural Kebeles(lowest administrative unit) and 25 towns.
With a size of 760,000 ha, the reserve covers also three Regional Priority ForestAreas (compare Fig. 4) designated for national protection. It harbours 45,000 ha ofextensive wetlands and floodplains as well as the Omo-Gibe and Baro-Akob basinsand has been recognised for its remarkable species endemism (NABU 2017). Thearea is particularly noteworthy as global in situ gene bank being the origin andcentre of Coffea arabica’s genetic diversity. Due to this fact, the area has been ratedat a value of $1.5 billion (Hein and Gatzweiler 2006). Along with the forests, the

Community Action for Biodiversity and Forest Conservation … 85
Fig. 3 Location of the Kafa Biosphere Reserve at national and regional scale (NABU 2017)
aquatic habitats are the main suppliers of ecosystem services to local communitiesand provide animal fodder, building materials, medicinal plants etc.
650,000 people live in the premises of Kafa Biosphere Reserve. With an averageof 98% inhabitation per km2, the range extends from 52 to 210 inhabitants per km2
(SNNPR 2013). According to Chernet (2008) the population consists ethnically of81% Kaffichos, 6% Bench, 6% Amhara, 2% Oromo and 5% minorities (Manjas).More than 90%of the inhabitants’ livelihoods dependon subsistence farming, the saleof coffee (10% forest coffee/65% garden coffee), forest honey and the use of naturalresources e.g. for food, fuel, buildingmaterial andmedicinal plants or spices (SNNPR2013). Mainly grain is being cultivated, including the local Ethiopian grain speciesteff (Eragrostis teff ), legumes and the locally important Abyssinian banana (Enseteventricosum), whose starch-rich stem is fermented for bread. The most commonlivestock is cattle (7.5 per household, 2011/2012, local government), followed bypoultry, sheep and goats. Wild coffee harvesting has been practised over centuries;complex tenure arrangements and traditions and rites have been developed.

86 S. Bender and M. Tekle
Fig. 4 Kafa Biosphere Reserve, its protection zones (core/buffer/transition) and Forest PriorityAreas. Source Dennis Moss Partnership (2009)
Impacts of Climate Change and Threats to Biodiversity
Increasingly, the natural ecosystems of Kafa Biosphere Reserve are being degraded.The degradation also endangers important ecosystem functions and subsequentlyincreases the human vulnerability to climate change. Due to climate change, there isa rise in temperatures, changed precipitation patterns, more frequent droughts and athreat of the long-term water supply. At the same time, the degradation enforces sur-face run-off and fosters soil erosion, with negative consequences for soil fertility andwater quality through sedimentation and reduced ground-water formation. Besidessevere impacts on biodiversity, the loss of forests has also led to freeing a consider-able amount of CO2 and impair the forest’s function as a carbon sink. Climate changeimpacts like irregular and heavy rain falls, extreme droughts and heavy frosts as wellas proliferation of pests are challenging farmers and ecosystems. In particular thewild Arabica coffee is at risk (Davis et al. 2012). Though laws and regulations forthe protection and utilisation of forests and biodiversity exist in Ethiopia, insufficientcapacities of the responsible institutions prevent an effective implementation.

Community Action for Biodiversity and Forest Conservation … 87
Data Collection
In 2014, NABU decided for an evaluation of the 16 PFM sites by external experts inorder to (i) assess existing conditions of forest management; (ii) identify the effec-tiveness of the established PFM sites; (iii) see constraints, challenges and underlyingcauses for failures based on the forest management plan in each PFM sites; (iv) iden-tify measures for improved PFM implementation, management and awareness cre-ation. The evaluators used both primary data and secondary data collection: Guidedinterviews with 146 PFM committee members and reflection workshops with 350user community representatives in five Woredas served for data verification.
The authors are aware that the presented data is specific to the case of KafaBiosphere Reserve and may therefore have limitations. Nevertheless, the authors’intention is to support other areas in Ethiopia or beyond on their way to establishPFM and share lessons learned for practitioners.
Results and Discussion
For better understanding, the evaluated 16 PFM sites’ basic data are compiled inTable 1 (see underneath) showing the size of each PFM size and number of membersof each group. All of the 16 PFM sites were linked to coffee and honey coopera-tive unions based in the Zonal capital Bonga in order to create income from foresthoney and coffee being harvested in a sustainable manner. For forest developmentand improvement, the PFM sites were provided with 5.2 kg of tree seeds (e.g. Prunusafricana, Cordia africana, Hagenia abyssinica, Millettia ferruginea, Juniperus Pro-cera). In addition, the PFM communities collected locally available tree seeds andcultivated those. As a result, more than 100,000 native trees were planted by themembers following the forest development and conservation goals in the manage-ment plan (Fig. 5).
All PFM sites obtained support for a smooth working environment like nurserytools, office buildings, stationeries, office furniture and vouchers. For enhancingcapacities, the PFM committee members received regular trainings. All PFM groupsalso received livelihood related support: 114modern beehives, restocking of beehiveswith bees and other related equipment. To improve the honey production and thus thecommunities’ income, technical support and upgrading to a cooperative level wasprovided. The transformation of four PFM groups into cooperatives enabled themto professionalize the marketing of honey and wax through the honey head union.Two PFM sites were afterwards able to sell 10.2 t of honey and 121 kg of bees waxthrough the union and earned more than 750,000 Ethiopian Birr (~24.200 Euro).
The results of the assessment proved high involvement and participation of allrelevant actors for instance in the preparation of each management plan, bordernegotiation and setting of rights and responsibilities. All PFM members formallyacquired legal use rights recognition on the identified natural forests by the govern-

88 S. Bender and M. Tekle
Table 1 Basic data on the established PFM sites
PFM site Woreda Forest area(ha)
Date of handingover of PFM site
PFM members
Male Female Total
Kumiti Gimbo 386.42 11/2011 126 6 132
WohabinaGori
Gimbo 693.26 02/2013 314 313 627
Gacemo Gimbo 368.84 12/2012 260 256 516
Wodito Gimbo 1235.23 12/2012 384 316 700
BunaShuniyo
Decha 831.75 11/2011 174 10 184
Gora Decha 400.40 04/2012 133 26 159
BobaMeliyo
Decha 742.52 01/2012 306 79 385
EtaHachecha
Decha 837.75 05/2012 138 111 249
ShunoYerina
Gesha 448.90 11/2011 166 3 169
Dadati Gesha 247.00 11/2011 129 17 146
HawurinaKukir
Saylem 450.80 07/2012 156 171 327
HaloGanity
Saylem 1259.70 12/2012 113 129 242
Eno Adiyo 1138.90 06/2013 544 512 1056
Yecha Adiyo 919.00 06/2013 214 235 449
Mediwuta Adiyo 827.25 12/2013 420 437 857
Sharada Adiyo 934.00 12/2013 475 520 995
Total 11,721.72 11/2011 4,052 3,141 7193
Source Befikadu and Luwiza (2014)
ment. Nevertheless, the activity performance for instance on forest protection anddevelopment for instance replanting differed between the PFM sites. When it comesto economic benefits for the community members, the assessment revealed signifi-cant amounts of cash of 1,100,000 Ethiopian Birr (~35,500 Euro) from the sale ofNTFPs, penalties and compensation fees.
Conclusions and Recommendations for Practitioners
PFM is a forest management system that showed to be a complementary mecha-nism for safeguarding forests and biodiversity, while respecting traditional users.The value adding to the forest as well as the involvement and handing over of man-
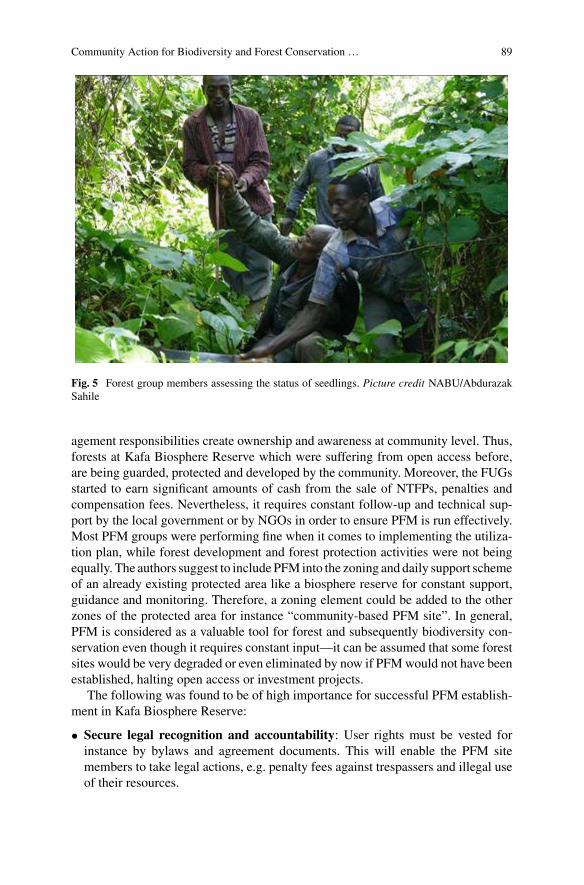
Community Action for Biodiversity and Forest Conservation … 89
Fig. 5 Forest group members assessing the status of seedlings. Picture credit NABU/AbdurazakSahile
agement responsibilities create ownership and awareness at community level. Thus,forests at Kafa Biosphere Reserve which were suffering from open access before,are being guarded, protected and developed by the community. Moreover, the FUGsstarted to earn significant amounts of cash from the sale of NTFPs, penalties andcompensation fees. Nevertheless, it requires constant follow-up and technical sup-port by the local government or by NGOs in order to ensure PFM is run effectively.Most PFM groups were performing fine when it comes to implementing the utiliza-tion plan, while forest development and forest protection activities were not beingequally. The authors suggest to include PFM into the zoning and daily support schemeof an already existing protected area like a biosphere reserve for constant support,guidance and monitoring. Therefore, a zoning element could be added to the otherzones of the protected area for instance “community-based PFM site”. In general,PFM is considered as a valuable tool for forest and subsequently biodiversity con-servation even though it requires constant input—it can be assumed that some forestsites would be very degraded or even eliminated by now if PFMwould not have beenestablished, halting open access or investment projects.
The following was found to be of high importance for successful PFM establish-ment in Kafa Biosphere Reserve:
• Secure legal recognition and accountability: User rights must be vested forinstance by bylaws and agreement documents. This will enable the PFM sitemembers to take legal actions, e.g. penalty fees against trespassers and illegal useof their resources.

90 S. Bender and M. Tekle
• Create a strong link and cooperation with local government institutions: Alack of support from governmental offices has been proven to be a hamperingfactor for an effectively working PFM group.
• Respect gender and social aspects: In the course of the PFM scheme both theManja minority and women were recognized equally with no restrictions, leadingto a better positioning at and integration into society.
• Assure traditional user rights:With the act of formally recognizing the traditionaluse rights of forest user groups, a sense of ownership developed in the communitiesfor protection and sustainable use of their forest resources.
• Increase the value of the forest for communities: By replanting and tendingseedlings in the forest, the communities were able to increase the forest cover andwith it the value of the forest. This may result in higher appreciation and awarenessof the value of natural ecosystems and their services.
• Introduce NTFP for alternative income generation: By offering the commu-nities NTFP like spices, coffee or traditional beekeeping systems, the forest usergroups show more commitment for conserving the forest while getting a higherincome.
• Create awareness withmembers and adjacent communities: In order to reach astrong sense of ownership and affiliation amongst the members, a constant aware-ness creation is needed. The contents of byelaws and management plans shouldbe accessible and transparent.
• Support a smooth working environment: In order to ensure a proper documen-tation and financial management, as well as the opportunity to hold meetings andbe visible in the community, it is recommended to establish basic offices for eachPFM group. Committee members should be regularly trained, but also evaluatedand, if needed, replaced.
• Ensure regular monitoring, documentation and reporting: The agreed man-agement plan and byelaws have to be monitored properly and transparently andactivities have to be documented. In addition, patrolling is easier to organize whentime schedules are being set and agreed and reporting and evaluation formats arebeing provided.
• Provide livelihood support: Accompanying the forest development, it provedadvisable to support the forest users with livelihood support like beekeeping, spiceproduction and other NTFP.
• Demarcate PFM boundaries: For visibility, understanding and ownership itproved valuable to clearly demarcate PFM zones in the field (e.g. paint markson trees, planting of border lines with non-native tree species).
NABU continued its work on PFM in the Kafa Biosphere Reserve after thedescribed first implementation phase and will continue doing so until 2019. It isplanned to further strengthen the almost 30 PFM sites established by NABU throughregular training, livelihood support and the development and legalisation of commonstandards for PFM sites. The latter will also help to easier measure the effectivenessof PFM groups in future (See Fig. 6).

Community Action for Biodiversity and Forest Conservation … 91
Fig. 6 Content FUG at Kafa Biosphere Reserve. Picture credit NABU/Svane Bender-Kaphengst
Acknowledgements NABU and the authors would like to acknowledge the donors which arethe International Climate Initiative (IKI) of the German Federal Ministry for the Environment,Nature Conservation, Building and Nuclear Safety (BMUB) and the Federal Ministry for EconomicCooperation andDevelopment (BMZ).Moreover, wewould like to thank our longstanding and closepartners, the Kafa Zone, Kafa Biosphere Reserve administration, the Kafa Forest Coffee Farmers’Cooperative Union and the Kafa Forest Bee Products Development and Marketing CooperativeUnion. For excellent completion of assignment our thanks goes toABELDevelopment&ProtectionConsultingPLCaswell as the consultants LuwizaW/Gebriel T/Michael andBefikaduMelesseTaye.Finally, we would like to pass our thanks to our always dedicated colleagues at NABU’s ProjectOffice Bonga, in particular AsayeAlemayehu, andNABUHeadquarters Berlin for constant support.
References
Befikadu MT, Luwiza WM (2014) Evaluation of Existing Participatory Forest Management (PFM)Sites Established by NABUWithin Kafa Biosphere Reserve, SNNPR. Final Report Submitted toNABU Bonga Office (unpublished), Ethiopia
BIDNTF (Biodiversity Indicators Development National Task Force) (2010) Ethiopia: Overviewof Selected Biodiversity Indicators. Addis Ababa, Ethiopia
Chernet T (2008) Land Resources and socio-economic report of Bonga, Boginda, Mankira and thesurrounding areas in Kaffa zone, SNNPRS. Report to PPP project on the establishment of a CoffeBiosphere Reserve in Bonga Region. Addis Ababa, Ethiopia
Davis AP, Gole TW, Baena S, Moat J (2012) The Impact of Climate Change on Indigenous Ara-bica Coffee (Coffea arabica): Predicting Future Trends and Identifying Priorities. PLoS ONE7(11):e47981
92 S. Bender and M. Tekle
Dennis Moss Partnership (2009) Application for Nomination of Kafa Biosphere Reserve. SouthAfrica (unpublished), Stellenbosch
De Vries B, Herold M (2014) NABU Forest and Climate Monitoring. Final report to the NABUproject “Climate Protection and Preservation of Primnary Forests—AManagement Model usingthe Wild Coffee Forests as an Example”. Wageningen University and Research Centre (WUR),The Netherlands
Dresen E (2011) Forest and Community Analysis. Final report. On behalf of NABU’s project.Climate Protection and Preservation of Primary Forests—A Management Model using the WildCoffee Forests in Ethiopia as an Example” (unpublished)
EFAP (Ethiopian Forest Action Program) (1994) Ethiopian Forest Action Program, vol I, II, III andIV. Final Report, MoNRDEP, EFAP Secretariat, Addis Ababa
FAO (2016) Forty years of community-based forestry. A review of its extent and effectiveness. FAOForestry Paper 176, Rome
FARM-Africa, SOS Sahel Ethiopia (2007) The Key Steps in Establishing Participatory ForestManagement. A field manual to guide practitioners in Ethiopia, Addis Ababa, Ethiopia
Gobeze T, Bekele M, Lemenih M, Kassa H (2009) Participatory forest management and its impactson livelihoods and forest status: the case of Bonga forest in Ethiopia. International ForestryReview 11(3):346–358
Hein LG, Gatzweiler F (2006) The economic value of coffee (Coffea arabica) genetic resources.Ecol Econ 60(1):176–185
McKee J (2007) Ethiopia Country Environmental Profile. Report for the European CommissionDelegation, Addis Ababa, Ethiopia
Ministry of Agriculture, Natural Resource Sector (2012) Scaling-up Participatory Forest Manage-ment Project
NABU (2017) NABU’s Biodiversity Assessment at the Kafa Biosphere Reserve. NABU, BerlinSNNPR (Southern Nations Nationalities and Peoples’ Regional State) (2013) Kafa Zone Financeand Economic department 2005 e.c. (2012) zonal statistical abstract

Impact of Climate Change on Sawfly(Suborder: Symphyta) Polinatorsin Andalusia Region, Spain
Jelena Barbir, Luis Oscar Aguado Martín and Xavier Rodriguez Lloveras
Abstract Sawflies (Symphyta) are insects widely distributed throughout the world,butmostly abundant and diverse in the temperate regions of theNorthern hemisphere.In Spain, they are linked to vegetation typical for aquatic environments (e.g. pondsand streams).Whilemany sawfly species are serious pests of horticulture and forestry,all sawflies found in the Andalusia Region are important pollinators. In order toevaluate if climate change affects sawflies in Spain, their present appearance anddistribution sampled form 2013 to 2016 was compared with the data collected from1920s to 1971. The results showed that biological cycle of some Symphyta specieswas advanced 20–30 days when compared with the dates of their usual presencein 1950–70s. While some species have been frequently found in the same areas as50 years ago, changes in climate affected vertical displacements to higher altitudesof other studied sawfly species. The most important findings of this study showedthat in the 21st century four species (Megalodontes bucephalus,Macrophyamilitaris,Strongylogaster multifasciata, Dolerus (Poodolerus) puncticollis) were not observedin any location nor sampling area, meaning that these species (important specializedpollinators) disappeared from the Andalusia region.
J. Barbir (B)International Climate Change Information Programme (ICCIP), Research and Transfer Centre,“Sustainability and Climate Change Management” (FTZ-NK), Ulmenliet 20, 21033 Hamburg,Germanye-mail: [email protected]
L. O. Aguado MartínFreelance Entomologist—Andrena Iniciativas y Estudios medioambientales S. L., Valladolid,Spaine-mail: [email protected]
X. Rodriguez LloverasGeological Hazards Prevention Unit, Institut Cartogràfic i Geològic de Catalunya, Parc deMontjuïc, 08038 Barcelona, Spaine-mail: [email protected]
© Springer Nature Switzerland AG 2019W. Leal Filho et al. (eds.), Handbook of Climate Change and Biodiversity,Climate Change Management, https://doi.org/10.1007/978-3-319-98681-4_6
93
94 J. Barbir et al.
Introduction
Sawflies (Symphyta) are insects widely distributed throughout the world, but mostlyabundant and diverse in the temperate regions of the Northern hemisphere wheresome species are characterized as important pests [e.g.Neodiprion sertifer (Geoffroy1975) known as the European pine sawfly]. In Spain, sawflies are linked to vegetationtypical for aquatic environments (e.g. ponds and streams) and many species are alsoserious pests of horticulture and forestry where each species of sawfly feeds on aspecific host. On the other hand, many sawfly species are important pollinators ofwild flowers in Southern Spain.
Sawflies (Symphyta) are wasps with a series of very primitive characteristics.They have not developed the agile articulation of the abdomen that characterizesthe majority of Hymenoptera, nor are they specialized, such as the Apocrita (therest of the bees and wasps), which have a drill or a stinger obtained throughoutthe evolution of the group. In addition they are not organized socially either, andtheir larvae conserve in their majority the phytophagous alimentary habits that areconsidered characteristic of the first members of the Hymenoptera order. The firstSymphyta date from the Triassic, about 220 million years ago. The superfamily ofthe Tenthredinoidea, it seems that it had its origin later, in the Jurassic period of theSecondary Era, something more than 120 million years ago. This data indicates thatthey are still about 10 million years older than the butterflies (Viitasaari 2002).
In many sawfly species, virgin females produce sex pheromones to attract males.In these cases the copulation between the two sexes takes place. However, there aremany species in which males are very rare such as Tenthredo (Cephaledo) Merid-iana (Serville 1823), Macrophya (Macrophya) militaris (Klug 1817) and others,and even in some species the male is unknown. In these species the females areparthenogenetic and the eggs are fertile without having previously copulated. Virtu-ally all generations are parthenogenetic, and usually only females emerge. However,occasionally a functional male may appear, possibly as an adaptive response to envi-ronmental changes (Burke 1962), given that sexual reproduction ensures a greatergenetic variety, favouring the appearance of individuals that adapt to the new con-ditions. Parthenogenesis can be adequate when a species is perfectly adapted in animmutable biotope. Considering this primitive biology of sawflies, they can be easilyaffected with climate change or other changes in environmental conditions (AguadoMartin 2007).
Climate change affects biological cycles, habitats and migrations of many dif-ferent species (Hegland et al. 2009; Scaven and Rafferty 2013). Species may faceextinction if habitat sizes shrink (for example, at the pole or at mountain points), or ifimmigration barriers or limited dispersal ability prevent them from reaching newlysuitable habitat (Lambers 2015). Since in Spain sawflies are linked mainly to veg-etation typical for aquatic environments, they are vulnerable to changes in climate(especially humidity).

Impact of Climate Change on Sawfly (Suborder: Symphyta) … 95
Unfortunately, research trends are mainly related to the species that directly affectagricultural production or other economic interests, while species that do not directlytreat or benefit humans are slightly disregarded. For example, direct effects of climatechange on the most important crop pollinators have received much attention lately,due to their crucial function in crop production (Scaven and Rafferty 2013; Barbiret al. 2014). Regarding sawflies, mainly important pests were studied in depth e.g.wheat stem sawfly (Perez-Mendoza and Weaver 2006), apple sawfly (Graf et al.2001), pine sawfly (Sholes 2011), etc. In all these studies, changes in temperaturesaffected biological cycle of sawflies, forcing them to vertically migrate, adapt topresent conditions or in worst cases to face extinction. In this study, all sawfly speciespresent in the study area were monitored and field data was compared with climaticdata. The main objective of the study is to evaluate if changes in climate affectdistribution and presence of sawflies in Andalusia region.
Methodology
Identification of Sawfly Species in the Andalusia Region
The study presents some interesting findings collected in the 20th century and com-pares it with recent data collected in the same locations. The research started with thecompilation of data series regarding the presence of different sawflies in Andalusiaregion collected by the Institute of Acclimatization of Almeria in the period from1920s to 1980s (20th century). Subsequently, in the period between 2011 and 2015(21st century) several samples were taken in the same locations and periods as in20th century. This data was collected in order to compare present distribution of thesawfly species with their distribution detected in the 20th century.
In each of the sampling locations regular transects were carried out, during the dif-ferent seasons, sweeping with the entomological sleeve different types of vegetationand substrates present in each of the previously selected habitats.
Allmaterial captured in the fieldwas labelled including relevant information: date,location, UTM, altitude, type of vegetation, temperature, humidity and observations.Subsequently, captured sawflies were identified in the laboratory. In the specific caseof some species, larvae and their captive breeding were captured until adults emerge,in order to be able to obtain more details about their biological cycle.

96 J. Barbir et al.
Study Area
Andalusia sits at latitude between 36° and 38° 44′ N, in the warm-temperate region.In general, it experiences a hot-summer Mediterranean climate, with dry summers.Study was conducted in 13 locations distributed along the Southern and Eastern partof the Andalusia region (Table 1). Three locations were located in Almeria province,four in Malaga province and six in Granada province. The locations were chosen inthe first period when samplings were conducted (in 20th century) where the maincriteria for choosing specific location was presence or absence of sawflies in thatarea.
As shown in the table above (Table 1), the sampling sites were located in differentattitudes (from 524 to 2500 m) what provided the necessary insight in two mostimportant climatic parameters—temperature and humidity. In order to better visu-alize locations of sampling spots, locations where grouped in three areas: Malaga(1), Sierra Nevada (2) and Alto Guadiana (3) (Fig. 1). Each area is characterizedby different microclimate due to differences in altitude, temperature and humidity(Figs. 1, 2, 3, 4 and 5).
Table 1 Sampling locations
Locations Municipality Province Altitud (m)
Albergue Universitario, SierraNevada
Pradollano Granada 2500
Veleta, Río Dilar, Sierra Nevada Pradollano Granada 2500
Horcajo Trevelez - SierraNevada
Trévelez Granada 2176
Puerto de la Ragua SierraNevada
Bayárcal Almería 2041
Refugio Postero Alto, Barrancode Alhorí
Jeréz delMarquesado
Granada 1900
Barranco de Molina, SierraMaría
María Almería 1649
La Sagra, Fuente Tornajo Huéscar Granada 1558
Sierra Alcojona Ronda Málaga 1498
Puerto del Lobo, Sierra Nevada Víznar Granada 1386
Alpujarras Juviles Granada 1255
Puerto del Saucillo, Sierra delas Nieves
Yunquera Málaga 1200
Alpujarras Laujar de Andarax Almería 804
Nacimiento de Moyano, Sierrade Ronda
Gaucín Málaga 612
Benaoján-Montejaque,Grazalema
Benaoján Málaga 524

Impact of Climate Change on Sawfly (Suborder: Symphyta) … 97
Fig. 1 Locations and altitudes of sampling sites: (1) Malaga; (2) Sierra Nevada; (3) Alto Guadiana
In Malaga (Fig. 1—1) the lowest altitude is 524 m.a.s.l., located at Benaoján-Montejaque, Grazalema. The highest altitude in Malaga (Fig. 1—1) is 1200 m.a.s.l.at Puerto del Saucillo, Sierra de las Nieves. In accordance with the land cover datafromCORINE (Bossard et al. 2000), the vegetation on the lower altitude area is densescrubland with oak trees. In high areas vegetation is dense coniferous forest andscrubland. In addition, there are many streams in this area (Zarzalones, Quejigales,and Moyano) along with the River Verde, which allows the existence of pastureswith different plant species (fam. Ranunculáceae, Pinsapo masses, junipers, oaks,melojos, cork oaks, hawthorns, gorse, rosemary, lavender and rockrose).
In Sierra Nevada (Fig. 1—2) the lowest altitude is at Juviles, Alpujarras, with1255 m.a.s.l.. The highest altitude is at Albergue Universitario and Veleta, Río Dilar,in Sierra Nevada, with 2500 m.a.s.l. In accordance with the CORINE Land Coverdata, the vegetation on the lower altitude area is scrubland with patches of coniferousforest. In high areas vegetation is scarce, mainly pasture and scrubland.
In Alto Guadiana (Fig. 1—3), only two sampling sites are present at similaraltitudes (1498 and 1558 m.a.s.l.). CORINE Land Cover data indicates scrublandand coniferous forest and dry-land crops.

98 J. Barbir et al.
Data Collection and Analysis
Locations where sampled in the 20th century (from year 1926 to 1983) and again inthe 21st century (from year 2011 to 2015). Scientific approach was based on the dataavailable from the Acclimatization Institute of Almeria, collected in the 20th century.These data have been compared with the data collected in the 21st century, defining aset of general displacement trends between the two intervals. In each location wherethe species suffered changes the trends have been identified.
The altitude has been considered as a classification factor, since it is closelyrelated with important changes in humidity and temperature even under small spatialdistances. These changes in climatic variables can provoke migration of the speciesto different areas. For this reason, the altitudinal analysis has been complementedwith the climatic data of the Andalusia region obtained from the EnvironmentalInformation Network of Andalusia (REDIAM 2017). The data used is: (a) Annualaverage temperature during themost recent reference period considered by the IPCC,1971–2000 (Hoerling et al. 2011; Kirtman et al. 2013), and the last five years ofavailable information (2010–2015); and (b) Annual average of Humidity Index (HI)calculated as precipitation (P) divided by the potential evapo-transpiration (ETP),during the intervals 1971–2000 and 2010–2015.
The comparison between these two factors and the sampling sites allows dis-cussing the migration trends of each species at local and regional scales.
Results
Sawfly Species Identified in the Study Area
Field samplings in the Andalusia Region were preformed between 1926 and 1983and allowed identification of 22 species of sawflies (Table 2). The most abundantfamily is Tenthredinidae with 17 different species, while two species from Argidaeand Cimbicidae families were detected, and one species Megalodontes bucephalus(Klug 1824) from Megalodontesidae family was located in the study area (Table 2).
The most abundant species in the study area were polyphagous sawflies fromSuperfamily Tenthredinoidea (both adults and their larvae). Even within the Super-family Tenthredinoidea some specialized species in the sub-family Selandriinaewerefound. This is one of the most primitive sub-families, composed of numerous speciesbelonging mainly to the genus Dolerus. These primitive sawflies species are alwayslinked to only one genus of primitive plants (genusCarex,Equisetáceas (genusEqui-setum) and Juncaceas (Juncus)). These plants normally grow in meadows, peat bogsand swampy environments and for that reason the sawflies feeding and pollinatingthem occupied the same habitat.
In 21st century, each location was studied again and the same species as in20th century were searched, as well as connection between distribution of sawflies

Impact of Climate Change on Sawfly (Suborder: Symphyta) … 99
Table2
Speciesidentifi
edin
thestud
yarea
Order
Family
Sub-family
Genus
Specie
Author
Sub-specie
Hym
enoptera
Argidae
Arginae
Arge
melanochroa
Gmelin
(1790)
Hym
enoptera
Argidae
Arginae
Arge
ochropus
Gmelin
(1790)
Hym
enoptera
Cim
bicidae
Abiinae
Abia
sericea
Linnaeus(1767)
Hym
enoptera
Cim
bicidae
Coryninae
Corynis
dusm
eti
Konow
(1905)
Hym
enoptera
Megalodontesidae
Megalodonteninae
Megalodontes
bucephalus
Klug(1824)
Hym
enoptera
Tenthredinidae
Seland
riinae
Dolerus
(Achaetoprion)
uliginosus
(Lacou
rt,1999)
Hym
enoptera
Tenthredinidae
Seland
riinae
Dolerus
(Dolerus)
germ
anicus
(Lacou
rt,1999)
Hym
enoptera
Tenthredinidae
Seland
riinae
Dolerus
(Cyperolerus)
anticus
(Lacou
rt,1999)
Hym
enoptera
Tenthredinidae
Seland
riinae
Dolerus
(Poodolerus)
puncticollis
(Lacou
rt,1999)
Hym
enoptera
Tenthredinidae
Seland
riinae
Strong
ylogaster
(Stron
gyloga
ster)
multifasciata
(Lacou
rt,1999)
Hym
enoptera
Tenthredinidae
Tenthredininae
Macrophya
(Macrophya)
annulata
(Lacou
rt,1999)
Hym
enoptera
Tenthredinidae
Tenthredininae
Macrophya
(Macrophya)
militaris
(Lacou
rt,1999)
(contin
ued)

100 J. Barbir et al.
Table2
(contin
ued)
Order
Family
Sub-family
Genus
Specie
Author
Sub-specie
Hym
enoptera
Tenthredinidae
Tenthredininae
Macrophya
(Macrophya)
montana
(Lacou
rt,1999)
montana
Hym
enoptera
Tenthredinidae
Tenthredininae
Rhogogaster
(Cytisogaster)
picta
(Lacou
rt,1999)
Hym
enoptera
Tenthredinidae
Tenthredininae
Rhogogaster
(Rhogogaster)
chlorosoma
(Lacou
rt,1999)
Hym
enoptera
Tenthredinidae
Tenthredininae
Tenthredo
(Cephaledo)
meridiana
(Lacou
rt,1999)
Hym
enoptera
Tenthredinidae
Tenthredininae
Tenthredo(Elinora)
baetica
(Lacou
rt,1999)
Hym
enoptera
Tenthredinidae
Tenthredininae
Tenthredo
(Eurogaster)
mesom
elas
(Linnaeus,1758)
Hym
enoptera
Tenthredinidae
Tenthredininae
Tenthredo
(Eurogaster)
mioceras
(Lacou
rt,1999)
Hym
enoptera
Tenthredinidae
Tenthredininae
Tenthredo
(Tenthredo)
violettae
(Lacou
rt,1973)
Hym
enoptera
Tenthredinidae
Tenthredininae
Tenthredo
(Tenthredopsis)
scutellaris
(Fabricius,1
804)
puncticollis
Hym
enoptera
Tenthredinidae
Tenthredininae
Tenthredo
(Tenthredopsis)
coqu
ebertii
(Lacou
rt,1999)

Impact of Climate Change on Sawfly (Suborder: Symphyta) … 101
and climate change. Besides the effect of climate change on vertical displacementof sawflies, the results showed that biological cycle of some sawfly species wasadvanced 20–30 days when compared with the dates of their usual presence in1950–70s.
Climate Change in the Andalusia Region
Processing climatic data from the Andalusia region, it has been found that averagetemperature and humidity changed in 21st century in comparison to data processedin 20th century.
Changes in Temperature
Analised temperature data showed that averege temperatures in the inteval from 2010to 2015 increased in comparison with the average tempereatures in the referenceperiod between 1971–2000 (Figs. 2 and 3).
Fig. 2 Average temperatures in the period from 1971 to 2000: (1) Malaga; (2) Sierra Nevada; (3)Alto Guadiana
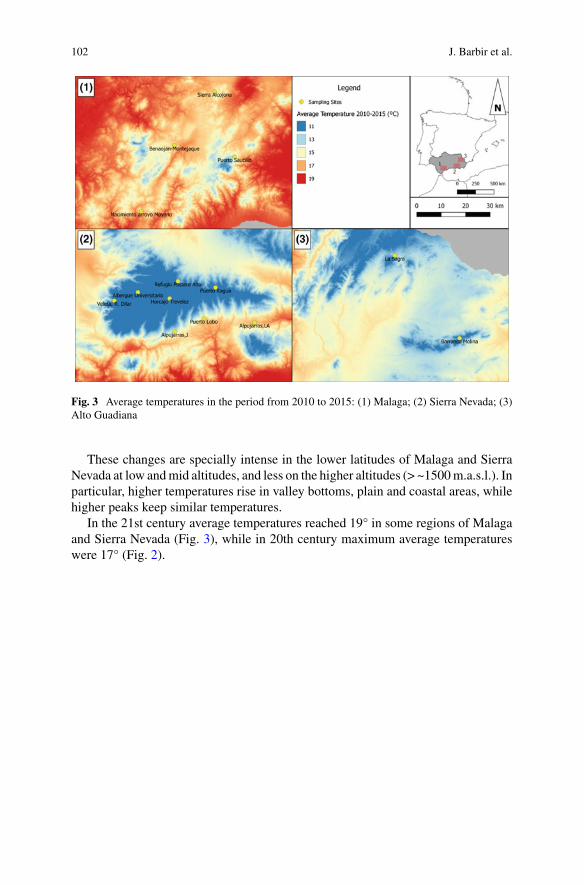
102 J. Barbir et al.
Fig. 3 Average temperatures in the period from 2010 to 2015: (1) Malaga; (2) Sierra Nevada; (3)Alto Guadiana
These changes are specially intense in the lower latitudes of Malaga and SierraNevada at low andmid altitudes, and less on the higher altitudes (> ~1500m.a.s.l.). Inparticular, higher temperatures rise in valley bottoms, plain and coastal areas, whilehigher peaks keep similar temperatures.
In the 21st century average temperatures reached 19° in some regions of Malagaand Sierra Nevada (Fig. 3), while in 20th century maximum average temperatureswere 17° (Fig. 2).
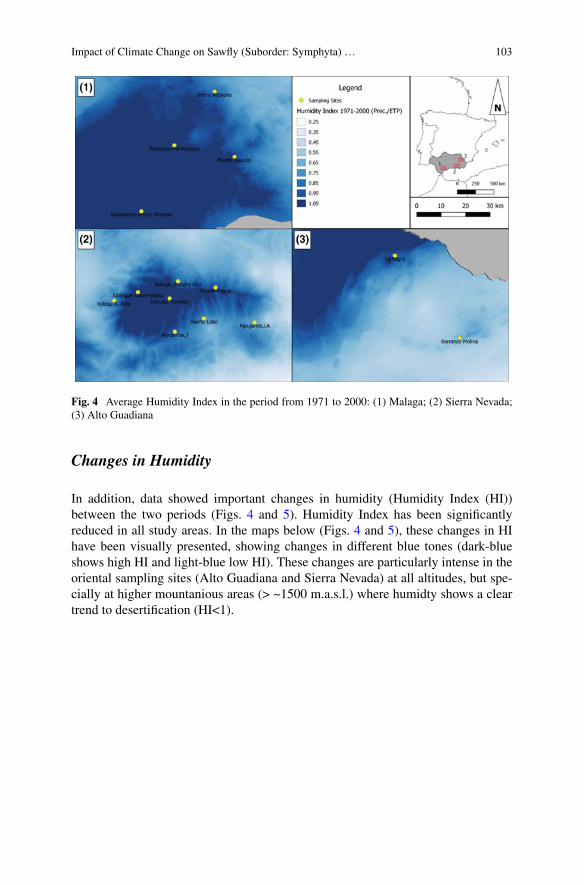
Impact of Climate Change on Sawfly (Suborder: Symphyta) … 103
Fig. 4 Average Humidity Index in the period from 1971 to 2000: (1) Malaga; (2) Sierra Nevada;(3) Alto Guadiana
Changes in Humidity
In addition, data showed important changes in humidity (Humidity Index (HI))between the two periods (Figs. 4 and 5). Humidity Index has been significantlyreduced in all study areas. In the maps below (Figs. 4 and 5), these changes in HIhave been visually presented, showing changes in different blue tones (dark-blueshows high HI and light-blue low HI). These changes are particularly intense in theoriental sampling sites (Alto Guadiana and Sierra Nevada) at all altitudes, but spe-cially at higher mountanious areas (> ~1500 m.a.s.l.) where humidty shows a cleartrend to desertification (HI<1).
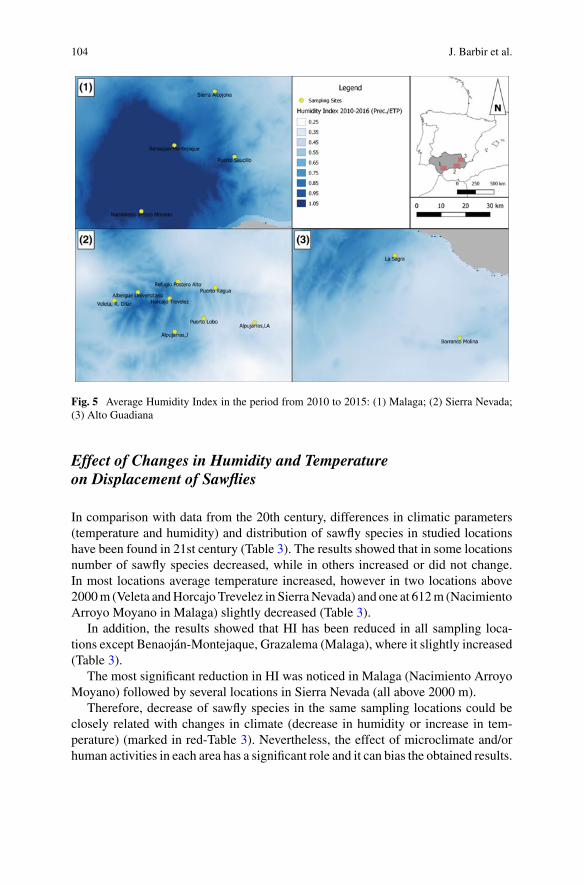
104 J. Barbir et al.
Fig. 5 Average Humidity Index in the period from 2010 to 2015: (1) Malaga; (2) Sierra Nevada;(3) Alto Guadiana
Effect of Changes in Humidity and Temperatureon Displacement of Sawflies
In comparison with data from the 20th century, differences in climatic parameters(temperature and humidity) and distribution of sawfly species in studied locationshave been found in 21st century (Table 3). The results showed that in some locationsnumber of sawfly species decreased, while in others increased or did not change.In most locations average temperature increased, however in two locations above2000m (Veleta andHorcajo Trevelez in SierraNevada) and one at 612m (NacimientoArroyo Moyano in Malaga) slightly decreased (Table 3).
In addition, the results showed that HI has been reduced in all sampling loca-tions except Benaoján-Montejaque, Grazalema (Malaga), where it slightly increased(Table 3).
The most significant reduction in HI was noticed in Malaga (Nacimiento ArroyoMoyano) followed by several locations in Sierra Nevada (all above 2000 m).
Therefore, decrease of sawfly species in the same sampling locations could beclosely related with changes in climate (decrease in humidity or increase in tem-perature) (marked in red-Table 3). Nevertheless, the effect of microclimate and/orhuman activities in each area has a significant role and it can bias the obtained results.
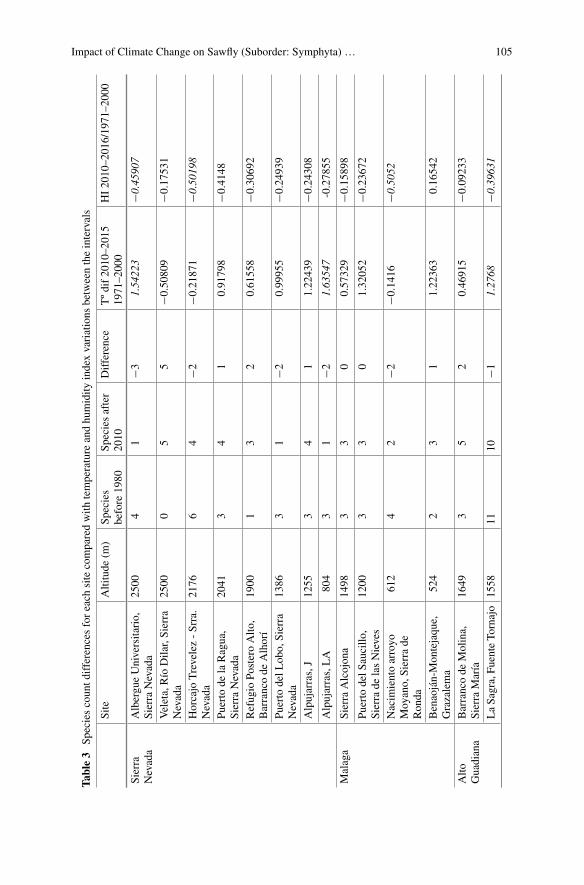
Impact of Climate Change on Sawfly (Suborder: Symphyta) … 105
Table3
Speciescoun
tdifferences
foreach
sitecomparedwith
temperature
andhu
midity
indexvariations
betw
eentheintervals
Site
Altitude
(m)
Species
before
1980
Speciesafter
2010
Difference
Tºdif2010–2015
1971–2000
HI2010–2016/1971–2000
Sierra
Nevada
AlbergueUniversitario,
Sierra
Nevada
2500
41
−31.54223
−0.45907
Veleta,Río
Dila
r,Sierra
Nevada
2500
05
5−0
.50809
−0.17531
Horcajo
Trevelez-Srra.
Nevada
2176
64
−2−0
.21871
−0.50198
Puerto
delaRagua,
Sierra
Nevada
2041
34
10.91798
−0.4148
Refug
ioPo
steroAlto
,Barrancode
Alhorí
1900
13
20.61558
−0.30692
Puerto
delL
obo,
Sierra
Nevada
1386
31
−20.99955
−0.24939
Alpujarras,J
1255
34
11.22439
−0.24308
Alpujarras,LA
804
31
−21.63547
-0.27855
Malaga
Sierra
Alcojona
1498
33
00.57329
−0.15898
Puerto
delS
aucillo
,Sierra
delasNieves
1200
33
01.32052
−0.23672
Nacim
ientoarroyo
Moyano,
Sierra
deRonda
612
42
−2−0
.1416
−0.5052
Benaoján-Montejaque,
Grazalema
524
23
11.22363
0.16542
Alto
Guadiana
Barrancode
Molina,
Sierra
María
1649
35
20.46915
−0.09233
LaSa
gra,Fu
enteTo
rnajo
1558
1110
−11.2768
−0.39631
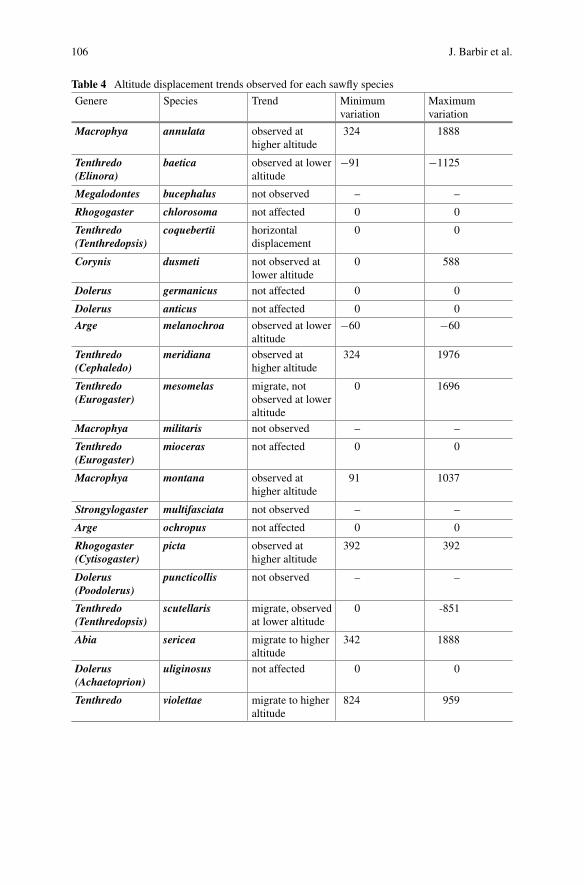
106 J. Barbir et al.
Table 4 Altitude displacement trends observed for each sawfly species
Genere Species Trend Minimumvariation
Maximumvariation
Macrophya annulata observed athigher altitude
324 1888
Tenthredo(Elinora)
baetica observed at loweraltitude
−91 −1125
Megalodontes bucephalus not observed – –
Rhogogaster chlorosoma not affected 0 0
Tenthredo(Tenthredopsis)
coquebertii horizontaldisplacement
0 0
Corynis dusmeti not observed atlower altitude
0 588
Dolerus germanicus not affected 0 0
Dolerus anticus not affected 0 0
Arge melanochroa observed at loweraltitude
−60 −60
Tenthredo(Cephaledo)
meridiana observed athigher altitude
324 1976
Tenthredo(Eurogaster)
mesomelas migrate, notobserved at loweraltitude
0 1696
Macrophya militaris not observed – –
Tenthredo(Eurogaster)
mioceras not affected 0 0
Macrophya montana observed athigher altitude
91 1037
Strongylogaster multifasciata not observed – –
Arge ochropus not affected 0 0
Rhogogaster(Cytisogaster)
picta observed athigher altitude
392 392
Dolerus(Poodolerus)
puncticollis not observed – –
Tenthredo(Tenthredopsis)
scutellaris migrate, observedat lower altitude
0 -851
Abia sericea migrate to higheraltitude
342 1888
Dolerus(Achaetoprion)
uliginosus not affected 0 0
Tenthredo violettae migrate to higheraltitude
824 959

Impact of Climate Change on Sawfly (Suborder: Symphyta) … 107
Table 5 Summary of species and trends based on vertical and horizontal displacement
Trend Number of species %
Vertical displacement(observed at higher/notobserved at lower altitude)
8 36
Vertical displacement(observed at lower altitude)
3 14
Horizontal displacement 1 5
Not affected 6 27
Not observed on 21st century(disappeared)
4 18
Total 22 100
For that reason, only vertical displacement (observed at higher/lower altitude) wasclosely related with climate change.
Vertical Displacement of Sawfly Species
Six species (Arge ochropus, Dolerus germanicus, Dolerus (Achaetoprion) uligi-nosus, Dolerus anticus, Rhogogaster chlorosoma, Tenthredo mioceras) were notaffected, and they maintained their habitats in the same locations as in the 20th cen-tury (Table 4). On the other side, the results of this study showed that six of the sawflyspecies migrated to higher and three to lower locations. Only one species (Tenthredocoquebertii) migrated to other locations but without changing the altitude (horizon-tal displacement), while two species (Corynis dusmeti and Tenthredo mesomelas)disappeared from lower altitude and were detected only at higher altitudes (Table 4).
The most important findings of this study showed that in transects conductedin the 21st century four species (Megalodontes bucephalus, Macrophya militaris,Strongylogaster multifasciata, Dolerus (Poodolerus) puncticollis) were not observedin any location nor sampling area (Table 4), meaning that these species are not presentanymore in the Andalusia region.
Data presented in Table 4 was summarized in Table 5, showing that 36% ofsawfly species migrated to higher locations, only 14% to lower locations, while 18%of the species disappeared from the study area. The results also showed that 27% ofthe species were not affected by altitude or climatic conditions (Table 5) and theymaintained present in the same locations as 50–80 years ago. In addition, only 5%(one species) displaced horizontally, probably caused by changes in habitat provokedby human activity.

108 J. Barbir et al.
Discussion
Changes in temperatures affect biological cycle of sawflies, forcing them to migrate,adapt to present conditions or in worst cases to face extinction. Changing climateaffects ecosystems since warming may force species to migrate to higher latitudeswhere temperatures are more favourable for their survival. In this study, of twenty-two sawfly species found in the 20th century only eighteen species were re-found inthe 21st century in the Andalusia region. Although all initial locations were trans-crossed again in 21st century, the data of this study showed that 4 sawfly speciesdisappeared from the study area.
In addition, the results showed important vertical and horizontal displacementsof sawflies to different locations. This was especially observed in sawfly specieswith narrow temperature optima, since they are highly affected with climate change(Sholes 2011). Similar findings have been proven for other insects, as for example,migration of pollinators was described by Scaven and Rafferty (2013) or adaptationof different herbivores to changes in climate in Gutbrodt et al. (2011). Regardingsawflies, only the most important sawfly pests were studied in depth e.g. wheatstem sawfly (Perez-Mendoza and Weaver 2006), apple sawfly (Graf et al. 2001),pine sawfly (Sholes 2011). However, this study was focused on all sawfly speciesdetected in the study area and the results of cross-transects showed that none of thespecies in that area is pest to horticultural or forest crops. In contrary, the sawfliesstudied are beneficial since they are natural pollinators of the plants where they growand feed, contributing inmaintenance of the botanical biodiversity of landscapes. Forthat reason, disappearance of sawfly species in the study area can provoke changesat many levels.
Most of the studied sawflies are insects adapted to warm environments with highdegree of humidity, usually coinciding with the emergence of adults with the flow-ering of a large number of weeds that will provide them with the necessary proteinsfor their feeding (pollen) as well as the essential sugars (nectar). For that reason,decrease in humidity might be the more important trigger for sawfly displacementthan elevated temperature in the 21st century.
Although vertical displacement (migration of species to higher or lower latitudes)is mainly related with changes in climate, horizontal displacement can frequently beprovoked by human activities, changes in habitat or landscape etc. Man alters thelandscapes by reducing some of the meadows to expand crops or forest plantations(mainly pine trees), or to extend ski slopes at the Sierra Nevada (Aguado Martin2016). All this has reduced and fragmented some habitats and affected the survivalof some species in a very negative way, especially for some sawfly species (e.g.Corynis, Dolerus and Megalodonts) which have low rate of mobility (they are ableto move only between 40 and 100 meters from the place they were born) (AguadoMartin 2016).
Among the species studied, the most sensitive ones, both for their nutritionalspecialization and for their habitats, areMegalodontes bucephalus and Corynis dus-meti, both related to plants of the genus Ranunculus, in which their larvae feed and

Impact of Climate Change on Sawfly (Suborder: Symphyta) … 109
adults feed and mate. These plants begin to be scarce in some areas, so these speciesmust so follow water streams to avoid dehydration and survive, or they must fly towooded areas (pine forests, pins pares, underbrush) where these flowers keep grow-ing (Aguado Martin 2016). One of the species that disappeared, Strongylogastermultifasciata is linked in the areas studied to the presence of ferns, but these plantshave drastically reduced their habitat. In addition, the maximum temperatures startto be almost insurmountable for the development of their larvae.
Disappearance of Dolerus puncticollis cannot be found in its nutritional plants(grasses), since these survive in the study area, but rather in the temperature thresholdstoo high, since it is a very sensitive to high temperatures and they also need a highhumidity for survival.
Finally, Macrophya milittaris (species usually lives only in cool and shady areasand close to riverbank forests or water courses) was not found in 21st century, sincechanges in climate affected vegetation drastically. Its disappearance since 1952 isquite striking and it has been telling us how climate change in the south of theIberian Peninsula has been occurring for many decades in a slow and progressive butunstoppable way. This study showed that climatic change caused disappearance andmigration of some sawfly species, while others were negatively affected with humanactivity. The main limitation of this study is low number of repetitive observation inthe second observation period. For that reason, it is highly recommended to conductsimilar studies in the future, in order to obtain complete image of what is causing thedisplacements of sawfly populations in the Andalusia Region and to find the mostsustainable way how to mitigate it.
Conclusions
Evaluating the most important climatic parameters, humidity and temperature, havebeen observed that climate changed in the last 100 years in the study area (Andalusiaregion, Spain). In many locations of this study, average temperature increased andhumidity index decreased. These changes can affect survival of many species in theirnatural habitat. The study showed that in some locations number of sawfly speciesdecreased while in others increased or did not change. In addition, some of the sawflyspecies migrated to higher or lower locations, while others migrated to other loca-tions but without changing the altitude. The study showed that in the 21st centuryfour species (Megalodontes bucephalus, Macrophya militaris, Strongylogaster mul-tifasciata, Dolerus (Poodolerus) puncticollis) were not observed in any location norsampling area, meaning that these species are not anymore present in the Andalusiaregion. In conclusion, changes in climate affected vertical displacements of differentsawfly species as well as disappearance of four sawfly species in Andalusia region.
110 J. Barbir et al.
References
AguadoMartin OL (2007) Las mariposas diurnas de Castilla y León-II (Lepidópteros Ropalóceros)Especies, biología, distribución y conservación. Junta de Castilla y León. Consejería de MedioAmbiente, Fundación Patrimonio Natural, pp 907–911
Aguado Martin OL (2016) Personal observation AndalusiaBarbir J, Dorado J, Fernandez-Quintanilla C, Blanusa T, Maksimovic C, Badenes-Perez FR (2014)Wild rocket—effect of water deficit on growth, flowering, and attractiveness to pollinators. ActaAgric. Scand Sect B-Soil Plant Sci 64:482–492
Bossard M, Feranec J, Otahel J (2000) CORINE land cover technical guide. Addendum, USABurke HR (1962) Studies on the Genus Anthonomus in North and Central America (Coleoptera:Curculionidae) I. Some New and Little Known Species from Mexico. Southwestern Naturalist7:202–210
Fabricius JC (1804) Systema piezatorum secundum ordines, genera, species adjectis synonymis,locis, observationibus, descriptionibus. pp. I–XVI [= 1–16], 1–439, [1], index 1–32. Brunsvigae.(Reichard)
Gmelin JF (1790) Caroli a Linné, systema naturae. Tom. I. Pars IV. pp. 1517–2224. LipsiaeGraf B, Höpli HU, Höhn H (2001) The apple sawfly, Hoplocampa testudinea: Temperature effectson adult life-span and reproduction. Entomol Exp Appl 98:377–380
Gutbrodt B, Mody K, Dorn S (2011) Drought changes plant chemistry and causes contrastingresponses in lepidopteran herbivores. Oikos 120:1732–1740
Hegland ST, Nielsen A, Lázaro A, Bjerknes AL, Totland, Ø (2009) How does climate warmingaffect plant pollinator interactions? Ecol Lett 12:184–195
Hoerling M, Hurrell J, Kumar A, Terray L, Eischeid J, Pegion P, Zhang T, Quan X, Xu T (2011)On North American Decadal Climate for 2011–20. J Climate 24:4519–4528
KirtmanB, Power S, Adedoyin A, Boer G, Bojariu R, Camilloni I, Doblas-Reyes F, Fiore A, KimotoM,Meehl G (2013) Near-term climate change: projections and predictability, In: Climate Change2013: The Physical Science Basis. Contribution of Working Group I to the Fifth AssessmentReport of the Intergovernmental Panel onClimateChange. In: press,C.U. (Ed.). ICPP,Cambridge,UK and New York, USA
Klug (1817) Macrophya militaris (Klug, 1817) Klug, 1817 in GBIF Secretariat (2017). GBIFBackbone Taxonomy Checklist Dataset https://doi.org/10.15468/39omei
Klug F (1824) Entomologische Monographien. Mit 10 illuminirten Kupfertafeln. pp. I–XIV [=1–14], 1–242. Berlin
Konow S (1905) Raja-çekhara’s Karpura-mañjarı: a drama, Vol 4 Motilal Banarsidass.Lacourt J (1973) Note sur quelques Hymenóptès tenthrédoïdes capturés dans la Sierra-Nevada(Espagne), avec description dúne nouvelle espèce du genre Tenthredo L. violettae. Bulletin de laSociété entomologique de France. 78:289–293
Lacourt J (1999) Répertoire des Tenthredinidae ouest-paleartiques (Hymenoptera, Symphyta).Société Entomologique de France. París. p 432
Lambers M (2015) Retraction statement: ‘Species distributions shift downward across westernNorth America’. Global Change Biol 21:1376–1376
Linnaeus C (1758) Tomus I. Syst. nat., ed. 10. Holmiae, Laurentii Salvii: [1–4], 1–824Linnaeus C (1767) Systema naturae, Tom. I. Pars II. Editio duodecima, reformata. Holmiae. (Lau-rentii Salvii): 533–1327
Perez-Mendoza J, Weaver DK (2006) Temperature and Relative Humidity Effects on Postdia-pause Larval Development and Adult Emergence in Three Populations of Wheat Stem Sawfly(Hymenoptera: Cephidae). Environ Entomol 35:1222–1231
REDIAM (2017) The Environmental information network of Andalusia In: Andalucia JE (ed).Andalusia
Scaven VL, Rafferty NE (2013) Physiological effects of climate warming on flowering plants andinsect pollinators and potential consequences for their interactions. Curr Zool 59:418–426

Impact of Climate Change on Sawfly (Suborder: Symphyta) … 111
Sholes ODV (2011) Consequences of Narrow Temperature Tolerance for a Pinyon Pine Sawfly,Neodiprion edulicolus. Environ Entomol 40:777–781
Viitasaari M (2002) Sawflies I. (Hymenoptera, Symphyta) A review of the suborder, the WesternPaleartic taxa of Xyeloidea and Pamphilioidea. Tremex Press Ltd., Helsinki, p 516

Coffee, Climate and Biodiversity:Understanding the Carbon Stocksof the Shade Coffee Production Systemof India
Nadesa Panicker Anil Kumar, Amsad Ibrahim Khan Saleem Khanand Vaniyan Balakrishnan
Abstract In the light of climate change, the ecosystem services of traditionallymaintained shaded Arabica coffee farms become prominent largely for increasingcarbon removal. Themost important functionof the shade-growncoffeeagroforestrysystem is the reduction of the concentration of Carbon in the atmosphere. It is esti-mated that one-hectare shade-grown coffee farm with large forest trees can sequester70–80 tonnes of carbon per hectare, which is more or less equivalent to the carbonstored in an equal area of forest. A full sun–grown or open coffee in one hectare canonly store less than 10 tonnes of carbon. “Monsooned Malabar Arabica Coffee is aspecialty coffee of India, sourced from shade coffee plantation and has geographicalindication (GI) protection. Shade grown coffee also serves as a refuge for biodiver-sity and its diverse and complex structure has a high potential to retain biodiversityin the changing climate scenarios. In this context, this paper discusses the nexus ofcoffee, climate and biodiversity and its implications with Wayanad, Kerala, India asa case study. This paper emphasizes the need for promoting sustainable productionand consumption of coffee as a carbon neutral brand and promotion of shade grown,biodiversity rich and climate resilient coffee can emerge as a highly valued com-
N. P. Anil Kumar (B) · A. I. K. Saleem KhanM. S. Swaminathan Research Foundation, 3rd Cross Street, Taramani Institutional Area,Chennai 600 113, Indiae-mail: [email protected]; [email protected]
A. I. K. Saleem Khane-mail: [email protected]; [email protected]
V. BalakrishnanM. S. Swaminathan Research Foundation, Puthurvayal P.O, Wayanad, Kalpetta,Kerala 673577, Indiae-mail: [email protected]
© Springer Nature Switzerland AG 2019W. Leal Filho et al. (eds.), Handbook of Climate Change and Biodiversity,Climate Change Management, https://doi.org/10.1007/978-3-319-98681-4_7
113

114 N. P. Anil Kumar et al.
modity in the world coffee market. Attempts at revival of the shade grown coffeesystem amongst the small growers with appropriate steps in marketing the coffeeas a specialty product (carbon neutral and grown in bio-diverse environment) arediscussed.
Introduction
The Paris agreement on climate change strengthens the global response to the threatof a changing climate by keeping a global temperature rise this century well below2 °C above pre-industrial levels and to pursue efforts to limit the temperature increaseeven further to 1.5 °C (UNFCCC 2017). Therefore, keeping global temperaturebelow the estimated level by reducing GHG in the atmosphere is essential. Removingatmospheric carbon and storing it in the terrestrial biosphere is one of the options,which have been proposed to compensate GHG emissions (Albrecht and Kandji2003). The importance of agroforestry systems as carbon sinks has recently beenrecognized due to the need of climate change mitigation (Soto-Pinto et al. 2010).It is also considered as an option aimed at reducing emissions of greenhouse gasesin the United Nations based REDD+(reducing emissions from deforestation andforest degradation, conserving and enhancing forest carbon stocks, and sustainablymanaging forests) program for tropical developing regions (Atangana et al. 2014;Tumwebaze and Byakagaba 2016). It has the potential to sequester atmosphericcarbon in trees and soil while maintaining sustainable productivity (Oelbermannet al. 2004). It can mitigate GHG emissions, conserve biodiversity and generateincome (Hager 2012). Given that the most significant increases in carbon storageon land can be achieved by moving from low-biomass, land-use systems to tree-based systems, the practice of agroforestry presents a viable option for forest-basedmitigation (Polzot 2004).
Coffee agroforestry has emerged as a promising land use system for sequesteringcarbon and contributing to climate change mitigation (Dossa et al. 2008; Soto-Pintoet al. 2010; Schmitt-Harsh et al. 2012). Given enhanced carbon sequestration thatoccurs with tree planting and the practice of agroforestry farming, shade growncoffee systems have been recognized as viable afforestation and reforestation (A&R)strategies under the Clean Development Mechanism (CDM) of the Kyoto Protocol(IPCC 2000; UNFCCC 2006; Schmitt-Harsh et al. 2012). Compared to non- shadedor partially shaded plantations, shade-grown coffee stores significant amounts ofcarbon in both the aboveground woody biomass of shade trees and the litter layerand soil organic matter. These pools contribute to GHG emission reductions and thealleviation ofGHGaccumulation in the atmosphere (Polzot 2004). On the other hand,coffee is cultivated under a canopy of shade trees, a practice that ensures the longevityof the farm, supports biodiversity, and provides communities with a broad array ofecosystem services (Jha et al. 2011).Coffea arabica is grown under the shade of trees,which moderate the microclimate for the benefit of the crop (Van Kanten and Vaast2006; Siles et al. 2010; Hergoualch et al. 2012). Moderately shaded Coffea arabica

Coffee, Climate and Biodiversity: Understanding the Carbon … 115
coffee plants have photosynthetic rates three times higher than coffee leaves underfull sun and planting Coffea arabica under shade is the most important for bothquality improvement and maintaining sustainable production (Alemu and Dufera2017). Recent studies in traditional shaded coffee plantations have demonstratedthis agroecosystem’s potential as a refuge for biodiversity (Perfecto et al. 1996;Moguel and Toledo 1999; Perfecto et al. 2003). Shade grown coffee plantation hasdiverse, complex structure and that has a high potential to retain biodiversity in thechanging climate scenarios. However, researches in coffee systems have allowedfor an improved understanding of habitat management and biodiversity, a closerexamination of the relationships between biodiversity and ecosystem services (Jhaet al. 2014), and a greater understanding of the linkage between climate change andbiodiversity. Thus, densely shaded coffee agroforests besides demonstrable carbonbenefits, it also provides a number of other ecosystem services and functions (e.g. soilconservation, water regulation) similar to natural forest ecosystems (Schmitt-Harshet al. 2012). Shaded coffee provides a viable business case to coffee smallholders andsupports biodiversity and ecosystem services. Besides the direct benefits to small-scale coffee farmers, further opportunities to increase the attractiveness of shadedplantations may lie in ecosystem services related to shade trees (Jezeer and Verweij2015). While the ecological and socioeconomic costs and benefits associated withshade coffee are clear, many modern management schemes abandon shade practicesand also there are many challenges in bridging sustainable coffee management withlivelihood security (Jha et al. 2011). Importantly, biodiversity declines within coffeesystems are of particular concern, given that ecosystem services such as pollination,pest control, erosion control, watershed management, and carbon sequestration areworth billions annually and are largely a function of biodiversity levels (Wardle et al.2011; Jha et al. 2014).
Thus, the rationale behind this paper is to develop a holistic understanding of acomprehensive approach to study carbon benefits, conserve biodiversity, and sustainecosystem services of the shade-grown coffee system in the face of climate change.The objective of this paper is to discuss that the shade-grown coffee has a high poten-tial for carbon storage, studying its carbon profile and promoting their application asa significant climate change adaptation and mitigation strategies to conserve biodi-versity and to sustain ecosystem services in the Indian context. It is also to highlightthe value of Shade Coffee System in the conservation of quite a good number ofthreatened tree species ofWestern Ghats (a global biodiversity hotspot), which are inuse as the source of products such as timber, fruits, nuts, resins and gums or barks. Inthis paper, we have taken Wayanad District of Kerala in India as a case study and weoutlined the shade-grown coffee through the lens of climate change and biodiversity.We have also discussed the difference between traditional shade and modern opensystem and highlighted the nexus of carbon stock of coffee production system andbiodiversity. Importantly, we emphasized the need for promoting sustainable pro-duction and consumption as a carbon neutral coffee brand and accentuate that shadegrown, biodiversity rich and climate resilient coffee can emerge as a highly valuedcommodity in the world coffee market.
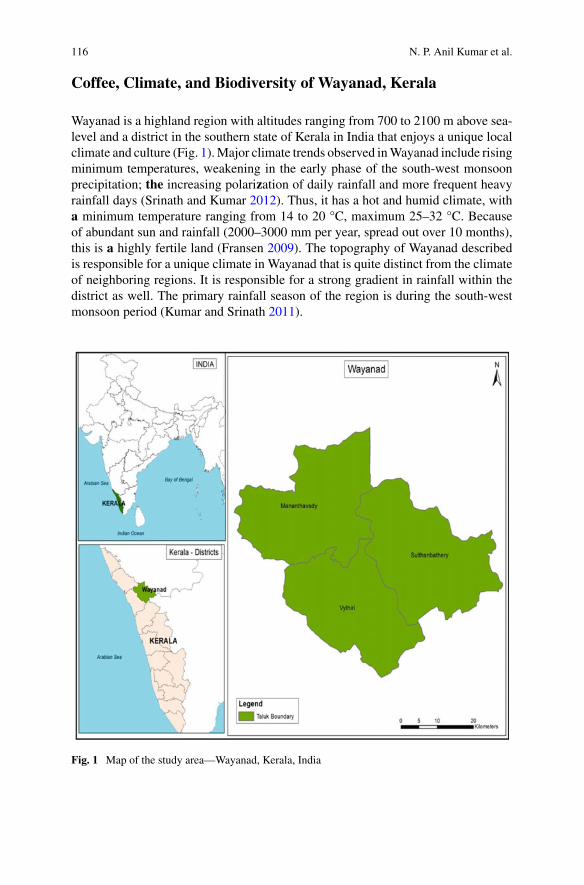
116 N. P. Anil Kumar et al.
Coffee, Climate, and Biodiversity of Wayanad, Kerala
Wayanad is a highland region with altitudes ranging from 700 to 2100 m above sea-level and a district in the southern state of Kerala in India that enjoys a unique localclimate and culture (Fig. 1).Major climate trends observed inWayanad include risingminimum temperatures, weakening in the early phase of the south-west monsoonprecipitation; the increasing polarization of daily rainfall and more frequent heavyrainfall days (Srinath and Kumar 2012). Thus, it has a hot and humid climate, witha minimum temperature ranging from 14 to 20 °C, maximum 25–32 °C. Becauseof abundant sun and rainfall (2000–3000 mm per year, spread out over 10 months),this is a highly fertile land (Fransen 2009). The topography of Wayanad describedis responsible for a unique climate in Wayanad that is quite distinct from the climateof neighboring regions. It is responsible for a strong gradient in rainfall within thedistrict as well. The primary rainfall season of the region is during the south-westmonsoon period (Kumar and Srinath 2011).
Fig. 1 Map of the study area—Wayanad, Kerala, India
Coffee, Climate and Biodiversity: Understanding the Carbon … 117
Wayanad is declared as one of the 18 true agro biodiversity hotspots in the world(Joy 2004). Wayanad-Silent Valley region in the Western Ghats is a global biodi-versity hotspot. This region is climate vulnerable in terms of scores of factors like(i) higher variation in rainfall, (ii) chances of flash floods and prolonged droughts,(iii) increased occurrences of forest fire, (iv) landslide, (v) unscientific land usepattern, (vi) erosion of biodiversity, (vii) concentration of tribal communities andlandless people, (viii) lower ranking in the human development index and highersocial deprivation and environmentally fragile landscapes, and (ix) high percentageof the population of small holder farmers who rely on rain-fed agriculture.
Today it is home to a complex agro-forestry economy where major plantationcrops such as coffee, pepper and tea along with crops such as rice and banana, alongwith a host of others are grown intensively at multiple times in the year. Wayanad isalso home to a large tribal population (17.43% of the total population as per Census2001) who are socio-economically worse off compared to the general populace.Apart from the general climate-dependent nature of the economy, the small size ofland-holdings of most farmers in Wayanad and the largest tribal population rendersthe people and the livelihoods of Wayanad highly vulnerable to climate change andvariability (Srinath and Kumar 2012).
Coffee is one of the important plantation crops of India, which is cultivatedmainlyin the hill tracts of South India especially in Karnataka, Kerala, and Tamil Nadu. Theother important States of India in which coffee is grown on a limited scale areAndhra Pradesh, Maharashtra, West Bengal, Assam, Andaman and Nicobar Islands,and Madhya Pradesh (Joy 2004). Kerala is the second largest producer of coffee inIndia. It produces 23% of the total coffee output in the country. Wayanad produces90% of the total coffee output in the State (Joy 2004). Of the territory of Wayanad,54% is agriculture land, 37% is forest. The main product is coffee and it occupies110,000 ha, 58% of the total agricultural land in the district. 80% of total coffee inKerala are from Wayanad (Fransen 2009). The district is rich in agrobiodiversitythough on-farm erosion of genetic diversity of crops, breeds and strains are reportedhigh in the region (Kumar et al. 2010, 2015).
Thewild biodiversity ofWayanad is also very rich both in terms of species, genera,families, andhighpercentage of endemism (MSSRF2016). The area ofWayanad fallsentirelywithin theWesternGhats of India, whichwas one of the eighteen biodiversityhot spots proposed originally by Myers (Myers et al. 2000; Santhoshkumar andIchikawa 2010). The forests here are globally important as they house endemicflora and fauna, which include 229 species of plants, 31 species of mammals, 15species of birds, 52 species of amphibians. Among these, 55 species are criticallyendangered, 148 species are endangered and 129 species are vulnerable as per IUCNclassification. Moreover, a number of cultivated food plants have their wild relativesin these forests. Among spices, black pepper, cardamom, cinnamon and curcumahave their wild relatives largely in these wet evergreen forests (Santhoshkumar andIchikawa 2010).

118 N. P. Anil Kumar et al.
Coffee Cultivation: Traditional Shade and Modern OpenSystem
Coffee cultivation provides livelihoods for a large number of people live in thebiodiversity-rich mountainous states of India like Wayanad, Kerala. Coffee (Coffeaarabica (de Jessieu) Linn) was introduced in India about 400 years ago in the BabaBudan hills in the Western Ghats, which presently a global biodiversity hotspot.India’s wild coffee species are C. bengalensis, C. travancorensis, C. wightiana,C.khasiana and C.jenkinsii. Amongst these species the first three were convention-ally placed under the genus Psilanthus, but of late all being treated as species of thegenus Coffea. Coffea robusta L (C. canephora Pierre ex A froehner) and the vari-eties like Cauvery, S.795, and Sln 9 which perform well in a broad range of shade(30–60%) are becoming the preferred choices in the major coffee grown regions ofIndia. Figure 2a and b represents shade coffee farms and open or partially shadedcoffee farm in Wayanad District of Kerala, India. Though Coffee is considered asone of the major agricultural commodities that drive deforestation, the traditionalfarming methods of the small coffee growers in India were on the contrary to thisbelief. Since 1840 the British popularized coffee cultivation on a plantation modein selectively cleared evergreen and moist-evergreen forest slopes of the mediumelevation mountains, mainly in the south west and eastern region of India, in threestates Karnataka, Kerala and Tamil Nadu. NowCoffee plantations being spread in thenorth eastern hill regions of the country too. Till early part of 1990s “Arabica coffee”dominated the coffee plantation. The dominance of Arabica has been falling downfor the last 20–25 years with the preference over the Robusta variety-a sturdy, highyielding and sun-loving species. Now, nearly 80% of the Coffee plantations in Kar-nataka and Kerala dominated by the Robusta variety. Another variety that is grownin the region, but not for commercial purpose is Liberian Coffee (Coffee liberica).
Presently, three different kinds of structural designs for growing coffee (Arabicaand Robusta coffee) have been seen, such as (i) substantially shaded ones (purelyArabica) integrated with large forest trees, which are mainly for growing black pep-per, and ground cover of ginger, clove and turmeric. This practice is mostly followedby the small scale farmers as an income security strategy by having multiple crops(ii) medium shaded farms (both Arabica and Robusta) with predominantly jack treesor the exotic silver oak trees integrated with pepper and ginger, or turmeric as groundcrops; and (iii) un-shaded or open mono crop farms with only Robusta. The predom-inant trend amongst the big planters of the region, is maintaining Robusta mono-cropcoffee farms in view of getting the maximum production from the target crop. Theresearch and development (R&D) system of the country gives more focus on onlyincreasing the total production and productivity of the coffee. Thus, this system ofproduction of coffee is getting popularized, and it is destructive to biodiversity andmany of the beneficial ecosystem services (Kumar 2017).

Coffee, Climate and Biodiversity: Understanding the Carbon … 119
Fig. 2 a Shade coffee farms, Wayanad, Kerala, India. b Open or partially shaded Coffee Farm,Wayanad, Kerala, India

120 N. P. Anil Kumar et al.
Shade Grown Coffee System Is Akin to Tropical Forest
Coffee is shade tolerant and traditionally grown under shade trees in complex agro-forestry systems, thereby providing a refuge for biodiversity and sustaining otherecosystem services. Shade grown coffee is increasingly promoted as a promisingapproach to deal with the twin challenges of biodiversity conservation and localdevelopment. Biodiversity benefits associated with shaded coffee practices are wellresearched and it is clear that these systems hold considerable potential to con-serve biodiversity (Bhagwat et al. 2008; Jezeer and Verweij 2015). The shade growncoffee forestry system has many features and functions of a tropical forest ecosys-tem. For example, many such farms are ground water recharging catchments andplaying a key role in the maintenance of the local hydrological systems (Kumar2017). Habitat on shade-grown coffee farms outshone sun-grown coffee farms withincreased numbers and species of birds as well as an improved bird habitat, soilprotection/erosion control, carbon sequestration, natural pest control and improvedpollination.While sun-grown systems can have higher yields, the shaded farms easilyoutperform them in sustainability measurements with the trees providing an array ofecological services that offer both direct and indirect “income/payback” to farmersand the environment (Rice 2010). Shaded coffee provides a viable business case tocoffee smallholders. Besides the direct benefits to small-scale coffee farmers, shadetrees provide a sustainable and financially viable strategy to cope with climate andpayments for ecosystem service (e.g. carbon sequestration) can increase farmer s’incomes (Jezeer and Verweji 2015).
Some large shaded coffee farms inWayanad district of Kerala were identifiedwith85 different forest tree species (Table 1), the frog species diversity is also immenselyrich in shade coffee farms, which include 10 rare and threatened frog species (GroundFrog (1sp) Bush Frog (6 spp) and tree frog (3 spp). Out of this 9 species, six arerecently described new species (Refer Box. 1). Figure 3 showcases some of the frogdiversity identified from the shade coffee farms of Wayanad, Kerala. Pseudophilatuswayanadensis is a mid-elevation species inhabiting leaf litter and shrubs and com-monly seen in the coffee plantations. Males are found calling from the top of thecoffee plants at an average heigt of 1.5 m the ground. Eggs laid in the soil under leaflitter (Jerdon 1854; Biju et al. 2010); Raorchestes anili is a mid-elevation speciesinhabiting thick bushes, preferring shady canopy areas of coffee plantation. Vocalis-ing males with their distinct metallic “ting-ting-ting” calls are found during late mayto early October on the foliage up to 3 m and eggs are laid in the soil under leaf litter(Biju and Bossuyt 2006; Biju et al. 2010); Raorchestes akroparallagii is a low-midelevation species having a wide distribution in the Western Ghats. Males are foundcalling from bushes at a height of 1–2 m from the ground. Various color morphsranging brown to yellow colors are observed within this species (Biju and Bossuyt2009; Biju et al. 2010). Details of information about other frog species are presentedin the Box. 1. Furthermore, over 80 bird species, more than in an equivalent area ofopen coffee land, and exceeded only by primary tropical forest also reported fromthis “semi-forest” plantation type. The shades coffee forestry system with reference

Coffee, Climate and Biodiversity: Understanding the Carbon … 121
Table 1 List of tree species found in shade coffee plantations of Wayanad
Sl. No Botanical name Local name
1. Holigarna arnottiana Cheru
2. Holigarna grahamii Cheru
3. Mangifera indica Moochi
4. Spondias pinnata Kattu Ambazham
5. Cananga odorata Langilangi
6. Polyalthia coffeoides Nedunar
7. Alstonia scholaris Ezhilam Pala
8. Tabernaemontana alternifolia Kundala Pala
9. Wrightia arborea Mylam Pala
10. Caryota urens Aanapana
11. Vernonia arborea Karana
12. Oroxylum indicum Palakapayyani
13. Spathodea campanulata Thaneerkaimaram
14. Stereospermum colais Pathiri
15. Lophopetalum wightianum Venkkotta
16. Garcinia gummi-gutta Kodampuli
17. Terminalia bellirica Thanni
18. Terminalia paniculata Maruthu
19. Dillenia bracteata Kattupunna
20. Vateria indica Payin
21. Elaeocarpus serratus Kara
22. Elaeocarpus tuberculatus Mukkanni
23. Antidesma montanum Putharaval
24. Aporosa cardiosperma Vetti
25. Croton tiglium Neervala Maram
26. Glochidion ellipticum Njanjetti
27. Macaranga peltata Vatta
28. Mallotus philippensis Sindooram
29. Phyllanthus emblica Nelli
30. Bischofia javanica. Neeli
31. Acrocarpus fraxinifolius Nari Venga
32. Cassia fistula Kanikkonna
33. Adenanthera pavonina Manchadi
34. Albizia amara Nenmen ivaka
35. Albizia lebbeck Vaka
36. Butea monosperma Plasu
(continued)

122 N. P. Anil Kumar et al.
Table 1 (continued)
Sl. No Botanical name Local name
37. Dalbergia latifolia. Veeti
38. Flacourtia montana. Chalir Pazham
39. Hydnocarpus pentandra Marotti
40. Scolopia crenata Mullukara
41. Nothapodytes nimmoniana Peenari
42. Actinodaphne malabarica Malavirinji
43. Cinnamomum malabatrum Karuppa
44. Cinnamomum wightii Kattukaruva
45. Litsea coriacea Vettithali
46. Litsea wightiana Pattuthali
47. Persea macrantha Kulirmavu
48. Careya arborea Pezhu
49. Magnolia champaca Chembakam
50. Kydia calycina Vellachadachi
51. Aglaia barberi Kara Akil
52. Aphanamixis polystachya Chemmaram
53. Chukrasia tabularis Chuvanna Akil
54. Melia dubia Kattuveppu
55. Toona ciliata Vembu
56. Artocarpus gomezianus Pulichakka
57. Artocarpus heterophyllus Plavu
58. Artocarpus hirsutus Anjili
59. Ficus drupacea Kallal
60. Ficus exasperata Paarakam
61. Ficus hispida Paarakam Valuthu
62. Ficus racemosa Atthi
63. Myristica beddomei Kattu Jathi
64. Psidium guajava Pera
65. Syzygium caryophyllatum Njara
66. Syzygium cumini Njaval
67. Chionanthus mala-elengi Kalledala
68. Olea dioica Edala
69. Carallia brachiata Venkana
70. Prunus ceylanica Nai kambagam
71. Pavetta indica var. tomentosa Pavetta
72. Acronychia pedunculata Muttanari
73. Melicope lunu-ankenda Kambili
(continued)

Coffee, Climate and Biodiversity: Understanding the Carbon … 123
Table 1 (continued)
Sl. No Botanical name Local name
74. Meliosma pinnata Kalavi
75. Chrysophyllum roxburghii Athappala
76. Pterospermum diversifolium Pambaram
77. Sterculia guttata Potta-kavalam
78. Symplocos cochinchinensis Pachotti
79. Grewia serrulata Kotti maram
80. Grewia tiliifolia Chadachi
81. Celtis tetrandra Karukkuyyan
82. Celtis timorensis Bhoonari
83. Clerodendrum infortunatum. Peruku
84. Gmelina arborea Kumbil, Kumizhu
85. Vitex altissima Myila, Myilu
to earthworms, termites, and ants show the soil of such farms are amazing diverse.(Tables 2, 3 and 4). The traditional integrated coffee farms of the small and marginalfarmers are rich in forest tree species and spices like black pepper (of many vari-eties and species), which are growing on the wild trees. The wild pepper speciesseen are Piper argyrophyllum Miq. Piper attenuatum Ham., Piper hymenophyllumMiq and Piper wightiiMiq., An endemic wild cinnamon,Cinnamomummalabatrum(Burm. f.) Blume; wild turmeric likeCurcuma neilgherrensisWight,Curcuma pseu-domontana Graham, Curcuma raktakanta Mangaly & Sabu, and wild ginger suchas Zingiber capitatum Roxb.,var. elatum (Roxb.) Baker, Zingiber zerumbet (L.) J.E.Smith, are the species that can common in a shade coffee farm in the district.
Farmers cultivate spices like black pepper, cardamom, cinnamon, clove, gingerand turmeric as the intercrops of the coffee farm. The farms, especially the smallfarms also are integrated with the cultivation of areca nut, and species, like gingerand turmeric (Kumar 2017). Wayanad is a globally renowned region for its exclusivepeculiarity and uniqueness in harboring an enormous assemblage of diverse spicecrops, among which Wayanadan pepper has got place of pride in internationalmarket, because of its unique quality. The district’s coffee farms once harbored awide range of endemic pepper varieties which grew luxuriantly, yielded well andfairly paid the farmers. There are 25 odd pepper varieties being cultivated in thedistrict, mostly as the intercrop of coffee farms (Table 5). Over the last 150 yearsthis method of cultivation has been evolved into a sustainable, disease and pest freecoffee agro-forestry system (CAS).

124 N. P. Anil Kumar et al.
Box. 1 The frog diversity identified from shade Coffee Farms of Wayanad,Kerala, India
1. Pseudophilatus wayanadensis is a mid-elevation species inhabiting leaf litterand shrubs and commonly seen in the coffee plantations.Males are found callingfrom the top of the coffee plants at an average height of 1.5 m the ground. Eggslaid in the soil under leaf litter (Jerdon 1854; Biju et al. 2010).
2. Raorchestes anili is a mid elevation species inhabiting thick bushes, preferringshady canopy areas of coffee plantation. Vocalising males with their distinctmetallic “ting-ting-ting” calls are found during late May to early October onthe foliage up to 3 m and eggs are laid in the soil under leaf litter (Biju andBossuyt 2006; Biju et al. 2010).
3. Raorchestes akroparallagii is a low-mid elevation species having a wide distri-bution in the Western Ghats. Males are found calling from bushes at a height of1–2m from the ground. Various colour morphs ranging brown to yellow coloursare observed within this species (Biju and Bossuyt 2009; Biju et al. 2010).
4. Raorchestes glandulosus is a high elevation species distributed above 800 mabove sea level. Males are found calling at a height of 3–4 m from the coffeeplantations (Jerdon 1854; Biju et al. 2010).
5. Raorchestes ponmudi is a widely distributed species commonly found in thecoffee plantations. Males are observed calling from the leaves and branches ofcoffee plants and small trees up to 3 m in height. During the winter, severalindividuals can be found hibernating in tree holes (Biju and Bossuyt 2005a;Biju et al. 2010).
6. Raorchestes nerostagona is a tree dwelling species found in the coffee plan-tations of Wayanad. The cryptic lichen like colour pattern, provides excellentcamoflage from predators. Generally they found on the ground during the nonbreeding season. However, during breeding season, males climbing to the uppercanopy of tall trees to advertise their presence (Biju and Bossuyt 2005b; Bijuet al. 2010).
7. Racophorus malabaricus is a rain forest adopted canopy species commonlyseen in the coffee plantations. Build foam nest in water tanks of the coffeeplantations (Jerdon 1870).
8. Racophorus laterralis is a mid-elevation species breed in the water tanks ofcoffee plantations (Boulenger 1883).
9. Polypedates pseudocruciger is a low and mid-elevation species found inthe wooded areas. Found abundantly in the coffee plantations (Daniels andRavichandran 1995).
10. Uperdon triangularis is seen in the leaf litter of coffee plantations and evergreenpatches of Western Ghats (Günther 1876).

Coffee, Climate and Biodiversity: Understanding the Carbon … 125
Pseudophilatus wayanadensis Raorchestes anili
Raorchestes akroparallagii Raorchestes glandulosus
Raorchestes ponmudi Raorchestes nerostagona
Racophorus malabaricus Racophorus laterralis
Polypedates pseudocruciger Uperdon triangularis
Fig. 3 Some of the frog species found in shade coffee plantations in Wayand, Kerala, India. Pho-tographs credits Dr. Anil Sachariya

126 N. P. Anil Kumar et al.
Know the Nexus of Carbon Stock of Coffee ProductionSystem and Biodiversity
Wayanad and the adjoining coffee grown areas experience a shift towards mono cropand high input farming. There are wide spread deliberate attempts for growing coffeecompletely exposed to sun with high input agro-chemicals for getting the maximumcrop productivity, and income. This change in farm practices and intensified use offarm inputs becomes a big sustainability issue, particularly in the context of biodiver-sity loss and the consequent climate vulnerabilities. The region is also experiencingunprecedented and irreversible climate variations like weakening in the early phaseof the south-west monsoon precipitation, increasing polarisation of daily rainfall,more frequent heavy rainfall days and rising minimum temperature. The challengesassociated with climate variations result in staggering poverty, especially amongstthe resource poor tribe communities likePaniya, Adiya andKattunaikka inWayanad.It is also a fact that the indirect benefit that enjoyed by people of the region in theform of increased removal of carbon through integrated coffee cultivation also hasnow getting diminished.
In the light of climate changemitigation, carbon (C) storage in both living biomassand in the soil is a key ecosystem service provided by forests and agroforests (Bonan2008; Miles and Kapos 2008; Beenhouwer et al. 2016). In particular, the ecosys-tem services of traditionally maintained, shaded Arabica and Robusta coffee farmsbecome very prominent largely for increasing carbon removal. The most importantfunction of the shade grown traditional coffee agroforestry system is the reductionof the concentration of Carbon in the atmosphere. It is estimated that one hectareshade-grown coffee farmwith large forest trees can sequester 70–80 tonnes of carbonper hectare, which is more or less equivalent to the carbon stored in an equal areaof forest. A fully sun–grown or open coffee in one hectare can only store less than10 tonnes of carbon (Noponen et al. 2012). A study in the adjacent Coorg regionreported the soil organic carbon sequestration potential of the shaded coffee sys-tem averaged 3.43 t/ha and microbial organic carbon content 831.76 mg/g comparedto 1.84 t/ha and 669.46 mg/g respectively that of the partially shaded system withexotic silver oak trees (Kumar 2017). One of the major challenges at the interface ofclimate change and ecosystem science is to identify points of convergence betweenC storage and biodiversity conservation (Phelps et al. 2012). In general, a higherC storage potential is assumed to co-occur with biodiversity conservation (Venter2014; Beenhouwer et al. 2016). Two recent studies found a correlation when soil Cstorage was included. Woody plant species richness was associated with higher totalC (aboveground and soil) storage in a recent study of Costa Rican coffee agroforestrysystems by Hager (2012) and Saha et al. (2009) found a positive correlation betweensoil organic C and plant diversity in home gardens of India (Richards and Mendez2013).
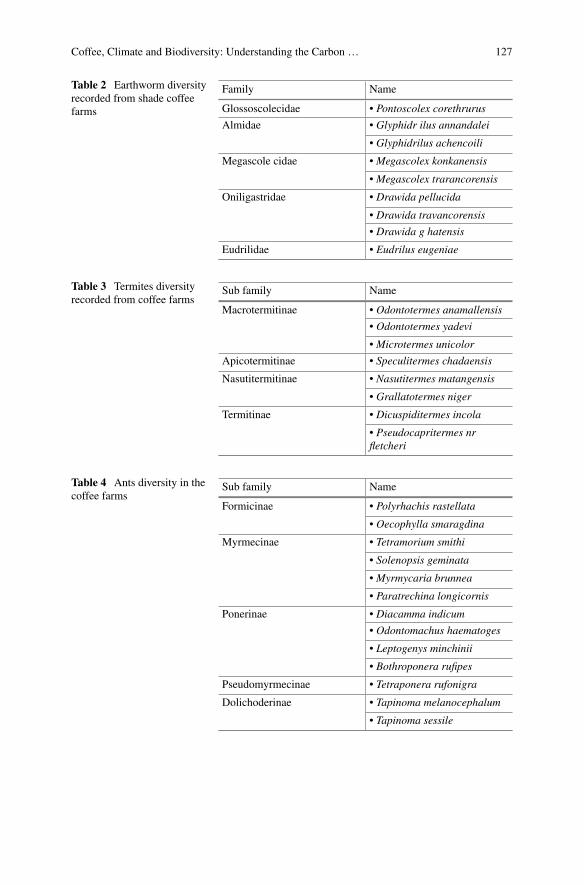
Coffee, Climate and Biodiversity: Understanding the Carbon … 127
Table 2 Earthworm diversityrecorded from shade coffeefarms
Family Name
Glossoscolecidae • Pontoscolex corethrurus
Almidae • Glyphidr ilus annandalei
• Glyphidrilus achencoili
Megascole cidae • Megascolex konkanensis
• Megascolex trarancorensis
Oniligastridae • Drawida pellucida
• Drawida travancorensis
• Drawida g hatensis
Eudrilidae • Eudrilus eugeniae
Table 3 Termites diversityrecorded from coffee farms
Sub family Name
Macrotermitinae • Odontotermes anamallensis
• Odontotermes yadevi
• Microtermes unicolor
Apicotermitinae • Speculitermes chadaensis
Nasutitermitinae • Nasutitermes matangensis
• Grallatotermes niger
Termitinae • Dicuspiditermes incola
• Pseudocapritermes nrfletcheri
Table 4 Ants diversity in thecoffee farms
Sub family Name
Formicinae • Polyrhachis rastellata
• Oecophylla smaragdina
Myrmecinae • Tetramorium smithi
• Solenopsis geminata
• Myrmycaria brunnea
• Paratrechina longicornis
Ponerinae • Diacamma indicum
• Odontomachus haematoges
• Leptogenys minchinii
• Bothroponera rufipes
Pseudomyrmecinae • Tetraponera rufonigra
Dolichoderinae • Tapinoma melanocephalum
• Tapinoma sessile
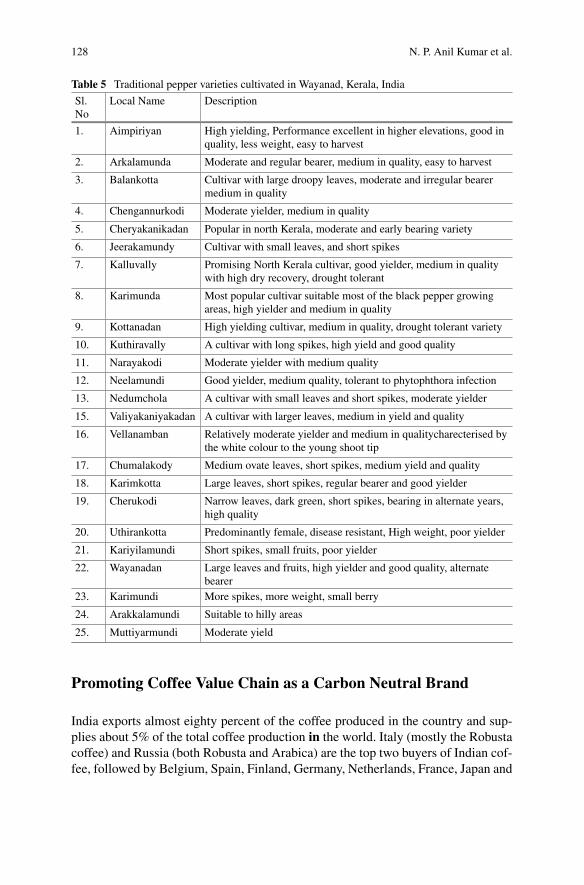
128 N. P. Anil Kumar et al.
Table 5 Traditional pepper varieties cultivated in Wayanad, Kerala, India
Sl.No
Local Name Description
1. Aimpiriyan High yielding, Performance excellent in higher elevations, good inquality, less weight, easy to harvest
2. Arkalamunda Moderate and regular bearer, medium in quality, easy to harvest
3. Balankotta Cultivar with large droopy leaves, moderate and irregular bearermedium in quality
4. Chengannurkodi Moderate yielder, medium in quality
5. Cheryakanikadan Popular in north Kerala, moderate and early bearing variety
6. Jeerakamundy Cultivar with small leaves, and short spikes
7. Kalluvally Promising North Kerala cultivar, good yielder, medium in qualitywith high dry recovery, drought tolerant
8. Karimunda Most popular cultivar suitable most of the black pepper growingareas, high yielder and medium in quality
9. Kottanadan High yielding cultivar, medium in quality, drought tolerant variety
10. Kuthiravally A cultivar with long spikes, high yield and good quality
11. Narayakodi Moderate yielder with medium quality
12. Neelamundi Good yielder, medium quality, tolerant to phytophthora infection
13. Nedumchola A cultivar with small leaves and short spikes, moderate yielder
15. Valiyakaniyakadan A cultivar with larger leaves, medium in yield and quality
16. Vellanamban Relatively moderate yielder and medium in qualitycharecterised bythe white colour to the young shoot tip
17. Chumalakody Medium ovate leaves, short spikes, medium yield and quality
18. Karimkotta Large leaves, short spikes, regular bearer and good yielder
19. Cherukodi Narrow leaves, dark green, short spikes, bearing in alternate years,high quality
20. Uthirankotta Predominantly female, disease resistant, High weight, poor yielder
21. Kariyilamundi Short spikes, small fruits, poor yielder
22. Wayanadan Large leaves and fruits, high yielder and good quality, alternatebearer
23. Karimundi More spikes, more weight, small berry
24. Arakkalamundi Suitable to hilly areas
25. Muttiyarmundi Moderate yield
Promoting Coffee Value Chain as a Carbon Neutral Brand
India exports almost eighty percent of the coffee produced in the country and sup-plies about 5% of the total coffee production in the world. Italy (mostly the Robustacoffee) and Russia (both Robusta and Arabica) are the top two buyers of Indian cof-fee, followed by Belgium, Spain, Finland, Germany, Netherlands, France, Japan and

Coffee, Climate and Biodiversity: Understanding the Carbon … 129
USA. “Monsooned Malabar Arabica Coffee “is a specialty coffee of India, sourcedfrom shade coffee plantation and has GI protection. This coffee is produced fromthe harvested cherries that are exposed to rain and winds of the monsoon for about3–4 months to make the pH balance of the seeds neutral. But, this practice has beenalmost disappeared or restricted to only with some elite planters. There is a hugepotential to create an impact on farmers’ income by making shade coffee farming aprofitable venture and free from climate change risks (Kumar 2017). Because agroforests are human-managed systems, this may present an opportunity for farmersto manage such systems for greater C sequestration. However, this would requirea re-examination of mechanisms to support or reward shade coffee farmers (Davisand Mendez 2011; Richards and Mendez 2013). For example, small-scale farmershave generally been excluded from REDD, Clean Development Mechanism (CDM),and other PES schemes for C sequestration because of the expense involved in man-aging multiple small farms and the lower per-hectare mitigation benefits relativeto afforestation and reforestation projects (Wunder and Borner 2012; Richards andMendez 2013). Therefore, the promotion of shade grown, biodiversity-rich and cli-mate resilient Coffee can emerge as a highly valued commodity in the world coffeemarket. Revival of the shade grown coffee system amongst the small growers withappropriate steps in marketing the coffee as a speciality product (carbon neutral andgrown in bio-diverse environment) can improve the farm income and enhance thecoffee agro-ecosystem services.
Conclusion
Agroforestry systems have been recognized for their potential to sequester largeamounts of C (Noponen et al. 2013). Agro ecosystems have the potential to act ascarbon sinks and carbon storage pools while contributing to increased farm produc-tion, environmental conservation and poverty alleviation (Pandey 2002; Manjunathaet al. 2016). On the other hand, agroforestry systems have substantial potential toconserve native biodiversity and provide ecosystem services. In particular, agro-forestry systems have the potential to conserve native tree diversity and sequestercarbon for climate change mitigation (Richards and Mendez 2013). Coffee farms asagroforestry may contribute to GHG mitigation and biodiversity conservation in asynergistic manner which has implications for the effective allocation of resourcesfor conservation and climate change mitigation strategies in the agricultural sector(Hager 2012). It is possible to produce high quality coffee without destructing bio-diversity or contributing negatively to some of the critical ecosystem services. Oneof the important steps to make the shade Coffee Agro-forestry System globally vis-ible is a creation of scientifically valid evidences on the biodiversity and ecosystemservices, and the emission- mitigation potential of this system. Evidence from suchstudy will also help to promote eco-tourism in the coffee production areas. There areno serious studies in India that analyzed the carbon emission in the entire value chainof Indian Coffee production, processing, transporting and consumption system. The
130 N. P. Anil Kumar et al.
need for a trans-disciplinary approach inclusive of the private industries in under-standing the entire life cycle of the coffee production system is urgent for developingcoffee production system and the value chain as a carbon neutral brand. Also, thereis a need to work upon “consumption awareness” which can positively impact onsustainable production of coffee. Since management practices such as shade use andreforestation influence both climate vulnerability and carbon stocks in coffee, theremay be synergies between climate change adaptation and mitigation that could makeit advantageous to jointly pursue both objectives (Rahn et al. 2013). Importantly,there is a need for policy incentives that encourage the planting and maintenance ofshade trees in coffee plantations for the benefit of carbon sequestration (Tumwebazeand Byakagaba 2016). Accordingly, biodiversity of agro-ecosystems have impor-tant consequences for long-term carbon storage, and thus warrants incorporationinto the design, implementation, and regulatory framework of mitigation initiatives(Diaz et al. 2009). There have been significant efforts to develop robust methods toaccount for the benefits, if any, of sequestration and temporary storage and releaseof biogenic carbon. However, there is still no overall consensus on the most appro-priate ways of considering and quantifying it (Brandão et al. 2013). Thus, this paperemphasizes that the sustainably grown coffee helps to increase climate resilience,contributes to carbon mitigation, conserves biodiversity and stabilizes ecosystemswhile also helping farmers stabilize and improve their income and livelihood (Stifung2017).
Limitations
Although this paper was thoughtfully prepared and reached its aim, there were somelimitations. Some of the limitations of the paper includes that (1) this paper hasonly outlined the conceptual nexus of coffee, climate and biodiversity, however,more investigations are warranted to establish the strong scientific approach to makeconnections among the three; (2) this paper has made an attempt to deepen theunderstanding on carbon stocks of the shade coffee production system of India,nonetheless a strategic methodological approach is required to assess the carbonstocks of the shade coffee production system of India; (3) lack of availability ofcarbon stock information at the local level of the shade coffee farms in India is oneof the important limitations of this paper to present any quantifiable information ofthe carbon stocks of the shade coffee production system.
Acknowledgements The authors are grateful to Dr. V. Selavam, Executive Director, MSSRF forhis enduring support. We are indeed thankful to all the staffs and management of MSSRF Chennai,Tamil Nadu and MSSRF CABC, Wayanad, Kerala for their encouragement and support. We placethe record of appreciations to Ms. Punitha and Mr. Nagraj of GIS Unit, MSSRF for their GISsupport. We thank Dr. Anil Sachariya for sharing with us those lively pictures of frog diversity thathe photographed from the coffee plantations. Thanks are due to our colleagues Mr. Salim Pichan,Mr. Joseph John, Mr. M. K. Nanda Kumar, Ms. C. S. Dhanya and Mr. T. A. Raveendran for theirbrilliant assistance to us in collecting necessary field data. We thank the Minister and Department

Coffee, Climate and Biodiversity: Understanding the Carbon … 131
of Finance, Minister and Department of Environment and Climate Change, Government of Keralawho mooted and supported the idea of realizing “Carbon Neutral Wayanad” in persuading us toinvestigate the importance of shade coffee farms in carbon removal of Wayanad district, Kerala,India.
References
Albrecht A, Kandji ST (2003) Carbon sequestration in tropical agroforestry systems. Agric EcosystEnviron 99(1–3):15–27
Alemu A, Dufera E (2017) Climate Smart Coffee (coffea arabica) Production. Am J Data Mini andKnowl Discov 2(2):62–68
Atangana A, Khasa D, Chang S, Degrande A (2014) Carbon sequestration in agroforestry systems.Tropical Agroforestry. Springer, Netherlands, pp 217–225
Beenhouwer MD, Geeraert L, Mertens J, Geel MV, Aerts R, Vanderhaegen K, Honnay O (2016)Biodiversity and carbon storage co-benefits of coffee agroforestry across a gradient of increasingmanagement intensity in the SW Ethiopian highlands. Agric Ecosyst Environ 222:193–199
Bhagwat SA, Willis KJ, Birks HJB, Whittaker RJ (2008) Agroforestry: a refuge for tropical biodi-versity? Trends Ecol Evol 23:261–267. https://doi.org/10.1016/j.tree.2008.01.005
Biju SD, Bossuyt F (2005a) A new species of Philautus (Anura, Ranidae, Rhacophorinae) fromPonmudi hill in the Western Ghats of India. J Herpetol 39:349–353
Biju SD, Bossuyt F (2005b) A new species of frog (Ranidae, Rhacophorinae, Philautus) from therainforest canopy in the Western Ghats. India Curr Sci 88(1):175–178
Biju SD, Bossuyt F (2006) Two new species of Philautus (Anura, Ranidae, Rhacophorinae) fromthe Western Ghats, India. Amphibia-Reptilia 27:1–9
Biju SD, Bossuyt F (2009) Systematics and phylogeny of Philautus Gistel, 1848 (Anura, Rha-cophoridae) in the Western Ghats of India, with descriptions of 12 new species. Zool J LinnSoc-Lond 155(2):374–444
Biju SD, Shouche Y, Dubois A, Dutta SK, Bossuyt F (2010) A ground dwelling rhacophorid fromthe highest mountain peak of Western Ghats of India. Curr Sci 98(8):1119–1125
Bonan GB (2008) Forests and climate change: forcings, feedbacks, and the climate benefits offorests. Science 320:1444–1449
Boulenger GA (1883) Description of new species of reptiles and batrachians in the BritishMuseum.Ann Magaz Nat History Series 5(12):161–167
Brandão M, Levasseur A, Kirschbaum MUF, Weidema BP, Cowie AL, Jørgensen SV, HauschildMZ, Pennington DW, Chomkhamsri K (2013) Key issues and options in accounting for carbonsequestration and temporary storage in life cycle assessment and carbon footprinting. J Life CycleAss 18(1):230–240
Daniels RJR, Ravichandran MS (1995) The Ceylonese tree frog Polypedates cruciger Blyth, a newrecord for India. Asiatic Herpetological Research 6:36–37
Davis A, Mendez VE (2011) Prioritizing food security and livelihoods in climate change mitigationmechanisms: experiences and opportunities for smallholder coffee agroforestry, forest communi-ties and REDD+. Salvadoran Research Program on Development and Environment (PRISMA),San Salvador, El Salvador
Diaz S, Hector A, Wardle DA (2009) Biodiversity in forest carbon sequestration initiatives: not justa side benefit. Curr Opin Environ Sustain 1(1):55–60
Dossa EL, Fernandes ECM, ReidWS (2008) Above and belowground biomass, nutrient and carbonstocks contrasting an open-grown and a shaded coffee plantation. Agrofor Syst 72:103–115
Fransen G (2009) The Coffee Industry inWayanad, Kerala. Independent Report. Community Agro-biodiversity Centre, M. S. Swaminathan Research Foundation, Wayand, Kerala, India

132 N. P. Anil Kumar et al.
Günther A (1876) Third report on collections of Indian reptiles obtained by the British Museum.Proce Zool Soc Lon 567–577
Hager A (2012) The effects of management and plant diversity on carbon storage in coffee agro-forestry systems in Costa Rica. Agrofor Syst 86(2):159–174
Hergoualch K, Blanchart E, Skiba U, Hénaultf C, Harmand JM (2012) Changes in carbon stock andgreenhouse gas balance in a coffee (Coffea arabica) monoculture versus an agroforestry systemwith Inga densiflora. Costa Rica. Agric Ecosyst Environ 148(2012):102–110
IPCC (2000) Special report on land use, land-use change and forestry. Cambridge University Press,Cambridge, UK
Jerdon TC (1854) Catalogue of reptiles inhabiting the peninsula of India. J Asiatic Soc Bengal22:522–534
Jerdon TC (1870) Notes on Indian herpetology. Proc Asiatic Soc Bengal 1870:66–85Jezeer RE, Verweij PA (2015) Shade grown coffee—double dividend for biodiversity and small-scale coffee farmers in Peru. Hivos, Hague, The Netherlands
Jha S, Bacon CM, Philpott SM, Rice RA, Mendez VE, Laderach P (2011) A Review of EcosystemServices, Farmer Livelihoods, and Value Chains in Shade Coffee Agroecosystems. In: CampbellWB, Ortiz SL (eds) Integrating Agriculture, Conservation and Ecotourism: Examples from theField. Issues in Agroecology—Present Status and Future Prospectus, vol 1. Springer, Dordrecht
Jha S, Bacon CM, Philpott SM, Mendez VE, Laderach P, Rice RA (2014) Shade coffee: update ona disappearing refuge for biodiversity. Biosci 64(5):416–428
Joy CV (2004) Small Coffee Growers of Sulthan Bathery, Wayanad. Discussion Paper. KeralaResearch Programme on Local Level Development, Centre for Development Studies, PrasanthNagar, Ulloor, Thiruvananthapuram, Kerala, India
Kumar AN (2017) Greening the Coffee Production in India. Greening Consumption and ProductionMOOC1 31May—12 July 2017 andWorld Environment Day, 2017.M.S.Swaminathan ResearchFoundation, Chennai, Tamil Nadu, India
Kumar AN, Gopi G, Prajesh P (2010) Genetic erosion and degradation of ecosystem services ofwetland rice fields: a case study from Western Ghats, India. In: Lockie S, Carpenter D (eds)Agriculture. Earthscan publishers, Biodiversity and Markets, pp 137–153
Kumar AN, Nambi VA, Rani MG, Oliver King EDI, Chaudhury SS, Mishra S (2015) Communityagro biodiversity conservation continuum: an integrated approach to achieve food and nutritionsecurity. Curre Sci 109:3
KumarD, SrinathP (2011)Climate trends inWayanad,Kerala:Voices from the community.NationalSeminar on Recent Trends in Climate and Impact of Climate Change on South-West India,St.Joseph College, Devagiri, Kozhikode, Kerala, India. Online https://www.researchgate.net/publication/235926198_Climate_Trends_in_Wayanad_Voices_from_the_Community Accessed 16Dec 2017
Manjunatha M, Devakumar AS, Nivedita M, Kushalappa CG (2016) Carbon stock present in dom-inant tree species of coffee based agroforestry system. Int J Agrofor Silvicult 5(5):311–314
Miles K, Kapos V (2008) Reducing greenhouse gas emissions from deforestation and forest degra-dation: global land-use implications. Science 320:1454–1455
Moguel P, Toledo VM (1999) Biodiversity conservation in traditional coffee systems in Mexico.Conserve Biol 12:1–11
MSSRF (2016) Wayanad: a climate change, Biodiversity and Hunger Hotspot. Community Agro-biodiverity Centre, M.S.Swamianthan Research Foundation, Wayanad, Kerala, India. Onlinehttps://www.mssrfcabc.res.in/about-the-centre/location/about-wayanad/. Accessed 16 Dec 2017
Myers N, Mittermeier RA, Mittermeier C, da Fonseca GAB, Kent J (2000) Biodiversity hotspotsfor conservation priorities. Nature 403(24):853–857
Noponen MRA, Jones GE, Haggar JP, Soto G, Attarzadeh N, Healey JR (2012) Greenhouse gasemissions in coffee grownwith differing input levels under conventional andorganicmanagement.Agric Ecosyst Environ 151:6–15

Coffee, Climate and Biodiversity: Understanding the Carbon … 133
Noponen MRA, Healey JR, Soto G, Haggar JP (2013) Sink or source—the potential of coffee agro-forestry systems to sequester atmospheric CO2 into soil organic carbon. Agric Ecosyst Environ175(1):60–68
Oelbermann M, Voroney RP, Gordon AM (2004) Carbon sequestration in tropical and temperateagroforestry systems: a review with examples from Costa Rica and southern Canada. AgricEcosyst Environ 104(3):359–377
Pandey DN (2002) Carbon sequestration in agroforestry systems. Clim Chang Pol 2:367–377Perfecto I, Mas A, Dietsch T, Vandermer J (2003) Conservation of biodiversity in coffee agroe-cosystems: a tri-taxa comparison in southern Mexico. Biodivers Conserv 12:1239–1252
Perfecto I, Rice RA, Greenberg R, Van derVoort ME (1996) Shade coffee: a disappearing refugefor biodiversity. BioSci 46:598–608
Phelps J, Webb EL, AdamsWM (2012) Biodiversity co-benefits of policies to reduce forest-carbonemissions. Nat Clim Change 2:497–503
Polzot LC (2004) Carbon storage in coffee agroecosystems of southern costa rica: potential applica-tions for the clean development mechanism. Faculty of Environmental Studies, York University,Toronto, Ontario, Canada, pp 149. Online http://www.sidalc.net/repdoc/A11184i/A11184i.pdf.Accessed 16 Dec 2017
Rahn E, Läderach P, Baca M, Cressy C, Schroth G, Malin D, Van Rikxoort H, Shriver J (2013)Climate change adaptation, mitigation and livelihood benefits in coffee production: where are thesynergies? Mitigation and Adaptation Strategies for Global Change. http://sci-hub.tw/10.1007/s11027-013-9467-x
Rice R (2010) The Ecological Benefits of Shade-Grown Coffee:The Case for Going Bird Friendly.Smithsonian Migratory Bird Center. Online https://nationalzoo.si.edu/scbi/migratorybirds/coffee/bird_friendly/ecological-benefits-of-shade-grown-coffee.cfm. Accessed 16 December 2017
RichardsMB,MendexVE (2013) Interactions between carbon sequestration and shade tree diversityin a smallholder coffee cooperative in El Salvador. Conserv Biol 28(2):489–497
Saha SK, Nair PKR, Nair VD, Kumar BM (2009) Soil carbon stock in relation to plant diversity ofhomegardens in Kerala, India. Agroforest Sys 76:53–65
Santhoshkumar AV, Ichikawa K (2010) Homegardens: Sustainable land use systems in Wayanad,Kerala, India. In: Bélair C, Ichikawa K., Wong BY.L, Mulongoy KJ. (eds) Sustainable use ofbiological diversity in socio-ecological production landscapes. Background to the ‘SatoyamaInitiative for the benefit of biodiversity andhumanwell-being.’ Technical Series no. 52, Secretariatof the Convention on Biological Diversity, Montreal, Canada, pp 125–128
Schmitt-HarshM, Evans TP, Castellanos E, Randolph JC (2012) Carbon stocks in coffee agroforestsandmixed dry tropical forests in thewestern highlands ofGuatemala.Agroforest Syst 86:141–157
Siles P, Harmand JM,Vaast P (2010) Effects of Inga densiflora on themicroclimate of coffee (Coffeaarabica L.) and overall biomass under optimal growing conditions in Costa Rica. Agroforest Syst78:269–286
Soto-Pinto L, Anzueto M, Mendoza J, Ferrer GJ, de Jong B (2010) Carbon sequestration throughagroforestry in indigenous communities of Chiapas, Mexico. Agrofor Syst 78:39–51
Srinath P, Kumar D (2012) Adapting to climate change and variability in an agro-forestry region inSouth India. International Conference on Public Policy and Governance, 4–6th September 2012,Bangalore, Karnataka, India
Stifung HRN (2017) Coffee and climate: Enabling effective response. Online https://www.hrnstiftung.org/the-initiative-for-coffee-climate. Accessed 15 Dec 2017
Tumwebaze SB, Byakagaba P (2016) Soil organic carbon stocks under coffee agroforestry systemsand coffee monoculture in Uganda. Agriculture, Ecosystems and Environ 216:188–193
UNFCCC (2006) Revised simplified baseline and monitoring methodologies for selected small-scale afforestation and reforestation activities under the clean development mechanism. UnitedNations Framework Convention on Climate Change, Bonn, Germany
UNFCCC (2017) The Paris agreement: Essential elements. United Nations Framework Conventionon Climate Change, Bonn, Germany. Online http://unfccc.int/paris_agreement/items/9485.php.Accessed 15 Dec 2017

134 N. P. Anil Kumar et al.
Van Kanten R, Vaast P (2006) Transpiration of arabica coffee and associated shade tree species insub-optimal, low-altitude conditions of Costa Rica. Agroforest Syst 67:187–202
Venter O (2014) REDD + policy: corridors of carbon and biodiversity. Nat Clim Change 4:91–92WardleDA,Bardgett RD, CallawayRM,Van der PuttenWH (2011) Terrestrial ecosystem responsesto species gains and losses. Science 332:1273–1277
Wunder S, Borner J (2012) Payments for environmental services to mitigate climate change: agri-culture and forestry compared. In: Wollenberg EK, Nihart A, Grieg-Gran M, Tapio-Biström ML(eds) Climate mitigation and agriculture. Earthscan, London, pp 170–180
Implications for Biodiversityof Potentially Committed Global ClimateChange (from Science and Policy)
Peter D. Carter
Abstract Climate change impacts on biodiversity that are observed today are sub-stantially less than those predictable in the future. Vital policy-relevant informationregarding global climate change and biodiversity includes the sources of increasedfuture global warming commitment, which stem from both climate change policyand climate science. Full, long-term (over many 100s of years) equilibrium globalwarming commitment, calculated by the constant atmospheric greenhouse gas com-position, is put at ‘about 2 °C’ by the IPCC 2014 assessment. Significant furthercommitted warming at 2 °C is expected due to weakened terrestrial carbon sinks andlarge planetary sources of carbon feedback emissions. Committed climate changedue to policy is calculated from national emissions targets. Together these policytargets lead to over 3 °C global warming by 2100, which will increase much moreafter 2100. Commitment clearly shows the climate, oceans and biodiversity globalemergency, requiring the immediate decline of emissions with supporting responsesthat are well known and universally recommended.
Introduction
Climate change will exacerbate the ongoing impacts of biodiversity loss. How muchdepends on already committed (locked in) global warming, and that depends on bothclimate science and policy commitments on emissions.
This paper grew out of my interest in exploring the most policy-relevant aspectsof climate change, in particular regarding future life. Predicting the higher degreesof future climate change the world faces is essential for driving conservation andfor planning mitigation and adaptation. The greatly increased loss of biodiversity inthe future due to future global climate change is assessed here by looking at today’salready committed degrees of global climate change. This chapter treats biodiversityloss and ecosystem loss as one and the same. Climate change increases biodiversity
P. D. Carter (B)Climate Emergency Institute, 4708 Captains Crescent, Pender Island, BC V0N 2M2, Canadae-mail: [email protected]
© Springer Nature Switzerland AG 2019W. Leal Filho et al. (eds.), Handbook of Climate Change and Biodiversity,Climate Change Management, https://doi.org/10.1007/978-3-319-98681-4_8
135

136 P. D. Carter
loss, and biodiversity/ecosystem loss increases climate change by reducing landcarbon sinks, e.g., forests.
That the world is in a very large extinction event has been known for manyyears. The same applies to climate change, as recorded in the assessments of theIntergovernmental Panel on Climate Change (IPCC) from 1990 to 2014. It wasin 1996 that Richard Leakey published The Sixth Extinction: Patterns of Life andthe Future of Humankind (Leakey and Lewin 1996). In 2017, Ceballos, Ehrlich,and Dirzo were published under the shocking title Biological annihilation via theongoing sixth mass extinction signaled by vertebrate population losses and declines.What is less well known is that already committed global climate change will makethe extinction rate far worse than projected (Urban 2015).
Increasing Climate Change Increases Biodiversity Loss
In its 2007 fourth assessment, the IPCC said:
In the medium term (i.e., decades), climate change will increasingly exacerbate human-induced pressures, causing a progressive decline in biodiversity. Projected future climatechange and other human-induced pressures are virtually certain to be unprecedented com-pared with the past several hundred millennia. (IPCC 2007, Working Group II 4.1.2.)
Climate change impacts further increasing today’s accelerating biodiversity loss(Ceballos et al. 2015) would be a truly catastrophic case of abrupt climate change,as explained by the National Research Council (NRC) (2013): ‘The abrupt changesthat are already underway […] include increases in extinction rates of marine andterrestrial species.’ The NRC states that unchecked habitat destruction, fragmenta-tion, and over-exploitation combined with the ongoing pressures of climate changecould result in amass extinction equivalent inmagnitude to the one that wiped out thedinosaurs, and that it conceivably could occur before the year 2100. The predicted‘velocity’ of climate change—that is, how fast populations of a species would haveto shift in order to keep pace with the local climate envelope shift—is unprecedented.
Future Catastrophic Biodiversity Decline
All sources project large increases in species extinctions from global climate change.Even the best-case emissions scenario with immediate global emissions declineincreases the risk of extinctions (IPCC 2014a, WGII Summary for Policy Mak-ers). Both global climate change due to greenhouse gas (GHG) emissions and theincreased extinction of species by climate change have great inertia, each takingdecades (or more for extinction). In view of the fact that the world is in or is enteringa catastrophic sixthmajor extinction event already, the effect of global climate change
Implications for Biodiversity of Potentially Committed Global … 137
would appear to be potentially cataclysmic to biodiversity, which is addressed in thischapter.
The challenge of preserving enough habitat for biodiversity to recover in the futureis enormous. Pimm et al. (2014) (in arguably the most comprehensive research paperon future biodiversity loss under global climate change) say that conservation iskey, backed up by the point that the rate at which mammals, birds, and amphibianshave slid toward extinction over the past four decades would have been 20% higherwere it not for conservation efforts. Although the paper says that data and researchlag far behind what is needed, we nevertheless do know the two big solutions thatwould have enormous benefit. These are: (1) conservation through the terminationof deforestation, and (2) termination of industrial age fossil fuel emissions. Thesuccess of conservation is a strong argument for the huge conservation upgrade inthe proposed plan of Wilson (2016) to protect half of the Earth’s land and oceans,and to end deforestation.
Several Sources of Committed Climate Changeand Biodiversity Loss
Committed climate change and biodiversity loss stem from both climate changepolicy and climate system science. If policies are improved, the policy commitmentmight lessen. Climate system commitment is actually much more than is publishedand is irreversible (locked in). Commitment further reinforces a cataclysmic outcomefor global biodiversity.
The data on commitment paints a terrible picture for the future of biodiversity andthe natural world, so at the outset let us be reminded that we have all the solutions.They are well known, as explained by Sutter (2016) in ‘How to stop the sixth massextinction’, which included E. O. Wilson’s Half-Earth Project. These solutions aredeveloped, and they can be readily applied.
Biodiversity loss is already extreme and accelerating. According to the NRC(2013), the extreme rate of acceleration in biodiversity loss is probably unprecedentedin 65 million years; today’s sixth mass extinction event reveals current biodiversityloss as an abrupt planetary catastrophe that will be further greatly accelerated by acommitted, unavoidable increase in global climate change. Data sets (see stateofour-climate.com) show that all climate change indicators from 1900 are accelerating,particularly atmospheric CO2, global surface warming, and amplified Arctic warm-ing, as well as ocean heating, ocean acidification, and ocean deoxygenation.
In terms of policy, this is an Earth (or biodiversity) emergency requiring imme-diate measures for concerted and energetic mitigation, adaptation and conservation.Assessing the projected committed impacts on ecosystems and biodiversity in globalclimate change models is essential for urgently planning both biodiversity conser-vation measures and climate change mitigation measures, and to plan strategies for
138 P. D. Carter
adaptation. Furthermore, committed climate change impacts on biodiversity must beprojected far beyond 2100 (the horizon used by the IPCC).
In doing such an assessment, it is necessary to address the several sources thatcause greater committed future global climate change. In general, there are two typesof climate change commitment: (1) locked-in commitment due to climate changescience (for example, due to climate system inertia, observed ecosystem damage andloss at the time observed will be practically irreversible); and (2) climate changeemissions policy commitment. Both lead to a far greater degree of global climatechange than today’s—which is already having severe disastrous to catastrophic localand regional impacts on all continents.
Commitment Due to Emissions Policies
Policy commitment—current government policy—is recorded by the national gov-ernment emissions targets filed with the United Nations as intended nationally deter-mined contributions (INDCs). Combined, these will lead to a substantial increasein global emissions by 2030, according to an update from the UN Climate ChangeSecretariat (2016). Indeed, these emissions targets lead to a global warming of over3 °C by 2100 (which will be much higher after 2100), according to Climate ActionTracker (2017). This warming by 2100 is triple today’s warming of just over 1 °C.Because of ocean thermal inertia, full equilibrium warming long after 2100 wouldbe 6 °C.
Also on policy commitment, the 1992 Framework Convention on Climate Change(UNClimate Change Secretariat 1992), to which all governments are bound, requiresthe stabilization of greenhouse gas concentrations in the atmosphere at a level suf-ficient to allow ecosystems to adapt naturally to climate change. Stabilization ofatmospheric GHG concentrations is the right metric to use because, unlike the globalaverage surface warming alone, the atmospheric GHG concentrations account foradditional committed warming in the future. However, atmospheric GHG concen-trations are already far above a safe level for ecosystems, on land and in oceans, andCO2 increase is accelerating.
Climate System Science Commitment
The climate system inertia of the ocean heat lag commits warming by 2100 to doublelong after 2100, which can be seen in Fig. 1 by 2300, and which is best explainedby the NRC Climate Stabilization Targets (2011). Added to that, there will be extrawarming from carbon feedback emissions. A significant degree of global warmingcauses more emissions and then more warming, so at least a doubling of warmingfrom now on is predictable. Based on a 2012 global warming of 0.85 °C, the IPCCfifth assessment’sWGI (2013) estimated that the climate system inertia commitment

Implications for Biodiversity of Potentially Committed Global … 139
Fig. 1 Projected climate change impacts on ecosystems and species according to degrees of globalwarming (vs. pre-industrial) (Image reprinted courtesy of IPCC Climate Change 2007 WorkingGroup II Fig. 4.4, published by Cambridge University Press)
due to the ocean heat lag would be an extra 0.6 °C by 2100 and a full equilibriumwarming commitment of ‘about 2 °C’ long after 2100 (WGI, Chap. 12). This does notaccount for extra warming by carbon feedbacks. Global warming in early 2018 was1.1 °C and atmospheric CO2 was 408 ppm (March 2018 seasonally adjusted meanCO2), which would put today’s committed warming at about 2.08 °C. AtmosphericCO2 is increasing faster than ever. This can only be expected to lead to a collapse ofglobal and regional ecosystem biodiversity. Also, both committed global temperatureincreases (i.e., policy and science) last for a thousand or more years (Solomon et al.2009), over which time many more species will be driven to extinction.
Climate Change Danger Limits
The first estimate for a climate change danger limit was in 1990 and was basedon safety for ecosystems. ‘A maximum sea level rise of between 0.2 and 0.5 mabove the 1990 global sea level’ and ‘a maximum rate of rise of between 20 and50 mm per decade’ were recommended to ‘permit the vast majority of vulnerableecosystems, such as natural wetlands and coral reefs, to adapt’ because ‘beyond thisrate of rise, damage to ecosystems will rise rapidly’ (Rijsberman and Swart 1990). A

140 P. D. Carter
mean global temperature rise limited to a maximum rate of change in temperature of0.1 °C per decade was recommended based on an understanding of the vulnerabilityof ecosystems.
While global temperature increase in 2016was just above 1.0 °C, scientists in 1990believed that ‘temperature increases beyond 1 °Cmay elicit rapid, unpredictable, andnon-linear responses that could lead to extensive ecosystem damage’ (RijsbermanandSwart 1990). Since the 2012UNParisClimateAgreement, the science has treated1.5 °C, rather than 2 °C, as the danger limit.
Rijsberman and Swart (1990) also recommended a maximum CO2-equivalentconcentration of 330–400 ppm in the atmosphere. Yet, atmospheric CO2-equivalentin 2016 was 489 ppm (NOAA 2017), far above ecosystem safety.
Although not so defined in the Paris Agreement, since 2009 the standingequilibrium-warming target has been reduced to a target only by 2100. Climatesystem commitment means that this will be double long after 2100.
Climate Change and Biodiversity Trends
The IPCC assessments, the main source of data and information for this chapter, letus know how much and how long we have known about the global climate changeimpacts to biodiversity. With each succeeding assessment since 1990, the climatechange situation for biodiversity has been found, withmore research, to beworse, notbetter. Furthermore, the uncertainties make the predictable impacts on biodiversityconsiderably worse than published.
Loss of population abundance is a major indicator of biodiversity decline. Thecommitted species extinction rate at increasing degrees of climate change was usedin the IPCC’s fourth assessment (2007). The last World Wide Fund for Nature Liv-ing Planet Report (2016) on species population abundance shows a sustained rapiddecline since 1970. Global biodiversity is declining at an alarming rate. The 2016WWF’s Living Planet Index reveals that global populations of fish, birds, mammals,amphibians and reptiles declined by 58% between 1970 and 2012. We could witnessa two-thirds decline in the half-century from 1970 to 2020—unless we act now toreform our food and energy systems.
In this time of continuing global warming, ecosystems matter a lot to global, aswell as regional, biodiversity and the future survival of most of the world’s species.Some ecosystems hold enormous sources of potential carbon feedback emissionsthat are vulnerable to release by global warming acting upon these ecosystems (IPCC1990). These large vulnerable carbon pools include permafrost, high latitude peat-lands, tropical peatlands and forests subject to fire and/or dieback.
Implications for Biodiversity of Potentially Committed Global … 141
The Worst-Case Scenarios
The IPCC (2014a) projected a global warming by 2100 of up to 7.8 °C when includ-ing climate uncertainty. The worst possible effect of global surface warming on all oflife is an ecosystem change effect of the Arctic releasing wetland and permafrost car-bon. Because global warming will last for over 1000 years (Solomon et al. 2009), wecan expect carbon feedback emissions from the several enormous planetary poolsof carbon. The risk of planetary catastrophic ‘runaway carbon dynamic’ was firstrecognized by the IPCC in the third assessment (2001, 19.6.3.2. Large-Scale Singu-larities). Global energy-related CO2 emissions rose by 1.4% in 2017, for a historichigh of 32.5 Gt. (International Energy Agency 2018). Global emissions and atmo-spheric concentrations are tracking closest to the IPCC worst-case scenario (Saunois2016).
Climate Change and Biodiversity Loss Interaction
Another great concern is the potential amplifying negative interaction between bio-diversity loss and global climate change, where each makes the other worse in anegative synergistic manner for both. Climate change reduces the land carbon sinkthrough its impacts on forests, leaving more CO2 in the atmosphere. Brook et al.(2008) point out that species loss can occur directly and abruptly if habitat destruc-tion or overexploitation of populations is severe. ‘Yet the final descent to extinctionis often driven by synergistic processes (amplifying feedbacks) that can be discon-nected from the original cause of decline.’ They reviewed:
recent observational, experimental and meta-analytic work which together shows that owingto interacting and self-reinforcing processes, estimates of extinction risk for most speciesare more severe than previously recognized. As such, conservation actions which only tar-get single-threat drivers risk being inadequate because of the cascading effects caused byunmanaged synergies. (Brook et al. 2008)
Their paper anticipated that climate change would interact with and accelerate ongo-ing threats to biodiversity, such as habitat degradation, overexploitation and invasivespecies.
This synergistic interaction, taken further by Segan et al. (2016), has to beaccounted for in a general and region-specific manner to plan priorities in conserva-tion, mitigation and adaptation. Adaptation is urgent today but cannot be expectedto be successful for long without concomitant mitigation; a long-held global climatechange principle is that adaptation must be accompanied by mitigation.
The IPCC fourth assessment (2007) said that global extinction is a crucial keyissue ‘because of a very likely link between biodiversity and ecosystem functioning inthe maintenance of ecosystem services.’ Grace et al. (2016) found that communitiesrich in species are substantially healthier and more productive than those depleted of

142 P. D. Carter
species. Here we take the health of ecosystems and biodiversity as one entity called‘ecosystem biodiversity.’
As it is, the current accelerating rate of species extinction is 1000 times the back-ground rate (Pimm et al. 2014). With committed and feedback-accelerated climatechange, this is likely to become the highest rate of any extinction event on Earth,with accelerating losses for every degree rise in global temperatures (Urban 2015).Today’s emissions targets, which substantially increase (rather than decrease) globalemissions by 2030, are bound to make this extinction qualify as the fastest ever. Thispolicy commitment is, to a large extent, avoidable and would be greatly reduced ifgovernments followed the recommendations of the climate and ocean change scien-tists, which is to immediately and rapidly reduce global emissions.
What the IPCC Assessments Say
Based on a 2012 global warming of 0.85 °C, the IPCC’s fifth assessment (2013)estimated a full-equilibrium warming commitment, due to climate system inertia, of‘about 2 °C’ long after 2100. Remember, global warming has already reached justover 1 °C since industrialization.
The IPCC’s third assessment WGII (2001) Summary for Policy Makers(SPM)—which is approved by all world governments—reported emergent findingsthat regional changes in climate, particularly increases in temperature, had alreadyaffected a diverse set of physical and biological systems in many parts of the world,with associations between changes in regional temperatures and observed changes inphysical and biological systems documented in many aquatic, terrestrial, and marineenvironments.
The IPCC fourth assessment’s WGII (2007) SPM reported with high confidencethat recent warmingwas strongly affecting terrestrial biological systems and changesin freshwater and marine biological systems, with declining oxygen levels and cir-culation. Approximately 20–30% of plant and animal species assessed were foundto be at additional increased risk of extinction above 1.5–2.5 °C. For increases inglobal average temperature exceeding 1.5–2.5 °C and in concomitant atmosphericcarbon dioxide concentrations, there are projected to be major changes in ecosystemstructure and function, species’ ecological interactions, and species’ geographicalranges, with predominantly negative consequences for biodiversity.
The IPCC fourth assessment provided a graph (see Fig. 1) ofmore specific ecosys-tem and species impacts (IPCC 2007, WGII Fig. 4.4). Line B1 is the temperatureincrease at constant atmospheric concentrations from 2100 up to committedwarmingby 2300. Degrees of warming would be treated as committed for policy relevance.These impact on top of ongoing global ecosystem degradations.
For an in-depth projection of ecosystem impacts, see the IPCC fourth assessment’s(2007) WGII Table 4.1. Their extinction projections relied largely on Thomas et al.(2004), a paper that remains very important, as it is rich with information on globalclimate change and biodiversity. The topic has been revisited and the Thomas projec-

Implications for Biodiversity of Potentially Committed Global … 143
tions in general confirmed. The Thomas et al. projections include a high-emissionsclimate change scenario, the latter being the closest to that which the world is nowtracking. The paper draws several crucial conclusions:
Minimum expected (that is, inevitable) climate-change scenarios for 2050 produce fewerprojected ‘committed extinctions’ by about half of those predicted under maximum expectedclimate change. These scenarios would diverge even more by 2100. Returning to near pre-industrial global temperatures as quickly as possible could prevent much of the projected,but slower acting, climate-related extinction from being realized. (Thomas et al. 2004)
This is a call for the immediate global decline of emissions, as in the IPCC fifthassessment (2014a) WGIII best-case scenario.
A big point of the Thomas et al. (2004) paper was that by 2050, global climatechange could take over from direct habitat change as the main cause of specialextinctions and biodiversity loss. The worst case was a committed 58% of all speciesby 2050 by climate change alone. The paper estimated that an additional 34% of alloriginal species would be committed to extinction due to habitat destruction from2000 to 2050. The paper adds that extinction risks might be even higher taking otherfactors into account.
One of the worst possible outcomes for biodiversity is synergy between globalclimate change and the other non-climate change impacts,where the combined effectsof multiple stressors are greater than the sum of individual effects. Assessments haveassumed thatmultiple stressors lead to cumulative linear effects,with little interactionamong threats considered. Findings serve as a reminder that these assessments shouldseriously consider the potential synergy of multiple threats interacting; Fortini andDye (2017) indicate the seriousness of ‘potential synergisms and compounding threatinteractions, especially with stressors that are as complex as climate change.’
It is important to realize that because of commitment, to prevent an impact pro-jected to occur at, for example, 3 °C, global warming must be limited to 1.5 °C dueto total climate system inertia.
The IPCC’s (2014a) fifth assessment is grim for the future of biodiversity andspecies:
A large fraction of both terrestrial and freshwater species faces increased extinction risk underprojected climate change during and beyond the 21st century, especially as climate changeinteracts with other stressors, such as habitat modification, over-exploitation, pollution, andinvasive species (high confidence). (IPCC 2014a)
Extinction risk is increased under all IPCC (2014a) RCP (representative carbonpathway) scenarios, with risk increasing with both magnitude and rate of climatechange. The IPCC (2014b) graphic below (Fig. 2) shows projected impacts on biodi-versity.Warming and impacts are only up to 2100. As shown in Fig. 2, the assessmentsaid that many species will be unable to track suitable climates under all scenariosexcept the best case (RCP2.6) this century. Those that cannot adapt sufficiently fastwill decrease in abundance or go extinct in some or all of their ranges, with largelosses of biodiversity.
The IPCC (2014a) assessment shows the velocity capacity of species comparedto the rate of climate change. It shows that above the RCP2.6 best-case emissions

144 P. D. Carter
Fig. 2 Projected impacts on ecosystems and species (Image reprinted courtesy of IPCC ClimateChange 2014 Synthesis Report Fig. 2.5, published online by IPCC, Geneva, Switzerland)
scenario, which causes the slowest rate of climate change, most trees and herbaceousplants cannot keep up with climate change, leading to an extremely high risk ofterrestrial extinctions in general. As the best-case emissions scenario, RCP2.6 is theonly scenario not above 2 °C by 2100; it is an increase of 1.6 °C from pre-industrial.
According to the IPCC’s fifth assessment (2014b) Synthesis Report, continuedemission of greenhouse gases increases ‘the likelihood of severe, pervasive and irre-versible impacts for people and ecosystems.’ Furthermore, ‘many aspects of climatechange and associated impacts will continue for centuries, even if anthropogenicemissions of greenhouse gases are stopped. […] The risks of abrupt or irreversiblechanges increase as the magnitude of the warming increases.’
The IPCC (2014a) assessment predicted that within this century, magnitudes andrates of climate change associated with all but the best-case emissions scenario(immediate global decline) pose high risk of abrupt and irreversible impacts onterrestrial and freshwater ecosystems, including wetlands. These impacts include thepotential of ecosystems to become a source of feedback carbon emissions. Examplesthat could lead to such substantial impacts on climate are the boreal-tundra Arcticsystem and the Amazon forest. Carbon stored in the terrestrial biosphere (e.g., inpeatlands, permafrost, and forests) is susceptible to loss to the atmosphere. Increasedtreemortality and associated forest dieback are projected to occur inmany regions thiscentury, due to increased temperatures and drought. Feedback from forest diebackposes risks to carbon storage and biodiversity. Indeed, forest dieback has alreadystarted,with the IPCC (2014a) reporting that ‘extensive treemortality andwidespreadforest dieback linked to drought and temperature stress have been documented onall vegetated continents.’ This includes the great Amazon and Boreal forests.
Implications for Biodiversity of Potentially Committed Global … 145
The forests of the Amazon Basin are being altered through severe droughts, land use (defor-estation, logging), and increased frequencies of forest fire. Some of these processes areself-reinforcing through positive feedbacks, and create the potential for a large-scale tippingpoint. […] Climate change contributes to this tipping point by increasing drought severity,reducing rainfall, and raising air temperatures. (IPCC 2014a, Fig. 4.8)
In 2017, the first-ever global database of trees (by Beech et al. 2017) revealed thatout of 60,065 total, 9600 tree species are threatenedwith extinction.Adding that threatto so much actual tree mortality and forest dieback makes the impact on biodiversityin general very clear. [The IPCC (2014a) assessment of species extinctions goes onlyup to 2100, which does not constitute total committed extinctions since warming iscommitted to substantially increase after 2100.]
The fact that trees and herbaceous plants are unable to keep up with the rate ofclimate change equivalent to a global warming of 1.6 °C by 2100 is of enormousconcern because of a domino effect: a plant extinction impacts many animals. Cas-cading biodiversity loss as a result of climate change originates mostly from plantspecies and is indirectly transferred to animal species. Therefore, climate change hasan even greater negative effect on the biodiversity of animals through losses of plantsand trees (Schleuning et al. 2016). Kew’s (2016) State of the World’s Plants 2016estimated that 1 in 5 plants are threatened with extinction.
Coastal biodiversity is high. But according to the IPCC fifth assessment (2014a),coastal biodiversity is threatened by sea level rise and eutrophication-driven deoxy-genation. Figure 2 shows that impacts have started.
Ocean biodiversity is severely threatened by the combination of deep open oceanheating, deoxygenation and acidification. These are all accelerating—with oceanheating going deeper—and the IPCC (2014a) says that they are predicted to combinesynergistically, creating a situation with the potential for ocean biodiversity collapse,which alone would be a calamity for life on land.
Marine species are being impacted by ocean acidification and warming extremes(IPCC 2014a). The progressive acidification of oceans due to increasing atmosphericcarbon dioxide is expected to have negative impacts on marine shell-forming organ-isms (e.g., corals) and their dependent species. As Fig. 2 shows, already someforaminifera and pteropods are being affected. At an acidification with a global sur-face warming of 1.6 °C, 20–50% of corals, echinoderms and mollusks are affected.At a global warming of 2.4 °C, vulnerable taxa are increasingly affected and warmwater coral reefs are marginalized.
There is little to no effective adaptation available for ocean ecosystems and species(IPCC 2014a, SPM Box 2 Table 1). For all emissions scenarios except the best-caseimmediate global emissions reduction scenario, ocean acidification poses substantialrisks to marine ecosystems, associated with impacts on the physiology, behaviour,and population dynamics of individual species from phytoplankton to animals:
Ocean acidification acts together with other global changes (e.g., warming, decreasing oxy-gen levels) and with local changes (e.g., pollution, eutrophication). Simultaneous drivers,such as warming and ocean acidification, can lead to interactive, complex, and amplifiedimpacts for species and ecosystems. (IPCC 2014a, WGII SPM)

146 P. D. Carter
Coral reefs worldwide would seem committed to extinction at a 2 °C globalwarming plus acidification. To protect at least 50% of the coral reef cells, globalmean temperature change would have to be limited to 1.2 °C (1.1–1.4 °C), not takingocean acidification effects into account (Frieler et al. 2013).
From 1910 to 2010, there is a recorded 70% decline in ocean biomass and fishstocks (IPCC 2014a). The progressive expansion of oxygen minimum zones andanoxic ‘dead zones’ is projected to further constrain fish habitat. Open-ocean netprimary production is projected to redistribute and to fall this century globally underall RCP scenarios. Climate change adds to the threats of over-fishing and other non-climatic stressors (IPCC 2014a).
Finally, new research shows that the phenomenon of interspecies mismatch-ing/mistiming, another huge climate change concern, is now happening (Kharoubaet al. 2018), adding a further devastating layer to climate change impacts on biodi-versity.
Limitations of the Chapter
The climate change projections applied in this paper are medians that do not accountfor higher climate sensitivities at higher warming, nor extra emissions from largesources of carbon feedback emissions. Uncertainties including abrupt changes andtipping points are not applied in IPCC warming projections. Interactions of multi-ple adverse climate change impacts on species and interspecies interactions are notquantified. The IPCC (2014a) mentions that ancillary stresses on species due to over-harvesting, habitat destruction, landscape fragmentation, alien species invasions, andfire regime change are not accounted for in projections on species. It also notes underuncertainties that capacity for, and limits to, ecological adaptive processes are knownonly in a few cases and tipping points remain a major source of uncertainty with highpotential consequences.
For a standard environmental health risk assessment, the approach could be furtherdeveloped with current near worst-case emissions scenarios and worst-case rangesof projections.
Conclusions and Recommendations
Due to climate system inertia, theworld is in a committed biodiversity loss emergencyaffecting both land and oceans. The global aggregate of national emissions policiescommits (indeed, condemns) the world to a future global biodiversity collapse. Thenow recommended global warming limit of 1.5 °C, on top of the 6th mass extinction,is still deadly for global biodiversity. It is important to keep in mind that in theIPCC (2014a) projections, climate system commitment is 2 °C equilibrium warming
Implications for Biodiversity of Potentially Committed Global … 147
and policy commitment is over 3 °C by 2100, which is a full policy equilibriumcommitment of over 6 °C after 2100.
The imperative now is mitigating catastrophic global climate change impacts toecosystems andbiodiversity. Frommultiple lines of evidence,we see that this requiresthe immediate and rapid decline of global greenhouse gas emissions, reaching nearzero within decades. This depends on achieving some form of safe removal andsequestration of some atmospheric CO2,which, for the sake of biodiversity, definitelycannot be biomass energy (burning) with carbon capture and sequestration (BECCS).
The imperative of near-zero emissions by mid-century requires ending fossil fuelsubsidies fast; ending deforestation and deforestation-driving government subsidies;and charging central fossil fuel producers the full environmental and social costs oftheir pollution.
Clearly, the imperative is also for a massive global upgrade of conservation (pro-tecting huge swathes of theworld’s land and oceans, as suggested in the proposed planof E. O. Wilson in 2016 to protect half of the Earth’s land and oceans) and attemptsat assisted ecosystem adaptation, with priority on global biodiversity hotspots. Thiswill require massive injections of funding for the necessary research, conservation,and adaptation.
The effective measures for ecosystem adaptations are essentially the same as formitigation, that is, large expansion of protected areas and termination of deforesta-tion. The strategies of coastal afforestation, watershedmanagement, andmaintainingwetlands and urban green space (IPCC 2014a, Table SPM.1) will only be successfulif they accompany the most aggressive global climate change mitigation measurespossible.
Mitigation of both climate change and biodiversity loss is, in theory, achievable,with large countervailing benefits to human populations and the future of humanity.No more research is required to know that these must happen. There are well knownsolutions, but now they really do need to happen with urgency, because committedglobal climate change gives us—and all species—no more time to act.
References
Beech E, Rivers M, Oldfield S, Smith PP (2017) GlobalTreeSearch: the first complete globaldatabase of tree species and country distributions. J Sustain For 36(5):454–489
BrookBW, SodhiNS, BradshawCJ (2008) Synergies among extinction drivers under global change.Trends Ecol Evol 23(8):453–460
Ceballos G, Ehrlich PR, Barnosky AD, García A, Pringle RM, Palmer TM (2015) Acceleratedmodern human-induced species losses: entering the sixthmass extinction. Sci Adv 1(5):e1400253
CeballosG,EhrlichPR,DirzoR (2017)Biological annihilation via the ongoing sixthmass extinctionsignaled by vertebrate population losses and declines. Proc Natl Acad Sci 114(30):E6089–E6096
Climate Action Tracker (2017) Effect of current pledges and policies on global temperature. Con-sortium of Climate Analytics, NewClimate Institute and Ecofys. http://www.climateactiontracker.org/global
Fortini LB, Dye K (2017) At a global scale, do climate change threatened species also face a greaternumber of non-climatic threats? Glob Ecol Conserv 11:207–212

148 P. D. Carter
Frieler K, Meinshausen M, Golly A, Mengel M, Lebek K, Donner SD, Hoegh-Guldberg O (2013)Limiting global warming to 2 °C is unlikely to save most coral reefs. Nat Clim Change 3:165–170
Grace JB, Anderson TM, Seabloom EW, Borer ET, Adler PB, Harpole WS, Hautier Y, HillebrandH, Lind EM, Pärtel M, Bakker JD (2016) Integrative modelling reveals mechanisms linkingproductivity and plant species richness. Nature 529(7586):390
Intergovernmental Panel on Climate Change (IPCC) (1990) Climate change the IPCC impactsassessment. TegartWJMcG, SheldonGW,Griffiths DC (eds). AustralianGovernment PublishingService, Canberra
IPCC (2001) Vulnerability to climate change and reasons for concern: a synthesis. In: Smith JB,Schellnhuber H-J, Mirza MMQ (eds) Contribution of working group II to the third assessmentreport of the Intergovernmental Panel on Climate Change. Cambridge University Press, Cam-bridge
IPCC (2007) Contribution of working group II to the fourth assessment report of the Intergov-ernmental Panel on Climate Change. Parry ML, Canziani OF, Palutikof JP, van der Linden PJ,Hanson CE (eds). Cambridge University Press, Cambridge
IPCC (2013) The physical science basis: working group I contribution to the fifth assessment reportof the Intergovernmental Panel on Climate Change. Stocker TF, Qin D, Gian-Kasper PlattnerG-K, Tignor MMB, Allen SK (eds). Cambridge University Press, Cambridge
IPCC (2014a)Working group II contribution to the fifth assessment report of the IntergovernmentalPanel on Climate Change. Field CB, Barros VR, Dokken DJ, Mach KJ, Mastrandrea MD (eds).Cambridge University Press, Cambridge
IPCC (2014b) Climate change 2014: synthesis report. Contribution of working groups I, II and IIIto the fifth assessment report of the Intergovernmental Panel on Climate Change. [Core WritingTeam, Pachauri RK, Meyer LA (eds)]. IPCC, Geneva, 151 pp
International Energy Agency (2018) Global Energy & CO2 Status Report 2017. https://www.iea.org/publications/freepublications/publication/GECO2017.pdf
KewRB (2016)The state of theworld’s plants report–2016.RoyalBotanicGardens,Kew,RichmondKharouba HM, Ehrlén J, Gelman A, Bolmgren K, Allen JM, Travers SE, Wolkovich EM (2018)Global shifts in the phenological synchrony of species interactions over recent decades. Proc NatlAcad Sci 11:201714511
Leakey RE, Lewin R (1996) The sixth extinction: patterns of life and the future of humankind.Anchor Press, New York
NationalOceanic andAtmosphericAdministration (NOAA) (2017)TheNOAAAnnualGreenhouseGas Index (AGGI). Butler JH & Montzka SA (eds). NOAA Earth System Research Laboratory,Boulder. https://www.esrl.noaa.gov/gmd/aggi/aggi.html
National Research Council (2011) Climate stabilization targets: emissions, concentrations, andimpacts over decades to millennia. National Academies Press, Washington, DC
National Research Council (2013) Abrupt impacts of climate change: anticipating surprises.National Academies Press, Washington, DC
Pimm SL, Jenkins CN, Abell R, Brooks TM, Gittleman JL, Joppa LN, Raven PH, Roberts CM,Sexton JO (2014) The biodiversity of species and their rates of extinction, distribution, andprotection. Sci J 344(6187):1246752
Rijsberman FR, Swart RJ (eds) (1990) Targets and indicators of climate change: report of workinggroup II of the advisory group on greenhouse gases. Stockholm Environment Institute. http://www.sei.org/publications/climatic-change-indicators/
Saunois M (2016) The growing role of methane in anthropogenic climate change. Environ Res Lett11:120207
Schleuning M, Fründ J, Hof C et al (2016) Ecological networks are more sensitive to plant than toanimal extinction under climate change. Nat Commun 7:13965
Segan DB, Murray KA, Watson JE (2016) A global assessment of current and future biodiversityvulnerability to habitat loss—climate change interactions. Glob Ecol Conserv 5:12–21
Solomon S, Plattner GK,Knutti R, Friedlingstein P (2009) Irreversible climate change due to carbondioxide emissions. Proc Natl Acad Sci 106(6):1704–1709

Implications for Biodiversity of Potentially Committed Global … 149
Sutter JD (2016) How to stop the sixth mass extinction. CNN: https://edition.cnn.com/2016/12/12/world/sutter-vanishing-help/index.html
Thomas CD, Cameron A, Green RE, Bakkenes M, Beaumont LJ, Collingham YC, Erasmus BF,De Siqueira MF, Grainger A, Hannah L, Hughes L (2004) Extinction risk from climate change.Nature 427(6970):145
United Nations Climate Change Secretariat (1992) UN Framework Convention on Climate Change(UNFCCC)
United Nations Climate Change Secretariat (2016) Aggregate effect of the intended nation-ally determined contributions: an update. Synthesis report by the secretariat. United NationsFCCC/CP/2015/7. https://unfccc.int/documents/9176
Urban MC (2015) Accelerating extinction risk from climate change. Science 348(6234):571–573Wilson EO (2016) Half-earth: our planet’s fight for life. https://eowilsonfoundation.org/half-earth-our-planet-s-fight-for-life/
World Wide Fund for Nature (2016) Living planet report. WWF, Gland. http://wwf.panda.org/about_our_earth/all_publications/lpr_2016/

Ensuring Co-benefits for Biodiversity,Climate Change and SustainableDevelopment
Risa Smith, Oscar Guevara, Lauren Wenzel, Nigel Dudley,Valeria Petrone-Mendoza, Martin Cadena and Andrew Rhodes
Abstract Significant investments are required by Parties to the three Rio Conven-tions—Convention on Biological Diversity (CBD), the United Nations FrameworkConvention on Climate Change (UNFCCC) and the United Nations Convention toCombat Desertification (UNCCD), as well as the United Nations 2030 Agenda forSustainable Development (2030 Agenda), to meet the ambitious goals that countrieshave agreed to. When the development of national and subnational frameworks tomeet global commitments are conducted in isolation, the opportunity is lost to: (1)
R. Smith (B)IUCN, World Commission on Protected Areas (WCPA), Galiano Island, Canadae-mail: [email protected]
O. GuevaraWWF, Bogotá, Colombiae-mail: [email protected]
O. GuevaraIUCN, World Commission on Protected Areas (WCPA), Gland, Switzerland
L. WenzelIUCN, World Commission on Protected Areas, Silver Spring, USAe-mail: [email protected]
N. DudleyEquilibrium Research, Gland, Switzerlande-mail: [email protected]
N. DudleySchool of Earth and Environmental Sciences, University of Queensland, Brisbane, Australia
V. Petrone-MendozaComisión Nacional de Áreas Naturales Protegidas, Mexico City, Mexicoe-mail: [email protected]
M. CadenaUNDP, Mexico City, Mexicoe-mail: [email protected]
A. RhodesPronatura Mexico, Mexico City, Mexicoe-mail: [email protected]
© Springer Nature Switzerland AG 2019W. Leal Filho et al. (eds.), Handbook of Climate Change and Biodiversity,Climate Change Management, https://doi.org/10.1007/978-3-319-98681-4_9
151

152 R. Smith et al.
leverage co-benefits from the same investment; (2) use resources more efficiently;and (3) ensure that one action does not negatively affect another policy priority. Forexample, investments in greenhouse gas reduction have the potential either to pos-itively impact biodiversity and sustainable development, or to result in unintendednegative consequences; chances of positive synergies are greatly increased by coop-eration and joint policy, planning and implementation. The challenge now is to learnlessons from the vast and diverse number of approaches being tried around the worldand to enhance co-benefits. This paper describes the major inter-linkages betweenglobal commitments for conservation and development. It demonstrates the impor-tance of enhancing synergies among global agreements and avoiding unintended andnegative consequences, particularly on biodiversity, by providing examples of bestpractices and describing some of the pitfalls that occur when implementation of oneagreement does not explicitly seek to enhance co-benefits with other agreements. Inconclusion, the paper presents the case for the central role of nature-based solutionsin simultaneously attaining global commitments for biodiversity, climate change andsustainable development.
Introduction
The world is at cross-roads with the convergence of several crises: catastrophicclimate change, the sixth mass biodiversity extinction event, land degradation on amassive scale (Ripple et al. 2017) and increasing economic inequality in spite of areduction in extreme poverty (World Bank 2016). Despite bold global commitments,and some specific successes, progress on all of these issues has been too little andtoo slow.
The United Nations Convention on Biological Diversity (CBD), FrameworkConvention on Climate Change (UNFCCC), Convention to Combat Desertification(UNCCD) and the 2030 Sustainable Development Agenda and its associated Sus-tainable Development Goals (SDGs), all recognize, in various decisions, the inter-linkages between their agreements and the benefits of co-implementation. Whilecommitments have been made to enhance synergies, co-implementation has provento be difficult in practice and negative impacts on biodiversity in particular, fromimplementation of other priorities, frequently occurs.
The cost of fully implementing the Aichi Biodiversity Targets of the CBD, theParis Agreement of the UNFCCC, the SDGs and the UNCCD’s target of land degra-dation neutrality (LDN) is estimated at hundreds of billions of dollars per year until2030 (CBD High-Level Panel 2014; Stern 2015; Schmidt-Traub 2015). The sheerscale of investment required is argument enough to ensure that progress towards onegoal does not hamper progress towards another. Add to that the inter-relatednessof these goals and enhanced effectiveness and efficiency that could be gained fromworking in concert across issues, and the need to develop ways for effective co-
Ensuring Co-Benefits for Biodiversity, Climate Change … 153
implementation becomes obvious (Science for Environmental Policy 2015; Cadenaet al. 2017; Quéré et al. 2014; Executive Secretary of Convention on BiologicalDiversity 2017; Schultz et al. 2016; Steiner 2017). Despite some notable exceptions,and efforts at the global level, there is little consistency or cross-referencing betweenglobal goals (Bodin and Santamari 2016). Potential approaches have been proposed,including enhancing resilience thinking (Cadena et al. 2017; Schultz et al. 2016), theecosystem approach (Bodin and Santamari 2016; Epple et al. 2016), the landscapeapproach (Sayer et al. 2013), landscape management (Peterson 2011) adaptive man-agement (Epple et al. 2016), ecosystem-based adaptation (Herr and Landis 2016) andusing the CBD’s National Biodiversity Strategies and Action Plans as mechanismsto foster integrated thinking (Cadena et al. 2017; Executive Secretary of Conventionon Biological Diversity 2017). Even from the perspective of climate change goalsalone, taking an integrated approach is essential, including for enhancement of car-bon sinks in terrestrial and coastal sectors (IPCC 2014) and placement of renewableenergy infrastructure (Science forEnvironmental Policy 2015).Yet at the national andregional levels there are relatively few successful examples of attaining co-benefits.
Many countries and organizations have already emphasized the importance oftaking measures that maximize synergies among global goals and minimize negativeimpacts and externalities (Bodin and Santamari 2016) [i.e. tackling Aichi Biodi-versity Targets on protected areas and ecosystem degradation and specific Sustain-able Development Goals (Brooks et al. 2015)]. These provide valuable principles toguide countries towards co-implementation and co-measurements of success. Theneed now is to go beyond principles and to develop the capacity and concrete toolsfor making decisions that enhance implementation of global commitments, at dif-ferent scales, without creating undesirable impacts and unnecessary trade-offs. As2020 approaches, and progress towards biodiversity, climate change and sustainabledevelopment goals are assessed, the importance of turning principles into concretedecision-making tools has become urgent.
In this paper, we analyze—through different approaches—major convergencepoints between the Rio-Conventions and the 2030 Agenda, exploring entry pointsthat can be useful to regional, national and subnational efforts to increase co-implementation and avoid potential trade-offs.
Biodiversity and Nature-Based Solutions to Climate ChangeMitigation
1. Terrestrial Ecosystems
To keep global temperature rise this centurywell below 2 °C, relative to pre-industriallevels, emissions of greenhouse gases into the atmosphere must be reduced by50–70% by 2050 and to zero by 2100 (IPCC 2014). Several actions will have to betaken simultaneously: (i) reduction and eventual phase-out of fossil fuels; (ii) reduc-

154 R. Smith et al.
tion of emissions from land use and land use change; (iii) removal of carbon dioxidefrom the atmosphere (The Economist 2017; Rockström et al. 2017; IPCC 2014);and (iv) maintenance of natural carbon sinks and storage (Rockström et al. 2017).Recognizing that Land Use, Land-Use Change and Forestry (LULUCF) accountfor approximately 24% of total greenhouse gas emissions—almost equivalent toenergy and heat production (25%) and more than transportation (16%) or industrialactivity (21%) (Thompson 2014)—the Paris Agreement on Climate acknowledgesthat nature-based solutions will play an important role in reducing greenhouse gasemissions (see Article 5, UNFCCC 2015). The necessity of this approach has beenreinforced by the International Declaration on Nature-Based Solutions for WaterManagement Under Climate Change (Marrakech Partnership et al. 2017), the RED-PARQUESDeclaration (REDPARQUES 2015b), the inclusion of nature-based solu-tions in some—albeit only a few—Nationally Determined Contributions (NDCs) toclimate change (Laurans et al. 2016) and in the scientific literature (Rockström et al.2017). According to some estimates, nature-based solutions to climate change, suchas restoration of forests, wetlands, grasslands and agricultural lands, afforestationand protection of ecosystems that are currently sequestering and storing carbon,could reduce greenhouse gas emissions by as much as 37% by 2030 (Griscom et al.2017). In the interest of advancing an integrated approach the CBD, at its thirteenthConference of the Parties, expanded the sectors in which it intends to mainstreambiodiversity to include energy and mining, manufacturing, processing and healthsectors (CBD 2016).
One important feature of nature-based solutions to climate change mitigation isthat LULUCF can reverse the negative impacts of past activities (UNFCCC 2014).Carbon stocks in forest biomass decreased by an estimated 0.22 Gt annually from2011–2015, mainly because of a reduction in forest area. Through better forest man-agement, forest restoration and afforestation these losses can be reversed.
Brazil’s NDC to the Paris Agreement provides an example of how nature-basedsolutions can be integrated into climate change mitigation. Brazil aims to reducegreenhouse gas emissions by 37% below 2005 levels by 2025, through the imple-mentation of policies that also build resilience of populations, ecosystems, infrastruc-ture and production systems, by reducing vulnerability, and through the provision ofecosystem services [Federative Republic of Brazil (FRB) 2016].
2. Marine Ecosystems
Oceans, including coastal ecosystems, have sequestered approximately 30% of thecarbon dioxide in the atmosphere since pre-industrial times (Thompson 2014). Bluecarbon—the carbon stored in mangroves, salt marshes and seagrasses—is a majorcarbon sink, covering less than 20% of the total ocean area, but accounting forapproximately half of the total carbon sequestered and stored in marine sediments.These habitats are found on every continent except Antarctica and combined cover49 million hectares (The Blue Carbon Initiative 2017).
The role of coastal ecosystems in climate change mitigation is better understoodthan open ocean ecosystems, and is often included in calculations of the impor-tance of ecosystems in climate change mitigation (Duarte et al. 2013; Roberts et al.
Ensuring Co-Benefits for Biodiversity, Climate Change … 155
2017; Epple et al. 2016). For example, the loss of vegetated marine habitats, such asseagrasses, salt-marshes, macro-algae and mangroves is estimated to result in a netemission of 1GtCO2 per year (Duarte et al. 2013). This compares to the 4.9Gt annualemissions from land use change, including forestry (Griscom et al. 2017). IUCN esti-mates that if half of the annual coastal wetlands loss was halted, emissions wouldbe reduced by a 0.23 Gt CO2 per year (Herr and Landis 2016)—equivalent to tak-ing 50,000 cars off the road (calculated from US Environmental Protection Agency2017). Although the potential for forest activity to sequester carbon is greater than forcoastal marine habitats, the coastal marine habitats provide a significant contributionand their importance to biodiversity is equal to that of forests (Duarte et al. 2013;Herr and Landis 2016).
As of 2016 only 28 countries had included coastal wetlands as part of their NDCsfor climate change mitigation, most of which specifically refer to mangrove protec-tion, conservation and restoration. More widespread inclusion of coastal wetlandsin NDCs would have significant co-benefits for both biodiversity and sustainabledevelopment (Herr and Landis 2016).
Ocean acidification is increasingly recognized as a carbon-driven problem threat-ening ocean foodwebs, food security and livelihoods. Since the industrial revolution,the acidity of ocean water has increased by about 30%, potentially threatening shell-building marine life, including phyto- and zoo-plankton, which are the base of themarine food web (PacificMarine Environmental Laboratory Carbon Program 2017).The need to reduce ocean acidification is prominent in both the SDGs and the AichiBiodiversity Targets, further highlighting the need to integrate efforts.
Marine protected areas (MPAs) can enhance the ability of the oceans to sequestermore carbonwithout increasing ocean acidification andwithout negatively impactingmarine species. There are twomechanisms bywhich this can occur. First, fish excreteammonia or ammonium through their gills, making the most bioavailable form ofnitrogen available to primary producers, which in turn sequester CO2 from the atmo-sphere. Enhanced fish populations, which are protected from overfishing in MPAs,will make more nitrogen available, resulting in increased primary productivity. Thiseffect can be significant. One study showed that nitrogen cycling can be enhancedby four to fivefold in unfished sites compared to fished sites. The second mechanismby which marine systems can increase carbon sequestration is just beginning to bebetter understood. Fish are known to affect the marine inorganic carbon cycle bycalcifying carbon in their guts and excreting carbonate [i.e. calcified carbon], muchof which ends up as stored carbon in marine sediments. However, information islacking on several aspects of this process, making it difficult to determine its overallcontribution to removal of atmospheric CO2 (Roberts et al. 2017).
Just as deforestation results in CO2 emissions to the atmosphere, activities thatdisturb the ocean floor, such as bottom trawling and seabed mining, can readilyremobilize stored CO2 with unknown consequences to the marine carbon cycle.MPAs have the potential to serve as a valuable tool to manage these impacts.
All nature-based solutions to reduce greenhouse gases emissions and improvecarbon sequestration can have an impact on biodiversity and on the livelihoods andwell-being of people who depend on biodiversity. There is no magic, one-size-fits-all
156 R. Smith et al.
tool that will ensure that decisions to meet one goal do not have a negative impacton others. At the project assessment level, a decision-screen that weighs impact andmaximizes all benefits is needed.
The Relationship Between Biodiversity and the SustainableDevelopment Goals
Biodiversity is relevant to all SDGs, including those that do not directly reflect theAichi Biodiversity Targets. An overview of the importance of the 2030 Agenda forSustainable Development, and associated SDGs, as an enabling environment for theachievement of the Aichi Biodiversity Targets has been provided by the Conventionon Biological Diversity (Executive Secretary of Convention on Biological Diversity2017; Schultz et al. 2016). Briefly, achieving the SDGs addresses the drivers ofbiodiversity loss, builds the institutional capacity for governing biodiversity andaids in mainstreaming biodiversity through recognition of the ecosystem servicesprovided by biodiversity (Schultz et al. 2016). Aware of the strong links between theSDGs and the Aichi Biodiversity Targets, the 13th Conference of the Parties (COP13) to the CBD decided that Parties and all relevant stakeholders should integrateand mainstream biodiversity into implementation of the SDGs.
The Relationship Between Land Degradation Neutralityand Other Biodiversity and Climate Targets
The UNCCD has made land degradation neutrality [LDN] the central focus of itsglobal strategy, recognizing the health of the land as a unifying theme that influencesbiodiversity, human livelihoods and climate change in equal measure. The SDGsexplicitly support attainment ofLDNinSDG15.3, to: “combat desertification, restoredegraded land and soil, including land affected by desertification, drought and floods,and strive to achieve a land degradation neutral world”. Attaining LDN impliesa drastic reduction in land use change such as deforestation and loss of naturalgrasslands, which in turn has positive impacts on climate change mitigation andbiodiversity conservation.
Mitigating Climate Change, Safeguarding Biodiversity,Reducing Land Degradation and Supporting SustainableDevelopment Goals
1. Spatial Planning

Ensuring Co-Benefits for Biodiversity, Climate Change … 157
Spatial planning—on both land and in the ocean—is the first step to enable inte-grated thinking across a landscape. There are good examples of how spatial plan-ning can work for safeguarding or enhancing biodiversity, mitigating climate changeand taking into account sustainable development. Several European countries haveimplemented a project screen for renewable energy projects inwhich sensitivitymap-ping locates important biodiversity areas, including protected areas, and avoids thesewhen locating wind or solar energy infrastructure (Science for Environmental Policy2015). German law prevents the siting of renewable energy infrastructure at locationsthat conflict with conservation goals (Peschel 2010). In response, the German SolarIndustry Association, in conjunction with the German Society for Nature Conser-vation, has drawn up criteria to guide nature-friendly solar development (Peschel2010). Solar photovoltaic arrays and wind installations—both of which are impor-tant for reducing fossil fuel use—are situated to avoid protected areas and carbonsequestering ecosystems, retain trees and hedges, avoid disturbance of birds and batsduring breeding season and surrounding vegetation is managed for the benefits ofwildlife.
South Africa has taken a landscape approach in which sensitivity mapping, at var-ious scales, identifies protected areas, endangered ecosystems and ecological supportareas needed to maintain resilient ecosystem services. This spatial mapping allowsfor the identification of appropriate areas for production, development and conser-vation, thus implementing CBD, UNCCD, UNFCCC and the SDG goals, with onecomprehensive process (Peterson 2011).
Supported by spatial mapping, several tools are available to facilitate decisionsthat provide multiple benefits. At a global or national scale, Key Biodiversity Areas(KBAs) are “sites contributing significantly to the global persistence of biodiversity”and therefore help to plan development in ways that minimize negative impacts onbiodiversity (IUCN 2016a). Similarly, the identification of High Conservation ValueAreas (HCVA) is a tool widely used in landscape mapping, conservation and naturalresource planning and advocacy. Its six values cover environmental and social priori-ties shared by awide range of stakeholders (Senior et al. 2015). Themanygap analysistools available, such as the USGSGap Analysis Program (USGS 2017), help to max-imize the effectiveness of protected area networks by locating protected areas in themost suitable locations for multiple benefits. IUCN has developed a framework forcountries to rapidly identify areas suitable for forest landscape restoration—Restora-tion Opportunities Assessment Methodology (ROAM). This tool allows for optimiz-ing positive impacts of land use transitions on key ecosystem services, includingcarbon sequestration, the provision of hydrological services, water yield and sedi-ment retention and nutrient retention (IUCN 2016b).
It is important to note that spatial planning is somewhat controversial becauseits use can make trade-offs among different values and sectors more immediate andtangible. For this reason, it is essential to build in robust stakeholder and publicparticipation into planning processes.
2. Land and Freshwater Management

158 R. Smith et al.
Once spatial planning has identified current land and water use, and made proposalsabout future uses, many land management tools are available to protect multiplevalues across a landscape.
ProtectedAreas andOther Effective Area-BasedConservationMechanisms (OECM)
The pivotal role that connected, well-funded, well-managed protected areas play insupporting not only biodiversity goals, but also sustainable development and climatechange goals, is increasingly recognized (Nature Needs Half 2017; Ripple et al.2017; REDPARQUES 2015a; Dudley et al. 2010, 2014, 2017; Secretariat of theConvention on Biological Diversity 2016). About 312 Gt of CO2 are stored in theworld’s protected area network, equivalent to 15% of the world’s terrestrial carbonstock (Dudley et al. 2010).
Emerging information supports the benefits of well-planned and managed pro-tected areas in implementation of the SDGs. For example, inCostaRica andThailand,districts adjacent to protected areas experience 10 and 30% less poverty, respectively,than districts without protected areas (Turner et al. 2012). The natural ecosystemsmaintained by protected areas contribute to a range of ecosystem services, includingfood and water security, disaster risk reduction and health and recreational servicesand the economic values of these are increasingly being recognized.
REDPARQUES (Latin American Technical Cooperation Network on NationalParks, and other Protected Areas and Wildlife) is a unique network of protected areaagencies that seeks to improve the management of national parks and other protectedareas through technical cooperation and the exchange of knowledge and experienceamong its 19 member countries. One of the unique elements of REDPARQUES isthat it has expanded recognition of the importance of protected areas in mitigationof and adaptation to climate change, thereby providing a model for using protectedareas to attain multiple goals. The Amazon Vision, one of the REDPARQUES part-ners, includes an initiative on “Protected Areas, Natural Solutions against ClimateChange (NASCC)”. This initiative recognizes that protected areas are key to buildingresilience to mitigate the impacts of a changing climate, to ensuring the provisionof ecosystem services on which people depend and to protecting biodiversity (RED-PARQUES 2015a; Suarez et al. 2015). The Amazon Vision makes extensive useof spatial mapping to identify climatic conditions, climate risk and opportunities toenhance resilience in the Amazon’s protected areas network. This tool provides afoundation for decisions on management of existing protected areas and creationof new ones that include multiple goals and values and facilitates a climate smart-landscape approach to other agendas, including participatory land use planning andthe development of infrastructure (Suarez et al. 2015).
Global efforts to encourage different forms of conservation management, whichallow for economic activity without losing the ecosystem values of the natural sys-tems, could lead to recognition of new types of protected areas and the prevention ofcarbon-emitting land conversions such as deforestation. Furthermore, the potentialof conservation outside the protected areas network is gaining increasing recogni-tion. The initially confusing wording of Aichi Target 11, which referred to “protectedareas and other effective area-based conservation measures” has been the trigger for
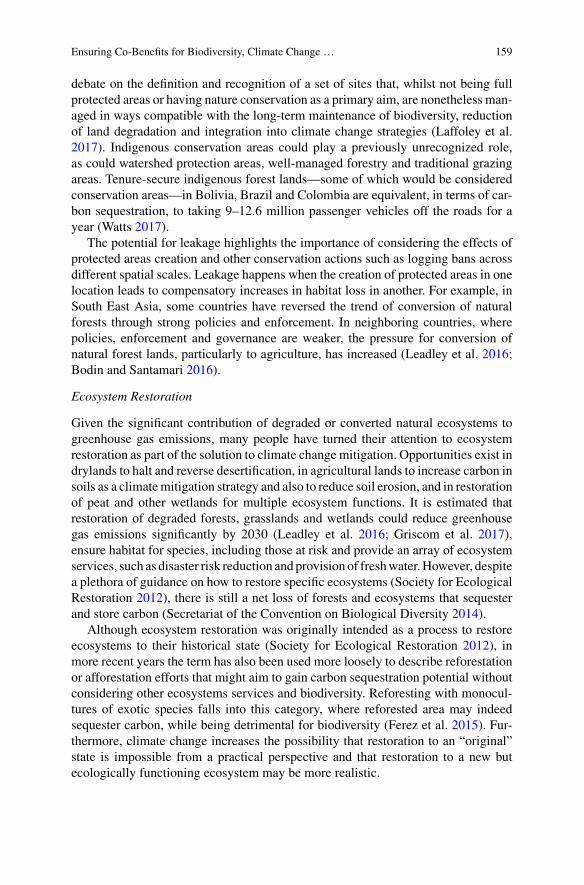
Ensuring Co-Benefits for Biodiversity, Climate Change … 159
debate on the definition and recognition of a set of sites that, whilst not being fullprotected areas or having nature conservation as a primary aim, are nonetheless man-aged in ways compatible with the long-term maintenance of biodiversity, reductionof land degradation and integration into climate change strategies (Laffoley et al.2017). Indigenous conservation areas could play a previously unrecognized role,as could watershed protection areas, well-managed forestry and traditional grazingareas. Tenure-secure indigenous forest lands—some of which would be consideredconservation areas—in Bolivia, Brazil and Colombia are equivalent, in terms of car-bon sequestration, to taking 9–12.6 million passenger vehicles off the roads for ayear (Watts 2017).
The potential for leakage highlights the importance of considering the effects ofprotected areas creation and other conservation actions such as logging bans acrossdifferent spatial scales. Leakage happens when the creation of protected areas in onelocation leads to compensatory increases in habitat loss in another. For example, inSouth East Asia, some countries have reversed the trend of conversion of naturalforests through strong policies and enforcement. In neighboring countries, wherepolicies, enforcement and governance are weaker, the pressure for conversion ofnatural forest lands, particularly to agriculture, has increased (Leadley et al. 2016;Bodin and Santamari 2016).
Ecosystem Restoration
Given the significant contribution of degraded or converted natural ecosystems togreenhouse gas emissions, many people have turned their attention to ecosystemrestoration as part of the solution to climate change mitigation. Opportunities exist indrylands to halt and reverse desertification, in agricultural lands to increase carbon insoils as a climatemitigation strategy and also to reduce soil erosion, and in restorationof peat and other wetlands for multiple ecosystem functions. It is estimated thatrestoration of degraded forests, grasslands and wetlands could reduce greenhousegas emissions significantly by 2030 (Leadley et al. 2016; Griscom et al. 2017),ensure habitat for species, including those at risk and provide an array of ecosystemservices, such as disaster risk reduction andprovision of freshwater.However, despitea plethora of guidance on how to restore specific ecosystems (Society for EcologicalRestoration 2012), there is still a net loss of forests and ecosystems that sequesterand store carbon (Secretariat of the Convention on Biological Diversity 2014).
Although ecosystem restoration was originally intended as a process to restoreecosystems to their historical state (Society for Ecological Restoration 2012), inmore recent years the term has also been used more loosely to describe reforestationor afforestation efforts that might aim to gain carbon sequestration potential withoutconsidering other ecosystems services and biodiversity. Reforesting with monocul-tures of exotic species falls into this category, where reforested area may indeedsequester carbon, while being detrimental for biodiversity (Ferez et al. 2015). Fur-thermore, climate change increases the possibility that restoration to an “original”state is impossible from a practical perspective and that restoration to a new butecologically functioning ecosystem may be more realistic.

160 R. Smith et al.
The New York Declaration on Forests—an update of the Bonn Challenge—aimsto bring 150million hectares of degraded and deforested land into restoration by 2020and 350 million hectares by 2030. This declaration recognizes that these restorationefforts have to be implemented with national priorities in mind, such as water andfood security, rural development, climate change, biodiversity and land degradationneutrality. As of September 2016, commitments for forest restoration under this ini-tiative include 63.3million hectares in Africa, 23.6million hectares in Latin Americaand 22.4 million hectares in Asia (Bodin and Santamari 2016).
Investments in ecosystem restoration have increased over the past few years onall continents (Bodin and Santamari 2016). It is time to measure the successes andchallenges from existing approaches in attaining co-benefits for biodiversity, climatechange and sustainable development.
REDD+
Some initiatives originally intended for climate change mitigation have beenexpanded to include biodiversity conservation. Reducing emissions from deforesta-tion and degradation (REDD) in developed countrieswas expanded in theBali ActionRoadmap to include conservation, sustainable management of forests and enhance-ment of forest carbon stocks in developing countries (REDD+) (Harvey et al. 2010).REDD+ supports climate change goals as well as conservation and sustainable devel-opment goals articulated in the Aichi Biodiversity Targets and SDGs. Some of theways in which REDD+ now supports multiple goals are: the expansion of the eligi-bility for funding to countries with historically low deforestation; use of criteria thatensures REDD+ does not result in the conversion of natural forests to plantations,exotic monocultures or non-forested systems; use of criteria to prevent leakage—en-suring that protecting forests in one place does not result in deforestation in anotherplace; and prevention of funds to projects with questionable mitigation benefits andfew or no biodiversity benefits (e.g. palm plantations) (Harvey et al. 2010).
Many REDD+ projects have already demonstrated the benefits of this newapproach, including: the Taita Hills Project in Kenya, which generates carbon offsetsfor the protection of forest and savannah outside Tsavo National Park; the RukingaWildlife Sanctuary, also in Kenya, which provides income to the community, govern-ment and local landlords for avoiding greenhouse gas emissions from deforestation(IPCC 2014). A model looking at the potential for REDD+ to positively affect bio-diversity, demonstrated that in Brazil the number of threatened species could bereduced to 6 species from 311 by simply enforcing Brazil’s new Forest Code (Mead2016), which is now known as the Law of Native Vegetation Protection (LNVP).
Mangroves are now eligible for REDD+ funding, and efforts are underway toestablish a voluntary carbon standard to create sustainable financing for other bluecarbon habitats.
3. Management of Marine Systems
The development of the SGDs and the increasing recognition of the role of oceansin regulating global climate offer important opportunities to better integrate coastal
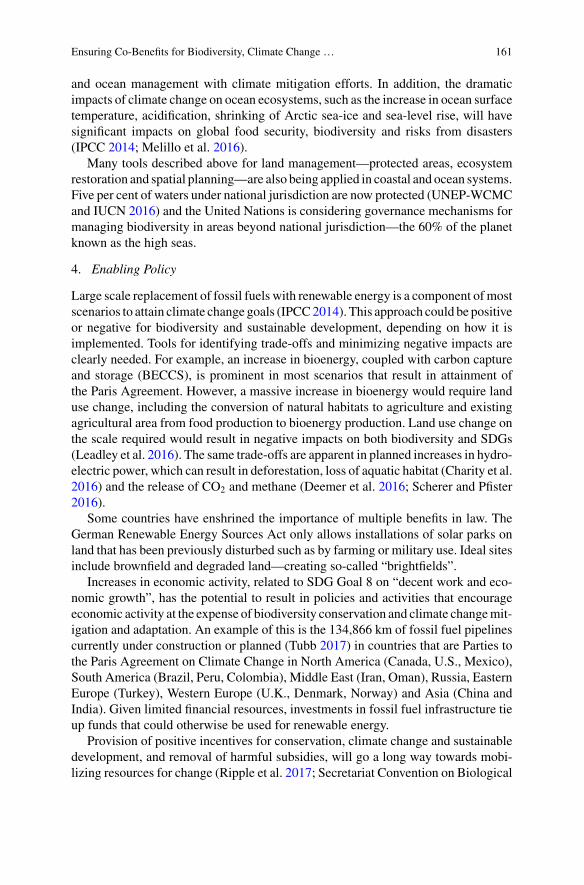
Ensuring Co-Benefits for Biodiversity, Climate Change … 161
and ocean management with climate mitigation efforts. In addition, the dramaticimpacts of climate change on ocean ecosystems, such as the increase in ocean surfacetemperature, acidification, shrinking of Arctic sea-ice and sea-level rise, will havesignificant impacts on global food security, biodiversity and risks from disasters(IPCC 2014; Melillo et al. 2016).
Many tools described above for land management—protected areas, ecosystemrestoration and spatial planning—are also being applied in coastal and ocean systems.Five per cent of waters under national jurisdiction are now protected (UNEP-WCMCand IUCN 2016) and the United Nations is considering governance mechanisms formanaging biodiversity in areas beyond national jurisdiction—the 60% of the planetknown as the high seas.
4. Enabling Policy
Large scale replacement of fossil fuels with renewable energy is a component ofmostscenarios to attain climate change goals (IPCC2014). This approach could be positiveor negative for biodiversity and sustainable development, depending on how it isimplemented. Tools for identifying trade-offs and minimizing negative impacts areclearly needed. For example, an increase in bioenergy, coupled with carbon captureand storage (BECCS), is prominent in most scenarios that result in attainment ofthe Paris Agreement. However, a massive increase in bioenergy would require landuse change, including the conversion of natural habitats to agriculture and existingagricultural area from food production to bioenergy production. Land use change onthe scale required would result in negative impacts on both biodiversity and SDGs(Leadley et al. 2016). The same trade-offs are apparent in planned increases in hydro-electric power, which can result in deforestation, loss of aquatic habitat (Charity et al.2016) and the release of CO2 and methane (Deemer et al. 2016; Scherer and Pfister2016).
Some countries have enshrined the importance of multiple benefits in law. TheGerman Renewable Energy Sources Act only allows installations of solar parks onland that has been previously disturbed such as by farming or military use. Ideal sitesinclude brownfield and degraded land—creating so-called “brightfields”.
Increases in economic activity, related to SDG Goal 8 on “decent work and eco-nomic growth”, has the potential to result in policies and activities that encourageeconomic activity at the expense of biodiversity conservation and climate changemit-igation and adaptation. An example of this is the 134,866 km of fossil fuel pipelinescurrently under construction or planned (Tubb 2017) in countries that are Parties tothe Paris Agreement on Climate Change in North America (Canada, U.S., Mexico),South America (Brazil, Peru, Colombia), Middle East (Iran, Oman), Russia, EasternEurope (Turkey), Western Europe (U.K., Denmark, Norway) and Asia (China andIndia). Given limited financial resources, investments in fossil fuel infrastructure tieup funds that could otherwise be used for renewable energy.
Provision of positive incentives for conservation, climate change and sustainabledevelopment, and removal of harmful subsidies, will go a long way towards mobi-lizing resources for change (Ripple et al. 2017; Secretariat Convention on Biological
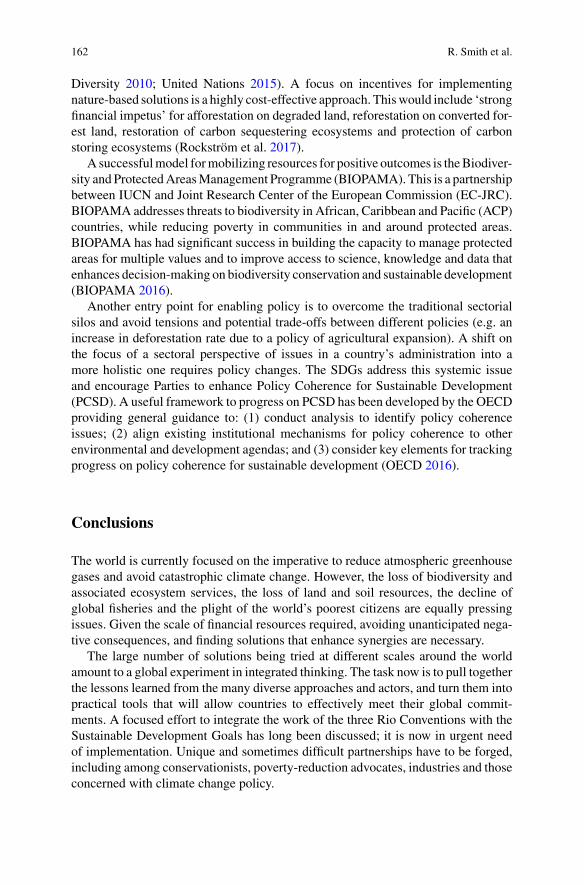
162 R. Smith et al.
Diversity 2010; United Nations 2015). A focus on incentives for implementingnature-based solutions is a highly cost-effective approach. Thiswould include ‘strongfinancial impetus’ for afforestation on degraded land, reforestation on converted for-est land, restoration of carbon sequestering ecosystems and protection of carbonstoring ecosystems (Rockström et al. 2017).
A successfulmodel formobilizing resources for positive outcomes is theBiodiver-sity and ProtectedAreasManagement Programme (BIOPAMA). This is a partnershipbetween IUCN and Joint Research Center of the European Commission (EC-JRC).BIOPAMA addresses threats to biodiversity in African, Caribbean and Pacific (ACP)countries, while reducing poverty in communities in and around protected areas.BIOPAMA has had significant success in building the capacity to manage protectedareas for multiple values and to improve access to science, knowledge and data thatenhances decision-making on biodiversity conservation and sustainable development(BIOPAMA 2016).
Another entry point for enabling policy is to overcome the traditional sectorialsilos and avoid tensions and potential trade-offs between different policies (e.g. anincrease in deforestation rate due to a policy of agricultural expansion). A shift onthe focus of a sectoral perspective of issues in a country’s administration into amore holistic one requires policy changes. The SDGs address this systemic issueand encourage Parties to enhance Policy Coherence for Sustainable Development(PCSD). A useful framework to progress on PCSD has been developed by the OECDproviding general guidance to: (1) conduct analysis to identify policy coherenceissues; (2) align existing institutional mechanisms for policy coherence to otherenvironmental and development agendas; and (3) consider key elements for trackingprogress on policy coherence for sustainable development (OECD 2016).
Conclusions
The world is currently focused on the imperative to reduce atmospheric greenhousegases and avoid catastrophic climate change. However, the loss of biodiversity andassociated ecosystem services, the loss of land and soil resources, the decline ofglobal fisheries and the plight of the world’s poorest citizens are equally pressingissues. Given the scale of financial resources required, avoiding unanticipated nega-tive consequences, and finding solutions that enhance synergies are necessary.
The large number of solutions being tried at different scales around the worldamount to a global experiment in integrated thinking. The task now is to pull togetherthe lessons learned from the many diverse approaches and actors, and turn them intopractical tools that will allow countries to effectively meet their global commit-ments. A focused effort to integrate the work of the three Rio Conventions with theSustainable Development Goals has long been discussed; it is now in urgent needof implementation. Unique and sometimes difficult partnerships have to be forged,including among conservationists, poverty-reduction advocates, industries and thoseconcerned with climate change policy.
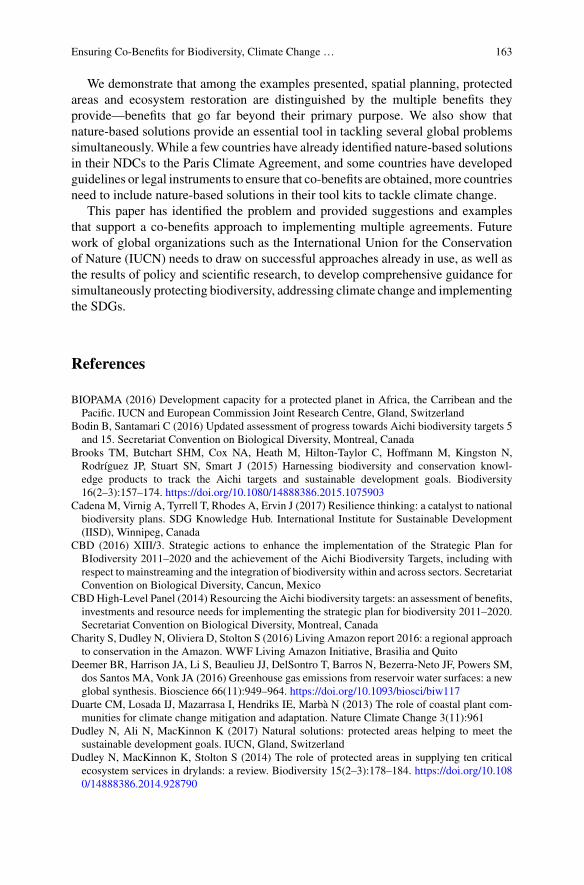
Ensuring Co-Benefits for Biodiversity, Climate Change … 163
We demonstrate that among the examples presented, spatial planning, protectedareas and ecosystem restoration are distinguished by the multiple benefits theyprovide—benefits that go far beyond their primary purpose. We also show thatnature-based solutions provide an essential tool in tackling several global problemssimultaneously. While a few countries have already identified nature-based solutionsin their NDCs to the Paris Climate Agreement, and some countries have developedguidelines or legal instruments to ensure that co-benefits are obtained,more countriesneed to include nature-based solutions in their tool kits to tackle climate change.
This paper has identified the problem and provided suggestions and examplesthat support a co-benefits approach to implementing multiple agreements. Futurework of global organizations such as the International Union for the Conservationof Nature (IUCN) needs to draw on successful approaches already in use, as well asthe results of policy and scientific research, to develop comprehensive guidance forsimultaneously protecting biodiversity, addressing climate change and implementingthe SDGs.
References
BIOPAMA (2016) Development capacity for a protected planet in Africa, the Carribean and thePacific. IUCN and European Commission Joint Research Centre, Gland, Switzerland
Bodin B, Santamari C (2016) Updated assessment of progress towards Aichi biodiversity targets 5and 15. Secretariat Convention on Biological Diversity, Montreal, Canada
Brooks TM, Butchart SHM, Cox NA, Heath M, Hilton-Taylor C, Hoffmann M, Kingston N,Rodríguez JP, Stuart SN, Smart J (2015) Harnessing biodiversity and conservation knowl-edge products to track the Aichi targets and sustainable development goals. Biodiversity16(2–3):157–174. https://doi.org/10.1080/14888386.2015.1075903
Cadena M, Virnig A, Tyrrell T, Rhodes A, Ervin J (2017) Resilience thinking: a catalyst to nationalbiodiversity plans. SDG Knowledge Hub. International Institute for Sustainable Development(IISD), Winnipeg, Canada
CBD (2016) XIII/3. Strategic actions to enhance the implementation of the Strategic Plan forBIodiversity 2011–2020 and the achievement of the Aichi Biodiversity Targets, including withrespect to mainstreaming and the integration of biodiversity within and across sectors. SecretariatConvention on Biological Diversity, Cancun, Mexico
CBDHigh-Level Panel (2014) Resourcing the Aichi biodiversity targets: an assessment of benefits,investments and resource needs for implementing the strategic plan for biodiversity 2011–2020.Secretariat Convention on Biological Diversity, Montreal, Canada
Charity S, Dudley N, Oliviera D, Stolton S (2016) Living Amazon report 2016: a regional approachto conservation in the Amazon. WWF Living Amazon Initiative, Brasilia and Quito
Deemer BR, Harrison JA, Li S, Beaulieu JJ, DelSontro T, Barros N, Bezerra-Neto JF, Powers SM,dos Santos MA, Vonk JA (2016) Greenhouse gas emissions from reservoir water surfaces: a newglobal synthesis. Bioscience 66(11):949–964. https://doi.org/10.1093/biosci/biw117
Duarte CM, Losada IJ, Mazarrasa I, Hendriks IE, Marbà N (2013) The role of coastal plant com-munities for climate change mitigation and adaptation. Nature Climate Change 3(11):961
Dudley N, Ali N, MacKinnon K (2017) Natural solutions: protected areas helping to meet thesustainable development goals. IUCN, Gland, Switzerland
Dudley N, MacKinnon K, Stolton S (2014) The role of protected areas in supplying ten criticalecosystem services in drylands: a review. Biodiversity 15(2–3):178–184. https://doi.org/10.1080/14888386.2014.928790

164 R. Smith et al.
Dudley N, Stolton S, Belokurov A, Krueger L, Lopoukhine N, MacKinnon K, Sandwith T, SekhranN (2010) Natural solutions: protected areas helping people cope with climate change. IUCN,TNC, UNDP, WCS, World Bank, WWF, Gland, Switzerland
EppleC, JenkinsM,Garcia-Rangel S,GuthM (2016)Managing ecosystems in the context of climatechange mitigation: A review of current knowledge and recommendations to support ecosystem-based mitigation actions that look beyond terrestrial forests. Secretariat of the Convention onBiological Diversity, UNEP, WCMC and German Federal Ministry for the Environment, NatureConservation, Building and Nuclear Safety, Montreal, Canada
Executive Secretary of Convention on Biological Diversity (2017) Biodiversity and the 2030 agendafor sustainable development. Montreal, Canada
Federative Republic of Brazil (FRB) (2016) Intended nationally determined contribution towardachieving the objective of the United Nations Framework Convention on Climate Change.Brasilia, Brazil
Ferez APC, Campoe OC, Mendes JCT, Stape JL (2015) Silvicultural opportunities for increasingcarbon stock in restoration of Atlantic forests in Brazil. Forest Ecol Manage 350(SupplementC):40–45. https://doi.org/10.1016/j.foreco.2015.04.015
Griscom BW, Adams J, Ellis PW, Houghton RA, Lomax G, Miteva DA, Schlesinger WH, Shoch D,Siikamäki JV, Smith P, Woodbury P, Zganjar C, Blackman A, Campari J, Conant RT, Delgado C,Elias P, Gopalakrishna T, Hamsik MR, Herrero M, Kiesecker J, Landis E, Laestadius L, LeavittSM, Minnemeyer S, Polasky S, Potapov P, Putz FE, Sanderman J, Silvius M, Wollenberg E,Fargione J (2017) Natural climate solutions. Proc Natl Acad Sci U S A 114:11645–11650.https://doi.org/10.1073/pnas.1710465114
Harvey CA, Dickson B, Kormos C (2010) Opportunities for achieving biodiversity conservationthrough REDD. Conserv Lett 3(1):53–61. https://doi.org/10.1111/j.1755-263X.2009.00086.x
Herr D, Landis E (2016) Coastal blue carbon ecosystems. Opportunities for nationally determinedcontributions: policy brief. IUCN and TNC, Gland, Switzerland and Washington, USA
IPCC (2014) Climate change 2014: synthesis report. Contribution of working groups I, II and III tothe fifth assessment report of the intergovernmental panel on climate change. Geneva, Switzerland
IUCN (2016a) A global standard for the identification of key biodiversity areas, Version 1.0. Firstedition. IUCN, Gland, Switzerland
IUCN (2016b) Restoration of forest ecosystems and landscapes as contribution to the Aichi biodi-versity targets. Global Forest and Climate Change Program, IUCN, Gland, Switzerland
Laffoley D, Dudley N, Jonas H, MacKinnon D, MacKinnon K, Hockings M, Woodley S (2017)An introduction to ‘other effective area-based conservation measures’ under Aichi target 11 ofthe convention on biological diversity: origin, interpretation and emerging ocean issues. AquatConserv Marine Freshw Ecosyst 27(S1):130–137
Laurans Y, Ruat R, Barthelemy P (2016) Counting on nature: how governments plan to rely onecosystems for their climate strategies. Issue Brief, vol 05/2016, April 2016 edn. Institute dudéveloppement durable et des relations internationales, Paris, France
Leadley P, Alkemade R, Arneth A, Krug C, Popp A, Rondinini C, Stehfest E, Dv Vuuren (2016)Relationship between the Aichi targets and land-based climate mitigation. UN Convention onBiological Diversity, Montreal, Canada
Marrakech Partnership, Global Alliances for Water and Climate, French Water Partnership (2017)International declaration: nature-based solutions for water management under climate change.Bonn, Germany
Mead L (2016) Forests and landscape restoration feature at UN biodiversity conference. SDGKnowledge Hub, IISD. http://sdg.iisd.org/news/forests-and-landscape-restoration-feature-at-un-biodiversity-conference/
Melillo JM, Lu X, Kicklighter DW, Reilly JM, Cai Y, Sokolov AP (2016) Protected areas’ role inclimate-change mitigation. Ambio 45(2):133–145. https://doi.org/10.1007/s13280-015-0693-1
Nature Needs Half (2017) Nature needs half. Wild Foundation. http://natureneedshalf.org/OECD (2016) Better policies for sustainable development 2016: A New Framework for PolicyCoherence. OECD, Paris, France. https://doi.org/10.1787/9789264256996-en

Ensuring Co-Benefits for Biodiversity, Climate Change … 165
Pacific Marine Environmental Laboratory Carbon Program (2017) A Primer on pH. NOAA PacificEnvironmental Laboratory. https://www.pmel.noaa.gov/co2/story/A+primer+on+pH
Peschel T (2010) Solar parks—opportunities for biodiversity. German Renewable Energies Agency,Berlin, Germany
Peterson C (2011) Integrating biodiversity into spatial planning and environmental assessment.Botswana
Quéré CL, Moriarty R, Andrew RM, Peters GP, Ciais P, Friedlingstein P, Jones SD, Sitch S, TansP, Arneth A (2014) Global carbon budget. Earth Syst Sci Data Discuss 7:521–610
REDPARQUES (2015a) About REDPARQUES. REDPARQUES. http://redparques.com/?lang=en. Accessed 15 Dec 2017
REDPARQUES (2015b) Declaration by the Latin American network for technical cooperationon national parks, other protected areas, and wild flora and fauna (REDPARQUES) to the 21stconference of the parties (cop) of the united nations framework convention on climate change.REDPARQUES, Paris, France
Ripple WJ, Wolf C, Newsome TM, Galetti M, Alamgir M, Crist E, Mahmoud MI, Laurance WF(2017) World scientists’ warning to humanity: a second notice. BioScience 1–3. https://doi.org/10.1093/biosci/bix125
Roberts CM, O’Leary BC, McCauley DJ, Cury PM, Duarte CM, Lubchenco J, Pauly D, Saenz-Arroyo A, Sumaila UR, Wilson RW, Worm B, Castilla JC (2017) Marine reserves can mitigateand promote adaptation to climate change. Proc Natl Acad Sci U SA 114(24):6167–6175. https://doi.org/10.1073/pnas.1701262114
Rockström J, Gaffney O, Rogelj J, Meinshausen M, Nakicenovic N, Schellnhuber HJ (2017) Aroadmap for rapid decarbonization. Science 355(6331):1269
Sayer J, Sunderland T, Ghazoul J, Pfund J-L, Sheil D, Meijaard E, Venter M, Boedhihartono AK,Day M, Garcia C (2013) Ten principles for a landscape approach to reconciling agriculture,conservation, and other competing land uses. Proc Natl Acad Sci U S A 110(21):8349–8356
Scherer L, Pfister S (2016) Hydropower’s biogenic carbon footprint. PLoSONE 11(9):1–11. https://doi.org/10.1371/journal.pone.0161947
Schmidt-TraubG (2015) Investment needs to achieve the sustainable development goals—summaryfor policymakers. Sustain Dev Solut Netw, New York, USA
Schultz M, Tyrrell TD, Ebenhard T (2016) The 2030 agenda and ecosystems—a discussion paperon the links between Aichi biodiversity targets and the sustainable development goals. SwedBioat Stockholm Resilience Centre, Stockholm, Sweden
Science for Environmental Policy (2015) Wind and solar energy and nature conservation. FutureBrief 9. Science Communication Unit, Bristol
Secretariat Convention on Biological Diversity (2010) AIchi biodiversity targets. Secretariat Con-vention on Biological Diversity. https://www.cbd.int/sp/targets/. Accessed 4 Dec 2017
Secretariat of the Convention on Biological Diversity (2014) Global biodiversity outlook 4: a mid-term assessment of progress towards the implementation of the strategic plan for biodiversity2011–2020. Convention on biological diversity, Montreal, Canada. Doi: ISBN- 92-9225-539-8
Secretariat of the Convention on Biological Diversity (2016) Decisions XIII/2, paragraph 9 (III):Progress towards the achievement of Aichi biodiversity targets 11 and 12. Decision adopted bythe Conference of the Parties to the Convention on Biological Diversity, XIII/2. Convention onBiological Diversity, Montreal, Canada
Senior MJM, Brown E, Villalpando P, Hill JK (2015) Increasing the scientific evidence base inthe “high conservation value” (HCV) approach for biodiversity conservation in managed tropicallandscapes. Conserv Lett 8(5):361–367. https://doi.org/10.1111/conl.12148
Society for Ecological Restoration (2012)Available guideance and guidelines on ecosystem restora-tion. Montreal, Canada
Steiner A (2017) Investing in innovative nature-based solutions. UNDPSternN (2015) Climate negotiations, sustainable development and growth—speech. London Schoolof Economics and Political Science, Grantham Research Institute on Climate Change and the
166 R. Smith et al.
Environment. http://www.lse.ac.uk/GranthamInstitute/publication/negociations-climatiques-developpement-durable-et-croissance/. Accessed 4 Dec 2017
Suarez C, Prussman CL, Abud M, Guevara O, Vergara A, Zuniga LA, Gorricho J, Naranjo LG(2015) Vulnerability analysis of the Amazon Biome and its protected areas
The Blue Carbon Initiative (2017) The blue carbon initiative. IUCN, CI, IOC-UNESCO. http://thebluecarboninitiative.org/. Accessed 19 Dec 2017
The Economist (2017) Sucking up carbon: Greenhouse gases must be scrubbed from the air. TheEconomist (Nov 16)
Thompson A (2014) Major greenhouse gas reductions needed by 2050: IPCC. Climate Cen-tral. http://www.climatecentral.org/news/major-greenhouse-gas-reductions-needed-to-curtail-climate-change-ipcc-17300. Accessed 15 Nov 2017
Tubb R (2017) P&GJ’s 2017 Worldwide pipeline construction report. Pipeline Gas J 244(1)TurnerWR,BrandonK,Brooks TM,GasconC,GibbsHK,LawrenceKS,Mittermeier RA, Selig ER(2012) Global biodiversity conservation and the alleviation of poverty. Bioscience 62(1):85–92
UNEP-WCMC, IUCN (2016) Protected planet report. Cambridge UK and Gland SwitzerlandUNFCCC (2014) Paris agreement: essential elements. (Oct 23)UNFCCC (2015) Paris agreement. UNFCCC, Paris, FranceUnited Nations (2015) Sustainable development goals: 17 goals to transform the world. UNWeb Services Section. http://www.un.org/sustainabledevelopment/sustainable-development-goals/. Accessed 4 Dec 2017
US Environmental Protection Agency (2017) Greenhouse gas emissions from a typical passengervehicle 2017 (Dec 18)
USGS (2017) National gap analysis project USGS. https://gapanalysis.usgs.gov/data/. Accessed 16Dec 2017
Watts J (2017) For us, the land is sacred: on the road with the defenders of the world’s forests. TheGuardian
World Bank (2016) Poverty and shared prosperity: taking on inequality. License: creative commonsattribution CC BY 3.01 IGO, Washington, DC. https://doi.org/10.1596/978-1-4648-0958-3
Sustainable Hydropower: UsingEcosystem-based Adaptation to IncreaseLocal Adaptation Capacity in Brazil
Katia Cristina Garcia, Alexandre Mollica, Denise Ferreira de Matosand Luciana Rocha Leal da Paz
Abstract Recent observed changes in climate patterns in Brazil has increased theimportance of ecosystem-based adaptation (EbA) in order to reduce the effectsof drought and floods. The energy (hydropower) sector is specially starting to beaffected by those changes. Changing rainfall patterns, rising temperature, droughtsand extreme weather events may affect hydroelectricity generation, causing dam-ages to the infrastructure or disruptions in service. EbA is mentioned in the BrazilianNDC, highlighting the need to increase national capacity in water security (NationalWater Security Plan), conservation and sustainable use of biodiversity (NBSAP). Inaddition, the Energy Sector Strategy of the NAP mentions the environmental issues,especially regarding the protection and recovery of natural resources (fauna, flora andphysical environment). This paper discusses how the hydropower generation inBrazilcan shift to a sustainable hydropower pattern, capable of dealing with climate changeissues and, additionally, contributing to increase local adaptation capacity using anecosystem approach, as accorded on Paris Agreement. A set of EbA measures arepresented as opportunities to reduce the climate vulnerability and/or increase theresilience of local ecosystems and of the communities depending on them, wherehydropower projects are installed or are being planned.
Hydropower Generation, Biodiversity and Climate Change
Concerns about the protection and conservation of biodiversity have been gainingmore attention in international political discussions. As one of the richest countries inthe world in terms of biodiversity, with high rates of endemism (MMA 1998), Brazilhas been engaged in the international context and has been developing strategies,plans and programs adapted to its needs and reality. Among the major international
K. C. Garcia (B) · A. Mollica · D. F. de Matos · L. R. L. da PazEnergy Optimization and Environment Department, Electric Power Research Center (CEPEL),Eletrobras Group, Av. Horácio de Macedo, 354, Cidade Universitária, Ilha do Fundão, Rio deJaneiro, RJ 21941-911, Brazile-mail: [email protected]
© Springer Nature Switzerland AG 2019W. Leal Filho et al. (eds.), Handbook of Climate Change and Biodiversity,Climate Change Management, https://doi.org/10.1007/978-3-319-98681-4_10
167
168 K. C. Garcia et al.
biodiversity-related conventions ratified by Brazil, we mention The Ramsar Conven-tion onWetlands of International Importance, Convention Concerning the Protectionof the World Cultural and Natural Heritage, Convention on International Trade inEndangered Species of Wild Fauna and Flora and the Convention on BiologicalDiversity (CBD).
Parallel to the growing concerns about biodiversity protection and conservation,there is also an increase in global energy demand (EIA 2015). With this growth, thepressure on biodiversity is also expected to increase. In Brazil, part of the projecteddemand for electricity will be supplied by the expansion of hydroelectricity (Brazil,MME/EPE 2015). A major issue is that many of the sites that have potential forhydroelectric generation expansion also have a high value in terms of biologicaldiversity with sensitive ecosystems and with local communities that depend on theseecosystems as food suppliers or as a source of income, which means, in other words,an overlap problem (Table 1).
A number of important negative impacts to biodiversity are particularly related togeneration plants as well as transmission and distribution infrastructure, which mayoccur during the implementation or operation phases. Table 2 indicates some possibledirect and indirect impacts of electricity generation, transmission and distributionactivities to biodiversity, identified in environmental studies in Brazil.
Nowadays, impacts related to hydroelectricity are considered in several planningstages, from long term planning studies (30 years) to the 10-year expansion plan,and especially in the project phase, when requiring environmental permits. However,these evaluations focus onminimizing/controlling each impact, rather than the cumu-lative impacts of other activities in the basin. Moreover, none of these studies assessneither how the biodiversity could be affected by possible climate changes, nor howlocal populations could be affected with a possible loss of biodiversity, and hence ofthe environmental services. As a consequence, such populations may become evenmore vulnerable.
The main objective of this paper is to propose the use of the so-called “climatelens” and “lens of ecosystems” when assessing the impacts at all levels of the expan-sion and operation planning of electric power generation, andmore specifically of thehydroelectricity plants. These aspects are not only aimed at minimizing/controllingthe impacts of energy generation, taking into account the current and future vul-nerability of the region, but also defining a set of programs that can contribute toincrease the capacity of adaptation of these sensitive areas. Minimizing environmen-tal impacts is an important vector of resilience that also relates to the concept ofEcosystem-based Adaptation (EbA), defined first at the Convention on BiologicalDiversity.
Ecosystem-Based Adaptation (EbA) is defined as the use of ecosystem manage-ment, conservation and restoration, to provide ecosystem services that enable societyto adapt to the impacts of climate change. EbA can have many positive impacts onbiodiversity and on local communities (Fundação Grupo Boticário 2015), such as:
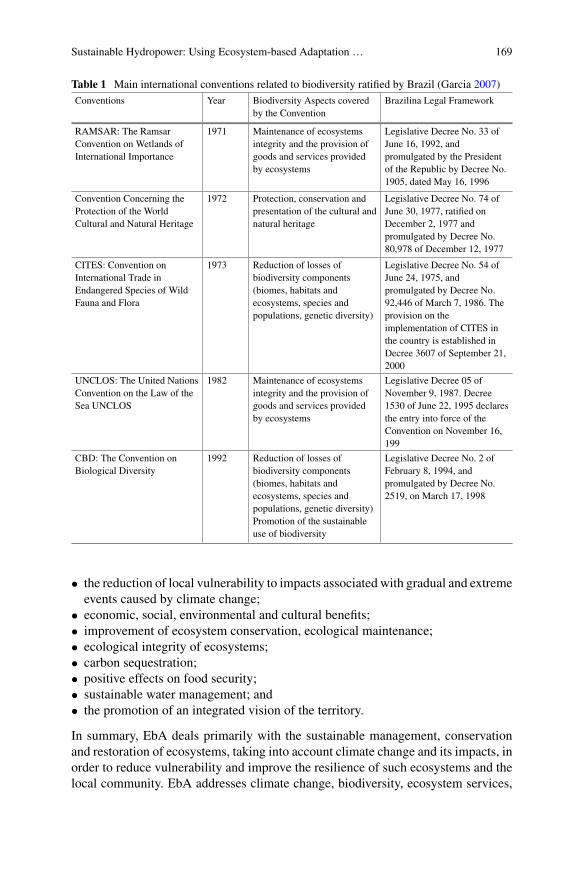
Sustainable Hydropower: Using Ecosystem-based Adaptation … 169
Table 1 Main international conventions related to biodiversity ratified by Brazil (Garcia 2007)
Conventions Year Biodiversity Aspects coveredby the Convention
Brazilina Legal Framework
RAMSAR: The RamsarConvention on Wetlands ofInternational Importance
1971 Maintenance of ecosystemsintegrity and the provision ofgoods and services providedby ecosystems
Legislative Decree No. 33 ofJune 16, 1992, andpromulgated by the Presidentof the Republic by Decree No.1905, dated May 16, 1996
Convention Concerning theProtection of the WorldCultural and Natural Heritage
1972 Protection, conservation andpresentation of the cultural andnatural heritage
Legislative Decree No. 74 ofJune 30, 1977, ratified onDecember 2, 1977 andpromulgated by Decree No.80,978 of December 12, 1977
CITES: Convention onInternational Trade inEndangered Species of WildFauna and Flora
1973 Reduction of losses ofbiodiversity components(biomes, habitats andecosystems, species andpopulations, genetic diversity)
Legislative Decree No. 54 ofJune 24, 1975, andpromulgated by Decree No.92,446 of March 7, 1986. Theprovision on theimplementation of CITES inthe country is established inDecree 3607 of September 21,2000
UNCLOS: The United NationsConvention on the Law of theSea UNCLOS
1982 Maintenance of ecosystemsintegrity and the provision ofgoods and services providedby ecosystems
Legislative Decree 05 ofNovember 9, 1987. Decree1530 of June 22, 1995 declaresthe entry into force of theConvention on November 16,199
CBD: The Convention onBiological Diversity
1992 Reduction of losses ofbiodiversity components(biomes, habitats andecosystems, species andpopulations, genetic diversity)Promotion of the sustainableuse of biodiversity
Legislative Decree No. 2 ofFebruary 8, 1994, andpromulgated by Decree No.2519, on March 17, 1998
• the reduction of local vulnerability to impacts associated with gradual and extremeevents caused by climate change;
• economic, social, environmental and cultural benefits;• improvement of ecosystem conservation, ecological maintenance;• ecological integrity of ecosystems;• carbon sequestration;• positive effects on food security;• sustainable water management; and• the promotion of an integrated vision of the territory.
In summary, EbA deals primarily with the sustainable management, conservationand restoration of ecosystems, taking into account climate change and its impacts, inorder to reduce vulnerability and improve the resilience of such ecosystems and thelocal community. EbA addresses climate change, biodiversity, ecosystem services,

170 K. C. Garcia et al.
Table 2 Possible direct and indirect impacts on biodiversity by the activities of the electricity sector(Eletrobras 2013)
Direct Impacts Indirect Impacts Atividade Tipo deEmpreendimento
Water Quality Change Impact on flora andfauna
Energy generation Hydroelectric PowerPlantsThermonuclear Plant
Loss of VegetationCover
Fragmentation andborder effectImpact on fauna
Energy generationEnergy transmition
Hydroelectric PowerPlantsWind farmsTransmission andDistribution Lines
Changes in habitats Changes in fauna andflora communities
Energy generationEnergy transmition
Hydroelectric PowerPlantsThermoelectric PowerPlantsTransmission lines
Interference in faunaand flora
Changes in ecologicalprocesses
Energy generationEnergy transmition
Hydroelectric PowerPlantsThermoelectric PowerPlantsWind farmsTransmission lines
Interference onmigratory routes ofaquatic fauna
Population reductionReduction of geneticdiversity
Energy generation Hydroelectric PowerPlants
Interference inmigratory routes andcollision with birds
Population reductionReduction of geneticdiversity
Energy generationEnergy transmitionEnergy Distribution
Wind farmsTransmission andDistribution Lines
and sustainable resource management, and is more effective when local communityis involved. UNDP highlights some examples of EbA:
• tree planting with high water retention capacity in drought areas;• identification and planting of species to reduce erosion and landslides;• maintenance of ecosystem connectivity;• preservation or restoration of sensitive areas;• natural resource management to ensure maximum benefit to communities.
We believe that projects and actions aligned with the concept of EbA can be encour-aged when building and operating hydroelectric plants in regions with high environ-mental sensitivity. Plants that have a long-term vision of environmental conservationcan present a set of EbAmeasures from the construction phase to the operation phase,aiming the maintenance of biodiversity and ecosystem services, which can help thelocal populations to adapt to possible adverse impacts of climate change.
Guidelines from the International Association for Impact Assessment (IAIA)stress that “(…) impact assessment (IA) can ensure that the design of policies,
Sustainable Hydropower: Using Ecosystem-based Adaptation … 171
plans, programs and projects adequately take into account mitigation of changes(the effects of the proposal on greenhouse gas emissions), and adaptation to cli-mate change (effects of climate change on the proposal). Taking climate change intoaccount in decisions, through IA, can help reduce vulnerability to climate change,thereby improving the resilience of natural and human systems (…)”. This meansthat IA can help and also play a significant role in achieving national, regional orsectoral climate change objectives (IAIA 2013).
According to the IPCC (2014), adaptive capacity is the ability of a system toadjust to climate variability and extreme weather and weather events, mitigatingpossible damage and taking advantage of opportunities or dealingwith consequences.It depends on two variables: vulnerability and resilience. The lower the vulnerabilityof a system and the greater the resilience, the greater its potential for adaptation(IPCC 2014).
Adaptation to climate change is the process of adjusting to the current orfuture climate and its effects (IPCC 2014). In human systems, adaptation seeks tomitigate, avoid harm or explore beneficial opportunities. In natural systems, humanintervention can facilitate adjustment to the future climate and its effects. There area number of approaches to adapting to climate change, such as the hazard-basedapproach, risk management, vulnerability studies, resilience-based approach, andthe Ecosystem-Based Adaptation (EbA), discussed in this paper.
EbA and the International Agreements Ratified by Brazil
Despite been neglected in the past as a viable tool for adaptation and mitigation, EbAis gaining more recognition in the international climate policy scene since the ParisConference, when the focus began to rapidly shift from theory to action, mainlydue to the commitments set out in the Intended Nationally Determined Contribu-tions (INDC). EbA is mentioned in the Brazilian NDC, when the need to increasenational capacity in water security it is highlighted (National Water Security Plan)and when the need for conservation and sustainable use of biodiversity is mentioned(National Strategic Plan for Protected Areas and the Brazilian Forest Code, in par-ticular for Permanent Preservation Areas). In addition, the Energy Sector Strategyof the National Adaptation Plan (NAP), instituted in 2016, mentions the need totake into consideration the issues related to environmental legislation regarding theprotection and recovery of natural resources (fauna, flora and physical environment)in the adaptation studies of the electricity sector.
The Brazilian NAP also presents an assessment of biodiversity and ecosystemsloss considering several climate change scenarios. The adaptation options prioritizedconsidering these scenarios were: use of ecosystem-based adaptation (EbA) in areaswhere the risk of extreme climate events is high; modelling consequences for bio-diversity and ecosystem services caused by conservation, recovery and sustainableuse of biodiversity public policies; and monitoring in 50 federal protected areas toassess in situ the current and future impacts of climate change on biodiversity.
172 K. C. Garcia et al.
EbA in Practice: Proposing and MeasuringEfficiency/Effectiveness
According to the International Institute for Environment and Development(IIED/IUCN 2016), although many countries make commitments aligned with theconcept of EbA, this rarely leads to clear goals and targets, which would allow anassessment of the effectiveness of adaptation measures over of time. Even wheremeasurable targets are defined, it is unclear whether they will be enough to meetadaptation needs in the communities and ecosystems that are affected (IIED/IUCN2016).
Some organizations around the world are evaluating the effectiveness of EbAmeasures for the development of robust adaptation plans, taking into account localeconomic interests as well as social and environmental needs, thus allowing greateraccess to funding for adaptation (IIED 2016).
In this sense, effective EbAmeasures should follow some basic principles (UNDP,s.d.):
• build actions based on good practices in integrated natural resource management;• involve local communities;• develop strategies with multiple partnerships (governments, communities, privatesectors, NGOs, researchers, etc.) of diverse interests, such as conservation, devel-opment and poverty reduction; and
• integrate EbA with a broader context of adaptation.
From these basic principles, a methodology based on four components is proposed(UNDP, s.d.):
Component A: Define the context of adaptation, noting the possible climatic or non-climatic pressures on biodiversity, the ecosystem services, and the needs of localcommunities.Component B: Development for change, which means planning the EbA actions thatwill be implemented, including the definition of its objectives and goals, as well asthe indicators to be used to monitor the performance.Component C: Implementation of the adaptation measures, including monitoring,data interpretation, evaluation and route adjustment (finishing the plan, do, check,act cycle).Component D: Selection of appropriate adaptationmeasures according to the specificlocal context. The options can be grouped according to ecosystem services and theirbenefits, always aiming to maintain or increase resilience.
In order to be effective, actions should enable communities to maintain or improvetheir adaptive or resilient capacity and reduce their vulnerability to climate change,while improving co-benefits that promote well-being. Another aspect to consider iswhether actions restore, maintain, or enhance ecosystem capacity to continue pro-ducing ecosystem services for local communities, allowing ecosystems to withstandthe impacts of climate change and other stressors. The financial/economic aspect

Sustainable Hydropower: Using Ecosystem-based Adaptation … 173
is also important to be evaluated. Therefore, actions should be supported by local,regional and national governments and involve synergistic interactions betweenmul-tiple sectors considering social, institutional and political issues that can influencethe implementation of EbA initiatives (IIED 2016).
This work proposes all these issues to be considered when evaluating, proposingand implementing EbA actions in the planning and operation of hydroelectricitygeneration, in addition to defining the objectives and goals to be achieved over time.In order to do so, we propose some examples of possible measures to be exploredthat can meet the mentioned criteria and are in accordance with the commitmentsestablished by Brazil in the NDC and with the NAP.
EbA and Sustainable Hydropower
In the previous section we mentioned the principles of the EbA. This paper suggestssome possible actions, which should be complementary and synergistic, and caneffectively contribute to the restoration, maintenance or enhancement of ecosystemcapacity to produce environmental services that are essential to local communities,thus increasing their capacity to adapt to climate changes. In this way, the need forintegrated vision in the definition of measures is reinforced. We also suggest somemeasures to be integrated on: aBiodiversity andEcosystemConservation Plan, a Planto Support Sustainable Local Economic Activities, and a Plan to Promote ScientificResearch. Other possibilities may be evaluated in each environmental study andaccording to each context.
Biodiversity and Ecosystem Conservation Plan
Three possible complementary actions aligned with the concept of EbA are sug-gested: financial support to protected areas; creation of new protected areas andimprovement of existing protected areas, as described below.
Financial support to existing protected areas:
A contribution to the conservation of ecosystems is always guaranteed, since currentBrazilian legal framework already requires the payment of environmental compen-sation when implementing new hydroelectric projects. An alternative action that fitsthe principles of the EbA is the additional support for protected areas, which may bein the form of financial resources.
The financial resources can be very important for the implementation and mainte-nance of protected areas, as there is often a need to remove people, or even forCAPEXinvestment, such as new vehicles or other equipment important to support monitor-ing activities. A good example of financial support program is the ARPA Program,

174 K. C. Garcia et al.
“Protected Areas of the Amazon”, created by the Brazilian Environment Ministry(MMA 2015), aiming the conservation and sustainable use of tropical forests.
Creation of new protected areas:
The participation of the company in the process of creating new protected areasis another interesting possibility. According to ICMBIO,1 the legal process for thecreation of protected areas in Brazil is a manifestation of interest of some sectorof society (ICMBIO 2015). This is a great opportunity for the concessionaire toact within this process, such as suggesting the location of the new protected areas,which should be preferably in the vicinity of the plant or reservoir, joining themosaicof protected areas in the vicinity. Another possibility is the creation of a protectedarea managed by the company, which is called in Brazil RPPN (“Reserva Particulardo Patrimônio Natural or Private Natural Area”, in Portuguese). The RPPN shouldcover the surroundings of the hydropower project, aiming to prevent the expansionof human occupation over the natural or forested areas, guaranteeing the ecosystemconservation and maintenance. The RPPNs can also act as buffer zones for existingnon-private protection areas, creating a biodiversity conservation corridor.
Improvement of existing protected areas:
The entrepreneur may also consider the support for the improvement of existing pro-tected areas under the Biodiversity and Ecosystem Conservation Plan, either throughpartnerships or even helping in the assessment of management effectiveness of a pro-tected area. Regarding partnerships, we mention the ICMBio published in 2009 andtheManual of Procedures (ICMBIO 2009). Although the latter does not define a spe-cific regulatory framework for shared management, it defines ways of establishingpartnerships for the participation of other entities in management of protected areas.
There are some examples from the electricity sector and also from other sectorsin Brazil where there was an effective participation of large structuring companiesin the processes of creation and maintenance of protected areas that shows a greatvalue for the conservation of the ecosystems (CEPEL 2016).
Another way of assisting in the improvement of protected areas is by establishinga continuous process of assessing the effectiveness of the management of protectedenvironments, identifying strengths and weaknesses and planning for future actions.This applies to protected areas generally under the responsibility of the entrepreneur,such as the reservoir borders. Currently there is a methodological framework avail-able for this purpose in the literature,with emphasis on theRAPPAM—RapidAssess-ment and Prioritization of Protected Area Management method (Ervin 2003). Eval-uation of management effectiveness is recognized worldwide as a vital componentfor obtaining a transparent, proactive and well-run conservation unit management.Besides being an essential tool for the local, regional and national level, this type ofevaluation has gained a great deal of attention in the international context (Hockingset al. 2006).
1Acronym for Chico Mendes Institute for Biodiversity Conservation (Portuguese: Instituto ChicoMendes de Conservação da Biodiversidade). ICMBio is the BrazilianMinistry of the Environment’sadministrative arm.
Sustainable Hydropower: Using Ecosystem-based Adaptation … 175
Local Economic Activities Support Plan (LEASP)
The Local Economic Activities Support Plan (LEASP) must contain a spectrum ofactions that is capable of promoting a better regional insertion of the hydroelectricprojects in its areas of influence, promoting environmental conservation and sus-tainable economic activities. The participation of the stakeholders involved in thisprocess is important for the success of the proposed initiatives, since they shoulddevelop autonomy to continue the activities promoted by the plan and its programs.
The composition of LEASP encompasses environmental programs that are cur-rently used in the basic environmental plans of hydropower plants in Brazil. Thenovelty of this proposition is the focus on restoring, maintaining or increasing thecapacity of ecosystems to produce environmental services that are essential to localcommunities.
Another area that may inspire the elaboration of plans, programs and projectsaimed to promote sustainable local economic activities at local and regional leveland environmental conservation are the national reports that show good practices inthe management of protected areas. The publication of ICMBio/IPE (2014), is one ofthese reports, and contains some examples of practices, such as the ones highlightedbelow:
• Taim Ecological Station (Rio Grande, RS): The project focuses on the negotiationprocesses with local community to expand the protected area through the creationof an advisory council. The methodological basis was to qualify the participatoryprocesses, identify and expose the different needs of the beneficiaries of environ-mental services, produce documents in a participatory way and give transparencyand wide publicity to the process.
• Tefé National Forest, Extractive Reserve of the Jutai River, Extractive ReserveBaixo Juruá, Extractive Reserve do Juruá, Extractive Reserve of the Unini River,Marine Extractive Reserve do Soure: The project “Young Protagonists” seeksto diagnose and foster the emergence of new youth leaderships in federal pro-tected areas. For this, it develops community strengthening actions and amplifythe knowledge of the participants about conservation, biodiversity monitoring andenvironmental education.
• Trombetas River Biological Reserve (Oriximiná, PA): The Project “ParticipatoryMonitoring of the Reproduction of Amazonian Chelonia” transformed a conflic-tive relationship between the managers of the protected area and the surroundingquilombola community, who came to be seen as an important player in the biodi-versity conservation.
• Medium Purus Extractive Reserve (Lábrea, AM): ICMBio has built agreementswith local communities to carry out sustainable fisheriesmanagement in the region.After five years an annual quota of expenditure was released and rules for theexpenditure were established, followed-up by ICMBio. As a result, there was adecrease in illegal catch and marketing, which promoted community engagementand illegal catch control.
176 K. C. Garcia et al.
Plan to Promote Scientific Research
The System of Investments in Research and Development and Energy Efficiency bythe concessionaire, permission and authorized companies of the electricity sectorin Brazil, establishes a regular source of financial resources for the developmentof R&D projects, which originated from generation, transmission and distributioncompanies that operate regularly in Brazil (CGEE 2015).
The scientific presence and monitoring of biological, geological, ethnic, archaeo-logical, social and cultural diversity through permanent research stations can providescientific information and relevant analyses. Thus, the present proposal suggests theestablishment of a Plan to Promote Scientific Research, consisting of a set of guide-lines for all research activities from the implantation to the operation of the plant.
With the insertion of a major infrastructure project in a region with low anthro-pogenic occupation, opportunities for development and financing of research projectsare opened, with emphasis on expanding the scientific knowledge base on the regionin the physical-biotic or social aspects. What is proposed here is to go beyond thesurveys required to carry studies for the environmental permits, establishing a con-tinuous research program that can encompass different aspects, expanding scientificknowledge about biological, geological, ethnic, archaeological, social and culturaldiversity of the region. This knowledgemay be used as important inputs for the devel-opment of public policies focused on biodiversity conservation and maintenance.
Here we suggest somemajor themes that can be worked out within the frameworkof a Scientific Research Promotion Plan and which are directly related to the mostevident research needs in sensitive areas that can be affected by possible climaticchanges. Examples are: landscapes, ecosystems and species (population studies -monitoring, specific studies (e.g. ichthyofauna), ecology of target species, geneticsand taxonomy, latu sensu landscape studies, ex situ conservation, reintroduction,geographic distribution); environmental pressures (conflicts with human practices,pollution, climate change); invasive alien species (impact of alien species); sus-tainable use of natural resources; and socio-biodiversity (conservation medicine,thematic maps, social and economic studies, ethno-cognition).
Conclusion
The present paper showed that it is possible to establish a set Ecosystem-basedAdaptation measures (EbA) since the planning and project phase up to the operationof hydroelectric plants that aim to contribute to the conservation of biodiversity, tothe generation of socioeconomic benefits to local communities and to constructionand maintenance of the knowledge and practices of traditional local communities .

Sustainable Hydropower: Using Ecosystem-based Adaptation … 177
Table 3 Summary of proposed EbA measures for Sustainable Hydropower in Brazil
EbA measure Ecosystemservice
Benefits Adaptive capacityneeded
Exemples of indicators
Expansion ofprotected areas
R/P/S/Ca Direct Medium Area or % of protected area
Reforestation R/P/S Direct Low Area or % of reforested area
Restoration ofecosystems
R/P/S Direct Medium Area or % of restored area
Conservation offorest remnants
R/P/S Direct Low Area
Support for localsustainableeconomicactivities
P Indirect Low Number of plans supportedNumber of stakeholdersinvolvedLevel of cooperationbetween govern-ment/companies/community
R&D R/P/S/C Indirect Low Number of studiesSpecies and ecosystemsbenefited by the studiesCommunities benefitingfrom the results of thestudies
aR Regulating Service; P Provisioning Service; S Supporting Service; C Cultural Service
In addition, by working to promote the sustainable use of nature and biodiversity, thedevelopment and implementation of EbAmeasures promotes coherence with severalrelevant international commitments, such as the Convention on Biological Diversity,the Convention on the Protection of World Heritage, Cultural and Natural Heritage,the Ramsar Convention on Wetlands, among others.
Table 3 resumes how some suggested measures may be viewed as EbAmeasures,highlighting the related ecosystem services benefited, the potential benefits (director indirect), the adaptive capacity needed and some examples of indicator for EbAefficiency/effectiveness assessment.
References
Brasil, MME/EPE (2015) Plano Decenal de Expansão de Energia 2024/Ministério de Minas eEnergia. Empresa de Pesquisa Energética. MME/EPE, Brasília
CEPEL (2016) Metodologia para o Desenvolvimento e Implantação de Projetos de UsinasHidrelétricas sob o Conceito de Usinas-Plataforma. Relatório Técnico nº 11662/2016. Rio deJaneiro, 182 pp
CGEE. Centro de Gestão e Estudos Estratégicos (2015) Sugestões de aprimoramento ao modelo defomento à PD&I do Setor Elétrico Brasileiro: Programa de P&D regulado pela Aneel. Brasília,DF, 320 pp
EIA (2015) EIA Annual energy outlook 2015. DOE/EIA-0383, Washington, DC
178 K. C. Garcia et al.
Eletrobras (2013) Relatório Anual de Sustentabilidade. Avaiable at: www.eletrobras.com.brErvin J (2003) WWF: Rapid Assessment and Prioritization of Protected Area Management (RAP-PAM) methodology. Gland
Fundação Grupo Boticário de Proteção à Natureza (2015) ADAPTAÇÃO BASEADA EM ECOS-SISTEMAS - Oportunidades para políticas públicas em mudanças climáticas, Curitiba
Garcia (2007) Avaliação Estratégica do Risco à Biodiversidade (AERB) nos Planos e Programasda E&P offshore de Petróleo e Gás Natural no Brasil. Tese de Doutorado do Programa de Plane-jamento Energético (PPE/COPPE/UFRJ), Rio de Janeiro/RJ
Hockings M, Stolton S, Leverington F, Dudley N, Courrau J (2006) Evaluating Effectiveness: aframework for assessing management effectiveness of protected areas, 2nd edn. IUCN, Gland,and Cambridge, xiv+105 pp
IAIA (2013) Decisões Climáticas Inteligentes. Fast Tips, no 3, fevereiro de 2013ICMBIO (2009) Manual de Convênios, Contratos de Repasse, Termos de Cooperação, Termos deParceria e Termos de Reciprocidade. Disponível em: http://www.ICMBio.gov.br/portal/images/stories/comunicacao/downloads/manualconvcontratosICMBio.pdf. Acesso em: 20 Dec 2015
ICMBIO (2015) Instituto Chico Mendes de Conservação da Biodiversidade. http://www.icmbio.gov.br/portal/o-que-fazemos/criacao-de-unidades-de-conservacao.html. Acesso em 29 Oct 2015
ICMBIO/IPE (2014) Práticas Inovadoras na Gestão de Áreas Protegidas. Disponívelem: http://www.icmbio.gov.br/praticasinovadoras/images/stories/publicacoes/2014/publicacao_praticas_2014a.pdf
IIED (2016) Ecosystem-based approaches to adaptation: strengthening the evidence and informingpolicy. May, 2016. UK
IIED/IUCN (2016) Ecosystem-based adaptation: a win–win formula for sustainability in a warmingworld? Briefing, Issue July 2016
IPCC (2014) Climate change 2014: synthesis report. Contribution of Working Groups I, II and IIIto the fifth assessment report of the Intergovernmental Panel on Climate Change [Core WritingTeam, Pachauri RK, Meyer LA (eds)]. IPCC, Geneva, 151 pp
MMA (2015) Programa Áreas Protegidas da Amazônia - ARPA – FASE II. Análise Ambiental.Ministério do Meio Ambiente – MMA. Brasília. 2010
MMA (1998) First national report for the convention on biological diversity – Brazil. Ministry ofEnvironment. Brasilia/DF, Brazil. http://www.gov.br/informma/item/7927
UNDP (United Nations Development Programme) (s.d.) Ecosystem-Based Adaptation. Disponívelem: www.undp.org
The Yellowstone to Yukon ConservationInitiative as an Adaptive Responseto Climate Change
Charles C. Chester and Jodi A. Hilty
Abstract The need for connectivity across large areas has long been a core principlein the field of conservation biology. Whereas early rationales for conserving connec-tivity included the maintenance of genetic health and the protection of ecosystemprocesses, the more recently recognized threat posed by climate change to biodiver-sity has only amplified the focus on connectivity. Within the last decade, the term“large landscape conservation” has become a generic term applied to efforts intendedto align on-the-ground conservation programs with the scale of the potential changesresulting from climate change. An early example of such an approach was the Yel-lowstone to Yukon Conservation Initiative (Y2Y), spanning the Rocky Mountainsbetween Canada and the United States. First conceived in the early 1990s, Y2Yconnoted not only a region, but also a science & advocacy network, a conservationorganization, and—particularly in its early years—a challenge to the conservationcommunity to broaden its vision ofwhatwill be required for effectivewildlife conser-vation over the coming century. This includes consideration of how, under conditionsof climate change, biological communities may disarticulate and then reorganizeacross time and space, and of the consequent need for intact land conservation net-works to allow species to move through increasingly human-occupied landscapes.Accordingly, a key aspect of the programmatic work under Y2Y focuses on pro-tecting ecologically intact landscapes as a core approach to effective biodiversityconservation. Today, Y2Y has become widely cited for its groundbreaking efforts toexpand the conceptual scale of effective conservation landscapes in North Americaand the world.
C. C. Chester (B)The Fletcher School, Brandeis University, Tufts University, 9 Lowell Street,Cambridge, MA 02138, UKe-mail: [email protected]
J. A. HiltyYellowstone to Yukon Conservation Initiative, Suite 200, 1240 Railway Avenue, Canmore ABT1W 1P4, Alberta, Canadae-mail: [email protected]
© Springer Nature Switzerland AG 2019W. Leal Filho et al. (eds.), Handbook of Climate Change and Biodiversity,Climate Change Management, https://doi.org/10.1007/978-3-319-98681-4_11
179
180 C. C. Chester and J. A. Hilty
Introduction: Science and Conservation in the Y2Y Region
Although biodiversity is responding to climate change in myriad ways, range move-ment across landscapes (and seascapes) is perhaps the most widely recognized. Inparticular, species movement both latitudinally (e.g., poleward) and/or altitudinally(e.g., upslope) has been documented in numerous cases, although the overall patternsof species movement are complex and do not indicate a simplistic species responsemechanism (see Lenoir and Svenning 2015; Pecl et al. 2017). Nonetheless, at local,national, regional and global levels, many actors in the conservation communityhave responded to the threat of climate change by focusing on “large landscape con-servation,” a generic term applied to those efforts intended to align on-the-groundconservation programswith the scale of these documented and projectedmovements.
The Yellowstone to Yukon (Y2Y) region has been widely profiled and recognizedas one of the world’s first large landscape conservation efforts—sometimes called“continental scale” conservation efforts (Johnson 2017). Much of the programmaticwork currently conducted under the Y2Y aegis focuses on the need for ecologicalconnectivity across large landscapes, with the ultimate goal being to enhance theresilience ofwildlife to the threat of climate change.Yet to garner a full understandingof Y2Y’s current approach to grappling with the threat of climate change, it is usefulto begin with a short review of Y2Y’s early history.
Within two years of its first conception in 1993 (Locke 1993/94), Y2Yhad evolvedinto a highly active “virtual network” of biologists and conservationists who wereinterested in the idea. Over the following half-decade, an organizationwith the formaltitleY2YConservation Initiative solidifiedwith themission of both promoting a largerlandscape vision across the broad region and of prioritizing conservation resourcestoward areas of critical conservation concern (Chester 2006). Overall, the idea of“Yellowstone to Yukon” has since manifested itself in at least four principal ways:
• Y2Y is a region stretching 3218 km across one of the planet’s most intact mountainsystems, from the Arctic Circle in the Yukon south to Greater Yellowstone Ecosys-tem’s Wind River Range, encompassing five US states, two Canadian provinces,and two Canadian Territories.
• Y2Y is a network of hundreds of individuals, conservation organizations, busi-nesses, and other actors both within and outside the region.
• Y2Y is an organization based in Canmore, Alberta, which conducts a range ofconservation activities throughout the region.
• Y2Y is a conservation vision of a continental scale, one of the first of its kind.
Over the subsequent twenty-plus years since its original conception,Y2Yhas becomecommonly cited as one of world’s most ambitious examples of large landscape con-servation; as one observer described, Y2Y has become “perhaps the granddaddy ofcitizen-generated large-landscape projects” (Hiss 2015).

The Yellowstone to Yukon Conservation Initiative as an Adaptive … 181
Today, one can see the same suite of large mammals in the Rocky Mountains thatAlexander MacKenzie saw in 1793, when he became the first Caucasian to cross thecontinent north of Mexico (Gailus 2010). However, many of these species, includingwolves (Canis lupus), grizzly bears (Ursus arctos),wolverines (Gulo gulo), and cari-bou (Rangifer tarandus) have become imperiled, particularly in the southern portionof the Y2Y region. Approximately 700 protected areas in the Y2Y region—whichincludes the world’s first national park (Yellowstone), Canada’s first national park(Banff), and the world’s first international peace park (Waterton-Glacier)—are thecore mainstays of biodiversity conservation for the area (Chester 2015; Chester et al.2013).
Scientific understanding has been at the core of the Y2Y vision since its concep-tion. Both the theory of island biogeography and metapopulation theory served askey rationales, both of which indicated that the survival of individual species andmaintenance of overall biodiversity would be enhanced by larger protected areas thatwere situated both closer together and within a permeable matrix (Hilty et al. 2006).Although the Y2Y region has a comparatively high percentage of its land base inprotected areas, on their own they will not adequately protect biodiversity partiallybecause they do not extend over the region’s full breadth of natural habitats, andpartially because their extent is sufficient to maintain either lasting populations ofwide-ranging species nor the natural processes they depend upon (Hilty et al. 2006).
Methodology and Limitations
Our primary purpose here is to explain the role of Y2Y in activities pertaining tobiodiversity conservation in the Northern Rockies of Canada and the United States,with a particular focus on both (1) the effects of climate change on biodiversity and(2) the conservation responses to the threat of climate change. Both authors have beeninvolved in Y2Y for a combined thirty-plus years as academic researchers and asboard members and/or staff. In addition to our own experience with and involvementwith Y2Y, we have cited a range of sources from the academic literature—mostlyjournal articles and academic books, but also reports from the conservation com-munity (mostly NGOs) and media/press coverage. While our background with Y2Yenhances our historical insights and we have attempted to examine Y2Y objectively,this association requires up-front recognition. Another important potential limitationincludes the fact that we do not closely examine several other early efforts at largelandscape conservation, such as those that occurred in Central America, regions ofeastern United States (such as New York and Florida), and other areas (see Worboyset al. 2010), and our focus on Y2Y should not be interpreted as a claim that Y2Ywas alone in early efforts to foster large landscape conservation.
182 C. C. Chester and J. A. Hilty
Y2Y as a Response to Climate Change
Scientific reviews from on climate change and biodiversity repeatedly recommendand prioritize (1) increasing the number and size of protected areas and (2) workingto functionally connect protected areas as the key actions that society should taketo conserve biodiversity into the future (Heller and Zavaleta 2009; nearly a decadeafter this groundbreaking review, there remains active discussion over the role ofconnectivity in biodiversity conservation; see, for instance, Bonebrake et al. 2018;Reside et al. 2018; Jones et al. 2016; Sirami et al. 2017; McGuire et al. 2016). Suchrecommendations are essentially congruent with the Y2Y mission of connectingand protecting the habitats across the Y2Y region. Progress with regards to suchgoals has been made; in the first 20 years since the operationalization of the Y2Yvision, the area under strict protection (e.g., legislated parks, wilderness, and otherdesignations) increased from 9 to 14% of the region (Wendy et al. submitted). Still,parts of Y2Y are disconnected for some species, and increasing human activitiescontinue to threaten to isolate protected areas currently connected.
A wide range of sectors are highly active in the conservation arena in the Y2Yregion, including government agencies, industry, indigenous communities, and non-governmental organizations (NGOs). The latter includes traditional conservation andenvironmental groups employing advocacy and litigation, as well as sportsmen andangler organizations, land trusts, scientific institutions, local community groups andwatershed associations. Notably, Y2Y the organization (more below) has supportedscientific work in the region to identify and draw attention to place-based and issue-based conservation priorities, and has worked to bridge efforts amongst partnersworking to further scientific understanding of the region.
In the context of this conservation-rich and science-rich history, a vast array of gov-ernment, academic, and independent scientists have conducted a myriad number ofbiological, social, economic, and political conservation-relevant investigations in theY2Y region, with the result that the Y2Y region is probably one of the better-studiedregions of the world when it comes to the practice of conservation. Partly because theregion has been imbued with these conservation values and biological insights, theconservation community has been relatively quick to focus on the challenge of cli-mate change. That said, much remains to be done, and preparing for climate changewill need to occur at multiple scales from the very local to pan-regional.
Overall, as climate change confronts the historical legacy of conservation in theY2Y region, the conservation community holds itself to a two-fold proposition: first,that a 150 year-old experiment in protecting wildlife and wildlands will continue tobenefit future generations, and second, that in this era of climate disruption, on-the-ground conservation from the local scale to the continental scale will foster effectiveresilience and adaptation.
The Yellowstone to Yukon Conservation Initiative as an Adaptive … 183
Range of Anthropogenic Threats to Biodiversity
Human population density in the Y2Y region is relatively low. Natural resources,be it land, wildlife, minerals, or oil and gas, are managed through a complex webof federal, provincial, state, and local agencies. Natural resource extractive indus-tries in the region include mining, and oil and gas extraction, forestry, agriculture,ranching, and grazing. While these activities still dominate in many parts of theregion, the economy has increasingly shifted toward “nonconsumptive” industriessuch as outdoor recreation, tourism, a wide range of service sector businesses, andamenity migration, which as been defined as “population movement towards naturalamenity-rich rural communities, a phenomenon that has been prominent in manyparts of the world in the last four decades” (Matarrita-Cascante 2017). While thereare prima facie reasons to interpret these developments as beneficial for conservation,two key points must be taken into account. First, the term “nonconsumptive” maybe a misnomer; for example, the impacts of tourism—even “ecotourism”—can besignificant (see, e.g., Blumstein et al. 2017). Second, although these changes haveled to a diversifying political landscape, the region’s politics remain largely favorabletoward the extractive industries.
While biodiversity across the Y2Y region is threatened by a familiar list of humanactivities, the degree and types of threats change from south to north. Southward,rural residential sprawl constitutes the most significant factor in land-use changeand the resultant threats to wildlife species (Hamilton et al. 2016; Farr et al. 2017).For grizzly bears, a single house per square mile can mean the difference betweengood habitat and sink habitat—that is, where conflict with humans typically meansthe demise of bears (Schwartz et al. 2012). As one moves north through the region,areas with little permanent human presence are increasingly facing new or expandedforms of natural resource extraction—including unsustainable forestry practices, oiland gas development, mineral exploration, as well as the placement and extent ofrenewable energy projects and infrastructure. On top of this lies the threat of climatechange.
To protect the region’s biodiversity, conservationists have relied on a wide rangeof tools, including advocacy for enhanced protected areas, private land conserva-tion, wildlife restoration initiatives, incentive programs, and education and conflict-reductionprograms. In regard to targeting keypublic andprivate lands, approximately14%of theY2Y region lies protected under a range of designations, includingwilder-ness areas, wildlife refuges, and national, state, and provincial parks (Francis et al.Submitted for publication). Extensive work on connectivity and road ecology hasfocused on mitigating the impacts of roads and highways, with particular focus onkey transportation corridors such as the Trans-Canada Highway (which bisects BanffNational Park) andHighway 3 (which runs through the Crowsnest Pass area of south-ern Alberta) (Paul et al. 2014; Sawaya et al. 2014). Significantly, the “Path of thePronghorn,” the first federally designated migration corridor in the United States,lies in the Y2Y region (Berger and Cain 2014; Degen 2014).

184 C. C. Chester and J. A. Hilty
At each of these scales, connectivity work furthers the larger vision of the Y2Yregion working as an enormous corridor made up of protected core areas andcorridor linkages—which collectively ensure the long-term viability of the region’sbiodiversity.
Climate Change Impacts
Climate change can be seen as an external driver spread over the above “tradition-al” threats to biodiversity—one that will manifest itself differently across the Y2Yregion, but overall will entail “profound effects” (Guay et al. 2016; although focusedon the US portion of the region, this publication provides a thorough review of theeffects of climate change for this area).
The Y2Y region is home to several research initiatives on the effects of climatechange, with focal points ranging from niche habitats of particular species to exten-sive large landscape analyses.While the status of US government supported researchinitiatives remains uncertain, a few prominent examples of such research initiativeshas included the Pacific Climate Impacts Consortium, the US Forest Service RockyMountain Research Station, the US Geological Survey’s Northwest and North Cen-tral Climate Science Centers, the Northern Rockies Adaptation Partnership, and theDepartment of the Interior’s Great Northern Landscape Conservation Cooperative.1
While these efforts indicate that scientists and government officials have commit-ted to research and understanding the impacts of climate change across the RockyMountains and adjacent ecoregions, continuing support for such research remainsunclear for the US as of publication.
The potential for rapid climate change in the Rocky Mountains has been longrecognized (Luckman and Kavanagh 2000). Mountain ecosystems are both beingimpacted by climate change at a faster rate than most other places (Pepin et al. 2015),and Y2Y is no exception with rates exceeding the global averages (Graumlich andFrancis 2010). At the same time, Y2Y and other intact mountain ecosystems arehighly likely to contain refugia for species during climate change since mountainousregions offer different aspects, elevations, and north-south movement options overrelatively short distances (Chen et al. 2011).
A sizeable and expanding body of scientific evidence has shown that not only isthe Y2Y region currently experiencing climate change impacts, but that continuedchanges will impose significant alterations to the region’s ecology (Reiners et al.2003) as well as agriculture (Hannah et al. 2013). Compared with the historicalrecords, the region’s mean annual temperatures have been increasing, precipitationpatterns have changed, and there has been an increased frequency of extremeweather—the last of which could have the highest impact due extreme temperaturesleading to stress, reproductive failure, and even death for the many species withrelatively narrow climate envelop requirements (Graumlich and Francis 2010).
1Weblinks to these institutions can be found at http://ieinfo.net/geo-na-y2y.html.
The Yellowstone to Yukon Conservation Initiative as an Adaptive … 185
Compared to previous decades, winters have been shorter and warmer in thetwenty-first century. Precipitation is increasingly falling as rain instead of snow,which entails significant impacts on seasonal water availability as well as glaciers.One notable consequence has been the climate threat to Glacier National Park, wherethe park’s namesake features are at risk (Luce 2018). Moreover, some species suchas the wolverine (Gulo gulo) that may depend on permanent ice and snow through-out the year (typically for food caches and insulation) will experience the greatestimpacts—although how this will unfold is highly complex, particularly in compari-son to other anthropogenic threats aside from climate change (McKelvey and Buotte2018; Stewart et al. 2016). Beyond such direct physical changes, species are experi-encing phenological alterations, including shifts in species distributions, changes inhibernation patterns, and the potential decoupling of phenological timing betweencodependent species (Graumlich and Francis 2010). In some cases, climate changecould entail benefits such as reduced cold stress and longer foraging seasons, yet theextent of such benefits is not clear. An illuminating case study can be found withmarmot species (Marmota spp.) in the Rocky Mountains; on the one hand, whilethey may benefit from increased capacity to colonize new territory and increase pop-ulations, a drier and warmer active season may entail significant negative impacts(Armitage 2017; Turnock et al. 2017). Overall, the available observational data andmodeling data point to (1) the changing species distributions in the Y2Y region,and (2) the likelihood of further change over the current century. As a consequence,species that are unable either to adapt or to relocate to areas with conducive climateand habitat conditions are unlikely to survive (Graumlich and Francis 2010).
Widespread outbreaks of pine beetles (most significantly, the mountain pine bee-tle, Dendroctonus ponderosae) have given the Y2Y region its most visible climateimpact, with expanding stands of dying and dead trees now ubiquitous in much ofthe Y2Y region. Although a native species that has incurred extensive past infes-tations, recent infestations have been widely characterized as unprecedented, espe-cially in regard to the beetles’ effects on higher elevation, five-needle pine species,such as whitebark pine (Pinus albicaulis). These extensive infestations largely resultfrom milder winters and the pine beetle’s resultant capacity to shorten its life cycle(Loehman et al. 2018).
Discussion: Opportunities and Challenges
For conservationists working in the Y2Y region, climate change is not a newly-recognized threat (see, e.g., Luckman 1990). And when the concept of “Y2Y” wasfirst proposed in the mid-1990s, the threat of climate change was one factor consid-ered in the rationale for conservation at a large landscape scale (Harvey 1998). Yetthe broad focus of conservation science at the time was on the increasing islandiza-tion effects of increasing natural resource extraction activities and the developmentof human infrastructure (e.g., roads & buildings).

186 C. C. Chester and J. A. Hilty
Although the conservation community has by no means eliminated any of theselong-standing threats, over the course of the last decade it has widened its focus toencompass the threat of climate change. Accordingly, climate science is advancingacross the region, and to some degree has become a central focus for conservationactivities in the region (Hilty et al. 2017). Climate change science both helps toinform how and whether conservation efforts to date will fare in terms of climatechange and helps identify refugia. In the Columbia Headwaters region, for instance,Y2Y is working with the organization Wildsight and other partners on an expandedconservation vision based on science indicating that this area is likely to continueto serve as a climate refuge to a greater degree than other areas in the region (Utzig2015). Such climate refugia will promote persistence for some species (McLaughlinet al. 2017) and can reduce rates of change and related extremes. Climate refugiasuch as in the Columbia Headwaters can exist for a variety of reasons, from weatherpatterns to topographic influences and vegetation attributes (Ashcroft 2010;Macleanet al. 2017).
While river systems have long been known to be vital to biodiversity in the Y2Yregion and new research continues to expand on the importance of river systems(Hauer et al. 2016), Y2Y and partners are increasingly focusing on headwaters con-servation both because water conservation is a major 21st Century climate exac-erbated issue and because the issue resonates with people. One example of such aconservation push is in the Bighorn, an area lying mostly along the eastern notchbetween Banff and Jasper National Parks. More than 88% of the water for the city ofEdmonton originates in the Bighorn, and recent polls show that residents in Edmon-ton are keen to conserve their headwaters (Hilty et al. 2017; Y2YCI 2016).
Another common recommendation of scientists for helping biodiversity duringthis time of climate change is restoration of impaired systems. The Kootenai Valleyin north Idaho along the US-Canada border has suffered decades of major land usechange, transforming this forested lowland ecosystem into a managed landscapeof agriculture, cattle grazing, and dysfunctional hydrology that compromises thisecosystem’s ability to adapt to the hotter, drier climate conditions forecasted for thisregion. Grizzly bear scientists mapped out large landscape connectivity prioritiesfrom the perspective of grizzly bears (Kendall et al. 2016; Proctor et al. 2015). To date,Y2Y hasworkedwith land trusts in the region to purchase key connectivity lands, andcurrently Y2Y is engaging with the Idaho Department of Fish and Game to restoreecological functioning to 250 acres of forested lowland in the Boundary-Smith CreekWildlife Management Area in the Kootenai Valley for the purpose of increasing theresiliency of this ecosystem to climate change. In this area, which is considered anessential corridor in the context of large landscape conservation, restoration effortswill include the construction of two ephemeral ponds for native amphibians, theplanting of 50,000 native trees and plants, the restoration of ephemeral flood cyclesto 1 mile of dry streambed, and the restoration of 35 acres to forested pollinatorhabitat. These restoration efforts are designed to increase this ecosystem’s resiliencyto climate change by restoring hydrological functioning to a portion of this watershedand by using topographical alterations to maximize cool air refugia; these effortswill also enhance connectivity for large mammals and local wildlife including pale

The Yellowstone to Yukon Conservation Initiative as an Adaptive … 187
jumping slugs and western toads, both listed as Species of Greatest ConservationNeed in Idaho (IDFG 2017; Lucid et al. 2016).
Increasingly, conservation efforts across Y2Y are incorporating climate changeconsiderations into prioritization and actions; at the same time, conservationresponses to climate change—be it by government agencies, conservation NGOs,private sector entities, communities, or other actors—have varied widely across theregion. Some have emphasized continuing with traditional land conservation efforts,such as local land trusts—although here there are a growing number of cases wherethe impact of climate change on water dynamics are being considered at a morelocal level. Other conservationists have responded to the threat of climate change bymaking the case that, in essence, their long-standing conservation priorities alreadyare a response to climate change—at least to the degree that their traditional focuson maintaining connectivity, protecting core areas, and eliminating threats such asinvasive species are also the priorities that will enhance resilience and the capac-ity to adapt to climate change (see Butt et al. 2016). And others are engaging withnew approaches and tools, ranging from incorporating the impacts of climate changeinto formal analyses (Weaver 2011, 2017) to targeted beaver (Castor canadensis)restoration efforts to help raise ground water levels, cool in-stream water, and extendmountain water run-off periods (Gibson and Olden 2014).
But even as climate change considerations are being incorporated at the planninglevel in the Y2Y region, the reality is that many institutions are still working toaccount for climate change in their working agendas; moreover, a relatively new USfederal agenda intends to gut climate change preparedness initiatives. Yet perhapsmore fundamental challenge for the conservation community is the degree to whichmany citizens living in the Y2Y region reject the premise of anthropogenic climatechange.Despite overwhelming scientific evidence, this backlash influences particularsectors in theY2Y region and presents significant challenges in incorporating climatechange considerations into policy and management decisions. Without addressingthis problem directly, the conservation community in the Y2Y region will continueto face institutional resistance to incorporating climate change into natural resourcemanagement.
It is important to point out that efforts to reduce greenhouse gas emissions throughrenewable energy can, under some conditions, entail roughly equivalent impacts ascarbon extraction in terms of footprint on biodiversity and habitats. For example,growing wind and hydro power generation projects are increasing their collectivefootprint in the Y2Y region. As they expand, they could conflict with a number ofspecific conservation priorities unless carefully placed.
Another central challenge to the conservation community may be its own his-tory, which since the 1872 establishment of Yellowstone National Park has been oneof parceling out specific areas on the assumption that stasis in land use (i.e., landpreservation) is equivalent to inherent conservation value. This approach assumedthat if a sufficient portion of land were to be designated as “protected areas,” theycould effectively conserve a region’s biodiversity. Although protected areas remainkey to conservation, their role is shifting; the threat of climate change now requiresconservationists to work across much larger landscapes, not only to ensure their

188 C. C. Chester and J. A. Hilty
capacity to move across those landscapes, but to preserve ecosystem functions. Gen-erally speaking, both a precedent and a mechanism for effective and coordinatedmultijurisdictional planning and implementation remain lacking.
Ultimately, conservationists in the Y2Y region—as with conservationists aroundthe globe—are beginning to incorporate and prioritization adaptation to climatechange in various efforts. Still, these efforts will not be successful unless the worldsteps up efforts on the mitigation side of the climate equation. Also, while most peo-ple working to address large landscape conservation in the Y2Y region understandthat the adaptation means ensuring that ecological changes sustain changing config-urations of biodiversity, climate science and supporting information is still lackingto guide clear decisions in all cases. This means that some partners are hesitant toincorporate climate change considerations or to adapt what they are doing to bettersupport climate resilience. In the Y2Y region, both because of the rapidly expandinghuman footprint and the increasing evidence of climate change-related impacts, it isclear that time is limited and, consequently, that the more actors across the regionstep-up to consider climate change, the likelier that the region’s biodiversity willpersist into the future.
Although we do not know exactly how climate change will affect the Y2Y regionover the coming decades, we do know enough to expect that the region will seesignificant and unpredictable ecosystem changes due to alterations in temperatureand precipitation. Consequently, if it is to remain relevant and effective, the conser-vation community has not choice but to forswear the assumption that a traditionalconservation model will sufficiently protect the region’s biodiversity. At a globallevel, as hydrodynamic flows are altered by climate change, ensuring the region’sfreshwater supplies to its full range of users is likely to become one of the mostcontentious resource challenges facing humankind. In the Y2Y region, changes inprecipitation form (viz., rain or snow) and quantity is likely to result in certain seasonsbecomingmore arid, with resultant higher demands during certain times of year fromagricultural and municipal users. This in turn is likely to lead to pressure for moredams—even as climate change makes survival challenging for aquatic species thatdependent on free-flowing and cool streams. If such conflicts are not prioritized andaddressed proactively, it is unlikely that these vulnerable species will be protectedunder conditions of unmanaged resource scarcity. Similarly, ensuring connectivityforwide-ranging andmigratory specieswill be critical, and thus understandingwhichkinds of corridors or linkages will remain robust over long-term conditions of climatechange will be essential (Cross et al. 2012).
Another promising approach is to identify and protect regions of “climate refugia,”or areas where glaciation did not occur (Dobrowski and Parks 2016; Graumlich andFrancis 2010). Although the location of past refugias hold no necessary promise forwarmer future, the multifaceted mountainous terrain of the Y2Y region may wellensure conditions that protect species from current and impending changes.
The Yellowstone to Yukon Conservation Initiative as an Adaptive … 189
Conclusion
Over the past century, portions of the Y2Y region have been the subject of extensiveand intensive scientific attention. As a result, there is a substantial body of scientificknowledge and insight to undergird biodiversity conservation as the region becomesincreasingly subject to conditions of climate change. Despite this knowledge, how-ever, considerable uncertainty remains both for the region as a whole and for anyparticular subregion of the landscape. With such uncertainties in mind, the conser-vation community must ensure that across the Y2Y region as a whole, plants andanimals can move and shift into appropriate habitats and niches according to localand subregional patterns of a changing climate. As one of us helped to articulate ina defense of US system of Large Landscape Cooperatives (LLCs; see Baldwin et al.2018), Y2Y’s response to climate change must incorporate the following objectives:
1. maintain and expand placement of core conservation areas;2. build network connectivity responsive to the changing climate;3. assess habitat vulnerability to potential land-use change;4. integrate social constraints with biodiversity and ecosystem-service goals, and5. compare alternative scenarios.
When Y2Y was first conceived in 1993, conservation biologists were primar-ily concerned with decreasing genetic connectivity due to anthropogenic landscapechange. As climate change becamemore widely recognized in the conservation com-munity, the need for effective connectivity as a tool for responding to climate changebecame a driving rationale in efforts to conserve habitat. Accordingly, over the courseof the past decade, working at a “large landscape scale” has become de rigueur inthe arena of conservation biology and conservation implementation.
In such a world of accelerated climate change, the Y2Y region presents one ofthe world’s most significant opportunities to work at a large landscape scale. Theecological integrity of the Y2Y region derives from a number of factors: the regionis comparatively intact and untrammeled, it contains a wide latitudinal range, andits mountainous terrain incorporates both elevational gradients and diverse north-east-south-west aspects (Pecl et al. 2017). Together, this means that the Y2Y regionwill carry more resilience to climate change than many other regions. Given theopportunity presented by the Y2Y region’s high level of resilience, it remains criticalto devise and implement “climate-effective” conservation actions today so that theregion’s species will remain viable under conditions of dramatic change.

190 C. C. Chester and J. A. Hilty
References
Armitage Kenneth B (2017) Hibernation as a major determinant of life-history traits in marmots. JMammal 98(2):321–331
Ashcroft Michael B (2010) Identifying refugia from climate change. J Biogeogr 37:1407–1413Baldwin RF, Trombulak SC, Leonard PB, Noss RF, Hilty JA, Possingham HP, Scarlett L, AndersonMG (2018) The future of landscape conservation. BioScience Prepublication print available athttps://doi.org/10.1093/biosci/bix142
Berger Joel, Cain Steven L (2014) Moving beyond science to protect a mammalian migrationcorridor. Conserv Biol 28(5):1142–1150
BlumsteinDaniel T,GeffroyBenjamin, SamiaDiogoSM,BessaEduardo (eds) (2017)Ecotourism’spromise and peril: a biological evaluation. Springer Nature, Cham, Switzerland
Bonebrake TC, Brown CJ, Bell JD, Blanchard JL, Chauvenet A, Champion C, Chen I-C, Clark TD,Colwell RK, Danielsen F, Dell AI, Donelson JM, Evengård B, Ferrier S, Frusher S, Garcia RA,Griffis RB, Hobday AJ, Jarzyna MA, Lee E, Lenoir J, Linnetved H, Martin VY, McCormack PC,McDonald J, McDonald-Madden E, Mitchell N, Mustonen T, Pandolfi JM, Pettorelli N, Possing-ham H, Pulsifer P, Reynolds M, Scheffers BR, Sorte CJB, Strugnell JM, Tuanmu M-N, TwinameS, Vergés A, Villanueva C, Wapstra E, Wernberg T, Pecl GT (2018) Managing consequencesof climate-driven species redistribution requires integration of ecology, conservation and socialscience. Biol Rev 93:284–305
Butt N, Possingham HP, De Los Rios C, Maggini R, Fuller RA, Maxwell SL, Watson JEM (2016)Challenges in assessing the vulnerability of species to climate change to inform conservationactions. Biol Cons 199:10–15
Chen Ching, Hill Jane K, Ohlemüller Ralf, Roy David B, Thomas Chris D (2011) Rapid rangeshifts of species associated with high levels of climate warming. Science 333:1024–1026
Chester Charles C (2006) Conservation across borders: biodiversity in an interdependent world.Island Press, Washington, D.C.
Chester Charles C (2015)Yellowstone toYukon: transborder conservation across a vast internationallandscape. Environ Sci Policy 49:75–84
Chester Charles C, Hilty Jodi A, Hamilton Lawrence S (2013) Mountain gloom and mountain gloryrevisited: a survey of conservation, connectivity, and climate change inmountain regions. JMountEcol 9:1–34
Cross Molly S, Zavaleta Erika S, Bachelet Dominique, Brooks Marjorie L, Enquist Carolyn AF, Fleishman Erica, Graumlich Lisa J, Groves Craig R, Hannah Lee, Hansen Lara, HaywardGreg, Koopman Marni, Lawler Joshua J, Malcolm Jay, Nordgren John, Petersen Brian, RowlandErika L, Scott Daniel, Shafer Sarah L, Rebecca Shaw M, Tabor Gary M (2012) The adaptationfor conservation targets (ACT) framework: a tool for incorporating climate change into naturalresource management. Environ Manage 50:341–351
Degen P (2014) Scaling up: Collaborative approaches to large landscape conservation. Annapolis,Maryland &Woodstock, Vermont: Chesapeake Bay Office & Stewardship Institute, US NationalPark Service, US Department of the Interior. http://www.largelandscapenetwork.org/scaling_up
Dobrowski SolomonZ, ParksSeanA (2016)Climate change velocity underestimates climate changeexposure in mountainous regions. Nature Commun 7:12349
Farr Cooper M, Pejchar Liba, Reed Sarah E (2017) Subdivision design and stewardship affect birdand mammal use of conservation developments. Ecol Appl 27(4):1236–1252
Gailus Jeff (2010) The grizzly manifesto: in defence of the great bear. Rocky Mountain Books,Victoria, B.C.
Gibson Polly P, Olden Julian D (2014) Ecology, management, and conservation implications ofNorth American beaver (Castor canadensis) in dryland streams. Aquat Conserv: Marine FreshwEcosys 24(3):391–409
Graumlich Lisa, Francis Wendy L (2010) Moving toward climate change adaptation: the promiseof the Yellowstone to Yukon Conservation Initiative for addressing the region’s vulnerabilities.Yellowstone to Yukon Conservation Initiative, Canmore, Alberta
The Yellowstone to Yukon Conservation Initiative as an Adaptive … 191
Guay Kevin, Jantz Patrick, Gross John E, Rogers Brendan M, Goetz Scott J (2016) Historicaland projected climates to support climate adaptation across the Northern Rocky Mountains. In:Hansen Andrew J, Theobald David M, Monahan William B (eds) Climate change in wildlands:pioneering approaches to science and management. Island Press, Washington, DC, pp 78–94
Hamilton Christopher M, Baumann Matthias, Pidgeon Anna M, Helmers David P, ThogmartinWayne E, Heglund Patricia J, Radeloff Volker C (2016) Past and predicted future effects ofhousing growth on open space conservation opportunity areas and habitat connectivity aroundNational Wildlife Refuges. Landscape Ecol 31(9):2175–2186
HannahL,Roehrdanz PR, IkegamiM, ShepardAV, ShawMR,TaborG, Zhi L,Marquet PA,HijmansRJ (2013) Climate change, wine, and conservation. Proc Natl Acad Sci 110(17):6907–6912
Harvey Ann (ed) (1998) A sense of place: Issues, attitudes and resources in the Yellowstone toYukon ecoregion. Yellowstone to Yukon Conservation Initiative, Canmore, Alberta
Hauer F Richard, Locke Harvey, Dreitz Victoria J, Hebblewhite Mark, Lowe Winsor H, MuhlfeldClint C, Nelson Cara R, Proctor Michael F, Rood Stewart B (2016) Gravel-bed river floodplainsare the ecological nexus of glaciated mountain landscapes. Sci Adv 2(6):e1600026
Heller Nicole E, Zavaleta Erika S (2009) Biodiversity management in the face of climate change:a review of 22 years of recommendations. Biol Cons 142(1):14–32
Hilty Jodi A, Lidicker William Zander, Merenlender Adina Maya (2006) Corridor ecology: thescience and practice of linking landscapes for biodiversity conservation. IslandPress,Washington,DC
Hilty JA, Nelson R, Francis W (2017) Yellowstone to Yukon Conservation Initiative: robust con-servation and climate adaptation in action. In: Dominick D, Michael G (eds) Encyclopedia of theAnthropocene. Elsevier
Hiss Tony (2015) One backyard: the first national workshop on large landscape conservation. LandLines, Winter, pp 24–29
IDFG (2017) Idaho State Wildlife Action Plan, 2015. Boise, Idaho: Idaho Department of Fish andGame: Grant No.: F14AF01068 Amendment #1. Sponsored by the US Fish andWildlife Service,Wildlife and Sport Fish Restoration Program. https://idfg.idaho.gov/sites/default/files/state-wildlife-action-plan.pdf
Johnson S (2017) Building a large landscape conservation community of practice. Cambridge:Lincoln Institute of Land Policy: Working Paper WP17SJ1
Jones Kendall R, Watson James E M, Possingham Hugh P, Klein Carissa J (2016) Incorporatingclimate change into spatial conservation prioritisation: a review. Biol Cons 194:121–130
KendallKatherineC,MacleodAmyC,BoydKristina L, JohnBoulanger J, RoyleAndrew,KaswormWayne F, Paetkau David, Proctor Michael F, Annis Kim, Graves Tabitha A (2016) Density,distribution, and genetic structure of grizzly bears in the Cabinet-Yaak Ecosystem. JWildlManag80(2):314–331
Lenoir J, Svenning JC (2015) Climate-related range shifts: a global multidimensional synthesis andnew research directions. Ecography 38(1):15–28
Locke H (1993/94) Yellowstone to Yukon. Wild Earth 3(4):68–72Loehman RA, Bentz BJ, DeNitto GA, Keane RE, ManningME, Duncan JP, Egan JM, JacksonMB,Kegley S, Blakey Lockman I, Pearson DE, Powell JA, Shelly S, Steed BE, Zambino PJ (2018)Effects of climate change on ecological disturbance in the Northern Rockies. In: Halofsky JE,Peterson DL (eds) Climate change and Rocky Mountain ecosystems. New York, Springer BerlinHeidelberg, pp 115–141
Luce C (2018) Water resources. In: Halofsky JE, Peterson DL (eds) Climate change and RockyMountain ecosystems. New York, Springer Berlin Heidelberg, pp 25–36
Lucid MK, Robinson L, Ehlers SE (2016) Multi-species baseline initiative project report.2010–2014. Coeur d’Alene, Idaho: Idaho Department of Fish and Game. https://idfg.idaho.gov/baseline
Luckman Brian H (1990) Mountain areas and global change: a view from the Canadian Rockies.Mt Res Dev 10(2):183–195

192 C. C. Chester and J. A. Hilty
Luckman Brian, Kavanagh Trudy (2000) Impact of climate fluctuations on mountain environmentsin the Canadian Rockies. Ambio 29(7):371–380
Maclean IlyaMD,SuggittAndrewJ,WilsonRobert J,Duffy JamesP,Bennie Jonathan J (2017)Fine-scale climate change: modelling spatial variation in biologically meaningful rates of warming.Glob Change Biol 23(1):256–268
Matarrita-Cascante David (2017) Moving the amenity migration literature forward: understandingcommunity-level factors associated with positive outcomes after amenity-driven change. J RuralStud 53:26–34
McGuire Jenny L, Lawler Joshua J, McRae Brad H, Nunez Tristan A, Theobald David M (2016)Achieving climate connectivity in a fragmented landscape. Proc National Acad Sci [USA]113(26):7195–7200
McKelvey K, Buotte P (2018) Effects of climate change on wildlife in the Northern Rockies. In:Halofsky JE, Peterson DL (eds) Climate change and Rocky Mountain ecosystems. New York,Springer Berlin Heidelberg, pp 25–36
McLaughlin BC, Ackerly DD, Zion Klos P, Natali J, Dawson TE, Thompson SE (2017) Hydrologicrefugia, plants, and climate change. Glob Change Biol 23(8):2941–2961
Paul K, Quinn MS, Huijser MP, Graham J, Broberg L (2014) An evaluation of a citizen sciencedata collection program for recording wildlife observations along a highway. J Environ Manage139:180–187
Pecl GT, Araújo MB, Bell JD, Blanchard J, Bonebrake TC, Chen I-C, Clark TD, Colwell RK,Danielsen F, Evengård B, Falconi L, Ferrier S, Frusher S, Garcia RA, Griffis RB, Hobday AJ,Janion-Scheepers C, Jarzyna MA, Jennings S, Lenoir J, Linnetved HI, Martin VY, McCormackPC, McDonald J, Mitchell NJ, Mustonen T, Pandolfi JM, Pettorelli N, Popova E, Robinson SA,ScheffersBR, Shaw JD, SorteCJB, Strugnell JM, Sunday JM,TuanmuM-N,VergésA,VillanuevaC, Wernberg T, Wapstra E, Williams SE (2017) Biodiversity redistribution under climate change:Impacts on ecosystems and human well-being. Science 355 (eaai9214)
Pepin N, Bradley RS, Diaz HF, Baraer M, Caceres EB, Forsythe N, Fowler H, Greenwood G,HashmiMZ, LiuXD,Miller JR, Ning L, Ohmura A, Palazzi E, Rangwala I, SchönerW, SeverskiyI, Shahgedanova M, Wang MB, Williamson SN, Yang DQ (2015) Elevation-dependent warmingin mountain regions of the world. Nature Climate Change 5(5):424–430
Proctor Michael F, Nielsen Scott E, KaswormWayne F, Servheen Chris, Radandt Thomas G, GrantMachutchon A, Boyce Mark S (2015) Grizzly bear connectivity mapping in the Canada-UnitedStates trans-border region. J Wildl Manag 79(4):544–558
Reiners William A, Baron Jill S, Debinski Diane M, Elias Scott A, Fagre Daniel B, Findley JamesS, Mearns Linda O, Roberts David W, Seastedt Timothy R, Stohlgren Thomas J, Veblen ThomasT, Wagner Frederic H (2003) Natural ecosystems I: The Rocky Mountains. In: Wagner FredericH (ed) Rocky Mountain/Great Basin regional climate-change assessment. Utah State Universityreport for the U.S. Global Change Research Program, Logan, Utah, pp 145–184
ResideApril E, Butt Nathalie, AdamsVanessaM (2018)Adapting systematic conservation planningfor climate change. Biodivers Conserv 27:1–29
Sawaya MA, Kalinowski ST, Clevenger AP (2014) Genetic connectivity for two bear species atwildlife crossing structures in Banff National Park. Proc Royal Soc B 281:20131705
Schwartz Charles C, Gude Patricia H, Landenburger Lisa, Haroldson Mark A, Podruzny Shannon(2012) Impacts of rural development on Yellowstone wildlife: linking grizzly bear (Ursus arctos)demographics with projected residential growth. Wildlife Biology 18(3):246–257
Sirami Clélia, Caplat Paul, Popy Simon, Clamens Alex, Arlettaz Raphaël, Jiguet Frédéric, BrotonsLluís, Martin Jean-Louis (2017) Impacts of global change on species distributions: obstacles andsolutions to integrate climate and land use. Glob Ecol Biogeogr 26(4):385–394
Stewart Frances E, CcNicole A, HeimAnthony P, Clevenger John Paczkowski, Volpe John P, FisherJason T (2016) Wolverine behavior varies spatially with anthropogenic footprint: implicationsfor conservation and inferences about declines. Ecol Evol 6(5):1493–1503
TurnockBY, Litt AR,Vore JM,HammondCAM(2017)Habitat characteristics of the hoarymarmot:assessing distribution limitations in Montana. Ecosphere 8(10):e01977

The Yellowstone to Yukon Conservation Initiative as an Adaptive … 193
Utzig G (2015) Conservation planning in the face of climate change: a case study in southeasternBritish Columbia [Draft Project Overview]: Kutenai Nature Investigations Ltd. http://www.westkootenayresilience.org/Proj-Overview_3-20-15.pdf
Weaver JL (2011) Conservation value of roadless areas for vulnerable fish and wildlife species inthe Crown of the Continent ecosystem, Montana: Wildlife Conservation Society: Working paper40
Weaver JL (2017) Bighorn backcountry of Alberta: Protecting vulnerable wildlife and preciouswaters: Wildlife Conservation Society: WCS Canada Conservation Report #10
Worboys Graeme L, Francis Wendy L, Lockwood Michael (eds) (2010) Connectivity conservationmanagement: a global guide. Earthscan, London
Y2YCI (2016) Edmonton& clearwater county residents love their headwater. Yellowstone toYukonConservation Initiative, Last Modified November 8. https://y2y.net/news/media-releases/edmonton-clearwater-county-residents-love-their-headwaters
Saving the Last Endemic-Church Forestsin Ethiopia: The Case of Lake TanaBiosphere Reserve
Teowdroes Kassahun and Svane Bender
Abstract The restoration of degraded forests to maintain ecosystem services, con-serve endemic biodiversity and to enhance climate change adaptation is a major con-cern in developing countries. In Northern Ethiopia, large forests have been convertedinto arable land; today the last remaining refugia for native woody plant species arefound around churches. The so-called church forests are considered as the last nat-ural seed banks for native trees species, reference areas for local endemism and lastcorner stones for species distribution. Against this background, NABU, a Germanoriginated NGO, initiated a conservation programme and investigated the speciesand structural composition of 10 pilot church forests. A total of 74 woody species(41 tree, 26 shrub and 6 liana species) representing 32 families were recorded. Dif-ferences between forests were strongly expressed in species number (14–35) andnumber of seedlings (150–4150/ha). Similarities between forests decreased follow-ing the altitude difference. It was found that for successful restoration of the pilotforests, interconnecting them by vegetation corridors, creating buffering areas andlivestock fencing as well as and reforesting were suitable measures. NABU thereforeimplemented a restoration programme for safeguarding the last green forest islandstogether with the Ethiopian Orthodox Church.
T. Kassahun (B)Department of Ecology, Faculty of Environmental Sciences, Czech University of Life Sciences,Kamýcká 129, 165 21 Prague 6—Suchdol, Czech Republice-mail: [email protected]
S. BenderThe Nature and Biodiversity Conservation Union (NABU), Charitéstr. 3, 10117 Berlin, Germanye-mail: [email protected]
© Springer Nature Switzerland AG 2019W. Leal Filho et al. (eds.), Handbook of Climate Change and Biodiversity,Climate Change Management, https://doi.org/10.1007/978-3-319-98681-4_12
195

196 T. Kassahun and S. Bender
Introduction
Climate change is one of themost serious environmental, social and economic threatsaffectingmillions of peopleworldwide. Its impact ismuchmore visible in developingcountries by deepening poverty, food insecurity, poor livelihoods and unsustainabledevelopment (FAO2005; IPCC2007). This level of vulnerability is largely because ofthe population’s high dependence on ecosystem services and limited capacity to adaptto a changing climate (MEA 2005). Hence, adapting to these changing conditionsis becoming a necessity in order to decrease their impact on human wellbeing. Inthis context, forests conservation must be considered as one of the major optionsfor adaptation to a changing climate. This is largely because a significant part ofthe population relies on forests as safety nets during harsh periods (Nkem et al.2007). In Ethiopia, land degradation and deforestation are impairing the capacity offorests and the land to contribute to food security. The country is facing a populationgrowth rate of at least 2.9% (Anteneh 2017) which is one of the highest in the worldand results in extensive forest use and clearing for farmland, fuel wood, fodder andconstruction materials. Furthermore, a constant fragmentation of forests into smallpatches is influencing the forest structure and species composition and ultimatelyleading to habitat loss (Echeverria et al. 2006). The fragmentation and isolation offorests in Northern Ethiopia Highlands, at Lake Tana Biosphere Reserve, representsa particular case.
At Lake Tana Biosphere Reserve region, forest cover has decreased from 40%to less than 1% within the last 50 years. Most of the forest residuals, mainly smallpatches are now located at churches and monasteries (zur Heide 2012). These so-called church forests are integral part of the Ethiopian Orthodox Tewahido Church(EOTC), which originate in the fourth century AD (Wassie 2002). Almost all EOTC,are surrounded by a ring of forests and remained in the landscape, even though large-scaled deforestation has occurred in the Ethiopian Highlands. These “church forests”provide sites for religious ceremonies, social gatherings and burial grounds. Most ofthese forests, though poor in regards to species abundance and biodiversity today;are dominated by natural, indigenous tree species. Many forests host endemic andendangered species that are extinguished in other places. They can be consideredas important reserves for species and biodiversity conservation and buffer againstdepletion. Church forests are also an important seed source for rehabilitation fordegraded areas. Overall, church are considered as forests serving as in situ conser-vation sites for biodiversity, in particular for indigenous trees and shrubs, whichescaped from being destroyed forever under the shelters of the church value (Wassie2002). Deforestation threatens the long-term water supply of the local population.There are also rises in ground-surface temperature, altered precipitation patterns andmore frequent droughts induced by global climate change, which amongst otherthings, has a negative impact on agricultural yields. Some case studies of Ethiopiaand other sub-Saharan countries (partly considered in the IPCC 4th state of playreport) have modelled the interaction of climate change, changes in land use, defor-estation and surface run-off, as well as groundwater recharge in catchment areas.
Saving the Last Endemic-Church Forests in Ethiopia: The Case … 197
It became apparent that rising temperatures increases evapotranspiration and in sodoing reduces groundwater recharge, whilst the increase in heavy rainfalls markedlyincreases surface run-off and groundwater recharge. In combination with deforesta-tion and the degradation of pasture and agricultural areas, which also increase surfacerun-off, these factors further advance soil erosion, and lead to flooding and reducedwater quality downstream. The latter will have a serious impact on Lake Tana itself.
Although church forests have been considered as stable for several decades, theyare now visibly affected by encroachment from adjacent farms, unlawful livestockgrazing within the church compound, illegal harvest of forest products (Woods et al.2017), and extensive expansion of non-indigenous tree like Eucalyptus spp. (Lianget al. 2016). Additionally, these forests are residuals frompreviouslywell-establishedand connected forests, but now exist as isolated forest fragments in the landscape.Fragmented forests are generally more susceptible to degradation compared to largeintact forests due to edge effect that creates artificial boundary (Laurence et al.2011). They are also much more exposed to higher wind, higher temperature andlower humidity at the edge compared to the interior of the forest (Laurence et al.1998) resulting to mortality of seedlings (Zambrano et al. 2014). This all affects thelong-term existence of these small forests.
Against this background, NABU, a German originating NGO, initiated a churchforest, conservation programme in 2013. NABU supported technically and finan-cially the establishment of Lake Tana Biosphere Reserve as a wider approach forconserving habitats, culture and biodiversity, while opening up sustainable devel-opment opportunities like ecotourism or regionally produced and labelled productsfor local communities. NABU works towards conservation and sustainable develop-ment in Ethiopia since 2006 having a specialisation onUNESCO biosphere reserves’establishment and management. After securing the legal protection of parts of thearea as core zones of theUNESCObiosphere reserve, it seemed ofmajor significanceto maintain the last forest islands of the former forested area. According to NABU,ecological restoration efforts should both focus on maintaining forest species diver-sity and ecosystem services of the last remaining forests by creating conditions thatfacilitate regeneration of the various species within the forest as well as expandingforest area, interconnecting patches and creating new ones. In order to understandforest structure, ecology, threats and socioeconomic pressures, a baseline study onspecies and structural composition as well as the living conditions of adjacent com-munities, was therefore assigned by NABU to the Amhara Regional AgriculturalResearch Institute (ARARI). Based on the study, detailed and participatory elabo-rated forest management plans for restoration and interconnection for each forestas well as income generation schemes for the local communities living around thechurch forests were planned to be developed. In the course of an extended fieldsurvey on present church forests in the wider area, ten pilot church forests at LakeTana Biosphere Reserve were selected and assessed in detail. This paper presents theecological main results of the study addressing the following questions: (1) What isthe forest structure and species composition of the 10 church forests? (2)Which pos-sible measures could be taken for conservation and restoration of the church forestsin order to preserve biodiversity and contribute to adaptation to climate change?

198 T. Kassahun and S. Bender
The findings of the study and NABU’s approach for conserving some of the lastforest patches and their biological diversity might add to the little existent knowledgeon forest churches in the Lake Tana Basin and support the biosphere reserve manage-ment unit, local administrations and other stakeholders in their efforts to maintainthe last indigenous forest resources of Lake Tana area.
Materials and Methods
Study Area
The study was conducted in north-eastern Ethiopia, at Lake Tana Biosphere Reserve(see Fig. 1). The Lake Tana Biosphere Reserve is located in the Amhara NationalRegional State approximately 563 kmnorthwest ofAddisAbaba in the north-westernpart of Ethiopia. The biosphere reserve comprises Lake Tana, the largest lake inEthiopia, the main source of the Blue Nile, which provides important ecosystemservices. The area is a hotspot of biodiversity, internationally known as an ImportantBird Area and is of global importance for agricultural genetic diversity. The area ischaracterized by an enormous heterogeneity of land uses and natural ecosystems.Amongst the 10 administrative districts (locally known as Woredas) that are encom-passing the Tana Lake, the Dera district has been chosen for both the study and thepiloting of selected measures. Dera is located at the eastern part of the lake coveringan estimated area of 149,726 ha, at an altitude ranging between 1500–3200 m.a.s.l.The rainfall is characterized by a bimodal distribution with the main rainy seasonfrom June to August and a small rainy season fromMarch to May. The average rain-fall varies between 1000 and 1500 mm and the annual average temperature rangesbetween 13 and 27 °C (BoA 2013). The topography comprises uneven and raggedmountainous highlands, extensive plains and few deep gorges. The area is part ofthe most degraded and eroded parts of the regional state of Amhara. The commonsoil types are nitosol and vertisol. The dominant land use system is farming coveringalmost 46% of the district followed by small forest patches, in which almost 50%of it belonging to the so-called church forests. The district has a total population of259, 113 of which 98% are members of the EOTC (CSA 2007).
Out of 1404 church forests in that administrative zone (South Gondar adminis-trative zone), 10 church forests were selected for the study. The selection criteriafocused on forests being bigger than 1 ha and of comparable altitude, with the excep-tion of Abune Aregawi church forest (0.7 ha) which was included as it is located in astrategic location and useful as a stepping stone to link other forests ecologically. Allstudied forests are located in so called the buffer zones of the Lake Tana BiosphereReserve and cover a total area of 89.3 ha (Table 1).
The church forests sizes varied between 0.7 and 44.2 ha; most churches wereestablished between 368 and 1984 A.D (Wassie et al. 2010). Out of the 10 selectedchurch forests, only 5 served for pilot measures and monitoring.

Saving the Last Endemic-Church Forests in Ethiopia: The Case … 199
Fig. 1 Location of the study area in the SouthGondar Administrative Zone, at Lake TanaBiosphereReserve, Ethiopia (NABU 2017)
Table 1 Characteristics of the 10 pilot church forests selected for the study
Name of church andforest
Altitude (m) Forest area (ha) No. of plots*
Abune Aregawi 1846 0.7 2
Denbiso Abo 1906 1.85 4
Wagira Mariam 1888 2.5 8
Aba Libanos 1932 2.8 11
Wonchet Michail 1935 6.2 12
Fisa Michail 1846 6.9 16
Woyebila k/miheret 1878 7.43 22
Zara Michail 1906 8.3 21
Gindatemem 1863 8.4 27
Wolet Ppetros 1797 44.2 20
*Each plot measures 10 m×10 m
Data Collection
In all 10 forests, a randomly oriented transect linewas laid out with 10m×10mplotslocated at a distance of 50malong transects.Other transectswere then laid out parallelto this first transect, at 50 m distance from each other. For the largest forest, WoletePetros, 44.2 ha, transects and sample plots laid at 100m intervals. Consequently, 2–27plots were established in each forest depending on their size leading to 148 samplingplots. For each church forest, the forest borders were mapped and the areas coveredby trees within the boundaries were calculated (Fig. 2). The areas occupied by churchbuildings as well as other non-forested sites were measured and subtracted from the

200 T. Kassahun and S. Bender
Fig. 2 Aerial photograph of a typical church forest surrounded by arable land at Lake Tana Bio-sphere Reserve (Photo Prof. Michael Succow)
total area to reach the actual forest area. The altitude of the forests was determined atthe central locationwithin the forest. In each sample plot, tree and shrub species, wereidentified and counted to estimate the number of individuals per species. Diameter at1.3 m height was measured for each tree in the sample plots having >5 cm diameterand >1.3m height and the number of saplings with <1 cm diameter and <1.3m heightwas recorded in each sample plot. Seedlings were counted in a 5 m×5 m sub-plotswithin each of the main 10 m×10 m plots. Plants with multiple stems at or below1.3 m height were treated as a single individual. The heights of all woody specieswere measured using a hypsometer and meter tape. Leaf litter depth was measuredfrom the litter surface to bare organic soil at 4 points, one at the centre, at two cornersand one in the middle of one side of each plot. The number of clearly visible cattletrails and dead stumps (>5 cm diameter) were recorded for each plot. Common andscientific names of all woody species where identified and recorded. Identificationwas done using Hedberg and Edwards (1995), Edwards et al. (1995, 2000), Azeneet al. (1993).
In-depth interviews were also conducted with church priests, community leadersand guards. Furthermore, site visits with guided walks led by persons assigned fromthe churches and additional support from satellite images, served to document thephysical features of the church forest systems. Focus group discussions were alsoconducted covering different groups such as elders, influential leaders within thecommunity, women who are commonly engaged in fuel wood collection and youthwho are frequently landless and I need of income.
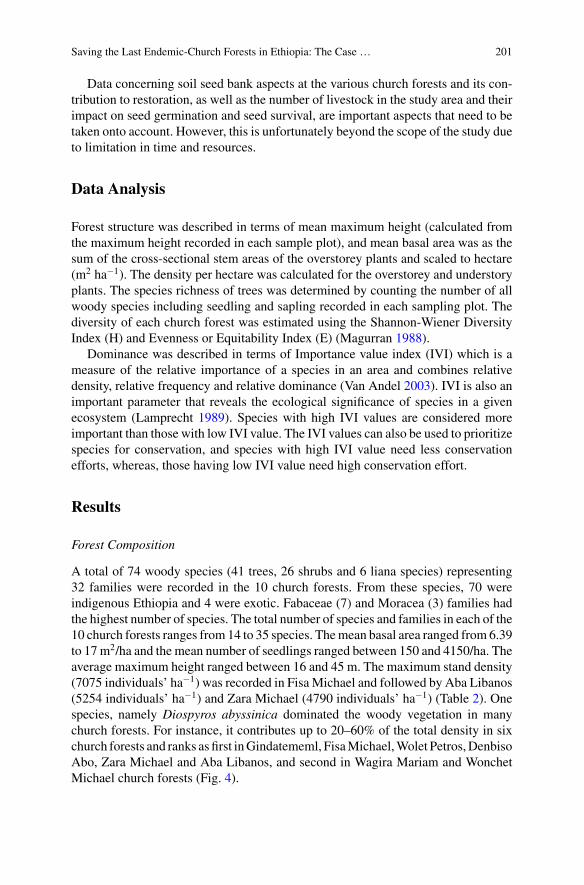
Saving the Last Endemic-Church Forests in Ethiopia: The Case … 201
Data concerning soil seed bank aspects at the various church forests and its con-tribution to restoration, as well as the number of livestock in the study area and theirimpact on seed germination and seed survival, are important aspects that need to betaken onto account. However, this is unfortunately beyond the scope of the study dueto limitation in time and resources.
Data Analysis
Forest structure was described in terms of mean maximum height (calculated fromthe maximum height recorded in each sample plot), and mean basal area was as thesum of the cross-sectional stem areas of the overstorey plants and scaled to hectare(m2 ha−1). The density per hectare was calculated for the overstorey and understoryplants. The species richness of trees was determined by counting the number of allwoody species including seedling and sapling recorded in each sampling plot. Thediversity of each church forest was estimated using the Shannon-Wiener DiversityIndex (H) and Evenness or Equitability Index (E) (Magurran 1988).
Dominance was described in terms of Importance value index (IVI) which is ameasure of the relative importance of a species in an area and combines relativedensity, relative frequency and relative dominance (Van Andel 2003). IVI is also animportant parameter that reveals the ecological significance of species in a givenecosystem (Lamprecht 1989). Species with high IVI values are considered moreimportant than those with low IVI value. The IVI values can also be used to prioritizespecies for conservation, and species with high IVI value need less conservationefforts, whereas, those having low IVI value need high conservation effort.
Results
Forest Composition
A total of 74 woody species (41 trees, 26 shrubs and 6 liana species) representing32 families were recorded in the 10 church forests. From these species, 70 wereindigenous Ethiopia and 4 were exotic. Fabaceae (7) and Moracea (3) families hadthe highest number of species. The total number of species and families in each of the10 church forests ranges from 14 to 35 species. Themean basal area ranged from 6.39to 17m2/ha and the mean number of seedlings ranged between 150 and 4150/ha. Theaverage maximum height ranged between 16 and 45 m. The maximum stand density(7075 individuals’ ha−1) was recorded in Fisa Michael and followed by Aba Libanos(5254 individuals’ ha−1) and Zara Michael (4790 individuals’ ha−1) (Table 2). Onespecies, namely Diospyros abyssinica dominated the woody vegetation in manychurch forests. For instance, it contributes up to 20–60% of the total density in sixchurch forests and ranks as first inGindatememl, FisaMichael,Wolet Petros,DenbisoAbo, Zara Michael and Aba Libanos, and second in Wagira Mariam and WonchetMichael church forests (Fig. 4).

202 T. Kassahun and S. Bender
Table2
Areaof
forest(ha),S
pecies
richness,M
eanbasalarea(m
2/ha,calculated
from
individu
alswith
dbh>5cm
),meandensity
(num
berof
individu
als/ha),
averagemaxim
umheight
andIV
Ifoundin
the10
church
forests
Density/ha
Nam
eof
church
and
forest
Forestarea
Richn
ess
Baselarea
m2/ha
Seedlin
gSa
pling
Tree
Totalstem
Shannon
index(H
)Evenn
ess
IVI(To
p10)
Abune
Aregawi
0.7
176.81
600
800
700
2100
2.45
0.87
207
Denbiso
Abo
1.85
1410.30
2450
525
725
3700
1.82
0.69
242
Wagira
Mariam
2.5
169.61
1150
1650
375
3175
1.70
0.61
266
Aba
Libanos
2.8
246.97
3927
964
364
5254
1.81
0.57
280
Wonchet
Michail
6.2
2311.92
150
475
258
883
2.69
0.86
181
Fisa
Michail
6.9
2117.81
4150
1438
206
7075
1.70
0.56
265
Woyebila
k/miheret
7.43
3511.86
2291
1268
514
4075
2.42
0.68
214
Zara
Michail
8.3
2415.52
4043
533
214
4790
1.96
0.61
277
Gindatemem
8.4
3311.23
3448
830
256
4533
1.73
0.49
214
Wolet
Petros
44.2
326.39
1205
910
750
2185
2.29
0.66
224

Saving the Last Endemic-Church Forests in Ethiopia: The Case … 203
0 500
10001500200025003000350040004500
Stem
den
sity
/ ha
Name of Church Forest
Population structure of all woody species Seedling Sapling Tree
Fig. 3 The population structure of all woody species in ten church forest
Forest Structure
Based on structural features such as basal area, density and vegetation height, theforest differed broadly (Table 2). The population structure of woody species showedhigher stem densities in the lower diameter classes (seedling and sapling) and pro-gressively declining stem densities with increasing diameter classes (tree) in manyof selected church forests. A greater proportion of individuals of all woody species,were found in lower diameter size classes, compared to larger diameter size in manyof church forests. This forest condition resembles inverted “J” shape (Fig. 3). Thepopulation structure of some dominant species showed different population structurethan the normal structure observed in all woody species (Fig. 4).Mimusops kummeland Albiia shimperiana showed broken “J” structure indicating a failure of repro-duction. Species like Celtis africana and Ehretia cymosa showed broken inverted“J” shape, although there is relatively good early recruitment and establishment ofseedlings but showing failure of further development to sapling and mature tree.
Species Richness and Diversity
The church forest varied in their species richness and diversity. Species numberranged from 14 to 35. The Shannon’s diversity index was maximum in WonchetMichail (2.69) followed by Abune Aregawi (2.45) and Weybila K/Miheret (2.42),while the evenness measure was 0.86, 0.87 and 0.68 respectively (Table 2).Only three woody species (Diospyros Abyssinia, Millettia ferruginea and Crotonmacrostachyus) were found commonly in all 10 church forests. Species richness anddiversity values decreased with altitudes.
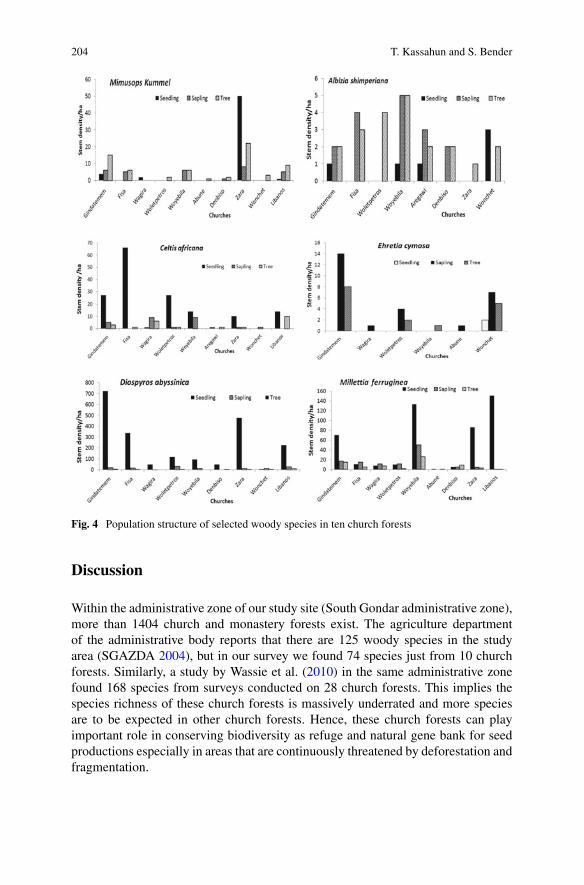
204 T. Kassahun and S. Bender
Fig. 4 Population structure of selected woody species in ten church forests
Discussion
Within the administrative zone of our study site (South Gondar administrative zone),more than 1404 church and monastery forests exist. The agriculture departmentof the administrative body reports that there are 125 woody species in the studyarea (SGAZDA 2004), but in our survey we found 74 species just from 10 churchforests. Similarly, a study by Wassie et al. (2010) in the same administrative zonefound 168 species from surveys conducted on 28 church forests. This implies thespecies richness of these church forests is massively underrated and more speciesare to be expected in other church forests. Hence, these church forests can playimportant role in conserving biodiversity as refuge and natural gene bank for seedproductions especially in areas that are continuously threatened by deforestation andfragmentation.

Saving the Last Endemic-Church Forests in Ethiopia: The Case … 205
Although the size of the assessed church forests varies from 0.7 to 44.2 ha, therewas no indication regarding a trend between species richness and forest area. Theabsence of a relationship between species richness and forest area was also reportedin other studies (Haig et al. 2000; Santos et al. 2007; Wassie et al. 2010). However,in some of the larger forest patches such as Wolet petros (44.2 ha) and Zara Michail(8.3 ha) slightly more species were recorded.
This could be attributed to ecological processes like island effects (Hill andCurran2003) and also to sampling effects, in bigger forest patches containing more plotsthat sampled more of the community (Hill and Curran 2001). The edge effect couldalso be one factor why smaller church forests had still relatively higher richness. Theedge effect may have increased the niches available inside the forest and disturbancesfavouring species in these smaller patches (Wassie et al. 2010). Even though largerpatches of forest are important for maintaining a viable population, small patches orremnants forests role should not be neglected (Fisher and Lindenmayer 2002).
In our study,we observed a small trend in species richness decreasingwith increas-ing altitude. Our finding is supported by an earlier study byWassie et al. (2010)whichfound a similar decrease in species richness in 28 church forests. Other studies inthe tropics also confirm species richness and diversity declining at higher altitude(Mohandass et al. 2017; Lacoul and Freedman 2006). When it comes to structuralcomposition of the forests, human influence had a strong effect on all church forestsexcept Zara Michael forest, which is fully protected with stone walls surroundingthe entire forest boundary. Hence, Zara Michael had the lowest stump density com-pared to the other forests. The other forests typically faced high degrees of exposureto human and animal pressure. The majority of the shrubs and herbaceous speciesfound at the external boundary of the forests are browsed or the seedlings are tram-pled. In the smaller church forests such as Aba Libanos, similar challenges wereobserved, but the threat was more severe as the forest area was very small and manytall trees were removed for construction and as income source for the church.
Local Communities’ Perception Towards Church Forests
The various respondents stress the church forests as an intrinsic part of socio-religiouspractice within the Orthodox Christian religion. Even though they are important forreligious and social services, they are not protected officially for their ecosystem ser-vices or biodiversity. Furthermore, they do not offer direct benefits to communities’livelihoods as for instance communal property or resources provide. Only nuns andmonks who live or work in the church forest compounds benefit directly throughcollection of fruits etc. However, community members stress the significance of pro-tecting the forest as it belongs to the church and this attitude of belonging to thechurch was found as a good deterrence against overuse of church forest resourcesat least in most of the forests (Klepeis et al. 2016). From an economic perspectiverespondent refer the benefits of the forest for collecting fodder grass, trees seeds andeven seedlings, which can be bought directly from some church forests.
When it comes to the level of degradation, the community does not principallyagree with the premise that the forests are degraded and in danger of being lost.Nevertheless, they emphasize on the lack of proper management and replacing cut

206 T. Kassahun and S. Bender
trees with seedlings. Furthermore, the tendency of replacing indigenous tree speciessuch as Mimmusops kummel or Albiia shimperiana with income generating speciessuch as Coffea arabica or foreign species which have a direct negative impact on theecology of the respective ecosystem likeEucalyptus spp. is concerning.Nevertheless,some respondents consider these procedures as the right approach for sustaining thechurches financially. As future solution, the majority of the respondents suggestederecting stone wall around the forest for multiple reasons: Firstly, it can clearlydemarcate the boundary of the church from the surrounding arable lands; secondly,it prevents cattle from ranging freely in the forest while disturbing the ecosystemseverely, and finally it adds prestige to the church (Klepeis et al. 2016).
Application of the Results to Church Forest Managementand Conservation
NABU’s aim is to conserve the church forests at Lake Tana Biosphere Reserve asshelter sites for species and biodiversity and buffer against climate change impactsand to develop schemes for conservation and restoration of the church forests. Takinginto account the main outcomes of the study and continuous discussion with thelocal community and church community, free grazing near the church forest, illegaldeforestation and farmland encroachment towards the forestwere identified as criticalproblems (Fig. 5).
Church forests have existed for hundreds of years due to strongbut largely informalindigenous protection systems backed by the local community’s shared religiousvalues and traditions (Wassie and Teketay 2006; Klepeis et al. 2016). In addition,the recent establishment of the Lake Tana Biosphere Reserve will definitely helpin ending the continuous cycle of ecological degradation in the area. Most of thechurch forests surrounding the lake fall within the biosphere reserve region. Ideally,this gives them further protection and makes them useful to restore deforested landsin the area (zur Heide 2012). In our study, we surveyed 10 church forests and founda total of 74 woody species and an indigenous tree such as Prunus africana, which isincluded in the IUCN red list of threatened species (IUCN 2006). Thus, these forestsare very critical and serve as refuge for many indigenous species in the area. Thismakes the conservation of church forests as the priority in the biosphere reserve.
Following the study results and conducting intensive literature review, NABUimplemented the conservation program on church forests successfully. The inter-ventions focus on: (1) maintaining forest species diversity and ecosystem servicesby supporting efforts that help for regeneration of various species within the forest;(2) expanding the forest size in areas where possibilities exist; (3) creating bufferzones and interconnections between the church forests; and (4) establishing areaclosures to improve degraded areas.

Saving the Last Endemic-Church Forests in Ethiopia: The Case … 207
Fig. 5 A stone wall fence surrounding a church forest at Lake Tana Biosphere Reserve (PhotoAngelika Berndt)
Moreover, NABU in collaboration with the local community and the churchesstarted erecting stone wall around the five target church forests. Stone walls haveshown clear ecological benefits: (1) enhancing the regeneration potential by protect-ing seedlings from disturbance, reducing edge effects and grazing threats (Wassieet al. 2009) and (2) improving the floristic composition of the seedlings in the forestespecially for species with low regeneration status such as O. europaea ssp. (Woodset al. 2017).
As part of the applied integrated approach to protect the church forests, a model ofecological corridors network has been developed to deal with the effect of fragmen-tation and loss of corridors between patches. Hence, the concept of interconnectingthe selected five church forests by decreasing the distance between them and bycreating buffer areas around them (such as area enclosures) as well as developingmore vegetation patches in the landscape has been followed (Fig. 6). The selectedforests showed clear potential for expanding them. Therefore, NABU together withthe local administration andwith active community participation started reforestationand enrichment planting with endemic species (e.g.Mimusops kummel) that show alow natural regeneration capacity and are under threat of disappearing. As it is alsoa keystone species, it can speed up restoration.
So far there is great enthusiasm among the leaders of selected church forests andlocal communities living in the vicinity of the churches. They have been activelyengaging and participating in the conservation efforts and erection of stone wall. Inthe future, it will be important to monitor how effective the stone walls have been in
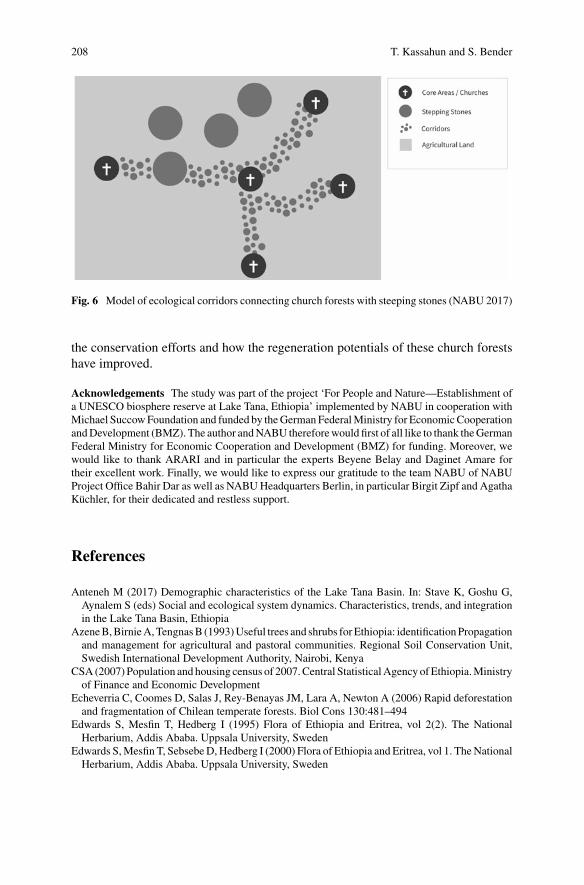
208 T. Kassahun and S. Bender
Fig. 6 Model of ecological corridors connecting church forests with steeping stones (NABU 2017)
the conservation efforts and how the regeneration potentials of these church forestshave improved.
Acknowledgements The study was part of the project ‘For People and Nature—Establishment ofa UNESCO biosphere reserve at Lake Tana, Ethiopia’ implemented by NABU in cooperation withMichael SuccowFoundation and funded by theGerman FederalMinistry for EconomicCooperationandDevelopment (BMZ). The author andNABU thereforewould first of all like to thank theGermanFederal Ministry for Economic Cooperation and Development (BMZ) for funding. Moreover, wewould like to thank ARARI and in particular the experts Beyene Belay and Daginet Amare fortheir excellent work. Finally, we would like to express our gratitude to the team NABU of NABUProject Office Bahir Dar as well as NABUHeadquarters Berlin, in particular Birgit Zipf and AgathaKüchler, for their dedicated and restless support.
References
Anteneh M (2017) Demographic characteristics of the Lake Tana Basin. In: Stave K, Goshu G,Aynalem S (eds) Social and ecological system dynamics. Characteristics, trends, and integrationin the Lake Tana Basin, Ethiopia
AzeneB,BirnieA,TengnasB (1993)Useful trees and shrubs forEthiopia: identificationPropagationand management for agricultural and pastoral communities. Regional Soil Conservation Unit,Swedish International Development Authority, Nairobi, Kenya
CSA (2007) Population and housing census of 2007.Central StatisticalAgency ofEthiopia.Ministryof Finance and Economic Development
Echeverria C, Coomes D, Salas J, Rey-Benayas JM, Lara A, Newton A (2006) Rapid deforestationand fragmentation of Chilean temperate forests. Biol Cons 130:481–494
Edwards S, Mesfin T, Hedberg I (1995) Flora of Ethiopia and Eritrea, vol 2(2). The NationalHerbarium, Addis Ababa. Uppsala University, Sweden
Edwards S,Mesfin T, SebsebeD,Hedberg I (2000) Flora of Ethiopia and Eritrea, vol 1. TheNationalHerbarium, Addis Ababa. Uppsala University, Sweden

Saving the Last Endemic-Church Forests in Ethiopia: The Case … 209
Fischer J, Lindenmayer DB (2002) Small patches can be valuable for biodiversity conservation:two case studies on birds in south-eastern Australia. Biol Conserv 106:129–136
Food and Agriculture Organization of the United Nations (FAO) (2005) Irrigation in Africa infigures AQUASTAT Survey—2005. FAO Water Reports
Haig AR, Matthes U, Larson DW (2000) Effects of natural habitat fragmentation on the speciesrichness, diversity, and composition of cliff vegetation. Can J Bot 78:786–797
Hedberg I, Edwards S (1995) Flora of Ethiopia and Eritrea, vol 7. Uppsala University, The NationalHerbarium, Sweden, Addis Ababa
Hill JL, Curran PJ (2001) Species composition in fragmented forests: conservation implications ofchanging forest area. Appl Geogr 21:157–174
Hill JL, Curran PJ (2003) Area, shape and isolation of tropical forest fragments: effects on treespecies diversity and implications for conservation. J Biogeogr 30:1391–1403
Intergovernmental Panel for Climate Change (IPCC) (2007) In: Parry M, Canziani O, Palutikof J,van der Linden P, Hanson C (eds) Climate change 2007: Impacts, adaptations and vulnerability.Contribution ofWorking Group II to the Third Assessment Report of the Intergovernmental Panelon Climate Change. Cambridge University Press, Cambridge
IUCN (2006) IUCN Red List of Threatened Species. www.iucnredlist.orgKlepeis P, Orlowaska IA, Kent EF, Cardelus CL, Scull P, Wassie A, Woods C (2016) Ethiopianchurch forests: A hybrid model of protection. Human Ecol 44:715–730
Lacoul P, Freedman B (2006) Relationships between aquatic plants and environmental factors alonga steep Himalayan altitudinal gradient. Aquat Bot 84:3–16
Lamprecht H (1989) Silviculture in the tropics: tropical forest ecosystems and their tree species-possibilities and methods for their Long-term utilization. Deutsche Gesellschaft Fur TechnischeZusammenarbeit (GTZ) GmbH, Eschborn, Germany
LaurenceW, Camargo JLC, Luizao RCC (2011) The fate of Amazonian forest fragments: a 32-yearinvestigation. Conserv Biol 144:56–67
Laurence W, Ferreira L, Rankin-de Merona J, Laurence S (1998) Rain forest fragmentation and thedynamics of Amazonian tree communities. Ecology 79:2032–2040
Liang J, Reynolds T,Wassie Eshete A, Collins C,Wuubalem A (2016) Effects of Exotic Eucalyptusspp. Plantations on Soil Properties in and around sacred natural sites in the Northern EthiopianHighlands. AIMS Agriculture and food 2:175–193
Magurran AE (1988) Ecological diversity and its measurement. Chapman and Hall, LondonMillennium Ecosystem Assessment (MEA) (2005) Ecosystem and human well-being: our humanplanet. Island Press, Summary for policy makers
Mohandass D, Campbell MJ, Hughes AC, Mammides C, Davidar P (2017) The effect of altitude,patch size and disturbance on species richness and density of lianas in montane forest patches.Acta Oecol 83:1–14
Nkem J, Santoso H,Murdiyarso D, BrockhausM, KanninenM (2007) Using tropical forest ecosys-tem goods and services for planning climate change adaptationwith implications for food securityand poverty reduction. J Semi-Arid Trop Agri Res 4(1):1–23
SGAZDA (2004) South Gondar zonal department of agriculture: annual report. Gondar, EthiopiaSantos K, Kinoshita LS, dos Santos FAM (2007) Tree species composition and similarity in semideciduous forest fragments of south-eastern Brazil. Biol Cons 135:268–277
Van Andel TR (2003) The distance of measures in physiological sampling. Ecology 47:451–460Wassie A (2002) Opportunities, constraints and prospects of the Ethiopian Orthodox TewahidoChurches in conserving forest resources: The case of Churches in South Gondar. Swedish Uni-versity of agricultural Sciences, Uppsala, Northern Ethiopia
WassieA, Sterck FJ, TeketayD, Bongers F (2009) Effects of livestock exclusion on tree regenerationin church forests of Ethiopia. For Ecol Manage 257:765–772
Wassie A, Sterck FJ, Bongers F (2010) Species and structural diversity of church forests in afragments Ethiopian highland landscape. J Veg Sci 21:938–948
Wassie A, Teketay D (2006) Soil seed banks in church forests on northern Ethiopia: implicationsfor the conservation of woody plants. Flora. 201:32–43

210 T. Kassahun and S. Bender
Woods CL, Cardelus C, Scull PA,Wassie E, BaezM, Klepeis P (2017) Stone walls and sacred forestconservation in Ethiopia. Biodiv Conserv 26(1):209–221
Zambrano J, Coates R, Howe HF (2014) Effects of forest fragmentation on the recruitment successof the tropical tree Poulsenia armata at Los Tuxtlas, Veracruz, Mexico. J Trop Ecol 30:209–218
zur Heide F (2012) Feasibility study for a Lake Tana Biosphere reserve, Ethiopia. Federal Agencyfor Nature Conservation. Retrieved December 17, 2017
Factors Affecting Communicationand Information Sharing for WaterResource Management in Lake VictoriaBasin (LVB)
Odongtoo Godfrey, Ssebuggwawo Denis and Lating Peter Okidi
Abstract Lake Victoria Basin (LVB) is a very important resource for the five ripar-ian countries: Uganda, Kenya, Tanzania, Rwanda and Burundi. The basin providesresources for fishing, agriculture, medicine, forestry, water transport and other eco-nomic activities. However, its area is grossly affected by climate change due topopulation growth, urbanization, industrialization, increasing commercial activitiesand inadequate provision of sanitation services which have caused a lot of pollution.This climate change is likely to lead to loss of biodiversity in terms of species rich-ness. Moreover, the increase in the population growth around Lake Victoria Basinis associated with an increase in economic activities that lead to ecosystem vul-nerability and social-ecological disequilibrium. Climate change is likely to affectbiodiversity as species struggle to adapt to climatic changes. In order to address theissue of climate change, proper communication and information sharing among thestakeholders around the Lake Victoria Basin is paramount. This paper addresses thisneed, by discussing major socio-economic activities taking place around this Basin,their impact on climate change and its impact on biodiversity thereof, and problemsrelated to resource management. The study took place in the districts of BuikweandMayuge in Uganda. Qualitative and quantitative research approaches were used,data collected was analyzed using Statistical Package for Social Science researchsoftware. From the findings, there are variations in access to communication gad-gets, mobile phones being top on the list of accessibility. The study concludes byidentifying the best option for communication and information sharing based on the
O. Godfrey (B)Department of Information Technology, Makerere University, 7062, Kampala, Ugandae-mail: [email protected]
S. DenisDepartment of Computer Science, Kyambogo University, 1, Kampala, Ugandae-mail: [email protected]
L. P. OkidiDepartment of Electrical and Computer Engineering, Makerere University, 7062, Kampala,Ugandae-mail: [email protected]
© Springer Nature Switzerland AG 2019W. Leal Filho et al. (eds.), Handbook of Climate Change and Biodiversity,Climate Change Management, https://doi.org/10.1007/978-3-319-98681-4_13
211

212 O. Godfrey et al.
factors evaluated and recommends an integrated web-based and mobile applicationtool for better management of resource in Lake Victoria Basin.
Introduction
LakeVictoria is the largest freshwater lake inAfricawith a surface area of 68,800km2
(EAC 2006). It is a very important resource for the five riparian countries: Uganda,Kenya, Tanzania, Rwanda and Burundi. The basin provides resources for fishing,agriculture, medicine, forestry, water transport and other economic activities. How-ever, Lake Victoria Basin is facing problems of drastic climate change due to rapidpopulation growth, urbanization, industrialization, increasing commercial activitiesand inadequate provision of sanitation services which had in turn caused a lot of pol-lution. Climate change is responsible for the deterioration of the quality of water andnatural resources in the Lake Victoria Basin. Increased human activities, poor landuse practices and pollution of water bodies greatly reduce the quantity and qualityof the available water resources in the basin (Okurut 2010).
Without adequate intervention in the management of climate change in LVB, it isclear that the disadvantaged communities will continue to suffer. Managing scarceresources requires the application of appropriate technology, which is embedded intraditional knowledge and some inspired by fresh science research work and newinsight (Mongi et al. 2010). Water resource management is the activity of planning,developing, distributing and managing the optimum use of water resources (Okurut2010). In an idealworld, water resourcemanagement planning seeks to allocatewateron an equitable basis to satisfy all uses and demands (Diggs 1991; Ssozi 2015).
This research arose out of the observation that there has been a steady populationgrowth around Lake Victoria Basin (LVB), a change in climate around the Basin ismanifested by floods, drought events, and sedimentation, etc. The population growthhas over the years led to a number of socio-economic activities which have alsocontributed tremendously to climate change. Moreover, there is no ICT tool that canfacilitate reliable information sharing among the local population and local leadersaround the Basin. There was therefore a need to investigate and identify the majoreconomic activities, the major energy sources, transport means, etc. that can lead toclimate change. There was also a need to identify the available ICT tools currentlyused in the dissemination and sharing of relevant information about environmentconservation around the Basin so as to avoid the effects of climate change on theecosystems and biodiversity. This paper is one of the papers in which we intend toaddress the issues of climate change and its impact on biodiversity and developing atool to address the gap in information dissemination and sharing.
Factors Affecting Communication and Information … 213
Related Work
Climate in Lake Victoria Basin is continuously changing and it is getting worse astime passes. Bad periods are becoming more frequent than before, resulting in poorperformance in agriculture and consequently food shortages in several areas in LVB.This has made farmers from different age groups to acknowledge the impact andare trying to adapt in different ways (Mongi et al. 2010). However, communitiesattempting to adapt to the adverse effects of climatic change are recognizing thepotential role of information and communication technologies (ICTs) in respondingto it (Ngonidzashe and Adekunle 2013).
According to East African Community Development Strategy Assessment (EAC2006), it was revealed that communication and knowledge sharing are vital for waterresources management in Lake Victoria Basin (LVB), and that at the moment, thereare inadequate stakeholders’ participation, inadequate communication and informa-tion sharing strategies; water quality monitoring and evaluation process is entirelymanual. This had led to poor governance of the scarce water resource in LVB(Okurut 2010). Hence, there is a need to develop a tool which can be used by selectedpeople and community leaders to timely communicate and coordinate activities ofgovernance of resources in Lake Victoria Basin.
It is estimated that 200 tons of untreated effluents are discharged into the Lakeeveryday from economic activities around the lake (Okurut 2010). The problemaffects millions of people whose livelihood depends on the natural resource base(UNDP 2007). Decline in volume of water in the basin may also have impacts onthe socio-economic and political stability of the EAC. Some member countries areusing LVB resources without consideration of its sustainability. Examples are; Jinjadam for Hydro-electric Power in Uganda and Shinyanga-Kahama water project inTanzania (UNDP 2007). Management of resources therefore calls for an integratedapproach, in order to address these challenges (Philippe 2011).
Rinawati et al. (2013) noted that climate change creates potential major threatsto global biodiversity. The authors further observed that “the multiple componentsof climate change are projected to affect all pillars of biodiversity, from genes overspecies to biome level”. This is true of the biodiversity around Lake Victoria Basin(LVB) which is threatened by climate change as noted by Case (2006). Case arguesthat because of climate change, the ecosystems and the livelihoods that depend onthem are threatened. Muhweezi (2014) also noted that Biodiversity and ecosystem-specific goods and services in Uganda are likely to be adversely affected by climatechange in the future. This he argues, is due to rising temperatures, whichwill increaseby more than 2 °C by 2030.
Malcom (2003) and Green et al. (2003) noted that “recent reviews demonstratea high confidence that climate change effects are already showing in living things.Despite this, there have been few attempts to model climate change impacts onbiodiversity at the global scale”.
Case (2006) further observed that the effects of climate change such as risingtemperature and changes in precipitation are undeniably clear with impacts already

214 O. Godfrey et al.
affecting ecosystems, biodiversity and people. There are a number of socio-economicactivities being carried out around Lake Victoria Basin. These not only affect the bio-diversity, but also affect the management and governance of the water as a resource.
Weggoro and Ntamubano (2010), suggested that some of the practices in whichgovernance of water resources can be improved includes; increase transparencythrough the provision of information concerning operating policies and procedures,programs, and projects to the general public. Information should be exchanged tostimulate debate, deepen understanding, and nurture new perspectives on trans-boundary environmental challenges and increase efforts to involve the public. Severalconceptual frameworks have been developed to model the relationship between ICTand natural resources under climate change. These model suggests that governanceof such natural resource has a chain of three major underlying components: method-ologies, participation and results which are to bemonitored and evaluated at differentstages (Linuma and Tenge 2017).
Information and Communication Technologies have had an increasing impact oneconomic and social development, resulting from their capacity to generate and dis-seminate information to facilitate the coordination of different actors in and beyondgovernment (Yonazi et al. 2012). ICTs are highly diverse and can be implementedon different scales such as sensor networks, satellite earth stations, meteorologicalsystems and mobile phones that individuals can use to access information, reportproblems or share experiences(Ospina and Heeks 2010; Mongi et al. 2015).
Research Methodology
Study Sites
The study was conducted in Buikwe, and Mayuge districts. Measures were under-taken in choosing the type of community that contributed positively to researchworksthrough random sampling. The rationale for selecting these districts were based onthree factors; First, their location within the Lake Victoria Basin. Second, the major-ity of its population depends on fishing, agriculture, charcoal burning, local herbs andwater transport as their major sources of income. Third, the areas are vastly affectedby decline in water resources and also the community’s willingness to contributetowards achieving the project objectives.
Sampling Procedures
Researchers used probability and non-probability sampling methods. In proba-bility sampling, simple random sampling was employed to come up with repre-sentative of community members from the two villages. In non-probability sam-pling, purposive sampling method was employed to select key informants who pro-vided key information on LVB. These are people who are knowledgeable on cli-matematters, examples, Community Development Officers, Environmental Officers,

Factors Affecting Communication and Information … 215
Law Enforcement Officers, and NGOs working on environments and other povertyeradication program.
Population Size and Distribution
A sample size of 89 respondents from two study areas in Buikwe and Mayugedistricts was selected using Morgan and Krejcie (1970) tables. Both purposive andstratified random sampling procedures were used to ensure representation of allrelevant stakeholders to ease reliability and efficiency in data collection. There were30 key informants and 59 community members.
Data Collection Methods
Primary data collection was done through questionnaires survey using structuredquestionnaire, focused group discussion by using prepared guide questions and keyinformants interview by using interview guide. Questionnairemethod for data collec-tion helped to collect a lot of information in a short time. This enabled the researchersto find out ready information easily for the study. Focus group discussion were donethrough inviting village people such as agricultural extension workers, commercialfarmers, peasant farmers, fisheries, cattle keepers and other communityworkers. Thisaided an efficient digging of information through interaction. The pertinent concernincludingwhy there still exist illegal cutting of trees for charcoal and firewood, illegalfishing tools and corruption was clearly identified.
Reliability and Validity of the Research Approach
To address the issue of reliability, questions were checked to determine if they areprompting the types of responses expected. A pilot test with a small set of peoplefrom the target population was also done and the tools were found reliable. Theobservation protocol/record keeping sheet was also critical in getting credible data.Three experts in the study area of the research (expert in water resource managementand climate change) were used to check and provide guidance on the questionnaireused as a data collection tools.
Data Analysis
The statistical tool, SPSS, was used to generate descriptive statistics and other resultsas discussed in the next section. Content analysis was used for Qualitative data bywhich they were categorized into major themes related to research.
Results
Respondents’ Characteristics
As shown in Fig. 1, majority of the respondents weremale (71.4%)while 28.6%werefemales. 44.8%of the communitymemberswere in the age group 36–50 years. 37.7%

216 O. Godfrey et al.
Fig. 1 Respondent characteristics
of the community members had secondary school education; 22.6% had tertiaryeducation. Most of the respondents (81.3%) had stayed in their current places ofresidence for over 15 years. Low level of education has a impact on the use andadoption of technologies.
Major Economic Activities
As shown in Fig. 2 below, themajor economic activities are crop production (47.2%),fishing (16.3%), small businesses (10%),Wage Laborers (4.5) and Livestock keeping(7.5).
Most of the respondents are involved in crop production and fishing.
ICT Facilities and Uses
As shown in the Fig. 3 below, the most accessible ICT facilities are radio (48.9%),mobile phone (52%) and TV (13.1%). Access to internet is low (2.7%) and computer(2.7%). Community access to information on LVB water resources is low (44%).
Owners of Transport Asset
As shown in the Fig. 4 below, most of the community members use bicycles fortransport (32.6%), boat (5%), motorcycle (4.5%), motor vehicle (1.8) and Boat (5%).There is a big problem of transport as the majority rely on bicycles to facilitatetheir movement. As a result, field officers working for Governments, NGOs, in themanagement of water resources become less effective in performing their duties.
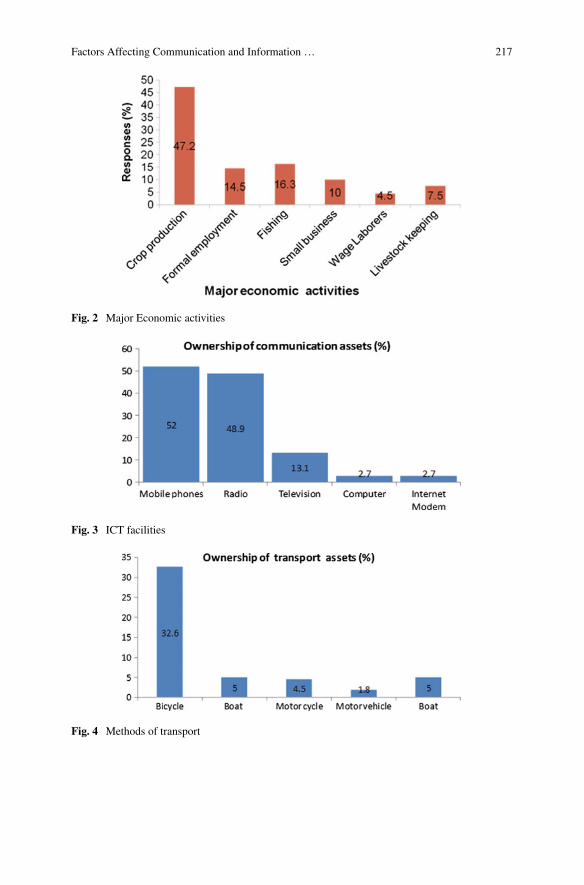
Factors Affecting Communication and Information … 217
Fig. 2 Major Economic activities
Fig. 3 ICT facilities
Fig. 4 Methods of transport

218 O. Godfrey et al.
Fig. 5 Energy source
Major Energy Sources
Figure 5, shows major household energy sources: Kerosene (47.5%); fire-wood/charcoal (57%); grid electricity (7.2%), solar (9%) and Gas (8.6%). The mostaccessible andwidely used energy source is firewood/charcoal. This could be becausethe electricity is still very expensive for the community as well as solar and gas. Theresults of forest cover depletion is felt as people cut down trees for firewood andcharcoal.
Major Governance Issues for Sustainable LVB Water Resources
Figure 6 shows governance issues rating (1–3) in relation to degradation, inadequateparticipation, lack of transparency, lack of equity, lack of coordination, corruptionamong officials and climate change.
Perceived Benefits of LVB Water Resources
The perceived benefits of LakeVictoria basin were; income generation (28.8%), foodsource (28.8%). source of water supply (22%), Tourism (8.3%), Construction sand(5.1%), Timber (3.4%), Weather (10.2%).
Community Perception on Major Causes of LVB Water Resources Degradation
The community perceptions on the causes of Lake Victoria Basin water degradationare; poor governance, high population, deforestation, poor farming methods.
Key Informant Perception on Major Causes of LVB Water Resources Degradation
The key informant perception onmajor causes of LakeVictoria Basinwater resourcesdegradation is; illegal fishing activities, negligence of people, lack of employment,poverty, inadequate knowledge, industrial activities, limited community participationand awareness, mining activities, poor enforcement of laws and regulations.

Factors Affecting Communication and Information … 219
Fig. 6 Major governance issues
Weaknesses in Existing Policies on LVB Water Resource Management
Major Weaknesses in the existing policies on Lake Victoria Basin resource man-agement are; Lack of enforcement of laws, Limited community participation andawareness.
Discussion
Since there is low level of education as indicated in the results, the design of ICTtechnologies needs to be user friendly, and must be community oriented if success isto be achieved. The fact that the majority of the respondents stayed in their currentplace for a long time, implies that they have really felt the effect of climate changeand their report was therefore trusted.
The most accessible ICT facilities are mobile phones (52%) and the access tointernet and computer is still low (2.7%). Given this situation in mind, the successof any resource management tool for community, should be developed under com-munity context and therefore consideration on the gadgets owned by those people isworth mentioned. Hence, the system should integrate internet and mobile phone.
Most of the respondents are involved in crop production and fishing. The increasein population around Lake Victoria has a big effect on the forest cover as peopleclear bushes to pave way for crop production hence resulting into adverse effect ofclimate change. Also fishing practices need to be totally streamlined as many peopleget involved as a way of survival because of lack of employment.

220 O. Godfrey et al.
The major accessible household energy source is firewood/charcoal (57%) whilethe lowest is Gas (8.6%). This had again impacted on forest cover since the growingpopulation cut down trees indiscriminatively for charcoal and firewood. The littleuse of electricity could be due to it being expensive which is not affordable to thelocal community. Governance issues in relation to degradation, inadequate partici-pation, lack of transparency, lack of equity, lack of coordination, corruption amongofficials have been found as a serious problem. The proposed ICT technology willcurb down this vices by adequately aiding the community participation and efficientimplementation of policies on LVB.
Limitation and Constraints of the Study
Lake Victoria Basin covers five countries including Uganda, Kenya, Tanzania,Rwanda and Burundi. For this exploratory and preliminary study it was not pos-sible to visit all the countries of the East African Community (EAC) due to logisticalconstraints. However, this will be the case in future when the current logistical con-straints are solved. There was apprehension from some of the research participantswho never wanted to be interviewed or fill the questionnaire having known that theresearch is about the activities they are involved in around the Lake. This took theresearchers a lot of time to identify willing participants to take part in the study.
Conclusion, Recommendations and Further Research
Conclusion
This study examined the challenges being faced and the impact of climate changeon water resource and biodiversity around Lake Victoria Basin. A number of majoreconomic activities and energy sources were identified and these have been found tohave an effect on climate. It was also discovered that participation of all stakehold-ers in the governance of water resources is paramount if success in curbing downchallenges facing water bodies due to adverse effect of climate change is to be real-ized. Furthermore, it revealed that there is no way participation in governance can beachieved unless there is a reliable communication system in place. Since stakeholdersare different and complex in nature, and given the fact that they are equipped withdifferent communication gadgets, there is need for an integrated system to bring allpersons on board which will enhance water resource governance in LVB. Also, thestudies noted that there are weaknesses in the enforcement of policies as well as littleawareness of those policies. This could be so, because of lack of reliable communi-cation platform which can help stakeholders to share and coordinate information ongovernance. The government and other non-state actors should invest more money toproduce a reliable communication system to coordinate the activities of governance.

Factors Affecting Communication and Information … 221
Recommendations
The proposed recommendation to curb down challenges affecting Lake VictoriaBasin is; improved enforcement of rules and regulations, high community involve-ment in the management of water resources, awareness creation, fight against cor-ruption and improved communication among stakeholders. We recommend that asystem should be developed to enhance effective communication at all levels of gov-ernance. According to the findings, the most communication gadgets available tothe population that are commonly in use are; Mobile Phones, Internet, Radios andTelevision sets. This implies that the ICT tool to be developed should incorporate atleast two of these communication gadgets.
The researchers recommend an integrated mobile application tool which willincorporate mobile phone, internet and web-based in one platform. This tool willbe used by selected people such as key informants, community leaders, Govern-ment workers concerned with LVB, NGOs etc. in enhancing management of waterresources in LVB.
Lessons Learned and Further Research
This study revealed thatmajority of the people around the LakeVictoria Basin are un-ware of the dangers posed by their economic activities. Moreover, the local leaderslack effective and efficient means of disseminating and sharing the information aboutthe dangers brought about by climate change and its impact on the ecosystems,biodiversity and the water resource.
Areas for further research include developing an ICT tool that integrates all theavailable communication channels. This toolwill be used to enhance communication,dissemination and sharing of information about methods and procedures that can betaken to preserve and protect the shores and waters of LVB.
Acknowledgements Many thanks goes to the local communities and leaders in the study areas forcooperating with us in providing the reliable information necessary for this study. Special thanksto SIDA secretariat—Makerere University in Uganda for the sponsorship and Busitema University,without whose support this studies would not have been possible.
References
CaseM(2006)Climate change impacts onEastAfrica.A reviewof the scientific literature. Publishedby WWF-World Wide Fund For Nature (formerly World Wildlife Fund), Gland, Switzerland.Available https://www.wwf.or.jp/activities/lib/pdf_climate/environment/east_africa_climate_change_impacts_final.pdf. Retrieved 12th Jan 2018
Diggs D (1991) Drougth explerience and perception of climate change among great plains farmers.Great Plains Res J Nat Soc Sci Res 1(1):114–132 University of Nebraska Press
East African Community (EAC) (2006) Popular version of the shared vision and strategy frameworkfor management and development of Lake Victoria Basin East African Community Secretariat,Arusha. Retrieved from www.lvbcom.org. Accessed on 12 Dec 2017

222 O. Godfrey et al.
Green RE et al (2003) Global climate change and biodiversity. In: Proceedings of the 3rd interna-tional conference on Global climate change and biodiversity. University of East Anglia, Norwich,UK, organized jointly by theRSPB,WWF-UK,EnglishNature,UNEP-WorldConservationMon-itoring Centre and the Tyndall Centre for Climate Change Research
Krejcie RV, Morgan DW (1970) Determining sample size for research activities. Educ PsycholMeasur 30(3):607–610
Linuma OF, Tenge AJ (2017) Challenges of formal institutions in water resources management inthe Lake Victoria Basin. Int J Modern Soc Sci 6(1):34–50
Malcolm JR (2003) Models of the global impact of climate change on biodiversity and adaptiveresponses. In: Proceedings of the 3rd International conference on Global Climate Change andBiodiversity. University of East Anglia, Norwich, UK, organized jointly by the RSPB, WWF-UK, English Nature, UNEP-World Conservation Monitoring Centre and the Tyndall Centre forClimate Change Research
Mongi HJ, Majule AE, Lyimo JG (2010) Vulnerability and adaptation of rain fed agriculture toclimate change and variability in semi-arid Tanzania. Afr J Environ Sci Technol 4(6):371–381
Mongi HJ, Mvuma AN, Kucel SB, Tenge AJ, Gabriel M (2015) Accessibility and Utilization ofmobile phone for governance of water resources in the lake victoria Basin: Constraints andOpportunities in Tanzania. Afr J Environ Sci Technol 9(5):438–450
Muhweezi, AB (2014)An overviewof climate change and biodiversity inUganda.African andLatinAmericanResilience toClimateChange Project. Tetra TechARDProject. Produced for theUnitedStates Agency for International Development by Tetra Tech ARD, through a Task Order underthe Prosperity, Livelihoods, and Conserving Ecosystems (PLACE) Indefinite Quantity ContractCore Task Order (USAID Contract No. AID-EPP-I-00-06-00008, Order Number AID-OAA-TO-11-00064). Available http://pdf.usaid.gov/pdf_docs/PA00JZQG.pdf. Retrieved on 16th Jan2018
Ngonidzashe Z, Adekunle O (2013) Role of information and communication technologies (ICTs) inmitigating, adapting to and monitoring climate change in developing countries In: Internationalconference on ICT for Africa 2013, Feb 20–23, Harare, Zimbabwe
Okurut T (2010) Integrated environmental protection approaches: strengthening the role of watersupply operators in resource conservation. In: 15th international african water congress andexhibition commonwealth resort, Munyonyo, Kampala, Uganda
Ospina A, Heeks R (2010) Linking ICTs and climate change adaptation: enabling innovative strate-gies. Centre for Development Informatics, University of Manchester. www.seachangecop.org.Retrieved 15th Sept 2017
Philippe G (2011) ICT for Water efficiency. In: Environmental Monitoring. Nice Sophia AntipolisUniversity/Polytech Nice Sophia, France: INTECH. http://www.intechopen.com/books/environmental-monitoring. Retrieved 22nd Dec 2017
Rinawati F, Stein K, Lindner A (2013) Climate change impacts on biodiversity—the setting of alingering global crisis. Biodiversity 5(1):114–123
Ssozi F, Blake E, Rivett U (2015) Designing for sustainability: involving communities in developingICT interventions to support water resource management. In: Cunningham P, Cunningham M(eds) IIMC International Information Management Corporation. https://doi.org/978-1-905824-51-9. Retrieved 30th Dec 2017
United Nations Development Programme (UNDP). (2007). Human development report : fightingclimate change, human solidarity in a divided world. UNDP, New York. http://www.preventionweb.net/files/2272_hdr20072008summaryenglish.pdf. Retrieved 20th Jan 2018
Weggoro N, Ntamubano W (2010) EAC governance structure with regard to water shade manage-ment. In: Paper presented at the symposium on science and policy linkages or transboundarywater management. http://www.eac.int/environment/index.php. Retrieved 21st Sept 2017
Yonazi E, Kelly T, Halewood N, Blackman C (2012) The transformational use of information andcommunication technologies in Africa. Report by African Development Bank and World Bank.http://www.etransformafrica.org. Retrieved 22nd Aug 2017
Climate Sentinels Research Program:Developing Indicators of the Effectsof Climate Change on Biodiversityin the Region of New Aquitaine (SouthWest, France)
Fanny Mallard and Laurent Couderchet
Abstract Understanding local effects of climate change on biodiversity are essentialfor environmental policy orientation. Lacks of knowledge at regional level have ledto the development of a research program: “Climate sentinels” (www.sentinelles-climat.org). A research hypothesis is that the effects can be studied from indicatorsof species that have weak displacement. These “sentinel” species will be the firstto respond to local climatic variations by adaptation or local extinction. In France,New Aquitaine region is a relevant research laboratory. It offers both sensitivity toclimate change and a variety of natural ecosystems. The approach to understandingthe response of these indicators to climate change is based on observations in a wholeregion, standardized protocols in relationship with models using mainly abundancedata, validated data linked to associated sufficient coverage and relevant observationsin connection with time and space scales. In this paper, we will present 3 pointscharacterizing this project: (1) the research-action approach of the program bringstogether different types of actors (decisionmakers, naturalists, managers, researchersand the public),within an independent organisation and catalyst “CistudeNature”, (2)themethod of establishing a list of development indicators called “Climate sentinels”,(3) the protocols and data analysis of multi-ecosystems, multi-species at differentscales that are used to support projections of climate change impacts on biodiversity.The aim is to share feedback on this topic concerning the structuring of the programat the interface between science and society.
F. Mallard (B)Cistude Nature, Chemin du Moulinat, 33185 Le Haillan, Francee-mail: [email protected]
L. CouderchetUniversity of Bordeaux-Montaigne, Passages—UMR 5319 CNRS, Maison des Suds—12,Esplanade des Antilles, 33607 Pessac Cedex, Francee-mail: [email protected]
© Springer Nature Switzerland AG 2019W. Leal Filho et al. (eds.), Handbook of Climate Change and Biodiversity,Climate Change Management, https://doi.org/10.1007/978-3-319-98681-4_14
223

224 F. Mallard and L. Couderchet
Introduction
Thecomplex influences of climate onbiodiversity and the intrinsic adaptive responsesof species are still little followed and unknown (Berteaux et al. 2010). Effects specif-ically related to climate change are difficult to highlight because of the multiplefactors to be taken into account such as lack of knowledge about interactions andspecies adaptation, on observation results done only locally and over too short periodsof time. The example of terrestrial ecosystems illustrates this multiplicity of pres-sures, impacts and interactions. In particular, the dual pressure of climate change andland use are confusing the understanding of the impacts of climate change (Mallard2016a). The organisms are confronted with these cumulative effects of multiple dis-turbances. If the dissociation of effects is not really feasible, it is possible to choosesystems that give access to the effects of climate such as protected, natural environ-ments, ectothermic animals whose ecology and physiology are directly dependenton amñbient thermal and hygrometric conditions.
The lack of knowledge and data is progressively reduced thanks to long-termobservations, the improvement of understandings of ecological processes, data pro-cessing techniques, and the choice of various and complementarymodels. In practice,understanding the response of biodiversity to climate change in order to implementconservation strategies requires: (1) to combine regional and local space scales, timeseries data for biodiversity and climate (Root and Schneider 2006) to provide ele-ments of knowledge for the implementation of actions by the local natural areasmanagers but also to the regional decision-makers driving forces (Berteaux et al.2010), (2) to perform observations, protocols fields related to models with abun-dance data, (3) to provide validated data, associated sufficient coverage, scalablecampaigns based on these data, and relevant observations linked to time and spacescales, (4) finally to communicate aggregated information to different actors.
Today, there is no long-term monitoring, indexed, and standardized allowing aglobal analysis of the impacts of climate change on biodiversity state at the regionalscale. These shortcomings lead to new research approaches that extend the workof monitoring species populations. Being aware that these gaps must be filled asa priority, the Cistude Nature association has created links with partners to set upa multi-year study program: “Climate sentinels” (2016–2021). The challenge is tomove forward fundamental knowledge by reasoning in terms of multi-scale spaceand time operation. In this context, it is essential to know and to take into accountvariables coupled in space and time, to combine different theoretical disciplines fromvarious field studies, by facilitating the analysis and the multi-public circulation ofknowledge. This program raises the following question: How to assess and predictthe response of regional biodiversity to climate change?A research hypothesis is thatthe effects can be studied from indicators of species that have weak displacement.At a regional or local scale, the most endangered species are those with latitudinaland altitudinal spatial restrictions and limited dispersal capacity (Feehan et al. 2009).These “sentinel” species will be the first to respond to local climatic variations byadaptation or local extinction.

Climate Sentinels Research Program: Developing Indicators … 225
In this paper, the first part describes a research approach responding to this prob-lem in a new discipline of ecology to be developed, which would be first of all ascience of climate-biology relations: the ecology of climate change. The second partidentifies the scientific perspectives for the development of indicators monitoring theeffects of climate change on terrestrial ecosystems through the search of species orgroups of species that are sensitive and indicative of this climate change. The iden-tification of these sentinel species of climate requires the choice of a study area thatis coherent at the biological level, but also for biodiversity conservation actions andfor the dissemination of knowledge. The terrestrial ecosystems of New Aquitaineregion (France) are selected according to ecological, climatological and topographi-cal criteria. Finally, the third part presents the approach of global analysis of programindicators and the modelling of spatial distributions and future projections of speciesin the face of climate change. The ecological data used come from two types: speciespresence data from existing regional observatories and abundance data from sam-pling protocols implemented specifically. Three universal responses of these plantand animal species are studied and are based on changes in distribution, physio-logical and phenological adjustments (plasticity) or micro-evolutionary phenomena(selection) (Daufresne et al. 2009).
The purpose of this paper is to share a feedback on how this program is structured(after a first year of implementation), how to address the issue of climate changeand biodiversity at the interface between science and society. The project “ClimateSentinels” presented is reproducible. The methods and models developed in thisprogram could be referred to discussion, generalized and applied in other territories atboth national and European level to increase knowledge of biodiversity. Themethodsput in place, the data processing tools and the reflections around the formation ofa community of actions, whose role is to act on the political orientations, considera standardization process and allow a transposition to other territories. The aim isto strengthen the links between researcher community and naturalists, natural areasmanagers of and the decision-makers who implement environmental policies, as wellas the general publicwhich guides societal choices. The scale of study brings togetherthe actors of the region level. This scientific exercise is part of epistemological changecontext.Wehope this shared experiencewill promote, inspire and export this initiativeto other territories.
Research Approach
Hypothesis and Objectives Related to the Problematic
Answering the problem requires identifying relevant and operational indicators at aregional level (New Aquitaine, France) to assess the state of biodiversity, to projectit and to try to predict the biodiversity response to climate change. The indicatorsallow a reduction in the number of measurements and parameters, thus simplifying
226 F. Mallard and L. Couderchet
the approach of complex, interdependent phenomena. Their function is to describe,distinguish, simplify, aggregate, evaluate and be a basis to project the impacts ofclimate change on biodiversity. For biodiversity indicators, the objectives are alsomultiple. They make it possible to evaluate at the same time, the viability, the dura-bility, the resilience, the productivity and the vulnerability. In short, to take stock ofthe state of health of biodiversity and to allow users to make decisions and evaluatethe consequences.
As a result the indicators used are “biological” and concern species (or groupsof species) of flora and fauna studied in their environment. The status and evolutionof these indicators are related to a set of meteorological and climatic parametersat different time and space scales. These data concern temperature, hygrometry,rainfall, solar radiation and wind speed, in order to identify trends in the impact oftheir variations on the state of biodiversity.
Three types of impacts of climate change on biodiversity are currently recognized:(1) expansion, persistence of the species to themodified climate in the habitat (geneticadaptation, phenotypic plasticity), (2) slippage, migration tomore appropriate refugeareas or (3) contraction, local extinction, collapse, decline (Davis and Shaw 2001).
The number of local extinctions will strongly depend on the ability of the speciesto move (Foden et al. 2008) or to adapt. At the regional or local scale, the mostendangered species are those with latitudinal, altitudinal spatial restrictions and lim-ited dispersal capabilities (Feehan et al. 2009). Amphibians, reptiles, micromammalsand some invertebrates have lowermovement capabilities than largemammals or fly-ing species. We hypothesize that these species should be among the first to respondto local climatic variations and thus constitute “Climate sentinels”. On the otherhand these species, not very mobile, are generally easily observable which allowsfor simple and less expensive study protocols. In addition, they generally have anaffirmed heritage aspect.
From these indicators, two main objectives are then distinguished:
• The first is ecological and determines the potential effects of climate change bydissociating them from other anthropogenic factors by monitoring the status ofthese sentinel species. Most of the impacts on species will be detected over time,in relation to their intrinsic response time and changes in climate change. Theseeffects cannot be detected easily in the field over a short time, which impliesobservations of greater sensitivity and in sufficient quantity in the early stages.
• The second is biogeographic. On the basis of these data and associated models,it is necessary to evaluate, characterize, at different local and regional scales, theresponse of these sentinel species of the climate.
Climate Sentinels Research Program: Developing Indicators … 227
Action Research
To describe the complex relationships between society and the environment, a pos-sible framework of reasoning is to rely on the analysis model called “DPSIR” Driver(D)—Pressure (P)—State (S)—Impact (I)—Responses (R) to provide a method forunderstanding synergies between the effects of climate change, ecological processes,political decisions and management actions (Smeets and Weterings 1999). It allowsto describe, to classify the origins, the causes and the consequences.
A first stage of the framework lists all disturbances on the natural elements ofthe landscape. The “Drivers” correspond to the driving forces mostly related tohuman activities. The actors who influence these forces are ultimately the generalpublic. These decision makers who implement policies including environmental.The decision makers of the program (here European Union, Region New Aquitaine,departments of Gironde and Pyrénées-Atlantiques) are financers and support theprogram. Even these driving forces cause pressures (“Pressure”) of various natures,climate change is an impactwhich becomes a pressure component from a biodiversitypoint of view.
The second step involves monitoring the state of natural ecosystems based on thepresence, abundance of animal or plant species that live there and are subject to thesepressures. Information from this state is collected bynaturalist experts of the program.The essenceof thismonitoring is to take into account all “impacts” or spatial-temporaleffects, including those induced by the “climate” component. The state first takesinto account the vulnerability, gap between its levels reached and its limit level,but also the resilience of the ecosystem. Next, projections of the impacts of climatechange on biodiversity over time are essential for the development of conservationstrategies. They are largely derived from bioinformatics analysis strategies, involvingspatial-temporal modelling of each species, each functional group, each community,and ecosystems. Academics and research laboratories in collaboration with CistudeNature develop the modelling part.
This last approach becomes a meeting point between applied research and basicresearch, between thosewhoexperiment, providedata and thosewhomodel, increase,aggregate information. The coupling of the two approaches (bottom-up/top-down)allows a so-called “hypothetico-deductive” approach. The process consists of for-mulating a hypothesis in order to deduce observable consequences (Fig. 1) and theseobservations in turn determine their validity. Although complex to set up, the scien-tific literature encourages hypothetico-deductive approaches by frequently linkingfield studies, models and experiments in order to attest to a causal and not only cor-relative association between climate change and decline of biodiversity (Pradervandet al. 2014).
Finally, with this DPSIR framework, the final step is to evaluate the effective-ness, and to identify adaptation and mitigation actions to climate change effects toimplement. This step also helps to explain, and to sensitize, in short to carry out amediation work with a large public that influences implementation of the measures
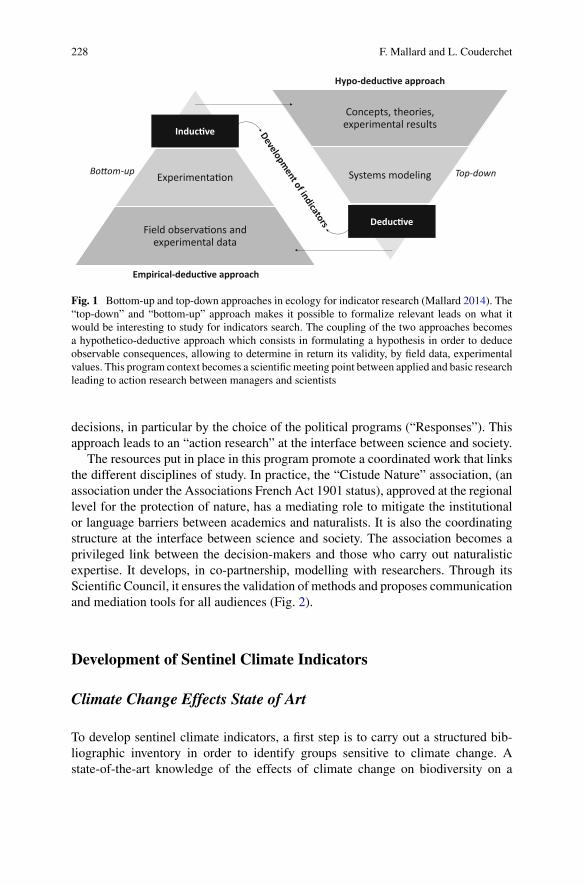
228 F. Mallard and L. Couderchet
Experimenta on
Field observa ons andexperimental data
Concepts, theories,experimental results
Systems modeling
Hypo-deduc ve approach
Induc ve
Deduc ve
Bo om-up Top-down
Empirical-deduc ve approach
Fig. 1 Bottom-up and top-down approaches in ecology for indicator research (Mallard 2014). The“top-down” and “bottom-up” approach makes it possible to formalize relevant leads on what itwould be interesting to study for indicators search. The coupling of the two approaches becomesa hypothetico-deductive approach which consists in formulating a hypothesis in order to deduceobservable consequences, allowing to determine in return its validity, by field data, experimentalvalues. This program context becomes a scientificmeeting point between applied and basic researchleading to action research between managers and scientists
decisions, in particular by the choice of the political programs (“Responses”). Thisapproach leads to an “action research” at the interface between science and society.
The resources put in place in this program promote a coordinated work that linksthe different disciplines of study. In practice, the “Cistude Nature” association, (anassociation under the Associations French Act 1901 status), approved at the regionallevel for the protection of nature, has a mediating role to mitigate the institutionalor language barriers between academics and naturalists. It is also the coordinatingstructure at the interface between science and society. The association becomes aprivileged link between the decision-makers and those who carry out naturalisticexpertise. It develops, in co-partnership, modelling with researchers. Through itsScientific Council, it ensures the validation of methods and proposes communicationand mediation tools for all audiences (Fig. 2).
Development of Sentinel Climate Indicators
Climate Change Effects State of Art
To develop sentinel climate indicators, a first step is to carry out a structured bib-liographic inventory in order to identify groups sensitive to climate change. Astate-of-the-art knowledge of the effects of climate change on biodiversity on a

Climate Sentinels Research Program: Developing Indicators … 229
Euro
pe, R
egio
n of
New
Aqu
itain
e, D
epar
tmen
t of
Giro
nde,
Dep
artm
ent o
f Pyr
enee
s Atla
nqu
eCi
zens
, Sch
ool c
hild
ren,
Tea
cher
s, b
egin
ners
, co
nfirm
ed n
atur
alist
s, e
xper
ts, .
..
Uni
vers
ityof
Bor
deau
x M
onta
igne
, Uni
vers
ityof
Pau
and
Pay
s de
l'Ado
ur, M
étéo
Fra
nce,
…
Nat
ure
rese
rve,
Con
serv
ator
y of
nat
ural
env
ironm
ent,…
Cist
ude
Nat
ure,
CEN
-Co
nser
vato
ry o
f Nat
ural
Are
a ,eniatiuqA foCB
NSA
-So
uth
Atla
nc
Bota
nica
l Co
nser
vato
ry, D
avid
Gen
oud-
Dge,
GM
HL -
Mam
mal
an
d He
rpet
olog
ical
Gro
up o
f Lim
ousin
, ...
Gen
eral
pub
lic
Orie
nta
on
Déc
isio
n m
aker
Fina
ncer
Nat
ural
iste
xper
t
Know
ledg
e
Man
ager
s Acon
Rese
arch Mod
ellin
g
Scen
ficco
unci
l
Valid
aon
Pres
sure
s (P)
Driv
ers (
D)
Stat
e (S
)Im
pact
(I)
Coor
dina
tor
Cist
ude
Nat
ure
Cata
lyst
Repo
nse
(R)
Clim
ate
chan
ge
Fig.2
ScienceandSo
cietyInterfaceMod
elof
theClim
atesentinelsprog
ram.The
prog
ram
ispartof
anactio
nresearch
approach
attheinterfacebetw
een
scienceandsociety.Cistude
Natureisan
independ
entassociationwhich
coordinatestheprog
ram.Ithelpsto
create
thelin
ksbetw
eenresearcher
commun
ityandnaturalist,naturalareasmanagersof
andthedecision
-makerswho
implem
entenvironm
entalpo
licies,as
wellas
thegeneralpu
blic
which
guides
societal
choices.Thisstructurehasamediatin
grole
tomitigate
institu
tionalo
rlang
uage
barriers
betw
eenacadem
icsandnaturalists.T
heassociations
colle
ctthedata
(bottom-upapproach).Researchersanalyseandmodelthedata(top-dow
napproach)
230 F. Mallard and L. Couderchet
global scale was therefore realized as part of the program. Groups of indicatorspecies commonly used to characterize the state of the environment were identi-fied:mosses, ferns, Gymnosperms andAngiosperms, insects (Bumblebees, Odonata,Lepidoptera), amphibians, reptiles (lizards) and small mammals (rodents, AlpineMarmot) (Mallard 2016a).
This bibliography, available on the website of the study (www.sentinelles-climat.org), shows that climate change is a pressure that affects the structure and dynamicsof ecosystem functioning through a wide range of effects that can be classifiedaccording to their nature and characteristics: direct, indirect, induced and temporary,permanent and cumulative (Fig. 3):
– Direct effects are the major ones directly related to climate change that unequiv-ocally influence key ecosystem processes,
– Indirect effects come from the retro-action combination of direct effects, whichtend to increase them at different spatial-temporal scales,
– Induced effects are derived from anthropic responses that are related to the mea-sures put in place related to political decisions,
– Cumulative effects include in summary the interaction of direct, indirect andinduced effects. Other anthropogenic factors will synergize positively or nega-tively with climate change and increase pressure on species survival (Kremen andOstfeld 2005).
Climate Sentinel Species
Following the bibliographic synthesis, it was necessary to define study areas to iden-tify indicator species. These different geographical areas have varying intensities ofclimate change (GIEC 2013). They contain species with different sensitivities to thepressure of climate change (Bertin 2008; Li et al. 2013). In France, New Aquitaineregion is an open-air study laboratory in the sense that it is both particularly sensitiveto climate change, with contrasting local climatic zones and a wide variety of naturalecosystems (Le Treut 2013; Mallard 2016a).
Rare species are not only those that are the most sensitive to climate change. Thecommon species of a taxa, because of its specific variability, are also sensitive to thisevolution (Pearman et al. 2011). The state of the art of knowledge (Mallard 2016a),defined criteria and a large empirical database of flora atlas productions (atlas online:ofsa.fr) and fauna in Aquitaine (atlas online: si-faune.oafs.fr) (Berroneau 2015; Ruysand Couzi 2015; Gourvil et al. 2016), indicator species and groups of species havebeen developed for 5 types of climate-sensitive ecosystems (Fig. 4): dunes, dry, wet,forest and mountain.
From this territory, in summary below, 20 indicators of climate change in thedifferent ecosystems were chosen. The evolution of floristic process indicatorswill be followed for each of these natural environments. Within these ecosystems,the following animal species are studied: insects (Lepidoptera, Odonata, bumble-

Climate Sentinels Research Program: Developing Indicators … 231
Fig.3
Effectsof
clim
atechange
onthecomponentsof
ecosystem
(adapted
from
Mallard
2016a).C
limatechange
isapressure
that
affectsthestructureand
dynamicsof
ecosystem
functio
ning
throug
hawiderang
eof
effectsthatcanbe
classifie
daccordingto
theirnature
andcharacteristics:direct,ind
irect,indu
ced;
tempo
rary,p
ermanent;cumulative.According
tothebibliography,animal
andplantspeciescanbe
classifie
daccordingto
theirsensitivity
toclim
atechange:
exposed,
vulnerable,extinction

232 F. Mallard and L. Couderchet
Thre
e ax
esnoitubirtsidfo
aerAPh
enol
ogy
Ecop
hysio
logy
Faun
aInverteb
rata
Amph
ibia
Rep
lia
Smal
l mam
malia
Insecta
Odo
nata
Hym
enop
tera
Lepi
dopt
era
Bom
bus
Lace
rda
e
Rode
na
Mar
mot
am
arm
ota
Dun
eD
ryW
etM
ount
ain
Fore
st
Calc
areo
usgr
assla
ndW
ethe
aths
and
peat
bogs
Rear
-co
asts
pond
s
Mou
ntai
nflo
raLo
wla
ndbe
ech
Bibl
iogr
aphi
cda
taEm
piric
alda
ta
Ecos
yste
ms
stud
ied
in N
ew A
quita
ine
Dune
gr
assla
nd
Tim
on le
pidu
sZo
otoc
avi
vipa
ra
Leuc
corh
inia
Iber
olac
erta
bonn
ali
Smal
l m
amm
alia
Lepi
dopt
era
Bom
bus
Hyla
mol
leri
H. a
rbor
eaRa
na p
yren
aica
Mar
mot
am
arm
ota
Pond
s of t
he
Land
es d
e G
asco
gne
Flor
a
Lepi
dopt
era
Emys
orbi
cula
ris
Vipe
rabe
rus
Vipe
rinae
Test
udin
es
Fig.4
Stepsfordeveloping
indicatorsofspeciesand
groups
ofspeciesthatareindicatorsofclim
atechange
(adapted
from
Mallard
2016a).Fromthebibliography
synthesis,defin
edcriteriaandlargeem
piricaldatabase
ofatlasproductio
nsof
flora
andfaunain
theNew
Aquitaineregion,speciesandgroups
ofindicator
specieshave
been
developedfor5Ecosystem
stypes,sensitive
toclim
atechange:d
unes,d
ry,w
et,forestand
mountain
Climate Sentinels Research Program: Developing Indicators … 233
bees), amphibians (Rana pyrenaica—Pyrenees frog,Hyla molleri–Iberian Tree Frogand Hyla arborea–green), reptiles (Iberolacerta bonnali—Pyrenean Rock Lizard,Timon lepidus—Ocellated lizard, Zootoca vivipara—Viviparous lizard, Emys orbic-ularis—European Pond turtle, Vipera berus—Viper peliad) and small mammals(Marmota marmota—Alpine Marmot, small mammals) (Fig. 4).
Program Analysis Plan
These 20 indicators in the 5 selected ecosystems form the basis of the “Climatesentinels” study program for long-term analysis and monitoring of the effects ofclimate change on biodiversity in NewAquitaine. The originality of this program liesin themonitoring ofmulti-ecosystems, multi-species over time and at the 84,000 km2
scale of the region. This last part describes themodelling process implementedwhichis part of the program, according to French geographer Roger Brunet: we mustgo through a model to understand and be understood (Brunet 2000). Based on theexploitation of bibliographic data and specific collected data within the frameworkof the program, the modelling objective is to evaluate the forecast responses of thesentinel species.
Modelling does not start with computer model, it starts as a schematization. Amodel is a simplified representation of a reality. To be relevant, the first step is tounderstand and justify its incoming and outgoing. Thus, a very flexible model with-out ecological justification will give biased predictions and significant uncertainties(Araújo and Peterson 2012; Bell and Schlaepfer 2016).
In order to visualize what we had to consider as factors, and the answers weexpected from the model, we give a reflection scheme which summarizes it (Fig. 5).
Naturalistic Data from Regional Observatories
In order to study the effects of climate change on biodiversity at the regional scale,the collection of information in the field requires many observations to obtain sig-nificant results. The regional observatories are tools allowing access to a mass ofnaturalistic observations validated and distributed throughout the territory (Bœufet al. 2012). In New Aquitaine, two mechanisms aim to collect, manage, validateand disseminate all the information on biodiversity produced by data producers andparticularly the technical partners. The Wildlife Information System (SI Faune) has8 thousand data and the Observatory of Plant Biodiversity (OBV) of New Aquitaine3 million data. These atlas biodiversity data can be processed in the form of speciespresence. The observation effort is heterogeneous in the territory and does not allowa relevant analysis of presence and absence of species. This type of data can still beused in the scientific literature. For example, Brotons et al. (2004) used bird atlasdata in Catalonia. According to the authors, presence and absence of species data

234 F. Mallard and L. Couderchet
Dune
en
viro
nmen
tTi
mon
lepi
dus
Dry
gras
sland
s
Wet
land
s
Fore
sts
Lepi
dopt
era
Smal
l mam
mal
s
Phen
garis
alco
nO
dona
taHy
la m
olle
ri/H
yla
arbo
rea
Zoot
oca
vivi
para
Emys
orbi
cula
risVi
pera
beru
s
Vege
taon
of p
lain
bee
ch
Mou
ntai
nBu
mbl
ebee
sRa
na p
yren
aica
Iber
olac
erta
bonn
ali
Mar
mot
am
arm
ota
BIO
LOG
ICAL
IND
ICAT
ORS
N E W A Q U I T A I N E R E G I O N
ECO
LOG
ICAL
DAT
ACL
IMAT
IC
IND
ICAT
ORS
CLIM
ATE
DAT
AO
THER
FAC
TORS
INDI
VIDU
S
Tem
pera
ture
Hum
idity
Pluv
iom
etry
Win
d
Sola
r ra
dia
on
Régi
onal
ob
serv
ator
ies
OBV
SI F
aune
Historicaldata
Pres
ence
Indi
vidu
alTh
erm
al n
iche
Abun
danc
e
Rich
ess
spec
ific
Dive
rsity
Stud
ysit
es
Prot
ocol
Sen
nels
data
Program data
Mes
oclim
ate
Wea
ther
sta
on
Mac
rocl
imat
e
Mét
éo
Fran
ce
Prob
e
Mic
rocl
imat
e
Habi
tat
conn
ecvi
ty
Rarit
yog
habi
tat
Frag
men
taon
ha
bita
t
Form
of h
abita
t
Size
of h
abita
t
Scen
ficbi
as
Prot
econ
of
area
Surf
ace
Man
agem
ent
Conn
exio
n of
sit
es
Bala
nced
dist
ribu
on o
f sit
es
Site seleconcriteria
Phen
olog
y
Repa
ron
Ecop
hysio
logy
PRO
JECT
ION
MO
DELS
IPCC
SCE
NAR
IOS
ADAP
TATI
ON
EXTI
NCT
ION
Vege
taon
of n
on-b
oist
edco
asta
ldun
es
Calc
areo
usgr
assla
nds
Vege
taon
of w
ethe
aths
and
bogs
Vege
taon
of p
ond
Vege
taon
of r
ear-
lior
al p
onds
Vege
taon
of b
ogs
Fig.5
Overallplan
ofanalysis
oftheClim
atesentinelsprog
ram.In
orderto
stud
ytheeffectsof
clim
atechange
onbiod
iversity
attheregion
alscale,
the
observationin
thefield
requ
ires
sufficientd
atain
orderto
obtain
relevant
results.R
egionalo
bservatories
aretoolsto
access
amassof
naturalistic
observations,
valid
ated
anddistributedthroug
hout
theterrito
ry.H
owever,these
dataallowus
toaccess
mainlythepresence
data.T
hedatacomefrom
naturalistic
observation
protocolsnoty
etstandardized
protocol.A
tthisscaletheMétéo-Francedataareused.T
heabundancedataof
individualscontainawealth
ofim
portantanalysis.
The
combinatio
nof
thissecond
type
ofcomplem
entary
data
with
that
ofthepresence
data
ones
enriches
andvalid
ates
themodels.These
data
require,in
all
cases,protocolized
mon
itoring
ofnaturalpo
pulatio
nsin
thefield.T
obe
linkedto
clim
atechange,the
mon
itoring
ofsentinel
speciesissupp
lementedby
spot
mon
itoring
oftemperatureandhu
midity
ateach
sitethroug
haweatherstation.Ecophysiology
cancontributetoaglob
alvision
oftheim
pactsof
clim
atechange
onorganism
s,ecosystemsandtheirevolutionary
respon
ses.Sp
eciesandtheirlifestages
have
differenttherm
alrang
esrefle
ctingspecializ
ationin
temperature
regimes,habitatandlifestyle
characteristics.Theirtemperature
limits
canbe
mod
ified
byacclim
ationor
evolutionary
adaptatio
nto
specificlim
its.Therm
alprob
esareused
tomim
icthethermalandhydricprop
ertie
sof
organism
s.The
type
ofclim
atemod
eladaptedto
theprog
ram
istheMDS(Species
Distribution
Mod
el)integratingallb
iological,clim
atic,historicaland
recent
indicators,aswellasthescenariosof
theIntergovernm
entalP
anelon
Clim
ateChange(IPC
C)
Climate Sentinels Research Program: Developing Indicators … 235
allow projections by generalized linear models (GLM)more accurate than ecologicalniche factor analysis (ENFA) using only presence data. Species with less stringentecological requirements are modelled with less precision than species with lowerrequirements. Models for large and tolerant species are more sensitive to absencedata, suggesting that presence/absence methods may be particularly important inpredicting distributions of this species type. It is more difficult to accurately projectindependent generalist species distributions with the method used (Brotons et al.2004). In the program, we selected small species, mostly specialists. The presencedata are then sufficient for predicting the evolution of these sentinel climate speciesin the face of climate change.
Protocoled Monitoring Data
The abundance data of individuals and the relative proportions of species allow awealth of analysis. The combination of this type of complementary data with speciesincidence or presence-absence data enriches and validates models and the levels ofuncertainty for analysing the effects of global changes on biodiversity. Incidenceor presence-absence data from species are easier to obtain than abundance datafrom individuals and relative proportions of species related to number of individu-als observed (Howard et al. 2014). These last data require, in all cases, protocoledmonitoring of natural populations in the field. Long-term monitoring of natural pop-ulations is generally considered as essential. Direct observations should be madeover periods of several decades (Bertin 2008). The implementation of protocols formonitoring climate and biological indicators standardized and adapted to the prob-lem of climate change is necessary. As part of this project, monitoring protocols forclimate and biological indicators were defined in 2016 (Mallard 2016b).
For each fauna or flora indicator, the sampling plan defines the criteria for theassociated study sites. A working hypothesis for the selection of study sites is torely on a state of conservation of sites limiting, as much as possible, the influenceof anthropogenic factors other than climate change, which may often have a greaterimpact on local biodiversity. In this study, the selection of the sites is thus based ona reference of a state of conservation described as “good”.
In a climatic region, the climate varies from place to place; local microclimateschange according to altitude and latitude. The climatic conditions are peculiar andresult from topography and vegetal cover. The combined action of climatic fac-tors, and especially the temperature-humidity pair, directly affects the distribution ofplant and animal species and the development of their populations. Monitoring sen-tinel species is therefore complemented by spot measurements of temperature andhumidity at each site. These two factors are the most representative and most easilymeasurable climatic conditions of populations at this local scale (Mallard 2016b).
A first field campaign in 2016 allowed the installation of equipment and the testingof protocols. The protocols validated in 2016 are based on methods recognized atnational level. Depending on the indicators of the different dune, dry, wet, forested,

236 F. Mallard and L. Couderchet
mountainous environments, the number of monitored sites ranges from 5 to 80. Floramonitoring is carried out once a year per site in 2017 and renewed for 3–6 years.Wildlife indicators are measured annually during the duration of the program with2–9 surveys per year and per site (Mallard 2016b).
Ecophysiology can contribute to a global vision of the impacts of climatechange on organisms, ecosystems and their evolutionary responses (Bozinovic andPörtner 2015). In this program, the ecophysiological responses of individuals arestudied using experimental field devices such as probes and thermocouples placedin biomimetic models to imitate the thermal and hydric properties of organisms(Sinervo et al. 2010).
Projection Modelling
In order to establish an overall analysis of all the data collected, we have identifiedand analysed existing models on climate change and biodiversity. The method ofanalysis is the same as the one of the state of the art of the effects of climate changeon the different groups of species (Mallard 2016a).
Over the past 20 years, studies on modelling of species distribution and climatechange have been very numerous.We have listed and described the computer modelsused “impact factor” review papers to determine the relevant model(s) for the chosenindicators of the program. We have identified potential gaps in current models andresearch pathways to obtain predictive maps of species distributions. The models areclassified in 4 main categories, from the simplest, like GLM—Generalized LinearModel, to the most complex ones, like Random Forest (RF) or ANN—ArtificialNeural Networks (Mallard 2017). The models are used alone or in combination,their results being mostly improved when combined (Leathwick et al. 2006; Watlinget al. 2015). In practice, a frequently used model is the Species Models Distribution(SDM). Its approach is flexible and allows to integrate a large number of factorssuch as fragmentation, dispersion or altitude but also climate scenarios. SDM canbe based on three different types of models (empirical, analytical or mathematical,mechanistic) (Guisan and Zimmermann 2000). According to some authors, it is quiteaccurate and gets good results when compared with other models. However, it alsohas limitations and has been controversial in some studies.
The uncertainty of the model can result from the initial hypotheses (Dormannet al. 2008). If the questions asked of the models are not sufficiently defined, theresults will be biased and will not be acceptable (Elith and Leathwick 2009). Simpli-fied model boundaries describe complex processes, such as models describing futureclimate conditions or algorithms describing species-environment relationships. Thealgorithm remains the most important source of uncertainty. The result of the mod-elling must be interpreted carefully. Models are limited by lack of data, inaccuratedata, or missing data (Dormann et al. 2008). In Climate sentinels program, the dataused for modelling is largely derived from established protocols, which minimizesprediction errors. Failure to take certain factors into account may influence model
Climate Sentinels Research Program: Developing Indicators … 237
results such as altitude (Oke and Thompson 2015), dispersal (Gonçalves et al. 2016)or biotic factors (Singer et al. 2016). A small number of factors will not yield solidresults. With too many factors, the model becomes too heavy to run. The predictivemaps are then biased and the results no longer make it possible to isolate the climatechange factor. This state of affairs has been taken into account in our reflection andintegrated into the models applied to the program the essential factors (biological,climatic, spatial or even anthropogenic) in order to obtain reliable and robust resultsallowing to observe the modifications related specifically to the climate change. Thenumber of factors can also be a barrier to the transferability of the models developedin the program. From one territory to another, even very similar, the factors differ andthe results too (Duque-Lazo et al. 2016). The use of direct factors/resources makesthe model more generalizable and transferable. In regard to the different scales andvaried territories present in the program, it is highly probable that for each indicatorthe model must be adapted according to the scale, the environment, and the climaticconditions. That is to say that during the data campaign and associated modelling,algorithms have to be adapted to become more efficient according to the species andthe spaces concerned. Scale and time transferability is not the only difficulty encoun-tered when transposing a model from one territory to another, extrapolation is also asource of error, especially when models must predict future conditions, particularlybecause landscapes futures will likely include climate data that will not be similar.Models that are too complex can lead to biased predictions during extrapolation. Asa result, predictions can be biased and become useless for guiding decision-makingas part of environmental management measures (Bell and Schlaepfer 2016). Allof these criticisms are indispensable in the improvement of the model. Naturalists,researchers in the same project can propose improvements, model adjustments tominimize biases.
Even though the SDM is sometimes controversial (Heikkinen et al. 2007; Guoet al. 2015), its remains an option in a modelling approach in the context of speciesmobility linked to climate change. Thismodel has shown its robustness in predictions(Bell and Schlaepfer 2016). The main criticism was to give biased results when nottaking into account a factor or because of an inappropriate use without thinkingdefined beforehand (Oke and Thompson 2015; Gonçalves et al. 2016; Singer et al.2016).Nevertheless, over the years, the addition of different factors by the researchershas significantly improved its performance (Bell and Schlaepfer 2016).
The SDM integrates all sentinel biological indicators, climate, historical andrecent data, aswell as scenarios from the Intergovernmental Panel onClimateChange(IPCC). The RCP (Representation Concentration Pathways) scenarios consideredin the program are RCPs 4.5 and 6 which gives a stabilization of greenhouse gasemissions and the RCP 8.5 which remains the most pessimistic scenario and doesnot provide any reduction of the greenhouse gas emissions, rather an increase inthem (GIEC 2013). Not taking into account these scenarios would distort our futurepredictive maps. Predictive performance and model correlation are evaluated by sta-tistical measures. AUC—Area Under Curve—and TSS—True skill statistic, calledalso Hanssen Kuipers discriminant, allow to test the predictive performance of the
238 F. Mallard and L. Couderchet
model in terms of presence/absence of species (Watling et al. 2015; Phillips-Maoet al. 2016).
Conclusion
Because of its rapidity and intensity, current climate change is a major (direct orindirect) pressure on biodiversity. The Climate sentinels program contributes andoffers an innovative global approach in applied ecology, based on a strong scientificbase, to understand the interactions between climate variations and the biodiversityresponses. Ongoing work is being done on a regional scale relevant to the imple-mentation of conservation measures: New Aquitaine, west of France. This work isbased to clarify short and long-term impacts, negative or positive influence levels,direct, indirect and induced effects on fauna and flora species in various ecosystems.The emergence of sub-branches of ecology related to human activities is relativelyrecent. The concept of “ecology of climate change” does not exist to our knowledgeyet. The study establishing the ecology of climate change is thus rooted in a multi-disciplinary approach, at the interface between ecology, climatology and geography,at the interface between research and naturalistic expertise.
Twenty biological monitoring indicators, known as climate sentinels, have beenselected and developed from species or groups of species that are among the mostsensitive to climate change, and are easy to follow to ensure work at the level ofNew Aquitaine. This research field is essential to feed data and to use projectionmodels. This requires consistency efforts to set up shared methods, repositories toaddress, and complete or continue ongoing research. With all the various partners ofthe program, scientifically standardized climate and biological monitoring materialsand protocols were set up, tested and validated in 2016, the first campaign beingdone in 2017.
The diversity of 5 lowland environments, from littoral to mountain environmentsare considered on more than two hundred sites which will be followed till 2021.These data are the basis of the projections of future impacts of climate change onbiodiversity. The data will feed the transfer of information to stakeholders, drivingforces, which is necessary for the development of conservation strategies and thepromotion of informed and voluntary environmental policies. The awareness of theactors will be all the more important and accepted that the method and results ofresearch are widely disseminated. Mediation tools are developed and adapted totargeted audiences to disseminate andmake available bibliographies,means,methodsand results of the program.
Acknowledgements We thank the European Union, the region of New Aquitaine, the DepartmentofGironde and Pyrénées-Atlantiques for their support and the funding of the program.We also thankthe members of the 2016 scientific council of the program for their opinion, their analysis, and theiradvice on methods, protocols, models and result analysis of the whole program: Hervé Le Treut,Honorary President of theCouncil scientist, Professor at Pierre andMarieCurieUniversity; IngeVanHalder, researcher at INRA/University of Bordeaux; Oliver Lorvelec researcher at INRA/University
Climate Sentinels Research Program: Developing Indicators … 239
of Rennes; Claude Miaud, researcher at CNRS; Sylvain Delzon, researcher at INRA/University ofBordeaux; and Yohana Cabaret, doctor, project manager at AcclimaTerra. Finally, we would liketo sincerely thank all our technical and scientific partners for this action research cited on websitehttps://www.sentinelles-climat.org.
References
Araújo MB, Peterson AT (2012) Uses and misuses of bioclimatic envelope modeling. Ecology93(7):1527–1539. https://doi.org/10.1890/11-1930.1
BellDM, SchlaepferDR (2016)On the dangers ofmodel complexitywithout ecological justificationin species distribution modeling. Ecol Model 330:50–59. https://doi.org/10.1016/j.ecolmodel.2016.03.012
Berroneau M (2015) Guide des amphibiens et reptiles d’Aquitaine. C. Nature, Le Haillan, France,180p
Berteaux D, de Blois S, Angers JF, Bonin J, Casajus N, Darveau M, Fournier F, Humphries MM,McGill B, Larivée J, Logan T, Nantel P, Périé C, Poisson F, Rodrigue D, Rouleau S, Siron R,Thuiller W, Vescovi L (2010) The CC-bio project: studying the effects of climate change onQuebec biodiversity. Diversity 2(11):1181–1204. https://doi.org/10.3390/d2111181
Bertin RI (2008) Plant phenology and distribution in relation to recent climate change. J Torrey BotSoc 135(1):126–146. https://doi.org/10.3159/07-RP-035R.1
Bœuf G, Allain YM, Bouvier M (2012) L’apport des sciences participatives à la connaissance dela biodiversité en France. La Lettre de l’OCIM. Musées, Patrimoine et Culture scientifiques ettechniques 144:8–18. https://doi.org/10.4000/ocim.1119
Bozinovic F, Pörtner HO (2015) Physiological ecology meets climate change. Ecol Evol5(5):1025–1030. https://doi.org/10.1002/ece3.1403
Brotons L, Thuiller W, Araújo MB, Hirzel AH (2004) Presence-absence versus presence-onlymodelling methods for predicting bird habitat suitability. Ecography 27(4):437–448. https://doi.org/10.1111/j.0906-7590.2004.03764.x
Brunet R (2000) Des modèles en géographie? Sens d’une recherche. Bulletin de la Société deGéographie de Liège 2:21–30
DaufresneM,LengfellnerK, SommerU (2009)Globalwarmingbenefits the small in aquatic ecosys-tems. Proc Natl Acad Sci 106(31):12788–12793. https://doi.org/10.1073/pnas.0902080106
Davis MB, Shaw RG (2001) Range shifts and adaptive responses to quaternary climate change.Science 292(5517):673–679. https://doi.org/10.1126/science.292.5517.673
Dormann CF, Purschke O, Márquez JRG, Lautenbach S, Schröder B (2008) Components ofuncertainty in species distribution analysis: a case study of the great grey shrike. Ecology89(12):3371–3386. https://doi.org/10.1890/07-1772.1
Duque-Lazo J, Van Gils H, Groen TA, Navarro-Cerrillo RM (2016) Transferability of speciesdistribution models: the case of Phytophthora cinnamomi in Southwest Spain and SouthwestAustralia. Ecol Model 320:62–70. https://doi.org/10.1016/j.ecolmodel.2015.09.019
Elith J, Leathwick JR (2009) Species distribution models: ecological explanation and predictionacross space and time. Annu Rev Ecol Evol Syst 40(1):677–697. https://doi.org/10.1146/annurev.ecolsys.110308.120159
Feehan J, Harley M, Van Minnen J (2009) Climate change in Europe. 1. Impact on terrestrialecosystems and biodiversity. A review. Agron Sustain Dev (EDP Sciences) 29(3):409–421.https://doi.org/10.1051/agro:2008066
Foden W, Vié JC, Angulo A, Butchart S, DeVantier L, Dublin H, Gutsche A, Stuart S, Turak E(2008) Species susceptibility to climate change impact. In: Vié JC, Hilton-Taylor C, Stuart SN(eds) The 2008 review of the IUCN red list of threatened species. IUCN Gland, Switzerland

240 F. Mallard and L. Couderchet
GIEC (2013) Changements climatiques 2013 les éléments scientifiques: extraits de la contributiondu groupe de travail I au cinquième rapport d’évaluation du Groupe d’experts intergouvernemen-tal sur l’évolution du climat. Groupe d’experts intergouvernemental sur l’évolution du climat,Geneva, Switzerland, 204p
Gonçalves J, Honrado JP, Vicente JR, Civantos E (2016) A model-based framework for assessingthe vulnerability of low dispersal vertebrates to landscape fragmentation under environmentalchange. Ecol Complexity 28:174–186. https://doi.org/10.1016/j.ecocom.2016.05.003
Gourvil PY, Soulet D, Couanon V, Sannier M, Drouet E, Simpson D, Van Halder I (2016)Pré-Atlas des rhopalocères et zygènes d’Aquitaine. Synthèse des connaissances 1995–2015.CEN Aquitaine, LPO Aquitaine, France, 217p
Guisan A, Zimmermann NE (2000) Predictive habitat distribution models in ecology. Ecol Model135(2–3):147–186. https://doi.org/10.1016/S0304-3800(00)00354-9
Guo C, Lek S, Ye S, Li W, Liu J, Li Z (2015) Uncertainty in ensemble modelling of large-Scalespecies distribution: effects from species characteristics and model techniques. Ecol Model306:67–75. https://doi.org/10.1016/j.ecolmodel.2014.08.002
Heikkinen RK, Luoto M, Kuussaari M, Toivonen T (2007) Modelling the spatial distributionof a threatened butterfly: impacts of scale and statistical technique. Landscape Urban Plann79(3–4):347–357. https://doi.org/10.1016/j.landurbplan.2006.04.002
Howard C, Stephens PA, Pearce-Higgins JW, Gregory RD, Willis SG (2014) Improving speciesdistribution models: the value of data on abundance. Methods Ecol Evol 5(6):506–513. https://doi.org/10.1111/2041-210X.12184
Kremen C, Ostfeld RS (2005) A call to ecologists: measuring, analyzing, and managing ecosystemservices. Front Ecol Environ 3(10):540–548. https://doi.org/10.1890/1540-9295%282005%29003%5B0540:ACTEMA%5D2.0.CO%3B2
Le Treut H (2013) Les impacts du changement climatique en Aquitaine: Un état des lieuxscientifique. Presses Universitaires de Bordeaux, Pessac, France, 360p
Leathwick JR, Elith J, Hastie T (2006) Comparative performance of generalized additive modelsand multivariate adaptive regression splines for statistical modelling of species distributions.Ecol Model 199(2):188–196. https://doi.org/10.1016/j.ecolmodel.2006.05.022
Li Y, Cohen JM, Rohr JR (2013) Review and synthesis of the effects of climate change onamphibians. Integr Zool 8(2):145–161. https://doi.org/10.1111/1749-4877.12001
Mallard F (2014) Développement d’une méthode d’évaluation quantitative des effets des projetsd’infrastructures de transport terrestre sur les milieux naturels. Université Nantes Angers leMans, France, 472p, [online] https://tel.archives-ouvertes.fr/tel-01006355/document
Mallard F (2016a) Programme les sentinelles du climat. Tome I : Développement d’indicateursdes effets du changement climatique sur la biodiversité en Nouvelle Aquitaine. C. Nature, LeHaillan, France, 86p. [online] https://technique.sentinelles-climat.org/les-productions/
Mallard F (coord) (2016b) Programme les sentinelles du climat. Tome II : Protocolesd’échantillonnage des indicateurs des effets du changement climatique sur la biodiversitéen Nouvelle Aquitaine. C. Nature, Le Haillan, France, 453p. [online] https://technique.sentinelles-climat.org/les-productions/
Mallard F (2017) Programme les sentinelles du climat. Tome III : Cadre de la modélisation prédic-tive des réponses des espèces face au changement climatique en Nouvelle-Aquitaine. C. Nature,Le Haillan, France, 90p. [online] https://technique.sentinelles-climat.org/les-productions/
Oke OA, Thompson KA (2015) Distribution models for mountain plant species: the value ofelevation. Ecol Model 301:72–77. https://doi.org/10.1016/j.ecolmodel.2015.01.019
Pearman PB, Guisan A, Zimmermann NE (2011) Impacts of climate change on Swiss biodiversity:an indicator taxa approach. Biol Cons 144(2):866–875. https://doi.org/10.1016/j.biocon.2010.11.020
Phillips-Mao L, Galatowitsch SM, Snyder SA, Haight RG (2016) Model-based scenario planningto develop climate change adaptation strategies for rare plant populations in grassland reserves.Biol Cons 193:103–114. https://doi.org/10.1016/j.biocon.2015.10.010

Climate Sentinels Research Program: Developing Indicators … 241
Pradervand JN, Pellissier L, Randin CF, Guisan A (2014) Functional homogenization of bumblebeecommunities in alpine landscapes under projected climate change. Climate Change Responses1(1):1–10. https://doi.org/10.1186/s40665-014-0001-5
Root TL, Schneider SH (2006) Conservation and climate change: the challenges ahead. ConservBiol 20(3):706–708. https://doi.org/10.1111/j.1523-1739.2006.00465.x
Ruys T, Couzi L (2015) Atlas des Mammifères sauvages d’Aquitaine. Tome 6 : Les rongeurs, lesérinacéomorphes et les soricomorphes. Cistude Nature et LPO Aquitaine. C. Nature, Le Haillan,France, 228p
Sinervo B, Méndez-de-la-Cruz F, Miles DB, Heulin B, Bastiaans E, Villagrán-Santa Cruz M,Lara-Resendiz R, Martínez-Méndez N, Calderón-Espinosa ML, Meza-Lázaro RN, GadsdenH, Avila LJ, Morando M, De la Riva IJ, Victoriano Sepulveda P, Sepulveda PV, Rocha CFD,Ibargüengoytía N, Puntriano CA, Massot M, Lepetz V, Oksanen TA, Chapple DG, Bauer AM,Branch WR, Clobert J, Sites JW Jr (2010) Erosion of lizard diversity by climate change andaltered thermal niches. Science 328(5980):894–899. https://doi.org/10.1126/science.1184695
Singer A, Johst K, Banitz T, Fowler MS, Groeneveld J, Gutiérrez AG, Hartig F, Krug RM, Liess M,Matlack G, Meyer KM, Peer G, Radchuk V, Voinopol-Sassu AJ, Travis JMJ (2016) Communitydynamics under environmental change: how can next generation mechanistic models improveprojections of species distributions? Ecol Model 326:63–74. https://doi.org/10.1016/j.ecolmodel.2015.11.007
Smeets E, Weterings R (1999) Environmental indicators: typology and overview. EuropeanEnvironment Agency Copenhagen, Copenhagen, Denmark, 19p
Watling JI, Brandt LA, Bucklin DN, Fujisaki I, Mazzotti FJ, Romañach SS, Speroterra C(2015) Performance metrics and variance partitioning reveal sources of uncertainty in speciesdistribution models. Ecol Model 309:48–59. https://doi.org/10.1016/j.ecolmodel.2015.03.017
Introducing Spatio-TemporalConservation Units: Models for FlexibleOptimization of Species PersistenceUnder Climate Change
Diogo Alagador and Jorge Orestes Cerdeira
Abstract Anticipating the effects of climate change on biodiversity and integratingthem in planning protocols for the future are fundamental strategies to increase theeffectiveness of conservation efforts. With climate change, species require disper-sal skills to follow displacements of their suitable climates and therefore, spatialconservation interventions need to consider such dynamics. In general, commonplanning frameworks identify networks of conservation areas seemed important forspecies range shifts. However, it is highly unlikely that all the areas in a networkpresent synchronous conservation value. Furthermore, given the continuous (spatialand temporal autocorrelated) nature of threats and ecological processes, the valueof each area is largely dependent on the state of the neighboring areas in the recentpast. In this study, a family of three models centered on the prioritization (not ofsingle areas but) of temporal chains of areas as conservation units is presented.These models drive the use of financial investments through time in order to maxi-mize the persistence of biodiversity in dynamic environments. Alike the most typicalapproaches, the here introduced models allow investments to be transferred betweenareas losing conservation relevancy to the areas that gain relevancy. A fictitious (butplausible) conservation plan for ten mammal species in Iberian Peninsula up to 2080is used to illustrate the setting-up and outputs of the models. Results evidence thatthe conservation effectiveness achieved in each model depends on singular spatio-temporal distribution relationships among species and between species and distinctland-uses. Planners should then investigate the sensitivity of their goals to distinctdecision-support tools even when driven by similar designs and constraints.
D. Alagador (B)Research Center on Biodiversity and Genetic Resources, University of Évora, Casa Cordovil, RuaJoaquim Henrique da Fonseca, 7000-890 Évora, Portugale-mail: [email protected]
J. O. CerdeiraDepartment of Mathematics, Faculty of Sciences and Technology, NOVA University of Lisbon,2829-516 Caparica, Portugale-mail: [email protected]
© Springer Nature Switzerland AG 2019W. Leal Filho et al. (eds.), Handbook of Climate Change and Biodiversity,Climate Change Management, https://doi.org/10.1007/978-3-319-98681-4_15
243

244 D. Alagador and J. O. Cerdeira
Introduction
Biodiversity conservation typically runs under constrained budgets and with overar-ching aspirations. At present time, growing impacts of anthropogenic activities onhabitats and species have been attested (Venter et al. 2016). These make protectedareas (PA) attractive instruments to counteract these negative effects. Planned to setaside biodiversity from local impingent stressors, the typical way PA are established(as territories of perpetual protection) is not ingenious enough to counter the effectsof pervasive and dynamic threats, as the ones typically arising from climate change(Hannah and Salm 2003). Under this context, novel-informed decisions are requiredin order to make long-term conservation (characterized by complex, non-linear pro-cesses) effective. A paradigm shift is needed in order to align PA establishment withthe dynamics of climate such that biodiversity responses are anticipated and inte-grated within conservation models (Araújo et al. 2011a; Scott and Lemieux 2005;Dodd et al. 2010).
As the spatial patterns of climate change with time, species rearrange their dis-tributional ranges in order to keep track of their suitable climatic conditions (Garciaet al. 2014). Species that were adequately represented in PA may lose protection.Species that were once poorly covered in PAmay gain protection. New species, oncenot part of a given region, may appear while other species may leave (Araújo et al.2004). Under such a melting pot of responses, planners need to control out whichspecies need to be represented and to what levels those representations should bemaintained into the future within PA, to make them persist.
In the last two decades several PA selection models have been proposed. Broadly,these models followed two general Operations Research problems (Williams andReVelle 1997): the minimum set cover and the maximal coverage. In the minimumset cover (minCost), PA are identified in order to cover a given representation levelof each biodiversity feature in the minimum area (or with the minimum financialinvestment). In the maximal coverage model (maxCoverage), PA selection is madeto maximize the number of biodiversity features adequately represented, with a fixedbudget to spend on area protection (see Table 1 for a comprehensive characterizationof these models). These models have mostly been used with a static overview onbiodiversity distribution and conservation area cost, thus retrieving PAmaps unlikelyto counter-back the negative consequences of climate change. A smaller number ofstudies used these same problems integrating time-varying biodiversity distributionsin decisions protocols (for a review see, Alagador et al. 2016). Capable to deliversolutions for PA establishment with regard to climate change effects on species, theproblems formulated thereinwere not dedicatedly developed, nor are fully optimized,to handle environmental dynamics. For example, solution maps built to anticipateclimate change effects over several decades into the future, do not give informationon the timing each spatial conservation unit is likely to gain (or to lose) relevancy toenter into (or to be released from) an effective PA network. Also, because solutionmaps do not present a time-component, it is not possible to identify a conservationunit that may functionally replace a given highly disturbed conservation unit.
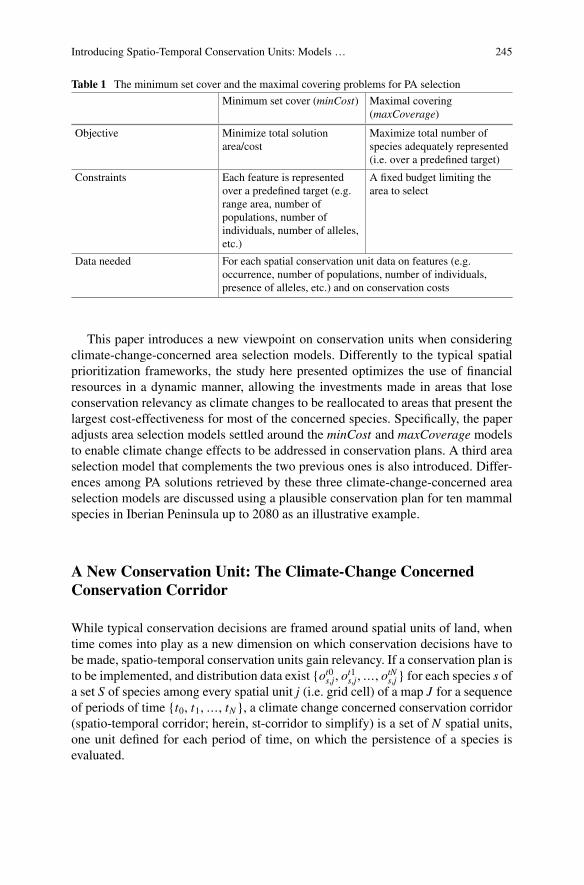
Introducing Spatio-Temporal Conservation Units: Models … 245
Table 1 The minimum set cover and the maximal covering problems for PA selection
Minimum set cover (minCost) Maximal covering(maxCoverage)
Objective Minimize total solutionarea/cost
Maximize total number ofspecies adequately represented(i.e. over a predefined target)
Constraints Each feature is representedover a predefined target (e.g.range area, number ofpopulations, number ofindividuals, number of alleles,etc.)
A fixed budget limiting thearea to select
Data needed For each spatial conservation unit data on features (e.g.occurrence, number of populations, number of individuals,presence of alleles, etc.) and on conservation costs
This paper introduces a new viewpoint on conservation units when consideringclimate-change-concerned area selection models. Differently to the typical spatialprioritization frameworks, the study here presented optimizes the use of financialresources in a dynamic manner, allowing the investments made in areas that loseconservation relevancy as climate changes to be reallocated to areas that present thelargest cost-effectiveness for most of the concerned species. Specifically, the paperadjusts area selection models settled around the minCost and maxCoverage modelsto enable climate change effects to be addressed in conservation plans. A third areaselection model that complements the two previous ones is also introduced. Differ-ences among PA solutions retrieved by these three climate-change-concerned areaselection models are discussed using a plausible conservation plan for ten mammalspecies in Iberian Peninsula up to 2080 as an illustrative example.
A New Conservation Unit: The Climate-Change ConcernedConservation Corridor
While typical conservation decisions are framed around spatial units of land, whentime comes into play as a new dimension on which conservation decisions have tobe made, spatio-temporal conservation units gain relevancy. If a conservation plan isto be implemented, and distribution data exist {ot0s,j, o
t1s,j,…, otNs,j} for each species s of
a set S of species among every spatial unit j (i.e. grid cell) of a map J for a sequenceof periods of time {t0, t1,…, tN}, a climate change concerned conservation corridor(spatio-temporal corridor; herein, st-corridor to simplify) is a set of N spatial units,one unit defined for each period of time, on which the persistence of a species isevaluated.

246 D. Alagador and J. O. Cerdeira
Fig. 1 Schematic representation of st-corridors. In a persistence scores are associated to three st-corridors (c1, c2 and c3) using data on probability of occurrence (o.
.) and probability of successfuldispersal (d .
. ). In b the evaluation of a non-independent set of corridors is illustrated. The st-corridorsc1 and c2 use j3 at t1 and c2 and c3 use j3 at t2. These are therefore non-independent. Contrarily,although made by the spatial unit, j3, c1 and c3 use it at different periods of time periods andare therefore independent. The maximum persistence additively associated to all possible stable(independent) sets of st-corridors measures the persistence of a species s in the final solution
In accordance to probability theory, the probability of an entity to persist withina system evaluated at discrete-times (assuming independence) is the product of theprobabilities of the entity to occur in each period of time with the probabilities ofthe entity to pass from one time to another. With otisj as the probability of a species sto occur in spatial unit j at time ti (data typically retrieved through habitat suitabilitymodels, Araújo and Guisan 2006), then the probability of a species to persist in ast-corridor, c made by {j0, j1,…, jN} is:
Pc(s) � ot0s, j0 × dt0,t1s, j0, j1
× · · · × dtN−1,tNs, jN−1, jN
× otNs, jN (1)
wheredtn ,tn+1s, jn , jn+1
is the probability of a species s to successfully disperse from jn to jn+1 at[tn;tn+1] time-interval. Given that species-specific dispersal rates are highly variablein space, accurate data are hardly available to be used at specific contexts for severalspecies. Dispersal kernels are therefore used as general models to infer how dispersalsuccess varies with dispersal distance. In general, the largest the dispersal distancethe lowest the probability of success. In limit, if a species does not disperse thendtn ,tn+1s, j,i � 0, for j �� i and dtn ,tn+1
s, j, j � 1. For distances larger than the distance a speciesis able to disperse in a given time-period, dmaxs, (i.e. dist( jn, jn+1) > dmaxs), thendtn ,tn+1s, jn , jn+1
� 0. An illustrative example on how persistence scores are evaluated isoutlined in Fig. 1a.

Introducing Spatio-Temporal Conservation Units: Models … 247
The selection of PA supporting the persistence of species along time (from t0 totN ), passes by the identification of a given number of st-corridors for each of thespecies. However, in order to be fully effective, the st-corridors identified for eachspecies should form a stable set in the sense that, no two corridors may use the samespatial unit in the same time-period (Fig. 1b exemplifies the evaluation of total speciespersistence in a non-stable set of st-corridors). In this way negative contagious effectsthat may occur in each spatial-unit in a certain period of time are not spread into otherst-corridors, thus promoting redundancy in the set of st-corridors of each species.
With st-corridors, the effect of a disturbance acting in a specific location andtiming may be measured in every other spatial units and time periods (see Fig. 2, foran illustration of a portfolio of disturbing factors acting at distinct spatial units andtime-periods).
Persistence as Conservation Targets
The ultimate goal of conservation is to promote the persistence of biodiversity fea-tures at long-term. However, the evaluation of persistence is hardly made anticipa-tively, as by nature implies time to collect and analyze data. Therefore, several generalrules have been used to estimate persistence and therefore to define conservation tar-gets in area selection models. For example, amount area, number of species, numberof populations and allele frequency within PA have been considered as targets toachieve in final solutions (Neel and Cummings 2003; Pressey et al. 2003). In areaselection models, like the ones here introduced, the estimation of persistence maybe upgraded adding the temporal dimension, as mentioned in Eq. 1 (Alagador andCerdeira 2017). In the following section, the difficulties associatedwith the definitionof persistence targets will be discussed and proposal for their definition made.
Area Scheduling Models: Area Selection Through Time
Settled as conservation units, st-corridors may be used with distinct area selectionmodels developed to handle the spatially-dynamic impacts of climate change imping-ing biodiversity. Instead of spatial units, these climate change concernedmodels oper-ate with the evaluation and selection of st-corridors for maximizing (or minimizing)some benefit (or cost) function.
A proximate version of the minCost model may be built using st-corridors asselection units (K-minCostst). Like minCost, the objective in K-minCostst is theidentification of a solution of minimum cost (but nowmade by st-corridors) in whichthe established persistence targets are fulfilled. There is, however, a detail that needsto be highlighted when quantifying solution cost using st-corridors instead of spatialunits. Unlike the static models, for which solution cost is made by adding up the costsassociated with the selected spatial units, solution cost in st-corridor-based models
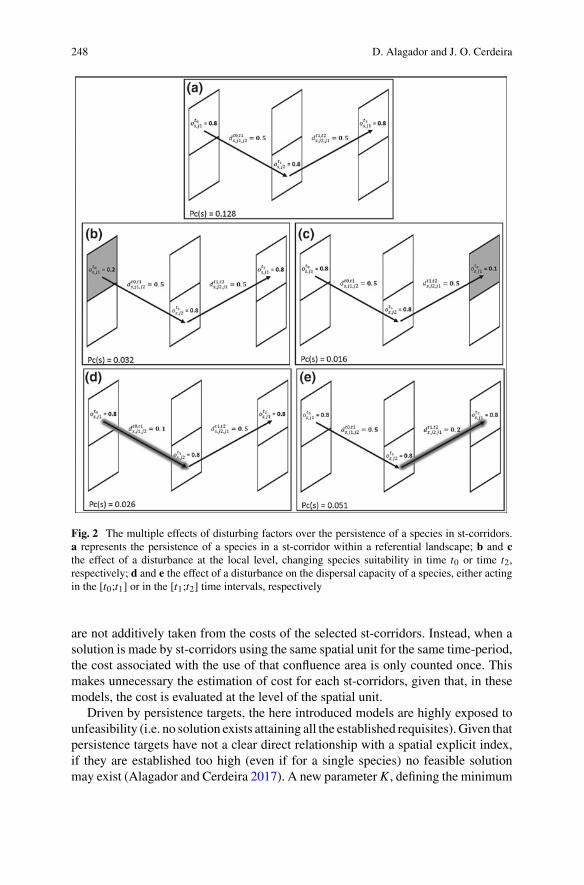
248 D. Alagador and J. O. Cerdeira
Fig. 2 The multiple effects of disturbing factors over the persistence of a species in st-corridors.a represents the persistence of a species in a st-corridor within a referential landscape; b and cthe effect of a disturbance at the local level, changing species suitability in time t0 or time t2,respectively; d and e the effect of a disturbance on the dispersal capacity of a species, either actingin the [t0;t1] or in the [t1;t2] time intervals, respectively
are not additively taken from the costs of the selected st-corridors. Instead, when asolution is made by st-corridors using the same spatial unit for the same time-period,the cost associated with the use of that confluence area is only counted once. Thismakes unnecessary the estimation of cost for each st-corridors, given that, in thesemodels, the cost is evaluated at the level of the spatial unit.
Driven by persistence targets, the here introduced models are highly exposed tounfeasibility (i.e. no solution exists attaining all the established requisites). Given thatpersistence targets have not a clear direct relationship with a spatial explicit index,if they are established too high (even if for a single species) no feasible solutionmay exist (Alagador and Cerdeira 2017). A new parameter K , defining the minimum
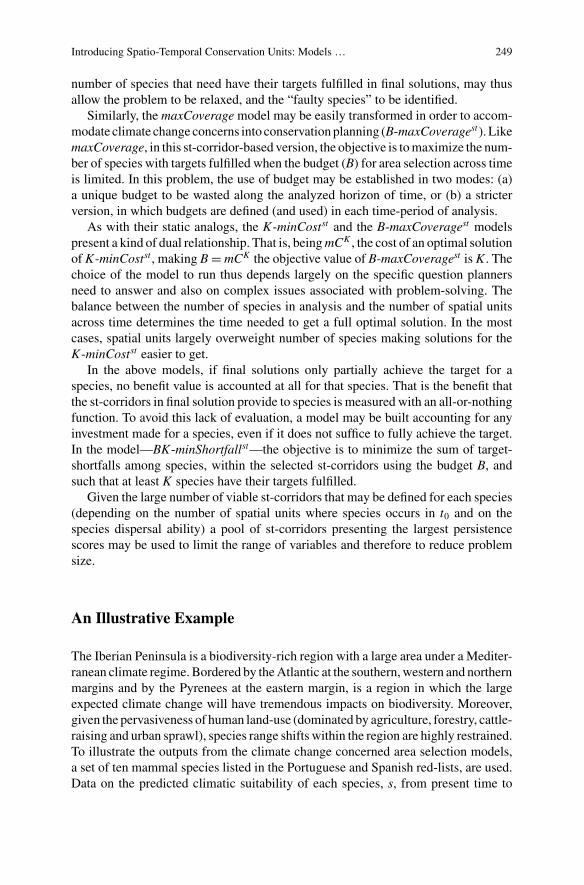
Introducing Spatio-Temporal Conservation Units: Models … 249
number of species that need have their targets fulfilled in final solutions, may thusallow the problem to be relaxed, and the “faulty species” to be identified.
Similarly, the maxCoveragemodel may be easily transformed in order to accom-modate climate change concerns into conservationplanning (B-maxCoveragest). LikemaxCoverage, in this st-corridor-based version, the objective is tomaximize the num-ber of species with targets fulfilled when the budget (B) for area selection across timeis limited. In this problem, the use of budget may be established in two modes: (a)a unique budget to be wasted along the analyzed horizon of time, or (b) a stricterversion, in which budgets are defined (and used) in each time-period of analysis.
As with their static analogs, the K-minCostst and the B-maxCoveragest modelspresent a kind of dual relationship. That is, beingmCK , the cost of an optimal solutionof K-minCostst , making B � mCK the objective value of B-maxCoveragest is K . Thechoice of the model to run thus depends largely on the specific question plannersneed to answer and also on complex issues associated with problem-solving. Thebalance between the number of species in analysis and the number of spatial unitsacross time determines the time needed to get a full optimal solution. In the mostcases, spatial units largely overweight number of species making solutions for theK-minCostst easier to get.
In the above models, if final solutions only partially achieve the target for aspecies, no benefit value is accounted at all for that species. That is the benefit thatthe st-corridors in final solution provide to species is measured with an all-or-nothingfunction. To avoid this lack of evaluation, a model may be built accounting for anyinvestment made for a species, even if it does not suffice to fully achieve the target.In the model—BK-minShortfallst—the objective is to minimize the sum of target-shortfalls among species, within the selected st-corridors using the budget B, andsuch that at least K species have their targets fulfilled.
Given the large number of viable st-corridors that may be defined for each species(depending on the number of spatial units where species occurs in t0 and on thespecies dispersal ability) a pool of st-corridors presenting the largest persistencescores may be used to limit the range of variables and therefore to reduce problemsize.
An Illustrative Example
The Iberian Peninsula is a biodiversity-rich region with a large area under a Mediter-ranean climate regime. Bordered by theAtlantic at the southern,western and northernmargins and by the Pyrenees at the eastern margin, is a region in which the largeexpected climate change will have tremendous impacts on biodiversity. Moreover,given the pervasiveness of human land-use (dominated by agriculture, forestry, cattle-raising and urban sprawl), species range shifts within the region are highly restrained.To illustrate the outputs from the climate change concerned area selection models,a set of ten mammal species listed in the Portuguese and Spanish red-lists, are used.Data on the predicted climatic suitability of each species, s, from present time to
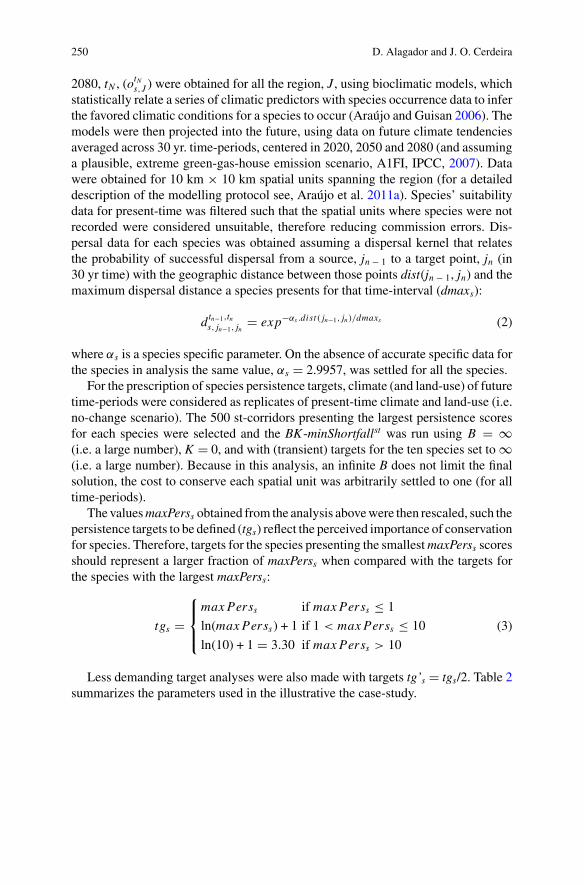
250 D. Alagador and J. O. Cerdeira
2080, tN , (otNs,J ) were obtained for all the region, J , using bioclimatic models, which
statistically relate a series of climatic predictors with species occurrence data to inferthe favored climatic conditions for a species to occur (Araújo and Guisan 2006). Themodels were then projected into the future, using data on future climate tendenciesaveraged across 30 yr. time-periods, centered in 2020, 2050 and 2080 (and assuminga plausible, extreme green-gas-house emission scenario, A1FI, IPCC, 2007). Datawere obtained for 10 km × 10 km spatial units spanning the region (for a detaileddescription of the modelling protocol see, Araújo et al. 2011a). Species’ suitabilitydata for present-time was filtered such that the spatial units where species were notrecorded were considered unsuitable, therefore reducing commission errors. Dis-persal data for each species was obtained assuming a dispersal kernel that relatesthe probability of successful dispersal from a source, jn − 1 to a target point, jn (in30 yr time) with the geographic distance between those points dist(jn − 1, jn) and themaximum dispersal distance a species presents for that time-interval (dmaxs):
dtn−1,tns, jn−1, jn
� exp−αs .dist( jn−1, jn)/dmaxs (2)
where αs is a species specific parameter. On the absence of accurate specific data forthe species in analysis the same value, αs � 2.9957, was settled for all the species.
For the prescription of species persistence targets, climate (and land-use) of futuretime-periods were considered as replicates of present-time climate and land-use (i.e.no-change scenario). The 500 st-corridors presenting the largest persistence scoresfor each species were selected and the BK-minShortfallst was run using B � ∞(i.e. a large number), K � 0, and with (transient) targets for the ten species set to ∞(i.e. a large number). Because in this analysis, an infinite B does not limit the finalsolution, the cost to conserve each spatial unit was arbitrarily settled to one (for alltime-periods).
The valuesmaxPerss obtained from the analysis abovewere then rescaled, such thepersistence targets to be defined (tgs) reflect the perceived importance of conservationfor species. Therefore, targets for the species presenting the smallestmaxPerss scoresshould represent a larger fraction of maxPerss when compared with the targets forthe species with the largest maxPerss:
tgs �
⎧⎪⎨
⎪⎩
max Perss if max Perss ≤ 1
ln(max Perss) + 1 if 1 < max Perss ≤ 10
ln(10) + 1 � 3.30 if max Perss > 10
(3)
Less demanding target analyses were also made with targets tg’s � tgs/2. Table 2summarizes the parameters used in the illustrative the case-study.

Introducing Spatio-Temporal Conservation Units: Models … 251
Table 2 The species in analysis; their Red List Book (RL) threat status in Portugal (PT) and Spain(SP); the maximum dispersal distance (dmaxs), the maximum persistence obtained in a non-climatechange scenario (maxPerss) and the target defined for the most target demanding assessments (tgs)
Speciesname
Abbrev RL Status dmaxs(km/30 yr)
maxPerss tgs
PT SP
Galemyspyrenaicus
Gpy VU VU 20 4.07 2.40
Mustelaerminea
Mer DD DD 10 1.86 1.62
Mustelalutreola
Mlu NT EN 10 0.03 0.03
Oryctolaguscuniculus
Ocu NT VU 65 88.04 3.30
Arvicolasapidus
Asa NT VU 31 34.60 3.30
Microtuscabreraea
Mca VU VU 115 0.21 0.21
Canis lupus Clu EN NT 160 3.76 2.32
Ursusarctos
Uar EX CR 200 0.08 0.08
Felissylvestris
Fsy VU NT 200 21.23 3.30
Caprapyrenaica
Cpy CR NT 200 0.29 0.29
EX Extinct; CE Critically endangered; EN Endangered; VU Vulnerable; NT Near threatened; DDData deficient; aendemic of Iberian Peninsula
Data on the cost to assign to each spatial unit for conservation were derived fromland-use data for present-time and the time-periods aligned with species data (i.e.2020, 2050, 2080). For each spatial unit, j, in each time-period, t, the fraction coverwith agriculture ( f t,agrj ), pasture ( f t,pastj ), forests ( f t, f orj ) and urban lands ( f t,urbj )was measured and the cost to use each spatial unit in a given time period (Alagadorand Cerdeira 2018) settle as:
cost tj � 1 + f t,agrj + f t,pastj + f t, f orj + f t,urbj (4)
The K-minCostst model was run using K∈{1, 2, …, 10}. The solution costsobtained either with the most and the less demanding target-settings (for each Kvalue, with mCK retrieving feasible solutions) were used as referential values todefine a set of B values to use in the other two models (B). Adding to those values,each interval [mCK ,mCK + 1], was portioned in five equal-sized sets and their innerlimits defined four more B values to use (with K < Kmax and Kmax the maximumK retrieving a feasible K-minCostst solution). Four B values were also establishedbelow mC1 (0.90. mC1; 0.925. mC1, 0.95. mC1and 0.975. mC1) and above mCKmax
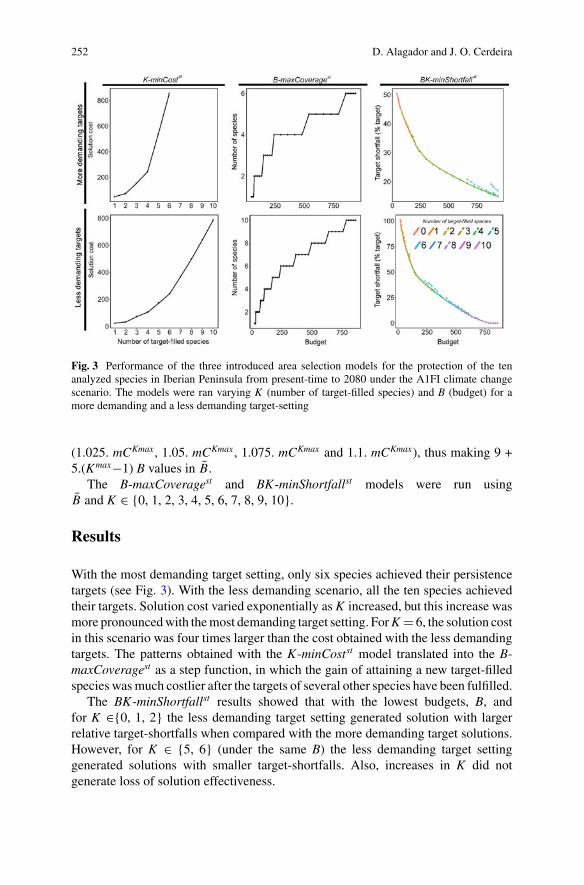
252 D. Alagador and J. O. Cerdeira
Fig. 3 Performance of the three introduced area selection models for the protection of the tenanalyzed species in Iberian Peninsula from present-time to 2080 under the A1FI climate changescenario. The models were ran varying K (number of target-filled species) and B (budget) for amore demanding and a less demanding target-setting
(1.025. mCKmax, 1.05. mCKmax, 1.075. mCKmax and 1.1. mCKmax), thus making 9 +5.(Kmax−1) B values in B.
The B-maxCoveragest and BK-minShortfallst models were run usingB and K ∈ {0, 1, 2, 3, 4, 5, 6, 7, 8, 9, 10}.
Results
With the most demanding target setting, only six species achieved their persistencetargets (see Fig. 3). With the less demanding scenario, all the ten species achievedtheir targets. Solution cost varied exponentially as K increased, but this increase wasmore pronouncedwith themost demanding target setting. ForK � 6, the solution costin this scenario was four times larger than the cost obtained with the less demandingtargets. The patterns obtained with the K-minCostst model translated into the B-maxCoveragest as a step function, in which the gain of attaining a new target-filledspecies wasmuch costlier after the targets of several other species have been fulfilled.
The BK-minShortfallst results showed that with the lowest budgets, B, andfor K ∈{0, 1, 2} the less demanding target setting generated solution with largerrelative target-shortfalls when compared with the more demanding target solutions.However, for K ∈ {5, 6} (under the same B) the less demanding target settinggenerated solutions with smaller target-shortfalls. Also, increases in K did notgenerate loss of solution effectiveness.

Introducing Spatio-Temporal Conservation Units: Models … 253
Fig. 4 Shortfall to persistence targets (as a percentage of targets) obtained for each species in solu-tions of varying cost (budget) using: a K-minCostst , b B-maxCoveragest , and c BK-minShortfallst
models. Plots refer to the most demanding persistence targets assessed. Gpy: Galemys pyrenaicus;Mer:Mustela erminea;Mlu:Mustela lutreola;Ocu:Oryctolagus cuniculus;Asa: Arvicola sapidus;Mca: Microtus cabrerae; Clu: Canis lupus; Uar: Ursus arctos; Fsy: Felis sylvestris; Cpy: Caprapyrenaica
The effectiveness to protect the distinct species differed significantly with themodel used and withK andB values (see Fig. 4 for a full evaluation of the persistenceexpectancies of each of the ten analyzed species under the full parameterization

254 D. Alagador and J. O. Cerdeira
space experimented). The accrue of target-filled species in K-minCostst followed asequential-cumulative pattern with Ocu, Asa, Fsy, Clu, Mca and Cpy being added tothe set of target-filled species respectively. This nested pattern of target-filled specieswas not reproduced in the B-maxCoveragest . For some budgets decisions on whichof two species to cover adequately have to be made leading to shifts on the set oftarget-filled species.
The species-specific curves representing solutions fromBK-minShortfallst permitto distinguish the species requiring less financial resources to meet their persistencetargets (e.g. Ocu, Asa, Fsy) from the species which (e.g. Mlu, Mca and Cpy). ForK ∈ {0, 1, 2, 3, 4} the increased protection of Mer and Uar conflicted with theprotection of Gpy, thus making the target-shortfall of Gpy to increase as B increased500 forward.
Fig. 5 presents an overview of cost-effectiveness of spatial units making st-corridors in Iberian Peninsula along time using the three proposed models. Here,the six K-minCostst solutions presented higher stability when compared with thesolutions retrieved by the two other models (Fig. 5). The 54 solutions obtained withB-maxCoveragest delivered a homogeneous map of number of species benefitingfrom the selection of spatial units with time. Finally, BK-minShortfallst solutionspresented a large variation in the species favored by the prioritized areas. Most ofthe spatial units supported two to three species, but in some regions (NW and NEof Iberian Peninsula) spatial units contributed for the conservation of six to sevenspecies within all the time-periods assessed.
Discussion
This study introduces a novel concept in conservation planning (the climate changeconcerned conservation corridor, st-corridor) that defines a flexible conservation unitto be used when the effects of dynamic processes over multiple species (as the onesgenerated from climate change) need to be anticipated. Using st-corridors as conser-vation units in distinct area selection models, planners are able to define a schedulefor the uptake (or release) of areas to (from) the side of conservation. When a spatialunit is expected to lose conservation value to other spatial unit(s), it may be releasedfrom conservation focus and the investments here saved are transferred to spatialunits predicted to retrieve larger conservation benefits. In this way, PA selectionsurpasses the typical greedy protocols, under which areas are accumulated as timepasses, and is converted to a flexible framework that still needs to accommodate tothe impacts of the most pervasive socio-economic activities, but that requires lessarea to retrieve the same or even larger conservation benefits (Fuller et al. 2010).
With the time dimension at play, themost natural way to evaluate the effectivenessof st-corridors is through a quantitative evaluation of species persistence reflectingthe vulnerability of species to climate change (or other threats under analysis) andthat, depending on data availability and spatial scale, may present distinct structures(Williams et al. 2008). The biogeographical scale of the study-case here used, per-

Introducing Spatio-Temporal Conservation Units: Models … 255
Fig. 5 The mean number of species protected by each spatial unit in each time period obtainedamong several solutions made by varying K and B, in a K-minCostst , b B-maxCoveragest , and cBK-minShortfallst models using the most demanding persistence targets. Histograms represent thenumber of spatial units protecting, in average, a given number of species for solutions generatedwith: d K-minCostst , e B-maxCoveragest , and f BK-minShortfallst models
mitted species persistence scores to be assessed using broad-scale evaluations ofclimate suitability (i.e. exposure level) and species dispersal abilities (i.e. speciessensitivity) through time. From the side of exposure, the effects of micro-habitatsand topographic buffering may be integrated for a measure of climate suitability(Potter et al. 2013; Lenoir et al. 2017). The synergistic effects of climate with otherfactors may also be important to be evaluated. For example, the effects of new occur-ring species, of excluded species and new species interrelationships (Araújo et al.2011b), and the occurrence of new threats (like new uses of land) may be integratedinto this local suitability score. From the side of sensitivity, genetic, phylogeneticand behavioral plasticity are factors that leverage species’ adaptive capacity at thelocal scale (Shoo et al. 2013). Besides dispersal, other sensitivity indicators as lifehistory traits (e.g. reproductive rates, life-span, metabolic rates), population dynam-ics (extinct-colonization events under a meta-population structure) and abundancedata may also aid to get a more integrative picture of the likely species persistencewithin the analyzed spatio-temporal system (Hampe and Petit 2005). By acting antic-ipatively to the effects of climate change over time, the here proposed framework islargely dependent on predictive tools that naturally incorporate uncertainties. Someuncertainties may be quantified and controlled within the final solutions such thatrobust assessments are made. Measures on the effects of assuming distinct climate
256 D. Alagador and J. O. Cerdeira
scenarios, distinct bioclimatic model types (Araújo and New 2007) and on the likelyvariability of spatial unit cost (Salomon et al. 2013) may allow an uncertainty layerto be produced. By merging uncertainty and cost, final solutions will tend to givehigher priority to the less costly spatial units with the more stable estimations onlocal suitability (Lemes and Loyola 2013).
While flexible to be used in some particular cases, themodels here presented sufferfrom general caveats. As stated above, although in theory the models here presentedmay incorporate a portfolio of threats acting at the local suitability and dispersalcapabilities of species, the models are mostly appropriate to handle climate change.The st-corridors selected are areas that should be given full consideration as pathwaysenabling species natural adaptation through time. Given that the states of areas (forthe different species) are not dependent on the history of previous decisions (andinterventions) either locally on in neighboring areas, testing the effect of changingland-use practices in order to mitigate threats for single or various species should becarried out using pure dynamic implementations of area prioritization models. Giventhat these effects are stochastic by nature, a large number of potential system statesneeds to be evaluated which implies greater complexity and new quality-heuristicmethods to be developed (Sheldon et al. 2010).
In the models here described, there is the possibility to save investments withreallocation of financial efforts from the areas that lose conservation effectivenesstowards the areas whose cost-effectiveness compensate such losses. In practice,more than a redirection of investments, real-world land-markets allow new financialresources to be generated from the released areas. Interest rates, selling or rentingcontracts may provide new profits for conservation agencies. With the anticipativemodels here introduced these imbricate economic details may be approximated inadvance by informing the cost of intervene in spatial units with possible financialrevenues associated to the release of area from conservation focus.
Identically to the example here presented, it is very likely that, facedwith the sameeffectiveness requirements (i.e. K values) and with the same financial resources toinvest in conservation (B values), planners will be confronted with distinct solutionswhen using different area selection models. Importantly, planners need to state theirgoals clearly; to formulate an adequate optimization protocol (using either a mini-mum cost or maximum benefit scheme), and to test the sensitivity of their models toparameter variability. This is a process that goes well beyond a few maps of priorityareas. Ideally, it should involve a wide array of stakeholders such that intangiblevariables are considered (Knight et al. 2010). The models here introduced are notprescriptive and may be adopted as support tools to optimally anticipate the wide-ranging effects of climate change on biodiversity and ecosystem services.
Conclusions and Future Prospects
This study introduces the st-corridor as a new conservation unit that has relevancyin anticipative conservation plans, as it allows to find well delimited pathways ofspecies persistence into the future while also identifying the timing spatial units gain

Introducing Spatio-Temporal Conservation Units: Models … 257
relevancy to support species range adaptations as a response to changing climates.These conservation units may be integrated in distinct assignment problems runningwith distinct goals and constraints and, therefore, have potential to assist stakeholdersand decision makers in testing different attitudes towards climate-change-concernedconservation planning. In the future, these models may be implemented in real con-servation frameworks looking to resolve the broad question driving conservationplanners and policy-makers: where, when and how to use conservation resources inorder to make species to persist the increasing challenges from climate change.
Acknowledgements This research was funded by FEDER funds through the Fundação paraa Ciência e a Tecnologia (FCT) and Programa Operacional Factores de Competitividade—-COMPETE—and was undertaken under the projects PTDC/AAG-GLO/3979/2014 (ref. 9471-RIDTI) and UID/MAT/00297/2013. DA received support through a FCT’s postdoctoral fellowshipSFRH/BPD/104077/2014. Both authors have no conflicts of interest to declare.
References
Alagador D, Cerdeira J (2018) A quantitative analysis on the effects of critical factors limiting theeffectiveness of species conservation in future-time. Ecol Evol 8(6):3457–3467
Alagador D, Cerdeira JO (2017) Meeting species persistence targets under climate change: a spa-tially explicit conservation planning model. Divers Distrib 23(6):703–713
Alagador D, Cerdeira JO, Araújo MB (2016) Climate change, species range shifts and dispersalcorridors: an evaluation of spatial conservation models. Methods Ecol Evol 7(7):853–866
Araújo MB, Guisan A (2006) Five (or so) challenges for species distribution modelling. J Biogeogr33(10):1677–1688
Araújo MB, New M (2007) Ensemble forecasting of species distributions. Trends Ecol Evol22(1):42–47
Araújo MB, Cabeza M, Thuiller W, Hannah L, Williams PH (2004) Would climate change drivespecies out of reserves? An assessment of existing reserve-selection methods. Glob Change Biol10(9):1618–1626
AraújoMB,AlagadorD, CabezaM,Nogués-BravoD, ThuillerW (2011a) Climate change threatensEuropean conservation areas. Ecol Lett 14:484–492
Araújo MB, Rozenfeld A, Rahbek C, Marquet PA (2011b) Using species co-occurrence networksto assess the impacts of climate change. Ecography 34(6):897–908
Dodd A, Hardiman A, Jennings K, Williams G (2010) Protected areas and climate change—reflec-tions from a practitioner’s perspective. Utrech Law Rev 6(1):141–148
Fuller RA,McDonald-Madden E,Wilson KA, Carwardine J, GranthamHS,Watson JEM, Klein CJ,Green DC, Possingham HP (2010) Replacing underperforming protected areas achieves betterconservation outcomes. Nature 466(7304):365–367
Garcia RA, Cabeza M, Rahbek C, Araújo MB (2014) Multiple dimensions of climate change andtheir implications for biodiversity. Science 344(6183):486
Hampe A, Petit RJ (2005) Conserving biodiversity under climate change: the rear edge matters.Ecol Lett 8(5):461–467
Hannah L, Salm R (2003) Protected areas and climate change. In: Hannah L, Lovejoy T (eds)Climate change and biodiversity: synergistic impacts, vol 4. Advances in Applied BiodiversityScience. Conservation International, Washington DC, pp 91–100
IPCC (2007) Climate Change 2007: Synthesis report. Contribution of working groups I, II and III tothe fourth assessment report of the Intergovernmental Panel on Climate Change. IPCC, Geneva,Switzerland
258 D. Alagador and J. O. Cerdeira
Knight AT, Cowling RM, Difford M, Campbell BM (2010) Mapping human and social dimensionsof conservation opportunity for the scheduling of conservation action on private land. ConservBiol 24(5):1348–1358
Lemes P, Loyola RD (2013) Accommodating species climate-forced dispersal and uncertainties inspatial conservation planning. PLoS ONE 8(1):e54323
Lenoir J, Hattab T, Pierre G (2017) Climatic microrefugia under anthropogenic climate change:implications for species redistribution. Ecography 40(2):253–266
NeelMC,CummingsMP (2003) Effectiveness of conservation targets in capturing genetic diversity.Conserv Biol 17(1):219–229
Potter KA, Arthur Woods H, Pincebourde S (2013) Microclimatic challenges in global changebiology. Glob Change Biol 19(10):2932–2939
Pressey RL, Cowling RM, Rouget M (2003) Formulating conservation targets for biodiversitypattern and process in the Cape Floristic Region, South Africa. Biol Conserv 112(1–2):99–127
Salomon Y, McCarthy MA, Taylor P, Wintle BA (2013) Incorporating uncertainty of managementcosts in sensitivity analyses of matrix population models. Conserv Biol 27(1):134–144
Scott D, Lemieux C (2005) Climate change and protected area policy and planning in Canada.Forestry Chronicle 81(5):696–703
Sheldon D, Dilkina B, Elmachtoub A, Finseth R, Sabharwal A, Conrad J, Gomes C, Shmoys D,Allen W, Amundsen O, Vaughan B (2010) Maximizing the spread of cascades using networkdesign. In: Proceedings of the twenty-sixth conference on uncertainty in artificial intelligence(UAI2010)
Shoo L, Hoffmann A, Garnett S, Pressey R, Williams Y, Taylor M, Falconi L, Yates C, Scott J,Alagador D,Williams S (2013)Making decisions to conserve species under climate change. ClimChange 119(2):239–246
Venter O, Sanderson EW, Magrach A, Allan JR, Beher J, Jones KR, Possingham HP, LauranceWF, Wood P, Fekete BM, Levy MA, Watson JEM (2016) Sixteen years of change in the globalterrestrial human footprint and implications for biodiversity conservation. Nat Commun 7
Williams JC, ReVelle CS (1997) Applyingmathematical programming to reserve selection. EnvironModel Assess 2(3):167–175
Williams SE, Shoo LP, Isaac JL, Hoffmann AA, Langham G (2008) Towards an integrated frame-work for assessing the vulnerability of species to climate change. PLoS Biol 6(12):e325

The Impact of Climate Changeand Variability on Wild TerrestrialAnimals in Selected Rural CoastalRegions of Kenya
Bertha Othoche
Abstract Climate change has become a household term in the North and Southcoastal region of Kenya. The ever increasing temperature conditions and erraticrains have raised concerns among local communities in the region. The changing cli-matic conditions has affected both man and animal in almost equal measure. Specifi-cally,migration and disappearance of terrestrial animals have been observed. Climatechange and biodiversity and specifically terrestrial animals are interrelated. Climatechange affects water and pasture which are the lifeblood to terrestrial animals. Theseanimals need water for transport of nutrients and other metabolic processes. Theyneed pasture to acquire nutritional components and for growth and development.Any adverse change on climate therefore affects the animals directly. This paperpresents an assessment of the impact of climate change on terrestrial animals. Thespecific objectives of the paper include: to assess the changing weather and climaticconditions; to document climate change impacts on terrestrial animals, and to explorethe strategies put in place by stakeholders to address the problems. The study adoptsa descriptive approach including the use of ten local community leaders and con-servation agents as key informants to obtain thematic data on terrestrial animals inthe selected areas. Four focus group discussions were organized each with ten localcommunity members to give additional information on climate change and terrestrialanimals. Data was analyzed using descriptive statistics and presented graphically inline with the emerging themes. The study generated knowledge and valuable infor-mation to global conservation agents, national governments, policy makers and theacademia on climate change and biodiversity and specifically terrestrial animals.
B. Othoche (B)School of Environmental and Earth Sciences, Pwani University, P.O. Box 195, Kilifi 80108, Kenyae-mail: [email protected]
© Springer Nature Switzerland AG 2019W. Leal Filho et al. (eds.), Handbook of Climate Change and Biodiversity,Climate Change Management, https://doi.org/10.1007/978-3-319-98681-4_16
259

260 B. Othoche
Introduction: Climate Change and Biodiversity
Climate change and weather variability have been observed globally in the recentpast. Climate change is the significant and long lasting change in the statistical dis-tribution of weather patterns over periods ranging from a decade to millions of years(Blast 2010). Climatologists have identified upward trends in global temperaturesand now estimate an unprecedented rise of 2.0 °C by the year 2100 (Partz et al.1996). The changing climatic conditions have affected the quality of both terrestrialand ocean biodiversity in different ecosystems.
Biodiversity refers to the variety of life on earth measured at genetic, speciesand ecosystem levels (Benn 2010). Under favorable conditions, biodiversity flourishand becomes healthy and more productive. The distribution of biodiversity acrossthe globe is influenced by physical and anthropogenic factors. Latitudinal gradientsin species diversity has been observed (Field et al. 2009; Young 2003; Tittensoret al. 2010; Myers et al. 2000; Gaston 2000). Generally, biodiversity is in greatabundance in the equatorial and tropical areas than it is in the temperate and polarregions. Specifically, terrestrial biodiversity tends to be abundant in the tropical areaswhile marine biodiversity is abundant along the coastal regions. This is due to warmtemperatures and abundance of rainfall in the tropical and equatorial regions (Fieldet al. 2009). The tropical forests for example cover less than 10%of the earth’s surfacebut contain 90% of the world’s species. In general, biodiversity hot spots occur infavorable environments in relation to latitudinal changes (McPeek and Brown 2007;Peters 2013; Robosky 2009). Terrestrial biodiversity plays an important role in thelife of man and other animals in general. Indeed, biodiversity offers services andproducts that sustain ecosystems.
The services offered by biodiversity can be categorised as provisional, regula-tory and cultural services. Provisional services involve the production of renewableresources such as food, wood, and fresh water. Regulatory services include those thatregulate climate and weather patterns and disease and pest control. Cultural servicesrepresent human value and enjoyment and includes cultural heritage, landscape aes-thetics, outdoor recreation and spiritual significance (Cardinale et al. 2012; Wrightand Bernard 2002; Daniel 2012).
For biodiversity and specifically terrestrial biodiversity to flourish in an area,there should be adequate supply of water. Climate change affects continuous supplyof water from direct precipitation (Adams and Dannele 2008). This in turn affectswater sources that rely on precipitation. Examples of sources of water that rely onprecipitation directly and indirectly include rivers, water pans and boreholes. Thesewater sources are sustained by the hydrological cycle which dictates the amount ofwater that eventually reaches the earth’s surface and remains available for plants.From plants the feeding chains are sustained and therefore existence of ecosystemsguaranteed. Sustainable water supply is no longer guaranteed in most parts of theworld. This problem has been aggravated by the changing weather and climatic pat-terns (Bates et al. 2008; Parmesan and Yohe 2003; UNESCO 2003). In the study arearainfall patterns have been erratic for most part of the last decade thereby affecting
The Impact of Climate Change and Variability on Wild Terrestrial … 261
water supply. Rivers and streams have turned into seasonal channels and some havedried out completely leaving behind sand and gravel during the dry season. Waterpans have also dried up and borehole water volume reduced.
Climate change has impacted on biodiversity in different ecosystems worldwide.Both aquatic and terrestrial ecosystems have been affected in one way or the other.More so, climate change has impacted on terrestrial animals specifically (Sahney et al.2010). It has been established that every organism has a unique set of preferencesthat enables it to establish its own niche with specific environmental conditions. Eachniche has specific conditions that enables the organism to survive. The environmentalconditions associated with each niche where each organism survives include climate,soil conditions, competition, latitude, among others. Any alteration of an animal’sniche especially when climatic conditions change will definitely affect the wellbeingof the specific animals. Climate change therefore is a major factor to consider wheninvestigating biodiversity and sustainable environmental conditions.
Climate change might result in low productivity in the terrestrial animal ecosys-tems, poor health of animals, migration and disappearance of the animals as well asextinction of the same animals where adverse conditions spread over a long periodof time (Pimm et al. 2014; Rustard 2008; Pearson and Dawson 2005). In the studyarea, manifestations of climate change have been established. This is in the form ofprolonged droughts, ever increasing temperatures and erratic rains (Makenzi et al.2013). Animals have adversely been affected due to prolonged droughts and inad-equate pasture in the midst of erratic rains. It is with this in mind that this paperinvestigates the impact of climate change on terrestrial animals in the North andSouth coastal region of Kenya.
The Study Objectives
The specific objectives of the study included: to assess the changing weather andclimatic conditions; to document climate change impacts on terrestrial animals, andto explore the strategies put in place by stakeholders to address the problems.
The Rationale of the Paper
Climate change and biodiversity conservation are global issues in the contemporarysociety. Biodiversity conservation is an urgent matter due to the ever increasingthreats. In order to arrest this trend, researches on biodiversity and climate change arenecessary on a continuous basis. It is with this background that this paper investigatesthe impact of climate change on terrestrial animals. The study highlights the problemsassociated with climate change and biodiversity thereby contributing towards findingsolutions on biodiversity conservation amidst effects of climate change. Very fewstudies have addressed the effects of climate change on terrestrial animals in the

262 B. Othoche
selected study areas hence this study addresses and fills the gap in literature in thisarea. The study also contributes to the professional development component therebyenhancing scholarly work in climate change science.
Methodology
The Study Area
The study area is located in the coastal region of Kenya. Specifically, the studywas carried in two counties, namely Kwale and Kilifi in the South and North Coastrespectively. Communities in the South Coast are mainly the Digo, while in theNorth Coast they are mainly the Giriama. Both communities belong to theMijikendagroup of the coastal region of Kenya. The communities are mixed farmers; henceclimate and agriculture are key livelihood resources. The ecosystems that formedreference base for terrestrial animals for the study because of the high concentrationof such animals are the Arabuko Sokoke Forest in North Coast, (Kilifi County) andShimba Hills, in South Coast, (Kwale County). The most important ecosystem inthe north coast of Kenya is the Arabuko Sokoke forest. The forest is located at3°16′S39°49′. In terms of area, the park is 6 km2. Apart from Arabuko Sokoke, othermajor forest resources in the North Coast include the Dakatcha Woodland and theDida forest. Arabuko Sokoke is the largest coastal forest (GoK 2016). Part of thisforest has been designated as a national park. ShimbaHill National Reserve is locatedat 04°′26′′S39º23′16′′E and has an area of 192.51 km2. Indeed, Arabuko Sokoke andShimba Hills are conservation areas managed by Kenya Wildlife Service as well asthe Kenya Forest Services assisted by other conservation groups.
Research Design
This study adopted a descriptive approach that resulted in data acquisition, analysisandpresentation. This design is used as a framework that addresses research questionsand gives the methods and procedures used in sampling, data collection and analysis.
Sampling and Sample Size
The study used purposive non-probability sampling method. Ten local communityleaders and conservation agents as key informants are used to obtain thematic data onterrestrial animals in the selected areas. Four focus group discussions were organizedeach with ten local community members to give additional information on climate
The Impact of Climate Change and Variability on Wild Terrestrial … 263
change and terrestrial animals. Data was analyzed using descriptive statistics andpresented graphically in line with the emerging themes.
Results/Discussion
Climate in the Selected Study Areas
It was established that the average annual rainfall in the study area increases slightlyfrom the coast, from 900–1000mm, to more than 1100mm. The region receives bothlong and short rains. The first rainy season (“Long Rains”) starts normally towardsthe end of March. Near the coast the rains are heavy in April and May, and decreasegradually until October in most years without a distinctive end. The second rainyseason (“Short Rains”) starts indistinctly around the middle of October, and lastsuntil December or January but with no pronounced end, and variability is high. Theunpredictability of the rainfall patterns in the coastal region of Kenya affects humanactivities and the farming calendar (Othoche 2013).
In termsof temperature conditions, the highest is 34 °C,while the lowest is 22.5 °C.The average temperature conditions are 30 °C though this varies according to seasonsand location as well as other environmental factors. The average relative humidityranges between 60–80%. Wind speed in the region in terms of km/h ranges fromminimum values of 4.8 to maximum of 10.9 (Kenya Meteorological Department(KMD) 2014).
Biodiversity in the Study Area
Kenya is rich in biodiversity (World Resources Institute 2007). Generally, the coastalforests have a rich biodiversity. The region has over 50% of Kenya’s threatenedspecies of plants, 60% of birds in Kenya and 65% of animals. Large concentrationsof terrestrial animals in the study area are mainly found in protected areas such asArabuko Sokoke and Shimba hills. However, wildlife also lives with communitiesoutside the parks. Indeed, in Kenya, about 70% of wildlife live on private lands(Othoche 2011a, b). Terrestrial animals are also spread across the landscape in privatelocal community land in both the south and north coastal regions of Kenya. This hasexposed such animals to human wildlife conflicts.
264 B. Othoche
Terrestrial Animals in North Coast
The most common terrestrial animals in the North Coast include Elephants, Buffalo,Birds, Snakes, tortoise, Crocodiles, Turtles, Fish. The area also has forest reserves,crocodiles and snake parks. Specifically, Arabuko Sokoke protects many endemicand near endemic species of animals to include the birds. The endemic birds includeClarke’sWeaver bird. The near-endemic species include Sokoke Pipit, Sokoke ScopsOwl and the Amani Sun Bird. Other endemic and near endemic animals include theGolden-Rumped Elephant Shrew, the Sokoke bushy tailed Mongoose, the Ader’sDuiker, Savannah elephants, African Civeta, Baboons, Vervet Monkey, and a diver-sity of amphibians. Arabuko Sokoke has 40 mammals, 270 birds, 49 reptiles, and 25amphibians (Kenya Forest Service (KFS) 2013a, b).
Terrestrial Animals in South Coast
The most unique ecosystem in the South Coast that harbors most terrestrial animalsis Shimba Hills. This is a protected area. Shimba Hills is the center of terrestrialanimal concentration in the region. The most common terrestrial animals in thesouth coastal region of Kenya include the Elephant, the endangered Sable Antelope,Giraffes, Leopards, Hyenas, the Gazelle, the Hippo, Buffalo, Zebra among others.The park also has a number of birds such as the Ostrich, Falcon, Hornbill, Sunbird,among others; reptiles include the Python, Cobra, Lizard, and Gecko) while insectsinclude Butterflies, Mosquitoes, and Beetle). Shimba Hills has 111 birds and 22 ofthese are coastal endemic. In general, Shimba Hills has about 700 Elephants and 100Antelopes. Other rare animals include the Hyena and Leopard (Kenya Forest Service(KFS) 2013a, b).
Changing Weather and Climatic Conditions in the Northand South Coastal Regions of Kenya
Researches have confirmed that climate andweather patterns in the study area have orare changing (Othoche 2013; Makenzi et al. 2013). A summary of long term averagerainfall figures shows variability of the climatic parameters. For the South Coast,(Kwale County) annual rainfall varies between 500 and 1700 mm with a mean of977 mm of rain. On average the region experiences 60 days of rain per year thoughthis has been fluctuating from as low as 35 to as a high as 100 rain days. Rainfallfigures at Shimba Hills shows a decline in average values. The mean annual rainfallvalue is 1380 mm. The year 2016 average value was only 739 mm. This was thesecond driest year in the region after 1974 which had 693 mm. Mean rainfall andtemperature statistics for North Coast also show fluctuating trends (Table 1).

The Impact of Climate Change and Variability on Wild Terrestrial … 265
Table 1 The mean rainfall and temperature statistics for north coast
Northcoastalregion
1960–1969 1970–1979 1980–1989 1990–1999 2000–2009 2010–2015
Meanannualtemperature
29.8 29.6 29.6 30.0 30.3 29.7
Averageannualrainfall
875.3 899.8 880.7 957.6 1108.2 910
Source KMD, Mtwapa (2016)
Table 1 shows interdecadal average values of temperature and rainfall conditionsfor North Coast. It is observed that themean annual temperatures have remained highwith an average figures of 30 °C. The mean rainfall values are also high but withgreater monthly and yearly variations. The interdecadal values hide significant vari-ations of very low and very high rainfall patterns. Weather variability is an importantindicator of climate change.
In this study, responses from FDs revealed the same trend of temperature andrainfall patterns. The following are some of the manifestations of climate change inthe coastal region of Kenya. The responses are given in percentages derived fromaverage values for the four FGDs groups. The responses from ten officials indicatethat climate change has threatened terrestrial animals as it affects water resources andpasture. This has resulted in disappearance or migration of animals to better wateredparts of the region (Table 2).
There was above average response on the various manifestations of climatechange. There was nearly 100% agreement that climate and weather variability in thestudy area are real. Local communities and officers from selected sites confirmed thesituation on the ground. These manifestations have been confirmed in various stud-ies (IPCC 2007, 2013; Othoche 2013). Data fromKenyaMeteorological Department(KMD) has revealed that rainfall totals in the study sites and in Kenya in general hasbeen fluctuating from the normal (KMD 2016). This is in line with the findings basedon FGDs. Temperatures are on the rise and showing an upward trend in maximumoccurrences. This is also in line with the IPCC (2007, 2013).
The Impact of Climate on Terrestrial Animals in the CoastalRegion of Kenya
The North and South coastal region of Kenya has a rich plant and animal life. Thecoastal forests such as Arabuko Sokoke and Shimba Hills are unique ecosystems.These unique protected areas formhabitat for terrestrial animals and plants. However,

266 B. Othoche
Table 2 Manifestations of climate change in the North and South Coast of Kenya
S/No. Climate changemanifestationsin the North andSouth Coast ofKenya
Responses (n � 40) Percentageresponses (%)
Remarks
1 Agreement thatClimate isChanging in theNorth and SouthCoast of Kenya
33 83 North and SouthCoast
2 Temperaturesincreasinglybecoming hotterand drier
34 85 North and SouthCoast—Mostly33 °C instead ofthe averagevalues of 27 °Cfor the region
3 Changes inrainfall patternshenceunpredictability
34 85 North and SouthCoast—Rainfallreliability,seasonality andfrequent delays
4 Frequentdroughts andheat waves
35 88 North and SouthCoasts
Frequent heatwaves
35 88 North and SouthCoast
5 Changes in windpatterns/speed
30 75 North Coast
Source Othoche (2013)
animals that are of less harm to the society roam about freely resulting in humanwildlife conflicts (Table 3).
Climate change has also impacted negatively on community livelihoods hencecommunities target wild terrestrial animals. This further endangers the animalsresulting in migration or disappearance. Climate change results in illegal extrac-tion/activities hence increased pressure on wildlife from surrounding communities.
Strategies Put in Place by Stakeholders to Addressthe Impact of Climate Change on Terrestrial Animals
The key informants gave detailed information on biodiversity conservation and cli-mate change. Due to the adverse impacts of climate change observed in Kenya, anumber of strategies have been put in place to address some of the problems. On

The Impact of Climate Change and Variability on Wild Terrestrial … 267
Table 3 Impact of Climate Change on Terrestrial Animals (n � 40)
S/No. Impact ofClimate changeon terrestrialanimals
Strongly agree Don’t agree Don’t know Remarks
1 Disappearanceof birds
29 08 03 Gongonyika,Kuhe
2 Drying up ofwater bodies
37 1 2 River Bogolo,in North Coast
3 Reduction involume of waterin some waterbodies
38 1 1 Rivers AthiSabaki;Chemchem inKilifi NorthRiver Kafuloni
4 Impact onTerrestrialAnimals—Dis-appearanceand/or migra-tion—(Warthog,Dikdik, wildgoat, mud fish,giant snakes)
37 2 1 KilifiNorth—dryingup of riverKafuloniIllegal loggingin ArabukoSokoke Forestdue to increasein populationand low yieldsin agricultureas climatechange isexperienced
Migration toTsavo EastNationalPark—elephant,black rhino
34 4 2 North andSouthCoast—dryingup of waterbodies
5 Increasingnumber of pestsand vectors—-Mosquitoes,tsetse fly
33 3 4 North andSouthCoast—changein temperatureconditions
Source Othoche (2013)
issues related to climate change, Kenya is adopting the United Nations resolutionon climate change as outlined in the Kyoto Protocol which was signed by worldgovernments in 1992, finalized in 1997 in Kyoto, Japan and went into force in 2005.The Protocol’s mandate is to ensure a reduction in green-house gas emissions andstabilization of the emission concentrations at a level that would prevent dangerousanthropogenic interference with the climate system (Depledge 2000). Kenya there-fore participates in the annual COPs which are the offshoot to of the Kyoto Protocol

268 B. Othoche
and of which the most current include COP21 in Paris in 2015, COP22 in Marrakechin 2016 and COP23 in Bonn in 2017.
The Kenya Meteorological Department also has encouraged the use of locallyavailable technology to monitor weather and climate variability. There is concertedeffort to ecosystem services to be monitored through Ecosystem Based Adaptation,(EBA) which involves use of biodiversity and ecosystem as part of the overall adap-tation strategy to the impact of climate change. This includes planting of trees, andcover crops. Due to the various issues observed in relation to climate change, Kenyahas put in place policy guidelines for different sectors. Various policies on ClimateChange and Biodiversity Conservation have been enacted. There is also collabora-tion with the international community to address the changing weather and climatepatterns. Some of these policy documents include: The National Environment Policy(2012/2013); Forest Policy (2014); The Kenya national Environmental Action Plan(NEAP); the National Development Plan (NDP) Alternative Livelihood Industry;Climate Change Policy (KCP); the National Food and Nutrition Security Policy,2011, among others. The national and county governments have embarked on cam-paigns to create awareness among local communities on climate change adaptationand mitigation as well as biodiversity conservation. Indigenous knowledge is beingapplied at grassroots level in climate change adaptation and mitigation and biodiver-sity conservation.
There are various strategies that have been put in place to conserve biodiversityin Kenya within the changing climatic conditions. Membership to various biodi-versity conservation bodies is a strategy aimed at enforcing the global agenda onbiodiversity conservation. The Convention on Biological Diversity (CBD) for exam-ple was adopted in the year 2010 during the 10th Conference of Parties (COP10).The objectives of this convention is to develop national strategies for conservationand sustainable utilization of biological diversity (Heinrich 2002). The CartagenaProtocol on Biosafety was adopted in the year 2000 to protect biological diversityfrom potential risks posed by living organisms resulting from biotechnology. It isa requirement that products from new technologies be based on the precautionaryprinciple. In line with biodiversity conservation bodies, Kenya has also embarkedon establishment of protected areas for biodiversity conservation; establishment ofzoological gardens which are refuge areas for rare animals that could disappear with-out captive breeding such as the zoos and aquariums. These are conservation areasfor preservation of genetic stocks for re-introduction to the wild when conditionsbecome favorable. They are also used for educational and scientific research.
Botanical gardens/Arboretums are set aside for research and exhibition of plants,documentation of local flora, preserving samples of rare and endangered species andmaintenance of specimen collections for future use. It acts as a museum for plants forexample, the East African Botanical Garden in Nairobi. Indeed, the National muse-ums of Kenya are actively involved in biodiversity conservation through establish-ment of botanical gardens. Seed banks have been established as an ex situ approachwhere storage of conservation materials in form of seeds is monitored with regardto viability through germination tests and purity analysis. National parks and gamereserves have been established on terrestrial and aquatic ecosystems with the objec-

The Impact of Climate Change and Variability on Wild Terrestrial … 269
tive to preserve wildlife that cannot co-exist with human beings and human activities.National parks are under the jurisdiction of central government while game reservesare managed by the local county council (Othoche 2011a, b). Other measures includeawareness creation and education of local communities on the importance of protect-ing the terrestrial animals; ecotourism activities on private land to generate incomehence reduce pressure on animals; and enactment of laws onwildlife and biodiversityin general.
Conclusions
Empirical data on climatic variables, from Kenya Meteorological Department andfrom the officials from Kenya Wildlife Service and Kenya Forest Services, mostlyrainfall and temperature have confirmed that there is variability of these climaticparameters. The rains are unpredictable and temperature conditions on the upwardtrend. There is both temporal and spatial variability of these climatic parameters.Temporal variability is further manifested in daily, monthly, seasonal and annualvariability.
This scenario is confirmed by qualitative data from local communities in thestudy area through FGDs and key informant interviews. Local people observed thatclimate change and variability has manifested itself in different ways. These includeprolonged drought and low and erratic rainfall totals. TheKenyaGovernment throughvarious parastatals has come up with regulatory measures and policies on climatechange and biodiversity conservation. There is indeed collaborative effort to involvelocal communities to accommodate wildlife and be involved in conservation througha shared or participatory approach.
Limitations of the Work
The paper covered selected areas in the north and south coastal region of Kenya. Thespecific areas included Kwale and Kilifi Counties in the coastal region of Kenya. Thepaper covered only the impact of climate change andweather variability on terrestrialanimals in the selected areas. Rainfall and temperature trends were covered. Primaryand secondary were used. However, there are quite a number of ecosystems that offerhabitat to terrestrial animals that could be investigate in future studies.
Constraints of the Paper
Timing was a major constraint to this work but this was addressed by use of datacollection procedures that ensured acquisition of adequate data for the paper.
270 B. Othoche
References
AdamsRM,Dannele EP (2008)Effects of climate change onwater resources. Choices: themagazineof food, farm, and resource issues. Richard M. JEL Classifications: Q25, Q54
Bates BC, Kundzewicz ZW, Wu S, Palutikof JP (eds) (2008) Climate change and water. Technicalpaper of the Intergovernmental Panel on Climate Change. IPCC Secretariat, Geneva, 210 pp
Benn J (2010)What is biodiversity.World ConservationMonitoring Center, Cambridge, UK,UNEPBlast J (2010) Seven theories of climate change. The Heartland Institute, USACardinale B et al (2012) Biodiversity loss and its impact on humanity. Nature 486(7401):59– 67.Bibcode: 2012Natur.486…59C. http://doi.org/10.1038/nature11148. PMID 22678280
Daniel TC et al (2012) Contributions of cultural services to the ecosystem services agenda. ProcNatl Acad Sci 109 (23): 8812–8819. Bibcode:2012PNAS..109.8812D. https://doi.org/10.1073/pnas.1114773109. PMC 3384142 . PMID 22615401
Depledge J (2000)UnitedNations FrameworkConvention onClimateChange (UNFCCC) technicalpaper: Tracing the origins of the Kyoto protocol: an article by Article Textual History. UNFCCC
Field R et al (2009) Spatial species richness gradients across scales: a meta-analysis. J Biogeogr36(1):132–147. https://doi.org/10.1111/j.1365-2699.2008.01963.x
Gaston KJ (2000) Global patterns in biodiversity. Nature 405(6783):220–227. https://doi.org/10.1038/35012228. PMID 10821282
GoK (2016) Kenya wildlife service, Kenya. Government Printer, NairobiHeinrich M (2002) Handbook of the convention on biological diversity. Earthscan, LondonIPCC (2007) Fourth assessment report: climate change 2007: the AR4 synthesis report. Geneva,Switzerland
IPCC (2013) Climate change 2013: the physical science basis. In: Stocker TF, Qin D, Platter G-K,Tignor M, Allen SK, Boschung J, Nauels A, Xia Y, Bex V, Midgley PM (eds) Contribution of theworking group I to the fifth assessment report of the Intergovernmental Panel on Climate Change.Cambridge University Press, United Kingdom and New York, NY, USA, 1535 pp. https://doi.org/10.1017/cbo9781107415324
Kenya Forest Service (KFS) (2013) Kenya Forest Service, Ecosystem Conservator, Kilifi CountyBriefs, Kenya
Kenya Forest Service (KFS) (2013) Kenya Forest Service, Ecosystem Conservator, Kwale CountyBriefs, Kenya
KMD (2014) Climate data. KMDKMD (2016) Mtwapa climate data. KMDMakenzi et al (2013) Trend analysis of climate change and its impacts on crop productivity in thelower Tana River Basin, Kenya, October, 2013. J Environ Resour 1(4):237–248 240
McPeek MA, Brown JM. (2007) Clade age and not diversification rate explains species richnessamong animal taxa. AmNat 169(4):E97–E106. https://doi.org/10.1086/512135. PMID17427118
Myers Norman, Mittermeier Russell A, Mittermeier Cristina G, Fonseca Da, Gustavo AB, KentJennifer (2000) Biodiversity Hotspots for Conservation Priorities. Nature 403(6772):853
Othoche B (2011) The aesthetic environment of Lake Victoria region. Western Kenya. Lap LambertAcademic Publishing. GmbH & CO. KG
Othoche B (2011) Basic useful facts and concepts in biogeography. Lap Lambert Academic Pub-lishing. GmbH & Co. KG
OthocheB (2013) Climate change adaptation in the coastal region ofKenyawith special reference toBahari Division, Kilifi District. In: Proceedings of the 4th National Museums of Kenya Biennialscientific conference. 6–8th November, 2013
ParmesanC,YoheG (2003)A globally coherent fingerprint of climate change impacts across naturalsystems. Nature 421(6918):37–42. https://doi.org/10.1038/nature01286. PMID 12511946
Partz JA, Epstein PR, Burke TA, Balbus JM (1996) Global climate change and emerging infectiousdiseases. J A Med Assoc (JAMA) 275(3):217–223. https://doi.org/10.1001/jama.1996.03530270057032
The Impact of Climate Change and Variability on Wild Terrestrial … 271
Pearson RG, Dawson TP (2005) Long-distance plant dispersal and habitat fragmentation: identi-fying conservation targets for spatial landscape planning under climate change. Biol Conserv123:389–401
Peters S (2013) Sepkoski’s Online Genus Database. University of Wisconsin-Madison. Retrieved10 Apr 2013
Pimm SL, Jenkins CN, Abell R, Brooks TM, Gittleman JL, Joppa LN, Raven PH, Roberts CM,Sexton JOet al (2014)Thebiodiversity of species and their rates of extinction, distribution andpro-tection. Science 344(6187):1246752. https://doi.org/10.1126/science.1246752. PMID 24876501
Rabosky DL (1 August 2009) Ecological limits and diversification rate: alternative paradigms toexplain the variation in species richness among clades and regions. Ecol Lett 12(8):735–743.https://doi.org/10.1111/j.1461-0248.2009.01333.x. PMID 19558515
Rustard LE (2008) The response of terrestrial ecosystems to global climate change: towards anintegrated approach. Sci Total Environ 404:222–235
Sahney S, Benton MJ, Falcon-Lang HJ (2010) Rainforest collapse triggered Pennsylvanian tetra-pod diversification in Euramerica. Geology 38(12):1079–1082. Bibcode: 2010Geo….38.1079S.https://doi.org/10.1130/g31182.1
Tittensor DP, Mora C, Jetz W, Lotze HK, Ricard D, Berghe EV, Worm B (2010) Global Pat-terns and Predictors of Marine Biodiversity Across Taxa. Nature 466(7310): 1098–1101. Bib-code:2010Natur.466.1098T. https://doi.org/10.1038/nature09329. PMID 20668450
United Nations Educational, Scientific and Cultural Organization (UNESCO) (2003) TheUNworldwater development report. Water for people,Water for life.WorldWater Assessment Programme.UNESCO, New York
World Resources Institute (2007) Natures benefits in Kenya. an atlas of ecosystems and humanwell-being. World Resources Institute, Washington DC and Nairobi
WrightRT,Bernard JN (2002) Environmental science: towards a sustainable future, 8th edn. PearsonEducation, Upper Saddle River, NJ
Young Anthony (2003) Global environmental outlook 3 (GEO-3): past, present and future perspec-tives. Geogr J 169:120
Biodiversity Risks for Belarus Connectedwith the UV Climate Change
Aliaksandr Krasouski, Siarhei Zenchanka, Elena Loginovaand Maxim Andreev
Abstract Ultraviolet radiation (UVR) has a significant impact on human health,state of aquatic and terrestrial ecosystems, biogeochemical cycles and air quality.International agreements on the protection of the ozone layer have contributed tothe development of research in this field and in the expansion of the monitoringnetwork for measurement of the ozone layer depletion and the total ozone. The studyof various factors that affect ultraviolet radiation is given great attention. A closelink and a mutual influence of climate change and changes in the ozone layer haveshown during recent studies. Moreover, changes in the ozone layer lead to changesin UVR and influence on biodiversity. The identification of these relationships, thestudy of the state of the ozone layer and the intensity of UV radiation has becomeone of the aims of this article. Another aim of the article is to assess the impact ofchanging UVR levels over the territory of Belarus on the development of elementsof wildlife and agricultural productivity. The analysis showed that the main objectof exposure for large animals is the organs of vision, whereas for small animals thedegree of their coloring is essential. The basic composition of wild vegetation inall landscapes has changed. Typical crops for Belarus were replaced, which led toa change in agricultural technology. This is due to changes in the distribution ofclimatic zones on the territory of Belarus. Studies have also shown that over theterritory of Belarus, unlike the Western Europe, there is still no restoration of theozone layer, which increases the risks of exposure of the UVR to biodiversity.
A. KrasouskiNational Ozone Monitoring Research and Education Center,Belarusian State University, 4, Nezavisimosti Avenue, 220030 Minsk, Belaruse-mail: [email protected]
S. Zenchanka (B)Minsk Branch of Plekhanov Russian University of Economics,127 build. 2 Mayakovskogo Str., Minsk 220028, Belaruse-mail: [email protected]
E. Loginova · M. AndreevBelarusian State University, 4, Nezavisimosti Avenue, 220030 Minsk, Belaruse-mail: [email protected]
© Springer Nature Switzerland AG 2019W. Leal Filho et al. (eds.), Handbook of Climate Change and Biodiversity,Climate Change Management, https://doi.org/10.1007/978-3-319-98681-4_17
273

274 A. Krasouski et al.
Introduction
Convention on biological diversity (Convention 1992) defines biological diversityas “the variability among living organisms from all sources including, inter alia,terrestrial, marine and other aquatic ecosystems and the ecological complexes ofwhich they are part: this includes diversity within species, between species and ofecosystems”.
On 25th September 2015 countries adopted new sustainable development goalsdirected at the transforming our world during the next 15 years (Resolution 2015).
Goal 15 “Protect, restore and promote sustainable use of terrestrial ecosystems,sustainably manage forests, combat desertification, and halt and reverse land degra-dation and halt biodiversity loss” refers to the biodiversity conservation. Some targetsand corresponding indicators for this goal are presented in Table 1.
These targets and indicators are in close correspondencewith the Strategic Plan forBiodiversity 2011–2020 and theAichi Targets (Strategic Plan 2011)which consider 5strategic goals and 20 targets. The Strategic Plan provides that “by 2050, biodiversityis valued, conserved, restored and wisely used, maintaining ecosystem services,sustaining a healthy planet and delivering benefits essential for all people”.
Table 1 Biodiversity conservation targets and indicators (Report 2017)
Target Indicator
15.1 By 2020, ensure the conservation,restoration and sustainable use of terrestrialand inland freshwater ecosystems and theirservices, in particular forests, wetlands,mountains and drylands, in line withobligations under international agreements
15.1.1 Forest area as a proportion of total landarea15.1.2 Proportion of important sites forterrestrial and freshwater biodiversity that arecovered by protecting areas, by ecosystem type
15.2 By 2020, promote the implementation ofsustainable management of all types of forests,halt deforestation, restore degraded forests andsubstantially increase afforestation andreforestation globally
15.2.1 Progress towards sustainable forestmanagement
15.3 By 2030, combat desertification, restoredegraded land and soil, including land affectedby desertification, drought and floods, andstrive to achieve a land degradation-neutralworld
15.3.1 Proportion of land that is degraded overtotal land area
15.5 Take urgent and significant action toreduce the degradation of natural habitats, haltthe loss of biodiversity and, by 2020, protectand prevent the extinction of threatened species
15.5.1 Red list index
15.9 By 2020, integrate ecosystem andbiodiversity values into national and localplanning, development processes, povertyreduction strategies and accounts
15.9.1 Progress towards national targetsestablished in accordance with AichiBiodiversity Target 2 of the Strategic Plan forBiodiversity 2011–2020

Biodiversity Risks for Belarus Connected with the UV … 275
Human activities have led to fundamental changes in our ecosystems and, indeed,they destabilize our ecosystems. The latest assessment on the state of the biosphere(Rockström 2015; Steffen et al. 2015) shows that as a result of human activities,mankind have already crossed four planetary boundaries (climate change, biodiver-sity loss, deforestation and fertilizer use). It is seen that biodiversity strongly dependson climate change and in its turn the ozone layer depletion contributes to climatechange (UNEP 2010, 2014) especially in its regional component (Krasouski andZenchanka 2018).
In their review Cardinale et al. (2012) presented six consensus statements:
1. There is nowunequivocal evidence that biodiversity loss reduces the efficiency bywhich ecological communities capture biologically essential resources, producebiomass, decompose and recycle biologically essential nutrients.
2. There is mounting evidence that biodiversity increases the stability of ecosystemfunctions through time.
3. The impact of biodiversity on any single ecosystem process is nonlinear andsaturating, such that change accelerates as biodiversity loss increases.
4. Diverse communities are more productive because they contain key species thathave a large influence on productivity, and differences in functional traits amongorganisms increase total resource capture.
5. Loss of diversity across trophic levels has the potential to influence ecosystemfunctions even more strongly than diversity loss within trophic levels.
6. Functional traits of organisms have large impacts on the magnitude of ecosystemfunctions, which give rise to a wide range of plausible impacts of extinction onecosystem function.
There are two aims of the article:
1. The study of the link and a mutual influence of climate change and changes inthe ozone layer, which lead to changes in UVR and influence on biodiversity.
2. Assessment of the impact of changing UVR levels on the territory of Belarus onthe development of wildlife species and agricultural productivity.
The article consists of the next section:
• Methods:
– Theoretical approach– Instrumental methods.
• Cause-effect relationships: climate change, ozone layer depletion, ultraviolet radi-ation and biodiversity changes:
– Ultraviolet radiation and ozone layer.– Ozone layer depletion and Climate Change.– Impact of UV radiation on biodiversity.

276 A. Krasouski et al.
• Results. UV radiation over the territory of Belarus.
– Investigated areas.– Measurement.
• Discussion and Conclusion.
Methods
Two approaches to the investigation were used: theoretical and instrumental.Limitations of investigation are defined by its aims—the study of the state of
the ozone layer and the intensity of UV radiation and the assessment of the impactof changing UVR levels over the territory of Belarus on biodiversity. One morerestriction is connected with the limited places of research.
Theoretical approach includes the analysis of scientific reports, programs and arti-cles.
Three sections—Ultraviolet radiation and ozone layer; Ozone layer depletion andClimate Change; Impact of UV radiation on biodiversity—describe different aspectsof interaction between climate change, ozone layer depletion and incidence ultravi-olet radiation and their influence on biodiversity.
Values of UV power and daily doses of UV for various biological effects (ery-thema, DNA damage, etc.), as well as the values of the UV Index, were calculatedfrom measured UV spectra in accordance with WMO requirements.
Instrumental methods. The measurements of energy density spectra (EDS) of solarradiation in the spectral range of 285–450 nm on the earth’s surface were carried outwith the help of ultraviolet spectroradiometer PION-UV and its polar modificationPION-F, developed at theNationalOzoneMonitoringResearch andEducationCenter(http://ozone.bsu.by/).
PION-UV (Fig. 1) is an automatic ultraviolet spectroradiometer.PION-UV is a compact instrument for measuring absolute intensities and spectral
distribution of direct and scattered ultraviolet solar radiation in the spectral range of280–450 nm intending for use in the monitoring network of solar UV-B radiation,as well as in studies on the effect of UV radiation on natural and anthropogenicecological systems. The optic of the device is optimized for any measurements ofUV radiation; tightness and thermal stability ensure operation in any weather.
Its advantages over analogues are:
• Portability;• Mobility;• Low cost;• Import substitution.

Biodiversity Risks for Belarus Connected with the UV … 277
Fig. 1 PION-UVspectroradiometer
Fig. 2 PION-F photometer
Unlike PION-UV, PION-F (Fig. 2) is an autonomous remote system for monitor-ing the state of the ozone layer andmeasuring the dose of active biological ultravioletradiation (UV Index). It consists of two-channel photometer and a solar panel.
PION-F is completely autonomous and does not require external power sourcesand communication with a computer for data storage and processing. The resultsof measurements are transmitted via the GSM network to the remote server, whichallows continuous monitoring the ozonosphere online. The autonomy of the systemand the use of theGSMnetwork for data transfer allows the photometer to be installed
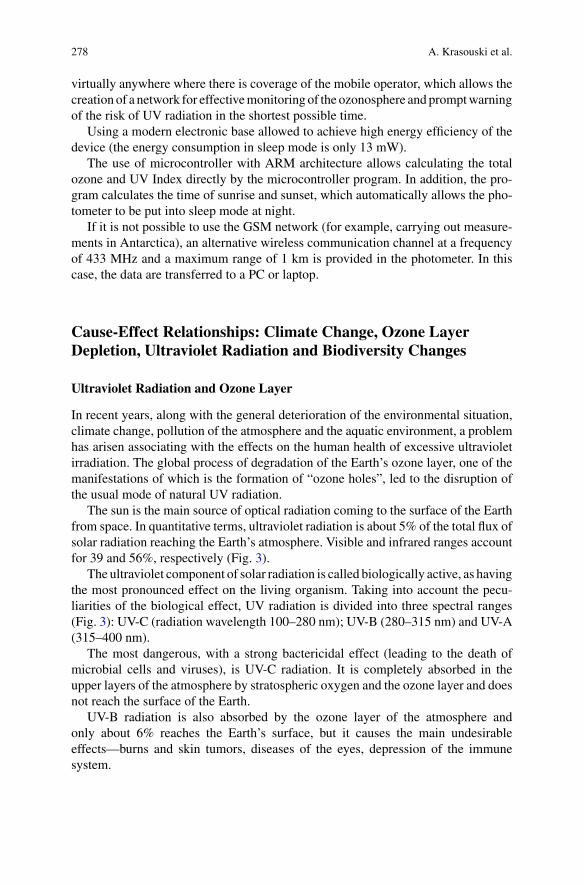
278 A. Krasouski et al.
virtually anywhere where there is coverage of the mobile operator, which allows thecreation of a network for effectivemonitoring of the ozonosphere andpromptwarningof the risk of UV radiation in the shortest possible time.
Using a modern electronic base allowed to achieve high energy efficiency of thedevice (the energy consumption in sleep mode is only 13 mW).
The use of microcontroller with ARM architecture allows calculating the totalozone and UV Index directly by the microcontroller program. In addition, the pro-gram calculates the time of sunrise and sunset, which automatically allows the pho-tometer to be put into sleep mode at night.
If it is not possible to use the GSM network (for example, carrying out measure-ments in Antarctica), an alternative wireless communication channel at a frequencyof 433 MHz and a maximum range of 1 km is provided in the photometer. In thiscase, the data are transferred to a PC or laptop.
Cause-Effect Relationships: Climate Change, Ozone LayerDepletion, Ultraviolet Radiation and Biodiversity Changes
Ultraviolet Radiation and Ozone Layer
In recent years, along with the general deterioration of the environmental situation,climate change, pollution of the atmosphere and the aquatic environment, a problemhas arisen associating with the effects on the human health of excessive ultravioletirradiation. The global process of degradation of the Earth’s ozone layer, one of themanifestations of which is the formation of “ozone holes”, led to the disruption ofthe usual mode of natural UV radiation.
The sun is the main source of optical radiation coming to the surface of the Earthfrom space. In quantitative terms, ultraviolet radiation is about 5% of the total flux ofsolar radiation reaching the Earth’s atmosphere. Visible and infrared ranges accountfor 39 and 56%, respectively (Fig. 3).
The ultraviolet component of solar radiation is called biologically active, as havingthe most pronounced effect on the living organism. Taking into account the pecu-liarities of the biological effect, UV radiation is divided into three spectral ranges(Fig. 3): UV-C (radiation wavelength 100–280 nm); UV-B (280–315 nm) and UV-A(315–400 nm).
The most dangerous, with a strong bactericidal effect (leading to the death ofmicrobial cells and viruses), is UV-C radiation. It is completely absorbed in theupper layers of the atmosphere by stratospheric oxygen and the ozone layer and doesnot reach the surface of the Earth.
UV-B radiation is also absorbed by the ozone layer of the atmosphere andonly about 6% reaches the Earth’s surface, but it causes the main undesirableeffects—burns and skin tumors, diseases of the eyes, depression of the immunesystem.

Biodiversity Risks for Belarus Connected with the UV … 279
Sunlight
UV radia on(100 – 400) nm
5 %
Visible radia on(400 - 760) nm
39 %
Infrared radia on(760 - 5000) nm
56 %
UV-C(100 – 280) nm
UV-B(280 – 315) nm
UV-A(315 – 400) nm
Fig. 3 Solar radiation spectrum
Finally, UV-A radiation is slightly attenuated by the atmosphere, but the biologicaleffect produced by it is approximately 1000 timesweaker than that ofUV-B radiation.
Given the significant impact of UV radiation on the biosphere and human health,it is extremely important to carry out its constant monitoring, as well as to study thefactors which determine the arrival of UV radiation to the Earth’s surface.
Ozone Layer Depletion and Climate Change
The strong ozone depletion in the springmonths inAntarctica in the early 1980s led tothe adoption in 1985 of the Vienna Convention for the Protection of the Ozone Layer(Convention 1985) and the signing in 1987 of theMontreal Protocol on the reductionof the production and consumption of ozone-depleting substances (Protocol 1987).The main goal of the measures taken is to protect the biosphere (primarily to preventthe harmful effects of UV radiation on human health) from the increased doses ofUV-C that are possible with the depletion of the stratospheric ozone layer. Given thesignificant impact of UV radiation on human health and the biosphere as a whole,it is extremely important to conduct its constant monitoring, as well as to study thefactors determining the arrival of UV radiation to the Earth’s surface
In addition to influencing the intensity and spectral composition of UV radiation,changes in the ozone layer lead to climate change (Hegglin et al 2015; UNEP 2010,2014).
Krasouski and Zenchanka (2017) consider two mechanisms of interaction “ozonelayer depletion—climate change”: “the “radiation” mechanism which is responsiblefor the formation of ozone in the upper stratosphere and lowers the height of thetropopause, the other operates in the troposphere and called “thermodynamic”. Itcreates conditions for the dry andmoist instability and thereby raises the height of thetropopause and decreases the total ozone content. Mutual influence and the relativerole of tropospheric (“thermodynamic”) and stratospheric (“radiation”) mechanisms

280 A. Krasouski et al.
vary according to region and season. Thermodynamic processes (convection) prevailin the tropical region. “Radiation” mechanism prevails in the unstable troposphereand in the polar latitudes”.
Changing of regional climate distributes biodiversity at local sites.
Impact of UV Radiation on Biodiversity
The Sun UV radiation always plays important roles in our environment, andaffects nearly all flora and fauna. The changing of UV irradiance can affect pri-mary production in all ecosystems, terrestrial and aquatic, natural, managed, orexploitedwith a potential cascade of effects.Current understandingof these processesdoes not enable confident prediction of the impacts. Chapin, Sala and Huber-Sannwald (Scenario 2013) pointed that “little is known about the effects of increasingUV-B on either biodiversity or ecosystem function”. It is necessary to consider aspositive as negative impact of UV radiation on living organisms and plants.
There are serious impacts of ozone depletion on biodiversity. For example,increased UV radiation reduces the levels of plankton in the oceans and subsequentlydiminishes fish stocks. It can also have adverse effects on plant growth, thus reducingagricultural productivity. A direct negative economic impact is the reduced lifespanof certain materials.
In forests and grasslands increased UV-B radiation is likely to result in changesin species composition (mutation) thus altering the bio-diversity in different ecosys-tems. Physiological and developmental processes of plants are affected by UV-Bradiation, even by the amount of UV-B in present-day sunlight. Despite mechanismsto reduce or repair these effects and a limited ability to adapt to increased levels ofUV-B, plant growth can be directly affected by UV-B radiation (Secretariat of theConvention on Biological Diversity 2014).
The negative impact on living organism is connected with eye diseases, the defeatof the skin, malfunctions in the immune system, On the other hand, the positive effectof UV radiation on living organisms is connected with synthesizes the vitamins ofgroup D necessary for health, which prevent the development of such diseases asrickets, osteoporosis and some types of cancer.
Plants, as primary producers, are fully dependent on solar radiation. Light isthe source of energy for them, driving photosynthesis and directing developmentfrom germination to flowering. UV radiation might increase the amount of activesubstances in medicinal plant. However, sunlight, especially its UV component, cancause negative effects on plants: decreasing the plant growth, changing plant color,plant productivity, etc.
These three sections—Ultraviolet radiation and ozone layer; Ozone layer deple-tion and Climate Change; and Impact of UV radiation on biodiversity—showmutualinteraction of climate change and ozone layer depletion, and their influence on theintensity of the UV radiation which impact on elements of biodiversity.

Biodiversity Risks for Belarus Connected with the UV … 281
The Results. UV Radiation over the Territory of Belarus
Investigated Areas
Monitoring of power, doses of biologically active solar radiation and UV Indexesare carried out at the Minsk Ozonometric Station of the NOMREC, bio-station ofthe Belarusian State University on Lake Naroch, as well as at the meteorological siteof the Gomel University (http://ozone.bsu.by/instruments.htm). These three placesare disposed at different parts of the Belarus belonging to different climatic zones(Loginov 2017). Besides that Lake Naroch is a recreation area and measurement ofUV Indexes is very important for peoples’ health.
Measurement
Monitoring UV radiation is becoming more and more important, especially in viewof the continuing changes of the processes in the ozone layers of the atmosphereand the consequent effects on the environment and physical health. As mentioned byChubarova et al. (2016) the pattern of temporal and spatial variability of the UVR israther complicated due to the impact on it of variations not only of ozone, but alsoof other geophysical factors—cloudiness, aerosol, and surface albedo. It should benoted that in many regions in recent years a noticeable increase in UV radiation.
At Figs. 4 and 5 the results of UV Index measurement are shown.In accordancewith the recommendation of theWHOandWMOtheUV Index uses
to assess the degree of risk of UV radiation exposure for human (WHO 2002). The
Fig. 4 The UV Index in Minsk

282 A. Krasouski et al.
Fig. 5 The UV index near Lake Naroch
UV Index (UVI) is calculated frommeasurements of total ozone (TO) and maximumlevels of UV radiation (UV maximum) making in an astronomical afternoon. UVImaximum defines risk of maximum irradiation of human, ecosystems, etc. in theabsence of clouds. The real UV Index was measured and then it was re-calculatedusing the average value of UVR level in the period from one hour to and one hourafter astronomical afternoon. This level is always less than the maximum. The dailybehavior of UV Index can be modeled by changing the zenith angle. Informationon the UV Index is used to determine the potential danger of excessive exposure ofsunlight on human health. As can be seen, the maximum of the UV Index (maxUVI)is observed in the spring-summer and summer-autumn periods.
Data on the spectral composition and intensity of UV radiation are used to cal-culate the doses of biological effects of erythema, DNA damage, cataracts and skincancer.
“Erythema dose” is an amount of radiation that, when applied to the skin, causeserythema (temporary reddening).
Figure 6 presents the results of retroanalysis of the total annual “erythema dose”for the Lake Naroch area.
This curve was obtained by re-analysis using data on the recovery of ozone, meancloudiness and aerosol content. Maximum “erythema dose” in 1995 coincides withthe existence of an ozone hole over the territory of Belarus.
The average annual dose of biological effects of erythema, skin cancer andcataracts in theMinsk region is 400, 800 and 1500 kJ/m2, respectively. Themain con-
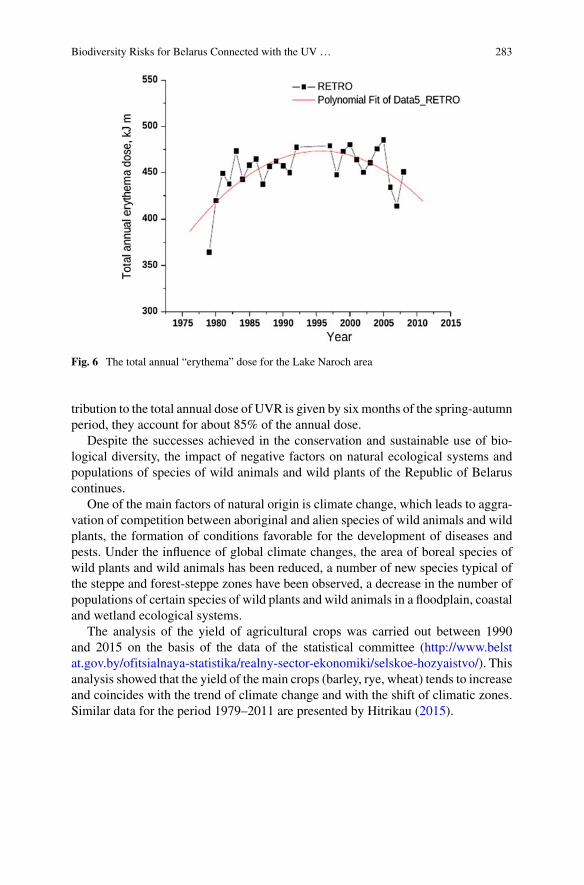
Biodiversity Risks for Belarus Connected with the UV … 283
Fig. 6 The total annual “erythema” dose for the Lake Naroch area
tribution to the total annual dose of UVR is given by six months of the spring-autumnperiod, they account for about 85% of the annual dose.
Despite the successes achieved in the conservation and sustainable use of bio-logical diversity, the impact of negative factors on natural ecological systems andpopulations of species of wild animals and wild plants of the Republic of Belaruscontinues.
One of the main factors of natural origin is climate change, which leads to aggra-vation of competition between aboriginal and alien species of wild animals and wildplants, the formation of conditions favorable for the development of diseases andpests. Under the influence of global climate changes, the area of boreal species ofwild plants and wild animals has been reduced, a number of new species typical ofthe steppe and forest-steppe zones have been observed, a decrease in the number ofpopulations of certain species of wild plants and wild animals in a floodplain, coastaland wetland ecological systems.
The analysis of the yield of agricultural crops was carried out between 1990and 2015 on the basis of the data of the statistical committee (http://www.belstat.gov.by/ofitsialnaya-statistika/realny-sector-ekonomiki/selskoe-hozyaistvo/). Thisanalysis showed that the yield of the main crops (barley, rye, wheat) tends to increaseand coincides with the trend of climate change and with the shift of climatic zones.Similar data for the period 1979–2011 are presented by Hitrikau (2015).
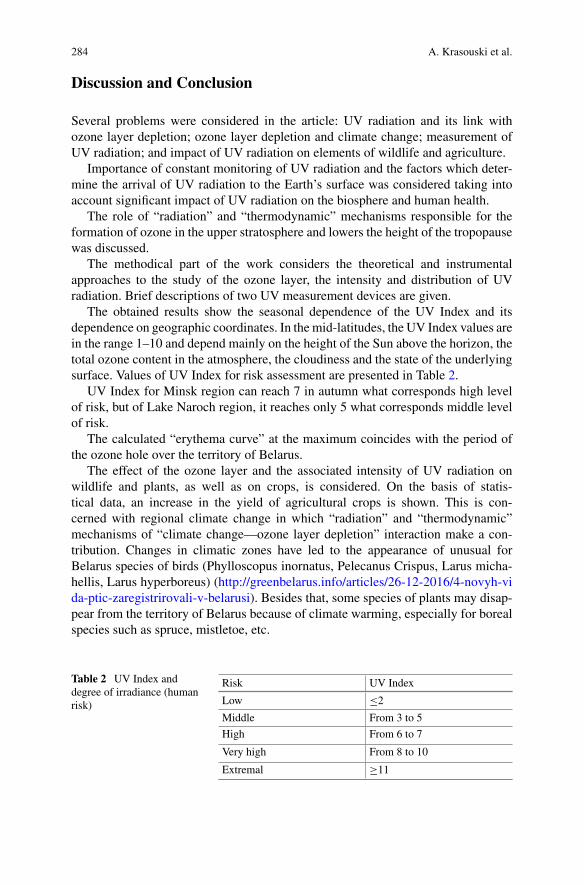
284 A. Krasouski et al.
Discussion and Conclusion
Several problems were considered in the article: UV radiation and its link withozone layer depletion; ozone layer depletion and climate change; measurement ofUV radiation; and impact of UV radiation on elements of wildlife and agriculture.
Importance of constant monitoring of UV radiation and the factors which deter-mine the arrival of UV radiation to the Earth’s surface was considered taking intoaccount significant impact of UV radiation on the biosphere and human health.
The role of “radiation” and “thermodynamic” mechanisms responsible for theformation of ozone in the upper stratosphere and lowers the height of the tropopausewas discussed.
The methodical part of the work considers the theoretical and instrumentalapproaches to the study of the ozone layer, the intensity and distribution of UVradiation. Brief descriptions of two UV measurement devices are given.
The obtained results show the seasonal dependence of the UV Index and itsdependence on geographic coordinates. In the mid-latitudes, the UV Index values arein the range 1–10 and depend mainly on the height of the Sun above the horizon, thetotal ozone content in the atmosphere, the cloudiness and the state of the underlyingsurface. Values of UV Index for risk assessment are presented in Table 2.
UV Index for Minsk region can reach 7 in autumn what corresponds high levelof risk, but of Lake Naroch region, it reaches only 5 what corresponds middle levelof risk.
The calculated “erythema curve” at the maximum coincides with the period ofthe ozone hole over the territory of Belarus.
The effect of the ozone layer and the associated intensity of UV radiation onwildlife and plants, as well as on crops, is considered. On the basis of statis-tical data, an increase in the yield of agricultural crops is shown. This is con-cerned with regional climate change in which “radiation” and “thermodynamic”mechanisms of “climate change—ozone layer depletion” interaction make a con-tribution. Changes in climatic zones have led to the appearance of unusual forBelarus species of birds (Phylloscopus inornatus, Pelecanus Crispus, Larus micha-hellis, Larus hyperboreus) (http://greenbelarus.info/articles/26-12-2016/4-novyh-vida-ptic-zaregistrirovali-v-belarusi). Besides that, some species of plants may disap-pear from the territory of Belarus because of climate warming, especially for borealspecies such as spruce, mistletoe, etc.
Table 2 UV Index anddegree of irradiance (humanrisk)
Risk UV Index
Low ≤2
Middle From 3 to 5
High From 6 to 7
Very high From 8 to 10
Extremal ≥11

Biodiversity Risks for Belarus Connected with the UV … 285
National Ozone Monitoring Research and Education Center plans to increaseozone and UV monitoring network in Belarus by placing measuring devices in allregional centers. In addition, during the past few years, NOMREK has been involvedin ozone layer research in Antarctica as part of the Belarusian Antarctic Expeditionand will continue these studies in the future.
References
Cardinale BJ, Duffy JE, Gonzalez A, Hooper DU, Perrings C, Venail P, Narwani A, Mace GM,Tilman D, Wardle DA, Kinzig AP, Daily GC, Loreau M, Grace JB, Larigauderie A, SrivastavaDS, Naeem S (2012) Biodiversity loss and its impact on humanity. Nature 486(7401), 59–67.https://doi.org/10.1038/nature11148
Chubarova N, Zhdanova E, Hattatov V, Bargin P (2016) Actual problems of ultraviolet radiationand ozone layer studying. Vestnic Russ Acad Sci 86(9):839–846 (in Russian)
Convention (1985) The Vienna convention for the protection of the ozone layer. Avail-able at: http://ozone.unep.org/en/treaties-and-decisions/vienna-convention-protection-ozone-layer. Accessed 25 Sept 2017
Convention (1992) Convention on biological diversity. United Nation. Available at: https://www.cbd.int/convention/. Accessed 15 Dec 2017
Hegglin MI, Fahey DW, McFarland M, Montzka SA, and Nash ER (2015) Twenty questions andanswers about the ozone layer: 2014 update, scientific assessment of ozone depletion: 2014,84 pp., World Meteorological Organization, Geneva, Switzerland
HitrikauM (2015)Agrometeorological assessment of productivity cereal and technical crops.M.Sc.thesis. Available at: http://elib.bsu.by/bitstream/123456789/118397/…/Hitrikau.pdf. Accessed 6May 2018. (in Russian)
KrasouskiA, Zenchanka S (2017)Montreal andKyoto: needs in inter-prototcol communications. In:Leal FilhoW,Manolas E,AzulAM,AzeiteiroUM,McGhieH (eds)Handbook ofClimateChangeCommunication, vol 1: Theory of climate change communication. Climate change management,Springer International Publishing, Switzerland, pp 95–106
Krasouski A, Zenchanka S (2018) Ozone layer depletion, climate change, risks and adaptation.In: Alves F, Leal Filho W, Azeiteiro U (eds) Theory and practice of climate adaptation. Climatechange management, pp 137–150. Springer International Publishing, Swizerland
Loginov VF (2017) Climate change: trends, circles and pauses. In: Loginov VF, Mikutsky VS.Minsk: Belarusian science, 179 p. (in Russian)
Protocol (1987) The Montreal protocol on substances that deplete the ozone layer. Avail-able at: http://ozone.unep.org/en/treaties-and-decisions/montreal-protocol-substances-deplete-ozone-layer. Accessed 25 Sept 2017
Report (2017) Report of the inter-agency and expert group on sustainable development goal indi-cators. United Nations E/CN.3/2016/2. Statistical commission. Available at: https://unstats.un.org/unsd/statcom/48th-session/documents/2017-2-IAEG-SDGs-E.pdf. Accessed 12 Jan 2018
Resolution (2015) Transforming our world: the 2030 agenda for sustainable development. UnitedNations A/RES/70/1. Available from https://sustainabledevelopment.un.org/post2015/transformingourworld. Accessed 15th Dec 2017
Rockström J (2015) The planet’s future is in the balance. But a transformation is already underway,The Guardian, 14 Nov, p. 35. (Google Scholar)
Scenario (2013) Global biodiversity in a changing environment: scenarios for the 21st century. In:Chapin FS, Sala OE, Huber-Sannwald E (eds) Springer Science & Business Media. Availableat: https://books.google.by/books?id=h2bdBwAAQBAJ&pg=PA186&lpg=PA186&dq=UV+and+biodiversity&source=bl&ots=SUW7OiSF5H&sig=MUlG_Eb5tsbxl7-w_CZq3gJbj3c&hl=ru&sa=X&ved=0ahUKEwjiq7HYk4XYAhUlYJoKHXm-BWsQ6AEIXjAH#v=onepage&q=UV%20and%20biodiversity&f=false. Accessed 15 Dec 2017
286 A. Krasouski et al.
Secretariat of the Convention on Biological Diversity (2014) Global biodiversity outlook 4. Mon-tréal, 155 pages
Steffen W, Richardson K, Rockström J, Cornell SE, Fetzer I, Bennett EM, Biggs R, Carpenter SR,de Vries W, de Wit CA, Folke C, Gerten D, Heinke J, Mace GM, Persson LM, RamanathanV, ReyersB Sorlin S (2015) Planetary boundaries: guiding human development on a changingplanet. Science 347(6223):1259855. https://doi.org/10.1126/science.1259855
Strategic Plan (2011) Strategic plan for biodiversity 2011–2020 and the Aichi targets. Living inharmony with nature. UNEP. Secretariat of the convention on biological diversity. Available at:https://www.cbd.int/sp/. Accessed 15 Dec 2017
UNEP (2010) Environmental effects of ozone depletion and its interactions with climate change:2010 assessment. J Photochem Photobiol Sci 2011(10):165–320
UNEP (2014) Environmental effects of ozone depletion and its interactions with climate change:2014 assessment. J Photochem Photobiol Sci 2015(14):7–184
WHO (2002) Global solar UV index: a practical guide. A joint recommendation of theWorld HealthOrganization, World Meteorological Organization, United Nations Environment Programme,and the International Commission on Non-Ionizing Radiation Protection. WHO/SDE/OEH/02.2.Available at: http://www.who.int/uv/publications/en/GlobalUVI.pdf. Accessed 12 Jan 2018
Aliaksandr Krasouski is Associate Professor of Geography Departament of Belarusian StateUniversity, and has a Ph.D. in Physics. He is a founder of National Ozone Monitoring Researchand Education Center of the Belarusian State University. His research focus is in the area of ozonemonitoring, meteorology and “ozone depletion-climate change” interaction.
Zenchanka Siarhei is a professor of the chair of Management, Accounting and Finance of theMinsk Branch of the Plekhanov Russian University of Economics. He has a Ph.D. in Applied Sci-ence. His research focus is in the areas of the sustainable development and education for sustain-able development.
Elena Loginova is Associate Professor of the Geography Departament of Belarusian State Uni-versity, and has a Ph.D. in geography. His research focus is in the areas of the climate change andbiodiversity.
Maxim Andreev is a 5-years student of the Geography Departament of Belarusian State Univer-sity. The results, presented in article, will be included in his graduate work.

The Impact of Forest Fireon the Biodiversity and the SoilCharacteristics of Tropical Peatland
Cahyono Agus, Fatikhul F. Azmi, Widiyatno, Zinda R. Ilfana,Dewi Wulandari, Dony Rachmanadi, Marinus K. Harun and Tri W. Yuwati
Abstract Land use change and forest fire covering millions ha of peat-land in Cen-tral Kalimantan are the main factor contribute on forest peatland degradation. Thisstudy aimed to determine the impact of forest peatland fire severity level on theplant diversity and soil chemical properties of wet tropical peatland in Central Kali-mantan, Indonesia. The severe peat fire extremely decreased diversity, number ofindividuals as well as number of plant species. The accumulation of ashes in forestpeat fires impacted area instantly increased pH, organic matter, humic acid content,hydrophobicity, available-N and available-K. However, their availabilities had onlybeen temporary as they were easily diminished and washed way which result inlong-term land degradation. An opened and dried peatland had low water holdingcapability and, hence, it was relatively easy to burn during the dry season but floodedduring the rainy season. Tropical forest peats fires significantly reduced plant diver-sity and changed soil chemical properties. This forest peat fire potentially loss itsfunction, particularly moisture storage, carbon, nutrients and biodiversity.
C. Agus (B) · F. F. Azmi · Widiyatno · Z. R. IlfanaFaculty of Forestry UGM Bulaksumur, Yogyakarta 55281, Indonesiae-mail: [email protected]
D. WulandariSEAMEO BIOTROP, Bogor, Indonesia
D. WulandariUniversitas Islam Indonesia, Yogyakarta, Indonesia
D. Rachmanadi · M. K. Harun · T. W. YuwatiBanjarbaru Forestry & Environment Research & Development Institute, Banjarbaru, Indonesia
© Springer Nature Switzerland AG 2019W. Leal Filho et al. (eds.), Handbook of Climate Change and Biodiversity,Climate Change Management, https://doi.org/10.1007/978-3-319-98681-4_18
287

288 C. Agus et al.
Introduction
Indonesia is the country with the widest tropical peatland area in Southeast Asia,which covers 20,695,000 ha or 81.7% of the total tropical peatland in Southeast Asia(Rieley et al. 1996b). Peat swamp forest is one of thewet land typewhich its existencehas beenmost threatenedbyhumanactivities. Landuse changeof forest’ function intoagriculture or plantation may threaten the existence of the natural peat swamp forest.It is reported that the carbon content of peatland in Sumatera was 22,293 milliontons in 1990 and it was decreased into 18,813 million tons in 2002 (Wahyunto et al.2004). It means that in 12 years periods (1990–2002) the carbon reserve decreasedapproximately 3470 million tons or 289.16 million tons per year of the total carbonreserve in peatland in Sumatera. Land use change and over exploitation of tropicalforest ecosystem lead to the land degradation and damages (Agus et al. 2004, 2011,2016, 2017; Agus 2013, 2018; Kita et al. 2008; Cahyanti and Agus 2017; Asdak2002).
Degradation of peat swamp forest ecosystem may result on the loss function ofhydrology, biogeochemical, biodiversity and ecology. This is because peat swampforest represents flood buffering space, water reservoir during dry season, filteringsystem of water quality, and habitat of various germplasm. The peat swamp areaplays an important role as producer of woods, food stuffs, and living and breedingenvironment ofwater biota, soilmicrobiota aswell as various life supporting systems.Furthermore, swamp area also supports the historical role, cultural values, science,and other social systems (Barchia 2006).
Forest fire presents significant impact on the condition of peatland, particularlyon its function as carbon reserve. Forest fire will likely emit a huge quantity ofcarbon dioxide. According toKrisnawati et al. (2015), the carbon dioxide emission inCentral Kalimantan resulted from the forest fire was 24,305,601 tons, 348,780 tons,and 10,565,491 tons in 2009, 2010, and 2011 respectively. As one of greenhousegases, the carbon dioxide triggers global warming. Forest fire affects peatland byproducing CO2, CO and hydrocarbon. The CO resulted from incomplete burningof forest fire may emit greenhouse gases as one of global warming contributor. Inaddition to the CO, forest fire may also result on high particle emission that posesdanger for human’s health. The quantity of the particle resulting from the forest firewill accumulate in atmospheric moisture which then form thick fog (Adinugrohoet al. 2005). Indonesia has committed to reduce the emission of the greenhousegases up to 26% under business as usual (BAU) level in 2020 and to up to 41% ifthere was an international support (Krisnawati et al. 2015).
Indonesia’s wet tropical forest provides rich biodiversity. However, forest fire,illegal logging, and irresponsible human activities greatly contribute in the reductionof thewidth of the forest area over the years. Forest fire causes degradation and inflictson economical, ecological, social and cultural losses. Moreover, it has caused thefailure in the implementation of sustainable forest management. In another word, ithas been unable to fulfill the existing ecolabel requirements. Economically, it causesloss of forest resources, decrease the potential result of lumbers representing one of

The Impact of Forest Fire on the Biodiversity and the Soil … 289
the basic capitals in national development. Furthermore, it may also decrease both thequantity and quality of biological natural resources along with the ecosystem whichserves the function of supporting life. This, in effect, would decrease t diversityof flora and fauna as the sources of germplasm, quality of soil, change in foresthydrological function as well as global warming. The forest fire that had affectedpeatland has significant impact on the global warming as the peatland played animportant role in carbon, water and geothermal cycles. It was therefore necessary toconduct a study of the soil characteristics and the vegetation composition of the areaaffected by the forest fire.
The Distribution of Peat Swamp Forest
There is 37,734,300 ha tropical peatland in the world (about 10–12% of global peat-land), distributed in South America, Central Asia, Southeast Asia, Africa and pacificcountries. About 67.1% of the tropical peatland worldwide can be found in SoutheastAsia, which is 25,329,400 ha (Rieley et al. 1996b). Indonesia has the widest tropicalpeatland in Southeast Asia, which covers 20,695,000 ha or about 81.7% of the totaltropical peatland in Southeast Asia (Rieley et al. 1996b), distributed in Kalimantan(6.79 millions ha), Sumatra (8.25 millions ha), Irian Jaya (4.62 millions ha) and theremaining peatlands distributed in Sulawesi, Halmahera and Seram (Radjagukguk1997).
According to Wahyunto et al. (2004), peatland in Kalimantan has the maturationlevels of ‘Fibric’ (i.e., in raw condition and has not undergone weathering process),‘Hemic’ (i.e., half-weathered), ‘Sapric’ (i.e., completelyweathered/dissolved) and/orthe combination of one of the three or the entire three levels. The thickness of thepeatland in Kalimantan varies from very thin (<50 cm) to very thick (>8 m). It hasbeen estimated that the carbon content of the peatland in Kalimantan was 11.3 gigatons (GT).
The Diversity of Plant Species in Peat Swamp Forest
Peatland represents an important land resource for people as it produced lumbers(including ramin, meranti, belangiran, bamboo, nyatoh, kempas, pulai, terantang,geronggang, mahang, punak, betanggur and balam), clothing materials (includingleaves and barks), food stuffs (including paddy, corn, sago, tubers and vegetables),and even herbalmedicines (including kepayang, krinyu, katalayu, lukut, galam, luwa,rengas, sarigading, jingah, gulinggang), as well as fitness materials (including pasakbumi and gingers) and industrial materials (including rattan, hemp and jelutung).There are also many annual plants growing in the peatland such as coconut trees,coffee trees, rubber trees, oil palms, pepper, orange, rambutan, durian, cempedak,jackfruit and pineapple. There are also rare and exotic fruits found in the peatland such

290 C. Agus et al.
as big mangosteen (Garcinia sp.), sweetsop fruit (Anona sp.), red flesh durian (Duriosp.) and its family members like pampakin, lai-lidung, lahong, mahrawin, kamundai,and likol/leko (Durio graveolens). Family members of rambutan such as taap andkopuan (Arthocarpus spp.), butter fruit (Diospirus discarlon), pitanak (Leukocinitisspp.), gitaan (Leukconitis corpidae), rambai padi (Baccaureamutleana), kapul/puak,ramunia (Bouea macrophylla), and balasungkawa (Noor et al. 2007) also has itscontribution. There are about 60 species of treeswith economic valuewhich produceslumbers (Barchia 2006) in addition to about 310–376 species of other plants in thepeatlands in Kalimantan and Sumatera with the density of 1300–3200 individualsper hectare (Wibisono 2005). There are also many species of fishes, birds and otherfauna found in the peatland that are rich in protein, fat, vitamin and mineral sources.There are about 104 wild faunas, including 32 mamalia (13 protected species), 8reptiles (5 protected species), 60 species of birds (9 protected species). It has beenpredicted that there are about 100–500 species of fishes found in the peat swampwaters (Dahuri 1997).
The Characteristics of Peat Soil
Tropical peatland is composed of litters of various plants growing in the tropicalswamp forest, consisting of stems, branches, raw roots that were still indicative oftheir original plants. Driessen (1978) describes that physical characteristics of peat-land soil is a result from a number of variables which influence each other. One of thephysical characteristics of the peatland soilwhich often to be compared tomineral soilis soil moisture content. The capability of the peatland soil to keepmoisture is greatlysignificant, ranging from 200 to 1000% based onweight or 50–90% based on volume(Andriesse 1988). The capability of the peatland soil to keep water is significantlyinfluenced by thematurity of peat and groundwater depth (Rieley et al. 1996a). Fibricpeat material able to keep the moisture of 500 and 1000% of weight, while hemicand sapric peat materials only able to keep the moisture of 200 to 500% of weight.In saturated water condition of catotelm zone, the fibric peat material may keepmuch more moisture than hemic and sapric peat materials. However, in non-water-saturated condition or in acrotelm zone, the capability of the peat material varieswith its distance to groundwater surface. Bulk density represents the most importantcharacteristics because some other characteristics of the peat soil are closely relatedto it (Andriesse 1988). Compared to the mineral soil, the bulk density of the peatsoil is much lower. The bulk density of tropical peat soil is generally lower than thatof non-tropical soil, ranging from 0.1 to 0.3 kg dm−3 and it usually decreases withdepth (Rieley et al. 1996a).
The tropical peatland is characterized by low nutrient content and high acidity(Rieley et al. 1996a) as a result from the formation process of its peat materials whichis influenced by rain water deficient of minerals. The composition of the nutrientsis highly dependent on the plant‘s nutrient composition produced by litters.. Themajority of the tropical peatland contains less than 5%minerals. The total content of

The Impact of Forest Fire on the Biodiversity and the Soil … 291
chemical elements of ombrogen peatland is lower than that of topogen peatland andmineral land (Rieley et al. 1996a). The macro and micro elements contained in thelow layer of the peatland are usually lower than that of the upper layers (Ahmad-Shahet al. 1992). Thus, nutrient deficiency often has its occurrence in thick and ombrogenpeat land.
The total nitrogen (N) content of the tropical peatland in some areas in Indonesiaranges from 0.3 to 2.1%, in Malaysia 0.9–1.7%, and in Brunei 0.3–2.2% (Sajarwan1998). The range of available mineral-N for plants is less than 1% from total Ncontent. The mineral nitrogen contained in the peatland is not easily available forthe plants because of its high C/N ratio, which is range from 25 to 50 (Jali 1999).The majority of phosphor (P) in peatland is in the form of organic-P and only smallamount of the organic-P is in the form of organic-P compound. The available soil-Pis more likely depend on the mineralization results of the organic-P compound. Themineralization and the immobilization of the P by microorganisms is significantlyinfluenced by the C/P ratio of the peatland (Tisdale et al. 1985). The total P contentof the tropical peatland is generally less than 0.1% and its C/P ratio is 15–20 timeslower than the C/N ratio (Jali 1999).
The Tropical Peatland Fire
The forest fire that has affected the tropical peatland, especially in Southeast Asia, hastaken place in a long period of time. Usually, it occurs during dry season, especiallyin reclaimed peatland areas. The first severe forest fire occurred in 1982/1983 duringthe El-Nino dry season in which about 500,000 ha of the peatland, especially inEast Kalimantan was burned out (Page et al. 2002). Another severe forest fire tookplace in 1997/1998 and affected about 1.5 million ha of the peatland in Indonesia(BAPPENAS1998).Among the affected areas, 750,000ha are located inKalimantan,which included approximately 500,000 ha at PPLG inCentral Kalimantan (Page et al.2002).
The forest fire during the dry season might be triggered by natural occurrencessuch as dried branches and leaves which are unintentionally burned by human. Somemajor causal factors of the fire related to human are burning practice to clear the landfor agricultural purposes, land drainage, logging, human recreation activities such ascamping and excursion, hunting and fishing, especially electrical fishing (Abdullahet al. 2002). The forest fire in Malaysia is caused by land clearing for agricultural use(Abdullah et al. 2002). Meanwhile, forest fire in Central Kalimantan is assumed tobe related to forest clearing and drainage of peatland. This is because 80% of the firespots are found in the PPLG area and concentrated around the drainage and irrigationcanals (Page et al. 2002).
The forest fires may give either direct and indirect impact to peatland. The directimpacts of the fire are, among others, the loss of the upper layers of litters of the peat-land (Jaya et al. 2000), the decline in the biodiversity, the environmental degradation,and the deteriorating of health condition of living organism in the surrounding areas
292 C. Agus et al.
affected by the fire (Musa and Parlan 2002). The forest fire in Central Kalimantan in1997/1998 causes the decrease in the vegetation density, loss of 75% of the peatlandof 35–70 cm of depth, and loss of 0.2–0.6 Gt carbon (D’Arcy and Page 2002). Fur-thermore, Noor (2010) reported that a million hectare of opened peatland in CentralKalimantan has annually contributed 0.425million tons ofCH4 to the global emissionof greenhouse gases. The carbon emission of the peatland opened for agricultural useapproximately 2.25–3.74 tons C/ha/year. Thus the opening of a million hectare ofthe peatland would have the potential emission of the greenhouse gases equivalent to8.07–13.58million tons CO2 annually. The lost carbon has extraordinarily significantimpact on the emission of CO2 into atmosphere. Meanwhile, the indirect impactsof the forest fire that affect the peatland represents the post-effects resulting fromthe recovery process of the peatland both naturally and deliberately by human beinginto its original condition. This may have happened for many years depending on thecapability to recover the peatland and also the quality of the peatland itself. Therehas not been any study reporting the post-effects of the forest fire that have affectedthe peatland‘s characteristics. After the forest fire, the canopy of the forest was moreopend and the peatland became more exposed. Consequently, the peat soil was moreopened to atmosphere (aerob) compared to its natural condition. Therefore, it waspredicted that the characteristics of the peatland would change after the fire.
Ffolliot and Bennet in De Bano et al. (1998) classified the severity of the forestfire based on the observed damage of trees into:
• Low fire severity: at least 50% of trees are indicative of observed damage caused bythe fire such as the burned crown, the dead shoots (the upper parts were burned, butgerminating) or the dead roots, while>80% of the damaged/burned trees survive.
• Moderate fire severity: 20–50% of trees are indicative of unobserved damagecaused by the fire, 40–80% of the damaged/burned trees survive.
• High fire severity: <20%of trees are indicative of unobserved damage, themajorityof the damages resulting from the fire is observed in the dead roots, while<40%of the damaged/burned trees survive.
The Degraded Land After Forest Fire in Kalimantan
The impact of the above 3 kinds of forest fire severity on the characteristic of biodi-versity and soil were studied in the Special Purpose Forest (KHDTK) of TumbangNusa located in Jabiren Raya Sub-district, Pulang Pisau District, Central Kaliman-tan which was under the management of Indonesian Center for Environment andForestry Research and Development (BP2LHK) Banjarbaru. The forest fire in 2015,was one of the biggest forest fires that has ever taken place in the area of KHDTKTumbang Nusa showed that more than 50% of the area of the KHDK Tumbang Nusawas burned at various severity levels.
Secondary forest represented the land with the biggest number of individuals thatwas not affected by the forest fire in 2015. There were 106 individuals found intact,

The Impact of Forest Fire on the Biodiversity and the Soil … 293
Fig. 1 The condition of the forest during the fire and after the fire in 2015. a The condition ofground fire that caused burned crown. b The condition of the ground soon after the severe fire. cThe dead roots followed by falling down of the trees because of the fire. d The condition of thesevere fire a year after the fire. Source BP2LHK Banjarbaru
consisting of 8 species of trees. Furthermore, there were 44 individuals of treessurvived, consisting of a species. Meanwhile, there were 16 trees found dead in thelandwhichmeans 73.33% of the trees survived of the forest fire in 2015. The severelyburned land without any vegetation cover had only 4 remaining trees after the fire in2015. Meanwhile, the condition of the severely burned land with vegetation coverwas the same as that of the burned land without any vegetation cover after the fire in2015 in which all of the trees had been burned out and there were only a very smallnumber of surviving trees. However, after the fire, the land with vegetation coverexperienced natural rejuvenation that the in-field data of the vegetation gathered in2017 were indicative of the increase in the number of individuals and the species.
The most severe fire was ground fire which the heat under surface of the groundcaused the death of trees resulted from burned-out roots. In effects, trees were unableto survive. Moreover, the ground fire also led to surface fire that reached the crown(Fig. 1a). Almost all of the trees in the area had burned out leaving only the standingburned trees (Fig. 2d). The severe damage resulting from the severe fire is presentedin Fig. 1.
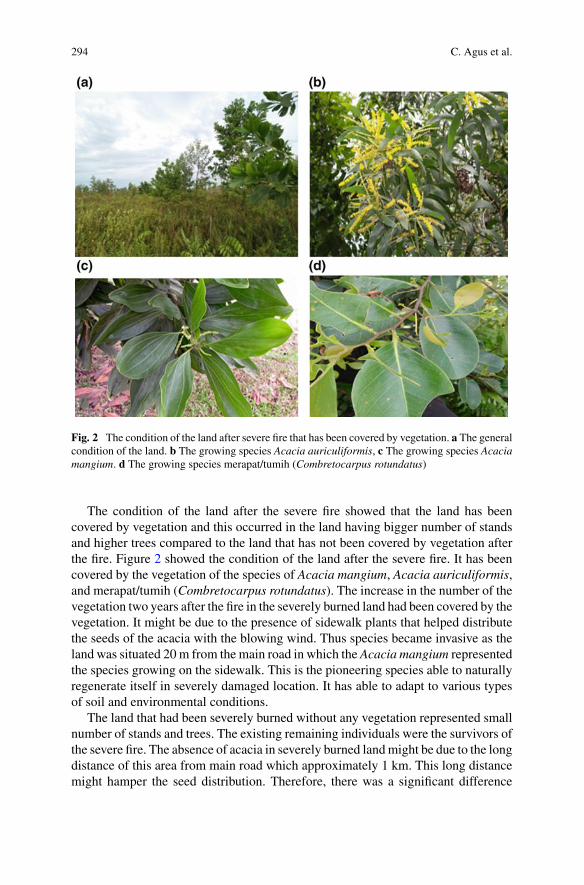
294 C. Agus et al.
Fig. 2 The condition of the land after severe fire that has been covered by vegetation. a The generalcondition of the land. b The growing species Acacia auriculiformis, c The growing species Acaciamangium. d The growing species merapat/tumih (Combretocarpus rotundatus)
The condition of the land after the severe fire showed that the land has beencovered by vegetation and this occurred in the land having bigger number of standsand higher trees compared to the land that has not been covered by vegetation afterthe fire. Figure 2 showed the condition of the land after the severe fire. It has beencovered by the vegetation of the species of Acacia mangium, Acacia auriculiformis,and merapat/tumih (Combretocarpus rotundatus). The increase in the number of thevegetation two years after the fire in the severely burned land had been covered by thevegetation. It might be due to the presence of sidewalk plants that helped distributethe seeds of the acacia with the blowing wind. Thus species became invasive as theland was situated 20m from the main road in which the Acacia mangium representedthe species growing on the sidewalk. This is the pioneering species able to naturallyregenerate itself in severely damaged location. It has able to adapt to various typesof soil and environmental conditions.
The land that had been severely burned without any vegetation represented smallnumber of stands and trees. The existing remaining individuals were the survivors ofthe severe fire. The absence of acacia in severely burned landmight be due to the longdistance of this area from main road which approximately 1 km. This long distancemight hamper the seed distribution. Therefore, there was a significant difference

The Impact of Forest Fire on the Biodiversity and the Soil … 295
-
10,000
20,000
30,000Am
ount
(Ind
ivid
uha
-1)
Fire severity
Seedling Poles Trees
0
2
4
6
8
10
Spec
ies a
mou
nt
Fire severity
Belowground Seedling Poles Trees
-
0.50
1.00
1.50
2.00
2.50
3.00
Dens
ity (I
ndiv
idu
m-2
)
Fire Severity
Seedling Poles Trees
0.00
0.50
1.00
1.50
2.00
BT BA BM SF BT BA BM SF
BT BA BM SF BT BA BM SF
ID S
hann
on
Fire Severity
Belowground Seedling Poles Trees
Fig. 3 The number of the individuals and the species, the density of the vegetation and Shannon’sDiversity Index at various growth levels and fire severity. Note BT—severely burned without anyvegetation cover, BA—severely burned with vegetation cover, BM—moderately burned, SF—sec-ondary forest
between the two areas of the affected land in terms of their vegetation condition afterthe fire
Vegetation measurement on trees and their rejuvenation showed that secondaryforest had 4 species for ground plants, 2 species for seedling level, 5 species for stakelevel, 8 species for pole, and tree level (Fig. 3). Figure 2a illustrates the conditionof the secondary forest in which the species of Balangeran (Shorea balangeran),Gerunggang (Cratoxylon arborescens), Meranti (Shorea spp.), Merapat (Combreto-carpus rotundatus), Meranti Daun Lebar (Shorea uliginsoa), and other species werefound. The number of the individuals and the species tended to increase because ofthe minimal presence of interference.
The number of the species at growth levels of seedling, stake, pole and trees afterthe moderate fire was very low, a species for each was Merapat Combretocarpusrotundatus). Merapat is the local species of Kalimantan well-known as fire resistantbecause of its thick bark. It was evidenced in 73.33% of the trees remained after themoderate fire. The causal factor of the big number of the surviving trees after the firewas the presence of the fire resistant species in higher severity level of the fire. Landwith moderate fire level only affected on the surface of the ground, did not affect thelower layers, and did not burn crown unlike in the land with severe fire.
The number of the individuals at all growth levels tended to decrease with theseverity of the fire. However, the value was more likely to vary at the growth level
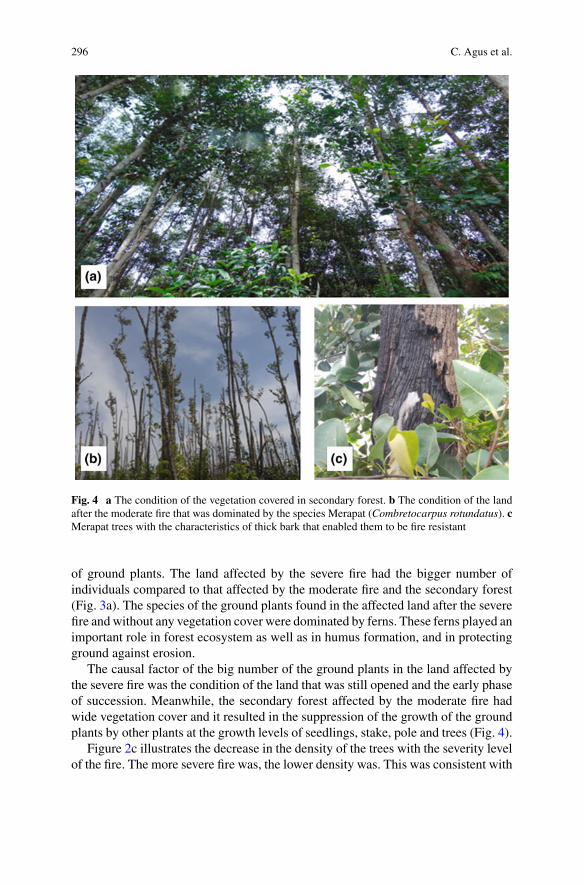
296 C. Agus et al.
Fig. 4 a The condition of the vegetation covered in secondary forest. b The condition of the landafter the moderate fire that was dominated by the species Merapat (Combretocarpus rotundatus). cMerapat trees with the characteristics of thick bark that enabled them to be fire resistant
of ground plants. The land affected by the severe fire had the bigger number ofindividuals compared to that affected by the moderate fire and the secondary forest(Fig. 3a). The species of the ground plants found in the affected land after the severefire andwithout any vegetation cover were dominated by ferns. These ferns played animportant role in forest ecosystem as well as in humus formation, and in protectingground against erosion.
The causal factor of the big number of the ground plants in the land affected bythe severe fire was the condition of the land that was still opened and the early phaseof succession. Meanwhile, the secondary forest affected by the moderate fire hadwide vegetation cover and it resulted in the suppression of the growth of the groundplants by other plants at the growth levels of seedlings, stake, pole and trees (Fig. 4).
Figure 2c illustrates the decrease in the density of the trees with the severity levelof the fire. The more severe fire was, the lower density was. This was consistent with

The Impact of Forest Fire on the Biodiversity and the Soil … 297
D’Arcy and Page (2002) that the forest fire which affected the peatland in CentralKalimantan in 1997/1998 has caused 75% decrease in the density of the trees.
Shannon’s diversity index at each of the growth levels of the vegetation was alsomore likely to decrease with the severity of the forest fire. According to Shannon,this was because the forest fire resulted on the loss of various species growing in theland. The index shows that the highest pole and trees were found in the secondaryforest and classified into moderate diversity, while the index was low in the case ofthe forest fire in 2015.
The Characteristics of Soil After Forest Fire
The forest fire that affected peatland resulted in the environmental condition withmore free air flow (aerob) than that in its natural condition, as such found in thepeatland rarely affected by the fire and represented secondary forest. Themore aerobecondition enable the change and the maturation of the peat materials which occurredin the peatland after the fire because of the high precipitation.
The compression has either reduced the volume of the peat mass (Dexter 2004)or increased its weight. Figure 5 illustrates the soil pores extant in the land after thesevere fire with or without vegetation cover, which was denser compared to the otherpeatlands after the fire. The dense soil pores resulted in soil compression and groundsolidifying and, hence, it led to the increase in the weight volume.
Based on the results of the study, the WHC values ranged from the lowest(162.59%) in the peatland after the severe fire and with vegetation cover to thehighest (189.12%) in the secondary forest that were rarely affected by fire (Fig. 6)although they did not show significant difference. All of theWHC values were above100%,whichwas consistent with the statement byMutalib et al. (1992) that the watercontent of the peatland was in the range of 100–1300% of its dry weight.
The organic carbon content of the peatland after the fire was in the range of thelowest (77.04%) in the peatland after the severe fire and covered by vegetation to thehighest (93.39%) in the secondary forest that was rarely affected by the fire (Fig. 6).The values tended to be higher compared to the range of the organic carbon of normalpeatland, which was in the range of 54.3–57.84% (Barchia 2006). The high organiccarbon content of the peatland after the fire without any vegetation cover mightbe influenced by the accumulation of organic materials in the land because of thetransfer of the organic materials resulting from the burning process during the fire.Not only they came from the inside parts of the trees in the land, but also from theupper parts of the trees such as stems, branches and crown. In addition, the increasein the organic materials was also caused by the residue of the burning process whosemain components included hemicellulose, cellulose and lignin that became carbondioxide (CO2) and carbonate (CO3) compound. The CO2 was released as gas, whilethe CO3 would accumulate as ashes that the carbon content of the peatland increased(Lutz and Chanler in Iswanto 2005).
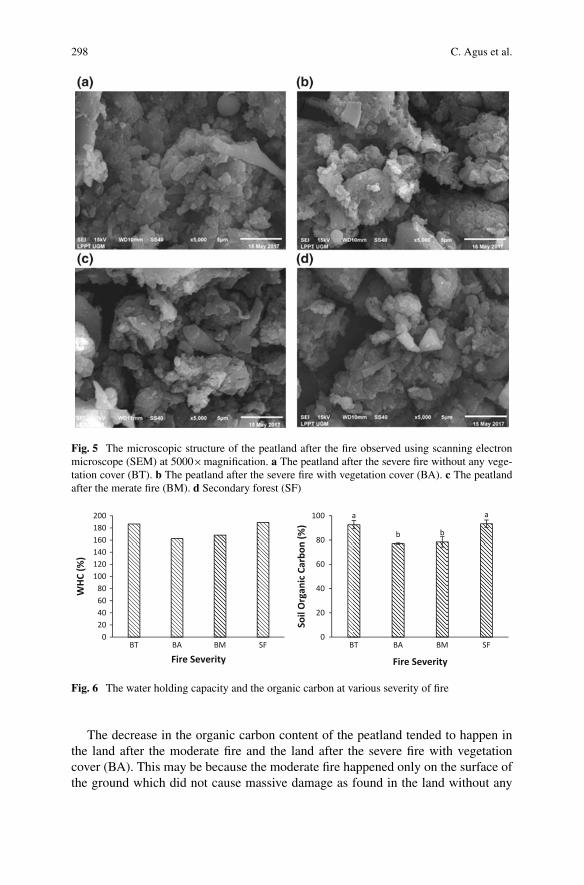
298 C. Agus et al.
Fig. 5 The microscopic structure of the peatland after the fire observed using scanning electronmicroscope (SEM) at 5000×magnification. a The peatland after the severe fire without any vege-tation cover (BT). b The peatland after the severe fire with vegetation cover (BA). c The peatlandafter the merate fire (BM). d Secondary forest (SF)
020406080
100120140160180200
WHC
(%)
Fire Severity
a
b b
a
0
20
40
60
80
100
BT BA BM SF BT BA BM SF
Soil
Org
anic
Car
bon
(%)
Fire Severity
Fig. 6 The water holding capacity and the organic carbon at various severity of fire
The decrease in the organic carbon content of the peatland tended to happen inthe land after the moderate fire and the land after the severe fire with vegetationcover (BA). This may be because the moderate fire happened only on the surface ofthe ground which did not cause massive damage as found in the land without any
The Impact of Forest Fire on the Biodiversity and the Soil … 299
vegetation cover (Agus et al. 2004; Agus 2013, 2018).This could be proven that theremaining trees in the land affected by the moderate fire was 73.33%, while therewas only 10% of the remaining trees in the severe fire without any vegetation cover.
The pH value of each of the peatlands was in the range of the lowest (3.27) to thehighest (3.76). This corresponds with the statement by Noor (2010) that the majorityof the peatland reacted from acid to very acid condition (pH < 4). The value wasclassified in ultra acid to extremely acid categories, while themineral soil usually hadthe pH value of 5–8 (Barchia 2006). The mean pH of the peatland in the secondaryforest was 3.27, meaning that it increased in the area affected by the moderate fireto 3.62 and in the area affected by the severe fire (BA) to 3.76. This shows that theforest fire caused the increase in the pH, hence, the availability of certain nutrientsnecessary for plants would exist and it would decrease again to normal in 5 years(Iswanto 2005). Therefore, if the pH was close to the initial pH, the availability ofcertain nutrients for plants was lower. Additionally, the increase in the soil pH wasconsistent with Chandler cit. in Sugato (2005) suggesting that the residue of theburning process could increase cation exchange, which tended to increase the soilpH.
The results of the analysis of scanning electron microscope with x-ray energy-dispersive spectroscopy (SEM-EDX) showed that the essential macro nutrients ofthe peatland after the fire were found in various types of soil. The essential macroelement of Sulfur (S) was found only in the secondary forest, meanwhile, it was notfound in the peatland after the moderate and severe fires in 2015. The causal factorof the loss of the sulfur might be the occurrence that took place a couple of years ago.According to Hoskin in De Bano et al. (1998) when the temperature of soil increasedduring the heating process, the soil chemical components contained in the organicmaterials would result in the loss of the organic materials at the temperature below100 °C. While it would be easy for the elements to evaporate, it would disappearat the temperature of 200 °C. At the temperature of 200–300 °C, about 85% ofthe organic matters of the soil would disappear. At the temperature above 300 °C,the remaining organic matters with carbon content would disappear and the heatingup of the temperature of 450 °C for 2 h or 500 °C, for half hour would cause thedisappearance of 99% of organic matters.
Table 1 shows that the essential micro nutrients found in the peatland after the fireincluded Cu, Si and Zn. Copper (Cu) was the element found in all of the peatlandafter the fire. The causal factor of the presence of the Cu might be the presence ofthe chelating bonds between organic acid and the metals extant in soil (Stevenson1982). Hodgson et al. in Mengel and Kirkby (1987) suggested that more than 98%of the Cu solution in the soil was stuck by organic matters.
The elements of the Zn and the Si represented the essential micro nutrients con-tained only in some areas of the peatland after the fire. The Zn was found only inthe peatland after the severe fire and the land has been covered by vegetation and insecondary forest. Meanwhile, the Si was found only in the peatland after the moder-ate fire and without any vegetation cover. According to Barchia (2006) the minimumcontent of the essential micro nutrients was common in the peatland. Carbonate andphenol groups in the caution exchange site of the peatland could form complex bonds

300 C. Agus et al.
Table 1 The percentage of the mass resulting from the electron dispersive X-ray (EDX) of thepeatland at various severities of fire
Unsur Mass (%)
BM BA SF BT
C 50.27 55.3 50.78 51.34
N 15.89 17.56 15.05 16.44
O 30.38 25.47 30.03 30.62
Si 1.92 – – 0.26
Cu 1.55 1.22 2 1.34
Zn – 0.45 1.6 –
S – – 0.54 –
Note BT—Severely burned without any vegetation, BA—Severely burned with vegetation, BM—-Moderately burned, SF—Secondary forest
with micro elements that they were unavailable for plants. Moreover, the excessivereduction caused the change of the micro elements into their metal forms withoutany load (Andriesse 1988).
The forest fire that affected the peatland was the one that burned not only forestplants, but also the litters layer and part of the peat materials, especially those inupper layer (Usup et al. 2000). This caused the loss of a part of the upper layer ofthe peatland, which in turn caused the change in the environmental condition intomore aerob because of the excessive drainage. Consequently, the peat materials wereexcessively exposed to air flow that resulted in the further change of the peatmaterialsinto more mature ones.
The graph showing the analysis results of the vegetation shows that there was notany secondary forest burned in 2015 with higher diversity index value at the growthlevels of trees pole, stake and seedlings (Fig. 4). This shows that the forest fire causedthe extinction of various species of flora and fauna (Purbowaseso 2004). Thus, theforest fire that affected the peatland had direct impact of the decrease in biodiversityalong with its economic values. For example, the forest fire that affected the peat-land in Central Kalimantan in 1997/1998 had burned the trees with high economicvalue such as ramin (Gonystylus bancanus) and belangeran (Shorea blangeran). Inaddition, it also caused 75% decrease in the density of the trees (D’Arcy and Page2002). It was also responsible for the loss of 0.2–0.6 Gt of C and 35–70 cm peat layer(Page et al. 2002). The loss of the carbon had extraordinarily significant impact onthe emission of the CO2 into atmosphere. Meanwhile, the loosing rate of the peatlayer was highly imbalanced with the formation rate and the accumulation of the peatmaterials relatively long time. The peatland grew at the growing rate of 0–3mm/year.The growing rate of the peatland in Barambai Delta Pulau Petak, South Kalimantanwas about 0.05 mm annually, while it was 0.13 mm/year in Pontianak. It went fasterin Malaysia, which was about 0.22–0.48 mm annually (Noor 2010).

The Impact of Forest Fire on the Biodiversity and the Soil … 301
Conclusion
1. The forest fire that affected tropical peatland caused the decrease in the biodiver-sity of the vegetation as indicated by the decrease in Shanon-Whiener’s diversityindex and by the significant decrease in the number of the species, the density ofthe individuals of trees.
2. The physical and chemical characteristics of the peatland 2 years after the for-est fire changed. It was clearly observed in the volume weight (VW) value, soilorganic carbon, pH, available-N, available-K, and the presence of the essentialmicro elements of Cu, Zn, and Si. At the same time, the decrease in the waterholding capacity (WHC), cation exchange capacity (CEC) and electric conduc-tivity (EC) took place. However, the change in the chemical characteristics of thesoil took place temporarily because of the loss of the nutrients resulting from theleaching, the emission into atmosphere accompanied by other negative impactof the disturbance of hydrological function, the loss of the carbon of the peatlayers, as well as the increase in the temperature.
Acknowledgements The authors express their greatest gratitude to SEAMEOBIOTROP,Ministryof Research, Technology and Higher Education RI and UGM Yogyakarta for their research andpublication funding, and Banjarbaru Environment and Forestry Research andDevelopment Institutefor supports of field researchmaterials.Wegratefully acknowledge the funding fromUSAID throughthe SHERA program—Centre for Development of Sustainable Region (CDSR).
References
Abdullah MJ, Ibrahim MR, Abdul AR (2002) The influence of forest fire in Peninsular Malaysia:history, root causes, prevention, and control. Makalah disajikan pada workshop on preventionand control of fire in Peatlands. 19–21 Mar 2002, Kuala Lumpur, Malaysia
AdinugrohoWC, Suryadiputra INN, Saharjo BH, Labueni S (2005) Panduan PengendalianKebakaran Hutan dan Lahan Gambut. Wetlands International—Indonesia Programme, Bogor
Agus C, Karyanto O, Kita S, Haibara K, Toda H, Hardiwinoto S, Supriyo H, Na’iemM,WardanaW,SipayungM,Khomsatun,Wijoyo S (2004) Sustainable site productivity and nutrientmanagementin a short rotation Gmelina arborea plantation in East Kalimantan, Indonesia. New Forest J28:277–285
Agus C, Sunarminto BH, Suhartanto B, Pertiwiningrum A, Wiratni SI, Pudjowadi D (2011) Inte-grated Bio-cycles farming system for production of bio-gas throughGAMADIGESTER, GAMAPURIFICATION and GAMA COMPRESSING. J Jpn Inst Energy 90(11):1086–1090
Agus C (2013) Management of tropical bio-geo-resources through integrated bio-cycle farmingsystem for healthy food and renewable energy sovereignty: sustainable food, feed, fiber, fertilizer,energy, pharmacy for marginalized communities in Indonesia. In: Proceeding of 2013 IEEEglobal humanitarian technology conference (GHTC). www.ieeeghtc.org. San Jose, CaliforniaUSA 20–23 Oct 2013
Agus C, Putra PB, Faridah E, Wulandari D (2016) Napitupulu RNP organic carbon stock and theirdynamics in rehabilitation ecosystem areas of post open coal mining at tropical region. ProcediaEng 159:329–337
302 C. Agus et al.
AgusC,Wulandari D, PrimanandaE,HendryanA,HarianjaV (2017) The role of soil amendment ontropical post tinmining area in Bangka island Indonesia for dignified and sustainable environmentand life. IOP Conf Ser: Earth Environ Sci 83:012030
Agus C (2018) Development of blue revolution through integrated bio-cycles system on tropicalnatural resources management. In: Leal FilhoW, Pociovalis, teanu D, Borges de Brito P, Borges deLima I (eds) Towards a sustainable bioeconomy: principles, challenges and perspectives. Worldsustainability series. Springer, Cham, pp 155–172
Ahmad SA, Radzi-Abbas M, Mohd-Jamil AS (1992) Characteristics of tropical peat under a sec-ondary forest and an oil palm plantation in Selangor, Malaysia. Dalam: Proocedings of the 9thinternational peat congress, vol 1, Uppsala, Sweden
Andriesse JP (1988) Nature and management of tropical peat soils. FAO Soil Bull (59). (Rome,Italy)
Asdak C (2002) Hidrologi Dan Pengelolaan Daerah Aliran Sungai. Gadjah Mada University Press,Yogyakarta
BAPPENAS (1998) Planning for fire prevention and drought management project: interim report.BAPPENAS, Jakarta
Barchia MF (2006) Gambut: Agroekosistem dan Transformasi Karbon. Gadjah Mada UniversityPress, Yogyakarta
Cahyanti PAB, Agus C (2017) Development of landscape architecture through geo-eco-tourism intropical karst area to avoid extractive cement industry for dignified and sustainable environmentand life. IOP Conf Ser: Earth Environ Sci 83:012028
D’Arcy LJ, Page SE (2002) Assessment of the effects of the 1997/1998 forest fire and anthropogenicdeforestation on peat swamp forest in Central Kalimantan, Indonesia. In: Dalam: Rieley JO, PageSE (eds) Peatlands for people, natural resources function, and sustainable management. BPPTdan Indonesian Peat Association, Jakarta
De Bano LF, Neary DG, Ffolliott PF (1998) Fire’s effects on ecosystem. Wiley, USADahuri R (1997) Dampak Lingkungan Proyek Pengembangan Lahan Gambut Sejuta Hekta danArahan Pengelolaannya dalam Pengelolaan Gambut Berwawasan Lingkugan. Jurnal Alami2(1):7–12. (BPP Teknologi, Jakarta)
Dexter AR (2004) Soil physical quality: Part I. Theory, effects of soil texture, density, and organicmatter, and effects on root growth. Institute of Soil Science and Plant Cultivation (IUNG), ul.Czartoryskich, vol 8, pp 24–100 Pulawy, Poland
Driessen PM (1978) Peat soils. Dalam: Soil and Rice. IRRI. Los Banos, PhilippinesIswantoDS (2005) Perubahan Sifat Fisik danKimiaGambut pada LahanBekas Terbakar di TegakanAcacia crassicarpan PT. Sebangun Bumi Andalas Wood Industries, Provinsi Sumatera Selatan(skripsi). Fakultas Kehutanan, Institut Pertanian Bogor, Bogor
Jali DD (1999) Nitrogen mineralization, litter production and cellulose decomposition in tropicalpeat swamps. Ph.D. thesis. University of London, London
Jaya A, Page SE, Rieley JO, Limin S, Böhm HDV (2000) Impact of forest firest on carbon stor-age in tropical peatlands. InL: Dalam: Rochefort L, Daigle JY (eds) Sustaining our Peatlands.Proceedings of the 11th international peat congress, Québec City, Canada
Kita S, Agus C, Toda H, Haibara K (2008) Effect of short-rotation harvesting on soil microbialbiomass and nitrogen mineralization inGmelina arborea plantations in East Kalimantan. Tropics17(3):251–259
Krisnawati H,AdinugrohoWC, ImanuddinR, danHutabarat S (2015) PendugaanEmisi GasRumahKacaTahunandariHutandanLahanGambut diKalimantanTengah. Pusat Penelitian danPengem-bangan Konservasi dan Rehabilitasi, Badan Penelitian dan Pengembangan Kehutanan, Bogor
Mengel K, Kirkby EA (1987) Principles of plant nutrition, 4th ed. International Potash Institute,Switzerland
Musa S, Parlan I (2002) The 1997/1998 forest fire experience in Peninsular Malaysia. Makalahdisajikan padaWorkshop on Prevention and Control of Fire in Peatlands. 19–21Mar 2002. KualaLumpur, Malaysia

The Impact of Forest Fire on the Biodiversity and the Soil … 303
Mutalib AA, Lim JS, Wong MH, Koonvai L (1992) Characterization, distribution and utilization ofpeat in Malaysia. In: Dalam: Aminuddin BY, Tan SL, Aziz B, Samy J, Salmah Z, Siti Petimah H,Choo ST (eds) Tropical peat. Proceedings of the international symposium on tropical Peatland,MARDI, Malaysia
Noor M (2010) Lahan Gambut: Pengembangan, Konservasi, dan Perubahan Iklim. Gadjah MadaUniversity Press, Yogyakarta
Noor M, Ar-Riza I, Jumberi A (2007) Status, Potensi dan Pengembangan Buah Eksotik. In: Dalam:Supriyo A, Noor M, Ar-Riza I, Nzemi D (eds) Keanekaragaman Flora dan Buah-buah EksotikLahan Rawa. Balai Penelitian Pertanian Lahan Rawa, BBSDLP, Bogor
Page SE, Rieley JO, Boehm H-DV, Jaya A, Limin SH (2002) The amount of carbon released frompeat and forest fires in Indonesia during 1997. Nature 420:61–65
Purbowaseso B (2004) Pengendalian Kebakaran Hutan. Rineka Cipta, JakartaRadjagukguk B (1997) Peat Soil of Indonesia: location, classification, and problem for sustain-ability. In: Dalam: Rieley JO, Page SE (eds) Biodiversity and sustainability of tropical Peatland.Proceeding of the international symposium on tropical Peatlands. Palangka Raya, Indonesia
Rieley JO, Ahmad-Shah AA, Brady MA (1996a) The extent and nature of tropical peat swamps.In: Dalam: Maltby E, Immirzi CP, Safford RJ (eds) Tropical lowland Peatlands of SoutheastAsia. Proceedings of a workshop on integrated planning and management of tropical lowlandPeatlands. IUCN. Gland, Switzerland
Rieley JO, Page SE, Setiadi B (1996b) Distribution of Peatlands in Indonesia. In: Dalam: Lap-palainen E (ed) Global peat resources. Publisher International Peat Society, Jyska, Finland
SajarwanA (1998) PengaruhPemberianPupukKandang terhadapLajuDekomposisi danPerubahanSifat Kimia Tanah Gambut Fibrist. Universitas Brawijaya, Malang, Tesis
Stevenson FJ (1982) Humus chemistry: genesis, composition, reactions. A Willey IntersciencePublication, Willey. New York, USA
Sugato IS (2005) Perubahan Sifat Fisik dan Kimia Tanah Setelah 1, 2, dan 3 Tahun Pembakaran DiHutan Sekunder. Skripsi Jurusan Budidaya Hutan, Fakultas Kehutanan. Institut Pertanian Bogor,Bogor, Jasinga Bogor
Tisdale SL, Nelson WL, Beaton JD (1985) Soil fertility and fertilizers. Edisi ke 4. MacmillanPublishing Company, New York
Usup A, Limin SH, Takahashi H (2000) Aspect and mechanism of peat fire in tropical peatland: acase study in Central Kalimantan, 1997. In: Dalam: Iwakuma T, Inoue T, Kohyama T, Osaki M,Simbolon H, Tachibana H, Takahashi H, Tanaka N, Yabe K (eds) Proceedings of the internationalsymposium on tropical peat lands. Graduate school of environmental earth science, HokkaidoUniversity, Sapporo–Research and Development Center for Biology, the Indonesian Institute ofScience, Bogor
Wahyunto SR, Subagjo H (2004) Peta Sebaran Lahan Gambut, Luas dan Kandungan Karbon diKalimantan/Map of Peatland distribution area and carbon content in Kalimantan, 2000–2002.Wetlands International—Indonesia Programme & Wildlife Habitat Canada (WHC), Bogor
Wibisono ITC, Siburaa L, Suryadiputra INN (2005) Panduan Rehabilitasi dan Teknik Silvikultur diLahan Gambut. Kerjasama Wetlands International dan Wildlife Habitat Canada. CCFPI, Bogor

Promoting Climate Agendaand Biodiversity Conservationat the Local Level: A Case for Nepal’sRural and Urban Municipalities
Krishna Roka
Abstract Nepal is one of the most vulnerable countries to climate change. Thispaper discusses the impact climate change is having on the biodiversity in Nepal andwhy local governments need to conserve biodiversity to act on a climate agenda in thecoming years. It recommends ecosystem and landscape-based approaches for climatechange mitigation, adaptation, and disaster reduction. Large-scale approaches cannot only conserve biodiversity but also contribute to the social and economic well-being of local communities. Nepal has this unique opportunity to formulate andimplement appropriate policies towards biodiversity conservation at the local levelboth in rural and urban areas. After 20 years of administrative governance, in 2017,Nepali people have elected new representatives for 264 urban municipalities and 480ruralmunicipalities. In addition, the newly elected local governments should increasetheir commitment for biodiversity conservation by involving local communities asstewards. To do that Nepal’s rural and urban governments should develop policiesthat align with United Nations Sustainable Development Goals 11, 13 and 15 formaking cities resilient and sustainable, combat climate change, and protect, restoreand promote sustainable use of terrestrial ecosystems and halt biodiversity loss. Toachieve them Nepal needs support from the international community to empowerlocal people to monitor changes, to innovate for the future and adopt sustainabilityin their daily lives.
K. Roka (B)University of Wisconsin-Stevens Point, Wisconsin, USAe-mail: [email protected]
© Springer Nature Switzerland AG 2019W. Leal Filho et al. (eds.), Handbook of Climate Change and Biodiversity,Climate Change Management, https://doi.org/10.1007/978-3-319-98681-4_19
305
306 K. Roka
Background
Climate change is one of the most important socio-environmental issues today. TheIntergovernmental Panel on Climate Change’s (IPCC) fifth assessment is clear onthe human influence on the climate system and the widespread impacts it has onhuman and natural systems (IPCC 2014a, b). IPCC with high confidence claims thefollowing impacts of climate change on the natural system: terrestrial, freshwaterand marine species have shifted their geographic ranges, seasonal activities, migra-tion patterns, abundances, and species interactions in response to climate change.The report further identifies biodiversity conservation as one of the best options tomitigate further changes to the climate. Nepal, which is one of the most vulnerablecountries to climate change, must create policies at the local and national level topromote climate agenda and biodiversity conservation. The policies should integrateadaptation andmitigation as complementary strategies for reducing andmanaging therisks of climate change (IPCC 2014a, b). Conservation of biodiversity will continueto provide the much-needed ecosystem services for the people and help to mitigatethe impacts of climate change. Nepal has this unique opportunity to formulate andimplement appropriate policies towards biodiversity conservation at the local levelboth in rural and urban areas. After 20 years of administrative governance, in 2017,Nepali people have elected new representatives for 264 urban municipalities and 480rural municipalities.
For over five decades, Nepal’s conservation programs operated under a top-downbureaucratic structure. The old approach is ill equipped to tackle the problems fromclimate change; therefore, this paper argues for a bottom-up nested approach wherelocal people and their representatives are major actors. This is an opportunity forthe local government to do planning and development activities to conserve existingbiodiversity and promote climate change mitigation and adaptation. Without suchpolicies, Nepal’s vulnerability to climate change will increase from the high to thethreatening level. This paper discusses the impact climate change is having on thebiodiversity in Nepal and why local governments need to conserve biodiversity to acton a climate agenda in the coming years. It recommends ecosystem and landscape-based approaches to climate changemitigation, adaptation, anddisaster reduction (Lo2016). Large-scale approaches can not only conserve biodiversity but also contributeto the social and economic well-being of local communities.
In a communique to theUnitedNations, Nepal reported an increase in temperatureand decrease in mean rainfall between 1975 and 2005. It also indicated that undervarious climate change scenarios,mean annual temperatures are projected to increaseby 1.3–3.8 °C by 2060 and 1.8–5.8 °CC by 2090. Annual precipitation is projectedto decrease by 10–20% during the same time (GoN 2016). Between 1977 and 2010a 29% decrease in ice cover was recorded and the number of glacier lakes increasedby 11%. Out of 75 districts, 29 are highly vulnerable to landslides, 22 to drought, 12to glacier lake outburst floods (GLOF) and 9 to flooding (MoE 2010). Most of theimpact from climate change is felt at the local level and therefore, local governmentis on the front lines of defense.

Promoting Climate Agenda and Biodiversity Conservation … 307
Changes in precipitationAcidification
Rising temperaturePeople migration
Phenology and physiology
Biodiversity loss
DesertificationRelease of green house gases
Anthropogenic activities
Climate change
Fig. 1 Biodiversity and climate change
The focus on biodiversity conservation as a mitigation strategy is due to thefact agriculture, forestry, and other land uses account for about 24% of net globalgreenhouse gases (GHGs) (Baccini et al. 2015). In addition, the changes in land-useaffect the economic system by adding extra cost towards mitigation and adaptation.The impact on the biodiversity well documented at all ecosystem levels from micro-biomes to large forests, which are experiencing profound changes, and some areeven being pushed to the brink of extinction. Biodiversity conservation will not onlyprotect further loss of species but also serve as a tool to mitigate future damage tothe ecosystem. The inter-play between climate change and biodiversity loss createsa vicious cycle (Fig. 1) where climate change leads to biodiversity loss, which inturn leads to more climate change. Therefore, the only way to break this cycle isto improve biodiversity to create a different path towards sustainability by reducingclimate change. To achieve these endsNepal needs scientifically and socially feasiblesolutions. It is very crucial that such solutions operate in concert with local ecosystemand landscape for successful results. In addition, such strategies and policies could bealigned with the United Nations Sustainable Development Goals (SDGs), to whichnational and local governments are committed.
The focus of local governments on biodiversity conservation for climate changemitigation has to do with the relationship biodiversity has with many of the SDGs.

308 K. Roka
Here is one statement of how biodiversity conservation can help meet SDG 1—EndPoverty In All Its Forms Everywhere,
The conservation and sustainable use of biodiversity, including through sustainable agri-culture based on ecosystem approaches, along with the restoration and safeguarding ofecosystems and the valuable services they provide, can help to prevent men and womenfrom falling into poverty and can help to lift them out of it by increasing their income andreducing their vulnerability to external economic shocks or environmental disasters. (CBD2017)
Indeed, biodiversity conservation is linked positively to all SDGs. Two other SDGsthat relate directly to biodiversity conservation and climate change are SDG11—TakeUrgent Action To Combat Climate Change And Its Impacts; and SDC 15—Protect,Restore And Promote Sustainable Use Of Terrestrial Ecosystems, Sustainably Man-age Forests, Combat Desertification And Halt And Reverse Land Degradation AndHalt Biodiversity Loss. The interdisciplinary focus of the paper will contributetowards a better understanding of the relationship between climate change and bio-diversity, and the rationale for the conservation of the latter. Some of the limitationsof the paper include the lack of data on the impact of climate change on local biodi-versity at the district or regional level, limited access to planning documents of localgovernments, and the lack of primary data on the priorities and perspectives of thenewly elected local government officials.
Biodiversity in Nepal
Nepal is a land-locked country in south Asia between India in the south and China tothe north.Nepal’s physiography ranges fromalluvial plains in the tropical lowlands tothe snow covered Himalayan mountains. It is divided into five major physiographiczones extending east to west: the high himal, high mountains, middle mountains(middle hills), siwalik (chure) and terai (Table 1). IUCN identified 118 habitat typesin Nepal, which support a rich biodiversity (IUCN 2015).
Nepal comprises less than 0.1% of earth’s total land area, but it has significantbiodiversity for its size. Nearly 3% of the world’s known flora are found in Nepal
Table 1 Physiographic and bioclimatic zones of Nepal (GoN 2014)
Physiographic zone Coverage (%) Elevation (m)2 Bioclimatic zone
High Himal 23 Above 5000 Nival (tundra andarctic)
High mountains 19 3000–5000 Subalpine and Alpine
Middle mountains 29 1000–3000 Subtropical andMontane (temperate)
Siwalik 15 500–1000 Tropical
Terai 14 Below 500 Tropical
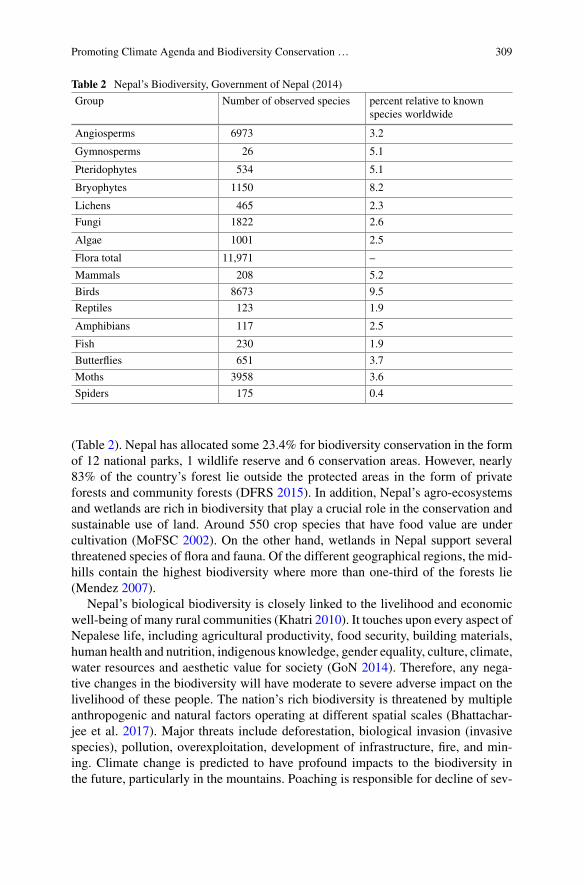
Promoting Climate Agenda and Biodiversity Conservation … 309
Table 2 Nepal’s Biodiversity, Government of Nepal (2014)
Group Number of observed species percent relative to knownspecies worldwide
Angiosperms 6973 3.2
Gymnosperms 26 5.1
Pteridophytes 534 5.1
Bryophytes 1150 8.2
Lichens 465 2.3
Fungi 1822 2.6
Algae 1001 2.5
Flora total 11,971 –
Mammals 208 5.2
Birds 8673 9.5
Reptiles 123 1.9
Amphibians 117 2.5
Fish 230 1.9
Butterflies 651 3.7
Moths 3958 3.6
Spiders 175 0.4
(Table 2). Nepal has allocated some 23.4% for biodiversity conservation in the formof 12 national parks, 1 wildlife reserve and 6 conservation areas. However, nearly83% of the country’s forest lie outside the protected areas in the form of privateforests and community forests (DFRS 2015). In addition, Nepal’s agro-ecosystemsand wetlands are rich in biodiversity that play a crucial role in the conservation andsustainable use of land. Around 550 crop species that have food value are undercultivation (MoFSC 2002). On the other hand, wetlands in Nepal support severalthreatened species of flora and fauna. Of the different geographical regions, the mid-hills contain the highest biodiversity where more than one-third of the forests lie(Mendez 2007).
Nepal’s biological biodiversity is closely linked to the livelihood and economicwell-being of many rural communities (Khatri 2010). It touches upon every aspect ofNepalese life, including agricultural productivity, food security, building materials,human health and nutrition, indigenous knowledge, gender equality, culture, climate,water resources and aesthetic value for society (GoN 2014). Therefore, any nega-tive changes in the biodiversity will have moderate to severe adverse impact on thelivelihood of these people. The nation’s rich biodiversity is threatened by multipleanthropogenic and natural factors operating at different spatial scales (Bhattachar-jee et al. 2017). Major threats include deforestation, biological invasion (invasivespecies), pollution, overexploitation, development of infrastructure, fire, and min-ing. Climate change is predicted to have profound impacts to the biodiversity inthe future, particularly in the mountains. Poaching is responsible for decline of sev-
310 K. Roka
eral large animals and some plant species; the high demand for wildlife productsin the international market has put 43 bird species and large mammals like rhino(Rhinoceros unicornis), tiger (Panthera tigris tigris), musk deer (Moschus chryso-gaster), pangolin (Manis sp.) under risk from poaching (GoN 2014). In response, thenational government and NGOs are actively involved in managing and preservingthe natural resource heritage.
In recent years, conservation efforts by the national government, NGOs, INGOs,and local communities have increased forest cover; however, the gains are not equallydistributed. For example, in 2015 the government reported an increase in forestcover of 40%, up from 29% in 1998 (DFRS 1999, 2015). In the Chitwan-AnnapurnaLandscape (CHAL) of central Nepal the forest area remained unchanged (35.5%)between 1990 and 2010 (WWF 2013), whereas forest area declined by 9% in theKailash Sacred Landscape (KSL) from 1990 to 2009 (Uddin et al. 2015). Withoutrobust policies and planning, forest loss across the country are projected to intensifyin the future. The role of policymakers and newly elected local leaders has neverbeen so crucial to conserve biodiversity in Nepal.
Politics play a large role in Nepal’s natural resource management policies. Forestsare a fertile ground for exploitation by politicians seeking votes; as a result, in pastyears the country lost significant area of forests to resettlement and associated activ-ities often with hidden political agendas. Nepal cannot afford to lose more forestresources (Khatri 2010). Therefore, it is important to inform and assist policy mak-ers on the environmental and economic benefits of forest conservation. Nepal isa global leader of participatory forest management, which can be a conduit for asuccessful climate change mitigation system.
Climate Change and Nepal
Nepal’s unique physiographic and topographic features give rise to its climatic andecological diversity. The climate ranges from subtropical in the south (terai) to arcticin the north (high himal). Around 80% of the precipitation in Nepal occurs duringthe Indian summer monsoon (June–September). The mean precipitation is about1530 mm, with maximum precipitation occurring in the siwalik and middle moun-tains, and the high mountain range receiving less rain. The temperature is highestduring the summer (May–June) in the 36–39 °C range and the winter temperatureminimum averages−3 °C. However, the temperature variability depends on the ele-vation. The terai region is the warmest part of the country, with high temperaturesexceeding 40 °C (Chalise et al. 1996).
Nepal is one of the most vulnerable countries to climate change (IPCC 2007).Climate change will bring variations in precipitation and increase in temperaturethat will affect glacial and snowpack melting. Both processes will have potentiallysevere socio-environmental consequences as they affect the availability of freshwaterto millions of people and influence species distribution and survival. WWF Nepalreported in 2017:

Promoting Climate Agenda and Biodiversity Conservation … 311
Climate change has hit Nepal hard, and it has hit fast. It is causing greater variations inweather patterns and more extreme weather events, like the drought that contributed to theexceptional number of wildfires that raged across Nepal during 2016’s pre-monsoon season.But the fires are just one small piece of the shifting climate-change picture. The rains,too, have become less predictable, making it more difficult to decide which crops to growand when to plant them. More hailstorms and stronger snows in some areas are affectingagriculture as well. (Seiff 2017)
IPCC’s fourth assessment report projected a temperature rise of 2–4 °C in South Asiaby the end of the century. It also reported an increase in GHGs in the region mostlyfrom anthropogenic activities. This increase in GHGswill cause further warming andlong lasting, possibly, irreversible impacts to the people and the ecosystems. The fifthassessment however projects some reductions in global emissions after 2020 whichwould keep thewarmingbelow2 °C in the region (IPCC2014a).Nepal’s high-altituderegions have seen more warming in recent years than the low-lying regions (Thapaet al. 2016). According to the government, the average annualwarming between 1971and 2014 was 0.056 °C. The biggest change has been recorded in the precipitationlevel. Droughts have become more intense in the central region since the 1980s,and the mean rainfall during the monsoon season has increased from 1981 to 2012(Jeeban et al. 2015). In the same time rainfall in other seasons decreased by 1%.
Climate Change Impacts on Biodiversity in Nepal
Worldwide numerous studies have observed the impact of climate change on biodi-versity. Some of the responses from species to climate change include changing theirphenology events like blooming, migration and breeding (Parmesan and Matthews2005; Bellard et al. 2012). The impact could happen at the species level where itwill affect the synchrony with species’ food and habitat requirement (Bellard et al.2012). At the ecosystem level, it could affect vegetation communities and even altertheir composition. At higher altitude, species are expected to expand northwards andshift their tree lines upwards at the expense of low stature tundra and alpine commu-nities (Alo and Wang 2008). Because of climate change several species are alteringtheir range, mostly at higher altitudes (Tingley et al. 2012), while some harmfulpathogens are causing alarming declines in amphibian populations at lower altitudes(Bosch et al. 2007). One of the most extremes outcome of unchecked climate changeis species extinction (Bellard et al. 2012).
Theknowledgeon the impacts of climate changeonNepal’s biodiversity is limited.Some of the known consequences listed by the national government are, (i) shiftsin agro-ecological zones, prolonged dry spells, and higher incidences of pests anddiseases, (ii) increased temperature and rainfall variability, (iii) increased emergenceand quickened spread of invasive alien plant species, (iv) increased incidence of forestfire in recent years, (v) changes in phenological cycles of tree species, (vi) shifting oftreeline in the Himalaya, and (vii) depletion of wetlands. However, available research

312 K. Roka
finding on the impact of climate change on individual plant and animal species ismore pronounced, and indicate the need for immediate actions.
Studies on the impact of climate change on forests in Nepal are related to alti-tude variations (Thapa et al. 2016). Climate projection show lower and mid-montaneforests are more vulnerable than upper montane and subalpine forests. The low andmid-montane forests are predicted to decrease in size into small patches ofmicrorefu-gia and may act as “climate corridors” for species forced to shift northwards, whilethe subalpine scrub vegetation continues to shift range northwards (Thapa et al.2016). Other notable alterations in forests in the Himalayas include early averageonset of the growing season and increased length of the growing season. In westernHimalayas, researchers have found an overall longer growing season, while littlevariation was recorded in central and eastern Himalayas (Shrestha et al. 2012). Atthe species level, several alpine plant species exhibited distribution differences undercurrent climate conditions versus future scenarios.Many species are projected to shiftnorthwards and shrink in overall distribution under future climate scenarios (Songet al. 2004). Himalayan fir (Abies spectabilis) responded negatively to temperaturerise with slow growth rate and its tree line extending northwards in response to cli-mate change (Gaire et al. 2011). For some species like the Chinese caterpillar fungus(Ophiocordyceps sinensis), a potential loss of habitat and possible range extensionare predicted for the future (Shrestha and Bawa 2014). As forests support biodiver-sity and ecosystem services to local communities, changes in the forest ecosystemcan prove catastrophic to humans and animals.
Negative effects of climate change on several species of animals are also predicted.Most of the impact will be in their distribution and loss of habitat from changingprecipitation and rising temperature. For example, a 30% loss of habitat is predictedfor snow leopard (Panther uncia) mainly along the southern distribution range due tothe projected shrinking of the alpine zones (Forrest et al. 2012). A population extir-pation risk is predicted for several species of salamanders and frogs with changingprecipitation levels (McCain and Colwell 2011). Distribution of invertebrate specieswere found to be significantly related to altitude variation in the central Himalayas.Of the 78 species studied, 79% exhibited a negative response to increasing altitude,which is predicted to occur in the future (Shah et al. 2015).
All future scenarios under the current climate condition predict significant impactto Nepal’s biodiversity. In addition to the direct impact to the native species, climatechange could assist in the expansion and distribution of invasive species,whichwouldoutcompete with the native flora and fauna.
Nearly 75% of Nepal’s population depend on agriculture, which is highly cli-mate sensitive and increasingly at risk from climate change impacts (CDKN 2017).Key effects of climate change on agriculture include declining water availability forirrigation, increasing peak flood flows, changing river morphology and decliningcrop yields (at higher altitudes) (Pradhan 2017). The projected changes from climatechange will exacerbate the existing harmful impacts in the agriculture sector. It isexpected an increase in dryness in drought-prone areas and wetter conditions in wetareas where plant species may not adapt to the new production conditions. On theother hand, temperature increase means crops like rice and wheat can be grown in

Promoting Climate Agenda and Biodiversity Conservation … 313
higher altitudes (Gautam2008).A4 °C increase in temperaturewould lead to increasein rice yield in the terai by 3.4%, in the hills by 17.9% and in themountains 36.1%. Atthe same time, climate change can delay crop maturity and destroy local species. Cli-mate change will also affect livestock in higher altitudes that are essential to people’slivelihood. Resident of Mustang (a high-altitude district) reported increased preva-lence of new livestock diseases, increase in mortality, decrease in animal breedingbehavior, and decrease in animal productivity (Koirala and Shrestha 2014). At higheraltitude, climate change associated temperature changes has resulted in less snow-fall and rapid melting of snow, which in turn caused less water in the upper part ofthe region, lower ground water discharge, less grass production, weaker agriculturalproduction, and a changing ecosystem (Aryal et al. 2014).
Nepal’s forests are an integral part of what is essentially an agrarian society. Forexample, forest litter and livestock manure are the main source of fertilizer, andfuelwood is the main energy source for 70% of the population. Climate change willnot only affect forest biodiversity but also the livelihood of millions of people whodepend on the biodiversity. According to the government of Nepal, the likely impactof climate change on biodiversity can be categorized into three likely scenarios (GoN2014):
(a) The climatic range of many species will move upward in elevation from their currentlocations. This will have differential effects on species. Some species will migrate throughfragmented landscapes whilst others may not be able to do so.
(b) Many species that are already vulnerable are likely to become extinct. Species withlimited climatic ranges and/or with limited geographical opportunities (e.g., mountain topspecies), species with restricted habitat requirements, and/or small populations are typicallythe most vulnerable.
(c) Changes in the frequency, intensity, extent, and locations of climatically and non-climatically induced disturbances will affect how and at what rate the existing ecosystemswill be replaced by new plant and animal assemblages.
TheHighHimal andHighMountain areas are likely to experience the largest transfor-mations. Among the natural habitats, remnant native grasslands are highly vulnerableto the impacts of climate change (Koirala and Shrestha 2014). The threats to biodiver-sity are affected by several underlying social, political, economic, technological andcultural variables that also contribute to climate change. According to the nationalgovernment, the growth of population, along with changing density and distributionpatterns, are believed to have contributed to loss and degradation of forest habitats indifferent ways, including increased forest encroachment for agricultural expansionsand increased pressure to meet energy and timber needs (GoN 2014). Therefore,policies towards biodiversity conservation under the climate change predictions arekey to prevent further loss of biodiversity in Nepal. These policies should be part ofthe local government’s priority in the coming years.
314 K. Roka
Climate Agenda and Biodiversity Conservation at the LocalLevel
According to the IPCC, mitigation and adaptation are complementary approachesfor reducing risks of climate change impacts over different time-scales (IPCC 2007).Mitigation will reduce climate change impacts in the short and long-term, adaptationwill reduce the vulnerability of people and ecosystems to future changes. Localgovernments can play a significant role in planning and implementing mitigationand adaptation strategies in coordination with the national government, as the IPCCstated:
National governments play key roles in adaptation planning and implementation throughcoordinating actions and providing frameworks and support. While local government andthe private sector have different functions, which vary regionally, they are increasingly rec-ognized as critical to progress in adaptation given their roles in scaling up adaptation ofcommunities, households, and civil society and in managing risk information and financing.(IPCC Fourth Assessment 4.4.2.1, 2007)
At the national level, Nepal has made climate change an important topic and devel-oped adaptation and preparation plans to adapt and mitigate climate change. A high-level Climate Change Council under the Prime Minster was formed in 2009 to guideclimate change adaptation and mitigation. In 2008, the government also created theNational Adaptation Programme of Action (NAPA) to prioritize community basedcoping strategies for climate-induced vulnerability. In addition, Nepal has taken sev-eral initiatives to reduce climate hazards and build resilience. Nepal’s communiqueto the UNFCC includes a detailed list of actions and strategies the government isplanning to implement as agreed under the ParisAgreement of 2015. Such plans oftenappear great on paper but poor on implementation. The first step towards biodiversityconservation under the future climate scenario is to close the gaps within the currentconservation system. Nepal became part of the Convention on Biological Diversityin 1994; however, it failed to enact comprehensive legislation for conservation ofbiodiversity and sustainable use.
The current policies on environment, development, and local governance lackclear objectives on biodiversity conservation. For example, the Agriculture sector’soveremphasis on commercializationmay undermine biodiversity management (GoN2014). Many of the laws at various levels are not well connected and coordinated andoften contradict each other. The Forest Act of 1993 and the Local Self-GovernanceAct of 1999 differ on how the revenue from the sale of forest products should bedistributed. The Forest Act states local user groups can manage the revenue inde-pendently; on the other hand, the Self-Governance Act stipulates the revenue shouldgo into the district fund. It is clear Nepal’s well-intentioned policies and strategiesfor biodiversity conservation are marred by implementation and evaluation difficul-ties. Therefore, the newly elected local governments should prioritize biodiversityconservation into all development and planning programs. Some of the agendas may

Promoting Climate Agenda and Biodiversity Conservation … 315
require improvising the existing management system, like the community forestryprogram, while other frameworks must be implemented or tested to mitigate furtherimpact from climate change.
Models of Adaptive Management
Designing a climate change strategy for the future is riddled with uncertainty; how-ever, inaction is not an option.Climate change adaptation is away tomodify strategiesto persist and succeed under new and changing climate conditions (Abrahms et al.2017). This paper focuses on the ecosystem-based adaptation similar to IPCC’s def-inition, “initiatives and measures to reduce the vulnerability of natural and humansystems against actual or expected climate change effects” (IPCC 2007). One way tobuild a strategy is by using local scenario planning, which creates multiple plausiblefutures to evaluate the outcomes and consequences of different decisions (Petersonet al. 2003). Several adaptive management frameworks for ecosystems are available;this paper recommends three frameworks (adopted from Abrahms et al. 2017) thatare pertinent to Nepal’s biodiversity.
(a) Adaptation for conservation targets (ACT) framework—The ACT frameworkoffers a structured approach to specific adaptation action (species/ecosystem)and has been implemented across North America. It includes six steps to climatechange adaptation: (1) identify the conservation feature of interest and defineconservation objectives, (2) build a conceptual model to assess impacts of pos-sible future scenarios, (3) identify management options, (4) prioritize actions,(5) implement actions, and (6) monitor and evaluate outcomes.
(b) Climate-smart conservation (CSC) framework—This offers a structuredapproach to integrate climate-change adaptation into existing planning pro-cesses. The CSC framework consists of seven steps: (1) define conservationobjectives, (2) identify key climate vulnerabilities, (3) revise objectives as nec-essary, (4) identify management options, (5) prioritize actions, (6) implementactions, and (7) monitor and evaluate outcomes.
(c) Portfolio decision analysis (PDA) framework—The PDA framework offers aquantitative approach to selecting a portfolio for management actions wherethere is a trade-off between human activities and biodiversity conservation.Its purpose is to maximize natural assets while minimizing impacts to humanassets. It also includes six steps: (1) identify natural and human assets of interest,(2) determine vulnerabilities of and risks to assets, (3) identify potential man-agement actions, (4) quantify the ‘effectiveness’ value of management actions,(5) determine costs of management actions, and (6) determine an optimal set ofmanagement actions given costs and budget constraints.
Nepal has already achieved success in the management and conservation of bio-diversity by integrating social, economic and environmental values in its policies.Nepal’s conservation policies have transformed from ‘people exclusionary’ and

316 K. Roka
‘species focused’ towards ‘people-centered and community based’ in recent years(DNPWC 2017). The government of Nepal amended its National Park and WildlifeConservation Act of 1973 to allocate 30–50% of the total revenue from parks andconservation areas into local community development. Communities, local author-ities, and civil society organizations are now directly involved in various activitiesto promote integrated and long-term conservation management. To manage the pro-tected areas, the government of Nepal has collaborated with international organiza-tions like the International Union for Conservation of Nature (IUCN) and the WorldWildlife Fund (WWF). In the global platform, Nepal is a party and or a signatory tointernational treaties like Convention on Biological Diversity (CBD), Convention onInternational Trade in Endangered Species ofWild Fauna and Flora (CITES), GlobalTiger Fund (GTF), Ramsar, South Asia Wildlife Enforcement Network (SAWEN),United Nations Educational, Scientific and Cultural Organization (UNESCO)WorldHeritage Convention (DNPWC 2017). The community forestry program has proveneffective in mitigating climate change by sequestrating carbon and in regulatingweather patterns (Pandey et al. 2016; Khanal et al. 2017). The community forestryprogram’s success suggests that any conservation efforts in Nepal should be inte-grated with the people’s livelihood. Promoting biodiversity conservation in the agri-culture sector can be effective in emulating participatory conservation outside theforestry sector.
Since agriculture is the mainstay for majority of the Nepalese, this sector shouldbe protected from the adverse impacts of climate change. To do that the governmentpolicies should integrate agro-biodiversity into its planning and assist farmers withtechnical andfinancial resources to continue producing food for the future.Additionalbenefits of agro-biodiversity and agro-ecosystems will help with climate changemitigation, biodiversity conservation, and water conservation.
At the local level, this requires farmers participation in the decision-making pro-cess. Improving current practices of in situ conservation of crop and livestock geneticresources, using local seeds and research and promotion of adaptive traits of localcrops are ways to help farmers. It is crucial to make usable knowledge accessible tofarmers, make policies more sensitive to smallholder farmers, and create incentivesfor private sector to promote climate-smart agriculture (Poudel 2017). The climate-smart agriculture approach can be used to increase ecological diversity by helpingfarmers to plant new crops and seeds, build home garden, practice mixed farming,establish community seed banks, and multi-use water systems (Poudel et al. 2017).Other local level strategies include planting native grass, constructing water holes,rainwater harvesting and monitoring of distribution and shift of trees (Aryal et al.2014). These activities will not only sustain livelihood options but also conservebiodiversity.
Managing biodiversity under climate change is challenging for a poor country likeNepal. One of the biggest obstacles to Nepal’s climate agenda is funding. Currently,nearly 55% of the total climate change expenditure comes from donor support (Nepal2012). Even though the national government has increased the budget for climatechange, it is only 10.34%of the total budget. Of the different programs, nearly 45%of
Promoting Climate Agenda and Biodiversity Conservation … 317
the climate change expenses were allocated for forests and biodiversity conservation(Oxfam 2014). These programs are already having an impact on climate changeadaptation and mitigation as evident a recent project.
Success Story: Hariyo Ban Project
In August 2011,WWFNepal initiated one of the largest, most complex conservation,development and climate change projects in the country (Seiff 2017). Hariyo Ban(green forest), a $40 million project funded by the USAID was implemented inpartnership with CARE, the Federation of Community Forest Users Nepal, and theNational Trust for Nature Conservation. It was designed at the landscape-level asa community-driven approach to conserving biodiversity and assisting people toadapt to climate change and mitigate greenhouse gas emissions by storing carbon.It covered two major landscapes: the Chitwan-Annapurna Landscape (CHAL) andTerai Arc Landscape (TAL). Initial assessment by WWF found the CHAL was morevulnerable to climate change and people in the area suffered from landslides, cropfailures and changes in rainfall patterns. For five years, the Hariyo Ban worked withthousands of local people and Nepal’s government to mitigate climate change. Itclaims to have sequestrated an estimated 3.7 million tons of carbon emissions in theforests (Netra Sharma, USAID).
The success of the project is visible from the size of the land area conserved,the climate change adaptation activities undertaken, and biodiversity conservationachieved (Table 3). The project’s success offers hope for Nepal to come out frombeing one of the most vulnerable nations to a successful example of mitigationand adaptation to climate change. As one participant in the project said, “beforeHariyo Ban, the forest was very thin, after we started to take care of the forest,conservation improved, and the forest has becomedenser.”The chief operating officerof WWF, Marcia Marsh, summed up the project’s success as being both social andenvironmental.
Biodiversity conservation is a multipurpose objective. It can serve as a bufferduring extreme climate and weather events like rainfalls, droughts, storms, and land-slides. Conservation of resilient and disease resistant plants, livestock breeds, andfish will tackle food insecurity and empower local communities. Promoting agro-biodiversity will foster soil microorganisms and maintain soil’s physical and ecolog-ical health, ultimately improving soil fertility. Integrating biodiversity conservationin urban planning will contribute to sustainable human settlements. Even in urbanareas, healthy ecosystems canprovide protection and resilience fromextremeweatherevents and disasters (CBD 2017). Overall, ecosystem-based approaches contributeto all SDGs to achieve social, economic and environmental targets. Specifically, bio-diversity conservation is key to mitigation and adaptation efforts for countries likeNepal. This will also fulfill Nepal’s commitment to climate change at the global level.

318 K. Roka
Table 3 Hariyo Ban’s success in numbers (Seiff 2017)
Biodiversity conservation Sustainable landscapes Climate change adaptation
1. 61,244 people benefitingfrom economic activitiesincluding skills training,agriculture, and greenenterprises like beekeeping,growing broom grass, andcardamom plantations2. 201 community-basedantipoaching units establishedand mobilized3. 32,727 members ofcommunity natural resourcemanagement groups engagedin biodiversity conservation4. 131.7 miles of electricfencing erected to reducehuman-wildlife conflict5. 485 community learningand action centers establishedor strengthened to increaseparticipation6. 18 key plant and animalspecies benefiting fromincreased research,monitoring, and conservationefforts
1. 167,807 acres restoredthrough improved wetland andgrassland management, andfencing to control livestock2. 7136 acres of new forestplantations3. 2 payments for ecosystemservices projects implementedin the Phewa and Marshyangdiwater catchments4. 10 policy documents onforest management andproducts, biodiversity, andclimate mitigation supportedby Hariyo Ban5. 147,375 people benefitingfrom alternative energysources. This includes:6. 18,929 improvedcookstoves7. 6143 biogas units
1. 18,392 people trained inclimate change adaptationstrategies2. 421 climate adaptation plansprepared activities supportedunder these plans include:3. 359 drinking water supplysystems installed and/ormaintained4. 156 irrigation systemsinstalled/and or maintained5. 85 miles of foot trailsmaintained6. 81 wildlife watering holesmaintained7. 414 check dams, dykes, andembankments constructed8. 367,407 people withincreased awareness of,capacity for, and/orparticipation in adaptationactivities
Ecosystems such as forests, rangelands, croplands, peatlands andwetlands represent globallysignificant carbon stores. Their conservation, restoration and sustainable use is included asa part of many Intended Nationally Determined Contributions, and is therefore a criticalelement for the fulfilment of the Paris Agreement under the United Nations FrameworkConvention for Climate Change, a global commitment toward the mitigation of dangerouschanges to the Earth’s atmospheric temperature and climate system. (CBD 2017)
Implementing the climate agenda for biodiversity and INDCs objectives in Nepalfaces many challenges. First, there is a dearth of capacity at all levels of the bureau-cracy that does not understand how potentially detrimental the impacts of climatechange would be on the economy. Second, the heavy dependence on subsistenceagriculture puts many farmers at risks from small changes (both positive and neg-ative) in the environment. Third, the topography presents challenges for potentialadaptation process. The isolation created by the geography affects mobilization ofresources and technology for adaptation and mitigation. Fourth, rapid urbanizationhas pushed the government to the brink to fulfill the needs of the people. Furthermore,urban expansion into ecological sites and pressure on the local environment imposenewer challenges to adaptation. Fifth, a history of institutional failures and politicalinstability, both at the national and local level, will hinder effective adaptation andimplementation of policies. This has led to high turnover of government staff, reorga-

Promoting Climate Agenda and Biodiversity Conservation … 319
nization of public institutions, and ineffective coordination and collaboration amongpolitical parties and interest groups. Sixth, climate change and biodiversity conserva-tion have not been an issue during elections. Only three parties had included climatechange in their manifesto and development associated activities like constructionand production dominated the manifesto of all political parties in the local electionof 2017. To overcome the above challenges, this paper proposes the local govern-ment play a larger role in creating locally feasible adaptation and mitigation plansfor climate change. Biodiversity conservation should be an integral component ofall plans as it is the cost-effective strategy that is already widely practiced and hasproduced successful results on climate change. Therefore, the paper recommendsthe following to the local governments of Nepal:
(1) Address the impacts of climate change on biodiversity by investing on timelyactions to reduce further biodiversity loss;
(2) Plan and implement ecosystem-based approaches to tackle current and futureclimate change impacts;
(3) Develop education and awareness programs for the public on the importance ofbiodiversity for climate change adaptation, mitigation and disaster risk reduc-tion;
(4) Recognize the role of protected and conservation areas in climate change adap-tation, mitigation and disaster risk reduction;
(5) Promote ecosystem-based approaches in rural and urban areas;(6) Use existing tools and techniques to enhance ecosystem-based approaches and,
where necessary, refine these tools and techniques; and(7) Ensure climate change adaptation, mitigation and disaster risk reduction activ-
ities include indigenous and local knowledge and benefits them.
Conclusion
The main objective of this paper was to discuss the relationship between climatechange and biodiversity in Nepal, and how local governments can mitigate someof the impacts by integrating biodiversity conservation in their governance. Underthe current and future scenario, climate change will have immeasurable impactson Nepal’s biodiversity. Ecosystems and communities at higher elevations will bemost affected from environmental change. This gives the newly elected local govern-ments a window of opportunity to develop and implement policies that will promotebiodiversity conservation and tackle climate change. The focus on governance isimportant as past and existing policies to tackle climate change were poorly imple-mented. In addition, good governance is fundamental to make progress in adapting toclimate change and mitigate its impacts. The newly elected local government offersexcellent opportunity to carve a path towards a future where economic, social andenvironmental values are equally considered. The paper focused on one of the manyways to mitigate climate change- promoting biodiversity conservation. Furthermore,

320 K. Roka
Nepal can use its experience with participatory resource governance towards climatechange mitigation and adoption. The paper offers the following prospects for thefuture: capacity building of local governments, integrating relevant SDGs in localplanning, strengthening collaboration between local and national government for bio-diversity conservation, and seeking international support to design and implementconservation programs for climate change mitigation and adaptation.
There are ample policies and strategies developed by the government, NGOs andINGOs to address climate change in Nepal. However, translating those policies intotangible actions with funding and skilled human resources is a challenge (Poudel2017). Failing to implement a successful mitigation strategy would affect achieve-ment of other objectives related to human health, food security, biodiversity, localenvironmental quality, energy access, livelihoods and equitable sustainable devel-opment (IPCC 2014a, b). Importantly, biodiversity conservation will assist Nepalto achieve its SDGs. Therefore, increasing efforts to mitigate and adapt to climatechange implies a concerted effort through interactions and connections among humanhealth, water, energy, land use, and biodiversity. To do this the national and localgovernments could collaborate with the many bilateral and multilateral organiza-tions working in Nepal, and connect with the international community. Not actingto mitigate climate change would irreversibly damage the ecosystem of Nepal.
Nepal is already a leader in participatory conservation practices. The communityforestry program’s success in restoring forests should be applied towards climatechange mitigation and biodiversity conservation. The diversification of participa-tory practices will conserve species and support livelihoods. As the senior climatechange expert with theWWF said, “you can’t do good conservation, without learningfrom the people who live there and helping meet their needs” (Seiff 2017). Futureconservation practices need public participation in urban and rural areas. The rapidurbanization in Nepal could result in an increase in GHGs through consumption andland conversion; therefore, the future cities should be sustainable with lots of greenspaces, biodiversity refuges, and powered by renewable energy. Climate change,therefore, offers an opportunity for the local governments to commit to biodiversityconservation and make Nepal an example of successful of climate change mitigationand adaptation in the region or probably in the world.
References
AbrahmsB,DiPietroD,GraffisA,HollanderA (2017)Managing biodiversity under climate change:challenges, frameworks, and tools for adaptation. Biodivers Conserv 26:2277–2293
Alo C A, Wang G I (2008) Potential future changes of the terrestrial ecosystem based on climateprojections by eight general circulation models. J Geophys Res Biogeosci 113(16). https://doi.org/10.1029/2007jg000528
Aryal A, Brunon D, Raubenheimer D (2014) Impact of climate change on human-wildlife-ecosystem interactions in the trans-Himalaya region of Nepal. Theor Appl Climatol 115:517–529

Promoting Climate Agenda and Biodiversity Conservation … 321
Baccini A,WalkerW, Carvahlo L, FarinaM, Sulla-Menashe D, Houghton R (2015) Tropical forestsare a net carbon source based on new measurements of gain and loss. Science. https://doi.org/10.1126/science.aam5962
Bellard C, Bertelsmeier C, Leadley P, Thuiller W, Courchamp F (2012) Impacts of climate on thefuture of biodiversity. Ecol Lett 15:365–377
Bhattacharjee A, Anadón JD, Lohman DJ, Doleck T, Lakhankar T, Shrestha BB, Thapa P, DevkotaD, Tiwari S, Jha A, Siwakoti M, Devkota NR, Jha PKKrakauer NY (2017) The impact of climatechange on biodiversity in Nepal: current knowledge, lacunae, and opportunities. Climate 5(80).https://doi.org/10.3390/cli5040080
Bosch J, Carrascal LM, Duran L (2007) Climate change and outbreaks of amphibian chytridiomy-cosis in a montane area of Central Spain, is there a link? Proc R Soc B 274:253–260
CBD (2017) Biodiversity and the 2030 agenda for sustainable development: technical note. Conven-tion on biological diversity. https://www.cbd.int/development/doc/biodiversity-2030-agenda-technical-note-en.pdf
CDKN (2017) Nepal’s climate and development. In: Stories of change from CDKN: Nepal specialedition, March 2017. Climate and development knowledge network, London
Chalise SR, Shrestha ML, Shrestha BR (1996) Climatic and hydrological atlas of Nepal. ICIMOD,Kathmandu, Nepal
DFRS (1999) Forest resources of Nepal 1987–1998.Ministry of forest and soil conservation. DFRS,Kathmandu, Nepal
DFRS (2015) State of Nepal’s Forests. Forest Resource Assessment (FRA) Nepal, Ministry ofForest and Soil Conservation: Kathmandu, Nepal
DNPWC(2017)Management effectiveness evaluation of selected protected areas ofNepal.Ministryof Forests and Soil Conservation, Department of National Parks and Wildlife Conservation,Kathmandu, Nepal
Forrest JL, Wikramanayake E, Shrestha R, Areendran G, Gyeltshen K, Maheshwari A, MazumdarS, Naidoo R, Thapa GJ, Thapa K (2012) Conservation and climate change: assessing the vulner-ability of snow leopard habitat to tree line shift in the Himalaya. Biol Conserv 150:129–135
Gaire NP, Dhakal YR, Lekhak HC, Bhuju DR, Shah SK (2011) Dynamics of Abies spectabilis inrelation to climate change at the tree line ecotone in Langtang National Park. Nepal J Sci Technol12:220–229
Gautam AK (2008) Climate change impact on Nepalese agriculture and strategies for adaptation.In: Paper presented in NAPA workshop organized by LI-BIRD and Biodiversity International.12/23/2009. LI-BIRD, Pokhara, Nepal
GoN (2014) National biodiversity strategy and action plan: 2014–2020. Government of Nepal(GoN), Ministry of Forests and Soil Conservation, Kathmandu, Nepal
GoN (2016) Intended nationally determined contributions (INDC): communicated to the UNFCCCSecretariat in February 2016. Ministry of Population and Environment, Government of Nepal,Kathmandu, Nepal
IPCC (2007) The fourth assessment report of the Intergovernmental panel on climate change. IPCC,Geneva, Switzerland
IPCC (2014) Climate change 2014 synthesis report: summary for policy makers. IPCC, Geneva,Switzerland. https://www.ipcc.ch/pdf/assessment-report/ar5/syr/AR5_SYR_FINAL_SPM.pdf
IPCC (2014a) The IPCC’s fifth assessment: what’s in it for South Asia? Climate and developmentknowledge network. https://cdkn.org/wp-content/uploads/2014/04/CDKN-IPCC-Whats-in-it-for-South-Asia-AR5.pdf
Jeeban P, Dahal P, Shrestha ML, Aryal S, Krakauer NY, Pradhanang SM, Lakhankar T, Jha AK,SharmaM, Karki R (2015) Spatial and temporal variability of rainfall in the Gandaki River Basinof Nepal Himalaya. Climate 3:210–226
Khanal DR, Rai M, Onta A (2017) Community conservation in Nepal contributes to meeting Aichibiodiversity targets and sustainable development goals. Forest Cover 53:3–6. http://globalforestcoalition.org/wp-content/uploads/2017/11/forestcover-53-EN-low.pdf

322 K. Roka
Khatri TB (2010) Conservation governance in Nepal: protecting forest biodiversity and people’slivelihoods. Unasylva 236(61):34–40
Koirala A, Shrestha KB (2014) Effects of climate change on the livestock population in mustangdistrict, Nepal. Asian J Agric Dev 14(1):37–49
Lo V (2016) Synthesis report on experiences with ecosystem-based approaches to climate changeadaptation and disaster risk reduction. Technical Series No. 85. Secretariat of the Convention onBiological Diversity, Montreal
McCain CM, Colwell RK (2011) Assessing the threat to montane biodiversity from discordantshifts in temperature and precipitation in a changing climate. Ecol Lett 14:1236–1245
Mendez JM (2007) Nepal biodiversity resource book. Kathmandu, Nepal, ICIMODMoE (2010) National adaptation programme of action (NAPA) to Climate change, Ministry ofEnvironment, Government of Nepal, Kathmandu, Nepal
MoFSC (2002) Nepal biodiversity strategy. Government of Nepal, Ministry of Forests and SoilConservation, Kathmandu, Nepal
Nepal G (2012) Climate finance and Nepalese perspective. In: Devkota DC, Uprety BK, BhattaraiTN (eds) Climate change and UNFCCC negotiation process. Ministry of Science, Technologyand Environment, Kathmandu, Nepal
Oxfam (2014) Climate change adaptation finance in Nepal. Oxfam Nepal Country Office, Kath-mandu, Nepal
Pandey SS, Cockfield G, Maraseni TN (2016) Assessing the roles of community forestry in climatechange mitigation and adaptation: a case study from Nepal. For Ecol Manage 360:400–407
Parmesan C, Matthews J (2005) Biological impacts of climate change. In: Groom M, Meffe GK,Carroll CR (eds) Principles of conservation biology, third. Sinauer Associates Inc, Sunderland,pp 333–354
Peterson GD, Cumming GS, Carpenter SR (2003) Scenario planning: a tool for conservation in anuncertain world. Conserv Biol 17:358–366
Poudel B (2017) Scaling up climate-smart agriculture in Nepal. Stories of change from CDKN. In:Khanal RC, Rais Z, Khan HR (eds) Outlook: Nepal special edition. CDKN, London. https://cdkn.org/wp-content/uploads/2017/03/NEPAL_Outlook_Web-final-10Mar17.pdf
Poudel, Bikash, Khanal R C, KC A, Bhatta K, Chaudhary P (2017) Climate-smart agriculture inNepal: champion technologies and their pathways for scaling up. Policy Brief. CDKN, London
Pradhan P (2017) Scaling up climate-smart agriculture in Nepal. Stories of change from CDKN.In: Khanal RC, Rais Z, Khan HR (eds) Outlook: Nepal special edition. CDKN, London. https://cdkn.org/wp-content/uploads/2017/03/NEPAL_Outlook_Web-final-10Mar17.pdf
Seiff A (2017) Adapting to climate change in Nepal: a bold partnership led by Nepal’s people makesstrides in the climate-vulnerable country. World Wildlife Mag, Spring 2017. https://www.worldwildlife.org/magazine/issues/spring-2017/articles/adapting-to-climate-change-in-nepal
Shah RDT, Sharma S, Haase P, Jähnig SC, Pauls SU (2015) The climate sensitive zone along analtitudinal gradient in central Himalayan Rivers: a useful concept to monitor climate changeimpacts in mountain regions. Clim Chang 132(2):265–278
Shrestha UB, Bawa KS (2014) Impact of climate change on potential distribution of Chinese cater-pillar fungus (Ophiocordyceps sinensis) in Nepal Himalaya. PLoS ONE 9(9):e106405
Shrestha UB, Gautam S, Bawa KS (2012) Widespread climate change in the Himalayas and asso-ciated changes in local ecosystems. PLoS ONE 7(5):e36741
Song M, Zhou C, Ouyang H (2004) Distributions of dominant tree species on the Tibetan Plateauunder current and future climate scenarios. Mt Res Dev 24:166–173
Thapa GJ, Wikramanayake E, Jnawali SR, Oglethorpe J, Adhikari R (2016) Assessing climatechange impacts on forest ecosystems for landscape-scale spatial planning in Nepal. Curr Sci110:345
Tingley MW, Koo MS, Moritz C et al (2012) The push and pull of climate change causes heteroge-neous shifts in avian elevational ranges. Glob Change Biol 18:3279–3290

Promoting Climate Agenda and Biodiversity Conservation … 323
Uddin K, Chaudhary S, Chettri N, Kotru R, Murthy M, Chaudhary RP, Ning W, Shrestha SM,Gautam SK (2015) The changing land cover and fragmenting forest on the roof of the world: acase study in Nepal’s Kailash sacred landscape. Landsc Urban Plan 141:1–10
World Wildlife Fund (WWF) Nepal (2013) Chitwan-Annapurna LANDSCAPE: drivers of defor-estation and forest degradation. WWF Nepal Hariyo Ban Program, Kathmandu, Nepal

Climate and Biological Diversity: HowShould the Effects of Climate Changeon Biological Diversity Be LegallyAddressed in Internationaland Comparative Law and Solutions?
Sergio Peña-Neira
Abstract International treaties and declarations on climate change have focusedalmost exclusively on sources of climate change neglectfully the consequences onbiodiversity the ultimate foundation for life on Earth. Although extremely appro-priate, such approach neglect to the consequences of climate change on biologicaldiversity and on their components (animals, plants, insects, microorganisms andhabitats) almost condemned to disappear due their impossibility to move or adapt.Therefore, a lack of legal rules in international law has arisen due to lack of inter-national legal framework to address loss biodiversity by conserving it in a mixtureof forms of conservation. An example is reflected in “climate change and the law”a report of the Argentine Association of Comparative Law to the XVIII Congressof the International Academy of Comparative Law (author Professor Erkki Hollo).In this report, consequence of climate change on the biological diversity has notbeen addressed due to lack of legal rules (among other reasons). Sustaining agricul-ture and agrobiodiversity to maintain food production for human beings is part ofthe “ecosystem services” of biodiversity that have been completely forgotten whenthe consequences of climate change has not been properly addressed. In order tofill scientific gap grounds from natural science and juridical sciences particularly,international law will be explained in this article arguing for preventive measuresto save biodiversity in danger. It is a conceptual paper as most of our work in sci-ences. First the paper will establish not only the relationship between n the effects
S. Peña-Neira (B)Society and Health Research Centre—Facultad de Humanidades, Universida Mayor (Chile),Campus Alonso de Córdova, Badajoz 130 of 1403, Las Condes, Santiago, Chilee-mail: [email protected]; [email protected]; [email protected]
S. Peña-NeiraUniversity of Cambridge, Brandon Research Fellow, Lauterpacht Research Center forInternational Law, 5 Cranmer Rd, Cambridge CB3 9BL, UK
© Springer Nature Switzerland AG 2019W. Leal Filho et al. (eds.), Handbook of Climate Change and Biodiversity,Climate Change Management, https://doi.org/10.1007/978-3-319-98681-4_20
325
326 S. Peña-Neira
of climate change on biodiversity for legal scholars but solutions to the problem willbe discussed. Most of the literature on the subject seems to lack the importance ofinternational law and public policy on facing the aforementioned problem and it isnot possible to “act” without legal rules.
Introduction
Focusing on destruction of biodiversity due to consequences of changes in climate bya lack of legal rules is basic because knowing legal solutions against destruction ofbiodiversity by climate change might be a contribution to prevent such annihilation.Reasons for such lack are not clear but maintaining such lack of legal rules mightbe extremely costly due to biodiversity loss including unknown species and their“ecosystem services”.
Lambers has depicted in a serial of warrants this problem: “Move, adapt or perish.(…) Species may face extinction if habitat sizes shrink (for example, at the pole or atmountain points) (…), or if immigration barriers (D) or limited dispersal ability (…)prevent them from reaching newly suitable habitat” (Lambers Ris 2015). In certaincases, some species are “migrating” to other places.However, such amigration shouldbe under help of law by promoting conservation of species or allowing movement ofmembers of these species (Hurlbert 2015; Araújo 2015) or encouragingmovement ofbiodiversity by human beings to conserve it in different but safer places. A procedureof interpretation of current legal rules or enactment of international legal rules arebasic forms of solving a lack of rules.
Certainly, biodiversity plays a key role on giving human beings quality of life.The reasons for prevention and content of effects of climate change on biodiversity isthat a large amount of our needs as specie is intimate related to biodiversity and it ispossible to human beings to adapt to the effects of climate change but is uncertain forbiodiversity itself. Without such adaptation, most probably, biodiversity will perishand as human beings, we will not be able to sustain the needs of food of an ever-increasing population. Further, it is necessary to establish not only the connectionin international legal rules but to define certain basic possibilities for solving thelegal gap. What it is much more important, connections between climate change andbiodiversity has been addressed since the 1960s (e.g. Rachel Carson’s books silentspring, to mention one of many titles) (Carson 1962) but we have not been able toconsider such relationship together. Supposedly this was the basic feature, the basicrationale behind both aforementioned international treaties and considering the bookof Carson this should be the main focus of international research but still there is nottransdisciplinary and interdisciplinary research on climate change. This article mightbe a first step not only to discuss the topic but to propose certain solutions, legally, andof course, in public policy aiming to consider further research from natural scientists.
Some solutions seems to be impossible, for example: (1) biodiversity corridors(however, they would create international troubles as well as national one relatedto problems of speed of biodiversity and capacity to define places in which this

Climate and Biological Diversity: How Should the Effects of Climate … 327
diversity might have opportunity to survive. The problem is not only at species levelbut at ecosystems, habitats and other levels). (2) Our proposal is a combination onwhat has been the rule of law established in the Convention on Biological Diversity,conservation ex situ and in situ (Articles 7 and 8). In otherwords, a change of habitats,ecosystems and species from one place to another place considering informationfrom natural science. However, international environmental governance (Galaz et al.2012) still has not solved this issue, for example Conventions on Biological Diversityand on Climate Change and even the recent Paris Agreement has not addressed theproblem.
(I) Conventions
In general terms legal norms expresses policy on a subject. As far as biodiversityand climate change are concerned, international policy has been expressed by largegroups of States in international legal rules: conventions on biological diversity andclimate change.
The Convention on Biological Diversity (ONU 1992a) aims conservation ofgenetic resources by establishing conservation or ex situ or in situ in articles 8 and9 of this treaty (ONU 1992a). On the other hand, the Framework Convention onClimate Change (ONU 1992b) has not addressed the effects of climate change onbiodiversity. Even recent convention, the Paris Agreement has included internationalrights and obligations on the subject and only a reference has been placed in paragraph14th of the Preamble (ONU 2015). However, the Convention on Biological Diversityhas included an article generating a solution based on interpretation of internationallegal rules. Article 22 expressly prevent conflicts with rights and obligations statedin other treaties unless exercising them might bring negative consequences for bio-diversity (ONU 1992a). Negative consequences like disappearance or great damagefor biodiversity would be possible, therefore a common interpretation in which notonly sources for climate change should be addressed but consequences too.
(II) Lack of Legal Rules on Conservation Vis a Vis Effects of Change of Climate
As pointed out already, the Convention on Biological Diversity (ONU 1992a) andthe Framework Convention on Climate Change (ONU 1992b) have different aims.Wewill call them “static”. They rule or conservation, sustainable use or utilization ofgenes’ from individual in species and even conservation of individuals and speciesas well as their technological change (ONU 1992a) or sources of the effects of thechange of climate. Theywere not established to address in a properway consequencesfor biodiversity arising from effects of the change of climate and other sources.
In 1992 rules in both conventions were considered sufficient to solve the prob-lem (Conserving genetic resources and biodiversity and diminishing CO2): a clearapplication internationally and nationally of both conventions would diminish nega-tive effects of climate change on biodiversity. Even internationally such combinationof conventions have not been considered properly and it is far from solving suchproblem.
The lack of legal rule is based on change of conditions as consequence of climatechange and the need of new sites of individuals or species and even ecosystems.
328 S. Peña-Neira
As already pointed out, one pressing problem is disappearance of natural habitatsof individuals, species or ecosystems due to climate change effects’. Therefore,such change might be developed on individuals’ or species’ own decision based ondetection of negative effects of change of climate and promoting such behaviour.Such movement might be developed with or without help of human beings.
“Biodevastation” by illegal traffic of species is another direct threat to animalsand, at the same time, an indirect threat to plants, insects and microorganisms. Directthreat means devastation of one species of animals provoking loss of one part ofthe trophic chain and, at the same, an increasing number of other animals, evenplants and insects due to the loss of this specie (Bellard 2012). Illegal trafficking ofcertain species and even illegal traffic of parts or pieces of exemplars of a speciehas increased. As pointed out by a recent report species in the Red List of CITES(International Convention of Trade of Endangered Species) are likely to disappear ifsuch traffic would not detain (ONU 2016). This “biodevastation” is a further attackagainst biodiversity making more difficult to safe it against the climate change.
(III) Scientific Elements from a Pure Natural Science Viewpoint (Aspects of Bio-diversity Conservation and Destruction)
One author expresses that “anthropogenic climate change can alter interspecific inter-actions and produce unexpected changes in species distributions, community struc-ture, and diversity.” (Harley 2011). The statementmakes clear negative consequencesto biodiversity due to Climate change of anthropogenic source (Bateman et al. 2013).
Although conventions on conservation, international agreements, have beenenacted not much understanding of normative legally binding system has been devel-oped. Clear examples are “effectiveness”, “amount of treaties”, “scope and partici-pation” without including political willingness to define absence of effectiveness ofthese international treaties. The importance of international treaties is related to afirst step in order to achieve conservation of natural resources.
(a) The General Effects on Biodiversity (IPCC)
In 2003 the Secretariat of theConvention onBiologicalDiversity addressed effects onbiodiversity of climate change (Secretariat of the Convention on Biological Diversity2002). As well, in 2002 The Framework Convention on Climate Changes has con-fronted this problem (Gitay et al. 2002). Expected and specific effects on biodiversitywere, among others, poleward or upward movements of climatic range, extinction,replacement or change of existing ecosystems at the ecosystem or landscape scale,change of productivity of certain crops (upward or downward) (Secretariat of theConvention on Biological Diversity 2002). Further, the atmosphere is changing dueto concentration of greenhouse gases provoking that temperature has increased in theglobal mean surface, earth and sea (Gitay et al. 2002) swelling the temperature onbiological system during the 20th Century, changing “the timing of biological events(phenology), species distribution and streamflow, floods, droughts, water tempera-ture and water quality and high latitude ecosystems in the Northern Hemisphere,”and increasing “frequency and intensity of outbreaks of pests and diseases”, affecting
Climate and Biological Diversity: How Should the Effects of Climate … 329
adversely coral reefs, ecosystems with diseases and toxicity, fish populations (Gitayet al. 2002). Such consequences has been described by some as affection of humanwell-being due to destruction or affection of “ecosystem services” (Watson et al.2005).
It is possible to find as framework of this research a lack of legal rules in conservingbiodiversity (due to negative consequences of climate change on biodiversity) as oneof the reasons for this problem.Aswell, climate change onmarine biodiversity shouldbe addressed due to increasing problems in the subject (Galaz et al. 2012). On theother hand, researchers have developed few answers: Acclimation capacity of plantsand animals as well as “topography and ‘microclimatic buffering’” are elementsaltering conclusions ofmanymodels on destruction of biodiversity by climate change(Wilis and Bhagwat 2009). Topography seems to be themain problem not consideredin earlier models (Wilis and Bhagwat 2009). Further, “habitat heterogeneity resultingfrom topographic diversity might be essential” for conservation of biota (Wilis andBhagwat 2009). Even high impact of CO2 in the atmosphere might create a positiveoutcome in the Amazonas, maintaining main features of the area as explained byHoorn et al. (2010) because biomes or “remain the same” or might be “substituteby wetter or more productive biomass” but only if dry season is not extended than4 months (Wilis and Bhagwat 2009). In this view, the level of extinction diminished(Wilis and Bhagwat 2009). Certainly, it is necessary to agree that complexity anduncertainty on the kind of extinction is currently present. However, it seems necessarynot only to research but, more than this, to prevent extinction from more specificspecies and individuals without the capacity to move from one place to another.
Legally speaking some scholars has addressed the subject, most notably Morgera(2011, 2012) and Hodas (2005). What must be emphasized is that decisions in theConference of the Parties of the Convention on Biological Diversity are not legallybinding (ONU 1992a). Article 23 of the Convention of Biological Diversity has notestablished legally binding decisions of the Conference of the Parties. Certainly,the acceptance of protocols, amendments, annexes and even subsidiary bodies hasbeen included in the competence of the Conference of the Parties. However, a directamendment other orders included in decisions of the conference are far from obliga-tory. “Moratoriums of geoengineering” (Morgera 2011, 2012) are not internationallylegally binding. Certainly, everyone might agree that rules in the Convention on Bio-logical Diversity might be helpful for diminishing negative effects on biodiversity(Morgera 2011), however, theywere “designed” to achieve the goals of the conventiontherefore their broadness in the area of conservation includes effects of contamina-tion, illegal trade, etc. Further, all the legal rules in the Convention on BiologicalDiversity has established international rights and international obligations. Thinkingcontrary might derived in negative consequences for all treaties of the world. TheVienna Convention on the Law of Treaties (1969) developed international rights andinternational obligations as consequence of the entry into force of the Treaty (article26) and to third parties (articles 35 and 36). Certainly, from a pure governance view,treaties might be considered in a different way, for example, as indications on how tobehave. However, parties are obliged to comply their international obligations, they

330 S. Peña-Neira
have to honoured them and use these international obligations as indications. Theyhave to implement them in a narrow sense, apply them.
Therefore, it is possible to explain that negative effects on biodiversity from cli-mate change depend on various factors related to features of Earth’s surface. Further,it is necessary, for legal enactment of rules to consider legal quality of Decisions.They are just outcomes of the Conference of the Parties without legally binding rules.
(b) The Specific Effects on Biodiversity
It is possible to find examples of negative consequences to biodiversity. Some spe-cific cases will be explained, briefly however, it has been described earlier start ofbreeding, earlier migration of birds and insects, change of timing of breeding provok-ing a mismatch with food species creating a surplus of certain species and possibledisappearance of others due to lack of hunting and shortage of food (Gitay et al.2002).
(b.1) Change on Forests and Biodiversity
Bateman et al. (2013) has pointed out the negative consequences in biodiversity bythe effects of climate change when a change of the use of land should be made. In theUK National Ecosystem Assessment one of the main outcomes, methodologicallyspeaking, was the consequence of on “optimal land uses” (Bateman et al. 2013). All“scenarios”, six, using rule based approach, explain vast changes to land in England(Bateman et al. 2013). All scenarios will produce a change more or less negative andthe “best” case scenario is current pattern of use of lands but without an increasein productivity unless the CO2 increases (Bateman et al. 2013). However, this willprovoke a destruction of biodiversity derived from the extreme agricultural use of theland without a precise improvement in the quality of life of people. This conclusionmight be interesting for the UK’s agricultural sector, North in the Hemisphere, butnot for countries in the Southern part of the Northern Hemisphere or in the Northernpart of the Northern Hemisphere.
Boreal forests are almost 30% of the global area of forests and losing them willcreate large gaps on ecosystem services (Gauthier 2015). On a regular base they areat high latitude (Northern or Southern Hemispheres). They are accustoming to strongwinters with snow and low temperatures providing wood and shelter against windand other services like conservation of animals, plants and microorganisms as wellas the protection of water flows. They have large biodiversity between the speciesof trees even a “high population-level genetic diversity” (Gauthier 2015). Humansare provoking the creation of “extreme weather events” by very low profile events,even unperceived by human beings (Kerr 2007). Such events will change the currentenvironment of boreal forests. It is a matter of time facing environmental change anddisappearance of this forest.
On the other side of the world, rich biodiversity will disappear as consequence ofeffects of climate change, for example India, Brazil, South Africa (Mehdi 2010).

Climate and Biological Diversity: How Should the Effects of Climate … 331
(IV) Proposals for a Solution of the Destruction of Biodiversity
Solutions in Saving Biodiversity
Some proposals for solutions in saving biodiversity acknowledged the uncertaintyof the future of biodiversity (Hallegatte 2008) and might be explained shortly as firstknowing what is there and their distribution (Jetz et al. 2007) through knowledgeand later define which species to save and why. The “geography of life on earth” isextremely poor documented (Jetz et al. 2007). Therefore, it is needed further work onthismatter for example global tracking of animals, plants andmicroorganisms. Todayit is possible such tracking using international space stations following small animalsas a project (Pennisi 2013). However, the question remains, we do not know everysingle species of biodiversity. Further, we are not able to have even a small amount of“usable knowledge” (“data analysis and forecast”) and explanations (adapted fromKerr 2007) to takemeasures vis a vis conserving biodiversity. Such informationmighthelp to tackle specific ecosystems, animals, plants, insects and microorganisms orgeneral ecosystems but with specific aims saving those that might be in specific andnear danger like the one nearby shores in which the sea will be risen.
One proposal has been “passages” for biodiversity flows (CONAMA 2003). Con-sidering that such passageswould be establish from the shore to inland, biodiversity’sshore will flow through those corridors escaping from the rising sea. Certainly, suchidea was helpful in the beginning of the process of change of the climate. However,today is clear that degree and speed of change of species from one habitat to anotherone is low (Loarie 2009).
Another possibility is conserving species and even individuals of species ex situ,as established by the Convention on Biological Diversity. Unfortunately, it seemsnot enough considering the speed of climate change. Another possibility might beconservation in situ as established by the Convention on Biological Diversity. How-ever, it is clear that the change of the climate would affect all populations in areasunder threat of being changed by the effects of change of climate.
Legal or Normative solutions
(a) Harmonically Interpreting of Treaties
Treaties are in a legal system which might be considered an “International Ruleof Law”. Treaties do have legal rules establishing international obligations. Theseinternational obligations, in this case, obligation to conserve in situ or ex situ (ONU1992a)would be complemented in an evolutionary interpretation (InternationalCourtof Justice 2010; Peña 2015) to conserve biological diversity to be affected or alreadyaffected by the effects of climate change in situ and ex situ.
(b) Amendment of International Treaties
International treaties do have amendments ormight be complemented by new treatiesderived from old one. Clear examples are the Paris Agreement and Nagoya Protocol.It is possible in this point in time to define an extremely short international agreementto move entire ecosystems from one place to another place in the same country or in

332 S. Peña-Neira
a different one preserving rights of the State but promoting the conservation of thespecie or species.
(c) A General Treaty on the Environment
A treaty on the environment encompassing all aspects of the environment establishingrights and obligations might include the conservation of areas by provoking andpromoting change of species and individuals aiming conserving them, protectingthem from current and future predators and controlling them from increasing interms of population.
(d) Conservation Ex Situ and In Situ
This research is based on three assumptions, climate change provokes destruction ofbiological diversity, the change of place of biodiversity is a low race speed (extremelylow race due to natural difficulties to move from a niche and achieve a different one),and human beings might be able to change biodiversity from the original place toa place in which conditions might be suitable to prevent extinction by conservingthem. International legal rules are in place and it is just necessary to interpret themharmonically considering new problems for our biodiversity. Certainly, interpreta-tion of the Convention on Biological Diversity and the Framework Convention onClimate change should be in good faith. The evolution of the problems related toclimate change and biodiversity create the need to make a teleological approach anda preventive approach based on precaution and creating a positive legal frameworkfor a conservation of biodiversity that need to move from their own natural territoryto a new territory in order to be preserve should be established. Further work on theconcept of conservation ex situ and in situ is needed.
A Brief Reflection on Lessons Learned
Certainly, it is not enough to define a lack of international policies and internationaland national legal rules related to destruction of biodiversity and the possibility ofchange of certain representatives of habitats and ecosystems to places in which theymight survive such destruction. Such a lack exists and it is necessary to highlightit and to find legal solutions. However, the article has certain limitations; externallypolitical willingness is needed to take policy, legal and practical measures to addressthe problem as exposed, internally, the article cannot deal with all scientific refer-ences (in a broad scope of the word “scientific”) explaining the issue or discussingtraditional solutions and possible new problems. However, such large amount ofscientific knowledge has not come to a point in which political authorities wouldconsider solutions to this problem. A first step was more based on counting thebiodiversity than on saving biodiversity. Today counting and saving or saving forcounting is a more reliable concept.
Limitations, from a legal standpoint, one of the expression of public policy, cur-rent solutions have not been conceived. However, it is a real problem to be treated in
Climate and Biological Diversity: How Should the Effects of Climate … 333
a scientific form and strong enough as the problem of the consequences of climatechange almost 25 years ago. The discussion on the reality of climate change and theexperiences thereof were at the core of the academic and social communities at thattime. Today legal discussions should address more specific problems on the subjectotherwise we will continue loosing the war against the effects of climate changeon biodiversity (Cordonier-Seggier 2015). For example, legal rules permitting themovement of plant, animals, microorganisms, insects to safer areas. The movementby ex situ/in situ conservation to safer places. The definition of “safer places” byauthorities and scientist. Monitoring of these places and the evolution of the inter-relation of biodiversity in order to create habitats and ecosystems in safer places.Legal rights over land should be considered in order to apply old legal institutionsor to create new legal institutions.
The current solution of gene banks and other sources of protection is not enough.These solutions focus on the main elements of plants, animals, insects and microor-ganisms the genes. However, they are not focus on the main problem of interrelationsand even the idea of saving the life of these creatures. Certainly some of their inter-relations have been described but not all of them.
From a pure public policy standpoint solutions based on documentation relatedto the aforementioned problem are a good first step. However, even the EuropeanUnion has moved more on grassroots or local initiatives and not on national andinternational policies on the subject. Literature, on the other hand has not addressedthis topic mainly to a lack of knowledge or on concentration on other real problems.
Conclusion
Lack of international legal rules preventing or managing effects of climate change onconservation of biological diversity is visible but no international initiative has beendeveloped for negotiations on a treaty on the subject and the current internationaltreaties on climate change or biodiversity were not firstly enacted to face the problem.Traditional solutions like counting or saving genes from biodiversity are positive butinsufficient.
It is clear the current reality of the impact of climate change on biodiversity. Itmight be discussed destruction’s degree, time and other important elements. How-ever, measures under the framework of current international legal rules should betaken and re-interpretation of international treaties in a preventive, precautionary andconsistent manner or development of new international legal rules following theseideas would be necessary to reinforce grass roots solutions and scientific warning.One measure, interpretation or enactment, might be first extraction of biodiversity(ex situ conservation) to finally preserve it in survival places under protection andmonitoring (in situ conservation).
334 S. Peña-Neira
References
Araújo TLK (2015) Environmental law, public policies, and climate change: a social-legal analysisin the Brazilian context. In: Walter LF (ed) Handbook of climate change adaptation. Springer,Berlin, Heidelberg, pp 973–982
Bateman IJ et al (2013) Economic decision-making: land use in the United Kingdom. Science341:45, 46
Bellard C (2012) Impacts of climate change on the future of biodiversity, Ecolett 15(4):365–367Carson R (1962) Silent spring. Mariner Books, pp 5–130CONAMA (2003) Estrategia Nacional de Biodiversidad. Republica de Chile, Santiago de Chile, p589
Cordonier-Seggier MC (2015) Inaugural speech, Cordonier-Segger, Marie Claire, et al. conferenceon biodiversity, sustainable development and the law. University of Cambridge, p 1
GalazV et al (2012) Polycentric systems and interacting planetary boundaries-emerging governanceof climate change-ocean acidification-marine biodiversity. Ecol Econ 81:21–32
Gauthier S et al (2015) Boreal forest health and climate change. Science 349(6250):819–822Gitay H et al (2002) Climate change and biodiversity, Intergovernmental panel on climate change.Bonn, pp 16–24
Hallegatte S (2008) Strategies to adapt to an uncertain climate changes. Glob Environ Change240–247
Harley CD (2011) Climate change, keystone predation, and biodiversity loss. Science334:1124–1127
Hodas D (2005) Biodiversity and climate change, 3d Colloquium of the IUCN academy of envi-ronmental law. Macquarie University, Sydney, pp 2–4
Hoorn C et al (2010) Amazonia through time: Andean uplift, climate change, landscape evolution,and biodiversity. Science 330:927–931
HurlbertM (2015) Assessing the capacity of law to facilitate adaptation to climate change. InWalterLF (ed) Handbook of climate change adaptation. Springer, Berlin, Heidelberg, pp 708–720
International Court of Justice (2010) Argentina v Uruguay, Judgement, United Nations Organiza-tion. The Hague, pp 18–107
Jetz W et al. (2007) Project impacts of climate change on the global diversity of birds. PLoS biol1211–1219
Kerr RH (2007) Global Warming is changing the world. Science 316:188–190Lambers Ris JH (2015) Extinction risks from climate change. Science 348(6234):501Loarie SR et al (2009) The velocity of climate change. Nature 462(24/41):1052–1054Mehdi A (2010) Climate change and biodiversity: India’s perspective and legal framework. J IndianLaw Inst 52(3&4):343ss
Morgera E (2011) Faraway, so close: a legal analysis of the increasing interactions between theconvention on biological diversity and climate change law. University of Edinburg, School ofLaw, Working paper series, No 2011/05, pp 1–5
MorgeraE (2012)Noneed to reinvent theWheel for human rights-based approach to tackling climatechange: the contribution of international biodiversity law. University of Edimburg School of LawResearch Paper 2012/15, Edinburgh, 2015, p 6
ONU (1992a) Convention on biological diversity. Rio de Janeiro, articles 8 and 9ONU (1992b) Framework convention on climate change. Rio de Janeiro, articles 4 and 5ONU (2015) Paris Agreement, ParisONU (2016) World wildlife crime report, United Nations Office on Drugs and Crimes, New York,pp 3–11
Pennisi E (2013) Global tracking of small animals gains momentum. Science 334:1042Peña S (2015) La equidad en la utilización de los recursos genéticos naturales defendiendo losderechos de sujetos internacionales: interpretación y aplicación y derecho comparado, Huelva,pp 115–126

Climate and Biological Diversity: How Should the Effects of Climate … 335
Secretariat of the Convention on Biological Diversity (2002) Interlinkages between biologicaldiversity and climate change: advice on the integration of biodiversity considerations into theimplementation of the United Nations Framework Convention on Climate Change and its KyotoProtocol, Conference of the Parties to the Convention on Biological Diversity. Ad Hoc TechnicalExpert Group on Biological Diversity and Climate Change, Secretariat of the Convention onBiological Diversity, 2003|Montreal, Quebec, Canada, pp 3–7
Vienna Convention on the law of treaties (1969), United Nations Organizations, Vienna, articles26,35,36.
Watson R et al (2005) Ecosystem and human well-being, summary for decision makers, millenniumecosystem assessment. Island Press, p 3
Wilis K, Bhagwat SA (2009) Biodiversity and climate change. Science 326:806–807
Is Adaptation to Climate ChangeThreatening Forest Biodiversity?A Comparative and InterdisciplinaryStudy Case of Two French Forests
Timothée Fouqueray, Antoine Charpentier, Michel Trommetterand Nathalie Frascaria-Lacoste
Abstract France is highly covered by forests, upon which rely numerous jobs andnatural habitats. Therefore, the country adopted a strategy of adaptation to climatechange, leaning on a rich silviculture history to offer foresters various means to adapt(rotation shortening, species mixes, …). Still, different adaptations can be interest-ing in a given forest, depending on the trade-off between ecosystem services: timberproduction, biodiversity conservation, water quality preservation, … Hence, how doFrench foresters decide of the adaptation to implement?What are the impacts of theirchoices on biodiversity?The following explores howadaptation in thefield occurs—acomplementary approach of providing better understanding of the impacts of climatechange on forest biodiversity. It analyses how biodiversity is included in field adap-tations, and how this concords with guidelines of sustainable forestry. Results comefrom semi-structured interviews led in two French forests differing in anthropiza-tion, making use of ecology and geographic sciences. The analysis discriminates twonon-exclusive positions on biodiversity: “utilitarists” adapting thanks to biodiversityand “conservationists” adapting for biodiversity. Utilitarists rely on species selectionor introduction of allochtonous species to resist windstorms or biological attacks forinstance, a potential threat for local populations. On the opposite, conservationistsfavor Darwinian adaptation over interventionist strategies. Conservationists would
T. Fouqueray (B) · N. Frascaria-LacosteEcologie, Systématique, Evolution, AgroParisTech, CNRS,Université Paris-Sud, Université Paris-Saclay, 91400 Orsay, Francee-mail: [email protected]
A. CharpentierMaster Bioterre, Université Paris, Panthéon Sorbonne, 75005 Paris, France
M. TrommetterGAEL, INRA, CNRS, Grenoble INP, Université Grenoble Alpes, 38000 Grenoble, France
© Springer Nature Switzerland AG 2019W. Leal Filho et al. (eds.), Handbook of Climate Change and Biodiversity,Climate Change Management, https://doi.org/10.1007/978-3-319-98681-4_21
337

338 T. Fouqueray et al.
for example prioritize spontaneous evolution, at the risk of tree species running shortof time because of the speed of climate change. These results are integrated in a widerproject including natural parks managers for decision-taking in forest management.
Introduction: Adaptation to Climate Changein Multifunctional Forests
French forests are Europe’s fourth biggest forests (165,000 km2), most of thembeing deciduous (MAAF 2017). Integrating biodiversity conservation in adaptationto climate change (ACC) policies is of highest importance, because of the ecologi-cal interest of forest environments and because of a French customary tradition ofmultifunctionality of public forests. More than just a state of mind, forest multi-functionality is legally embedded and states that public forests must simultaneouslyserve for various ecosystem services such as timber production, recreational activi-ties and biodiversity conservation (Barthod 2015). This very peculiar context goeswith a legacy of systemic public forest management and monitoring inherited fromthe sixteenth century. The necessity to integrate biodiversity conservation along withother forest ecosystem services is one of French characteristics that is of high interestbecause such constraints are commonly shared in a wide variety of situations.
Yet, even if the French government launched ACC policies and funded researchprograms, a knowledge gap persists concerning actual measures taken in the field.Better documentation of what really occurs in French forests is therefore needed toavoid putativemaladaptation for forest biodiversity (Juhola et al. 2016). The rationaleof this paper is therefore to explore what foresters actually do in the field to adapt,and more precisely how biodiversity is included in field adaptations. Maladaptationcould indeed arise from utilitarian adaptations, when adapting thanks to biodiversityremains blind to Darwinian evolution (varietal selection ignoring climatic uncertain-ties, introduction of productive but invasive tree species,…). Additional issues mightalso stem from a conservationist strategy of adapting for biodiversity, with poten-tial prioritization of spontaneous evolution regardless of the time lag between treeDarwinian evolution and the speed of climate change (Corlett and Westcott 2013).Getting insights on how foresters behave when confronted to climate changes is keyto develop accurate incentives in public policies. This paper could be of particularinterest for informing both the 2018 renewal of France 4-years Mitigation Strategyand National Plan for Adaptation to Climate Change.
In the end, how do French foresters decide of the adaptation to implement? Whatare the impacts of their choices on biodiversity? In order to examine these issues,results from a field study depict how foresters consider biodiversity in their adapta-tions to climate change. We analyzed the collected mentions of ACC in the light of afew management principles for a sustainable forestry: avoidance of natural habitats

Is Adaptation to Climate Change Threatening Forest … 339
loss, maintenance of ecological connectivity, maintenance of forest heterogeneity(diversity of species, ages and successional stages), focus of management onto thelandscape scale, avoidance of forest-use intensification (Noss 2001; Lindenmayeret al. 2006; Brang et al. 2014).
Methodology: Framing an Interdisciplinary Study Case
To evaluate on-the-ground adaptations, we carried out individual semi-structured andopen-ended interviews in France during June and July 2017. Interviewees were pri-vate owners, officials frommunicipalities and central agencies, and forest managers.
Ecologists usually base their environmental analyses on the production and valida-tion of logical knowledge (Moon and Blackman 2014). Yet, ecological consequencesof ACC practices are due to human reasoning and motivations departing from objec-tive mechanisms. Hence, a constructivist method fits with the objective of exploringhow interviewees relate (or not) biodiversity conservation with ACC in forest man-agement (Kaufmann 2004). Each interview consisted of (i) a general description ofthe interviewee’s silvicultural practices, (ii) a description of the temporal evolutionof these practices and (iii) the interviewee’s opinion about brakes and levers to reachdesired silvicultural practices. If not spontaneously mentioned, we also asked whatwere their reactions following last decade’s natural disturbances, for instance Lothar-Martin windstorms in 1999 or 2003 droughts (Ministère de la Transition écologiqueet solidaire 2017).
Every interviewwas recorded, fully transcribed and qualitatively analyzed. Audiotracks and written transcriptions were analyzed using Sonal, an encoder-softwareconducting audio-textual synchronization. Sonal allows for thematic and statisticdiscourse studies, such as topic occurrences and/or co-occurrences (e.g. “loggingpractices” and/or “forest uses”) (Nicolas 2013). To be considered as an ACC, aninterview sample should mention the expression of a change in forest managementpractices, either explicitly linked with climate change (ex: “first thing, forest standmanagement in the context of climate change”), or implicitly linked with at leastone of climate change consequences (ex: mitigation policies and demand for non-fossil energy sources “we used to produce around 35,000 tons of fuelwood”). Oncean interview sample was referenced as mentioning an ACC, it was characterizeddepending on adaptation category, interventionism level, motive, temporality, spa-tial scale of application, adaptation of what, adaptation to what. To avoid arbitraryclassifications, characterizations were cross-checked by another author after beingcarried out by one author.
Adaptation category. Mentions of ACC were classified under the categories“Forest-use market diversification”, “Insurances”, “Land-use change”, “Naturalselection” (e.g. forest stands with spontaneous evolution),“Research and develop-ment”, “Silvicultural changes - forest density”, “Silvicultural changes - pest con-trol”, “Silvicultural changes - physical and chemical environment”, “Silviculturalchanges - quality management”, “Silvicultural changes - rotation length”, “Sil-

340 T. Fouqueray et al.
vicultural changes - technical itinerary” (e.g. Conversion of a regular woodlandinto an uneven-aged stand), “Silvicultural changes - tree species”, “Social innova-tion” (modifications of social interactions, e.g. creation of forest tales about climatechange), “Timber market diversification” (e.g. selling timber products as fuelwood,lumber, wood for paper fibres, …).
Interventionism. Interventionism qualified whether adaptations could haveoccurred without human intervention. When applicable, assessment of whether theACC ‘would exist without human intervention’, ‘reversibility’ and ‘coercition of eco-logical dynamics” were based on interviews analyses and cited literature. An ACCwas considered ‘existing without human intervention’ when it occurs in the wild (e.g.species mixes), ‘reversible’ when the time needed to return to pre-adaptation condi-tions is lower or as long as the implementation time of the adaptation (e.g. thinning isreversible, because it occurs every decade, long enough for forests to densify again).‘Coercition of ecological dynamics’ qualified an ACC as going counter-current ofthe ecological dynamics (‘Control and Command’) or as accompanying ecologicaldynamics (‘Monitor and Adapt’). For instance, if a local tree population declinesbecause of rarefying rainfalls or increasing droughts, its maintenance through artifi-cial plantationswould correspond to ‘Control andCommand’. In this case, a ‘Monitorand Adapt’ envision of ecological dynamics could be funding research and develop-ment for adapting timber transformation machines to the tree species replacing thedeclining one.
Motive. Purposes of adaptationswere assessed using a ‘adapting for or bybiodiver-sity’ and a ‘adapting for forests or for social-economic systems’ criteria. Assessmentsstemmed from interviewees’ expressed opinions.
Temporality. Reactive adaptations are “adjustments in ecological, social, or eco-nomic systems in response to observed or expected changes in climatic stimuli andtheir effects” (Adger et al. 2005). Hence, an ACC was counted as reactive when aninterviewee implemented it to avoid detrimental impacts of a climatic risk alreadyexperienced (windstorm, fire,…). Proactive adaptations are measures taken to lessenthe perceived negative impacts of future events (Engle 2011). An ACCwas thereforecounted as anticipative when the interviewee mentioned it as an a priori preparationof predicted climate changes. When the action of ACC was first a by-product ofanother action, it was considered as “Side effect of other silvicultural changes” (e.g.resulting from economic strategies, some shortened rotations also have interest forACC).
Spatial scale of application. The scale of the ACC was always clearly apparent orexplicit in the interviews. Spatial scales described the spatial extent of the ACC: theindividual (ex: inclusion of silvicultural changes in popular culture), the forest stand,the municipality, the whole forest (massif) or the whole country (ex: observatorynetwork of the effects of climate change on trees).
Adaptation of what. Discourse analysis gathered elements highlighting whatecosystem services were preferentially targeted by interviewees’ ACC.
Adaptation to what. Discourse analysis gathered elements highlighting what werethe risks against which interviewees mentioned ACC. For instance, shortening rota-
Is Adaptation to Climate Change Threatening Forest … 341
tion lengths was sometimes displayed as an ACC to drought, sometimes to wind-storms.
As any methodology, ours has its own limitations. In several interviews, it wasnot possible to cross-check the interviewees’ statement with field visits (interviewswere nevertheless included in the study). Another limitation pertains to samplingbiases: because interviewees are by definition foresters within reach of researchers,they are also involved in professional networks prone to release informations aboutACC. This was taken into account in the analyses, but as this bias applies to everyinterviewees, it was not considered as questioning our results.
The selection of study areas was guided by social-ecological considerations so toretain twovery contrasted forests characterizingpolar opposites ofFrench forestman-agement (see Table 1). The first study area—the man-created forest of the “Landesde Gascogne” (hereafter refered to as “Landes”)—lies in southwestern France and isgrounded on a young and very interventionist history. The draining of former marsh-lands two centuries ago led to a mechanized and monocultural forestry. Soils areplowed to plant selected seedlings (Pinus pinaster) that are usually clearcut betweentheir thirtieth and fortieth year. On the opposite, the second study area, known as the“Vosges du Nord” (“Vosges”), displays a silvicultural history that dates back over400 years (Jéhin 2005): an important proportion of forests are composed of uneven-aged and mixed stands. These areas were also chosen on the basis of local naturalparks managers showing interest in ACC studies linked with biodiversity issues. Itmust be kept in mind that our study areas are not representative of the whole Frenchsilvicultural technics range. Hence, our results must not be taken as applicable forthe whole country: they reflect two distinct and strong opposites of how forestersdeal with ecological processes in their silvicultures.
In that respect, forests can be studied as social-ecological systems (SES), forthey couple Darwinian adaptation with socio-economic adaptations arising in inter-connected demographic, cultural and economic contexts (Anderies et al. 2006). Aninterdisciplinary combination of geography and ecological sciences is therefore rel-evant to address the inclusion of biodiversity in foresters’ ACC measures.
Results
97 mentions of ACC were compiled from a total of 27 interviews (13 in the Landes,14 in the Vosges). Only one forester did not explicitly mention any ACC, but heinsisted on his silvicultural practices being flexible to environmental and externalchanges. Interviews were usually 1–2 h long, but could last up to 5 h.
Adaptation category. Changing tree species (mixes, replacement, …), acting onthe physical and chemical environment (by subsoiling, fertilization, …) and diver-sifying timber sales are the three most widespread mentions of ACC (Table 2). Onthe contrary, diversifying forest economic uses (tourism), innovating socially (devel-opment of forest tales related to climate changes) are the two least mentioned ACC(Table 2).
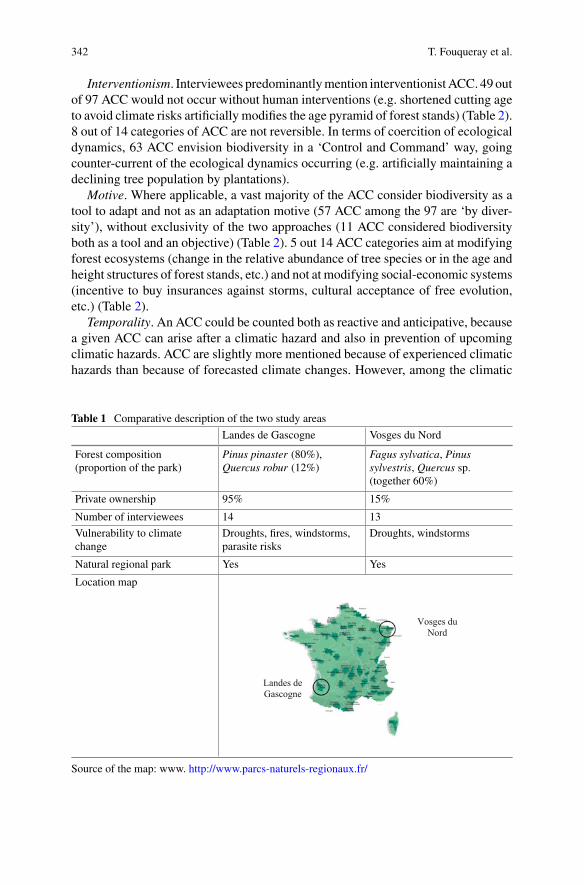
342 T. Fouqueray et al.
Interventionism. Interviewees predominantlymention interventionistACC. 49 outof 97 ACC would not occur without human interventions (e.g. shortened cutting ageto avoid climate risks artificially modifies the age pyramid of forest stands) (Table 2).8 out of 14 categories of ACC are not reversible. In terms of coercition of ecologicaldynamics, 63 ACC envision biodiversity in a ‘Control and Command’ way, goingcounter-current of the ecological dynamics occurring (e.g. artificially maintaining adeclining tree population by plantations).
Motive. Where applicable, a vast majority of the ACC consider biodiversity as atool to adapt and not as an adaptation motive (57 ACC among the 97 are ‘by diver-sity’), without exclusivity of the two approaches (11 ACC considered biodiversityboth as a tool and an objective) (Table 2). 5 out 14 ACC categories aim at modifyingforest ecosystems (change in the relative abundance of tree species or in the age andheight structures of forest stands, etc.) and not at modifying social-economic systems(incentive to buy insurances against storms, cultural acceptance of free evolution,etc.) (Table 2).
Temporality. An ACC could be counted both as reactive and anticipative, becausea given ACC can arise after a climatic hazard and also in prevention of upcomingclimatic hazards. ACC are slightly more mentioned because of experienced climatichazards than because of forecasted climate changes. However, among the climatic
Table 1 Comparative description of the two study areas
Landes de Gascogne Vosges du Nord
Forest composition(proportion of the park)
Pinus pinaster (80%),Quercus robur (12%)
Fagus sylvatica, Pinussylvestris, Quercus sp.(together 60%)
Private ownership 95% 15%
Number of interviewees 14 13
Vulnerability to climatechange
Droughts, fires, windstorms,parasite risks
Droughts, windstorms
Natural regional park Yes Yes
Location map
Landes de Gascogne
Vosges du Nord
Source of the map: www. http://www.parcs-naturels-regionaux.fr/

Is Adaptation to Climate Change Threatening Forest … 343
Table2
Classificatio
nof
the97
adaptatio
nsto
clim
atechange
colle
cted
from
French
foresters,with
theirinterventio
nism
characteristics
Adaptation
category
Num
berof
occur-
rences
Examples
Adaptationforor
bybiod
iversity?
Adaptationof
forestsor
ofsocial-economic
(hum
an)system
s?
Would
theadaptatio
nexist
with
outh
uman
interventio
n?Reversibility
Coercition
ofecologicaldynamics
By
For
For
andby
NA
Yes
No
Maybe
but
slow
er
NA
Con
trol
and
com-
man
d
Mon
itor
and
adap
t
NA
Insurances
againstclim
atic
hazards
2Insurances
against
windstorm
s–
––
2Hum
ans
––
–2
Yes
02
0
Land-use
change
8Sw
itchto
photovoltaicplantsor
organicagricultu
reby
land
clearing
––
–8
Forests
–8
0–
No
80
0
Tim
bermarket
diversificatio
n12
Salesdiversificatio
ntowards
fuelwoo
d,introd
uctio
nof
contractualsales
oftim
ber
93
0–
Forests
––
–10
Yes
93
0
Forest-use
market
diversificatio
n
1Market
diversificatio
ntowards
non-tim
ber
forestprod
ucts
(mushroo
ms)and
recreatio
nalactivities
10
0–
Hum
ans
10
0–
Yes
10
0
Researchand
developm
ent
4Establishm
ento
fregion
alobservatoriesof
clim
atechange
13
0–
Hum
ans
31
3Yes
13
0
(contin
ued)

344 T. Fouqueray et al.
Table2
(contin
ued)
Adaptation
category
Num
berof
occur-
rences
Examples
Adaptationforor
bybiod
iversity?
Adaptationof
forestsor
ofsocial-economic
(hum
an)system
s?
Would
theadaptatio
nexist
with
outh
uman
interventio
n?Reversibility
Coercition
ofecologicaldynamics
By
For
For
andby
NA
Yes
No
Maybe
but
slow
er
NA
Con
trol
and
com-
man
d
Mon
itor
and
adap
t
NA
Natural
selection
9Acceptanceof
spon
taneou
sevolutionin
forest
stands
23
4–
Hum
ans
90
0–
Yes
09
0
Social
innovatio
n1
Storytellin
gof
forest
andclim
atetalesfor
child
ren
––
–1
Hum
ans
01
0–
Yes
01
0
Silvicultural
changes—
forest
density
7Reduced
forest
density
70
0–
Forests
16
0–
No
70
0
Silvicultural
changes—
phys-
icaland
chem
ical
environm
ent
12Su
bsoilin
g,soil
tillage,fertilisation
20
19
Forests
111
0–
No
102
0
Silvicultural
changes—
tree
species
29Sp
eciesmixes,
varietalselection,
assisted
migratio
n,speciesreplacem
ent
260
3–
Forests
1312
4–
No
207
2
Silvicultural
changes—
tech-
nical
itinerary
3Close-to-nature
forestry
10
2–
Forests
30
0–
Yes
03
0
(contin
ued)

Is Adaptation to Climate Change Threatening Forest … 345
Table2
(contin
ued)
Adaptation
category
Num
berof
occur-
rences
Examples
Adaptationforor
bybiod
iversity?
Adaptationof
forestsor
ofsocial-economic
(hum
an)system
s?
Would
theadaptatio
nexist
with
outh
uman
interventio
n?Reversibility
Coercition
ofecologicaldynamics
By
For
For
andby
NA
Yes
No
Maybe
but
slow
er
NA
Con
trol
and
com-
man
d
Mon
itor
and
adap
t
NA
Silvicultural
changes—
pest
control
2Biocontrolu
sing
B.
thuringiensis
10
1–
Forests
11
0–
No
11
0
Silvicultural
changes—
qual-
ity managem
ent
2Increasedstand
thinning
20
0–
Forests
02
01
No
11
0
Silvicultural
changes—
rota-
tion
length
5Sh
ortenedrotatio
ns5
00
–Fo
rests
05
0–
Yes
32
0
TOTA
L97
579
1120
2949
516
6332
2
Figu
rescorrespo
ndto
thenu
mberof
occurrencesof
anadaptatio
ncatego
ryin
theinterviews.Fo
rinstance,“insurances
againstclim
atic
hazards”
countfor2
adaptatio
nsou
tofthe97
identifi
edin
theinterviews;in
thesecases,adaptatio
nstouchup
onsocial-econo
micsystem
s,they
arereversibleandin
a‘M
onito
rand
Adapt’vision
ofACC
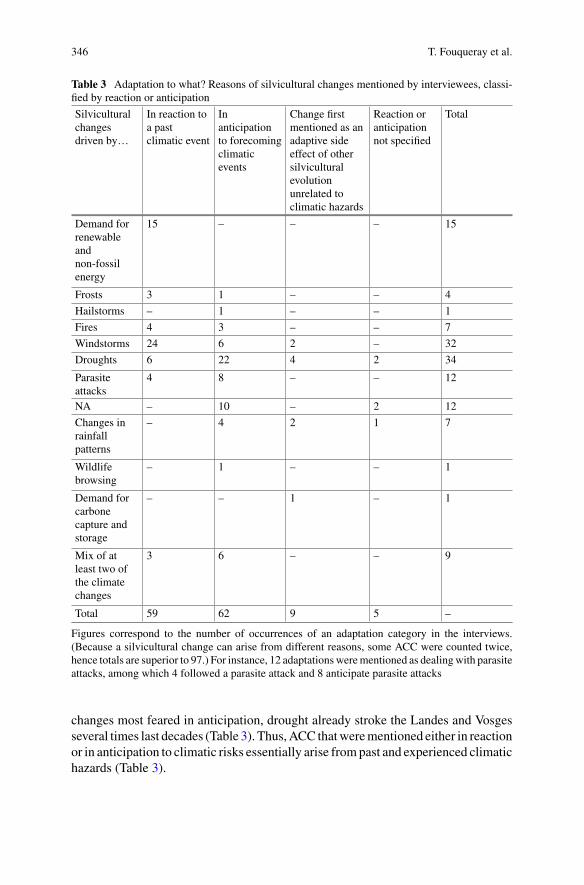
346 T. Fouqueray et al.
Table 3 Adaptation to what? Reasons of silvicultural changes mentioned by interviewees, classi-fied by reaction or anticipation
Silviculturalchangesdriven by…
In reaction toa pastclimatic event
Inanticipationto forecomingclimaticevents
Change firstmentioned as anadaptive sideeffect of othersilviculturalevolutionunrelated toclimatic hazards
Reaction oranticipationnot specified
Total
Demand forrenewableandnon-fossilenergy
15 – – – 15
Frosts 3 1 – – 4
Hailstorms – 1 – – 1
Fires 4 3 – – 7
Windstorms 24 6 2 – 32
Droughts 6 22 4 2 34
Parasiteattacks
4 8 – – 12
NA – 10 – 2 12
Changes inrainfallpatterns
– 4 2 1 7
Wildlifebrowsing
– 1 – – 1
Demand forcarbonecapture andstorage
– – 1 – 1
Mix of atleast two ofthe climatechanges
3 6 – – 9
Total 59 62 9 5 –
Figures correspond to the number of occurrences of an adaptation category in the interviews.(Because a silvicultural change can arise from different reasons, some ACC were counted twice,hence totals are superior to 97.) For instance, 12 adaptationswerementioned as dealingwith parasiteattacks, among which 4 followed a parasite attack and 8 anticipate parasite attacks
changes most feared in anticipation, drought already stroke the Landes and Vosgesseveral times last decades (Table 3). Thus,ACC thatwerementioned either in reactionor in anticipation to climatic risks essentially arise frompast and experienced climatichazards (Table 3).

Is Adaptation to Climate Change Threatening Forest … 347
Table 4 Adaptation of what ecosystem services, on what spatial scales? Forest services mentionedas the interviewees’ focus for ACC, classified by spatial scale
Forest use orecosystem service tobe adapted
Totalnumber ofoccurrences
Spatial scale
Individual Foreststand
Municipality Forestmassif
Country
Timber production 63 – 45 – 16 2
Not applicable(NA)/Undefined byinterviewee
14 – 8 – 5 1
Land use 8 – 4 4 – –
Timber productionand biodiversity
4 – 2 – 2 –
Timber production,biodiversity andesthaetic landscape
3 – 2 – 1 –
Recreationalactivities
1 – 1 – – –
Biodiversityconservation
1 – – – 1 –
Soil retention toprevent erosion
1 – – 1 – –
Cultural heritage(forest history)
1 1 – – – –
Human health 1 – – – 1 –
Total 97 1 62 5 26 3
Figures correspond to the number of occurrences of an adaptation category in the interviews. Ex:among the 4 ACC aiming at adapting timber production and biodiversity, 2 were designed at theforest stand level and 2 at the forest massif scale
Spatial scale of application. Adaptations largely apply at the forest stand scale (62mentions out of 97) and at the forest scale (23 mentions). Noticeably, only one ACCconcerned the individual scale: cultural heritage, in other words, the development offorest tales linked with climatic hazards (windstorms) (Table 4).
Adaptation of what. ACC first aim at adapting timber production (63 mentionsout of the 97 mentioned ACC). There is only one instance of ACC of biodiversityfor itself, while the other ACC aiming at adapting biodiversity are always relatedeither to the adaptation of timber production or of aesthetic landscapes (7 mentions)(Table 4).
Adaptation towhat. Top-mentionedACCaremostly in responding to punctual andalready experienced climatic risks: droughts (34 citations),windstorms (32 citations),demand for renewable and non-fossil energy (15 citations), parasitic attacks (12citations) (Table 3).

348 T. Fouqueray et al.
Discussion
Biodiversity Conservation as an Adaptation by-Productof Utilitarian Timber Production
Contrasting with the often reported lack of ACC implementation (Campbell et al.2008), almost all interviewees mentioned ongoing or operational adaptation mea-sures—97 in total (Table 2). This can be attributable to the long-term planning offorest management and to the strong forest cultures of the Landes and the Vosges.Following Carpenter et al. (2001), two main questions can shape the study of howbiodiversity issues are integrated among these 97 ACC. To what climatic risks areforest adapted? What are the forest goods and services targeted?
The first lesson from the field about to what foresters adapt is common: ACCweremostly in reaction to droughts and windstorms, two climatic hazards that occurredin both study areas (Table 3). For instance, Lothar-Martin windstorms in 1999 dev-astated more than 30% of the Landes stands and also hit the Vosges, as put simplyby a forestry advisor: “When the wind is strong here, many people can’t sleep any-more…”. Reactive adaptations are rooted in the enhanced perception of risks alreadyexperienced, a cognitive bias found in other environments (Rey-Valette et al. 2012).Paradoxically, the third most mentioned ACC is not related to climate hazards butto an indirect consequence of mitigation policies. The mitigation-driven demand forrenewable and non-fossil energy sources leads to increased fuelwood supply throughslash and stump removal, seen as a business opportunity for wood producers.
Interviewees also detailed what forest services they try to adapt, and biodiversityconservation was clearly less cited as an adaptation target than timber production(by far the top-ranked one, Table 4). Moreover, biodiversity conservation was nearlysystematically mentioned along with forest scenery or timber production (Table 4).This is not surprising, as timber production is the major source of income and con-centrates adaptation efforts. To quote a forest manager, “Today, forest owners onlyearn money from timber sales, around 90% of their incomes, with lease of huntingbeing the other 10%. The rest of it [biodiversity conservation and carbon seques-tration] is a gift to the society, and we even pay property taxes for that!”. Carefulapplication of payment for ecosystem services could be an interesting way out of thepredominance of timber production in ACC, with a collective share of biodiversityconservation costs (Farley and Costanza 2010).
This focus on timber productionmight explain why forest stand is the spatial scalereferred to as the most efficient to achieve ACC (64% of all ACC mentions). Timberproduction is indeed designed and managed at the forest stand level. This raises theissue of spatial integration of biodiversity dynamics, which do not stop at the foreststands limits. The ACC emphasis on forest stands could be a brake for managingecological connectivity, one of the putative safeguards for biodiversity conservationbeing the key role played by natural parks authorities. Supporting this vision, it isalmost only forest officials with responsibilities regarding biodiversity conservationwho cited the whole forest as their ACC spatial scale—the second most cited spatial

Is Adaptation to Climate Change Threatening Forest … 349
scale (Table 4). As an example, Vosges park managers underlined the necessityto plan ACC at the forest scale because they must ensure ecological corridors. Torebalance the impacts of shortened rotations, they established a no-managementnetwork composed of old-growth patches. Authorities of deconcentrated servicesof the Ministry of Environment also expressed their full consideration of long-termchanges (e.g. phenological or temperature shifts), even if ACC in anticipation wereless implemented than reactive ACC. Concerns persist because authorities (whetherfrom natural parks or from State services) must comply to national public policiesthat did not prove very pioneering regarding biodiversity conservation. For instance,it is only in 2017 that the national plan for adaptation to climate change incorporatedrecommendations for protected natural areas and biodiversity (Observatoire Nationaldes Effets du Réchauffement Climatique 2017).
Biodiversity Conservation Overwhelmed by an InterventionistApproach of Adaptation to Climate Change
Interviewed foresters mostly considered biodiversity as a tool to adapt and not anadaptation goal in itself, as outlined in Table 2. However, a utilitarian approach ofbiodiversity does not necessarily imply an interventionist conception of ACC. Suc-cessful silvicultural attempts exist that balance long-term utilitarian cost-minimizingtimber production with environmental imperatives (Brang et al. 2014). In France, theProSilva organization promotes a close-to-nature forestry withmixed forests, hetero-geneous structures, natural regeneration when possible and avoidance of clear cuts(de Turckheim and Bruciamacchie 2005; ProSilva 2017). Interviewed in the Vosges,a prominent member of ProSilva summarized his vision of biodiversity as an ACCtool: “Stability of production is important. So a diversified system is more stable,more perennial than a house of cards. Any grain of sand and everything collapses,then you’re lost.”
Still, most of the 97 collected ACC were interventionist, for instance excludingthe social-economic system as the adaptation target to be modified in order to ensureACC (Table 2). In other words, human intervention condition most of the reportedACC, such as planting trees according to windstorms tracks to decrease their windsurface areas. Human intervention is not always by essence detrimental to biodiver-sity, when it comes to conservation efforts—even if they are most often designed tooffset anthropogenic forcing. For some forest species, concerns exist about their abil-ity to adapt fast enough (through Darwinian evolution, dispersion, range expansionor phenotypic plasticity) (Campbell et al. 2008). More specifically, trees have longgeneration time and some species have low ability to disperse (Corlett and West-cott 2013); issues of time lag between climatic changes and biological responsescould make it relevant to plan human-based adaptation of such organisms (Millaret al. 2007). However, virtually none of the interviewees spontaneously came to thatquestion.

350 T. Fouqueray et al.
Most of the mentioned ACC mentioned are irreversible and therefore very sen-sitive issues when dealing with species mixes and provenances. For instance, theintentional translocation of tree populations to account for climatic risks (assistedmigration) can introduce unwanted genotypes in target environments (Millar et al.2007; Lefèvre et al. 2014). Great care must be taken not to forget key ecologi-cal mechanisms, such as translocation of tree populations without considering theirextended phenotype—their association with soil fungi or arthropods communitieson source sites (Frascaria-Lacoste and Fernández-Manjarrés 2012). Most of species-basedACCmentionedwere cautious in implementation, as for instance themigrationof an oak population from southern France into the Vosges to address temperatureshifts. Still, even if this pilot experiment did not foster non-native species introduc-tion, careful monitoring is required to evaluate whether introduced trees outperformlocal populations or if they contribute to genetic mixing. French ACC public policiescould be a way to implement precautionary measures with respect to sustainableforestry principles (Sansilvestri et al. 2015).
Interventionism is also significantly rooted in the coercition of ecological dynam-ics, as suggested by the prevalence of ‘Control and command’ ACC (around 65% ofACC). For these ACC, adaptation focuses on a single variable of the environmentwithout integrating potential side-effects, often supported by a technological framingof the response to a climatic hazard. An archetypal example is provided by some Lan-des forest owners, who aim at extending soil root exploration on their forest stands.Before planting, some of them used 250 horse-power subsoilers to break the hardesthorizon of the soil. However, they sometimes reported maladaptation to droughts,for subsoiling increased water draining and lowered water soil retention. Moreover,their stand were less resilient to windstorms, because maritime pines would breakin two instead of falling untouched on the floor as a consequence of their deeperroot anchorage. This ‘Control and command’ ACC was only focusing on adapta-tion to droughts and hindered access to forest stands and harvest of damaged trees,disregarding forest complexity.
In the end, the interviews allow to examine the impacts of ACC choices on bio-diversity through the prism of the sustainable forest principles:
– Avoidance of natural habitat loss could suffer from shortened rotations, as fewerold trees hosting cavities would stay in forests after logging (Fan et al. 2004;Lindenmayer et al. 2006). In the Vosges, attention has been focused on the lossof cavity trees, and a compensatory network of old-growth trees has been imple-mented for thirty years.
– Maintenance of ecological connectivity and focus on the landscape scale is ofgreater concern, as the most quoted spatial scale was the forest stand.
– Maintenance of forest heterogeneity (diversity of species, ages and successionalstages) first depends on owners’ silvicultural practices. In public forests, the mul-tifunctionality injunction imposes to take biodiversity into account, but on-the-ground implementation is at the discretion of localmanagers. In the Landes forests,owners are mainly individuals who pay a tax dedicated to fire prevention, a brakefor fire-based heterogeneity of forests but a prerequisite for timber production
Is Adaptation to Climate Change Threatening Forest … 351
(Doustin 1975). Forestry goals and local contexts therefore greatly condition theforest heterogeneity management principle, with consideration through ongoingresearch about tree diversity and herbivory by forest insects (Jactel and Brocker-hoff 2007).
– Avoidance of forest-use intensification might be the biggest focus point when itcomes to adaptation to the indirect effects of climate change. Economic adaptationto the rise in fuelwood demand, indirectly due to mitigation policies, could leadto extended harvest of slash and stump, threatening long-term soil equilibrium(Jandl et al. 2007; Walmsley and Godbold 2010). Inertia of private owners couldnevertheless balance intensification of forest-use, as shown by several interviews:numerous forest owners cannot afford investments in forest roads or have toosmall forest holdings to derive benefits from fuelwood sales.
Conclusions
In order to assess potential long-term adverse effects of ACC on biodiversity con-servation, we interviewed foresters, forest authorities and forest owners. Two forestcases contrasting in anthropization were selected: the “Landes de Gascogne” andthe “Vosges du Nord”, both study areas complying with France’s forest specifici-ties: vast, multifunctional, and managed (at least public forests). Analyses of thecollected mentions of ACC were conducted in the light of sustainable forestry prin-ciples: avoidance of natural habitats loss, maintenance of ecological connectivity,maintenance of forest heterogeneity, focus onto the landscape scale, avoidance offorest-use intensification (Noss 2001; Lindenmayer et al. 2006; Brang et al. 2014).
Much of ACC mentioned were utilitarian—considering biodiversity as a toolto adapt and not as a conservation goal. Much of them were also interventionist,designed to adapt forest environments to timber production, most oftenwithout ques-tioning the adaptation of human social-economic systems. Based on the interviews,integrating biodiversity conservation within this interventionist context seems highlyrelevant, since timber production should probably persist as one of forest most usedecosystemic services, a consideration found across other research projects (O’Haraand Ramage 2013). Still, numerous difficulties persist to evaluate the impacts onbiodiversity of ACC of forestry practices. Are interventionist ACC required for bio-diversity conservation, or can forest environments adapt to climate change with-out human interventions? In a few cases, such as shortened rotations or subsoiling,effects on biodiversity of interventionist ACC are quite straightforward to measure.But interventionism is not always so unequivocal, due to numerous ecological andclimatic uncertainties (Campbell et al. 2008). An example is assisted migration,where uncertainties are high about the tree real velocity, dispersal, acclimation tophenological shifts or about gene flow from supposed adapted populations, not tomention the variety of ecological processes harsh to evaluate (Frascaria-Lacoste andFernández-Manjarrés 2012; Corlett and Westcott 2013).

352 T. Fouqueray et al.
Favoring intervention or spontaneous evolution is of no little importance, butuncertainty renders it difficult to follow accurate guidelines (Hallegatte 2009). Whenconsidering the implementation of an ACC, we first recommend end-users to basetheir practical decision-making on sustainable forestry principles. When applicable,we also suggest to include uncertainty in their everyday silvicultural practices bysystematically preferring the one option with positive outcomes over a wide rangeof futures, in order to avoid “putting all eggs into one basket” (Dessai et al. 2009;O’Hara and Ramage 2013).
These silvicultural practices impacting forest environments are based on socialand economic decision-making. Thus, interdisciplinary research is critical to long-term successful biodiversity conservation. Understanding adaptation processes isone thing, but basing nature parks management on recent knowledge is another.From a conservationist point of view, ACC for biodiversity conservation is a chal-lenge that requires maintained and enhanced exchanges between researchers fromdifferent fields and nature parks managers (Stein et al. 2013). Learning from litera-ture study cases and formal and informal professional meetings stays indispensableto encourage capacity-building and adoption of the ‘Monitor and adapt’ manage-ment paradigm. In this logic, reversibility of ACC and ecological threshold uncer-tainties—genetic bottlenecks, effects of thinning or slash removal on ecosystemfunctioning, …—are to be monitored. ‘Monitor and adapt’ could also participate inintegrating laisser-faire measures as a pro-active choice within the ACC range.
Considering that forest officials are those accounting the most for biodiversity, itwould also be legitimate to question whether their interactions with forest ownersor forest experts leads to better integration of these forest sustainability principles.Methodological constraints do not allow us to go beyond the one-to-one interviews,but another research project is in progress. Based on companion modelling and seri-ous games (Bousquet and Le Page 2004; Abbrami et al. 2015), it aims at analyzingthe importance of communication between forest stakeholders for incorporating bio-diversity conservation in the players’ ACC strategies.
Explicitation of how foresters first consider biodiversity as a utilitarian tool tomaintain productive forests could be our main result for biodiversity conservation.This couldbe a significant asset for biodiversity conservation in non-protected forests.Indeed, clarifying the value of biodiversity for ACC is a first stage to rise awarenessabout conservation importance—so long as the utilitarianperceptionof biodiversity isnot the only one. In this light, the emergence of public policies relying on ecosystem-based adaptation and on nature-based solutions is a step in this direction (Balianet al. 2014; Eggermont et al. 2015). Aiming at turning adaptation with nature intosomething as efficient as adaptation against nature, this promising concept couldbecome in the coming years a useful communication tool reconciling biodiversityconservation with other ecosystemic services in multifunctional environments. In2018, renewal in France of both the national plan for adaptation to climate changeand the national mitigation strategy will be chances to assess the inclusion of nature-based solutions in public policies for biodiversity conservation.

Is Adaptation to Climate Change Threatening Forest … 353
References
Abbrami G, Allier F, Arrault S, Barnaud C, Barreteau O, Becu N, Bommel P, Bonté B, BousquetF, Daré W’s, Decourtye A, Dionnet M, Dray A, Dumrongrojwatthana P, Étienne M, Gajaseni N,Gourrat M, Page CL, Leteurtre E, Manzano P, Mathevet R, Monteil C, Gurung TR, Rougier J-E,Souchère V, Trébuil G, Venot J-P, Werdenberg F (2015) La modélisation d’accompagnement:partager des représentations, simuler des dynamiques. INRA, Paris
AdgerWN, Arnell NW, Tompkins EL (2005) Successful adaptation to climate change across scales.Glob Environ Change 15:77–86. https://doi.org/10.1016/j.gloenvcha.2004.12.005
Anderies J, Walker B, Kinzig A (2006) Fifteen weddings and a funeral: case studies and resilience-based management. Ecol Soc 11
Balian E, Eggermont H, le RouxX (2014) Outputs of the strategic foresight workshop “nature-basedsolutions in a BiodivERsA context”. BiodivERsA, Brussels
Barthod C (2015) La multifonctionnalité des forêts entre discours et pratiques : illusion ou réalitéà assumer? Rev For Fr
Bousquet F, Le Page C (2004) Multi-agent simulations and ecosystem management: a review. EcolModel 176:313–332. https://doi.org/10.1016/j.ecolmodel.2004.01.011
Brang P, Spathelf P, Larsen JB, Bauhus J, Boncina A, Chauvin C, Drossler L, Garcia-Guemes C,Heiri C, Kerr G, Lexer MJ, Mason B, Mohren F, Muhlethaler U, Nocentini S, Svoboda M (2014)Suitability of close-to-nature silviculture for adapting temperate European forests to climatechange. Forestry 87:492–503. https://doi.org/10.1093/forestry/cpu018
Campbell A, Kapos V, Chenery A, Kahn S, Rashid M, Scharlemann JPW, Dickson B (2008) Thelinkages between biodiversity and climate change adaptation. UNEPWorld Conserv Monit Cent
Carpenter S, Walker B, Anderies JM, Abel N (2001) FromMetaphor to measurement: resilience ofwhat to what? Ecosystems 4:765–781. https://doi.org/10.1007/s10021-001-0045-9
Corlett RT, Westcott DA (2013) Will plant movements keep up with climate change? Trends EcolEvol 28:482–488. https://doi.org/10.1016/j.tree.2013.04.003
Dessai S,HulmeM,Lempert R, PielkeR (2009)Dowe need better predictions to adapt to a changingclimate? EOS Trans Am Geophys Union 90:111–112
de Turckheim B, Bruciamacchie M (2005) La futaie irrégulière - Théorie et pratique de la sylvicul-ture irrégulière, continue et proche de la nature. Edisud, Saint-Remy-de-Provence
Doustin D (1975) Organisation de la lutte dans le massif landais. Rev For Fr 1975 Fasc ThématiqueIncendie For 500–503
Eggermont H, Balian E, Azevedo JMN, Beumer V, Brodin T, Claudet J, Fady B, Grube M, KeuneH, Lamarque P, Reuter K, Smith M, van Ham C, Weisser WW, Le Roux X (2015) Nature-basedsolutions: new influence for environmental management and research in Europe. GAIA—EcolPerspect Sci Soc 24:243–248. https://doi.org/10.14512/gaia.24.4.9
Engle NL (2011) Adaptive capacity and its assessment. Glob Environ Change 21:647–656. https://doi.org/10.1016/j.gloenvcha.2011.01.019
Fan Z, Shifley SR, Thompson FR, Larsen DR (2004) Simulated cavity tree dynamics under alter-native timber harvest regimes. For Ecol Manag 193:399–412. https://doi.org/10.1016/j.foreco.2004.02.008
Farley J, Costanza R (2010) Payments for ecosystem services: from local to global. Ecol Econ69:2060–2068. https://doi.org/10.1016/j.ecolecon.2010.06.010
Frascaria-Lacoste N, Fernández-Manjarrés J (2012) Assisted colonization of foundation species:lack of consideration of the extended phenotype concept-response toKreyling et al. (2011). RestorEcol 20:296–298. https://doi.org/10.1111/j.1526-100x.2012.00875.x
Hallegatte S (2009) Strategies to adapt to an uncertain climate change. Glob Environ Change19:240–247. https://doi.org/10.1016/j.gloenvcha.2008.12.003
Jactel H, Brockerhoff EG (2007) Tree diversity reduces herbivory by forest insects. Ecol Lett10:835–848. https://doi.org/10.1111/j.1461-0248.2007.01073.x
354 T. Fouqueray et al.
Jandl R, Lindner M, Vesterdal L, Bauwens B, Baritz R, Hagedorn F, Johnson DW, MinkkinenK, Byrne KA (2007) How strongly can forest management influence soil carbon sequestration?Geoderma 137:253–268. https://doi.org/10.1016/j.geoderma.2006.09.003
Jéhin P (2005) Les forêts des Vosges du nord duMoyen-Age à la Révolution. Presses UniversitairesDe Strasbourg, Strasbourg
Juhola S, Glaas E, Linnér B-O, Neset T-S (2016) Redefining maladaptation. Environ Sci Policy55:135–140. https://doi.org/10.1016/j.envsci.2015.09.014
Kaufmann J-C (2004) L’entretien compréhensif, 3rd edn. Armand Colin, ParisLefèvre F, Boivin T, Bontemps A, Courbet F, Davi H, Durand-Gillmann M, Fady B, Gauzere J,Gidoin C, KaramM-J, LalagüeH, Oddou-Muratorio S, Pichot C (2014) Considering evolutionaryprocesses in adaptive forestry. Ann For Sci 71:723–739. https://doi.org/10.1007/s13595-013-0272-1
Lindenmayer DB, Franklin JF, Fischer J (2006) General management principles and a checklist ofstrategies to guide forest biodiversity conservation. Biol Conserv 131:433–445. https://doi.org/10.1016/j.biocon.2006.02.019
MAAF (2017) Programme National de la Forêt et du Bois 2016–2026. Ministère de l’Agriculture,de l’Agroalimentaire et de la Forêt, Paris
Millar CI, Stephenson NL, Stephens SL (2007) Climate change and forests of the future: managingin the face of uncertainty. Ecol Appl 17:2145–2151
Ministère de la Transition écologique et solidaire (2017) Géorisques | Mieux connaître les risquessur le territoire. http://www.georisques.gouv.fr/. Accessed 18 Dec 2017
Moon K, Blackman D (2014) a guide to understanding social science research for natural scientists:social science for natural scientists. Conserv Biol 28:1167–1177. https://doi.org/10.1111/cobi.12326
Nicolas L (2013) Encodage et analyse de données qualitatives - Apports et limites du logiciel Sonalcomme outil de recherche en SHS. Adjectif.net
Noss RF (2001) Beyond Kyoto: forest management in a time of rapid climate change. Conserv Biol15:578–590
Observatoire National des Effets du Réchauffement Climatique (2017) Recommandations pour unnouveau Plan national d’adaptation au changement climatique. Observatoire National des Effetsdu Réchauffement Climatique, Paris
O’HaraKL,RamageBS (2013) Silviculture in an uncertainworld: utilizingmulti-agedmanagementsystems to integrate disturbance. Forestry 86:401–410. https://doi.org/10.1093/forestry/cpt012
ProSilva (2017) Pro Silva France. https://www.prosilva.fr/html/index.html. Accessed 19 Dec 2017Rey-Valette H, Rulleau B, Meur-Férec C, Flanquart H, Hellequin A-P, Sourisseau E (2012) Lesplages du littoral languedocien face au risque de submersion: définir des politiques de gestiontenant compte de la perception des usagers. Géographie Économie Société 14:369–391. https://doi.org/10.3166/ges.14.369-391
SansilvestriR, Frascaria-LacosteN, Fernández-Manjarrés JF (2015)Reconstructing a deconstructedconcept: policy tools for implementing assistedmigration for species and ecosystemmanagement.Environ Sci Policy 51:192–201. https://doi.org/10.1016/j.envsci.2015.04.005
Stein BA, Staudt A, CrossMS, Dubois NS, Enquist C, Griffis R, Hansen LJ, Hellmann JJ, Lawler JJ,NelsonEJ, PairisA (2013) Preparing for andmanaging change: climate adaptation for biodiversityand ecosystems. Front Ecol Environ 11:502–510. https://doi.org/10.1890/120277
Walmsley JD, Godbold DL (2010) Stump harvesting for bioenergy—a review of the environmentalimpacts. Forestry 83:17–38. https://doi.org/10.1093/forestry/cpp028
Hypotheses from Recent Assessmentsof Climate Impacts to Biodiversityand Ecosystems in the United States
Shawn L. Carter, Abigail J. Lynch, Bonnie J. E. Myers,Madeleine A. Rubenstein and Laura M. Thompson
Abstract Climate change poses multiple threats to biodiversity, and has alreadycaused demonstrable impacts. We summarize key results from a recent nationalassessment of observed climate change impacts to terrestrial, marine, and freshwaterecosystems in the United States, and place results in the context of commonly articu-lated hypotheses about ecosystem response to climate change for global implications.Specific impacts we consider include: range shifts; phenological shifts; phenotypicchanges; primary production changes; biological invasions; and novel communities.Significant effort has been made recently to incorporate adaptation measures intoland and water management at both national and international scales, but the scale ofimpacts and associated uncertainties pose challenges to existing management insti-tutions. Using commonly articulated hypotheses about climate change, biodiversity,and ecosystem response can provide context for informed decisions atmultiple scalesand can help to provide a clearer understanding of the ecological and mechanisticlinkages between climate change and biodiversity.
S. L. Carter · A. J. Lynch · B. J. E. Myers · M. A. Rubenstein (B) · L. M. ThompsonNational Climate Adaptation Science Center, US Geological Survey,12201 Sunrise Valley Drive, Reston, VA 20192, USAe-mail: [email protected]
S. L. Cartere-mail: [email protected]
A. J. Lynche-mail: [email protected]
B. J. E. Myerse-mail: [email protected]
L. M. Thompsone-mail: [email protected]
© Springer Nature Switzerland AG 2019W. Leal Filho et al. (eds.), Handbook of Climate Change and Biodiversity,Climate Change Management, https://doi.org/10.1007/978-3-319-98681-4_22
355
356 S. L. Carter et al.
Introduction
Contemporary anthropogenic climate change is increasingly impacting biodiversityand associated ecosystem services (IPCC 2013). Terrestrial systems are experiencingrising air temperatures, increasing incidences of large forest fires, reduced snow packand earlier spring melt, and an increasing number of extreme precipitation events(Wuebbles et al. 2017); freshwater systems are experiencing changing temperatures,flow regimes, and precipitation patterns (Rahel and Olden 2008; Jimenez Cisneroset al. 2014); and marine systems are additionally affected by sea level rise, acidifi-cation, and altered ocean circulation (Brierley and Kingsford 2009). Furthermore,these impacts are expected to increase in frequency or intensity into the future aswarming accelerates (Urban 2015).
Such changes in climate have significant impacts on biodiversity, includingshifts in the relative distribution or abundance of organisms across habitats (rangeshifts); changes in the timing of important life history events (phenological shifts);trait changes that can better cope with new environmental conditions (phenotypicchanges); changes in the production of biomass by photosynthetic organisms (pri-mary production changes); increases in the presence or abundance of alien invasiveorganisms across regions (biological invasions); and changes in species interactions(novel communities). Understanding the rate and magnitude of these changes andconsequences is critical to informing future natural resource management decisionsin the face of climate change. Furthermore, understanding these impacts specifi-cally in the context of scientific hypotheses can help to clarify important underlyingprocesses andmechanisms, and serve as a framework to inform future research, mod-eling, and assessment efforts. In this paper, we draw upon recent climate assessmentsin the United States for the purpose of illustrating impacts which are already beingobserved and quantified. In addition, we articulate a series of hypotheses about biodi-versity response to climate change and present an argument for how such a frameworkcan help to inform future research and decision making.
Recent assessment activities internationally and in the United States have pro-vided insight into the implications of climate impacts to biodiversity and have high-lighted potential management responses. Internationally, the United Nations’ (UN)2030 Agenda for Sustainable Development and associated Sustainable DevelopmentGoals (SDGs), as well as the Aichi Biodiversity Targets of the Convention on Bio-logical Diversity (CBD), recognize that improved management and conservation ofbiodiversity is central to achieving international goals for human and environmentalwell-being (Sachs et al. 2009; Secades et al. 2014; Romanelli et al. 2015). In theUnited States, the National Climate Assessment (NCA) is a quadrennial report thatsynthesizes the state of scientific knowledge about the status and impacts of anthro-pogenic climate change, and analyzes impacts to both human and natural systems.A recurring chapter devoted to Ecosystems, Ecosystem Services, and Biodiversity
Hypotheses from Recent Assessments of Climate Impacts to … 357
(Groffman et al. 2014) specifically reviews observed climate impacts on biodiversityand resulting changes in ecosystem services on national and sub-national scales. The4th NCA, scheduled for release in 2018, brought together experts from 13 Federalagencies, academia, and non-governmental organizations to synthesize literature onobserved climate change impacts in the United States. Such assessments can helpdecision makers better understand risks and manage for the most significant impactsof climate change by highlighting how valuable ecosystem services may be affected(Alcamo 2005; Jones et al. 2014).
Here, we provide a hypothesis-driven synthesis of climate change impacts to bio-diversity in the United States, structured around the type of impact (range shifts; phe-nological shifts; invasive species; changes in primary production; novel ecosystems;and phenotypic changes) and ecosystem type (terrestrial, freshwater, and marine)(Table 1) and review implications for potential adaptive management responses(Table 2). While an exhaustive assessment of evidence for and against each hypoth-esis is beyond the scope of this piece, we provide an overview of observed impactsstructured around each typeof impact and a framework for a hypothesis-driven impactassessment (Table 1). This effort will assist with anticipating potential impacts ofclimate change in the U.S., clarify how those impacts vary within and across ecosys-tem types, and help to identify science-informed management options that minimizeharm to biodiversity.
Synthesis of Impacts
Range Shifts
Species are expected to shift their geographic distribution in order to stay withintheir climate niche (Parmesan and Yohe 2003); higher elevations or latitudes forterrestrial and freshwater systems and deeper depths for marine systems (Chen et al.2011, Urban 2015). Species’ capacity for range shifts is limited by their inherentadaptive capacity, as well as by other drivers of spatial distributions (e.g., predatorsand competitors, land use changes, availability of migration corridors). In instanceswhere range shifts cannot accommodate the pace of climate impacts, local extinctionsare expected (Wiens 2016). Range shifts have numerous implications for sociallyimportant aspects of biodiversity on an international scale, including fisheries stocksthat no longer align with existingmanagement boundaries (Pinsky and Fogarty 2012;Barange et al. 2014) and expanding ranges of vector-borne diseases, such as Lymedisease, malaria, and avian flu (Vandegrift et al. 2010; Caminade et al. 2014; Ostfeldand Brunner 2015).
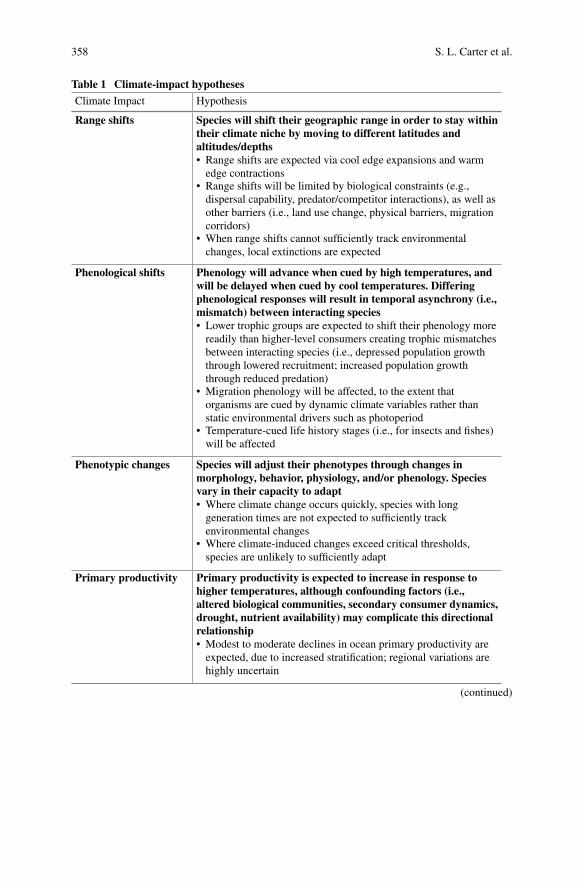
358 S. L. Carter et al.
Table 1 Climate-impact hypotheses
Climate Impact Hypothesis
Range shifts Species will shift their geographic range in order to stay withintheir climate niche by moving to different latitudes andaltitudes/depths• Range shifts are expected via cool edge expansions and warmedge contractions
• Range shifts will be limited by biological constraints (e.g.,dispersal capability, predator/competitor interactions), as well asother barriers (i.e., land use change, physical barriers, migrationcorridors)
• When range shifts cannot sufficiently track environmentalchanges, local extinctions are expected
Phenological shifts Phenology will advance when cued by high temperatures, andwill be delayed when cued by cool temperatures. Differingphenological responses will result in temporal asynchrony (i.e.,mismatch) between interacting species• Lower trophic groups are expected to shift their phenology morereadily than higher-level consumers creating trophic mismatchesbetween interacting species (i.e., depressed population growththrough lowered recruitment; increased population growththrough reduced predation)
• Migration phenology will be affected, to the extent thatorganisms are cued by dynamic climate variables rather thanstatic environmental drivers such as photoperiod
• Temperature-cued life history stages (i.e., for insects and fishes)will be affected
Phenotypic changes Species will adjust their phenotypes through changes inmorphology, behavior, physiology, and/or phenology. Speciesvary in their capacity to adapt• Where climate change occurs quickly, species with longgeneration times are not expected to sufficiently trackenvironmental changes
• Where climate-induced changes exceed critical thresholds,species are unlikely to sufficiently adapt
Primary productivity Primary productivity is expected to increase in response tohigher temperatures, although confounding factors (i.e.,altered biological communities, secondary consumer dynamics,drought, nutrient availability) may complicate this directionalrelationship• Modest to moderate declines in ocean primary productivity areexpected, due to increased stratification; regional variations arehighly uncertain
(continued)
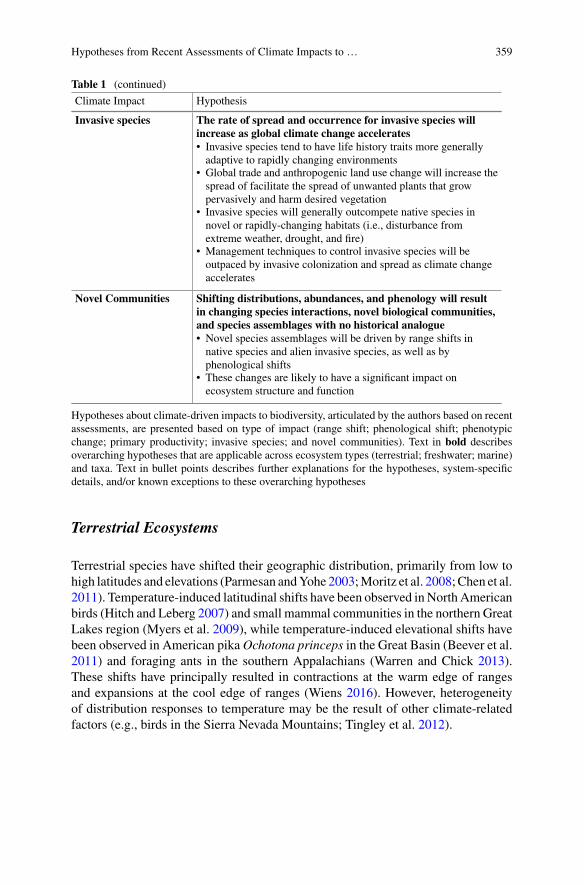
Hypotheses from Recent Assessments of Climate Impacts to … 359
Table 1 (continued)
Climate Impact Hypothesis
Invasive species The rate of spread and occurrence for invasive species willincrease as global climate change accelerates• Invasive species tend to have life history traits more generallyadaptive to rapidly changing environments
• Global trade and anthropogenic land use change will increase thespread of facilitate the spread of unwanted plants that growpervasively and harm desired vegetation
• Invasive species will generally outcompete native species innovel or rapidly-changing habitats (i.e., disturbance fromextreme weather, drought, and fire)
• Management techniques to control invasive species will beoutpaced by invasive colonization and spread as climate changeaccelerates
Novel Communities Shifting distributions, abundances, and phenology will resultin changing species interactions, novel biological communities,and species assemblages with no historical analogue• Novel species assemblages will be driven by range shifts innative species and alien invasive species, as well as byphenological shifts
• These changes are likely to have a significant impact onecosystem structure and function
Hypotheses about climate-driven impacts to biodiversity, articulated by the authors based on recentassessments, are presented based on type of impact (range shift; phenological shift; phenotypicchange; primary productivity; invasive species; and novel communities). Text in bold describesoverarching hypotheses that are applicable across ecosystem types (terrestrial; freshwater; marine)and taxa. Text in bullet points describes further explanations for the hypotheses, system-specificdetails, and/or known exceptions to these overarching hypotheses
Terrestrial Ecosystems
Terrestrial species have shifted their geographic distribution, primarily from low tohigh latitudes and elevations (Parmesan andYohe 2003;Moritz et al. 2008;Chen et al.2011). Temperature-induced latitudinal shifts have been observed inNorthAmericanbirds (Hitch and Leberg 2007) and small mammal communities in the northern GreatLakes region (Myers et al. 2009), while temperature-induced elevational shifts havebeen observed in American pikaOchotona princeps in the Great Basin (Beever et al.2011) and foraging ants in the southern Appalachians (Warren and Chick 2013).These shifts have principally resulted in contractions at the warm edge of rangesand expansions at the cool edge of ranges (Wiens 2016). However, heterogeneityof distribution responses to temperature may be the result of other climate-relatedfactors (e.g., birds in the Sierra Nevada Mountains; Tingley et al. 2012).
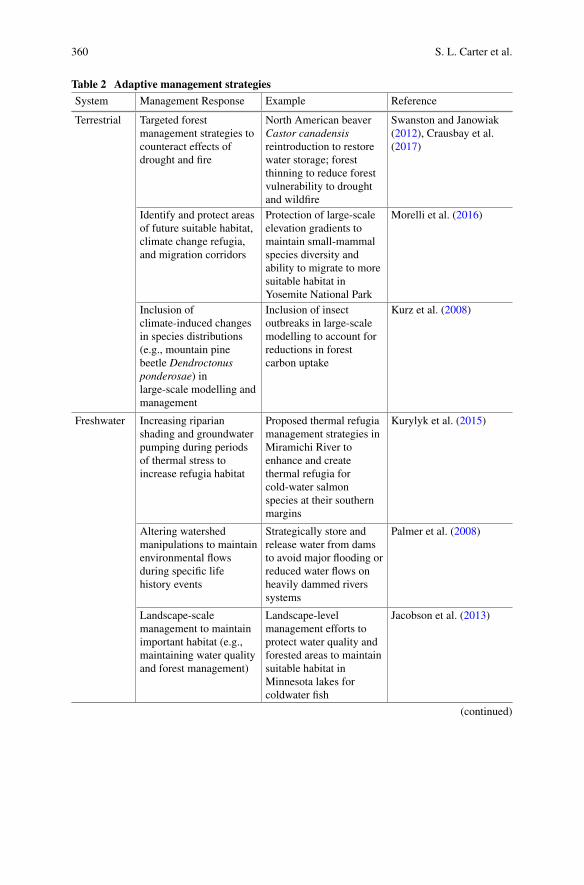
360 S. L. Carter et al.
Table 2 Adaptive management strategies
System Management Response Example Reference
Terrestrial Targeted forestmanagement strategies tocounteract effects ofdrought and fire
North American beaverCastor canadensisreintroduction to restorewater storage; forestthinning to reduce forestvulnerability to droughtand wildfire
Swanston and Janowiak(2012), Crausbay et al.(2017)
Identify and protect areasof future suitable habitat,climate change refugia,and migration corridors
Protection of large-scaleelevation gradients tomaintain small-mammalspecies diversity andability to migrate to moresuitable habitat inYosemite National Park
Morelli et al. (2016)
Inclusion ofclimate-induced changesin species distributions(e.g., mountain pinebeetle Dendroctonusponderosae) inlarge-scale modelling andmanagement
Inclusion of insectoutbreaks in large-scalemodelling to account forreductions in forestcarbon uptake
Kurz et al. (2008)
Freshwater Increasing riparianshading and groundwaterpumping during periodsof thermal stress toincrease refugia habitat
Proposed thermal refugiamanagement strategies inMiramichi River toenhance and createthermal refugia forcold-water salmonspecies at their southernmargins
Kurylyk et al. (2015)
Altering watershedmanipulations to maintainenvironmental flowsduring specific lifehistory events
Strategically store andrelease water from damsto avoid major flooding orreduced water flows onheavily dammed riverssystems
Palmer et al. (2008)
Landscape-scalemanagement to maintainimportant habitat (e.g.,maintaining water qualityand forest management)
Landscape-levelmanagement efforts toprotect water quality andforested areas to maintainsuitable habitat inMinnesota lakes forcoldwater fish
Jacobson et al. (2013)
(continued)

Hypotheses from Recent Assessments of Climate Impacts to … 361
Table 2 (continued)
System Management Response Example Reference
Marine Reducing anthropogenicstress (e.g., pollution,overharvesting)
Integration of marinereserves into broaderspatial planning toaddress overharvest andpollution threats outsidethe reserves and reductionof destructive fishingpractices (e.g., blastfishing)
Green et al. (2014)
Adapting protected areasplacement, size, andtiming
Representation of20–30% of all habitattypes in individual MPAscould help maintainbiodiversity and reducehabitat loss; useclimate-informedscenarios to assist inselection of protectedareas placement
Green et al. (2014)
Restoration of coastalwetlands, marshes,mangroves and reefs
Planting of salt and floodtolerant marsh species towithstand the impacts ofsea level rise
Powell et al. (2017)
Select potential management responses to climate change impacts are provided as examples forterrestrial, freshwater, and marine systems
Freshwater
Freshwater organisms have reduced dispersal capabilities due to the relatively closednature of freshwater systems (e.g., barriers to upstream and downstream movement,habitat degradation, stream fragmentation and connectivity) (Comte et al. 2013).Depending on physiological thermal limits and preferences, climate change cancause distribution changes of freshwater species to vary in degree and direction (e.g.,expansion or contraction) (Lynch et al. 2016). White perch Morone Americana, forexample, expanded its range in the Great Lakes with warmer air and water tempera-tures (Johnson et al. 2011), while the range of four Pacific salmon species expandednorthward with warmer ocean and summer river conditions in Canada (Babaluket al. 2000). Documentation of freshwater species shifting ranges is increasing asmore freshwater ecosystems are impacted by climate change, having consequencesfor biodiversity, species composition, and richness (Comte et al. 2013; Myers et al.2017).

362 S. L. Carter et al.
Marine
For marine ecosystems, extensive and contiguous habitat generally allows for shiftsin distribution and abundance of species at a faster rate than in terrestrial or freshwatersystems in the face of climate change (Nye et al. 2009; Kleisner et al. 2017). Rangeshifts for marine communities have been observed up to 28 km per decade (comparedwith 6.1 km in terrestrial systems; Burrows et al. 2011). Projections suggest thatrange shifts will continue with marine organisms moving to higher latitudes anddeeper depths to maintain optimal habitat (Urban 2015). However, ocean currentsand ocean chemistry make projecting the potential for range shifts in marine speciesmore complex than movement driven solely by temperature (Harley et al. 2006).Additionally, organisms in stable environments, such as marine tropical systems,often have much narrower niche bounds and may not be able to migrate at a ratecomparable to environmental change (Walther et al. 2002).
Phenological Shifts
Climate change is expected to alter the phenology of most species across ecosystemtypes. Earlier springs have been well documented (Ault et al. 2013), and increasinglystudies have focused on delays in the onset of autumn as well (Gallinat et al. 2015).A wide range of organisms have demonstrated phenological shifts in response tothese changes (Thackeray et al. 2010), although these responses vary across taxo-nomic and trophic groups (Thackeray et al. 2016), as does our ability to detect suchchanges. Generally, species in lower trophic levels are expected to advance theirphenology more than higher trophic consumers (Thackeray et al. 2010). These dif-ferences will likely result in altered species interactions and will have implicationsfor species fitness and production, particularly for populations of vulnerable species(Møller et al. 2008; Peer and Miller 2014) like pollinators (Memmott et al. 2007)and salmonids (Kovach et al. 2015b). Phenological shifts, and consequent trophicmismatches, are often difficult to account for in single-species management struc-tures but they are necessary to consider for a comprehensive assessment in informingadaptive management (Lawler 2009).
Terrestrial
Phenological shifts and associated mismatches have been well-documented in ter-restrial systems, such as those between plants in the prairie-forest transition areasof the Midwest and their pollinators: the plants are at increased risk of extinction

Hypotheses from Recent Assessments of Climate Impacts to … 363
because pollinators are arriving after peak bloom, minimizing the likelihood of pol-lination of plants and reducing the diet breadth of pollinators (Memmott et al. 2007).Organisms do not universally respond to phenological drivers in the same way; whenphenological shifts manifest differently, they can result in mismatched or insufficientresponses. Broad-tailed hummingbirds in Arizona and Colorado, for example, havenot advanced their arrival date sufficiently to track the advancing phenology of theirprimary nectar sources (McKinney et al. 2012).
Freshwater
Phenological shifts resulting from changes in temperature and flow have been doc-umented for a variety of North American fish species; because detection is ofteneasier in coldwater habitats, the literatures focuses mainly salmonid species (Kovachet al. 2015b; Lynch et al. 2016; Myers et al. 2017). Earlier spawning migrationsare documented in salmon species in Alaska and Washington (Quinn and Adams1996; Kovach et al. 2013, 2015a) and Rio Grande fish assemblages in New Mexico(Krabbenhoft et al. 2014). These phenological changes have impacts on freshwaterecosystem biodiversity by affecting food web dynamics, organism demographics(e.g., abundance and growth), and species composition (Lynch et al. 2016). Thesechanges can result in mismatches in resource availability and impact ecosystemfunctioning and services.
Marine
Alterations in phenology are perhaps the most evident climate response in rapidlychangingmarine systems (Asch 2015). Shorter winters, earlier springs, and extendedsummers are occurring in some marine systems (Edwards and Richardson 2004;Robinson et al. 2014; Henderson et al. 2017; Thomas et al. 2017), resulting in shiftsin the early life stages of commercially important groundfish (Klein et al. 2017),Northern shrimp Pandalus borealis (Richards 2012), and highly migratory anadro-mous fishes such as Atlantic salmon Salmo salar and river herring Alosa spp. In thenortheastern United States (Juanes et al. 2004; Ellis and Vokoun 2009; Otero et al.2014), mismatches can arise when trophic levels respond to climatic cues differently.For example, larval fish have evolved synchronized hatching with seasonal marinephytoplankton blooms; if the bloom and hatch are decoupled, the larval fish maymiss this critical food source (Post 2016; Sundby et al. 2016).

364 S. L. Carter et al.
Phenotypic Changes
Species may have some ability to cope with climate change by adjusting their traitsthrough plastic or evolutionary mechanisms so they can better tolerate changingenvironmental conditions and reduce risk of population declines or local extinctions.Specifically, changes in morphology, behavior, or physiology may increase fitness,but those adjustments are more commonly the result of phenotypic plasticity ratherthan evolution (Merilä and Hendry 2014), particularly for species with long genera-tion times. Therefore, it is likely that many species will be unable to keep pace withrapid climate changes in situ (Staudinger et al. 2013).
Terrestrial
There is some documentation of plastic and evolutionary responses to climate changein terrestrial species. Snowshoe hares Lepus americanus are plastic in the timing oftheir coat color changes from white to brown in spring in response to early snowmelt, making them less susceptible to predation (Zimova et al. 2014). Evolutionarychange has been observed in Brassica rapa L. sampled from southern California,which began flowering earlier to minimize the impact of shorter growing seasons asthe result of increased drought impacts (Franks 2011). Numerous other organisms,including the American pika, have demonstrated the capacity to alter their behaviorin order to adapt to changing habitat conditions (Beever et al. 2017).
Freshwater
Documented responses of fish to climate change reveal the ability of freshwaterorganisms to adapt to changes in climate conditions through multiple pathways, off-setting species loss and providing some resilience to freshwater ecosystem function(Elmqvist et al. 2003; Kovach et al. 2015b; Lynch et al. 2016). For example, Kovachet al. (2012) found evidence of an evolutionary response in migration timing ofpink salmonOncorhynchus gorbuscha into freshwater habitats in response to streamtemperature increases and shifting ocean conditions using long-term genetic data.Although temperature preferences and thresholds are known for some freshwater fishspecies and phenological and range shifts have been observed (Lyons et al. 2009;Alofs et al. 2014; Krabbenhoft et al. 2014), increased temperatures or shifts in flowspast critical temperature or water level thresholds may ultimately exceed plastic orevolutionary responses and result in reduced ability to adapt.
Hypotheses from Recent Assessments of Climate Impacts to … 365
Marine
In a critical review of the plastic and evolutionary responses to climate change infish, Crozier andHutchings (2013) note numerous examples of phenotypic responsesof fishes to climate change but only two formally include evolutionary mechanismsfor an anadromous species, sockeye salmon O. nerka (Crozier et al. 2011; Kovachet al. 2012). While the trends were considered adaptive for some life stages, adap-tive capacity was not explicitly examined in these studies. However, if evolutionarychanges are to occur, they may act to reduce animal body size and life span, whichwould reduce their value for fisheries (Sheridan and Bickford 2011).
Changing Primary Productivity
As primary production is driven, at least in part, by temperature, climate change isexpected to increase productivity in terrestrial, freshwater, and marine systems. Pro-jected increases, however, are not always realized since confounding factors, such assunlight, nutrient loading, and secondary consumer interactions can influence actualproduction rates in dynamic and non-linear ways (Brown et al. 2010; Rykaczewskiand Dunne 2011; Zhu et al. 2016). An understanding of climate change implicationsfor primary production rates is particularly important for biodiversity managementplanning because primary productivity impacts ecosystem function and structureacross trophic levels (Carpenter and Kitchell 1992).
Terrestrial
While terrestrial primary production has increased globally with climate change(Campbell et al. 2017), factors such as regional climate and land use changes causeprimary production trends to vary across the U.S. (Zhu et al. 2016). Worseningdroughts in the Southwest, for example, have decreased primary production in thatregion (Zhang et al. 2013) and models suggest that decline will continue in the future(Reeves et al. 2014).As a result, those areasmayundergo large changes in communitycomposition and species diversity (Polley et al. 2013; Fritz et al. 2016).Other regionalfactors, such asmountain pine beetleDendroctonus ponderosae outbreaks in westernNorth America, have shown to decrease primary productivity of certain tree species.Although the beetle is native to the region, warmer winters have increased survivaland exacerbated outbreaks in some regions, affecting the ability of northern foreststo take up and store carbon (Kurz et al. 2008).

366 S. L. Carter et al.
Freshwater
Climate-induced floods and changes in flow, temperature, and cloud cover influ-ence freshwater ecosystem plankton, macrophytes, primary production, and nutrientcycling (Carpenter andKitchell 1992). Primary production can increase after extremeprecipitation events due to large amounts of nutrient runoff, leading to eutrophica-tion and hypoxic conditions in lakes. Reduced oxygen levels in turn have negativeimpacts on fish and other freshwater organisms (Schindler et al. 1990). Melack et al.(1997) predicted increased glacial runoff from climate change would reduce primaryproduction and ultimately cause decreased growth in salmon in southcentral Alaska.The impacts of climate change on freshwater primary production affects ecosystemfunction on multiple levels (Elser et al. 2007).
Marine
Marine primary production is driven by light and nutrients and is moderated bytemperature. With climate change, there is increased stratification between the sur-face and deeper layers which can limit nutrient availability at the surface (Stocker2014), as well as projected changes to salinity (Saba et al. 2016). Direct evidencefor declines in primary productivity as a result of climate change, however, remainsmixed (Henson et al. 2010; McQuatters-Gollop et al. 2011; Boyce et al. 2014).Modest to moderate declines in ocean primary production are projected for mostlow- to mid-latitude oceans over the next century, but regional patterns of changeare less certain (Rykaczewski and Dunne 2010; Bopp et al. 2013; Laufkötter et al.2015). Most models also project increasing primary productivity in the Arctic due todecreasing ice cover, which is supported by recent observations (Arrigo et al. 2008;Vancoppenolle et al. 2013; Ardyna et al. 2014).
Invasive Species
Climate change and non-native species are both recognized as significant driversof biodiversity loss (Hellmann et al. 2008). Novel climate conditions and bioticselection pressures are generally expected to favor invasive species over short evo-lutionary timescales (Moran and Alexander 2014), although locally adaptive traitsand competition for resources can also favor native species (Sorte et al. 2013). Achanging climate, in conjunction with increased global trade, is generally expectedto favor the establishment and spread of biological invasions, but the condition of thehabitat and ecosystem structure (i.e., species richness and diversity) will also impactestablishment. Direct evidence, however, is still lacking formany taxa (Hulme 2017).

Hypotheses from Recent Assessments of Climate Impacts to … 367
Terrestrial
Extreme climatic events, such as storms, floods, or droughts, can facilitate the trans-port, establishment, and spread of terrestrial invasive species, as well as affect themagnitude of their impacts (Diez et al. 2012). Many of the same ‘weedy’ traits(e.g., pervasive growth) associated with invasive species put them at an advantagewith respect to climate change tolerance and adaptability. For example, introducedcool-season grasses can respond strongly to extreme precipitation events, whichhas drastically altered the plant community composition in a Colorado mixed-grassprairie (Concilio et al. 2016).
Freshwater
Climate change coupled with the presence of invasive species in freshwater ecosys-tems has compounding impacts on native diversity (Rahel and Olden 2008). Arecent review of aquatic invasive species found that recent invasions are more well-documented for terrestrial systems compared to freshwater (Havel et al. 2015).Nonetheless, climate change is thought to have allowed the invasion of two trop-ical, invasive dragonflies to freshwater systems in Florida (Paulson 2001). Presenceand increased abundance of invasive species resulting in alterations of the food web(see Zanden et al. 1999) andmore competition for resources impact native freshwaterspecies and biodiversity (Lynch et al. 2016).
Marine
Non-native species are often introduced into marine systems via transportation, com-merce, and other human-assistance pathways, but natural spread is an increasinglycommon pathway due to changing conditions (Molnar et al. 2008). The range expan-sion of invasive species due to climate change has been proposed as a mechanism forincreasing successful invasions (Occhipinti-Ambrogi 2007). The effect of climatechange and invasive species has been implicated in the expansion of invasive Euro-pean green crab Carcinus maenas from the Gulf of Maine to Nova Scotia (Roman2006), as well as in the collapse of marine ecosystems, such as in the Gulf of Maine,where declines in groundfish stocks have been attributed to overfishing, introductionof opportunistic benthic species, and a 1–2 °C increase in sea surface temperatures(Harris and Tyrrell 2001).
368 S. L. Carter et al.
Novel Communities
Novel communities and ecosystems are predicted to become increasingly commonas native species shift their ranges, new species invade areas outside their histor-ical ranges, and species shift their phenology patterns (Lynch et al. 2016). Novelcommunities have been documented in terrestrial (Morgado et al. 2015), freshwater(Krabbenhoft et al. 2014), and marine ecosystems (Edwards and Richardson 2004;Smith et al. 2017). Novel communities will present new challenges to biodiversitymanagement efforts and create difficult questions and decisions on how best to man-age these new climate change-induced assemblages.
Terrestrial
New combinations of terrestrial species are already being observed in many partsof the U.S., particularly where warming is more rapid. Fungal community structureis shifting in the moist tundra regions of Alaska so that warm-adapted species arebecoming more common, potentially affecting nutrient cycling and carbon storage(Morgado et al. 2015). Additionally, warming temperatures have reshuffled winterbird community structure in the eastern U.S. as a result of increasing abundanceand colonization of smaller-bodied and warm-adapted birds (Princé and Zuckerberg2015). Invasive cheatgrassBromus tectorum in sagebrush-steppe habitats in thewest-ern U.S. is creating novel conditions (Bradley et al. 2006) that are disrupting trophicinteractions between large mammalian predators (e.g., American badger Taxideataxus) and their prey (e.g., Piute ground squirrel Urocitellus mollis; Holbrook et al.2016).
Freshwater
Climate-induced range shifts, invasive species colonization, changes to primary pro-duction, and varying levels of adaptive capacity may result in novel freshwater com-munities and ecosystemswith new species functioning differently (Lynch et al. 2016).For example, southeastern U.S. freshwater systems are particularly vulnerable to cli-mate change effects in high diversity streams and lakes (Mulholland et al. 2008).Climate-induced changes in flow result in less diverse macroinvertebrate communi-ties made up of species with shorter life histories, such as mayflies, outcompetingspecies with longer life history traits (e.g., mollusks) (Mulholland et al. 2008).

Hypotheses from Recent Assessments of Climate Impacts to … 369
Marine
Climate change-driven range shifts and introduction of invasive species can leadto new species interactions and novel communities within marine systems. Often,these new scenarios can have negative implications for native species. Residencetime for tropical species in the temperate estuaries of Narragansett Bay and LongIsland Sound has increased with climate change to the point where some speciesare becoming more established; this has significant implications for commercialfisheries, as these habitats are nursery grounds for many commercial fish species andthe tropical species can predate on the fry and also compete for valuable resources(Wood et al. 2009).
Management Responses and Broader Implications
As climate change increasingly affects biota and ecosystems around the world, evi-dence is accumulating for both anticipated and unanticipated effects. Nevertheless,many knowledge gaps and uncertainties remain, particularly at local and regionallevels. The speed of this global, unprecedented change and associated uncertain-ties require rapid, ongoing dialogue between managers and scientists to ensureinformed management of impending risks to valued resources. However, many pro-jected impacts to biodiversity have not yet been tested or are occurring inconsistentlyacross taxa and among ecosystems. Here, we reviewed evidence for climate impactsto biodiversity from recent literature and climate assessments in the U.S. for thepurpose of constructing general working hypotheses.
We articulated common hypotheses about expected range shifts, phenologicalshifts, phenotypic responses, changes to primary production, biological invasions,and development of novel communities to climate change (Table 1), and attemptedto provide a basic assessment framework for understanding observed climate changeimpacts to biodiversity. We articulated these hypotheses based on literature reviewswe conducted during recent assessments, and based on our subject matter exper-tise. It is important to note that conducting a systematic literature review for eachhypothesis was outside the scope of this paper, as was articulating hypotheses ona regional- or system-specific scale. Ultimately, this set of hypotheses can be mostuseful as a generalized framework, within which the research community can iter-atively assess impacts and refine hypotheses in light of new evidence. Repeatedevaluation of observed impacts through modelling and assessment are essential todescribing the underlying processes driving climate change impacts within globalecosystems. Flexible, adaptive management approaches can use this information toprepare for projected impacts of climate change while accounting for significantuncertainty (Table 2). Moving forward, this effort will benefit from a formal, quan-titative assessment of evidence for each hypothesis through a systematic literaturereview and expert elicitation, particularly to examine impacts at regional scales. In
370 S. L. Carter et al.
addition, work connecting the observed and projected impacts of climate change, asunderstood through these hypotheses, to effects on ecosystem goods and services andassociated co-benefits would provide valuable information to decision makers andmanagers. By using a hypothesis-driven framework to understand climate impacts tobiodiversity, the scientific community can better inform climate adaptation actionsand associated management strategies.
References
Alcamo J (2005) Ecosystems and human wellbeing: a framework for assessment/MillenniumEcosystem Assessment. Millennium Ecosystem Assessment Board. Island Press, WashingtonD.C
Alofs KM, Jackson DA, Lester NP (2014) Ontario freshwater fishes demonstrate differing range-boundary shifts in a warming climate. Biodivers Res 123–136
Ardyna M, Babin M, Gosselin M, Devred E, Rainville L et al (2014) Recent Arctic Ocean sea iceloss triggers novel fall phytoplankton blooms. Geophys Res Lett 41:6207–6212
Arrigo KR, Van Dijken G, Pabi S (2008) Impact of a shrinking Arctic ice cover on marine primaryproduction. Geophys Res Lett 35:1–6
AschRG (2015) Climate change and decadal shifts in the phenology of larval fishes in the Californiacurrent ecosystem. Proc Natl Acad Sci 112:4065–4074
Ault TR, Henebry GM, De Beurs KM, Schwartz MD, Betancourt JL et al (2013) The false springof 2012, earliest in North American record. Trans Am Geophys Union 94:181–182
Babaluk JA, Reist JD, Johnson JD, Johnson L (2000) First records of Sockeye (Oncorhynchusnerka) and Pink Salmon (O. gorbuscha) from banks Island and other records of Pacific Salmonin Northwest territories Canada. Arctic 53:161–164
Barange M, Merino G, Blanchard JL, Scholtens J, Harle J et al (2014) Impacts of climate changeon marine ecosystem production in societies dependent on fisheries. Nat Clim Change 4:211
Beever EA, Ray C, Wilkening JL, Brussard PF, Mote PW (2011) Contemporary climate changealters the pace and drivers of extinction. Glob Change Biol 17:2054–2070
Beever EA, Hall LE, Varner J, Loosen AE, Dunham JB et al (2017) Behavioral flexibility as amechanism for coping with climate change. Front Ecol Environ 15:299–308
Bopp L, Resplandy L, Orr JC, Doney SC, Dunne JP et al (2013) Multiple stressors of oceanecosystems in the 21st century: projections with CMIP5 models. Biogeoscience 10:6225–6245
Boyce DG, Dowd M, Lewis MR, Worm B (2014) Estimating global chlorophyll changes over thepast century. Prog Oceanogr 122:163–173
Bradley BA, Houghton RA, Mustard JF, Hamburg SP (2006) Invasive grass reduces abovegroundcarbon stocks in shrublands of the Western US. Glob Change Biol 12:1815–1822
Brierley AS, KingsfordMJ (2009) Impacts of climate change on marine organisms and ecosystems.Curr Biol 19:602–614
Brown CJ, Fulton EA, Hobday AJ,Matear RJ, PossinghamHP et al (2010) Effects of climate drivenprimary production change onmarine foodwebs: implications for fisheries and conservation.GlobChange Biol 16:1194–1212
BurrowsMT, SchoemanDS, Buckley LB,Moore P, Poloczanska ES et al (2011) The pace of shiftingclimate in marine and terrestrial ecosystems. Science 334:652–656
Caminade C, Kovats S, Rocklov J, Tompkins AM, Morse AP et al (2014) Impact of climate changeon global malaria distribution. Proc Natl Acad Sci 111:3286–3291
Campbell JE, Berry JA, Seibt U, Smith SJ, Montzka SA et al (2017) Large historical growth inglobal terrestrial gross primary production. Nature 544:84–87
Hypotheses from Recent Assessments of Climate Impacts to … 371
Carpenter SR, Kitchell JF (1992) Global change and freshwater ecosystems. Annu Rev Ecol Syst23:119–139
Chen I-C, Hill JK, Ohlemuller R, Roy DB, Thomas CD (2011) Rapid range shifts of speciesassociated with high levels of climate warming. Science 333:1024–1026
ComteL,BuissonL,DaufresneM,GrenouilletG (2013)Climate-induced changes in the distributionof freshwater fish: observed and predicted trends. Freshw Biol 58:625–639
Concilio AL, Nippert JB, Ehrenfeucht S, Cherwin K, Seastedt TR (2016) Imposing antecedentglobal change conditions rapidly alters plant community composition in a mixed-grass prairie.Oecologia 182:899–911
Crausbay SD, Ramirez AR, Carter SL, Cross MS, Hall KR et al (2017) Defining ecological droughtfor the 21st century. Bull Am Meteorol Soc
Crozier LG, Hutchings JA (2013) Plastic and evolutionary responses to climate change in fish. EvolAppl 7:68–87
Crozier LG, Scheuerell MD, Zabel RW (2011) Using time series analysis to characterize evolution-ary and plastic responses to environmental change: a case study of a shift toward earlier migrationdate in Sockeye salmon. Am Nat 178:755–773
Diez JM, D’Antonio CM, Dukes JS, Grosholz ED, Olden JD et al (2012) Will extreme climaticevents facilitate biological invasions? Front Ecol Environ 10:249–257
Edwards M, Richardson AJ (2004) Impact of climate change on marine pelagic phenology andtrophic mismatch. Nature 430:881–884
Ellis D, Vokoun JC (2009) Earlier spring warming of coastal streams and implications for alewifemigration timing. North Am J Fish Manag 29:1584–1589
Elmqvist T, FolkeC,NyströmM,PetersonG,Bengtsson J et al (2003)Response diversity, ecosystemchange, and resilience. Front Ecol Environ 1:488–494
Elser JJ, BrackenMES,ClelandEE,GrunerDS,HarpoleWS et al (2007)Global analysis of nitrogenand phosphorus limitation of primary producers in freshwater, marine and terrestrial ecosystems.Ecol Lett 10:1135–1142
Franks SJ (2011) Plasticity and evolution in drought avoidance and escape in the annual plantBrassica rapa. New Phytol 190:249–257
Fritz SA, Eronen JT, Schnitzler J, Hof C, Janis CM et al (2016) Twenty-million-year relationshipbetween mammalian diversity and primary productivity. Proc Natl Acad Sci 113:10908–10913
Gallinat AS, Primack RB, Wagner DL (2015) Autumn, the neglected season in climate changeresearch. Trends Ecol Evol 30:169–176
Green AL, Fernandes L, Almany G, Abesamis R,McLeod E et al (2014) Designing marine reservesfor fisheriesmanagement, biodiversity conservation, and climate change adaptation. CoastManag42:143–159
Groffman PM, Kareiva P, Carter S, Grimm NB, Lawler J et al (2014) Chapter 8: Ecosystemsbiodiversity, and ecosystem services, pp 195–219. Climate change impacts in the United States:The Third National Climate Assessment. U.S. Global Change Research Program
Harley CDG, Randall Hughes A, Hultgren KM, Miner BG, Sorte CJB et al (2006) The impacts ofclimate change in coastal marine systems. Ecol Lett 9:228–241
Harris L-G, Tyrrell MC (2001) Changing community state in the Gulf of main: synergism betweeninvaders, overfishing and climate change. Biol Invasions 3:9–21
Havel JE, Kovalenko KE, Kats LB (2015) Aquatic invasive species: challenges for the future.Hydrobiologia 750:147–170
Hellmann JJ, Byers JE, Bierwagen BG, Dukes JS (2008) Five potential consequences of climatechange for invasive species. Conserv Biol 22:534–543
Henderson ME, Mills KE, Thomas AC, Pershing AJ, Nye JA (2017) Effects of spring onset andsummer duration on fish species distribution and biomass along the Northeast United Statescontinental shelf. Rev Fish Biol Fish 27:411–424
HensonSA, Sarmiento JL,Dunne JP, BoppL, Lima I et al (2010)Detection of anthropogenic climatechange in satellite records of ocean chlorophyll and productivity. Biogeosciences 7:621–640
372 S. L. Carter et al.
Hitch AT, Leberg PL (2007) Breeding distributions of North American bird species moving northas a result of climate change. Conserv Biol 21:534–539
Holbrook JD, Arkle RS, Rachlow JL, Vierling KT, Pilliod DS et al (2016) Occupancy and abun-dance of predator and prey: implications of the fire-cheatgrass cycle in sagebrush ecosystems.Ecosphere 7
Hulme PE (2017) Climate change and biological invasions: evidence, expectations, and responseoptions. Biol Rev 92:1297–1313
IPCC (2013) Summary for policymakers. In: Stocker TF, Qin D, Plattner G-K., Tignor M, AllenSK, Boschung J, Nauels A, Xia Y, Bex V, Midgley PM (eds) Climate Change 2013: thephysical science basis. Contribution of working group I to the fifth assessment report of theintergovernmental panel on climate change. Cambridge University Press, Cambridge, UnitedKingdom and New York, NY, USA
Jacobson PC, Fang X, Stefan HG, Pereira DL (2013) Protecting cisco (Corego- nus artedi Leseur)oxythermal habitat from climate change: building resilience in deep lakes using a landscapeapproach. Adv Limnol 64:323–332
Jimenez Cisneros BE, Oki T, Arnell NW, Benito G, Cogley JG et al (2014) Freshwater resources.In: Climate change 2014: impacts, adaptation and vulnerability. Contribution of working groupII to the fifth assessment report of the intergovernmental panel on climate change. CambridgeUniversity Press, Cambridge, pp 229–269
Johnson TB, Evans DO, Evans DO (2011) Size-Dependent winter mortality of young-of-the- yearWhite Perch: climate warming and invasion of the Laurentian Great lakes. Trans Am Fish Soc119:301–313
Jones RN, Patwardhan A, Cohen SJ, Dessai S, Lammel A et al (2014) Foundations for deci-sion making. In climate change 2014: impacts, adaptation, and vulnerability. Part A: globaland sectoral aspects. Contribution of working group II to the fifth assessment report of theintergovernmental panel on climate change. Cambridge University Press, pp 195–228
Juanes F, Gephard S, Beland KF (2004) Long-term changes in migration timing of adult Atlanticsalmon (Salmo salar) at the southern edge of the species distribution. Can J Fish Aquat Sci61:2392–2400
Klein ES, Smith SL, Kritzer JP (2017) Effects of climate change on four New England groundfishspecies. Rev Fish Biol Fish 27:317–338
Kleisner KM, Fogarty MJ, Mcgee S, Hare JA, Moret S et al (2017) Marine species distributionshifts on the U.S. Northeast Continental Shelf under continued ocean warming. Prog Oceanogr153:24–36
Kovach RP, Gharrett AJ, Tallmon DA (2012) Genetic change for earlier migration timing in a pinksalmon population. Proc Roy Soc B Biol Sci 279:3870–3878
Kovach RP, Joyce JE, Echave JD, Lindberg MS, Tallmon DA (2013) Earlier migration timing,decreasing phenotypic variation, and biocomplexity in multiple Salmonid species. PLoS ONE 8
Kovach RP, Ellison SC, Pyare S, Tallmon DA (2015a) Temporal patterns in adult salmon migrationtiming across southeast Alaska. Glob Change Biol 21:1821–1833
Kovach RP, Muhlfeld CC, Dunham JB, Letcher BH, Kershner JL (2015b) Impacts of climaticvariation on trout: a global synthesis and path forward. Rev Fish Biol Fish 26:135–151
Krabbenhoft TJ, Platania SP, Turner TF (2014) Interannual variation in reproductive phenology ina riverine fish assemblage: implications for predicting the effects of climate change and alteredflow regimes reproductive readiness. Freshw Biol 59:1744–1754
Kurylyk BL, Macquarrie KTB, Linnansaari T, Cunjak RA, Curry RA (2015) Preserving, augment-ing, and creating cold-water thermal refugia in rivers: concepts derived from research on theMiramichi River, New Brunswick (Canada). Ecohydrology 8:1095–1108
Kurz WA, Dymond CC, Stinson G, Rampley GJ, Neilson ET et al (2008) Mountain pine beetleand forest carbon feedback to climate change. Nature 452:987–990
Laufkötter C, Vogt M, Gruber N, Aita-Noguchi M, Aumont O et al (2015) Drivers and uncertaintiesof future global marine primary production in marine ecosystemmodels. Biogeosciences Discuss12:3731–3824

Hypotheses from Recent Assessments of Climate Impacts to … 373
Lawler JJ (2009) Climate change adaptation strategies for resource management and conservationplanning. Ann N Y Acad Sci 1162:79–98
Lynch AJ, Myers BJE, Chu C, Eby LA, Falke JA et al (2016) Climate change effects on NorthAmerican inland fish populations and assemblages. Fisheries 41:346–361
Lyons J, Zorn T, Stewart J, Seelbach P,Wehrly K et al (2009) Defining and characterizing coolwaterstreams and their fish assemblages inmichigan andNorth American. J FishManag 29:1130–1151
McKinney AM, CaraDonna PJ, Inouye DW, Barr B, Bertelsen CD et al (2012) Asynchronouschanges in phenology of migrating broad-tailed hummingbirds and their early season nectarresources. Ecology 93:1987–1993
McQuatters-Gollop A, Reid PC, Edwards M, Burkill PH, Castellani C et al (2011) Is there a declinein marine phytoplankton? Nature 472:6–7
Melack JM, Dozier J, Goldman CR, Greenland D, Milner AM et al (1997) Effects of climatechange on inland waters of the Pacific coastal mountains and Western Great Basin of NorthAmerica. Hydrol Process 11:971–992
Memmott J, Craze PG, Waser NM, Price MV (2007) Global warming and the disruption ofplant-pollinator interactions. Ecol Lett 10:710–717
Merilä J, Hendry AP (2014) Climate change, adaptation, and phenotypic plasticity: the problemand the evidence. Evol Appl 7:1–14
Møller AP, Rubolini D, Lehikoinen E (2008) Populations of migratory bird species that didnot show a phenological response to climate change are declining. Proc Natl Acad Sci USA105:16195–16200
Molnar JL, Gamboa RL, Revenga C, Spalding MD (2008) Assessing the global threat of invasivespecies to marine biodiversity. Front Ecol Environ 6:485–492
Moran EV, Alexander JM (2014) Evolutionary responses to global change: lessons from invasivespecies. Ecol Lett 17:637–649
Morelli TL, Daly C, Dobrowski SZ, Dulen DM, Ebersole JL et al (2016) Managing climate changerefugia for climate adaptation. PLoS ONE 11:1–17
Morgado LN, Semenova TA, Welker JM, Walker MD, Smets E et al (2015) Summer temperatureincrease has distinct effects on the ectomycorrhizal fungal communities of moist tussock anddry tundra in Arctic Alaska. Glob Change Biol 21:959–972
Moritz C, Patton JL, Conroy CJ, Parra JL, White GC et al (2008) Impact of a century of climatechange on small-mammal communities in Yosemite National Park, USA. Science 322:261–264
Mulholland PJ, Best GR, Coutant CC, Hornberger GM, Meyer JL et al (2008) Effects of climatechange on freshwater ecosystems of the South-Eastern United States and the Gulf Coast ofMexico. Hydrol Process 11:949–970
Myers BJE, LynchAJ, Bunnell DB,ChuC, Falke JA et al (2017)Global synthesis of the documentedand projected effects of climate change on inland fishes. Rev Fish Biol Fish 27:339–361
Myers P, Lundrigan BL, Hoffman SMG, Haraminac AP, Seto SH (2009) Climate-induced changesin the small mammal communities of the Northern Great Lakes region. Glob Change Biol15:1434–1454
Nye JA, Link JS, Hare JA, Overholtz WJ (2009) Changing spatial distribution of fish stocks inrelation to climate and population size on the Northeast United States continental shelf. MarEcol Prog Ser 393:111–129
Occhipinti-Ambrogi A (2007) Global change and marine communities: alien species and climatechange. Mar Pollut Bull 55:342–352
Ostfeld RS, Brunner JL (2015) Climate change and Ixodes tick-borne diseases of humans. PhilosTrans Roy Soc B: Biol Sci 370:20140051
Otero J, L’Abée-Lund JH, Castro-Santos T, Leonardsson K, Storvik GO et al (2014) Basin-scalephenology and effects of climate variability on global timing of initial seaward migration ofAtlantic salmon (Salmo salar). Glob Change Biol 20:61–75
Palmer MA, Reidy Liermann CA, Nilsson C, Flörke M, Alcamo J et al (2008) Climate change andthe world’s river basins: anticipating management options. Front Ecol Environ 6:81–89

374 S. L. Carter et al.
Parmesan C, Yohe G (2003) A globally coherent fingerprint of climate change impacts acrossnatural systems. Nature 421:37–42
Paulson D (2001) Recent odonata records from Southern Florida. Int J Odonatol 4:57–69Peer AC, Miller TJ (2014) Climate change, migration phenology, and fisheries managementinteract with unanticipated consequences. North Am J Fish Manag 34:94–110
Pinsky ML, Fogarty M (2012) Lagged social-ecological responses to climate and range shifts infisheries. Clim Change 115:883–891
Polley HW, Briske DD, Morgan JA, Wolter K, Bailey DW et al (2013) Climate change and NorthAmerican Rangelands: trends, projections, and implications. Rangeland EcolManag 66:493–511
Post E (2016) Implications of earlier sea ice melt for phenological cascades in Arctic marine foodwebs. Food Webss 13:60–66
Powell EJ, Tyrrell MC, Milliken A, Tirpak JM, Staudinger MD (2017) A synthesis of thresholdsfor focal species along the US Atlantic and Gulf Coasts: a review of research and applications.Ocean Coast Manag 148:75–88
Princé K, Zuckerberg B (2015) Climate change in our backyards: the reshuffling of North America’swinter bird communities. Glob Change Biol 21:572–585
Quinn TP, Adams DJ (1996) Environmental changes affecting the migratory timing of AmericanShad and Sockeye Salmon. Ecology 77:1151–1162
Rahel FJ, Olden JD (2008) Assessing the effects of climate change on aquatic invasive species.Conserv Biol 22:521–533
Reeves MC, Moreno AL, Bagne KE, Running SW (2014) Estimating climate change effects onnet primary production of rangelands in the United States. Clim Change 126:429–442
Richards RA (2012) Phenological shifts in hatch timing of northern shrimp Pandalus borealis.Mar Ecol Prog Ser 456:149–158
Robinson NJ, Valentine SE, Tomillo PS, Saba VS, Spotila JR et al (2014) Multidecadal trends inthe nesting phenology of Pacific and Atlantic leatherback turtles are associated with populationdemography. Endangered Species Res 24:197–206
Roman J (2006) Diluting the founder effect: cryptic invasions expand a marine invader’s range.Proc Roy Soc Lond B: Biol Sci 273:2453–2459
Romanelli C, Cooper D, Campbell-Lendrum D, Maiero M, Karesh WB et al (2015) Connectingglobal priorities: biodiversity and human health: a state of knowledge review. World HealthOrganization and Secretariat for the Convention on Biological Diversity
Rykaczewski RR, Dunne JP (2010) Enhanced nutrient supply to the California current ecosystemwith global warming and increased stratification in an earth system model. Geophys Res Lett 37
Rykaczewski RR, Dunne JP (2011) A measured look at ocean chlorophyll trends. Nature 472:E5Saba VS, Griffies SM, Anderson WG, Winton M, Alexander MA et al (2016) Enhanced warmingof the Northwest Atlantic ocean under climate change. J Geophys Res: Oceans 121:118–132
Sachs JD, Baillie JEM, SutherlandWJ,Armsworth PR,AshN et al (2009) Biodiversity conservationand the millennium development goals. Science 325:1502-1503
Schindler ADW, Beaty KG, Fee EJ, Cruikshank DR, Debruyn ER et al (1990) Effects of climaticwarming on lakes of the Central Boreal Forest. Science 250:967–970
Secades C, O’Connor B, Brown C, Walpole M (2014) Earth observation for biodiversity monitor-ing: a review of current approaches and future opportunities for tracking progress towards theAichi Biodiversity Targets. CBD technical series No. 72
Sheridan JA, Bickford D (2011) Shrinking body size as an ecological response to climate change.Nat Clim Change 1:401–406
Smith KE, Aronson RB, Steffel BV, Amsler MO, Thatje S et al (2017) Climate change and thethreat of novel marine predators in Antarctica. Ecosphere 8
Sorte CJB, Ibáñez I, Blumenthal DM, Molinari NA, Miller LP et al (2013) Poised to prosper? Across system comparison of climate change effects on native and non native species performance.Ecol Lett 16:261–270

Hypotheses from Recent Assessments of Climate Impacts to … 375
Staudinger MD, Grimm NB, Staudt A, Carter SL, Chapin FS et al (2013) Impacts of climatechange on biodiversity, ecosystems, and ecosystem services technical input to the 2013 NationalClimate Assessment
Stocker T (2014) The physical science basis. In: Climate change 2013: the physical science basis.Contribution of working group to the fifth assessment report of the intergovernmental panel onclimate change. Cambridge University Press
Sundby S, Drinkwater KF, Kjesbu OS (2016) The North Atlantic spring-bloom system—wherethe changing climate meets the winter dark. Frontiers Mar Sci 3:28
Swanston C, Janowiak M (2012) Forest adaptation resources: climate change tools and approachesfor land managers. General Technical Report NRS-87:120
Thackeray SJ, Sparks TH, FrederiksenM, Burthe S, Bacon PJ et al (2010) Trophic level asynchronyin rates of phenological change for marine, freshwater and terrestrial environments. Glob ChangeBiol 16:3304–3313
Thackeray SJ, Henrys PA, Hemming D, Bell JR, Botham MS et al (2016) Phenological sensitivityto climate across taxa and trophic levels. Nature 535:241–245
Thomas AC, Pershing AJ, Friedland KD, Nye JA, Mills KE et al (2017) Seasonal trends andphenology shifts in sea surface temperature on the North American northeastern continentalshelf. Elementa Science of the Anthropocene 5
Tingley MW, Koo MS, Moritz C, Rush AC, Beissinger SR (2012) The push and pull of climatechange causes heterogeneous shifts in avian elevational ranges. Glob Change Biol 18:3279–3290
Urban MC (2015) Accelerating extinction risk from climate change. Science 348:571–573Vancoppenolle M, Bopp L, Madec G, Dunne J, Ilyina T et al (2013) Future Arctic Ocean primaryproductivity from CMIP5 simulations: uncertain outcome, but consistent mechanisms. GlobalBiogeochem Cycles 27:605–619
Vandegrift KJ, Sokolow SH, Daszak P, Kilpatrick AM (2010) Ecology of avian influenza virusesin a changing world. Ann N Y Acad Sci 1195:113–128
Walther G-R, Post E, Convey P, Menzel A, Parmesan C et al (2002) Ecological responses to recentclimate change. Nature 416:389–395
WarrenRJ, Chick L (2013)Upward ant distribution shift correspondswithminimum, notmaximum,temperature tolerance. Glob Change Biol 19:2082–2088
Wiens JJ (2016) Climate-related local extinctions are already widespread among plant and animalspecies. PLoS Biol 14:e2001104
Wood AJM, Collie JS, Hare JA (2009) A comparison between warm-water fish assemblages ofNarragansett Bay and those of long Island sound waters. Fish Bull 107:89–100
Wuebbles DJ, Fahey DW, Hibbard KA, DeAngelo B, Doherty S et al (2017) Executive summaryof the climate science special report: fourth national climate assessment. Washington, D.C
Zanden MJV, Casselam JM, Rasmussen JB (1999) Stable isotope evidence for the food webconsequences of species invasions in lakes. Nature 401:1997–2000
Zhang Y, Susan Moran M, Nearing MA, Ponce Campos GE, Huete AR et al (2013) Extremeprecipitation patterns and reductions of terrestrial ecosystem production across biomes. JGeophys Res: Biogeosciences 118:148–157
Zhu Z, Piao S, Myneni RB, Huang M, Zeng Z et al (2016) Greening of the earth and its drivers.Nat Clim Change 6:791–795
Zimova M, Mills LS, Lukacs PM, Mitchell MS (2014) Snowshoe hares display limited phenotypicplasticity to mismatch in seasonal camouflage. Proc Roy Soc B: Biol Sci 281:20140029
Significance of Protected Area Networkin Preserving Biodiversity in a ChangingNorthern European Climate
Raimo Virkkala, Risto K. Heikkinen, Saija Kuusela, Niko Leikolaand Juha Pöyry
Abstract Climate change is a major threat to biodiversity, causing species to moveto new climatically suitable areas, and thus increasing the extinction probability ofspecies inhabiting fragmented landscapes. This highlights the need for climate-wiseconservation strategies. With such strategies, a well-connected network of protectedareas (PAs) is one of the most important means to support species survival. Anextensive and representative PA network can enhance the resilience of regional pop-ulations of species, resulting in slower species loss in landscapes with a significantproportion of area of habitat being protected. This paper presents analyses of boththe observed (1974–2010) and the predicted changes (by 2051–2080) in boreal birdpopulations in Finland. Firstly, the results show some general patterns of climatechange on bird species: (1) species are shifting their ranges towards north, (2) rangesizes of many species are declining, and (3) these changes are different in northernand southern species and in species occupying different habitats. Secondly, the paperlooks more into the role of protected area (PA) network in securing birds in a chang-ing climate and concludes that at least in Finland, open habitats, such as open miresand mountain heaths, change more rapidly in their species composition in protectedareas than for example old-growth forests. However, generally, species decline lesswithin than outside PAs showing that protected areas alleviate climate change effectson bird species of conservation concern. This finding, further supported by resultsfrom elsewhere in Europe, provides evidence for the resilience of PA networks inpreserving species under climate change. Representative PA network that includeshigh cover for key habitats is hence needed in all latitudinal zones. The projectedefficiency of the PA network in maintaining biodiversity was partly dependent on thestrength of climate change varying with respect to future scenarios. This suggests
R. Virkkala (B) · R. K. Heikkinen · S. Kuusela · N. Leikola · J. PöyryBiodiversity Centre, Finnish Environment Institute, P.O. Box 140, FI-00251Helsinki, Finlande-mail: [email protected]
© Springer Nature Switzerland AG 2019W. Leal Filho et al. (eds.), Handbook of Climate Change and Biodiversity,Climate Change Management, https://doi.org/10.1007/978-3-319-98681-4_23
377
378 R. Virkkala et al.
that a flexibly adaptive climate-wise conservation planning is required to be betterprepared for preserving biodiversity in the face of uncertain climate change. Thirdly,the paper discusses several aspects of climate change studies and avian biodiversitythat have been hitherto understudied especially in the northern biomes. The papersuggests that future studies should concentrate on (1) abundance-based models andprioritisations, (2) species’ adaptive capacity (ability to avoid the impacts of climatechange through dispersal and/or evolutionary change) and sensitivity (limited poten-tial to persist in situ under changing climate) to climate change, (3) the role of thelandscape matrix around the PAs and (4) the effects of the biogeophysical features ofthe PAs themselves. In conclusion, we envision that improved assessments regardingthe ability of PA networks to maintain biodiversity in northern biomes are needed toenhance our ability to perform climate-wise conservation planning.
Introduction
Global climate change is one of the most important threats to biodiversity (Bellardet al. 2012; Thomas et al. 2004), creating accelerating pressures on species pop-ulations and communities (Parmesan 2006; Pacifici et al. 2017). Future changesin climate are projected to cause large changes in the distribution of species invarious taxa (Thomas et al. 2004; Thuiller et al. 2005). For example, bird speciesdistributions have been projected to change considerably in Europe during the 21stcentury (Huntley et al. 2007, 2008). Climate change also causes a notable turnoverin species and alters the functional structure of species assemblages (Thuiller et al.2014; Virkkala and Lehikoinen 2017).
One of themain instruments alleviating the impacts of climate change on biodiver-sity are regional and national networks of protected areas (PAs). However, speciesranges are moving poleward following the effects of changing climate (Parmesan2006; Huntley et al. 2007, 2008; Brommer et al. 2012), which poses challenges forthe PA networks, possibly decreasing their efficiency at preserving biota (Araújoet al. 2004; Hannah et al. 2007). Under shifting species distributions, PAs may ceaseto provide protection to those species for which they were originally established(Coetzee et al. 2009; Hole et al. 2009; Araújo et al. 2011).
The future efficiency of the PA network in preserving biodiversity under a chang-ing climate has been studied using modelled projections of species range shifts, andby comparing climatically suitable areas for the species at present and in the future(Hannah et al. 2007; Hole et al. 2009; Araújo et al. 2011). Such studies, employingso-called bioclimatic envelope models (BEMs), have provided important insightsinto potential species losses, turnover and gains in conservation areas, as well asgaps in the PA network (Heikkinen et al. 2006; Araújo and Peterson 2012).
Climate change-driven range shifts are expected to be the most pronounced atnorthern latitudes because of the greater temperature increase projected for theseregions (Jetz et al. 2007). For example, in Finland, according to the strongest climatechange scenario, the mean annual temperature will increase by as much as 7 °C by

Significance of Protected Area Network in Preserving … 379
2080 in comparison with the baseline period, 1961–1990 (Jylhä et al. 2004). Loarieet al. (2009) compared the world’s 14 main biomes and their PAs, demonstratingthat the so-called climate residence time will be among the lowest for PAs situatedin boreal forests by the year 2100. This would mean that the PAs of boreal forestsare likely to face the greatest climatic changes on a global scale. Moreover, speciesand communities in northern boreal and Arctic regions are at particular risk becausethe Arctic Ocean represents an effective natural barrier to northward range shifts.Virkkala et al. (2008) showed that bird species particularly susceptible to the effectsof climate warming are indeed those with distributions concentrated in the northernboreal or Arctic zones.
Given these forecasts, the magnitude of species turnover in the PAs of a borealbiome may be extensive following the large local and regional changes in climaticsuitability for the species, i.e. northern species retreating northwards will be replacedby new species from the south. The need for assessments of the impacts of climatechange on boreal biota is urgent due to the fact that landscapes and environmentsin northern Europe are also affected by diverse land use causing the degradation ofhabitats, such as intensive forest management, drainage of mires and wetlands, andultimately, fragmentation of a previously continuous forest landscape.
In this paper we first (Sections “General Patterns of Climate Change Effects onBird Species in Finland” to “Range Shifts of Birds in Relation to Dispersal Pat-terns”) summarise findings from recent studies on bird species distributional anddensity pattern changes with respect to PA network in northern Europe, and then(Section “Directions for Future Research”) discuss a number of insufficiently stud-ied research questions with respect to the conservation of birds in the changingnorthern environments. In the first sections, key findings come from our analyses ofboth the observed (1974–2010) and predicted changes (by 2051–2080) in boreal birdpopulations in Finland. Here, we will first assess whether the distributional changesof species are in line with the predictions of the climate change and secondly, if thechanges are more pronounced in unprotected than in protected areas, i.e. whether aPA network can be resilient in relation to climate change in preserving species of con-servation concern. In other words, the paper sheds light on the question of how wellwill the current PA network maintain bird species populations in the future givena rapidly changing northern European climate. In Section “Directions for FutureResearch” we discuss future prospects of species and PA vulnerability assessmentswhich can be used in developing climate-wise protected area networks. Conclusionsare presented in Section “Conclusions”. The paper focuses on birds and studies per-formed in northern Europe. Thus, the conclusions may not hold in other speciesgroups with different life histories and dispersal abilities, or in birds living in otherlocations with possibly less severe climatic changes and anthropogenic pressures.

380 R. Virkkala et al.
General Patterns of Climate Change Effects on Bird Speciesin Finland
Finland stretches 1100 km across the boreal biome of northern Europe and is lat-itudinally divided in the hemiboreal, southern boreal, middle boreal and northernboreal zone, with the northernmost parts of northern boreal being at the border ofthe subarctic zone (Fig. 1). PA network is largely concentrated in the northern borealzone and ismostly coveredwith coniferous (dominated by Scots pinePinus sylvestrisor Norway spruce Picea abies), mixed and deciduous (dominated mainly by birchBetula spp) forests, openmires (treeless peatlands), marshlands, andArcticmountainheaths.
In Finland, themeanweighted latitude of the observed population density of the 94most common land bird species has moved northwards, on average by 1.3 km year−1
from the 1970s to the 2010s (Virkkala and Lehikoinen 2014). The shift wasmore pro-nounced in northern species than in southern ones, but range shift based on presence-absence atlas data was more rapid in southern than in northern species (Brommeret al. 2012; Virkkala and Lehikoinen 2014). The difference can be explained by themethodology that was used: in the atlas data the extinction from a given grid cell atthe species’ southern range margin can be a slow process with a small bird popula-tion surviving for some time. Similarly, in Sweden the composition of boreal birdassemblage has been shown to respond to temperature changes with a time lag of1–3 year(s) (Lindström et al. 2013).
Studies based on BEMs using presence-absence bird atlas data from 1974 to1989 have suggested that northern-boreal bird species may face range contractionsof 74–82% by 2080 depending on the climate scenario for northern Europe (Virkkalaet al. 2008). Observed range shifts provide support for these predictions: the rangesof northern-boreal bird species that were predicted to contract by 2080 had alreadydeclined by 27% from 1974–89 to 2006–10 (Virkkala et al. 2014a)
Based on the Finnish national bird atlases compiled in 1974–1989 and 2006–2010,the recent range shifts in forest, mire, marshland and Arctic mountain heath birdspecies of conservation concern [including e.g. red-listed species, EU Bird Directivespecies (Annex I), species of European conservation concern; see Virkkala et al.(2013a) for details], aswell as the changes in their species richness in protected versusunprotected areas were compared (Virkkala et al. 2014b). The trends emerging fromthe atlas data comparisons were also related to the projected distributional changesof these species for the time slice of 2051–2080 (Virkkala et al. 2013a, b). The resultssuggest that the observed changes in bird distributions are in the same direction asthe BEM-based predictions, resulting in a decrease in species richness of (northern)mire and Arctic mountain heath species and an increase in (southern) marshlandspecies.

Significance of Protected Area Network in Preserving … 381
Fig. 1 Location of protected areas (red) in Finland. Light grey� southern boreal zone, middlegrey�middle boreal zone and dark grey�northern boreal zone. Hemiboreal zone in the south-western coast is included in the southern boreal zone
382 R. Virkkala et al.
The Role of Protected Areas in Preserving Bird SpeciesPopulations
Virkkala and Rajasärkkä (2011a) examined changes in bird populations in a setof 96 Finnish PAs based on transect count observations. Their results showed thatpopulations of southern species had increased by 29%while those of northern specieshad declined by 21% between 1981–1999 and 2000–2009. These changes were mostpronounced near the species range boundaries: southern birds increased most innorthern PAs and northern species decreased most notably in southern PAs (Virkkalaand Rajasärkkä 2011b). In particular, species breeding on open mires and in Arcticmountain heaths in northernFinlandhavedecreased. It appears that species inhabitingPAswhere the focal habitatsmay change rapidly because of climate change (e.g. openmires and mountain heaths) have more difficulties in maintaining their populationsthan species occupying PAs where the time lags in climate change-induced habitatalterations are longer (as in old-growth forests) (Virkkala and Rajasärkkä 2012).
The observed changes in species richness between the two time slices (1974–1989and2006–2010)were in general parallel in protected andunprotected areas.However,protected areas maintained a higher level of species richness than unprotected areas(Virkkala et al. 2014b). Moreover, when examining the population density changesof bird species, it appears that northern cold-adapted species have declinedmuch lesswithin than outside PAs (Santangeli et al. 2017). These findings provide support forthe significance and resilience of PA networks in preserving species diversity underclimate change. Similar results were also presented in France, demonstrating thatthe more a bird species benefited from PAs, the less vulnerable it was to temperaturechanges (Gaüzère et al. 2016).
Within the boreal zone, the ranges of species of conservation concern are predictedto shift dramatically during the 21st century. For example, the ranges of forest species(measured as probability of occurrence) currently situated in the southern borealzone are predicted to move towards the middle and northern boreal zones (Virkkalaet al. 2013a). The ranges of all species groups occurring in different habitats (exceptmarshland birds) are predicted to decrease by 2051–2080, with the decline beinggreatest in southern boreal and smallest in northern boreal zone. This is becausespecies presently occurring in the southern boreal zone are predicted to move to thenorthern boreal zone partly compensating for the predicted decline of the northernboreal species. In contrast, southern Finland is projected to face a general decline insouthern boreal birds. This is because species found e.g. in the Baltic countries willapparently not be able to compensate for the projected losses in southern Finland.Thus, the ranges of the species are predicted to shift northwards, but the potential gainof expanding southern species of conservation concern (occurring presently south ofFinland) will apparently not compensate for the loss of the present boreal species.Overall, a high bird species turnover is predicted to occur in the 21st century and wasalready observed in Finland between 1974 and 2010 (Virkkala andLehikoinen 2017).For species living in forests, mires and mountain habitats, the changes are predicted

Significance of Protected Area Network in Preserving … 383
to be slightly greater in unprotected than in protected areas. Thus, a representative PAnetwork that includes high cover for key habitats is needed in all latitudinal zones.
Virkkala et al. (2013b) expanded on the finding of earlier studies by relating birdspecies occurrences to the amount of habitat preferred in the PAs in the differentboreal zones. Here, a novel integrated habitat suitability index was employed toaccount jointly for the projected species’ probability of occurrence and the avail-ability of suitable habitat (Virkkala et al. 2013b). Based on this suitability index, thedistribution of suitability hotspots (topmost 5%) were determined for birds living inforests, open mires, marshlands and Arctic mountain heaths in 1971–2000 and underthree climate change scenarios (IPCC SRES scenario: B1, A1B, A2). The locationsof the suitability hotspots were compared with the locations of reserves with thegreatest amounts of the four habitats to assess the efficiency of the PA network. Forspecies inhabiting mires, marshlands and Arctic mountain heaths, a high proportionof protected habitat was included in the 5% hotspots in the scenarios for 2051–2080,showing a goodmatch between current PAs and suitability hotspots in 2051–2080. Incontrast, in forests in the southern and middle boreal zones, only a small proportionof the protected habitat was included in the 5% hotspots, indicating that the efficiencyof the current PA network will be insufficient for forest birds in the future (Virkkalaet al. 2013b). This is because only 2.3% in the southern boreal zone and only 3.7%in the middle boreal zone are included in the protected areas whereas 23% of forestsin the northern boreal zone are protected (Virkkala et al. 2013a).
In the northern boreal zone, the predicted efficiency of the reserve network inforests was highly dependent on the forcefulness of projected climate change. In thenorthern boreal zone the extent of PAs ismuch higher than in the south (see Fig. 1), butdue to the concentrated location of the areas, the significance of PAs for maintainingforest bird species (of conservation concern) emerges particularly under the strongestscenario: A2 (Virkkala et al. 2013b). The concentrated level of forest protection inthe northernmost part of the northern boreal zone raises an interesting dilemma: ina mild climate change scenario, the PA network is clearly inefficient, while in astrong climate change scenario it preserves, on average, species occurrences muchmore effectively precisely because southern forest species are expected tomovemoretowards the north as a result of climate change (Virkkala et al. 2013b). However, theextinction of northern species should be the most profound according to the strongestclimate change scenario (Virkkala et al. 2008). Thus, there is no single solution forpreserving biodiversity in a changing climate, but several future pathways should beconsidered.
Range Shifts of Birds in Relation to Dispersal Patterns
PAs have been observed to facilitate the species’ range expansions of various species(Thomas et al. 2012), which is a key issue when analysing the future significance ofPA networks for biodiversity given a changing northern European climate. IndividualPAs can act as stepping stones for creating a suitable breeding habitat (Thomas and
384 R. Virkkala et al.
Gillingham 2015). In Finland, certain habitats, such as old-growth forests and manymire and wetland types, can nowadays only be found in PAs due to intensive forestryand other land use practices outside PAs. For species specialised to these habitats,the PA network is indispensable.
The dispersal ability of bird species is, in general, fairly good in relation to manyother species groups, although certain resident forest species can be quite poor dis-persers [e.g. Siberian jay Perisoreus infaustus (Griesser et al. 2014)]. Good dispersalability of individual birds enables shifts in a species range, but intensive land useleading to the degradation and fragmentation of habitats may restrict bird speciesrange shifts following the effects of climate change (see Virkkala and Lehikoinen2017). In addition to northern species (such as the Siberian jay), some southern birdspecies have also declined and their ranges have retreated. This may suggest that notall southern species may track climate change due to the scarcity of suitable habitatnorth of their present range. In general, species richness is predicted to increase inthe northern latitudes as more southern species expand their ranges northwards (seeHuntley et al. 2007). However, in Finland the total amount of bird species richnessdid not change in 10 km grid cells in a clearly warming period from 1974–1989to 2006–2010. Thus, southern species have not expanded as quickly as might beexpected as a result of climate change (Virkkala and Lehikoinen 2017; for the futurepredictions of southern species, see Section “The Role of Protected Areas in Preserv-ing Bird Species Populations”). Moreover, in Finland 128 land bird species shiftedtheir mean weighted densities between 1970–1989 and 2000–2012 by 37 km to thenorth north-east while the mean annual temperature shifted on average 186 km inthe same direction. Thus, the speed of climate change is occurring almost five timesmore quickly than the speed of density shifts (Lehikoinen and Virkkala 2016).
Directions for Future Research
Abundance and Vulnerability Studies
The studies discussed above have mainly examined the recent range shifts inbird species, or forecasted future distributions using bioclimatic envelope models(BEMs). Studying the magnitude of projected changes in remaining, new and over-lapping (present-future) suitable areas allows to asses species’ exposure to the effectsof climate change (Foden et al. 2013; Reside et al. 2016). However, while BEMsprovide useful estimates of potential changes, forecasts for the relative suitabilityof different regions and individual PAs for a species may be improved by includingmeasures of abundance in the models (Howard et al. 2014). Importantly, abundance-based models assist in the identification of PAs, which can harbour sufficiently largepopulations, thus lowering the local extinction risk. Suchmodels have been applied tobirds in the UK, revealing vital insights into the projected future population declinesof species and the long-term representativeness of PAs (Johnston et al. 2013). In

Significance of Protected Area Network in Preserving … 385
northern biomes, abundance-based data prioritisations of current and future impor-tant areas for bird conservation are still lacking, constituting one obvious knowledgegap. Data permitting, the inclusion of breeding success in the bird species modelswould alsomake it easier to identify PAswith the highest potential for long-term pop-ulation persistence (Suárez-Seoane et al. 2017). However, the collection of breedingsuccess data may need to be targeted to particular species of conservation concerndue to the considerably high resource demands.
It is increasingly acknowledged that climate change exposure assessments forspecies should be complemented with an examination of two other vulnerabilitymeasures: species’ adaptive capacity (ability to avoid the impacts of climate changethrough dispersal and/or evolutionary change) and sensitivity (limited potential topersist in situ under changing climate) to climate change. In a case-in-point study,Foden et al. (2013) developed vulnerability assessments for the world’s 9856 birdspecies. In their work, sensitivity was determined based on characteristics such ashabitat specialisation, narrow environmental tolerance and rarity, low adaptive capac-ity based on, e.g. poor dispersal potential, and limited evolutionary potential due to,e.g. low genetic diversity or low reproductive output. Bird studies focusing on certainbiomes (Reside et al. 2016) or regions (Case et al. 2015) have largely employed sim-ilar vulnerability criteria, along with some other criteria, such as dietary breadth andspecies’ physiological sensitivity. Corresponding studies from northern biomes arelargely lacking. Clearly, new studies on this topic could help in assessing which birdspecies are among the most vulnerable in boreal environments and which life historytraits make them sensitive in the face of climate change. For example, although birdsare more mobile than many other species groups, there are between-species differ-ences in their dispersal ability, potentially affecting their range expansion capacityand colonisation of isolated PAs (Huntley et al. 2008; Reside et al. 2016).
Two take-home messages emerge from the vulnerability studies. First, a speciesmay be vulnerable due to its limited adaptive capacity or high degree of sensitivity,even if it is only slightly exposed to climate change, and also due to other combi-nations of vulnerability criteria. Most importantly, sole exposure-based assessmentsmay either overestimate or underestimate climate change impacts, and different per-spectives are required to reveal hidden vulnerabilities (Reside et al. 2016). Second,the combined use of three criteria makes it possible to identify the species mostat risk, i.e. species that are highly sensitive, that are highly exposed and that havelowest adaptive capacity (Foden et al. 2013). Such information facilitates targetingconservation interventions not only for the most vulnerable species, but also for theareas and PAs harbouring the largest concentrations of those particular species. Trait-based analysis can also be linked to observed changes in species distributions (Pacificiet al. 2017). Thomas and Gillingham (2015) reviewed the numerous positive casesof species being able to colonise new PAs; such information could also be linkedwith species’ life histories to determine traits that either support the colonisation ofnew areas or severely obstruct it.
Habitat preferences of bird species may limit their ability to adapt to climatechange not only because of their fidelity to a specific habitat but also due to differ-ences in the rate of projected habitat changes relevant for the species. For example,
386 R. Virkkala et al.
forest dwelling species are not generally subjected to rapid environmental changesin protected forests, but, on the other hand, the colonisation of old-growth forestmay be delayed in currently sparsely wooded PAs due to the slow succession rateof forests. In contrast, the overgrowth of open alpine areas and grasslands is a rapidprocess which has been considered as one key threat to open habitat bird species(Chamberlain et al. 2013) (see also Virkkala and Rajasärkkä 2012 and Section “TheRole of Protected Areas in Preserving Bird Species Populations” above).
Importance of Matrix and Protected Areas’ Characteristics
Assessing the representativeness of PA networks in a changing climate requiresresearch also on two other topics: the landscape matrix around the PAs and thebiogeophysical features of the PAs themselves. Häkkilä et al. (2017) examined theeffects of land use intensity in the surrounding matrix on the diversity of bird speciesin boreal PAs. They showed that low intensity forest management in the matrixsupported the well-being of a wide range of specialised bird species in the PAs,indicating the challenges for boreal forest reserves to maintain the full range of birddiversity in degraded landscapes. Similar studies could also be conducted for othernorthern ecosystems, including peatland, wetland and alpine communities in the PAnetwork. Equally important would be more in-depth examinations of the impactson the quality of a dynamically changing matrix and its interactions with climaticchange, as these two drivers may jointly have amplified effects on the efficacy of PAs(Sieck et al. 2011). Indeed, Beale et al. (2013) have shown that while recent spatialchanges in climatically suitable areas have driven the broad patterns of distributionalchanges, colonisation preferentially occurs in less degraded areas with a higherproportion of PAs. Land use scenarios indicate that many PAs are likely to losenatural vegetation in their surroundings due accelerating human impacts (Gimonaet al. 2012; Martinuzzi et al. 2015). These prospects highlight the importance ofbuffering PAs (Sieck et al. 2011) but they also identify the PAs which are projectedto be hardest hit by the joint impacts of matrix and climate change.
Intensified land use in the matrix may also have negative impacts on species’ abil-ity to move to the new PAs as suitable habitats becomemore fragmented and isolatedin the intervening landscape (Sieck et al. 2011) and the overall ecological connectiv-ity of the network deteriorates (Gimona et al. 2012). A key target for climate-wisespecies conservation is the planning of a network of readily reachable, biodiversity-friendly managed sites that can serve as stepping stones in the process (Huntley et al.2008). The importance of such a stepping stone or metapopulation network dependson species’ dispersal ability, which is more critical for resident birds and species withlow gap-crossing propensity than for migratory birds (see also Section “Range Shiftsof Birds in Relation to Dispersal Patterns”). However, further research is requiredon how dispersal ability, in association with other important traits, such as habi-tat specialisation and sensitivity to temporal weather perturbations, affect species’range shifting and colonisation processes across the dynamically altering matrix and

Significance of Protected Area Network in Preserving … 387
under varying climatic conditions. Such studies would make it possible to determineareas where the landscape matrix severely hampers many species from tracking thespatial changes in their climate space, which potentially would require interventionssupporting species dispersal.
The characteristics of the PAs themselves also affect species persistence. Onebasic principle is that smaller PAs are able to support smaller populations of species.Additionally, climate change may affect the strength of the density dependence regu-lating a population, and this can influence local populations in smaller PAs differentlythan in larger ones. Thus, the highly variable climate projected for future years mayimpede in a temporally varying population from returning to former population lev-els most strongly small PAs (Crick 2004), causing increased risk of local extinctions.However, new research is required to better understand the links between extremeweather events and population fluctuations and crashes, and particularly how wellspecies with different traits are buffered against the environment-driven fluctuations.
Increased topographic and habitat heterogeneity within PAs will supposedly sup-port higher species richness and also provide increased chances for local popula-tions to survive due to the wider availability of different microclimates buffering theimpacts of climatic variations (Thomas andGillingham 2015).Moreover, topograph-ically heterogeneous PAs may help species to avoid misusing phenological triggersand the associated temporal mismatches between trophic levels (Crick 2004). How-ever, studies of this sort are in short supply for northern biomes. There is also a needto link such studies with the life histories of species to be able to recognise whattypes of bird species the environmentally variable PAs benefit the most. In addition,little is known about the extent of which environmentally diverse PAs offer sufficientlong-term protection to bird species because the local temperature variations, even intopographically variable PAs, will usually not compensate for the projected increasesin regional temperatures towards the end of this century (Ackerly et al. 2010). Thisagain highlights the importance of the ability of species to migrate to new areas andPAs.
Conclusions
This paper shows evidence of climate change effects on northern European birds,underpinning the facts that species are shifting their ranges towards north with rangesizes of many species declining and that these changes are different in northern andsouthern species and in species occupying different habitats. Importantly, speciesdecline less within than outside PAs showing that protected areas alleviate climatechange effects on bird species of conservation concern. This finding, further sup-ported by results from elsewhere in Europe, provides evidence for the resilience ofPA networks in preserving species under climate change. Representative PA networkthat includes high cover for key habitats is hence needed in all latitudinal zones. Theprojected efficiency of the PA network in maintaining biodiversity was partly depen-dent on the strength of climate change varying with respect to future scenarios. This
388 R. Virkkala et al.
suggests that a flexibly adaptive climate-wise conservation planning is required to bebetter prepared for preserving biodiversity in the face of uncertain climatic change.
The paper discusses several aspects of climate change studies and avian biodi-versity that have been hitherto understudied especially in the northern biomes. Wesuggest that future studies should concentrate on (1) abundance-based models andprioritisations, (2) species’ adaptive capacity (ability to avoid the impacts of climatechange through dispersal and/or evolutionary change) and sensitivity (limited poten-tial to persist in situ under changing climate) to climate change, (3) the role of thelandscape matrix around the PAs and (4) the effects of the biogeophysical featuresof the PAs.
In conclusion, we envision that improved assessments regarding the ability ofPA networks to maintain biodiversity in northern biomes, as well as the climate-wise conservation planning under climate change in general, require more in-depthexaminations of the different risk sources, ranging from species exposure to climatechange and their traits to the impacts of the biogeophysical features of PAs andland use on the matrix. Such cross-cutting analyses will help researchers distinguishbetween areas where the different climate change-based risks are low or moderateand areas where many climatically vulnerable species coincide with PAs with alowered buffering potential and severely degraded matrix. Such maximal risk areasmay require major restoration measures to increase their value in the PA network.
Acknowledgements Our work was financially supported by the Finnish Ministry of the Environ-ment through the SUMI project (Protected area network in the changing climate).
References
Ackerly DD, Loarie SR, Cornwell WK, Weiss SB, Hamilton H, Branciforte R, Kraft NJB (2010)The geography of climate change: implications for conservation biogeography. Divers Distrib16(3):476–487
Araújo MB, Peterson AT (2012) Uses and misuses of bioclimatic envelope modeling. Ecology93(7):1527–1539
Araújo MB, Cabeza M, Thuiller W, Hannah L, Williams PH (2004) Would climate change drivespecies out of reserves? An assessment of existing reserve-selection methods. Glob Change Biol10(9):1618–1626
Araújo MB, Alagador D, CabezaM, Nogues-Bravo D, Thuiller W (2011) Climate change threatensEuropean conservation areas. Ecol Lett 14(5):484–492
Beale CM, Baker NE, Brewer MJ, Lennon JJ (2013) Protected area networks and savannah birdbiodiversity in the face of climate change and land degradation. Ecol Lett 16(8):1061–1068
Bellard C, Bertelsmeier C, Leadley P, Thuiller W, Courchamp F (2012) Impacts of climate changeon the future of biodiversity. Ecol Lett 15(4):365–377
Brommer JE, Lehikoinen A, Valkama J (2012) The breeding ranges of Central European and Arcticbird species move poleward. PLoS One 7(9):e43648
Case MJ, Lawler JJ, Tomasevic JA (2015) Relative sensitivity to climate change of species innorthwestern North America. Biol Cons 187:127–133

Significance of Protected Area Network in Preserving … 389
Chamberlain DE, Negro M, Caprio E, Rolando A (2013) Assessing the sensitivity of alpine birdsto potential future changes in habitat and climate to inform management strategies. Biol Cons167:127–135
CoetzeeBWT,RobertsonMP,ErasmusBFN, vanRensburgBJ, ThuillerW (2009) Ensemblemodelspredict important bird areas in southern Africa will become less effective for conserving endemicbirds under climate change. Glob Ecol Biogeogr 18(6):701–710
Crick HQP (2004) The impact of climate change on birds. Ibis 146(s1):48–56Foden WB, Butchart SHM, Stuart SN, Vié J-C, Akçakaya HR, Angulo A, DeVantier LM, GutscheA, Turak E, Cao L, Donner SD, Katariya V, Bernard R, Holland RA, Hughes AF, O’HanlonSE, Garnett ST, Sekercioglu CH, Mace GM (2013) Identifying the world’s most climate changevulnerable species: a systematic trait-based assessment of all birds, amphibians and corals. PLoSOne 8(6):e65427
Gaüzère P, Jiguet F, Devictor V (2016) Can protected areas mitigate the impacts of climate changeon bird’s species and communities? Divers Distrib 22(6):625–637
Gimona A, Poggio L, Brown I, Castellazzi M (2012) Woodland networks in a changing climate:threats from land use change. Biol Cons 149(1):93–102
Griesser M, Halvarsson P, Sahlman T, Ekman J (2014) What are the strengths and limitations ofdirect and indirect assessment of dispersal? Insights from a long-term field study in a group-livingbird species. Behav Ecol Sociobiol 68(3):485–497
HäkkiläM, LeTortorec E, Brotons L, RajasärkkäA, TornbergR,MönkkönenM (2017)Degradationin landscapematrix has diverse impacts on diversity in protected areas. PLoSOne 12(9):e0184792
Hannah L, Midgley G, Andelman S, Araújo M, Hughes G, Martinez-Meyer E, Pearson R,WilliamsP (2007) Protected area needs in a changing climate. Front Ecol Environ 5(3):131–138
HeikkinenRK, LuotoM,AraújoMB,Virkkala R, ThuillerW, SykesMT (2006)Methods and uncer-tainties in bioclimatic envelopemodelling under climate change. Prog PhysGeogr 30(6):751–777
Hole DG, Willis SG, Pain DJ, Fishpool LD, Butchart SHM, Collingham YC, Rahbek C, HuntleyB (2009) Projected impacts of climate change on a continent-wide protected area network. EcolLett 12(5):420–431
Howard C, Stephens PA, Pearce-Higgins JW, Gregory RD, Willis SG (2014) Improving speciesdistribution models: the value of data on abundance. Methods Ecol Evol 5(6):506–513
Huntley B, Green RE, Collingham YC, Willis SG (2007) A climatic atlas of European breedingbirds. Durham University, The RSPB and Lynx Edicions, Barcelona
Huntley B, Collingham YC, Willis SG, Green RE (2008) Potential impacts of climate change onEuropean breeding birds. PLoS One 3(1):e1439
Jetz W, Wilcove DS, Dobson AP (2007) Projected impacts of climate and land-use change on theglobal diversity of birds. PLoS Biol 5(6):1211–1219
Johnston A, Ausden M, Dodd AM, Bradbury RB, Chamberlain DE, Jiguet F, Thomas CD, CookASCP, Newson SE, OckendonN, RehfichMM,Roos S, Thaxter CB, BrownA, CrickHQP, DouseA, McCall RA, Pontier H, Stroud DA, Cadiou B, Crowe O, Deceuninck B, Hornman M, Pearce-Higgins JW (2013) Observed and predicted effects of climate change on species abundance inprotected areas. Nat Clim Change 3:1055–1061
Jylhä K, Tuomenvirta H, Ruosteenoja K (2004) Climate change projections for Finland during the21st century. Boreal Environ Res 9(2):127–152
Lehikoinen A, Virkkala R (2016) North by northwest: climate change and directions of densityshifts in birds. Glob Change Biol 22:1121–1129
Lindström Å, Green M, Paulson G, Smith HG, Devictor V (2013) Rapid changes in bird commu-nity composition at multiple temporal and spatial scales in response to recent climate change.Ecography 36(3):313–322
Loarie SR, Duffy PB, Hamilton H, Asner GP, Field CB, Ackerly DD (2009) The velocity of climatechange. Nature 462(7276):1052–1055
Martinuzzi S, Radeloff VC, Joppa LN, Hamilton CM, Helmers DP, Plantinga AJ, Lewis DJ (2015)Scenarios of future land use change aroundUnitedStates’ protected areas. BiolCons 184:446–455

390 R. Virkkala et al.
Pacifici M, Visconti P, Butchart SHM, Watson JEM, Cassola FM, Rondinini C (2017) Species’traits influenced their response to recent climate change. Nat Clim Change 7(3):205–218
Parmesan C (2006) Ecological and evolutionary responses to recent climate change. Annu Rev EcolEvol Syst 37:637–669
Reside AE, Vanderwal J, Garnett ST, Kutt AS (2016) Vulnerability of Australian tropical savannabirds to climate change. Austral Ecol 41(1):106–116
Santangeli A, Rajasärkkä A, Lehikoinen A (2017) Effects of high latitude protected areas on birdcommunities under rapid climate change. Glob Change Biol 23(6):2241–2249
Sieck M, Ibisch PL, Moloney KA, Jeltsch F (2011) Current models broadly neglect specific needsof biodiversity conservation in protected areas under climate change. BMC Ecol 11:1–12
Suárez-Seoane S, Álvarez-Martinez JM, Wintle BA, Palacín C, Alonso JC (2017) Modelling thespatial variation of vital rates: An evaluation of the strengths andweaknesses of correlative speciesdistribution models. Divers Distrib 23(8):841–853
Thomas CD, Gillingham PK (2015) The performance of protected areas for biodiversity underclimate change. Biol J Lin Soc 115(3):718–730
Thomas CD, Cameron A, Green RE, Bakkenes M, Beaumont LJ, Collingham YC, Erasmus BFN,de Siqueira MF, Grainger A, Hannah L, Hughes L, Huntley B, van Jaarsveld AS, Midgley GF,Miles L, Ortega-Huerta MA, Peterson AT, Phillips OL, Williams SE (2004) Extinction risk fromclimate change. Nature 427(6970):145–148
Thomas CD, Gillingham PK, Bradbury RB, Roy DB, Anderson BJ, Baxter JM, Bourn NAD, CrickHQP, FindonRA, FoxR,Hodgson JA,Holt AR,MorecroftMD,O’HanlonNJ, Oliver TH, Pearce-Higgins JW, Procter DA, Thomas JA, Walker KJ, Walmsley CA, Wilson RJ, Hill JK (2012) Pro-tected areas facilitate species’ range expansions. Proc Natl Acad Sci U SA 109(35):14063–14068
Thuiller W, Lavorel S, Araújo MB, Sykes MT, Prentice IC (2005) Climate change threats to plantdiversity in Europe. Proc Natl Acad Sci U S A 102(23):8245–8250
Thuiller W, Pironon S, Psomas A, Barbet-Massin M, Jiguet F, Lavergne S, Pearman PB, Renaud J,Zupan L, Zimmermann NE (2014) The European functional tree of bird life in the face of globalchange. Nat Commun 5:3118
Virkkala R, Lehikoinen A (2014) Patterns of climate-induced density shifts of species: polewardshifs faster in northern boreal birds than in southern birds. Glob Change Biol 20(10):2995–3003
Virkkala R, Lehikoinen A (2017) Birds on the move in the face of climate change: high speciesturnover in northern Europe. Ecol Evol 7(20):8201–8209
Virkkala R, Rajasärkkä A (2011a) Climate change affects populations of northern birds in borealprotected areas. Biol Let 7(3):395–398
Virkkala R, Rajasärkkä A (2011b) Northward density shift of bird species in boreal protected areasdue to climate change. Boreal Environment Research 16(suppl. B):2–13
Virkkala R, Rajasärkkä A (2012) Preserving species populations in the boreal zone in a changingclimate: contrasting trends of bird species groups in a protected area network. Nat Conserv 3:1–20
Virkkala R, Heikkinen RK, Leikola N, Luoto M (2008) Projected large-scale range reductions ofnorthern-boreal land bird species due to climate change. Biol Cons 141(5):1343–1353
Virkkala R,HeikkinenRK, Fronzek S,KujalaH, LeikolaN (2013a)Does the protected area networkpreserve bird species of conservation concern in a rapidly changing climate? Biodivers Conserv22(2):459–482
Virkkala R, Heikkinen RK, Fronzek S, Leikola N (2013b) Climate change, northern birds of con-servation concern and matching the hotspots of habitat suitability with the reserve network. PLoSOne 8(6):e63376
Virkkala R, Heikkinen RK, Lehikoinen A, Valkama J (2014a) Matching trends between recentdistributional changes of northern-boreal birds and species-climate model predictions. Biol Cons172:124–127
Virkkala R, Pöyry J, Heikkinen RK, Lehikoinen A, Valkama J (2014b) Protected areas alleviate cli-mate change effects on northern bird species of conservation concern. Ecol Evol 4(15):2991–3003

Wild Power, Biodiversity and SolarFarms: A Business Model to EncourageClimate Change Mitigationand Adaptation at Scale
David Gazdag and Guy Parker
Abstract The UK is facing a sustained decline in biodiversity while struggling tomeet its targets for renewable energy production. Wild Power is a new approachto renewable energy supply that requires native biodiversity to be restored on itsgenerating sites as a core component of the business model. A customer pays a smallpremium which is used to encourage biodiversity, and in return receives a guaranteeof renewable energy supply and biodiversity benefit. Solar farms are the ideal vehiclefor delivering biodiversity benefits as the panels oversail the land, most of which isavailable for ecological enhancement. Furthermore, solar farms are spread acrossthe landscape and collectively cover a significant land area. Core to Wild Power’sapproach is engaging local communities with solar farms to raise awareness of themultiple benefits of this technology, but also as a means of reconnecting people withnature. The Wild Power approach has been designed for UK solar farms, with aimto expand to wider renewable technologies, and countries in time. It is believed thatthis approach is novel and has global implications for biodiversity and sustainabledevelopment. This chapter presents the Wild Power model and describes its intent toencourage renewable energy as a means of mitigating climate change and promoteadaptation through the creation of biodiversity-rich sites that should also enhanceecosystem services delivery.
D. Gazdag (B)Wild Power Ltd., Bank House, Southwick Square, Southwick, West Sussex BN42 4FN, UKe-mail: [email protected]: http://www.wildpower.org
G. ParkerWychwood Biodiversity Limited, Damerells Combe, Aveton Gifford TQ74NQ, UKe-mail: [email protected]
© Springer Nature Switzerland AG 2019W. Leal Filho et al. (eds.), Handbook of Climate Change and Biodiversity,Climate Change Management, https://doi.org/10.1007/978-3-319-98681-4_24
391

392 D. Gazdag and G. Parker
The UK’s Biodiversity Decline
Recent studies indicate that the UK’s biodiversity decline is even greater than theglobal average (Hayhowet al. 2016). Between 2002 and 2013, it is estimated that 53%ofUK species declined (Hayhow et al. 2016). This decline is attributed to agriculturalpractices as well as pressures from climate change. Habitat fragmentation throughagricultural development appears to exacerbate biodiversity loss (Fahrig 2003). Newevidence suggests climate change effects may be accelerated with the slowing ofthe Gulf Stream (Caesar et al. 2018). Clearly there is need for urgent mitigation ofclimate change and biodiversity loss.
Solar Farms and Climate Change Mitigation
Solar power has the ability to mitigate the effects of climate change. Solar photo-voltaics are among the best ways to decarbonise the electricity production, beingscalable and relatively easy to develop. A single 5 MW site saves around 2150 tonsof CO2 (STA 2018) as compared to UK baseline electricity generation per annum,which over the 25-years lifespan of a solar farm equates to a saving of around 54,000tons.
Solar power has rapidly expanded in the UK since 2010, with large scale groundmounted solar being responsible for around 8.6 GW of energy generation today.There are more than 1200 utility scale solar farms spread across the UK (Fig. 1),covering an estimated 19,000 ha (Scurlock, NFU; pers. comm.). In combination,they significantly contribute to the UK’s targets to reduce CO2 generation by 80%in 2050.
Many solar farms were built on former arable land. When land is converted fromarable production to permanent grassland (the typical land cover for a solar farmin the UK), it has the potential to switch from being a net producer of carbon (acarbon ‘source’) to a net receiver of carbon (a carbon ‘sink’). Arable fields producecarbon through all the intensive inputs required to grow a crop, including chemicalfertilisers, pesticides and machinery time. By contrast, permanent grassland requiresfew inputs and produces a thickmat of vegetationwhich is effective at storing carbon.While the overall reduction in CO2 may be small (around 1 ton/ha or less than 1%of the reduction due to renewable energy production (POST 2015; FAO 2010) thiseffect can be significant at the national and global level and should contribute to thelong-term Paris goals for negative emissions.

Wild Power, Biodiversity and Solar Farms: A Business Model … 393
Fig. 1 Map of large scale solar deployment (planned and constructed) in the UK from April 2017(Source BEIS Renewable Energy Planning Database, 2017)
Solar Farms and Climate Change Adaptation
Solar farms also have the ability to contribute to climate change adaptation, to coun-teract the changes to the environment caused by climate change. The likely effectsof climate change upon the UK include increases in temperature, changes in theseasonality of rainfall, and an increased frequency of extreme events such as floods,with knock-on effects for the distribution and density of native biodiversity.
Where solar farms were constructed on former arable land, converting the landcover to permanent grassland should reduce the risk of flooding and erosion eventsby creating a stable, permanent and well-vegetated ground surface.
If traditional grasses or wild flowers (e.g. fine grasses and herbs) have been estab-lished, this form of vegetation tends to be more drought resistant than agriculturalcrops or pasture grasses, since wild flowers and fine grasses tend to have deeper
394 D. Gazdag and G. Parker
roots. Such areas are more likely to resist single severe drought events or multiplesmall drought events.
Where solar farms are managed to encourage wildlife, they should provide refugefor a variety of native plants, invertebrates, reptiles and birds (Montag et al. 2015).A network of solar farms managed for wildlife spread across the landscape shouldsupport adaptation of wildlife to climate change which requires space and a varietyof habitats in order to adapt to shifts in range.
Finally, sites that are rich in biodiversity are likely to provide a range of ecosystemservices for the benefit of society. These services are likely to support agriculturalproduction, as discussed later in this chapter.
Solar Farms and Biodiversity
The relationship between solar farms, land management and biodiversity has beenthe focus of recent studies and there exists a small but growing evidence base aswell as a large body of independent research into parallel agri-environment schemes.Recent evidence suggests solar farms can provide positive benefits for biodiversitywhere creation of native habitats, including species rich grasslands, hedgerows andwetlands has been undertaken (Montag et al. 2015).
Biodiversity gains from such management approaches can include a higher diver-sity of botanical species, a higher abundance of common species of butterfly andbumblebee, and a higher diversity of breeding birds, including greater abundance ofspecies of conservation concern (Montag et al. 2015).
The solar industry, in developing its approach to biodiversity, has borrowed landmanagement options from the UK’s agri-environment schemes (BRE 2014). Optionssuch as grassland field margins and native species-rich hedgerows can fit well aroundsolar infrastructure and have been recognised as priority habitats for the UK Bio-diversity Action Plan (JNCC 2012). Field margins can harbour arable wild flowerssuch as shepherd’s needle, corncockle, broadleaved spurge, cornflower, corn butter-cup and pheasant’s-eye which are rare in the wild. In turn, wild flowers are importantsources of nectar and pollen for bumblebees, wasps and butterflies. Grasshoppersand beetles take cover in the grasses, along with many beneficial predators, such asspiders and ladybirds, which feed on crop pests like aphids (Wildlife Trusts 2018).Such invertebrate rich habitats provide foraging for birds and small mammals.
Adoption of biodiversity-focused land management is fairly limited within thesolar industry at present. Wild Power’s approach is to promote the adoption of agri-environment style options for land management, but also to encourage the creationof rare habitat types such as species rich limestone or acid grassland, which havedeclined greatly in the past century and which have resulted in associated specieslike the Adonis blue butterfly having been virtually extirpated from the UK.

Wild Power, Biodiversity and Solar Farms: A Business Model … 395
Ecosystem Services
Society benefits from nature in a multitude of ways in the form of food production,the provisioning of clean drinking water, the decomposition of wastes, and the pol-lination of crops amongst many others. These benefits, termed ‘ecosystem services’contribute to human wellbeing and economic wealth (Millenium Ecosystem Assess-ment 2005). Ecosystem services are all underpinned by biodiversity, which can be,depending on the definition, a regulator of ESs, a final ESs or a good (Mace et al.2012)
Solar farms that encourage biodiversity have the potential to supply a range ofecosystem services, including carbon sequestration, water cycling, crop pest preda-tion and pollination. Research on solar farms and ecosystem services is currentlylimited, but it is possible to draw upon wider research undertaken on UK agriculture.
The SPIES project—Solar Park Impacts on Ecosystem Services (Armstrong andWhite 2018) has collated evidence on ecosystem service benefits from a range ofdifferent landmanagement options. Landmanagers can use this decision-support toolto assess the impacts of different management approaches on ecosystem services.The evidence is sourced from a database of scientific papers, mainly concerned withagri-environment schemes, including the habitat options already mentioned above.
The SPIES tool is being used by Wild Power as a mean of assessing the valueof different land management options for ecosystem service provision. To give anexample, SPIES determines that creating field margins should positively impact thefollowing ecosystem services: climate regulation, pollination regulation, water qual-ity and flood regulation—along with maintaining habitats and biodiversity. Plantingandmaintaining hedges should positively impact habitats for biodiversity, pollinationregulation and pest and disease regulation.
SPIES also considers cultural ecosystem service values such as recreational andaesthetic interactions, which for Wild Power, and for the solar industry more gener-ally, can be an important component of public acceptance of a project.
It is likely that ecosystem services generated on a solar farm would not onlybenefit the solar farm itself, but should also support agricultural production in thesurrounding landscape. It is not currently possible to say to what degree birds andinsects associatedwith a biodiverse solar farmmay have a positive benefit as crop pestpredators upon surrounding arable land. In addition, it is not possible to determinethe influence of pollinators with increasing distance from a source habitat. However,independent research is under way to address these knowledge gaps. For example,a study launched in 2017 is investigating the potential for strips of wild flowersplanted within arable crops to encourage crop pest predators and so reduce pesticideuse (Guardian 2018).

396 D. Gazdag and G. Parker
Pollination
Pollination is among the best studied ecosystem service in the UK and is affordedmore specific attention here. The majority of global, and European, biodiversityis made up of insects, but still relatively little is known about the distribution andabundance of most species, and even less about their dynamics and the threats theyface (Potts et al. 2015). This lack of knowledge on the status and trends of themajorityof Europe’s species is of concern and is particularly important for species that playimportant functional roles, such as pollinators.
Wild pollinators in Europe are dominated by 2000 species, including bumblebeesand solitary bees, hoverflies, butterfly, beetle and other fly species. Declines in wildbees and hoverflies have been clearly documented in the Netherlands and the UKwhere monitoring has taken place (Potts et al. 2015).
According to SPIES, maintaining wild flower/nectar seed meadows andhedgerows, connecting habitats, creating buffer zones/filed margins, ceasing pes-ticide/fertilizer use and grazing later in the year are all management steps that shouldenhance pollinators, and would be expected on a Wild Power solar farm.
Data gathered from systematic surveys of selected pollinators on a Wild Powerpilot solar farm in theUKpresent an interesting case study (Parker, unpublished data).Bumblebee abundance in the 3 years following baseline (when the solar farm wasconstructed andwild flower habitatswere introduced) is seen to increase significantly,with moderate increases in species richness too. Butterflies on the other hand exhibitlarge fluctuations, with an initial spike in abundance, followed by a decline to belowbaseline levels. Species richness of butterflies declines through the survey period(Fig. 3).
The graphics of bumblebees and butterflies raise some interesting questions on theinteraction between pollinators, and what services can a Wild Power farm provide.According to Potts et al. (2015), bumblebees have more stable population in UK andEurope, while butterflies are more volatile and continue to decline. This backgroundvolatility in butterflies may contribute to the fluctuations displayed in Fig. 2.
Honeybees are encouraged on Wild Power solar farms, as community involve-ment is central to the proposal, and honey is a useful means of demonstrating theconnection between solar energy and food production. However, recent studies sug-gest honey bees can potentially compete with wild pollinators (Barbir et al. 2015,2016). Based on this evidence, and until further research is available, Wild Powerwill set conservative guidance for the number of hives per hectare that a solar farmcan support. This is an example of how Wild Power is committed to using the bestavailable evidence to inform its management decisions.

Wild Power, Biodiversity and Solar Farms: A Business Model … 397
- 10 20 30 40 50 60 70 80
Baseline (2014)
2015 2016 2017
Bumblebees
Species Individuals
-
5
10
15
20
25
30
35
Baseline (2014)
2015 2016 2017
Butterflies
Species Individuals
Fig. 2 Results of 4 years of invertebrate surveys at a single solar farm in the UK managed forbiodiversity. Species richness is shown in blue and abundance is shown in orange (SourceG Parker,unpublished data)
Scaling up
If all solar farms in the UK were managed for biodiversity, then their potential todeliver biodiversity and ecosystem service benefits could be significant at the nationalscale. However, only a small sub-set of solar farms currently adopt this approach.The question remains how to scale up these benefits across the solar industry. WildPower aims to use market forces to ensure uptake at a meaningful scale for climatechange resilience and adaptation, and UK’s biodiversity and ecosystem services.
A New Way of Selling Electricity
While green electricity has growing demand, both in the corporate and domestic mar-ket segments, no supplier currently offers verified biodiversity benefits. Wild Powerwill sell renewable energy to domestic customers from sites that have been enhancedfor biodiversity according to strict standards—and directly connects customers totheir local sites. Market research indicates that a significant portion of buyers whoare already committed to renewable energy will be willing to pay for this additionalbenefit. A scalable model has been designed to bring private financing for large scalebiodiversity enhancement and climate change mitigation (Fig. 3).
Working with local ecologists, the rewilding plan is developed, based on theneeds of the sites and in alignment with the rigorous Wild Power guidelines. Thebiodiversity outcomes are monitored annually using systematic methods and aresubject to independent verification. Wild Power enters a contractual agreement withsolar farms to purchase their future energy and provides them with the full packageof re-wilding.
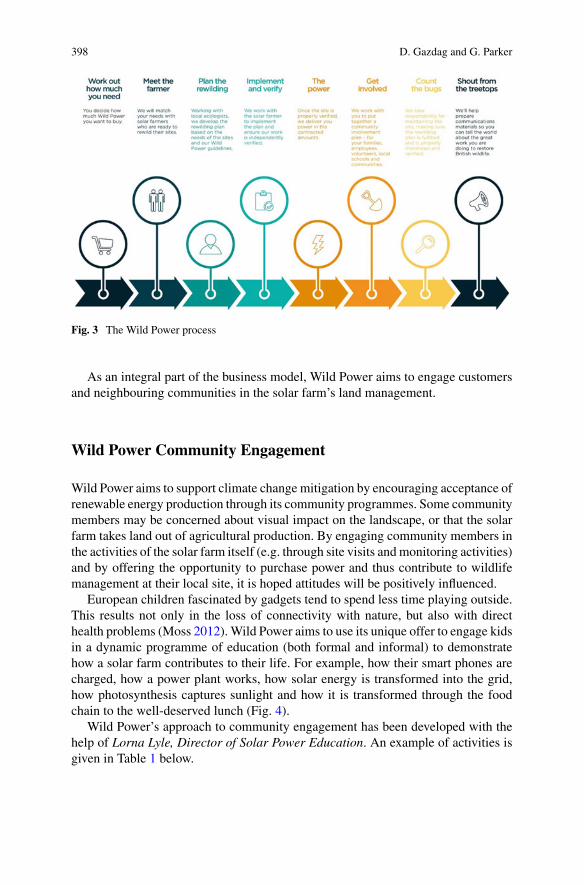
398 D. Gazdag and G. Parker
Fig. 3 The Wild Power process
As an integral part of the business model, Wild Power aims to engage customersand neighbouring communities in the solar farm’s land management.
Wild Power Community Engagement
Wild Power aims to support climate change mitigation by encouraging acceptance ofrenewable energy production through its community programmes. Some communitymembers may be concerned about visual impact on the landscape, or that the solarfarm takes land out of agricultural production. By engaging community members inthe activities of the solar farm itself (e.g. through site visits andmonitoring activities)and by offering the opportunity to purchase power and thus contribute to wildlifemanagement at their local site, it is hoped attitudes will be positively influenced.
European children fascinated by gadgets tend to spend less time playing outside.This results not only in the loss of connectivity with nature, but also with directhealth problems (Moss 2012). Wild Power aims to use its unique offer to engage kidsin a dynamic programme of education (both formal and informal) to demonstratehow a solar farm contributes to their life. For example, how their smart phones arecharged, how a power plant works, how solar energy is transformed into the grid,how photosynthesis captures sunlight and how it is transformed through the foodchain to the well-deserved lunch (Fig. 4).
Wild Power’s approach to community engagement has been developed with thehelp of Lorna Lyle, Director of Solar Power Education. An example of activities isgiven in Table 1 below.

Wild Power, Biodiversity and Solar Farms: A Business Model … 399
Fig. 4 Wild Power engaging with children
Table 1 Examples of Wild Power community and training programs
Activity Description
Ecology Team Building and Bug Hotel TeamBuilding
Community participants and customers workwith ecologists to study and improve thebiodiversity at a wild power site. They willlearn ‘on the job’ about hedge planting, weedremoval, seeding, building hibernacula and bughotels, and undertaking botanical surveys
School Wild Power Car Challenge—TeamBuilding
School children will design, construct, test andrace solar or wind powered cars as part of aWild Power challenge event
Educational Visits School children will visit a Wild Power siteand learn how renewable energy is generated,supporting their science learning andencouraging them to be thoughtful consumers.They will study the biodiversity of the site andfollow this up with workshops in class. Theseactivities are designed to fit into the NationalCurriculum
Teacher’s Day Teachers are invited to tour a Wild Power site,learn how energy is generated, complete a bughunt and build a bug hotel, return to a localschool to share findings and explore ways touse the site in the classroom
Wild Power is committed to sharing the results of its work both to raise awarenessof biodiversity loss and climate change and to support practitioners in achieving bestpractice land management on solar farms. This will be achieved through educationprograms, collaboration with NGOs and universities, case studies published onlinesharing results through papers and symposia.

400 D. Gazdag and G. Parker
Sustainability
Sustainable development is at the core of Wild Power’s business model. The 17Sustainable Development Goals (SDGs) of the 2030 Agenda for Sustainable Devel-opment recognize that ending poverty must go hand-in-hand with strategies thatbuild economic growth and addresses a range of social needs including education,health, social protection, and job opportunities, while tackling climate change andenvironmental protection (UN 2016).
Wild Power contributes to SDG 11 (Sustainable Cities and Communities), SDG13 (Climate Action), SDG 15 (Life on land), SDG 7 (Affordable and clean energy)and is planning to expand to SDG 14 (Life Below water). Wild Power also aims tocontribute to SDG 1 (No poverty) SDG 2 (Zero hunger) SDG 4 (Quality education)SDG 6 (Clean water and sanitation)—and in line with SDG 17 Wild Power seekspartnerships to reach our goals.
To scale up successful project cases to programmes or sustainable market level,it is important to adopt a holistic approach to private sector engagement on climatechange and green growth (OECD 2018). AsWild Power extends its program to otherrenewable energy sources (e.g. wind, off-shore wind, hydro) and other countries andregions, the approach will be able to support multiple SDGs at a meaningful scale.
Conclusions
Wild Power encourages native biodiversity on solar farms as a core component of itsbusiness model. Wild Power sites have the potential to supply multiple benefits fromthe land, including the generation of renewable solar energy, improved biodiversity,and the supply of a range of ecosystem services including carbon sequestration, andwater/air/soil quality, pollination, flood and soil erosion regulation, amongmany oth-ers. These benefits not only contribute to climate changemitigation, they also supportadaptation both of native biodiversity and agricultural production. Such benefits arevitally important in the UK where land resources are limited and biodiversity is indecline, and are relevant to many situations globally.
Constraints of This Research
The Wild Power approach is constrained by the following knowledge gaps:
1. The evidence base concerning the relationship between solar farms and biodiver-sity is currently limited and further research is required to understand the positiveand negative impacts of applying different land management options.
Wild Power, Biodiversity and Solar Farms: A Business Model … 401
2. There is a limited understanding of the relationship between biodiversity andecosystem services, and specifically the quantity and characteristics of ecosystemservice supply from specific habitats.
References
Armstrong A, White PCL (2018) Solar park impacts on ecosystem services. Retrieved from http://www.lancaster.ac.uk/spies/. Accessed on 20 Apr 2018
Barbir et al (2015) The attractiveness of flowering herbaceous plants to bees (Hymenoptera:Apoidea) and hoverflies (Diptera: Syrphidae) in agro-ecosystems of Central Spain. Agric ForEntomol 17:20–28
Barbir et al (2016) Functionality of selected aromatic Lamiaceae in attracting pollinators in CentralSpain. J Econ Entomol 109(2):529–536
BEIS (2017) Renewable Energy Planning Database, April 2017. Department for Business, Energyand Industrial Strategy. Retrieved from https://www.gov.uk/government/publications/renewable-energy-planning-database-monthly-extract. Accessed on Mar 2018
BRE (2014) Biodiversity guidance for solar developments. In: Parker GE, Greene L (eds)Caesar L, Rahmstorf S, Robinson A, Feulner G, Saba V (2018) Observed fingerprint of a weakeningAtlantic Ocean overturning circulation. Nature 556:191–196
Fahrig L (2003) Effects of habitat fragmentation on biodiversity. Annu Rev Ecol Evol Syst34:487–515
FAO (2010) Challenges and opportunities for carbon sequestration in grassland systems. A technicalreport on grassland management and climate change mitigation, Integrated Crop Management,vol 9. Retrieved from http://www.fao.org/fileadmin/templates/agphome/documents/climate/AGPC_grassland_webversion_19.pdf. Accessed on May 2018
Guardian (2018) Stripes of wildflowers across farm fields could cut pesticide spraying. Retrievedfrom https://www.theguardian.com/environment/2018/jan/31/stripes-of-wildflowers-across-farm-fields-could-cut-pesticide-spraying?CMP. Accessed on Mar 2018
Hayhow DB, Burns F, Eaton MA, Al Fulaij N, August TA, Babey L, Bacon L, Bingham C, BoswellJ, Boughey KL, Brereton T, Brookman E, Brooks DR, Bullock DJ, Burke O, Collis M, Corbet L,Cornish N, De Massimi S, Densham J, Dunn E, Elliott S, Gent T, Godber J, Hamilton S, HaveryS, Hawkins S, Henney J, Holmes K, Hutchinson N, Isaac NJB, Johns D, Macadam CR, MathewsF, Nicolet P, Noble DG, Outhwaite CL, Powney GD, Richardson P, Roy DB, Sims D, Smart S,Stevenson K, Stroud RA, Walker KJ, Webb JR, Webb TJ, Wynde R, Gregory RD (2016) State ofnature 2016. The State of Nature Partnership
JNCC (2012) UK biodiversity action plan. Retrieved from http://jncc.defra.gov.uk/ukbap. Accessedon Mar 2018
Mace G, Norris K, Fitter H (2012) Biodiversity and ecosystem services: a multilayered relationship.Trends Ecol Evol 21(1):19–26
Millenium Ecosystem Assessment (2005) https://www.millenniumassessment.org/en/index.htmlMontag H, Parker G, Clarkson T (2015) The effects of solar Farms on local biodiver-sity: a comparative study. Clarkson and Woods and Wychwood Biodiversity. Retrievedfrom https://www.solar-trade.org.uk/wp-content/uploads/2016/04/The-effects-of-solar-farms-on-local-biodiversity-study.pdf. Accessed on Apr 2018
Moss S (2012) Natural childhood. Stephen National Trust reportOECD (2018) Private sector engagement to address climate change and promote green growth.Retrieved from https://www.oecd.org/dac/peer-reviews/Policy-Brief-4-Private-Sector-Engagement-to-Address-Climate-Change-and-Promote-Green-Growth.pdf. Accessed on Mar 2018
POST (2015) Emissions from crops, UKHouses of Parliament, The ParliamentaryOffice of Scienceand Technology, NOTE No. 486

402 D. Gazdag and G. Parker
Potts S, Biesmeijer K, Bommarco R, Breeze T, Carvalheiro L, Franzén M, González-Varo JP,Holzschuh A, Kleijn D, Klein A-M, Kunin B, Lecocq T, Lundin O, Michez D, Neumann P,Nieto A, Penev L, Rasmont P, Ratamäki O, Riedinger V, Roberts SPM, Rundlöf M, ScheperJ, Sørensen P, Steffan-Dewenter I, Stoev P, Vilà M, Schweiger O (2015) Status and trends ofEuropean pollinators. Key findings of the STEP project. Pensoft Publishers, Sofia, p 72
Scurlock J (2018) National Farmers Union (NFU), UK. Personal commentSTA (2018) What is a solar farm? Retrieved from https://www.solar-trade.org.uk/solar-farms/.Accessed on May 2018
UN (2016) The sustainable development agenda. Retrieved from https://www.un.org/sustainabledevelopment/development-agenda/. Accessed on 20 Apr 2018
Wildlife Trusts (2018) Arable field margins. Retrieved from https://www.wildlifetrusts.org/wildlife/habitats/arable-field-margins. Accessed on Mar 2018

Handling the Impacts of Climate Changeon Biodiversity
Walter Leal Filho
Abstract This final chapter describes the need for and outline some of the ways viawhich the impacts of climate change on biodiversity may be handled. It also suggestssome measures which may be helpful in reaching different groups, so as to betterengage them in adaptation efforts.
Introduction
Climate change and a whole and global warming in particular, are known to havea negative impact on biodiversity in three main ways. Firstly, climate change leadsto increases in temperatures, which are known to be detrimental to a number oforganisms, especially those in sensitive habitats such as coral reefs and rainforests.Secondly, the pressures posed by a changing climate may lead to sets of responsesin areas as varied as phenology, range and physiology of living organisms, oftenleading to changes in life cycles (especially but not only in reproduction), losses inproductivity or even death. On occasions, the very survival of some very sensitivespecies may be endangered. Thirdly, the impacts of climate change on biodiversityare estimated to be felt in the short term in respect of some species and ecosystems,but also in the medium and long term in many biomes. Indeed, if left unattended,some of these impacts may be irreversible.
TheConvention onBiodiversity acknowledges the fact that biodiversity is affectedby climate change, and that biodiversity, through the ecosystem services it supports,also makes an important contribution to both climate-change mitigation and adap-tation. In addition, the Intergovernmental Panel on Climate Change (IPCC) has, inconnection with its 5th Assessment Report (AR5), recognized the fact that withouteffective mitigation strategies, further changes in climate, atmospheric carbon diox-
W. Leal Filho (B)Faculty of Life Sciences, Research and Transfer Centre “Sustainable Development and ClimateChange Management”, Hamburg University of Applied Sciences, Ulmenliet 20, 21033 Hamburg,Germanye-mail: [email protected]
© Springer Nature Switzerland AG 2019W. Leal Filho et al. (eds.), Handbook of Climate Change and Biodiversity,Climate Change Management, https://doi.org/10.1007/978-3-319-98681-4_25
403
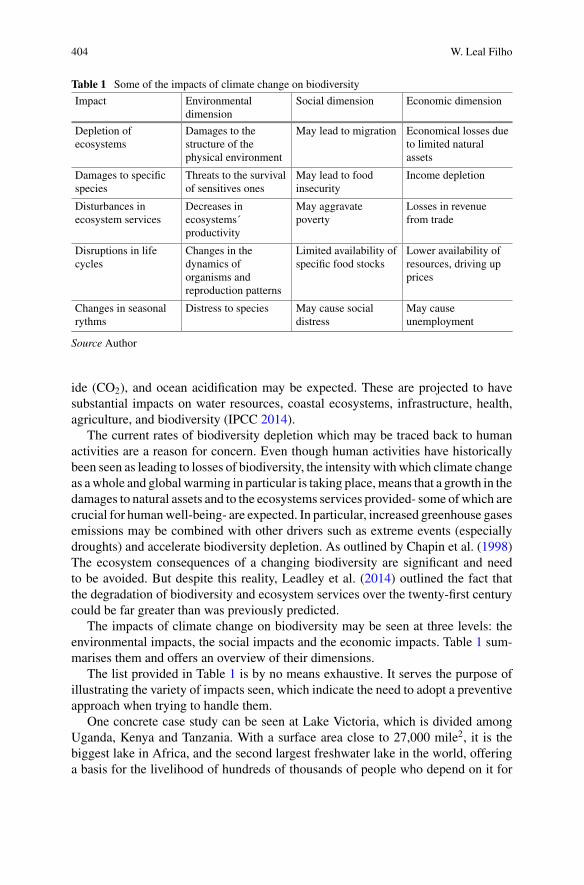
404 W. Leal Filho
Table 1 Some of the impacts of climate change on biodiversity
Impact Environmentaldimension
Social dimension Economic dimension
Depletion ofecosystems
Damages to thestructure of thephysical environment
May lead to migration Economical losses dueto limited naturalassets
Damages to specificspecies
Threats to the survivalof sensitives ones
May lead to foodinsecurity
Income depletion
Disturbances inecosystem services
Decreases inecosystems´productivity
May aggravatepoverty
Losses in revenuefrom trade
Disruptions in lifecycles
Changes in thedynamics oforganisms andreproduction patterns
Limited availability ofspecific food stocks
Lower availability ofresources, driving upprices
Changes in seasonalrythms
Distress to species May cause socialdistress
May causeunemployment
Source Author
ide (CO2), and ocean acidification may be expected. These are projected to havesubstantial impacts on water resources, coastal ecosystems, infrastructure, health,agriculture, and biodiversity (IPCC 2014).
The current rates of biodiversity depletion which may be traced back to humanactivities are a reason for concern. Even though human activities have historicallybeen seen as leading to losses of biodiversity, the intensity with which climate changeas awhole and global warming in particular is taking place,means that a growth in thedamages to natural assets and to the ecosystems services provided- some ofwhich arecrucial for humanwell-being- are expected. In particular, increased greenhouse gasesemissions may be combined with other drivers such as extreme events (especiallydroughts) and accelerate biodiversity depletion. As outlined by Chapin et al. (1998)The ecosystem consequences of a changing biodiversity are significant and needto be avoided. But despite this reality, Leadley et al. (2014) outlined the fact thatthe degradation of biodiversity and ecosystem services over the twenty-first centurycould be far greater than was previously predicted.
The impacts of climate change on biodiversity may be seen at three levels: theenvironmental impacts, the social impacts and the economic impacts. Table 1 sum-marises them and offers an overview of their dimensions.
The list provided in Table 1 is by no means exhaustive. It serves the purpose ofillustrating the variety of impacts seen, which indicate the need to adopt a preventiveapproach when trying to handle them.
One concrete case study can be seen at Lake Victoria, which is divided amongUganda, Kenya and Tanzania. With a surface area close to 27,000 mile2, it is thebiggest lake in Africa, and the second largest freshwater lake in the world, offeringa basis for the livelihood of hundreds of thousands of people who depend on it for

Handling the Impacts of Climate Change on Biodiversity 405
Fig. 1 Influences of climatechange on biodiversity in theAmazon rainforests. SourceAuthor
Changing climate
conditons
Impacts on ecosystems
Impacts on individual
species
Changes in carbon stocks
Release of greenhouse
gases
agriculture, fishing and other economic activities. As a result of climate change andthe increased temperatures, levels of evaporation have increased. This is combinedwith the concentration of nutrients from agriculture on the water which, in turn,may provide good conditions for the excessive growth of algae or macrophytes,which seriously affect the water quality. These changes favour the most robust algaland animal species whilst the more sensitive ones may disappear, and the changesinterfere with various beneficial uses of water (Gikuma-Njuru et al. 2015). Theimpacts of climate change to the biodiversity of Lake Victoria ersoty are well beyondthe environmental ones: a reduction in the levels of fish production could lead to aimbalance in food availability. This could, in turn, aggravate poverty and possiblycatalyse political instability in the affected areas.
A second concrete case study can be seen from the Amazon rainforests: climatechange is believed to be influencing the dynamics of rivers in the region in a significantway. It may also influence their role as carbon stocks (Jantz et al. 2014) and thebiodiversity elements it is associated with (Fig. 1).
In addition, increased temperatures and reduced rainfall in some areas may alsoreduce suitable habitat during dry, warm months and potentially lead to an increasein invasive, exotic species, which then can out-compete native ones. According toBrodie et al. (2012), there are many key concerns, among which is the fact thataridification could increase the accessibility of previously non-arable or remote lands,elevate fire impacts and exacerbate ecological effects of habitat disturbance.
As these two examples illustrate, the problem is serious and deserves promptattention, despite the fact that there are some challenges which need to be overcome.

406 W. Leal Filho
Challenges in Biodiversity Conservation Under a ChangingClimate
There are various challenges which make the handling of the impacts of climatechange to biodiversity a difficult task. Some of them are as follows:
i. climate impacts may affect ecosystems completely or in part, leading to changesin physio-chemical conditions and altering the structure of habitats;
ii. these impacts may also be felt as the species´ level, meaning that the mostsensitive ones either considerably suffer or may even perish;
iii. damages to biodiversity are difficult to be reversed, especially when they are atadvanced stages;
iv. apart from damages to fauna and flora, impacts on biodiversity often reflect onnegative consequences to the livelihoods of some populations, especially thepoorer ones which depend on natural resources as sources of income.
There are also many factors which exarcerbate the negative influences of climatechange to biodiversity conservation. Firstly, the pressures caused by physio-chemicalstructures of some ecosystems, combined with a heavy reliance on them -and oftentheir excessive use-, may lead to a decrease in their availability to provide theirecosystem services. This is the case of oceans at the macro level, which are shownto be influenced by climate change (especially, but not only by acidification), withvarious negative effects to the fauna and flora they host, or to lakes (which alongwith evaporation also are put under pressure by euthrophication) at the micro level.
Secondly, climate change affects biodiversity in the sense that it causes disruptionsin food chains. The reductions in the population of some species—or the completedisappearance of particular species as the literature documents—may lead to changesin the food supply. For instance, reductions im plankton due to high temperaturesmay affect the many water based organisms which feed on them.
Thirdly, changes in temperature and weather conditions may trigger other phe-nomena which may seriously undermine biodiversity. The Intergovernmental Panelon Climate Change (IPCC) suggests that flooding associated with sea-level rise islikely to have substantial impacts on lowland areas such as the Amazon River delta(IPCC 2014). Another example is seen in respect of forest fires, as those observedin California or parts of Portugal and Spain in 2017. Long dry spells can providesuitable conditions for forest fires, which can spread over large distances and wipeout entire populations of animals and plants, over a short period of time.
There is also a perceived need to better communicate the connections betweenclimate change and biodiversity (Leal Filho 2009; Leal Filho et al. 2018), since thismay support attempts to catalyse real action.
At the macro level, the “Lima Declaration on Climate Change and Biodiversity”issued in 2014 lists a variety of measures which need to be pursued, to reducethe impacts of climate change on biodiversity. Since then, there have been calls formutually supportive implementation of the nationally determined contributions underthe Paris Agreement on Climate Change and the national biodiversity strategies and

Handling the Impacts of Climate Change on Biodiversity 407
action plans under the Convention on Biological Diversity and its Strategic Plan forBiodiversity 2011–2020 (CBD2017). It is important that coordinated efforts betweenthe United Nations Framework Convention on Climate Change and the Conventionon Biological Diversity are implemented, in a waywhich is consistent with the actionneeded at the national and local levels.
Conclusions: Moving Towards Mitigating the Impactsof Climate Change on Biodiversity
At present, many individual governments, financial institutes and internationaldonors are currently spending billions of dollars in projects around climate changeand biodiversity, but with little coordination. Quite often, the emphasis is on adap-tation efforts, with little emphasis on the connections between physio-ecologicalchanges and the life cycles and metabolisms of fauna and flora, or the influence ofpoor governance on biodiversity.
There is therefore a perceived need to not only better understand the impacts ofclimate change on biodiversity, but also to engage on an action pyramid which entailsa set of measures aimed at managing the many risks climate change poses to fauna,flora and micro organisms (Fig. 2). These are:
• identify the procedures which may be deployed to reduce the impacts of climatechange to biodiversity
• test them with a view to checking their feasibility and efficiency• implement them in a wider scale, with a replication and upscaling which may gowell beyond the areas originally tested.
Implement
Test
Identify
Fig. 2 Action pyramid to handle the impacts of climate change on biodiversity. Source Author
408 W. Leal Filho
In particular, the question as to how better restore and protect ecosystems from theimpact of climate change also has to be urgently addressed.
A second course of action needed, is a greater emphasis to the protection and/orrestauration of the ecosystems most affected by climate change. Here, the list is quitelong: from forests to lakes, from mountains to valleys and mangroves.
Ecosystem-based approaches to climate change adaptation should therefore beone of the top priorities, both in respect of government policies, but also in termsof development assistance. An investment in ecosystems protection is likely to yieldbenefits 10 times or more greater than the focus on a particular species. Efforts toprotect and recover damaged ecosystems may potentially represent a significant stepforward, since they automatically benefit the many plant and animal species, as wellas microorganisms, which inhabit these ecosystems.
Furthermore, in trying to address the problems climate change poses to biodiver-sity, it is important to consider a set of the SustainableDevelopmentGoals, especially:
• SDG 1 (No Hunger),• SDG 2 (No Poverty),• SDG 13 (Climate Action),• SDG 14 (Life Below Water) and• SDG 15 (Life on Land).
Since biodiversity issues permeate all these themes, an integrated approach is needed,as opposed to the many disconnected approaches which tend to prevail today.
References
Brodie J, Post E, LauranceWF (2012) Climate change and tropical biodiversity: a new focus. TrendsEcol Evol 27:145–150
Chapin FS, Sala OE, Burke IC, Grime JP, Hooper DU, Lauenroth WK, Lombard A, Mooney HA,Mosier AR, Naeem S (1998) Ecosystem consequences of changing biodiversity. Bioscience,45–52
Convention on Biological Diversity (CBD) (2017) The Lima declaration on biodiversity and climatechange: contributions from science to policy for sustainable development. CBD Technical SeriesNo. 89. CBD, Quebec, Montreal
Gikuma-Njuru P et al (2015) Eutrophication of the Lake Victoria ecosystem. Lake Victoria Envi-ronmental Management Project, Kampala
IPCC (2014) Climate change 2014: synthesis report. Contribution of working groups I, II and IIIto the fifth assessment report of the intergovernmental panel on climate change [Core WritingTeam, Pachauri RK, Meyer LA (eds)]. IPCC, Geneva, 151 pp
Jantz P, Goetz S, Laporte N (2014) Carbon stock corridors to mitigate climate change and promotebiodiversity in the tropics. Nat Clim Change 4:138–142
Leadley P et al (2014) Interacting-regional scale regime shifts for biodiversity and ecosystemservices. Bioscience 64(8):665–679
Leal Filho W (2009) Communicating climate change: challenges ahead and action needed. Int JClim Change Strat Manage 1(1):6–18. https://doi.org/10.1108/17568690910934363
Leal Filho W et al (2018) Theory of climate change communication. Handbook of climate changecommunication, vol 1. Springer, Berlin