Predicting the Morphologies of γ Precipitates in Cobalt-Based ...
Upload
independentCategory
view
0download
0
NANO EXPRESS
Controlled Growth of WO3 Nanostructures with ThreeDifferent Morphologies and Their Structural, Optical,and Photodecomposition Studies
S. Rajagopal Æ D. Nataraj Æ D. Mangalaraj ÆYahia Djaoued Æ Jacques Robichaud ÆO. Yu. Khyzhun
Received: 2 June 2009 / Accepted: 17 July 2009 / Published online: 4 August 2009
� to the authors 2009
Abstract Tungsten trioxide (WO3) nanostructures were
synthesized by hydrothermal method using sodium tungstate
(Na2WO4�2H2O) alone as starting material, and sodium
tungstate in presence of ferrous ammonium sulfate [(NH4)2
Fe(SO4)2�6H2O] or cobalt chloride (CoCl2�6H2O) as struc-
ture-directing agents. Orthorhombic WO3 having a rectan-
gular slab-like morphology was obtained when Na2WO4�2H2O was used alone. When ferrous ammonium sulfate and
cobalt chloride were added to sodium tungstate, hexagonal
WO3 nanowire clusters and hexagonal WO3 nanorods were
obtained, respectively. The crystal structure and orientation
of the synthesized products were studied by X-ray diffraction
(XRD), micro-Raman spectroscopy, and high-resolution
transmission electron microscopy (HRTEM), and their
chemical composition was analyzed by X-ray photoelectron
spectroscopy (XPS). The optical properties of the synthe-
sized products were verified by UV–Vis and photolumines-
cence studies. A photodegradation study on Procion Red MX
5B was also carried out, showing that the hexagonal
WO3 nanowire clusters had the highest photodegradation
efficiency.
Keywords Tungsten trioxide � Hydrothermal �Structure-directing chemicals � Nanowires � Nanorods �Photodecomposition
Introduction
One-dimensional (1-D) nanostructures have attracted much
attention because of their distinct properties and wider
applications. Self-assembled growth of one-dimensional
nanostructures is a simple and spontaneous process.
However, understanding the reaction chemistry and growth
mechanism of the process is necessary to obtain these
structures. Repeated experiments of this synthetic method
are needed to obtain uniform growth of 1-D nanostructures.
Semiconductor metal oxide nanostructures are highly
attractive, so more attention has been paid, because of their
obvious optical and electronic applications. Tungsten tri-
oxide (WO3) is one of the n type indirect wide band gap
materials [1, 2]. It is a fundamental functional material
having interesting physical properties and wide range of
applications. Due to its high work function, it was used as a
charge injection layer [3]. Because of its higher catalytic
activity, it can be used in photocatalytic and electrocata-
lytic applications [4, 5]. It serves as a good host for ions, so
it can be used successfully in electrochemical Li ion bat-
teries, electrochromic, thermochromic, and photochromic
devices [6–9]. Many methods have been developed to
synthesize 1-D WO3 nanostructures, such as template-
assisted growth [4], anodization [10], conventional thermal
evaporation [1], hot wall chemical vapor deposition [11],
S. Rajagopal � D. Nataraj (&)
Thin Film & Nanomaterials Laboratory, Department of Physics,
Bharathiar University, Coimbatore 641 046, India
e-mail: [email protected]
D. Mangalaraj
Department of Nanoscience and Technology,
Bharathiar University, Coimbatore 641 046, India
Y. Djaoued � J. Robichaud
Laboratoire de Micro-Spectroscopies Raman et FTIR, Universite
de Moncton-Campus de Shippagan, 218, boul. J.-D. Gauthier,
Shippagan, NB E8S 1P6, Canada
O. Yu. Khyzhun
Department of Structural Chemistry of Solids, Frantsevych
Institute for Problems of Materials Science, National Academy
of Sciences of Ukraine, 3 Krzhyzhanivsky Street, 03142 Kyiv,
Ukraine
123
Nanoscale Res Lett (2009) 4:1335–1342
DOI 10.1007/s11671-009-9402-y
arc discharge [12], pulsed laser deposition [13], and
hydrothermal method [14]. Among the various methods,
hydrothermal method is a facile, dominant tool for the
synthesis of anisotropic nanoscale materials. Significant
advantages of this method are controllable size, low tem-
perature growth, cost-effectiveness, and less complicated.
Number of attempts were paid to synthesize controlled
WO3 nanostructures by hydrothermal method with the help
of structure-directing chemicals like Na2SO4, Rb2SO4,
K2SO4, Li2SO4, and Na2S [6, 14–17]. All attempts suggest
that the reason behind the controlled growth was due to the
presence of sulfate ions in the reaction. The data reported
in Refs. [6, 14–17] show that I-group compounds such as
Li2SO4, Na2SO4, Na2S, K2SO4, and Rb2SO4 were used as
structure-directing chemicals for the synthesis of WO3
nanostructures. In the present work, we choose VIII-group
metal complexes, such as ferrous ammonium sulfate, as
structure-directing chemical for the synthesis of WO3
nanostructures. Since chlorine is next to sulfur in periodic
table, we expect that it may have similar tendency to sulfur.
Therefore, cobalt chloride was also used as another
structure-directing chemical to realize the change in
morphology of WO3 products. It is interesting that we have
obtained wire- and rod-shaped WO3 nanostructures,
respectively, from ferrous ammonium sulfate and cobalt
chloride as structure-directing agents. Their structural,
optical, and photodegradation properties were also studied
in this paper.
Experimental Details
Synthesis of Tungsten Oxide Nanostructures
All the chemicals were of analytical grade and taken without
further purification or modification. Sodium tungstate
(Na2WO4�2H2O) is the starting material. Hydrochloric acid
(HCl), oxalic acid (C2H2O4�2H2O), nitric acid (HNO3),
ferrous ammonium sulfate [(NH4)2Fe(SO4)2�6H2O], and
cobalt chloride (CoCl2�6H2O) were the other chemicals used
for the growth.
Three different reactions were made for the preparation
of WO3 products. In the first experiment, sodium tungstate
was dissolved in 100 mL double distilled water (DDW)
(6.6 g, 0.2 mole) and acidification was done by adding HCl
to get a pH of 1. A white precipitate was obtained, and it
was dissolved by adding oxalic acid (0.4 g in 30 mL DDW,
0.1 mole). As a result, a transparent solution was obtained,
and it is the final solution for this experiment. In the second
reaction, sodium tungstate (6.6 g, 0.2 mole) and ferrous
ammonium sulfate (0.4 g, 0.1 mole, 10 mL DDW) were
dissolved in DDW separately and mixed under vigorous
stirring. A dark brown color mixture was obtained, and it
was dissolved by adding oxalic acid. In this case, a trans-
parent yellow color solution was obtained. It is the final
solution of this reaction and its pH was 1. In the third
experiment, sodium tungstate (6.6 g, 0.2 mole) and cobalt
chloride (1.786 g, 0.5 mole, 15 mL in DDW) solutions
were prepared separately and mixed with constant stirring.
A violet mixture appeared, and it was dissolved by nitric
acid. Now, a transparent red solution was obtained and its
pH was 1. These three solutions were transferred separately
into 40 mL Teflon-lined stainless steel autoclave and
maintained at 180 �C for 24 h to get the final product. The
as-obtained products were washed several times both in
water and ethanol and finally dried at 100 �C for 2 h.
Characterization Techniques
The surface morphology, structural, and chemical states of
the formed nanostructures were characterized by using
scanning electron microscopy (SEM-5600 JEOL JSM),
transmission electron microscopy (TEM-2011 JEOL
STEM), X-ray diffraction (PANalytical X-ray diffractom-
eter—XPERT PRO), Raman spectroscopy (Horiba Jobin
Raman spectrometer, reflection mode, wavelength of
532 nm, 2mW), and X-ray photoelectron spectroscopy
(XPS—ion-pumped chamber of an ES-2401 spectrometer
Mg Ka radiation, photon energy 1,253.6 eV) techniques.
Optical measurements were carried out in UV–Vis spec-
trophotometer (SHIMADZU 3600 UV–Vis–NIR spectro-
photometer), and photoluminescence properties were
analyzed by using Horiba Jobin Yvon spectrofluoromax
spectrometer.
Results and Discussion
Characterization of Surface Morphology and Structural
Properties
Figure 1a–c shows the scanning electron microscope
(SEM) images of the as-prepared WO3 products synthe-
sized using three different hydrothermal reactions. Rect-
angular slab-like WO3 crystals were obtained by direct
hydrothermal synthesis. These rectangular slab-like struc-
tures show their sharp corners and smooth surfaces as
indicated in the Fig. 1a. When ferrous ammonium sulfate
was used, WO3 nanowire clusters were obtained, and their
SEM image is shown in Fig. 1b. The average length and
diameter of the nanowires were 1 lm (1,000 nm) and
30 nm, respectively. Cobalt chloride-reacted WO3 prod-
ucts, shown in Fig. 1c, look like rod-shaped nanostructures.
Their average length and diameter were only about 100 and
30 nm, respectively. There is no change in the cross-
sectional dimension between nanowires and nanorods, but
1336 Nanoscale Res Lett (2009) 4:1335–1342
123
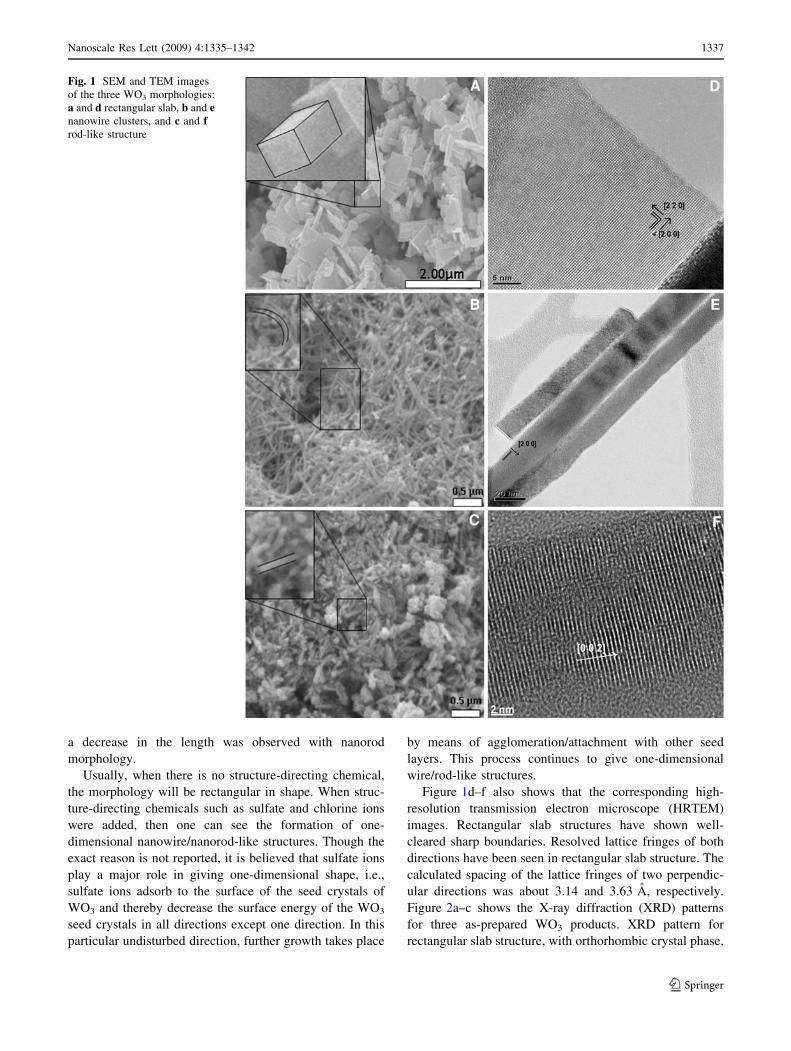
a decrease in the length was observed with nanorod
morphology.
Usually, when there is no structure-directing chemical,
the morphology will be rectangular in shape. When struc-
ture-directing chemicals such as sulfate and chlorine ions
were added, then one can see the formation of one-
dimensional nanowire/nanorod-like structures. Though the
exact reason is not reported, it is believed that sulfate ions
play a major role in giving one-dimensional shape, i.e.,
sulfate ions adsorb to the surface of the seed crystals of
WO3 and thereby decrease the surface energy of the WO3
seed crystals in all directions except one direction. In this
particular undisturbed direction, further growth takes place
by means of agglomeration/attachment with other seed
layers. This process continues to give one-dimensional
wire/rod-like structures.
Figure 1d–f also shows that the corresponding high-
resolution transmission electron microscope (HRTEM)
images. Rectangular slab structures have shown well-
cleared sharp boundaries. Resolved lattice fringes of both
directions have been seen in rectangular slab structure. The
calculated spacing of the lattice fringes of two perpendic-
ular directions was about 3.14 and 3.63 A, respectively.
Figure 2a–c shows the X-ray diffraction (XRD) patterns
for three as-prepared WO3 products. XRD pattern for
rectangular slab structure, with orthorhombic crystal phase,
Fig. 1 SEM and TEM images
of the three WO3 morphologies:
a and d rectangular slab, b and enanowire clusters, and c and frod-like structure
Nanoscale Res Lett (2009) 4:1335–1342 1337
123
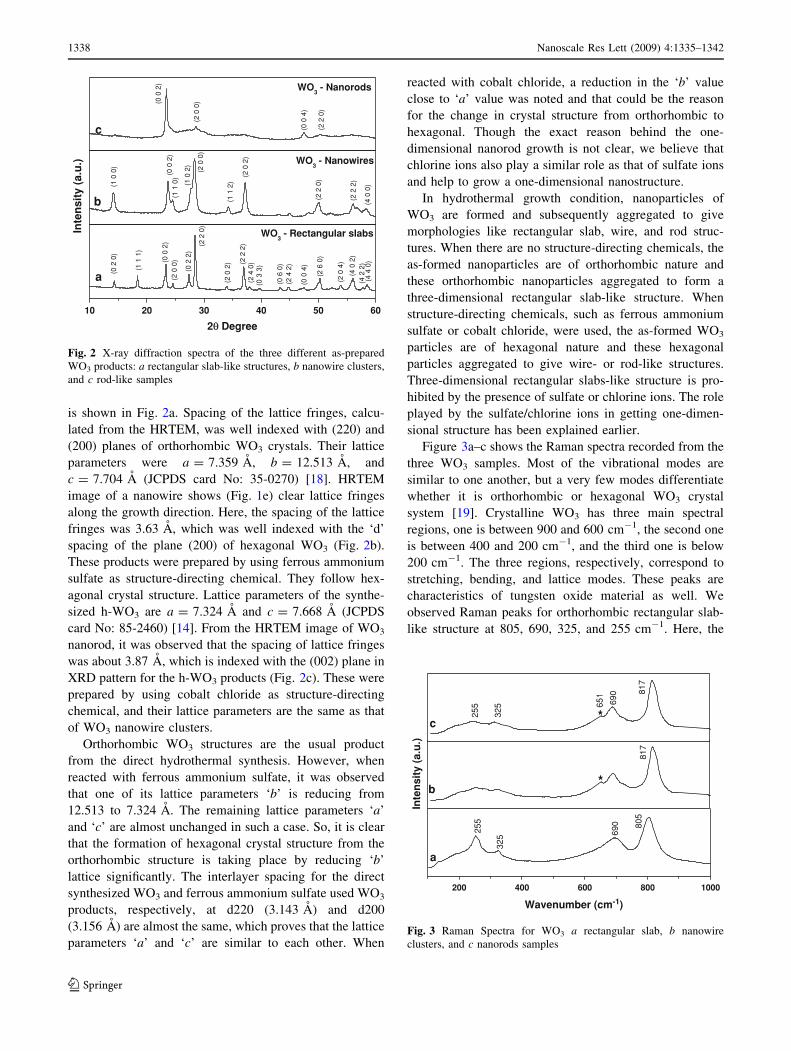
is shown in Fig. 2a. Spacing of the lattice fringes, calcu-
lated from the HRTEM, was well indexed with (220) and
(200) planes of orthorhombic WO3 crystals. Their lattice
parameters were a = 7.359 A, b = 12.513 A, and
c = 7.704 A (JCPDS card No: 35-0270) [18]. HRTEM
image of a nanowire shows (Fig. 1e) clear lattice fringes
along the growth direction. Here, the spacing of the lattice
fringes was 3.63 A, which was well indexed with the ‘d’
spacing of the plane (200) of hexagonal WO3 (Fig. 2b).
These products were prepared by using ferrous ammonium
sulfate as structure-directing chemical. They follow hex-
agonal crystal structure. Lattice parameters of the synthe-
sized h-WO3 are a = 7.324 A and c = 7.668 A (JCPDS
card No: 85-2460) [14]. From the HRTEM image of WO3
nanorod, it was observed that the spacing of lattice fringes
was about 3.87 A, which is indexed with the (002) plane in
XRD pattern for the h-WO3 products (Fig. 2c). These were
prepared by using cobalt chloride as structure-directing
chemical, and their lattice parameters are the same as that
of WO3 nanowire clusters.
Orthorhombic WO3 structures are the usual product
from the direct hydrothermal synthesis. However, when
reacted with ferrous ammonium sulfate, it was observed
that one of its lattice parameters ‘b’ is reducing from
12.513 to 7.324 A. The remaining lattice parameters ‘a’
and ‘c’ are almost unchanged in such a case. So, it is clear
that the formation of hexagonal crystal structure from the
orthorhombic structure is taking place by reducing ‘b’
lattice significantly. The interlayer spacing for the direct
synthesized WO3 and ferrous ammonium sulfate used WO3
products, respectively, at d220 (3.143 A) and d200
(3.156 A) are almost the same, which proves that the lattice
parameters ‘a’ and ‘c’ are similar to each other. When
reacted with cobalt chloride, a reduction in the ‘b’ value
close to ‘a’ value was noted and that could be the reason
for the change in crystal structure from orthorhombic to
hexagonal. Though the exact reason behind the one-
dimensional nanorod growth is not clear, we believe that
chlorine ions also play a similar role as that of sulfate ions
and help to grow a one-dimensional nanostructure.
In hydrothermal growth condition, nanoparticles of
WO3 are formed and subsequently aggregated to give
morphologies like rectangular slab, wire, and rod struc-
tures. When there are no structure-directing chemicals, the
as-formed nanoparticles are of orthorhombic nature and
these orthorhombic nanoparticles aggregated to form a
three-dimensional rectangular slab-like structure. When
structure-directing chemicals, such as ferrous ammonium
sulfate or cobalt chloride, were used, the as-formed WO3
particles are of hexagonal nature and these hexagonal
particles aggregated to give wire- or rod-like structures.
Three-dimensional rectangular slabs-like structure is pro-
hibited by the presence of sulfate or chlorine ions. The role
played by the sulfate/chlorine ions in getting one-dimen-
sional structure has been explained earlier.
Figure 3a–c shows the Raman spectra recorded from the
three WO3 samples. Most of the vibrational modes are
similar to one another, but a very few modes differentiate
whether it is orthorhombic or hexagonal WO3 crystal
system [19]. Crystalline WO3 has three main spectral
regions, one is between 900 and 600 cm-1, the second one
is between 400 and 200 cm-1, and the third one is below
200 cm-1. The three regions, respectively, correspond to
stretching, bending, and lattice modes. These peaks are
characteristics of tungsten oxide material as well. We
observed Raman peaks for orthorhombic rectangular slab-
like structure at 805, 690, 325, and 255 cm-1. Here, the
10 20 30 40 50 60
WO3 - Rectangular slabs
(4 4
0)
(4 2
2)
(4 0
2)
(2 0
4)
(2 6
0)
(0 0
4)
(2 4
2)
(0 6
0)
(0 3
3)
(2 4
0)(2
2 2
)
(2 0
2)
(2 2
0)
(0 2
2)
(2 0
0)(0
0 2
)
(1 1
1)
(0 2
0)
a
2θ Degree
Inte
nsi
ty (
a.u
.) WO3 - Nanowires
(4 0
0)
(2 2
2)
(2 2
0)
(2 0
2)
(1 1
2)
(2 0
0)
(1 0
2)
(1 1
0)
(0 0
2)
(1 0
0)
b
WO3 - Nanorods
c (2 2
0)
(0 0
4)
(2 0
0)(0
0 2
)
Fig. 2 X-ray diffraction spectra of the three different as-prepared
WO3 products: a rectangular slab-like structures, b nanowire clusters,
and c rod-like samples
200 400 600 800 1000
255
325 69
0 805
a
Inte
nsi
ty (
a.u
.)
Wavenumber (cm-1)
*
817
325
b
*255 65
1
690 81
7
c
Fig. 3 Raman Spectra for WO3 a rectangular slab, b nanowire
clusters, and c nanorods samples
1338 Nanoscale Res Lett (2009) 4:1335–1342
123
mode at 805 and 690 cm-1 corresponds to stretching
vibration of O–W-O, whereas the modes at 325 and
255 cm-1 corresponds to bending vibration of W–O-W. In
the case of the hexagonal nanowire structure, we observed
almost similar modes as that of orthorhombic structure.
The modes are 817 and 690 cm-1 and which were due to
stretching vibrations. Upon comparing the stretching
modes of orthorhombic (805 cm-1) and hexagonal
(817 cm-1) structures, in the case of hexagonal WO3, it
was found that there is a shift in wavenumber toward
higher side (Fig. 3b, c). This shift could be due to a local
structural change in the crystal system, upon conversion
from orthorhombic to hexagonal crystal structure. In
addition to this, we also noticed a characteristic mode of
hexagonal WO3 at 651 cm-1 [20], which again confirmed
the crystal structures of nanowire and nanorods. No
impurity peaks other than WO3 were observed, which
shows the purity of the as-prepared samples.
Characterization of Chemical States
X-ray photoelectron spectroscopy (XPS) analysis was
carried out to further confirm the purity of the samples and
44 42 40 38 36 34 32 30
Binding Energy (eV)
W 4 f7 / 2
W 4 f5 / 2
c
b
Co
un
ts (
a.u
)
a
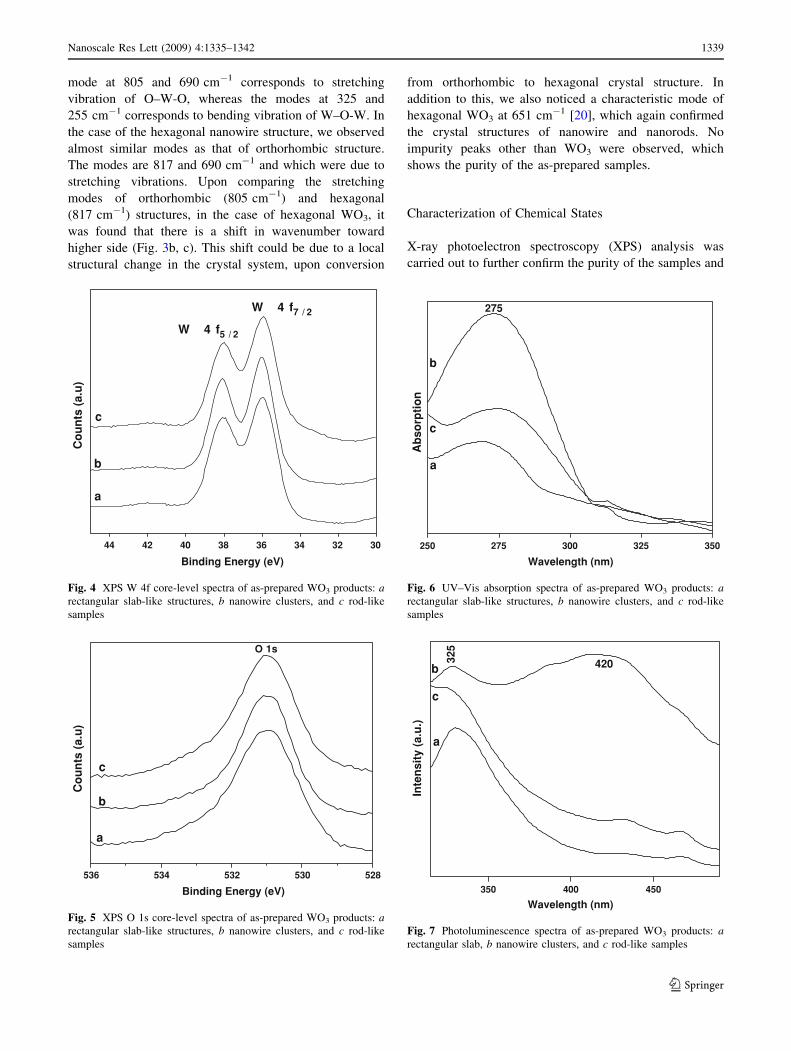
Fig. 4 XPS W 4f core-level spectra of as-prepared WO3 products: arectangular slab-like structures, b nanowire clusters, and c rod-like
samples
536 534 532 530 528
c
b
a
Binding Energy (eV)
Co
un
ts (
a.u
)
O 1s
Fig. 5 XPS O 1s core-level spectra of as-prepared WO3 products: arectangular slab-like structures, b nanowire clusters, and c rod-like
samples
250 275 300 325 350
275
c
b
a
Ab
sorp
tio
n
Wavelength (nm)
Fig. 6 UV–Vis absorption spectra of as-prepared WO3 products: arectangular slab-like structures, b nanowire clusters, and c rod-like
samples
350 400 450
420325
c
b
a
Inte
nsi
ty (
a.u
.)
Wavelength (nm)
Fig. 7 Photoluminescence spectra of as-prepared WO3 products: arectangular slab, b nanowire clusters, and c rod-like samples
Nanoscale Res Lett (2009) 4:1335–1342 1339
123
also to check the electronic state of the samples. Figure 4a–c
shows the XPS W 4f core-level spectra for all the three
as-prepared WO3 samples. From these results, we observed
that impurities like Fe, Co, Cl, N, and S are not present in
all the three samples. The XPS W 4f core-level spectra
have revealed that in all the samples under study tungsten
atoms are in the formal valence state ?6 [21]. Their 4f
peaks binding energies were observed at 38.0 and 36.0 eV,
which corresponds to spin-orbit splitting of the W 4f7/2 and
W 4f5/2 components, respectively, in tungsten oxides [21].
The XPS O 1 s core-level binding energies of the tungsten
oxide samples under consideration correspond to 531.0 eV
(Fig. 5a–c). From the relative intensities of the XPS
spectra, we have calculated the compositional stoichiom-
etry between ‘W’ and ‘O’ and it is found to be about 1:3 in
the every sample studied.
Characterization of Optical Properties
To study the photoluminescence as well as photodegrada-
tion performance of the as-prepared WO3 samples, it is
necessary to know the absorption edge and number of
photons absorbed by the material. So, UV–Vis absorption
spectra were taken for all the three WO3 samples.
Figure 6a–c shows the absorption spectra with a peak
maximum at 275 nm wavelength for all the three samples.
A very clear, high intense absorption peak was obtained for
nanowire cluster structures, whereas for nanorod and
rectangular slab structures less intense absorption was seen.
Using this absorption maximum, photoluminescence
property of the as-prepared WO3 nanostructures was
studied and their emission results are shown in Fig. 7a–c.
We have seen emission peaks at 325 and 420 nm for all the
three WO3 samples. The emission at 325 nm corresponds
to edge emission [22–25]. Only nanowire clusters have
shown relatively high intense another emission peak at
420 nm and which could originate from the presence of
oxygen vacancies or defect states [23]. Though XPS results
have shown a stoichiometry in composition, our PL results
have shown the presence of defect states by means of an
emission at 420 nm. This could be due to more sensitivity
of PL than XPS. Increase in surface to volume ratio results
in increase of defect states in the case of WO3 nanowire
clusters and that could be the reason for the observed
0.0
0.2
0.4
0.6
0.8
1.0C
h
gfe
d
c
ba
Ab
sorb
ance
Wavelength (nm)
0.0
0.2
0.4
0.6
0.8
1.0B
h
g
f
e
d
c
ba
Ab
sorb
ance
300 400 500 600 700
A
0.0
g
h
f
e
d
c
ba
0.8
0.6
0.4
0.2
1.0A
bso
rban
ce
Wavelength (nm)
300 400 500 600 700
Wavelength (nm)
300 400 500 600 700
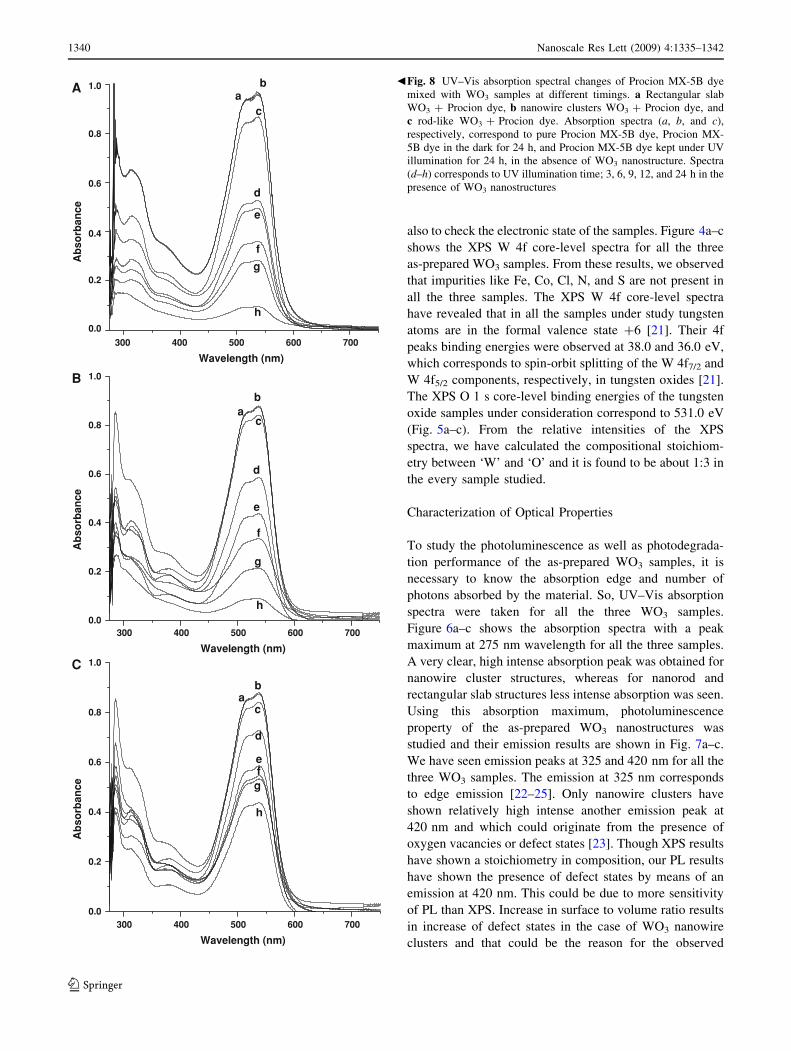
Fig. 8 UV–Vis absorption spectral changes of Procion MX-5B dye
mixed with WO3 samples at different timings. a Rectangular slab
WO3 ? Procion dye, b nanowire clusters WO3 ? Procion dye, and
c rod-like WO3 ? Procion dye. Absorption spectra (a, b, and c),
respectively, correspond to pure Procion MX-5B dye, Procion MX-
5B dye in the dark for 24 h, and Procion MX-5B dye kept under UV
illumination for 24 h, in the absence of WO3 nanostructure. Spectra
(d–h) corresponds to UV illumination time; 3, 6, 9, 12, and 24 h in the
presence of WO3 nanostructures
b
1340 Nanoscale Res Lett (2009) 4:1335–1342
123
strong visible emission in this sample. Rectangular slab
and rod-shaped morphologies weakly exhibited this char-
acteristic peak with noticeable intensity as shown in the
Fig. 6a, c.
Photodecomposition Measurements
Photodecomposition activities of the as-prepared WO3
nanostructures were analyzed with Procion Red MX-5B.
We have chosen this dye for the decomposition purpose,
because it is one of the harmful environmental pollutants.
Attempts were made to decompose it by using TiO2
nanoparticles in a typical photocatalytic reactor [26]. Since
WO3 nanostructures could also exhibit good photocatalytic
performance, we used this for our photodecomposition
study. For the present study, we used 0.25 mmole of Pro-
cion Red MX-5B reactive dye in 20 mL of DDW and about
0.05 g of all the three as-prepared WO3 powders were
mixed with the as-prepared dye solution and the photode-
composition experiment was carried out. A 2.0 mW UV
light source with 365 nm wavelength was used for this
work. Three experiments were carried out with three dif-
ferent WO3 nanostructure morphologies. The absorption
spectra changes during the photodecomposition of the
reactive dye and resulted with a decrease in the absorption
maximum. The results are shown in Fig. 8a–c for all the
three morphologies. Absorption value a, b, and c in Fig. 8,
respectively, correspond to pure as-prepared dye, dye in
dark for 24 h, and dye kept in UV light for 24 h, but
without WO3 dispersion. From the observed results, we
come to a conclusion that there is no any noticeable change
when maintained for 24 h in dark, but a slight decrease in
absorption was observed after 24 h exposure in UV illu-
mination. With this initial study, the as-prepared WO3
nanostructures were dispersed in the dye solution and
illuminated with UV light for 3, 6, 9, 12, and 24 h and their
absorptions were recorded. The spectra in Fig. 8d–h cor-
respond to respective absorption spectra from the overall
experimental results. Upon comparison of all the results, it
was found that the WO3 nanowire cluster dispersed med-
ium has responded quickly in decomposing the dye. UV–
Vis absorption spectra have shown that, only this particular
morphology has high cross-section for absorption of pho-
tons, and this could be the reason for the quick response in
decomposition.
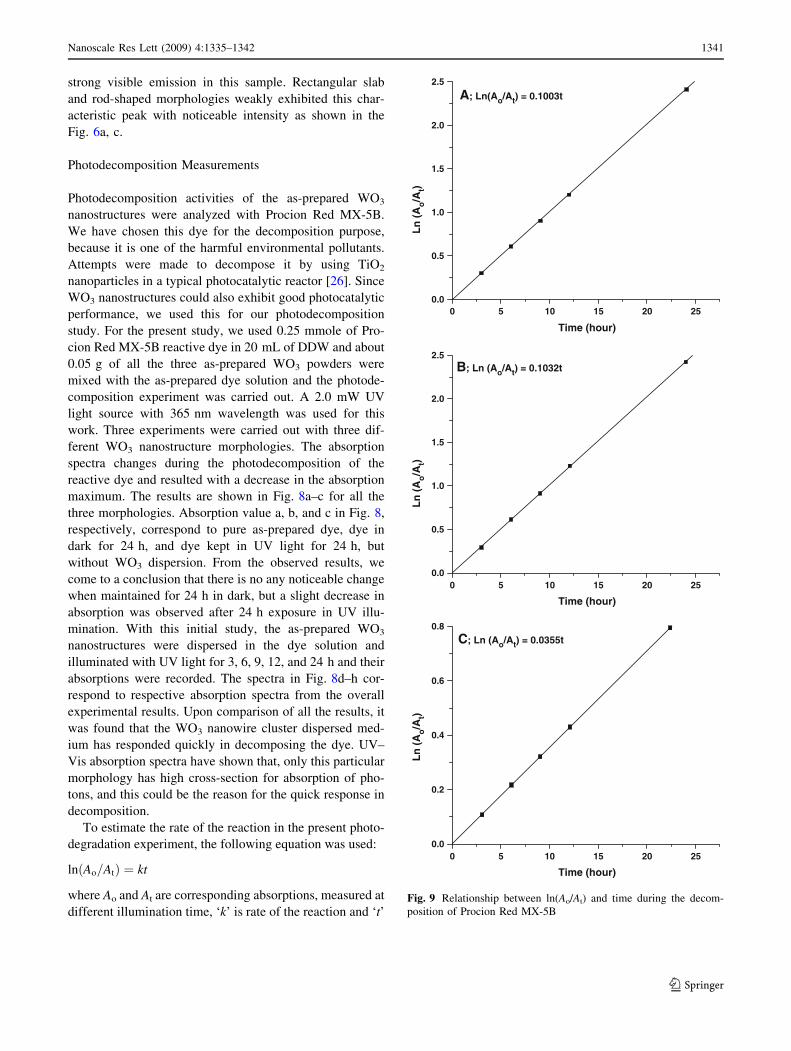
To estimate the rate of the reaction in the present photo-
degradation experiment, the following equation was used:
lnðAo=AtÞ ¼ kt
where Ao and At are corresponding absorptions, measured at
different illumination time, ‘k’ is rate of the reaction and ‘t’
0.0
0.5
1.0
1.5
2.0
2.5B; Ln (Ao/At) = 0.1032t
Time (hour)
0.0
0.5
1.0
1.5
2.0
2.5
A; Ln(Ao/At) = 0.1003t
Time (hour)
0 5 10 15 20 25
0 5 10 15 20 25
0 5 10 15 20 250.0
0.2
0.4
0.6
0.8
C; Ln (Ao/At) = 0.0355t
Ln
(A
o/A
t)
Time (hour)
Ln
(A
o/A
t)L
n (
Ao/A
t)
Fig. 9 Relationship between ln(Ao/At) and time during the decom-
position of Procion Red MX-5B
Nanoscale Res Lett (2009) 4:1335–1342 1341
123
is reaction time. The rate of the reaction k was calculated
from all the three photodecomposition experiments by
drawing a graph between ln(Ao/At) and time. Figure 9a–c
shows the relation between ln(Ao/At) and time. Rate of the
reaction k was obtained from the slope of these graphs and
the as-obtained values are 0.1003, 0.1032, and 0.0355 h-1,
which, respectively, correspond to photodecomposition
reaction with WO3 rectangular slab, nanowire clusters and
nanorod structures. Comparatively a high photodecompo-
sition was noted from WO3 nanowire cluster samples.
Conclusion
Self-assembled WO3 nanostructures were synthesized with
new structure-directing chemicals by using hydrothermal
route and its structural, optical, and photodecomposition
activity were studied. We have obtained different WO3
morphologies like rectangular slab, nanowire clusters, and
nanorods by introducing new structure-directing chemicals
(ferrous ammonium sulfate, cobalt chloride) in this
hydrothermal reaction. The possible growth mechanism of
various shaped WO3 nanostructures was also discussed.
From optical absorption maxima, quantum confinement
effect was realized for all the three morphologies. From
photodecomposition experiment, a relatively high photo-
decomposition activity was observed from nanowire clus-
ters sample due to their high absorption. Further study is
under research to investigate the concentration-dependent
morphologies and their role in photodecomposition.
Acknowledgments The author would like to thank
Dr. K. Swaminathan, Professor and Head, Department of Microbial
Biotechnology, Bharathiar University for his support in utilizing
UV–Vis absorption spectrophotometer. One of the authors
S. Rajagopal would like to thank Bharathiar University for awarding
University Research Fellowship to carry out this work.
References
1. B. Cao, J. Chen, X. Tang, W. Zhou, J. Mater. Chem. 2323, 19
(2009)
2. M. Miyauchi, Phys. Chem. Chem. Phys. 6258, 10 (2008)
3. M. Hoping, C. Schildknecht, H. Gargouri, T. Riedl, M. Tilgner,
H.H. Johannes, W. Kowalsky, Appl. Phys. Lett. 213306, 92
(2008)
4. M. Sadakane, K. Sasaki, H. Kunioku, B. Ohtani, W. Ueda,
R. Abe, Chem. Commun. 6552 (2008)
5. X. Cui, L. Guo, F. Cui, Q. He, J. Shi, J. Phys. Chem. C 4134, 113
(2009)
6. K. Huang, Q. Pan, F. Yang, S. Ni, X. Wei, D. He, J. Phys.
D: Appl. Phys. 155417, 41 (2008)
7. S.R. Bathe, P.S. Patil, Smart Mater. Struct. 025004, 18 (2009)
8. S.N. Alamri, Smart Mater. Struct. 025010, 18 (2009)
9. Z. Luo, J. Yang, H. Cai, H. Li, X. Ren, J. Liu, X. Liang, Thin
Solid Films 5541, 516 (2008)
10. A. Mozalev, V. Khatko, C. Bittencourt, A.W. Hassel, G. Gorokh,
E. Llobet, X. Correig, Chem. Mater. 6482, 20 (2008)
11. Y. Zhang, Y. Chen, H. Liu, Y. Zhou, R. Li, M. Cai, X. Sun,
J. Phys. Chem. C 1746, 113 (2009)
12. A.A. Ashkarran, A. Irajizad, M.M. Ahadian, S.A.M. Ardakani,
Nanotechnology 195709, 19 (2008)
13. K.J. Lethy, D. Beena, V.P. Mahadevan Pillai, V. Ganesan,
J. Appl. Phys. 033515, 104 (2008)
14. Z. Gu, T. Zhai, B. Gao, X. Sheng, Y. Wang, H. Fu, Y. Ma, J. Yao,
J. Phys. Chem. B 23829, 110 (2006)
15. Z. Gu, Y. Ma, W. Yang, G. Zhang, J. Yao, Chem. Commun. 3597
(2005)
16. Z. Gu, H. Li, T. Zhai, W. Yang, Y. Xia, Y. Ma, J. Yao, J. Solid.
State. Chem. 98, 180 (2007)
17. X. Song, Y. Zhao, Y. Zheng, Mater. Lett. 3405, 60 (2006)
18. S. Komaba, N. Kumagai, K. Kato, H. Yashiro, Solid State Ionics
193, 135 (2000)
19. P. Delichere, P. Falaras, M. Froment, A.H. Goff, B. Agius, Thin
Solid Films 35, 161 (1988)
20. M.F. Daniel, B. Desbat, J.C. Lassegues, B. Gerand, M. Figlarz,
J. Solid State Chem. 235, 67 (1987)
21. O.Y. Khyzhun, J. Alloys Compd. 1, 305 (2001)
22. K. Hong, M. Xie, R. Hu, H. Wu, Appl. Phys. Lett. 173121, 90
(2007)
23. K. Lee, W.S. Seo, J.T. Park, J. Am. Chem. Soc. 3408, 125 (2003)
24. M. Feng, A.L. Pan, H.R. Zhang, Z.A. Li, F. Liu, H.W. Liu,
D.X. Shi, B.S. Zou, H.J. Gao, Appl. Phys. Lett. 141901, 86
(2005)
25. S. Pal, C. Jacob, J. Mat. Sci. 5429, 41 (2006)
26. C. Hu, J.C. Yu, Z. Hao, P.K. Wong, Appl. Catal. B: Environ. 47,
42 (2003)
1342 Nanoscale Res Lett (2009) 4:1335–1342
123
Copyright © 2022 FDOKUMEN