Continuous Positive Airway Pressure and Noninvasive Ventilation
Upload
independentCategory
view
3download
0
Comparisons of Noninvasive Bone Mineral Measurementsin Assessing Age-Related Loss, Fracture Discrimination,
and Diagnostic Classification*STEPHAN GRAMPP, HARRY K. GENANT, ASHWINI MATHUR, PHILIPP LANG, MICHAEL JERGAS,
MASAHIKO TAKADA, CLAUS-C. GLUER, YING LU, and MONICA CHAVEZ
ABSTRACTThe purpose of this study was to examine the commonly available methods of noninvasively assessing bonemineralstatus across three defined female populations to examine their interrelationships, compare their respectiveabilities to reflect age- and menopause-related bone loss, discriminate osteoporotic fractures, and classify patientsdiagnostically. A total of 47 healthy premenopausal (age 33 6 7 years), 41 healthy postmenopausal (age 64 6 9years), and 36 osteoporotic postmenopausal (age 70 6 6 years) women were examined with the followingtechniques: (1) quantitative computed tomography of the L1–L4 lumbar spine for trabecular (QCT TRAB BMD)and integral (QCT INTG BMD) bone mineral density (BMD); (2) dual X-ray absorptiometry of the L1–L4posterior-anterior (DXA PA BMD) and L2–L4 lateral (DXA LAT BMD) lumbar spine, of the femoral neck (DXANECK BMD) and trochanter (DXA TROC BMD), and of the ultradistal radius (DXA UD BMD) for integralBMD; (3) peripheral QCT of the distal radius for trabecular BMD (pQCT TRAB BMD) and cortical bone mineralcontent (BMC) (pQCT CORT BMC); (4) two radiographic absorptiometric techniques of the metacarpal (RAMETC BMD) and phalanges (RA PHAL BMD) for integral BMD; and (5) two quantitative ultrasound devices(QUS) of the calcaneus for speed of sound (SOS CALC) and broadband ultrasound attenuation (BUA CALC). Ingeneral, correlations ranged from (r 5 0.10–0.93) among different sites and techniques. We found that pQCTTRAB BMD correlated poorly (r 0.46) with all other measurements except DXAUDBMD (r5 0.62, p 0.0001)and RA PHAL BMD (r 5 0.52, p 0.0001). The strongest correlation across techniques was between QCT INTBMD and DXA LAT BMD (r 5 0.87, p 0.0001), and the weakest correlation within a technique was betweenpQCT TRAB BMD and pQCT CORT BMC (r5 0.25, p 0.05). Techniques showing the highest correlations withage in the healthy groups also showed the greatest differences among groups. They also showed the bestdiscrimination (as measured by the odds ratios) for the distinction between healthy postmenopausal and osteo-porotic postmenopausal groups based on age-adjusted logistic regression analysis. For each anatomic site, thetechniques providing the best results were: (1) spine, QCT TRAB BMD (annual loss, 21.2% [healthy premeno-pausal and healthy postmenopausal]); Student’s t-value [not the T score], 5.4 [healthy postmenopausal vs.osteoporotic postmenopausal]; odds ratio, 4.3 [age-adjusted logistic regression for healthy postmenopausal vs.osteoporotic postmenopausal]); (2) hip, DXA TROCBMD (20.46; 3.5; 2.2); (3) radius, DXAUDBMD (20.44; 3.3;1.9) and pQCT, CORT BMC (20.72; 2.9; 1.7); (4) hand, RA PHAL (20.51; 3.6; 2.0); and (5) calcaneus, SOS(20.09; 3.4; 2.1) and BUA (20.52; 2.6; 1.7). Despite these performance trends, the differences among sites andtechniques were statistically insignificant ( p > 0.05) using age-adjusted receiver operating characteristic (ROC)curve analysis. Nevertheless, kappa score analysis (using 22.0 T score as the cut-off value for osteopenia and 22.5 Tscore for osteoporosis) showed that in general the diagnostic agreement among these measurements in classifyingwomen as osteopenic or osteoporotic was poor, with kappa scores averaging about 0.4 (exceptions were QCT TRAB/INTG BMD, DXA LAT BMD, and RA PHAL BMD, with kappa scores ranging from 0.63 to 0.89). Often differentpatients were estimated at risk by using differentmeasurement sites or techniques. (J BoneMinerRes 1997;12:697–711)
Musculoskeletal Section and Osteoporosis Research Group, Department of Radiology, University of California, San Francisco,California, U.S.A.
*Presented in part by H.K.G. at the XIth International Work-shop on Bone Densitometry, Gleneden Beach, Oregon, U.S.A.,September 24–28, 1995.(28)
JOURNAL OF BONE AND MINERAL RESEARCHVolume 12, Number 5, 1997Blackwell Science, Inc.q 1997 American Society for Bone and Mineral Research
697

INTRODUCTION
OSTEOPOROSIS is the most common generalized disease ofthe skeleton, causing reduction of bone mass and
changes in bone structure. The loss of integrity of thetrabecular network and the cortical shell result in a reduc-tion in bone strength and in fragility fractures. Currentmethods for evaluating skeletal status, assessing osteoporo-sis, and determining fracture risk rely mostly on the nonin-vasive measurement of bone mineral content (BMC) andbone mineral density (BMD).(1–5) Of these methods, themost common is dual X-ray absorptiometry (DXA), typi-cally used at the posterior-anterior and lateral lumbarspine, proximal femur, and forearm. Quantitative computedtomography (QCT) overcomes the projectional limitationsof DXA and allows a selective measurement of trabecularbone in the spine. The validity of QCT of the lumbar spine isgenerally accepted and the method is regarded as a sensi-tive tool for noninvasive measurement of the BMD.(6–11)
Recently, peripheral QCT (pQCT) instruments have be-come available leading to renewed interest in measurementsof the radius.(11–16) Similarly, new techniques to measureBMD of the phalanges(17–19) and metacarpals(20–23) usingradiographic absorptiometry (RA) have shown promisingresults. The only established techniques for noninvasiveassessment of bone status that do not require radiation areultrasound-based techniques measuring ultrasound velocity(speed of sound, SOS) and broadband ultrasound attenua-tion (BUA) at the calcaneus and other sites.(24–27)
The purpose of this study(28) was to examine the above-mentioned methods of noninvasively assessing bone min-eral status across three defined female populations (healthypremenopausal, healthy postmenopausal, and osteoporoticpostmenopausal women) to examine their interrelation-ships, compare their respective abilities to reflect age- andmenopause-related bone loss, discriminate women with os-teoporotic vertebral fractures, and classify women diagnos-tically as osteopenic or osteoporotic.
MATERIALS AND METHODS
We studied 47 healthy premenopausal (PRE, age 33 6 7years), 41 healthy postmenopausal (POST, age 64 6 9years), and 36 osteoporotic postmenopausal (OSTEO, age70 6 6 years) women. Exclusion criteria were history ofgeneralized disease of bone, malignant disease, or traumaat the measurement sites, or any drug treatment that couldinfluence bone metabolism. The diagnosis of osteoporosiswas defined as the presence of at least one atraumaticvertebral fracture. A fracture was determined by a semi-quantitative assessment of morphologic changes of the tho-racic and lumbar spine on lateral conventional radio-graphs.(29) This assessment was based on the qualitativeappearance of each vertebra, with a fracture defined byaltered morphology and a decrease in vertebral height ofapproximately 20% or more at the anterior, middle, orposterior aspect of the vertebral body.Nearly all of these women (Table 1) were examined with
each of the following techniques. (1) QCT with a GE 9800
computerized tomography (CT) scanner (General Electric,Milwaukee, WI, U.S.A.). The standard protocol for spinalbone mineral analysis(6,30,31) was used. It uses a 10 mmthick axial slice in the midsection of four vertebral bodiesfrom L1 to L4. Measurements were performed with a singleenergy technique at 80 kVp. Calibration of the CT imagewas achieved by a simultaneous scanning of a calibrationphantom (Image Analysis, Columbia, KY, U.S.A.) contain-ing various inserts of hydroxyapatite-equivalent material.The images were evaluated on an off-line image processingworkstation with an automated quantitative image evalua-tion technique.(30) Two different regions of interest (ROIs)in each vertebra were evaluated for BMD.(30) These werethe elliptical ROIs, (trabecular bone of the vertebral body)and the integral ROIs (a portion of the trabecular andcortical bone of the entire vertebra representing a cross-section through the midvertebra and portions of the poste-rior elements but no transverse processes or vertebral end-plates). BMDwas determined for each ROI (trabecular [QCTTRABBMD] and integral [QCT INTGBMD]) and expressedin hydroxyapatite-equivalent units (mg/cm3).(6,30–33)
(2) DXA with a Hologic QDR-2000 scanner (HologicInc., Waltham, MA, U.S.A.) using pencil beam, 140/70 kVp,2.0 mA and the manufacturer’s recommended standardanalysis procedures for the posterior-anterior lumbar spineat L1–L4 (DXA PA BMD), the lateral lumbar spine atL2–L4 (DXA LAT BMD), the proximal femur at the fem-oral neck (DXA NECK BMD), trochanter (DXA TROCBMD), intertrochanteric region (DXA INTER BMD), andWard’s triangle (DXAWARD BMD), and the distal radiusat the ultradistal (DXA UD BMD), 1/3 (DXA 1/3 BMD),total (DXA TOT BMD), and midradius (DXA MIDBMD). The software allowed anatomic separation of thedifferent ROIs. Spine scans were performed with the pa-tient in the supine position. Lateral scans were performedfollowing a PA scan in which the vertebral levels wereidentified with the subject in supine position. Hip scanswere performed with the subject in supine position. Distalradius scans were performed with the subject’s arm placedpalm down on the scanning table, scanning distal to theradial styloid and covering the ultradistal, the distal thirdradius, and the ulna. The projectional BMD results for allROIs were given in grams per square centimeter.(3) Peripheral QCT measurements of the nondominant
radius were obtained with a Stratec XCT-960 scanner(Stratec GmbH, Pforzheim, Germany), using a single en-ergy technique (47 kVp, 0.3 mA). One axial slice (2.5 mmthickness) was obtained at a region defined to be at 4% ofthe ulnar length proximal to the most proximal site of theradial articular surface. The axial slice was automaticallyevaluated to define trabecular, cortical, and total ROIs. Tocalculate the total ROI, the software used a thresholdingalgorithm to define the outer boundary of the bone. Thetrabecular ROI was generated by reducing the area of thetotal ROI by 55%. This was done by trimming pixels fromthe periphery to define a core area, which consists exclu-sively of trabecular bone. The cortical was defined througha second thresholding algorithm identifying bone with highdensity in the outer rim. Constant threshold levels wereused for all subjects (0.5 mg/cm3 for total bone; 0.7 mg/cm3
698 GRAMPP ET AL.
for cortical bone). Based on this approach, pQCT TOTBMD, pQCT TRAB BMD, pQCT CORT BMD and so onwere calculated. From area, slice thickness, and BMD (mg/cm3), the BMC (g) (for example pQCT CORT BMC) ofeach region was calculated.(4) Two computerized RA techniques were performed
on conventional radiographs of the nondominant hand.Two manufacturer-specific aluminum wedges were used asreference phantoms: for the second metacarpal (ChugaiPharmaceutical Co. Ltd, Tokyo, Japan) and for the middlephalanges (Computed Osteosystems, Yellow Springs, OH,U.S.A.). Lateral radiographs were taken for each subject bydirect exposure. The hands were radiographed twice witheach phantom in accordance with the procedures providedby the manufacturers (50 kVp, 400 mA, 0.8 s, and 60 kVp,300 mA, 0.5 s; the mean of the double measurement wasused in the data analysis). The focus-to-film distance was105 cm. An aluminum alloy reference wedge was placedparallel to the middle phalanx of the index finger (phalanxmeasurement) or parallel to the main axis of the entirehand (metacarpal measurement). Developed films weresent to both manufacturers for analysis. In order to do this,each film was digitized by a high resolution video camera.For the phalanx measurements, ROIs were defined encom-passing the wedge and the middle phalanges; ROIs for themetacarpal measurements were encompassing the wedgeand a 6- to 8-mm-long portion (10% of the length) of thesecond metacarpal. Through a curve fitting process appliedto the wedge image data, a set of parameters was calculateddefining the relationship between absorber density and op-tical density for each individual film. These parameterswere applied to the bone image data to compute bonemineral mass. The integral BMDs (RA CH METC BMDand RA CO PHAL BMD) for the respective bones weredetermined with both techniques and given as aluminum-equivalent units in grams per square centimeter.(5) Two quantitative ultrasound devices made by Walker
Sonix (WS, Hologic Inc.) and the Lunar Achilles (LA,Lunar Corp., Madison, WI, U.S.A.) were used for measure-ments of the calcaneus of the nondominant side. Bothsystems used an emitting and receiving transducer eitherside of the heel, with water (heated to 358C) as the couplingagent. The systems used a transmitting transducer with acentral frequency of 0.5 MHz, which was electronicallyexited to produce a broadband spectra. Ultrasonic waveswith a predominant bipolar appearance were transmittedthrough the heel, detected by receiving transducers, anddigitized for analysis. SOS (m/s) and BUA (dB/MHz) weredetermined (SOS WS CALC, BUA WS CALC, SOS LACALC, and BUS LA CALC) with both machines accordingto the manufacturers’ recommended standard procedures.The means and standard deviations of the measurements
for the three subject groups were calculated. The Student’st-test (t values and p values) and percent decrement wereused for comparing the different measurements for reflect-ing intergroup differences. Annual changes were expressedas percent changes relative to the predicted values at age 30and as fractional standard deviations relative to the stan-dard deviation (SD) of PRE. Correlations with age alongwith p values are also reported. Odds ratios (for 1 SD
decrease in the measured parameter) and 95% confidencelimits based on the age-adjusted logistic regression werecalculated to measure the discriminative ability (for dis-criminating between OSTEO and POST group) and the riskof osteoporotic fracture associated with the measured pa-rameter. The pairwise comparisons of the discriminativeabilities were tested using age-adjusted receiver operatingcharacteristic (ROC) curve analysis.Pairwise comparisons of all techniques were obtained by
pooling all subjects (PRE, POST, OSTEO) and using Pear-son’s correlation coefficients (r), percent standard errors ofthe estimate (CV), and p values for testing significance ofthe correlations.To compare techniques for their diagnostic ability, a
kappa score analysis was done on the postmenopausalwomen (POST and OSTEO) and osteoporotic postmeno-pausal women (OSTEO). This was done by classifying everywomen from the postmenopausal groups as osteopenic ifher T score with respect to the reference group (PRE) wasless than 22.0. Similarly every subject from the osteopo-rotic group was classified as osteoporotic if her T scorecompared with the reference group (PRE) was less than22.5. The T score for an individual woman and a particularmeasurement is defined as the measurement minus themean measurement for the young normals (PRE) dividedby the SD of the measurement in the PRE group. Note thatthe T score is measuring the position of an individualwoman with respect to the PRE group and is different fromthe Student’s t value.
RESULTS
Results showed that all parameters (except pQCT TRABBMD) between the PRE and POST groups had statisticallysignificant differences ( p # 0.05) (Table 1). Except forpQCT TRAB BMD, pQCT CORT BMD, pQCT TRABBMC, SOS WS CALC, and BUA LA CALC, other mea-surements showed statistically significant differences be-tween POST and OSTEO groups ( p # 0.05; Table 1). TheStudent’s t values and percent decrements demonstrate thedifferent levels of significance (Table 1 and Fig. 1).Linear regressions showed that in healthy women (PRE
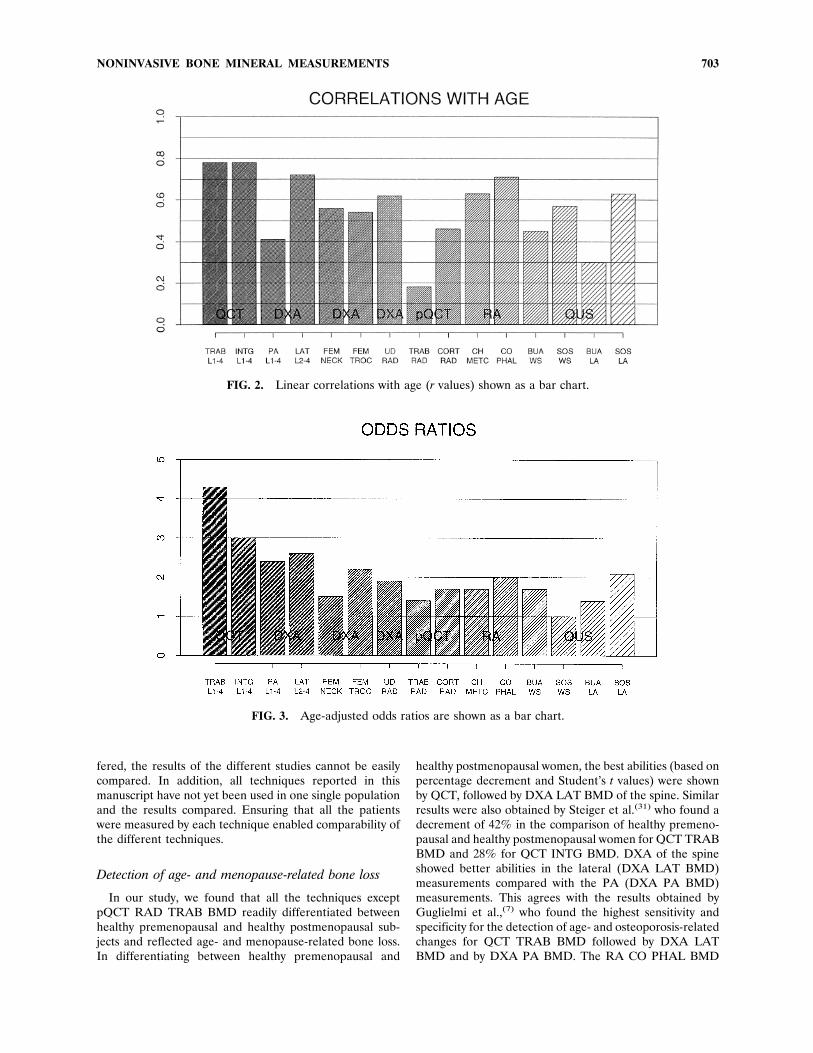
AND POST) the only parameter not significantly corre-lated with age was pQCT TRAB BMD. All other parame-ters were significantly correlated with age ( p # 0.05;Table 1 and Fig. 2). The highest correlation with age wasfound at the spine with r 5 20.78 for QCT TRAB BMDand QCT INTG BMD and r 5 20.72 for DXA LAT BMD.The highest annual bone loss was measured by QCT TRABBMD (1.18%), DXA WARD BMD (1.0%), and QCTINTG BMD (0.80%). The smallest annual changes wereregistered for both measurements of the ultrasound param-eter SOS (SOS WS CALC 5 20.02; SOS LA CALC 520.09). However, when expressed in terms of SD ratherthan percentages (relative to PRE) the annual changes forultrasound SOS were comparable to most other techniques.Age-adjusted odds ratios for discriminating the OSTEO
from POST group were significant for QCT TRAB BMD(4.3, 95% confidence limits 1.8, 10.0) and QCT INTG BMD
NONINVASIVE BONE MINERAL MEASUREMENTS 699

TABLE 1. COMPARISON OF MEANS, AGE-RELATED LOSSES, AND FRACTURE ASSOCIATIONS BY TECHNIQUE
Methodparameter (n)
Mean SD% decr.t valuep valuePRE vs.POST
% decr.t valuep valuePOSTvs.
OSTEO
Annual loss(%)/SDPRE 1POST
Cor (2) w.age p valuePRE 1POST
Odds ratioLCL/UCLPOST vs.OSTEO
ROCAREA SEPOST vs.OSTEOPRE POST OSTEO
QCT TRAB 178 106 72 40.7 31.5 1.18 0.78 4.3 0.82BMD mg/cm3 33 30 22 10.7 5.4 0.064 0.0001 1.8/10.1 0.05(123) 0.0001 0.000QCT INTG 289 208 176 27.8 15.5 0.80 0.78 3.0 0.80BMD mg/cm3 36 31 29 11.2 4.7 0.064 0.0001 1.5/6.1 0.05(123) 0.0001 0.000DXA PA BMD 1.02 0.90 0.79 11.7 12.0 0.30 0.41 2.4 0.78g/cm2 (124) 0.12 0.12 0.15 4.6 3.6 0.026 0.0001 1.4/4.2 0.05
0.0001 0.001DXA LAT BMD 0.82 0.65 0.58 20.8 11.4 0.58 0.72 2.6 0.79g/cm2 (123) 0.08 0.08 0.07 9.7 4.2 0.058 0.0001 1.4/5.0 0.05
0.0001 0.000DXA FEM 0.82 0.67 0.62 18.0 7.7 0.53 0.56 1.5 0.71NECK BMD 0.12 0.12 0.10 5.8 2.0 0.036 0.0001 0.9/2.5 0.06g/cm2 (124) 0.0001 0.045DXA FEM 0.69 0.58 0.52 15.8 11.5 0.46 0.54 2.2 0.77TROC BMD 0.10 0.08 0.09 5.7 3.5 0.033 0.0001 1.3/3.8 0.05g/cm2 (124) 0.0001 0.001DXA FEM 1.09 0.90 0.84 17.4 6.7 0.47 0.55 1.5 0.71INTER BMD 0.14 0.13 0.15 6.4 2.1 0.030 0.0001 0.9/2.5 0.06g/cm2 (124) 0.0001 0.040DXA FEM 0.76 0.50 0.43 34.2 14.0 1.00 0.70 1.6 0.72WARD BMD 0.15 0.14 0.11 8.1 2.5 0.040 0.0001 0.9/2.9 0.06g/cm2 (124) 0.0001 0.020DXA FEM 0.94 0.77 0.71 18.1 7.8 0.48 0.57 1.6 0.73TOT BMD 0.12 0.11 0.12 6.5 2.4 0.030 0.0001 0.9/2.7 0.06g/cm2 (124) 0.0001 0.020DXA RAD 0.44 0.38 0.34 14.0 10.4 0.44 0.62 1.9 0.74UD BMD 0.05 0.04 0.06 6.1 3.3 0.039 0.0001 1.0/3.5 0.06g/cm2 (122) 0.0001 0.002DXA RAD 0.68 0.60 0.56 11.8 6.7 0.38 0.64 1.6 0.721/3 BMD 0.05 0.07 0.07 6.3 2.9 0.052 0.0000 0.9/2.7 0.06g/cm2 (122) 0.0000 0.006DXA RAD 0.59 0.53 0.48 10.2 9.4 0.35 0.63 2.1 0.73MID BMD 0.05 0.06 0.07 5.8 3.2 0.042 0.0000 1.0/4.6 0.06g/cm2 (122) 0.0000 0.002DXA RAD 0.57 0.50 0.46 12.3 8.0 0.46 0.66 2.2 0.74TOT BMD 0.04 0.05 0.06 6.5 3.3 0.053 0.0000 1.1/4.4 0.06g/cm2 (122) 0.0000 0.001pQCT RAD 192 175 161 9.0 8.1 0.22 0.18 1.4 0.70TRAB BMD 30 53 41 1.8 1.2 0.014 0.1000 0.9/2.4 0.06mg/cm3 (106) 0.0829 0.230pQCT RAD 692 650 618 6.1 4.9 0.19 0.31 1.3 0.71CORT BMD 70 85 69 2.3 1.7 0.019 0.0070 0.7/2.3 0.06mg/cm3 (106) 0.0200 0.090pQCT RAD 361 323 290 10.5 10.2 0.31 0.35 1.5 0.73TOT BMD 49 62 53 2.9 2.4 0.023 0.0020 0.9/2.8 0.06mg/cm3 (106) 0.0050 0.020pQCT RAD 68 59 55 13.2 6.8 0.38 0.30 1.2 0.69TRAB BMC 13 17 16 2.8 1.0 0.019 0.0070 0.7/2.1 0.06mg (106) 0.0070 0.300
700 GRAMPP ET AL.

(3.0, 1.5, 6.1), for DXA PA BMD (2.4, 1.4, 4.2), DXA LATBMD (2.6, 1.4, 5.0), DXA TROC BMD (2.2, 1.3, 3.8), DXAUD BMD (1.9, 1.0, 3.5), DXA MID BMD (2.1, 1.0, 4.6),DXA RAD TOT BMD (2.2, 1.1, 4.4), for RA CO PHALBMD (2.0, 1.1, 3.6), and for BUA WS CALC (1.7, 1.0, 3.0)and SOS LA CALC (2.1, 1.2, 3.9) (Table 1 and Fig. 3). Thearea under the age adjusted ROC curves for the differentmeasurements were not significantly different from eachother ( p . 0.05).For further comparisons between and among techniques,
we selected from each technique those parameters that aremost widely used. We also included the parameters thatshowed the best performance if they were not the mostcommonly used parameters. (See Tables 2 and 3).Correlations, percentage standard error of estimate
(CV), and p values based on all women and on linearregressions for the selected parameters are given in Table 2.Correlations ranged from 0.11 to 0.94 among different sitesand techniques. We found that pQCT TRAB BMD corre-lated poorly, with correlations less than 0.46 with othermeasurements (except DXA UD BMD, r 5 0.62, p #0.0001 and RA CO PHAL BMD, r 5 0.52, p # 0.0001).Comparing all techniques, the strongest correlation acrosstechniques was between QCT INTG BMD and DXA LATBMD (r 5 0.87, p # 0.0001) and the weakest within a
technique was between pQCT TRAB BMD and pQCTCORT BMC (r5 0.25, p# 0.01). The mean correlation andthe associated SD for each technique was calculated(Fig. 4). On the average, the QCT techniques correlatedbest while the pQCT and QUS techniques showed weakercorrelations.By kappa analysis the diagnostic agreement among the
different measurements was generally poor in classifyingpostmenopausal women (POST and OSTEO) as osteopenic(T score , 2.0) or in classifying women with vertebralfractures (OSTEO) as osteoporotic (T score , 2.5) (Table 3and Figs. 5 and 6). Exceptions were the kappa analysiscomparisons among QCT TRAB, QCT INTG, DXA LAT,and RA PHAL, which gave kappa scores between 0.65 and0.89 for the classification as osteopenic and between 0.63and 0.87 for the classification as osteoporotic. Even in thesecases, different patients were sometimes estimated at riskby different measurement approaches (Figs. 5 and 6).
DISCUSSION
Measurements of different bone parameters such asBMD, BMC, SOS, or BUA at various body sites have beenfound useful in assessing skeletal status, assessing osteopo-
TABLE 1. CONTINUED
Methodparameter (n)
Mean SD% decr.t valuep valuePRE vs.POST
% decr.t valuep valuePOSTvs.
OSTEO
Annual loss(%)/SDPRE 1POST
Cor (2) w.age p valuePRE 1POST
Odds ratioLCL/UCLPOST vs.OSTEO
ROCAREA SEPOST vs.OSTEOPRE POST OSTEO
pQCT RAD 145 111 87 23.2 21.9 0.72 0.46 1.7 0.73CORT BMC 40 38 30 3.7 2.9 0.027 0.0001 0.9/3.2 0.06mg (106) 0.0004 0.006pQCT RAD 283 241 221 14.8 8.3 0.44 0.54 1.4 0.69TOT BMC 43 32 35 4.9 2.4 0.029 0.0000 0.8/2.7 0.06mg (106) 0.0000 0.020RA CH 2.48 2.13 1.91 14.2 10.3 0.47 0.63 1.7 0.73METC BMD 0.30 0.28 0.29 4.9 3.3 0.038 0.0001 0.9/3.3 0.06A1 eqival. (103) 0.0001 0.002RA CO 107 88 79 18.6 10.0 0.51 0.71 2.0 0.77PHAL BMD 9 11 10 8.2 3.6 0.062 0.0001 1.1/3.6 0.06A1 eqival. (103) 0.0001 0.001BUA WS 89 74 64 16.5 13.5 0.52 0.45 1.7 0.73CALC 18 16 18 4.1 2.6 0.026 0.0001 1.0/3.0 0.06db/MHz (123) 0.0001 0.010SOS WS 1517 1505 1504 0.8 0.1 0.02 0.57 1.0 0.69CALC 11 8 27 5.6 0.32 0.034 0.0001 0.6/1.5 0.06m/s (121) 0.0001 0.750BUA LA 117 111 106 5.1 5.2 0.18 0.30 1.4 0.70CALC 13 12 15 2.2 1.9 0.016 0.0050 0.8/2.4 0.06db/MHz (115) 0.0310 0.068SOS LA 1580 1532 1510 3.0 1.5 0.09 0.63 2.1 0.78CALC 38 30 26 6.3 3.4 0.039 0.0001 1.2/3.9 0.05m/s (115) 0.0001 0.001
NONINVASIVE BONE MINERAL MEASUREMENTS 701

rosis, and determining osteoporotic fracture risk. QCT ofthe spine has been used to assess the skeletal status anddetect age- and disease-related changes,(6–11,30–33) but ithas been less widely used than DXA due to its cost andcomplexity. More recently, QUS, pQCT, and computerized
RA have been introduced as reliable methods for assessingskeletal status.Most of these techniques have been evaluated and com-
pared in limited combinations in different studies. Since thestudy populations and/or the definition of osteoporosis dif-
FIG. 1. (A) QCT TRAB BMD, (B) DXA LAT BMD, (C) DXA FEM TROC BMD, (D) DXA RAD UD BMD, (E)pQCT CORT RAD BMC, (F) RA CO PHAL BMD, (G) BUA WS CALC, and (H) SOS LA CALC in the discriminationof study groups. Means with standard deviation lines are given.
702 GRAMPP ET AL.
fered, the results of the different studies cannot be easilycompared. In addition, all techniques reported in thismanuscript have not yet been used in one single populationand the results compared. Ensuring that all the patientswere measured by each technique enabled comparability ofthe different techniques.
Detection of age- and menopause-related bone loss
In our study, we found that all the techniques exceptpQCT RAD TRAB BMD readily differentiated betweenhealthy premenopausal and healthy postmenopausal sub-jects and reflected age- and menopause-related bone loss.In differentiating between healthy premenopausal and
healthy postmenopausal women, the best abilities (based onpercentage decrement and Student’s t values) were shownby QCT, followed by DXA LAT BMD of the spine. Similarresults were also obtained by Steiger et al.(31) who found adecrement of 42% in the comparison of healthy premeno-pausal and healthy postmenopausal women for QCT TRABBMD and 28% for QCT INTG BMD. DXA of the spineshowed better abilities in the lateral (DXA LAT BMD)measurements compared with the PA (DXA PA BMD)measurements. This agrees with the results obtained byGuglielmi et al.,(7) who found the highest sensitivity andspecificity for the detection of age- and osteoporosis-relatedchanges for QCT TRAB BMD followed by DXA LATBMD and by DXA PA BMD. The RA CO PHAL BMD
FIG. 2. Linear correlations with age (r values) shown as a bar chart.
FIG. 3. Age-adjusted odds ratios are shown as a bar chart.
NONINVASIVE BONE MINERAL MEASUREMENTS 703

TABLE 2. CORRELATION COEFFICIENTS (R) AND %SEE (CV) FOR ALL WOMEN (PRE, POST AND OSTEO) P VALUE 5 NS,NOT SIGNIFICANT AT 0.05; 21 SIGNIFICANCE AT 0.05; 22 AT 0.01; 23 AT 0.001; 24 AT 0.0001
r CV p
QCTTRABBMD
QCTINTGBMD
DXAPABMD
DXALATBMD
DXAFEMNECKBMD
DXAFEMTROCBMD
DXAUDRADBMD
pQCTTRABRADBMD
pQCTCORTRADBMC
RACHMETCBMD
RACOPHALBMD
BUAWSCALC(db/MHz)
SOSWSCALC(m/s)
BUALACALC(db/MHz)
SOSLACALC(m/s)
QCT 1 0.94 0.72 0.87 0.71 0.77 0.76 0.40 0.64 0.71 0.81 0.64 0.40 0.40 0.79TRAB 8.8 12.1 9.2 14.2 12.1 11.0 23.0 28.7 12.1 9.8 19.9 1.1 11.5 1.7BMD 24 24 24 24 24 24 24 24 24 24 24 24 24 24QCT 0.94 1 0.83 0.88 0.77 0.83 0.76 0.41 0.62 0.72 0.80 0.60 0.37 0.41 0.76INTG 15.1 9.6 8.9 12.8 10.7 11.0 22.8 29.4 11.9 10.1 20.7 1.1 11.4 1.9BMD 24 24 24 24 24 24 24 24 24 24 24 24 24 24DXA 0.72 0.83 1 0.74 0.76 0.76 0.62 0.36 0.48 0.57 0.61 0.50 0.31 0.34 0.58PA 30.2 14.0 12.8 13.1 12.3 13.3 23.2 32.8 14.0 13.5 22.4 1.1 11.8 2.3BMD 24 24 24 24 24 24 24 24 24 24 24 23 23 24DXA 0.87 0.88 0.74 1 0.71 0.81 0.67 0.40 0.55 0.66 0.75 0.61 0.41 0.35 0.74LAT 21.0 11.9 11.7 14.2 11.3 12.5 22.9 31.2 12.8 11.3 20.5 1.1 11.7 1.9BMD 24 24 24 24 24 24 24 24 24 24 24 24 24 24DXA 0.71 0.77 0.76 0.71 1 0.84 0.67 0.40 0.53 0.60 0.62 0.54 0.37 0.34 0.67FEM 30.6 16.1 11.3 13.3 10.4 12.5 22.9 31.8 13.7 13.3 21.8 1.1 11.8 2.1NECK 24 24 24 24 24 24 24 24 24 24 24 24 23 24BMDDXA 0.77 0.83 0.76 0.81 0.84 1 0.65 0.45 0.49 0.60 0.69 0.55 0.34 0.29 0.72FEM 27.5 14.2 11.2 11.2 11.0 12.8 22.2 32.6 13.7 12.3 21.6 1.1 12.0 2.0TROC 24 24 24 24 24 24 24 24 24 24 24 23 22 24BMDDXA 0.76 0.76 0.62 0.67 0.67 0.65 1 0.62 0.69 0.74 0.77 0.56 0.42 0.24 0.66UD 27.9 16.3 13.5 13.8 14.8 14.4 19.7 25.9 11.4 10.8 21.3 1.1 11.1 2.1RAD 24 24 24 24 24 24 24 24 24 24 24 24 21 24BMDpQCT 0.40 0.41 0.36 0.40 0.40 0.45 0.62 1 0.25 0.38 0.52 0.41 0.29 0.11 0.46TRAB 40.3 23.2 16.0 17.2 19.1 17.5 13.3 36.3 15.5 14.5 23.3 1.2 11.8 2.6RAD 24 24 24 24 24 24 24 21 24 24 24 22 NS 24BMDpQCT 0.64 0.62 0.48 0.55 0.53 0.49 0.69 0.25 1 0.62 0.63 0.42 0.27 0.30 0.42CORT 33.8 20.0 15.1 15.6 17.7 17.1 12.1 24.2 13.2 13.2 23.2 1.2 11.3 2.6RAD 24 24 24 24 24 24 24 21 24 24 24 22 22 24BMCRA 0.71 0.72 0.57 0.66 0.60 0.60 0.74 0.38 0.62 1 0.73 0.51 0.28 0.26 0.60CH 32.7 18.5 14.9 14.7 16.5 16.1 12.2 23.5 30.3 11.6 23.7 1.2 12.0 2.4METC 24 24 24 24 24 24 24 24 24 24 24 22 21 24BMDRA 0.81 0.80 0.61 0.75 0.62 0.69 0.77 0.52 0.63 0.73 1 0.62 0.45 0.38 0.75CO 27.1 16.0 14.5 13.1 16.2 14.6 11.6 21.8 29.9 11.8 21.5 1.1 11.4 2.0PHAL 24 24 24 24 24 24 24 24 24 24 24 24 24 24BMDBUA 0.64 0.60 0.50 0.61 0.54 0.55 0.56 0.41 0.42 0.51 0.62 1 0.52 0.41 0.83WS 33.3 20.2 15.0 15.0 16.9 15.9 14.0 22.8 33.9 14.8 13.2 1.0 11.4 1.6CALC 24 24 24 24 24 24 24 24 24 24 24 24 24 24(db/MHz)SOS 0.40 0.37 0.31 0.41 0.37 0.34 0.42 0.29 0.27 0.28 0.45 0.52 1 0.24 0.56WS 39.2 23.3 16.3 17.2 18.6 18.1 15.1 23.9 36.0 16.2 14.9 22.2 12.1 2.4CALC 24 24 22 24 24 23 24 22 22 22 24 24 22 24(m/s)BUA 0.40 0.41 0.34 0.35 0.34 0.29 0.24 0.11 0.30 0.26 0.38 0.41 0.24 1 0.42LA 38.9 23.2 16.3 17.7 19.1 18.5 16.3 25.2 35.1 16.3 15.4 23.8 1.1 2.6CALC 24 24 23 24 23 22 21 NS 22 21 24 24 22 24(db/MHz)SOS 0.79 0.76 0.58 0.74 0.67 0.72 0.66 0.46 0.42 0.60 0.75 0.83 0.56 0.42 1LA 26.1 16.6 14.2 12.7 15.1 13.4 12.6 22.5 33.4 13.6 10.9 14.5 1.0 11.4CALC 24 24 24 24 24 24 24 24 24 24 24 24 24 24(m/s)

TABLE 3. KAPPA SCORES FOR THE CLASSIFICATION OF POSTMENOPAUSAL WOMEN (POST AND OSTEO) AS OSTEOPENIC(T SCORE , 22.0) AND OSTEOPOROTIC POSTMENOPAUSAL (OSTEO) AS OSTEOPOROTIC (T SCORE , 22.5)
kt,22.0t,22.5
QCTTRABBMD
QCTINTGBMD
DXAPABMD
DXALATBMD
DXAFEMNECKBMD
DXAFEMTROCBMD
DXAUDRADBMD
pQCTTRABRADBMD
pQCTCORTRADBMD
RACHMETCBMD
RACOPHALBMD
BUAWSCALC(db/MHz)
SOSWSCALC(m/s)
BUALACALC(db/MHz)
SOSLACALC(m/s)
QCTTRABBMD
1.00 0.89 0.41 0.75 0.34 0.47 0.41 0.25 0.18 0.32 0.68 0.20 0.29 0.04 0.38
1.00 0.87 0.54 0.81 0.16 0.30 0.31 0.17 0.22 0.33 0.75 0.12 0.12 0.03 0.28
QCTINTGBMD
0.89 1.00 0.46 0.75 0.32 0.50 0.43 0.29 0.21 0.32 0.71 0.24 0.33 0.05 0.41
0.87 1.00 0.60 0.86 0.18 0.35 0.43 0.15 0.12 0.28 0.78 0.14 0.14 0.05 0.33
DXAPABMD
0.41 0.46 1.00 0.37 0.43 0.66 0.40 0.16 0.19 0.35 0.31 0.30 0.33 0.06 0.27
0.54 0.60 1.00 0.55 0.15 0.35 0.22 0.07 0.34 0.50 0.44 0.17 0.31 0.04 0.09
DXALATBMD
0.75 0.75 0.37 1.00 0.26 0.44 0.33 0.26 0.21 0.34 0.65 0.27 0.38 0.06 0.47
0.81 0.86 0.55 1.00 0.21 0.40 0.35 0.21 0.08 0.44 0.63 0.16 0.17 0.05 0.34
DXAFEMNECKBMD
0.34 0.32 0.43 0.26 1.00 0.56 0.55 0.21 0.10 0.39 0.19 0.30 0.50 0.13 0.37
0.16 0.18 0.15 0.21 1.00 0.47 0.07 20.04 20.04 20.08 0.06 20.04 0.25 0.17 0.28
DXAFEMTROCBMD
0.47 0.50 0.66 0.44 0.56 1.00 0.33 0.35 0.20 0.33 0.36 0.25 0.36 0.04 0.42
0.30 0.35 0.35 0.40 0.47 1.00 0.38 0.64 0.35 0.53 0.31 0.33 0.33 0.07 0.37
DXAUDRADBMD
0.41 0.43 0.40 0.33 0.55 0.33 1.00 0.44 0.31 0.44 0.36 0.36 0.44 0.07 0.38
0.31 0.43 0.22 0.35 0.07 0.38 1.00 0.58 0.29 0.41 0.44 0.24 20.04 0.07 0.58
pQCTTRABRADBMD
0.25 0.21 0.16 0.26 0.21 0.35 0.44 1.00 0.22 0.33 0.35 0.22 0.16 0.05 0.29
0.17 0.15 0.07 0.21 20.04 0.64 0.58 1.00 0.41 0.57 0.32 0.47 20.04. 20.06 0.40
pQCTCORTRADBMC
0.18 0.21 0.19 0.20 0.10 0.20 0.31 0.22 1.00 0.29 0.17 0.16 0.25 0.13 0.23
0.22 0.12 0.34 20.08 20.04 0.35 0.29 0.41 1.00 0.26 0.19 0.17 0.25 0.24 20.07
RACHMETCBMD
0.32 0.32 0.35 0.34 0.38 0.33 0.44 0.33 0.29 1.00 0.30 0.27 0.23 0.11 0.24
0.33 0.28 0.49 0.44 0.08 0.53 0.41 0.57 0.26 1.00 0.43 0.48 0.33 0.08 0.19
RACOPHALBMD
0.68 0.71 0.30 0.65 0.19 0.36 0.36 0.35 0.17 0.30 1.00 0.33 0.23 0.03 0.50
0.75 0.78 0.44 0.63 0.06 0.31 0.44 0.32 0.19 0.43 1.00 0.23 0.10 0.07 0.35
BUAWSCALC(db/MHz)
0.20 0.24 0.30 0.27 0.30 0.25 0.36 0.22 0.16 0.27 0.33 1.00 0.55 0.18 0.50
0.12 0.14 0.17 0.16 20.04 0.33 0.24 0.47 0.17 0.48 0.23 1.00 0.31 20.05 0.37
SOSWSCALC(m/s)
0.29 0.33 0.33 0.38 0.50 0.36 0.44 0.16 0.25 0.23 0.23 0.55 1.00 0.03 0.63
0.12 0.14 0.31 0.17 0.25 0.33 20.04 20.04 0.25 0.33 0.10 0.31 1.00 20.04 20.04
BUALACALC(db/MHz)
0.04 0.05 0.06 0.63 0.13 0.03 0.07 0.05 0.13 0.11 0.03 0.18 0.03 1.00 0.07
0.03 0.05 0.04 0.05 0.17 0.07 0.07 20.06 0.24 20.08 0.07 20.05 20.04 1.00 0.12
SOSLACALC(m/s)
0.38 0.41 0.27 0.47 0.37 0.43 0.38 0.29 0.23 0.24 0.50 0.50 0.63 0.07 1.00
0.28 0.33 0.09 0.34 0.28 0.37 0.58 0.40 20.08 0.19 0.35 0.37 20.04 0.12 1.00
NONINVASIVE BONE MINERAL MEASUREMENTS 705

technique showed good distinction between healthy pre-menopausal and healthy postmenopausal women and bet-ter sensitivity to age-related changes than pQCT, QUS, andDXA of either femur or radius. A similar trend was re-ported by Matsumoto et al.,(23) who found that RA of themetacarpals provided a sensitivity for discrimination be-tween age groups similar to that of DXA PA BMD. Inaddition, we found that for DXA of the proximal femur, thebest parameter was the DXA FEMWARDBMD; for DXAof the radius, DXA RAD TOT BMD; for pQCT of theradius, pQCT RAD CORT BMC; for RA of the hand, RACO PHAL BMD; and for QUS of the calcaneus, SOS LACALC.Similarly, when investigating age- and menopause-re-
lated changes by linear regression analysis, we found astrong inverse relationship between bone parameters andage for most sites and techniques. Our results, in agreementwith many studies,(7,10,31,34,35) suggest that the sensitivity todetect age-related changes, expressed as percentage annualloss, was higher at the spine measured with QCT TRABBMD than with QCT INTG BMD, DXA LAT BMD, orDXA PA BMD. We found that DXA PA BMD showedcomparatively smaller age-related changes compared withother axial and many appendicular measures except pQCTand QUS. This finding agrees with that of Steiger et al.,(36)
who found smaller changes with age in DXA PA BMD thanin DXA at the femur or at the calcaneus. The authorssuggested that this may be influenced by the fact that DXAPA spine measurements are confounded by degenerativechanges of the vertebrae, a suggestion strongly supportedby Ito et al.(9) and also suggested in our study population.We also found a comparatively high annual change ofaround 21% for DXA FEM WARD. Similar results forDXA of the femur were reported by Greenspan et al.,(37)
who found that in women aged 65 and over, the highestannual BMD changes (20.86%) occurred at the Ward’striangle. However, results given by Steiger et al.(36) for
age-related changes in women aged 65 and over showedlarger changes for DXA FEMNECK BMD and DXA FEMTROC BMD (20.82% and 21.30%, respectively). Thosenumbers differ from ours principally because our measureof annual loss substantially reflects the menopause whileSteiger’s reflect age-related effects among the very elderly.For QUS measurements, we found that BUAWS CALC,
which largely covers a volume of trabecular bone, showed acomparatively high annual loss of 20.52% (the SOS per-cent decrement would generally be low compared withother parameters due to a large denominator). This sup-ports the concept that skeletal sites consisting predomi-nantly of trabecular bone respond faster to metabolic stim-uli than cortical bone.(38,39) This measure, however, was theonly ultrasound parameter in our study which showed sucha substantial annual decrement. Similar results were re-ported by Schott et al.(40) who found annual changes in afemale population of 20.29% by BUA LA CALC and of20.07% by SOS LA CALC. Moris et al.(41) found agecorrelations in women of r 5 20.62 for SOS and r 5 20.59for BUA, similar to our observed correlations.In our study, the measurements at the radius most
strongly influenced by age and menopause were DXA RAD1/3 BMD (20.46%/year) and pQCT RAD COR BMC(20.38%). Age-related changes in cortical BMC at theradius appear to be largely due to endosteal thinning of thecortical bone since both cortical area and cortical BMCdiminish proportionally. The importance of changes in theperipheral cortical bone was recently emphasized in severalstudies at the forearm using DXA(36,42–44) as well aspQCT.(13,15) However, some authors have reported signif-icant losses in radial trabecular BMD of 20.5 to 21.1%/year in women, especially shortly after the meno-pause.(14,45) The differences between our results and thesestudies might be caused by differences between study pop-ulations, especially due to different criteria used in thedefinition of healthy subjects. Moreover, in contrast to
FIG. 4. Mean intersite/technique correlations (average r values by technique) shown as a bar chart.
706 GRAMPP ET AL.

these pQCT studies, which separated cortical bone and softtissue by an iterative contour-finding algorithm(14) or anindividual threshold setting,(45) a constant threshold wasused for all subjects in our study. Although this consistencyof threshold guaranteed a high measurement precision,(15)
it under-represented the total amount of bone in cases oflow overall density or thin cortical rims. Differences in thedata evaluation process were therefore most pronounced inelderly subjects and might be responsible for the inconsis-tency in the trabecular BMD results.With respect to RA techniques, our data showed reason-
able age-related changes at both the phalanges and the
metacarpals. The age-related annual losses were compara-ble to other peripheral measurements used in our study.This result is consistent with the results published for RA atboth sites of the hand. In this context, Fukunaga et al.(21)
demonstrated that RA CH METC BMD showed age-re-lated losses comparable to DXA RAD BMD and betterthen DXA PA BMD of the lumbar spine. Matsumoto etal.(23) reported annual losses in women by RA of the meta-carpals which ranged between 20.8% (in the eighth de-cade) and 21.5% (in the sixth decade). One reason ournumbers differ could be that in calculating annual bone losswe used all the women with ages ranging from 21 to 79,
FIG. 5. Mean (1SD) kappa scores for the classification of postmenopausal women (POST and OSTEO) as osteopenic(T score , 22.0 relative to PRE) shown as a bar chart.
FIG. 6. Mean (1SD) kappa scores for the classification of women with vertebral fractures (OSTEO) as osteoporotic(T score , 2.5 relative to PRE) shown as a bar chart.
NONINVASIVE BONE MINERAL MEASUREMENTS 707

while Matsumoto et al.(23) calculated losses for women ineach decade.
Discrimination of osteoporotic women
Of equal interest to the comparisons of the two healthygroups (reflecting age- and menopause-related changes)are the comparisons of the measurements in their ability todiscriminate between healthy postmenopausal and osteopo-rotic postmenopausal women. We used the Student’s t-test,odds ratios, and area under the ROC curve as statisticalapproaches to quantify the ability of the measurements todiscriminate the osteoporotic postmenopausal group fromthe healthy postmenopausal group. Since most of the mea-surements are influenced by age, we adjusted for age in thelogistic regression and ROC analysis. The results of oddsratios analysis reflected closely the trends shown by theStudent’s t-test. In our study, QCT TRAB BMD and QCTINTG BMD gave the best results based on age-adjustedodds ratios, followed by DXA LAT BMD and DXA PABMD. The same trend, with QCT demonstrating the high-est sensitivity for distinction between normal and osteopo-rotic women, was found in studies by Guglielmi et al.(7) andby Jergas et al.,(35) who compared QCT with DXA LATBMD and DXA PA BMD, by Pacifici et al.,(10) and by VanBerkum et al.,(46) who compared QCT with DXA PA BMD.Some appendicular measurements made in our study alsogave a significant odds ratio but were generally lower com-pared with measurements at the spine. The parametersgiving the highest odds ratio for each of these techniqueswere: for DXA of the femur, FEM TROC BMD; for DXAof radius, RAD TOT BMD; for pQCT of the radius, RADCORT BMC; for RA of the hand, CO PHAL BMD; and forQUS of the calcaneus, SOS LA CALC. The trend of spinemeasurements showing better discrimination for vertebralfractures has been reported in many cross-sectional studiescomparing the abilities of measurements of the spine withthose of peripheral sites.(34,47–50) In contrast, it has beenreported in both cross-sectional and longitudinal studiesthat peripheral measurements may be equal to spinal mea-surements when the latter are obtained by projectionaltechniques such as DXA. Cummings et al.(51) and Davis etal.(52) found that calcaneal DXA measurements were betterthan the DXA PA BMD for assessing hip fracture risk andage-related bone loss. Matsumoto et al.,(23) in a comparisonof RA CH METC BMD and DXA PA BMD, found themethods were equivalent in their abilities to discriminate anosteoporotic group from a healthy group. Grampp et al.,Bjarnson et al., and Overgaard et al. found that DXA of theradius had a discriminative ability comparable to spinalDXA.(15,53,54)
Even with the trends shown in our study, the discrimina-tive abilities of various measurements based on the age-adjusted ROC analysis were not significantly different. Dueto the relatively small sample size of our study, the powerfor detecting small differences is not very great. Therefore,the comparison of odds ratios was only able to depict trendsin our study and could become significant in larger popu-lations. So with the small sample sizes in mind and thetrends shown above, it can be suggested that the ability of
QCT TRAB BMD for the discrimination of osteoporoticsubjects is strongest, followed by QCT INTG BMD. DXAat the spine as well as other measurements at hip, radius,hand, and calcaneus also demonstrate these discriminatoryabilities, similar to each other but weaker than those ofQCT.
Correlations among measurement techniques
Correlations between the different measurementsranged from weak to strong depending on the anatomicsite and technique used. Average correlations amongall the techniques/sites were only modest (Fig. 7) andwere similar to those given in the recent litera-ture.(7,10,11,15,17,19–22,34–36,45,47,55,56) Generally, correlationsbetween measurements at the lumbar spine includingQCT and DXA were modest to strong. Correlations be-tween the various measurement ROIs at the femur usingDXA were modest, and between the various calcaneusmeasurements using QUS weak to moderate. At the radius,measurements performed with pQCT and DXA did notshow strong correlations, and trabecular and cortical boneparameters by pQCT were only weakly correlated.We found modest correlations when comparing axial and
peripheral measurement sites. One remarkable point maybe that in our study the comparison between X-ray basedmethods and ultrasound measurements were only margin-ally lower than those between X-ray based methods alone.This agrees with results given by other authors for measure-ments of BUA(40,41,50,57,58) and SOS.(41,59)
The only study that reported substantially different re-sults from ours for pQCT was from Rico et al.(60) In theirstudy of radial pQCT, correlation coefficients for compar-isons between total BMD and cortical BMD, total BMDand trabecular BMD, and trabecular BMD and corticalBMD were r 5 0.95, 0.62, and 0.43, respectively. This couldbe due to different study populations, a different definitionof osteoporosis, and/or a different algorithm to differentiatecortical bone from soft tissue.
Diagnostic agreement among measurement techniques
The selection of a specific threshold level for t score israther arbitrary, and at any given point the prevalence of“disease” differs substantially by site and technique. In thisexercise we selected a T score of 22 for osteopenia toachieve a reasonable balance between “disease” and “non-disease” in this elderly female population. The selection ofT score of 22.5 for osteoporosis is compatible with WHOproposed criteria and perhaps appropriate for the vertebralfracture group.Considering the relatively modest correlation coefficients
found between the different parameters, techniques, andsites, it is not surprising that by kappa analysis the diagnos-tic agreement among these measures in classifying womenas osteopenic or osteoporotic was generally poor whenusing specific thresholds. The exception to this was theagreement of QCT TRAB/INTG BMD with DXA LATBMD and with RA CO PHAL BMD. Often different pa-tients were estimated at risk by different measurement
708 GRAMPP ET AL.

approaches, (as indicated by the rather low kappa scores).These levels of diagnostic disagreement may result from anumber of factors. All of the techniques have their ownspecific error sources as well as fundamentally differentmethodologies and units of expression that undermine theirrespective abilities to define true biological relationshipswithin or between anatomic sites or between individuals.(1,61)
Beyond technical considerations, genetic and environmen-tal influences and pathophysiologic forces may impact thecortical and trabecular bone envelopes or the appendicularand axial skeleton in a different manner in different indi-viduals,(36,49,52,62) and therefore some of the measured dis-crepancies reflect true anatomic variations that result inunlike diagnostic classifications. These observations havemajor clinical ramifications. The choice of the same T score(22.0 for osteopenia and 22.5 for osteoporosis in thisstudy) for different sites and different techniques may notbe advisable. More importantly, use of a single measure anda specific cut-off to diagnose and treat an individual patientis problematic and perhaps unwise.There are limitations in the interpretation of our study
results. First, due to our small population size, many of thedifferences do not reach statistical significance and someapparent differences may not be real. Second, this study iscross-sectional in design and can provide inferences aboutvertebral fracture discrimination but no information specif-ically about fracture risk prediction or the ability to monitordisease or treatment-induced changes. Third, our resultsmay be influenced by our definition for osteoporosis, re-quiring the presence of a vertebral fracture.(63) This diag-nostic criterion may favor axial measurements over periph-eral measurements, whereas selecting hip fracture or otherlong-bone fracture could provide different ranking of themethods.All of the techniques examined were capable of assessing
age- and menopause-related changes, and of defining theskeletal status in these women. Spinal QCT appeared toprovide the most robust performance overall. The othermeasurements at the axial or appendicular sites were rela-tively similar to each other. The results derived from thevarious techniques were only moderately correlative, whichprecluded the prediction of one parameter from anotherparameter in the individual woman and caused disagree-ment in diagnostic classification in many women.
ACKNOWLEDGMENTS
We thank Cynthia Hayashi-Clark ARRT, Susan SchoenARRT, and Vesta March ARRT for performing the mea-surements and analyses of the patient scans.
REFERENCES
1. Genant HK, Engelke K, Fuerst T, Gluer CC, Grampp S, HarrisST, Jergas M, Lang T, Lu Y, Majumdar S, Mathur A, TakadaM 1996 Noninvasive assessment of bone mineral and structure:State of the art. J Bone Miner Res 11:707–730.
2. Black D, Cummings SR, Genant HK, Nevitt MC, Palermo L,
Browner W 1992 Axial and appendicular bone density predictfractures in older women. J Bone Miner Res 7:633–638.
3. Mosekilde L, Bentzen SM, Ørtoft G, Jorgensen J 1989 Thepredictive value of quantitative computed tomography for ver-tebral body compressive strength and ash density. Bone10:465–470.
4. Spector TD, McCloskey EV, Doyle DV, Kanis JA 1993 Prev-alence of vertebral fracture in women and the relationship withbone density and symptoms: The Chingford Study. J BoneMiner Res 8:817–822.
5. Grampp S, Jergas M, Gluer CC, Lang P, Brastow P, GenantHK 1993 Radiological diagnosis of osteoporosis: Currentmethods and perspectives. Radiol Clin N Am 31:1133–1145.
6. Genant HK, Cann CE, Ettinger B, Gordan GS 1982 Quanti-tative computed tomography of vertebral spongiosa: A sensi-tive method for detecting early bone loss after oophorectomy.Ann Intern Med 97:699–705.
7. Guglielmi G, Grimston SK, Fischer KC, Pacifici R 1994 Os-teoporosis: Diagnosis with lateral and posteroanterior dualx-ray absorptiometry compared with quantitative CT. Radiol-ogy 192:845–850.
8. Genant HK, Gluer CC, Steiger P, Faulkner KG 1992 Quanti-tative computed tomography for the assessment of osteoporo-sis. In: Moss AA, Gamsu G, Genant HK (eds.) Tomography ofthe Body, Vol. 2. W.B. Saunders, Philadelphia, PA, U.S.A., pp.523–549.
9. Ito M, Hayashi K, Yamada M, Uetani M, Nakamura T 1993Relationship of osteophytes to bone mineral density and spinalfracture in men. Radiology 189:497–502.
10. Pacifici R, Rupich R, Griffin M, Chines A, Susman N, AvioliLV 1990 Dual energy radiography versus quantitative com-puter tomography for the diagnosis of osteoporosis. J ClinEndocrinol Metab 70:705–710.
11. Grampp S, Jergas M, Lang P, Steiner E, Fuerst T, Gluer CC,Mathur A, Genant HK 1996 Quantitative CT assessment of thelumbar spine and radius in patients with osteoporosis. AJR AmJ Roentgenol 167:133–140.
12. Ruegsegger P, Durand E, Dambacher MA 1991 Localizationof regional forearm bone loss from high resolution computedtomographic images. Osteoporos Int 1:76–80.
13. Ruegsegger P, Durand EP, Dambacher MA 1991 Differentialeffects of aging and disease on trabecular and compact bonedensity of the radius. Bone 12:99–105.
14. Schneider P, Borner W 1991 Periphere quantitative Comput-ertomographie zur Knochenmineralmessung mit einem neuenspeziellen QCT-Scanner. Fortschr Rontgenstr 154:292–299.
15. Grampp S, Lang P, Jergas M, Gluer CC, Mathur A, Engelke K,Genant HK 1995 Assessment of the skeletal status by periph-eral quantitative computed tomography of the forearm: Short-term precision in-vivo and comparison to dual x-ray absorpti-ometry. J Bone Miner Res 10:1566–1576.
16. Grampp S, Majumdar S, Jergas M, Newitt D, Lang P, GenantHK 1996 Distal radius: In vivo assessment with quantitativeMR imaging, peripheral quantitative CT, and dual x-ray ab-sorptiometry. Radiology 198:213–218.
17. Kleerekoper M, Nelson DA, Flynn MJ, Pawluszka AS, Jacob-sen G, Peterson EL 1994 Comparison of radiographic absorp-tiometry with dual-energy x-ray absorptiometry and quantita-tive computed tomography in normal older white and blackwomen. J Bone Miner Res 9:1745–1749.
18. Yang S-O, Hagiwara S, Engelke K, Dhillon MS, Guglielmi G,Bendavid EJ, Soejima O, Nelson D, Genant HK 1994 Radio-graphic absorptiometry for bone mineral measurement of thephalanges: Precision and accuracy study. Radiology 192:857–859.
19. Cosman F, Herrington B, Himmelstein S, Lindsay R 1991
NONINVASIVE BONE MINERAL MEASUREMENTS 709

Radiographic absorptiometry: A simple method for determi-nation of bone mass. Osteoporos Int 2:34–38.
20. Derisquebourg T, Dubois P, Devogelaer JP, Meys E, Du-quesnoy B, Nagant de Deuxchaisnes C, Delcambre B, March-andise X 1994 Automated computerized radiogrammetry ofthe second metacarpal and its correlation with absorptiometryof the forearm and spine. Calcif Tissue Int 54:461–465.
21. Fukunaga M, Tomomitsu T, Otsuka N, Imai H, Morita R,Nishii Y 1990 Indexes of bone mineral content on secondmetacarpal bone roentgenogram analyzed by digital imageprocessing: A comparison with other bone mass quantifyingmethods. Radiat Med 8:230–235.
22. Hayashi Y, Yamamoto K, Fukunaga M, Ishibashi T, TakahashiK, Nishii Y 1990 Assessment of bone mass by image analysis ofmetacarpal bone roentgenograms: A quantitative digital imageprocessing (DIP) method. Radiat Med 8:173–178.
23. Matsumoto C, Kushida K, Yamazaki K, Imose K, Inoue T 1994Metacarpal bone mass in normal and osteoporotic Japanesewomen using computed x-ray densitometry. Calcif Tissue Int55:324–329.
24. Baran DT, Kelly AM, Karellas A, Gionet M, Price M, Leahy D,Steuterman S, McSherry B, Roche J 1988 Ultrasound attenu-ation of the os calcis in women with osteoporosis and hipfractures. Calcif Tissue Int 43:138–142.
25. Heaney RP, Avioli LV, Chestnut CH, Lappe J, Recker RR,Brandburger GH 1989 Osteoporotic bone fragility: Detectionby ultrasound transmission velocity. JAMA 261:2986–2990.
26. Agren M, Karellas A, Leahey D, Marks S, Baran D 1991Ultrasound attenuation of the calcaneus: A sensitive and spe-cific discriminator of osteopenia in postmenopausal women.Calcif Tissue Int 48:240–244.
27. Gluer CC, Wu CY, Jergas M, Goldstein SA, Genant HK 1994Three quantitative ultrasound parameters reflect bone struc-ture. Calcif Tissue Int 55:46–52.
28. Genant HK, Grampp S, Mathur A, Gluer CC, Jergas M,Takada M, Lang P, Lu Y, Chavez M 1996 Comparisons ofnon-invasive bone mineral measurements in assessing age-related loss, fracture discrimination, and diagnostic classifica-tion. Osteoporos Int 6:76–110.
29. Genant HK, Wu CY, van Kuijk C, Nevitt M 1993 Vertebralfracture assessment using a semi-quantitative technique.J Bone Miner Res 8:1137–1148.
30. Genant HK, Cann CE, Pozzi-Mucelli RS, Kanter AS 1983Vertebral mineral determination by quantitative computed to-mography: Clinical feasibility and normative data. J ComputAssist Tomogr 7:554–559.
31. Steiger P, Block JE, Steiger S, Heuck A, Friedlander A, Et-tinger B, Harris ST, Gluer CC, Genant HK 1990 Spinal bonemineral density by quantitative computed tomography: Effectof region of interest, vertebral level, and technique. Radiology175:537–543.
32. Cann CE, Genant HK 1980 Precise measurement of vertebralmineral content using computed tomography. J Comp AssistTomogr 4:493–500.
33. Cann CE, Genant HK, Kolb FO, Ettinger B 1985 Quantitativecomputed tomography for prediction of vertebral fracture risk.Bone 6:1–7.
34. Reinbold W, Genant H, Reiser U, Harris S, Ettinger B 1986Bone mineral content in early-postmenopausal and postmeno-pausal osteoporotic women: comparison of measurementmethod. Radiology 160:469–478.
35. Jergas M, Breitenseher M, Gluer CC, Yu W, Genant HK 1995Estimates of volumetric bone density from projectional mea-surements improve the discriminatory capability of dual x-rayabsorptiometry. J Bone Miner Res 10:1101–1110.
36. Steiger P, Cummings SR, Black DM, Spencer NE, Genant HK
1992 Age-related decrements in bone mineral density inwomen over 65. J Bone Miner Res 7:625–632.
37. Greenspan SL, Maitland LA, Myers ER, Krasnow MB, KidoTH 1994 Femoral bone loss progresses with age: A longitudinalstudy in women over age 65. J Bone Miner Res 9:1959–1965.
38. Jones CD, Laval-Jeantet AM, Laval-Jeantet MH, Genant HK1987 Importance of measurement of spongious vertebral bonemineral density in the assessment of osteoporosis. Bone8:201–206.
39. Genant H, Cann C, Ettinger B, Gordan G 1982 Determinationof bone mineral loss in the axial skeleton of oophorectomizedwomen using quantitative computed tomography. J ComputAssist Tomogr 6:217–218.
40. Schott AM, Hans D, Sornay-Rendu E, Delmas PD, MeunierPJ 1993 Ultrasound measurements on os calcis: Precision andage-related changes in a normal female population. Osteopo-ros Int 3:249–254.
41. Moris M, Peretz A, Tjeka R, Negeban N, Wouters M, Berg-mann P 1995 Quantitative ultrasound bone measurements:Normal values and comparison with bone mineral density bydual x-ray absorptiometry. Calcif Tissue Int 57:6–10.
42. Mazess RB, Peppler WW, Chesney RW, Lange TA, LindgrenU, Smith E 1983 Does bone measurement on the radius indi-cate skeletal status? Concise communication. J Nucl Med25:281–288.
43. Gardsell P, Johnell O, Nilsson BE, Gullberg B 1993 Predictingvarious fragility fractures in women by forearm bone densitom-etry: a follow-up study. Calcif Tissue Int 52:348–353.
44. Riis BJ, Christiansen C 1988 Measurement of spinal or periph-eral bone mass to estimate early postmenopausal bone loss?Am J Med 84:646–653.
45. Butz S, Wuster C, Scheidt-Nave C, Gotz M, Ziegler R 1994Forearm BMD as measured by peripheral quantitative com-puted tomography (pQCT) in a German reference population.Osteoporos Int 4:179–184.
46. Van Berkum FN, Birkenhager JC, Van Veen LC, ZeelenbergJ, Birkenhager-Frenkel DH, Trouerbach WT, Stijnen T, PolsHA 1989 Noninvasive axial and peripheral assessment of bonemineral content: A comparison between osteoporotic womenand normal subjects. J Bone Miner Res 4:679–685.
47. Heuck AF, Block J, Gluer CC, Steiger P, Genant HK 1989Mild versus definite osteoporosis: Comparison of bone densi-tometry techniques using different statistical models. J BoneMiner Res 4:891–900.
48. Bagur A, Vega E, Mautalen C 1994 Age dependence of thenormal/abnormal difference of bone mineral density in osteo-porotic women. Bone Miner 26:209–218.
49. Riggs BL, Wahner HW, Dunn WL, Mazess RB, Offord KP,Melton III LJ 1981 Differential changes in bone mineral den-sity of the appendicular and axial skeleton with aging. J ClinInvest 67:328–335.
50. Herd RJ, Blake GM, Miller CG, Parker JC, Fogelman I 1994The ultrasonic assessment of osteopenia as defined by dualx-ray absorptiometry. Br J Radiol 67:631–635.
51. Cummings SR, Black DM, Nevitt MC, Browner W, Cauley J,Ensrud K, Genant HK, Palermo L, Scott J, Vogt TM 1993Bone density at various sites for prediction of hip fractures: thestudy of osteoporotic fractures. Lancet 341:72–75.
52. Davis JW, Ross PD, Wasnich RD 1994 Evidence for bothgeneralized and regional low bone mass among elderly women.J Bone Miner Res 9:305–309.
53. Overgaard K, Hansen MA, Riis BJ, Christiansen C 1992 Dis-criminatory ability of bone mass measurements (SPA andDEXA) for fractures in elderly postmenopausal women. CalcifTissue Int 50:30–35.
54. Bjarnson K, Nilas L, Hassager C, Christiansen C 1995 Dual
710 GRAMPP ET AL.
energy x-ray absorptiometry of the spine: Decubitus lateralversus anteroposterior projection in osteoporotic women:Comparison to single energy x-ray absorptiometry of the fore-arm. Bone 16:255–260.
55. Yu W, Gluer CC, Grampp S, Jergas M, Fuerst T, Wu CY, LuY, Fan B, Genant HK 1995 Spinal bone mineral assessment inpostmenopausal women: A comparison between dual x-rayabsorptiometry and quantitative computed tomography. Os-teoporos Int 5:433–439.
56. Overton TR, Wheeler GD 1992 Bone mass measurements inthe distal forearm using dual-energy x-ray absorptiometry andgamma-ray computed tomography: A longitudinal, in vivocomparative study. J Bone Miner Res 7:375–381.
57. Massie A, Reid DM, Porter RW 1993 Screening for osteopo-rosis: Comparison between dual energy x-ray absorptiometryand broadband ultrasound attenuation in 1000 perimenopausalwomen. Osteoporos Int 3:107–110.
58. Young H, Howey S, Purdie DW 1993 Broadband ultrasoundattenuation compared with dual-energy x-ray absorptiometryin screening for postmenopausal low bone density. OsteoporosInt 3:160–164.
59. Faulkner KG, McClung MR, Coleman LJ, Kingston-Sandahl E1994 Quantitative ultrasound of the heel: Correlation withdensitometric measurements at different skeletal sites. Osteo-poros Int 4:42–47.
60. Rico H, Gonzalez-Riola J, Revilla M, Villa LF, Gomez-Cas-
tresana F, Escribano J 1994 Cortical versus trabecular bonemass: Influence of activity on both bone components. CalcifTissue Int 54:470–472.
61. Genant HK, Lu Y, Mathur AK, Fuerst TP, Cummings SR 1996Classification based on DXA measurements for assessing therisk of hip fractures. J Bone Miner Res 11(suppl 1): S120.
62. Hannan M, Felson D, Anderson JJ 1992 Bone mineral densityin elderly men and women: Results from the Framinghamosteoporosis study. J Bone Miner Res 7:547–553.
63. Consensus Development Conference 1993 Diagnosis, prophy-laxis, and treatment of osteoporosis. Am J Med 94:646–650.
Address correspondence and reprint requests to:Harry K. Genant, M.D.
Professor of Radiology, Medicine, and Orthopedic SurgeryExecutive Director, Osteoporosis Research Group
Department of RadiologyMusculoskeletal Section
University of California–San Francisco505 Parnassus Avenue
Box 0628San Francisco, CA 94143 U.S.A.
Received in original form August 14, 1996; in revised form No-vember 1, 1996; accepted December 5, 1996.
NONINVASIVE BONE MINERAL MEASUREMENTS 711
Copyright © 2022 FDOKUMEN