Effect of notch-root radius on the fracture toughness of composite Si3N4 ceramics

www.elsevier.com/locate/ceramint
Ceramics International 33 (2007) 315–320
Evaluation of fracture resistance of ceramics:
Edge fracture tests
George Gogotsi *, Sergey Mudrik, Vasily Galenko
Pisarenko Institute for Problems of Strength, 2, Timiryazevskaya Str., 01014 Kiev, Ukraine
Received 17 June 2005; received in revised form 27 July 2005; accepted 20 September 2005Available online 28 February 2006
Abstract
Advanced oxide and nonoxide ceramics were tested by edge flaking with different indenters. Flaking toughness values obtained with the
Rockwell indenter were shown to be practically proportional to fracture toughness values measured by the single edge V-notched beam (SEVNB)
method. The discussed edge fracture (EF) method enabling the determination of fracture resistance of ceramics in small-size specimen tests was
demonstrated to be appropriate for materials technology as well as for the evaluation of ceramics for dentistry, cutting tools, and like uses.
Emphasis was placed on the results of investigation of chip scars formed upon flaking off the specimens with the Rockwell, Vickers, and Knoop
indenters.
# 2006 Elsevier Ltd and Techna Group S.r.l. All rights reserved.
Keywords: C. Fracture; D. Conventional ceramics; Edge fracture; Flaking toughness; Indentation
1. Introduction
Fracture of brittle materials upon concentrated loads
attracted attention already in the Paleolithic Period, when
stone tools were first developed. This approach was also used
for the choice of the best stones for tool production, which
became the starting point for fracture resistance tests.
A study [1] was a new step in this direction; its authors
revealed the linear relationship between chip sizes (chip width-
to-height and thickness-to-height ratios are approximately
constant) at the same loads applied to the edge of the material.
They proposed [2] to indent a rectangular specimen with the
polycrystalline Rockwell indenter using increasing loads at
different distances from the edge until a chip breaks off,
determined the linear relation between the load Pf required to
produce a chip and the distance d of the indenter from the edge,
and suggested the ratio Pf/d as a measure of the edge toughness
M of the material. One of the authors [3] proposed to use the
slope of the fracture load Pf versus edge distance d diagram to
determine this value. These tests would require a special test
machine because the loading point on indentation must be
* Corresponding author. Tel.: +380 44 285 44 64; fax: +380 44 286 16 84.
E-mail address: [email protected] (G. Gogotsi).
0272-8842/$32.00 # 2006 Elsevier Ltd and Techna Group S.r.l. All rights reserve
doi:10.1016/j.ceramint.2005.09.017
chosen very precisely. For different brittle materials under study
(from Crown glass to tungsten carbide) the edge toughness M
versus critical plane strain energy release rate GIc relationship
was also established. Authors [4] used the Rockwell and Knoop
indenters to investigate not only ceramics and hard metals but
also brittle tool steels. They confirmed the validity of the M–GIc
relationship and noticed that the KIc–GIc relationship was not
observed. Several dental ceramics were extensively studied
elsewhere [5]. The tests were performed under small loads
using a diamond cone. The initial portions of Pf–d diagrams
were nonlinear. Sintered Si3N4 ceramics for valves of internal
combustion engines were also investigated [6,7]. Studies of the
effect of specimen edge shapes on edge toughness resulted in
the modification of their design.
Known data, while very interesting and useful, demonstrate
that the M–GIc relationship has no physical substantiation. It is
not observed for ceramics [8,9] but holds for different brittle
materials (e.g., test results [2,3]). A known procedure does not
take account of differences in the mechanical behavior of
ceramics [10] and other brittle materials, fracture patterns in the
zone of the indenter contact with the specimen as well as the
real fracture surface area formed upon flaking. Therefore, a
more advantageous edge fracture method was developed [9]. Its
efficiency and suitability for testing different ceramic materials
was verified in the present investigation.
d.
G. Gogotsi et al. / Ceramics International 33 (2007) 315–320316
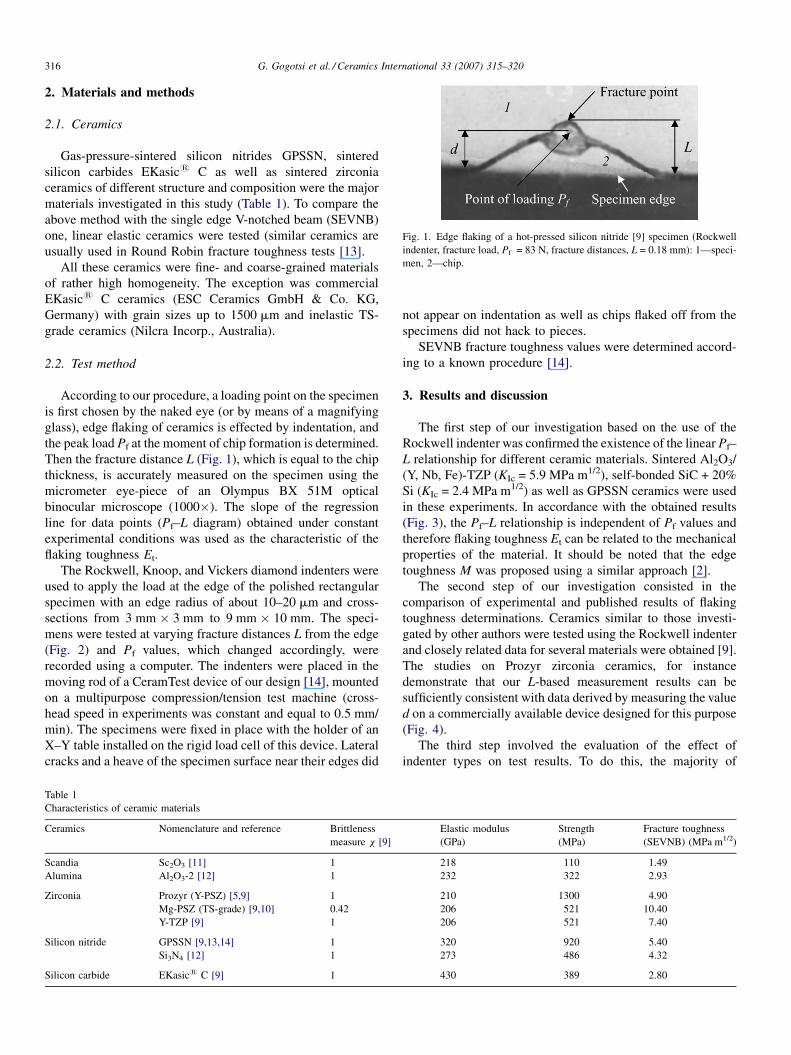
Fig. 1. Edge flaking of a hot-pressed silicon nitride [9] specimen (Rockwell
indenter, fracture load, Pf = 83 N, fracture distances, L = 0.18 mm): 1—speci-
men, 2—chip.
2. Materials and methods
2.1. Ceramics
Gas-pressure-sintered silicon nitrides GPSSN, sintered
silicon carbides EKasic1 C as well as sintered zirconia
ceramics of different structure and composition were the major
materials investigated in this study (Table 1). To compare the
above method with the single edge V-notched beam (SEVNB)
one, linear elastic ceramics were tested (similar ceramics are
usually used in Round Robin fracture toughness tests [13].
All these ceramics were fine- and coarse-grained materials
of rather high homogeneity. The exception was commercial
EKasic1 C ceramics (ESC Ceramics GmbH & Co. KG,
Germany) with grain sizes up to 1500 mm and inelastic TS-
grade ceramics (Nilcra Incorp., Australia).
2.2. Test method
According to our procedure, a loading point on the specimen
is first chosen by the naked eye (or by means of a magnifying
glass), edge flaking of ceramics is effected by indentation, and
the peak load Pf at the moment of chip formation is determined.
Then the fracture distance L (Fig. 1), which is equal to the chip
thickness, is accurately measured on the specimen using the
micrometer eye-piece of an Olympus BX 51M optical
binocular microscope (1000�). The slope of the regression
line for data points (Pf–L diagram) obtained under constant
experimental conditions was used as the characteristic of the
flaking toughness Et.
The Rockwell, Knoop, and Vickers diamond indenters were
used to apply the load at the edge of the polished rectangular
specimen with an edge radius of about 10–20 mm and cross-
sections from 3 mm � 3 mm to 9 mm � 10 mm. The speci-
mens were tested at varying fracture distances L from the edge
(Fig. 2) and Pf values, which changed accordingly, were
recorded using a computer. The indenters were placed in the
moving rod of a CeramTest device of our design [14], mounted
on a multipurpose compression/tension test machine (cross-
head speed in experiments was constant and equal to 0.5 mm/
min). The specimens were fixed in place with the holder of an
X–Y table installed on the rigid load cell of this device. Lateral
cracks and a heave of the specimen surface near their edges did
Table 1
Characteristics of ceramic materials
Ceramics Nomenclature and reference Brittleness
measure x [9]
Scandia Sc2O3 [11] 1
Alumina Al2O3-2 [12] 1
Zirconia Prozyr (Y-PSZ) [5,9] 1
Mg-PSZ (TS-grade) [9,10] 0.42
Y-TZP [9] 1
Silicon nitride GPSSN [9,13,14] 1
Si3N4 [12] 1
Silicon carbide EKasic1 C [9] 1
not appear on indentation as well as chips flaked off from the
specimens did not hack to pieces.
SEVNB fracture toughness values were determined accord-
ing to a known procedure [14].
3. Results and discussion
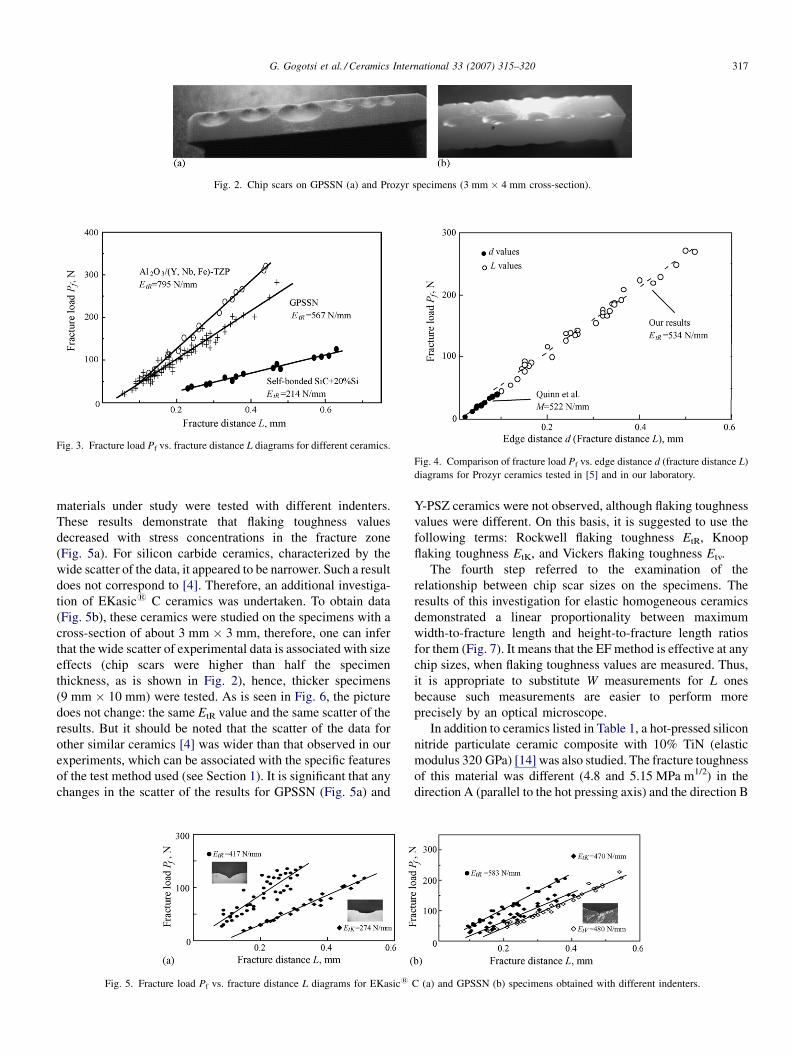
The first step of our investigation based on the use of the
Rockwell indenter was confirmed the existence of the linear Pf–
L relationship for different ceramic materials. Sintered Al2O3/
(Y, Nb, Fe)-TZP (KIc = 5.9 MPa m1/2), self-bonded SiC + 20%
Si (KIc = 2.4 MPa m1/2) as well as GPSSN ceramics were used
in these experiments. In accordance with the obtained results
(Fig. 3), the Pf–L relationship is independent of Pf values and
therefore flaking toughness Et can be related to the mechanical
properties of the material. It should be noted that the edge
toughness M was proposed using a similar approach [2].
The second step of our investigation consisted in the
comparison of experimental and published results of flaking
toughness determinations. Ceramics similar to those investi-
gated by other authors were tested using the Rockwell indenter
and closely related data for several materials were obtained [9].
The studies on Prozyr zirconia ceramics, for instance
demonstrate that our L-based measurement results can be
sufficiently consistent with data derived by measuring the value
d on a commercially available device designed for this purpose
(Fig. 4).
The third step involved the evaluation of the effect of
indenter types on test results. To do this, the majority of
Elastic modulus
(GPa)
Strength
(MPa)
Fracture toughness
(SEVNB) (MPa m1/2)
218 110 1.49
232 322 2.93
210 1300 4.90
206 521 10.40
206 521 7.40
320 920 5.40
273 486 4.32
430 389 2.80
G. Gogotsi et al. / Ceramics International 33 (2007) 315–320 317
Fig. 2. Chip scars on GPSSN (a) and Prozyr specimens (3 mm � 4 mm cross-section).
Fig. 3. Fracture load Pf vs. fracture distance L diagrams for different ceramics.
Fig. 4. Comparison of fracture load Pf vs. edge distance d (fracture distance L)
diagrams for Prozyr ceramics tested in [5] and in our laboratory.
materials under study were tested with different indenters.
These results demonstrate that flaking toughness values
decreased with stress concentrations in the fracture zone
(Fig. 5a). For silicon carbide ceramics, characterized by the
wide scatter of the data, it appeared to be narrower. Such a result
does not correspond to [4]. Therefore, an additional investiga-
tion of EKasic1 C ceramics was undertaken. To obtain data
(Fig. 5b), these ceramics were studied on the specimens with a
cross-section of about 3 mm � 3 mm, therefore, one can infer
that the wide scatter of experimental data is associated with size
effects (chip scars were higher than half the specimen
thickness, as is shown in Fig. 2), hence, thicker specimens
(9 mm � 10 mm) were tested. As is seen in Fig. 6, the picture
does not change: the same EtR value and the same scatter of the
results. But it should be noted that the scatter of the data for
other similar ceramics [4] was wider than that observed in our
experiments, which can be associated with the specific features
of the test method used (see Section 1). It is significant that any
changes in the scatter of the results for GPSSN (Fig. 5a) and
Fig. 5. Fracture load Pf vs. fracture distance L diagrams for EKasic1
Y-PSZ ceramics were not observed, although flaking toughness
values were different. On this basis, it is suggested to use the
following terms: Rockwell flaking toughness EtR, Knoop
flaking toughness EtK, and Vickers flaking toughness Etv.
The fourth step referred to the examination of the
relationship between chip scar sizes on the specimens. The
results of this investigation for elastic homogeneous ceramics
demonstrated a linear proportionality between maximum
width-to-fracture length and height-to-fracture length ratios
for them (Fig. 7). It means that the EF method is effective at any
chip sizes, when flaking toughness values are measured. Thus,
it is appropriate to substitute W measurements for L ones
because such measurements are easier to perform more
precisely by an optical microscope.
In addition to ceramics listed in Table 1, a hot-pressed silicon
nitride particulate ceramic composite with 10% TiN (elastic
modulus 320 GPa) [14] was also studied. The fracture toughness
of this material was different (4.8 and 5.15 MPa m1/2) in the
direction A (parallel to the hot pressing axis) and the direction B
C (a) and GPSSN (b) specimens obtained with different indenters.

G. Gogotsi et al. / Ceramics International 33 (2007) 315–320318
Fig. 7. Maximum chip scar width W (a) and chip scar depth D (b) vs. fracture distance L diagrams of GPSSN specimens tested with different indenters (*: Rockwell,
^: Vickers, and ^: Knoop).
Fig. 6. Fracture load Pf vs. fracture distance L diagrams for EKasic1 C
ceramics (specimens of different sizes) and data [4].
Fig. 8. Fracture load Pf vs. fracture distance L diagrams for a silicon
nitride/titanium nitride particulate ceramic composite (different loading
directions).
(normal to the hot pressing axis), accordingly. Such an effect is
also typical of flaking toughness, as is shown in Fig. 8. It is
interesting to note that in case of a silicon nitride/silicon nitride-
titanium nitride laminar ceramic composite with a compressed
Si3N4 outer layer [14], the relationship between flaking
toughness in the A and B directions is opposite. Tensile stresses
in the compressed outer layer contribute to its fracture under
loading in the direction B.
Considerable study has been given to chip scars on the
tested specimens because they control the accuracy of the
data obtained in this investigation. As is seen, symmetrical
chip scars (Fig. 2) can be obtained if the edge of the
Fig. 9. Chip scars on an
specimen is rectangular, its surface is polished, its loading
plane is perpendicular to the indentation direction. However,
in a lot of cases chip scars look differently. For instance, chip
scars formed on hot-pressed Si3N4 (Fig. 1) were similar to
those shown in [4] for PM tool steel (64 HRC), the shape of
grains governed fracture patterns of EKasic1 C ceramics
(Fig. 9), etc. Based on the results of this investigation and
published data, it is impossible to examine all the factors
controlling edge fracture patterns in different ceramic
materials.
Mention should also be made of some unintelligible effects
observed during the experiments, e.g., nonlinearity of fracture
EKasic1 C specimen.

G. Gogotsi et al. / Ceramics International 33 (2007) 315–320 319
Table 2
Comparison of test methods
Method Choice of a
loading point
Tool for fracture Characterization
of the tested
specimen
Analysis Results
Paleolithic Naked eye Stone in hand Visual examination
of chip scars
Choice of more
fracture-resistant stones
Production of
high-quality
stone tools
Known [2] Microscope of a
special test unit
Indenter in a
special test unit
– Calculation of edge
toughness
Data of edge
fracture resistance
evaluation
Edge
fracture
Naked eye
(or a magnifying glass)
Indenter in a
standard test unit
Measurement of
chip scar sizes
Calculation of
flaking toughness
Data for fracture
toughness evaluation
Fig. 10. Fracture load Pf vs. fracture distance L diagram for Mg-PSZ ceramics.
Fig. 11. Flaking toughness EtR vs. fracture toughness KIc diagram for the
ceramics under study (characters in brackets are the number of tests).
load Pf versus fracture distance L diagrams (Fig. 10). As a
result of their linear approximation, EtR = 878 N/mm can be
obtained. If the Pf–L diagram is divided into 0.15–0.30 mm,
0.30–0.45 mm, and 0.45–0.60 mm pieces, EtR = 550, 891,
and 1040 N/mm are derived. If the Pf–L diagram is divided
into a larger number of pieces or differentiated, the
obtained diagram would be similar to the R-curve for these
ceramics [10]. This problem will be investigated in the
immediate future but it is already clear that the EF method
can provide new reliable data on the fracture resistance of
ceramics.
Before proceeding to the discussion of the results, it would
be appropriate to compare the EF method with those described
elsewhere [2] and probably used in the Paleolithic Period
(Table 2).
Summarizing the investigation results, it might be well to
evaluate the flaking toughness EtR versus fracture toughness KIc
relationships for linear elastic and single phase ceramics under
study (Fig. 11). In this case the validity of the SEVNB method is
obvious since it makes use of fracture mechanics concepts [15]
based on the model solid body which is homogeneous and
linear elastic. These diagrams demonstrate that the flaking
toughness EtR versus fracture toughness KIc relationship is
almost linear.
4. Conclusions
The edge fracture (EF) method can easily be put to practical
use in any laboratory performing mechanical tests.
It has been shown that the RoFkwell flaking toughness EtR
versus fracture toughness KIc relationship is almost linear.
Thus, EtR values can be used for the comparative evaluation of
the fracture resistance of ceramic materials.
Acknowledgments
The authors are thankful to Professor E. Almond (National
Physical Laboratory, UK) for his idea of studying the edge
fracture of ceramics, Dr. J. Quinn (American Dental Associa-
tion Foundation, USA) for her support in launching this
investigation, Dr. J. Kubler (EMPA, Switzerland) and Dr. A
Rendtel (ESK Ceramics GmbH & Co. KG, Germany) for
ceramic specimens as well as Eng. B. Ozersky (Pisarenko
Institute for Problems of Strength, Ukraine) for his assistance in
the performance of experiments.
G. Gogotsi et al. / Ceramics International 33 (2007) 315–320320
References
[1] E. Almond, N. McCormick, Constant geometry edge flaking of brittle
materials, Nature 321 (1986) 53–55.
[2] N. McCormick, E. Almond, Edge flaking of brittle materials, J. Hard
Mater. 1 (1990) 25–51.
[3] N. McCormick, A Method for Edge Toughness Testing, Crown Copy-
right, Nottingham, England, 1991.
[4] R.Morrell,A.Gant,Edgechipping—whatdoes it tellus? in:J.R.Varuer, G.D.
Quinn (Eds.), Fractography of Glasses and Ceramics IV, Ceramic Transac-
tion, vol. 122, American Ceramic Society, Westerville, 2001, pp. 23–41.
[5] J. Quinn, I. Lloyd, Flake and scratch size ratios in ceramics, in: J.R.
Varuer, G.D. Quinn (Eds.), Fractography of Glasses and Ceramics IV,
Ceramic Transaction, vol. 122, American Ceramic Society, Westerville,
2001, pp. 57–72.
[6] M. Hang, R. Danzer, R. Paar, Edge toughness of brittle materials, in: G.N.
Babini, M. Haviar, P. Saigalik (Eds.), Engineering Ceramics’96: Higher
Reliability Through Processing, Kluwer Academic Publishers, 1997, pp.
327–335.
[7] R. Danzer, M. Hangl, R. Paar, Edge chipping of brittle materials, in: J.R.
Varuer, G.D. Quinn (Eds.), Fractography of Glasses and Ceramics IV,
Ceramic Transaction, vol. 122, American Ceramic Society, Westerville,
2001, pp. 43–55.
[8] F. Petit, P. Descamps, J.P. Erauw, F. Cambier, Toughness (KIc) measure-
ment by a sliding indentation method, Key Engineering Materials, vols.
206–213, Transaction Technical Publications, Switzerland, 2002 , pp.
629–632.
[9] G.A. Gogotsi, S. Mudrik, A. Rendtel, Sensitivity of silicon carbide and
other ceramics to edge fracture: method and results, in: E. Lara-Curzio, M.
Readey (Eds.), 28th International Conference on Advanced Ceramics and
Composites: A, Ceramic Engineering & Science Proceedings, American
Ceramic Society, vol. 25 (3), 2004, pp. 237–246.
[10] G.A. Gogotsi, Deformational behaviour of ceramics, J. Eur. Ceram. Soc. 7
(1991) 87–92.
[11] G. Gogotsi, Thermal stress behaviour of yttria, scandia and AlN ceramics,
Ceram. Int. 6 (1980) 31–35.
[12] G.A. Gogotsi, V.I. Galenko, B.I. Ozerskty, T.A. Khristewich, Edge
fracture of elastic ceramics, Strength of materials, 2005, No. 5, pp. 84–92.
[13] J. Kubler, Fracture Toughness of Ceramics Using the SEVNB Method:
Round Robin, VAMAS Report No.37/ESIS Document D2-99, EMPA,
Swiss Federal Laboratories for Materials Testing and Research, Duben-
dorf, Switzerland, September 1999.
[14] G. Gogotsi, Fracture toughness of ceramics and ceramic composites,
Ceram. Int. 29 (2003) 777–784.
[15] T.L. Anderson, Fracture Mechanics: Fundamentals and Applications,
CRS Press LLC, Boca Raton, 1995.
Copyright © 2022 FDOKUMEN