Fracture behaviour of Mg-PSZ ceramics: Comparative estimates
6
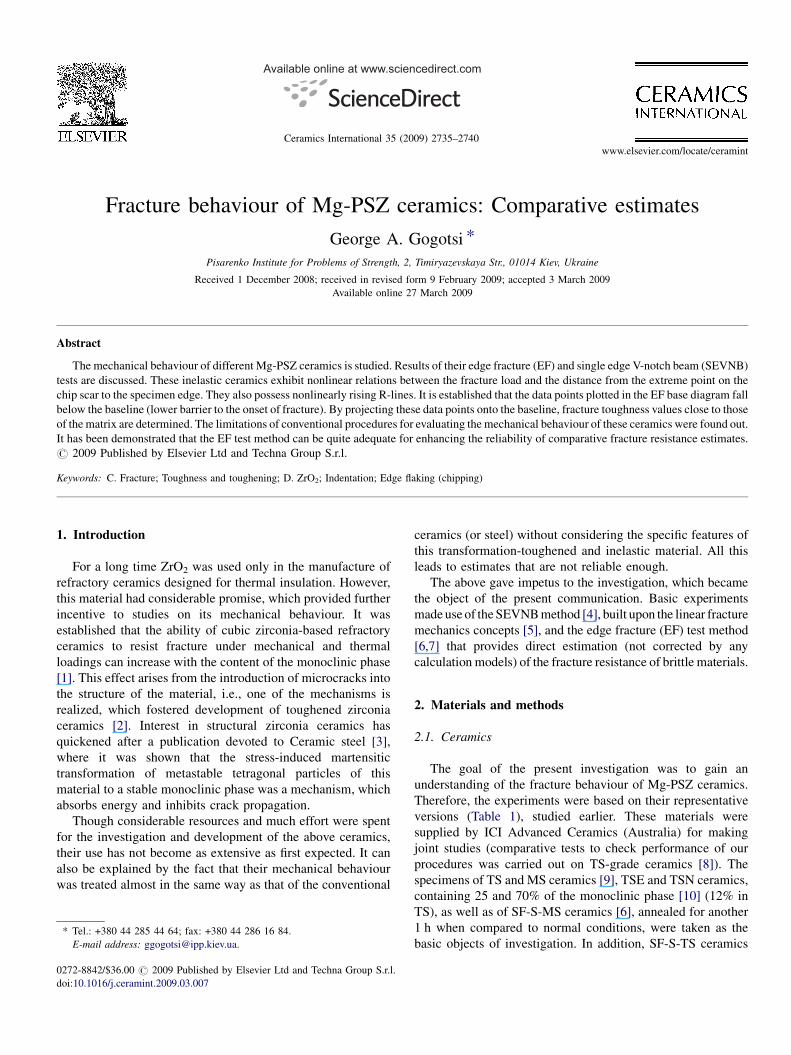
Fracture behaviour of Mg-PSZ ceramics: Comparative estimates George A. Gogotsi * Pisarenko Institute for Problems of Strength, 2, Timiryazevskaya Str., 01014 Kiev, Ukraine Received 1 December 2008; received in revised form 9 February 2009; accepted 3 March 2009 Available online 27 March 2009 Abstract The mechanical behaviour of different Mg-PSZ ceramics is studied. Results of their edge fracture (EF) and single edge V-notch beam (SEVNB) tests are discussed. These inelastic ceramics exhibit nonlinear relations between the fracture load and the distance from the extreme point on the chip scar to the specimen edge. They also possess nonlinearly rising R-lines. It is established that the data points plotted in the EF base diagram fall below the baseline (lower barrier to the onset of fracture). By projecting these data points onto the baseline, fracture toughness values close to those of the matrix are determined. The limitations of conventional procedures for evaluating the mechanical behaviour of these ceramics were found out. It has been demonstrated that the EF test method can be quite adequate for enhancing the reliability of comparative fracture resistance estimates. # 2009 Published by Elsevier Ltd and Techna Group S.r.l. Keywords: C. Fracture; Toughness and toughening; D. ZrO 2 ; Indentation; Edge flaking (chipping) 1. Introduction For a long time ZrO 2 was used only in the manufacture of refractory ceramics designed for thermal insulation. However, this material had considerable promise, which provided further incentive to studies on its mechanical behaviour. It was established that the ability of cubic zirconia-based refractory ceramics to resist fracture under mechanical and thermal loadings can increase with the content of the monoclinic phase [1]. This effect arises from the introduction of microcracks into the structure of the material, i.e., one of the mechanisms is realized, which fostered development of toughened zirconia ceramics [2]. Interest in structural zirconia ceramics has quickened after a publication devoted to Ceramic steel [3], where it was shown that the stress-induced martensitic transformation of metastable tetragonal particles of this material to a stable monoclinic phase was a mechanism, which absorbs energy and inhibits crack propagation. Though considerable resources and much effort were spent for the investigation and development of the above ceramics, their use has not become as extensive as first expected. It can also be explained by the fact that their mechanical behaviour was treated almost in the same way as that of the conventional ceramics (or steel) without considering the specific features of this transformation-toughened and inelastic material. All this leads to estimates that are not reliable enough. The above gave impetus to the investigation, which became the object of the present communication. Basic experiments made use of the SEVNB method [4], built upon the linear fracture mechanics concepts [5], and the edge fracture (EF) test method [6,7] that provides direct estimation (not corrected by any calculation models) of the fracture resistance of brittle materials. 2. Materials and methods 2.1. Ceramics The goal of the present investigation was to gain an understanding of the fracture behaviour of Mg-PSZ ceramics. Therefore, the experiments were based on their representative versions (Table 1), studied earlier. These materials were supplied by ICI Advanced Ceramics (Australia) for making joint studies (comparative tests to check performance of our procedures was carried out on TS-grade ceramics [8]). The specimens of TS and MS ceramics [9], TSE and TSN ceramics, containing 25 and 70% of the monoclinic phase [10] (12% in TS), as well as of SF-S-MS ceramics [6], annealed for another 1 h when compared to normal conditions, were taken as the basic objects of investigation. In addition, SF-S-TS ceramics www.elsevier.com/locate/ceramint Available online at www.sciencedirect.com Ceramics International 35 (2009) 2735–2740 * Tel.: +380 44 285 44 64; fax: +380 44 286 16 84. E-mail address: [email protected]. 0272-8842/$36.00 # 2009 Published by Elsevier Ltd and Techna Group S.r.l. doi:10.1016/j.ceramint.2009.03.007
Transcript of Fracture behaviour of Mg-PSZ ceramics: Comparative estimates
Fracture behaviour of Mg-PSZ ceramics: Comparative estimates
George A. Gogotsi *
Pisarenko Institute for Problems of Strength, 2, Timiryazevskaya Str., 01014 Kiev, Ukraine
Received 1 December 2008; received in revised form 9 February 2009; accepted 3 March 2009
Available online 27 March 2009
Abstract
The mechanical behaviour of different Mg-PSZ ceramics is studied. Results of their edge fracture (EF) and single edge V-notch beam (SEVNB)
tests are discussed. These inelastic ceramics exhibit nonlinear relations between the fracture load and the distance from the extreme point on the
chip scar to the specimen edge. They also possess nonlinearly rising R-lines. It is established that the data points plotted in the EF base diagram fall
below the baseline (lower barrier to the onset of fracture). By projecting these data points onto the baseline, fracture toughness values close to those
of the matrix are determined. The limitations of conventional procedures for evaluating the mechanical behaviour of these ceramics were found out.
It has been demonstrated that the EF test method can be quite adequate for enhancing the reliability of comparative fracture resistance estimates.
# 2009 Published by Elsevier Ltd and Techna Group S.r.l.
Keywords: C. Fracture; Toughness and toughening; D. ZrO2; Indentation; Edge flaking (chipping)
www.elsevier.com/locate/ceramint
Available online at www.sciencedirect.com
Ceramics International 35 (2009) 2735–2740
1. Introduction
For a long time ZrO2 was used only in the manufacture of
refractory ceramics designed for thermal insulation. However,
this material had considerable promise, which provided further
incentive to studies on its mechanical behaviour. It was
established that the ability of cubic zirconia-based refractory
ceramics to resist fracture under mechanical and thermal
loadings can increase with the content of the monoclinic phase
[1]. This effect arises from the introduction of microcracks into
the structure of the material, i.e., one of the mechanisms is
realized, which fostered development of toughened zirconia
ceramics [2]. Interest in structural zirconia ceramics has
quickened after a publication devoted to Ceramic steel [3],
where it was shown that the stress-induced martensitic
transformation of metastable tetragonal particles of this
material to a stable monoclinic phase was a mechanism, which
absorbs energy and inhibits crack propagation.
Though considerable resources and much effort were spent
for the investigation and development of the above ceramics,
their use has not become as extensive as first expected. It can
also be explained by the fact that their mechanical behaviour
was treated almost in the same way as that of the conventional
* Tel.: +380 44 285 44 64; fax: +380 44 286 16 84.
E-mail address: [email protected].
0272-8842/$36.00 # 2009 Published by Elsevier Ltd and Techna Group S.r.l.
doi:10.1016/j.ceramint.2009.03.007
ceramics (or steel) without considering the specific features of
this transformation-toughened and inelastic material. All this
leads to estimates that are not reliable enough.
The above gave impetus to the investigation, which became
the object of the present communication. Basic experiments
made use of the SEVNB method [4], built upon the linear fracture
mechanics concepts [5], and the edge fracture (EF) test method
[6,7] that provides direct estimation (not corrected by any
calculation models) of the fracture resistance of brittle materials.
2. Materials and methods
2.1. Ceramics
The goal of the present investigation was to gain an
understanding of the fracture behaviour of Mg-PSZ ceramics.
Therefore, the experiments were based on their representative
versions (Table 1), studied earlier. These materials were
supplied by ICI Advanced Ceramics (Australia) for making
joint studies (comparative tests to check performance of our
procedures was carried out on TS-grade ceramics [8]). The
specimens of TS and MS ceramics [9], TSE and TSN ceramics,
containing 25 and 70% of the monoclinic phase [10] (12% in
TS), as well as of SF-S-MS ceramics [6], annealed for another
1 h when compared to normal conditions, were taken as the
basic objects of investigation. In addition, SF-S-TS ceramics
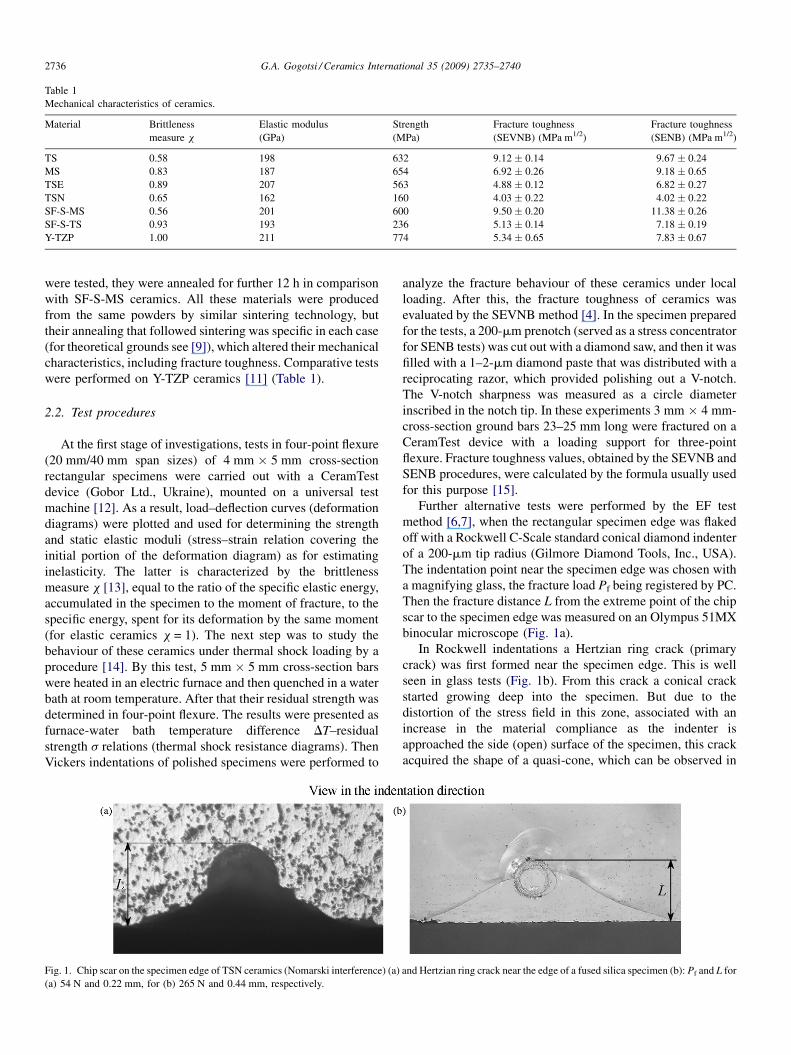
Table 1
Mechanical characteristics of ceramics.
Material Brittleness
measure x
Elastic modulus
(GPa)
Strength
(MPa)
Fracture toughness
(SEVNB) (MPa m1/2)
Fracture toughness
(SENB) (MPa m1/2)
TS 0.58 198 632 9.12 � 0.14 9.67 � 0.24
MS 0.83 187 654 6.92 � 0.26 9.18 � 0.65
TSE 0.89 207 563 4.88 � 0.12 6.82 � 0.27
TSN 0.65 162 160 4.03 � 0.22 4.02 � 0.22
SF-S-MS 0.56 201 600 9.50 � 0.20 11.38 � 0.26
SF-S-TS 0.93 193 236 5.13 � 0.14 7.18 � 0.19
Y-TZP 1.00 211 774 5.34 � 0.65 7.83 � 0.67
G.A. Gogotsi / Ceramics International 35 (2009) 2735–27402736
were tested, they were annealed for further 12 h in comparison
with SF-S-MS ceramics. All these materials were produced
from the same powders by similar sintering technology, but
their annealing that followed sintering was specific in each case
(for theoretical grounds see [9]), which altered their mechanical
characteristics, including fracture toughness. Comparative tests
were performed on Y-TZP ceramics [11] (Table 1).
2.2. Test procedures
At the first stage of investigations, tests in four-point flexure
(20 mm/40 mm span sizes) of 4 mm � 5 mm cross-section
rectangular specimens were carried out with a CeramTest
device (Gobor Ltd., Ukraine), mounted on a universal test
machine [12]. As a result, load–deflection curves (deformation
diagrams) were plotted and used for determining the strength
and static elastic moduli (stress–strain relation covering the
initial portion of the deformation diagram) as for estimating
inelasticity. The latter is characterized by the brittleness
measure x [13], equal to the ratio of the specific elastic energy,
accumulated in the specimen to the moment of fracture, to the
specific energy, spent for its deformation by the same moment
(for elastic ceramics x = 1). The next step was to study the
behaviour of these ceramics under thermal shock loading by a
procedure [14]. By this test, 5 mm � 5 mm cross-section bars
were heated in an electric furnace and then quenched in a water
bath at room temperature. After that their residual strength was
determined in four-point flexure. The results were presented as
furnace-water bath temperature difference DT–residual
strength s relations (thermal shock resistance diagrams). Then
Vickers indentations of polished specimens were performed to
Fig. 1. Chip scar on the specimen edge of TSN ceramics (Nomarski interference) (a)
(a) 54 N and 0.22 mm, for (b) 265 N and 0.44 mm, respectively.
analyze the fracture behaviour of these ceramics under local
loading. After this, the fracture toughness of ceramics was
evaluated by the SEVNB method [4]. In the specimen prepared
for the tests, a 200-mm prenotch (served as a stress concentrator
for SENB tests) was cut out with a diamond saw, and then it was
filled with a 1–2-mm diamond paste that was distributed with a
reciprocating razor, which provided polishing out a V-notch.
The V-notch sharpness was measured as a circle diameter
inscribed in the notch tip. In these experiments 3 mm � 4 mm-
cross-section ground bars 23–25 mm long were fractured on a
CeramTest device with a loading support for three-point
flexure. Fracture toughness values, obtained by the SEVNB and
SENB procedures, were calculated by the formula usually used
for this purpose [15].
Further alternative tests were performed by the EF test
method [6,7], when the rectangular specimen edge was flaked
off with a Rockwell C-Scale standard conical diamond indenter
of a 200-mm tip radius (Gilmore Diamond Tools, Inc., USA).
The indentation point near the specimen edge was chosen with
a magnifying glass, the fracture load Pf being registered by PC.
Then the fracture distance L from the extreme point of the chip
scar to the specimen edge was measured on an Olympus 51MX
binocular microscope (Fig. 1a).
In Rockwell indentations a Hertzian ring crack (primary
crack) was first formed near the specimen edge. This is well
seen in glass tests (Fig. 1b). From this crack a conical crack
started growing deep into the specimen. But due to the
distortion of the stress field in this zone, associated with an
increase in the material compliance as the indenter is
approached the side (open) surface of the specimen, this crack
acquired the shape of a quasi-cone, which can be observed in
and Hertzian ring crack near the edge of a fused silica specimen (b): Pf and L for
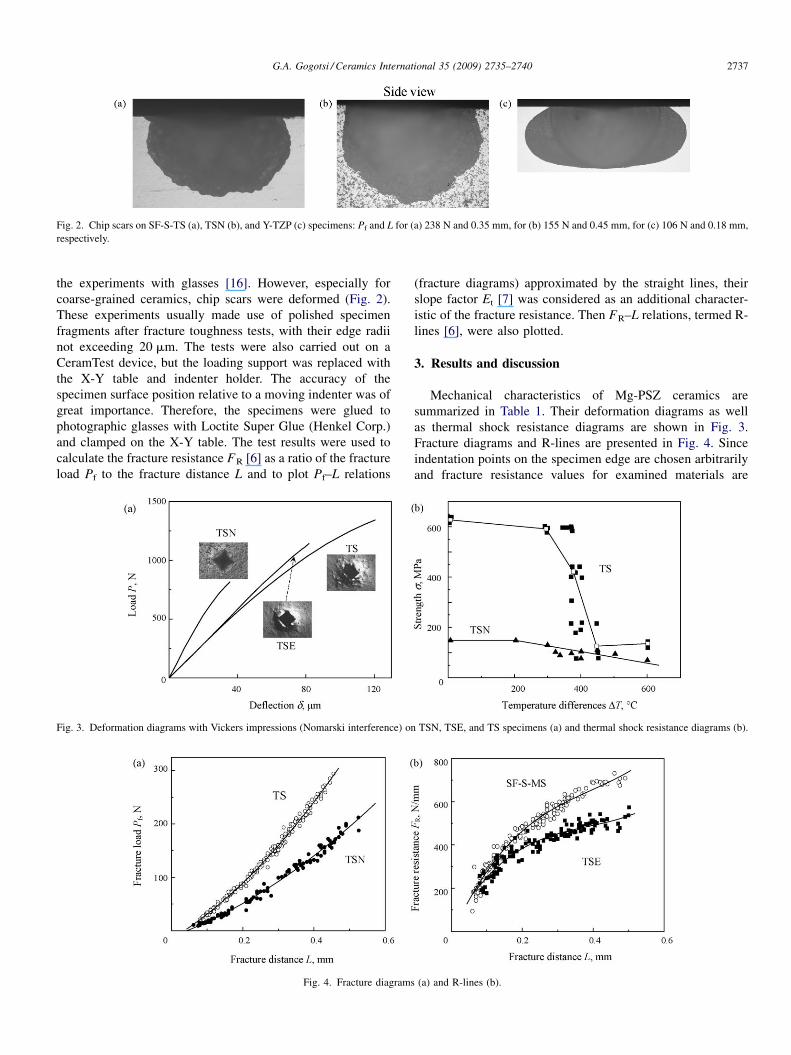
Fig. 2. Chip scars on SF-S-TS (a), TSN (b), and Y-TZP (c) specimens: Pf and L for (a) 238 N and 0.35 mm, for (b) 155 N and 0.45 mm, for (c) 106 N and 0.18 mm,
respectively.
G.A. Gogotsi / Ceramics International 35 (2009) 2735–2740 2737
the experiments with glasses [16]. However, especially for
coarse-grained ceramics, chip scars were deformed (Fig. 2).
These experiments usually made use of polished specimen
fragments after fracture toughness tests, with their edge radii
not exceeding 20 mm. The tests were also carried out on a
CeramTest device, but the loading support was replaced with
the X-Y table and indenter holder. The accuracy of the
specimen surface position relative to a moving indenter was of
great importance. Therefore, the specimens were glued to
photographic glasses with Loctite Super Glue (Henkel Corp.)
and clamped on the X-Y table. The test results were used to
calculate the fracture resistance FR [6] as a ratio of the fracture
load Pf to the fracture distance L and to plot Pf–L relations
Fig. 3. Deformation diagrams with Vickers impressions (Nomarski interference) on
Fig. 4. Fracture diagrams
(fracture diagrams) approximated by the straight lines, their
slope factor Et [7] was considered as an additional character-
istic of the fracture resistance. Then FR–L relations, termed R-
lines [6], were also plotted.
3. Results and discussion
Mechanical characteristics of Mg-PSZ ceramics are
summarized in Table 1. Their deformation diagrams as well
as thermal shock resistance diagrams are shown in Fig. 3.
Fracture diagrams and R-lines are presented in Fig. 4. Since
indentation points on the specimen edge are chosen arbitrarily
and fracture resistance values for examined materials are
TSN, TSE, and TS specimens (a) and thermal shock resistance diagrams (b).
(a) and R-lines (b).
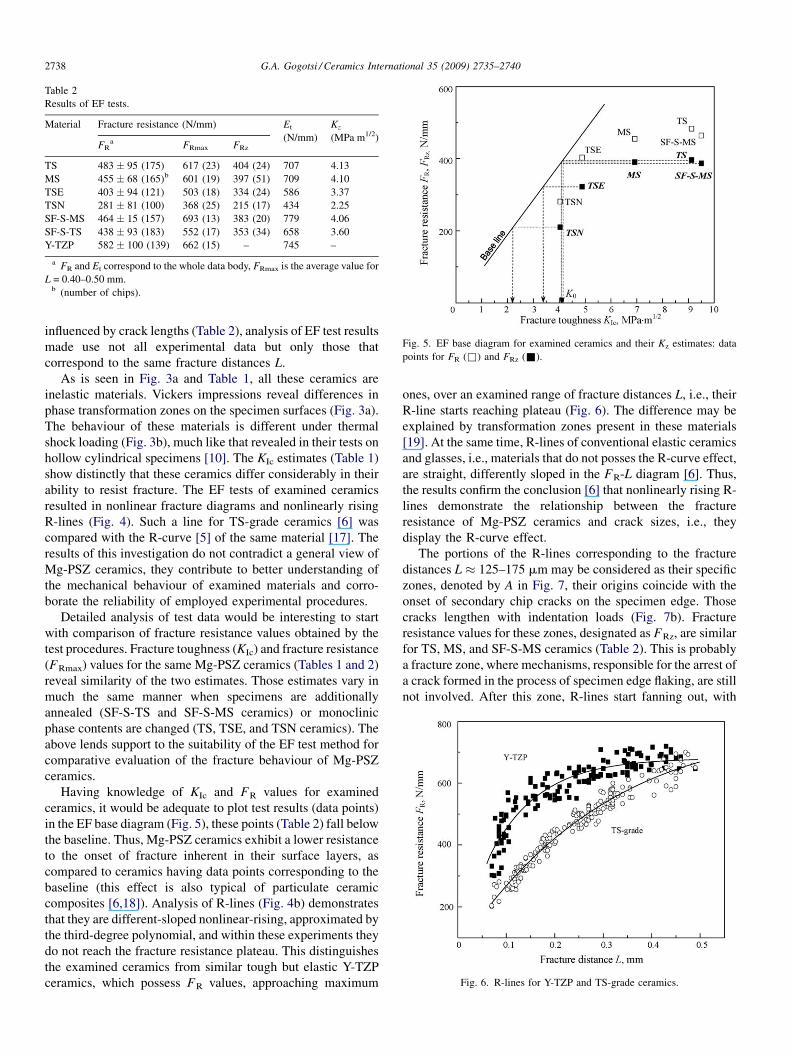
Fig. 5. EF base diagram for examined ceramics and their Kz estimates: data
points for FR (&) and FRz (&).
Table 2
Results of EF tests.
Material Fracture resistance (N/mm) Et
(N/mm)
Kz
(MPa m1/2)FR
a FRmax FRz
TS 483 � 95 (175) 617 (23) 404 (24) 707 4.13
MS 455 � 68 (165)b 601 (19) 397 (51) 709 4.10
TSE 403 � 94 (121) 503 (18) 334 (24) 586 3.37
TSN 281 � 81 (100) 368 (25) 215 (17) 434 2.25
SF-S-MS 464 � 15 (157) 693 (13) 383 (20) 779 4.06
SF-S-TS 438 � 93 (183) 552 (17) 353 (34) 658 3.60
Y-TZP 582 � 100 (139) 662 (15) – 745 –
a FR and Et correspond to the whole data body, FRmax is the average value for
L = 0.40–0.50 mm.b (number of chips).
Fig. 6. R-lines for Y-TZP and TS-grade ceramics.
G.A. Gogotsi / Ceramics International 35 (2009) 2735–27402738
influenced by crack lengths (Table 2), analysis of EF test results
made use not all experimental data but only those that
correspond to the same fracture distances L.
As is seen in Fig. 3a and Table 1, all these ceramics are
inelastic materials. Vickers impressions reveal differences in
phase transformation zones on the specimen surfaces (Fig. 3a).
The behaviour of these materials is different under thermal
shock loading (Fig. 3b), much like that revealed in their tests on
hollow cylindrical specimens [10]. The KIc estimates (Table 1)
show distinctly that these ceramics differ considerably in their
ability to resist fracture. The EF tests of examined ceramics
resulted in nonlinear fracture diagrams and nonlinearly rising
R-lines (Fig. 4). Such a line for TS-grade ceramics [6] was
compared with the R-curve [5] of the same material [17]. The
results of this investigation do not contradict a general view of
Mg-PSZ ceramics, they contribute to better understanding of
the mechanical behaviour of examined materials and corro-
borate the reliability of employed experimental procedures.
Detailed analysis of test data would be interesting to start
with comparison of fracture resistance values obtained by the
test procedures. Fracture toughness (KIc) and fracture resistance
(FRmax) values for the same Mg-PSZ ceramics (Tables 1 and 2)
reveal similarity of the two estimates. Those estimates vary in
much the same manner when specimens are additionally
annealed (SF-S-TS and SF-S-MS ceramics) or monoclinic
phase contents are changed (TS, TSE, and TSN ceramics). The
above lends support to the suitability of the EF test method for
comparative evaluation of the fracture behaviour of Mg-PSZ
ceramics.
Having knowledge of KIc and FR values for examined
ceramics, it would be adequate to plot test results (data points)
in the EF base diagram (Fig. 5), these points (Table 2) fall below
the baseline. Thus, Mg-PSZ ceramics exhibit a lower resistance
to the onset of fracture inherent in their surface layers, as
compared to ceramics having data points corresponding to the
baseline (this effect is also typical of particulate ceramic
composites [6,18]). Analysis of R-lines (Fig. 4b) demonstrates
that they are different-sloped nonlinear-rising, approximated by
the third-degree polynomial, and within these experiments they
do not reach the fracture resistance plateau. This distinguishes
the examined ceramics from similar tough but elastic Y-TZP
ceramics, which possess FR values, approaching maximum
ones, over an examined range of fracture distances L, i.e., their
R-line starts reaching plateau (Fig. 6). The difference may be
explained by transformation zones present in these materials
[19]. At the same time, R-lines of conventional elastic ceramics
and glasses, i.e., materials that do not posses the R-curve effect,
are straight, differently sloped in the FR-L diagram [6]. Thus,
the results confirm the conclusion [6] that nonlinearly rising R-
lines demonstrate the relationship between the fracture
resistance of Mg-PSZ ceramics and crack sizes, i.e., they
display the R-curve effect.
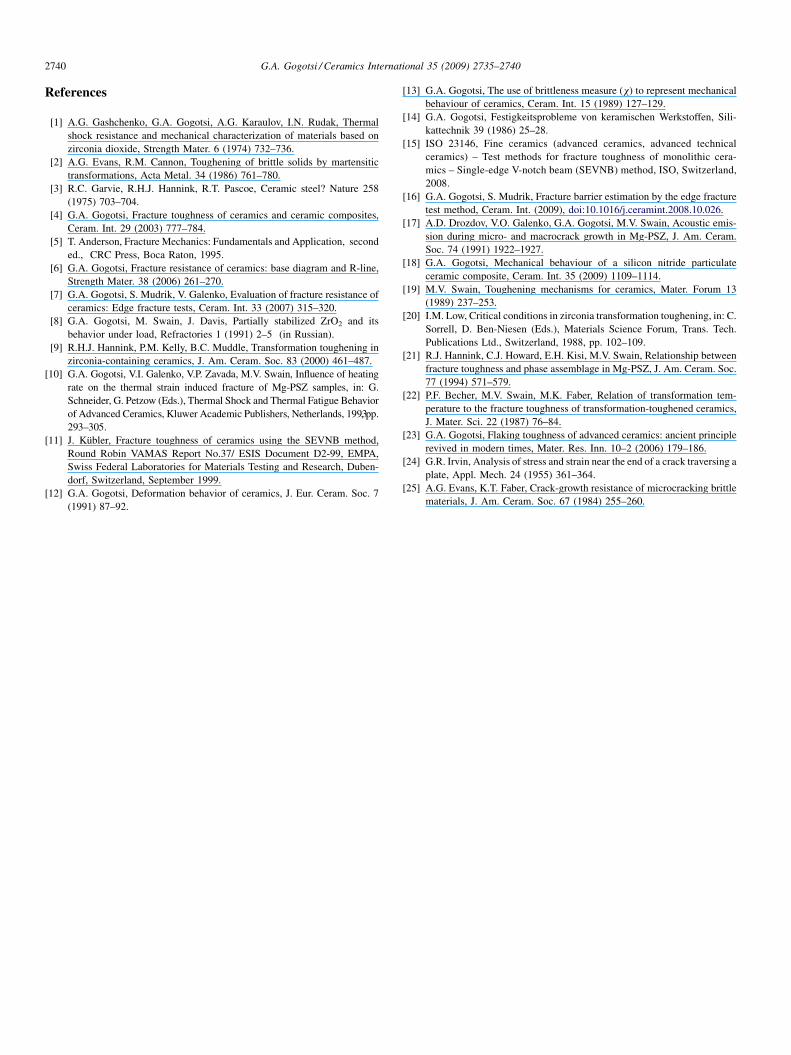
The portions of the R-lines corresponding to the fracture
distances L � 125–175 mm may be considered as their specific
zones, denoted by A in Fig. 7, their origins coincide with the
onset of secondary chip cracks on the specimen edge. Those
cracks lengthen with indentation loads (Fig. 7b). Fracture
resistance values for these zones, designated as FRz, are similar
for TS, MS, and SF-S-MS ceramics (Table 2). This is probably
a fracture zone, where mechanisms, responsible for the arrest of
a crack formed in the process of specimen edge flaking, are still
not involved. After this zone, R-lines start fanning out, with
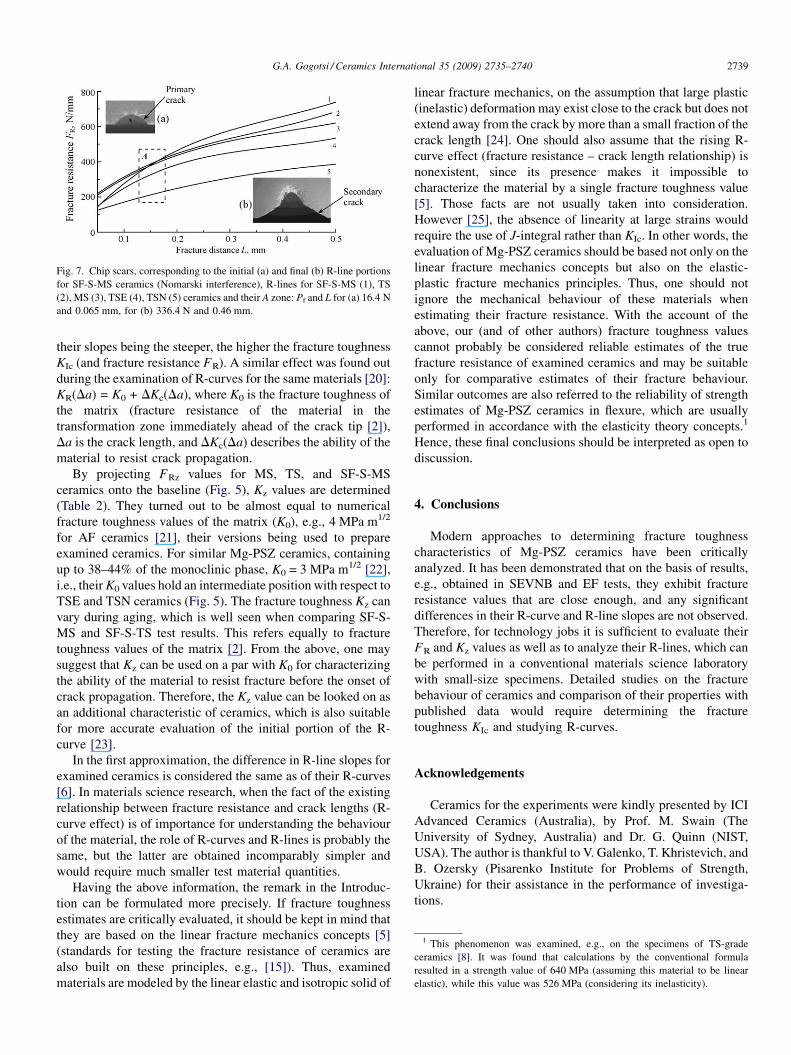
Fig. 7. Chip scars, corresponding to the initial (a) and final (b) R-line portions
for SF-S-MS ceramics (Nomarski interference), R-lines for SF-S-MS (1), TS
(2), MS (3), TSE (4), TSN (5) ceramics and their A zone: Pf and L for (a) 16.4 N
and 0.065 mm, for (b) 336.4 N and 0.46 mm.
1 This phenomenon was examined, e.g., on the specimens of TS-grade
ceramics [8]. It was found that calculations by the conventional formula
resulted in a strength value of 640 MPa (assuming this material to be linear
elastic), while this value was 526 MPa (considering its inelasticity).
G.A. Gogotsi / Ceramics International 35 (2009) 2735–2740 2739
their slopes being the steeper, the higher the fracture toughness
KIc (and fracture resistance FR). A similar effect was found out
during the examination of R-curves for the same materials [20]:
KR(Da) = K0 + DKc(Da), where K0 is the fracture toughness of
the matrix (fracture resistance of the material in the
transformation zone immediately ahead of the crack tip [2]),
Da is the crack length, and DKc(Da) describes the ability of the
material to resist crack propagation.
By projecting FRz values for MS, TS, and SF-S-MS
ceramics onto the baseline (Fig. 5), Kz values are determined
(Table 2). They turned out to be almost equal to numerical
fracture toughness values of the matrix (K0), e.g., 4 MPa m1/2
for AF ceramics [21], their versions being used to prepare
examined ceramics. For similar Mg-PSZ ceramics, containing
up to 38–44% of the monoclinic phase, K0 = 3 MPa m1/2 [22],
i.e., their K0 values hold an intermediate position with respect to
TSE and TSN ceramics (Fig. 5). The fracture toughness Kz can
vary during aging, which is well seen when comparing SF-S-
MS and SF-S-TS test results. This refers equally to fracture
toughness values of the matrix [2]. From the above, one may
suggest that Kz can be used on a par with K0 for characterizing
the ability of the material to resist fracture before the onset of
crack propagation. Therefore, the Kz value can be looked on as
an additional characteristic of ceramics, which is also suitable
for more accurate evaluation of the initial portion of the R-
curve [23].
In the first approximation, the difference in R-line slopes for
examined ceramics is considered the same as of their R-curves
[6]. In materials science research, when the fact of the existing
relationship between fracture resistance and crack lengths (R-
curve effect) is of importance for understanding the behaviour
of the material, the role of R-curves and R-lines is probably the
same, but the latter are obtained incomparably simpler and
would require much smaller test material quantities.
Having the above information, the remark in the Introduc-
tion can be formulated more precisely. If fracture toughness
estimates are critically evaluated, it should be kept in mind that
they are based on the linear fracture mechanics concepts [5]
(standards for testing the fracture resistance of ceramics are
also built on these principles, e.g., [15]). Thus, examined
materials are modeled by the linear elastic and isotropic solid of
linear fracture mechanics, on the assumption that large plastic
(inelastic) deformation may exist close to the crack but does not
extend away from the crack by more than a small fraction of the
crack length [24]. One should also assume that the rising R-
curve effect (fracture resistance – crack length relationship) is
nonexistent, since its presence makes it impossible to
characterize the material by a single fracture toughness value
[5]. Those facts are not usually taken into consideration.
However [25], the absence of linearity at large strains would
require the use of J-integral rather than KIc. In other words, the
evaluation of Mg-PSZ ceramics should be based not only on the
linear fracture mechanics concepts but also on the elastic-
plastic fracture mechanics principles. Thus, one should not
ignore the mechanical behaviour of these materials when
estimating their fracture resistance. With the account of the
above, our (and of other authors) fracture toughness values
cannot probably be considered reliable estimates of the true
fracture resistance of examined ceramics and may be suitable
only for comparative estimates of their fracture behaviour.
Similar outcomes are also referred to the reliability of strength
estimates of Mg-PSZ ceramics in flexure, which are usually
performed in accordance with the elasticity theory concepts.1
Hence, these final conclusions should be interpreted as open to
discussion.
4. Conclusions
Modern approaches to determining fracture toughness
characteristics of Mg-PSZ ceramics have been critically
analyzed. It has been demonstrated that on the basis of results,
e.g., obtained in SEVNB and EF tests, they exhibit fracture
resistance values that are close enough, and any significant
differences in their R-curve and R-line slopes are not observed.
Therefore, for technology jobs it is sufficient to evaluate their
FR and Kz values as well as to analyze their R-lines, which can
be performed in a conventional materials science laboratory
with small-size specimens. Detailed studies on the fracture
behaviour of ceramics and comparison of their properties with
published data would require determining the fracture
toughness KIc and studying R-curves.
Acknowledgements
Ceramics for the experiments were kindly presented by ICI
Advanced Ceramics (Australia), by Prof. M. Swain (The
University of Sydney, Australia) and Dr. G. Quinn (NIST,
USA). The author is thankful to V. Galenko, T. Khristevich, and
B. Ozersky (Pisarenko Institute for Problems of Strength,
Ukraine) for their assistance in the performance of investiga-
tions.
G.A. Gogotsi / Ceramics International 35 (2009) 2735–27402740
References
[1] A.G. Gashchenko, G.A. Gogotsi, A.G. Karaulov, I.N. Rudak, Thermal
shock resistance and mechanical characterization of materials based on
zirconia dioxide, Strength Mater. 6 (1974) 732–736.
[2] A.G. Evans, R.M. Cannon, Toughening of brittle solids by martensitic
transformations, Acta Metal. 34 (1986) 761–780.
[3] R.C. Garvie, R.H.J. Hannink, R.T. Pascoe, Ceramic steel? Nature 258
(1975) 703–704.
[4] G.A. Gogotsi, Fracture toughness of ceramics and ceramic composites,
Ceram. Int. 29 (2003) 777–784.
[5] T. Anderson, Fracture Mechanics: Fundamentals and Application, second
ed., CRC Press, Boca Raton, 1995.
[6] G.A. Gogotsi, Fracture resistance of ceramics: base diagram and R-line,
Strength Mater. 38 (2006) 261–270.
[7] G.A. Gogotsi, S. Mudrik, V. Galenko, Evaluation of fracture resistance of
ceramics: Edge fracture tests, Ceram. Int. 33 (2007) 315–320.
[8] G.A. Gogotsi, M. Swain, J. Davis, Partially stabilized ZrO2 and its
behavior under load, Refractories 1 (1991) 2–5 (in Russian).
[9] R.H.J. Hannink, P.M. Kelly, B.C. Muddle, Transformation toughening in
zirconia-containing ceramics, J. Am. Ceram. Soc. 83 (2000) 461–487.
[10] G.A. Gogotsi, V.I. Galenko, V.P. Zavada, M.V. Swain, Influence of heating
rate on the thermal strain induced fracture of Mg-PSZ samples, in: G.
Schneider, G. Petzow (Eds.), Thermal Shock and Thermal Fatigue Behavior
of Advanced Ceramics, Kluwer Academic Publishers, Netherlands, 1993, pp.
293–305.
[11] J. Kubler, Fracture toughness of ceramics using the SEVNB method,
Round Robin VAMAS Report No.37/ ESIS Document D2-99, EMPA,
Swiss Federal Laboratories for Materials Testing and Research, Duben-
dorf, Switzerland, September 1999.
[12] G.A. Gogotsi, Deformation behavior of ceramics, J. Eur. Ceram. Soc. 7
(1991) 87–92.
[13] G.A. Gogotsi, The use of brittleness measure (x) to represent mechanical
behaviour of ceramics, Ceram. Int. 15 (1989) 127–129.
[14] G.A. Gogotsi, Festigkeitsprobleme von keramischen Werkstoffen, Sili-
kattechnik 39 (1986) 25–28.
[15] ISO 23146, Fine ceramics (advanced ceramics, advanced technical
ceramics) – Test methods for fracture toughness of monolithic cera-
mics – Single-edge V-notch beam (SEVNB) method, ISO, Switzerland,
2008.
[16] G.A. Gogotsi, S. Mudrik, Fracture barrier estimation by the edge fracture
test method, Ceram. Int. (2009), doi:10.1016/j.ceramint.2008.10.026.
[17] A.D. Drozdov, V.O. Galenko, G.A. Gogotsi, M.V. Swain, Acoustic emis-
sion during micro- and macrocrack growth in Mg-PSZ, J. Am. Ceram.
Soc. 74 (1991) 1922–1927.
[18] G.A. Gogotsi, Mechanical behaviour of a silicon nitride particulate
ceramic composite, Ceram. Int. 35 (2009) 1109–1114.
[19] M.V. Swain, Toughening mechanisms for ceramics, Mater. Forum 13
(1989) 237–253.
[20] I.M. Low, Critical conditions in zirconia transformation toughening, in: C.
Sorrell, D. Ben-Niesen (Eds.), Materials Science Forum, Trans. Tech.
Publications Ltd., Switzerland, 1988, pp. 102–109.
[21] R.J. Hannink, C.J. Howard, E.H. Kisi, M.V. Swain, Relationship between
fracture toughness and phase assemblage in Mg-PSZ, J. Am. Ceram. Soc.
77 (1994) 571–579.
[22] P.F. Becher, M.V. Swain, M.K. Faber, Relation of transformation tem-
perature to the fracture toughness of transformation-toughened ceramics,
J. Mater. Sci. 22 (1987) 76–84.
[23] G.A. Gogotsi, Flaking toughness of advanced ceramics: ancient principle
revived in modern times, Mater. Res. Inn. 10–2 (2006) 179–186.
[24] G.R. Irvin, Analysis of stress and strain near the end of a crack traversing a
plate, Appl. Mech. 24 (1955) 361–364.
[25] A.G. Evans, K.T. Faber, Crack-growth resistance of microcracking brittle
materials, J. Am. Ceram. Soc. 67 (1984) 255–260.