Individualized fracture risk assessment
10
Copyright © Lippincott Williams & Wilkins. Unauthorized reproduction of this article is prohibited. C URRENT O PINION Individualized fracture risk assessment: progresses and challenges Tuan V. Nguyen a,b,c , Jacqueline R. Center a,b , and John A. Eisman a,b,d Purpose of review Fragility fracture is a major public health burden, because it is associated with a substantial morbidity and mortality. Risk prediction models, including the Fracture Risk Assessment Tool (FRAX) and Garvan Fracture Risk Calculator (GFRC), have been developed to provide a useful clinical framework for communicating the risk of fracture. The present review examines the validation of risk prediction models in osteoporosis and identifies some major challenges. Recent findings Recent validation studies suggested that the area under the ROC curve in fracture discrimination ranged from 0.61 to 0.83 for FRAX, and from 0.63 to 0.88 for GFRC, with hip fracture having a better discrimination than fragility fractures as a group. FRAX substantially underestimated the risk of fracture, whereas the predicted risk by GFRC was close to or slightly higher than the actual risk. Results of post-hoc analyses of clinical trials indicated the antifracture efficacy of alendronate, coronate, bazedoxifene, and denosumab was greater in patients with higher predicted risk of fracture. However, there was no correlation between antifracture efficacy and predicted fracture risk among patients on raloxifene and strontium ranelate. Summary The prognostic performance of FRAX and GFRC for fracture prediction is not perfect, but these predictive models can aid patients and doctors to communicate about fracture risk in the medium term and to make rational decisions. However, the application of these predictive models in making decisions for an individual should take into account the individual’s perception of the importance of the risk of fracture and its severity outcomes. Keywords fracture, Fracture Risk Assessment Tool, garvan fracture risk calculator, osteoporosis INTRODUCTION Osteoporosis and its consequence of fracture impose significant healthcare burden on society. From the age of 50, the residual lifetime risk of fracture is approximately 50% in women and approximately 30% in men [1]. In women, the lifetime risk of hip fracture is equivalent to or higher than the risk of invasive breast cancer [1,2]. In men, the lifetime risk of hip and clinical vertebral fractures (17%) is com- parable to the lifetime risk of being diagnosed with prostate cancer [2,3]. In Australia alone, direct costs attributable to osteoporotic fractures were estimated to be US$ 700 million in 1994 [4]. More recent estimates, including indirect costs, are US$ 7 billion annually [5]. This figure, relatively similar across countries, translates to US$ 1 every day for every person. Osteoporotic fractures and their adverse outcomes are projected to increase in parallel with the ageing of the population [6]. Osteoporosis [or low Bone mineral density (BMD)], fragility fracture, recurrent fracture, and premature mortality are highly clustered. Individ- uals with osteoporosis have an increased risk of an initial fracture, and the presence of a fracture signals increased risk of subsequent fractures for the next 5–10 years [7,8]. Individuals with osteoporosis, a Osteoporosis and Bone Biology Program, Garvan Institute of Medical Research, b St Vincent’s Clinical School, c School of Public Health and Community Medicine, UNSW Medicine, University of New South Wales and d Sydney School of Medicine, Notre Dame University, Sydney, New South Wales, Australia Correspondence to Tuan V. Nguyen, Osteoporosis and Bone Biology Program, Garvan Institute of Medical Research, 384 Victoria Street, Darlinghurst, Sydney, NSW 2010, Australia. Tel: +61 2 9295 8277; fax: +61 2 9295 8241; e-mail: [email protected] Curr Opin Rheumatol 2013, 25:532–541 DOI:10.1097/BOR.0b013e328361ff8c www.co-rheumatology.com Volume 25 Number 4 July 2013 REVIEW
-
Upload
independent -
Category
Documents
-
view
1 -
download
0
Transcript of Individualized fracture risk assessment
C
REVIEW
CURRENTOPINION Individualized fracture risk assessment: progresses
and challenges
o
pyright © Lippincott Williwww.co-rheumatology.com
a,b,c a,b a,b,d
Tuan V. Nguyen , Jacqueline R. Center , and John A. EismanPurpose of review
Fragility fracture is a major public health burden, because it is associated with a substantial morbidity andmortality. Risk prediction models, including the Fracture Risk Assessment Tool (FRAX) and Garvan FractureRisk Calculator (GFRC), have been developed to provide a useful clinical framework for communicating therisk of fracture. The present review examines the validation of risk prediction models in osteoporosis andidentifies some major challenges.
Recent findings
Recent validation studies suggested that the area under the ROC curve in fracture discrimination rangedfrom 0.61 to 0.83 for FRAX, and from 0.63 to 0.88 for GFRC, with hip fracture having a betterdiscrimination than fragility fractures as a group. FRAX substantially underestimated the risk of fracture,whereas the predicted risk by GFRC was close to or slightly higher than the actual risk. Results of post-hocanalyses of clinical trials indicated the antifracture efficacy of alendronate, coronate, bazedoxifene, anddenosumab was greater in patients with higher predicted risk of fracture. However, there was nocorrelation between antifracture efficacy and predicted fracture risk among patients on raloxifene andstrontium ranelate.
Summary
The prognostic performance of FRAX and GFRC for fracture prediction is not perfect, but these predictivemodels can aid patients and doctors to communicate about fracture risk in the medium term and to makerational decisions. However, the application of these predictive models in making decisions for anindividual should take into account the individual’s perception of the importance of the risk of fracture andits severity outcomes.
Keywords
fracture, Fracture Risk Assessment Tool, garvan fracture risk calculator, osteoporosis
aOsteoporosis and Bone Biology Program, Garvan Institute of MedicalResearch, bSt Vincent’s Clinical School, cSchool of Public Health andCommunity Medicine, UNSW Medicine, University of New South Walesand dSydney School of Medicine, Notre Dame University, Sydney, NewSouth Wales, Australia
Correspondence to Tuan V. Nguyen, Osteoporosis and Bone BiologyProgram, Garvan Institute of Medical Research, 384 Victoria Street,Darlinghurst, Sydney, NSW 2010, Australia. Tel: +61 2 9295 8277; fax:+61 2 9295 8241; e-mail: [email protected]
Curr Opin Rheumatol 2013, 25:532–541
DOI:10.1097/BOR.0b013e328361ff8c
INTRODUCTION
Osteoporosis and its consequence of fracture imposesignificant healthcare burden on society. From theage of 50, the residual lifetime risk of fracture isapproximately 50% in women and approximately30% in men [1]. In women, the lifetime risk of hipfracture is equivalent to or higher than the risk ofinvasive breast cancer [1,2]. In men, the lifetime riskof hip and clinical vertebral fractures (17%) is com-parable to the lifetime risk of being diagnosed withprostate cancer [2,3]. In Australia alone, direct costsattributable to osteoporotic fractures were estimatedto be US$ 700 million in 1994 [4]. More recentestimates, including indirect costs, are US$ 7 billionannually [5]. This figure, relatively similar acrosscountries, translates to US$ 1 every day for everyperson. Osteoporotic fractures and their adverseoutcomes are projected to increase in parallel withthe ageing of the population [6].
ams & Wilkins. Unautho
Osteoporosis [or low Bone mineral density(BMD)], fragility fracture, recurrent fracture, andpremature mortality are highly clustered. Individ-uals with osteoporosis have an increased risk of aninitial fracture, and the presence of a fracture signalsincreased risk of subsequent fractures for the next5–10 years [7,8]. Individuals with osteoporosis,
rized reproduction of this article is prohibited.
Volume 25 � Number 4 � July 2013

KEY POINTS
� Fragility fracture is associated with an increased risk ofadverse outcomes, including disability and mortality.
� FRAX and GFRC are models for predicting the absoluterisk of fracture. The models have been developed andimplemented based on a set of risk factors for fracture.
� The discrimination of fracture versus nonfracture byFRAX and GFRC is imperfect, with area under the ROCcurve ranging between 0.6 and 0.85.
� FRAX substantially underestimated the risk of fracture inmen and women.
� The prognostic performance of these predictive modelscan be improved by incorporating genetic informationand time-related changes in clinical risk factorswithin individuals.
Individualized fracture risk assessment Nguyen et al.
fracture and recurrent fracture have a greater risk ofmortality than those with an initial fracture or with-out a fracture. Indeed, numerous studies [7,9,10],including our own, have consistently shown thatthe relative risk of death in men with fracture(1.8-fold) is significantly greater than that in women(1.4-fold). The increased mortality risk was alsoobserved in younger individuals with fracture [3].
Bisphosphonates are considered first-line treat-ment of osteoporosis, and recent evidence suggestthat this group of drugs could also reduce the risk ofmortality among men and women with a fracture[11,12]. In a large randomized controlled trial, zole-dronic acid treatment was shown to reduce the riskof posthip-fracture mortality by 28%, when givenwithin 90-days posthip surgery [13]. Interestingly,only a small part of the benefit of reducing deathpostfracture was attributable to preventing refrac-ture. More recent studies [11,12,14] have alsosuggested that individuals on oral bisphosphonateshave lower risk of mortality. Collectively, theevidence from clinical trials suggests that the first5 years, particularly the first year, after fracture isperhaps the ideal time for intervention to reduce therisk of mortality among hipfracture patients. Yet,less than 30% of women and less than 10% of men,who have already had an osteoporotic fracture,receive treatment to reduce their risk of subsequentfractures [15].
TRANSLATION OF RISK FACTORS INTOPREDICTIVE MODELS
Low BMD is the most robust predictor of fracturerisk. Each SD difference in BMD is associated withabout a two-fold change in the risk of fracture
Copyright © Lippincott Williams & Wilkins. Unaut
1040-8711 � 2013 Wolters Kluwer Health | Lippincott Williams & Wilk
[16,17]. However, BMD alone cannot reliably pre-dict an individual who is (or is not) going to sustain afracture. It has been estimated that less than 40% offracture cases occur in people with BMD in theosteoporotic range [18]. Among women aged60 years or older with low BMD (high-risk group)only 40% sustained an osteoporotic fracture withina 13-year of follow-up [18]. On the contrary, amongthose who sustained a fracture, almost 60% hadBMD above the osteoporotic cut-point (T-score<�2.5). In other words, more than half of individ-uals with low BMD were ‘resistant to fracture’. Thesituation in elderly men is similar: 70% of men withlow BMD did not sustain a fracture; and amongfracture cases, 77% occurred in those with non-osteoporotic BMD levels.
The modest predictive value of BMD in terms offracture prediction is not unexpected. It is wellknown that fracture, as well as other importanthealth events, is the end result of multiple riskfactors. During the past three decades, severalnon-BMD risk factors have been identified to beassociated with fracture risk. These risk factors canbe broadly classified into two groups: modifiableand nonmodifiable, each with modest strengthsof association. The risk factors not amenable tomodification include the personal history of a priorfracture after the age of 40; history of fracture in aclose relative; advancing age; being a woman; andgenetic factors that are yet to be identified. Riskfactors that are potentially modifiable includecurrent cigarette smoking; low body weight; estro-gen deficiency or early menopause (in women) orhypogonadism (in men) (without sex hormonetherapy or replacement); long-term low calciumintake; excessive alcohol intake; limited physicalactivity; poor health or frailty (including rheuma-toid arthritis, hyperthyroidism, impaired eyesight,and dementia); long-term exposure to anticonvul-sant drugs; and a history of falls or recurrent falls.Among these risk factors, four key risk factors areidentified: advancing age, personal history of afragility fracture, falls, and low BMD [19–21].
At any given level of BMD, fracture risk varieswidely in relation to the burden of other risk factors,including advancing age, prior fracture, and falls.Thus, for any one individual, the likelihood of frac-ture depends on a combination of these and otherrisk factors [22]. This means that two individuals,both with ‘osteoporosis’, can have different risks offracture because they have different risk profiles.Similarly, an osteoporotic individual can have thesame risk of fracture as a nonosteoporotic individualdue to the difference in constellation of risk factorsbetween the two individuals. In other words,the prognosis for fracture risk can and should be
horized reproduction of this article is prohibited.
ins www.co-rheumatology.com 533

Co
Metabolic bone disease
individualized by using an individual’s uniquerisk profile.
In an attempt to translate multivariable riskfactors into individualized risk prediction, a numberof algorithms have been developed. Among thesealgorithms, the Garvan Fracture Risk Calculator(GFRC) [21,23], Fracture Risk Assessment Tool(FRAX) [24], and Qfracture [25] are widely availableand used. FRAX uses 12 risk factors, including fem-oral neck BMD, anthropometric factors, lifestylefactors, and comorbidities. The GFRC uses five riskfactors, namely, age, sex, femoral neck BMD, priorfracture, and history of falls. Although FRAXprovides 10-year risk of hip fracture and majorosteoporotic fractures, the GFRC provides 5-yearand 10-year risks of hip fracture and major osteo-porotic fractures (Table 1). The development andimplementation of these models represents animportant advance in osteoporosis assessment andtreatment, because they provide clinicians withtools that can estimate short-term estimates of riskof fracture for an individual. This individualizedassessment overcomes the problem of populationrisk stratification that is applicable to groups ofindividuals (rather than to an individual).
PROGNOSTIC PERFORMANCE
The usefulness of a predictive model is usuallyquantified in terms of its discrimination and
pyright © Lippincott Williams & Wilkins. Unautho
Table 1. Risk factors included in FRAX and garvan fracture
FRAX
Risk factors (inputs) Age
Sex
Femoral neck BMD
Body weight
Height
History of prior fracture
Parental history of hip fracture
Current smoking
Chronic glucocorticoid use
Rheumatoid arthritis
Secondary osteoporosis
Alcohol (3 or more units per d
Output 10-year risk of hip fracture
10-year risk of major fractures
Website http://www.shef.ac.uk/FRAX
GFRC, garvan fracture risk calculator.
534 www.co-rheumatology.com
reclassification. Discrimination is the ability toseparate individuals who will sustain a fracturealong a continuum from those who will not.The primary metric of discrimination is the areaunder the ROC curve (AUC), which was developedduring the Second World War for the detection ofradar signals. In the medical context, the AUCevaluates the compromise between sensitivityand specificity, and is thus a global estimate ofprognostic accuracy [26]. However, AUC is a ratherinsensitive measure [27]. Hence, a clinically mean-ingful difference in prognostic value between twopredictive models is not necessarily reflected bythe AUC.
Another feature of usefulness of a predictivemodel is risk reclassification [28]. For a giventhreshold of risk (e.g. 10-year risk of 20%), an indi-vidual can be classified as ‘high-risk’ or ‘low-risk’.With additional risk factors the individual maychange risk category from one to another. If anew risk factor or marker is materially useful, thenthe addition of the risk factor should result in moreindividuals who will subsequently fracture beingclassified into the high-risk group than to the low-risk group; conversely, among those who will notsubsequently fracture, more would be classified intothe low-risk group than the high-risk group. The netdifference between the two proportions of reclassi-fication is referred to as net reclassification improve-ment (NRI) [29]. Thus, when treatment decisions are
rized reproduction of this article is prohibited.
risk calculator
GFRC
Age
Sex
Femoral neck BMD (or body weight)
Number of prior fractures
Number of falls during the past 12 months
ay)
5-year risk of hip fracture
5-year risk of any fragility fracture
10-year risk of hip fracture
10-year risk of any fragility fracture
www.fractureriskcalculator.com
Volume 25 � Number 4 � July 2013
Individualized fracture risk assessment Nguyen et al.
based on risk threshold, the NRI can be helpful formaking a clinical decision concerning an individual.
The usefulness of any predictive model isconsidered preliminary until it has been tested inmultiple independentpopulations. In thepast5yearsor so, several independent validation studies havebeen carried out to examine the prognostic perform-ance of GFRC [30,31], FRAX [32–35,36
&
,37&&
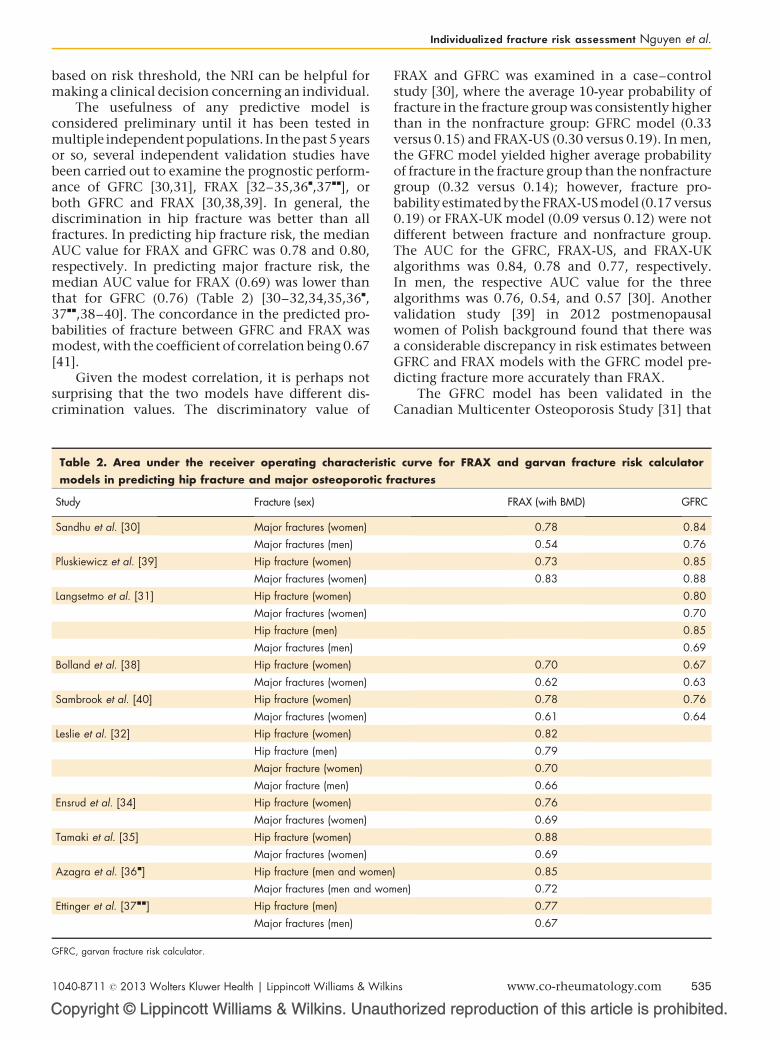
], orboth GFRC and FRAX [30,38,39]. In general, thediscrimination in hip fracture was better than allfractures. In predicting hip fracture risk, the medianAUC value for FRAX and GFRC was 0.78 and 0.80,respectively. In predicting major fracture risk, themedian AUC value for FRAX (0.69) was lower thanthat for GFRC (0.76) (Table 2) [30–32,34,35,36
&
,37
&&
,38–40]. The concordance in the predicted pro-babilities of fracture between GFRC and FRAX wasmodest, with the coefficient of correlation being 0.67[41].
Given the modest correlation, it is perhaps notsurprising that the two models have different dis-crimination values. The discriminatory value of
Copyright © Lippincott Williams & Wilkins. Unaut
Table 2. Area under the receiver operating characteristimodels in predicting hip fracture and major osteoporotic f
Study Fracture (sex)
Sandhu et al. [30] Major fractures (women)
Major fractures (men)
Pluskiewicz et al. [39] Hip fracture (women)
Major fractures (women)
Langsetmo et al. [31] Hip fracture (women)
Major fractures (women)
Hip fracture (men)
Major fractures (men)
Bolland et al. [38] Hip fracture (women)
Major fractures (women)
Sambrook et al. [40] Hip fracture (women)
Major fractures (women)
Leslie et al. [32] Hip fracture (women)
Hip fracture (men)
Major fracture (women)
Major fracture (men)
Ensrud et al. [34] Hip fracture (women)
Major fractures (women)
Tamaki et al. [35] Hip fracture (women)
Major fractures (women)
Azagra et al. [36&] Hip fracture (men and women
Major fractures (men and wom
Ettinger et al. [37&&] Hip fracture (men)
Major fractures (men)
GFRC, garvan fracture risk calculator.
1040-8711 � 2013 Wolters Kluwer Health | Lippincott Williams & Wilk
FRAX and GFRC was examined in a case–controlstudy [30], where the average 10-year probability offracture in the fracture group was consistently higherthan in the nonfracture group: GFRC model (0.33versus 0.15) and FRAX-US (0.30 versus 0.19). In men,the GFRC model yielded higher average probabilityof fracture in the fracture group than the nonfracturegroup (0.32 versus 0.14); however, fracture pro-babilityestimatedbytheFRAX-USmodel (0.17 versus0.19) or FRAX-UK model (0.09 versus 0.12) were notdifferent between fracture and nonfracture group.The AUC for the GFRC, FRAX-US, and FRAX-UKalgorithms was 0.84, 0.78 and 0.77, respectively.In men, the respective AUC value for the threealgorithms was 0.76, 0.54, and 0.57 [30]. Anothervalidation study [39] in 2012 postmenopausalwomen of Polish background found that there wasa considerable discrepancy in risk estimates betweenGFRC and FRAX models with the GFRC model pre-dicting fracture more accurately than FRAX.
The GFRC model has been validated in theCanadian Multicenter Osteoporosis Study [31] that
horized reproduction of this article is prohibited.
c curve for FRAX and garvan fracture risk calculatorractures
FRAX (with BMD) GFRC
0.78 0.84
0.54 0.76
0.73 0.85
0.83 0.88
0.80
0.70
0.85
0.69
0.70 0.67
0.62 0.63
0.78 0.76
0.61 0.64
0.82
0.79
0.70
0.66
0.76
0.69
0.88
0.69
) 0.85
en) 0.72
0.77
0.67
ins www.co-rheumatology.com 535
Co
Metabolic bone disease
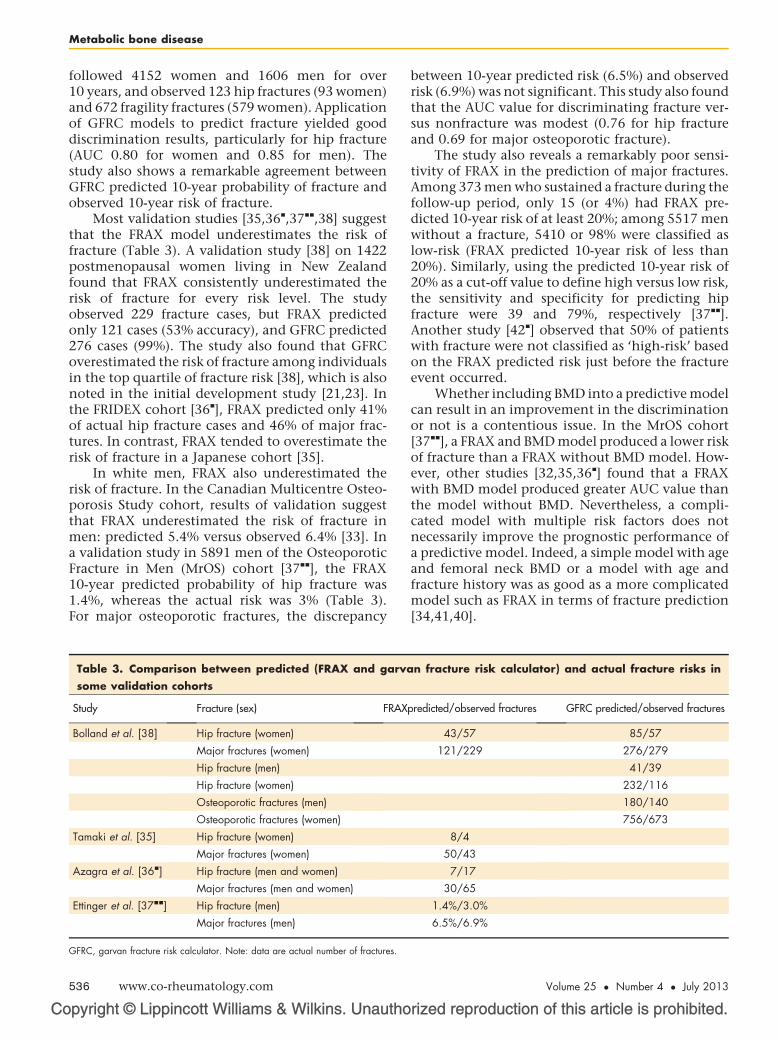
followed 4152 women and 1606 men for over10 years, and observed 123 hip fractures (93 women)and 672 fragility fractures (579 women). Applicationof GFRC models to predict fracture yielded gooddiscrimination results, particularly for hip fracture(AUC 0.80 for women and 0.85 for men). Thestudy also shows a remarkable agreement betweenGFRC predicted 10-year probability of fracture andobserved 10-year risk of fracture.
Most validation studies [35,36&
,37&&
,38] suggestthat the FRAX model underestimates the risk offracture (Table 3). A validation study [38] on 1422postmenopausal women living in New Zealandfound that FRAX consistently underestimated therisk of fracture for every risk level. The studyobserved 229 fracture cases, but FRAX predictedonly 121 cases (53% accuracy), and GFRC predicted276 cases (99%). The study also found that GFRCoverestimated the risk of fracture among individualsin the top quartile of fracture risk [38], which is alsonoted in the initial development study [21,23]. Inthe FRIDEX cohort [36
&
], FRAX predicted only 41%of actual hip fracture cases and 46% of major frac-tures. In contrast, FRAX tended to overestimate therisk of fracture in a Japanese cohort [35].
In white men, FRAX also underestimated therisk of fracture. In the Canadian Multicentre Osteo-porosis Study cohort, results of validation suggestthat FRAX underestimated the risk of fracture inmen: predicted 5.4% versus observed 6.4% [33]. Ina validation study in 5891 men of the OsteoporoticFracture in Men (MrOS) cohort [37
&&
], the FRAX10-year predicted probability of hip fracture was1.4%, whereas the actual risk was 3% (Table 3).For major osteoporotic fractures, the discrepancy
pyright © Lippincott Williams & Wilkins. Unautho
Table 3. Comparison between predicted (FRAX and garvasome validation cohorts
Study Fracture (sex) FRAX
Bolland et al. [38] Hip fracture (women)
Major fractures (women)
Hip fracture (men)
Hip fracture (women)
Osteoporotic fractures (men)
Osteoporotic fractures (women)
Tamaki et al. [35] Hip fracture (women)
Major fractures (women)
Azagra et al. [36&] Hip fracture (men and women)
Major fractures (men and women)
Ettinger et al. [37&&] Hip fracture (men)
Major fractures (men)
GFRC, garvan fracture risk calculator. Note: data are actual number of fractures.
536 www.co-rheumatology.com
between 10-year predicted risk (6.5%) and observedrisk (6.9%) was not significant. This study also foundthat the AUC value for discriminating fracture ver-sus nonfracture was modest (0.76 for hip fractureand 0.69 for major osteoporotic fracture).
The study also reveals a remarkably poor sensi-tivity of FRAX in the prediction of major fractures.Among 373 men who sustained a fracture during thefollow-up period, only 15 (or 4%) had FRAX pre-dicted 10-year risk of at least 20%; among 5517 menwithout a fracture, 5410 or 98% were classified aslow-risk (FRAX predicted 10-year risk of less than20%). Similarly, using the predicted 10-year risk of20% as a cut-off value to define high versus low risk,the sensitivity and specificity for predicting hipfracture were 39 and 79%, respectively [37
&&
].Another study [42
&
] observed that 50% of patientswith fracture were not classified as ‘high-risk’ basedon the FRAX predicted risk just before the fractureevent occurred.
Whether including BMD into a predictive modelcan result in an improvement in the discriminationor not is a contentious issue. In the MrOS cohort[37
&&
], a FRAX and BMD model produced a lower riskof fracture than a FRAX without BMD model. How-ever, other studies [32,35,36
&
] found that a FRAXwith BMD model produced greater AUC value thanthe model without BMD. Nevertheless, a compli-cated model with multiple risk factors does notnecessarily improve the prognostic performance ofa predictive model. Indeed, a simple model with ageand femoral neck BMD or a model with age andfracture history was as good as a more complicatedmodel such as FRAX in terms of fracture prediction[34,41,40].
rized reproduction of this article is prohibited.
n fracture risk calculator) and actual fracture risks in
predicted/observed fractures GFRC predicted/observed fractures
43/57 85/57
121/229 276/279
41/39
232/116
180/140
756/673
8/4
50/43
7/17
30/65
1.4%/3.0%
6.5%/6.9%
Volume 25 � Number 4 � July 2013

Individualized fracture risk assessment Nguyen et al.
THRESHOLD FOR INTERVENTIONOne application of fracture prediction models isfor selecting patients suitable for intervention.However, this application raises serious challenges,because the predicted risk of fracture is a continu-ous probabilistic variable ranging from 0 to 1, andselecting a predicted probability to classify anindividual as ‘high-risk’ or ‘low-risk’ requires athorough research. Nevertheless, the NationalOsteoporosis Foundation guidelines recommendtreatment in the following clinical situations inpostmenopausal women and men aged 50 years orolder [43]: with a hip or clinical vertebral fractureor a morphometric vertebral fracture; with femoralneck or lumbar spine BMD T-scores being equal toor less than �2.5 after excluding secondary causeof osteoporosis; with femoral neck or lumbar spineBMD T-scores between �1 and �2.5 and a 10-yearrisk of hip fracture at least 3% or a 10-year risk ofmajor osteoporotic fracture at least 20%. Theclinical benefit and cost-effectiveness of theserecommendations should be subject to more sys-tematic research.
The individualization of fracture risk assess-ment can be applied to optimize the number neededto treat (NNT). In several randomized clinical trials[44] the number of patients needed to be treated(NNT) to reduce one vertebral fracture comparedwith the untreated group ranged between 8 and 83.For hip fracture, the NNT ranged between 91 and250 [44]. The NNT varies inversely with the back-ground risk, such that treatment of high-risk indi-viduals inherently yields lower NNT (Fig. 1). Thelarge variability in the NNTs among trials isassumed to be due to the variability in fracture rates
Copyright © Lippincott Williams & Wilkins. Unaut
80
70
60
50
40
30
20
10
Incidence of
Number neededto treat (NNT)
0.05 0.10
FIGURE 1. Relationship between background risk (rate of fractutreat to reduce one case of fracture. Each dot in the figure repres[44].
1040-8711 � 2013 Wolters Kluwer Health | Lippincott Williams & Wilk
among the study samples. However, the variabilityis expected given the multiple risk factors thataffect the incidence of fractures. In the presenceof such variability, selecting patients based on theirabsolute risk of fracture (rather than based on a BMDthreshold value) may improve the consistency oftherapeutic efficacy and efficiency of trials. Trialsspecifically testing the efficacy of multivariablerisk based therapy have not been done. However,such approaches could be expected to prove morecost-effective and yield a more consistent NNT,particularly if the duration, typically 3 years, isstandardized.
Recent analyses of correlation between FRAX-predicted fracture risks and antifracture efficacyyielded mixed results. One clinical trial [45]randomized 5212 women aged 75 years and olderinto two groups: placebo receiving calcium andvitamin D with placebo or clodronate (800 mg dailypo). Ten-year probability of fracture was computedfor each woman using baseline clinical risk factorsincluding BMI, prior fracture, glucocorticoid use,parental hip fracture, smoking, alcohol and secon-dary osteoporosis. In women in the top 25th per-centile of fracture probability (average probability of24%), treatment reduced the risk of fracture by 23%over 3 years (hazards ratio 0.77, 95% CI 0.63–0.95).Importantly, among those in the top 10% percentileof risk (average fracture probability of 30%), treat-ment reduced the fracture risk by 31% (hazards ratio0.69, 0.53–0.90) [45]. Thus, treatment of individualsat high risk or moderate risk could reasonably beexpected to have similar benefit in relative butgreater effect in absolute risk reduction for thehigher-risk group.
horized reproduction of this article is prohibited.
vertebral fracture in placebo group
0.15 0.20 0.25 0.30
re in the placebo group) and number of patients needed toents the result of a randomized controlled trial. Adapted from
ins www.co-rheumatology.com 537

Co
Metabolic bone disease
In a post-hoc analysis of the fracture interven-tion trial, the investigators used FRAX to estimateeach patient’s 10-year risk of fracture, and thencorrelated the risk with antifracture efficacy. Theinvestigators conclude that the magnitude of effectof alendronate was constant across FRAX-predictedrisks [46
&&
]. However, a close examination of thedata reveals that the absolute risk reductionincreased with absolute risk levels, and as a result,the number needed to treat decreased as absoluterisk increased. For example, among those in the firsttertile of risk (4.8–22.1%) the NNT was 76, butamong those in the highest tertile (34.2–85.4%)the NNT was 40.
Results of post-hoc analyses of clinical trialsappear to suggest that in relative risk terms, themagnitude of antifracture efficacy of denosumab[47
&&
] and bazedoxifene [48] was dependent onabsolute risks of fracture, such that those at highrisk had better relative efficacy than those at low riskof fracture. However, the antifracture of strontiumranelate [49] and raloxifene [50] seemed to be inde-pendent of the fracture risk assessed by FRAX. How-ever, it is not clear whether absolute risk reductionor the number needed to treat was independent ofpatients’ absolute risk levels. Nevertheless, takentogether, these results are consistent with thesupposition that the antifracture effect size ofpharmacologic therapies are inversely associatedwith patients’ absolute risks, supporting the useof predictive models for selecting patients toinclude in future randomized controlled trials ofosteoporosis.
ISSUES FOR FURTHER RESEARCH
Although the development and implementationof fracture prediction models represent a signifi-cant advance in osteoporosis research, severalissues need to be addressed in the future. Currentprognostic models have been developed based onthe ‘one size-fits-all’ approach. For example, eachmodel uses a set of risk factors for predicting 5-yearor 10-year risk of all types of fracture, because it isassumed that the set of risk factors is associatedwith any type of fracture in any ethnic populationin both men and women. This assumptionis strong and likely untenable, because a riskfactor may be uniquely associated with a type offracture. For instance, fall is a major risk factor forhip fracture; it is not a risk factor for vertebralfracture.
An important weakness of current fracture pre-diction models is that they are based on a singlemeasurement of risk factors, with the underlyingbut not stated assumption that the risk factors do
pyright © Lippincott Williams & Wilkins. Unautho
538 www.co-rheumatology.com
not change with time. Obviously, this assumptionis not true in many risk factors such as BMD andbody weight that are known to decline or changewith time. Moreover, the rates of decline in BMDvaried substantially among individuals. Similarly,the risk of a second fracture is greater closer in timeto the initial fracture with risks declining substan-tially after 10 years. Therefore, one importantaspect of future model development should takethe time-varying nature of risk factors into accountto achieve a better estimate of risk for an indi-vidual.
Osteoporosis has traditionally been viewedin terms of hip fracture, or more recently, morpho-metric vertebral fracture. As a result, most previousstudies have focused on the search for risk factors ofhip and vertebral fractures. There is a serious lack ofliterature of the risk factors for nonhip and non-vertebral fractures. However, emerging evidence hasshown that virtually all types of fracture are associ-ated with increased risk of other fractures and evenmore importantly of premature mortality. There-fore, it is important to gain insight into commonand specific risk factors for specific types of fracture,refracture, and mortality.
The assessment of fracture risk should be indi-vidualized, and genetic factors can improve thereliability of fracture prediction in an individual[51,52]. Genome-wide association studies [53–65]over the past 5 years have identified many novelgenes involved in determination of bone density,some of which have been also associated with frac-ture risk. At present, these common variants explainonly a small proportion of the apparent heritabilityand they have yet to be incorporated into fractureprediction models.
Risk communication in osteoporosis needsmuch more research attention. ‘Risk’ is an elusiveconcept that is not easily understood by patientsand doctors. Although in medical parlance, risk iscommonly seen as the probability of getting a dis-ease over a certain period, it is formally defined asthe product of probability and consequence of anadverse event [66]. The probability componentmeasures the uncertainty, whereas consequencemeasures the impact of an event. Virtually all pre-dictive models in medicine, including FRAX andGFRC, provide only the uncertainty, not impact, ofa health event. From a probabilistic viewpoint, itcan be argued that probability does not exist [67].Probability is derived from statistical modelingof factors that are assumed to occur an infinitenumber of times under similar conditions. In osteo-porosis, fracture risk is predicted from multiplefactors that were measured in the past, and thisinformation is used to estimate the fraction of
rized reproduction of this article is prohibited.
Volume 25 � Number 4 � July 2013

Individualized fracture risk assessment Nguyen et al.
individuals with a similar risk profile who will havea fracture in the future. However, the risk factorschange with time. Thus, although risk exists as anobjective identity, its measure – probability – doesnot exist objectively. This explains why risk percep-tion is widely different among individuals. Forsome, a 20% probability of fracture is a significantconcern, but for others the probability does notwarrant any preventive action. Some fractures willbe of limited concern to some people but of greatconcern to others, who have a more personal andperhaps more accurate view of their impact onquality of life and even survival. An individual’sabsolute risk over a meaningful time period, argu-ably 5 rather than 10 years [68
&
], has to be con-sidered alongside that individual’s concern aboutthe outcome of interest.
The above consideration leads to the issue ofmode of risk communication. The effect and con-sequence of risk factors are commonly expressed interms of relative risk, which is not an optimal way inrisk communication [69] because it can be mislead-ing. Natural frequency [70] and absolute probability[71] are better ways to communicate risk to patients.In recent years, NNT [72], an absolute risk basedmetric, is increasingly used to convey the benefit oftreatment. In hip fracture prevention, NNT has beenshown to be an effective tool for improving patients’acceptance of treatment [73]. However, NNT can belimited for most members of the public, especiallywhen the duration is ignored.
CONCLUSION
Evidence from validation studies so far indicatesthat the prognostic performance of FRAX and theGarvan Fracture Risk Calculator for fracture predic-tion is not perfect, but is still as good as, if not betterthan, models for other chronic health conditions.The area under the ROC curve for FRAX is largelyunder 0.8, and somewhat better for the GarvanFracture Risk Calculator. This level (0.8) is con-sidered to be ‘good’ discrimination and is certainlyclinically useful.
Despite their imperfect discrimination, bothFRAX and Garvan Fracture Risk Calculator canaid patients and doctors to communicate aboutfracture risk in the medium term. In the era ofevidence-based medicine, patients and non-patients alike need to be given reliable and easy-to-understand information about health risk andbenefit of intervention. The risk information fromthese models can help patients and their doctors toreach a rational decision. However, for communi-cation purposes, it is important to note that FRAXtends to underestimate the risk of fracture in both
Copyright © Lippincott Williams & Wilkins. Unaut
1040-8711 � 2013 Wolters Kluwer Health | Lippincott Williams & Wilk
men and women, and the reason for this is notclear.
Certainly, FRAX and GFRC used different riskfactors and different weights for each risk factor inthe estimation of fracture risk. Moreover, there issome debate about how the potential effect ofmortality on the predicted risk of fracture is appliedin the two models. However, the use of these pre-dictive models in making decisions for an individualdoes not take into account the individual’s percep-tion of the importance of the risk. Improvement ofthese predictive models to include the effectsof genetic variants on the one hand and severityof outcomes on the other will enhance their clinicalutility.
Acknowledgements
None.
Conflicts of interest
The authors are developers of the Garvan Fracture RiskCalculator.
REFERENCES AND RECOMMENDEDREADINGPapers of particular interest, published within the annual period of review, havebeen highlighted as:
& of special interest&& of outstanding interest Additional references related to this topic can also be found in the CurrentWorld Literature section in this issue (pp. 559–560).1. Nguyen ND, Ahlborg HG, Center JR, et al. Residual lifetime risk of fractures inwomen and men. J Bone Miner Res 2007; 22:781–788.
2. Cummings SR, Black DM, Rubin SM. Lifetime risks of hip, Colles’, or vertebralfracture and coronary heart disease among white postmenopausal women.Arch Intern Med 1989; 149:2445–2448.
3. Shortt NL, Robinson CM. Mortality after low-energy fractures in patients agedat least 45 years old. J Orthop Trauma 2005; 19:396–400.
4. Randell A, Sambrook PN, Nguyen TV, et al. Direct clinical and welfare costs ofosteoporotic fractures in elderly men and women. Osteoporos Int 1995;5:427–432.
5. Access Economics Pty Ltd. The Burden of Brittle Bones: Costing Osteo-porosis in Australia. Canberra, ACT: Access Ecomomics Pty Ltd; 2001.
6. Sanders KM, Seeman E, Ugoni AM, et al. Age- and gender-specific rate offractures in Australia: a population-based study. Osteoporos Int 1999;10:240–247.
7. Bliuc D, Nguyen ND, Milch VE, et al. Mortality risk associated with low-traumaosteoporotic fracture and subsequent fracture in men and women. JAMA2009; 301:513–521.
8. Center JR, Bliuc D, Nguyen TV, Eisman JA. Risk of subsequent fracture afterlow-trauma fracture in men and women. JAMA 2007; 297:387–394.
9. Johnell O, Kanis JA, Oden A, et al. Fracture risk following an osteoporoticfracture. Osteoporos Int 2004; 15:175–179.
10. Center JR, Nguyen TV, Schneider D, et al. Mortality after all major types ofosteoporotic fracture in men and women: an observational study. Lancet1999; 353:878–882.
11. Bolland MJ, Grey AB, Gamble GD, Reid IR. Effect of osteoporosis treatmenton mortality: a meta-analysis. J Clin Endocrinol Metab 2010; 95:1174–1181.
12. Center JR, Bliuc D, Nguyen ND, et al. Osteoporosis medication and reducedmortality risk in elderly women and men. J Clin Endocrinol Metab 2011;96:1006–1014.
13. Lyles KW, Colon-Emeric CS, Magaziner JS, et al. Zoledronic Acid in ReducingClinical Fracture and Mortality after Hip Fracture. N Engl J Med 2007;357:1799–1809.
14. Beaupre LA, Morrish DW, Hanley DA, et al. Oral bisphosphonates areassociated with reduced mortality after hip fracture. Osteoporos Int 2011;22:983–991.
horized reproduction of this article is prohibited.
ins www.co-rheumatology.com 539

Co
Metabolic bone disease
15. Eisman J, Clapham S, Kehoe L. Osteoporosis prevalence and levels oftreatment in primary care: the Australian BoneCare Study. J Bone MinerRes 2004; 19:1969–1975.
16. Marshall D, Johnell O, Wedel H. Meta-analysis of how well measures of bonemineral density predict occurrence of osteoporotic fractures. BMJ 1996;312:1254–1259.
17. Nguyen T, Sambrook P, Kelly P, et al. Prediction of osteoporotic frac-tures by postural instability and bone density. BMJ 1993; 307:1111–1115.
18. Nguyen ND, Eisman JA, Center JR, Nguyen TV. Risk factors for fracture innonosteoporotic men and women. J Clin Endocrinol Metab 2007; 92:955–962.
19. Cummings SR, Melton LJ. Epidemiology and outcomes of osteoporoticfractures. Lancet 2002; 359:1761–1767.
20. Cummings SR, Nevitt MC, Browner WS, et al. Risk factors for hip fracture inwhite women. Study of Osteoporotic Fractures Research Group. N Engl JMed 1995; 332:767–773.
21. Nguyen ND, Frost SA, Center JR, et al. Development of a nomogram forindividualizing hip fracture risk in men and women. Osteoporos Int 2007;18:1109–1117.
22. Nguyen ND, Pongchaiyakul C, Center JR, et al. Identification of high-riskindividuals for hip fracture: a 14-year prospective study. J Bone Miner Res2005; 20:1921–1928.
23. Nguyen ND, Frost SA, Center JR, et al. Development of prognostic nomo-grams for individualizing 5-year and 10-year fracture risks. Osteoporos Int2008; 19:1431–1444.
24. Kanis JA, Johnell O, Oden A, et al. FRAX and the assessment of fractureprobability in men and women from the UK. Osteoporos Int 2008; 19:385–397.
25. Collins GS, Mallett S, Altman DG. Predicting risk of osteoporotic and hipfracture in the United Kingdom: prospective independent and external valida-tion of QFractureScores. BMJ 2011; 342:d3651.
26. Harrell FEJ, Califf RM, Pryor DB, et al. Evaluating the yield of medical tests.JAMA 1982; 247:2543–2546.
27. Huntjens KM, Kosar S, van Geel TA, et al. Risk of subsequent fracture andmortality within 5 years after a nonvertebral fracture. Osteoporos Int 2010;21:2075–2082.
28. Pencina MJ, D’Agostino RB Sr, D’Agostino RB Jr, Vasan RS. Evaluating theadded predictive ability of a new marker: from area under the ROC curve toreclassification and beyond. Stat Med 2008; 27:157–172; discussion 207-12.
29. Cook NR. Statistical evaluation of prognostic versus diagnostic models:beyond the ROC curve. Clin Chem 2008; 54:17–23.
30. Sandhu SK, Nguyen ND, Center JR, et al. Prognosis of fracture: evaluation ofpredictive accuracy of the FRAX algorithm and Garvan nomogram. Osteo-poros Int 2010; 21:863–871.
31. Langsetmo L, Nguyen TV, Nguyen ND, et al. Independent external validation ofnomograms for predicting risk of low-trauma fracture and hip fracture. CMAJ2011; 183:E107–E114.
32. Leslie WD, Lix LM, Johansson H, et al. Independent clinical validation of aCanadian FRAX tool: fracture prediction and model calibration. J Bone MinerRes 2010; 25:2350–2358.
33. Leslie WD, Lix LM, Langsetmo L, et al. Construction of a FRAX(R) model forthe assessment of fracture probability in Canada and implications for treat-ment. Osteoporos Int 2011; 22:817–827.
34. Ensrud KE, Lui LY, Taylor BC, et al. A comparison of prediction models forfractures in older women: is more better? Arch Intern Med 2009; 169:2087–2094.
35. Tamaki J, Iki M, Kadowaki E, et al. Fracture risk prediction usingFRAX(R): a 10-year follow-up survey of the Japanese Population-BasedOsteoporosis (JPOS) Cohort Study. Osteoporos Int 2011; 22:3037–3045.
36.&
Azagra R, Roca G, Encabo G, et al. FRAX(R) tool, the WHO algorithm topredict osteoporotic fractures: the first analysis of its discriminative andpredictive ability in the Spanish FRIDEX cohort. BMC Musculoskelet Disord2012; 13:204.
This study was based on the FRIDEX cohort which shows that FRAX tended tounderestimate the risk of fracture in men and women.37.&&
Ettinger B, Ensrud KE, Blackwell T, et al. Performance of FRAX in a cohort ofcommunity-dwelling, ambulatory older men: the Osteoporotic Fractures inMen (MrOS) study. Osteoporos Int 2013; 24:1185–1193.
This study examines the prognostic performance of FRAX in the prediction offracture risk of elderly men in a well characterized cohort. Results show thatFRAX had low sensitivity for major fracture, and underestimated the risk of hipfracture.38. Bolland MJ, Siu AT, Mason BH, et al. Evaluation of the FRAX and Garvan
fracture risk calculators in older women. J Bone Miner Res 2011; 26:420–427.
39. Pluskiewicza W, Adamczykb P, Franekc E, et al. Conformity between 10-yearprobability of any osteoporotic fracture assessed by FRAX and nomogram byNguyen et al. Bone 2009; 44 (Suppl 2):S229–S230.
40. Sambrook PN, Flahive J, Hooven FH, et al. Predicting fractures in an inter-national cohort using risk factor algorithms without BMD. J Bone Miner Res2011; 26:2770–2777.
pyright © Lippincott Williams & Wilkins. Unautho
540 www.co-rheumatology.com
41. van Geel TA, Nguyen ND, Geusens PP, et al. Development of a simpleprognostic nomogram for individualising 5-year and 10-year absolute risks offracture: a population-based prospective study among postmenopausalwomen. Ann Rheum Dis 2011; 70:92–97.
42.&
Aubry-Rozier B, Stoll D, Krieg MA, et al. What was your fracture risk evaluatedby FRAX(R) the day before your osteoporotic fracture? Clin Rheumatol 2013;32:219–223.
This study shows that 50% of patients with fracture were not classified as ‘high-risk’ by Swiss FRAX threshold.43. NOF. Clinician’s guide to prevention and treatment of osteoporosis. National
Osteoporosis Foundation. Washington DC; 2008.44. Delmas PD, Rizzoli R, Cooper C, Reginster JY. Treatment of patients with
postmenopausal osteoporosis is worthwhile: the position of the InternationalOsteoporosis Foundation. Osteoporos Int 2005; 16:1–5.
45. McCloskey E, Johansson H, Oden A, et al. Efficacy of clodronate on fracturerisk in women selected by 10-year fracture probability. J Bone Miner Res2007; 22:S131.
46.&&
Donaldson MG, Palermo L, Ensrud KE, et al. Effect of alendronate for reducingfracture by FRAX score and femoral neck bone mineral density: the FractureIntervention Trial. J Bone Miner Res 2012; 27:1804–1810.
This study reports that the relative risk reduction of fracture risk associated withalendronate treatment was independent of baseline FRAX-predicted risk offracture. However, the number needed to treat was dependent on baselineFRAX-predicted risk of fracture.47.&&
McCloskey EV, Johansson H, Oden A, et al. Denosumab reduces the risk ofosteoporotic fractures in postmenopausal women, particularly in those withmoderate to high fracture risk as assessed with FRAX. J Bone Miner Res2012; 27:1480–1486.
This post-hoc analysis shows an inverse correlation between antifracture efficacyof Denosumab and baseline predicted risk of fracture estimated by FRAX.48. Kanis JA, Johansson H, Oden A, McCloskey EV. Bazedoxifene reduces
vertebral and clinical fractures in postmenopausal women at high risk as-sessed with FRAX. Bone 2009; 44:1049–1054.
49. Kanis JA, Johansson H, Oden A, McCloskey EV. A meta-analysis of the effectof strontium ranelate on the risk of vertebral and nonvertebral fracture inpostmenopausal osteoporosis and the interaction with FRAX((R)). Osteo-poros Int 2011; 22:2347–2355.
50. Kanis JA, Johansson H, Oden A, McCloskey EV. A meta-analysis of theefficacy of raloxifene on all clinical and vertebral fractures and its dependencyon FRAX. Bone 2010; 47:729–735.
51. Tran BN, Nguyen ND, Center JR, et al. Enhancement of absolute fracture riskprognosis with genetic marker: the collagen I alpha 1 gene. Calcif Tissue Int2009; 85:379–388.
52. Tran BN, Nguyen ND, Nguyen VX, et al. Genetic profiling and individualizedprognosis of fracture. J Bone Miner Res 2011; 26:414–419.
53. Zheng HF, Tobias JH, Duncan E, et al. WNT16 influences bone mineraldensity, cortical bone thickness, bone strength, and osteoporotic fracture risk.PLoS Genet 2012; 8:e1002745.
54. Medina-Gomez C, Kemp JP, Estrada K, et al. Meta-analysis of genome-widescans for total body BMD in children and adults reveals allelic heterogeneityand age-specific effects at the WNT16 locus. PLoS Genet 2012; 8:e1002718.
55. Estrada K, Styrkarsdottir U, Evangelou E, et al. Genome-wide meta-analysisidentifies 56 bone mineral density loci and reveals 14 loci associated with riskof fracture. Nat Genet 2012; 44:491–501.
56. Zheng HF, Spector TD, Richards JB. Insights into the genetics of osteo-porosis from recent genome-wide association studies. Expert Rev Mol Med2011; 13:e28.
57. Duncan EL, Danoy P, Kemp JP, et al. Genome-wide association study usingextreme truncate selection identifies novel genes affecting bone mineraldensity and fracture risk. PLoS Genet 2011; 7:e1001372.
58. Karasik D, Dupuis J, Cho K, et al. Refined QTLs of osteoporosis-related traitsby linkage analysis with genome-wide SNPs: Framingham SHARe. Bone2010; 46:1114–1121.
59. Timpson NJ, Tobias JH, Richards JB, et al. Common variants in the regionaround Osterix are associated with bone mineral density and growth inchildhood. Hum Mol Genet 2009; 18:1510–1517.
60. Styrkarsdottir U, Halldorsson BV, Gretarsdottir S, et al. New sequencevariants associated with bone mineral density. Nat Genet 2009; 41:15–17.
61. Rivadeneira F, Styrkarsdottir U, Estrada K, et al. Twenty bone-mineral-densityloci identified by large-scale meta-analysis of genome-wide associationstudies. Nat Genet 2009; 41:1199–1206.
62. Richards JB, Kavvoura FK, Rivadeneira F, et al. Collaborative meta-analysis:associations of 150 candidate genes with osteoporosis and osteoporoticfracture. Ann Intern Med 2009; 151:528–537.
63. Zhang F, Xiao P, Yang F, et al. A whole genome linkage scan for QTLsunderlying peak bone mineral density. Osteoporos Int 2008; 19:303–310.
64. Styrkarsdottir U, Halldorsson BV, Gretarsdottir S, et al. Multiple genetic locifor bone mineral density and fractures. N Engl J Med 2008; 358:2355–2365.
65. Sims AM, Shephard N, Carter K, et al. Genetic analyses in a sample ofindividuals with high or low BMD shows association with multiple Wntpathway genes. J Bone Miner Res 2008; 23:499–506.
rized reproduction of this article is prohibited.
Volume 25 � Number 4 � July 2013
Individualized fracture risk assessment Nguyen et al.
66. Kaplan S, Garrick BJ. On the quantitative definition of risk. Risk Analysis 1981;1:11–27.
67. Nau RF. De Finetti was right: probability does not exist. Theory Decision 2001;51:89–124.
68.&
Bolland MJ, Jackson R, Gamble GD, Grey A. Discrepancies in predictedfracture risk in elderly people. BMJ 2013; 346:e8669.
This article highlights the differences in predicted risk of fracture between theFRAX and Garvan Fracture Risk Calculator, and argues that a 5-year risk predictionis more clinically relevant than 10-year risk prediction.69. Gigerenzer G, Gaissmaier W, Kurz-Milcke E, et al. Helping doctors and patients
to make sense of health statistics. Psychol Sci Public Interest 2007; 8:53–96.
Copyright © Lippincott Williams & Wilkins. Unaut
1040-8711 � 2013 Wolters Kluwer Health | Lippincott Williams & Wilk
70. Hoffrage U, Lindsey S, Hertwig R, Gigerenzer G. Medicine. Communicatingstatistical information. Science 2000; 290:2261–2262.
71. Fagerlin A, Zikmund-Fisher BJ, Ubel PA. Helping patients decide: tensteps to better risk communication. J Natl Cancer Inst 2011; 103:1436–1443.
72. Laupacis A, Sackett DL, Roberts RS. An assessment of clinically usefulmeasures of the consequences of treatment. N Engl J Med 1988; 318:1728–1733.
73. Hudson B, Toop L, Mangin D, Pearson J. Risk communication methods in hipfracture prevention: a randomised trial in primary care. Br J Gen Pract 2011;61:e469–e476.
horized reproduction of this article is prohibited.
ins www.co-rheumatology.com 541