The critical exponents of fracture precursors
11
arXiv:cond-mat/9906146v1 10 Jun 1999 The critical exponents of fracture precursors A. Guarino ∗ , R. Scorretti ∗ , S. Ciliberto ∗ and A. Garcimart´ ın ‡ ∗ Ecole Normale Sup´ erieure de Lyon, 46 all´ ee d’Italie, 69364 Lyon, France ‡ Departamento de F´ ısica, Facultad de Ciencias, Universidad de Navarra, E-31080 Pamplona, Spain. Abstract The acoustic emission of fracture precursors is measured in het- erogeneous materials. The statistical behaviour of these precursors is studied as a function of the load features and the geometry. We find that the time interval δt between events (precursors) and events ener- gies ε are power law distributed and that the exponents of these power laws depend on the load history and on the material. In contrast, the cumulated acoustic energy E presents a critical divergency near the breaking time τ which is E ∼ ( τ -t τ ) -γ . The positive exponent γ is independent, within error bars, by all the experimental parameters. PACS: 62.20.Mk, 05.20.-y, 81.40.Np 1
Transcript of The critical exponents of fracture precursors

arX
iv:c
ond-
mat
/990
6146
v1 1
0 Ju
n 19
99
The critical exponents of fracture precursors
A. Guarino∗, R. Scorretti∗, S. Ciliberto∗ and A. Garcimartın‡
∗Ecole Normale Superieure de Lyon, 46 allee
d’Italie, 69364 Lyon, France‡Departamento de Fısica, Facultad de
Ciencias, Universidad de Navarra,
E-31080 Pamplona, Spain.
Abstract
The acoustic emission of fracture precursors is measured in het-erogeneous materials. The statistical behaviour of these precursors isstudied as a function of the load features and the geometry. We findthat the time interval δt between events (precursors) and events ener-gies ε are power law distributed and that the exponents of these powerlaws depend on the load history and on the material. In contrast, thecumulated acoustic energy E presents a critical divergency near thebreaking time τ which is E ∼
(
τ−tτ
)
−γ. The positive exponent γ is
independent, within error bars, by all the experimental parameters.
PACS: 62.20.Mk, 05.20.-y, 81.40.Np
1

Heterogeneous materials are widely studied not only for their large utilityin applications but also because they could give more insight to our under-standing of the role of macroscopic disorder on material properties. Thestatistical analysis of the failure of these materials is an actual and funda-mental problem which has received a lot of attention in the last decade boththeoretically [1]-[18] and experimentally [19]-[24]. When an heterogeneousmaterial is stretched its evolution toward breaking is characterized by theappearance of microcracks before their final break-up. Each microcrack pro-duces an elastic wave which is detectable by a piezoelectric microphone. Themicrocraks constitute the so called precursors of fracture.
The purpose of this letter is just to describe a detailed statistical analysisof fracture precursors performed under many different experimental condi-tions and in several heterogeneous materials. Analysis of this kind can givevery useful informations for constructing realistic statistical models of mate-rial failure. In our experiments we apply a pressure P to an heterogeneoussample until failure. The parameters that we consider are the elapsed timeδt between two consecutive events, the acoustic energy ε released by a sin-gle microcrack and the acoustic energy cumulated since the beginning of theloading E. In this paper we discuss the statistical behavior of these param-eters as a function of the load applied to the sample, the material elasticproperties and the geometry.
In previous experiments it has been shown [23, 24] that if a quasi-static1 constant pressure rate is imposed, that is P = Apt, the sample breaks in abrittle way. In this case the cumulated acoustic energy E(t) ( i.e. the totalenergy released up to a time t by the microfractures) scales with the reducedtime or pressure2 in the following way:
E ∼ (τ − t
τ)−γ ,
where t is time, the critical time τ is the time at which the sample breaksand γ = 0.27 ± 0.05 for all the materials we have checked. In contrast, ifa constant strain rate u = Bt is imposed, a plastic fracture is observed andthe released energy shows no critical behavior. We have also shown thatin the case of a constant P imposed to the sample (creep test), the totalenergy E becomes, near failure, a function of t and scales as E ∼ ( τ−t
τ)−γc .
1A load is considered quasi-static if the load rate is lower than the relaxation time ofthe system.
2In this case P and t are proportional.
2

Notably, the exponent found when a constant stress is applied is the samethan the one corresponding to the case of constant stress rate [25]: γ = γc.In all of the processes, at constant pressure and at constant pressure rate, theactual control parameter for failure seems to be the time. The appearanceof a microcrack seems to be due to a nucleation process [17, 18], and theprobability of nucleation determines the lifetime τ of the entire sample. Infact, we find that τ is given by the equation:
∫ τ
0
1
τo
e−(Po
P)4dt = 1 ,
where P is the pressure and τo and Po are constants, which depends onthe material and on the geometry [25].
In the case of constant load rate (P = Apt or u = Bt) the system has nota characteristic scale of energy or time: the histogram N(ε) of the releasedenergy and the histogram N(δt) of the elapsed time δt between two consec-utive events reveal power laws, i.e. N(ε) ∼ ε−β and N(δt) ∼ δt−α. Theexponents α, β and γ do not depend on the load rate Ap or B [23, 24]. Inthis paper we are interested in studying the exponents in different geometriesand when a constant (creep test), cyclic or erratic load are imposed.
The tests are performed by monitoring the acoustic emission (AE) re-leased before the final break-up of a sample on a high pressure chamber(HPC) machine. The sample separates two chambers and a pressure differ-ence P is imposed between them. A sketch of the apparatus is shown in fig.1a and 1b. We have prepared circular wood (Young modulusY = 2 108N/m2)and fiberglass samples of 22 cm diameter and 4 mm thickness. The Youngmodulus of these materials are Y = 2 108N/m2 for wood and Y = 2 108N/m2
for fiberglass. The AE consists of ultrasound bursts (events) produced by theformation of microcracks inside the sample. For each AE event, we recordthe energy ε detected by the four microphones 3, the place where it wasoriginated, the time at which the event was detected and the instantaneouspressure and displacement at the center of the sample. We are able to recordup to 33 events per second. The experimental apparatus is the same that hasbeen used to obtain the previously cited results; a more detailed descriptionof the experimental methods can be found in [23, 24].
3The energy is defined as the integral of the sum of the squared signals.
3
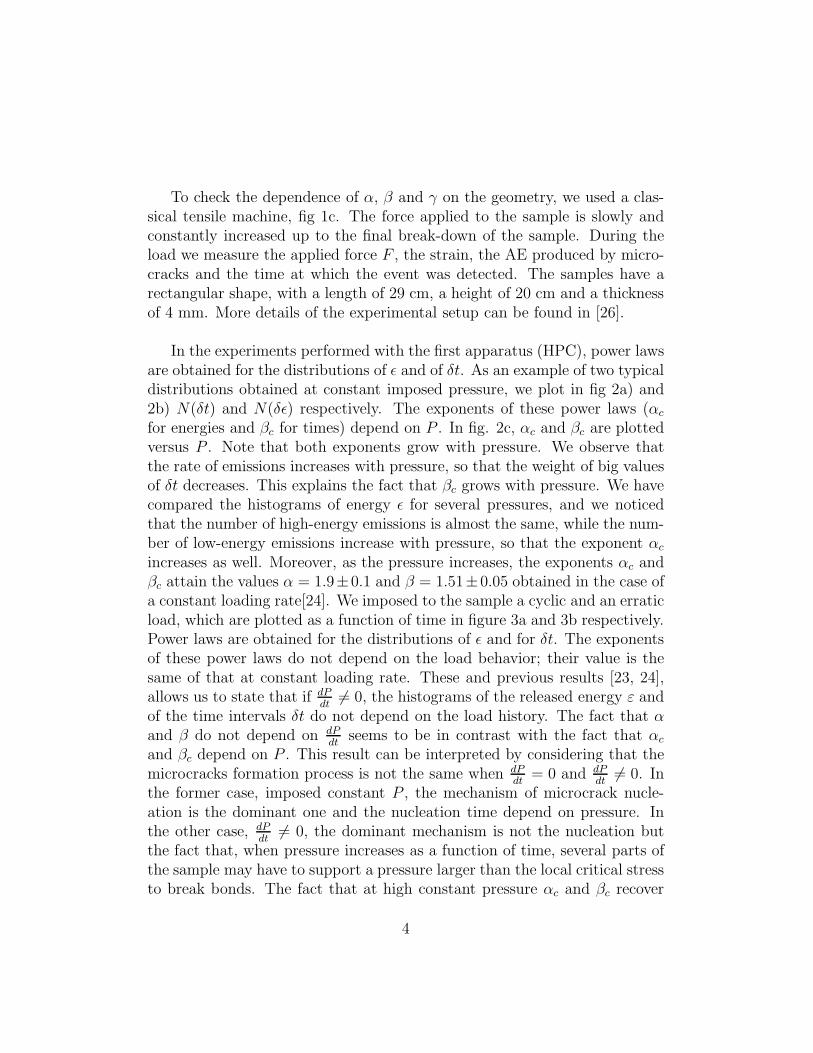
To check the dependence of α, β and γ on the geometry, we used a clas-sical tensile machine, fig 1c. The force applied to the sample is slowly andconstantly increased up to the final break-down of the sample. During theload we measure the applied force F , the strain, the AE produced by micro-cracks and the time at which the event was detected. The samples have arectangular shape, with a length of 29 cm, a height of 20 cm and a thicknessof 4 mm. More details of the experimental setup can be found in [26].
In the experiments performed with the first apparatus (HPC), power lawsare obtained for the distributions of ǫ and of δt. As an example of two typicaldistributions obtained at constant imposed pressure, we plot in fig 2a) and2b) N(δt) and N(δǫ) respectively. The exponents of these power laws (αc
for energies and βc for times) depend on P . In fig. 2c, αc and βc are plottedversus P . Note that both exponents grow with pressure. We observe thatthe rate of emissions increases with pressure, so that the weight of big valuesof δt decreases. This explains the fact that βc grows with pressure. We havecompared the histograms of energy ǫ for several pressures, and we noticedthat the number of high-energy emissions is almost the same, while the num-ber of low-energy emissions increase with pressure, so that the exponent αc
increases as well. Moreover, as the pressure increases, the exponents αc andβc attain the values α = 1.9±0.1 and β = 1.51±0.05 obtained in the case ofa constant loading rate[24]. We imposed to the sample a cyclic and an erraticload, which are plotted as a function of time in figure 3a and 3b respectively.Power laws are obtained for the distributions of ǫ and for δt. The exponentsof these power laws do not depend on the load behavior; their value is thesame of that at constant loading rate. These and previous results [23, 24],allows us to state that if dP
dt6= 0, the histograms of the released energy ε and
of the time intervals δt do not depend on the load history. The fact that αand β do not depend on dP
dtseems to be in contrast with the fact that αc
and βc depend on P . This result can be interpreted by considering that themicrocracks formation process is not the same when dP
dt= 0 and dP
dt6= 0. In
the former case, imposed constant P , the mechanism of microcrack nucle-ation is the dominant one and the nucleation time depend on pressure. Inthe other case, dP
dt6= 0, the dominant mechanism is not the nucleation but
the fact that, when pressure increases as a function of time, several parts ofthe sample may have to support a pressure larger than the local critical stressto break bonds. The fact that at high constant pressure αc and βc recover
4

the value αc and βc has a simple explanation. Indeed, in order to reach avery high pressure Ph,
dPdt
is different from zero for a time interval which iscomparable or even larger than the time interval spent at constant pressurePh. Thus at high constant pressure the system is close to the case dP
dt6= 0.
Using the cyclic and the erratic pressure, plotted respectively in fig. 3aand 3b, we can check the dependence of γ on the history of the sample, i.e.on the behavior of the imposed pressure. The cumulated energy E for thecyclic and the erratic pressure, shown in fig 3a and 3b as a function of t,is plotted in log-log scale as a function of the reduced parameter τ−t
τin fig
4a and 4b respectively. We observe that, in spite of the fluctuations due tothe strong oscillations of the applied pressure, near the final break-up theenergy E, as a function of τ−t
τ, is fitted by a power law with γ ≃ 0.27± 0.02.
In fig.4c), E measured when a constant pressure is applied to the sample isplotted as a function of τ−t
τ. A power law is found in this case too [25]. The
exponent γ is, within error bars, the same in the three cases. Hence it de-pends neither on the applied pressure history nor on the material [23, 24, 25].
Further, experiments made with the tensile machine show that γ is inde-pendent on the geometry. In fact we observe that the behavior of the energynear the fracture as a function of
(
τ−tτ
)
is still a power law of exponentγ ≃ 0.27, as shown in figure 4d.
Considering the experimental data here presented and those already pub-lished [23, 24], we claim that, if a load is imposed to an heterogeneous mate-rial, power laws are obtained for the histograms of the released energy ε andof the time intervals δt. The exponents of these power laws depend on thematerial and, if dP
dt= 0 , on the applied pressure P . In contrast, at imposed
pressure, the behavior of the cumulated energy E near the final breakingpoint does not depend on the load, on the geometry and on the material[23, 24, 25]. We find that time is the control parameter of the system and
that E ∼(
τ−tτ
)
−γ, where the critical exponent is γ = 0.27 ± 0.05. These
results are quite similar to those obtained with numerical simulations on ademocratic bundle fiber model with thermal noise. These facts and the ob-served dependence of τ on P allow us to conclude that microcrack nucleationprocess [17, 18] plays a fundamental role in the entire dynamics of the system.These are very useful informations in order to construct a realistic statisticalmodel of heterogenous material failure.
5

References
[1] Kanninen M.F. and Popelar C.H., Advanced Fracture Mechanics (OxfordUniversity Press, NewYork, 1985).
[2] Lawn B., Fracture of Brittle Solids (Cambridge University Press, Cam-bridge 1993, 2nd. edition).
[3] Herrmann H.J. and Roux S., Eds.,Statistical models for the fracture ofdisordered media (North-Holland, Amsterdam, 1990).
[4] Atkinson B. K., Introduction to fracture mechanics, Academic Press(1989).
[5] Shah S. P. Toughening Mechanisms in Quasi Brittle Materials, KluwerAccademic Publisher (1991).
[6] Dieter G., Mechanical Metallurgic, Mc Graw Hill, (1988).
[7] Naimark O.B. and Silberschmidt V.V., Eur. J. Mech. A / Solids 10 (1991)607.
[8] Bouchaud E., J. Phys. Condens. Matter 9 (1997) 4319.
[9] Hansen A., Hinrichsen E.L. and Roux S., Phys. Rev. Lett. 66 (1991) 2476.
[10] Hemmer, P.C. , Hansen A. J. Appl. Mech. 59 909 (1992)
[11] Zapperi S., Vespignani A. and Stanley H.E., Nature, vol 338, 658-660(1997).
[12] Zhou S. J., Bearzley D. M., Lomdahl P.S.and Holian B. L., Phys. Rev.Lett. 78 (1997) 479; Zhou S. J., Carlson A. E. and Thomson R., Phys.Rev. Lett. 72 (1994) 852,.
[13] P. Bak, C. Tang, K. Wiesenfield, Phys. Rev. Lett. 59, 381 (1987).
[14] De Arcangelis L. and Hermann H. J., Phys. Rev. B 39 (1989) 2678; DeArcangelis L., Hansen H., Herrmann H. J. and Roux S., Phys. Rev. B 40(1989) 877
[15] Sornette D. and Vanneste C., Phys. Rev. Lett. 68 (1992) 612.
6

[16] Mogi K., Bull. Earth Res. Inst. Tokyo 40, 125- (1962).
[17] Pomeau Y., Brisure spontanee des cristaux bidimensionnel courbes, C.R. Acad. Sci. Paris , vol. 314 II, 553-556 (1992).
[18] Gobulovic L. and Feng S., Rate of microcrack nucleation, Pys. Rev. A,40, 5223-5227,10 (1991).
[19] Stead D. and Szczepanik Z., Acoustic emission during uniaxial creepin potash. Fifth conference on acoustic emission/ microseismic activity ingeologic structures and materials, Pennsylvania State Univ., 97-111 (1991).
[20] Maes C. Van Moffaert A., Frederix H. and Strauven H., Phys. Rev. B57 9, 4987-4990 (1998).
[21] D.A. LOckner, J.D Byerlee, V. Kuksenko, A. Ponomarev, A.Sidorin,Nature 350, 39 (1991).
[22] A. Petri, G. Paparo, A. Vespignani, A. Alippi, M. constantini, Phys.Rev. Lett. 73, 43423 (1994).
[23] Garcimartin A., Guarino A., Bellon L. and Ciliberto S., Phys. Rev. Lett.79 17, 3202-3205 (1997).
[24] Guarino A., Garcimartin A. and Ciliberto S., European Physical JournalB, 6, 13-24 (1998).
[25] Guarino A., Garcimartin A. and Ciliberto S., Failure time and microc-rack nucleation, Subbmitted to the Europhysics letters.
[26] Boudet J.F., S. Ciliberto and V. Steinberg. Dynamic of crack propaga-tion in brittle materials. J. Phys II, 6, 1493-1516 (1996).
7

Figure 1: a, b) Sketch of the high pressure chamber (HPC) apparatus. S isthe sample, DS is the inductive displacement sensor (which has a sensitivityof the order of 1 µm). M are the four wide-band piezoelectric microphones.P=P1-P2 is the pressure supported by the sample. P is measured by a dif-ferential pressure sensor ( sensitivity 0.002 atm) that is not represented here.EV is the electronic valve which controls P via the feedback control systemCtrl . HPR is the high-pressure air reservoir. c) Sketch of the tensile ma-chine. An uniaxial force, which is measured by a piezoresistive sensor, isapplied to the sample by a stepping motor. Four wide-band piezoelectricmicrophones measure the acoustic emissions emitted by the sample. Experi-ments have been done using rectangular (20 x 29 cm) wood samples of 4 mmthickness. The whole apparatus is surrounded by a Faraday screen.
8

Figure 2: a,b) Two typical time δt and energy ε distributions obtainedat imposed constant pressure (P = 0.56 atm). c) The exponents αc (emptycircles) and βc (black points), plotted as a function of the value of the imposedconstant pressure. Note that as the pressure increases, the values of theexponents tend to those obtained in the case of constant pressure rate. Theerror bars represent the statistical uncertainty.
9

Figure 3: The imposed pressure, normalised at Pmax, and the cumulatedenergy E, normalized to Emax, are plotted as a function of time t. a) Anexample of erratic pressure. b) A cyclic pressure.
10

Figure 4: The cumulated energy E, normalized to Emax, as a function ofthe reduced control parameter τ−t
τat the neighborhood of the fracture point.
Figure d) represent the measure taken, at imposed constant rate force, onthe tensile machine. The other figures represent measures made on the HPCapparatus at : imposed constant pressure (c), imposed cyclic pressure (a) and
imposed erratic pressure (b). The dotted lines are the fit E = E0
(
τ−tτ
)
−γ.
The exponents found are: γ = 0.29 (a), γ = 0.25 (b), γ = 0.29 (c) andγ = 0.27 (d). In the case of a constant pressure rate (on the HPC machine)the same law has been found [24, 23]
11