Diffusion controlled grain growth in primary crystallization: Avrami exponents revisited
16
Journal of Physics: Condensed Matter (1988) 3833. 1 ’LIIXVLRQFRQWUROOHGJUDLQJURZWKLQDSULPDU\FU\VWDOOL]DWLRQ $YUDPL([SRQHQWV5HYLVLWHG T Pradell 1 , D Crespo 2 , N Clavaguera 3 and M T Clavaguera-Mora 4 1 ESAB, Universitat Politècnica de Catalunya. Urgell 187, 08036-Barcelona, SPAIN. 2 Dept. de Física Aplicada, Universitat Politècnica de Catalunya. Campus Nord UPC, Mòdul B4, 08034-Barcelona, SPAIN. 3 Física de l'Estat Sòlid, Facultat de Física, Universitat de Barcelona. Diagonal 647, 08028- Barcelona, SPAIN. 4 Grup de Física de Materials I, Dept. de Física, Universitat Autònoma de Barcelona. 08193- Bellaterra, SPAIN. 14 November 1997 $EVWUDFW The anomalous behaviour of the Avrami exponents found in the primary crystallisation of amorphous alloys leading to nanostructured materials is considered. A kinetic model able to adequately treat such phase transformation has been formulated by means of the implementation of a soft impingement diffusion mechanism after a transient interface controlled growth. A decrease in the nucleation rate as crystallization proceeds has also been considered. Comparison of the model with experimental data is performed, giving excellent agreement. The soft impingement diffusion mechanism is demonstrated to be responsible for the anomalous behaviour of the Avrami exponent, the decreasing nucleation rate being a second order effect.
Transcript of Diffusion controlled grain growth in primary crystallization: Avrami exponents revisited

^ Journal of Physics: Condensed Matter �� (1988) 3833.
1
'LIIXVLRQ�FRQWUROOHG�JUDLQ�JURZWK�LQ�D�SULPDU\�FU\VWDOOL]DWLRQ�$YUDPL�([SRQHQWV�5HYLVLWHG�^
T Pradell1, D Crespo2, N Clavaguera3 and M T Clavaguera-Mora4
1 ESAB, Universitat Politècnica de Catalunya. Urgell 187, 08036-Barcelona, SPAIN.2 Dept. de Física Aplicada, Universitat Politècnica de Catalunya. Campus Nord UPC, Mòdul B4, 08034-Barcelona,SPAIN.3 Física de l'Estat Sòlid, Facultat de Física, Universitat de Barcelona. Diagonal 647, 08028- Barcelona, SPAIN.4 Grup de Física de Materials I, Dept. de Física, Universitat Autònoma de Barcelona. 08193- Bellaterra, SPAIN.
14 November 1997
$EVWUDFW
The anomalous behaviour of the Avrami exponents found in the primary crystallisation of
amorphous alloys leading to nanostructured materials is considered. A kinetic model able to
adequately treat such phase transformation has been formulated by means of the implementation
of a soft impingement diffusion mechanism after a transient interface controlled growth. A
decrease in the nucleation rate as crystallization proceeds has also been considered. Comparison
of the model with experimental data is performed, giving excellent agreement. The soft
impingement diffusion mechanism is demonstrated to be responsible for the anomalous
behaviour of the Avrami exponent, the decreasing nucleation rate being a second order effect.

2
���,QWURGXFWLRQ
Experimental data on kinetics of primary crystallization often deviates from the theory
of Kolmogorov-Johnson-Mehl-Avrami (KJMA)[1][2][3], specially in the late stages of
crystallization. However, statistical considerations underlying KJMA may be applicable to this
situation, and the challenge is to find suitable models for the nucleation and growth rates in order
to obtain an adequate description of the experimental data.
One of the parameters commonly evaluated for analysing experimental data which follow
KJMA kinetics is the well known Avrami exponent, which is used as a tracer of the mechanisms
underlying the transformation. Dependence of nucleation and growth rates on temperature and
time are both responsible for the Avrami exponent determined, and, although experimental
procedures provide some knowledge of these dependencies, the same values of the Avrami
exponents may be obtained as a result of different mechanisms. Usually, several externally
controlled thermal conditions are used in order to obtain overall information of the
microstructural development through the evaluation of the crystalline fraction evolution or the
Avrami exponent. Therefore, an adequate theoretical description is necessary to fit the time
evolution of the crystalline fraction, [(W), and to obtain an adequate interpretation of the values
of the Avrami exponent, Q(W).
One of the situations where the misfit between KJMA and experimental data is observed
is the primary crystallization of amorphous alloys. Evaluation of Avrami exponents from [(W) insuch processes usually results in abnormally low values, which have given rise to some
controversy and confusion in the literature[4][5][6][7][8]. Recently, experimental data on the
crystalline fraction evolution of BCC Fe(Si) with a DO3 structure precipitation in a FINEMET
alloy has been modelled by considering homogeneous nucleation and interface plus diffusion
controlled grain growth with interference of the diffusion profiles between neighbour
grains[9][10], giving an excellent agreement with experimental data.
The main feature of the model is the introduction of a microstructural dependence of the
grain growth, as a consequence of grain interaction typical of partitioning transformations where
the precipitate has a different composition from the matrix in which it develops. Normally,
partitioning transformations result in the presence of gradients of the concentrations of several
solutes at the edge of the grains, the growth rate being limited by the slowest diffusing specimen.
However, as crystallization proceeds the diffusion profiles of neighbour grains begin to overlap
to an appreciable extent (soft impingement), giving rise to a further decrease in the growth rate
because of the reduction in the concentration gradient[11]. Therefore, the referred model may
adequately treat the growth problem limited by soft impingement in primary crystallisations.
However, a decreasing nucleation rate should also be expected in such transformations, since the

3
G[(7,W)1&[(7,W)
'G[̃(7,W) ���
[(7,W)'1&exp(& [̃(7,W)) ���
[̃(7,W) '
W
0
,(7, ) 9(7, ,W)G '
W
0
,(7, ) IGU(7, ,W) G G ���
composition of the matrix changes as crystallization proceeds, resulting in a remaining
amorphous phase stable versus crystallization. Therefore, the effect of decreasing nucleation rates
should also be considered and compared with the effect of the growing mechanism in the
resulting kinetics.
In this paper the Avrami exponent is calculated with the above referred model of growth
for a primary crystallization.The effect of introducing the interference of the already developed
microstructure on the grain growth is shown. Moreover, the effect of the decrease in the
nucleation rate expected in such transformations is also considered. The relative importance of
the decrease of the growth rate and of the nucleation rate during the transformation is discussed
by comparison with experimental data, and their implications on the determined values of the
Avrami exponent are discussed.
���(YDOXDWLRQ�RI�$YUDPL�H[SRQHQWV�
The kinetics of first order phase transitions driven by nucleation and growth kinetics is
statistically described by the KJMA theory. Avrami equation relates the evolution of crystallized
fraction [(7,W) to the extended crystallized fraction by[̃(7,W)
where 7 accounts not only for the temperature but also for any other external variables
characterizing the process, and W is time. Therefore, the transformed volume fraction may be
evaluated as
The extended volume fraction may easily be calculated from the kinetic parameters as
where , is the nucleation rate, 9(7, ,W) is, at time W, the G-dimensional volume of a grain born at
time , and consequently U(7, ,W) is its radius and IG is the G-dimensional form factor.
The Avrami exponent is defined from the slope of ln( (7,W)) versus ln(W), [̃

4
Q(7,W) 'G ln & ln(1&[(7,W))
G ln(W)'G ln [̃(7,W)G ln(W)
���
[̃(7,W) '1
(TG%1),0 IG *
G
0 W TG%1
Q ' TG%1
���
*(7,U) 'GUGW
''0(7)
U���
and it is evaluated only in the case of isothermal crystallisations; therefore, 7 becomes a fixed
parameter.
The radius U(7, ,W) is obtained by integration of the growth rate *(7,W). Then, for instance,
for a constant nucleation and any radius dependent grain growth, *(7,U(W, )), the radius has the
form U(7,W, )=*0(7) (W- )T, and the extended transformed fraction and the Avrami exponent
become, respectively,
If the time dependence is the same during the whole crystallization process, that is to say,
if there is no change in the mechanism of transformation, the Avrami exponent should be
constant throughout the whole process. The case of increasing and decreasing nucleation rates
may also be considered, taking, for instance, I(T,) = I0(T) p and I(T, ) = I0(T) (a+ )-p
respectively. In that case the Avrami exponents are not constant but continuously increase or
decrease, and give at the end of the transformation n(t64) 6 p+qd+1 for the case of increasing
nucleation rates, and n(t64) 6 qd for the case of decreasing nucleation rates. This is a general
result for any kind of time dependency of the nucleation rate[12]. As a consequence, decreasing
or increasing nucleation rates are often considered to be responsibles for non constant Avrami
exponents.
In the case of interface controlled growth the growth rate is constant and the Avrami
exponent becomes equal to G+1, namely 4 for three-dimensional growth (with constant
nucleation rate), 3 for two-dimensional growth, and so on.
For diffusion controlled growth rate, when steady state conditions are reached we have
which can be integrated obtaining

5
U(W, ) ' 2'0(7)@(W& ) 1/2 ���
thus leading to a value of 1+G/2 for the Avrami exponent (with constant nucleation rate), and in
particular 5/2 for the three-dimensional growth. Moreover, in the case of primary transformations
where a three dimensional diffusion controlled growth rate is expected, the minimum value
expected even for decreasing nucleation rates is qd = 3/2.
Finally, for the case of a decreasing growth rate with constant nucleation rate, the
minimum value expected for the Avrami exponent is 1. Values of the Avrami exponent below
this figure are thus classically attributed to both decreasing nucleation and growth rates.
���'LIIXVLRQ�FRQWUROOHG�JUDLQ�JURZWK�LQ�D�SULPDU\�FU\VWDOOL]DWLRQ
The above discussion is very fruitful for understanding complex crystallization processes.
To illustrate this we will now focus the discussion on the nanocrystallization of a FINEMET
alloy. These materials have been extensively studied from several points of view: their good soft
magnetic properties[13], the effect of alloy composition on their properties[14], kinetics of
crystallization[6][7][9][10][15][16] and crystalline and amorphous characterization
[4][16][17][18]. In particular we will analyse the isothermal nanocrystalline precipitation of a
BCC(Fe78Si22) phase, with a DO3 defective in Si superstructure, in a FINEMET material of
composition Fe73.5Si17.5Cu1Nb3B5. Careful kinetic analysis by Differential Scanning Calorimetry
(DSC) and Mössbauer Spectroscopy (MS)[16] has demonstrated that the isothermal
crystallization process of FINEMET materials shows a two step process:a first process, which
is not related to crystalline precipitates but rather to a change in the short range order of the
amorphous phase associated to an enhancement of the hyperfine magnetic interaction (Cu is
separated from the amorphous matrix forming clusters); and a second process which corresponds
to the primary precipitation itself. These two processes may be detected by DSC analysis under
isothermal or continuous heating conditions. )LJXUH���D� shows the isothermal calorimetric
signal, which is formed by the addition of two signals corresponding to the two processes already
mentioned, the first process shown in )LJXUH���E� and the second process shown in )LJXUH���F�.This two step process is also observed under continuous heating conditions, where the first
process appears as a broad peak at lower temperatures than the primary precipitation and may be
eliminated by a first thermal treatment at temperatures of about 430<C [18].
The analysis of the isothermal data in order to obtain the transformed fraction and the
Avrami exponent will be performed on the isothermal calorimetric signal after elimination of the

6
0 600 1200 1800t(s)
-300
-200
-100
0
Hea
t flo
w (
mW
/g)
exot
herm
ic
(a)
(b)(c)
)LJXUH�� (a) Isothermal DSC signal at 763 K corresponding to Fe73.5Si17.5Cu1Nb3B5; the two stepprocess is formed by an continous decaying signal (b) and crystallization peak (c).
first process. Therefore, the effect of Cu clustering will be eliminated from the analysis of the
nanocrystalline precipitation. Moreover, a diffusion controlled growth will dominate the
transformation as the primary phase has a different composition from the amorphous phase. The
chosen FINEMET composition has the advantage that the nanocrystalline precipitate has an Fe/Si
ratio very close to the one corresponding to the original amorphous alloy and which, under
isothermal conditions, does not change as crystallization proceeds [16]. In that case, mostly Nb
will diffuse out of the nanocrystalline phase. Other FINEMET compositions poorer in Si will
show a more complicated behaviour[18].
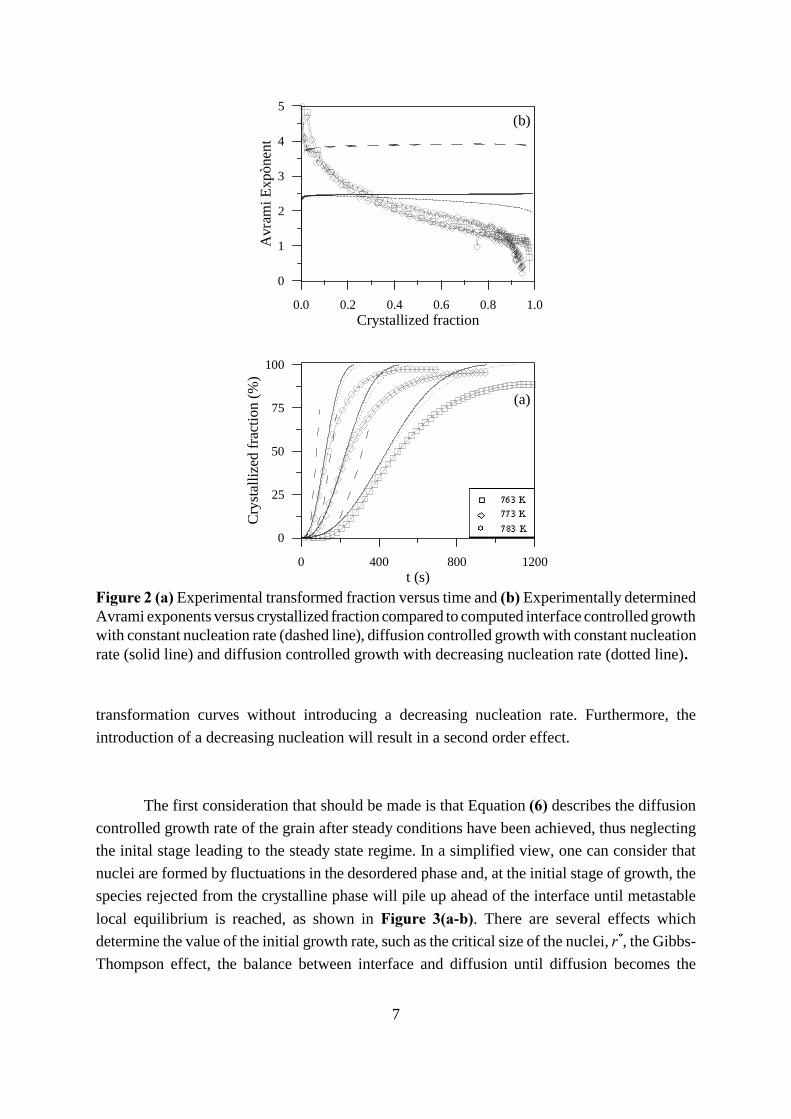
)LJXUH���D� shows the comparison of the experimentally determined transformed fraction
with the computed values, considering constant nucleation and either interface or diffusion
controlled growth, according to Refs[9-10]. )LJXUH���E� shows the experimentally determined
Avrami exponents compared to the computed values for both kinetics. The experimental Avrami
exponents appear to be close to 4 at the beginning of the transition, and further decrease below
the values predicted for a diffusion controlled transition. Common explanation associates this
behaviour with a decreasing nucleation rate during the transformation. A decreasing nucleation
rate is expected because in a primary transformation the change of the composition of the
amorphous matrix results in a change of the thermodinamic factors which favour the initial
nucleous precipitation. In order to take this effect into account the first mean field approximation
is to suppose a linear decreasing nucleation rate as ,�7� �� �,��7��������[� ��[10] )LJXUH�� also
shows the result of introducing the linear decreasing nucleation rate to the diffusion controlled
grain growth expected in a such transformation. None of these models seems able to explain the
experimental behaviour. We will demonstrate that the consideration of a diffusion controlled
growth with soft impingement will explain the behaviour of the Avrami exponents and the
7
0 400 800 1200t (s)
0
25
50
75
100
Cry
stal
lize
d fr
acti
on (
%)
0
1
2
3
4
5
Avr
ami E
xpò
nen
t
0.0 0.2 0.4 0.6 0.8 1.0Crystallized fraction
(b)
(a)
)LJXUH�� �D� Experimental transformed fraction versus time and �E��Experimentally determinedAvrami exponents versus crystallized fraction compared to computed interface controlled growthwith constant nucleation rate (dashed line), diffusion controlled growth with constant nucleationrate (solid line) and diffusion controlled growth with decreasing nucleation rate (dotted line)�
transformation curves without introducing a decreasing nucleation rate. Furthermore, the
introduction of a decreasing nucleation will result in a second order effect.
The first consideration that should be made is that Equation ��� describes the diffusion
controlled growth rate of the grain after steady conditions have been achieved, thus neglecting
the inital stage leading to the steady state regime. In a simplified view, one can consider that
nuclei are formed by fluctuations in the desordered phase and, at the initial stage of growth, the
species rejected from the crystalline phase will pile up ahead of the interface until metastable
local equilibrium is reached, as shown in )LJXUH� ��D�E�. There are several effects which
determine the value of the initial growth rate, such as the critical size of the nuclei, U , the Gibbs-
Thompson effect, the balance between interface and diffusion until diffusion becomes the
8
GUGW
'
X(7) , U#U7
'(7)U
& (&&
& (&&[W
, U>U7
���
[(W) &[W% (1 & [(W)) & ' &0 ���
limiting mechanism, etc. However, since we are using a mean field theory to analyze the overall
transformation, in our simplified model we will consider that growth is interface controlled until
a threshold radius, rT, is attained. Therefore, in order to describe the growth habit more
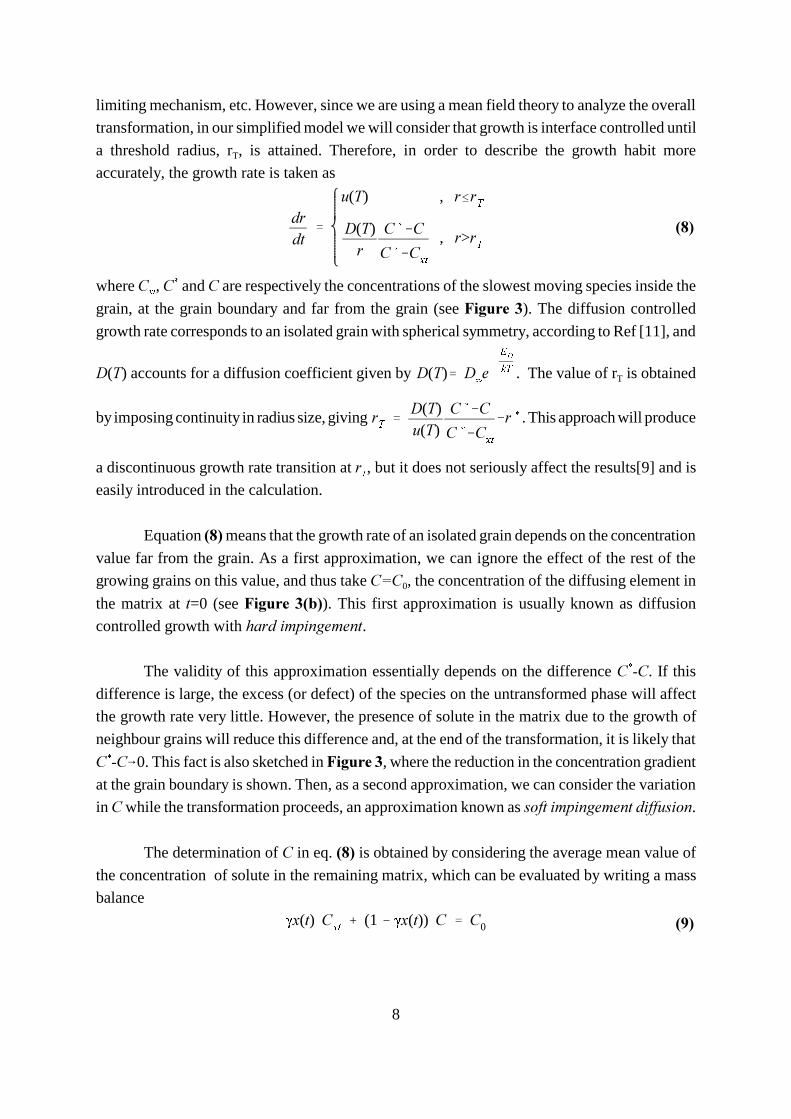
accurately, the growth rate is taken as
where &[W, & and & are respectively the concentrations of the slowest moving species inside the
grain, at the grain boundary and far from the grain (see )LJXUH��). The diffusion controlled
growth rate corresponds to an isolated grain with spherical symmetry, according to Ref [11], and
'(7) accounts for a diffusion coefficient given by . The value of rT is obtained'(7)' '4
H&
('
N7
by imposing continuity in radius size, giving . This approach will produceU7''(7)X(7)
& (&&
& (&&[W
&U (
a discontinuous growth rate transition at U7, but it does not seriously affect the results[9] and is
easily introduced in the calculation.
Equation ��� means that the growth rate of an isolated grain depends on the concentration
value far from the grain. As a first approximation, we can ignore the effect of the rest of the
growing grains on this value, and thus take & &0, the concentration of the diffusing element in
the matrix at W=0 (see )LJXUH���E�). This first approximation is usually known as diffusion
controlled growth with KDUG�LPSLQJHPHQW.
The validity of this approximation essentially depends on the difference & �&. If this
difference is large, the excess (or defect) of the species on the untransformed phase will affect
the growth rate very little. However, the presence of solute in the matrix due to the growth of
neighbour grains will reduce this difference and, at the end of the transformation, it is likely that
& �&60. This fact is also sketched in )LJXUH��, where the reduction in the concentration gradient
at the grain boundary is shown. Then, as a second approximation, we can consider the variation
in & while the transformation proceeds, an approximation known as VRIW�LPSLQJHPHQW�GLIIXVLRQ.
The determination of & in eq. ��� is obtained by considering the average mean value of
the concentration of solute in the remaining matrix, which can be evaluated by writing a mass
balance
9
1&'& (&&0
&0&&[W
����
GUGW
'
X(7) , U#U7
'0(7)
Un([(W)) , U>U
7
����
25
UC
once
ntra
tion
(a)
(b)
(c)
F[W
F�
F
)LJXUH� � Sketch of the evolution of the concentration of the diffusing species as thetransformation advances. (a) Transient growth process. (b) Diffusion controlled growth understeady state conditions. (c) End of the transformation while FßF
where accounts for the crystallized fraction at the end of the primary crystallization ( [=1).
Imposing that &(W64)6& , expression ��� becomes the level rule, namely,
Finally, substituting eq. ��� and eq. ���� in eq. ��� we obtain
where and for hard impingement and'0(7)''(7)& (&&0
& (&&[W
' '(7) n([(W))'1
for soft impingement. Note that new adjustable parameters are notn([(W)) '1 & [(W)1 & [(W)
introduced in the soft impingement approach if can be determined independently
Finally, the change of the matrix composition along the transformation is also expected
to result in a change of the nucleation rate. In the nanocrystalline precipitation of the FINEMET
alloy the matrix enriches in Nb as transformation proceeds. Nb is a well known estabilizer of the
10
0 400 800 1200t (s)
0
25
50
75
100
Cry
stal
lize
d fr
actio
n (%
)
-1
0
1
2
3
4
5
Avr
ami E
xpònent
0.0 0.2 0.4 0.6 0.8 1.0Crystallized fraction
(b)
(a)
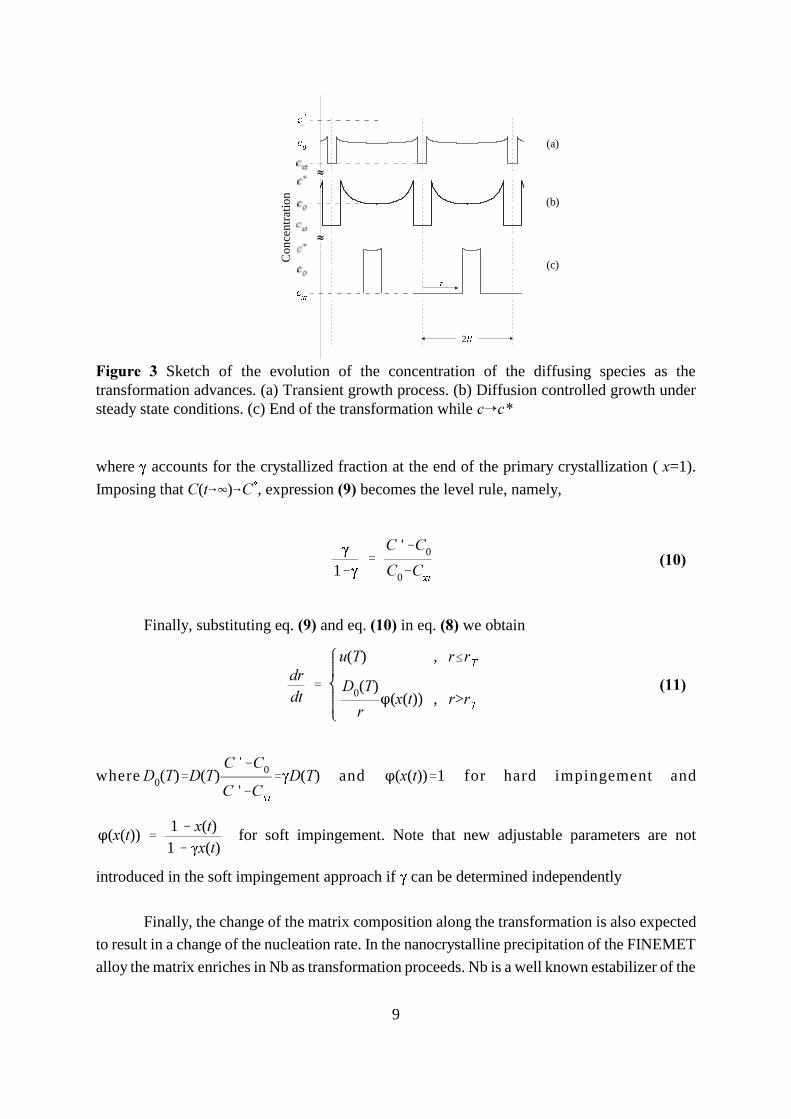
)LJXUH�� �D� Transformed fraction versus time and �E� Avrami exponent versus crystallizedfraction. Comparison of experimental data with computed values in the hard impingementdiffusion approximation with constant (dashed line) and decreasing (solid line) nucleation rates.
amorphous phase, and therefore a reduction of the nucleation rate should be expected. As a first
mean field aproximation, the reduction may be taken as ,�7� �� �,��7��������[� ��[10].
We will apply this model also to the FINEMET -Fe73.5Si17.5Cu1Nb3B5- nanocrystallization
of a BCC(Fe78Si22) primary phase, where Mössbauer measurements show that the transformed
fraction at the end of the primary crystallization is of about 60%[16], which gives a value of
=0.6.
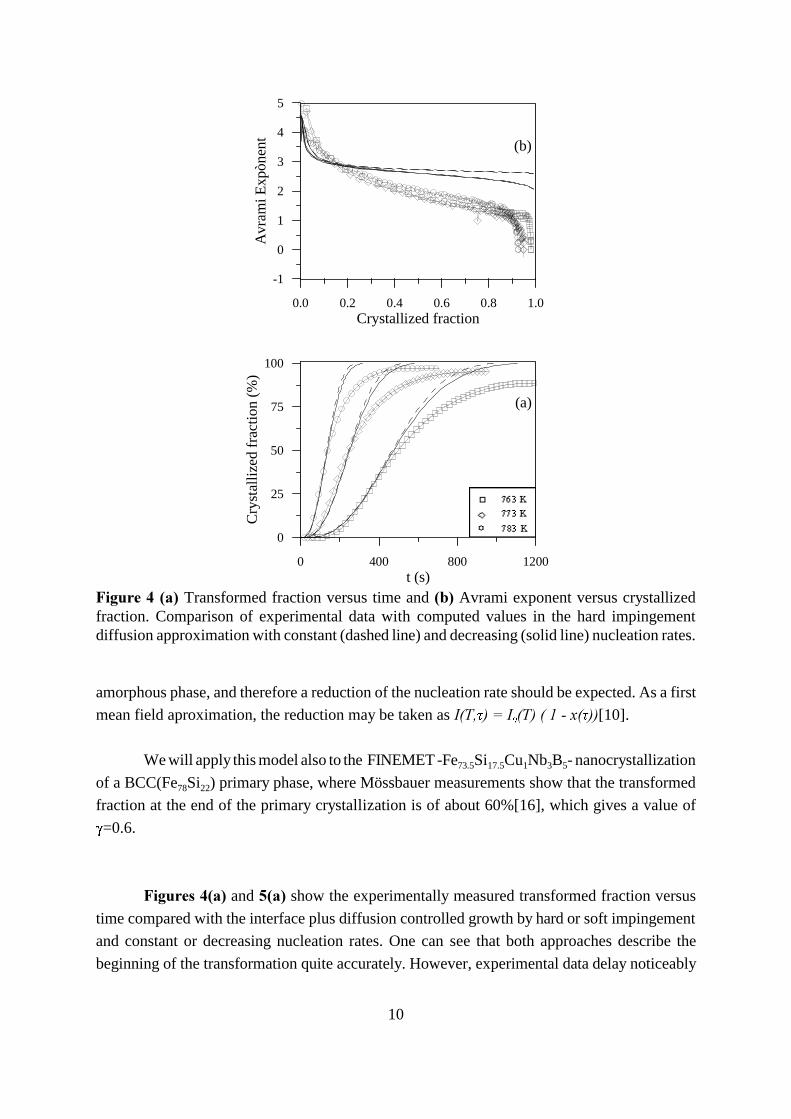
)LJXUHV���D� and ��D� show the experimentally measured transformed fraction versus
time compared with the interface plus diffusion controlled growth by hard or soft impingement
and constant or decreasing nucleation rates. One can see that both approaches describe the
beginning of the transformation quite accurately. However, experimental data delay noticeably
11
0 400 800 1200t (s)
-1
0
1
2
3
4
5
Avr
ami E
xpònent
0.0 0.2 0.4 0.6 0.8 1.0Crystallized fraction
(b)
(a)
0
25
50
75
100
Cry
stalli
zed f
ract
ion (
%)
)LJXUH�� �D� Transformed fraction versus time and �E� Avrami exponent versus crystallizedfraction. Comparison of experimental data with computed values in the soft impingementdiffusion approximations with constant (dashed line) and decreasing (solid line) nucleation rates.
from the hard impingement model after the crystallized fraction reaches about 50%. Moreover,
the decreasing nucleation rates for both growing process produce an extra delay of the
transformed fraction. However, the effect is much smaller than the soft impingement
consideration, and in itself is not able to explain the experimental behaviour. Agreement between
the soft impingement approximation and experimental data is excellent, always allowing for the
uncertainty of the experimental data.
Avrami exponents give an alternative view of this agreement. )LJXUHV���E� and ��E�show the experimentally determined Avrami exponents compared to the computed values for
the hard or soft impingement and constant or decreasing nucleation rates. Remembering that the
beginning of the grain growth is interface controlled in both cases, it is possible to understand
the present agreement between experimental and computed values at early stages of
12
[̃(W%GW)'[̃(W)%,9gW ����
Q(W% W).,9
gW
[̃(W)%,9gW.,9
gW
[̃(W)����
crystallization. However, in the hard impingement model the Avrami exponent tends to a final
value of 5/2, as predicted theoretically in a diffusion controlled growth process, far from the
experimentally determined values. On the other hand, the soft impingement model follows the
evolution of the experimental data more closely, the reduction in the diffusion gradient being
responsible for the low values of the Avrami exponent observed at the end of the transformation.
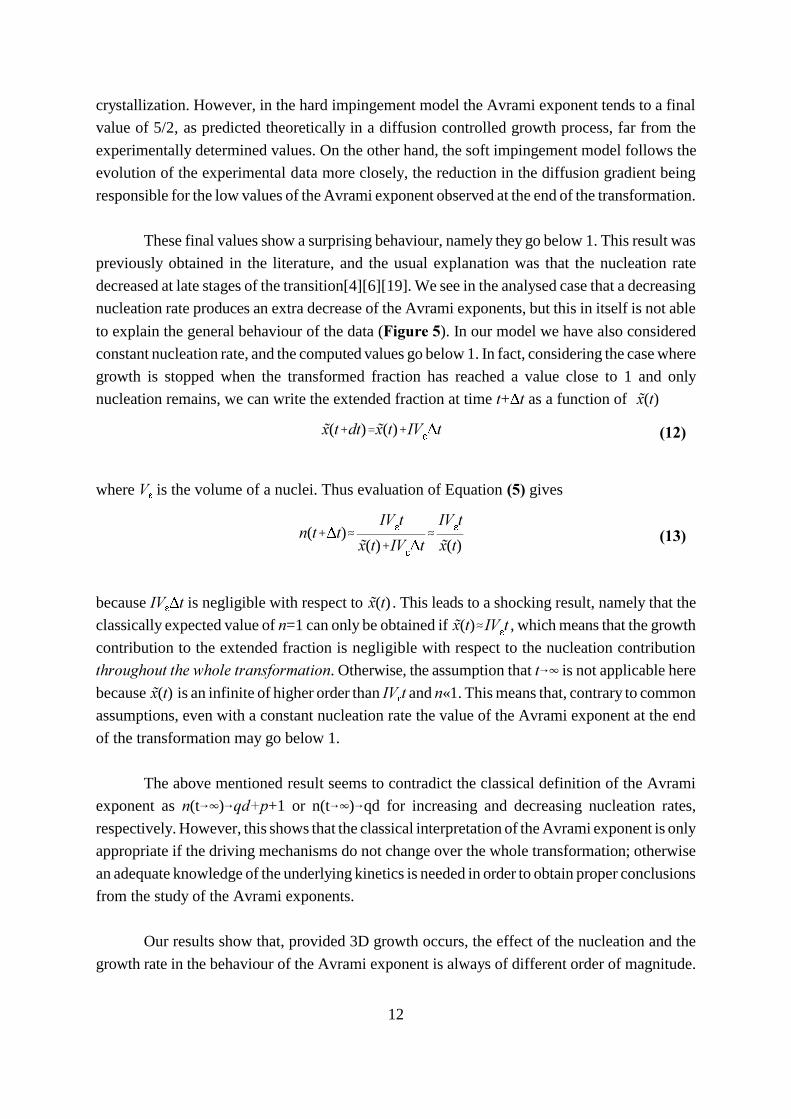
These final values show a surprising behaviour, namely they go below 1. This result was
previously obtained in the literature, and the usual explanation was that the nucleation rate
decreased at late stages of the transition[4][6][19]. We see in the analysed case that a decreasing
nucleation rate produces an extra decrease of the Avrami exponents, but this in itself is not able
to explain the general behaviour of the data ()LJXUH��). In our model we have also considered
constant nucleation rate, and the computed values go below 1. In fact, considering the case where
growth is stopped when the transformed fraction has reached a value close to 1 and only
nucleation remains, we can write the extended fraction at time W+ W as a function of ˜[(W)
where 9g is the volume of a nuclei. Thus evaluation of Equation ��� gives
because ,9gW is negligible with respect to . This leads to a shocking result, namely that the[̃(W)
classically expected value of Q=1 can only be obtained if , which means that the growth[̃(W).,9gW
contribution to the extended fraction is negligible with respect to the nucleation contribution
WKURXJKRXW�WKH�ZKROH�WUDQVIRUPDWLRQ. Otherwise, the assumption that W64 is not applicable here
because is an infinite of higher order than ,9gW and Q«1. This means that, contrary to common[̃(W)
assumptions, even with a constant nucleation rate the value of the Avrami exponent at the end
of the transformation may go below 1.
The above mentioned result seems to contradict the classical definition of the Avrami
exponent as Q(t64)6TG�S+1 or n(t64)6qd for increasing and decreasing nucleation rates,
respectively. However, this shows that the classical interpretation of the Avrami exponent is only
appropriate if the driving mechanisms do not change over the whole transformation; otherwise
an adequate knowledge of the underlying kinetics is needed in order to obtain proper conclusions
from the study of the Avrami exponents.
Our results show that, provided 3D growth occurs, the effect of the nucleation and the
growth rate in the behaviour of the Avrami exponent is always of different order of magnitude.
13
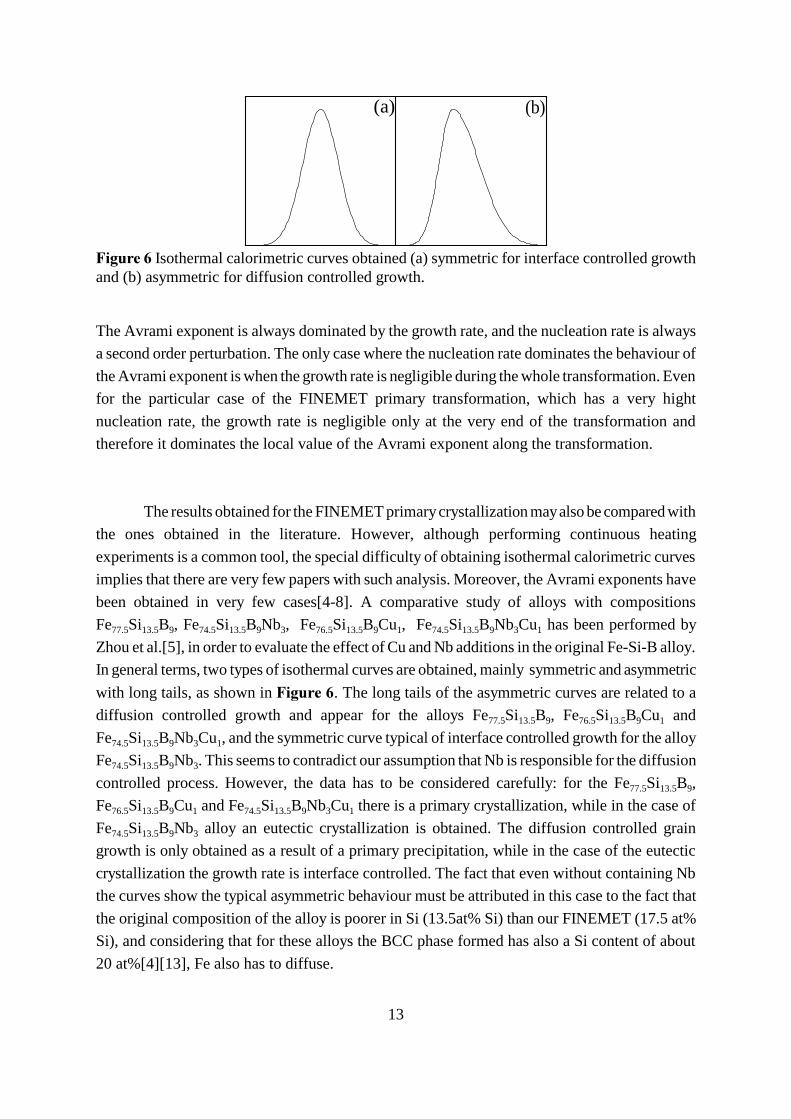
(a) (b)
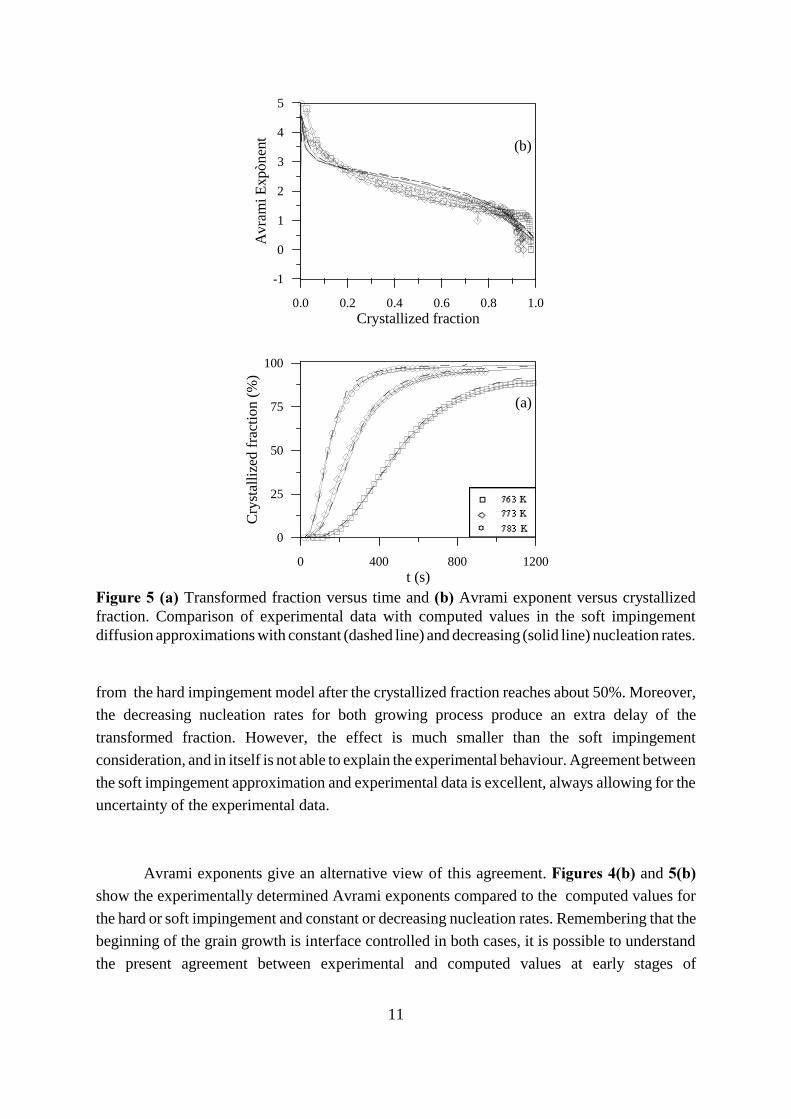
)LJXUH�� Isothermal calorimetric curves obtained (a) symmetric for interface controlled growthand (b) asymmetric for diffusion controlled growth.
The Avrami exponent is always dominated by the growth rate, and the nucleation rate is always
a second order perturbation. The only case where the nucleation rate dominates the behaviour of
the Avrami exponent is when the growth rate is negligible during the whole transformation. Even
for the particular case of the FINEMET primary transformation, which has a very hight
nucleation rate, the growth rate is negligible only at the very end of the transformation and
therefore it dominates the local value of the Avrami exponent along the transformation.
The results obtained for the FINEMET primary crystallization may also be compared with
the ones obtained in the literature. However, although performing continuous heating
experiments is a common tool, the special difficulty of obtaining isothermal calorimetric curves
implies that there are very few papers with such analysis. Moreover, the Avrami exponents have
been obtained in very few cases[4-8]. A comparative study of alloys with compositions
Fe77.5Si13.5B9, Fe74.5Si13.5B9Nb3, Fe76.5Si13.5B9Cu1, Fe74.5Si13.5B9Nb3Cu1 has been performed by
Zhou et al.[5], in order to evaluate the effect of Cu and Nb additions in the original Fe-Si-B alloy.
In general terms, two types of isothermal curves are obtained, mainly symmetric and asymmetric
with long tails, as shown in )LJXUH��. The long tails of the asymmetric curves are related to a
diffusion controlled growth and appear for the alloys Fe77.5Si13.5B9, Fe76.5Si13.5B9Cu1 and
Fe74.5Si13.5B9Nb3Cu1, and the symmetric curve typical of interface controlled growth for the alloy
Fe74.5Si13.5B9Nb3. This seems to contradict our assumption that Nb is responsible for the diffusion
controlled process. However, the data has to be considered carefully: for the Fe77.5Si13.5B9,
Fe76.5Si13.5B9Cu1 and Fe74.5Si13.5B9Nb3Cu1 there is a primary crystallization, while in the case of
Fe74.5Si13.5B9Nb3 alloy an eutectic crystallization is obtained. The diffusion controlled grain
growth is only obtained as a result of a primary precipitation, while in the case of the eutectic
crystallization the growth rate is interface controlled. The fact that even without containing Nb
the curves show the typical asymmetric behaviour must be attributed in this case to the fact that
the original composition of the alloy is poorer in Si (13.5at% Si) than our FINEMET (17.5 at%
Si), and considering that for these alloys the BCC phase formed has also a Si content of about
20 at%[4][13], Fe also has to diffuse.
14
Moreover, the beginning of the isothermal calorimetric curves has been cut in ref. [5],
preventing the observation of the overlap of the calorimetric signal corresponding to Cu
clustering, and giving rise to misleading Avrami exponents at the beginning of the
transformation.
Therefore, the analysis of the Avrami exponents reported for those materials must take
into account the cut off at the beginning of the transformation and the experimental error of the
calorimetric curves at the end of the transformation. Those considerations show that the values
obtained for the primary precipitations decrease continuously as crystallization proceeds, and go
below 5/2, while for the eutectic crystallization the Avrami exponent remains more or less
constant, and close to 4.
Other measurements of Avrami exponents in FINEMET alloys show in all the cases
decreasing values as crystallization proceeds[8], and abnormally low values at the end of the
transformation (~0.3)[4], (~0.2)[6] and (~0.7)[7]. Those results agree with the model of a
diffusion controlled growth with soft impingement.
���&RQFOXVLRQV
The Avrami exponent has been used in the interpretation of experimental data
corresponding to the primary crystallization of an amorphous alloy. The implementation of a soft
impingement diffusion mechanism after a transient interface controlled growth to explain a
primary crystallization enabled us to fit both the transformed fraction and the Avrami exponent
behaviour over the whole transformation. The consideration of decreasing nucleation rates also
has physical reasons. However, its effect in the kinetics is a second order effect compared with
the growth mechanism, which has been demonstrated to be chiefly responsible for the
experimental behaviour.
The final values of the Avrami exponents, both experimental and computed even with
constant nucleation rate, go below 1, in contradiction to the usual hypothesis that a decreasing
nucleation rate is needed to understand this kind of behaviour. This result shows that the Avrami
exponents are always dominated by the growth rate behaviour, and that the effect of the
nucleation rate is a second order effect.
$FNQRZOHGJHPHQWV�

15
[1] Kolmogorov AN 1937 %XOO��$FDG��6FL��8665��3K\V��6HU� � 355
[2] Johnson W A and Mehl P A 1939 7UDQV��$P��,QVW��0LQLQJ�DQG�0HWDOOXUJLFDO�(QJLQHHUV��� 416
[3] Avrami M 1939 -��&KHP��3K\V� � 1103; 1940 � 212; 1941 � 177
[4] Hampel G Pundt A and Hesse J 1992 -��3K\V���&RQGHQV��0DWWHU � 3195
[5] Zhou F He K Sui M and Lai Z 1994 0DW��6FL��(QJ��$ ������� 1419
[6] Cserei A Jiang J Aubertin F and Gonser U 1994 -��0DW��6FL���� 1213
[7] Danzig A Mattern N Doyle S 1995�1XF��,QVW��0HW��3K\V��5HV��%��� 465
[8] Liu T Chen N Xu Z X and Ma R Z 1996 -�0DJQ�0DJQ�0DWHU� ��� 365
[9] Crespo D Pradell T Clavaguera-Mora M T and Clavaguera N 1997 3K\V��5HY��% �� 3435
[10] Clavaguera N and Clavaguera-Mora M T 1996 7KHUPRG\QDPLFV�DQG�.LQHWLFV�RI�3KDVH7UDQVIRUPDWLRQV ed Im J S Park B Greer A L and Stephenson G B (Pittsburg: MaterialsResearch Society (MRS Symposia Proceedings No. 398)) p 319
[11] Christian W 1975 7KH� 7KHRU\� RI� 7UDQVIRUPDWLRQV� LQ� 0HWDOV� DQG� $OOR\V (Oxford:Pergamon Press)
[12] Pradell T Crespo D Clavaguera N and Clavaguera-Mora M T 1997 in: 1RQ�&U\VWDOOLQH�1DQRVFDOH�0DWHULDOV��3URF�RI�WKH��WK�,QW�:RUNVKRS�RQ�1RQ�&U\VWDOOLQH�6ROLGV ed J.Rivas and M. A. López-Quintela (Singapore: World Scientific Pub. Co.), in press
[13] Yoshizawa Y Oguma S and Yamauchi K 1988 -��$SSO��3K\V� ���6044Müller M Mattern N and Illgen L 1992 -��0DJ��0DJQ��0DW� ���, 263Herzer G 1993 Physica Scripta T4 307Schulz R Trudeau M L Dussault D Neste A V and Bailey L D 1994 Mater. Sci. Eng. A179/180 516Sakurai M Matsura M Kim S H Yoshizawa Y Yamauchi K and Suzuki K 1994 Mater.Sci. Eng. A 179/180 469
[14] Kataoka N Inoue A Masumoto T Yoshizawa Y and Yamauchi K 1989 Japan. J. Appl.Phys. 28 L1820Fujinami M Hashiguchi Y and Yamamoto T 1990 Japan J. Appl. Phys. 29 L477Yoshizawa Y Bizen Y and Arakawa S 1994 Mater. Sci. Eng A 179/180 871
This work was financed by CICYT, grants PB94-1209 and MAT96-0692, UPC, grant
PR9505, and Generalitat de Catalunya, grant 1995SGR 00514.
5HIHUHQFHV�

16
[15] Duhlaj P Svec P Janickovic D and Matko I 1991 0DWHU��6FL�(QJ� ��� 398Kulik T 1992 0DWHU��6FL��(QJ��$ ��� 95Clavaguera N Pradell T Zhu J and Clavaguera-Mora M T 1995 1DQRVW��PDWHU� � 453
[16] Pradell T Clavaguera N Zhu J and Clavaguera-Mora M T 1995 -��3K\V���&RQGHQV��0DWWHU� 4129
[17] Rixeckert G Schaaf P and Gonser U 1992 -��3K\V���&RQGHQV��0DWWHU � 10295Miglierini M 1994 -��3K\V���&RQGHQV��0DWWHU �� 1431
[18] Pradell T Zhou J Clavaguera N and Clavaguera-Mora M T 1997 -�� $SSO�� 3K\V�(submitted).
[19] Cahn J W 1996 7KHUPRG\QDPLFV�DQG�.LQHWLFV�RI�3KDVH�7UDQVIRUPDWLRQV ed Im J S ParkB Greer A L and Stephenson G B (Pittsburg: Materials Research Society (MRS SymposiaProceedings No. 398))