Aegic | Australia's Grain Outlook 2030
27
AEGIC | Australia’s Grain Outlook 2030 1 AEGIC is an initiative of the Western Australian State Government and Grains Research & Development Corporation Department of Primary Industries and Regional Development AUSTRALIA’S GRAIN OUTLOOK 2030 Ross Kingwell Chief Economist, AEGIC MIRP19030EN
-
Upload
khangminh22 -
Category
Documents
-
view
3 -
download
0
Transcript of Aegic | Australia's Grain Outlook 2030

AEGIC | Australia’s Grain Outlook 2030 1
AEGIC is an initiative of the Western Australian State Government and Grains Research & Development Corporation
Department ofPrimary Industries andRegional Development
AUSTRALIA’S GRAIN OUTLOOK
2030Ross Kingwell
Chief Economist, AEGIC
MIRP19030EN

AEGIC | Australia’s Grain Outlook 2030 2
ForewordAEGIC’s purpose is to increase value in the Australian grains industry. Hence, strategically it is important to understand internal and external trends that are likely to influence the value and creation of new opportunities for Australian grains. Key internal trends are explored in this report, including grain production and consumption trends within Australia. External trends are investigated in other reports currently in preparation.
All contents copyright @AEGIC. All rights reserved.
The related bodies corporate, directors and employees of AEGIC accept no liability whatsoever for any injury, loss, claim, damage, incidental or consequential damage, arising out of, or in any way connected with, the use of any information, or any error, omission or defect in the information contained in this publication. Whilst every care has been taken in the preparation of this publication AEGIC accepts no liability for the accuracy of the information supplied.

AEGIC | Australia’s Grain Outlook 2030 3
Summary
Towards 2030, Australia’s population and its demand for feed grains will grow. By 2030, Australia’s population will be around 30 million and the diets of many Australians will include grain-based foods and grain-fed meat. Supporting this domestic demand, and growing export demand, will be the yield-enhancing activity of plant scientists, technologists, farmers and their advisers. Their beneficial actions will be against the backdrop of a volatile changing climate in many grain-growing regions and competition from low-cost international suppliers.
This report examines trends in crop production, use of feed and food grains, and population and dietary change in Australia. We predict an additional 5.65mmt of grain will be produced in Australia by 2030, increasing from current production of 49mmt in 2017/18 to 54.6mmt in 2030. Due to population growth and the projected dietary habits of Australians, much of the additional production will be for domestic feed and food grain use, centred mostly in eastern Australia. The additional surplus of grain available for export in 2030 is expected to be between 2.4mmt and 2.77mmt.
Important spatial differences are emerging in grain demand and production across Australia. These spatial patterns have important structural implications for Australia’s grains industry.

AEGIC | Australia’s Grain Outlook 2030 4
• Australia’s population is projected to increase by between 16 and 19 per cent by 2030. This means between 4.07 and 4.89 million additional people in Australia.
• Little increase in the area sown to winter and summer crops in Australia has occurred since the mid-2000s and further increases are unlikely towards 2030.
• Despite plant breeding, agronomic and technology improvements, the average rate of crop yield improvement is only 0.6 per cent per annum since the late 1980s. There is spatial variation in yield improvement trends and yield volatility has worsened in eastern Australia.
• Climate change and seasonal variation are limiting yield growth in many grain-growing regions.
• The mix of crops grown across Australia is fairly stable with a slight increase in the relative importance of canola over the last decade. In eastern Australia coarse grains and pulses feature more in the mix of crops.
• The pattern of meat consumption among Australians is changing, with a growing dominance of chicken and pork consumption at the expense of beef and lamb.
• Increasingly, the main meats consumed by Australians are from grain-fed animals.
• By 2030:
— feed grain demand in Australia will increase by between 2.24mmt and 2.48mmt.
— an additional 0.64mmt to 0.77mmt of grain will be required for flour and malt production.
— an additional 5.65mmt of grain will be produced, increasing from current production of 49mmt in 2017/18 to 54.6mmt.
— the surplus of grain available for export is expected to be between 2.4mmt and 2.77mmt.
— almost all the additional grain production in eastern Australia will need to flow to the east coast domestic market to satisfy its growth in east coast feed and food demand.
— the main sources of additional exportable surpluses of grain will be Western Australia and South Australia.
— the grain quality profile of Australia’s main export crop, wheat, is likely to alter as Western Australia’s and South Australia’s share of national wheat exports increase.
• A key implication of our findings is that towards 2030 Australia’s domestic requirements for grain will become increasingly important, especially in eastern Australia where most of the population increase and greater demand for feed grains, flour, oil for human consumption and malt will occur. By contrast, most of the exportable surpluses of grain will increasingly come from the less populous states of Western Australia and South Australia. The task of finding export markets for the additional 2.4mmt to 2.77mmt of export grain may not be overly challenging, given the projected increase in grain imports envisaged for many of Australia’s current grain customers. But it needs noting that the task of selling more Australian grain will occur in the face of burgeoning exports from low cost international competitors.
Key Findings

AEGIC | Australia’s Grain Outlook 2030 5
Contents
Foreword 2
Summary 3
Key Findings 4
Introduction 6
Production trends 7
Consumption trends in Australia 11
Local demand for feed grains towards 2030 14
Local demand for food grains towards 2030 21
Future grain production 21
Australia’s exportable surplus of grain towards 2030 22
Caveats 24
References 26
Appendix One 27

AEGIC | Australia’s Grain Outlook 2030 6
IntroductionCrop production in Australia is subject to many influences. Farmland can be put to various uses; crop or animal production, horticulture or forestry and mixtures of some or all of these activities. Innovation and technology affects the cost and efficiency of producing each type of farm product. Commodity markets, both local and overseas, send their price signals about what commodities are most or least in demand. Meanwhile, farmers constantly battle with seasonal conditions and in many regions also deal with the march of a changing climate. Most farms in Australia are family businesses, so these businesses also need to deal with issues such as family business succession and how best to gear the next generation to engage with farm production and all its associated challenges and opportunities.
Historically, crop production has been a core activity for many Australian farm businesses. Towards 2030; what changes in Australia’s crop production are likely to emerge and what are the implications for the types and volumes of grain that Australia will produce and need to market? This question is the focus of this investigation. Being informed about the likely types and volumes of grain Australia will produce towards 2030 can improve our understanding of the market opportunities and challenges for Australian grain in the coming decade.

AEGIC | Australia’s Grain Outlook 2030 7
Production trendsAustralia’s winter and summer crop areas and production since the late 1980s are shown in Figure 1. Winter crop production increasingly dominates grain production in Australia, yet the area sown to winter crops has plateaued since the mid-2000s. Nonetheless, production continues to trend upwards, although yield volatility can cause variation in that trend.
0
10
20
30
40
50
60
0
5
10
15
20
25
1987
-88
1988
-89
1989
-90
1990
-91
1991
-92
1992
-93
1993
-94
1994
-95
1995
-96
1996
-97
1997
-98
1998
-99
1999
-00
2000
-01
2001
-02
2002
-03
2003
-04
2004
-05
2005
-06
2006
-07
2007
-08
2008
-09
2009
-10
2010
-11
2011
-12
2012
-13
2013
-14
2014
-15
2015
-16
2016
-17
2017
-18
Crop
pro
duct
ion (
mm
t)
Crop
are
a (M
ha)
Winter crop area Summer crop areaWinter crop production Summer crop production
Figure 1Winter and summer crop areas and production in Australia: 1987/88 to 2017/18
Crop production in Australia has increased 4-fold since the mid-1970s (Figure 2). Crop production has increased at a greater rate and to a larger extent than livestock production and its components of slaughterings and livestock products, such as wool or milk.
The increase in crop production has come from an increase in the area planted to winter crops and an increase in crop yields. Over the 3-years from 1987/88 to 1989/90 14.1 million hectares were planted to winter crops. During a recent 3-year period, 2015/16 to 2017/18, 21.8 million hectares were sown to winter crops; a 55% increase. Most of the area increases have occurred in WA, NSW and Vic; and the rates of yield increase in each State display marked spatial variability (Figure 7).

AEGIC | Australia’s Grain Outlook 2030 8
Total crops Livestock productsLivestock slaughterings Total livestock
25
45
65
85
105
125
145
165
1974
-75
1976
-77
1978
-79
1980
-81
1982
-83
1984
-85
1986
-87
1988
-89
1990
-91
1992
-93
1994
-95
1996
-97
1998
-99
2000
-01
2002
-03
2004
-05
2006
-07
2008
-09
2010
-11
2012
-13
2014
-15
2016
-17
Volu
me
of p
rodu
ctio
n in
dice
s
Figure 2Indices of the volume of production of crops, livestock slaughterings and livestock products in Australia since 1974/75
Across Australia, since the 2000s the area mix of crops has altered little, although the oilseed area has increased at the expense of some wheat and coarse grain area later in the decade. Pulse crops continue to occupy only around 10 per cent of the national crop area. Within some grain growing regions the mix of crops has changed more. For example, in WA the area of the main pulse crop, lupins, has reduced substantially while the area sown to the oilseed, canola, has greatly increased. Among pulse crops, offsetting the decline in the lupin area in WA has been increased plantings of chickpeas in NSW.
Despite the reasonably constant land share allocations to the main crops, as shown in Figure 3, climate variability has caused large swings in Australian grain production. Most major crop production in Australia is rainfed, so changes in rainfall acutely affect crop production. Over the period 2000 to 2018 the volatility of rainfall in eastern Australia has been greater than the volatility of rainfall in the west coast region of cropping, as is historically the norm. A measure of rainfall volatility, the coefficient of variation of rainfall, from 2000 to 2018 has been 0.28 in the Murray Darling basin versus 0.15 in the south west of Australia. As shown in Figure 4 and Figure 5 most of the variation in crop production in the eastern and western regions of cropping in Australia is attributable to rainfall variation. Because rainfall variation is greater in eastern Australia its crop production variation is also greater.
Low-yielding years in eastern Australia are almost always due to drought. What became known as the millennium drought in eastern Australia commenced in the late 1990s and worsened in 2001 and 2002. By 2003 it was recognised as the worst drought on record. Even more challenging was the year 2006, the driest on record for many parts of the country and conditions remained hot and dry through to early 2010 after which the drought broke, but then returned in 2018. A ramification of the greater volatility of grain production in eastern Australia is that when regional shares of grain production are examined, it appears as though WA has a highly variable share of the nation’s grain production (Figure 6). Whilst true, this is an artefact of the highly variable production in eastern Australia and the more reliable production of grain in Western Australia, at least to date, and in spite of the south-west grain-growing region of Western Australia also being acknowledged as subject to a drying and warming trend in its climate.

AEGIC | Australia’s Grain Outlook 2030 9
Wheat OilseedsCoarse grains Pulses
Crop
sha
re
0
0.1
0.2
0.3
0.4
0.5
0.6
2000
-01
2001
-02
2002
-03
2003
-04
2004
-05
2005
-06
2006
-07
2007
-08
2008
-09
2009
-10
2010
-11
2011
-12
2012
-13
2013
-14
2014
-15
2015
-16
2016
-17
2017
-18
2018
-19
East Coast grain production Murray-Darling basin rainfall
Crop
pro
duct
ion
(mm
t)
200
300
400
500
600
700
800
900
0
5
10
15
20
25
30
35
40
2000
-01
2001
-02
2002
-03
2003
-04
2004
-05
2005
-06
2006
-07
2007
-08
2008
-09
2009
-10
2010
-11
2011
-12
2012
-13
2013
-14
2014
-15
2015
-16
2016
-17
2017
-18
2018
-19
Mur
ray
Darli
ng B
asin
ann
ual
rain
fall
(mm
)
West Coast (WA and SA) grain production South west Australia annual rainfall
Wes
t co
ast
(WA
and
SA)
grai
npr
oduc
tion
(m
mt)
200
300
400
500
600
700
800
900
0
5
10
15
20
25
30
35
40
2000
-01
2001
-02
2002
-03
2003
-04
2004
-05
2005
-06
2006
-07
2007
-08
2008
-09
2009
-10
2010
-11
2011
-12
2012
-13
2013
-14
2014
-15
2015
-16
2016
-17
2017
-18
2018
-19
Sout
h w
est
Aust
ralia
ann
ual
rain
fall
(mm
)
Figure 3Proportion of Australia’s crop area sown to different crop types since 2000/01
Figure 4Crop production (mmt) in eastern Australia (Qld, NSW & Vic) since 2000/01 (mmt) and annual rainfall (mm) in the Murray-Darling basin
Figure 5Crop production in Western Australia and South Australia (mmt) and annual rainfall in the south west of Australia since 2000/01 (mm)

AEGIC | Australia’s Grain Outlook 2030 10
Western Australia (WA) has less yield variability compared to key grain-growing regions in NSW and Vic, but all regions display constrained yield growth. Figure 7 displays the rates of change in wheat yield across Australia over the period 1990 to 2017. Many parts of NSW, Vic, SA and central and eastern parts of WA’s grainbelt show very little yield advancement, despite the best endeavours of plant breeders, agronomists, farmers and agricultural engineers. Only in more southern or higher rainfall regions are higher rates of yield improvement observed. National and State aggregated statistics on grain production mask these important spatial changes in grain production. Australia’s major grain handlers have noted these spatial changes and accordingly have adjusted their investments in grain handling and storage facilities.
In regions with pronounced seasonal variability, it is likely that the frequency of poor years will financially constrain farmers’ input applications and lead to lesser rates of yield advancement. Indebtedness and financial insecurity will limit the grain yields achieved by some farms.
WA Vic QldNSW SA
Shar
e of
gra
in p
rodu
ctio
n
2000-01
2001-02
2002-03
2003-04
2004-05
2005-06
2006-07
2007-08
2008-09
2009-10
2010-11
2011-12
2012-13
2013-14
2014-15
2015-16
2016-17
2017-18
2018-19
0
0.1
0.2
0.3
0.4
0.5
0.6
0.7
Figure 6State shares of Australian grain production since 2000/01

AEGIC | Australia’s Grain Outlook 2030 11
Figure 7Spatial time trends in wheat yields in statistical sub-divisions across Australia from 1990 to 2017
Fitzroy SD BalFitzroy SD Bal
Mackay SD Bal
Hunter SD Bal
Tamworth
NorthernTablelands
Dubbo
Macquarie-Barwon
Upper Darling
Lachlan
AlburyCentral Murray
HopkinsGlenelg
West Central Highlands
South WimmeraSouth Goulburn
DarlingDownsSD Bal
South West
Fitzroy SD Bal
Barossa
Fleurieu
Yorke
Lower NorthRiverland
Murray Mallee
Upper South East
Pirie
Macquarie-Barwon
Upper Darling
Lincoln
West Coast
CentralTablelands
Lower South East
Kangaroo Island
Southern
Central North
Blackwood Pallinup
King
Hotham Lakes
MooreAvon
Campion
Johnston
Greenough River
FlindersRanges
CentralMurrumbidgee
Southern Tablelands LowerMurrumbidgee
CentralMacquarie
Northern Slopes
Upper Murray
MurrayDarling
E.Mallee
W.Mallee
NorthWimmera
W.Barwon
Wide BayBurnettSD Bal
N.Goulburn NorthLoddon
W.Mallee
NorthCentralPlain
West Ovens Murray
Preston
Tasmania
Australia
Western
SouthAustralia
Victoria
New
South
Wales
Queensland
LEGENDStatistical subdivision boundaryWheatbelt boundary
agrometeorology
0 200 400 600 800 1000
Kilometres (approx.)
> 72
60 to 72
48 to 60
36 to 48
24 to 36
12 to 24
Trend kg/ha/yr
0 to 12
C Agrometeorology Australia, 2019
AustraliaTrends in wheat yields at a statistical subdivision level
1990-2017
Steady/decreasing

AEGIC | Australia’s Grain Outlook 2030 12
Consumption trends in AustraliaIn eastern Australia where 75% of Australia’s consumers reside (Kingwell, 2019), domestic consumption trends are a key driving force behind grain production.
The unique characteristics of each type of grain affect its consumption. Wheat, for example, can be used in raw form as a local feed grain or an export grain. Additionally, it can be converted into flour and millmix, with the flour used in local manufacture of breads, noodles, cakes, pastries and biscuits. Canola can be exported or used locally, crushed into oil and canola meal, with the latter used as an animal feed. Barley is both an export grain as well as a local feed grain. In addition, it can be transformed into malt, mostly for beer production. Pulses such as lupins, chickpeas and field peas are exported and used locally for human consumption or, in the case of lupins and sorghum, for animal feeding.
Australia will experience further population growth and sustained wealth towards 2030. These twin factors will jointly increase the demand for grains as human foods — grains in breakfast cereals and snack bars, flour for bread, cakes, biscuits, pastries and as a cooking ingredient, malt for beer, cooking oils and pulses as a meal ingredient. Population and per capita income growth will also drive an increased demand for animal protein which in turn will increase domestic demand for feed grains. This demand will be exacerbated during periods of drought when grazing animals have inadequate pastures and will require supplementary grain-feeding to maintain animal welfare and sustain their production. Slightly offsetting that growth in demand for feed grains will be progress in animal breeding that will further improve the efficiency of feed conversion enabling higher meat yield from each animal (see Oceania in Figure 8, and Figure 9).

AEGIC | Australia’s Grain Outlook 2030 13
1961 1970 1980 1990 2000 2010 2014
Poultry
yie
lds
(kg
per
anim
al)
North America EuropeSouth America Oceania
Africa
World
Asia
2.5
2.0
1.5
1.0
0.5
0
1961 1970 1980 1990 2000 2010 2014
Pig
mea
t yi
elds
(kg
per
anim
al)
North America Europe South America AfricaWorld Asia
100
80
60
40
20
0
Figure 8Yield of meat from each raised chicken
Source: UN Food and Agricultural Organization (FAO)
Figure 9Yield of pig meat from each carcass
Source: UN Food and Agricultural Organization (FAO)

AEGIC | Australia’s Grain Outlook 2030 14
Local demand for feed grains towards 2030The local demand for feed grains is affected, and will continue to be affected, by dietary change among Australians (Figure 10). Per capita consumption of red meat (beef, lamb and mutton) in Australia is consistently trending downwards, whilst the opposite is observed for chicken and pork. Per capita chicken meat consumption has increased 5-fold since the early 1970s and in the early 2000s chicken became the main type of meat consumed by Australians. Chicken and pork are now the main meats consumed by Australians. However, overall, Australians’ consumption of meat has not changed much over the last 40 years with per capita consumption ranging from 100 to 110kg.
Beef and veal PorkLamb and mutton Chicken
1974
-75
1976
-77
1978
-79
1980
-81
1982
-83
1984
-85
1986
-87
1988
-89
1990
-91
1992
-93
1994
-95
1996
-97
1998
-99
2000
-01
2002
-03
2004
-05
2006
-07
2008
-09
2010
-11
2012
-13
2014
-15
2016
-17
Per
capi
ta c
onsu
mpt
ion
(kg)
0
10
20
30
40
50
60
70
Figure 10Australia’s per capita consumption trends of different meats since 1974/75
Source: Based on data in ABARES (2018)
The substantial shift in the per capita mix of meat consumption in Australia has been mostly a function of relative prices (Figure 11). Lamb was once the cheapest meat consumed in Australia. It is now the most expensive. Chicken is now the most affordable type of meat, followed by pork. The price gap between lamb and beef versus poultry has been widening, encouraging greater consumption of chicken. Poultry is now the most consumed meat at around 48kg per person. Beef and veal and pig meat each account for between 20 and 30kg per person. Fish, not mentioned in Figure 10, accounts for around 15kg per person and sheep meat is under 10kg per person.
This change in the pattern of meat consumption in Australia has important implications for the demand for feed grains. Back in the early 1970s when consumption of beef and sheep meat was commonplace, much of that meat was based on animals grazing pastures. However, most beef animals are now sent to feedlots for finishing, and pork and chicken meat production is entirely dependent on grain-feeding. Hence, an increasing proportion of the meat consumed by Australians is derived from grain-feeding.

AEGIC | Australia’s Grain Outlook 2030 15
Lamb PoultryBeef Pork
Pric
e in
dice
s
0
50
100
150
200
250
300
1984-85
1985-86
1986-87
1987-88
1988-89
1989-90
1990-91
1991-92
1992-93
1993-94
1994-95
1995-96
1996-97
1997-98
1998-99
1999-00
2000-01
2001-02
2002-03
2003-04
2004-05
2005-06
2006-07
2007-08
2008-09
2009-10
2010-11
2011-12
2012-13
2013-14
2014-15
2015-16
2016-17
2017-18
Figure 11Price indices of Australia’s main meats since 1984/85
Source: Based on data in ABARES (2018); (Base year is 1997/98 = 100)
The grain-based meats that now dominate Australians’ meat consumption represent very efficient use of feed grains (Table 1). Chicken and pig meat have far better feed conversion ratios than beef or sheep meat production.
Table 1 Feed conversion ratios in meat production
Chicken Pork Beef
Feed conversion for liveweight (feed weight/liveweight of animal) 1.8a 3.6b 10
Feed conversion for end product (feed weight/carcase weight) 2.4b 5b 17b
Protein content (% of edible weight) 20 14 15
Note: a See https://www.chicken.org.au/facts-and-figures/#Efficiency_of_Chicken_Production b Based on industry sources.
Also see Alexander et al. (2016) and Dalton and Keogh (2007).
The volumes of feed grains used by various livestock industries in Australia in 2017/18 are shown in Table 2. Some of the livestock industries in Table 2 primarily serve Australia’s domestic market. Such industries include aquaculture, eggs, horse, poultry meat and pork. Other industries such as beef, dairy and sheep are more export oriented.
Table 2 Feed grain use by livestock industries in Australia in 2017/18
Feed grain use (kt)
Poultry meat 3261Eggs 998Pork 1632Dairy 2628Beef 3913Sheep 309Horse 443Aquaculture 164Other 190
Source: Spragg (2018)

AEGIC | Australia’s Grain Outlook 2030 16
For livestock industries mainly with a domestic market focus, their dependence on feed grains will mostly be a function of change in the size of Australia’s population towards 2030 and shifts in dietary preferences that favour or discourage consumption of their animal products. Industries like aquaculture, poultry and eggs are far less exposed to the vagaries of climate, unlike the cattle and sheep industries, and so can quickly alter their production in response to market conditions. Their short breeding cycles also facilitate their responsiveness to market conditions. By contrast, the long intervals in breeding cycles for cows and ewes means that any expansion in their herd size occurs slowly and is vulnerable to any prolonged sequence of adverse seasons. Hence, any strategic alteration in feed grain use by the sheep and cattle industry tends to occur slowly; notwithstanding the dramatic impact that drought can have on feed grain demand.
Towards 2030, further dietary change is likely among the Australian population with a gradual rise in vegetarianism (Morgan, 2016), increased consumption of farmed fish and a further reduced frequency of red meat consumption. By illustration, the proportion of the Australian population strictly or broadly classed as vegetarian grew slightly from 10% to 11% between 2012 and 2016. The implications of this dietary shift is a likely plateauing or lessening of per capita meat consumption, and a further relative decline in red meat consumption; despite per capita wealth potentially increasing. Globally, usually as per capita wealth increases so does per capita meat and dairy product consumption. However, in highly developed economies, per capita meat consumption often is projected to plateau (OECD – FAO, 2019).
Meat and dairy production account for over half of Australia’s agricultural greenhouse gas emissions and heavily draw on water resources (CSIRO, 2019), thereby fuelling environmental concerns that lead some consumers to reduce their consumption of these products. For some other consumers, ethical issues surrounding animal welfare encourage a switch away from meat consumption.
Australia’s population is projected to reach 30 million people between 2029 and 2033 (ABS, 2018). The growth in population is a function of fertility rates, net overseas migration and average life expectancy. One likely scenario for Australia, as an advanced economy, is to display low fertility, medium life expectancy and a low net overseas migration, due to subdued global economic growth and government policy. Under these conditions, Australia’s population in 2030 is projected to be 29.17 million. Other plausible scenarios are described in Figure 12, with the resultant estimates of Australia’s population in 2030 ranging from 29.17 to 29.99 million.

AEGIC | Australia’s Grain Outlook 2030 17
Figure 12Population growth scenarios for Australia towards 2030. Numbers in brackets are the estimates of Australia’s population in 2030 in millions of persons
Source: ABS (2018)
Low fertility
Medium fertility
Medium life expectancy
Medium life expectancy
Low net overseas migration (29.17)
Low net overseas migration (29.42)
Low net overseas migration (29.22)
Low net overseas migration (29.47)
Medium net overseas migration
(29.68)
Medium net overseas migration
(29.93)
Medium net overseas migration
(29.73)
Medium net overseas migration
(29.99)
High life expectancy
High life expectancy

AEGIC | Australia’s Grain Outlook 2030 18
These population projections indicate that by 2030 there is likely to be between 4.07 and 4.89 million additional people in Australia. Importantly for feed grain demand, the ageing of Australia’s population will help maintain Australia’s relatively high per capita consumption of livestock industry products. Sui et al (2017) examined meat consumption by age group in Australia and found that per capita meat consumption is highest for persons in the age range 14 to 70. Moreover, per capita meat consumption for men and women from 51 to 70 years old is very similar to levels recorded by males and females from age 14 to 18. The age interval in which per capita consumption levels are highest is 19 to 50 years of age.
For livestock industries with a dominant focus on the domestic market, the growth in Australia’s population represents new demand and new sales opportunities. For other industries, such as beef and sheep meat, their product will either be diverted from an export market onto the growing domestic market or the combination of demand pull from the export and local markets may trigger greater production and therefore a greater demand for feed grains to service these markets.
To illustrate the important role played by population growth in the derived demand for feed grain, consider the example of poultry meat consumption, noting that less than 1% of all chicken meat and products sold in Australia are imported. Australia’s per capita consumption of poultry meat is 48.8kg (Figure 10), on a carcass weight basis (ABARES, 2018). Poultry meat consumption has been strongly trending upwards over several decades (Figure 10). Assuming that trend continues, albeit at a slightly lesser rate, then by 2030 poultry meat per capita consumption could be 55kg. The dressed weight (i.e. carcass weight) of a chicken is about 75% of its liveweight, and about 1.8kg of grain feed is required to produce a kilogram of liveweight for chickens (see Table 1). Hence, about 2.4kg of grain feed is required to produce a kilogram of carcass weight. By 2030 the additional grain feed requirements of Australia’s chicken meat industry attributable to population gain and slightly increased per capita consumption will be between 0.91mmt and 1.02mmt.
Another example is the egg industry. Data contained in various annual reports of the Australian Egg Corporation reveal that, particularly since the early 2000s, there has been a strong upward trend in the per capita consumption of eggs. In the 1990s consumption ranged between 145 to 180 eggs per person, then throughout the 2000s and continuing into current years, per capita consumption has increased to around 245 eggs per person. It takes around 2.3kg of feed to produce a kilogram of eggs, so to produce the 245 eggs currently consumed by each person requires about 28.2kg of feed. Hence, assuming the upward trend, albeit at a lesser rate, in per capita consumption of eggs continues towards 2030 then by 2030 255 eggs per person will be consumed. The likely additional feed grain quantity required for egg production in 2030 will be in the range of 0.15mmt to 0.17mmt. Similar estimates for other industries are presented in Table 3.
Per capita consumption of pork in Australia has been increasing steadily (Figure 10). As pork production is underpinned by grain-feeding, the expectation would be that additional feed grains would be required by 2030 to support the growing domestic demand for pork. However, the pork industry in Australia has been much affected by the ability to import pork meat, such that imports equate to 80 per cent of Australia’s pork production (ABARES, 2018). Net imports now account for around 70 per cent of Australians’ pork consumption. If this important role of imported pork continues towards 2030 then the Australian pig industry’s demand for feed grain will be far less than otherwise would be the case if such imports greatly declined. In this report, we assume the importation of pork will continue but production efficiency gains in the Australian pork industry will lower net imports to around 50 per cent of Australians’ pork consumption.

AEGIC | Australia’s Grain Outlook 2030 19
The recent serious outbreak of African swine fever in China, and their subsequent culling of infected pigs will support the enlarged domestic market share of local pig production in Australia. China will increase its imports of pork, yet because Australia neither has pig meat export protocols with China nor a sufficient volume of potential exportable surpluses, China will import pork from major European and North American exporters. Hence, some European pork that ordinarily would have been exported to Australia instead will now flow to China, relieving some competitive pressure on the Australian pork industry. If the Australian pork industry can maintain its competitive strength against pork imports then the Australian industry will draw on more local feed grains. Already observed in the Australian pork industry is a shift in production to regions where feed grain production is more reliable and affordable. For example, Victoria’s and South Australia’s share of national pork production is gradually increasing, underpinned by feed grain production in those regions. The result of these trade and structural changes in the pig industry is that we estimate the industry’s demand for feed grains to increase by between 0.5mmt and 0.55mmt by 2030
Increasing health consciousness among Australians will likely ensure their increased per capita consumption of seafood. In Australia’s domestic seafood market Australian product competes with Asian imports such as aquaculture prawns from Thailand and aquaculture finfish (basa) from China (Mobsby and Koduah, 2017). Nonetheless, the volume of farmed aquaculture products in Australia has grown at an average annual rate of 6 per cent from 2005/6 to reach 97,046 tonnes in 2015/16. Aquaculture draws on local feed supplies, so the combination of population increase and higher per capita consumption of aquaculture products will increase the demand for aquafeeds.
The components of the calculations for feed grain use in the chicken, pork and egg industries are outlined in Appendix One.
Table 3 Additional feed grain required at 2030 for various industries with a domestic focus
Additional feed grain use (mmt)
Poultry meat 0.91–1.02Eggs 0.15–0.17Pork 0.65–0.72Dairy 0.06–0.08Horse 0.07–0.09Aquaculture 0.04Other 0.019
To satisfy the feed grain demand growth in the industries listed in Table 3 will require the supply of an additional 1.88mmt to 2.12mmt of feed grains. Between 2008/9 to 2017/18, Australia produced on average 45mmt of winter and summer crops. To satisfy the additional demand for feed grains listed in Table 3 will require around a 5 per cent increase in Australia’s crop production. An important assumption is that Australia will not increase its importation of feed grains, mostly soybean meal. If Australia does increase both its grain production and feed grain imports, then more grain will be available for export than estimated in this report. In addition, we assume that Australia’s share of pork consumption based on imported pork will lessen. If this does not occur and Australia is increasingly reliant on imported pork, then the domestic demand for feed grain will be less than estimated here, and export grain volumes will be more than reported here.
The production prospects for sheep, beef and dairying are more uncertain relative to the other livestock industries as many factors affect their growth prospects. For example, animal welfare issues continue to discourage the export of live animals, especially sheep. Any shift in government policy that further restricts or forbids the export of live sheep is likely to discourage sheep

AEGIC | Australia’s Grain Outlook 2030 20
production in WA (the main source of live sheep exports and home to over 20 per cent of the national flock). Further reduction of the national flock would raise the price of local sheepmeat relative to chicken and pork; and further discourage local consumption of sheepmeat. A reduction in the national flock could lessen the feed grain demand of the sheep industry. However, record saleyard prices for sheep and sustained high prices for wool in recent years provide strong price incentives for farmers to increase their production of sheepmeat and wool, suggesting a gradual rebuild of Australia’s sheep flock (Figure 13), even against the backdrop of uncertainty surrounding live sheep exports.
CattleSheep
180
160
140
120
100
80
60
40
20
0
1974-75
1976-77
1978-79
1980-81
1982-83
1984-85
1986-87
1988-89
1990-91
1992-93
1994-95
1996-97
1998-99
2000-01
2002-03
2004-05
2006-07
2008-09
2010-11
2012-13
2014-15
2016-17
Num
ber
of a
nim
als
(mill
ion)
Figure 13Size of Australia’s cattle herd and sheep flock since 1974/75
Source: Based on data in ABARES (2018)
Similarly, the national beef herd has been remarkably stable (Figure 13), yet a lift in cattle meat prices on export and local markets in recent years is providing a strong incentive to increase the size of the national herd. Towards 2030, for both sheep and beef, the likely prospect is for a very gradual re-build of national stock numbers. Consequently, the additional demand for feed grain in beef and sheep production will be moderate. Currently feed grain use for beef and sheep production is 3.91mmt and 0.31mmt respectively (Table 2). By 2030, a 10 per cent increase in the beef and sheep population in Australia will create additional demand for feed grains of around 0.33mmt and 0.03mmt respectively. The demand for feed grains in the sheep industry may increase if there is a stronger focus on lamb production with finishing of lambs using grain-feeding.
For dairying, two-thirds of Australia’s milk output comes from Victoria and nationally, cow numbers and milk output have been mostly constant at around 1.62 million and 9,360 million litres respectively. Per capita consumption of fresh milk is stable at around 102 litres per person per annum, and cheese, butter and yoghurt consumption is increasing gradually. Even with further growth in Australia’s population and some further increase in the per capita consumption of some dairy products, the feed use by Australian dairying is not expected to change substantially. In 2017/18 feed grain use was 2.63mmt. If feed grain use towards 2030 does increase in dairying then the estimates of the exportable surplus of Australian grain reported below will be even lower, assuming there is no increased importation of feed grains.
Accounting for all the above-mentioned trends and influences likely to affect the domestic demand for feed grain then, by 2030, the demand for feed grains in Australia is likely to increase by between 2.24mmt and 2.48mmt. Of course, in some years, due to drought, larger volumes of feed grains will be required to support beef cattle, dairying and extensive sheep grazing enterprises.
AEGIC | Australia’s Grain Outlook 2030 21
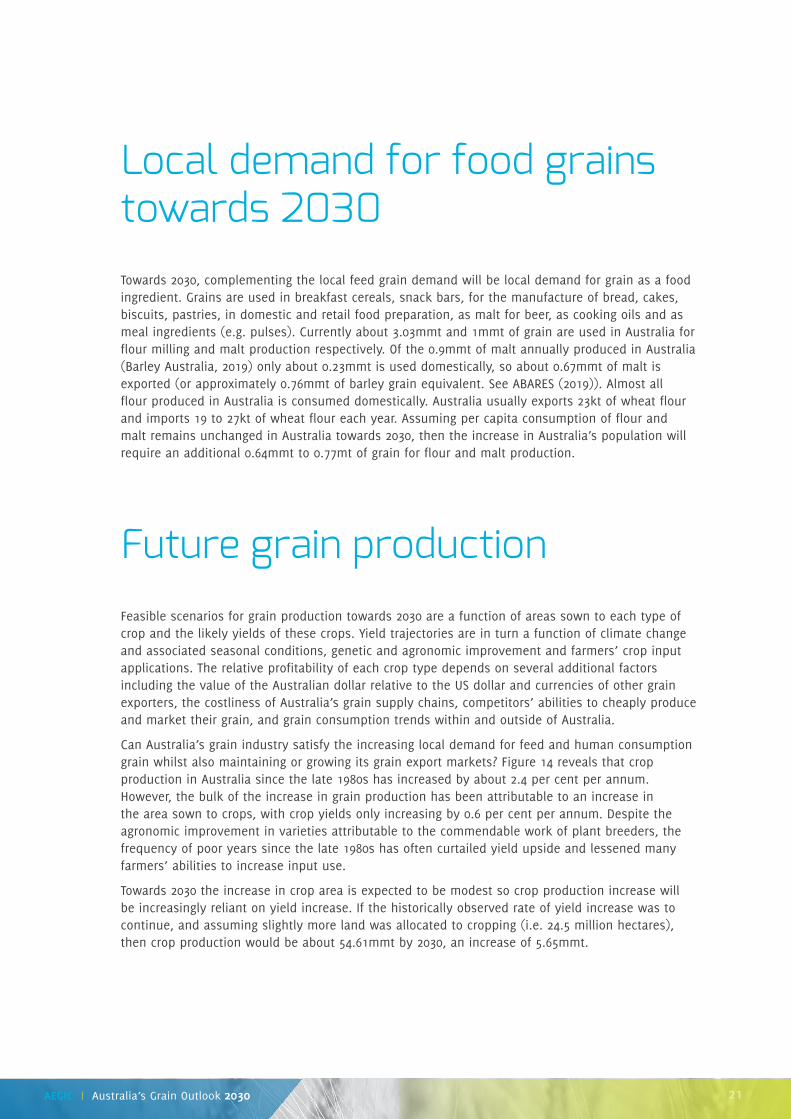
Local demand for food grains towards 2030Towards 2030, complementing the local feed grain demand will be local demand for grain as a food ingredient. Grains are used in breakfast cereals, snack bars, for the manufacture of bread, cakes, biscuits, pastries, in domestic and retail food preparation, as malt for beer, as cooking oils and as meal ingredients (e.g. pulses). Currently about 3.03mmt and 1mmt of grain are used in Australia for flour milling and malt production respectively. Of the 0.9mmt of malt annually produced in Australia (Barley Australia, 2019) only about 0.23mmt is used domestically, so about 0.67mmt of malt is exported (or approximately 0.76mmt of barley grain equivalent. See ABARES (2019)). Almost all flour produced in Australia is consumed domestically. Australia usually exports 23kt of wheat flour and imports 19 to 27kt of wheat flour each year. Assuming per capita consumption of flour and malt remains unchanged in Australia towards 2030, then the increase in Australia’s population will require an additional 0.64mmt to 0.77mt of grain for flour and malt production.
Future grain productionFeasible scenarios for grain production towards 2030 are a function of areas sown to each type of crop and the likely yields of these crops. Yield trajectories are in turn a function of climate change and associated seasonal conditions, genetic and agronomic improvement and farmers’ crop input applications. The relative profitability of each crop type depends on several additional factors including the value of the Australian dollar relative to the US dollar and currencies of other grain exporters, the costliness of Australia’s grain supply chains, competitors’ abilities to cheaply produce and market their grain, and grain consumption trends within and outside of Australia.
Can Australia’s grain industry satisfy the increasing local demand for feed and human consumption grain whilst also maintaining or growing its grain export markets? Figure 14 reveals that crop production in Australia since the late 1980s has increased by about 2.4 per cent per annum. However, the bulk of the increase in grain production has been attributable to an increase in the area sown to crops, with crop yields only increasing by 0.6 per cent per annum. Despite the agronomic improvement in varieties attributable to the commendable work of plant breeders, the frequency of poor years since the late 1980s has often curtailed yield upside and lessened many farmers’ abilities to increase input use.
Towards 2030 the increase in crop area is expected to be modest so crop production increase will be increasingly reliant on yield increase. If the historically observed rate of yield increase was to continue, and assuming slightly more land was allocated to cropping (i.e. 24.5 million hectares), then crop production would be about 54.61mmt by 2030, an increase of 5.65mmt.

AEGIC | Australia’s Grain Outlook 2030 22
y = 1.5449e0.0062x
R2 = 0.0691
y = 23.556e0.0236x
R2 = 0.4562
3.0
2.5
2.0
1.5
1.0
0.5
0
70
60
50
40
30
20
10
0
1987
-88
1988
-89
1989
-90
1990
-91
1991
-92
1992
-93
1993
-94
1994
-95
1995
-96
1996
-97
1997
-98
1998
-99
1999
-00
2000
-01
2001
-02
2002
-03
2003
-04
2004
-05
2005
-06
2006
-07
2007
-08
2008
-09
2009
-10
2010
-11
2011
-12
2012
-13
2013
-14
2014
-15
2015
-16
2016
-17
2017
-18
Crop
yie
ld (
t/ha)
Crop
pro
duct
ion (
mm
t)
Crop production
Exponent (Crop yield)
Crop yield
Exponent (Crop production)
Figure 14Crop production and crop yield in Australia since 1987/78
Source: Based on data in ABARES (2018)
Australia’s exportable surplus of grain towards 2030In summary, the estimated increase in domestic demand for feed grain in 2030 requires an additional 2.24mmt to 2.48mmt, assuming no additional volumes of feed grains are imported and assuming pork importation continues. In addition, local flour milling and malt production, to serve the growing domestic market, will require access to an additional 0.64mmt to 0.77mmt of wheat and barley.
The estimated increase in grain production in Australia by 2030 is 5.65mmt, of which only 2.4mmt to 2.77mmt is available for export. An important implication is that Australia’s domestic requirements for grain will become increasingly important, especially in eastern Australia where most of the population increase and greater demand for feed grains, flour and malt will occur. Australia’s domestic market will consume over half of all the increase in Australia’s grain production towards 2030. The domestic market’s increased grain demand mostly will be for feeding animals.
Given the spatial distribution of grain production and population in Australia, grain production in eastern Australia is likely to focus increasingly on domestic feed market opportunities. By contrast, in less populous regions like South Australia and Western Australia the focus will remain on export markets, supplemented by opportunistic grain sales to eastern Australia, generated by adverse seasonal conditions in eastern Australia.

AEGIC | Australia’s Grain Outlook 2030 23
In Australia, future domestic demand for grain and the future supply of grain are not closely spatially aligned, principally due to three-quarters of Australia’s population residing in eastern Australia. The growing relative importance of the east coast demand for grain towards 2030 can be illustrated by assuming that three quarters of the additional demand for feed grains in Australia will come from the east coast and the same proportion would apply to grain required for flour and malt production. This would mean that by 2030 an additional 2.16mmt to 2.44mmt would be demanded by the east coast domestic market. If eastern Australia maintains its share of Australian grain production towards 2030, then the additional grain production in eastern Australia will be 2.71mmt. In other words, almost all of the additional grain production in eastern Australia towards 2030 will need to flow to the east coast domestic market to satisfy its demand for feed grain and grain for food and beverage purposes.
By contrast, for Western Australia and South Australia, their States’ domestic demand only requires between 0.72mmt and 0.81mmt to be produced, yet if these States retain their share of national grain production then by 2030 they will produce an additional 2.94mmt. This means an additional exportable surplus from these States of between 2.13mmt and 2.22mmt. This additional volume of grain, able to flow to export markets, will help lower their regions’ unit supply chain costs, as those costs are mostly volume-based.
Already the relative importance of feed grain demand in eastern Australia is seen in the share of crops grown in eastern Australia versus Western Australia and South Australia (Figure 15). In eastern Australia there is a greater production emphasis on coarse grains and pulses.
It will be interesting to see how farmers in eastern Australia respond to the change in market conditions towards 2030. The production and storage of feed grains is likely to become commercially more attractive, especially while interest rates remain low. Wheat’s share of the crop mix may lessen, and the types of wheat grown may change. The likelihood of little additional exportable grain surpluses being produced in eastern Australia towards 2030 has other important implications for the use and ownership of export infrastructure (e.g. export grain terminals) and road and rail services to ports. The inland rail, due for completion around 2025, could play a key role in facilitating regional grain flow to ease drought impacts.
Worth noting is how the export quality of Australia’s main export crop, wheat, may change towards 2030. If eastern Australia increasingly focuses on feed grain production and the domestic food market, then an increasing proportion of the nation’s wheat exports are likely to come from increased wheat production in Western Australia and South Australia. These States produce a different mix of wheat classes to eastern Australia and so the export quality profile of Australian wheat will alter. Australia is unlikely, for example, to be a reliable exporter of increasing volumes of high protein wheat (APH and AH classes). By contrast, greater export volumes of APW and ASW are likely to be available from Western Australia and South Australia.
Coarse grains
East coast(NSW, Qld and Vic)
WheatPulsesOilseeds
WA and SA
Figure 15The mix of crops in eastern Australia (NSW, QLD, Vic) versus WA and SA — based on the 5-year average 2013/14 to 2017/18

AEGIC | Australia’s Grain Outlook 2030 24
CaveatsThe assumption of increases in grain yields commensurate with the rate observed since the late 1980s is a bold assumption, given the projections for further adverse climate change affecting crop production, especially in southern Australia. Hochman et al. (2017), for example, examined simulated wheat yields at sites across Australia with high quality weather data and found that the water-limited yield potential at those sites declined by an average 27% over a 26 year period from 1990 to 2015. Importantly, they found that despite the adverse trend in climate, an unprecedented rate of technology-driven gains was closing the gap between actual and water-limited potential yields by 25kg/ha/yr and so expected yield decline was not observed in practice. In addition, some clearly superior, higher yielding crop varieties have been bred and widely adopted over the last decade. Whether towards 2030 on-going plant breeding and agronomic improvements more than offset the projected adverse trend in climate in Australia’s grain-growing regions is unknown.
Although Hochman et al. (2017) identified that the yield gap is closing in Australia, nonetheless in a separate study Hochman and Horan (2018) found that further agronomic practice change by Australian farmers could potentially further lift wheat yields. They identified sub-optimal practices in fertiliser applications, tillage, weed control and the timeliness of crop sowing. Addressing these inadequacies could increase crop yields towards 2030.
Stephens (2017) examined the projected adverse trend in climate. He reviewed weather station historical data across Australia and concluded that a shift is occurring in Australia’s climatic zones. He identified the following shifts across Australia (see Figure 16):
• The summer dominant rainfall region has shifted south from near Longreach to Charleville,
• The summer rainfall zone has shifted south from Gunnedah towards Dubbo,
• The uniform rainfall zone has shifted southwest from southern New South Wales into central Victoria, while in Western Australia the uniform rainfall zone has shifted west from Kalgoorlie to Southern Cross.
• The winter rainfall zone in the southwest of Western Australia has shifted southwest leaving a smaller winter dominant zone along the west coast.
The ramification of these spatial shifts in climatic classes is greater crop intensification in southern and more coastal regions and a more variable grain production in the drier, marginal parts of Australia’s grain belt. The aggregate impact of these shifts, when combined with plant breeding improvements and technology innovation towards 2030, is difficult to gauge. What is certain is that yield improvement will be increasingly difficult due to the decline in growing season rainfall and more frequent extreme temperatures during grain-filling in many traditional grain-growing regions of Australia.
Other important caveats arise from uncertainty in the magnitude of demand for feed grains in key sectors like the beef and dairy sector. Seasonal conditions and expansion or contraction in export market opportunities can greatly alter the demand for feed grains in these sectors. Exactly how those important influences may change towards 2030 is not known, suffice to say that their use of feed grain is expected to expand rather than contract, restricting the volume of grain available for export.
Lastly, an important assumption underlying the estimates of the exportable surplus at 2030 is that Australia will not increase its importation of feed grains, mostly soybean meal. If Australia does increase both its grain production and feed grain imports, then more grain will be available for export than estimated in this report.

AEGIC | Australia’s Grain Outlook 2030 25
Figure 16The spatial shift in Australia’s climate classes

AEGIC | Australia’s Grain Outlook 2030 26
ReferencesABARES (2018) Australian Commodity Statistics, 2018. Available at: http://www.agriculture.gov.au/abares/research-topics/agricultural-commodities/agricultural-commodities-trade-data#2018
ABARES (2019) Australian Crop Report, June 2018. Data available at: http://www.agriculture.gov.au/abares/research-topics/agricultural-commodities/agricultural-commodities-trade-data#australian-crop-report-data
ABS (2018) Population Projections, Australia. Available at: https://www.abs.gov.au/ausstats/[email protected]/latestProducts/3222.0Media%20Release12017%20(base)%20-%202066
ABS (2019) Australia’s population growth remains steady. Available at: https://www.abs.gov.au/ausstats/[email protected]/latestProducts/3101.0Media%20Release1Sep%202018
Alexander, P., Brown, C., Arneth, A., Finnigan, J., and Rounsevell, M. D. (2016) Human appropriation of land for food: the role of diet. Global Environmental Change 41, 88-98. Available at: http://www.sciencedirect.com/science/article/pii/S0959378016302370?via%3Dihub#bib0330
Barley Australia (2019) Malt in Australia. Available at: https://www.barleyaustralia.com.au/malt
Chambers, N. (2008) A feasibility analysis of once-a-day feed delivery for Australian feedlots. Final Report to Meat & Livestock Australia.
CSIRO (2019) Growth opportunities for Australian food and agribusiness. CSIRO, pp. 42.
Dalton, G. and Keogh, M. (2007) The implications for Australian agriculture of changing demand for animal protein in Asia, Research Report, Australian Farm Institute, Surry Hills, Australia.
Hochman, Z., Gobbett, D. and Horan, H. (2017) Climate trends account for stalled wheat yields in Australia since 1990. Global Change Biology 3, 2071-2081.
Hochman, Z. and Horan, H. (2018) Causes of wheat yield gaps and opportunities to advance the water-limited yield frontier in Australia. Field Crops Research 228, 20-30.
Kingwell, R. (2019) Follow the mouths — just head to the coast, AEGIC Blog. Available at: https://www.grainsinnovation.org/blog/2019/7/29/32-follow-the-mouths-just-head-to-the-coast
Mobsby, D. and Koduah, A. (2017) Australian fisheries and aquaculture statistics 2016, Fisheries Research and Development Corporation project 2017-095. ABARES, Canberra, December.
Morgan, R. (2016) The slow but steady rise in vegetarianism in Australia. Roy Morgan Research.
OECD-FAO (2019) Agricultural Outlook 2017-2026 : MEATS – OECD-FAO Agricultural Outlook 2017-2026. OECD _ FAO data
Spragg, J. (2018) Feed grain supply and demand report 2018: A report for the Feed Grain Partnership: JCSSolutions Pty Ltd.
Stephens, D. (2017) Australia’s changing climate: implications for wheat production. Agrometeorology Australia. Guest Blog for AEGIC. Available at: https://www.grainsinnovation.org/blog/2017/10/2/australias-changing-climate-implications-for-wheat-production
Sui, Z., Raubenheimer, D. and Rangan, A. (2017) Consumption patterns of meat, poultry, and fish after disaggregation of mixed dishes: secondary analysis of the Australian National Nutrition and Physical Activity Survey 2011– 12. BMC Nutrition 3:52-63.
http://www.agriculture.gov.au/abares/research-topics/agricultural-commodities/agricultural-commoditi
http://www.agriculture.gov.au/abares/research-topics/agricultural-commodities/agricultural-commoditi
http://www.agriculture.gov.au/abares/research-topics/agricultural-commodities/agricultural-commoditi
http://www.agriculture.gov.au/abares/research-topics/agricultural-commodities/agricultural-commoditi
http://www.agriculture.gov.au/abares/research-topics/agricultural-commodities/agricultural-commoditi

AEGIC | Australia’s Grain Outlook 2030 27
Appendix One
Feed grain calculation for additional chicken meat production in 2030
(Population in 2030 minus population in 2018) * per capita consumption in 2030 (i.e. kg/person) * feed required to produce a kilogram of carcass weight
= (29.17-25.1)*55*2.4/1000
Plus
Population in 2018 * increase in per capita consumption in 2030 vs 2018 (i.e. kg/person) * feed required to produce a kilogram of carcass weight
= 25.1*(55-48.8)*2.4/1000
Feed grain calculation for additional pork production in 2030
In recent years 70% of domestic pork consumption (i.e. including processed meats) has come from net imports so far less domestic feed grains have been required to support Australians’ pork consumption than might otherwise be envisaged. Towards 2030 we assume a greater role for domestic pork production such that 50% of the potentially required additional feed grain will be required relative to the case where Australia was self-sufficient in pork production.
((Population in 2030 minus population in 2018) * per capita consumption in 2030 (i.e. kg/person) * feed required to produce a kilogram of carcass weight) * 0.5
= ((29.17-25.1)*33*5/1000) * 0.5
Plus
Population in 2018 * increase in per capita consumption in 2030 vs 2018 (i.e. kg/person) * feed required to produce a kilogram of carcass weight
= (25.1*(33-28)*5/1000) * 0.5
Feed grain calculation for additional egg production in 2030
(Population in 2030 minus population in 2018) * per capita consumption in 2030 (i.e. eggs/person) * weight of an egg (kg) * feed required to produce a kilogram of eggs
= (29.17-25.1)*(255)*(50/1000)*2.3/1000
Plus
Population in 2018 * increase in per capita consumption in 2030 vs 2018 (i.e. eggs/person) * weight of an egg (kg) * feed required to produce a kilogram of eggs
= 25.1*(255-245)*(50/1000)*2.3/1000