Australia's health 2000 (full publication) (AIHW)
492
The seventh biennial health report of the Australian Institute of Health and Welfare Australian Institute of Health and Welfare Canberra AIHW Cat. No. 19
-
Upload
khangminh22 -
Category
Documents
-
view
4 -
download
0
Transcript of Australia's health 2000 (full publication) (AIHW)

The seventh biennial health report of the Australian Institute of Health and Welfare
Australian Institute of Health and WelfareCanberra
AIHW Cat. No. 19
00 AH2000 prelims Page i Thursday, June 1, 2000 2:07 PM

ii AustraliaÕs Health 2000
TRIM SIZE 175 mm Wide x 250 mm Deep
© Australian Institute of Health and Welfare 2000
This work is copyright. Apart from any use as permitted under the Copyright Act 1968, no partmay be reproduced without written permission from the Australian Institute of Health and Welfare.Requests and inquiries concerning reproduction and rights should be addressed to the Head,Media and Publishing Unit, Australian Institute of Health and Welfare, GPO Box 570, Canberra,ACT 2601.
ISBN 1 74024 054 5ISSN 1032-6138
The Australian Institute of Health and WelfareÕs World Wide Web site can be found at:http://www.aihw.gov.au
Suggested citationAustralian Institute of Health and Welfare 2000. AustraliaÕs health 2000: the seventh biennial health report of the Australian Institute of Health and Welfare. Canberra: AIHW.
Australian Institute of Health and WelfareBoard ChairProfessor Janice Reid
DirectorDr Richard Madden
The Institute is AustraliaÕs national health and welfare statistics and information agency, and ispart of the CommonwealthÕs Health and Aged Care portfolio. The InstituteÕs mission is to improvethe health and well-being of Australians by informing community discussion and decision-makingthrough national leadership in developing and providing health and welfare statistics andinformation.
Cover art by Paul Garrett, National Art School, Darlinghurst, NSWCover design by Kate BarryText edited by Janette Whelan Publishing ConsultancyText proofread by Ann ParkinsonLayout by Green Words & Images, CanberraPublished by the Australian Institute of Health and WelfarePrinted by Pirie Printers
00 AH2000 prelims Page ii Thursday, June 1, 2000 2:07 PM

iii
TRIM SIZE 175 mm Wide x 250 mm Deep
The Hon Dr Michael Wooldridge MPMinister for Health and Aged CareParliament HouseCANBERRA ACT 2600
Dear Minister
On behalf of the Board of the Australian Institute of Health and Welfare I am pleased topresent to you AustraliaÕs Health 2000, as required under Subsection 31(1) of theAustralian Institute of Health and Welfare Act 1987.
I commend this report to you as a significant contribution to national information onhealth needs and services and to the development and evaluation of health policies andprograms in Australia.
Yours sincerely
Professor Janice ReidChairperson of the Board25 May 2000
00 AH2000 prelims Page iii Thursday, June 1, 2000 2:07 PM

iv AustraliaÕs Health 2000
TRIM SIZE 175 mm Wide x 250 mm Deep00 AH2000 prelims Page iv Thursday, June 1, 2000 2:07 PM

v
TRIM SIZE 175 mm Wide x 250 mm Deep
Editorial team
Contributors
Amanda Nobbs Andrew Smith Tony Wood (Editor)Alannah Smith
Fadwa Al-Yaman Jacki Grau James MorrisGraham Angus Narelle Grayson Manisha NijhawanTim Armstrong Tony Greville Andrew PhillipsStan Bennett John Harding Indrani Pieris-CaldwellKuldeep Bhatia Jenny Hargreaves Jeanette PopeDavid Braddock Trent Harlow Kaye Roberts-ThomsonHelena Britt James Harrison Krys SadkowskyJoe Christensen Diana Hetzel Ross SaundersBree Cook Tony Hynes Susana SenesMark Cooper-Stanbury Paul Jelfs Janis ShawJoan Cunningham Clara Jellie Geoff SimsJoanne Davies Paul Lancaster Richard SolonMichael de Looper Ros Madden John SpencerCarolyn Dunn Paul Magnus Chris StevensonGerard Fitzsimmons Colin Mathers Kathleen StrongIndra Gajanayake Sushma Mathur Jenny ThomsonDiane Gibson Paul Meyer Ian TitulaerJohn Glover Lynelle Moon Robert van der HoekJohn Goss Maryellen Moore Richard WebbBradley Grant
00 AH2000 prelims Page v Thursday, June 1, 2000 2:07 PM

vi AustraliaÕs Health 2000
TRIM SIZE 175 mm Wide x 250 mm Deep
Referees
The Institute wishes particularly to thank those people from other organisations whohave contributed to AustraliaÕs Health 2000.
Tony Adams Marylon Coates Brian OldenburgTony Barnes Stephen Colaguiri Neville OwenAdrian Bauman Sue Cornes John PaiceLawrie Beilin Margaret Cox Linda PettigroveMichael Bennett Jane Elkington Marelle RawsonAndrew Benson Michael Fett Angela ReddyCarol Bower Brendan Gibson Sid SaxRon Borland Andrew Grulich Dick ScottonCharles Bridges-Webb Lynne Hillier Chris Selby-SmithHelena Britt Anthony Jorm Alison SewellPeter Brooks John Kaldor Neil ThomsonWendy Brown John Leary Andrew TomkinKevin Buckett Geoff Marks Theo VosMargaret Burgess Tony McMichael Mal WaresRob Carter Mike Morgan Vicki WhiteHelen Catchatoor John Moss Ann WoolcockIan Caterson Frank Oberklaid
00 AH2000 prelims Page vi Thursday, June 1, 2000 2:07 PM

vii
TRIM SIZE 175 mm Wide x 250 mm Deep
ContentsEditorial team, contributors and referees . . . . . . . . . . . . . . . . . . . . . . . . . . . . . . . . . . . . iiiPreface . . . . . . . . . . . . . . . . . . . . . . . . . . . . . . . . . . . . . . . . . . . . . . . . . . . . . . . . . . . . . . . . .vii
1 Introduction 1
1.1 Health and its determinants . . . . . . . . . . . . . . . . . . . . . . . . . . . . . . . . . . . . . . . . . . . . 21.2 Implications for improving health. . . . . . . . . . . . . . . . . . . . . . . . . . . . . . . . . . . . . . . 51.3 The role of health information . . . . . . . . . . . . . . . . . . . . . . . . . . . . . . . . . . . . . . . . . . 61.4 The Australian health system. . . . . . . . . . . . . . . . . . . . . . . . . . . . . . . . . . . . . . . . . . . 7
2 The health of Australians 10
2.1 Dimensions and components of health . . . . . . . . . . . . . . . . . . . . . . . . . . . . . . . . . 10Life expectancy and longevity . . . . . . . . . . . . . . . . . . . . . . . . . . . . . . . . . . . . . . . . . . . . . . . . . 11
Self-reported health . . . . . . . . . . . . . . . . . . . . . . . . . . . . . . . . . . . . . . . . . . . . . . . . . . . . . . . . . . 12
Fitness . . . . . . . . . . . . . . . . . . . . . . . . . . . . . . . . . . . . . . . . . . . . . . . . . . . . . . . . . . . . . . . . . . . . . 17
Oral health. . . . . . . . . . . . . . . . . . . . . . . . . . . . . . . . . . . . . . . . . . . . . . . . . . . . . . . . . . . . . . . . . . 19
Sexual health. . . . . . . . . . . . . . . . . . . . . . . . . . . . . . . . . . . . . . . . . . . . . . . . . . . . . . . . . . . . . . . . 26
Immunological health . . . . . . . . . . . . . . . . . . . . . . . . . . . . . . . . . . . . . . . . . . . . . . . . . . . . . . . . 31
2.2 Burden of disease and injury . . . . . . . . . . . . . . . . . . . . . . . . . . . . . . . . . . . . . . . . . . 38Mortality . . . . . . . . . . . . . . . . . . . . . . . . . . . . . . . . . . . . . . . . . . . . . . . . . . . . . . . . . . . . . . . . . . . 39
Illness, morbidity and health conditions . . . . . . . . . . . . . . . . . . . . . . . . . . . . . . . . . . . . . . . . 44
Disability . . . . . . . . . . . . . . . . . . . . . . . . . . . . . . . . . . . . . . . . . . . . . . . . . . . . . . . . . . . . . . . . . . . 48
Australian Burden of Disease and Injury Study. . . . . . . . . . . . . . . . . . . . . . . . . . . . . . . . . . 48
2.3 NHPA diseases and conditions . . . . . . . . . . . . . . . . . . . . . . . . . . . . . . . . . . . . . . . . 55Cardiovascular disease . . . . . . . . . . . . . . . . . . . . . . . . . . . . . . . . . . . . . . . . . . . . . . . . . . . . . . . 55
Cancers. . . . . . . . . . . . . . . . . . . . . . . . . . . . . . . . . . . . . . . . . . . . . . . . . . . . . . . . . . . . . . . . . . . . . 63
Injuries . . . . . . . . . . . . . . . . . . . . . . . . . . . . . . . . . . . . . . . . . . . . . . . . . . . . . . . . . . . . . . . . . . . . . 71
Mental problems and disorders. . . . . . . . . . . . . . . . . . . . . . . . . . . . . . . . . . . . . . . . . . . . . . . . 76
Diabetes . . . . . . . . . . . . . . . . . . . . . . . . . . . . . . . . . . . . . . . . . . . . . . . . . . . . . . . . . . . . . . . . . . . . 84
Asthma. . . . . . . . . . . . . . . . . . . . . . . . . . . . . . . . . . . . . . . . . . . . . . . . . . . . . . . . . . . . . . . . . . . . . 90
2.4 Other major chronic diseases and conditions . . . . . . . . . . . . . . . . . . . . . . . . . . . . 94Chronic obstructive pulmonary disease. . . . . . . . . . . . . . . . . . . . . . . . . . . . . . . . . . . . . . . . . 95
Arthritis and other musculoskeletal disorders . . . . . . . . . . . . . . . . . . . . . . . . . . . . . . . . . . . 97
Nervous system disorders . . . . . . . . . . . . . . . . . . . . . . . . . . . . . . . . . . . . . . . . . . . . . . . . . . . 103
End-stage renal (kidney) disease. . . . . . . . . . . . . . . . . . . . . . . . . . . . . . . . . . . . . . . . . . . . . . 105
Cirrhosis and other chronic liver diseases . . . . . . . . . . . . . . . . . . . . . . . . . . . . . . . . . . . . . . 108
2.5 Communicable diseases . . . . . . . . . . . . . . . . . . . . . . . . . . . . . . . . . . . . . . . . . . . . . 109
00 AH2000 prelims Page vii Thursday, June 1, 2000 2:07 PM

viii AustraliaÕs Health 2000
TRIM SIZE 175 mm Wide x 250 mm Deep
3 Determinants of health 133
3.1 Environmental factors . . . . . . . . . . . . . . . . . . . . . . . . . . . . . . . . . . . . . . . . . . . . . . . 1333.2 Genetic factors . . . . . . . . . . . . . . . . . . . . . . . . . . . . . . . . . . . . . . . . . . . . . . . . . . . . . . 1383.3 Attitudes and beliefs. . . . . . . . . . . . . . . . . . . . . . . . . . . . . . . . . . . . . . . . . . . . . . . . . 1433.4 Lifestyle and behaviour . . . . . . . . . . . . . . . . . . . . . . . . . . . . . . . . . . . . . . . . . . . . . . 1443.5 Biomedical factors . . . . . . . . . . . . . . . . . . . . . . . . . . . . . . . . . . . . . . . . . . . . . . . . . . . 164
4 Health and determinants in population groups 179
4.1 Mothers and babies. . . . . . . . . . . . . . . . . . . . . . . . . . . . . . . . . . . . . . . . . . . . . . . . . . 1794.2 Children and young people. . . . . . . . . . . . . . . . . . . . . . . . . . . . . . . . . . . . . . . . . . . 1844.3 Men and women aged 25 and over . . . . . . . . . . . . . . . . . . . . . . . . . . . . . . . . . . . . 1924.4 Older people . . . . . . . . . . . . . . . . . . . . . . . . . . . . . . . . . . . . . . . . . . . . . . . . . . . . . . . 2004.5 Overseas-born . . . . . . . . . . . . . . . . . . . . . . . . . . . . . . . . . . . . . . . . . . . . . . . . . . . . . . 2044.6 Aboriginal and Torres Strait Islander peoples . . . . . . . . . . . . . . . . . . . . . . . . . . . 2074.7 Socioeconomically disadvantaged . . . . . . . . . . . . . . . . . . . . . . . . . . . . . . . . . . . . . 2184.8 Rural and remote populations . . . . . . . . . . . . . . . . . . . . . . . . . . . . . . . . . . . . . . . . 223
5 Health resources and use of services 232
5.1 Health services funding and expenditure. . . . . . . . . . . . . . . . . . . . . . . . . . . . . . . 2325.2 Cost of diseases . . . . . . . . . . . . . . . . . . . . . . . . . . . . . . . . . . . . . . . . . . . . . . . . . . . . . 2485.3 Private health insurance. . . . . . . . . . . . . . . . . . . . . . . . . . . . . . . . . . . . . . . . . . . . . . 2515.4 Health workforce. . . . . . . . . . . . . . . . . . . . . . . . . . . . . . . . . . . . . . . . . . . . . . . . . . . . 2585.5 Supply and use of health services . . . . . . . . . . . . . . . . . . . . . . . . . . . . . . . . . . . . . 2665.6 Use of medications . . . . . . . . . . . . . . . . . . . . . . . . . . . . . . . . . . . . . . . . . . . . . . . . . . 3015.7 Health promotion and prevention . . . . . . . . . . . . . . . . . . . . . . . . . . . . . . . . . . . . . 3065.8 Health research in Australia . . . . . . . . . . . . . . . . . . . . . . . . . . . . . . . . . . . . . . . . . . 309
6 Health service strategies, performance and monitoring 313
6.1 Issues in health services planning . . . . . . . . . . . . . . . . . . . . . . . . . . . . . . . . . . . . . 3136.2 Emerging and contemporary issues. . . . . . . . . . . . . . . . . . . . . . . . . . . . . . . . . . . . 3166.3 Performance indicators . . . . . . . . . . . . . . . . . . . . . . . . . . . . . . . . . . . . . . . . . . . . . . 3176.4 Service delivery monitoring . . . . . . . . . . . . . . . . . . . . . . . . . . . . . . . . . . . . . . . . . . 321
7 Challenges for national health information 332
7.1 The National Health Information Development Plan. . . . . . . . . . . . . . . . . . . . . 3327.2 Newly emerging information challenges . . . . . . . . . . . . . . . . . . . . . . . . . . . . . . . 3367.3 Major gaps in this report . . . . . . . . . . . . . . . . . . . . . . . . . . . . . . . . . . . . . . . . . . . . . 337
00 AH2000 prelims Page viii Thursday, June 1, 2000 2:07 PM

ix
TRIM SIZE 175 mm Wide x 250 mm Deep
8 Changes in AustraliaÕs disease proÞle: a view of the twentieth century
8.1 General trends in health over the twentieth century . . . . . . . . . . . . . . . . . . . . . 3408.2 Trends in the major causes of death in Australia . . . . . . . . . . . . . . . . . . . . . . . . 345
Statistical tables 365
Methods and conventions 428
Abbreviations 431
Glossary 437
Index 449
00 AH2000 prelims Page ix Thursday, June 1, 2000 2:07 PM

x AustraliaÕs Health 2000
TRIM SIZE 175 mm Wide x 250 mm Deep00 AH2000 prelims Page x Thursday, June 1, 2000 2:07 PM

xi
TRIM SIZE 175 mm Wide x 250 mm Deep
PrefaceWelcome to the seventh edition of AustraliaÕs Health, the two-yearly summary ofinformation on health in Australia. AustraliaÕs Health 2000 is a special edition because itsummarises AustraliaÕs health record at the end of the twentieth century. Yet, like itspredecessors, it provides a contemporary view of health and will be of maximum useover the next 2 years. As always, it contains a mass of factual and objective data toinform community discussion and policy debate on health issues. These include healthstatus (including new information summarising the burden of disease and injury),service provision and performance.
AustraliaÕs Health 2000 follows a more ordered structure than in the past and includessome other special features. Chapter 3 focuses on health determinants, in line with theinterest in population health planning from work being undertaken under the auspicesof the National Public Health Partnership. Chapter 6 brings together information onhealth service strategies and performance, reflecting the interest of AHMAC inmonitoring the performance of the overall health system. As chapter 7 points out, theseare both areas where more information development is needed to complete the picture.
Chapter 8 examines changes in AustraliaÕs disease profile in the twentieth century. Itdraws on work by JHL Cumpston, the first and longest serving head of theCommonwealth Department of Health (from 1921 to 1945) and the most importantfigure in public health in Australia this century, and of HO Lancaster, who examined indetail the Australian mortality experience in the early part of the century. It also draws,directly and indirectly, on a range of contemporary sources illustrating the depth ofknowledge of mortality in Australia right through the century.
The range of contributors is large and many have worked long and hard to produce thisbook. But special mention must go to Diana Hetzel for her work on chapter 8, to GeoffSims for his coordinating effort, and to the editor Tony Wood (as in 1998).
The Institute hopes that AustraliaÕs Health 2000 will find a place on many bookshelvesfor many years to come. On behalf of all the authors I wish readers an enjoyable andrewarding experience.
Richard MaddenDirector
00 AH2000 prelims Page xi Thursday, June 1, 2000 2:07 PM

xii AustraliaÕs Health 2000
TRIM SIZE 175 mm Wide x 250 mm Deep00 AH2000 prelims Page xii Thursday, June 1, 2000 2:07 PM

1
Introduction
1
TRIM SIZE 175 mm Wide x 250 mm Deep
1
Introduction
The twentieth century has seen great changes in the health of Australians. There hasbeen a 20-year gain in life expectancy at birth, and a dramatic fall in the toll ofinfectious disease, offset to an extent by an increase in chronic diseases associated withage. Although most Australians enjoy good health today, some groups in thepopulation continue to suffer poor health, in particular Aboriginal and Torres StraitIslander peoples.
This report is the seventh in the series of biennial reports on health in Australiaproduced by the Australian Institute of Health and Welfare (AIHW). It is broadlystructured along the lines of the conceptual framework for health shown in Figure 1.1.This shows health and wellbeing as the outcome of many causes modified byintervention activities that are supported by human and material resources.
This first chapter discusses what health is, what determines it, and the need for goodinformation on the causes and patterns of health and illness in the community. It alsoincludes an overview of the Australian health system. Chapter 2 reports on the healthstatus of Australians and describes the major diseases and conditions that have animpact on their health. It includes results from the InstituteÕs Australian Burden ofDisease and Injury Study conducted in 1999. Chapter 3 focuses on the environmentaland individual factors that determine health. Chapter 4 discusses the health of particularpopulation groups. Chapter 5 examines the cost of health services, employment in thehealth industry and the provision and use of health services. Chapter 6 looks atstrategies for improving the health of Australians and performance in health servicedelivery. Chapter 7 outlines requirements for health information for a betterunderstanding of current and emerging health issues. Chapter 8 uses mortality data todocument the changes in the disease profile of Australians during the twentieth century.
A wide range of statistical tables is included after chapter 8. These tables include dataon population and fertility as well as health-related information. They includeindicators that have been agreed for reporting under the National Health Priority Areasinitiative of governments, covering cardiovascular health, cancer control, injuryprevention and control, mental health, diabetes mellitus and asthma. Many of the tablesprovide time series information, as well as comparing Australia with other countries.Tables have also been included for some of the figures in the report, for the benefit ofreaders who may wish to examine the data in more detail.
01 AH2000 body Page 1 Thursday, June 1, 2000 3:06 PM

2
AustraliaÕs Health 2000
TRIM SIZE 175 mm Wide x 250 mm Deep
1.1 Health and its determinants
What is health?
Health has several important aspects, and our notions of it continue to develop. Thismeans it cannot be described simply; it needs a range of measures, and it is still difficultto measure fully.
The
Macquarie Dictionary
describes health as Ôthe general condition of the body or mindwith reference to soundness and vigourÕ (Macquarie 1997). In 1946 the World HealthOrganization (WHO) defined health as Ôa state of complete physical, mental and socialwell-being and not merely the absence of disease or infirmityÕ (WHO 1946).
The WHO description applies to an ideal standard of health and can be seen as a goalas much as a definition. However, it remains widely used and along with the Macquarieversion it helps to convey the ideas that:
¥ health is an important part of wellbeing, of how people feel and function, and alsocontributes to social and economic wellbeing;
¥ health is not simply the absence of illness or injury and there are degrees of goodhealth as well as of bad health;
Box 1.1: Australia at a glance
¥ 19 million people, including about 400,000 Indigenous persons (2% of total)
¥ Average life expectancy at birth 81 years for women, 76 for men
¥ Fertility rate below replacement level but at higher end for developed countries
¥ 50,000 years of Aboriginal settlement, 212 of European and other
¥ 6th largest land mass in world, almost same as USA (excluding Alaska)
¥ Lowest population density among developed countriesÑ2 persons per km
2
¥ Climate varied but mainly continental and dry
¥ Highly urbanised, most people living in south-east seaboard region
¥ Many cultural backgrounds, 23% of residents born overseas
¥ Christianity main religion (71%), no religion 17%, Buddhism 1.1%, Islam 1.1%
¥ 76% of 15Ð19-year-olds are at school or other educational institution
¥ Per capita income high, gross domestic product (GDP) 8th among 17 OECD countries
¥ Manufacturing main contributor to GDP (13.2%)
¥ Unemployment under 7% in late 1999
¥ Health expenditure 8.3% of GDP in 1997Ð98
01 AH2000 body Page 2 Thursday, June 1, 2000 3:06 PM

1
Introduction
3
TRIM SIZE 175 mm Wide x 250 mm Deep
¥ for example, the better the health, the better a personÕs energy, reserves, resilienceand capacity to stay that way for a longer life; also, many damaging processes in thebody occur long before symptoms arise; and
¥ health should be seen in a broad social context.
In short, healthy people feel and function well in body and mind and are in condition tokeep doing so for as long as possible.
Information on health must try to take account of the many factors that improve orreduce health and wellbeing, the processes and features of disease, and themanagement of illness and disability. Concepts and measures of health vary with theinterests of those using them, such as researchers, clinical health professionals,administrators, social scientists, health economists and policy makers. Biomedicalconcepts are concerned with the biological processes of health and ill health. Clinicaland epidemiological approaches consider mainly causes, disease, disability, death, lifeexpectancy and years of healthy life. The social sciences focus more on social, emotionaland material wellbeing as well as the quality of life. Health economists and policymakers are interested in information about the efficient and cost-effective use of limitedresources as well as in health outcomes.
Some of these concepts are difficult to measure because they are hard to define clearlyor because the measurement is expensive or technically difficult. For these reasons,much of this report relies on traditional or clinical measures such as death, disease,disability, certain risk factors or life expectancy. These measures either are clear-cut orhave been developed over many years, and some have arisen from the daily activitiesof the health system. Concepts such as ÔwellbeingÕ and Ôquality of lifeÕ are much morechallenging.
What determines and influences health?
Many things determine and influence health. Ideas about the causes of good health anddisease have developed significantly over the past two centuries. Although ill healthwas linked to industrial and urban living in the nineteenth century, the single-causegerm theory of disease came to dominate health sciences well into the twentiethcentury. However, in the twentieth century the rise of chronic diseases, such ascardiovascular disease and several cancers, led to a wider ÔmulticausalÕ view. Researchon populations showed the importance of ÔlifestyleÕ factors such as diet, physicalactivity and cigarette smoking. Disease and health came to be seen as the result of theinteraction of human biology, lifestyle and environmental factors, modified by healthcare (Lalonde 1974). As a further step, there has been increasing attention on the healthof groups, particularly inequalities between groups. This in turn has been linked to thebroad social and economic influences on health and lifestyle.
Figure 1.1 (page 4) shows some current concepts in simplified form. Health, disease anddisability can be seen as the result of a complex interplay of many factors described asindividual or environmental. These causes and effects can be modified to variousdegrees by prevention and health promotion or by treatment and rehabilitation. Suchinterventions are supported by human and material resources, including essentialinformation via research, monitoring and evaluation.
01 AH2000 body Page 3 Thursday, June 1, 2000 3:06 PM

4
AustraliaÕs Health 2000
TRIM SIZE 175 mm Wide x 250 mm Deep
ÔIndividualÕ factors shown in the box at the left of Figure 1.1 are those that can bemeasured in an individualÑalthough they can also be applied to groups and often, aspreviously mentioned, reflect environmental influences. The environmental factors canbe physical, as in landscape and climate; biological, as in vegetation, the food supply,infectious agents and other animal life; and socioeconomic, as in politics, culture,standards of living and the economy. Environmental factors in turn overlap one anotherin many ways and are also influenced by the actions of individuals.
The nature and scale of all these influences carry important implications for what andhow much can be done to improve health. Broad socioeconomic influences can affect allpeople to some extent, but they often act to the further disadvantage of groups withlower education and income. The effects include peopleÕs health risks, knowledge,attitudes, opportunities and behaviour. In more detail they include:
¥ the varying exposure of individuals to risks;
¥ the understanding and attitudes of individuals in relation to prevention, and to illhealth and its treatment;
¥ the willingness and ability of those individuals to look after their own health and alsoto obtain and follow professional help when needed; and
¥ the quality of that professional help and the ease of access to it.
These features will also vary according to factors such as age, sex, occupation andlocation. Other factors include marital status and social support or isolation. Age andsex are the largest single determinants of health but all factors have social andpsychological aspects.
Figure 1.1: A conceptual framework for health
Determinants of health
EnvironmentalPhysicalChemicalBiologicalSocialEconomicCulturalPolitical
IndividualGenetic contributionAttitudes and beliefsLifestyle and behaviourBiomedical factors
Interventions
Prevention and health promotionTreatment and careRehabilitation
Resources(inputs)
ResearchEvaluationMonitoringOther informationFinancialMaterialHuman
Disability(functional limitations)
DiseaseImpairments Symptoms Injuries
Health and wellbeing
01 AH2000 body Page 4 Thursday, June 1, 2000 3:06 PM

1
Introduction
5
TRIM SIZE 175 mm Wide x 250 mm Deep
1.2 Implications for improving health
Despite AustraliaÕs generally good health and major improvements over the twentiethcentury, there is still great scope for further gains. This can be seen from the previousdiscussion and from information in later chapters of this book:
¥ large and rapid improvements have already been shown to occur and in some areasseem likely to continueÑfor example, falling death rates from heart attack andstroke, two of the greatest killers;
¥ awareness of the numerous biological, behavioural, social and economic factors thatincrease the risk of ill health that can be prevented or modified, and that are presentlyat high levels among many individuals and groups;
¥ the example of some countries that much lower levels of some diseases are possible,suggesting what Australia can aim to achieve, for example in the area of death ratesfrom heart attack and several cancers;
¥ the relatively poor health (and therefore scope to improve) of those at a socio-economic disadvantage, most notably Aboriginal and Torres Strait Islander peoples;
¥ growing recognition of the contribution to the burden of disease of morbidity as well asmortality, and the identification of major sources of morbidity such as depression; and
¥ constant advances in health research and technology, producing better diagnosis andtreatment.
Health interventions can occur at many levels. These can range from clinical andpreventive attention to individuals through to efforts to improve the physical, social andeconomic environment for special groups or the community as a whole. As well asseeking to reduce peopleÕs exposure to risks, some strategies aim to help individualsdevelop personal skills to exercise more control over their own health and environmentsand to make healthy choices.
Given the great range of influences on health, many major improvements require astrong partnership between public health and clinical care and also that the healthsector work with other sectors to make the best use of limited resources. This furtherrequires that other sectors take into account the possible health impact of theirdecisions. Improvements in health technology and an ageing and more health-conscious population have also led to growing demands on health and treatmentservices. Expectations are also increasing in other areas of peopleÕs lives, so there arecompeting interests both within the health sector and between it and other sectors.
Much of this further gain can be achieved under present social and economic conditions.Improvements have occurred among all the major Australian socioeconomic groups,even though there are continuing large inequalities between them in their levels ofhealth. However, to achieve the full scope of improvement also requires significant socialchanges such as reducing educational and economic disadvantage. These changes can beseen as one of the great aims of society for reasons that include not only health (in itsnarrower sense), but also other benefits. They are already the subject of much action;they clearly extend far wider than the activities of the health sector and they requiremajor and sustained effort from many areas of society.
01 AH2000 body Page 5 Thursday, June 1, 2000 3:06 PM

6
AustraliaÕs Health 2000
TRIM SIZE 175 mm Wide x 250 mm Deep
The information on the great potential for improvement and how it might be achievedgives scope for a strategic approach in Australia towards sustainable gains. However,the major issues involved always require value judgments, and often include politicalprocesses because of competing interests. Along with limited resources, the situationinvolves choices, priority setting and trade-offs between the health sector and othersectors, between prevention and treatment services, and between the short term andlonger term.
1.3 The role of health information
Valid and reliable health information is fundamental to developing effective healthpolicies and programs, for general health-system development and to further the broadresearch and development effort (WHO 1996). The information needs to cover thepatterns and trends of health and illness in Australia, the determinants of health and illhealth, population health activities and clinical medical care (including primary healthcare). It is also required for a range of population groups.
Even where health care is delivered by private rather than by government providers,there are often public policy issues to do with funding (e.g. Medicare) or with managingthe relationship between care systems. Health care management uses information aboutpatients and their diagnoses or problems. It is also concerned with the nature ofservices provided and their cost, quality and effectiveness. Employment and traininginformation supports health labour force planning. There is increasing focus on theinteraction of care settings, particularly where different services are accessed by thesame patient as part of a complete episode of care. The latter information is less welldeveloped at present.
In the area of public health, information is required for:
¥ monitoring trends in the health and wellbeing of the community;
¥ similarly monitoring the determinants of that health and wellbeing;
¥ helping to determine priorities for public health interventions;
¥ identifying emerging issues that may require interventions;
¥ contributing to the design (or redesign) and management of interventions; and
¥ monitoring the effects of public health interventions.
Analysing disease prevalence and other data to estimate the burden of disease(reported in this edition of
AustraliaÕs Health
for the first time) and cost-effectiveness ofinterventions helps to shape decisions about priorities for interventions and forresearch, as does information about the equity of distribution of health and access tohealth services.
Increasing attention is being given to structuring and coordinating health information tosupport decision making. The National Health Information Agreement, made in 1993between Commonwealth, State and Territory health agencies, the Australian Bureau ofStatistics and the Australian Institute of Health and Welfare, now includes the Health
01 AH2000 body Page 6 Thursday, June 1, 2000 3:06 PM

1
Introduction
7
TRIM SIZE 175 mm Wide x 250 mm Deep
Insurance Commission. A major product of this agreement is the
National Health DataDictionary
(AIHW 1999) which is updated annually to provide standards for nationalhealth information and to be a guide for health data gathering generally.
The agreement also provides mechanisms for extending the range of informationavailable into areas of high priority. In this regard
The Aboriginal and Torres Strait IslanderHealth Information PlanÉThis Time LetÕs Make It Happen
(AHMAC & AIHW 1998) is animportant example of a commitment to use health information to focus attention onimportant health needs.
The role of health information does not stop at informing decision makers in policy,administrative or service provider roles. Regular wide dissemination of new healthinformation enables people to be informed about the issues behind public debate abouthealth and health services and to make judgments about health and their ownwellbeing.
1.4 The Australian health system
Individual Australians and families and health care professionals are partners inseeking good health and high-quality treatment. PeopleÕs decisions about lifestyle, self-care, and seeking and acting on professional help, and their participation in thedevelopment of public policy at many levels, all contribute to shaping the Australianhealth system. Increasingly, detailed information is available to and accessed byindividuals, especially via the Internet.
The Australian health system is complex, with many types and providers of services anda range of funding and regulatory mechanisms. Those who provide services includemedical practitioners, other health professionals, hospitals, and other government andnon-government agencies. Funding is provided by the Commonwealth (Federal)Government, State and Territory Governments, health insurers, individual Australiansand a range of other sources.
The CommonwealthÕs funding includes two national subsidy schemes, Medicare andthe Pharmaceutical Benefits Scheme. These schemes cover all Australians and subsidisetheir payments for medical services and for a high proportion of prescriptionmedications bought from pharmacies. The Commonwealth and State Governments alsojointly fund public hospital services so they are provided free of charge to patients.Between them, these three funding provisions aim to give all Australians, regardless oftheir personal circumstances, access to adequate health care at an affordable cost or nocost. These arrangements have become a central feature of AustraliaÕs health systemduring the last 25 years.
Many patientsÕ first contact with the health system is through a general medicalpractitioner (GP). Patients can choose their own GP and are reimbursed for all or part ofthe GPÕs fee by Medicare, depending on the GPÕs billing arrangements.
AustraliaÕs Health
now reports on reasons for the attendances and actions arising from them. For specialisedcare, patients can be referred to specialist medical practitioners, other healthprofessionals, hospitals or community-based healthcare organisations. These community-
01 AH2000 body Page 7 Thursday, June 1, 2000 3:06 PM

8
AustraliaÕs Health 2000
TRIM SIZE 175 mm Wide x 250 mm Deep
based services, some of which can also be accessed directly by patients, provide mentalhealth, family planning and other specialised care and treatment, usually funded throughMedicare or other government programs.
Australians also visit dentists and other private sector health professionals of theirchoice. Charges are met by the patients themselves, or with support of private healthinsurance, which Australians may purchase for these or hospital services.
Patients can access public hospitals through emergency departments, where they maypresent on their own initiative, or via the ambulance services, or after referral from amedical practitioner. Admitted patients are charged nothing for their treatment, food oraccommodation, unless they choose private treatment. Emergency department andoutpatient services are free.
Australians may also choose to be Ôprivate patientsÕ in hospital, if they use a privatehospital, or choose to be treated as a private patient in a public hospital. Private patientscan choose their own doctor, but the hospitalÕs services, which include accommodationand food, must be paid for by the patient, with or without the support of private healthinsurance, or through other arrangements such as compensation. Medicare subsidisesthe fees charged by doctors for services provided to private patients in hospitals, andprivate health insurance funds also contribute towards medical fees for insuredpatients. No-gap or known-gap arrangements are increasingly being agreed on betweenhospitals and insurers.
The health service system is regulated in various ways. Private hospitals are licensed byState and Territory Governments. Medical practitioners and other health professionalsare registered for practice in each State and Territory. The CommonwealthÕs regulatoryroles include overseeing the safety and quality of pharmaceutical and therapeuticgoods and appliances, and regulating the private health insurance industry.
In addition to the services outlined above, the Commonwealth, State and TerritoryGovernments and local governments provide public health services, community healthservices and ambulance services. Public health services include activities to ensure foodquality, immunisation services and other communicable disease control, public healtheducation campaigns, environmental monitoring and control, and screening programsfor diseases such as breast cancer.
Essential support to the health service system is given by many other agencies.Research and statistical agencies provide the information needed for prevention,detection, diagnosis, treatment, care and associated policy. Consumer and advocacygroups contribute to public discussion and policy. Professional associations for medicalpractitioners and other health professionals help set professional standards and clinicalguidelines. Universities and hospitals undertake training of undergraduate andpostgraduate health professionals. Voluntary agencies contribute in various ways,including raising funds for research, running education and health promotionprograms, and coordinating voluntary care.
Although they are not seen as part of the health system, many other government andnon-government organisations play a role because of their influence on health.Departments of transport and the environment, the media and the food industry arejust a few examples.
01 AH2000 body Page 8 Thursday, June 1, 2000 3:06 PM

1
Introduction
9
TRIM SIZE 175 mm Wide x 250 mm Deep
References
AHMAC & AIHW 1998. The Aboriginal and Torres Strait Islander health informationplanÉ this time letÕs make it happen. AIHW Cat. No. HWI 12. Canberra: AIHW.
AIHW 1999. National health data dictionary, version 8.0. AIHW Cat. No. HWI 18.Canberra: AIHW.
Lalonde M 1974. A new perspective on the health of Canadians. Ottawa: InformationCanada.
The Macquarie Dictionary, 3rd ed. 1997. Sydney: The Macquarie Library Pty Ltd,Macquarie University.
WHO 1946. Constitution of the WHO. Reprinted in: Basic documents, 37th ed. Geneva:WHO.
WHO 1996. Investing in health research and development. Report of the ad hoccommittee on health research relating to future intervention options. Geneva: WHO.
01 AH2000 body Page 9 Thursday, June 1, 2000 3:06 PM

10
AustraliaÕs Health 2000
TRIM SIZE 175 mm Wide x 250 mm Deep
2
The health of Australians
International comparisons show that Australians enjoy good health, and that theunderlying health trends are broadly in step with health improvements occurringelsewhere, particularly in other developed countries (AIHW: de Looper & Bhatia 1998).However, there are significant interpopulation differences in health outcomes withinAustralia.
This chapter reports on the health status of Australians towards the end of the twentiethcentury, and the diseases and conditions affecting them.
There are five broad sections:
2.1 Dimensions and components of health
describes health using indicators such aslife expectancy, self-rated health status, fitness, sexual health, oral health andimmunological health.
2.2
B
urden of disease and injury
outlines aspects of morbidity, disability andmortality in the Australian population. Results from the Australian Burden ofDisease and Injury study have been included to describe the contributions made byvarious diseases and conditions to ill health, disability and premature mortality.
2.3 National Health Priority Area (NHPA) diseases and conditions
reviews theburden of diseases and conditions that have been accorded priority status foraction by Australian Health Ministers. The diseases and conditions covered arecardiovascular diseases, cancers, injuries, mental disorders, diabetes and asthma.
2.4 Other major chronic diseases and conditions
details those chronic, non-communicable diseases that are not currently the focus of the NHPA initiative, butare large contributors to morbidity, disability and mortality in Australia. Some ofthese diseases and conditions are likely to emerge as major health and wellbeingconcerns with the ageing of the population.
2.5 Communicable diseases
provides data on various infectious diseases includinggastrointestinal illness, HIV/AIDS, sexually transmitted diseases, blood-borneinfection, vaccine-preventable diseases and other infections in Australia.
Determinants of health are not discussed in detail here, but are covered in chapter 3.Similarly, the health of various population subgroups in Australia is described inchapter 4.
2.1 Dimensions and components of health
The instinct for survival is the most basic of human traits, and therefore central to anydiscussion of health. However, a view of health in terms of freedom from disease, witha greater emphasis on body functions and structure, the ability to perform core
01 AH2000 body Page 10 Thursday, June 1, 2000 3:06 PM

2
The health of Australians
11
TRIM SIZE 175 mm Wide x 250 mm Deep
activities and participate in society, is likely to provide further insight into variation inhealth outcomes. This section provides brief overviews of various aspects of health, itsdimensions and components.
As well as providing an assessment of life expectancy, there is an overview of healthstatus as rated by Australians themselves. The section also describes variouscomponents of health in a modern settingÑphysical fitness, sexual health, oral healthand immunological health.
Life expectancy and longevity
Long life is a cherished goal for most people. For many Australians this goal is highlyachievable. Most Australians can now expect to live an average of 80 years, a largeproportion of these as healthy years.
Significant increases in life expectancy have occurred throughout the twentieth century.Reductions in infant and child mortality have been the most significant contributors tothe increase in life expectancy at birth over the period (ABS 1998c). However, morerecently, significant gains in life expectancy occurred following reductions in deathrates among the elderly, especially for diseases of the circulatory system, such as heartdisease and stroke. These trends have important consequences. Not only do theyincrease the proportion of the population reaching an advanced age, but they alsoinfluence the health, disease and disability patterns in a population.
Longevity is much more valuable if it is accompanied by freedom from suffering, pain ordisability. The growing prevalence of chronic diseases and disabilities has brought intofocus the need to seek a balance between the length and quality of life (WHO 1997).
Life expectancy in Australia
Most Australians can expect to live relatively long and healthy lives. An Australian boyborn between 1996 and 1998 can expect to live, on average, 75.9 years, and a girl born inthe same period can expect to live 81.5 years (ABS 1999a). These estimates assume that,over the lifetime of these individuals, the death rates at various ages will not deviatefrom the rates obtained in 1996Ð98. However, if the age-specific death rates decreasefurther, then the life expectancy achieved by these individuals will be more than thatestimated from current life tables.
A corollary to the above observation is that at higher ages total life expectancies aregreater than those obtained at birth. Surviving early years of life adds years to thebalance of life expectancy (Insel & Roth 1988). For example, for males aged 65 in1996Ð98, the expected number of remaining years of life is 16.3, a total life expectancy of81.3 years. For females aged 65 in 1996Ð98, this figure is 20.0 years or a total of85.0 years (ABS 1999a).
Life expectancy is not uniform across population groups. Some groups in thepopulation, such as those who are socioeconomically disadvantaged and Aboriginaland Torres Strait Islander peoples, have lower life expectancy than the national average.The most socioeconomically disadvantaged in society, for example, are expected to liveabout 3 years less than those most advantaged (AIHW: Mathers et al. 1999a). But the
01 AH2000 body Page 11 Thursday, June 1, 2000 3:06 PM

12
AustraliaÕs Health 2000
TRIM SIZE 175 mm Wide x 250 mm Deep
greatest difference is in relation to the life expectancy for Aboriginal and Torres StraitIslander peoples. Indigenous persons born in 1996Ð98 are expected to live about20 years less than the rest of the Australian population (ABS & AIHW 1999).
Life expectancy also shows regional variation. Based on 1996Ð98 data, life expectancy atbirth in the Northern Territory was the lowest for both sexes, considerably lower thanthe overall Australian levelsÑ5.3 years lower for males and 6.5 years lower for females(Table S11, page 371). These differences largely reflect the higher death rates in theIndigenous populations, which constitute a large proportion (29%) of the population inthe Northern Territory (ABS 1999a). In other States of Australia, male life expectancyranges from 75.1 years in Tasmania to 77.5 years in the Australian Capital Territory, andfemale life expectancy ranges from 80.4 years in Tasmania to 81.9 years in WesternAustralia.
Life expectancy for both males and females has increased considerably over the last 100years. Since 1901, life expectancy at birth increased by 38% (from 55.2 years) forAustralian males and by 39% (from 58.8 years) for Australian females. Trends in lifeexpectancy are discussed in more detail in chapter 8.
International comparisons
Australians enjoy some of the highest life expectancies in the world. In 1995, the highestmale life expectancies at birth were recorded in Iceland (76.5 years) and Japan(76.4 years), and the highest female life expectancies were recorded in Japan (82.9 years)and France (82.6 years). Australian life expectancy at birth is similar to that estimatedfor countries such as Canada, Norway, Spain, New Zealand, the United Kingdom andthe United States (Figure 2.1).
The countries compared in Figure 2.1 are all from more developed regions of the world.The life expectancies of less developed countries are considerably lower. Regionsdefined by the United Nations as being made up of less developed countries(i.e. countries outside Europe, North America, Australia, Japan and New Zealand) havean overall life expectancy of 64 years, compared with 75 years for developed regions.The African continent has the lowest life expectancy at birth of 52 years (PopulationReference Bureau 1999).
Self-reported health
PeopleÕs perception of their own health has been shown to be a powerful, independentpredictor of their survival in several populations (see, for example, Mossey & Shapiro1982, Kaplan & Camacho 1990, and Idler et al. 1990). Although some inconsistencybetween the results of different studies suggests that this is not equally true of allpopulations, Australian studies have demonstrated the link between self-reported healthand subsequent health outcomes, at least for older Australians (McCallum et al. 1994).
This section discusses how Australians rate their own health and wellbeing, based onself-assessed health status and the physical and mental health component summary(PCS and MCS) scores derived from the SF-12 questionnaire (Ware et al. 1996ÑseeBox 2.1, page 14). These summary scores were originally developed from the longerSF-36 health survey questionnaire and are intended to represent independent measures
01 AH2000 body Page 12 Thursday, June 1, 2000 3:06 PM

2
The health of Australians
13
TRIM SIZE 175 mm Wide x 250 mm Deep
of mental and physical health, with higher scores indicating better health. There is someevidence that results relating to physical health may affect the MCS score and vice versa(see Box 2.1, page 14).
The results presented here are based on data from the 1997 National Survey of MentalHealth and Wellbeing of adults (persons aged 18 years and over), conducted by theAustralian Bureau of Statistics (ABS).
(a) Philippines 1991; Ireland, Italy 1993; France, Iceland, Norway, Spain, USA 1994; Singapore 1996; Lebanon 1990–95; Malaysia 1990–96; New Zealand 1992–94; Switzerland 1994–95; Australia 1995–97.
Sources:
ABS 1998c; UN 1998; WHO 1998.
Figure 2.1: Life expectancy at birth, selected countries, 1995
Russia
Philippines(a)
Lebanon(a)
Poland
Malaysia(a)
USA(a)
Ireland(a)
Germany
New Zealand(a)
UK
Italy(a)
Spain(a)
France(a)
Singapore(a)
Netherlands
Norway(a)
Greece
Canada
Israel
Switzerland(a)
Australia(a)
Hong Kong
Sweden
Japan
Iceland(a)
55 57 59 61 63 65 67 69 71 73 75 77 79 81 83 85Life expectancy (years)
Males
Females
01 AH2000 body Page 13 Thursday, June 1, 2000 3:06 PM

14
AustraliaÕs Health 2000
TRIM SIZE 175 mm Wide x 250 mm Deep
Self-assessed health status
Just over half (57%) of people aged 18 years and over reported their overall health asexcellent or very good, and a further 28% reported that they were in good health.Proportions were similar for the two sexes. The remaining 15% rated their health aseither fair or poor. In interpreting, these findings, note that some of those in poorerhealth were excluded from the surveyÑfor example, people living in institutions suchas hospitals and nursing homes were not included.
Self-assessed health status is strongly related to age. The proportions reporting excellentor very good, good, and fair or poor health remained relatively unchanged up to theage group 35Ð44 years. At ages over 44 years, the proportion reporting excellent or verygood health declined with increasing age, from 66% at ages 35Ð44 to 37% at ages 75 andover, while the corresponding proportion reporting fair or poor health increased from10% to 33% (Figure 2.2).
PCS and MCS scores
The PCS score declines steadily with age for both males and females, whereas the MCSscore is higher at older ages than at younger ages (Figure 2.3). These patterns suggestthat whereas self-assessed physical health declines with age, self-assessed mental healthshows improvement. However, these findings should be interpreted with caution sincerespondents with cognitive problems such as dementia, which mainly occur at olderages, were excluded from completion of the SF-12 questionnaire.
Box 2.1: SF-12 questionnaire and self-assessed health
The SF-12 questionnaire is a standard international instrument developed by the MedicalOutcomes Trust, Boston, USA (Ware et al. 1998). It contains 12 questions that provide ageneric measure of self-reported health status.
The responses to various questions can be combined into a physical component summary(PCS) score and a mental component summary (MCS) score. The PCS is taken as repre-senting limitations in physical functioning, role limitations due to physical health prob-lems, bodily pain and general health. The MCS focuses mainly on role limitations due toemotional problems, social functioning, mental health and vitality (Ware et al. 1996).
These summary scores were originally developed from the longer SF-36 health surveyquestionnaire (Ware et al. 1994). The SF-12 questionnaire was designed as a shorter formof the SF-36 questionnaire; nonetheless it closely reproduces the MCS and PCS scores.Each score has a mean value in the general population of around 50, with a higher scoreindicating better self-reported health and wellbeing.
There is some evidence that the state of physical health may affect the MCS scores and viceversa, probably because mental and physical health are to some extent interrelated (Simonet al. 1998). However, they still provide useful summaries of self-reported physical andmental health status (Ware et al. 1996).
Self-assessed health was recorded with a question that asked respondents to rate theirhealth according to a 5-point Likert scale (excellent, very good, good, fair, poor).
01 AH2000 body Page 14 Thursday, June 1, 2000 3:06 PM

2
The health of Australians
15
TRIM SIZE 175 mm Wide x 250 mm Deep
Source:
AIHW analysis of National Survey of Mental Health and Wellbeing data.
Figure 2.2: Self-assessed health status by age, 1997
Source:
AIHW analysis of National Survey of Mental Health and Wellbeing data.
Figure 2.3: Mean physical and mental component scores by age and sex, 1997
18–24 25–34 35–44 45–54 55–64 65–74 75+0
10
20
30
40
50
60
70
Per cent of persons
Age group (years)
Excellent/very good
Good
Fair/poor
18–44 45–64 65–74 75+40
42
44
46
48
50
52
54
56
58
60
Age group (years)
Males
Females
18–44 45–64 65–74 75+40
42
44
46
48
50
52
54
56
58
60Mean score
Age group (years)
Physical component(PCS)
Mental component(MCS)
01 AH2000 body Page 15 Thursday, June 1, 2000 3:06 PM

16
AustraliaÕs Health 2000
TRIM SIZE 175 mm Wide x 250 mm Deep
Variation in self-reported health status
The link between health status and socioeconomic status has been clearly demonstratedin studies both in Australia and overseas (Wilkinson & Marmot 1998), with lowersocioeconomic status being associated with poorer health. The Australian Burden ofDisease and Injury Study shows a clear gradient in the total mortality burden withsocioeconomic disadvantage as defined by the ABSÕs Index of Relative SocioeconomicDisadvantage (IRSD) at the statistical local area level (AIHW: Mathers et al. 1999a). Thestudy also shows a similar marked gradient in the disability burden of mentaldisorders.
As expected, the proportion of people who reported their health as either excellent orvery good shows a marked trend across the socioeconomic disadvantage quintiles. Itrises from 49% for males and 53% for females in the first quintile (the mostdisadvantaged) to 63% for males and 65% for females in the fifth quintile (the leastdisadvantaged) (Figure 2.4). The pattern of poorer self-assessed health status withincreasing disadvantage is also reflected in the mean PCS scores and to a lesser extent inthe mean MCS scores (Figure 2.5).
Note:
Age standardised to the Australian population at 30 June 1991.
Source:
AIHW analysis of National Survey of Mental Health and Wellbeing data.
Figure 2.4: Proportion of people reporting their health as excellent or very good by sex and socioeconomic status, 1997
First quintile Second quintile Third quintile Fourth quintile Fifth quintile40
45
50
55
60
65
70
Per cent of persons
Quintile of IRSD
Males
Females
01 AH2000 body Page 16 Thursday, June 1, 2000 3:06 PM

2
The health of Australians
17
TRIM SIZE 175 mm Wide x 250 mm Deep
Fitness
Fitness can be broadly defined as the matching of an individual to his or her physicaland social environment. Through a combination of heredity and modifiable lifestylefactors, an individual may acquire the attributes to carry out physical tasks with vigourand alertness, and without undue fatigue in a specified physical, social andpsychological environment. This implies that fitness has both physical and mentalcomponents that are largely modifiable.
Traditionally, definitions of physical fitness have related only to the physical attributesthat are necessary for optimal sport or work performance in terms of an individualÕsability in an athletic competition, a performance test or occupation (Pate 1988; Gledhill1990). Muscular strength, motor skills, power, endurance, body composition, body size,motivation and nutritional status are thus important components of performance-related fitness (Bouchard & Shephard 1994). In recent years, there has been anincreasing interest in the health-related aspects of fitness (Bouchard et al. 1997).
Mental fitness involves stimulating the mind through education, work and leisure, andenables people to solve many of the challenges confronted throughout life(Gringold 1999).
Note:
Age standardised to the Australian population at 30 June 1991.
Source:
AIHW analysis of National Survey of Mental Health and Wellbeing data.
Figure 2.5: Mean physical and mental component scores by sex and socioeconomic status, 1997
1st 2nd 3rd 4th 5th45
47
49
51
53
55
Quintile of IRSD1st 2nd 3rd 4th 5th
45
47
49
51
53
55Mean score
Quintile of IRSD
Males
Females
Physical component(PCS)
Mental component(MCS)
01 AH2000 body Page 17 Thursday, June 1, 2000 3:06 PM

18
AustraliaÕs Health 2000
TRIM SIZE 175 mm Wide x 250 mm Deep
Health-related fitness
Health-related fitness has been defined as a state characterised by (a) an ability toperform daily tasks with vigour and (b) traits and capacities associated with a low riskof development of diseases or conditions, where these diseases or conditions are relatedto a sedentary lifestyle (Bouchard & Shephard 1994).
The relationships between health-related fitness, participation in physical activity andhealth are complex. Not only does physical activity influence health, but health statusalso influences participation in physical activity and therefore level of fitness (Bouchard& Shephard 1994). Further, a personÕs natural (genetic) level of fitness will influenceparticipation, and there is variation among people in their response to the same levelsof physical activity (Bouchard et al. 1997). In the general population, both performance-related fitness and health-related fitness decline with increasing age, especially afterabout age 35 (Smith & Gilligan 1989).
Bouchard and Shephard (1994) have identified several components of health-relatedfitness: morphological, muscular, motor, cardiorespiratory and metabolic fitnesses(Box 2.2).
Health-related fitness of Australians
Quantitative information on the health-related fitness of Australians is sporadic. ANational Health and Fitness Survey was conducted in 1985 on Australian schoolchildren aged 7Ð15 years (Pyke 1987). More recently, a comparable survey was carriedout among New South Wales school children (Booth et al. 1997). The latter study showsthat about 25% of boys in Year 6, and around 30% of Year 8 and Year 10 boys, have lowaerobic capacity.
Several components of health-related fitness were measured in adults from Adelaide inthe Pilot Survey of the Fitness of Australians (DASET 1992). The survey found higherlevels of cardiorespiratory fitness, better lung function, and better flexibility and muscle
Box 2.2: Components of health-related fitness
Sources:
Bouchard & Shephard 1994; Bouchard et al. 1997.
Morphological component
Muscular component
Motor component
Cardiorespiratory component
Metabolic component
Body mass index
Body composition
Subcutaneous fat distribution
Abdominal visceral fat
Bone density
Flexibility
Power
Strength
Endurance
Agility
Balance
Coordination
Speed
Aerobic power
Heart functions
Lung functions
Blood pressure
Glucose tolerance
Insulin sensitivity
Blood cholesterol
Substrate oxidation characteristics
01 AH2000 body Page 18 Thursday, June 1, 2000 3:06 PM

2
The health of Australians
19
TRIM SIZE 175 mm Wide x 250 mm Deep
strength among those who were physically more active. Information on components ofhealth-related fitness has also been collected in the Risk Factor Prevalence Surveys(conducted in 1980, 1985 and 1989) and the 1995 National Nutrition Survey.
Data on the participation of Australian adults in physical activity were collected by theABS in 1998Ð99 (ABS 1999f). Although not a measure of fitness, around 15% of adultAustralians reported that they had participated in aerobics or fitness activitiessometime during the 12-month period prior to interview. Participation of Australians inphysical activity for health benefits is discussed further in chapter 3.
Oral health
Oral health refers to the health of a number of different tissues in the mouth, includingmucous membrane, connective tissue, blood vessels, nerves, muscles, bone, teeth andperiodontal structures. It also covers immunological, physiological, sensory anddigestive system aspects of human health. However, the term is used overwhelminglyin relation to two specialised tissues of the mouth, namely the teeth and the periodontalstructures or gums.
Many different factors affect the oral health of a population and individual variationtherein, prominent among which are age, exposure to fluorides, dietary patterns,preventive dental behaviours, smoking, alcohol consumption, stress, infection andimmunity, access to and use of preventive and dental restorative services, and attitudestowards treatment preferences. The oral health of children in developed countries hasimproved dramatically over the last several decades. Factors such as changes inexposure to fluoride and disease control and management have contributed to thisimprovement (AIHW: de Looper & Bhatia 1998).
The preservation or loss of teeth and periodontal structures starts early in life, and is alife-long, cumulative process. Early improvements contribute to better outcomes later inlife. The loss of all teeth, or edentulism, increases with age, but has been decreasingover time. The numbers of missing teeth in individuals with some natural teeth havealso been decreasing. For the individual, the loss of natural teeth is usually associatedwith chewing difficulties, higher levels of discomfort during eating, personalembarrassment, social isolation and the need for assistance. Decayed teeth are also thecause of much morbidity and pain.
Measurement of oral health
Indicators of oral health may be designed in terms of personal hygiene, dentalpreservation and/or oral wellbeing, However, the outcomes are usually measured interms of dental morbidity and mortality such as the number of decayed, missing orfilled teeth (DMFT) or edentulism. Because of the highly pervasive nature of dentalcaries and periodontal (gum) disease, it is necessary to measure not only the prevalencebut also the extent and severity of oral diseases.
An increasing proportion of Australian adults are retaining their natural teeth, withrecent significant falls in both adult DMFT scores and edentulism, due mainly toeffective preventive strategies and changes in disease management. However, both
01 AH2000 body Page 19 Thursday, June 1, 2000 3:06 PM

20
AustraliaÕs Health 2000
TRIM SIZE 175 mm Wide x 250 mm Deep
DMFT scores and the proportion of the population that are edentulous arecomparatively high for Australians when compared with other OECD countries(AIHW: de Looper & Bhatia 1998).
Child oral health
The oral health of primary and secondary school children in Australia continues toimprove. Oral health in children is most often assessed by their dental decay experience(or extent), expressed as a count of the number of teeth currently decayed, teethextracted as a result of having been decayed and teeth with fillings. The averagenumber of decayed, missing or filled teeth (dmft) in the deciduous dentition (ÔbabyÕ orprimary teeth) for children aged between 5 and 10 years declined markedly between1989 and 1996 (Table S26, page 390). Reductions were greatest for the youngest agegroups. The average dmft of 5-year-old children reduced by 39.1%, from 2.07 to 1.26,while for 10-year-old children the dmft score fell by 21.8%, from 1.88 to 1.47.
Disease experience in the permanent dentition (ÔadultÕ teeth) also declined between1989 and 1996 (Table S27, page 390). By 1996, the DMFT score for 12-year-old childrenhad reduced by 42.3%, from 1.56 to 0.90. This is a considerable improvement on theaverage score of 4.79 for 12-year-olds in 1977.
Appreciable differences in disease in the deciduous and permanent dentition existacross AustraliaÕs States and Territories, despite the general reduction in the level ofdisease (Table S28, page 391). The average dmft score for 6-year-old children in 1996was lowest in New South Wales (0.94) and the Australian Capital Territory (0.89) andhighest in Queensland (2.25). In the permanent dentition, average DMFT was lowest inSouth Australia (0.47) and the Australian Capital Territory (0.56) and again highest inQueensland (1.30). State and Territory differences may be a result of differences inpatterns of exposure to preventive factors such as water fluoridation, delivery systemorganisation, the targeting of oral care and even the methodology used for collectingoral health information. It is notable that, of the major cities in Queensland, onlyTownsville has fluoridated drinking water (AIHW 1998a).
The changing pattern of children’s oral health
Over the last two decades, there has been a considerable increase in the proportion ofchildren with no caries (tooth decay). Between 1989 and 1996, there was an increase inthe percentage of 6-year-old children with no decayed, missing or filled teeth from48.8% to 59.8%, and the percentage of 12-year-olds with no caries increased from 35.0%to 51.4% in the same period (Figure 2.6). These figures represent an increase of 20.5%and 46.9%, respectively, in the number of 6-year-olds and 12-year-olds without anydental caries at each age.
The burden of oral disease is increasingly concentrated in a minority of children. Inparticular, there remains a significant proportion of children who present with aconsiderable history of dental caries (Figure 2.7). The percentage of these high-riskchildren has decreased only slightly in recent years. For example, the proportion of6-year-old children with four or more decayed, missing or filled teeth reduced by only3.7% between 1989 and 1996.
01 AH2000 body Page 20 Thursday, June 1, 2000 3:06 PM

2
The health of Australians
21
TRIM SIZE 175 mm Wide x 250 mm Deep
Source: AIHW Dental Statistics and Research Unit Child Dental Health Surveys.
Figure 2.6: Proportion of children with no decayed, missing or filled teeth by age, 1989 to 1996
Source: AIHW Dental Statistics and Research Unit Child Dental Health Surveys.
Figure 2.7: Proportion of children with four or more decayed, missing or filled teeth by age, 1989 to 1996
1989 1990 1991 1992 1993 1994 1995 199625
35
45
55
65
Per cent of children with dmft + DMFT = 0
Year
6-year-olds
8-year-olds
10-year-olds
12-year-olds
1989 1990 1991 1992 1993 1994 1995 19960
2
4
6
8
10
12
14
16
18
20
Per cent of children with dmft + DMFT ≥ 4
Year
6-year-olds
8-year-olds
10-year-olds
12-year-olds
01 AH2000 body Page 21 Thursday, June 1, 2000 3:06 PM

22 AustraliaÕs Health 2000
TRIM SIZE 175 mm Wide x 250 mm Deep
Children with the largest burden of oral disease are more likely to be of lowersocioeconomic status, reside in a rural area or be of Indigenous origin (Davies et al.1997; Spencer et al. 1998; Gaughwin et al. 1999). In the Northern Territory in 1996,Indigenous 6-year-old children had three times the number of clinically detectabledecayed teeth (2.10 on average) than non-Indigenous children (0.73 on average).Therefore, although the caries experience of the general population of children hasimproved significantly, there remain pockets of at-risk children who require furthertargeting through oral health initiatives (AIHW DSRU: Armfield et al. 1999).
Oral health of young adults
Gains in oral health made in childhood need to be carried into adult years to continuethe improvement of oral health in the general population. Young adulthood may be aperiod of greater risk of oral diseases as it is a time of change when people move intonew accommodation arrangements, relationships become established and economicindependence is attained (Young 1996). These changes may alter patterns of preventivehealth behaviours and treatment service use by young adults. In addition, this agegroup is noted for its risk-taking behaviours.
The Adult Dental Programs Survey (AIHW DSRU: Brennan et al. 1995) indicated thatpublicly funded patients in the 18Ð24 age group have the highest rates of oral surgery(15% of visits), an average of slightly more than two decayed teeth and the highest ratesof temporary restorations (12% of visits), suggesting a strong presence of emergencytreatment. Brennan (2000) also found that in private practice extraction rates for dentalcaries, infections of the tooth root or gum-related diseases were highest in patients aged18Ð24 years.
A study in Adelaide in 1999 by Roberts-Thomson and Stewart examined 644 youngadults who were selected from the electoral roll. Figure 2.8 shows the distribution of thenumber of decayed, missing and filled teeth (DMFT) due to dental caries from thatstudy. More than one in five adults (22%) had no clinical evidence of caries. Thedistribution was positively skewed with a mean DMFT score of 3.66, and a median of3.0 teeth with caries experience.
However, over 10% of these young adults had a DMFT score of 8 or more. Persons withthe highest levels of tooth decay were more likely to be those who were disadvantagedsuch as concession card holders, those who use public dental clinics, and those who hadnot visited a dental professional in the previous 2 years.
The mean DMFT of 3.66 was made up of 75% filled teeth, 19% of teeth with untreateddecay and 6% of teeth missing due to dental caries. About 29% of the young adults haduntreated decayed teeth, with an additional 31% with signs of early decay. Those withuntreated decay were more likely to be young adults who usually visit only for aproblem, who have not made a dental visit in the last 2 years and who are regularsmokers.
Note that the results presented here are from urban Adelaide with access to waterfluoridation, and would therefore tend to be an underestimation of national figures. Forthe majority of young adults, the gains in oral health made in childhood are carried intolater years. However, for a minority, oral diseases remain a significant problem.
01 AH2000 body Page 22 Thursday, June 1, 2000 3:06 PM

2 The health of Australians 23
TRIM SIZE 175 mm Wide x 250 mm Deep
Oral health of nursing home residentsDemographic changes and changing patterns of oral health are resulting in largernumbers of older Australians who are increasingly dentate (have some of their ownnatural teeth). To provide a better understanding of their oral health, a baseline study ofthe oral health of nursing home residents was carried out in Adelaide in 1998 (Chalmerset al. 1999). The mean age of participating residents was 83.2 years. Oral inspections werecompleted for 224 residents.
Two-thirds (66%) of participating residents were edentulous. Edentulous residents hadsignificant oral problems and treatment needsÑthey had lost a higher percentage ofbody weight, they could eat fewer foods, their last visit to a dentist was more likely tohave been for a problem, and they were less likely to think they needed dentaltreatment. Denture-related conditions of the mouth were prevalent, such asinflammation of areas of the mouth covered by the denture (16.8%) and inflammationof the corners of the mouth (18.5%). Up to 20% of residents owned dentures that werenot worn.
Dentate residents had an average of 11.9 teeth remaining, 18.9 missing teeth, and1.1 retained roots (0.8 decayed and 0.3 sound retained roots). They had a mean of1.1 decayed teeth and 3.8 filled teeth, for an average DMFT score of 23.7.
Source: Adelaide Dental Study of Young Adults.
Figure 2.8: Distribution of dental decay in young adults aged 20Ð24 years, 1999
0 1 2 3 4 5 6 7 8 9 10 11 12 13 14 15 16 17 18 19 20+0
5
10
15
20
25
Per cent of young adults
DMFT
01 AH2000 body Page 23 Thursday, June 1, 2000 3:06 PM

24 AustraliaÕs Health 2000
TRIM SIZE 175 mm Wide x 250 mm Deep
Residents with a government concession card had significantly more missing teeth.Residents without a government card, those taking 8 or more medications and thosewho could eat most foods had significantly more filled teeth (Figure 2.9). Residents whohad been living at the nursing home for more than 3 years had significantly moreretained roots. Males had significantly more retained roots and decayed crowns(Figure 2.10). Significantly more plaque/debris-covered surfaces were found inresidents who could not eat many foods. Residents with severe cognitive impairmenthad more decayed teeth, more missing teeth, fewer filled teeth and many more plaque/debris-covered surfaces.
The prevalence of caries in the crown of the tooth and in the root was high in residentsof nursing homes. The mean number of decayed coronal surfaces (1.7) was greater thanthe number of decayed teeth (1.1), indicating that multiple surfaces were affected onsome teeth. The mean number of filled coronal surfaces was 8.7, decayed root surfaceswas 1.5, and filled root surfaces was 1.1. Males had significantly more decayed coronaland root surfaces; they also had more decayed root surfaces and significantly highernew caries in crowns and roots. Residents who could not eat many foods had moredecayed coronal surfaces, less filled coronal and root surfaces and many more plaque/debris-covered surfaces. More severely cognitively impaired residents had much highernumbers of decayed coronal surfaces.
Source: Chalmers et al. 1999.
Figure 2.9: Nursing home residents: tooth status by residentsÕ characteristics, 1998
Yes No 0–1 2–3 4–5 1–4 5–7 8+0
5
10
15
20
25
30Mean number of teeth
Missing teeth
Filled teeth
Government cardholder
Number of foodseaten
Number ofmedications
01 AH2000 body Page 24 Thursday, June 1, 2000 3:06 PM

2 The health of Australians 25
TRIM SIZE 175 mm Wide x 250 mm Deep
Plaque and tartar (calculus) accumulation was very high on residentsÕ teeth anddentures. Over 25% of dentate and edentulous residents who wore dentures hadstaining/debris accumulation on more than one-third of the denture surface. Residentswith significantly more plaque accumulation were those who could not eat many foodsand those who had been admitted to the nursing home more than 12 monthspreviously. Other residents with more plaque were those with a diagnosed dementiaand/or severe cognitive impairment, concession card holders, males, youngerresidents, and the more functionally dependent. Tartar accumulation was highÑ63% ofsites assessed for loss of periodontal attachment had tartar present on probing.Prevalence of mild to moderately deep gum pockets was common, but severeperiodontal disease was evident only in a small percentage (4.4%) of residents.
Dentate residents had high treatment needs as determined by a dentist (Table 2.1,page 26). They required a mean of 2.9 surfaces for restoration per resident. Normativeneed for extractions was highÑ0.9 teeth per dentate resident. However, less than 25%of residents perceived a need for dental treatment.
Over 30% of dentate residents had unstable and/or unretentive upper dentures and40% of edentulous residents had unstable and/or unretentive lower dentures. Over20% of dentate residents had defects with their upper partial dentures. However,residentsÕ perceived need for denture treatment was much lower than the normative
Source: Chalmers et al. 1999.
Figure 2.10: Nursing home residents: retained roots and decayed crowns by residentsÕ characteristics, 1998
Male Female < 3 years > 3 years0.0
0.5
1.0
1.5
2.0
2.5
3.0Mean number of teeth
Retained roots
Decayed crowns
Sex Time since admitted
01 AH2000 body Page 25 Thursday, June 1, 2000 3:06 PM

26 AustraliaÕs Health 2000
TRIM SIZE 175 mm Wide x 250 mm Deep
need. For example, based on clinical criteria, 68% of residents who required a new fulldenture did not want it and 50% of residents who required a denture reline did notwant it.
Sexual health Sexuality is integral to physical and mental health. In addition to its reproductivefunction, it influences a broad range of attitudes and social values. Sexual health,therefore, refers not only to the health of reproductive organs but also to thepsychological, emotional and relationship aspects of sexual behaviour.
Attitudes to sexuality, in particular to the reproductive purpose of sexual behaviour,have changed considerably over the last several decades. Two major factorscontributing to this change are improved methods of, and greater access to,contraception. Social and economic factors have also influenced the association betweensexual activity and reproduction.
For most people, sex is a positive and normal aspect of life. It is a means ofreproduction, as well as providing intimacy in relationships. For others, who experiencesexual dysfunction, sexual intimacy can be difficult and lead to emotional and relationalproblems. There is also the problem of sexually transmitted diseases (STDs) orunwanted pregnancy that can result from unsafe sex practices.
This section provides an overview of the sexual health of Australians, relating toreproduction and contraception, sexual health status, sexual dysfunction and STDs. Thesection on communicable diseases later in this chapter provides additional informationon STDs. Chapter 3 describes sexual health practices in Australia and associated riskfactors. The section on mothers and babies in chapter 4 covers the issues of pregnancy,multiple births, abortion and perinatal deaths in greater detail. Information onhealthcare services in relation to sexual health in general, and reproduction inparticular, is included in chapter 5.
Table 2.1: Nursing home residents: dentate residentsÑtreatment needs determined by dentist, 1998
Type of treatmentMean number of teeth
requiring treatment
Restorations
For 1 surface 0.97
For 2 surfaces 0.41
For 3 surfaces 0.30
For 4 surfaces 0.04
Extractions 0.87
Preventive 0.33
Source: Chalmers et al. 1999.
01 AH2000 body Page 26 Thursday, June 1, 2000 3:06 PM

2 The health of Australians 27
TRIM SIZE 175 mm Wide x 250 mm Deep
ReproductionAn important goal for many people is to have a family. However, the timing of startinga family and the size of the family has changed substantially over the last 100 years. Awide variety of contraceptive methods makes it possible for couples and individuals toplan the number and timing of children.
In 1998, around 246,000 women gave birth in Australia, with almost 250,000 live birthsregistered (the difference takes into account multiple births). The outcome of somepregnancies is the birth of a stillborn child. A total of 1,336 stillbirths were registered in1998 (ABS 1999c, 1999d). Crude birth rates have declined from 21.7 per 1,000 people in1971 to 13.3 per 1,000 in 1998.
Medical assistance such as in-vitro fertilisation (IVF) and gamete intrafallopian transfer(GIFT) have made it possible for people with fertility problems to have children. In1997, almost 3,500 births were the result of assisted conception. This was an increase of9.3% over the number of assisted-conception births in 1996 (AIHW NPSU: Hurst et al.1999).
FertilityThe average number of births per woman (the total fertility rate) has been declining inAustralia since the peak in 1961 (3.6 babies per woman). This is likely to be due to thegreater control women and men now have over reproduction. By 1998, the total fertilityrate had dropped to 1.76, below the replacement level of 2.1 babies per woman(Figure 2.11).
Source: ABS Cat. No. 3301.0 (various years).
Figure 2.11: Total fertility rate, Australia, 1921 to 1998
0
1
2
3
4
1920 1930 1940 1950 1960 1970 1980 1990 2000
Number of children per woman
Year
01 AH2000 body Page 27 Thursday, June 1, 2000 3:06 PM

28 AustraliaÕs Health 2000
TRIM SIZE 175 mm Wide x 250 mm Deep
As well, child-bearing is being delayed until later in life. Major declines in the fertilityrate over the period 1978 to 1998 occurred among younger women. Births to teenagemothers decreased by 38% over the period, to a rate of 18 births per 1,000 women aged15Ð19 years. Over the two decades the fertility rate for women aged 20Ð24 yearsdeclined by 48%, and for women aged 25Ð29 years by 23%. Conversely, between 1978and 1998, the fertility rate for women aged 30Ð34 years increased by 46%, and forwomen aged 35Ð39 years by 94% (ABS 1999c).
Changes in fertility are a result of the interaction of many social and economic factors,as well as health factors. These issues are beyond the scope of this report, but arediscussed in AustraliaÕs Welfare 1997 (AIHW 1997).
ContraceptionContraception is recognised as a preventive health measure because it offers protectionagainst unwanted pregnancy.
Contraception methods are many and varied, and can be classified as non-surgical orsurgical. Non-surgical methods include withdrawal or periodic abstinence (rhythm ornatural method), condoms, the contraceptive pill, diaphragm, spermicides, douche, andintra-uterine devices (IUD). Surgical methods are tubal ligation or hysterectomy inwomen and vasectomy in men. Although the number of vasectomies has remainedsteady over the past decade, the number of tubal ligations has dropped (Figure 2.12).
The 1995 National Health Survey found that almost 40% of women aged 18Ð49 yearsused the oral contraceptive pill, 19% used sterilisation and another 18% used condomsfor contraception (ABS 1998d).
Not all contraception methods are infallible. Sterilisation has the lowest failure rate(0.3%), followed by modern reversible methods such as IUD (4.4%) and traditionalmethods such as periodic abstinence, withdrawal, diaphragm and condoms (16.4%)(Handelsman 1995).
Sexual health statusSexual health status refers to the health of reproductive organs and problems relating topregnancy, the prevalence of sexual dysfunction and STDs.
Health of reproductive organs and pregnancyIn 1998Ð99, the Bettering the Evaluation And Care of Health (BEACH) survey foundthat female genital system problems accounted for 4.3% of the total number of healthissues managed by general practitioners (GPs). Most of these visits were for genitalcheck-ups or Pap smears (28%) and menopausal complaints (24%). Consultationsrelating to pregnancy and family planning accounted for 2.8% of all health issuesmanaged. Such problems include pre/postnatal check-ups and consultations relating tooral contraception. Male genital system problems accounted for 1% of all health issuesmanaged by GPs.
Statistics on hospital separations provide some information on morbidity related toreproductive organs (both male and female), as well as complications of pregnancy.There were 185,183 separations for diseases or disorders of the female pelvic organs andgenital tract (3.3% of all separations), with an average length of stay of about 2 days, in
01 AH2000 body Page 28 Thursday, June 1, 2000 3:06 PM

2 The health of Australians 29
TRIM SIZE 175 mm Wide x 250 mm Deep
1997Ð98. There were 213,378 separations related to labour and delivery, 135,589separations due to complications of pregnancy, 9,154 for complications of thepuerperium and 76,013 separations for pregnancy with an abortive outcome duringthat period. Diseases of male genital organs accounted for 45,166 separations and anaverage length of stay of about 3 days (AIHW 1999b).
Sexually transmitted diseasesMany STDs are notifiable on a national basis, which means that any diagnosis of thedisease must be reported to the relevant State/Territory authorities. These reports arethen provided to the Commonwealth through the National Notifiable DiseasesSurveillance System (NNDSS). The diseases classified as sexually transmissible forsurveillance in the NNDSS are chancroid, chlamydial infection, donovanosis,gonococcal infection, lymphogranuloma venereum and syphilis. Trends in the annualnumber of notifications for chlamydia, gonococcal infection and syphilis are shown inFigure 2.13, page 30. Trends in HIV infection and AIDS are discussed in section 2.5.
Chlamydia is the highest reported STD, and is among the top five notifiable diseases inAustralia. In 1998, a total of 11,405 notifications were received for chlamydial infection,a rate of about 88 cases per 100,000 population. The highest prevalence was recorded inthe age group 20Ð24 years, with 60% more notifications for females than males. The
Source: Commonwealth Department of Health and Aged Care, unpublished data.
Figure 2.12: Contraceptive medical procedures, 1985 to 1998
1985 1986 1987 1988 1989 1990 1991 1992 1993 1994 1995 1996 1997 19980
10
20
30
40
50
60Number of procedures (’000)
Year
IUD
Vasectomy
Tubal ligation
01 AH2000 body Page 29 Thursday, June 1, 2000 3:06 PM

30 AustraliaÕs Health 2000
TRIM SIZE 175 mm Wide x 250 mm Deep
incidence of chlamydia has been increasing over time, with an 80% increase in the ratebetween 1991 and 1998. However, this increase may reflect increased rates of testingand notification rather than any actual rise in prevalence.
Notifications of gonococcal infection have also increased over this period. In 1998, therewere 5,428 notifications of gonococcal infection to NNDSS. The notification rate of29 per 100,000 was higher than in recent years but still far below the rates recorded inthe 1970s and early 1980s (Thomson et al. 1999). Notification rates were the highestamong the age groups 15Ð19 and 20Ð24 years, and there were 50% more notifications formales than for females.
A total of 1,689 notifications of syphilis were received in 1998, a rate of 9 per 100,000population. This is a 29% increase in the rate compared with 1997, and a reversal of theunderlying trend since 1992.
Other important diseases that are commonly or usually spread by sexual contactinclude genital herpes, genital warts, trichomaniasis and parasitic infestations such aspubic lice. However, these diseases are not subject to national notification. Noinformation on their incidence is available.
Sources: Herceg et al. 1996; Thomson et al. 1999.
Figure 2.13: Trends in STD notifications, 1991 to 1998
1991 1992 1993 1994 1995 1996 1997 19980
10
20
30
40
50
60
70
80
90Notifications per 100,000 population
Year
Chlamydia
Gonococcal infection
Syphilis
01 AH2000 body Page 30 Thursday, June 1, 2000 3:06 PM

2 The health of Australians 31
TRIM SIZE 175 mm Wide x 250 mm Deep
Knowledge
Knowledge about the importance of contraception and protection against STDs isperhaps most important for young adults, because this is the stage when most peoplebecome sexually active and some have children. However, note that although havingthe knowledge is necessary, it does not ensure that an individual will engage in safersexual practices.
Information on the knowledge that young people have about STDs is available from anationally representative sample survey of 3,550 students (Year 10 and Year 12)conducted in 1997 by the Centre for the Study of Sexually Transmissible Diseases at LaTrobe University. Earlier, in 1992, the National Centre in HIV Social Research hadconducted a survey on the issue. The 1997 study found that there has been a shift overthe 5 years towards safer sexual practices, with significantly more young people usingcondoms and having sex with fewer partners than in 1992. The survey also found thatcondoms were the most common method, but substantial numbers of students wereusing the pill, with some falsely believing that the pill also protects them against STDs(Lindsay et al. 1997).
Education programs have been successful to the extent that young people are highlyinformed about the transmission of HIV/AIDS. However, knowledge about other STDsand blood-borne viruses is low. A most disturbing observation is that many students donot see themselves at risk of becoming infected with an STD. A substantial minority ofyoung people continue to engage in high-risk practices such as having unprotected sexwith casual partners; it is estimated that 4% never use condoms with casual partnersand 28% use them only sometimes (Lindsay et al. 1997).
Immunological healthThe immunological health of an individual depends on the bodyÕs ability to recogniseand effectively counter infection. People cannot survive without a functioning immunesystem. The immunological mechanisms also contribute to or control a range of otherhealth outcomes. Several primary prevention strategies take advantage of thesemechanisms to improve immunological health, both at an individual level and at apopulation level.
Of the many defences that the human body has against infections, the most basic arethose that prevent the entry of micro-organisms into the body. These include the skinand mucous membranes, and the secretions they produce which contain antimicrobialproteins. Despite this, some micro-organisms manage to enter the body either directlythrough wounds, sexual intercourse, breastfeeding, the placenta and blood transfusion,or indirectly through contaminated food and water, infected insects and animal contact.
Following contact with an infectious micro-organism, the immune system protects thebody with an array of defences (see Box 2.3, page 32). The immunity developedfollowing recovery from an infection is known as naturally acquired immunity. This isalso known as active immunity, because it depends on an active response by the bodyÕsown immune system.
01 AH2000 body Page 31 Thursday, June 1, 2000 3:06 PM

32 AustraliaÕs Health 2000
TRIM SIZE 175 mm Wide x 250 mm Deep
Box 2.3: Development of immunityThe body protects itself against the entry of microscopic organisms with the skin, and withchemicals exuded by the skin and by mucous membranes. If an infectious agent gets pastthese barriers, it then encounters two cooperative defence mechanisms, non-specific andspecific immunity.
Non-specific immunityNon-specific immunity depends mainly on white cells such as neutrophils and macro-phages which are involved in phagocytosis (cell eating), and on natural killer cells whichare particularly important in the defence against viruses. The body also possesses a varietyof proteins capable of antimicrobial activity such as complements and interferons whichassist in the defence process.
Non-specific immune responses often involve an inflammation. An injury to tissue causeschemical signals resulting in an increased flow of blood to the area and increased perme-ability of the blood vessels, thus allowing phagocytes to leave the blood and enter theinfected area. The area around the injury becomes inflamed (hot and red). The pus that isoften seen in an infected injury is mainly dead cells and fluid leaked from small blood ves-sels. An inflammatory response can involve the whole body. In severe infections injuredcells emit chemicals which cause the body to produce large numbers of white blood cells.Some white blood cells produce pyrogens, molecules that raise the bodyÕs temperature. Amoderate fever inhibits the growth of some infectious organisms and speeds up the phago-cytic processes described above. However, a very high fever may cause complications.
Specific immunityThe immune system learns how to distinguish between self and non-self early in its devel-opment. Each kind of micro-organism, be it a virus, a bacterium, a fungus or a parasite,contains macromolecules known as antigens. The body responds to these antigens in twoways.
The first way is by what is called cellular immunity, in which white blood cells known asT lymphocytes destroy organisms carrying that particular antigen. The second way is byhumoral immunity, in which white blood cells known as B lymphocytes produce anti-bodies. These antibodies bind to the antigen, and neutralise or inactivate the infectiousmicro-organism. This mechanism also makes it easier for phagocytes (see above) to ingestthem. Antibodies defend the body against toxins and free bacteria and viruses found inbody fluids, whereas T lymphocytes defend the body against bacteria and viruses livinginside human cells as well as against fungi and parasites (Campbell 1993).
Each antigen stimulates the production of a unique, appropriate immune response. Inaddition, the immune system has a great diversity of lymphocytes and this enables it torespond rapidly to many different types of micro-organisms. Furthermore, as people growolder and over the years become exposed to a wider range of infectious micro-organisms,the immune system develops memory. If the body encounters the same infectious organismagain, it is able to produce a quicker and stronger immune response to that antigen. Theindividual will then suffer only a mild illness or have no symptoms at all. A person whoexperienced an infection with a certain pathogen but shows no clinical symptoms onrenewed exposure to this pathogen is said to be naturally immune to that infection.
01 AH2000 body Page 32 Thursday, June 1, 2000 3:06 PM

2 The health of Australians 33
TRIM SIZE 175 mm Wide x 250 mm Deep
Disease protectionThe health outcome of an infection is influenced by many factors. These include theability of the micro-organism to produce disease among those exposed, the level ofseverity of the disease it causes, the actual number of micro-organisms the person isexposed to, and the level of natural or induced immunity in the host (Beaglehole et al.1998). An infection does not necessarily lead to illness. The great majority of micro-organisms to which people are exposed cause only mild symptoms or discomfort. Thereis, however, a minority of organisms, such as those causing measles or cholera, whichcan lead to severe illness and death if introduced into the body.
The problem with natural immunity as a protection strategy against certain infections isthat some or many people will die of the disease caused by the infection. Only thosewho survive the illness (mild or severe) would have acquired natural immunity.Immunity, however, can be acquired artificially by the use of vaccines made from killed,weakened or only small parts of the microbes that cause infection (Box 2.4, page 34). Inthis way, a person can become immune to disease-causing micro-organisms withouthaving to suffer illness.
Vaccination, however, is not without its risks. Although rare, some people may have asevere reaction to a vaccination. However, at a population level, the risks of severe anddebilitating illness or death from the disease itself if people are not vaccinated are muchhigher than the risk of an adverse reaction to a vaccine. For example, it is known fromexperience that 1 in 25 children infected with measles will develop pneumonia and 1 in2,000 will develop encephalitis (brain inflammation) (NHMRC 1997b). Of the childrenwho develop encephalitis, 10% will die and 40% will suffer permanent brain damage. Inaddition, about 1 in 25,000 will develop subacute sclerosing panencephalitis (SSPE,brain degeneration), a rare late complication of measles infection that is fatal (Elliottet al. 1999). But for every million children vaccinated against measles, only one childmay develop encephalitis as an adverse reaction to the vaccination (NHMRC 1997b).
Immunity in the form of antibodies can also be transferred from one individual toanother, and this mechanism is known as passive immunity. This occurs naturally whenantibodies pass through the placenta from the mother to the foetus. Although theseantibodies last only for a few months, they nevertheless protect the infant againstdiseases that the mother has been exposed to and possesses antibodies against. Thissource of antibodies, together with antibodies in breast milk, is important in protectingthe infant from infections during the early months of life.
Herd immunityIf a large proportion of individuals in the population is immune to a particularinfectious disease, then the general level of immunity in the population becomessufficiently high to minimise the spread of infections. Even if a small proportion of thepopulation is not immuneÑi.e. they remain susceptible to the diseaseÑtheir risk ofinfection is much reduced because they are less likely to be exposed to the organismand less able to pass it on to others. This outcome is called herd immunity.
01 AH2000 body Page 33 Thursday, June 1, 2000 3:06 PM

34 AustraliaÕs Health 2000
TRIM SIZE 175 mm Wide x 250 mm Deep
If everyone or almost everyone in a population is immune or protected against disease,it is possible to eradicate the disease completely. For example, as a result of a large andextensive campaign of vaccination throughout the world, the infectious agent causingsmallpox was completely eradicated. An immunisation coverage of 90% to 95% is,however, required to interrupt transmission of highly infectious diseases (Lister et al.1999).
Herd immunity can be lost if an increasing proportion of the population does notbecome immune. If a large pool of unprotected individuals exists, they can transmit theinfection and an outbreak or epidemic can occur as a result. Since some people eithercannot be vaccinated because of their medical condition or decline immunisationperhaps because of their beliefs, it is important that as many people as possible arevaccinated so that the herd immunity is maintained (Box 2.5).
Box 2.4: VaccinationVaccines are either whole preparations of the infectious or toxic agents that have beenkilled or modified (attenuated) so that they will not cause the disease, or antigen prepar-ations from an infectious agent that have been purified (subunit vaccines). The immunesystem may respond to this modified material resulting in immunological memory of thatparticular organism. This immunity will protect the body on a subsequent encounter withthat infectious agent. Active immunisation has contributed to the control of nine majorinfectious diseases which previously killed large numbers of children and adults: smallpox(completely eradicated), diphtheria, tetanus, yellow fever, pertussis (whooping cough),polio, measles, mumps and rubella (Moxon 1990).
A way of urgently but temporarily protecting against disease is through passive immun-isation. Antibodies can be transferred artificially from an individual or animal that hasbeen already vaccinated against the disease to a person who is in danger after beinginfected. Tetanus in humans can be treated in this way because the infection can developrapidly and protection from a normal vaccination would take too long. The protection pro-duced by passive immunisation is immediate but lasts only a few weeks.
The protection offered by a vaccine (vaccine efficacy) is measured in clinical trials whereone group is given the real vaccine and another group (the control group) is left unvacci-nated. Vaccine efficacy is the percentage reduction of the incidence of the disease among thevaccinated compared with the unvaccinated or control group (Giesecke 1994). The termÔvaccinatedÕ refers to those who are injected with the vaccine, whereas ÔimmunisedÕ refersto those in whom the vaccine actually brought about an immune response (NHMRC1997b).
It has been possible to develop effective vaccines against many important microbial dis-eases. Difficulties are encountered in the development of vaccines against several diseasescaused by parasites. Some of the obstacles are due to the complex life cycles of protozoanparasites, and others are related to evasion mechanisms of the infectious microbes. Theseinclude genetic variability of the organism and variability in the structure of its antigensthat would be targets of immune response mechanisms (influenza and HIV). In addition,some parasites mimic host tissues to evade destruction by the immune system.
01 AH2000 body Page 34 Thursday, June 1, 2000 3:06 PM

2 The health of Australians 35
TRIM SIZE 175 mm Wide x 250 mm Deep
Monitoring immunisation levelsThe herd immunity of a population can be monitored in several different ways. The mostuseful indicator is an assay for antibody levels. This type of information is not currentlycollected in Australia nationally. Another indicator of herd immunity is the extent of theimmunisation coverage. Although Australia has had a childhood immunisation programsince the 1920s, information on coverage was less than satisfactory until theestablishment of the National Notifiable Disease Surveillance Scheme (NNDSS) in 1991and the Australian Childhood Immunisation Register (ACIR) in 1996 (Lister et al. 1999).
Box 2.5: Immunisation strategiesA knowledge of vaccine potency (efficacy), the duration of its effectiveness, factors influ-encing the spread of infectious agents within a population and herd immunity all influenceimmunisation strategies used against different diseases. Strategic issues include the pro-portion of the population to be vaccinated and the age at which they should be vaccinated.In general, the higher the infectivity of a micro-organism (reproductive potential), thegreater the degree of coverage needed to generate and maintain herd immunity.
Other factors taken into account in developing immunisation strategies include the costsand benefits of immunising people and an assessment of the risks if a person becomesinfected. For example, diphtheria and pertussis (whooping cough) cause high mortalityand serious consequences and only people vaccinated against them are protected. Vaccinesagainst diphtheria and pertussis are safe, highly effective and produce long-lasting immu-nity. Thus the immunisation strategy for the two diseases is that everyone should beimmunised.
In contrast, vaccines against cholera offer only short-term and incomplete protection.Cholera is a serious disease, but in healthy people is rarely fatal, although it can kill childrenand old people. Cholera is spread by poor sanitation and water supply, uncommon problemsin Australia. Cholera immunisation is therefore not routinely recommended in Australia.
Many other diseases present risk to only certain individuals or groups in the population. InAustralia, these include meningococcal disease, pneumonia, influenza, hepatitis A, Q feverand tuberculosis (NHMRC 1997b). Vaccination is recommended only for aged people,healthcare workers, people with malfunctioning immune systems and those chronically ill,i.e. people at increased risk of becoming infected or of suffering severe illness if they do.
Other vaccines are used to protect travellers against diseases that they are only likely tocome into contact with outside of Australia. These include vaccines against cholera, Japa-nese encephalitis, typhoid, yellow fever, rabies and bat lyssavirus infections. When Aus-tralian travellers are protected against infection, the Australian resident population is alsoprotected because vaccinated travellers are less likely to bring the infections back into thecountry where they could spread further.
Vaccines used in the standard schedule of immunisation in Australia are diphtheria, tet-anus, pertussis, measles, mumps and rubella, polio, Haemophilus influenzae type B(Hib) and hepatitis B (NHMRC 1997b). All these vaccines are highly effective (range 84%to 100%) (Hall 1998).
01 AH2000 body Page 35 Thursday, June 1, 2000 3:06 PM

36 AustraliaÕs Health 2000
TRIM SIZE 175 mm Wide x 250 mm Deep
Before the establishment of ACIR, which collects information directly from providers,the ABS collected information on immunisation coverage by asking parents whethertheir children had been vaccinated. The most recent ABS data suggest that only 52% ofchildren aged 0Ð6 years are fully immunised for their age, excluding Haemophilusinfluenzae type B (Hib), 46% are partially immunised and the remaining 2% are either notimmunised or their immunisation status is unknown (ABS 1996a). Vaccination coveragealso varied by type of vaccine, age, State, socioeconomic status and country of origin.
Reliable ACIR data will not be available until 2001 but preliminary analysis indicatesthat the ABS surveys probably overestimate the degree of vaccination coverage(McIntyre et al. 1998).
Allergies, auto-immunity and immunodeficiency
High-quality immunological health requires fine regulation of the bodyÕs immunesystem. In certain circumstances, however, the immune system may overreact to certainantigens giving rise to allergies such as asthma. In other cases, and for reasons not yetwell understood, the immune system may fail to recognise the difference between thebody and the foreign agent, i.e. self and non-self, and react against the body cellsleading to a variety of auto-immune diseases. Examples include Type 1 diabetes andrheumatoid arthritis. Lack of effective immune functioning also results from a variety ofimmunodeficiencies such as AIDS.
There is a growing body of evidence that physical and emotional stress, includingdepression, can reduce natural immunity (Olff 1999). This can happen either throughdirect transmission of signals from the nervous system to the immune system, orthrough hormones produced during stress and during pregnancy which can adverselyaffect the immune system. It would appear that a sense of wellbeing and security,including good mental health, mediated through the immune system, has beneficialeffects for health in general.
Allergies
Allergic reactions can occur to such things as wasp and bee venom, particular drugs,certain foods, plants, dust mites and pets or other animals. These substances are calledallergens. For example, hay fever occurs when the immune system reacts to pollenallergens and becomes sensitised. Later exposure to the same allergen will cause a rapidand vigorous immune response that includes the release of histamines and otherchemicals. The bodyÕs reaction to histamines causes the symptoms of the allergy,sneezing, a runny nose and tears. If a reaction occurs in the tissues of the respiratorytract, it can cause smooth muscle contraction leading to breathing difficulties (Kay &Lessof 1992).
Allergies are also believed to be involved in the development of asthma, an increasinglyserious disease in Australia (Robertson et al. 1991). It is possible that allergens play animportant role in the sensitisation and persistence of T cell subsets responsible forcausing and maintaining the asthmatic condition. These cells occur in the lungs, andcontinued exposure to allergens results in an immune response that causes theobstruction of airflow in the lungs during an asthma attack (Kay 1997).
01 AH2000 body Page 36 Thursday, June 1, 2000 3:06 PM

2 The health of Australians 37
TRIM SIZE 175 mm Wide x 250 mm Deep
The rapid increase in asthma in developed countries has led some experts to suggestthat the absence of infections in childhood, due to improved hygiene and effectivechildhood immunisation, is responsible for the persistence of an early life, immatureimmune response. This is particularly the case in genetically susceptible individuals(Abramson & Walters 2000).
Auto-immunity
The failure of the immune system to distinguish between self and non-self leads to avariety of auto-immune diseases, including:
¥ systemic lupus erythmatosus, in which people develop immunity against nucleicacids released by the breakdown of normal cells (Bach & Koutouzov 1997);
¥ rheumatoid arthritis, a crippling disease in which the immune system attacks thecartilage and bone of joints;
¥ Type 1 diabetes, which results from the destruction of the insulin-producing cells ofthe pancreas;
¥ rheumatic fever, where antibodies against streptococcus also react with heart muscle,damaging heart valves; and
¥ multiple sclerosis, believed to be caused by auto-immune responses to certaincomponents of the nervous system.
The incidence, prevalence, morbidity and mortality associated with auto-immunediseases are difficult to establish. These diseases may share a common aetiology, but areexpressed in a diverse range of illnesses and outcomes. A wide range of information iscollected on epidemiological aspects of these diseases, but the degree to which they areclassified as auto-immune in administrative collections varies. No consistentcategorisation of auto-immune diseases occurs, and this may underestimate theirburden on the community.
Auto-immune diseases are responsible for significant illness, disability and activityrestriction in Australia. A major impact of these diseases is disability rather thanpremature mortality. With the exception of Type 1 diabetes, auto-immune diseases aremore highly prevalent among females than males (Figure 2.14, page 38), and thisdifference is reflected in hospital separation and mortality statistics (Table 2.2).
Table 2.2: Hospital separations (1997Ð98) and deaths (1998) for selected diseases and conditions with large auto-immune components
Condition ICD-9 code(s)
Hospital separations Mortality
Males Females Males Females
Type 1 diabetes* 250 5,974 5,628 — —
Rheumatic heart disease 390–398 764 1,308 87 171
Rheumatoid arthritis 714 1,603 4,080 29 106
Multiple sclerosis 340 771 2,224 31 63
Systemic lupus 710.0 208 873 10 44
* Type 1 diabetes is not coded separately in mortality collections.
Sources: AIHW National Morbidity Database and AIHW National Mortality Database.
01 AH2000 body Page 37 Thursday, June 1, 2000 3:06 PM

38 AustraliaÕs Health 2000
TRIM SIZE 175 mm Wide x 250 mm Deep
ImmunodeÞciencyImmunodeficiency arises through a variety of mechanisms. Some people are born withdefective immune systems. In other cases, cancerous cells may suppress or damage theimmune system. Some micro-organisms attack the immune system itself, leaving itunable to protect the body against other micro-organisms. A good example of the latteris infection with HIV, which causes weakness of the immune system leading to AIDS.When damage to the immune system reaches a certain point, cellular immunitycollapses and opportunistic infections and diseases such as KaposiÕs sarcoma andpneumocystis pneumonia can kill the host.
2.2 Burden of disease and injury The burden of disease refers to the impact on ÔhealthyÕ life of illness, injury, disabilityand premature mortality. Illnesses and conditions present in Australia are described,including estimates of their incidence and prevalence, using a range of data sources.The section on mortality describes trends in death rates by cause of death and identifiesthe contributions made by major diseases. A further section presents the results of theAustralian Burden of Disease and Injury Study which combined information fromvarious aspects of disease and injury into a single measure, disability-adjusted life years(DALYs).
Sources: AIHW National Morbidity Database; AIHW: Mathers et al. 1999a.
Figure 2.14: Prevalence of selected auto-immune conditions, 1996
Multiple sclerosis
Rheumatic heart disease
Type 1 diabetes
Rheumatoid arthritis
0 50 100 150 200 250 300 350 400 450 500Rate per 100,000 population
Males
Females
01 AH2000 body Page 38 Thursday, June 1, 2000 3:06 PM

2 The health of Australians 39
TRIM SIZE 175 mm Wide x 250 mm Deep
MortalityThis section describes the patterns of mortality in the Australian population in terms ofrate and cause of death, by age and sex. Trends in death rates over the period 1921 to1998 are also described. Mortality differentials by socioeconomic status, country ofbirth, ethnicity and remoteness are discussed in chapter 4.
Mortality patterns
In 1998, there were 127,194 deaths recorded in Australia, consisting of 67,066 maledeaths (758 per 100,000) and 60,128 female deaths (468 per 100,000). Deaths of personsaged 70 years and over accounted for 70% of all deaths, 20% occurred at ages50Ð69 years, 8% at ages 20Ð49 years, and 2% at ages less than 20 years.
Major causes of death by life stage
The major causes of death in various age groups in 1998 were as follows:
¥ The main underlying causes of deaths in infants (those aged less than 1 year) werecongenital anomalies, respiratory conditions and sudden infant death syndrome(SIDS) (also see section 4.1).
Box 2.6: Comparing death ratesStatistics relating to deaths are easily presented as crude death rates, i.e. the number ofdeaths in a year divided by the number of individuals in the corresponding population. Forexample, the crude death rate in Australia in 1998 was 680 deaths per 100,000 population.
However, since the risk of dying varies greatly with age and sex, even minor variations inthe age and sex structure of a population may affect crude death rates. This makes compar-isons between different populations and analysis of time trends in the same populationerroneous. One way around this difficulty is to compare age-specific death rates, i.e. mor-tality at particular ages for each sex, but this entails a separate comparison or analysis foreach age group. Interpopulation or temporal variations in age structure, however, can beadjusted by a simple statistical procedure called age standardisation.
In this report, unless otherwise specified, death rates have been directly age standardised tothe Australian population as at 30 June 1991 (ABS 1993b). Both AIHW and ABS haveagreed to adopt this as the national standard until population estimates for 30 June 2001become available. The population at 30 June 1991 was the standard used in the 1996 and1998 editions of AustraliaÕs Health, whereas the 1992 and 1994 editions used the popul-ation at 30 June 1988 as the standard. For this reason, age-standardised death rates in thispublication cannot be directly compared with those in the 1992 and 1994 editions.
The major causes of death are typically coded according to the International Classificationof Diseases (ICD) system, Version 9 (WHO 1977). The ICD-9 classification categorisesdiseases into sixteen broad groupings or chapters on the basis of type of condition or bodysystem. Causes of death can be further disaggregated either on the basis of similar diseaseaetiology (e.g. infectious diseases or cancers), or into specific disease entities (e.g. tubercu-losis, breast cancer or AIDS).
01 AH2000 body Page 39 Thursday, June 1, 2000 3:06 PM

40 AustraliaÕs Health 2000
TRIM SIZE 175 mm Wide x 250 mm Deep
¥ In children aged between 1 and 14 years, motor vehicle traffic accidents, congenitalabnormalities, leukaemia and drowning were the most frequent underlying causesof death.
¥ Among those aged 15Ð24 years, deaths from motor vehicle accidents, suicide anddrug dependence were the most common.
¥ Suicide, motor vehicle accidents, ischaemic heart disease (IHD), deaths due to the useand abuse of drugs of dependence, and breast cancer (in females) were the majorcauses of death among those aged 25Ð44 years.
¥ Among those aged 50 years and over, the most common causes of death weregenerally the same as for the total populationÑIHD, cerebrovascular disease orstroke, lung cancer, bowel cancer, cancer of the breast (females) and chronicobstructive pulmonary disease (COPD).
Trends in major causes of death, 1921 to 1998In 1998, seven major causes of death stood out when ranked by the number of deaths.These were: IHD, cerebrovascular disease or stroke, lung cancer, colorectal cancer,COPD, and breast and prostate cancers (Table 2.3). Trends in death rates for these majorunderlying causes over the period 1921 to 1998 are shown in Figures 2.15 and 2.16,page 41.
Table 2.3: Leading causes of death by number of deaths and sex, 1998
Males Females
Cause of death No. Cause of death No.
1 Ischaemic heart disease (410–414) 15,021 1 Ischaemic heart disease (410–414) 12,801
2 Lung cancer (162) 4,821 2 Cerebrovascular disease (430–438) 7,170
3 Cerebrovascular disease (430–438) 4,812 3 Dementia and related disorders (290, 294.1, 331)(a)
2,579
4 Chronic obstructive pulmonary disease (416.0, .8, .9, 490–492, 495–496)
3,325 4 Breast cancer (174) 2,542
5 Colorectal cancer (153, 154) 2,579 5 Colorectal cancer (153, 154) 2,165
6 Prostate cancer (185) 2,530 6 Lung cancer (162) 2,053
7 Suicide (950–959) 2,150 7 Chronic obstructive pulmonary disease (416.0, .8, .9, 490–492, 495–496)
2,026
8 Cancer of lymphatic tissue (200–208) 1,870 8 Cancer of lymphatic tissue (200–208) 1,600
9 Diabetes (250) 1,424 9 Diabetes (250) 1,327
10 Dementia and related disorders (290, 294.1, 331)(a)
1,294 10 Pneumonia (480–486)(a) 937
(a) Data are for 1996, as data for 1997 and 1998 are not comparable with previous years following the introduction of automatic coding by the Australian Bureau of Statistics in 1997.
Note: Codes refer to the International Classification of Diseases, 9th revision (ICD-9).
Source: AIHW National Mortality Database.
01 AH2000 body Page 40 Thursday, June 1, 2000 3:06 PM

2 The health of Australians 41
TRIM SIZE 175 mm Wide x 250 mm Deep
Ischaemic heart disease is the biggest cause of death in Australia. In 1998, there were171 deaths per 100,000 males and 93 deaths per 100,000 females with IHD as theunderlying cause of death.
IHD death rates climbed steadily from 1940 to 1968 (AIHW: dÕEspaignet 1993). Sincethen, the rates have declined steadily, by 3.6% in males and 3.0% in females per annum.The decline has been steeper over the past 5 years (1994 to 1998), with death ratesdeclining annually by 5.4% in males and 5.5% in females.
The reduction in IHD death rates is believed to be due mainly to prevention, notably:
¥ reduction in the prevalence of smoking
¥ control of blood pressure
¥ reduction of saturated fats in the diet
¥ improved management of the disease including the use of anti-hypertensive drugsand medical interventions.
Notes
1. The time series for ischaemic heart disease begins in 1968 due to coding changes between the ICD-8 and previous versions of the ICD.
2. The time series for chronic obstructive pulmonary disease (COPD) breaks at 1979 due to coding changes between the ICD-9 and previous versions of the ICD.
Source: AIHW National Mortality Database.
Figure 2.15: Trends in major causes of death, males, 1921 to 1998
1
10
100
1,000
1920 1930 1940 1950 1960 1970 1980 1990 2000
Deaths per 100,000 population
Year
Ischaemic heart disease
Cerebrovascular disease
COPD
Lung cancer
Colorectal cancer
Prostate cancer
01 AH2000 body Page 41 Thursday, June 1, 2000 3:06 PM

42 AustraliaÕs Health 2000
TRIM SIZE 175 mm Wide x 250 mm Deep
Cerebrovascular disease or stroke is the second biggest underlying cause of death, with56 deaths per 100,000 males and 51 deaths per 100,000 females in 1998.
Death rates for stroke increased over the first half of the century, but began to slowdown between 1950 and 1970. The rate peaked in the early 1950s in females, and in thelate 1960s in males. Since 1970, death rates for stroke have declined annually by over4.6% in males and 4.9% in females. As with IHD, changes in lifestyle and improvementsin the management of the disease are considered to have contributed to the decline inthese death rates.
Lung cancer is the leading cause of cancer deaths in Australia, with 53 deaths per 100,000males and 19 deaths per 100,000 females in 1998.
Between 1940 (when lung cancer was identified as a specific cause of death) and 1982,the death rate for lung cancer in males increased steadily. The rate has since declined,1.7% annually, with a more rapid decline over the 5-year period commencing in 1993.The death rate for lung cancer in females also increased during 1940 to 1967, but at arate lower than that in males. But, unlike males, the overall death rate for lung cancer in
Notes
1. The time series for ischaemic heart disease begins in 1968 due to coding changes between the ICD-8 and previous versions of the ICD.
2. The time series for chronic obstructive pulmonary disease (COPD) breaks at 1979 due to coding changes between the ICD-9 and previous versions of the ICD.
Source: AIHW National Mortality Database.
Figure 2.16: Trends in major causes of death, females, 1921 to 1998
1
10
100
1,000
1920 1930 1940 1950 1960 1970 1980 1990 2000
Deaths per 100,000 population
Year
Ischaemic heart disease
Cerebrovascular disease
COPD
Lung cancer
Colorectal cancer
Female breast cancer
01 AH2000 body Page 42 Thursday, June 1, 2000 3:06 PM
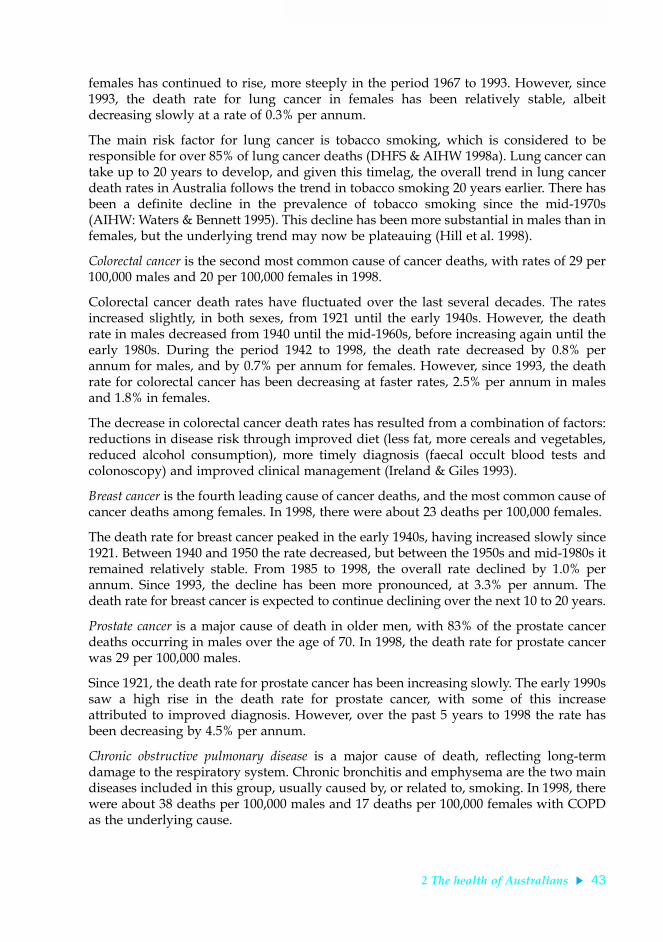
2 The health of Australians 43
TRIM SIZE 175 mm Wide x 250 mm Deep
females has continued to rise, more steeply in the period 1967 to 1993. However, since1993, the death rate for lung cancer in females has been relatively stable, albeitdecreasing slowly at a rate of 0.3% per annum.
The main risk factor for lung cancer is tobacco smoking, which is considered to beresponsible for over 85% of lung cancer deaths (DHFS & AIHW 1998a). Lung cancer cantake up to 20 years to develop, and given this timelag, the overall trend in lung cancerdeath rates in Australia follows the trend in tobacco smoking 20 years earlier. There hasbeen a definite decline in the prevalence of tobacco smoking since the mid-1970s(AIHW: Waters & Bennett 1995). This decline has been more substantial in males than infemales, but the underlying trend may now be plateauing (Hill et al. 1998).
Colorectal cancer is the second most common cause of cancer deaths, with rates of 29 per100,000 males and 20 per 100,000 females in 1998.
Colorectal cancer death rates have fluctuated over the last several decades. The ratesincreased slightly, in both sexes, from 1921 until the early 1940s. However, the deathrate in males decreased from 1940 until the mid-1960s, before increasing again until theearly 1980s. During the period 1942 to 1998, the death rate decreased by 0.8% perannum for males, and by 0.7% per annum for females. However, since 1993, the deathrate for colorectal cancer has been decreasing at faster rates, 2.5% per annum in malesand 1.8% in females.
The decrease in colorectal cancer death rates has resulted from a combination of factors:reductions in disease risk through improved diet (less fat, more cereals and vegetables,reduced alcohol consumption), more timely diagnosis (faecal occult blood tests andcolonoscopy) and improved clinical management (Ireland & Giles 1993).
Breast cancer is the fourth leading cause of cancer deaths, and the most common cause ofcancer deaths among females. In 1998, there were about 23 deaths per 100,000 females.
The death rate for breast cancer peaked in the early 1940s, having increased slowly since1921. Between 1940 and 1950 the rate decreased, but between the 1950s and mid-1980s itremained relatively stable. From 1985 to 1998, the overall rate declined by 1.0% perannum. Since 1993, the decline has been more pronounced, at 3.3% per annum. Thedeath rate for breast cancer is expected to continue declining over the next 10 to 20 years.
Prostate cancer is a major cause of death in older men, with 83% of the prostate cancerdeaths occurring in males over the age of 70. In 1998, the death rate for prostate cancerwas 29 per 100,000 males.
Since 1921, the death rate for prostate cancer has been increasing slowly. The early 1990ssaw a high rise in the death rate for prostate cancer, with some of this increaseattributed to improved diagnosis. However, over the past 5 years to 1998 the rate hasbeen decreasing by 4.5% per annum.
Chronic obstructive pulmonary disease is a major cause of death, reflecting long-termdamage to the respiratory system. Chronic bronchitis and emphysema are the two maindiseases included in this group, usually caused by, or related to, smoking. In 1998, therewere about 38 deaths per 100,000 males and 17 deaths per 100,000 females with COPDas the underlying cause.
01 AH2000 body Page 43 Thursday, June 1, 2000 3:06 PM

44 AustraliaÕs Health 2000
TRIM SIZE 175 mm Wide x 250 mm Deep
Death rates for COPD have followed a pattern similar to those for deaths from lungcancer in both males and females. COPD death rates in males increased steadily fromthe early 1950s, peaking in 1970. In the period 1970 to 1998, the male death rate declinedby 1.9% per annum, and since 1993 the decline has been 6.0% per annum. In females,the overall COPD death rate increased between 1960 and 1998, at almost 4.5% perannum. Since 1996, however, there has been little decline in the COPD death rateamong females.
Multiple causes of death Use of mortality data in understanding disease processes has been limited until recentlyby having information on only the single underlying cause of death. However, since1997 the ABS has been coding multiple causes of death information from deathcertificates. In 1998, more than one cause of death was listed on 71.5% of deathcertificates. In more than a half of these deaths, at least three causes of death were listed.
This additional information is potentially very useful for understanding, throughdisease-association and co-morbidity studies, the role of various factors contributing todeath. For example, of the 15,024 male deaths in 1998 with IHD as the stated underlyingcause of death, IHD was recorded as the sole cause of death in only 13% of cases. Heartfailure was listed as an additional cause of death in 16.5% of cases with IHD as theunderlying cause of death and hypertensive disease in 14.1% of cases. Another commoncause of death associated with IHD deaths was diabetes (9.1%). There were similarassociations for IHD deaths in females (Table 2.4).
Illness, morbidity and health conditionsThis section provides a brief overview of the incidence and prevalence of the mostcommon illnesses (morbidity) and health conditions in Australia. Information fromseveral different sources, including population surveys, GP visits and hospitalseparations, can be used to generate a profile of the extent of illness in the community.The prevalence of illness in the population, as determined by the National Health
Table 2.4: Additional causes of death associated with ischaemic heart disease as the underlying cause of death, 1998
Cause of death Additional cause of death
Males Females
Number Per cent Number Per cent
Reported alone 1,958 13.03 1,239 9.68
Reported with Cancer 1,035 6.89 538 4.20
Diabetes 1,366 9.09 1,130 8.83
Hypertensive disease 2,117 14.09 2,342 18.30
Heart failure 2,480 16.51 2,927 22.87
Cerebrovascular disease 1,097 7.30 1,184 9.25
Diseases of blood vessels 1,543 10.27 1,234 9.64
Pneumonia and influenza 573 3.81 541 4.23
Chronic obstructive pulmonary disease 1,716 11.42 1,037 8.10
Nephritis 1,018 6.78 798 6.23
Total deaths 15,024 12,801
Source: ABS 1999a.
01 AH2000 body Page 44 Thursday, June 1, 2000 3:06 PM

2 The health of Australians 45
TRIM SIZE 175 mm Wide x 250 mm Deep
Surveys (NHS), is briefly described below. Profiles of illness and morbidity, based ongeneral practitioner (GP) visits and hospital separations, are described in chapter 5. Formore details on actions taken in response to ill health, based on 1995 NHS data, seeAustraliaÕs Health 1998.
The scale of the problemAbout 85% of Australians report having an illness or condition either as a recent illnessin the previous 2 weeks or as a long-term condition. Three out of four persons also takesome form of health action in relation to their health in any 2-week period, with about60% taking some form of medication other than vitamins and minerals andapproximately one out of five consulting a doctor (ABS 1997b). In addition, some 9% ofthe employed population report taking days off work due to illness, most commonlyfor respiratory illnesses such as influenza, in any 2-week period (ABS 1997b).
These figures may suggest that a large proportion of the Australian population does notenjoy Ôfull healthÕ at all times. However, while many chronic or more serious conditionsare reported, these figures also include minor and temporary conditions, as well asconditions under control.
Recent and long-term conditionsAccording to the 1995 NHS, 65% of males and 73% of females reported experiencingone or more recent illnesses. Diseases of the respiratory system were the most commonrecent illnesses, reported by 22% of the population in 1995. The most frequentlyreported respiratory conditions were asthma, the common cold and influenza. Othercommonly reported recent illnesses were headaches (13%), diseases of the circulatorysystem (12%), and diseases of the digestive system (11%).
Around three-quarters of the population (73% of males, 76% of females) reportedhaving one or more long-term health conditions (conditions experienced for 6 monthsor more). Sight conditions were the most common long-term conditions reported; forexample, 21% were far-sighted, 20% were short-sighted, and 14% had other sightdisorders of refraction and accommodation. Other commonly reported long-termconditions were arthritis (15%), hay fever (14%), asthma (11%) and hypertension (10%).
Disease incidence and prevalenceThe Australian Burden of Disease and Injury Study has produced comprehensiveestimates of incidence, prevalence and average duration for a large number of diseasesand injuries and their disabling effects for Australians in 1996 (AIHW: Mathers et al.1999a). The estimates synthesise the available information from the most appropriatesources for each condition.
Table 2.5 (page 46) contains estimates of the total number of prevalent cases of the mostcommon diseases and injuries in Australia for 1996. Dental caries (tooth decay) wasestimated to be the most common health problem in Australia, with an average ofalmost one decayed tooth per person at any one point of time. The next most commonproblem was hearing loss; nearly 17% of the population are estimated to have hearingloss of a level sufficient to cause problems in conversations with more than one person.Edentulism or total tooth loss (nearly 8% of the population) and asthma (with aprevalence of nearly 7%) were the other major problems.
01 AH2000 body Page 45 Thursday, June 1, 2000 3:06 PM

46 AustraliaÕs Health 2000
TRIM SIZE 175 mm Wide x 250 mm Deep
Table 2.5: Most prevalent health conditions, 1996
Condition (a)
Prevalence (b)
Prevalence (%)Persons Males Females
1 Dental caries(c) 19,014,000 9,567,000 9,447,000 —
2 Hearing loss 3,088,300 2,245,800 842,500 16.9
3 Edentulism 1,396,700 392,400 1,004,300 7.6
4 Asthma 1,206,100 533,900 672,200 6.6
5 Periodontal disease(d) 1,027,200 494,700 532,500 5.6
6 Iron-deficiency anaemia 769,400 275,800 493,600 4.2
7 Alcohol dependence & harmful use 727,800 538,500 189,300 4.0
8 Osteoarthritis 625,000 241,500 383,500 3.4
9 Chronic back pain 585,800 300,500 285,300 3.2
10 Depression(e) 538,000 163,900 374,100 2.9
11 Type 2 diabetes 469,400 247,400 222,000 2.6
12 Slipped disc(f) 340,100 214,000 126,100 1.9
13 Urinary incontinence(g) 307,200 50,200 257,000 1.7
14 Chronic obstructive pulmonary disease 296,600 177,100 119,500 1.6
15 Social phobia(h) 291,100 130,000 161,100 1.6
16 Generalised anxiety disorder(h) 285,600 106,100 179,500 1.6
17 Fires/burns/scalds(i) 231,200 154,000 77,200 1.3
18 Benign prostatic hypertrophy(j) 195,400 195,400 — 1.1
19 Peptic ulcer disease 174,100 78,700 95,400 1.0
20 Attention-deficit disorder 173,200 125,200 48,000 0.9
21 Cannabis dependence/abuse 171,000 128,700 42,300 0.9
22 Cataracts 168,800 48,400 120,400 0.9
23 Angina pectoris 168,100 90,500 77,600 0.9
24 Osteoporosis 155,200 29,100 126,100 0.8
25 Bipolar affective disorder 133,400 67,900 65,500 0.7
(a) Prevalence has not been estimated for infectious diseases (apart from HIV/AIDS) or for cancers, congenital anomalies and maternal conditions related to pregnancy and childbirth. These diseases are not included in the rankings, but would not appear in the top 25 prevalent conditions.
(b) Prevalent cases of disease or injury, except where otherwise specified. Some prevalence estimates are derived from modelling of incidence and duration and assume a stationary population with no trends in incidence rates or average duration. All prevalence estimates rounded to nearest 100.
(c) Prevalence estimates relate to total decayed teeth (excluding missing and filled teeth), not to people with decayed teeth.
(d) Periodontal disease with pockets 6 mm or more deep.
(e) Prevalence estimates relate to people with dysthymia or experiencing a major depressive episode in the 12-month period of 1996.
(f) Prevalence refers to number of people with chronic conditions.
(g) Moderate and severe urinary incontinence (leaking urine occurring ‘often’) not due to neurological disorders, stroke, prostate problems or other diseases or injury.
(h) People experiencing symptomatic episodes in the 12-month period of 1996.
(i) Prevalence estimates include only people with long-term effects of injuries.
(j) Symptomatic benign prostate enlargement resulting in treatment.
Source: Australian Burden of Disease and Injury Study.
01 AH2000 body Page 46 Thursday, June 1, 2000 3:06 PM

2 The health of Australians 47
TRIM SIZE 175 mm Wide x 250 mm Deep
Table 2.6 contains estimates of the total number of new cases of the most commondiseases and injuries occurring in Australia in 1996. The condition with the highestincidence was upper respiratory tract infection (colds, acute sinusitis, tonsillitis, etc.).
Table 2.6: Most common new health conditions, 1996
Condition (a)
Incidence (b)Incidence per
1,000 populationPersons Males Females
1 Upper respiratory tract infections 43,399,200 20,794,600 22,604,600 2,370
2 Dental caries(c) 10,877,800 5,432,300 5,445,500 594
3 Chronic back pain 6,035,300 3,141,100 2,894,200 330
4 Diarrhoeal diseases 3,754,200 1,863,400 1,890,800 205
5 Lower respiratory tract infections 3,480,200 1,589,100 1,891,100 190
6 Otitis media 1,018,500 478,200 540,300 56
7 Periodontal disease(d) 399,700 195,300 204,400 22
8 Depression(e) 376,700 115,400 261,300 21
9 Falls(f) 359,141 175,070 184,071 20
10 Non-melanoma skin cancers 282,825 167,751 115,074 15
11 Alcohol dependence & harmful use 161,482 120,162 41,320 9
12 Peptic ulcer disease 156,045 73,199 82,846 9
13 Slipped disc(g) 143,489 83,769 59,720 8
14 Hearing loss 111,484 70,212 41,272 6
15 Menstrual problems(h) 106,952 — 106,952 6
16 Road traffic accidents(f) 88,139 54,711 33,428 5
17 Diverticulitis(i) 77,117 34,676 42,441 4
18 Separation anxiety disorder 73,199 37,505 35,694 4
19 Sports injuries(f) 70,732 52,157 18,575 4
20 Asthma 69,434 32,048 37,386 4
21 Gall bladder and bile duct disease(i) 66,132 21,309 44,823 4
22 Stroke 57,244 26,488 30,756 3
23 Benign prostatic hypertrophy(j) 53,752 53,752 — 3
24 Interpersonal violence(f) 47,585 36,343 11,242 3
25 Angina pectoris 44,548 28,468 16,080 2
(a) Incidence of iron-deficiency anaemia has not been estimated.
(b) Incident (new) cases of disease or injury occurring in Australia in 1996, except where otherwise specified. Some incidence estimates are derived from modelling of prevalence, case-fatality and remission rates and assume a stationary population with no trends in incidence, remission and case-fatality rates. Incidence estimates rounded to nearest 100.
(c) Incidence estimates relate to decayed teeth (excluding missing and filled teeth), not to people with decayed teeth.
(d) Periodontal disease with pockets 6 mm or more deep.
(e) Incidence estimates relate to number of major depressive episodes in the 12-month period of 1996, together with number of new cases of dysthymia (not resulting in a major depressive episode in 1996).
(f) New cases of injury requiring hospitalisation or attendance at a hospital emergency department.
(g) Total episodes of intervertebral disc disorders in 1996.
(h) Based on self-reported episodes of menstrual problems in the 1995 National Health Survey.
(i) Incidence estimated from hospitalisation data for Australia.
(j) Symptomatic benign prostate enlargement resulting in treatment.
Source: Australian Burden of Disease and Injury Study.
01 AH2000 body Page 47 Thursday, June 1, 2000 3:06 PM

48 AustraliaÕs Health 2000
TRIM SIZE 175 mm Wide x 250 mm Deep
This was followed by dental caries and then chronic back pain, with an estimated6 million new episodes per year. There were around 3.8 million new episodes ofdiarrhoeal disease per year, or around one for every five Australians.
Disability Disability is defined by the ABS as the presence of one or more of 17 Ôrestrictions,limitations or impairmentsÕ (Box 2.7). According to the ABS Survey of Disability, Ageingand Carers, about 3.6 million people reported disability in 1998, a prevalence rate of19.3% (Table 2.7). Almost 80% of people with a disability, or over 2.8 million people,reported core activity restrictions in 1998 (ABS 1999b). The extent of disability isdescribed in AustraliaÕs Welfare 1999 (AIHW 1999a).
Expected years of life with disability and core activity restrictionBased on 1998 mortality data, the life expectancy is 75.9 years for Australian males and81.5 years for Australian females. Only 57.5 (76%) and 63.3 (78%) of those years areexpected to be disability-free. In terms of profound and severe core activity restriction,it is estimated that 5.2 male life years and 7.6 female life years will be affected (AIHWunpublished data).
Australian Burden of Disease and Injury StudySo far, this chapter has looked at mortality, morbidity and disability in Australia, usingdeath rates, indicators of disease incidence and prevalence, and core activityrestrictions, each presented separately. This section presents a means of bringing theseisolated indicators together to present a summary view of the Ôburden of diseaseÕ.
The Global Burden of Disease Study has developed a new summary measure ofpopulation health, the disability-adjusted life year or DALY, that combines informationon the impact of premature death and of disability and other non-fatal health outcomes(Murray & Lopez 1996) (see Box 2.8, page 50). This measure was used to provide acomprehensive assessment of the global burden of disease and injury for the World
Table 2.7: Prevalence of disability (numbers and rates), by disability status, severity of core activity restriction and sex, 1998
Profoundcore
activityrestriction
Severecore
activityrestriction
Moderatecore
activityrestriction
Mild coreactivity
restriction
School-ing or
employ-ment
restrictiononly
Total withspecific
restrictions
Withoutspecific
restrictions
Totalwith
disability
Number (’000)
Males 218.8 286.6 338.6 534.3 188.4 1,566.7 254.4 1,821.1
Females 318.9 311.6 321.7 497.5 139.5 1,589.2 200.0 1,789.2
Persons 537.7 598.2 660.3 1,031.8 327.9 3,155.9 454.4 3,610.3
Percentage
Males 2.4 3.1 3.6 5.8 2.3 16.9 2.7 19.6
Females 3.4 3.3 3.4 5.3 1.7 16.9 2.2 19.1
Persons 2.9 3.2 3.5 5.5 2.0 16.9 2.4 19.3
Sources: ABS 1999b:14; AIHW 1999a.
01 AH2000 body Page 48 Thursday, June 1, 2000 3:06 PM
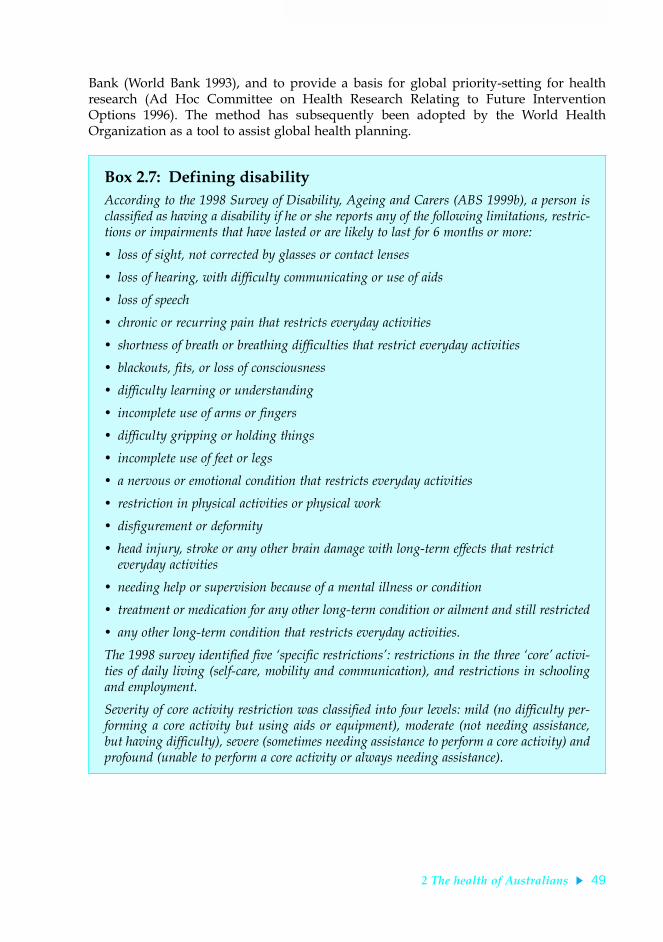
2 The health of Australians 49
TRIM SIZE 175 mm Wide x 250 mm Deep
Bank (World Bank 1993), and to provide a basis for global priority-setting for healthresearch (Ad Hoc Committee on Health Research Relating to Future InterventionOptions 1996). The method has subsequently been adopted by the World HealthOrganization as a tool to assist global health planning.
Box 2.7: Defining disabilityAccording to the 1998 Survey of Disability, Ageing and Carers (ABS 1999b), a person isclassified as having a disability if he or she reports any of the following limitations, restric-tions or impairments that have lasted or are likely to last for 6 months or more:
¥ loss of sight, not corrected by glasses or contact lenses
¥ loss of hearing, with difficulty communicating or use of aids
¥ loss of speech
¥ chronic or recurring pain that restricts everyday activities
¥ shortness of breath or breathing difficulties that restrict everyday activities
¥ blackouts, fits, or loss of consciousness
¥ difficulty learning or understanding
¥ incomplete use of arms or fingers
¥ difficulty gripping or holding things
¥ incomplete use of feet or legs
¥ a nervous or emotional condition that restricts everyday activities
¥ restriction in physical activities or physical work
¥ disfigurement or deformity
¥ head injury, stroke or any other brain damage with long-term effects that restrict everyday activities
¥ needing help or supervision because of a mental illness or condition
¥ treatment or medication for any other long-term condition or ailment and still restricted
¥ any other long-term condition that restricts everyday activities.
The 1998 survey identified five Ôspecific restrictionsÕ: restrictions in the three ÔcoreÕ activi-ties of daily living (self-care, mobility and communication), and restrictions in schoolingand employment.
Severity of core activity restriction was classified into four levels: mild (no difficulty per-forming a core activity but using aids or equipment), moderate (not needing assistance,but having difficulty), severe (sometimes needing assistance to perform a core activity) andprofound (unable to perform a core activity or always needing assistance).
01 AH2000 body Page 49 Thursday, June 1, 2000 3:06 PM

50 AustraliaÕs Health 2000
TRIM SIZE 175 mm Wide x 250 mm Deep
The AIHW has carried out a comprehensive study of the burden of disease in Australiafor the reference year 1996. This study adapted the DALY measure for the Australiancontext and calculated the disease burden for a comprehensive set of 176 disease andinjury categories.
This section provides an overview of the burden of disease and injury in Australiausing this statistic. More detailed results are given in two AIHW reports on theAustralian Burden of Disease and Injury Study (AIHW: Mathers et al. 1999a, 1999b).
Box 2.8: Disability-adjusted life year (DALY)The DALY is a summary measure of population health that combines information on mor-tality and non-fatal health outcomes. It was originally developed as part of the 1990 WorldHealth Organization and World Bank Global Burden of Disease Study and has beenadapted by the Australian Institute of Health and Welfare for the Australian context. Incommon with most summary health measures, the DALY uses time as a common Ôcur-rencyÕ. It is a measure of the years of healthy life lost due to illness or injuryÑone DALYis one lost year of ÔhealthyÕ life.
DALYs are calculated as the sum of years of life lost due to premature mortality (YLL) andthe equivalent years of ÔhealthyÕ life lost due to poor health or disability (YLD). YLL are cal-culated for each death as the average life expectancy of a person of the same age as theperson who died. Thus, unlike most measures of potential years of life lost, YLL do notexclude deaths above a specified age or years of life lost above that age. The YLL quoted inthis report are based on the projected average life expectancies for Australians alive in 1996.
YLD are calculated for a given condition by estimating the number of new cases of thatcondition in a specified time. For each new case, the YLD is obtained by multiplying theaverage duration of the condition (to remission or death) by a severity weight that quanti-fies the equivalent loss of healthy years of life due to living with the condition. The DALYvalue is then the sum of the YLL and the YLD.
The severity weights are derived to quantify societal preferences for health states. There areno comprehensive Australian measurements of such weights. The YLD quoted in thisreport are based on weights from a combination of sources. Where possible, the weights aretaken from a Dutch study of selected diseases of public health importance (Stouthard et al.1997). Where the Dutch weights are not available, the weights are taken from the 1990Global Burden of Disease Study. Where these are not available, provisional weights wereestimated using regression analysis based on the Dutch study results. The weights used inthis study should be regarded as provisional pending the development of internationallyaccepted standard weights or suitable Australian weights.
An annual discount rate of 3% is applied in calculating both the YLL and YLD. With thisdiscount rate, a year of healthy life gained in 10 years time is worth 24% less than onegained now. For example, a male infant death would result in 81 YLL without dis-counting, because this is the average male life expectancy at that age. The same deathwould result in 30 YLL with discounting. All YLL, YLD and DALY figures presented inthis report are based on new cases of disease and injury and deaths occurring in the cal-endar year 1996 and include discounting.
01 AH2000 body Page 50 Thursday, June 1, 2000 3:06 PM

2 The health of Australians 51
TRIM SIZE 175 mm Wide x 250 mm Deep
The burden of disease associated with each of the National Health Priority Areas isdescribed in section 2.3. The disease and injury burden in Australia attributable tomajor risk factors is described in chapter 3. Socioeconomic differentials and sexdifferentials in disease and injury burden are described in chapter 4.
The burden of premature mortality—YLL
In 1996, premature mortality was responsible for 1.35 million years of life lost (YLL)(discounted at 3% per annum) in Australia. Males lost 26% more years of life thanfemales. If male YLL are calculated using the cohort life expectancies for females (sothat there is no maleÐfemale difference in years of life lost due to a death at a given age),then the male excess mortality burden is 43%.
Cardiovascular diseases, cancers and injury were responsible for 72% of the total YLL inboth males and females. In people aged 75 years and over, cardiovascular diseasesaccounted for more than half the YLL, whereas cancers were a more important causethan cardiovascular diseases for all ages below 75. Injuries were the main cause of lostyears of life in young adults and children aged 5Ð14 years, and neonatal conditions themain cause in children aged under 5.
Ischaemic heart disease (IHD) was by far the largest cause of YLL in Australia in 1996(see Figure 2.17). IHD was followed by stroke and breast cancer in females, and by lungcancer and suicide in males. Heroin overdose deaths were in the top 20 causes of YLLfor males, resulting in almost as many years of life lost as HIV/AIDS or leukaemia.
Source: Australian Burden of Disease and Injury Study.
Figure 2.17: Distribution of mortality burden (YLL) and deaths for leading causes, 1996
Road traffic accidents
Suicide
Breast cancer
Prostate cancer
Diabetes mellitus
Dementia
Colorectal cancer
COPD
Lung cancer
Stroke
Ischaemic heart disease
0 5 10 15 20 25
01 AH2000 body Page 51 Thursday, June 1, 2000 3:06 PM

52 AustraliaÕs Health 2000
TRIM SIZE 175 mm Wide x 250 mm Deep
Because YLL give greater weight to deaths at younger ages, causes such as breastcancer, suicide and road traffic accidents claim a higher proportion of the prematuremortality burden than of the total number of deaths (Figure 2.17).
Trends in mortality burden, 1981 to 1996
There have been substantial declines in the mortality burden of cardiovascular diseases,road traffic accidents, low birthweight, and stomach cancer, for both males and females,over the last two decades. Overall, the age-adjusted mortality burden in Australia hasdeclined by 27% in the 15 years between 1981 and 1996 alone.
The burden of smoking-related diseases has decreased in males but increasedsubstantially in females. Between 1981 and 1996, the per person mortality burden forlung cancer and chronic obstructive pulmonary disease (COPD) decreased by 15% and16% respectively for males, but increased by 62% and 70% respectively for females.
The largest increases in YLL have occurred for HIV/AIDS, suicide and prostate cancerin males, for senile dementias and heroin dependence and abuse in both sexes, and forlung cancer and COPD in females. HIV/AIDS mortality peaked in 1989, and hasdropped dramatically since. The large apparent increase in YLL for dementia is likely tobe partly due to changes in coding practice that have led to increased identification ofdementia as an underlying cause of death.
Leading causes of the disability burden—YLD
The non-fatal component of the disease burden presents a substantially different picturefrom that provided by traditional mortality statistics. Figure 2.18 shows thecontributions for the major disease groups and injury to the total non-fatal burden ofdisease and injury in Australia in 1996.
Mental disorders were the leading cause of years of ÔhealthyÕ life lost due to disability(YLD) in 1996, accounting for nearly 30% of the total YLD in Australia. Nervous systemdisorders were responsible for 16% of YLD. The latter category was dominated bydementia and hearing loss.
In contrast to the mortality burden (YLL), the size of the overall disability burden (YLD)was almost identical for males and females. The YLD for nervous system disorders,mental disorders and musculoskeletal disorders were all higher for females than formales. The male burden was higher for cardiovascular diseases, diabetes, chronicrespiratory diseases and cancers.
Depression was the leading cause of YLD in Australia, causing 8% of the total YLD in1996. Hearing loss and alcohol dependence and harmful use were the second and thirdleading contributors to the YLD for males. Dementia and osteoarthritis were the secondand third leading contributors for females (AIHW: Mathers et al. 1999a).
Total burden of disease and injury—DALYs
The total burden of disease and injury in Australia in 1996 was estimated to be2.5 million DALYs. The male burden (in total DALYs) was 13% higher than the femaleburden. Non-fatal outcomes (YLD) were responsible for 43% of the male burden and49% of the female burden.
01 AH2000 body Page 52 Thursday, June 1, 2000 3:06 PM

2 The health of Australians 53
TRIM SIZE 175 mm Wide x 250 mm Deep
Note: Acute respiratory infections are included with the infectious diseases category in this figure.
Source: Australian Burden of Disease and Injury Study.
Figure 2.18: Non-fatal burden of disease (YLD) for major disease groups, 1996
Source: Australian Burden of Disease and Injury Study.
Figure 2.19: Burden of disease (YLL, YLD and total DALYs) for major disease groups, 1996
Other
Digestive system diseases
Oral health problems
Infectious diseases
Diabetes mellitus
Genito-urinary
Injuries
Cancer
Musculoskeletal disorders
Cardiovascular diseases
Chronic respiratory diseases
Nervous system disorders
Mental disorders
0 50 100 150 200 250 300 350YLD (’000)
Other
Neonatal conditions
Respiratory infections
Congenital
Infectious
Genito-urinary
Diabetes
Digestive
Musculoskeletal
Chronic respiratory
Injury
Nervous system
Mental illness
Cancer
Cardiovascular
0 100 200 300 400 500DALYs (’000s)
YLL
YLD
01 AH2000 body Page 53 Thursday, June 1, 2000 3:06 PM

54 AustraliaÕs Health 2000
TRIM SIZE 175 mm Wide x 250 mm Deep
Figure 2.19 shows the YLL and YLD contributions to total DALYs for the major diseasegroups and injury. Inclusion of non-fatal health outcomes provides a substantiallydifferent picture from that provided separately by traditional mortality or disabilitystatistics: mental disorders were the third leading cause of overall burden (14% of total)after cardiovascular diseases (20%) and cancers (19%). Central nervous system andchronic respiratory conditions were almost as large a contributor to total burden asinjuries.
The 15 leading causes of the burden of disease in Australia are shown in Table 2.8.Together, these 15 causes accounted for about 50% of the 1996 total disease burden inAustralia. Among these top 15 causes are 4 non-fatal or low-fatality diseases:depression, asthma, osteoarthritis and hearing loss. The burdens of mental illnessessuch as depression and alcohol dependence, and of non-fatal diseases such asosteoarthritis and hearing loss, have been seriously underestimated by traditionalapproaches that take into account only deaths and not disability.
The leading causes of death differ between the sexes. IHD and stroke are the twoleading causes of burden of disease in both sexes. Depression, dementia and breastcancer are the next three leading causes in females; in contrast, lung cancer, COPD andsuicide are respectively the third, fourth and fifth leading causes of burden of diseaseamong males (AIHW: Mathers et al. 1999a).
Table 2.8: The 15 leading causes of burden of disease, 1996
Per cent ofDALYs
1 Ischaemic heart disease 12.4
2 Stroke 5.4
3 Chronic obstructive pulmonary disease(a) 3.7
4 Depression 3.7
5 Lung cancer 3.6
6 Dementia 3.5
7 Diabetes mellitus 3.0
8 Colorectal cancer 2.7
9 Asthma 2.6
10 Osteoarthritis 2.2
11 Suicide and self-inflicted injuries 2.2
12 Road traffic accidents 2.2
13 Breast cancer 2.2
14 Hearing loss 1.9
15 Alcohol dependence and harmful use 1.8
(a) Chronic bronchitis and emphysema.
Source: AIHW: Mathers et al. 1999a.
01 AH2000 body Page 54 Thursday, June 1, 2000 3:06 PM

2 The health of Australians 55
TRIM SIZE 175 mm Wide x 250 mm Deep
The figures in Table 2.8 take into account only the actual condition with which someonehas been diagnosed. However, some conditions are also risk factors for otherconditions. For example, people with diabetes are also at higher risk of cardiovasculardisease. The data in Table 2.8 can be modified to take into account a broaderattributable burden in the following way:
¥ If the burden of suicide and self-inflicted injury attributable to depression is includedwith the disability burden of depression, the total burden of depression rises to 4.9%,making it the third leading cause of burden of disease in Australia, after IHD andstroke.
¥ If the burden of cardiovascular diseases attributable to diabetes is included withdiabetes, its total attributable burden rises to 4.9%, making it the equal third leadingcause of disease burden with depression.
¥ If the burden of diseases and injuries caused by alcohol use is included with its directburden in terms of mental health, the attributable burden of alcohol use rises to 2.2%.
2.3 NHPA diseases and conditionsThe preceding section outlined the contribution of various diseases and conditions tothe burden of disease in Australia. About 70% of the total burden has been attributed tocardiovascular problems, cancers, injuries, mental problems, diabetes mellitus andasthma, identified by Australian Health Ministers for priority action under the NationalHealth Priority Areas (NHPA) initiative.
The NHPA initiative is a collaborative effort involving Commonwealth, State andTerritory governments. It seeks to focus public attention and health policy on thoseareas that are known to contribute significantly to the burden of disease in Australia,and for which there is potential for health gain. The NHPA initiative recognises that inorder to reduce the burden of disease, strategies need to be holistic, and to encompassthe continuum of care from prevention through to treatment and management (AIHW& DHFS 1997).
This section gives an overview of the six NHPAs, providing information on theirincidence, prevalence, risk factors, illness, complications, disability and mortality. A setof indicators has been developed for each priority area to monitor progress towardsnational health targets. The AIHW has undertaken to report progress in each of thepriority areas biennially in AustraliaÕs Health. The latest information for each of theNHPA indicators is contained in Tables S52Ð57, pages 415Ð425. Further information onthe framework within which NHPA indicators have been developed can be found inchapter 6.
Cardiovascular diseaseCardiovascular disease comprises all diseases and conditions involving the heart andblood vessels including coronary heart disease, stroke, peripheral vascular disease andheart failure. The main underlying problem in cardiovascular disease is atherosclerosis,a process that clogs blood vessels with deposits of fat, cholesterol and other substances.It is most serious when it affects the blood supply to the heart (causing angina, heartattack or sudden death) or to the brain (which can lead to a stroke).
01 AH2000 body Page 55 Thursday, June 1, 2000 3:06 PM

56 AustraliaÕs Health 2000
TRIM SIZE 175 mm Wide x 250 mm Deep
Cardiovascular disease is AustraliaÕs greatest health problem. It kills more people thanany other disease (accounting for 40% of all deaths) and its health and economic burdenexceeds that of any other disease. In 1993Ð94, cardiovascular disease accounted for thelargest proportion of health system costs in Australia, $3.7 billion or 12% of total healthsystem costs (AIHW: Mathers & Penm 1999a). Cardiovascular disease accounted for22% of disease burden in Australia in 1996, 33.1% of premature mortality (YLL) and8.8% of years of equivalent ÔhealthyÕ life lost through disease, impairment and disability(YLD) (AIHW: Mathers et al. 1999a).
Based on the National Health Survey, an estimated 2.8 million Australians, or 16% ofthe population, had cardiovascular conditions in 1995. High blood pressure was themost common condition for both males and females (AIHW 1999c).
Much of the death, disability and illness caused by cardiovascular disease ispreventable. Many Australians remain at higher risk of the disease through smoking,being physically inactive, eating a diet high in saturated fats and/or being overweight.Many Australians have blood pressure and/or blood cholesterol above recommendedlevels; there has been little improvement in physical activity participation, and theproportion of overweight and obese Australians is on the increase.
Incidence
Coronary heart disease
There are no national data on the incidence of coronary heart disease in Australia.However, the Universities of Newcastle and Western Australia and the QueenslandDepartment of Health have developed a method to estimate the rate of coronary eventsamong people aged 35Ð69. Using this method, it is estimated that there were 19,910coronary events (mainly heart attacks) among people aged 35Ð69 in 1995Ð96. Non-fatalheart attacks represented almost two-thirds (12,955 cases) of these events. Non-fatalheart attacks were three times more common among males than females in the35Ð69 age group. Over the period 1984 to 1993, rates of non-fatal heart attacks fell byabout 3% per year (AIHW 1998a).
Stroke
Each year, around 40,000 Australians have a stroke, with 70% of these first-ever strokes.Stroke is the cause of nearly 25% of all chronic disability in Australia (NHMRC 1997c).It is more common among older Australians, with around 50% of all strokes occurringin those aged 75 and over. The incidence of stroke is higher in males than in femalesunder the age of 85. For 45-year-olds, the risk of having a stroke before age 85 is 1 in 4for males and 1 in 5 for females (AIHW 1999c).
Rheumatic fever and rheumatic heart disease
Although this disease is rare among the Australian population overall, its prevalenceamong Indigenous Australians is one of the highest in the world. The high rates ofrheumatic fever among Indigenous peoples are likely to reflect high levels of exposureto group A streptococci, with overcrowding and poor living conditions as major riskfactors (Carapetis & Currie 1998).
01 AH2000 body Page 56 Thursday, June 1, 2000 3:06 PM

2 The health of Australians 57
TRIM SIZE 175 mm Wide x 250 mm Deep
A register of people with known or suspected rheumatic fever and rheumatic heartdisease has been established in the Top End of the Northern Territory. In 1998, therewere 19 cases of acute rheumatic fever among Aboriginal children aged 5Ð14 in the TopEnd of the Northern Territory (216 per 100,000), whereas among non-Indigenouschildren in the area there were 2 cases (12.8 per 100,000). Over the last decade or so,there has been little change in the incidence of acute rheumatic fever among Aboriginalchildren (AIHW 1999c).
Rheumatic heart disease is the damage done to the heart muscle and heart valves by anattack of acute rheumatic fever. In 1998, Aboriginal people accounted for 95% of all casesof rheumatic heart disease in the Top End of the Northern Territory (426 cases), with aprevalence rate of 1,180 per 100,000. In contrast, there were 25 cases (24 per 100,000)among non-Indigenous Australians living in the Top End (AIHW 1999c).
Health services
General practiceA survey of general practice activity found that in 1998Ð99 cardiovascular problemsrepresented 11% of all problems managed by general practitioners (GPs) (AIHWGPSCU: Britt et al. 1999). Hypertension was the most common cardiovascular problemmanaged and was the most frequent problem seen in general practice overall,accounting for 5.7% of all problems. Other common cardiovascular problems managedwere cardiac check-up (0.9% of problems), coronary heart disease without angina (0.8%)and heart failure (0.6%). Lipid disorder, although not strictly a cardiovascular problem,rated high as well, accounting for 1.7% of problems managed.
Several classes of antihypertensive drugs and blood-lipid reducers were among the top30 drug groups prescribed by GPs, reflecting the large number of hypertensive andlipid disorder problems managed. Lipids accounted for the highest number ofchemistry pathology tests ordered, and represented 9.4% of all pathology tests orderedby GPs.
Comparison of 1998Ð99 results with those of a similar study conducted in 1990Ð91showed that although hypertension remained the most common problem managed byGPs, the rate per 100 encounters fell from 9.5 to 8.4. In contrast, the management ratefor lipid disorders increased in frequency from 1.8 to 2.5 per 100 encounters, probablybecause of raised awareness among both GPs and the public of the need to measure andcontrol cholesterol level (Sullivan 2000).
HospitalisationIn 1997Ð98, cardiovascular disease accounted for 434,748 hospital separations from allpublic acute and private hospitals in Australia. Of these, 37% were attributed to coronaryheart disease, 12% to stroke, 10% to heart failure, 10% to cardiac dysrhythmias, 8% tohaemorrhoids, 5% to varicose veins of lower extremities and 3% to peripheral vasculardisease.
Across all age groups, males were more likely to be hospitalised for cardiovasculardisease than females. The sex differential was particularly marked for coronary heartdisease and peripheral vascular disease, where males were twice as likely to behospitalised for these diseases than females. Hospitalisations associated with stroke and
01 AH2000 body Page 57 Thursday, June 1, 2000 3:06 PM

58 AustraliaÕs Health 2000
TRIM SIZE 175 mm Wide x 250 mm Deep
heart failure were similar for the two sexes, but for hypertensive disease and rheumaticfever and rheumatic heart disease, females were significantly more likely to behospitalised than males (Table 2.9).
Hospitalisation for cardiovascular disease increases rapidly with age (Table 2.9).Although those aged 55 years and over represent only 21% of the total population, theyaccounted for about three-quarters of hospital separations for cardiovascular disease. Inthe case of stroke, peripheral vascular disease and heart failure, over 89% ofhospitalisations were of those aged 55 years and over.
The average length of stay in hospital for cardiovascular disease declined from 7.6 daysin 1993Ð94 to 5.7 days in 1997Ð98. Over this period, there was an increase in theproportion of same-day patients, particularly for coronary heart disease (67%), largelyreflecting the much greater use of investigations in recent years. On average, thosehospitalised for stroke in 1997Ð98 tended to stay the longest (10.3 days), followed byheart failure (8.4 days), peripheral vascular disease (8.2 days), rheumatic fever andrheumatic heart disease (7.5 days), and hypertensive disease (4.7 days). Thosehospitalised for coronary heart disease tended to stay for a shorter period (on average4.6 days) than those hospitalised for other major cardiovascular diseases, diabetes, mostcancers and mental disorders. The average length of stay for non-cardiovasculardiseases was 3.9 days.
Table 2.9: Hospital separations(a) for cardiovascular diseases, 1997Ð98
Sex by disease (ICD-9-CM code)
Age group (years)
All ages<15 15–34 35–54 55–74 75+
Males
Coronary heart disease (410–414) 0.3 24.3 865.5 4,240.0 5,615.0 1,131.2
Stroke (430–438) 5.6 16.5 101.8 889.2 2,981.9 291.3
Peripheral vascular disease (441–444) 0.6 3.7 25.4 351.5 924.6 99.5
Heart failure (428) 2.8 5.0 47.8 596.7 2,980.3 226.7
Hypertensive disease (401–405) 4.5 7.0 31.2 84.9 172.4 32.0
Rheumatic fever and rheumatic heart disease (390–398) 3.3 3.2 6.3 22.6 31.8 8.2
All cardiovascular diseases (390–459) 63.3 303.4 1,890.8 8,562.7 17,112.5 2,647.3
Females
Coronary heart disease (410–414) 0.4 7.9 242.4 1,840.3 3,572.0 586.7
Stroke (430–438) 4.9 16.1 80.1 554.8 2,384.7 267.0
Peripheral vascular disease (441–444) 0.1 3.9 14.0 129.6 371.9 49.1
Heart failure (428) 3.3 1.7 23.1 364.4 2,452.6 220.8
Hypertensive disease (401–405) 2.8 7.6 36.6 129.6 273.1 50.8
Rheumatic fever and rheumatic heart disease (390–398) 3.9 5.6 10.2 41.7 33.1 14.0
All cardiovascular diseases (390–459) 46.5 288.3 1,220.4 4,938.3 12,517.0 2,009.1
(a) Age-specific separations per 100,000 population.
Source: AIHW National Hospital Morbidity Database.
01 AH2000 body Page 58 Thursday, June 1, 2000 3:06 PM

2 The health of Australians 59
TRIM SIZE 175 mm Wide x 250 mm Deep
Although males were more likely than females to be hospitalised for cardiovasculardisease, females tended to stay in hospital longer (5.8 days compared with 5.3 days).Length of stay in hospital for cardiovascular disease increased with age after age 30,with those aged 85 and over staying in hospital for 9.9 days on average compared with3.1 days for those aged 30Ð34 in 1997Ð98.
Cardiovascular proceduresThe most common heart operation in Australia is coronary artery bypass grafting. Thisprocedure was developed in the 1960s and its use has increased steadily since that time.In 1995, there were 17,150 coronary artery bypass graft operations, with 7% of these re-operations (AIHW: Senes & Davies 1999a). The death rate for coronary artery bypassgraft operations was 2.3%.
Other revascularisation procedures include coronary angioplasty and coronary stenting.Coronary angioplasty, a less invasive technique than coronary artery bypass grafting (itdoes not require the opening of a patientÕs chest), was introduced in the 1980s and its usehas grown dramatically since then. During 1996, there were 13,854 coronary angioplastyprocedures performed in Australia, an increase of 22% from the previous year (AIHW:Senes & Davies 1999b). Coronary stenting, widespread since 1995 in Australia, was usedin 54% of coronary angioplasty patients in 1996, an increase of 106% over its use in theprevious year (Figure 2.20). The main cardiovascular procedures are explained in Box 2.9(page 60).
In addition, during 1997Ð98 there were 76,362 coronary angiograms conducted and24,855 CT brain scans performed for the diagnosis of stroke.
Note: Coronary angioplasty includes procedures with or without stents.
Source: AIHW/NHF National Cardiac Surgery and Coronary Angioplasty Registers.
Figure 2.20: Trends in coronary revascularisation procedures, 1970 to 1996
1970 1972 1974 1976 1978 1980 1982 1984 1986 1988 1990 1992 1994 19960
5
10
15
20Number of procedures (’000)
Year
Coronary artery bypass grafts
Coronary angioplasty
Coronary stenting
01 AH2000 body Page 59 Thursday, June 1, 2000 3:06 PM

60 AustraliaÕs Health 2000
TRIM SIZE 175 mm Wide x 250 mm Deep
MortalityCardiovascular disease was the leading cause of death among Australians in 1998,accounting for 50,797 deaths or 40% of all deaths. Coronary heart disease was the majorcardiovascular cause of death accounting for 55% of all such deaths, followed by stroke(24%), heart failure (5%) and peripheral vascular disease (4%). Cardiovascular mortalityis higher among Indigenous Australians, in rural areas of the country, and amongsocioeconomically disadvantaged groups (DHAC & AIHW 1999b) (see chapter 4).
Over the last three decades there has been a considerable decline (around 66%) in cardio-vascular death rates. These declines are substantial, especially when compared with adecline of around 22% in the death rate for non-cardiovascular diseases. During theperiod 1987 to 1998, death rates for cardiovascular diseases fell 3.9% per year for malesand 3.7% per year for females, faster than for all causes overall (Table 2.10). Coronaryheart disease death rates have been declining faster than death rates from stroke.
Declines in death rates for coronary heart disease and stroke have been influenced byimprovements in some risk factors (levels of blood pressure, tobacco smoking andsaturated fat) and in medical interventions such as counselling, drug use, emergencycare, medical and surgical treatment, and follow-up care. These gains have beenachieved despite there being a significant increase in the prevalence of overweight andlittle change in physical activity levels.
Box 2.9: Cardiovascular proceduresThere is a range of procedures to diagnose and treat cardiovascular diseases. Some of themajor procedures are:
Coronary artery bypass grafting (CABG) entails opening a patientÕs chest and usingblood vessel grafts to bypass blockages in the coronary arteries and restore adequate bloodsupply to the heart muscle. CABG is not a cure for coronary artery disease, and there is arisk of recurrence.
Coronary angioplasty involves inserting a catheter with a balloon into a major arteryvia the skin. The catheter is threaded through the circulation back towards the heart andinto the coronary arteries to the area of the vessel blockage. The balloon is then inflatedagainst the blocked area to create a wider passage for blood flow.
Coronary stenting involves expanding metal mesh tubes within the artery to form a sup-porting structure to hold the artery open at the point where there is narrowing. The devel-opment of this catheter-based technique was due to the risk of early acute closure of thecoronary artery and a high rate of reblockage from coronary angioplasty.
Coronary angiography gives a picture of the heartÕs arteries. The procedure is used todiagnose coronary heart disease and is essential before either coronary artery bypass sur-gery or coronary angioplasty.
Computerised tomographic (CT) scan of the brain is used to guide treatment in acutestroke by distinguishing between major stroke types (either blocked blood supply to thebrain, or bleeding within the brain or on its surface). The test is also done to confirm aclinical diagnosis of stroke.
01 AH2000 body Page 60 Thursday, June 1, 2000 3:06 PM

2 The health of Australians 61
TRIM SIZE 175 mm Wide x 250 mm Deep
Table 2.10: Deaths from cardiovascular diseases, 1998
Cause of death (ICD-9 code)
Males Females
Number(1998)
Rate(a)
(1998)
Annual rateof change (b)
(per cent)Number
(1998)Rate(a)
(1998)
Annual rateof change (b)
(per cent)
All cardiovascular diseases (390–459) 24,746 284.7 –3.9 26,051 188.0 –3.7
Coronary heart disease (410–414) 15,024 171.3 Ð4.3 12,801 93.3 –4.1
Stroke (430–438) 4,812 56.4 –3.4 7,170 50.9 –3.6
Heart failure (428) 988 12.0 –4.3 1,567 10.3 –4.4
Peripheral vascular disease(441–444) 1,171 13.5 –2.9 916 6.8 –1.2
Hypertensive disease (401–405) 410 4.7 –3.2 730 5.2 –2.8
Rheumatic fever and rheumatic heart disease (390–398) 87 1.0 –5.2 171 1.5 –4.8
All causes of death (001–999) 67,073 759.9 –2.3 60,129 470.2 –1.9
(a) Age-standardised rate per 100,000 population.
(b) Annual change in the age-standardised death rate over the period 1987 to 1998.
Source: AIHW National Mortality Database.
Source: AIHW National Mortality Database.
Figure 2.21: Death rates for major cardiovascular diseases, 55 years and over, 1998
55–59 60–64 65–69 70–74 75–84 85+0
2,000
4,000
6,000
8,000
10,000
Deaths per 100,000 population
Age group (years)
All cardiovascular diseases
Coronary heart disease
Stroke
Males
Females
01 AH2000 body Page 61 Thursday, June 1, 2000 3:06 PM

62 AustraliaÕs Health 2000
TRIM SIZE 175 mm Wide x 250 mm Deep
Males were more likely to die from cardiovascular disease than females across almostall age groups, with death rates among males aged 25Ð74 two to three times those offemales in 1998. For coronary heart disease, the sex differentials were more markedthan for cardiovascular disease overall, particularly in the 25Ð64 age group where deathrates among males were 3Ð4 times those of females. For stroke, the sex differentialswere not as large as for coronary heart disease, with death rates across most age groupsmarginally higher for males than females (Figure 2.21).
Death rates for cardiovascular disease increased dramatically with age, with 82% of allsuch deaths occurring among those aged 70 and over, compared with less than 5% forthose aged under 55.
Note: Death rates have been age standardised to the World Standard Population.
Source: WHO 1996, 1998.
Figure 2.22: Death rates for cardiovascular disease, selected countries, 1994
Hong Kong
Japan
France
Spain
Canada
Chile
Italy
Australia
Netherlands
Singapore
Israel
Greece
Sweden
Norway
USA
England and Wales
New Zealand
Germany
Finland
Northern Ireland
Scotland
Switzerland
Poland
Russian Federation
0 200 400 600 800 1,000 1,200Deaths per 100,000 population
Males
Females
01 AH2000 body Page 62 Thursday, June 1, 2000 3:06 PM

2 The health of Australians 63
TRIM SIZE 175 mm Wide x 250 mm Deep
Cardiovascular disease death rates in Australia have declined by about 60% over theperiod 1960Ð64 to 1994. There have been similar large declines in other countries. Japan(for both males and females) and Canada (for females) are the only countries to exceedAustraliaÕs decline in cardiovascular disease death rates. Rates of decline in Canada (formales), the United States, France, Switzerland and Finland have also been substantial(WHO 1998).
Despite marked declines, AustraliaÕs cardiovascular disease death rates still compareunfavourably with those of some other developed countries. Of the 24 countriescompared, Australia had the eighth and tenth lowest death rates for cardiovasculardisease for males and females respectively in 1994. The Australian death rates, althoughone-third the rates in the Russian Federation and half the rates in Poland, were 72% and50% higher for males and females than the rates observed in Hong Kong. Australiandeath rates were also significantly higher than rates in Japan and France (Figure 2.22).
The relative ranking of Australian death rates varies for the major components ofcardiovascular disease. For coronary heart disease, Australian death rates rankedtowards the middle of those compared, whereas for stroke Australian death rates wereamong the lowest of those compared.
Cancers Cancer is a diverse group of diseases characterised by the proliferation and spread ofabnormal cells in the body. These abnormal cells invade and destroy surrounding tissueand can spread (metastasise) to distant parts of the body. Cancer can develop in mosttypes of cells, and each cancer has its own pattern of local behaviour and metastasis.Although some cancers share risk factors, most cancers have a unique set of risk factorsthat may be responsible for their onset. In Australia, information on cancers is collectedby State and Territory cancer registries, and compiled by the AIHW in the NationalCancer Statistics Clearing House (see Box 2.10, page 64).
It is estimated that 30% of cancers can be attributed to active smoking, 30% to dietaryinfluences, 2% to radiation exposure, 5Ð15% to infectious agents, and the remainder toother risk factors (Trichopoulos et al. 1996). Some of these risk factors are modifiablethrough lifestyle changes, and others are inherited. Although some risk factors areunavoidable, risks of particular cancers may be reduced through clinical monitoring ofa person and their risk factors and treating newly diagnosed cases early in theirdevelopment.
Each year, approximately 345,000 new cancer cases are diagnosed in Australia. A largeproportion of these, approximately 270,000, are non-melanocytic skin cancers (NMSC)which, if treated early, are far less life-threatening than most other cancers. Cancercurrently accounts for 29% of male deaths and 25% of female deaths.
Cancer control is a National Health Priority Area. Eight cancers have been targeted forpriority action: lung cancer, melanoma, NMSC, colorectal cancer, non-HodgkinÕslymphoma, prostate cancer in males and cancers of the cervix and breast in females.These cancers have a significant impact on the health status of the Australianpopulation and are of concern in all States and Territories.
01 AH2000 body Page 63 Thursday, June 1, 2000 3:06 PM

64 AustraliaÕs Health 2000
TRIM SIZE 175 mm Wide x 250 mm Deep
Cancer incidenceExcluding NMSC, there were 42,733 new cancers in males and 34,933 new cancers infemales in 1996, with age-standardised incidence rates of 489 per 100,000 males and339 per 100,000 females. In the same year, there were 19,196 male deaths due to cancerwith an age-standardised death rate of 226 per 100,000, and 14,893 female deaths due tocancer at the rate of 137 per 100,000 (AIHW & AACR 1999).
Details of NMSC are not recorded by all cancer registries as most are not histologicallyconfirmed or reported. These skin cancers are often self-detected and are usuallyremoved in doctorsÕ surgeries. Staples et al. (1998) estimated, using survey methods,that the national age-standardised incidence rates (standardised to the World StandardPopulation) for treated NMSC in 1995 were 1,374 per 100,000 for males and 857 per100,000 for females.
The incidence of the other most common cancers is presented in Figure 2.23. Prostatecancer is the most common cancer accounting for 23.5% of all cancers in males. Between1989 and 1994, there was a dramatic rise in the number of new cases of prostate cancerregistered. Incidence rates have fallen substantially since then, although not to pre-1989levels. The rise and then fall in the prostate cancer incidence rate has been attributed toearly detection through increased investigation, particularly following the introduction ofprostate-specific antigen (PSA) testing around 1990. PSA tests are specifically designed toidentify cancers before the onset of clinical symptoms. Many of these prevalent cancersmay not show any symptoms, and therefore would not be detected except for PSAtesting. The recent decline in the incidence rate indicates a return towards the underlying
Box 2.10: Cancer surveillance and monitoring in AustraliaThe registration of cancer is required by law in each of the States and Territories, usuallyunder the Public Health Acts, where the data are collated by cancer registries. These regis-tries collect clinical and demographic information about people with newly diagnosedcancer. This information is obtained from hospitals, pathologists, radiation oncologists,cancer treatment centres and nursing homes. Generally, operational guidelines for each ofthe registries are similar and coincide with the objectives of the International Associationof Cancer Registries. Although some registries operate under different coding systems forsite, morphology and other variables, the bulk of information is directly comparable andhas been reconciled for this publication.
Registrars of Births, Deaths and Marriages collect information related to deaths fromcancer. By combining information from these sources, the State and Territory cancer regis-tries produce statistics of cancer incidence and mortality. Data from these population-basedregistries enable monitoring of cancer incidence and mortality and have disclosed high-riskgroups and emerging incidence trends that warrant a public health response.
A national collection of cancer data is maintained by the National Cancer StatisticsClearing House at the Australian Institute of Health and Welfare, where data for incidenceare currently available to 1996 and for mortality to 1998 (AIHW & AACR 1999).
01 AH2000 body Page 64 Thursday, June 1, 2000 3:06 PM

2 The health of Australians 65
TRIM SIZE 175 mm Wide x 250 mm Deep
rate, removing the effect of these previously undetected cases. The incidence rate is alsodeclining as the number of PSA tests conducted falls, reducing the number of prevalentcases detected (Smith et al. 1998; Threlfall et al. 1998).
Note: NHL = Non-Hodgkin’s lymphoma.
Source: AIHW & AACR 1999.
Figure 2.23: New cases and number of deaths from most frequently occurring cancers (excluding non-melanocytic skin cancer), by sex, 1996
Prostate Colo-rectal
Lung Mela-noma
Bladder NHL Unknownsite
Kidney Stomach Lip0
2,000
4,000
6,000
8,000
10,000
12,000
Deaths per 100,000 population
Type of cancer
Males
Breast Colo-rectal
Mela-noma
Lung Unknownsite
NHL Uterus Ovary Cervix Pancreas0
2,000
4,000
6,000
8,000
10,000
12,000Deaths per 100,000 population
Type of cancer
Females
01 AH2000 body Page 65 Thursday, June 1, 2000 3:06 PM

66 AustraliaÕs Health 2000
TRIM SIZE 175 mm Wide x 250 mm Deep
The incidence of cancer is lowest in late childhood, but increases with age. Figure 2.24presents age-specific incidence rates for all cancers. Males have a higher incidence thanfemales beyond 55 years of age. However, females have a higher incidence than malesbetween ages 30 and 54 years because cancers of the cervix, uterus, ovary and breasthave an incidence almost seven times that of cancers specific to males in this age range.
Between 1990 and 1996, age-standardised incidence rates for all cancers combined(excluding NMSC) rose for both males and females by an average of 2.1% and 1.4% peryear respectively. Trends in incidence rates for individual cancers for this period havevaried. Among males, incidence of melanoma showed increases of approximately 3.6%per annum. The incidence of prostate cancer increased steadily until 1989 but hasshown a large average annual increase of 8% since then, despite the recent falls. Othercancers to show average annual increases from 1990 to 1996 include: colorectal (1.0%),bladder (1.6%), kidney (1.6%), brain (1.1%), non-HodgkinÕs lymphoma (0.7%) and testis(3.4%). Lung cancer has shown a consistent decline since 1983 and an average annualdecline from 1990 to 1996 of 2%. The following cancers also recorded a decline: larynx(Ð3.4%), stomach (Ð2.1%), unknown primary (Ð1.9%), leukaemia (Ð1.1%) and pancreas(Ð0.7%).
Source: AIHW & AACR 1999.
Figure 2.24: Age-specific incidence and death rates for malignant neoplasms (excluding non-melanocytic skin cancer), by sex, 1996
0–4 10–14 20–24 30–34 40–44 50–54 60–64 70–74 80–840
500
1,000
1,500
2,000
2,500
3,000
3,500
4,000Rate per 100,000 population
Age group (years)
Males—new cases
Females—new cases
Males—deaths
Females—deaths
01 AH2000 body Page 66 Thursday, June 1, 2000 3:06 PM

2 The health of Australians 67
TRIM SIZE 175 mm Wide x 250 mm Deep
Among females, the four most common cancers all showed average annual increases inthe age-standardised rate for the period 1990 to 1996, although the increases were muchmore substantial for breast cancer (3%), melanoma (2.3%) and lung cancer (1.6%) thanfor colorectal cancer (0.2%). Cancers of the pancreas (0.5%), uterus (1.5%), bladder (1.2%)and kidney (1.2%), leukaemias (0.6%) and non-HodgkinÕs lymphoma (2.7%) all showedan increase during this period. Cervical cancer showed one of the largest average annualdeclines in age-standardised incidence rate (Ð4.1%), but cancers of the larynx (Ð2.2%),brain (Ð0.8%) and unknown primary (Ð1.9%) also declined from 1990 to 1996.
Increases or decreases in the incidence of these cancers are due to variations in exposureto a range of risk factors such as UV radiation exposure, smoking, alcohol and otherdietary components (Trichopoulos et al. 1996). Improvements in detection of cancersthrough the introduction and more widespread use of medical technologies has alsoincreased the number of cancers reported, and improved the accuracy of determiningtheir site of origin.
Survival following cancer
Survival from cancer depends on the type of cancer, its behaviour (i.e. slow- or fast-growing) and its metastasising characteristics; the stage at diagnosis; the availability ofappropriate treatment; and the general health of the person and his or her capacity tohandle treatment.
Relative survival analysis uses the ratio of the survival of a person diagnosed with adisease, in this case cancer, to that of a person from the general population matched onage and sex. The South Australian and New South Wales cancer registries havepublished survival estimates for their respective jurisdictions where the 5-year relativesurvival ratio for all cancers is approximately 46% for males and 57% for females.
Survival ratios decline with age at diagnosis for most cancers. For all cancers in SouthAustralia in 1986Ð94, the relative survival ratios were 72% for those under 55 years,54% at 55Ð64 years, 48% at 65Ð74 years and 43% at 75 years and over (South AustralianCancer Registry 1996).
The NSW Cancer Registry has noted significant improvements in survival from mostcancers. For example, the 5-year survival ratio for cancer of the cervix improved from69% in 1980Ð85 to 75% in 1990Ð95. For other cancers, the improvement in survival was:61% to 83% for prostate cancer; 51% to 61% for colorectal cancer; 48% to 59% for kidneycancer; and 9% to 16% for cancer of the oesophagus (Supramaniam et al. 1999).
Mortality from cancer
In 1998, lung cancer accounted for 25% of cancer deaths among males, and prostatecancer and colorectal cancer both accounted for 13%. The major causes of cancer deathin females were breast cancer (17% of all cancer deaths), colorectal cancer (14%) andlung cancer (14%).
From the age of 15 years, death rates for cancer increase with age (Figure 2.24). Further, anageing population has meant that older people constitute a higher proportion of thosedying from cancer. For example, in 1983, approximately 30% of all cancer deaths occurredin persons aged 75 years and over, but by 1998 this proportion had risen to around 40%.
01 AH2000 body Page 67 Thursday, June 1, 2000 3:06 PM

68 AustraliaÕs Health 2000
TRIM SIZE 175 mm Wide x 250 mm Deep
Males have higher death rates than females before age 35 and from age 50 onwards. Thehigher death rates among females aged 35Ð49 years reflect the impact of the female-only cancers on the rates. However, the differential between the male and female ratesin this age group is not as large as that observed for incidence.
Specific cancers
The following sections provide information about breast cancer, lung cancer andmelanoma. These cancers are among the most commonly diagnosed cancers and have asignificant impact on morbidity, mortality and health service use. Other commoncancers, such as prostate and colorectal cancers, have been the focus of discussion inprevious editions of AustraliaÕs Health.
Breast cancer
Apart from non-melanocytic skin cancers, breast cancer is the most common cancerdetected in Australian females, where the lifetime risk of a female developing thisdisease before age 75 is 1 in 12. In 1997, 10,144 new cases of breast cancer werediagnosed in Australia. Breast cancer is also the most common cause of death fromcancer in females with 2,602 deaths in 1997 and 2,542 in 1998. The incidence of breastcancer has been on the rise since the early 1980s (Figure 2.25). The death rate for breastcancer has remained relatively stable over this period, declining marginally from24.9 deaths per 100,000 in 1980 to 23.0 deaths per 100,000 in 1998. The total healthsystem cost for female breast cancer was estimated to be $184 million in 1993Ð94(AIHW: Mathers et al. 1998b).
Established risk factors for breast cancer are age (breast cancer rates typically increaseprogressively with age from the third decade) and a family history of the disease. Otherfactors associated with increased risk are a previous history of breast cancer or benignbreast disease, a larger body size, reproductive factors including late age at first birth,nulliparity (never borne a child), early start to menstruation and late age at menopause,use of oral contraceptives at young ages, use of hormone replacement therapy andexposure of breast tissue to ionising radiation (particularly before 20 years of age) (see,for example, McMichael & Armstrong 1988; Higginson et al. 1992; Kelsey 1993). Morerecently, a role for physical activity in decreasing risk of breast cancer has beenproposed (Friedenreich & Rohan 1995). Diet, especially one rich in fat and animalprotein, and consumption of alcohol are other potential risk factors. Prevention of somedeaths from breast cancer is currently achievable mainly by earlier detection,principally by way of mammography in organised screening programs (such as that setup by BreastScreen Australia). Improvements in treatment have also contributed toincreased survival.
The 5-year relative survival ratio for females diagnosed with breast cancer from 1982 to1994 was 77%. The ratio has increased over time, with those diagnosed in the 1990sshowing a better 5-year relative survival ratio (79%) than those diagnosed in the 1980s(74%). Females diagnosed with breast cancer in their 40s had the best relative survival,whereas those aged in their 80s and 90s had the worst survival (AIHW, AACR &NHMRC 1998).
01 AH2000 body Page 68 Thursday, June 1, 2000 3:06 PM
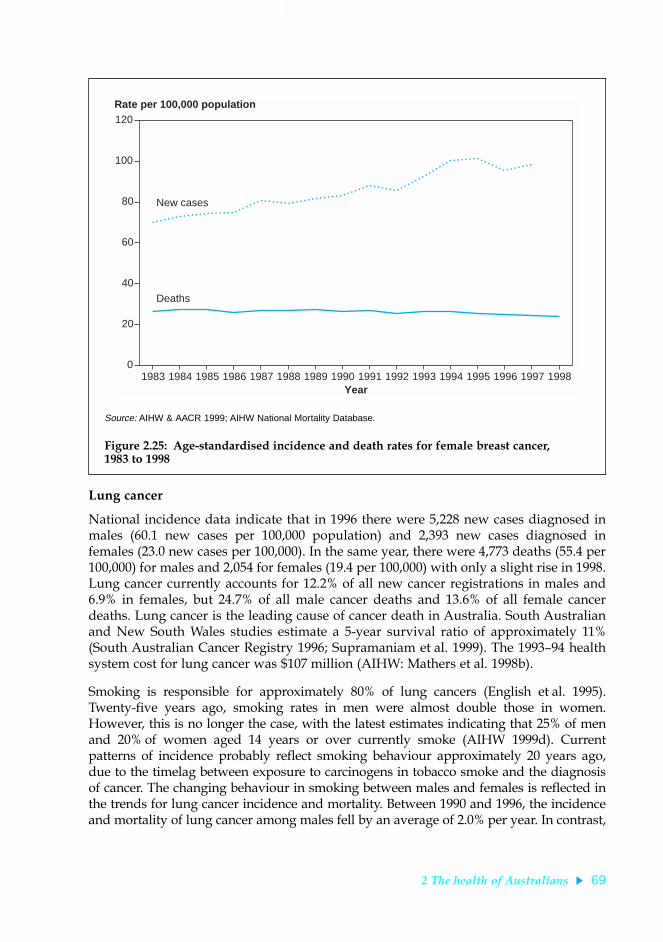
2 The health of Australians 69
TRIM SIZE 175 mm Wide x 250 mm Deep
Lung cancer
National incidence data indicate that in 1996 there were 5,228 new cases diagnosed inmales (60.1 new cases per 100,000 population) and 2,393 new cases diagnosed infemales (23.0 new cases per 100,000). In the same year, there were 4,773 deaths (55.4 per100,000) for males and 2,054 for females (19.4 per 100,000) with only a slight rise in 1998.Lung cancer currently accounts for 12.2% of all new cancer registrations in males and6.9% in females, but 24.7% of all male cancer deaths and 13.6% of all female cancerdeaths. Lung cancer is the leading cause of cancer death in Australia. South Australianand New South Wales studies estimate a 5-year survival ratio of approximately 11%(South Australian Cancer Registry 1996; Supramaniam et al. 1999). The 1993Ð94 healthsystem cost for lung cancer was $107 million (AIHW: Mathers et al. 1998b).
Smoking is responsible for approximately 80% of lung cancers (English et al. 1995).Twenty-five years ago, smoking rates in men were almost double those in women.However, this is no longer the case, with the latest estimates indicating that 25% of menand 20% of women aged 14 years or over currently smoke (AIHW 1999d). Currentpatterns of incidence probably reflect smoking behaviour approximately 20 years ago,due to the timelag between exposure to carcinogens in tobacco smoke and the diagnosisof cancer. The changing behaviour in smoking between males and females is reflected inthe trends for lung cancer incidence and mortality. Between 1990 and 1996, the incidenceand mortality of lung cancer among males fell by an average of 2.0% per year. In contrast,
Source: AIHW & AACR 1999; AIHW National Mortality Database.
Figure 2.25: Age-standardised incidence and death rates for female breast cancer, 1983 to 1998
1983 1984 1985 1986 1987 1988 1989 1990 1991 1992 1993 1994 1995 1996 1997 19980
20
40
60
80
100
120Rate per 100,000 population
Year
New cases
Deaths
01 AH2000 body Page 69 Thursday, June 1, 2000 3:06 PM

70 AustraliaÕs Health 2000
TRIM SIZE 175 mm Wide x 250 mm Deep
lung cancer incidence among females increased at an average rate of 1.6% per year. Theincrease in lung cancer incidence is predominantly in females aged 65 years and over,whereas the rate in younger females has generally remained stable or fallen. Despite thesepatterns, the male rate is still more than 2.5 times greater than the female rate.
MelanomaMelanoma is the fourth most common cancer in males and the third most commoncancer in females. There has been a strong upward trend in melanoma mortality sincethe early 1950s. Since 1990, the death rates for both sexes have been relatively stable(Figure 2.27) although males have a rate twice that of females.
Incidence rates for melanoma have increased markedly since 1983, especially for males.The largest increase occurred in those aged 60 years and over. Melanoma cost the healthsystem $66 million in 1993Ð94 (AIHW: Mathers et al. 1998b).
AustraliaÕs melanoma rates are among the highest in the world. A comparison betweenAustralia and England and Wales shows a tenfold difference in incidence, and it isknown that incidence in Australia is up to 150 times higher than in some othercountries. International differences in death rates are substantially less than incidencerates (AIHW: Giles et al. 1995).
Source: AIHW & AACR 1999; AIHW National Mortality Database.
Figure 2.26: Age-standardised incidence and death rates for lung cancer, by sex, 1983 to 1998
1983 1985 1987 1989 1991 1993 1995 19970
20
40
60
80
100
120Rate per 100,000 population
Age group (years)
Males—new cases
Males—deaths
Females—new cases
Females—deaths
01 AH2000 body Page 70 Thursday, June 1, 2000 3:06 PM

2 The health of Australians 71
TRIM SIZE 175 mm Wide x 250 mm Deep
Melanoma risk is related to UV radiation exposure. Melanoma incidence is higher inpeople with fair, sun-sensitive skin, those with many moles, and those who haveintermittent high recreational exposure or frequent sunburns. Exposure in childhoodmay be particularly important (DHFS & AIHW 1998a).
In 1996, there were 4,313 new cases diagnosed in males (48.0 new cases per 100,000population) and 3,448 new cases diagnosed in females (35.0 new cases per 100,000population). There were 635 male deaths (6.9 per 100,000) and 345 female deaths(3.1 per 100,000) in 1998. Melanoma currently accounts for approximately 10% of allnew cancer registrations, and 3.0% of all cancer deaths in males and 2.2% in females.Survival studies show that male 5-year relative survival ratios vary between 86% and89% and female ratios vary between 92% and 95% (South Australian Cancer Registry1996; Supramaniam et al. 1999).
InjuriesInjury contributes significantly to mortality and morbidity in Australia. It is the leadingcause of death among young people. Injury is also the cause of a range of disablingconditions, often persisting, that affect the quality of life of injured people and theirfamilies. The total health system costs of injury in 1993Ð94 have been estimated at$2.6 billion (AIHW: Mathers & Penm 1999b). Health Ministers have identified injuryprevention and control as a priority area.
Source: AIHW & AACR 1999; AIHW National Mortality Database.
Figure 2.27: Age-standardised incidence and death rates for melanoma, by sex, 1983 to 1998
1983 1985 1987 1989 1991 1993 1995 19970
10
20
30
40
50Rate per 100,000 population
Year
Males—new cases
Males—deaths
Females—new cases
Females—deaths
01 AH2000 body Page 71 Thursday, June 1, 2000 3:06 PM

72 AustraliaÕs Health 2000
TRIM SIZE 175 mm Wide x 250 mm Deep
Deaths
In 1998, a total of 7,946 deaths (5,614 males and 2,332 females) were the result of anexternal cause of injury (used here to mean injury and poisoning), representing 6% ofall deaths that year. Injury was the leading cause of death for persons aged under45 years, accounting for 43% of all deaths among people in that age group. Almost one-quarter of people dying from injury were young males aged 20Ð34 years.
Despite a large reduction in rates since 1970, road crashes remain a common cause ofinjury-related deaths. However, suicide accounted for the largest proportion of injurydeaths in 1998, followed by deaths due to road crashes. Unintentional falls, mostly byolder people, ranked third among commonly reported causes of injury death.
For nearly all types of injury, death rates in 1998 were higher among males thanfemales. (One exception was falls by older people, for which male and female rateswere similar.) Overall, injury death rates were the highest among young males, and inboth males and females in old age.
Trends in injury-related deaths
The death rate for injury declined during the second half of the twentieth century,broadly in step with the decline in the all-causes death rate. Throughout this period,injury was responsible for 7Ð8% of male deaths and for 4Ð5% of female deaths. Duringthe middle and late 1990s, however, injury death rates remained more or less static,whereas all-causes death rates continued to decline 1Ð2% annually.
Note: Age standardised to the Australian population at 30 June 1991.
Source: AIHW National Injury Surveillance Unit using mortality and population data from the ABS.
Figure 2.28: Injury mortality by sex and external cause, 1924 to 1998
0
10
20
30
40
50
60
70
80
90
100
1920 1930 1940 1950 1960 1970 1980 1990 2000
Deaths per 100,000 population
Year
Males—motor vehicleMales—suicideMales—other injuryFemales—motor vehicleFemales—suicideFemales—other injury
01 AH2000 body Page 72 Thursday, June 1, 2000 3:06 PM

2 The health of Australians 73
TRIM SIZE 175 mm Wide x 250 mm Deep
Trends over time in injury deaths vary greatly for major types of external cause(Figure 2.28). No sustained underlying trend is evident in the all-ages suicide rate overthe long term, although the age-specific rate has shown a differing trend. An increase inthe suicide rate occurred in the 1960s, when the rate of suicide using pharmaceuticalsubstances (especially barbiturates) increased. Death rates for motor vehicle crashesalso rose with the emergence of this mode of transport in the first half of the twentiethcentury, but dipped with the reduced use of motor vehicles during the GreatDepression and the Second World War. However, despite continued increases in vehiclenumbers and the distance travelled, case numbers and the population-based roadinjury death rate have declined sharply since the early 1970s, due mainly to the successof road safety initiatives (DHFS & AIHW 1998b).
Suicides and opiate-related deathsTwo categories of injuries have shown upward trends in death rates in recent years.These are suicide among males and deaths related to opiate drugs.
At about 23 deaths per 100,000 population, the male suicide rates in 1997 and 1998 werethe highest since the 1960s. The female suicide rate, on the other hand, has remainedclose to 5 per 100,000 population for two decades, but the rate is rising among youngfemales. Further information about suicide can be found in the section on mentalproblems and disorders (see page 79).
Notes
1. Age standardised to the Australian population at 30 June 1991.
2. Includes underlying cause of death codes E850.0, E858.8, 304.0, 304.7 and 305.5.
Source: AIHW National Injury Surveillance Unit analysis of ABS mortality data.
Figure 2.29: Opiate mortality, 1979 to 1998
1979 1981 1983 1985 1987 1989 1991 1993 1995 19970
5
10
15
20
25Deaths per 100,000 population
Year of death registration
Males
Females
Males aged 20–39 years
Females aged 20–39 years
01 AH2000 body Page 73 Thursday, June 1, 2000 3:06 PM

74 AustraliaÕs Health 2000
TRIM SIZE 175 mm Wide x 250 mm Deep
The rate for opiate-related deaths has risen dramatically since the early 1980s, especiallyamong young adults (Figure 2.29). The rate has risen in both sexes, although theincreases are much higher among males than females. The rate for suicide by opiateshas also risen, though less rapidly, from about 0.5 deaths per 100,000 in the early 1980sto about 1.0 in the late 1990s.
Hospital care
Injuries are a prominent reason for hospitalisation. Injury was the principal diagnosisrecorded for 403,386 separations from hospitals in Australia during 1997Ð98 (7% of allhospital separations).
Although records for 68,631 separations (1% of all separations) specified complicationsof care as the principal diagnosis, 255,120 (5% of all separations) had mention ofcomplications, misadventure, abnormal reaction or adverse effect of treatment in therecord. The occurrence of adverse events and other undesired outcomes of health care isdiscussed further in chapter 6.
Injury from causes other than complications of surgical and medical care was theprincipal diagnosis for 334,755 separations in 1997Ð98 (6% of all separations). Theseseparations accounted for about 1.3 million patient bed-days, with an average length ofstay of 4.0 days. The following discussion relates to these hospital separations.
Falls was the leading single cause of injury-related hospital care in Australia in 1997Ð98,accounting for 36% of all hospital separations for injury. Transport-related incidents (15%)and unintentional poisoning (5%) were the other common causes of hospitalisation.
Unintentional injuries accounted for 88% of separations from hospital due to injuries.Interpersonal violence and intentional self-harm each accounted for about half of theremaining 12%.
A fracture was the main diagnosis in 41% of the injury separations. Open wounds(17%), poisoning and toxic effects (11%), sprains, strains and dislocations (8%) andintracranial injuries (6%) were other common conditions.
Lower limb fractures to persons aged 65 years and over accounted for 7% of all hospitalseparations due to injury and for 21% of the bed-days. The average length of stay forthese separations was 12.2 days, more than three times longer than for injury casesoverall.
Prevention strategies
A range of strategies, developed by various sectors, has contributed to the sustaineddecline in death rates for injuries (National Injury Prevention Advisory Council 1999).The diverse nature of the issues constituting ÔinjuryÕ is reflected in the degree andvariety of institutional responses to the problem (NHMRC 1999). In particular, roadinjury, occupational injury, drug-related harm and suicide are subjects of specificpolicies and programs. The first two of these causes of injury are largely the province ofagencies outside the health sector; the response to suicide is largely from a mentalhealth perspective.
01 AH2000 body Page 74 Thursday, June 1, 2000 3:06 PM

2 The health of Australians 75
TRIM SIZE 175 mm Wide x 250 mm Deep
The risk of injury is particularly high for some sections of the population. Two groupswell known to experience high rates of injury are people who live in rural and remoteareas compared with urban-dwellers, and Indigenous peoples compared with non-Indigenous Australians (AIHW NISU: Moller 1996; AIHW 1998b).
At the national level, the health sector (in addition to efforts through the NationalMental Health Strategy to tackle suicide prevention) is focusing attention on aspects ofinjury that are not covered by well-established institutions and programs. The draftNational Injury Prevention Action Plan nominates four priority areas for immediateaction by the health sector in the period 2000 to 2002 (DHAC 1999):
¥ injury due to falls among persons aged 65 years and older;
¥ falls among children under 15 years of age;
¥ drowning and near drowning; and
¥ poisoning of infants and children less than 5 years of age.
Table 2.11 presents summary information on these four types of injury.
Table 2.11: Injury prevention priority areas for 2000Ð2002: summary data
IndicatorFalls at ages 65years and over
Falls at ages0–14 years Drowning
Poisoning atages 0–4 years
Mortality (1998)
Cases Males 397 2 215 2
Females 617 1 58 1
Persons 1,014 3 273 3
Deaths per 100,000 population Males 39.7 0.1 2.3 0.3
Females 48.1 0.1 0.6 0.2
Persons 44.4 0.1 1.5 0.2
Hospital separations (1997–98)
Cases Males 12,557 15,189 467 1,974
Females 36,863 9,706 224 1,622
Persons 49,420 24,895 691 3,596
Separations per 100,000 population Males 1,268.9 755.9 5.0 298.7
Females 2,895.3 508.1 2.4 258.9
Persons 2,184.0 635.1 3.7 279.3
Notes
1. ICD-9 codes: falls E880–888; drowning: E830, E832, E910; poisoning: E850–869.
2. Hospital separations are limited to cases where the principal diagnosis is in the range ICD-9-CM 800–999.
3. Mortality is by year of registration. Episodes of hospital care are by year of separation from hospital.
Source: AIHW National Injury Surveillance Unit.
01 AH2000 body Page 75 Thursday, June 1, 2000 3:06 PM

76 AustraliaÕs Health 2000
TRIM SIZE 175 mm Wide x 250 mm Deep
Mental problems and disordersMental problems and disorders relate to emotions, thoughts and behaviours which canmanifest as anxiety and depression or more serious disorders such as schizophrenia. The1995 National Health Survey estimates that about one million Australians suffer from amental problem or disorder. More than 50% of these are affected long term. However,only 40% of these will seek help or have their problem diagnosed (ABS 1997b).
Mental health has been identified as a National Health Priority Area (NHPA) (AIHW &DHFS 1997). Depression is the most common mental disorder reported, and has beenidentified as the first priority for action (DHAC & AIHW 1999a).
Mental problems and disorders are responsible for a large number of hospitalisations,although the number of deaths from these causes is low compared with other NHPAs.This is particularly the case among those in the age group 25Ð44 years. Mental problemsalso account for much disability, incur high health system costs, and impose a heavyburden of human suffering including stigmatisation of people with mental disordersand their families.
Interventions able to impact on mental problems and disorders occur at many levels ofthe community, and across the spectrum of disease prevention, management andmaintenance. In particular, prevention and early intervention activities are able to focuson recognition and early management of risk factors that increase peopleÕs vulnerabilityto mental problems and disorders.
Prevalence
The prevalence and types of mental disorders are known to vary with age, sex and acrosspopulation groups. Almost 1 out of 5 children and adolescents are reported to suffer froma mental problem or disorder within any 6-month period (Zubrick et al. 1995).Furthermore, the 1997 ABS Survey of Mental Health and Wellbeing found thatapproximately 18% of adults in the community suffer from a mental disorder (ABS 1998b).
The onset of most mental disorders occurs in mid-to-late adolescenceÑand tends tobecome chronicÑaffecting future psychosocial development. A comparative picture ofprevalence of mental problems between children and adults is given in Figure 2.30. Thisshows considerable morbidity in childhood with a steady increase in prevalence toearly adulthood but a gradual decline in the older years.
Although the overall prevalence rates are similar in both sexes, females are more likelyto experience anxiety and affective disorders whereas males are more likely toexperience substance use disorders (ABS 1998b). Further information on the prevalenceof mental problems and disorders in Australia is contained in AustraliaÕs Health 1998(AIHW 1998a).
GP consultations
People with mental problems and disorders are cared for in various settings, rangingfrom community settings to general practice, outpatient departments, day hospitalfacilities and psychiatric admissions. However, the rates of attendance varyconsiderably for different levels of psychiatric care. Other than community support,
01 AH2000 body Page 76 Thursday, June 1, 2000 3:06 PM

2 The health of Australians 77
TRIM SIZE 175 mm Wide x 250 mm Deep
GPs are usually the first point of healthcare contact by people with mental problems inAustralia. The number of GP consultations for mental problems and disorders is morethan twice the total contacts for other forms of professional care.
According to the BEACH (Bettering the Evaluation And Care of Health) Survey,psychological problems accounted for 7.2% of all problems managed by GPs in 1998Ð99,at a rate of 105 every 1,000 encounters (AIHW GPSCU: Britt et al. 1999). In 1996, therewere approximately 1,230 primary care providers in Australia specialising incounselling and psychotherapy (DHAC & AIHW 1999a).
Hospitalisation In 1997Ð98, mental disorders accounted for 235,477 hospital separations, or 4.2% of totalhospital separations (Table 2.12, page 78), an average of 12.6 separations and 169patient-days per 1,000 population (AIHW 1999b).
Persons diagnosed with major depressive disorder or schizophrenia accounted for thehighest proportion of separations for mental disorders in 1997Ð98, 18.6% and 14.7%respectively (AIHW 1999b).
Note: Data for this figure come from two different sources: 1993 Western Australian Child Health Survey (children; dark grey bars) and 1997 National Survey of Mental Health and Wellbeing (adults; light blue bars). The data are presented here to show age-specific changes in the prevalence rates and have been interpreted broadly.
Sources: Silburn et al. 1996; ABS 1998b.
Figure 2.30: Prevalence of mental problems and disorders by age
4–11 12–16 18–24 25–34 35–44 45–54 55–64 65+0
5
10
15
20
25
30Per cent
Age group (years)
01 AH2000 body Page 77 Thursday, June 1, 2000 3:06 PM

78 AustraliaÕs Health 2000
TRIM SIZE 175 mm Wide x 250 mm Deep
Co-morbidityCo-morbidity refers to the occurrence of more than one disorder at the same time, andis commonly found among people with mental disorders. The 1997 Survey of MentalHealth and Wellbeing found that nearly 1 in 3 persons with an anxiety disorder alsohad an affective disorder, and 1 in 5 also had a substance use disorder. Of those whohad an anxiety disorder, 8.7% also had both affective and substance use disorders. Also,those with mental disorders are more likely to have physical conditions. Almost 43% ofpersons with a mental disorder had one or more physical conditions such as a heartproblem, diabetes or cancer. This coexistence of a physical condition and a mentaldisorder was reported much more commonly among females (ABS 1998b).
Disability According to the 1998 Survey of Disability, Ageing and Carers, about 529,000 peoplehad a disability related to a mental disorder (ABS 1999b). Females were more likely toreport psychiatric disability than males. Disability was more common (62.9%) amongthose with both a physical condition and a mental disorder (ABS 1999b).
Table 2.12: Hospital separations(a) for mental disorders, all hospitals(b), 1997Ð98
ICD-9-CM code Principal diagnosis
Hospital separations
Total Per cent Rate (c)
290, 294.1, 331.0 Dementia 7,836 3.3 0.4
291–294 Other organic psychotic conditions(d) 16,572 7.0 0.9
295 Schizophrenic disorders 34,552 14.7 1.9
296 Other affective psychoses(e) 16,229 6.9 0.9
298–299 Other psychoses 4,555 1.9 0.2
296.2–296.3 Major depressive disorder 43,869 18.6 2.4
311 Depressive disorder, nec 8,987 3.8 0.5
297 Paranoid states 2,164 0.9 0.1
300 Neurotic disorders 22,660 9.6 1.2
301 Personality disorders 8,247 3.6 0.4
302 Sexual deviations and disorders 284 0.1 <0.1
303 Alcohol dependence syndrome 14,211 6.0 0.8
304 Drug dependence 6,826 2.9 0.4
305 Non-dependent drug use disorder 6,399 2.7 0.3
306–310, 312–316 Other non-psychotic mental disorders 41,729 17.7 2.2
V71.0 Observation for suspected mental condition 253 0.1 <0.1
Other codes Other factors influencing health status, services contact 104 0.04 <0.1
Total 235,477 100.00 12.6
(a) Includes same-day separations.
(b) Includes public psychiatric hospitals.
(c) Separations per 1,000 population.
(d) Excludes dementia in conditions classified elsewhere (294.1).
(e) Excludes major depressive disorder (296.2–296.3).
Source: AIHW National Hospital Morbidity Database.
01 AH2000 body Page 78 Thursday, June 1, 2000 3:06 PM

2 The health of Australians 79
TRIM SIZE 175 mm Wide x 250 mm Deep
MortalityIn 1998, a total of 3,268 deaths occurred where a mental disorder was listed as theunderlying cause of death. This figure does not include suicide, which is describedseparately in this section.
Death rates for mental disorders increased between 1985 and 1998 (Figure 2.31). Amongmales, the age-standardised rate increased from 13.4 deaths per 100,000 in 1985 to15.4 deaths in 1989, rising to 17.9 deaths in 1998. Female death rates for mental disordersalso increased from 9.3 deaths per 100,000 in 1985 to 11.2 deaths in 1989, rising to12.2 deaths in 1998.
Suicides Suicide is a leading cause of death in Australia, responsible for 2,683 deaths(2,150 males, 533 females) in 1998. The male suicide rate was higher than the female rateacross all age groups. Whereas the rate for adult females varied little by age, the malerate peaked between ages 20 and 39 years and (to a lesser extent) at ages 80 and over(Figure 2.32, page 80).
Suicide became a matter of national public health concern in Australia during the 1990s(DHAC 1998). A focus on youth suicide was prompted by the observation that the ratefor young males (i.e. ages 15Ð24 years) had risen about threefold during the 30 years to1990, and rates at older ages had tended to decline. During the 1990s, the rate did notrise further for males aged 15Ð19 years, but it continued to increase for males aged20Ð39 years (Figure 2.33, page 80).
Note: Mental disorders defined as ICD-9 codes 290–319.
Source: AIHW National Mortality Database.
Figure 2.31: Trends in death rates for mental disorders, 1985 to 1998
1985 1986 1987 1988 1989 1990 1991 1992 1993 1994 1995 1996 1997 19980
5
10
15
20
25Deaths per 100,000 population
Year of death registration
Males
Females
01 AH2000 body Page 79 Thursday, June 1, 2000 3:06 PM

80 AustraliaÕs Health 2000
TRIM SIZE 175 mm Wide x 250 mm Deep
Note: Age standardised to the Australian population at 30 June 1991.
Source: AIHW National Mortality Database.
Figure 2.32: Age-specific suicide rates, 1998
Note: Rates for ages 20–39 years and 40 years and over are age standardised to the June 1991 Australian population. Includes deaths with underlying cause of death codes E950–E959.
Source: AIHW National Injury Surveillance Unit analysis of ABS mortality data.
Figure 2.33: Suicide rates for selected male age groups, 1979 to 1998
15–19 20–29 30–39 40–49 50–59 60–69 70–79 80+0
10
20
30
40
50Deaths per 100,000 population
Age group (years)
Males
Females
1979 1981 1983 1985 1987 1989 1991 1993 1995 19970
10
20
30
40
50Deaths per 100,000 population
Year of death registration
15–19 years
40+ years
20–39 years
01 AH2000 body Page 80 Thursday, June 1, 2000 3:06 PM

2 The health of Australians 81
TRIM SIZE 175 mm Wide x 250 mm Deep
Hanging has become the predominant method of suicide in Australia, and its use isaccelerating (Figure 2.34). The 1,217 suicide deaths by hanging, strangulation andsuffocation in 1998 were 15% of all deaths from external causes, up from 2% in 1980.Hanging has been the most common method of suicide for males since the early 1990sand for females since 1997. The dramatic increase in hanging more than accounts for thetotal increase in the suicide rate in recent years. Suicide by hanging, strangulation andsuffocation rose from 13% of all suicides in 1980 to 45% in 1998. Rates remain muchhigher for males than females, but are increasing for both sexes.
The other marked changes in the method of suicide are a reduction by more than half inthe rate of suicide by shooting since the late 1980s, and an increase of about 20% insuicide by motor vehicle exhaust gas over the same period. Males often use moreviolent means, which result in a greater number of deaths than among females. On theother hand, females have higher rates of hospital separations for suicide and self-harmattempts (DHAC 1998).
Notes
1. Age standardised to the Australian population at 30 June 1991.
2. Categories: hanging, suffocation E953; motor vehicle exhaust gas E952.0; firearms E955.0; drugs, medications E950.0–950.5; other means, rest of E950–959.
Source: AIHW National Injury Surveillance Unit analysis of ABS mortality data.
Figure 2.34: Suicide mortality, 1979 to 1998
1979 1982 1985 1988 1991 1994 1997Year
1979 1982 1985 1988 1991 1994 19970
2
4
6
8
10
12
Deaths per 100,000 population
YearHanging, suffocation
Motor vehicle exhaust gas
Firearms
Drugs, medications
Other means
Males Females
01 AH2000 body Page 81 Thursday, June 1, 2000 3:06 PM

82 AustraliaÕs Health 2000
TRIM SIZE 175 mm Wide x 250 mm Deep
Approximately one-third of persons who die by suicide, and 40% of those who attemptsuicide, were receiving psychiatric treatment before the episode (DHAC 1998). Between60% and 90% of young people who attempt suicide are considered to be depressed(NHMRC 1997a).
Male psychiatric patients are more likely to commit suicide than female patients.Younger patients are at higher risk than older patients, and patients with extendedperiods of in-patient treatment are at twice the risk of suicide compared with short-staypatients (Lawrence et al. 1999).
Suicide and self-harm accounted for 20,131 hospital separations during 1997Ð98, morethan 53,000 patient-days in total. These figures include people who died in hospitalfollowing the suicide attempt.
Burden of mental disordersMental disorders were responsible for 13.3% of the total disease burden and for about30% of the non-fatal burden in 1996 (AIHW: Mathers et al. 1999a). Depression was theleading cause of non-fatal disease burden, responsible for 8% of the total years ofÔhealthyÕ life lost due to disability (YLD).
In males, substance use disorders accounted for 33% of the burden of disease due tomental problems and disorders in 1996 (Figure 2.35). In females, affective disordersaccounted for 39% of the burden. The burden of disease for affective disorders amongfemales was due almost entirely (87%) to depression.
Note: 1 DALY (disability-adjusted life year) = 1 lost year of equivalent ‘healthy’ life.
Source: AIHW: Mathers et al. 1999a.
Figure 2.35: The burden of mental illness by sex and major category of mental disorder, 1996
Other mental disorders
Eating disorders
Borderline personality disorder
Schizophrenia
Childhood conditions
Anxiety disorders
Substance use disorders
Affective disorders
0 10 20 30 40 50 60 70 80DALYS (’000)
Females
Males
01 AH2000 body Page 82 Thursday, June 1, 2000 3:06 PM

2 The health of Australians 83
TRIM SIZE 175 mm Wide x 250 mm Deep
Health system costs The institutional and non-institutional costs of mental disorders have been estimated at$2.58 billion or 8.3% of the total health system costs in 1993Ð94. Intentional self-inflictedinjuries cost a further $69 million (AIHW: Mathers & Penm 1999b). Hospitals andnursing homes accounted for almost 64% of these costs (AIHW: Mathers & Penm 1999b).
In addition, there are numerous indirect costs to the community resulting fromabsenteeism, lost productivity, burden on carers and family, legal costs and lost qualityof life which are difficult to quantify (DHAC & AIHW 1999a).
Major mental disordersTwo mental disorders, depression and schizophrenia, are discussed further in thissection because of their large overall burden in the Australian population.
Depression
A mental problem is classified as ÔdepressionÕ when at least five of the nine symptomslisted in Box 2.11 are present (DHAC & AIHW 1999a). The severity of depression rangesfrom minor melancholy and stress to debilitating levels requiring professional help andmedication. Depression as defined here includes depressive neurosis and postnatal orreactive depression.
Depression was the most common mental disorder reported by adults in the 1997Survey of Mental Health and Wellbeing, with 3.4% of males and 6.8% of femalesreporting the condition (ABS 1998b).
Depression was the fourth most common problem managed by general practitioners in1998Ð99 as revealed by the BEACH survey, at a rate of 35 per 1,000 encounters (AIHWGPSCU: Britt et al. 1999). The majority of patients were females (68%), and between theages of 25 and 64 years (72%). However, there is evidence that depression isunderdiagnosed, and undertreated in primary care settings (NHMRC 1997a).
Box 2.11: Major depressive symptoms¥ Depressed mood most of the day.
¥ Loss of interest or pleasure (in all or most activities, most of the day).
¥ Large increases or decreases in appetite (significant weight loss or gain).
¥ Insomnia or excessive sleeping (hypersomnia).
¥ Restlessness as evident by hand wringing and similar other activities (psychomotor agitation) or slowness of movement (psychomotor retardation).
¥ Fatigue or loss of energy.
¥ Feelings of worthlessness, or excessive and inappropriate guilt.
¥ Diminished ability to concentrate, or indecisiveness.
¥ Recurrent thoughts of death or suicide.Source: APA 1996.
01 AH2000 body Page 83 Thursday, June 1, 2000 3:06 PM

84 AustraliaÕs Health 2000
TRIM SIZE 175 mm Wide x 250 mm Deep
Depression and coexisting disease
Depression frequently occurs in combination with anxiety disorders, substance-relateddisorders, conduct disorders, eating disorders, attention deficit/hyperactivity disorderand chronic conditions such as heart disease, cancer and diabetes.
The 1997 Survey of Mental Health and Wellbeing found that approximately 50% ofpeople who have an affective or depressive disorder also have a related physicalproblem. Recent studies indicate that persons treated for depression have 2.3 times therisk of having a heart attack than those without it (Musselman et al. 1998). Depression isalso associated with an increased risk of developing diabetes and poorer diabeticcontrol (Goodnick 1997). Furthermore, approximately half the people being treated forcancer have a psychiatric disorder, usually with depressive symptoms.
According to the BEACH survey, most of the co-morbidities presenting with depression-related GP encounters were for chronic conditions such as hypertension (67 per 1,000depression-related encounters), back complaints (31 per 1,000), menopausal complaints(27 per 1,000) and diabetes (22 per 1,000). Sleep disturbance, including insomnia,managed at a rate of 21 per 1,000 depression encounters, was the only other psychologicalproblem co-managed with depression.
People with depression may also indulge in more risky health behaviours. There isevidence that 35% of people with mental disorders smoke; the effect is age specific,being more prevalent in younger adults (Jorm 1999).
Schizophrenia
Schizophrenia, bipolar affective disorders and delusional disorders are generallyknown as psychotic disorders. Schizophrenia accounts for over 60% of the psychoticdisorders, with males and females equally affected but with differing degrees ofseverity (Jablensky et al. 1999).
There are approximately 160,000 sufferers of schizophrenia in Australia, and the figureincreases by at least 2,000 each year (NISAD 1998). Schizophrenia can lead to lifelongdisability, affecting 1 in every 100 persons, often between the ages of 16 and 25 years.
For males, the incidence of schizophrenia is highest in those aged 15Ð24 years and forfemales in those aged 25Ð34 years. The disorder can also appear later in adulthood,although onset is less common after age 30 and rare after 40.
One in ten persons suffering from schizophrenia commits suicide and four out of tenare known to have attempted suicide. Most people who commit suicide do so withinthe first 10 years of their illness (DHAC & AIHW 1999a).
DiabetesDiabetes is a long-term (chronic) condition in which blood glucose levels remain highbecause the body produces little or no insulin or cannot use insulin properly. Insulin isa hormone produced by the pancreas that helps the body to use glucose.
Diabetes is the seventh leading cause of death in Australia (ABS 1999d), and contributesto significant illness, disability, poor quality of life and premature mortality. Over thecourse of the disease, diabetes can lead to a variety of conditions and complications
01 AH2000 body Page 84 Thursday, June 1, 2000 3:06 PM

2 The health of Australians 85
TRIM SIZE 175 mm Wide x 250 mm Deep
including heart disease, stroke, blindness, kidney failure and neurological problems.Diabetes also contributes to many pregnancy-related complications for the mother andthe unborn child.
Types of diabetes
Because the common feature of diabetes is high blood glucose, it is often mistakenlythought to be a single disease. There are several types of diabetes, with different causalmechanisms. There are three major types:
Type 1 diabetes is marked by a complete lack of insulin. People with this form ofdiabetes require insulin therapy to survive. It is the most common cause of childhooddiabetes.
Type 2 diabetes is marked by reduced levels of insulin, or the inability of the body touse insulin properly. The disease is common among people aged 40 years and over.Many people with this form of diabetes eventually need insulin therapy to control theirblood glucose levels.
Gestational diabetes occurs during pregnancy in about 4Ð6% of females not previouslydiagnosed with diabetes. Gestational diabetes is a marker of greater risk of developingType 2 diabetes later in life.
Both genetic and environmental factors contribute to the onset of diabetes. Type 1diabetes is believed to be caused by particular biological interactions and exposure toenvironmental triggers. In addition to ageing and genetic predisposition, the risk ofdeveloping Type 2 diabetes increases with body fatness. Regular physical activity, onthe other hand, plays a protective role against the development of Type 2 diabetes(Manson et al. 1992; Perry et al. 1995).
Poor nutrition in foetal and early infant life is also considered to predispose a person tothe development of Type 2 diabetes (Storlien et al. 1997; Hales & Barker 1992). Lowbirthweight, therefore, is considered a useful marker of the lifetime risk for Type 2diabetes (Leger et al. 1997). The risk factors for gestational diabetes are mostly similar tothose for Type 2 diabetes.
Incidence and prevalence
There are no national estimates of the incidence or prevalence of diabetes, based onmeasured blood glucose levels. According to the 1995 National Health Survey (NHS),over 430,700 persons (2.4% of the total population) reported that they had beendiagnosed with diabetes at some point in their lives. Of those, 82% reported that theycurrently have diabetes (ABS 1997d).
The true prevalence of diabetes is higher than the figures given above suggest becausea large proportion of diabetes, especially Type 2 diabetes, remains undiagnosed in thecommunity. It has been estimated that for every person in the population diagnosedwith diabetes, there is one undiagnosed person (DHAC & AIHW 1999c). It is thereforeestimated that there were about 700,000 persons with diabetes in Australia in 1995(Amos et al. 1997).
01 AH2000 body Page 85 Thursday, June 1, 2000 3:06 PM

86 AustraliaÕs Health 2000
TRIM SIZE 175 mm Wide x 250 mm Deep
Among the 1995 NHS respondents reporting diabetes, 18% had Type 1 diabetes, 42%had Type 2 diabetes, and 6% had gestational diabetes. Among the remaining 33%,i.e. those who did not report the type of diabetes, the majority were determined to haveType 2 diabetes (ABS 1997d). Estimates based on various data sources suggest that theprevalence of gestational diabetes is between 5.5% and 8.8% of all pregnancies (Stone &Halliday 1996; Moses & Colaguiri 1997).
The prevalence of diabetes increases with age, from 0.1% among people aged less than15 years to 8.9% among those aged 75 years and over (ABS 1997d). There is also amarked difference in the age profile of people with various types of diabetes. Type 1diabetes is more common among children and young adults because of its early onset;Type 2 diabetes is the predominant form among middle-aged and elderly persons onaccount of a rapid increase in its prevalence after the age of 45.
The prevalence of diabetes, particularly Type 2 and gestational diabetes, is higher incertain population groups, including Aboriginal and Torres Strait Islander peoples andpeople of Chinese, Vietnamese, Indian and Arab origin (Dowse et al. 1990; FECCA1997). On the other hand, Type 1 diabetes is more common among populations ofEuropean origin.
Estimates from regional studies indicate that the incidence (new cases) of Type 1 diabetesis between 12 and 15 per 100,000 among persons aged less than 15 years (McCarty et al.1996). In New South Wales, the incidence of Type 1 diabetes among children under theage of 15 years was reported to be about 22 per 100,000 in 1996. It has been suggestedthat the incidence of Type 1 diabetes in Australia is on the rise, increasing annually by3% between 1992 and 1996 (Handelsman & Jackson 1999).
Efforts are being made to generate reliable estimates of the incidence and prevalence ofdiabetes in Australia. The AIHW has recently established the National Diabetes Registerto assemble and maintain a national database of persons diagnosed with insulin-treateddiabetes (see Box 2.12). The Australian Diabetes, Obesity, and Lifestyle Study (AusDiab)is also currently in progress to determine the prevalence of diabetes using the oralglucose tolerance test. Plans to conduct a national biomedical risk factor survey, whichwould include testing for diabetes, are also being developed.
Diabetes-related complicationsDiabetes, if uncontrolled, can lead to a range of complications including diseases of thesmall blood vessels (microvascular disease) such as kidney disease, nerve damage andloss of vision, and diseases of the large blood vessels (macrovascular disease) such ascoronary heart disease, stroke and peripheral vascular disease. The risk ofmicrovascular complications is similar in both Type 1 and Type 2 diabetes, butmacrovascular complications are more common in persons with Type 2 diabetes.
All types of diabetes are known to be associated with obstetric and neonatalcomplications. Poorly managed diabetes in pregnancy can lead to spontaneousabortions, stillbirths or difficult births.
A range of factors is known to lead to, or contribute to, the risk of developingcomplications in diabetes. In addition to uncontrolled glucose levels and duration ofdisease, these risk factors include age, genetic predisposition, obesity, high blood
01 AH2000 body Page 86 Thursday, June 1, 2000 3:06 PM

2 The health of Australians 87
TRIM SIZE 175 mm Wide x 250 mm Deep
pressure, high cholesterol and tobacco smoking. The avoidance or reduction of risk-increasing behaviours and conditions can delay the onset or slow the progression ofcomplications associated with diabetes.
According to the 1995 NHS, the proportion of people with diabetes who also reportedhypertension (44.1%) was more than four times that of people without diabetes (10.0%).Similarly, the proportion of people with diabetes who reported heart disease (14.9%)was more than six times that of people without diabetes (2.5%), and the proportion ofpeople with diabetes who had kidney disease (6.8%) was over four times that of peoplewithout diabetes (1.5%). For eye disorders, 6% of people with diabetes reportedblindness, 10% reported cataracts and 3% reported glaucoma, all complications at muchhigher rates than reported by people without diabetes (ABS 1997d).
A study in South Australia has estimated that among people with Type 2 diabetes, twoout of three persons had at least one microvascular complication and more than one outof two persons had at least one macrovascular complication (Phillips et al. 1998).Common complications found were nerve damage, coronary heart disease andcirculatory problems in lower limbs and feet. More males than females reporteddiabetes-related complications.
Data from the 1999 National Association of Diabetes Centres (NADC) survey have alsoshown that persons attending specialist diabetes services (diabetes centres and specialistendocrinologists in private practice) have had a wide range of complications includingerectile dysfunction, nerve damage, kidney problems, eye damage, circulatory problemsin the limbs, myocardial infarction and stroke (Table 2.13, page 88).
Further evidence of renal complications caused by diabetes is found in the Australiaand New Zealand Dialysis and Transplant Registry, a register of people requiringkidney dialysis or a kidney transplant. About one in five registrants during 1995Ð97were persons with diabetes (Disney et al. 1998a).
Box 2.12: National Diabetes RegisterThe National Diabetes Register was established in 1999 as part of the National DiabetesStrategy to collect information about Australians who have insulin-treated diabetes. TheRegister is operated by AIHW using data from Diabetes Australia and the AustralasianPaediatric Endocrine Group.
The Register is currently collecting information about people who have been diagnosedwith insulin-treated diabetes since 1 January 1999.
Information contained in the register will assist in monitoring the incidence of insulin-treated diabetes in Australia (including Type 1, Type 2 and gestational diabetes).Researchers will also be able to use the Register for their studies on diabetes. In particular,it is expected that the Register will become an important source of information for clinicaland epidemiological studies of the causes, complications and even prevention of diabetes.
01 AH2000 body Page 87 Thursday, June 1, 2000 3:06 PM

88 AustraliaÕs Health 2000
TRIM SIZE 175 mm Wide x 250 mm Deep
Health services usePeople with diabetes are more than twice as likely as those without diabetes to consulthealth professionals or use hospital services (ABS 1997d). This higher rate is related totreatment for blood glucose control, as well as for complications associated with diabetes.
GP consultations
In 1998Ð99, according to the BEACH survey, diabetes was managed at 3.2% of all GPencounters with males and 2.1% of encounters with females (AIHW GPSCU: Britt et al.1999). For persons with diabetes, high blood pressure and lipid disorders were the othermain problems managed (Table 2.14). Ischaemic heart disease without angina and heartfailure were also common problems managed for males, whereas osteoarthritis anddepression were commonly managed for females with diabetes.
Hospital separationsIn 1997Ð98, diabetes was the principal diagnosis in 23,855 hospital separations or 0.4%of all hospital separations for that period. Diabetes is often not reported as the principaldiagnosis because the condition responsible for the hospitalisation, rather than thediabetes, is recorded as the principal diagnosis even when it is a complication ofdiabetes. Diabetes is often reported as an additional diagnosis, in particular in
Table 2.13: Presence of complications among people with diabetes, 1999
Current condition Per cent Condition (a) Per cent
Erectile dysfunction 26.4 Severe hypoglycaemia 4.5
Peripheral neuropathy 23.0 Myocardial infarction 2.3
Peripheral vascular disease 12.2 Stroke 2.1
Previous foot ulcer 5.0 New blindness 1.4
Active foot lesion 3.7 Lower limb amputation 0.9
Current foot ulcer 2.4 End-stage renal disease 0.8
Total sample 7,110 Total sample 7,110
(a) Condition seen in the last 12 months.
Source: NADC ANDIAB (Australian National Diabetes Information Audit & Benchmarking) Collection.
Table 2.14: GP consultations: top five ÔotherÕ problems managed at encounters where diabetes
was managed, 1998Ð99
Males Per cent (a) Females Per cent (a)
Hypertension 19.0 Hypertension 20.1
Lipid disorder 7.3 Lipid disorder 5.3
IHD(b) without angina 3.9 Immunisation(c) 5.1
Immunisation(c) 3.7 Osteoarthritis 3.0
Heart failure 2.7 Depression 2.9
Total number of complications 1,544 Total number of complications 1,543
(a) Listed condition as a proportion of all complications.
(b) Ischaemic heart disease.
(c) Includes preventive immunisation medication for hepatitis, tetanus, influenza and other non-specific conditions.
Source: AIHW GPSCU: Britt et al. 1999.
01 AH2000 body Page 88 Thursday, June 1, 2000 3:06 PM

2 The health of Australians 89
TRIM SIZE 175 mm Wide x 250 mm Deep
association with primary diagnoses of coronary heart disease, stroke and kidneydisease. When separations for diabetes as the principal diagnosis and as an additionaldiagnosis are combined, the total number of such separations rises to 300,181 or 5.4% ofall hospital separations (AIHW 1999b). This high number gives some insight into theextent of diabetes-related morbidity in the population, and the need to manage it in ahospital setting.
The impact of diabetes on the health system is further increased by the long periodsthat patients with diabetes spend in hospital. The average length of stay in hospital forpersons with diabetes as the principal diagnosis was 7 days (8.1 days when same-dayseparations were excluded). In comparison, the average length of stay for all personswithout diabetes as the primary diagnosis was 4.0 days (AIHW 1999b).
Diabetes also contributes to extended hospital stays for other related or non-relatedconditions. When separations for diabetes as an additional diagnosis were included inthe analysis, the average length of hospital stay increased to 7.9 days.
Mortality
Diabetes was the underlying cause of 2,751 deaths, or 2.2% of all deaths in 1998. Inaddition, diabetes was listed as an associated cause of 6,703 deaths (ABS 1999d).
Diabetes is rarely listed alone as the cause of death. Of the deaths in 1998 wherediabetes was given as the underlying cause of death, in less than 2% of cases it waslisted as the only cause. Listed in association with diabetes (as an underlying cause ofdeath) were conditions such as ischaemic heart disease (54.0%), hypertensive disease(22.6%), stroke (20.8%) and kidney-related diseases (19.7%).
Of the deaths in 1998 where diabetes was listed as an associated cause of death,ischaemic heart disease was recorded as the underlying cause of death in 26.4% ofcases. Other prominent underlying causes of death with which diabetes was associatedincluded cancer (13.8%) and stroke (8.3%).
The death rate for diabetes (as an underlying cause of death) has shown a consistentincrease in recent years, with average annual increases of 1.7% and 0.4% for males andfemales respectively between 1986 and 1997.
Burden of diabetes
In terms of premature mortality, diabetes was responsible for almost 70,000 years of lifelost (YLL) in 1996, almost 5.3% of the estimated YLL in Australia that year for all causes.Diabetes and its complications were also responsible for much disability in 1996, withmore than 53,000 years of equivalent ÔhealthyÕ life lost to disability (YLD), or 4.6% of allYLDs estimated for 1996. Although the impact of diabetes in terms of prematuremortality was similar in both sexes, YLD was much higher among males than females(AIHW: Mathers et al. 1999a).
As a result of the high impact of the disease, a substantial proportion of healthcareexpenditure goes on diabetes and its complications. The direct costs of diabetes and itscomplications in 1993Ð94 have been estimated at $681 million, or 2.2% of total healthsystem costs (AIHW: Mathers & Penm 1999a).
01 AH2000 body Page 89 Thursday, June 1, 2000 3:06 PM

90 AustraliaÕs Health 2000
TRIM SIZE 175 mm Wide x 250 mm Deep
AsthmaAsthma is a chronic inflammatory disorder of the airways that results in variableairflow obstruction in response to certain triggers. The disease affects all age groups butparticularly young people, and ranges in severity from intermittent mild symptoms to asevere, incapacitating and life-threatening disorder.
People with asthma experience reduced quality of life and require a range of healthservices, from consultations in primary care to emergency room visits to hospitalinpatient care. The symptoms are reversible, either spontaneously or with treatment;however, death may result if the asthmatic episode is not managed properly(NHLBI 1992).
Asthma is highly prevalent in Australia. Although asthma mortality has declined in thepast decade, Australia has the highest death rate for asthma among its young people incomparison to other developed countries (Peat et al. 1994).
Asthma became the sixth National Health Priority Area in 1999.
Prevalence The prevalence of asthma in Australia is one of the highest in the world, with more than2 million Australians estimated to be affected by the disease. According to the NationalHealth Survey (NHS), the self-reported prevalence of asthma has increased from 85 per1,000 persons in 1989Ð90 to 113 per 1,000 persons in 1995 (ABS 1997c). Most of these hadasthma of mild to moderate severity, and were not at high risk of death from the disease.
Asthma is more prevalent in young people. In the 1995 NHS, it was more commonlyreported as a recent or long-term condition by those aged less than 25 years (149 per 1,000persons). It was reported most often in those aged 5Ð14 years (192 persons per 1,000).Among those aged less than 15 years, asthma was reported more often by males, but inolder age groups the condition was more common in females (Figure 2.36).
There is some regional/latitudinal variation in the prevalence of asthma in Australia.According to the 1995 NHS, Queensland had the highest (134 per 1,000 persons) andTasmania the lowest (103 per 1,000 persons) prevalence of asthma. Symptoms of asthmado not vary much with season, although autumn has been reported as the time whenasthma attacks increase in number and severity (ABS 1997c).
Risk factorsThe symptoms of asthma can be triggered by a wide variety of agents in theenvironment, acting either alone or in conjunction with other irritants. The irritants thatcause episodes of airway narrowing and other asthma symptoms are specific to eachindividual. The known irritants include allergens, exercise, viral infections, exposure totobacco smoke, food chemicals, cold air and weather changes.
Allergens. Known asthma allergens include house dust mites, pollens and animal fur(usually cats and dogs). A high proportion of asthmatics (about 80%) are allergic to thehouse dust mite (Newton et al. 1998). Australian houses are reported to have some ofthe highest levels of house dust mite. This is mainly due to environmental factors suchas the location of housing in temperate coastal climates, which provide ideal conditionsfor mite proliferation.
01 AH2000 body Page 90 Thursday, June 1, 2000 3:06 PM

2 The health of Australians 91
TRIM SIZE 175 mm Wide x 250 mm Deep
Smoking. Tobacco smoking has been identified as another risk factor for asthma.According to the 1995 NHS, asthma prevalence was higher among smokers (11%) andex-smokers (11%) than those who have never smoked (9%). Furthermore, the prevalenceof asthma in young children living in households with one or more smokers was higherthan in non-smoking households. Of children aged 0Ð4 years, 13% living in householdswith one or more smokers had asthma compared with 9% in non-smoking households.Similarly, of children aged 5Ð9 years, 22% living in households with one or moresmokers had asthma compared with 18% in non-smoking households (ABS 1997c).
Drugs. Traditional, prescription or non-prescription drugs can also trigger asthmaticepisodes. The medications that may cause or exacerbate asthma symptoms includebeta-adrenergic blocking agents and aspirin. Some herbal preparations, such as ÔRoyalJellyÕ which has concentrated bee-pollen, can also trigger asthma. Allergic reactions andexacerbation of asthma have been reported with the use of herbs such as echinacea(Newton et al. 1998).
Other irritants. Exposure to sensitising agents in the workplace can also cause asthma,generally referred to as occupational asthma. Known agents include wood dust, flour,laboratory animals, industrial chemicals (isocyanates and epoxy resins) and metal salts.Extended exposure to these agents may also increase the severity of asthma symptoms(Newton et al. 1998).
Source: ABS 1997c.
Figure 2.36: Age-specific prevalence of asthma, 1995
0–4 5–14 15–24 25–34 35–44 45–54 55–64 65–74 75+0
50
100
150
200
250Rate per 100,000 population
Age group (years)
Males
Females
01 AH2000 body Page 91 Thursday, June 1, 2000 3:06 PM

92 AustraliaÕs Health 2000
TRIM SIZE 175 mm Wide x 250 mm Deep
Immunogenetic susceptibilities. Asthma often coexists with other respiratory and allergicconditions such as eczema, seasonal allergic rhinoconjunctivitis (hay fever), chronicobstructive pulmonary disease, emphysema and bronchitis, several of which areimmunogenetic in origin.
Asthma managementAsthma can be controlled by effective education, regular use of peak flow meters,identification of trigger factors, coordinating self-management with written actionplans, and regular medical consultations. Studies have shown that self-managementeducation reduces hospitalisations, emergency room visits, unscheduled visits to thedoctor, days off work and nocturnal asthma (Gibson et al. 1999).
Persons who have had a hospital admission related to asthma within the last 12 monthsof their consultation or who require three or more medications for control of theirasthma are at an increased risk of dying from the disease. These persons need tailoredmanagement plans developed by their GP and close consultation with their provider(Ruffin & Southcott 1997).
General practitioner consultationsAccording to the BEACH survey, asthma is the sixth most frequently managed problem(32 per 1,000 encounters) by GPs, accounting for 2.2% of problems managed in 1998Ð99(AIHW GPSCU: Britt et al. 1999).
Hospital separations Asthma is in the top five problems referred to hospital by GPs (AIHW GPSCU: Britt et al.1999). During 1997Ð98, asthma was the principal diagnosis in 60,280 hospital separationsor 1.08% of all hospital separations, with an average stay of 3.5 days (AIHW 1999b).
Asthma is often reported as an additional diagnosis in hospital separations, inparticular with principal diagnoses of pneumonia, cataract and heart conditions such asangina. When separations for asthma as the principal diagnosis and as an additionaldiagnosis are combined, the number rises to 251,472 or 4.52% of all hospital separations(AIHW 1999b). This figure gives some insight into the extent of hospital use associatedwith asthma.
Emergency department admissions
Asthma is one of the most common reasons for emergency department admissions. Theclinical presentation encompasses the whole spectrum of disease severity from chroniccough or mild wheeze to respiratory arrest. Misdiagnosis, undertreatment or poorasthma control of persons with asthma in the community and possibly in hospitalsoften lead to re-admissions either in the course of the same attack or with subsequentattacks of asthma.
A cross-sectional survey in Adelaide in 1994 found that 62% of 272 patients aged under15 years and 40% of 165 patients aged 15 years and over had attended hospital two ormore times during the preceding year. Among adults, repeat attendance was related toasthma severity but among children re-admissions were associated with parentalattitudinal variables relating to appraisal of their childÕs asthma severity, managementof asthma attacks and parental worry (Wakefield et al. 1997).
01 AH2000 body Page 92 Thursday, June 1, 2000 3:06 PM

2 The health of Australians 93
TRIM SIZE 175 mm Wide x 250 mm Deep
Disability
Asthma is a cause of significant disability in the community. According to the 1998Disability, Ageing and Carers Survey (ABS 1999b), more than 171,000 people inAustralia reported asthma as a disabling condition. The disability is mainly in the formof restriction of daily activities, including work and school participation. Furthermore,131,400 Australians reported experiencing specific activity limitation in regard to self-care, mobility and communication due to their asthma (ABS 1999b).
Mortality
Asthma was the underlying cause of 685 deaths in 1998, compared with 543 in 1980 and964 in 1989 (the peak year of asthma deaths). The death rates were generally similar forboth sexes from 1980 to 1998, although the rate among females was slightly higher thanthe rate among males between 1993 and 1998. The declining death rates since 1990(Figure 2.37) suggest improved treatment and management of the disease.
Burden of disease
As indicated above, asthma is a major cause of disability rather than prematuremortality. In 1996, asthma was responsible for 2.6% of the total burden of disease inAustralia. However, most of the burden of disease was more in the form of YLD (over86%) than YLL (AIHW: Mathers et al. 1999a).
Note: Age standardised to the Australian population at 30 June 1991.
Source: AIHW National Mortality Database.
Figure 2.37: Trends in death rates for asthma, 1980 to 1998
1980 1982 1984 1986 1988 1990 1992 1994 19963
4
5
6Deaths per 100,000 population
Age group (years)
Males
Females
01 AH2000 body Page 93 Thursday, June 1, 2000 3:06 PM

94 AustraliaÕs Health 2000
TRIM SIZE 175 mm Wide x 250 mm Deep
The majority of cases of asthma are diagnosed before the age of 15. These casescontribute 70% of the total asthma burden. The average duration of childhood/adolescent asthma is around 17 years and the average duration for asthma diagnosed inadulthood is around 30 years. As a result, the majority of asthma cases diagnosed inchildhood will continue into adulthood. This means that at any point in time themajority of existing (prevalent) cases of asthma will be in adults, with around 67% ofthe disability burden associated with prevalent cases at ages 15 and over and 34%associated with prevalent cases at ages 25 and over.
Health system costsThe health system costs for asthma are estimated to be $478 million in 1993Ð94, morethan 19% of the total costs for all respiratory conditions in that period. These includecosts that relate to prevention, diagnosis and treatment of asthma.
Pharmaceuticals constitute a large proportion of asthma-related costs ($199 million, or42% of the total costs). This is in contrast to the pattern of costs for other diseases, forwhich 45% of all costs are in the hospital sector (inpatients and outpatients), and only13% of the costs are towards pharmaceuticals. Hospital sector expenditure accounts foronly 28% of direct costs for asthma (Figure 2.38) (AIHW: Mathers & Penm 1998).
2.4 Other major chronic diseases and conditionsAlthough more than 80% of the years of life lost due to premature mortality (YLL) havebeen attributed to the six National Health Priority Areas (NHPAs), a large proportion ofyears of equivalent ÔhealthyÕ life lost to disability (YLD) result from a variety of otherchronic diseases and conditions. Prominent among the non-NHPA chronic diseases andconditions described in this section are chronic obstructive pulmonary diseases
Source: AIHW: Mathers & Penm 1998.
Figure 2.38: Health system costs for asthma, 1993Ð94
Hospital inpatients (20%)
Nursing homes (1%)
GPs and specialists (21%)
Other health professionals (3%)
Pharmaceuticals (42%)
Out-patients (8%)
Other (4%) Research (1%)
01 AH2000 body Page 94 Thursday, June 1, 2000 3:06 PM

2 The health of Australians 95
TRIM SIZE 175 mm Wide x 250 mm Deep
(COPD), musculoskeletal diseases and conditions, nervous system disorders, kidneyproblems and cirrhosis of the liver. This section outlines morbidity, disability andmortality associated with these diseases and conditions.
Chronic obstructive pulmonary disease COPD, also referred to as chronic obstructive airways disease, is a term used to describea combination of several different but related diseases. COPD is a progressive andirreversible disabling disorder characterised by diminished breathing capacity of thelungs. Several factors have been identified as contributors to COPD. Cigarette smokingis the most common risk factor; other risk factors include exposure to pollution (in theworkplace or elsewhere) and/or infection.
Chronic bronchitis and emphysema are the two prominent COPD diseases. Unspecifiedbronchitis, extrinsic allergic aleolitis and primary pulmonary heart disease (excludingkyphoscoliotic heart disease) are also categorised as COPD.
It is estimated that there were almost 300,000 persons with COPD in 1996, with morethan 20,000 new cases every year (AIHW: Mathers et al. 1999a). A large proportion ofthese cases were males.
Mortality. Although much less prevalent in the population than asthma, COPD isresponsible for more deaths. In 1998, COPD was responsible for 5,352 deaths, the fourthmost common cause of death among males (3,326 deaths) and sixth most commoncause of death among females (2,026 deaths).
The male death rate for COPD decreased from a peak of 75 per 100,000 in 1982 to a lowof 38 per 100,000 in 1998. In contrast, the female death rate increased slightly from11 per 100,000 in 1979 to 17 per 100,000 in 1998 (Figure 2.39, page 96).
Reductions in male mortality from COPD are considered to follow the decline insmoking rates and, to a lesser extent, better management of the disease. The increase inthe female death rate could be the delayed effect of an increase in the proportion offemale smokers, from the late 1970s to mid-1980s.
Hospitalisation. In 1997Ð98, there were almost 40,000 hospital separations with theprincipal diagnosis of COPD, with an average length of stay of 5.3 days.Hospitalisations for COPD occur principally among the elderly.
Hospital separation rates for COPD were higher for males than for females. Male hospitalseparations rates increased sharply from 140 per 100,000 in the age group 50Ð54 years to apeak of 4,300 per 100,000 in the age group 85 years and over. The increase in female rateswith age was not as pronounced, rising from 170 per 100,000 in the age group 50Ð54 yearsto a peak of 1,450 per 100,000 in those aged 80Ð84 years (Figure 2.40).
Disability. COPD is a major cause of disability. It occurs more commonly among olderindividuals who often have multiple chronic conditions that contribute to overalldisability. A prospective study of COPD suggests that disability in persons sufferingfrom COPD progresses gradually. However, within 7 to 8 years of initial diagnosis, mostpersons with COPD are no longer capable of productive work (Goldring et al. 1993).
01 AH2000 body Page 95 Thursday, June 1, 2000 3:06 PM

96 AustraliaÕs Health 2000
TRIM SIZE 175 mm Wide x 250 mm Deep
Source: AIHW National Mortality Database.
Figure 2.39: Trends in death rates for chronic obstructive pulmonary disease, 1979 to 1998
Source: AIHW National Hospital Morbidity Database.
Figure 2.40: Age-specific hospital separations with COPD as the principal diagnosis, 1997Ð98
1979 1981 1983 1985 1987 1989 1991 1993 1995 19970
10
20
30
40
50
60
70
80Deaths per 100,000 population
Year
Males
Females
0–4 10–14 20–24 30–34 40–44 50–54 60–64 70–74 80–840
500
1,000
1,500
2,000
2,500
3,000
3,500
4,000
4,500Separations per 100,000 population
Age group
Males
Females
85+
01 AH2000 body Page 96 Thursday, June 1, 2000 3:06 PM

2 The health of Australians 97
TRIM SIZE 175 mm Wide x 250 mm Deep
Burden of disease. The burden of COPD includes both premature mortality andsignificant disability. In 1996, COPD was the largest contributor to the burden of diseaseassociated with all respiratory diseases and conditions (including asthma), three timesthe burden of acute respiratory infections and more than four times the burden of otherchronic respiratory diseases (Figure 2.41).
The burden of COPD was greater among males than females. In 1996, it was the fourthleading cause of disease burden among males, accounting for 4.2% of their total diseaseburden, and the sixth leading cause for females, 3.2% of their total disease burden(AIHW: Mathers et al. 1999a:66).
The burden due to COPD increases with age, to peak in the age groups 55Ð74 years formales and 75 years and over for females. Among those aged 65 years and over, COPDranks as the fourth leading cause of burden for both males and females, accounting for5.8% and 4.0% respectively of the total burden (AIHW: Mathers et al. 1999a:73).
Arthritis and other musculoskeletal disordersArthritis and other diseases of the musculoskeletal system and connective tissue are adiverse group of diseases and conditions that includes problems, conditions anddisorders such as chronic back pain, gout, osteoporosis, osteoarthritis, rheumatoidarthritis and juvenile arthritis. They are responsible for considerable illness, morbidityand disability, compromising the quality of life, but have relatively low mortality whencompared with other disease groups. The impact of these diseases and conditions isdescribed below.
Source: AIHW unpublished data.
Figure 2.41: The burden of chronic obstructive pulmonary disease and other respiratory diseases, 1996
Acute respiratoryinfections
Other chronicrespiratory diseases
Chronic obstructivepulmonary disease
0 10 20 30 40 50 60 70 80 90 100DALYs (’000)
YLL
YLD
01 AH2000 body Page 97 Thursday, June 1, 2000 3:06 PM

98 AustraliaÕs Health 2000
TRIM SIZE 175 mm Wide x 250 mm Deep
The scale of the problem
Incidence and prevalence. In 1995, almost 5 million Australians (26% of the totalpopulation) self-reported one or more musculoskeletal diseases or conditions (ABS1997b:21). A majority of these respondents, 17% of the total population, reported theirproblem or condition as being long term (one that had lasted or was expected to last for6 months or more). Arthritis and back problems (disorders of the intervertebral disc andunspecified back problems) were reported most commonly, by 15% and 6% of the totalpopulation respectively (ABS 1997b:20,21).
Hospital separations and visits to GPs are other useful indicators of the extent of illnesscaused by these diseases and conditions (Table 2.15). In 1997Ð98, hospital separationsfor diseases of the musculoskeletal system and connective tissue represented 5.6% of allhospitalisations, with an average length of stay of 4.1 days. There were slightly moreseparations among males (52%) than females (48%). Musculoskeletal diseases andconditions also accounted for 11.7% of problems managed by GPs in 1998Ð99, with backcomplaints and osteoarthritis being the most common (AIHW GPSCU: Britt et al.1999:41).
Estimates of the incidence and prevalence of various musculoskeletal diseases andconditions, based on a range of data sources, have been recently generated (AIHW:Mathers et al. 1999a). Back pain is the most common of these diseases and conditions,with a prevalence rate of 51 per 1,000 population, followed by osteoarthritis with a rateof 34 per 1,000 population (Table 2.15).
Disability. Musculoskeletal diseases and conditions are responsible for much disabilityin the population. In 1998, about 1.2 million Australians were reported to have adisability due to arthritis and other musculoskeletal disorders (AIHW 1999a:219). Thisrepresents about one-third (34.4%) of people with a disability.
Of those reporting arthritis or other musculoskeletal disorders as their disablingcondition, more than 90% had restrictions in one or more of their core activities of self-care, mobility and communication, and/or restrictions in schooling or employment.People who were unable to perform core activities, or who always needed assistance,together with those who sometimes needed assistance, represented 29% of peoplereporting a musculoskeletal disability (ABS 1999b:23). Old age, accident and injurywere described as the major causes of disability attributed to arthritis and othermusculoskeletal disorders, each accounting for 27% of the reported cases. Workingconditions, work and overwork were reported as responsible in 21% of the cases ofmusculoskeletal disability (ABS 1999b:24).
Mortality. Compared with other major disease groups, deaths attributed to arthritis andother diseases of the musculoskeletal system as the underlying cause are relativelyuncommon. In 1998, death rates for diseases of the musculoskeletal system andconnective tissue were 2.3 per 100,000 males and 3.7 per 100,000 females.
Disease burden. In 1996, musculoskeletal diseases and conditions represented 4.7% of thetotal disease burden among females and 2.6% of the total burden among males (AIHW:Mathers et al. 1999a:69). Years of ÔhealthyÕ life lost due to disability represented 94% ofthe total burden among males and 91% among females.
01 AH2000 body Page 98 Thursday, June 1, 2000 3:06 PM

2 The health of Australians 99
TRIM SIZE 175 mm Wide x 250 mm Deep
Health system costs. Musculoskeletal disorders and conditions accounted for about$3 billion in health system costs in 1993Ð94, the third highest in the list of diseasegroups that are responsible for most health system expenditure. Back problems were amajor component, accounting for 23% of the total expenditure on musculoskeletaldisorders (Table 2.15). Osteoarthritis accounted for 21% of the costs, rheumatoidarthritis for 4% and osteoporosis for 2% (AIHW: Mathers & Penm 1999b:19).
Table 2.15: Selected musculoskeletal diseases and conditions: estimated incidence (1996), prevalence (1996), hospitalisations (1997Ð98) and health system costs (1993Ð94)
Disease or conditionIncidenceper 1,000
Prevalenceper 1,000
Hospital-isations
Total costs($’000)
Back pain 337.4 50.6 44,402 700
Osteoporosis 0.8 8.5 17,130 60
Osteoarthritis 2.3 34.1 51,306 624
Rheumatoid arthritis 0.2 3.0 5,683 129
All musculoskeletal diseases and conditions 480.5 131.1 312,383 3,002
Sources: AIHW National Morbidity Database; AIHW: Mathers et al. 1999a; AIHW: Mathers & Penm 1999b.
Source: AIHW National Hospital Morbidity Database.
Figure 2.42: Age-specific hospital separations with principal diagnoses of chronic back pain or slipped disc, 1997Ð98
0–4 10–14 20–24 30–34 40–44 50–54 60–64 70–74 80–840
100
200
300
400
500
600
700
800
900Separations per 100,000 population
Age group85+
Males
Females
01 AH2000 body Page 99 Thursday, June 1, 2000 3:06 PM

100 AustraliaÕs Health 2000
TRIM SIZE 175 mm Wide x 250 mm Deep
Back pain
Back pain encompasses both chronic back pain and slipped disc. It can be caused by thedisplacement of an intervertebral disc, bone growth, and ligament and/or musclestrain. Most back problems and complaints are transitory and short term, but in somecases they can become chronic.
In 1996, the prevalence rate for back pain was 51 per 1,000 persons (Table 2.15, page 99),higher in males (57 per 1,000) than females (45 per 1,000). The incidence rate for backpain has been estimated as 354 per 1,000 males and 321 per 1,000 females (AIHW:Mathers et al. 1999a:209).
Back complaints were the most frequent musculoskeletal disease or condition managedby GPs (AIHW GPSCU: Britt et al. 1999:41). Overall, back complaints were the seventhmost frequent problem managed by GPs in 1998Ð99, accounting for 1.8% of the totalproblems managed.
Considerable hospitalisation occurs for back pain. In 1997Ð98, there were about 44,000hospital separations with back pain as the principal diagnosis (Table 2.15). The rateswere slightly higher for females (245 per 100,000) than males (240 per 100,000), althoughthe separation rates were higher among males in the age groups between 20Ð24 yearsand 40Ð44 years (Figure 2.42, page 99).
Osteoporosis
Osteoporosis is a condition in which reduction in bone mass over time increases risk offractures, back pain and a curving of the spine. The occurrence of the conditionincreases with age and is common among older people.
Females are more susceptible to osteoporosis because of the reduction in bone densitythat begins around the age of 40 and accelerates in the years after menopause. Forexample, it is estimated that the proportion of females with osteoporosis increases from15% among those aged 60 to 64 years to 71% among those over 80 years of age (AIHW:Mathers et al. 1999a:74,209). The prevalence of osteoporosis among females (13.7 per1,000) was more than four times that among males (3.2 per 1,000) in 1996.
A similar picture emerges for hospital separations. In 1997Ð98, hospital separation ratesfor osteoporosis were 109 per 100,000 females and 89 per 100,000 males. The separationrates increase with age, most rapidly from age 60Ð64 years to peak in the age group85 years and over (Figure 2.43).
Osteoarthritis
Osteoarthritis is a degenerative joint disease affecting primarily the hands, spine andweight-bearing joints such as hips, knees and ankles. The disease begins in cartilageoverlying the ends of joint bones, and is caused and accelerated by mechanical forces,disrupting the normal function of the joint. Pain is initially experienced in the jointsduring and after activity, but as degeneration progresses it may occur with onlyminimal movement or even during rest. Obesity, overuse of a joint during recreationalor work-related activities, meniscus tears and other forms of arthritis are associatedwith the development of osteoarthritis, as are genetic factors.
01 AH2000 body Page 100 Thursday, June 1, 2000 3:06 PM

2 The health of Australians 101
TRIM SIZE 175 mm Wide x 250 mm Deep
Osteoarthritis is the second most prevalent musculoskeletal disease, after back pain, witha rate of 34 per 1,000 persons in 1996 (Table 2.15, page 99). It is more prevalent amongfemales (42 per 1,000) than males (27 per 1,000) (AIHW: Mathers et al. 1999a:209). It wasthe tenth most frequently managed problem in general practice, representing 1.5% of allproblems managed in 1998Ð99 (AIHW GPSCU: Britt et al. 1999:41).
Hospitalisation for osteoarthritis is mostly concentrated in the older age groups(Figure 2.43). In 1997Ð98, the hospital separation rate for females (311 per 100,000) wasslightly higher than the rate for males (283 per 100,000).
Osteoarthritis ranked as the tenth leading cause of total disease burden, ranking higheramong females (9th) than males (15th) (AIHW: Mathers et al. 1999a:66). It accounted for63% of the total burden of musculoskeletal diseases and conditions in 1996. The burdenof osteoarthritis is almost entirely (99%) composed of years of equivalent ÔhealthyÕ lifelost due to disability.
Rheumatoid arthritis
Rheumatoid arthritis (which includes juvenile rheumatoid arthritis) is the mostdisabling form of arthritis as it involves more than one joint and can ultimately lead tojoint destruction. The disease commences as an inflammation of the joint lining orsynovium that progresses to other parts of the joint and leads to destruction of the bone.
Source: AIHW National Hospital Morbidity Database.
Figure 2.43: Age-specific hospital separations with principal diagnoses of osteoporosis and osteoarthritis, 1997Ð98
0–4 10–14 20–24 30–34 40–44 50–54 60–64 70–74 80–840
200
400
600
800
1,000
1,200
1,400
1,600
1,800Separations per 100,000 population
Age group
Males—osteoarthritis
Females—osteoarthritis
Males—osteoporosis
Females—osteoporosis
85+
01 AH2000 body Page 101 Thursday, June 1, 2000 3:06 PM

102 AustraliaÕs Health 2000
TRIM SIZE 175 mm Wide x 250 mm Deep
It is most common in joints of the fingers, toes, wrists, knees, elbows and ankle.However, rheumatoid arthritis can also cause inflammation in the heart, blood vesselsand other body tissues.
Rheumatoid arthritis is more common among females. The prevalence rate in 1996 was4.1 per 1,000 females compared with 1.9 per 1,000 males (AIHW: Mathers et al.1999a:209). The hospital separation rate among females (42.8 per 100,000) was 2.5 timesthe rate among males (17.4 per 100,000). There was a similar difference in hospitalseparation rates for juvenile rheumatoid arthritis, 3.7 per 100,000 females comparedwith 1.4 per 100,000 males.
Hospital separation rates for rheumatoid arthritis increased rapidly from the age group40Ð44, reaching a peak in the age group 75Ð79 years. The juvenile form of the diseasewas concentrated in the younger age groups, particularly among those aged 0Ð14 years(Figure 2.44).
Gout
Gout is a form of arthritis in which joint inflammation is caused by a deposit of sodiumurate crystals in the synovium. It occurs mostly in toes, ankles, knees, elbows, wristsand hands, and more frequently in older males.
Source: AIHW National Hospital Morbidity Database.
Figure 2.44: Age-specific hospital separations with principal diagnoses of juvenile chronic arthritis and rheumatoid arthritis, 1997Ð98
0–4
10–14
20–24
30–34
40–44
50–54
60–64
70–74
80–84
0
20
40
60
80
100
120
140
160
180Separations per 100,000 population
Age group
Males
Females
All rheumatoid arthritis
0–4
10–14
20–24
30–34
40–44
50–54
60–64
70–74
80–84
0
2
4
6
8
10
12
14Separations per 100,000 population
Age group
Males
Females
Juvenile chronic arthritis
01 AH2000 body Page 102 Thursday, June 1, 2000 3:06 PM

2 The health of Australians 103
TRIM SIZE 175 mm Wide x 250 mm Deep
Gout is a major cause of hospitalisation, particularly among males. In 1997Ð98, hospitalseparation rates for gout were 24 per 100,000 males and 8 per 100,000 females.
Hospital separation rates for gout increase markedly with age. For males, it increasedfrom 8 per 100,000 in the age group 30Ð34 years to 53 per 100,000 in the age group65Ð69 years, then increased sharply to 310 per 100,000 in the age group 85 years andover. For females, the hospital separation rate was comparatively lower in all agegroups, nonetheless increasing from 11 per 100,000 in the age group 65Ð69 years to140 per 100,000 in the age group 85 years and over in 1997Ð98.
Nervous system disorders Nervous system disorders account for 9% of the total disease burden in Australia,mostly in the form of disability. They are also responsible for significant lostproductivity and healthcare costs. Several of these disorders, such as dementia(including AlzheimerÕs disease) and ParkinsonÕs disease, are highly age-associated andare important causes of death and disability among older persons. Epilepsy andmultiple sclerosis are other important nervous system disorders that contributesignificantly to the burden of disease.
DementiaDementia is the sixth leading cause of disease burden in Australia, accounting for 3.5%of the total burden. The main symptoms are progressive loss of memory and othercognitive functions, with both incidence and prevalence rising sharply after age 50.AlzheimerÕs disease is the principal type of dementia, accounting for approximately50% to 60% of known cases of dementia in persons over 50 years of age.
In Australia, death rates for dementia rose steadily up to 1995 due probably to increasedawareness of the disease (Figure 2.45, page 104). This pattern is largely influenced bytrends in death rates for AlzheimerÕs disease. A large number of deaths due toAlzheimerÕs disease have been coded to pneumonia since 1997, creating a break in thetime series. This largely explains the apparent fall in the death rate for dementia andrelated deaths in recent years (Figure 2.45).
Table 2.16: Selected nervous system disorders: estimated incidence (1996), prevalence (1996), mortality (1996), hospitalisations (1997Ð98) and health system costs (1993Ð94)
Nervous system disorder
Incidence per100,000
Prevalenceper 100,000
Mortality per100,000
Hospital-isations
Total costs($’000)
Dementia(a) 130 680 21 9,281 113,829
Epilepsy 30 340 1 17,255 157,419
Parkinson's disease 40 200 4 3,132 148,715
Multiple sclerosis 2 39 1 2,995 21,589
(a) ICD-9 codes 290, 330–331 used for incidence, prevalence, mortality, and hospitalisations; ICD-9 codes 331.0 and 331.2 used for costs.
Sources: AIHW National Morbidity Database; AIHW: Mathers et al. 1999a:208,214.
01 AH2000 body Page 103 Thursday, June 1, 2000 3:06 PM

104 AustraliaÕs Health 2000
TRIM SIZE 175 mm Wide x 250 mm Deep
Epilepsy
Epilepsy, a condition characterised by recurrent (two or more), unprovoked seizures,affects over 62,000 Australians, with estimated prevalence rates in 1996 of 360 per 100,000males and 320 per 100,000 females. Relatively few deaths (1 per 100,000) are attributableto epilepsy, but there were 17,255 hospitalisations in 1997Ð98 alone (Table 2.16). The healthsystem costs for epilepsy are considerable, over $157 million in 1993Ð94.
Age-specific incidence follows a U-shaped pattern, with higher rates in the youngestand oldest age groups. Several risk factors that lead to the development of epilepsyhave been identified, and these are known to vary with age. In addition to familyhistory, the major risk factors for epilepsy are: anoxia (oxygen starvation); congenitalmalformations and structural brain abnormalities among the newborn; cerebral palsy,mental retardation and central nervous system infections such as bacterial meningitisand viral encephalitis among children; and moderate to severe brain injury amongyoung adults. Cerebrovascular disease (stroke) and AlzheimerÕs disease are the majorrisk factors for epilepsy among the elderly.
Parkinson’s disease
ParkinsonÕs disease is a progressive, incurable neurological disease that affects anestimated 36,000 persons (AIHW: Mathers et al. 1999a). It mainly afflicts people overthe age of 50, with only 10% of the cases occurring at an earlier age.
Source: AIHW National Mortality Database.
Figure 2.45: Death rates for dementia and AlzheimerÕs disease, 1979 to 1998
1979 1981 1983 1985 1987 1989 1991 1993 1995 19970
1
2
3
4
5
6
7Deaths per 100,000 population
Year
Males—dementia
Females—dementia
Males—Alzheimer’s disease
Females—Alzheimer’s disease
01 AH2000 body Page 104 Thursday, June 1, 2000 3:06 PM

2 The health of Australians 105
TRIM SIZE 175 mm Wide x 250 mm Deep
The disease affects the brain (basal ganglia), leading to a progressive loss of motor skillsinvolving sequential movements, and impacts on cognition, behaviour and mood. It ismarked by increasing rigidity of the limbs, trunk and face, and by regular tremors,particularly when the body is at rest. At advanced stages, swallowing and speechbecome affected and the patient eventually is confined to a wheelchair or bed. Withouteffective treatment and support, people with ParkinsonÕs disease become increasinglydependent on institutional care.
Prevalence is higher among females (260 per 100,000 in 1996) than males (130 per100,000), although death rates are higher among males (4 per 100,000 compared with2 per 100,000 females). Health system costs were $149 million in 1993Ð94 (Table 2.16,page 103), predominantly for nursing home care.
Multiple sclerosisMultiple sclerosis (MS) affects mainly adults between the ages of 20 and 50 years, withaverage age of onset in the early 30s. The disease affects the myelin sheaths of thenerves and often involves progressive impairment of vision, speech, musclecoordination and bladder dysfunction.
The estimated prevalence rate for MS in Australia in 1996 was 39 per 100,000, withprevalence among females more than twice that among males (AIHW: Mathers et al.1999a). Recorded death rates in 1998 were 0.6 per 100,000 females and 0.3 per 100,000males, but most persons with MS die from other causes. Hospital separations for MShave recently increased by nearly 50%, from 2,018 in 1993Ð94 to 2,995 in 1997Ð98.Nearly three-quarters of hospital separations for MS are among females. Health systemcosts for MS as a primary cause were about $22 million in 1993Ð94 (Table 2.16).
As in several other countries, in Australia the prevalence of multiple sclerosis ispositively correlated with latitude, with Tasmania having about seven times theprevalence rate of tropical Queensland. Because of this geographical variation, severalstudies have focused on the potential role of infective agents in multiple sclerosis(McLeod et al. 1994).
End-stage renal (kidney) diseaseA variety of diseases and malfunctions affect the kidneys, including primary renaldisease (nephritis and nephrosis) and conditions such as cancer, hypertension, diabetes,congenital malformations, infectious diseases and some injuries. The most seriousconsequence of these diseases is end-stage renal failure, a condition that is fatal withina few weeks if untreated.
The Australian and New Zealand Dialysis and Transplant Registry (ANZDATA)monitors the incidence and prevalence of end-stage renal disease, and outcomes ofdialysis and transplantation, in Australia. According to ANZDATA, incidence of renalfailure in Australia is about 8 per 100,000 persons, with more males (59%) than females(41%) reported to develop renal failure (Disney et al. 1999:1,13).
The most common cause of end-stage renal disease is glomerulonephritis, an illness thatincludes a variety of conditions affecting the glomerular portion of the nephron andinhibiting the ultrafiltration of blood (Table 2.17, page 106). In 1998, glomerulonephritisrepresented 32% of new cases of end-stage renal disease notified to the Registry. Long-
01 AH2000 body Page 105 Thursday, June 1, 2000 3:06 PM

106 AustraliaÕs Health 2000
TRIM SIZE 175 mm Wide x 250 mm Deep
term complications associated with diabetes also cause nephropathy, the second mostcommon cause of end-stage renal disease. Another major cause, analgesic nephropathy,is attributed to the long-term use of various analgesic compounds and related agents,and is potentially preventable and partially reversible. Hypertension is also a majorcause of renal failure.
The proportion of new cases of renal failure resulting from diabetic nephropathyincreased from 16% in 1993 to 22% in 1998 (Table 2.17). Renal failure attributed tohypertension also increased over that period, from 9% to 12% of new cases. On theother hand, analgesic nephropathy dropped to 6% of all cases in 1998, by almost half ofthe proportion in 1993. This decline may be attributed to restrictions placed on the useof certain analgesics (NHMRC 1992:2).
Dialysis and kidney transplantationThere are two major treatment options to sustain life for people with renal failureÑdialysis and transplantation. Dialysis is a method of removing waste products from theblood when the kidneys are unable to function effectively. Transplantation involves thesurgical replacement of a patientÕs kidney with one from a donor. Over the last threedecades, these treatments have been increasingly refined.
The number of people on dialysis and those with functioning transplants is increasing(Figure 2.46), but for very different reasons. The increase in the number of people ondialysis is mainly due to older patients being accepted on the program. In 1998, 38% ofnew patients were aged 65 years and over compared with 7% in 1979 (Disney et al.1999). Stagnancy in the availability of new donor or cadaver kidneys during the 1990shas also contributed to the increase in dialysis patients (Disney et al. 1999).
The increase in the number of people with functional transplants is due mainly to amarked improvement in the survival of kidney transplants. Of people who had acadaveric kidney transplant in 1983, 58% had a functioning transplant 5 years later,increasing to 73% of those who had a transplant in 1993 (Disney et al. 1998b, 1999).Consequently, the rate for functioning kidney transplants has increased, from 9 per
Table 2.17: Causes of renal failure, 1993 and 1998
Cause
1993 1998
Number Per cent Number Per cent
Glomerulonephritis 380 33 507 32
Diabetic nephropathy 181 16 350 22
Analgesic nephropathy 124 11 97 6
Hypertension 105 9 191 12
Other 370 32 444 28
Total 1,160 100 1,589 100
Note: The data reported here have been supplied by the Australia and New Zealand Dialysis and Transplant Registry (ANZDATA). The interpretation and reporting of these data are the responsibility of the authors and in no way should be seen as an official policy or interpretation of the Australia and New Zealand Dialysis and Transplant Registry.
Source: Disney et al. 1998b, 1999.
01 AH2000 body Page 106 Thursday, June 1, 2000 3:06 PM

2 The health of Australians 107
TRIM SIZE 175 mm Wide x 250 mm Deep
100,000 in 1979 to 25 per 100,000 in 1998 (Figure 2.46). There were 517 kidney transplantoperations in 1998, 85% of which were for primary recipients (first kidney transplant),meeting less than one-third of the waiting list (Disney et al. 1999).
Dialysis procedures are the most common reason for admission to public hospitals(378,466 separations in 1997Ð98) and the fifth most common in private hospitals(44,640 separations in 1997Ð98) (AIHW 1999b). People requiring haemodialysis arelikely to use it at least twice a week, with about 100 separations from a hospital in anyone year. However, due to the large number of people receiving dialysis at home or in asatellite centre, hospital separations represent only about 30% of all dialysis proceduresoccurring in Australia (Disney et al. 1998b:84). As at 31 December 1998, there were5,523 Australians dependent on dialysis.
Deaths
In 1998, there were 789 male and 903 female deaths for which nephritis, nephroticsyndrome or nephrosis were recorded as the underlying cause, with age-standardiseddeath rates of 9.3 and 6.5 per 100,000 respectively (ABS 1999d:23). An additional9,370 deaths (5,162 males, 4,208 females) listed nephritis, nephrotic syndrome andnephrosis as a contributing cause of death (ABS 1999d:46). There has been little changein the underlying cause of death rate over the past 20 years. Improvements in treatmenttechnology are likely to have offset any increase in incidence.
Note: Age standardised to the Australian population at 30 June 1991.
Source: Disney et al. 1998b, 1999.
Figure 2.46: Kidney disease: new cases and treatments, 1979 to 1998
1979 1981 1983 1985 1987 1989 1991 1993 1995 19970
5
10
15
20
25
30Rate per 100,000 population
Year
New transplants
Functioning transplants
New patients
On dialysis
01 AH2000 body Page 107 Thursday, June 1, 2000 3:06 PM

108 AustraliaÕs Health 2000
TRIM SIZE 175 mm Wide x 250 mm Deep
Kidney disease among Aboriginal and Torres Strait Islander peoplesIndigenous people constitute an increasing and disproportionately large proportion ofnew patients commencing renal treatment, increasing from 5% in 1990 to 8% in 1998(Disney et al. 1999:13). In contrast, the proportion of persons with functioningtransplants remained the same (Disney et al. 1998b, 1999).
Diabetes is the major cause of kidney disease among Aboriginal and Torres StraitIslander peoples. In 1998, diabetic nephropathy contributed 42% of the Indigenousdialysis group, compared with 22% among the total dialysis group (Disney et al. 1999).
In 1994Ð98, there were 90 Indigenous deaths (42 males and 48 females) attributed torenal failure in Western Australia, South Australia and the Northern Territory alone(identification of Indigenous peoples in death records in other jurisdictions is not ofsufficient quality to allow for reporting). Indigenous deaths from renal failure alsooccur at relatively younger ages than non-Indigenous deaths (ABS 1999e).
Cirrhosis and other chronic liver diseases Cirrhosis results from damage to the liver, where the liver cells are destroyed andreplaced by scarred tissue. As the disease develops, the liver shrinks since there areprogressively fewer healthy cells.
There are four main categories of liver disease, namely alcoholic fatty liver, hepatitis,cirrhosis, and other or unspecified forms of liver disease. Some of these forms arepreventable or reversible. Almost all heavy drinkers have alcoholic fatty liver, but it ispartly reversible with abstinence from alcohol. Generally benign, alcoholic fatty livermay cause death through liver failure or the formation of lung or brain blood clots.Hepatitis is inflammation of the liver, which can cause widespread liver cell loss.Chronic active hepatitis can progress to cirrhosis and liver cancer. Cirrhosis contributessignificantly to the burden of disease in Australia, both in terms of premature mortalityand health system costs.
Determining the incidence and prevalence of cirrhosis and other chronic liver diseasesis difficult because most cases show no signs or symptoms until late. In 1996, it wasestimated that there were more than 1,000 new cases of cirrhosis and chronic liverdisease in Australia. The prevalence was estimated at about 70 per 100,000 males and50 per 100,000 females (AIHW: Mathers et al. 1999a:208). Cases are concentrated amongthose aged 35 years and over.
In 1998, cirrhosis of the liver was the underlying cause of 1,018 deaths (725 males and293 females) and the contributing or associated cause for another 876 deaths. The deathrate among males was higher than among females in all age groups, in particularbetween the ages of 55 and 79 years. The disease was also the major reason for 9,836hospitalisations in 1997Ð98. Again, the age-standardised hospitalisation rate for males(71 per 100,000) was higher than that for females (42 per 100,000). In 1997Ð98, the averagelength of hospital stay for a person with a principal diagnosis of cirrhosis was 9 days.
The death rate for cirrhosis and other chronic diseases of the liver is declining. Afterrising consistently for several decades, the rate peaked in the late 1970s (Figure 2.47).Since then, the age-standardised death rates have declined from 13 per 100,000 malesand 4.5 per 100,000 females in 1979 to 8 and 3 per 100,000, respectively, in 1998.
01 AH2000 body Page 108 Thursday, June 1, 2000 3:06 PM

2 The health of Australians 109
TRIM SIZE 175 mm Wide x 250 mm Deep
2.5 Communicable diseasesCommunicable or infectious diseases are illnesses due to specific infectious agents ortheir toxic products. Bacteria cause diseases such as pertussis (whooping cough) andtuberculosis; viruses cause diseases such as measles, influenza and Ross River virusinfection; fungi are responsible for conditions such as tinea; protozoan parasites causediseases including malaria; and bacterial toxins are responsible for conditions such assome forms of food poisoning. Infestations of larger parasites such as head lice are alsoregarded as communicable diseases.
This section provides an overview of communicable diseases in Australia, includingnotifications and deaths, and discusses the associated burden of disease, hospitalisationand health system costs. Information on communicable diseases in general, includingpneumonia, influenza and meningitis, is presented first, followed by notifiable diseasessuch as blood-borne diseases, gastrointestinal diseases, sexually transmitted diseases,vector-borne diseases, tuberculosis and vaccine-preventable diseases.
Information on the occurrence of communicable diseases in this section is derivedmainly from disease notifications, hospital separations and deaths data. Self-reportsfrom the National Health Surveys, data on visits to general practitioners, data from theAustralian Paediatric Surveillance Unit, laboratory investigations and special surveysare other sources of information useful for the surveillance of communicable diseases inAustralia.
Source: AIHW National Mortality Database.
Figure 2.47: Death rates for cirrhosis of the liver, 1970 to 1998
1970 1972 1974 1976 1978 1980 1982 1984 1986 1988 1990 1992 1994 1996 19980
2
4
6
8
10
12
14Deaths per 100,000 population
Year
Males
Females
01 AH2000 body Page 109 Thursday, June 1, 2000 3:06 PM

110 AustraliaÕs Health 2000
TRIM SIZE 175 mm Wide x 250 mm Deep
Communicable diseases were responsible for considerable morbidity and mortality inAustralia in the early part of the twentieth century. However, the incidence and deathrates for communicable diseases have been much reduced, with improvements inhygiene (building on advances begun in the nineteenth century), the introduction ofantibiotics and mass immunisations making major contributions (see chapter 8 for anoverview of changing patterns of disease in Australia over the twentieth century).
In 1998, there were 85,096 notifications of communicable diseases to the NationalNotifiable Diseases Surveillance System, representing a slight decrease from the 89,576notifications in 1997 (Thomson et al. 1999). The most commonly notified diseases wereblood-borne diseases, followed by gastrointestinal and sexually transmitted diseases. Fora brief description of communicable disease notifications in Australia, see Box 2.13.
In 1997Ð98, there were 79,156 hospital separations with a principal diagnosis ofinfectious and parasitic diseases. In addition, there were 67,683 hospital separations forpneumonia and influenza, and 924 hospital separations for meningitis (AIHW 1999b).
There is much variation in the epidemiology, distribution and mortality associated withvarious communicable diseases. Management of these diseases and the approachesavailable to control them also vary considerably. The following provides briefoverviews of the epidemiology of some of the high profile communicable diseases interms of notifications, hospital separations and deaths.
Acute respiratory infections Acute respiratory infections (ARI) are usually divided into upper respiratory tractinfections (URTI) and lower respiratory tract infections (LRTI). These infections areresponsible for much morbidity and mortality. It is estimated that in 1996 there were43 million new cases of URTI, and 7 million cases of LRTI.
Box 2.13: Disease notification A disease may be made notifiable to State and Territory health authorities if there is poten-tial for its control. Information on more than forty notifiable communicable diseases isavailable from the National Notifiable Diseases Surveillance System.
Surveillance of communicable diseases varies between jurisdictions, as each State/Territoryhas specific requirements under their public health legislation for notification by medicalpractitioners, laboratories and hospitals. The notifiable diseases and the case definitionsmay also vary between jurisdictions. However, Australia is working towards a modelpublic health legislation that will standardise the approach to communicable disease sur-veillance.
Newly diagnosed HIV infection and AIDS are notifiable conditions in every State and Terri-tory. The National Centre in HIV Epidemiology and Clinical Research compiles HIV/AIDSnotifications.
01 AH2000 body Page 110 Thursday, June 1, 2000 3:06 PM

2 The health of Australians 111
TRIM SIZE 175 mm Wide x 250 mm Deep
Mortality. ARIs contribute significantly to mortality. Pneumonia alone was responsiblefor 4,459 deaths (2,000 males and 2,459 females) in 1998, the third largest cause of deathamong females and the eighth largest cause of death among males. Deaths areconcentrated among males and females aged 70 years and over.
Both male and female death rates for ARI decreased over the period 1979 to 1996.However, the male death rate was consistently higher than the female rate. The maledeath rate fell from 25 per 100,000 in 1979 to 10 per 100,000 in 1996. For females, thedeath rate decreased from 15 per 100,000 in 1979 to 8 per 100,000 in 1996 (Figure 2.48).
Hospitalisations. In 1997Ð98, there were 155,960 hospital separations with the principaldiagnosis of ARI. Of the three groups of respiratory conditions considered in this report(asthma, COPD and ARI), ARI had the highest rate of hospitalisation but the shortestaverage length of stay (1.4 days).
Hospitalisations are concentrated among the elderly and the young. Again, rates arehigher for males than females. In the age group 0Ð4 years, hospital separation rates in1997Ð98 were 5,700 per 100,000 for males and 3,900 per 100,000 for females. From agegroup 50Ð54 years onwards the rates rose sharply from around 400 per 100,000 to peakin the age group 85 years and over with rates of 8,100 per 100,000 males and 4,400 per100,000 females (Figure 2.49).
Note: Data for 1997 and 1998 are not included as they are not comparable with previous years following the introduction of automatic coding of deaths data in 1997.
Source: AIHW National Mortality Database.
Figure 2.48: Trends in death rates for acute respiratory infections, 1979 to 1996
1979 1981 1983 1985 1987 1989 1991 1993 19950
5
10
15
20
25
30
Deaths per 100,000 population
Year
Males
Females
01 AH2000 body Page 111 Thursday, June 1, 2000 3:06 PM

112 AustraliaÕs Health 2000
TRIM SIZE 175 mm Wide x 250 mm Deep
Burden of disease. The burden from ARI is almost equally divided between prematuremortality (YLL) and years of equivalent ÔhealthyÕ life lost due to disability (YLD). Aswith the other major respiratory categories, the burden is similar for both the sexes butis higher among the young and the elderly.
Blood-borne diseasesBlood-borne diseases are diseases spread via blood, blood products and body fluids,although there are other modes of transmission, including sexual contact. They includeHIV infection, hepatitis B, hepatitis C and hepatitis D. Initial HIV infection may cause atransitory illness similar to glandular fever. The infection goes on to damage the immunesystem with AIDS developing as the patientÕs susceptibility to infections and cancersincreases. Hepatitis B, hepatitis C and hepatitis D are viral infections characterised byinflammation of the liver, jaundice, anorexia, vague abdominal discomfort, nausea andvomiting and/or fever. Severity can range from unapparent cases, detectable onlythrough laboratory tests, to fatal cases. Some people may become persistently infectedand develop chronic hepatitis, and/or cirrhosis and/or liver cancer.
HIV/AIDS. At the end of 1998, there were around 11,800 people living with HIV. By then,the cumulative number of HIV infections in Australia was estimated to be about 17,600.Most cases of HIV infection (85%) were transmitted by sexual contact between males,with relatively little transmission through other sources of exposure (NCHECR 1999).
Source: AIHW National Hospital Morbidity Database.
Figure 2.49: Age-specific hospital separations with a principal diagnosis of acute respiratory infection, 1997Ð98
0–4 10–14 20–24 30–34 40–44 50–54 60–64 70–74 80–840
1,000
2,000
3,000
4,000
5,000
6,000
7,000
8,000
9,000Separations per 100,000 population
Age group
Males
Females
85+
01 AH2000 body Page 112 Thursday, June 1, 2000 3:06 PM

2 The health of Australians 113
TRIM SIZE 175 mm Wide x 250 mm Deep
The number of HIV diagnoses in Australia has declined, from a peak of over 2,500 in1985 to just over 660 in 1998 (Figure 2.50). These include both newly acquired (anddiagnosed) infections and new diagnoses of infections acquired some time in the past(Box 2.14, page 114). Around 20Ð25% of the total HIV diagnoses recorded each yearsince 1993 have been in persons who are considered to have newly acquired the disease.
New diagnoses of AIDS in Australia, after adjustment for reporting delay, peaked in1994 with an estimated 950 diagnoses. The number is estimated to have declined to 348new diagnoses in 1998 (Figure 2.50). This decrease in the number of AIDS diagnoses, inaddition to reductions in new infections, is due to the use of effective drug therapies forthe treatment of HIV infection. It is estimated that there were 1,090 fewer AIDSdiagnoses between 1995 and 1998 than would have been expected if the use of thesetherapies had not delayed the progression from HIV to AIDS. A total of 2,430 personswere estimated to be living with AIDS in 1998 (NCHECR 1999).
Comparison of HIV/AIDS hospital separations over time is made difficult by thechange in coding practice for HIV/AIDS from ICD-9-CM (US version) to ICD-9-CM(Australian version) in July 1995. Therefore, only data since 1995Ð96 are reported here.Over the period 1995Ð96 to 1997Ð98, there were 904 hospital separations with the
Note: Age standardised to the Australian population at 30 June 1991.
Source: AIHW National Mortality Database.
Figure 2.50: Diagnoses of HIV infection and AIDS, 1980 to 1998
0
500
1,000
1,500
2,000
2,500
3,000
1980 1982 1984 1986 1988 1990 1992 1994 1996 1998
Number of cases
Year
Newly acquired HIV
Total HIV diagnoses
AIDS diagnoses
01 AH2000 body Page 113 Thursday, June 1, 2000 3:06 PM

114 AustraliaÕs Health 2000
TRIM SIZE 175 mm Wide x 250 mm Deep
principal diagnosis of HIV/AIDS and 36,116 separations with HIV/AIDS as anadditional diagnosis. Most of the separations were of males (95%), and the majority(63%) were of persons in the age group 30Ð44 years.
There has also been a considerable reduction in the number of AIDS-related deaths inrecent years. There were 170 AIDS-related deaths in 1998, almost one-fifth of the 735deaths recorded in 1994 (NCHECR 1999).
Hepatitis B. The number of notifications of incident (new) cases of hepatitis B hasremained fairly consistent since 1994. The National Notifiable Diseases SurveillanceSystem received notification of 247 cases in 1997 (1.3 per 100,000) and 261 in 1998 (1.4per 100,000).
Over the period 1993Ð94 to 1997Ð98, there were 2,247 hospital separations with theprincipal diagnosis of acute or chronic hepatitis B and 16,314 separations with hepatitis Bas an additional diagnosis. Hospital separations for hepatitis B were more commonamong males (64%) than females (36%), and the majority (62%) were of persons in theage group 25Ð49 years.
Over the past two decades, the number of deaths from hepatitis B has been rising.Between 1979 and 1998, there were 653 deaths with an underlying cause of hepatitis B,rising from 11 deaths in 1979 to 55 deaths in 1998 (Figure 2.51).
Hepatitis C. The numbers of hepatitis C cases notified (incident and unspecified) in 1997and in 1998 were similar, 19,770 and 19,604 respectively. However, notifications ofincident cases of hepatitis C increased from 81 in 1997 (0.5 per 100,000) to 343 in 1998(2.0 per 100,000). This change may be due mainly to surveillance efforts to distinguishbetween new and old infections.
Box 2.14: HIV and AIDS diagnosisNewly diagnosed HIV: Total number of cases of HIV infection newly diagnosed in a par-ticular year. Includes both newly acquired HIV and older cases of HIV that have only justbeen diagnosed.
Newly acquired HIV: Newly diagnosed HIV infection with a negative or indeterminateHIV antibody test result, or a diagnosis of HIV seroconversion illness, within 1 year ofHIV diagnosis.
Seroconversion illness: Characteristic clinical findings that reflect the first interaction ofHIV with the host immune system (i.e. primary HIV infection).
HIV antibody test: The test detects the presence of HIV antibodies that are produced bythe immune system in response to infection by the virus. Antibodies to HIV are usuallydetected within the first 2 to 6 weeks of illness.
AIDS: AIDS diagnosis is based on a positive HIV antibody test along with the presence ofany one of the conditions associated with severe immune deficiency.
01 AH2000 body Page 114 Thursday, June 1, 2000 3:06 PM

2 The health of Australians 115
TRIM SIZE 175 mm Wide x 250 mm Deep
Over the period 1993Ð94 to 1997Ð98, there were 8,485 hospital separations with theprincipal diagnosis of acute or chronic hepatitis C and 45,367 separations with hepatitis Cas an additional diagnosis. Hospital separations for hepatitis C were more commonamong males (61%) than females (39%), and the majority (65%) were of persons in the agegroup 25Ð44 years.
Hepatitis D. There were 13 notifications of hepatitis D in 1997 and 14 in 1998.
Gastrointestinal infectionsThe diseases currently classified as gastrointestinal for the National Notifiable DiseaseSurveillance System include hepatitis A, salmonellosis, campylobacteriosis, yersiniosis,listeriosis, shigellosis, botulism, typhoid and paratyphoid (Table S20, page 384).Haemolytic uraemic syndrome (HUS) became nationally notifiable in late 1998.
Campylobacteriosis. Campylobacteriosis accounts for more than 50% of allgastrointestinal notifications in Australia. The infection is transmitted mainly by food orby drinking untreated or poorly treated water. It usually causes diarrhoea for a fewdays, including abdominal pain, malaise, fever, nausea and vomiting. There were 11,848notifications of campylobacteriosis in 1997 (96.7 per 100,000) and 13,439 in 1998(108.3 per 100,000). Since 1991, campylobacteriosis notifications have trended upwards(Figure 2.52, page 116). The disease shows a seasonal pattern, with peak notifications inthe spring and summer months.
Source: AIHW National Mortality Database.
Figure 2.51: Hepatitis B deaths, 1979 to 1998
0
10
20
30
40
50
60
70
1979 1981 1983 1985 1987 1989 1991 1993 1995 1997
Number of deaths
Year
01 AH2000 body Page 115 Thursday, June 1, 2000 3:06 PM

116 AustraliaÕs Health 2000
TRIM SIZE 175 mm Wide x 250 mm Deep
Haemolytic uraemic syndrome. HUS is a potential complication of gastrointestinalinfection with shiga-toxin-producing Escherichia coli. Acute renal failure and death arepotential consequences of infection. The Australian Paediatric Surveillance Unit hasreported 108 confirmed cases of HUS for the period July 1994 to December 1998,including 20 from the outbreak in South Australia in 1995 that was attributed to a typeof smallgood (APSU 1999).
Over the period 1994Ð95 to 1997Ð98, there were 332 hospital separations with theprincipal diagnosis of HUS, an annual average of 83 hospital separations. The numberincreased from 84 in 1994Ð95 to 122 in 1997Ð98. The majority of hospital separations(60%) were of children aged 0Ð4 years.
Sexually transmitted diseasesChancroid, chlamydial infection (not elsewhere classified), donovanosis, gonococcalinfection, lymphogranuloma venereum and syphilis are the sexually transmitteddiseases (STDs) monitored by the National Notifiable Diseases Surveillance System.There were 15,165 STD notifications in 1997 and 18,554 STD notifications in 1998.
Chlamydial infection. Chlamydial notifications have increased in the 1990s. There were9,126 notifications of chlamydial infection in 1997 (74.5 per 100,000) and 11,405notifications in 1998 (87.7 per 100,000).
Source: National Notifiable Diseases Surveillance System.
Figure 2.52: Notifications of campylobacteriosis, by month of onset, 1991 to 1998
Jan1991
Jan1992
Jan1993
Jan1994
Jan1995
Jan1996
Jan1997
Jan1998
0
200
400
600
800
1,000
1,200
1,400
1,600
1,800Number of notifications
Year
01 AH2000 body Page 116 Thursday, June 1, 2000 3:06 PM

2 The health of Australians 117
TRIM SIZE 175 mm Wide x 250 mm Deep
Gonococcal infection. NNDSS received 4,689 notifications of gonococcal infection in 1997(25.3 per 100,000) and 5,428 notifications in 1998 (29.0 per 100,000). Notifications forgonococcal infection increased by more than 98% between 1991 and 1998. However, thisincrease may reflect improved diagnosis rather than any real increase in incidence.
Notifications of chancroid, lymphogranuloma venereum and syphilis have remainedsteady in recent years, whereas notifications of donovanosis have decreased.
Vector-borne diseasesThe nationally notifiable vector-borne diseases include several mosquito-borne viraldiseases and malaria. The viral diseases include infections caused by Barmah Forestvirus and Ross River virus, which cause epidemic polyarthritis. Also included areAustralian encephalitis (caused by Murray Valley encephalitis and Kunjin viruses),Japanese encephalitis and dengue fever.
Ross River virus. The Ross River virus infection was the most commonly notified vector-borne disease in Australia in 1998, with 3,094 cases (16.5 per 100,000). The infectionshows a seasonal pattern, with peak notifications in the wet season or summer months(Figure 2.53).
Source: National Notifiable Diseases Surveillance System.
Figure 2.53: Notifications of Ross River virus infection, by month of onset, 1992 to 1998
Jan1992
Jan1993
Jan1994
Jan1995
Jan1996
Jan1997
Jan1998
0
500
1,000
1,500
2,000
2,500
3,000
Number of notifications
Year
01 AH2000 body Page 117 Thursday, June 1, 2000 3:06 PM

118 AustraliaÕs Health 2000
TRIM SIZE 175 mm Wide x 250 mm Deep
Barmah Forest virus. Notifications of Barmah Forest virus infection have decreased inrecent years. There were 558 notifications in 1998 (3.0 per 100,000), down from the 704notifications in 1997 (3.8 per 100,000).
Dengue fever. Only a small number of cases of dengue fever were notified between 1993and 1996. However, outbreaks of locally acquired disease in far north Queenslandresulted in a large number of cases in 1997 and 1998. In 1997, 210 cases were notified(1.1 per 100,000), but 557 cases were notified in 1998 (3.0 per 100,000). Over 80% of thesenotifications were from Queensland.
Over the period 1993Ð94 to 1997Ð98, there were 205 hospital separations with theprincipal diagnosis of dengue fever. The numbers have increased consistently from 24in 1993Ð94 to 68 separations in 1997Ð98. The majority of hospital separations (58%) wereof persons between the ages of 15 and 34 years, and there was a greater proportion ofmales (62%) than females (38%). Almost 40% of the hospital separations were inQueensland. No deaths have been attributed to dengue fever as the underlying cause ofdeath since 1967.
Japanese encephalitis. Following outbreaks in the Torres Strait in 1995, the first case ofJapanese encephalitis acquired on the Australian mainland was reported in Queenslandin March 1998. Around the same time, a further case of Japanese encephalitis wasconfirmed in the Torres Strait.
Malaria. Australia has been certified malaria-free since 1981. Recent cases are allimportsÑtravellers returning from endemic areas. Malaria notifications remainedstable in the period 1994 to 1998.
Over the period 1993Ð94 to 1997Ð98, there were 2,515 hospital separations with theprincipal diagnosis of malaria, 37% of which occurred in Queensland. This correspondsto an average of 503 hospitalisations per year. The majority of hospital separations(52%) were of persons between the ages of 15 and 34 years, and 71% were males.
During the period 1979 to 1998, there were 22 deaths from malaria, on average aboutone death every year. The number of malaria deaths has shown little change over thepast 20 years. There were no malaria deaths reported in 1998.
Tuberculosis Australia has one of the lowest rates for tuberculosis notification internationally, withlittle change in the number of notifications over the last 10 years. From 1986 to 1997,between 863 and 996 new tuberculosis cases (5.2 to 5.7 per 100,000) have been notifiedannually.
In 1997, a total of 954 new cases (5.2 per 100,000) were notified. Most of the cases werein the older age groups, and were slightly more common among males (5.5 per 100,000)than females (4.8 per 100,000). The majority of notified new cases (71%) were of thoseborn overseas (Gilroy et al. 1999).
Over the period 1993Ð94 to 1997Ð98, there were 4,689 hospital separations with theprincipal diagnosis of tuberculosis, an annual average of 938 hospital separations. Therewere more hospital separations for males (54%) than females (46%).
01 AH2000 body Page 118 Thursday, June 1, 2000 3:06 PM

2 The health of Australians 119
TRIM SIZE 175 mm Wide x 250 mm Deep
A total of 1,807 tuberculosis deaths were recorded between 1979 and 1998. The numberdecreased from 95 in 1979 to 62 in 1998, with a high of 118 in 1981. Tuberculosis deathsoccurred more frequently in the older ages, with 1,547 deaths (86%) of persons aged55 years or more.
Vaccine-preventable diseases Vaccine-preventable diseases are the communicable diseases for which the NationalHealth and Medical Research Council schedule recommends routine vaccination/immunisation for children in Australia. These are pertussis (whooping cough), tetanus,diphtheria, poliomyelitis, invasive Haemophilus influenzae type b (Hib) disease, measles,mumps and rubella. There have been a number of important changes to thevaccination/immunisation schedule in the last few years, which are outlined inBox 2.15.
Despite a reduction in their incidence, vaccine-preventable diseases remain a problemin Australia. Table 2.18 (page 122) shows recent notifications, hospital separations anddeaths for these diseases.
Pertussis. Pertussis remains the most frequently reported vaccine-preventable disease,and cyclic epidemics of pertussis continue to occur. The most recent peak occurred in1997 with 10,668 notifications (57.6 per 100,000). In 1998, there were a total of 6,432notifications (34.3 per 100,000), with the highest number of cases in children under 1 yearof age. A large number of cases also occurred in children aged 5Ð9 years and 10Ð14 years.
Over the period 1993Ð94 to 1997Ð98, there were 4,031 hospital separations with theprincipal diagnosis of pertussis, an average of 806 hospital separations per year. Themajority of hospital separations (60%) were of children aged less than 1 year of age.
Box 2.15: Recent changes to the vaccination/immunisation scheduleRecent changes to the vaccination schedule are:
¥ a fifth dose of diphtheria, tetanus, pertussis (DTP) vaccine for children aged 4Ð5 yearsin 1994;
¥ the introduction in 1994Ð95 of the second dose of measles, mumps, rubella (MMR) vac-cine for both sexes at age 10Ð16 years, and subsequent change in 1998 for this dose to begiven between age 4 and 5 years;
¥ from 1 May 2000, the second dose of MMR and fifth dose of DTP was scheduled for4 years;
¥ the introduction of Haemophilus influenzae type b vaccination in 1993; and
¥ the introduction of acellular pertussis vaccine, replacing whole-cell pertussis vaccine, asboosters in 1997 and for the primary schedule in 1999.
The full immunisation schedule is contained in the NHMRC Australian ImmunisationHandbook (NHMRC 1997b).
01 AH2000 body Page 119 Thursday, June 1, 2000 3:06 PM

120 AustraliaÕs Health 2000
TRIM SIZE 175 mm Wide x 250 mm Deep
During the period from 1979 to 1998, there were 26 deaths with pertussis as theunderlying cause of death. In 1997, there were 6 pertussis deaths, reflecting the 1997outbreak, but there were no deaths from pertussis recorded in 1998.
Tetanus. Tetanus cases remain rare in Australia. Only 7 notifications of tetanus werereceived in 1998.
Over the period 1993Ð94 to 1997Ð98, there were 101 hospital separations with theprincipal diagnosis of tetanus, an annual average of 20 separations. The majority ofhospital separations (56%) were of persons aged 60 and older, and there was a greaterproportion of females (59%) than males (41%). There were an additional 3 hospitalseparations for cases of tetanus among newborns over this period.
Although uncommon, tetanus deaths continue to occur. During the period from 1979 to1998, there were 42 deaths with an underlying cause of tetanus, an average of about2 deaths every year. There has been little change in the numbers of tetanus deaths overthe past 20 years.
Diphtheria. No cases of diphtheria have been notified since 1993. Over the period 1979 to1998, there were only 3 deaths with an underlying cause of diphtheria.
Polio. There have been no notifications of community-acquired (wild-type) polio since1978 but a few possible cases of vaccine-related polio have been reported, the last one in1995 (Burgess & McIntyre 1999). As a necessary part of the process for Australia to bedeclared polio-free, an enhanced polio surveillance has been undertaken over the pastfew years to supplement the notification system for this disease. No cases have beendetected through these surveillance activities, which have included the activesurveillance program for acute flaccid paralysis by the Australian PaediatricSurveillance Unit (APSU 1999).
Haemophilus influenzae type b (Hib). The number of reported cases of invasive infectionslikely to be due to Hib has declined following the introduction in April 1993 of a freeHib vaccine for children under 5 years of age. There were 35 cases (0.2 per 100,000)reported in 1998, the lowest annual number of notifications since national surveillancebegan in 1991. Most cases were of children under 5 years of age, in particular childrenunder 2 years of age.
Hib is the agent most likely to cause Haemophilus influenzae meningitis and acuteepiglottitis. Virtually all cases of epiglottitis in young children are caused byHaemophilus influenzae type b. From 1993Ð94 to 1997Ð98, there were 1,309 hospitalseparations with the principal diagnosis of acute epiglottitis or Haemophilus influenzaemeningitis, an average of 262 hospital separations every year. The number decreasedconsistently over the period, from 436 in 1993Ð94 to 201 in 1997Ð98. There was a greaterproportion of hospital separations for males (58%), and 54% of these separations wereof children under the age of 10. Acute epiglottitis accounted for 72% of separations andHaemophilus influenzae meningitis for 28%.
Deaths from acute epiglottitis and Haemophilus influenzae meningitis have also beenfalling. During the period from 1979 to 1998, there were 251 deaths with theseunderlying causes, decreasing from 14 in 1979 to 3 in 1998. There was a high of 21deaths in 1987.
01 AH2000 body Page 120 Thursday, June 1, 2000 3:06 PM

2 The health of Australians 121
TRIM SIZE 175 mm Wide x 250 mm Deep
Measles. There were 306 measles notifications in 1998, at a rate of 1.6 per 100,000population. This was the lowest annual rate since national surveillance began in 1991.The highest notification rate in 1998 was in the age group 0Ð4 years (15.6 per 100,000),and there were slightly more notifications for males than females.
Over the period 1993Ð94 to 1997Ð98, there were 1,863 hospital separations with theprincipal diagnosis of measles, an annual average of 373 hospital separations. Therewas an 85% decrease in the number of measles hospital separations over this period,from 917 in 1993Ð94 to 133 in 1997Ð98. More than half of the hospital separations werein Queensland. Over half of the hospital separations were of children under the age of10 years (55%), and a further 16% of children aged 10Ð14 years.
During the period from 1979 to 1998, there were 74 deaths attributed to measles. Thetrend shows a decrease from 11 in 1979 to none in 1995 through to 1998. Measles,including the impact of the Measles Control Campaign, is discussed further in thesection on vaccination status (chapter 3, page 157).
Subacute sclerosing panencephalitis. Subacute sclerosing panencephalitis (SSPE) is a latecomplication of measles causing progressive brain damage and finally death, usually 10to 15 years after the initial measles episode (NHMRC 1997b). In the period from 1995 to1998, there were six cases of SSPE, with an incidence rate of 0.02 per 100,000 (APSU1999).
Over the period 1993Ð94 to 1997Ð98, there were 55 hospital separations with theprincipal diagnosis of SSPE. The number of SSPE hospital separations declinedconsistently over this period from 19 in 1993Ð94 to 3 in 1997Ð98. Males (83%) were morelikely to be hospitalised than females (17%), and the majority of hospital separations(74%) were of those in the age group 10Ð19 years.
During the period from 1979 to 1998, there were 79 deaths with an underlying cause ofSSPE, an average of about 4 per year. There has been a general decrease in mortalitydue to SSPE over the period, from 3 in 1979 to none in 1998. There was a high of9 deaths in 1981, with the last two deaths occurring in 1996.
Mumps. Annual notifications of mumps have remained stable since it became notifiablein all States and Territories in July 1996. In 1998, a total of 183 cases (1.0 per 100,000)were reported, with the highest notification rates in the age groups 5Ð9 years (3.1 per100,000) and 0Ð4 years (2.6 per 100,000).
Over the period 1993Ð94 to 1997Ð98, there were 190 hospital separations with theprincipal diagnosis of mumps, an annual average of 38 hospital separations. A largeproportion of the hospital separations (42%) were of children under the age of 14 years.
During the period from 1979 to 1998, there were 10 deaths from mumps, with anaverage of less than 1 per year. No mumps deaths have been reported since 1995.
Rubella. Notification rates for rubella have fallen from 4,380 notifications in 1995(24.2 per 100,000) to a low of 772 cases (4.1 per 100,000) in 1998. Males aged 15Ð19 yearscontinue to have the highest notification rate (15.8 per 100,000 in 1998), although thisrate has declined since 1994Ð95 when the second dose of the measles, mumps andrubella vaccine was introduced for both sexes at age 10Ð16 years.
01 AH2000 body Page 121 Thursday, June 1, 2000 3:06 PM

122 AustraliaÕs Health 2000
TRIM SIZE 175 mm Wide x 250 mm Deep
Over the period 1993Ð94 to 1997Ð98, there were 305 hospital separations with theprincipal diagnosis of rubella, decreasing from 73 in 1993Ð94 to 29 in 1997Ð98. Therewere more hospital separations of males (63%) than females (37%), and 50% were ofchildren under the age of 5 years. The last recorded rubella death was in 1988, the onlydeath from rubella during the 20-year period from 1979 to 1998.
The major burden of rubella on the community is children born with congenitalabnormalities due to maternal rubella during pregnancy. In the period between May1993 and December 1997, 26 children were born with congenital rubella infection(APSU 1999). Anomalies were identified in 21 children, with 17 having multiple defects.No cases were identified among children born in 1998.
Burden of communicable diseases Despite major reductions in mortality, and the overall success of vaccination,communicable diseases are responsible for considerable burden of disease and healthsystem costs. In 1996, infectious and parasitic diseases, along with acute respiratoryinfections including pneumonia and influenza, represented 3% of the total diseaseburden in Australia. HIV/AIDS represented about one-fifth of the total burden ofcommunicable diseases in 1996 (AIHW: Mathers et al. 1999a). The burden ofcommunicable diseases was 30% higher among males than females. This difference waslargely due to the greater burden of HIV/AIDS among males and its consequentpremature mortality.
Infectious and parasitic diseases accounted for 2.7% ($849 million) of the total healthsystem costs in 1993Ð94 (AIHW: Mathers et al. 1998a).
Issues and problemsOver the last few years, there has been a re-emergence of some of the infectious diseasespreviously thought to have been conquered, and the emergence of ÔnewÕ diseases.These have been associated with the increase in international travel, the development ofresistance to antimicrobials and changes in the environment, and the way in which the
Table 2.18: Notifications, hospital separations and deaths for the main vaccine-preventable diseases
DiseaseICD-9/ICD-9-CM codes
Notifications(1998)
Hospitalseparations
(1997–98)Deaths(1998)
Pertussis 033 6,432 989 0
Tetanus 037, 771.3 7 20 2
Haemophilus influenzae type b(a) 320.0, 464.3 35 201 3
Measles 055 306 133 0
Mumps 072 183 36 0
Rubella 056, 771.0 772 29 0
(a) Haemophilus influenzae cases were classified using the codes 320.0 (Haemophilus influenzae meningitis) and 464.3 (acute epiglottitis) as Haemophilus influenzae by type is not specified in the ICD-9 coding system.
Sources: National Notifiable Diseases Surveillance System; AIHW National Hospital Morbidity Database; AIHW National Mortality Database.
01 AH2000 body Page 122 Thursday, June 1, 2000 3:06 PM

2 The health of Australians 123
TRIM SIZE 175 mm Wide x 250 mm Deep
population interacts with new infections. In addition, better understanding of diseaseepidemiology and new diagnostic methods have led to the recognition of ÔnewÕcommunicable diseases.
Recently recognised emerging diseases include bat paramyxovirus, which causesrespiratory disease in humans and horses, in Queensland (Selvey & Sheridan 1994), anda lyssavirus that causes neurological symptoms in humans (Allworth et al. 1996).Factors that may contribute to the emergence of new agents of disease are medical andanimal husbandry practices and population movements. In addition, existing diseasessuch as dengue fever and Japanese encephalitis have spread more widely, as well asincreased in incidence in the northern regions of Australia. These problems emphasisethe need for continued control and active surveillance of these diseases.
The emergence of antibiotic-resistant bacteria has been recognised as an importantindicator of inappropriate use of antibiotics in human medicine and in food-producinganimals. Infections with multiresistant Staphylococcus aureus and more recentlyvancomycin-resistant enterococci pose an increasing threat to health, particularly in thehospital setting. Strategies to encourage prudent use of antimicrobials and betterinfection control are important in reducing the incidence of resistance (Turnidge et al.1996; McAlister et al. 1999).
ReferencesAbramson M J & Walters EH 2000. The epidemic of asthma: too much allergen or not
enough infection? Medical Journal of Australia 172:119Ð21.
ABS 1993a. Disability, ageing and carers: summary of findings, Australia 1993. ABS Cat.No. 4430.0. Canberra: ABS.
ABS 1993b. Estimated resident population by sex and age, States and Territories ofAustralia, June 1987 to June 1992. ABS Cat. No. 3201.0. Canberra: ABS.
ABS 1996a. ChildrenÕs immunisation, Australia, 1995. ABS Cat. No. 4352.0. Canberra:ABS.
ABS 1996b. Disability, ageing and carers: disability and disabling conditions, Australia1993. ABS Cat. No. 4433.0. Canberra: ABS.
ABS 1997a. Deaths Australia, 1995. ABS Cat. No. 3302.0. Canberra: ABS.
ABS 1997b. 1995 National Health Survey: summary of results, Australia. ABS Cat.No. 4364.0 Canberra: ABS.
ABS 1997c. 1995 National Health Survey: asthma and other respiratory conditions. ABSCat. No. 4373.0. Canberra: ABS.
ABS 1997d. National Health Survey: diabetes. ABS Cat. No. 4371.0. Canberra: ABS.
ABS 1998a. Estimated resident population by sex and age, States and Territories ofAustralia, June 1986 to June 1997. ABS Cat. No. 3201.0. Canberra: ABS.
ABS 1998b. 1997 National Survey of Mental Health and Wellbeing: adult component,Australia. ABS Cat. No. 4326.0 Canberra: ABS.
01 AH2000 body Page 123 Thursday, June 1, 2000 3:06 PM

124 AustraliaÕs Health 2000
TRIM SIZE 175 mm Wide x 250 mm Deep
ABS 1998c. Births, Australia, 1997. ABS Cat. No. 3301.0. Canberra: ABS.
ABS 1998d. Australian social trends. ABS Cat. No. 4102.0. Canberra: ABS.
ABS 1999a. Deaths Australia, 1998. ABS Cat. No. 3302.0. Canberra: ABS.
ABS 1999b. Disability, ageing and carers: summary of findings, Australia 1998. ABS Cat.No. 4430.0. Canberra: ABS.
ABS 1999c. Births, Australia, 1998. ABS Cat. No. 3301.0. Canberra: ABS.
ABS 1999d. Causes of death, Australia, 1998. ABS Cat. No. 3303.0. Canberra: ABS.
ABS 1999e. The health and welfare of AustraliaÕs Aboriginal and Torres Strait Islanderpeoples. ABS Cat. No. 4704.0. Canberra: ABS.
ABS 1999f. Participation in sport and physical activities. ABS Cat. No. 4177.0. Canberra:ABS.
ABS & AIHW 1999. The health and welfare of AustraliaÕs Aboriginal and Torres StraitIslander peoples, 1999. ABS Cat. No. 4704.0. AIHW Cat. No. IHW 3. Canberra: AGPS.
Ad Hoc Committee on Health Research Relating to Future Intervention Options 1996.Investing in health research and development. Geneva: World Health Organization.
AIHW 1997. AustraliaÕs welfare 1997: services and assistance. Canberra: AIHW.
AIHW 1998a. AustraliaÕs health 1998: the sixth biennial health report of the AustralianInstitute of Health and Welfare. AIHW Cat. No. AUS 10. Canberra: AIHW.
AIHW 1998b. Health in rural and remote Australia. AIHW Cat. No. PHE 6. Canberra:AIHW.
AIHW 1999a. AustraliaÕs welfare 1999: services and assistance. AIHW Cat. No. AUS 16.Canberra: AIHW.
AIHW 1999b. Australian hospital statistics 1997Ð98. AIHW Cat. No. HSE 6. Canberra:AIHW.
AIHW 1999c. Heart, stroke and vascular diseases, Australian facts. CardiovascularDisease Series No. 10. AIHW Cat. No. CVD 7. Canberra: AIHW and the HeartFoundation of Australia.
AIHW 1999d. 1998 National Drug Strategy Household Survey: first results. AIHW Cat.No. PHE 15. Canberra: AIHW.
AIHW & AACR 1999. Cancer in Australia 1996: incidence and mortality data for 1996and selected data for 1997 and 1998. AIHW Cat. No. CAN 7. Canberra: AIHW.
AIHW, AACR & NHMRC National Breast Cancer Centre 1998. Breast cancer survival inAustralian women 1982Ð1994. AIHW Cat. No. CAN 4. Canberra: AIHW.
AIHW & DHFS 1997. First report on National Health Priority Areas 1996. AIHW Cat.No. PHE 1. Canberra: AIHW & DHFS.
AIHW DSRU: Armfield JM, Roberts-Thomson KF & Spencer AJ 1999. The child dentalhealth survey, Australia 1996. AIHW Dental Statistics and Research Unit SeriesNo. 20. Adelaide: AIHW DSRU.
01 AH2000 body Page 124 Thursday, June 1, 2000 3:06 PM

2 The health of Australians 125
TRIM SIZE 175 mm Wide x 250 mm Deep
AIHW DSRU: Brennan D, Slade G, Davies M & Spencer AJ 1995. Adult dental programssurvey (cross sectional). Adelaide: AIHW DSRU.
AIHW GPSCU: Britt H, Sayer GP, Miller GC et al. 1999. General practice activity inAustralia 1998Ð99. General Practice Series No. 2. AIHW Cat. No. GEP 2. Canberra:AIHW GPSCU.
AIHW: dÕEspaignet ET 1993. Trends in Australian mortality: diseases of the circulatorysystem, 1950Ð1991. Mortality Series No. 2. Canberra: AGPS.
AIHW: de Looper M & Bhatia K 1998. International health: how Australia compares.AIHW Cat. No. PHE 8. Canberra: AIHW.
AIHW: Giles G, Jelfs P & Kliewer E 1995. Cancer mortality in migrants to Australia,1979Ð1998. AIHW Cancer Series No. 4. Canberra: AIHW.
AIHW NPSU: Hurst T, Shafir E & Lancaster P 1999. Assisted conception: Australia andNew Zealand 1997. AIHW Cat. No. PER 10. Canberra: AIHW NPSU.
AIHW: Mathers C & Penm R 1998. Health system costs of diseases and injury inAustralia 1993Ð94. Canberra: AIHW.
AIHW: Mathers C & Penm R 1999a. Health system costs of cardiovascular diseases anddiabetes in Australia 1993Ð94. Health and Welfare Expenditure Series No. 5. AIHWCat. No. HWE 11. Canberra: AIHW.
AIHW: Mathers C & Penm R 1999b. Health system costs of injury, poisoning andmusculoskeletal disorders in Australia 1993Ð94. AIHW Cat. No. HWE 12. Canberra:AIHW.
AIHW: Mathers C, Penm R, Carter R & Stevenson C 1998a. Health system costs ofdiseases and injury in Australia 1993Ð94. AIHW Cat. No. HWE 5. Canberra: AIHW.
AIHW: Mathers C, Penm R, Sanson-Fisher R, Carter R & Campbell E 1998b. Healthsystem costs of cancer in Australia 1993Ð94. AIHW Cat. No. HWE 4. Canberra: AIHWand National Cancer Control Initiative.
AIHW: Mathers C, Vos T & Stevenson C 1999a. The burden of disease and injury inAustralia. AIHW Cat. No. PHE 17. Canberra: AIHW.
AIHW: Mathers C, Vos T & Stevenson C 1999b. The burden of disease and injury inAustraliaÑsummary report. AIHW Cat. No. PHE 18. Canberra: AIHW.
AIHW NISU: Moller J 1996. Understanding national injury data regarding Aboriginaland Torres Strait Islander peoples. Australian Injury Prevention Bulletin Issue 14.Adelaide: AIHW NISU.
AIHW: Senes S & Davies J 1999a. Cardiac surgery in Australia 1995. AIHW Cat. No.CVD 8. Canberra: AIHW & National Heart Foundation of Australia.
AIHW: Senes S & Davies J 1999b. Coronary angioplasty in Australia 1996. AIHW Cat.No. CVD 9. Canberra: AIHW & National Heart Foundation of Australia.
AIHW: Waters AM & Bennett S 1995. Risk factors for cardiovascular disease: asummary of Australian data. Cardiovascular Disease Series No. 1. Canberra: AIHW.
01 AH2000 body Page 125 Thursday, June 1, 2000 3:06 PM

126 AustraliaÕs Health 2000
TRIM SIZE 175 mm Wide x 250 mm Deep
Allworth A, Murray K & Morgan J 1996. A human case of encephalitis due to alyssavirus recently identified in fruit bats. Communicable Diseases Intelligence20:504.
Amos AF, McCarty DJ & Zimmet P 1997. The rising global burden of diabetes and itscomplications: estimates and projections to the year 2010. Diabetic Medicine 14(suppl. 5):S1ÐS85.
APA (American Psychiatric Association) 1996. Diagnostic and statistical manual ofmental disorders, 4th edn. Washington, DC: American Psychiatric Association.
APSU (Australian Paediatric Surveillance Unit) 1999. Sixth annual report 1998. Sydney:APSU.
Bach JF & Koutouzov S 1997. New clues to systemic lupus. Lancet 350 (SupplementIII):11.
Beaglehole R, Bonita R & Kjellstrom T 1998. Basic epidemiology, 3rd edn. Geneva:World Health Organization.
Booth M, Macaskill P, McLellan L et al. 1997. NSW schools fitness and physical activitysurvey, 1997. Sydney: NSW Department of School Education.
Bouchard C & Shephard RJ 1994. Physical activity, fitness and health: the model andkey concepts. In: Bouchard C, Shephard R, Stephens T et al. (eds). Physical activity,fitness and health. Champaign, IL: Human Kinetics.
Bouchard C, Malina RM & Perusse L 1997. Genetics of fitness and physicalperformance. Champaign, IL: Human Kinetics.
Brennan DS 2000. Provisions of extractions in private general practice (in press).
Burgess M & McIntyre P 1999. Vaccine-associated paralytic poliomyelitis.Communicable Diseases Intelligence 23(3):80Ð1.
Campbell NA 1993. Biology, 3rd edn. Redwood City, CA: Benjamin CummingsPublishing Company.
Carapetis JR & Currie BJ 1998. Preventing rheumatic heart disease in Australia. MedicalJournal of Australia 168:428Ð9.
Chalmers JM, Hodge CP, Fuss JM, Spencer AJ & Carter KD 1999. The Adelaide DentalStudy of Nursing Homes baseline data collection report 1998. Adelaide: AIHWDSRU, University of Adelaide.
DASET (Department of Art, Sport, the Environment and Territories) 1992. Pilot surveyof the fitness of Australians. Canberra: AGPS.
Davies MJ, Spencer AJ, Westwater A & Simmons B 1997. Dental caries amongAustralian Aboriginal, non-Aboriginal Australian-born and overseas-born children.Bulletin of the World Health Organization 75:197Ð203.
DHAC 1998. National action plan for suicide prevention. Canberra: DHAC.
DHAC 1999. National Injury Prevention Action Plan: priorities for 2000Ð2002 (draft).Canberra: DHAC.
01 AH2000 body Page 126 Thursday, June 1, 2000 3:06 PM
2 The health of Australians 127
TRIM SIZE 175 mm Wide x 250 mm Deep
DHAC & AIHW 1999a. National Health Priority Areas report: mental health 1998.AIHW Cat. No. PHE 13. Canberra: DHAC & AIHW.
DHAC & AIHW 1999b. National Health Priority Areas report: cardiovascular health1998. AIHW Cat. No. PHE 9. Canberra: DHAC & AIHW.
DHAC & AIHW 1999c. National Health Priority Areas report: diabetes mellitus 1998.AIHW Cat. No. PHE 10. Canberra: DHAC & AIHW.
DHFS & AIHW 1998a. National Health Priority Areas report on cancer control 1997.AIHW Cat. No. PHE 4. Canberra: DHFS & AIHW.
DHFS & AIHW 1998b. National Health Priority Areas report: injury prevention andcontrol 1997. AIHW Cat. No. PHE 3. Canberra: DHFS & AIHW.
Disney APS, Russ GR, Walker R & Sheil AGR 1998a. Australia and New Zealanddialysis and transplant registry: annual report 1997. Adelaide: ANZDATA Registry.
Disney APS, Russ GR, Walker R, Collins J, Herbert K & Kerr P (eds) 1998b. ANZDATARegistry report 1998. Adelaide: ANZDATA Registry.
Disney APS, Russ GR, Walker R et al. (eds) 1999. ANZDATA Registry report 1999.Adelaide: ANZDATA Registry.
Dowse GK, Gareebo H & Zimmet PZ 1990. High prevalence of NIDDM and impairedglucose tolerance in Indian, Creole and Chinese Mauritians. Diabetes 30:390Ð6.
Elliot E, Williams K, Ridley G et al. 1999. Australian Paediatric Surveillance Unit:6th annual report 1998. Sydney: Royal Australian College of Physicians.
English DR, Holman CDJ, Milne E, Winter MG, Hulse GK, Codde JP et al. 1995. Thequantification of drug caused morbidity and mortality in Australia 1995. Canberra:DHSH.
FECCA (Federation of Ethnic CommunitiesÕ Councils of Australia) 1997. Dispelling themythÑa little bit of sugar. Canberra: Diabetes Australia.
Friedenreich CM & Rohan TE 1995. A review of physical activity and breast cancer.Epidemiology 6:311Ð7.
Gaughwin A, Spencer AJ, Brennan DS & Moss J 1999. Oral health in South Australia bysocio-demographic characteristics and choice of provider 1999. Community Dentistryand Oral Epidemiology 27:93Ð102.
Gibson P, Coughlan J, Wilson A et al. 1999. Self-management education and regularpractitioner review for adults with asthma (Cochrane review). Oxford: CochraneLibrary.
Giesecke J 1994. Modern infectious disease epidemiology. London: Edward Arnold.
Gilroy N, Antic R, Carnie J et al. 1999. Tuberculosis notifications in Australia 1997.Communicable Diseases Intelligence 23(13):337Ð48.
Gledhill N 1990. Discussion: assessment of fitness. In: Bouchard C, Shephard RJ,Stephens T et al. (eds). Exercise, fitness, and health: a consensus of currentknowledge. Champaign, IL: Human Kinetics.
01 AH2000 body Page 127 Thursday, June 1, 2000 3:06 PM

128 AustraliaÕs Health 2000
TRIM SIZE 175 mm Wide x 250 mm Deep
Goldring JM, James DS & Anderson HA 1993. Chronic lung diseases. In: Brownson R,Remington PL & David JR (eds). Chronic disease epidemiology and control.Washington: American Public Health Association.
Goodnick PJ 1997. Diabetes mellitus and depression: issues in theory and treatment.Psychiatric Annals 27:353Ð9.
Gringold R 1999. Successful aging. Melbourne: Oxford University Press.
Hales CN & Barker DJP 1992. Type 2 (non-insulin-dependent) diabetes mellitus: thethrifty phenotype hypothesis. Diabetologia 35:595Ð601.
Hall R 1998. Immunisation myths and realities: responding to arguments againstimmunisation, a guide to providers [online, cited March 2000]. Available fromInternet: URL: http//www.health.gov.au:80/pubhlth/strateg/immunus/myths.htm
Handelsman DJ 1995. Hormonal male contraception: progress and prospects for the21st century. Australian and New Zealand Journal of Medicine 25:808Ð16.
Handelsman P & Jackson L 1999. A national needs assessment of children andadolescents with diabetes, Australia 1999. Sydney: The Diabetes ResearchFoundation, Juvenile Diabetes Foundation of Australia.
Herceg A, Oliver G, Myint H et al. 1996. Annual report of the National NotifiableDisease Surveillance System 1995. Communicable Diseases Intelligence 20(21):440Ð64.
Higginson J, Muir CS & Munoz N 1992. Human cancer: epidemiology andenvironmental causes. Cambridge: Cambridge University Press.
Hill DJ, White VM & Scollo MM 1998. Smoking behaviours of Australian adults in 1995:trends and concerns. Medical Journal of Australia 168:209Ð13.
Idler EL, Kasl SV & Lemke JH 1990. Self-evaluated health and mortality among theelderly in New Haven, Connecticut, and Iowa and Washington counties, Iowa,1982Ð1986. American Journal of Epidemiology 82:91Ð103.
Insel PM & Roth WT 1988. Core concepts in health. California: Mayfield PublishingCompany.
Ireland P & Giles G 1993. A review of diet and cancer: what are the prospects forprevention in Australia? Cancer Forum 17(2):132Ð55.
Jablensky A, McGrath H, Herman D et al. 1999. National Survey of Mental Health andWellbeing. Report 4. People living with psychotic illness: an Australian study.Canberra: DHAC.
Jorm A 1999. Association between smoking and mental disorders: results from anAustralian national prevalence survey. Australian and New Zealand Journal of PublicHealth 23(3):245Ð8.
Kaplan GA & Camacho T 1990. Perceived health and mortality: a nine year follow-up ofthe human population laboratory cohort. American Journal of Epidemiology117:292Ð304.
Kay AB 1997. T cells as orchestractors of the asthmatic response. The rising trends inasthma. Ciba Foundation Symposium 206:56Ð70.
01 AH2000 body Page 128 Thursday, June 1, 2000 3:06 PM

2 The health of Australians 129
TRIM SIZE 175 mm Wide x 250 mm Deep
Kay AB & Lessof MH 1992. Allergy: conventional and alternative concepts. Clinical andExperimental Allergy 22:1Ð44.
Kelsey JL (ed.) 1993. Breast cancer. Epidemiologic Reviews 15:1.
Lawrence D, Jablensky A & Fuller S 1999. Suicide rates in psychiatric in-patients: anapplication of record linkage to mental health research. Australian and New ZealandJournal of Public Health 23(5):468Ð70.
Leger J, Levy-Marchal C, Bloch J et al. 1997. Reduced final height and indications forinsulin resistance in 20 year olds born for small gestational age: regional cohort study.British Medical Journal 315 (7104):341Ð7.
Lindsay J, Smith A & Rosenthal D 1997. Secondary students, HIV/AIDS and sexualhealth 1997. Carlton: La Trobe University, Centre for the Study of SexuallyTransmissible Diseases.
Lister S, McIntyre PB, Burgess MA & OÕBrien ED 1999. Immunisation coverage inAustralian children: a systematic review 1990Ð1998. Communicable DiseasesIntelligence 23(6):145Ð70.
Manson JE, Nathan DM, Krolewski E et al. 1992. A prospective study of exercise andincidence of diabetes among US male physicians. Journal of the American MedicalAssociation 268:63Ð7.
McAlister T, George N, Faoagali J et al. 1999. Isolation of β-lactamase positivevancomycin resistant Enterococcus faecalis; first case in Australia. CommunicableDiseases Intelligence 23(9):237Ð9.
McCallum J, Shadbolt B & Wang D 1994. Self-rated health and survival: a 7-year follow-up study of Australian elderly. American Journal of Public Health 84:1100Ð5.
McCarty DJ, Zimmet P, Dalton A et al. 1996. The rise and rise of diabetes in Australia,1996. A review of statistics, trends and costs. Canberra: Diabetes Australia.
McIntyre PB, Heath TC, OÕBrien ED et al. 1998. National immunisation coverageÑinterpreting the first three quarterly reports from ACIR. Communicable DiseasesIntelligence 22(6):111Ð12.
McLeod JG, Hammond SR & Hallpike JF 1994. Epidemiology of multiple sclerosis inAustralia. Medical Journal of Australia 160:117Ð22.
McMichael AJ & Armstrong BK 1988. Breast cancer in Australia: occurrence, risk factors,preventability and screening. Medical Journal of Australia 142:86Ð8.
Moses RG & Colaguiri S 1997. The extent of undiagnosed gestational diabetes mellitusin New South Wales. Medical Journal of Australia 167:14Ð6.
Mossey JM & Shapiro E 1982. Self-rated health: a predictor of mortality among theelderly. American Journal of Public Health 72:800Ð8.
Moxon ER 1990. The scope of immunisation. In: Moxon ER (ed.). Modern vaccines:current practice and new approaches. London: Edward Arnold.
01 AH2000 body Page 129 Thursday, June 1, 2000 3:06 PM

130 AustraliaÕs Health 2000
TRIM SIZE 175 mm Wide x 250 mm Deep
Murray CJ & Lopez AD (eds) 1996. The global burden of disease: a comprehensiveassessment of mortality and disability from diseases, injuries and risk factors in 1990and projected to 2020. Vol. 1. Global Burden of Disease and Injury Series. Harvard:Harvard School of Public Health.
Musselman DL, Evans DL & Nemeroff CB 1998. The relationship of depression tocardiovascular disease. Archives of General Psychiatry 55:580Ð92.
National Injury Prevention Advisory Council 1999. Directions in injury prevention.Report 2: injury prevention interventionsÑgood buys for the next decade. Canberra:DHAC.
NCHECR (National Centre in HIV Epidemiology and Clinical Research) 1999. HIV/AIDS, hepatitis C and sexually transmissible infections in Australia: annualsurveillance report 1999. Sydney: NCHECR.
Newton P, Flood J, Berry M et al. 1998. Environmental indicators for national state ofthe environment reportingÑhuman settlements, Australia: state of the environment(Environmental Indicator Reports). Canberra: Environment Australia.
NHLBI (National Heart, Lung and Blood Institute) 1992. International consensus reporton diagnosis and treatment of asthma. Bethesda: NIH.
NHMRC 1992. Australian Health Technology Advisory Committee. Guidelines for renaldialysis and transplantation services. Canberra: AGPS.
NHMRC 1997a. Clinical practice guidelines: depression in young people. Canberra:NHMRC.
NHMRC 1997b. The Australian immunisation handbook, 6th ed. Canberra: NHMRC.
NHRMC 1997c. Clinical practice guidelines: prevention of strokeÑthe role ofanticoagulants, antiplatelet agents and carotid endarterectomy. Canberra: AGPS.
NHMRC 1999. Paradigm shiftÑinjury: from problem to solution. New researchdirections. Canberra: NHMRC.
NISAD (Neuroscience Institute of Schizophrenia and Allied Disorders) 1998. Annualreport. Sydney: Garvan Institute of Medical Research.
Olff M 1999. Stress, depression and immunity: the role of defense and coping styles[comment]. Psychiatry Research 85(1):7Ð15.
Pate RR 1988. The evolving definition of fitness. Quest 40:174Ð9.
Peat J, van den Berg R, Green W et al. 1994. Changing prevalence of asthma inAustralian children. British Medical Journal 308:1591Ð6.
Perry IJ, Wannamethee SG, Walker MK et al. 1995. Prospective study of risk factors fordevelopment of non-insulin dependent diabetes in middle aged British men. BritishMedical Journal 310 (6979):560Ð4.
Phillips P, Wilson D, Beilby J et al. 1998. Diabetes complications and risk factors in anAustralian population. How well are they managed? International Journal ofEpidemiology 27:853Ð59.
Population Reference Bureau 1999. World population data sheet. Washington, DC: PRB.
01 AH2000 body Page 130 Thursday, June 1, 2000 3:06 PM

2 The health of Australians 131
TRIM SIZE 175 mm Wide x 250 mm Deep
Pyke JE 1987. The Australian health and fitness survey 1985: the fitness, health andphysical performance of Australian school students aged 7Ð15 years. Adelaide:Australian Council for Health, Physical Education and Recreation.
Robertson CF, Heycock E, Bishop J et al. 1991. Prevalence of asthma in Melbourneschool children: changes over 26 years. British Medical Journal 302:1116Ð8.
Ruffin R & Southcott A 1997. Recent advances in asthma management. CurrentTherapeutics 38:19Ð27.
Selvey L & Sheridan J 1994. Outbreak of severe respiratory disease in humans andhorses due to previously unrecognised paramyxovirus. Communicable DiseasesIntelligence 18(21):499.
Silburn SR, Zubrick SR, Garton A et al. 1996. Western Australia Child Health Survey:family and community health. Perth: ABS & TVW Telethon Institute for Child HealthResearch.
Simon GE, Revicki DA, Grothaus L & Vonkorff M 1998. SF-36 summary scores: arephysical and mental health truly distinct? Medical Care 36(4):567Ð72.
Smith DP, Armstrong BK & Saunders R 1998. Patterns of prostate specific antigen (PSA)testing in Australia in 1992 to 1996: an examination of Medicare data. Sydney: NSWCancer Council.
Smith EI & Gilligan C 1989. Health-related fitness of the older adult. In: Drury T (ed.).Assessing physical fitness and physical activity in population-based surveys.Washington: Government Printing Office.
South Australian Cancer Registry 1996. Epidemiology of cancer in South Australia,1977Ð1995. Cancer Series No. 18. Adelaide: South Australian Cancer Registry.
Spencer AJ, Armfield JM, Davies MJ & Slade GD 1998. Social equality in exposure towater fluoridation. Journal of Dental Research 77:700 (Abstract 546).
Staples M, Marks R & Giles GG 1998. Trends in the incidence of non-melanocytic skincancer (NMSC) treated in Australia 1985Ð1995: are primary prevention programsstarting to have an effect? International Journal of Cancer 78:144Ð8.
Stone C & Halliday J 1996. Gestational diabetes incidence in Victoria, 1996. Melbourne:Perinatal Data Collection Unit, Public Health and Development, Department ofHuman Services.
Storlien LH, Kriketos AD, Jenkins AB et al. 1997. Does dietary fat influence insulinaction? Annals of the New York Academy of Sciences 827:287Ð301.
Stouthard M, Essink-Bot M, Bonsel G, Barendregt J & Kramers P 1997. Disabilityweights for diseases in the Netherlands. Rotterdam: Department of Public Health,Erasmus University.
Sullivan D 2000. Investigation of lipids. Australian Family Physician 29(3):207Ð11.
Supramaniam R, Smith DP, Coates MS & Armstrong BK 1999. Survival from cancer inNew South Wales in 1980 to 1995. Sydney: NSW Cancer Council.
01 AH2000 body Page 131 Thursday, June 1, 2000 3:06 PM

132 AustraliaÕs Health 2000
TRIM SIZE 175 mm Wide x 250 mm Deep
Thomson J, Lin M, Halliday L et al. 1999. AustraliaÕs notifiable disease status, 1998.Annual report of the National Notifiable Disease Surveillance System.Communicable Diseases Intelligence 23(11):278Ð304.
Threlfall TJ, English DR & Rouse IL 1998. Prostate cancer in Western Australia: trends inincidence and mortality from 1985 to 1996. Medical Journal of Australia 169:21Ð4.
Trichopoulos D, Frederick PL & Hunter DJ 1996. What causes cancer? ScientificAmerican 275(3):50Ð7.
Turnidge J, Nimmo G & Francis G 1996. Evolution of resistance in Staphylococcus aureusin Australian teaching hospitals. Medical Journal of Australia 164(2):68Ð71.
UN (United Nations) 1998. Demographic yearbook 1996. New York: UN Departmentfor Economic and Social Information and Policy Analysis.
Wakefield M, Staugas R, Ruffin R et al. 1997. Risk factors for repeat attendance athospital emergency departments among adults and children with asthma. Australiaand New Zealand Journal of Medicine 27:277Ð84.
Ware JE, Kosinski M & Keller SD 1994. SF-36 physical and mental health summaryscales: a userÕs manual. Boston, MA: The Health Institute, New England MedicalCenter.
Ware JE, Kosinski M & Keller SD 1996. A 12-item short-form health survey: constructionof scales and preliminary tests of reliability and validity. Medical Care 34(3):220Ð33.
Ware JE, Kosinski M & Keller SD 1998. SF-12: how to score the SF-12 physical andmental health summary scales, 3rd ed. Lincoln, RI: Quality Metric Incorporated.
WHO 1977. International classification of diseases, ninth revision. Geneva: WHO.
WHO 1996. World health statistics annual, 1995. Geneva: WHO.
WHO 1997. The world health report 1997. Conquering suffering; enriching humanity.Geneva: WHO.
WHO 1998. World health statistics annual, 1996. Geneva: WHO.
Wilkinson R & Marmot M 1998. The solid facts: social determinants of health. Geneva:WHO.
World Bank 1993. World development report 1993: investing in health. New York:Oxford University Press.
Young C 1996. Are young people leaving home earlier or later? Journal of the AustralianPopulation Association 13:125Ð52.
Zubrick SR, Silburn SR, Garton A, Burton P, Dalby R, Carlton J, Shepherd C &Lawrence D 1995. Western Australian child health survey: developing health andwell-being in the nineties. Perth: ABS and the Institute for Child Health Research.
01 AH2000 body Page 132 Thursday, June 1, 2000 3:06 PM

3 Determinants of health 133
TRIM SIZE 175 mm Wide x 250 mm Deep
3 Determinants of health
As discussed briefly in chapter 1, the health of individuals and populations isdetermined by many factors acting alone or together, often in complex interplay.Information on the determinants of health is particularly important because it can helpexplain trends in health and why some groups have better or worse health than others.This knowledge can then guide the nature and focus of preventive activities. Preventioncan occur through the efforts of individuals acting on their own behalf, through healthprofessionals, and through governments and other agencies.
The health determinants outlined in this chapter comprise:
¥ Environmental factors. These include physical, chemical, biological, social, economic,cultural and political factors. Socioeconomic factors such as education andemployment can affect an individualÕs ability and opportunity to make healthychoices. Physical, chemical and biological factors affect the quality and safety of air,water, soil and food by, for example, chemical pollution and waste disposal methods.Larger scale environmental disruptions, such as human-induced climate change andozone depletion, can have major health implications.
¥ Genetic factors. Some diseases, such as muscular dystrophy, result entirely from anindividualÕs genetic make-up whereas many others reflect the interaction betweenthat make-up and environmental factors.
¥ Attitudes and beliefs. Attitudes, beliefs and knowledge influence individualsÕlifestyle and behaviours and so affect health.
¥ Lifestyle and behaviour. Patterns of eating and drinking, use of tobacco and otherdrugs, physical activity, sexual practice, and other behaviours can all contributestrongly to a personÕs health (Box 3.1, page 134). Along with genetic factors, lifestyleand behaviour influence biomedical factors that affect health.
¥ Biomedical factors. Blood pressure, blood cholesterol and bodyweight are among theimportant biomedical factors that affect health (Box 3.1). The levels of these factors inan individual are the result of lifestyle, behaviour and genetic predisposition.
3.1 Environmental factorsAustraliaÕs present social, economic and physical environment generally providesaccess to good-quality food and water, housing and places for recreation as well aseducation and employment. These contribute to an overall standard of living andhealth that compares well with other developed countries (enHEALTH 1999; AIHW:de Looper & Bhatia 1998; AIHW: Lester 1994).
01 AH2000 body Page 133 Thursday, June 1, 2000 3:06 PM

134 AustraliaÕs Health 2000
TRIM SIZE 175 mm Wide x 250 mm Deep
Despite this, some Australians such as Indigenous peoples have generally poor socialand economic conditions and poor health. In addition, significant changes to AustraliaÕsphysical environment since European settlement have been at considerable cost toresources such as soil, rivers and aquifers, and biodiversity (State of the EnvironmentAdvisory Council 1996; CSIRO 1998a). Also, material released into AustraliaÕsatmosphere and the oceans contributes to environmental issues that could havesignificant population health impacts in Australia and worldwide (Epstein 1999;McMichael 1993; McMichael & Powles 1999).
These changes to the physical environment are relevant to AustraliaÕs long-term abilityto supply basic human needs and may also pose more direct threats to health.Unfortunately, although environmental factors are increasingly seen as important, thereare presently insufficient data to monitor nationally the levels and changes in many ofthese factors or to accurately estimate their effect on current or future health.
Box 3.1: Some behavioural and biomedical risk factors associated with major causes of morbidity, disability and mortality
Risk factors Cause of ill health, disability and mortality
Behavioural
Poor diet and nutrition
Coronary heart disease, stroke, breast and digestive system cancers, type 2 diabetes, gallstones, osteoporosis, malnutrition, dental conditions
Excess alcohol consumption
Coronary heart disease, liver and pancreatic disease, stroke, high blood pressure, cancers of the digestive system, accidents, mental illness, violence
Smoking Coronary heart disease, several cancers including lung, mouth and cervical cancers, stroke, chronic lung disease
Other drug abuse HIV/AIDS, hepatitis, renal failure, mental illness, suicide, violence, accidents
Inadequate physical activity
Coronary heart disease, stroke, type 2 diabetes, colon cancer, osteoporosis, bone fractures, falls, mental illness, obesity
Excessive sun exposure
Melanoma and other skin cancers, premature ageing of the skin
Not vaccinated Measles, diphtheria, tetanus, pertussis, poliomyelitis, Haemophilus influenzae type b
Unprotected sexual activity
HIV/AIDS, hepatitis, cervical cancer, infertility, pelvic infection, venereal disease
Biomedical
Overweight and obesity
Coronary heart disease, type 2 diabetes, breast cancer, gallstones, degenerative joint disease, obstructive sleep apnoea
High blood pressure Coronary heart disease, stroke
Raised blood cholesterol level
Coronary heart disease, stroke
01 AH2000 body Page 134 Thursday, June 1, 2000 3:06 PM
3 Determinants of health 135
TRIM SIZE 175 mm Wide x 250 mm Deep
Social, economic, cultural and political determinantsThe strong association between health and social and economic factors has becomeincreasingly recognised and documented. However, the mechanisms behind thatassociation are less clear (Yen & Syme 1999). Much of the research on the social andeconomic bases of health focuses on the observation that people in poor circumstanceshave worse health than those in more advantaged conditions. Social and economicdisadvantages (e.g. poor education, unemployment and few assets) tend to occurtogether, and magnify the negative effects on health (WHO 1998). Social and economiccircumstances can also cause anxiety, low self-esteem and social isolation which in turncan influence health-related behaviours and health itself.
In Australia, men and women with lower socioeconomic status (as measured byeducation level, occupation, family income and areas of socioeconomic disadvantage),including many Indigenous peoples, bear a higher burden of disease (see chapter 4).
Social, economic and cultural determinants of health are closely related. Socialcircumstances affect behaviour, and socioeconomically disadvantaged people may beinfluenced by economic and cultural reasons in their choice of behaviours that affecthealth. People in lower socioeconomic groups are more likely to exhibit behaviours,such as smoking and heavy use of alcohol, that place them at higher risk (DHAC &AIHW 1999). Unhealthy behaviour may be driven partly by a lack of knowledge, partlyby more fatalistic attitudes and feelings of hopelessness, and partly by desire forimmediate gratification in the absence of other rewards.
Cultural factors may influence health because of traditions, attitudes and beliefs, andcustoms. Family life, parental support and social exclusion are other factors that crossthe social and cultural boundaries and may affect health in various ways. There are alsorelated issues of Ôsocial capitalÕ, a concept developed to explain the apparent benefitsthat social ties within communities have by making resources, advantages andopportunities available to individuals. Migrants, minority groups and refugees may besusceptible to ill health due to social isolation and often have few social supportnetworks (Kawachi et al. 1996; Wilkinson & Marmot 1998). Despite this, overseas-bornAustralians, especially those born in southern Europe, generally have lower death ratesthan those born in Australia (Powles & Gifford 1990).
Physical, chemical and biological determinants Over the past decade there has been growing concern about the links between healthand the damage that humans are doing to the physical environment (McMichael 1993).Humans now have a large and growing capacity to affect the life support systems ofthis planet such as water, agricultural land and climate.
Australia currently has no system of monitoring to provide regular national data aboutissues such as the quality of drinking water, food, sewerage, soil health andbiodiversity.
In the absence of agreed national indicators, the following provides an overview ofsome significant environmental issues relating to the environment and health.
01 AH2000 body Page 135 Thursday, June 1, 2000 3:06 PM

136 AustraliaÕs Health 2000
TRIM SIZE 175 mm Wide x 250 mm Deep
Australian climateThe atmosphere and its expression through the weather affect the economic and socialhealth of the country (CSIRO 1998b). Average annual temperatures have graduallyincreased to be about 1° Celsius higher in the year 2000 than they were in 1900, withmany of the warmest years on record having occurred in the 1980s and 1990s (Bureau ofMeteorology 1999a). Although average annual rainfall in north-west and south-eastAustralia has increased since 1910, rainfall in the other quadrants shows little or nochange (Bureau of Meteorology 1999b). Depending on location within Australia and theseverity of global warming, temperatures are estimated to rise by between 0.6° and 3.8°Celsius within 70 years, and winter rainfall over most of Australia may fall by up to 20%(CSIRO 1998a).
Global climate is changing and the factors causing this are of both natural and humanorigin (enHEALTH 1999). Although the timing and size of future changes are difficultto predict, the consequences upon health are likely to be significant (enHEALTH 1999).Health impacts could include increases in vector-borne diseases such as dengue fever,water- and sewerage-related diseases, and respiratory problems related to urbanpollution. There could also be indirect health impacts resulting from impairment ofagriculture and water resources as well as damage to buildings and roads (Watson et al.1997; enHEALTH 1999).
Some interesting environmental indicators are:
¥ a steady increase in atmospheric carbon dioxide concentrations from 330 parts permillion (ppm) in 1976 to over 360 ppm in 1998 (CSIRO 1999);
¥ per capita carbon dioxide emissions from energy use of 16.6 tonnes, which is lowerthan those of the United States (20.4) but higher than those of the Organisation forEconomic Co-operation and Development (OECD) average (11.1) (OECD 1997) andmuch higher than those for developing nations;
¥ estimated falling net greenhouse gas emissions from land clearing, from 103 milliontonnes of carbon dioxide equivalents in 1990 to 65 million tonnes in 1997;
¥ an 11% increase in net emissions from all other sources (related mainly to energy andagriculture) between 1990 and 1997, from 389 to 431 million tonnes of carbon dioxideequivalents (Australian Greenhouse Office 1997);
¥ 3% of AustraliaÕs energy production occurring through renewable methods,compared with 11% in Canada, 17% in Japan, 1% in the Netherlands and 7% in theUnited States (ABS 1999b); and
¥ 79% of Australians driving to work, 7% being driven to work as car passengers, 16%travelling by bus or train and 9% walking or cycling (ABS 1996a).
Stratospheric ozoneThe stratospheric ozone layer filters cancer-causing ultraviolet radiation from sunlightbefore it reaches the EarthÕs surface. This helps protect against skin cancer, cataracts andperhaps some suppression of the immune system (UNEP 1998). Human production andrelease of chlorofluorocarbons (CFCs) and similar compounds into the atmosphere hascaused a decrease in the concentration of stratospheric ozone, especially evident overAntarctica in spring. Through international agreement, the release of CFCs into the
01 AH2000 body Page 136 Thursday, June 1, 2000 3:06 PM

3 Determinants of health 137
TRIM SIZE 175 mm Wide x 250 mm Deep
atmosphere has slowed. However, since many CFCs persist in the stratosphere foryears, the concentration of the main CFCs has remained unchanged or is still increasingslightly (CSIRO 1999). The concentration of ozone over Antarctica in October hashalved since the 1950s (Fraser 1999). The Commonwealth Scientific and IndustrialResearch Organisation (CSIRO) estimates that the ozone layer may recover between theyears 2050 and 2070 (Fraser 1999). However, fair-skinned populations at mid-latitudesare predicted to experience a 5Ð10% increase in skin cancer incidence during the middledecades of the twenty-first century as a result of current higher ultraviolet lightexposure (Slaper et al. 1996).
Human health indicators of environmental effectsAlthough the importance of the environment is increasingly being recognised, itscontribution to health is often likely to be indirect, subtle, complex and delayed. It istherefore very difficult to estimate the full range and size of the health effects that canultimately be traced to the environment, and so to plan accordingly. AustraliaÕs abilityto report on health-related environmental issues is poorly developed, as elsewhere. Thereporting that is currently possible relies mainly on measures of ill health rather thanÔgood healthÕ. Three environment-related human health issues for which data exist arevector-borne diseases, skin cancer and low-level lead exposure of children.
A number of communicable diseases are influenced by environmental conditions or arekept in check by the efforts of environmental and other health workers. These diseasesinclude Ross River virus, Murray Valley encephalitis, Japanese encephalitis, denguefever, Barmah Forest virus, food poisoning diseases and legionellosis. The prevalence ofdiseases influenced by environmental conditions fluctuates considerably with changesin the weather and the prevalence of insect vectors. Surveillance of arboviruses andtheir vectors is important for the detection and management of these diseases, andclimate and environmental changes associated with global warming are likely to resultin higher numbers and wider geographic distribution of vector-borne diseases withinAustralia. The first case of Japanese encephalitis (a potentially fatal virus transmitted bymosquitoes) on the Australian mainland was diagnosed in March 1998 (Thomson et al.1998). In recent years, Japanese encephalitis has also been diagnosed in the Torres StraitIslands.
Development of melanoma and other skin cancers is related to exposure to ultravioletradiation in sunshine. Although the death rate from melanoma has remained relativelyunchanged, the incidence of new cases is growing steadily (AIHW 1999b) (seesection 2.2, page 70).
Industrial use of lead, especially in the manufacture of paint and as an additive in petrol,has resulted in the widespread distribution of lead in the environment where it isavailable for people, and especially children, to swallow or inhale. Community concernover the past decade about the health effects of lead, especially its effects on youngchildren, has stimulated action to solve the problem. There has been only one systematicnational study of blood lead concentration in children. This was conducted in 1995, andfound that less than 1 in 12 children aged 1Ð4 years had blood lead concentrationsgreater than or equal to the 1993 National Health and Medical Research Council(NHMRC) goal for all Australians (AIHW: Donovan 1996). From many individualAustralian studies there appears to be a general trend for blood lead concentrations in
01 AH2000 body Page 137 Thursday, June 1, 2000 3:06 PM
138 AustraliaÕs Health 2000
TRIM SIZE 175 mm Wide x 250 mm Deep
children to have decreased over time. It appears likely that this decrease is in response tothe introduction of legislation encouraging the use of unleaded petrol, the generallowering of paint-lead concentration over the decades and community awareness.
3.2 Genetic factorsGenetic factors play an important role in human health and disease. An individualÕsgenetic make-up (genome) sets the main features and boundaries within which life is tobe experienced. It also provides the blueprint for how the human body interacts withthe environment. In addition, the genome is programmed to protect its own molecularstructure and to repair any damage caused to it by environmental agents.
Human health also depends on the genetics of other life forms, especially organismsthat infect humans. Therefore, human health should be seen as the result of ourenvironment (including the genetics of other life forms), our genes, and the interactionbetween the two.
The spectrum of genetic diseasesGenetic factors contribute to diseases at various levels and in many different ways(Khoury 1996). A study in British Columbia, Canada, suggests that prior to age 25, morethan 5% of all live-born individuals will be affected by a disease that primarily has agenetic component (Baird et al. 1988). Separate estimates put the proportion at about10% when measured for recurrent genetic diseases over the whole lifetime (UNEP &ICPEMC 1992).
Broadly, three major types of genetic diseases/disorders are identified. (For explanationof various genetic terms and a description of the organisation of the human geneticmaterial, see Box 3.2.) These are:
¥ single gene (monogenic) disorders, genetic defects that result from an alteration or achange (mutation) in the structure of the gene and can be traced through families andclearly defined;
¥ chromosomal abnormalities, caused by structural changes in the chromosomes or thegain or loss of whole chromosomes (or parts of chromosomes), some of which can berelated to specific clinical syndromes; and
¥ multifactorial diseases, which seem to have a strong genetic component but areexpressed following interaction of genes with environmental factors such as diet,chemical exposure and lifestyle.
About 2% of the population will have a monogenic problem or condition, with some ofthe problems showing up at birth and others showing up later in life. Commonexamples of monogenic disorders are muscular dystrophy, cystic fibrosis andhaemophilia. Limited data are available to generate reliable estimates of the prevalenceof these problems in Australia.
The incidence of chromosomal abnormalities or malformations among live-born infants isestimated to be at least 0.5%. In addition to well-defined clinical syndromes, e.g. Downsyndrome, chromosomal abnormalities also account for more than 20% of spontaneousabortions (Riccardi 1977). Chromosomal abnormalities represented 13% of all notified
01 AH2000 body Page 138 Thursday, June 1, 2000 3:06 PM
3 Determinants of health 139
TRIM SIZE 175 mm Wide x 250 mm Deep
Box 3.2: Human genetic organisationIt is estimated that each human cell has at least 70,000 different types of genes. Genes,whose main function is to code for various proteins, are regions of deoxyribonucleic acid(DNA) that operate as units of heredity. The total set of genes and its organisation is calleda genome.
The genetic information is stored in the ordered sequence of four types of nucleotides(building blocks of nucleic acids) that are linked together to form DNA molecules. Thereare some 6 billion nucleotides in each human cell. This extensive information system ispackaged up into 46 chromosomes (23 pairs) within the nucleus of the cell, with genes sit-uated at specific sites or loci on the chromosomes.
For every pair of chromosomes, one chromosome comes from one parent and the secondfrom the other parent. These paired chromosomes are separated again at the time of forma-tion of sperm and ova.
While broadly similar in underlying structure, i.e. the ordered sequence of their nucle-otides, individual genes on each member of a pair of chromosomes may exist in alternativeforms, called alleles. Examples of this variation are alleles of the ABO gene, located onChromosome 9, that lead to the formation of A, B and O blood groups.
This existence of many different forms of the same gene in the populationÑalthough anindividual may carry no more than two alleles for any one geneÑin concert with variouschromosomal combinations (possible from a set of 23 pairs of chromosomes) is the source ofmuch genetic variation. In addition, maternally inherited genetic information contained inmitochondria, components of cells that are important in various cellular activities, adds tothe genetic complexity.
An international effort, the Human Genome Project, is currently under way to map thelocation of each gene on the chromosomes along with their nucleotide sequence in order tounderstand the function of various genes (Box 3.3, page 140).
Genetic termsCell: Cells are basic structural units of organisms, made up of various membranes,organelles and cytoplasm. The genetic material (DNA) is contained within the nucleus ofthe cell as well as its mitochondria.
Chromosome: A very long strand of DNA supported by proteins. In each human cell,except the egg and sperm cells, there are 46 chromosomes (arranged in 23 pairs, with onemember of a pair inherited from one parent) that vary in size and structure.
Chromosomal abnormalities: An anomaly resulting from a change in the number orstructure of the chromosomes. Chromosomal anomalies may occur either during the pro-duction of the egg or sperm, or at conception, and may even transmit (or be inherited) overgenerations.
DNA (deoxyribonucleic acid): The molecule in which genetic information is stored; com-posed of two complementary chains of nucleotides (its basic unit) wound in a double helix.
Gene: The basic unit of heredity; a sequence of nucleotides that codes for a peptide chain(assembled into proteins), along with other intermediary genetic molecules such as ribonu-cleic acid (RNA).
01 AH2000 body Page 139 Thursday, June 1, 2000 3:06 PM

140 AustraliaÕs Health 2000
TRIM SIZE 175 mm Wide x 250 mm Deep
congenital malformations in Australia in 1996, with an incidence rate of about 228 per100,000 live births (Table 3.1) (AIHW NPSU: Hurst et al. 1999). In addition to chromo-somal abnormalities, genetic contribution to congenital malformations such as spinabifida, congenital heart disease, and cleft lip/cleft palate is also high (Weatherall 1993).
The health impact of various genetic disorders mentioned above is small comparedwith their role in common diseases, several of which are multifactorial in origin. Highblood pressure, asthma, diabetes and schizophrenia, common chronic diseases whosepopulation impacts are known to be linked to environmental and lifestyle factors, alsohave large genetic components (Schull & Hanis 1990). However, the involvement ofmany genes in these diseases, each with an additive effect, makes it difficult to quantifythe extent of the genetic contribution (Nora et al. 1991).
In addition to the diseases that result from the abnormal functioning of the genes thatpeople have inherited from their parents, many genetic diseases result fromabnormalities of the genetic machinery of cells that manages genetic and cellularprocesses (UNEP & ICPEMC 1992). Many forms of cancer which result from acquiredabnormalities of the genetic machinery in body cells are prime examples of suchchanges. With the exception of a few rare childhood forms, cancer is now considered toresult from mutations acquired during the lifetime. These changes affect only the body
Box 3.3: The Human Genome ProjectInitiated in the United States in 1988Ñthe project is now an international researcheffortÑthe Human Genome Project (HGP) plans to generate genetic maps of all humanchromosomes by 2005 (Trent 1999). This includes the location of various genes on thechromosomes and determination of their ordered nucleotide sequence.
Several useful outcomes with relevance to human health are expected from the project,including:
¥ knowledge about the structure of various genes and their function;
¥ improved diagnosis and predictive testing for genetic disorders; and
¥ new treatments for genetic disorders, including gene therapy.
Before the advent of HGP, only 4Ð6% of all human genes had been identified and theirfunction partially described. These genes could at best be used as markers of various dis-eases. Availability of new molecular techniques, and a concerted international effort, hasnow ensured that the full sequence of the human genome, covering more than 70,000genes, will soon become available (Foote 1999).
There have been many spin-offs from the HGP already, including the development of:
¥ new technologies for microtesting, e.g. automated DNA testing of relatively small samplesof tissue or blood, with a variety of forensic, diagnostic, screening and biological applica-tions; and
¥ sophisticated methods to link vast arrays of data, originally developed to determine loca-tional relationships between different genes, which may prove highly suitable for linkingvarious administrative collections.
01 AH2000 body Page 140 Thursday, June 1, 2000 3:06 PM

3 Determinants of health 141
TRIM SIZE 175 mm Wide x 250 mm Deep
cells, and are not passed on unless they affect the DNA of the egg or sperm. However,it appears that we may inherit genes that make us more likely to develop a particularcancer following their mutation in body cells (Weatherall 1993).
Genetic resistance to diseaseExamples of genetic diseases given above reflect mutational changes in the genome thatcan damage health. However, not all mutations are harmful. Generally, along with othermechanisms, mutations lead to the generation of significant genetic diversity that isessential to our survival as a species.
The wide range of human leukocyte antigens (HLA), sentries that help differentiate selffrom non-self (see immunological health in chapter 2 for immune mechanisms), aregood examples of this type of variation. The HLA diversity ensures that there is enoughvariation among individuals in a population to resist new diseases.
Other forms of genetic resistance to disease include our innate ability to counter variousinfections and environmental hazards. Genetic traits such as sickle cell haemoglobinand ovalocytosis, which resist infection by the malarial parasite Plasmodium or stunt itsgrowth inside the cell, are good examples of innate genetic resistance. However,individuals differ markedly in their ability to resist infection (Wakelin 1988), and thischanges with age (Anderson & May 1991). Other environmental hazards are alsohandled variously by individuals using many different genetic mechanisms.
The genetic preparedness of the human host to resist disease is also influenced by thegenetic ability of the invading organism to bypass the resistance mechanisms. Quiteoften, human parasites evolve in step with the disease-resistance mechanisms of thehost. HostÐparasite interactions therefore present a fascinating example of howenvironmental interactions between species influence health and disease processes.Undoubtedly, many of the genetic traits we observe today, in either host or parasite, areresults of this co-evolution.
Table 3.1: Notifications of chromosomal malformations, 1996
ICD-9 code Chromosomal abnormality Number
Incidence(per 100,000
births)
758.0 Trisomy 21 (Down syndrome) 312 121
758.1 Trisomy 13 (Patau’s syndrome) 25 10
758.2 Trisomy 18 (Edward’s syndrome) 56 22
758.3 Autosomal deletion 46 18
758.5 Other autosomal anomalies 76 30
758.6 Turner’s syndrome 28 11
758.7 Klinefelter’s syndrome 17 07
758.8 Sex chromosome anomalies 25 10
758.9 Unspecified 2 1
758 Total 587 228
Note: All States and Territories notify foetuses and infants with major congenital malformations, including chromosomal abnormalities, to the AIHW National Perinatal Statistics Unit which provides a national monitoring system.
Source: AIHW NPSU: Hurst et al. 1999.
01 AH2000 body Page 141 Thursday, June 1, 2000 3:06 PM

142 AustraliaÕs Health 2000
TRIM SIZE 175 mm Wide x 250 mm Deep
A variety of determinants, however, may influence our inherent resistance to disease(Table 3.2). These include age, nutrition and socioeconomic factors. Variation in thecapacity and mechanism for DNA repair may also lead to differences in the survival ofharmful mutations. The genetic complexity of the invading organisms, as mentionedearlier, is another important factor.
However, this variation in response to infectious and other environmental agentsdepends on the degree of exposure. If the exposure is high, such as a highly virulentstrain of a virus, then a large proportion of the population may be overwhelmed by theexposure irrespective of genetic resistance.
Prevention of genetic diseasesA common perception is that, since the genetic inheritance of an individual or apopulation is unchangeable, its outcomes cannot be significantly altered. However, thelatest advances in genetic testing may remedy this problem partly through diseaseprevention. A series of tests for prenatal screening of chromosomal abnormalities andsome single-gene disorders is now available. A variety of gene therapy techniques hasalso been developed to manipulate naturally occurring genes and introduce them intothe body to combat disease. Also, given the role of genetic factors in influencing anindividualÕs response to various diseases, gene technology has the potential tocontribute to the prevention of these diseases by identifying those most at risk.
Table 3.2: Factors influencing genetic susceptibility to disease
Factor Mechanisms and outcomes
Age Older people are more vulnerable to disease than younger people because of the decline in their ability to handle environmental damage to DNA and the accumulation of harmful mutations over time.
Nutrition Diet can have a major inßuence on DNA mutation and cancer promotion. Some dietary factors may lead to certain genetic changes that in turn lead to cancers.
Socioeconomic factors No direct relationship has been identiÞed between socioeconomic factors and increases in genetic risks. However, poor diet, inadequate health care, infec-tious diseases, and exposure to environmental agents such as tobacco smoke can increase an individualÕs susceptibility to agents that cause genetic change.
Genetic complexity of parasites
Several parasitic organisms have evolved to circumvent the defence mecha-nisms of the human host, e.g. drug resistance, the ability to mutate at a faster rate, increased virulence and other evading mechanisms.
Degree of exposure There is an upper limit to the ability of organisms to survive in a hostile environ-ment. For example, extensive exposure to agents such as sunlight increases risks of skin cancer and may override all DNA repair capacities.
DNA repair mechanisms Damaged capacity to repair DNA may allow new mutations to survive. This repair capacity varies between individuals and between different tissues of the same individual.
Evolutionary maladaptations Several genetic traits such as sickle cell haemoglobin and thalassemias have evolved to help individuals and populations adapt to their environment. How-ever, when the affected individuals live in other environments, the disadvan-tages may outweigh any special advantage.
Note: Based on list given in UNEP & ICPEMC (1992).
01 AH2000 body Page 142 Thursday, June 1, 2000 3:06 PM

3 Determinants of health 143
TRIM SIZE 175 mm Wide x 250 mm Deep
3.3 Attitudes and beliefsPeopleÕs attitudes, beliefs and knowledge are among the many influences on health-related behaviour, and therefore on health itself. Documenting and tracking these so-called cognitive factors among Australians may help to explain overall health levels andtrends. It may also help shed light on the differences in the lifestyles and health ofdifferent groups in the population.
Available data indicate that health is an important issue for Australians. For example,Tasmanian adults rated ÔhealthÕ over factors such as Ôability to perform activities ofdaily livingÕ, Ôrelationship with partnerÕ, Ôpersonal safetyÕ and Ôrelationship withchildrenÕ as the most important factor for quality of life (DHHST 1999).
Attitudes and beliefs on specific health issuesData on AustraliansÕ attitudes, beliefs and knowledge are available for major healthissues such as diet, alcohol, illicit drug use and childhood immunisation. For example,most Australian adults believe that fat, sodium and sugar contributed to thedevelopment of disease and ill health (Crawford & Baghurst 1990). Despite the well-documented and widely promoted adverse effects of tobacco use, the 1998 NationalDrug Strategy Household Survey found that regular use of tobacco by adults isconsidered acceptable by 40% of Australians (Table 3.3, page 144).
Around 25% of Australians consider the regular use of cannabis/marijuana acceptable.For other drugs (except tobacco and alcohol), less than 10% of Australians believe thatregular use by adults is acceptable. The legalisation of cannabis/marijuana is supportedby around 30% of Australians, and about 10% support the legalisation of heroin,cocaine and amphetamines (AIHW 1999a). About 96% of Tasmanian adults believe thatimmunisation is Ôvery effectiveÕ or ÔeffectiveÕ in preventing childhood diseases such asmeasles, mumps, polio, diphtheria and tetanus (DHHST 1999).
Sex and age differences
Although Australian data are limited, differences in attitudes and beliefs relating tohealth are also evident between males and females, and between younger and older agegroups. For example, men believe that increasing physical activity is an importanthealthy behaviour, whereas women focus more on social, environmental and dietarychanges (Welsh et al. 1998). Further, older Australian men are more likely to highlightthe importance of Ôkeeping busyÕ and Ôhaving some purpose in lifeÕ. In contrast, olderwomen appear to share the hope of Ôslowing down moreÕ after being busy with themultiple roles of paid work, household duties, children and grandchildren. Women aremore likely to see Ôrest and relaxationÕ as important for good health (Brown et al. 1999).Men are also more likely than women to consider regular use of cannabis/marijuanaand alcohol to be acceptable (AIHW 1999a).
Younger people are more aware than older people of the importance of fibre in ahealthy diet, and the role of fat and salt in relation to heart disease (Crawford &Baghurst 1990).
01 AH2000 body Page 143 Thursday, June 1, 2000 3:06 PM

144 AustraliaÕs Health 2000
TRIM SIZE 175 mm Wide x 250 mm Deep
3.4 Lifestyle and behaviourDietary behaviourAustraliaÕs Food and Nutrition (AIHW: Lester 1994) described a strong associationbetween dietary behaviour and many chronic diseases. The major causes of death,illness and disability in which diet and nutrition play an important role include coronaryheart disease, stroke, hypertension, atherosclerosis, some forms of cancer, type 2diabetes, osteoporosis, dental caries, gall bladder disease and nutritional anaemias.
Ill health generally cannot be attributed to any one dietary component alone (Ashwell1997). Diseases associated with diet are also associated with environmental,behavioural, biological and genetic factors. The complex relationships between diet,other risk factors and disease make it difficult to assess the contribution of diet to illhealth (AIHW: Lester 1994).
In an optimal diet, the supply of required nutrients is adequate for tissue maintenance,repair and growth. The vitamins, minerals and proteins required to maintain the humanbody in good health can be met only through the intake of a well-balanced, widevariety of food.
The dietary guidelines for Australians recommend consumption of a wide variety ofnutritious food. Essential nutrients for good health are found in varying amountsthroughout many different food groups. Variety in a diet maximises the possibility ofobtaining enough of these essential nutrients.
Table 3.3: Proportion of people who find regular drug use by adults acceptable, 1998 (per cent)
Drug Males Females Persons
Tobacco 41.8 38.6 40.2
Alcohol 67.7 55.1 61.3
Cannabis/marijuana 30.4 20.9 25.6
Pain killers/analgesics(a) 10.3 8.8 9.5
Tranquillisers/sleeping pills(a) 7.2 3.8 5.5
Steroids(a) 3.9 0.9 2.4
Barbiturates(a) 2.7 0.7 1.6
Inhalants 1.7 0.3 1.0
Heroin 2.8 0.8 1.8
Methadone(b) 2.8 0.8 1.8
Amphetamines 4.7 1.7 3.1
Cocaine 3.8 1.1 2.4
Naturally occurring hallucinogens 6.4 2.2 4.3
LSD/synthetic hallucinogens 4.4 1.5 2.9
Ecstasy/designer drugs 5.1 1.5 3.3
(a) Non-medical use.
(b) Non-maintenance.
Source: 1998 National Drug Strategy Household Survey.
01 AH2000 body Page 144 Thursday, June 1, 2000 3:06 PM

3 Determinants of health 145
TRIM SIZE 175 mm Wide x 250 mm Deep
Food variety can be defined as the consumption of foods that are biologically diverse ornutritionally distinct from each other. Data from the 1995 National Nutrition Surveyshowed that the variety of food consumed in Australia increased significantly duringthe 14 years since the previous survey.
More than 90% of Australians reported consuming foods from the Ôcereal and grainsÕand Ômilk productÕ food groups in 1995 (ABS & DHFS 1997). However, over half of themales aged 12Ð44 years and approximately one-third of children aged 4Ð11 years hadnot eaten fruit on the day before the interview.
There is increasing evidence that fresh fruit and vegetable consumption offers protectionagainst cancer, coronary heart disease and stroke (Ness & Powles 1997; NHMRC 1992a;Rimm et al. 1996; Steinmetz & Potter 1996). Previously, five serves of fruit and vegetableswere recommended daily, but in recent years this has been increased to seven serves perday to obtain the best health benefits (Cashel & Jeffreson 1995).
In 1995, the proportion of people aged over 25 years who consumed less than fiveserves of fruit or vegetables per day ranged from a low of 46% for women aged 55Ð64 toa high of 70% for men aged 35Ð44 (ABS & DHFS 1997).
It is estimated that inadequate fruit and vegetable consumption (less than five serves)was responsible for 3% of the total burden of disease and 11% of total cancer burden inAustralia in 1996 (AIHW: Mathers et al. 1999). By comparison, the net harm associatedwith alcohol consumption in 1996 was around 2.2% of the total burden of disease. Theeffects of alcohol consumption on health are discussed elsewhere in this chapter.
Source: 1995 ABS National Nutrition Survey.
Figure 3.1: Saturated fat as a proportion of total energy intake, 1995
BB B
BB
JJ J
J J
16–18 19–24 25–44 45–64 65+0
5
10
15
20Per cent of saturated fat
Age group (years)
B Males
J Females
01 AH2000 body Page 145 Thursday, June 1, 2000 3:06 PM

146 AustraliaÕs Health 2000
TRIM SIZE 175 mm Wide x 250 mm Deep
High intakes of fat, especially saturated fats, are associated with elevated bloodcholesterol levels, overweight and increased death from cardiovascular disease inpopulations where levels of physical activity are low (AIHW 1999c). Total fat (includingsaturated, mono-unsaturated and polyunsaturated) accounts for about 33% of the totalenergy intake of Australian adults. Although total dietary fat intake appears to havedecreased from about 37% in the 1980s, the current level is still above the NHMRCÕsrecommended level of 30% (NHMRC 1991).
Among Australian adults, saturated fat accounts for around 13% of total energy intake(Figure 3.1), higher than the recommended maximum level of 10% (AIHW 1999c). Themajor sources of saturated fatty acids in the adult diet are cheese, butter and margarine,pastries, milk and meat (ABS & DHAC 1998).
High salt consumption in some people is associated with an increase in blood pressureand possibly cardiovascular illness and death. No national data exist to assess levels ofsalt consumption among Australians. However, in one study conducted in Hobart, only6% of men and 36% of women were below the recommended maximum intake of100 mmol/day (Beard et al. 1997).
The recommended dietary intake (RDI) is a level of consumption for each nutrientconsidered to be adequate to maintain good health and prevent deficiency diseases(NHMRC 1991). AustraliaÕs mean nutrient intake from food and beverages, reportedfrom the 1995 National Nutrition Survey, was very close to or exceeded the RDI formost vitamins and minerals in all age groups. The exceptions were calcium for femalesin most age groups and for boys aged 12Ð15 years, zinc for females aged over 12 years,and magnesium for girls aged 16Ð18 years (ABS & DHFS 1997). Calcium is importantfor bone and tooth development and insufficient dietary calcium increases the risk ofdeveloping low bone density and osteoporosis (NHMRC 1999). Zinc and magnesiumare important for immune function, wound healing and muscle growth (Mann &Truswell 1998).
The evidence linking diet with preventable disease is recognised in Australia andinternationally to provide sufficient reason for including improved nutrition as a majorcomponent of public health initiatives (AIHW: Lester 1994). The StrategicIntergovernmental Nutrition Alliance (SIGNAL) was established in 1997 as part of astrategic plan to further the implementation of the National Food and Nutrition Policy(DHCS 1992).
Alcohol consumptionAlcohol consumption is associated with considerable mortality and morbidity in theAustralian community, accounting for an estimated 3,700 deaths in 1997 and almost96,000 hospital episodes in 1996Ð97 (AIHW: Higgins et al. 2000).
It has been estimated that the harm caused by alcohol consumption accounts for 4.9% ofthe total disease burden (AIHW: Mathers et al. 1999). Conditions associated withhazardous and harmful alcohol use include some cancers, liver disease, pancreatitis,diabetes and epilepsy. Alcohol is a significant factor in motor vehicle fatalities andinjuries, and is associated with falls, drowning, burns, suicide and occupational injuries(English et al. 1995).
01 AH2000 body Page 146 Thursday, June 1, 2000 3:06 PM

3 Determinants of health 147
TRIM SIZE 175 mm Wide x 250 mm Deep
However, low to moderate levels of alcohol consumption can protect againsthypertension, ischaemic heart disease, stroke and gallstones. The net harm associatedwith alcohol consumption, after taking into account these benefits, is around 2.2% of thetotal disease burden. The distribution of harm and benefit varies with age. For bothmales and females, the harmful burden of disease is highest in the 15Ð24 years agegroup, and the greatest protective effect is realised in persons over 75 years of age.
There are also social costs to the excessive use of alcohol. In 1998, over one-third ofadult Australians reported being either verbally or physically abused by someoneunder the influence of alcohol (AIHW 1999a). About 1 in 10 persons reported being thevictims of alcohol-related property damage or theft.
Based on results from the 1998 National Drug Strategy Household Survey, about 9 in 10Australians aged 14 years or more had tried an alcoholic drink at some time in theirlives, and around 8 in 10 persons reported drinking in the past 12 months (AIHW 1999a).
Drinking status has remained largely unchanged over the last decade (Figure 3.2), witharound 50% of the population aged 14 years and over drinking regularly, i.e. on at leastone day per week. A further 30% drank on only a few occasions each month, and theremainder either no longer drank alcohol or had never consumed a full glass of alcohol.
Source: National Drug Strategy Household Survey series.
Figure 3.2: Alcohol drinking status, persons aged 14 years and over, 1991 to 1998
0
10
20
30
40
50
60
1990 1991 1992 1993 1994 1995 1996 1997 1998 1999
Per cent
Year
Regular
Occasional
Ex-drinker
Never full glass
01 AH2000 body Page 147 Thursday, June 1, 2000 3:06 PM

148 AustraliaÕs Health 2000
TRIM SIZE 175 mm Wide x 250 mm Deep
Although the drinking status pattern has remained fairly constant, overall levels ofalcohol consumption have decreased. Using apparent consumption data published bythe Australian Bureau of Statistics (ABS), consumption of pure alcohol decreasedmarkedly from 9.7 litres per person in 1981 to 8.2 litres in 1991, and then more slowly to7.6 litres in 1997 (ABS 1998a).
The 1998 National Drug Strategy Household Survey showed that among recentdrinkers (in the last 12 months), 14% of males and 6% of females typically consumedalcohol every day of the week (Table 3.4). Based on NHMRC recommendationsregarding responsible drinking behaviour (NHMRC 1992b), at least 8% of adult maledrinkers and 4% of females usually drank at levels considered to be hazardous orharmful to health (AIHW: Higgins et al. 2000).
Internationally, Australia ranked 19th in 1997Ð98 for per capita consumption of alcohol(total pure alcohol), at 7.6 litres per person (Productschap voor Gedistilleerde Dranken1999). This figure is made up from 94.5 litres of beer per person (for which Australiaranked 9th), 19.7 litres of wine per person (ranked 18th) and 1.3 litres per person of purealcohol from spirits (ranked 35th).
Tobacco smokingOf all risk factors for disease, tobacco smoking is responsible for the greatest burden onthe health of Australians. It is estimated that in 1996 tobacco smoking was responsiblefor about 12% of the total burden of disease in males and 7% in females (AIHW:Mathers et al. 1999).
Table 3.4: Alcohol consumption patterns, recent drinkers aged 14 years and over, 1998 (per cent)
Frequency
Quantity (standard drinks)
1–2 3–4 5–6 7 or more Total
Males
Every day 4 5 3 2 14
4–6 days/week 5 6 3 3 17
2–3 days/week 6 7 4 6 23
1 day/week 3 6 3 4 16
Less often 17 6 2 3 30
Total 36 31 15 18 100
Females
Every day 4 2 1 — 6
4–6 days/week 6 3 — — 10
2–3 days/week 9 4 1 2 16
1 day/week 8 4 2 2 17
Less often 35 9 3 2 50
Total 62 22 8 7 100
Note: ‘Recent’ refers to the last 12 months.
Source: National Drug Strategy Household Survey 1998.
01 AH2000 body Page 148 Thursday, June 1, 2000 3:06 PM

3 Determinants of health 149
TRIM SIZE 175 mm Wide x 250 mm Deep
Tobacco smoking increases the risk of coronary heart disease, stroke and peripheralvascular disease as well as a range of cancers and other diseases and conditions. It isresponsible for around 85% of new cases of lung cancer annually (DHFS & AIHW 1998).Approximately 13% of deaths from cardiovascular disease and 21% of deaths fromcancer are due to smoking tobacco (AIHW 1996). It is estimated that smoking tobaccowas associated with almost 150,000 hospitalisations in Australia in 1998 (AIHW 1999a).
From data collected in the 1995 National Health Survey it is estimated that almost3.2 million adult Australians were at risk of developing heart disease and other chronicconditions from smoking tobacco products (AIHW 1999c). About 27% of men and 20%of women aged 18 years and over were smokers. Highest rates of smoking were foundamong men (34%) and women (28%) aged 25Ð34 years. After 34 years of age, the rate ofsmoking declined with increasing age to be lowest among men and women aged75 years and over (Figure 3.3).
In 1995, the proportion of ex-smokers in Australia was 32% for men and 23% forwomen. The proportion of people reporting to have never smoked was 40% for menand 57% for women (AIHW 1999c).
Source: ABS National Health Survey 1995.
Figure 3.3: Proportion of adults who are current smokers, 1995
18–24 25–34 35–44 45–54 55–64 65–74 75+0
5
10
15
20
25
30
35
Per cent
Age
Men
Women
01 AH2000 body Page 149 Thursday, June 1, 2000 3:06 PM

150 AustraliaÕs Health 2000
TRIM SIZE 175 mm Wide x 250 mm Deep
Male adult smoking rates have been declining since the 1960s, while among womensmoking rates began to decline in the late 1970s. However, national surveys by the Anti-Cancer Council of Victoria show that the rate of decline of current smokers has slowedin more recent years (Hill, White & Scollo 1998) (Figure 3.4).
From data collected in a national survey of secondary students, it is estimated that morethan 276,000 aged 12Ð17 years were current smokers in 1996. It has been estimated thatapproximately 70,000 take up smoking each year (Hill, White & Letcher 1999). Thesmoking rate for those aged 12Ð15 years in 1996 was 16% for both boys and girls, withthe rate rising to 28% among boys aged 16Ð17 years and 32% among girls aged16Ð17 years (Figure 3.5).
There was a decline in current smoking rates for students aged 12Ð17 years from 1984through to 1990, but this decline has since ceased.
The 1998 National Drug Strategy Household Survey (AIHW 1999a) measured tobaccoconsumption patterns among Australians. The average number of cigarettes smokedper week by adult male and female smokers was 101 and 100 respectively.
The average number of cigarettes smoked per week by teenagers (aged between 14 and19 years) was 60 for males and 57 for females (AIHW 1999a).
Source: Hill, White & Gray 1988, 1991; Hill & White 1995; Hill, White & Scollo 1998.
Figure 3.4: Proportion of adults who are current smokers, 1974 to 1995
1974 1976 1980 1983 1986 1989 1992 19950
5
10
15
20
25
30
35
40
45
50
Per cent
Year
Males
Females
01 AH2000 body Page 150 Thursday, June 1, 2000 3:06 PM
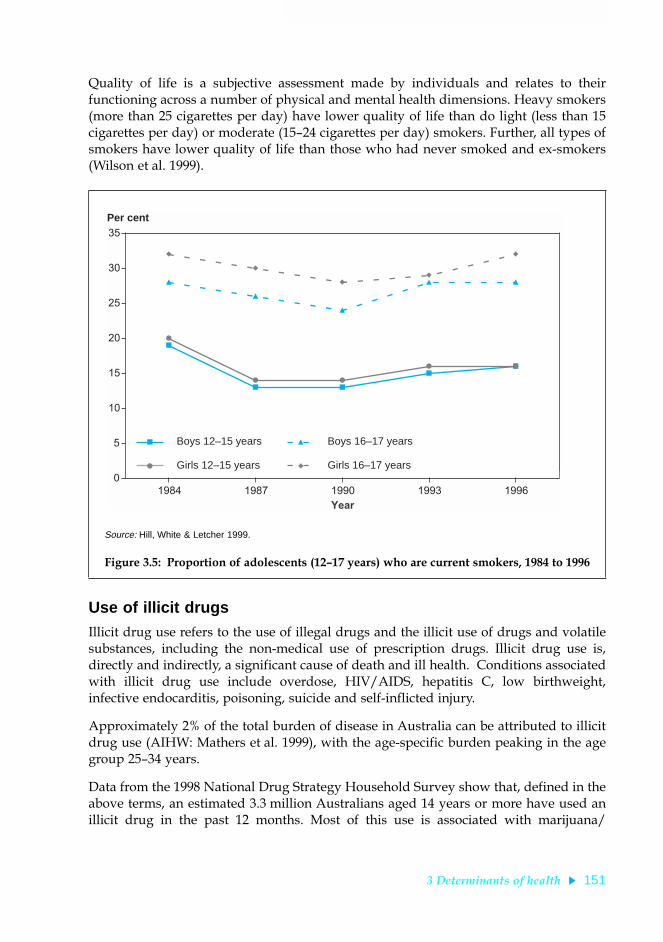
3 Determinants of health 151
TRIM SIZE 175 mm Wide x 250 mm Deep
Quality of life is a subjective assessment made by individuals and relates to theirfunctioning across a number of physical and mental health dimensions. Heavy smokers(more than 25 cigarettes per day) have lower quality of life than do light (less than 15cigarettes per day) or moderate (15Ð24 cigarettes per day) smokers. Further, all types ofsmokers have lower quality of life than those who had never smoked and ex-smokers(Wilson et al. 1999).
Use of illicit drugsIllicit drug use refers to the use of illegal drugs and the illicit use of drugs and volatilesubstances, including the non-medical use of prescription drugs. Illicit drug use is,directly and indirectly, a significant cause of death and ill health. Conditions associatedwith illicit drug use include overdose, HIV/AIDS, hepatitis C, low birthweight,infective endocarditis, poisoning, suicide and self-inflicted injury.
Approximately 2% of the total burden of disease in Australia can be attributed to illicitdrug use (AIHW: Mathers et al. 1999), with the age-specific burden peaking in the agegroup 25Ð34 years.
Data from the 1998 National Drug Strategy Household Survey show that, defined in theabove terms, an estimated 3.3 million Australians aged 14 years or more have used anillicit drug in the past 12 months. Most of this use is associated with marijuana/
Source: Hill, White & Letcher 1999.
Figure 3.5: Proportion of adolescents (12Ð17 years) who are current smokers, 1984 to 1996
B
B B
BB
J
J J
J J
H
H
H
H H
F
F
FF
F
1984 1987 1990 1993 19960
5
10
15
20
25
30
35
Per cent
Year
B Boys 12–15 years
J Girls 12–15 years
H Boys 16–17 years
F Girls 16–17 years
01 AH2000 body Page 151 Thursday, June 1, 2000 3:06 PM

152 AustraliaÕs Health 2000
TRIM SIZE 175 mm Wide x 250 mm Deep
cannabis (around 2.7 million persons). It is estimated that in 1997, over 800 people diedfrom illicit drug-related causes, and in 1996Ð97 there were over 11,000 hospital episodesrelated to the use of illicit drugs (AIHW 1999a).
Although estimates of low-prevalence behaviours are subject to high relative standarderrors, it appears that illicit drug use is generally increasing (Table 3.5). An exception isthe non-medical use of barbiturates, which is declining, due apparently to increasedrestrictions on access to this class of drugs. As noted above, marijuana/cannabis usecontinues to dominate among the drugs surveyed: in 1998 almost two-fifths of thepopulation aged 14 years and over had tried using marijuana/cannabis at some time intheir life, and almost one-fifth had used the drug in the past 12 months. Use of this drugin 1998 increased from previous years, and there was an associated increase incommunity acceptance of its regular use by adults (AIHW 1999a).
In 1998, with the exception of tranquillisers, recent use by males exceeded that of femalesfor all the substances included in the survey (Figure 3.6), and this reflected the patternfor lifetime use. However, between 1995 and 1998, illicit drug use among young females(aged 14Ð19) increased markedly (particularly for marijuana/cannabis), and use of illicitdrugs among young males remained relatively stable. This has led to a convergence inthe overall prevalence of illicit drug use between young males and females.
Injection of illicit drugs and non-prescribed pharmaceuticals can have significantadverse health effects, including drug overdose, acquiring of blood-borne infections(such as with HIV or hepatitis C virus (HCV)), and other illnesses from the injection ofcontaminants or impure substances. It is estimated that there were around 108,000injecting drugs users in 1998 (AIHW 1999a).
Table 3.5: Summary of illicit drug use, persons aged 14 years and over, 1991Ð98 (per cent)
Substance
Ever used Recently used (a)
1991 1993 1995 1998 1991 1993 1995 1998
Amphetamines(b) 8 8 6 9 3 2 2 4
Barbiturates(b) (c) 4 1 2 (c) — — —
Cocaine 3 2 3 4 1 1 1 1
Ecstasy 2 3 2 5 1 1 1 2
Hallucinogens 7 7 7 10 2 1 2 3
Heroin 2 2 1 2 1 — — 1
Inhalants 3 4 2 4 1 1 — 1
Injected drugs 2 2 1 2 1 1 1 1
Marijuana/cannabis 32 34 31 39 13 13 13 18
Pain killers(b) (c) 3 12 12 (c) 2 3 5
Steroids(b) n.a. 3 1 1 n.a. — — —
Tranquillisers (c) 3 3 6 (c) 1 1 3
(a) Used in the last 12 months.
(b) For non-medical purposes.
(c) Data for 1991 not comparable to other years.
Sources: National Campaign Against Drug Abuse Household Survey 1991; National Drug Strategy Household Survey 1993, 1995, 1998.
01 AH2000 body Page 152 Thursday, June 1, 2000 3:06 PM

3 Determinants of health 153
TRIM SIZE 175 mm Wide x 250 mm Deep
In a 1998 survey of injecting drug users who visited needle and syringe exchanges,2% tested positive for HIV antibodies and 49% of the surveyed users tested positive tothe HCV antibody. Prevalence of the antibodies is highly correlated with the length ofinjecting drug-use history (Table 3.6).
(a) For non-medical purposes.
(b) Non-maintenance.
Note: ‘Recent use’ = use within the last 12 months.
Source: 1998 National Drug Strategy Household Survey.
Figure 3.6: Recent use of selected illicit drugs, persons aged 14 years and over, 1998
Table 3.6: Prevalence of HIV and HCV antibodies among injecting drug users(a), 1998 (per cent)
History of injecting drug use
Tested positive to HIV antibody Tested positive to HCV antibody
Males Females Persons Males Females Persons
Less than 3 years 1 1 1 15 20 17
3 to 5 years 2 — 1 25 34 29
6 or more years 2 1 2 63 73 66
Not reported 3 — 2 49 55 52
Total 2 1 2 47 53 49
(a) Survey of users attending 32 needle and syringe program sites.
Source: NCHECR 1999.
Tranquillisers (a)
Steroids(a)
Pain killers(a)
Methadone(b)
Marijuana
Hallucinogens
Injected drugs
Inhalants
Heroin
Ecstasy
Cocaine
Barbiturates(a)
Amphetamines(a)
0 5 10 15 20 25Proportion of persons aged 14 years and over (per cent)
Males
Females
01 AH2000 body Page 153 Thursday, June 1, 2000 3:06 PM

154 AustraliaÕs Health 2000
TRIM SIZE 175 mm Wide x 250 mm Deep
Using data from the National HIV Database, approximately 8% of HIV diagnoses inAustralia have been in people with a history of injecting drug use, of whom half weremen who also reported homosexual contact (NCHECR 1999).
Physical inactivityPhysical inactivity is a major determinant of ill health and the effects of physical activityon reducing the risk of mortality from all causes are well documented for people at alllife stages (Mensink et al. 1999). According to recent estimates, physical inactivity isresponsible for about 7% of the total burden of disease in Australia (AIHW: Matherset al. 1999).
Studies show that participation in physical activity is associated with the prevention ofcardiovascular disease. People who do not participate in regular moderate physicalactivity are about twice as likely to suffer a cardiovascular condition compared withthose who participate (Blair et al. 1996).
Physical inactivity is associated with other risk factors for cardiovascular disease suchas overweight, high blood pressure and high blood cholesterol. People who increasetheir levels of physical activity will reduce their levels of these risk factors (Bauman &Owen 1999; United States Department of Health and Human Services 1996).
Participation in physical activity reduces the risk of developing colon cancer (Martinezet al. 1997), and emerging evidence suggests it provides a protective effect for breastcancer, especially among postmenopausal women (Sesso et al. 1997), and for lungcancer (Lee et al. 1999).
Participation in physical activity is associated with a reduced risk of developingdiabetes (Hu et al. 1999) and improvements in musculoskeletal health. Further, studieshave shown the benefits of physical activity on mental health (Chen & Millar 1999).
Currently, no nationally accepted uniform procedures exist for the collection andanalysis of data on physical activity in Australia. The development of an appropriate toolto measure the physical activity among populations is a challenging task. Physicalactivity (any bodily movement produced by skeletal muscles that results in energyexpenditure) for health benefit comprises several components (e.g. intensity, frequency,duration) that can be carried out in different settings (e.g. leisure time, occupational,transport). Measurement is further complicated because there are several dimensions ofphysical activity related to health such as energy expenditure, aerobic intensity, strengthand flexibility. For example, physical activity for the prevention of cardiovascular diseaseis different from that required for prevention of musculoskeletal problems.
The 1997 Active Australia National Physical Activity Survey indicated that 50% of menand 49% of women aged 18Ð75 years undertook physical activity at a level which wasbeneficial to health. This level was defined as participation in at least 150 minutesactivity of at least moderate intensity, spread over five sessions per week. In general,physical activity levels decline with increasing age (Figure 3.7).
The National Health Survey shows that the proportion of people doing no physicalactivity during their leisure time decreased only slightly between 1989Ð90 and 1995from 36% to 34%. This decline was due mainly to an increase in physical activity amongpeople aged 35Ð54 years (AIHW 1999c).
01 AH2000 body Page 154 Thursday, June 1, 2000 3:06 PM

3 Determinants of health 155
TRIM SIZE 175 mm Wide x 250 mm Deep
Walking increased in popularity during the 1990s with 45% of men and 53% of womenwalking for recreation or exercise in 1995, compared with 41% and 49%, respectively, in1989Ð90. Despite this increase, the overall proportions of people undertaking physicalactivity at moderate intensities did not change between 1989Ð90 and 1995, suggesting thatwalking may have replaced other forms of moderate physical activity (Armstrong 1998).
In an effort to increase physical activity participation rates, a national participationstrategy, Active Australia, has been established. Active Australia represents the interestsof Commonwealth and State government agencies, including the sport, health andfitness sectors. The sports and physical activities that attracted most participants in1998Ð99 were walking (23%), swimming (15%), aerobics (11%), golf (9%) and tennis(6%). Participation in organised sport and physical activity has increased from around27% in 1996Ð97 to 30% in 1998Ð99 (ABS 1999a).
Sun exposureAustralia has the highest incidence of skin cancer in the world (DHFS & AIHW 1998).Skin cancer is the most common cancer in Australia and can largely be prevented bytaking simple measures such as wearing protective clothing, applying sunscreens oravoiding the sun. Childhood exposure to sunlight has been shown to be an importantcause of skin cancer (NHMRC 1996).
Source: 1997 Active Australia National Physical Activity Survey 1997.
Figure 3.7: People who are sufficiently active for health, 1997
18–29 30–44 45–59 60–75 18–750
10
20
30
40
50
60
70Per cent
Age group (years)
Males Females
01 AH2000 body Page 155 Thursday, June 1, 2000 3:06 PM

156 AustraliaÕs Health 2000
TRIM SIZE 175 mm Wide x 250 mm Deep
The 1995 National Health Survey found that 77% of the population were protected fromexposure to the sun, by always or usually taking some sun protection measure, or bynot going out in the sun (Figure 3.8). The most protected group were young children, ofwhom 96% aged under 2 years and 92% of those aged 2Ð4 years were protected or notexposed to the sun. Only 69% of persons aged 15Ð24 years used sun protection or werenot exposed to the sun. Overall, 23% of the population never, seldom or only sometimesused any protection from exposure to the sun.
Some issues that can influence the accuracy of the survey results are discussed in Box 3.4.
In general, the type of sun protection used varied with age (Table 3.7). Hats followed bysunscreen and clothing were the most common types of protection used by children0Ð14 years. For people aged 15Ð54 years, the most common type of protection wassunglasses followed by hats and sunscreen. Those aged 55 years and over tended toprefer hats, with sunglasses and sunscreen as the next most frequently mentionedprotection measure taken.
Although there are no national trend data, results from surveys in Victoria and NewSouth Wales suggest that the use of sun protective measures has been rising. Data froma series of sun behaviour surveys in Victoria show a rise in the use of sunscreen inpeople exposed to the sun between 11 a.m. and 3 p.m. on Sundays in the summermonths, from 19% in 1988 to 34% in 1995 (Hill & Boulter 1996). Further, the proportion
Note: See Box 3.4 for comment on the accuracy of the estimates.
Source: 1995 National Health Survey.
Figure 3.8: Use of sun protection measures, 1995
0–1 2–4 5–14 15–24 25–34 35–44 45–54 55–64 65–74 75+ All ages0
20
40
60
80
100Per cent
Age group (years)
Don't go inthe sun
Always
Usually
Sometimes
Never/seldom
Frequency of sunprotection use
01 AH2000 body Page 156 Thursday, June 1, 2000 3:06 PM

3 Determinants of health 157
TRIM SIZE 175 mm Wide x 250 mm Deep
of people who wore a brimmed hat between 11 a.m. and 3 p.m. on the previous Sundayrose from 9% in 1988 to 20% in 1995. A similar trend was observed in New South Wales:in a survey of high school adolescents the percentage using high-level sun protection,measured by a score based on protection by a hat, clothing or SPF 15+ sunscreen,increased from 39% in 1991Ð92 to 57% in 1994Ð95 (Armstrong 1996). Over this periodthere was an associated decline in attitudinal and normative beliefs favourable togetting suntanned: the percentage of people who believed that a suntanned person ismore healthy declined from 17% in 1988 to 8% in 1995.
Vaccination statusImmunisation is the administration of vaccine(s) to prevent disease and so reduce deathand serious illnesses, particularly in infants and children but also in adults. The potentialrisks of immunisation are much lower than the risks or complications from thesediseases. Immunisation is recognised as a key cost-effective public health program(Freeman & Robbins 1994).
Table 3.7: Type of sun protection used, by age group, 1995 (per cent)
Age group Sunscreen Umbrella Hat Clothing Sunglasses Avoid sun Other
0–1 49 9 63 49 8 39 3
2–4 69 6 84 55 22 31 1
5–14 65 3 81 48 22 20 —
15–24 46 2 48 42 56 21 —
25–34 46 4 51 40 67 27 1
35–44 44 5 54 34 67 27 1
45–54 37 5 55 29 59 22 1
55–64 32 5 57 24 49 19 —
65–74 31 8 60 22 39 20 1
75 and over 22 8 57 17 30 19 1
Total 45 5 59 36 49 23 1
Source: 1995 National Health Survey.
Box 3.4: Accuracy of sun protection estimatesRespondents in the 1995 National Health Survey were asked what protective measures theydeliberately take when they go out in the sun. Such questions can result in over-estimates ofactual behaviour as respondents tend to report what they like to do rather than what theyactually did (Borland 1996).
It was not possible to conduct personal interviews with persons in some age groups: a parentor a responsible adult was interviewed on behalf of all children aged 0Ð14 years and thosechildren aged 15Ð17 years where permission to interview them personally was not given.
The question listed various sun protective items, but it implied the use of hats, clothing orsunglasses to be for sun protection.
01 AH2000 body Page 157 Thursday, June 1, 2000 3:06 PM

158 AustraliaÕs Health 2000
TRIM SIZE 175 mm Wide x 250 mm Deep
The effectiveness of immunisation was first demonstrated by Dr Edward Jenner some200 years ago with his experiments with vaccination against smallpox. Since then, thenumber of vaccines has grown and the role of immunisation has expanded significantly.In the early 1970s the World Health Organization (WHO) Expanded Programme onImmunization set as a goal the universal immunisation of children against diphtheria,pertussis, tetanus, tuberculosis, poliomyelitis and measles. Goals were also set for theeradication through immunisation of smallpox (achieved in 1977), poliomyelitis(currently under way) and measles (a future possibility) (Plotkin & Orstein 1999).
In Australia, vaccine-preventable diseases are still responsible for serious illness andoccasional death (Carnie 1997). The schedule of age-appropriate immunisations is setout in the Australian Immunisation Handbook (NHMRC 1997, 2000).
There have been a number of government strategies and programs to improveimmunisation coverage in Australia. These include the National Immunisation Strategyreleased in 1993 (NHMRC 1993), the Immunise Australia: Seven Point Plan announcedin February 1997, including the GP Immunisation Incentives Program from mid-1998,the Australian Childhood Immunisation Register (ACIR) begun in 1996 (NationalChildhood Immunisation Committee 1996), and most recently the Measles ControlCampaign (MCC). The effectiveness of these programs will ultimately be measured bythe extent of immunisation coverage and the number of new cases (incidence) ofvaccine-preventable diseases.
Immunisation coverageImmunisation coverage in Australia has been estimated in a number of ways includingspecial surveys through the State and Territory Public Health Departments, academicorganisations, ABS and other organisations (Lister et al. 1999). More recently theimplementation of the ACIR has provided a means of measuring immunisationcoverage at a national level for vaccines on the standard national childhood vaccinationschedule. There is an ongoing use of surveys for vaccine-preventable diseases for otherage groups and checks of validity of the ACIR data.
The ACIR was set up as a part of the National Childhood Immunisation Program tocollect immunisation-coverage information for Australian children under 7 years of ageregistered with Medicare since January 1996. The ACIR performs a number offunctions, including the collection of information from providers, provision ofimmunisation information for parents, and administration of a recall or remindersystem for parents. The ACIR also provides regular reports on immunisation coverageat national, State/Territory or local level for public health authorities (NationalChildhood Immunisation Committee 1996).
Since 1997 and as part of the Immunise Australia program, a number of initiatives havebeen introduced to improve both immunisation uptake and notification of encounters.Schemes to encourage parent compliance with the Australian Standard VaccinationSchedule have included the linkage of immunisation status to the CommonwealthChild Care Rebate scheme (with the accompanying history form), the ChildcareAssistance scheme, and the Maternity Immunisation Allowance. The General PracticeImmunisation Incentives scheme encourages participation by general practitioners inthe delivery of immunisation and reporting to ACIR of immunisation-encounter details.
01 AH2000 body Page 158 Thursday, June 1, 2000 3:06 PM

3 Determinants of health 159
TRIM SIZE 175 mm Wide x 250 mm Deep
ACIR coverage results are reported for birth cohorts at 1 and 2 years of age andexpressed as the percentage of children immunised (OÕBrien et al. 1998). The firstcoverage estimates for children at age 1 year were published in March 1998 for thecohort born between 1 January 1996 and 31 March 1996 (OÕBrien et al. 1998).Subsequent reports have been published on a quarterly basis and have shown aprogressive increase in coverage. The most recent report of immunisation coveragefound that for those aged 1 year (cohort born between 1 July 1998 and 30 September1998) 87% were fully immunised (Table 3.8) and for those aged 2 (cohort born in the3-month period between 1 July 1997 and 30 September 1997) 74.9% were fullyimmunised (Table 3.9) (Communicable Diseases Network 2000).
Table 3.8: Proportion of children immunised at 1 year of age, preliminary results by disease and State for the birth cohort 1 July to 30 September 1998
NSW Vic Qld WA SA Tas ACT NT Aust
Number of children 22,272 15,770 12,347 6,311 4,730 1,661 1,065 848 65,004
Diphtheria, tetanus and pertussis (%) 86.5 89.1 90.5 87.3 89.0 89.3 90.0 86.9 88.3
Poliomyelitis (%) 86.6 89.1 90.5 87.3 89.0 89.3 90.0 86.9 88.3
Haemophilus influenzae type b (%) 85.7 88.6 90.6 86.9 88.6 88.7 90.2 88.9 87.9
Fully immunised (%) 84.7 88.0 89.9 85.9 88.0 88.2 89.8 83.8 87.0
Change in fully immunised since last quarter (%) +0.5 +0.3 +1.5 –0.3 –1.0 +1.2 +0.8 +0.9 +0.5
Source: Australian Childhood Immunisation Register.
Table 3.9: Proportion of children immunised at 2 years of age, preliminary results(a) by disease and State for the birth cohort 1 July to 30 September 1997
NSW Vic Qld WA SA Tas ACT NT Aust
Number of children 22,876 15,840 12,688 6,516 4,778 1,605 1,073 924 66,300
Diphtheria, tetanus and pertussis (%) 81.4 83.5 84.9 81.2 84.6 82.1 87.2 75.9 82.8
Poliomyelitis (%) 81.4 83.6 84.9 81.2 84.6 82.1 87.2 75.9 82.8
Haemophilus influenzae type b (%) 80.5 83.2 85.3 80.9 83.9 80.4 86.8 81.2 82.4
Measles, mumps andrubella (%) 87.2 90.5 90.2 87.5 91.0 88.8 91.1 86.3 89.0
Fully immunised (%) 71.0 76.8 79.4 73.0 77.8 74.0 82.9 69.6 74.9
Change in fully immunised since last quarter (%) –1.2 –0.5 –1.7 –0.4 +1.0 –3.1 –0.9 +2.5 –1.0
(a) The proportions shown as ‘fully immunised’ appear low when compared with the proportions for individual vaccines. This is at least partly due to poor identification of children on immunisation encounter forms.
Source: Australian Childhood Immunisation Register.
01 AH2000 body Page 159 Thursday, June 1, 2000 3:06 PM

160 AustraliaÕs Health 2000
TRIM SIZE 175 mm Wide x 250 mm Deep
Measles as an example of the effectiveness of immunisationMeasles is often a severe disease, sometimes complicated by otitis media (2.5% of cases)and bronchopneumonia (4%). Acute encephalitis occurs in a small number of reportedcases and has a mortality of 10Ð15%, and 15Ð40% of survivors have permanent braindamage. Subacute sclerosing panencephalitis is a late complication of measles (occurringin about 1 in 25,000 cases) that causes progressive brain damage and is always fatal(NHMRC 1997).
The measles vaccine was first licensed in Australia in 1968 and was in routine use by theearly 1970s, but coverage estimates from this time are not available. The introduction ofthe measles vaccine resulted in a decrease in the number of measles cases, the number ofadmissions to hospital for measles and the number of deaths due to measles (Figure 3.9).However, measles epidemics continued to occur. In 1993 and 1994, a large epidemic ofmeasles affected Australia with over 9,000 notified cases (Figure 3.10) and a peak in thenumber of hospitalisations at about 1,100 (MEAC 2000a). A second dose of measlesvaccination for those aged 10Ð16 years was implemented in 1994 by States andTerritories but coverage estimates from this time are not available. Since then, thenumber of notified cases has decreased (Figure 3.10). Measles is now a notifiable diseasein all States and Territories.
Source: AIHW National Mortality Database.
Figure 3.9: Deaths due to measles, 1964 to 1998
1964 1967 1970 1973 1976 1979 1982 1985 1988 1991 1994 19970
5
10
15
20
25
30
35Number of deaths
Year
01 AH2000 body Page 160 Thursday, June 1, 2000 3:06 PM

3 Determinants of health 161
TRIM SIZE 175 mm Wide x 250 mm Deep
A further epidemic of measles was predicted for 1998 from serological surveys in NewSouth Wales and South Australia that showed gaps in levels of immunity (Forrest et al.1998). A set of recommendations was developed to prevent the predicted epidemic.The NHMRC recommended in 1998 that the second dose of the measles, mumps andrubella vaccine should be given to children when aged 4Ð5 years rather than at age10Ð16 years. The change in scheduling was to minimise the susceptible population byshortening the interval between the first and second dose from 10 years to 3 years. Morerecently, the recommendation for the second dose has been updated to 4 years. TheMCC followed this decision to ensure that all school children aged 5Ð12 years receivedtheir second dose.
The MCC was conducted from August to November 1998 with primary school childrenthe main target for measles immunisation. About 96% (1.7 million) of all primary schoolchildren were vaccinated, with about 1.3 million vaccinated in the school program(MEAC 2000b). Overall, the MCC resulted in increased protection against measles. Aserosurvey conducted after the MCC showed that 94% of children aged 6Ð12 years wereserologically immune compared to 84% before the MCC (MEAC 2000b). The impact ofthe MCC on notifications of measles cases is shown in Figure 3.10. It was estimated that17,500 cases of measles were averted (MEAC 2000b). The national immunisation coveragefor measles, mumps and rubella vaccine measured by ACIR has increased from 82.5% forthe first 2-year cohort of children born between 1 January 1996 and 31 March 1996(Communicable Diseases Network 1998) to 89% for the 2-year cohort for children bornbetween 1 July 1996 and 30 September 1996 (Communicable Diseases Network 2000).
Source: National Notifiable Diseases Surveillance System.
Figure 3.10: Measles notifications, by month, January 1991 to January 2000
Jan.91
Jan.92
Jan.93
Jan.94
Jan.95
Jan.96
Jan.97
Jan.98
Jan.99
Jan.00
0
200
400
600
800
1,000
1,200Number of notifications
Month of onset
Measles ControlCampaign
01 AH2000 body Page 161 Thursday, June 1, 2000 3:06 PM
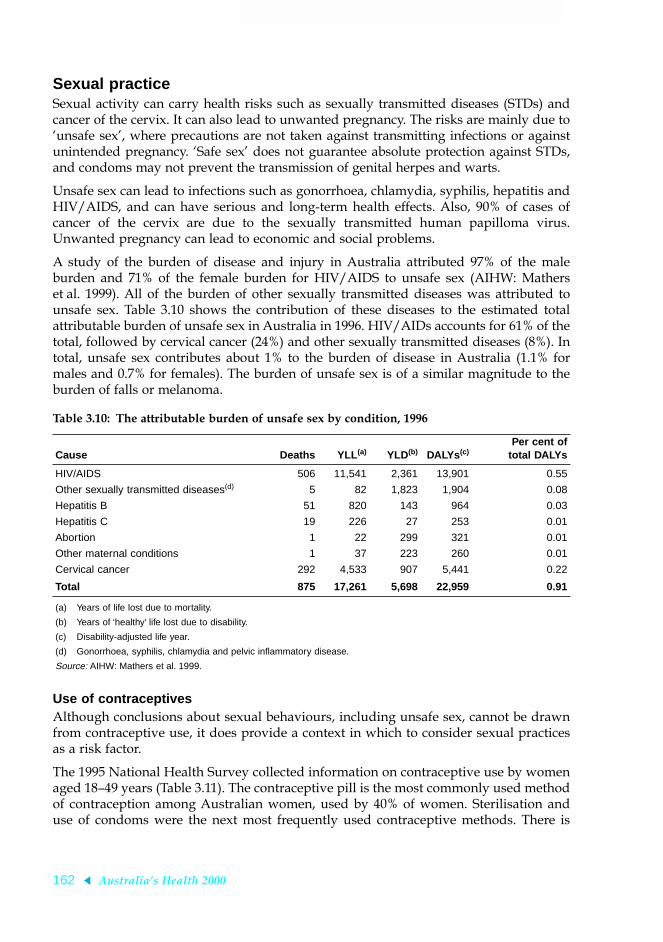
162 AustraliaÕs Health 2000
TRIM SIZE 175 mm Wide x 250 mm Deep
Sexual practiceSexual activity can carry health risks such as sexually transmitted diseases (STDs) andcancer of the cervix. It can also lead to unwanted pregnancy. The risks are mainly due toÔunsafe sexÕ, where precautions are not taken against transmitting infections or againstunintended pregnancy. ÔSafe sexÕ does not guarantee absolute protection against STDs,and condoms may not prevent the transmission of genital herpes and warts.
Unsafe sex can lead to infections such as gonorrhoea, chlamydia, syphilis, hepatitis andHIV/AIDS, and can have serious and long-term health effects. Also, 90% of cases ofcancer of the cervix are due to the sexually transmitted human papilloma virus.Unwanted pregnancy can lead to economic and social problems.
A study of the burden of disease and injury in Australia attributed 97% of the maleburden and 71% of the female burden for HIV/AIDS to unsafe sex (AIHW: Matherset al. 1999). All of the burden of other sexually transmitted diseases was attributed tounsafe sex. Table 3.10 shows the contribution of these diseases to the estimated totalattributable burden of unsafe sex in Australia in 1996. HIV/AIDs accounts for 61% of thetotal, followed by cervical cancer (24%) and other sexually transmitted diseases (8%). Intotal, unsafe sex contributes about 1% to the burden of disease in Australia (1.1% formales and 0.7% for females). The burden of unsafe sex is of a similar magnitude to theburden of falls or melanoma.
Use of contraceptivesAlthough conclusions about sexual behaviours, including unsafe sex, cannot be drawnfrom contraceptive use, it does provide a context in which to consider sexual practicesas a risk factor.
The 1995 National Health Survey collected information on contraceptive use by womenaged 18Ð49 years (Table 3.11). The contraceptive pill is the most commonly used methodof contraception among Australian women, used by 40% of women. Sterilisation anduse of condoms were the next most frequently used contraceptive methods. There is
Table 3.10: The attributable burden of unsafe sex by condition, 1996
Cause Deaths YLL (a) YLD(b) DALYs (c)Per cent of
total DALYs
HIV/AIDS 506 11,541 2,361 13,901 0.55
Other sexually transmitted diseases(d) 5 82 1,823 1,904 0.08
Hepatitis B 51 820 143 964 0.03
Hepatitis C 19 226 27 253 0.01
Abortion 1 22 299 321 0.01
Other maternal conditions 1 37 223 260 0.01
Cervical cancer 292 4,533 907 5,441 0.22
Total 875 17,261 5,698 22,959 0.91
(a) Years of life lost due to mortality.
(b) Years of ‘healthy’ life lost due to disability.
(c) Disability-adjusted life year.
(d) Gonorrhoea, syphilis, chlamydia and pelvic inflammatory disease.
Source: AIHW: Mathers et al. 1999.
01 AH2000 body Page 162 Thursday, June 1, 2000 3:06 PM

3 Determinants of health 163
TRIM SIZE 175 mm Wide x 250 mm Deep
variation in contraceptive use across age groups. Among younger women, thecontraceptive pill and condoms were most commonly used, but use of these diminishedwith age. Sterilisation was the most frequently reported method of contraceptionamong women aged over 40 years.
Table 3.11: Type of contraception used by women aged 18Ð49 years, 1995 (per cent)
Method
Age of users (years)
18–19 20–24 25–29 30–34 35–39 40–44 45–49 Total
Contraceptive pill 66.3 71.1 59.2 43.0 31.3 16.9 10.1 40.0
Condom 32.2 21.6 27.0 21.2 13.9 10.5 7.2 17.6
IUD — 2.1 — 2.8 3.1 6.1 2.8 3.0
Periodic abstinence — — 3.6 4.2 3.9 3.0 2.4 3.0
Other temporary method — 2.6 2.4 3.9 3.7 2.1 — 2.6
Female sterilisation — — 3.6 10.7 21.6 36.1 49.9 19.2
Male sterilisation — — 2.8 14.2 22.4 25.3 25.8 14.5
Number using contraception 111,300 441,100 428,600 453,700 476,500 448,200 392,600 2,757,900
Users as a proportion of all women 49.7 65.7 64.5 65.4 71.6 71.8 67.4 66.7
Source: ABS 1998b.
Source: ABS 1998b.
Figure 3.11: Use of the contraceptive pill, 1983, 1989 and 1995
18–19 20–24 25–29 30–34 35–39 40–44 45–490
10
20
30
40
50
60Per cent
Age group (years)
1983
1989
1995
01 AH2000 body Page 163 Thursday, June 1, 2000 3:06 PM

164 AustraliaÕs Health 2000
TRIM SIZE 175 mm Wide x 250 mm Deep
Data on the use of the pill can be compared for 1983, 1989 and 1995 (Figure 3.11,page 163). The proportion of women aged 18Ð49 years using the pill increased from 24%in 1983 to 28% in 1989 but changed little to 1995 (27%). The highest usage continues tobe in the age group 20Ð24 years.
It is estimated that over 85% of all HIV infection in Australia has been transmitted byunsafe sexual contact between men (NCHECR 1999). Of men who have sex with men,the percentage engaging in unprotected anal intercourse is the principal indicator ofunsafe sexual behaviour. Surveys in Sydney during the 1990s found that, of men whohave sex with men, around 30% reported unprotected anal sex with regular partners inthe previous 6 months. Around 15% reported unprotected anal sex with casual partnersin the previous 6 months. Surveys carried out in other capital cities show similar levelsof unsafe sexual behaviour (NCHECR 1999).
3.5 Biomedical factorsBody weightThe association between overweight or obesity and health problems such as coronaryheart disease, stroke, heart failure, type 2 diabetes, osteoarthritis, sleep apnoea, gallstones,and reproductive problems among women is well documented (NHLBI 1998).Overweight and obesity accounted for over 4% of the total burden of disease in Australiain 1996 (AIHW: Mathers et al. 1999).
Being underweight is also associated with poor health, including conditions such asosteoporosis, ulcers, mental conditions such as depression and eating disorders(Gilmore 1999).
Inappropriate body weight is due mainly to an imbalance between energy intake (diet)and energy expenditure (physical activity). Other factors, including genetics andenvironment, also play a role (Pi-Sunyer 1993).
Among those who are overweight, weight loss reduces the incidence and severity ofhigh blood pressure, high blood cholesterol, diabetes and osteoarthritis (NHLBI 1998).
Body mass index (BMI) is used to estimate the prevalence of underweight, normalweight, overweight and obesity in a population.
In 1995, just over 7.4 million adult Australians (56% of those aged 18 years and over)were overweight or obese (BMI ≥ 25). Of these, over 2.4 million (or 19% of the adultpopulation) were obese (BMI ≥ 30). Men were more likely to be overweight or obesethan were women, 64% compared with 49%. The proportion of overweight or obesepeople increased with age and peaked in the age groups 45Ð54 and 55Ð64 years for men(76%) and 55Ð64 years for women (67%) (Figure 3.12) (AIHW 1999c).
In 1995, the proportion of overweight or obese children and adolescents aged2Ð17 years was 21% for boys and 23% for girls.
In 1995, the proportion of underweight (BMI < 18.5) women aged 18 years and overwas almost 3%. However, among women aged 18Ð24 years the prevalence was over 6%.The proportion of underweight men aged 18 years and over was less than 1%. Theproportion of underweight children and adolescents aged 2Ð17 years was 6% for boysand 5% for girls.
01 AH2000 body Page 164 Thursday, June 1, 2000 3:06 PM

3 Determinants of health 165
TRIM SIZE 175 mm Wide x 250 mm Deep
Source: AIHW analysis of the 1995 National Nutrition Survey.
Figure 3.12: Proportion of overweight or obese adults, 1995
Note: Capital cities only.
Sources: NHF Risk Factor Prevalence Surveys; ABS National Nutrition Survey.
Figure 3.13: Proportion of overweight or obese adults, 25Ð64 years, 1980 to 1995
18–24 25–34 35–44 45–54 55–64 65–74 75+0
20
40
60
80
100
Per cent
Age group (years)
Males
Females
1980 1983 1989 19950
10
20
30
40
50
60
70
Per cent
Year
Males
Females
01 AH2000 body Page 165 Thursday, June 1, 2000 3:06 PM

166 AustraliaÕs Health 2000
TRIM SIZE 175 mm Wide x 250 mm Deep
There have been significant increases in the proportions of overweight and obeseAustralians over the last 15 years. Trend data from the Risk Factor Prevalence Surveysand the National Nutrition Survey show that the proportion of overweight or obesewomen aged between 25 and 64 years (living in Australian capital cities only) hasincreased from 27% in 1980 to 43% in 1995. Similarly, the proportion of overweight orobese men increased from 48% to 63% over this period (Figure 3.13). The proportion ofobese men has increased dramatically from 8% in 1980 to 18% in 1995 and the proportionof obese women has increased from 7% to 16%. On average, women in 1995 weighed4.8 kg more than their counterparts in 1980, and men 3.6 kg more (AIHW 1999c).
Although BMI is used as the main classification of overweight and obesity, the waist-to-hip ratio (WHR) and waist circumference are also useful measures of increased diseaserisk due to overweight and obesity (NHLBI 1998; WHO 1997).
Fat located in the abdominal region is associated with greater risk of diabetes, coronaryheart disease and high blood pressure, independent of BMI (Albu et al. 1997; Bj�rntorp1992; Lemieux et al. 1996). A high WHR (WHR > 0.9 in men and 0.8 in women) is usedto identify those individuals at increased risk of cardiovascular disease. In 1995, 53% ofadult men and 35% of adult women could be regarded as at increased risk fromcardiovascular disease due to a high WHR (ABS 1996b). For both men and women,WHR increased with age (Figure 3.14).
Source: AIHW analysis of the ABS 1995 National Nutrition Survey.
Figure 3.14: Proportion of adults with waist-to-hip ratio >0.9 for men and >0.8 for women, 1995
18–24 25–34 35–44 45–54 55–64 65–74 75+0
20
40
60
80
100Per cent
Age group (years)
Males
Females
01 AH2000 body Page 166 Thursday, June 1, 2000 3:06 PM

3 Determinants of health 167
TRIM SIZE 175 mm Wide x 250 mm Deep
Changes in waist circumference reflect changes in risk for chronic disease, althoughpopulations differ in the level of risk associated with a particular waist circumferencecut-off (Dowling & Pi-Sunyer 1993; Han et al. 1997). Although there are currently nostandard cut-offs for waist circumferences that indicate increased risk, the WHOsuggests that waist circumferences greater than 94 cm in men and greater than 80 cm inwomen indicate increased risk (WHO 1997). Waist circumferences greater than 102 cmand 88 cm for men and women respectively indicate substantially increased risk. Notethat these waist circumference measures are for Caucasians. Risk cut-offs for otherpopulations have not yet been developed. In 1995, 35% of men had a waistcircumference greater than 94 cm and 37% of women had a waist circumference greaterthan 80 cm. Almost 19% of men had a waist circumference greater than 102 cm and 23%of women had a waist circumference greater than 88 cm. For both men and women,waist circumferences generally increased with age.
Blood pressureHigh blood pressure is a major risk factor for coronary heart disease, stroke, heartfailure, peripheral vascular disease and renal failure. The risk of disease increases as thelevel of blood pressure increases. When high blood pressure is controlled bymedication, the risk of disease is reduced, but not to the levels of unaffected people(Kannel 1991). It is estimated that in 1996 high blood pressure was responsible for over5% of the total burden of disease among Australians (AIHW: Mathers et al. 1999).
Source: ABS National Nutrition Survey, 1995.
Figure 3.15: Proportion of adults with high blood pressure, 1995
18–24 25–34 35–44 45–54 55–64 65–74 75+0
10
20
30
40
50
60
70Per cent
Age group (years)
Men
Women
01 AH2000 body Page 167 Thursday, June 1, 2000 3:06 PM

168 AustraliaÕs Health 2000
TRIM SIZE 175 mm Wide x 250 mm Deep
In terms of predicting ill health, both systolic (SBP) and diastolic blood pressures (DBP)are predictors of cardiovascular disease. Each reduction of 10Ð14 mmHg in SBP and5Ð6 mmHg in DBP reduces the occurrence of stroke by two-fifths, of coronary heartdisease by one-sixth, and of cardiovascular disease by one-third (Chalmers 1999).
The 1995 National Nutrition Survey reported that around 2.2 million Australians aged18 years and over had high blood pressureÑ17% of men and 15% of women. Theproportion of men and women with high blood pressure increases with age(Figure 3.15, page 167).
Along with the decline in the proportion of people with high blood pressure and/orreceiving treatment since the 1980s, there has also been a significant decline in averageblood pressure levels during the same period (Figure 3.16). This decline occurredequally among those not on medication for high blood pressure as among those onmedication (AIHW 1999c; Bennett & Magnus 1994).
High blood pressure was the most common problem managed by general practitionersin 1998Ð99, accounting for about 6% of all conditions managed (AIHW GPSCU: Brittet al. 1999).
Note: Capital cities only.
Sources: NHF Risk Factor Prevalence Surveys; ABS National Nutrition Survey.
Figure 3.16: Proportion of persons aged 25Ð64 years with high blood pressure, 1980 to 1995
1980 1983 1989 19950
5
10
15
20
25
Per cent
Year
Males
Females
01 AH2000 body Page 168 Thursday, June 1, 2000 3:06 PM

3 Determinants of health 169
TRIM SIZE 175 mm Wide x 250 mm Deep
Biomedical and lifestyle factors that are major causes of high blood pressure includeexcess body fat, alcohol consumption, physical inactivity, dietary salt intake andcomplex dietary patterns with a low intake of fruit and vegetables and high saturatedfat (Puddey et al. 1987; Cutler et al. 1997; Appel et al. 1997). Stress raises blood pressuretransiently but in the long term may have indirect effects by influencing eating,drinking, smoking and physical activity patterns (Beilin 1997). Cigarette smokingincreases the risk of heart attack and stroke threefold in hypertensive individuals.
Blood cholesterolHigh blood cholesterol is a major risk factor for coronary heart disease and possibly forsome types of stroke. It is one of the main causes of the process by which the bloodvessels that supply the heart and other parts of the body become clogged. High bloodcholesterol causes nearly 3% of the total burden of disease of Australians (AIHW:Mathers et al. 1999).
For most people, saturated fat in the diet is regarded as the main factor that raises bloodcholesterol levels. Cholesterol in foods can also raise blood cholesterol levels, but lessthan saturated fat does. Genetic factors can affect blood cholesterolÑsome people havehigh cholesterol levels regardless of their saturated fat and cholesterol dietary intakeand are at increased risk from coronary heart disease (Bouchard et al. 1997).
The risk of heart disease increases steadily in a curvilinear manner from a low base withincreasing blood cholesterol levels. Total blood cholesterol levels above 5.5 mmol/L arean indication of a greatly increased risk of developing coronary heart disease. Levelsabove 6.5 mmol/L are considered to indicate extremely high risk (NHF 1987).
Box 3.5: High blood pressure Blood pressure is the force exerted by blood on the walls of the arteries and is written assystolic/diastolic (e.g. 120/80 mmHg, stated as Ô120 over 80Õ).
The continuous relationship between blood pressure levels and cardiovascular disease risk,and the ÔarbitraryÕ nature of the definition of high blood pressure, have contributed to thevariation in the definitions issued by various national and international authorities forpopulation surveys and clinical guidelines.
For use in Australian surveys, high blood pressure has been defined as:
¥ systolic blood pressure (SBP) greater than or equal to 160 mmHg and/or
¥ diastolic blood pressure (DBP) greater than or equal to 95 mmHg and/or,
¥ receiving medication for high blood pressure.
New classifications for the clinical management of high blood pressure have recently beenreleased by the World Health Organization (1999). These guidelines define hypertensionas an SBP of 140 mmHg or greater and/or a DBP of 90 mmHg or greater in subjects whoare not receiving medication for high blood pressure.
A review of the classifications of high blood pressure used in Australia will begin in 2000to establish national standards for population surveys.
01 AH2000 body Page 169 Thursday, June 1, 2000 3:06 PM

170 AustraliaÕs Health 2000
TRIM SIZE 175 mm Wide x 250 mm Deep
The last national survey to measure blood cholesterol levels in Australia was conductedby the National Heart Foundation in 1989. It was estimated that over 4.5 millionAustralian adults (aged 20Ð69 years) had high-risk cholesterol levels. Over 47% of menand 39% of women had blood cholesterol levels above 5.5 mmol/L (Bennett & Magnus1994). In men, there was a rapid increase in the prevalence of elevated total cholesterolafter age 34. In women, the increase occurred a decade later, after age 44, and the levelexceeded that of men after the age of 55 (Figure 3.17). In terms of those at very high riskof cardiovascular disease, over 15% of men and women aged 20Ð69 years had bloodcholesterol levels of 6.5 mmol/L or more.
There was little change during the 1980s in Australia in average blood cholesterol levelsor in the proportion of people with levels of 6.5 mmol/L or more (Bennett & Magnus1994). There are no recent data for Australia. New Zealand reported a fall in averagelevels between 1989 and 1997, and a fall in the proportion of people with levels of6.5 mmol/L or more (Russell et al. 1999).
A recent Australian study, the Long-term Intervention with Pravastatin in IschaemicDisease (LIPID) trial, showed that the cholesterol-lowering drug treatment pravastatinreduces the risk of death from coronary heart disease by around 24% in people withestablished coronary heart disease (LIPID Study Group 1998). This and otherinternational studies have clearly shown that lipid-lowering drugs are of benefit toprevent events both in people with coronary heart disease and in those without clinicalmanifestations of coronary heart disease.
Note: Capital cities only.
Source: 1989 NHF Risk Factor Prevalence Study.
Figure 3.17: Proportion of persons aged 20Ð69 years with raised blood cholesterol, 1989
20–24 25–34 35–44 45–54 55–64 65–690
10
20
30
40
50
60
70
80
90
100Per cent
Age group (years)
Males
Females
01 AH2000 body Page 170 Thursday, June 1, 2000 3:06 PM

3 Determinants of health 171
TRIM SIZE 175 mm Wide x 250 mm Deep
ReferencesABS 1996a. Environmental issues: PeopleÕs views and practices. ABS Cat. No. 4602.0.
Canberra: ABS.
ABS 1996b. Health classifications used in the Australian Bureau of Statistics. ABS Cat.No. 1219.0. Canberra: ABS.
ABS 1998a. Apparent consumption of foodstuffs, Australia, 1996Ð97. ABS Cat. No.4306.0. Canberra: ABS.
ABS 1998b. Australian social trends 1998. ABS Cat. No. 4102.0. Canberra: ABS.
ABS 1999a. Participation in sport and physical activities. ABS Cat. No. 4177.0. Canberra:ABS.
ABS 1999b. Year book Australia, vol. 81. ABS Cat. No. 1301.0. Canberra: ABS.
ABS & DHAC 1998. 1995 National Nutrition Survey: nutrient intakes and physicalmeasurements. ABS Cat. No. 4805.0. Canberra: ABS.
ABS & DHFS 1997. 1995 National Nutrition Survey: selected highlights. ABS Cat.No. 4802.0. Canberra: ABS.
AIHW 1996. Tobacco use and its health impact in Australia. AIHW Cat. No. CVD 1.Canberra: AIHW.
AIHW 1999a. 1998 National Drug Strategy Household Survey: first results. AIHW Cat.No. PHE 15. Drug Statistics Series. Canberra: AIHW.
AIHW 1999b. Cancer in Australia 1996: incidence and mortality data for 1996 andselected data for 1997 and 1998. Cat. No. CAN 7. Canberra: AIHW & AustralianAssociation of Cancer Registries.
AIHW 1999c. Heart, stroke and vascular diseases, Australian facts. AIHW Cat.No. CVD 7. Cardiovascular Disease Series No. 10. Canberra: AIHW & HeartFoundation of Australia.
AIHW GPSCU: Britt H, Sayer GP, Miller GC, Charles J, Scahill S, Horn F et al. 1999.General practice activity in Australia 1998Ð99. AIHW Cat. No. GEP 2. GeneralPractice Series No. 2. Canberra: AIHW GPSCU.
AIHW: de Looper M & Bhatia K 1998. International healthÑhow Australia compares.Cat. No. PHE 8. Canberra: AIHW.
AIHW: Donovan J 1996. Lead in Australian children: report on the National Survey ofLead in Children. Canberra: AIHW.
AIHW: Higgins K, Cooper-Stanbury M & Williams P 2000. Statistics on drug use inAustralia 1998. AIHW Cat. No. PHE 16. Drug Statistics Series. Canberra: AIHW.
AIHW NPSU: Hurst T, Shafir S, Day P & Lancaster P 1999. Congenital malformations,Australia, 1995 and 1996. AIHW Cat. No. PER 8. Sydney: AIHW NPSU.
AIHW: Lester IH 1994. AustraliaÕs food and nutrition. Canberra: AIHW.
AIHW: Mathers C 1994. Health differentials among adult Australians aged 25Ð64 years.Canberra: AIHW.
01 AH2000 body Page 171 Thursday, June 1, 2000 3:06 PM

172 AustraliaÕs Health 2000
TRIM SIZE 175 mm Wide x 250 mm Deep
AIHW: Mathers C, Vos T & Stevenson C 1999. The burden of disease and injury inAustralia. AIHW Cat. No. PHE 17. Canberra: AIHW.
Albu JB, Murphy L, Fager DH, Johnson JA & Pi-Sunyer FX 1997. Visceral fat and racedependent health risks in obese nondiabetic premenopausal women.Diabetes 5:321Ð5.
Anderson RM & May RM 1991. Infectious diseases of humans. Oxford: OxfordUniversity Press.
Appel L, Morre TJ, Obarzanetk E, Vollmer W, Swetkey L, Sacks R et al. 1997. A clinicaltrial of the effects of dietary patterns on blood pressure. DASH Collective ResearchGroup. New England Journal of Medicine 336:1117Ð24.
Armstrong B 1996. An overview. Cancer Forum 20(3) Special Edition: 152Ð57. Sydney:Australian Cancer Society.
Armstrong TP 1998. Monitoring trends in prevalence of physical activity in Australia1989/90Ð1995. Medicine and Science in Sports and Exercise 30:S202.
Ashwell M (ed.) 1997. Diet and heart disease: a round table of factors. British NutritionFoundation. London: Chapman & Hall.
Australian Greenhouse Office 1997. National Greenhouse Gas Inventory 1997.Canberra: AGO [cited 25 Jan 2000]. Available from Internet: URL: http://www.greenhouse.gov.au/inventory/inventory/inv_content.html
Baird PA, Anderson TW, Newcombe HB & Lowry RB 1988. Genetic disorders inchildren and young adults: a population study. American Journal of Human Genetics42:677Ð93.
Bauman A & Owen N 1999. Physical activity of adult Australians: epidemiologicalevidence and potential strategies for health gain. Journal of Science and Medicine inSport 2:30Ð41.
Beard TC, Woodward DR, Ball PJ, Hornsby H, von Witt RJ & Dwyer T 1997. The Hobartsalt study 1995: few meet national sodium intake target. Medical Journal of Australia166:404Ð7.
Beilin LJ 1997. Stress coping, lifestyle and hypertension: a paradigm for researchprevention and non-pharmacological management of hypertension. Clinical andExperimental Hypertension 19:739Ð52.
Bennett SA & Magnus P 1994. Trends in cardiovascular disease risk factors in Australia.Results from the National Heart FoundationÕs Risk Factor Prevalence Study,1980Ð1989. Medical Journal of Australia 161:519Ð27.
Bj�rntorp P 1992. Abdominal fat distribution and disease: an overview ofepidemiological data. Annals of Internal Medicine 24:15Ð18.
Blair SN, Kampert JB, Kohl HW, Barlow CE, Macera CA, Paffenbarger RS &Gibbons LW 1996. Influences of cardiorespiratory fitness and other precursors oncardiovascular disease and all-cause mortality in men and women. Journal of theAmerican Medical Association 276:205Ð10.
01 AH2000 body Page 172 Thursday, June 1, 2000 3:06 PM

3 Determinants of health 173
TRIM SIZE 175 mm Wide x 250 mm Deep
Borland R 1996. Understanding and measuring human responses to sun exposure.Cancer Forum 20(3) Special Edition:198Ð204. Sydney: Australian Cancer Society.
Bouchard C, Malina RM & P�russe L 1997. Genetics of fitness and physicalperformance. Champaign, Il.: Human Kinetics.
Brown WJ, Fuller B, Lee C, Cockburn J & Adamson L 1999. Never too late: olderpeoplesÕ perceptions of physical activity. Health Promotion Journal of Australia9:55Ð63.
Bureau of Meteorology 1999a. Australian annual mean temperature anomalies.Melbourne: Bureau of Meteorology [cited 11 Oct 1999]. Available from Internet: URL:http://www.bom.gov.au/climate/change/retrends.html
Bureau of Meteorology 1999b. Regional rainfall trends. Melbourne: Bureau ofMeteorology [cited 11 Oct 1999]. Available from Internet: URL: http://www.bom.gov.au/climate/change/rerain.html
Carnie J 1997. Immunising the population. Are we succeeding? Australian FamilyPhysician 26(8):925Ð31.
Cashel K & Jeffreson S 1995. The core food groups: the scientific basis for developingnutrition education tools. Canberra: NHMRC.
Chalmers J 1999. The 1999 WHOÐISH guidelines for the management of hypertension.The new guidelines shift the emphasis from blood pressure levels to totalcardiovascular risk. Medical Journal of Australia 171:458Ð9.
Chen J & Millar WJ 1999. Health effects of physical activity. Health Reports 11:21Ð30.
Communicable Diseases Network 1998. Communicable diseases surveillance.Communicable Diseases Intelligence 22(10):233
Communicable Diseases Network 2000. Communicable diseases surveillance.Communicable Diseases Intelligence 24(2):42
Crawford DA & Baghurst KI 1990. Diet and health: a national survey of beliefs,behaviours and barriers to change in the community. Australian Journal of Nutritionand Dietetics 47:97Ð104.
CSIRO 1998a. 1996 climate change scenarios. Aspendale: CSIRO [cited 11 Oct 1999].Available from Internet: URL: http://www.dar.csiro.gov.au/res/cm/scenarios.html
CSIRO 1998b. Measuring progress: is life getting better? Collingwood: CSIROPublishing.
CSIRO 1999. CSIRO information sheet: The Greenhouse Effect. Aspendale: CSIRODivision of Atmospheric Research [cited 11 Jan 2000]. Available from Internet: URL:http://www.dar.csiro.au/cc/gh_gg.htm
Cutler JA, Follman D & Alexander PS 1997. Randomized controlled trails of sodiumreduction: an overview. American Journal of Clinical Nutrition 65 Supplement:643SÐ651S.
DHAC & AIHW 1999. National health priority areas report: cardiovascular health 1998.AIHW Cat. No. PHE 9. Canberra: DHAC & AIHW.
01 AH2000 body Page 173 Thursday, June 1, 2000 3:06 PM

174 AustraliaÕs Health 2000
TRIM SIZE 175 mm Wide x 250 mm Deep
DHCS 1992. National food and nutrition policy. Canberra: AGPS.
DHFS & AIHW 1998. National Health Priority Areas report on cancer control 1997.AIHW Cat. No. PHE 4. Canberra: DHFS & AIHW.
DHHST (Department of Health and Human Services, Tasmania) 1999. Health andwellbeing in Tasmania: first results of the Healthy Communities Survey 1998 (Healthand Wellbeing Outcomes Unit Information Series). Hobart: Government Printer.
Dowling HJ & Pi-Sunyer FX 1993. Race dependent health risks of upper body obesity.Diabetes 42:537Ð43.
English DR, Holman CDJ, Milne E, Winter MG, Hulse GK, Codde JP et al. 1995. Thequantification of drug caused morbidity and mortality in Australia, 1995 edition.Commonwealth Department of Human Services and Health. Canberra: AGPS.
enHEALTH 1999. The National Environmental Health Strategy. Canberra: DHAC.
Epstein P 1999. Climate and health. Science 285:347Ð8.
Foote S 1999. Designing new drugs through DNA. Australian Family Physician 28(10):1011Ð6.
Forrest JM, Burgess MA, Heath TC & McIntyre PB 1998. Measles control in Australia:report of the measles control in Australia. Communicable Diseases Intelligence 22(3):33Ð6.
Fraser P 1999. CSIRO Media Release: Ozone damage to continue until at least 2050.Aspendale: CSIRO [cited 11 Jan 2000]. Available from Internet: URL: http://www.csiro.au/page.asp?type=mediaRelease&id=Ozone
Freeman P & Robbins A 1994. Introduction: vaccine technologies and public health:why a critical review now? International Journal of Technology Assessment in HealthCare 10(1):1Ð6.
Gilmore J 1999. Body mass index and health. Health Reports 11:31Ð43.
Han T, Richmond P, Avenell A & Lean MEJ 1997. Waist circumference reduction andcardiovascular benefits during weight loss in women. International Journal ofObesity and Related Metabolic Disorders 21:127Ð34.
Hill DJ & White VM 1995. Australian adult smoking prevalence in 1992. AustralianJournal of Public Health 19:305Ð8.
Hill DJ, White V & Letcher S 1999. Tobacco use among Australian secondary students in1996. Australian and New Zealand Journal of Public Health 23:252Ð9.
Hill DJ, White VM & Gray NJ 1988. Measures of tobacco smoking in Australia1974Ð1986 by means of a standard method. The Medical Journal of Australia 149:10Ð12.
Hill DJ, White V & Gray N 1991. Australian patterns of tobacco smoking in 1989.Medical Journal of Australia 154:797Ð801.
Hill DJ, White VM & Scollo MM 1998. Smoking behaviours of Australian adults in 1995:trends and concerns. Medical Journal of Australia 168:209Ð13.
01 AH2000 body Page 174 Thursday, June 1, 2000 3:06 PM

3 Determinants of health 175
TRIM SIZE 175 mm Wide x 250 mm Deep
Hill R & Boulter J 1996. Sun protection behaviourÑdeterminants and trends. CancerForum 20(3) Special Edition:204Ð11. Sydney: Australian Cancer Society.
Hu FB, Sigal RJ, Rich-Edwards JW, Colditz GA, Solomon, CG Willett et al. 1999.Walking compared with vigorous physical activity and risk of type 2 diabetes inwomen. Journal of the American Medical Association 282:1433Ð9.
Kannel WB 1991. Epidemiology of essential hypertension: the Framingham experience.Proceedings of the Royal College of Physicians Edinburgh 21:273Ð87.
Kawachi I, Colditz GA, Ascherio A, Rimm EB, Giovannucci E, Stampfer MJ & WillettWC 1996. A prospective study of social networks in relation to total mortality andcardiovascular disease in men in the USA. Journal of Epidemiology and CommunityHealth 50:245Ð51.
Khoury MJ 1996. From genes to public health: the applications of genetic technology topublic health. American Journal of Public Health 86:1717Ð22.
Lee I-M, Sesso HD & Paffenbarger RS 1999. Physical activity and risk of lung cancer.International Journal of Epidemiology 28:620Ð5.
Lemieux S, PrudÕhomme D, Bouchard C, Tremblay A & Depres J 1996. A singlethreshold value of waist girth identifies normal weight and overweight subjects withexcess visceral adipose tissue. American Journal Clinical Nutrition 64:685Ð93.
LIPID Study Group 1998. Prevention of cardiovascular events and death withpravastatin in patients with coronary heart disease and a broad range of initialcholesterol levels. New England Journal of Medicine 339:1349Ð57.
Lister S, McIntyre PB, Burgess MA & OÕBrien ED 1999. Immunisation coverage inAustralian children: a systematic review 1990Ð1998. Communicable DiseasesIntelligence 23(6):145Ð70.
Mann J & Truswell S (eds) 1998. Essentials of human nutrition. Oxford: OxfordUniversity Press.
Martinez ME, Giovannucci E, Spiegelman D, Hunter DJ, Willett WC & Colditz GA 1997.Leisure-time physical activity, body size and colon cancer in women. Journal of theNational Cancer Institute 89:948Ð55.
McMichael A & Powles JW 1999. Human numbers, environment, sustainability andhealth. British Medical Journal 319:977Ð80.
McMichael A 1993. Planetary overload. Cambridge: Cambridge University Press.
MEAC (Measles Elimination Advisory Committee) 2000a. Guidelines for the control ofmeasles outbreaks in Australia (draft).
MEAC (Measles Elimination Advisory Committee) 2000b. LetÕs work together to beatmeaslesÑa report on AustraliaÕs measles control campaign (draft).
Mensink GBM, Ziese T & Kok FJ 1999. Benefits of leisure-time physical activity on thecardiovascular risk profile at older age. International Journal of Epidemiology28:659Ð66.
01 AH2000 body Page 175 Thursday, June 1, 2000 3:06 PM

176 AustraliaÕs Health 2000
TRIM SIZE 175 mm Wide x 250 mm Deep
NCHECR (National Centre in HIV Epidemiology and Clinical Research) 1999. HIV/AIDS, hepatitis C and sexually transmissible infections in Australia: annualsurveillance report 1999. Sydney: NCHECR.
National Childhood Immunisation Committee 1996. Implementation of the Australianimmunisation register. Canberra: AGPS.
NHF 1987. Update on diet and disease 1987: 1-news on cholesterol. National HeartFoundation of Australia.
NHLBI (National Heart, Lung and Blood Institute) 1998. Obesity education initiativeexpert panel 1998. Clinical guidelines on the identification, evaluation, and treatmentof overweight and obesity in adults: the evidence report. Bethesda: NHLBI.
Ness AR & Powles JW 1997. Fruit and vegetables, and cardiovascular disease: a review.International Journal of Epidemiology 26:1Ð13.
NHMRC 1991. Recommended dietary intakes for use in Australia. Canberra: AGPS.
NHMRC 1992a. Dietary guidelines for Australians. Canberra: AGPS.
NHMRC 1992b. Is there a safe level of daily consumption of alcohol for men andwomen? Recommendations regarding responsible drinking behaviour. Canberra:NHMRC.
NHMRC 1993. National Immunisation Strategy. Canberra: AGPS.
NHMRC 1996. Primary prevention of skin cancer in Australia. Canberra: NHMRC.
NHMRC 1997. The Australian immunisation handbook, 6th edition. Canberra: AGPS.
NHMRC 1999. Dietary guidelines for older Australians. Canberra: AusInfo.
NHMRC 2000. The Australian immunisation handbook, 7th edition. Canberra:NHMRC.
Nora JJ, Berg K & Nora AH 1991. Cardiovascular diseases: genetics, epidemiology andprevention. Oxford: Oxford University Press.
OÕBrien ED, Sam GA, & Mead C 1998. Methodology for measuring AustraliaÕschildhood immunisation coverage. Communicable Diseases Intelligence 22(3):36Ð7.
OECD (Organisation for Economic Co-operation and Development) 1997. OECDenvironmental data. Paris: OECD [cited 14 Dec 1999]. Available from Internet: URL:http://www.oecd.org/env/indicators/Annex1.pdf
Pi-Sunyer FX 1993. Medical hazards of obesity. Annals of Internal Medicine 119: 655Ð60.
Plotkin SA & Orstein WA (eds) 1999. Vaccines. Philadelphia: WB Saunders.
Powles J & Gifford S 1990. How healthy are AustraliaÕs immigrants? The health ofimmigrant Australia: a social perspective. Sydney: Harcourt Brace Jovanovich.
Productschap voor Gedistilleerde Dranken 1999. World drink trends 1999 edition.Henley-on-Thames: NTC Publications.
Puddey IB, Beilin LJ & Vandongen R 1987. Regular alcohol use raises blood pressure intreated hypertensive subjects: a randomised controlled trial. Lancet 1:647Ð51.
01 AH2000 body Page 176 Thursday, June 1, 2000 3:06 PM

3 Determinants of health 177
TRIM SIZE 175 mm Wide x 250 mm Deep
Riccardi VM 1977. The genetic approach to human disease. New York: OxfordUniversity Press.
Rimm EB, Ascherio A, Giovannucci E, Spiegelman D, Stampfer MJ & Willett WC 1996.Vegetable, fruit, and cereal fiber intake and risk of coronary heart disease amongmen. Journal of the American Medical Association 275:447Ð51.
Russell DG, Parnell WR, Wilson NC et al. 1999. NZ food: NZ people. Key results of the1997 National Nutrition Survey. Wellington: Ministry of Health.
Saunders P 1999. The perception of equality. Social Policy Research Centre Newsletter75:1Ð6.
Schull WJ & Hanis CL 1990. Genetics and public health in the 1990s. Annual Review ofPublic Health 11:105Ð25.
Sesso HD, Paffenbarger RS & Lee I-M 1997. Physical activity and breast cancer risk inthe College Alumni Health Study (Abstract). American Journal of Epidemiology145 (Suppl):S23.
Slaper H, Velders GJM, Daniel JS, de Gruijl FR & van der Leun JC 1996. Estimates ofozone depletion and skin cancer incidence to examine the Vienna Conventionachievements. Nature 384:256Ð8.
State of the Environment Advisory Council 1996. State of the environment 1996.Collingwood: CSIRO.
Steinmetz KA & Potter JD 1996. Vegetables, fruit and cancer prevention: a review.Journal of the American Dietetic Association 96:1027Ð39.
Thomson J, Lin M, Halliday L, Preston G, McIntyre P, Gidding H et al. 1998. AustraliaÕsnotifiable diseases status, 1998. Annual report of the National Notifiable DiseasesSurveillance System. Communicable Diseases Intelligence 23(11):277Ð304.
Trent R 1999. Diagnosing disease through DNA: an exciting new frontier. AustralianFamily Physician 28(10):1005Ð9.
UNEP (United Nations Environment Program) 1998. Environmental effects of ozonedepletion. Nairobi: UNEP.
UNEP (United Nations Environment Program) & ICPEMC (International Commissionfor Protection against Environmental Mutagens and Carcinogens) 1992. Assessing therisk of genetic damage. Gaborone: Hodder and Stoughton.
United States Department of Health and Human Services 1996. The Surgeon GeneralÕsreport on physical activity and health. Washington: US Government Printing Office.
Wakelin D 1988. Introduction. In: Wakelin D & Blackwell JM (eds). Genetics ofresistance to bacterial and parasitic infection. London: Taylor & Francis.
Watson R, Zinyowera M & Moss R 1997. The regional impacts of climate change: anassessment of vulnerability. Inter-governmental Panel on Climate Change. Geneva:Intergovernmental Panel on Climate Change [cited 11 Jan 2000]. Available fromInternet: URL: http://www.ipcc.ch/pub/sr97.html
01 AH2000 body Page 177 Thursday, June 1, 2000 3:06 PM

178 AustraliaÕs Health 2000
TRIM SIZE 175 mm Wide x 250 mm Deep
Weatherall DJ 1993. The new genetics and clinical practice. New York: OxfordUniversity Press.
Welsh MC, Robinson TL & Lindman LS 1998. Sex differences in health attitudes andchoice of health behaviors. Psychological Reports 83:1161Ð2.
WHO 1997. Preventing and managing the global epidemic. Report of a WHOconsultation on obesity. Geneva: WHO.
WHO 1998. The world health report 1998. Geneva: WHO.
WHO 1999. International Society of Hypertension Guidelines for the management ofhypertensionÑguidelines subcommittee. Journal of Hypertension 17:151Ð83.
Wilkinson R & Marmot M 1998. Social determinants of healthÑthe solid facts.Copenhagen: WHO Regional Office for Europe.
Wilson D, Parsons J & Wakefield M 1999. The health-related quality-of-life of neversmokers, ex-smokers, and light, moderate, and heavy smokers. Preventive Medicine29:139Ð44.
Yen I & Syme SL 1999. The social environment and health: a discussion of theepidemiologic literature. Annual Review of Public Health 20:287Ð308.
01 AH2000 body Page 178 Thursday, June 1, 2000 3:06 PM
4 Health and determinants in population groups 179
TRIM SIZE 175 mm Wide x 250 mm Deep
4 Health and determinants in population groups
This chapter presents the major health and illness issues for a number of populationgroups, with an emphasis on the health status and the factors affecting the health ofspecific populations. These issues are generally reported using such standard measuresas morbidity, mortality, hospitalisations and the impact of socioeconomic status onlevels of health. An important aspect of such a report is the inclusion of underlyingdeterminants of ill health, although the reporting of a number of the social andbehavioural factors is limited by the lack of reliable national data.
The section on the health of men and women aged 25 and over draws heavily on recentwork in estimating the burden of disease and injury, as measured by years of life lostdue to premature mortality and the equivalent years of healthy life that are lost due todisability. The burden of disease project is discussed in chapter 2.
4.1 Mothers and babies
FertilityThere were 249,616 live births registered in Australia in 1998 (ABS 1999d), 0.9% fewerthan in 1997, and 9.7% fewer than the peak annual registration of 276,362 live births in1972. After declining to 223,129 in 1979, the annual number of births graduallyincreased to 264,151 in 1992 and has since declined again each year.
The crude birth rate relates the number of live births in any one year to the totalpopulation size. This rate declined from 21.7 per 1,000 people in 1971 to 14.9 per 1,000in 1991, and then to 13.3 per 1,000 in 1998.
Age-specific birth rates express the number of women in selected 5-year age groupsgiving birth in a year as a proportion of the number of women of the same age group inthe population. Recent trends in these rates have differed with age. For teenagers of15Ð19 years, the birth rate increased slightly each year from 20.3 live births per 1,000women in 1988 to 22.1 live births per 1,000 in 1991 and then decreased annually to18.5 per 1,000 women in 1998, an historical low. The birth rates for women in theirtwenties declined to their lowest levels ever in 1998, down to 60.0 per 1,000 for womenaged 20Ð24 years and 111.2 per 1,000 for women aged 25Ð29 years. Age-specific birthrates for older women have generally increased in recent years, reflecting the trend forsome women to defer child-bearing until their thirties, or even later. Women aged 30Ð34years had their lowest birth rates in the mid-1970s, those aged 35Ð39 in the late 1970s,and those aged 40Ð44 in the mid-1980s (Table S2, page 366). Since then, the birth rates ofwomen aged 35Ð39 years and 40Ð44 years steadily increased to 45.7 and 8.0 per 1,000women, respectively, in 1998.
01 AH2000 body Page 179 Thursday, June 1, 2000 3:06 PM

180 AustraliaÕs Health 2000
TRIM SIZE 175 mm Wide x 250 mm Deep
Multiple birthsTwin confinements have increased since the mid-1970s, and reached their highest rateever in Australia in 1998 when there were 14.6 twin confinements per 1,000. In 1998,there were 3,592 twin confinements among a total of 245,898 confinements (Figure 4.1).There were 98 confinements of triplets and higher order multiple births in 1998. Becausemultiple births increase with advancing maternal age up to the late thirties, rates ofmultiple births are influenced by changes in maternal age distribution. The increasinguse of assisted conception (in-vitro fertilisation and related techniques) to treat infertilecouples has also contributed to the higher rates of multiple births since the early 1980s.
In 1997, assisted conception accounted for 14% of twin confinements in Australia and36% of triplets. Among the more than 22,000 pregnancies resulting in births usingassisted conception since it began in Australia in 1979, twins occurred in 18.6%, tripletsin 2.4%, and other multiple births in 0.1%. These multiple births usually follow transferof more than one embryo into the uterus, or more than one egg into the fallopian tube,in the course of the various treatment procedures. In the past decade, the policy ofreducing the number of embryos or eggs transferred during assisted conception hasbeen partly effective in reducing the incidence of multiple births (Figure 4.2) (AIHWNPSU & Fertility Society of Australia 1999). An unknown proportion of other multiplebirths occurs after fertility drugs are used independently of assisted conception.
Source: AIHW NPSU, derived from ABS data.
Figure 4.1: Twin confinement rates, 1969 to 1998
1969 1971 1973 1975 1977 1979 1981 1983 1985 1987 1989 1991 1993 1995 19970
5
10
15Rate per 1,000 confinements
Year
01 AH2000 body Page 180 Thursday, June 1, 2000 3:06 PM
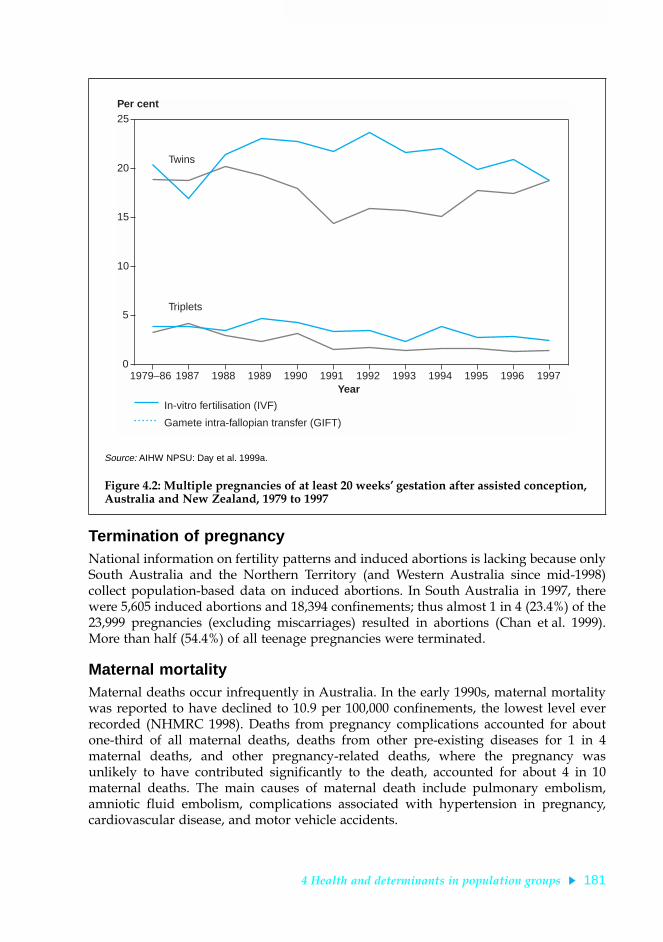
4 Health and determinants in population groups 181
TRIM SIZE 175 mm Wide x 250 mm Deep
Termination of pregnancyNational information on fertility patterns and induced abortions is lacking because onlySouth Australia and the Northern Territory (and Western Australia since mid-1998)collect population-based data on induced abortions. In South Australia in 1997, therewere 5,605 induced abortions and 18,394 confinements; thus almost 1 in 4 (23.4%) of the23,999 pregnancies (excluding miscarriages) resulted in abortions (Chan et al. 1999).More than half (54.4%) of all teenage pregnancies were terminated.
Maternal mortalityMaternal deaths occur infrequently in Australia. In the early 1990s, maternal mortalitywas reported to have declined to 10.9 per 100,000 confinements, the lowest level everrecorded (NHMRC 1998). Deaths from pregnancy complications accounted for aboutone-third of all maternal deaths, deaths from other pre-existing diseases for 1 in 4maternal deaths, and other pregnancy-related deaths, where the pregnancy wasunlikely to have contributed significantly to the death, accounted for about 4 in 10maternal deaths. The main causes of maternal death include pulmonary embolism,amniotic fluid embolism, complications associated with hypertension in pregnancy,cardiovascular disease, and motor vehicle accidents.
Source: AIHW NPSU: Day et al. 1999a.
Figure 4.2: Multiple pregnancies of at least 20 weeksÕ gestation after assisted conception, Australia and New Zealand, 1979 to 1997
1979–86 1987 1988 1989 1990 1991 1992 1993 1994 1995 1996 19970
5
10
15
20
25Per cent
Year
In-vitro fertilisation (IVF)
Gamete intra-fallopian transfer (GIFT)
Twins
Triplets
01 AH2000 body Page 181 Thursday, June 1, 2000 3:06 PM

182 AustraliaÕs Health 2000
TRIM SIZE 175 mm Wide x 250 mm Deep
Perinatal mortalityThe perinatal death rate declined markedly in the last two decades, decreasing to8.3 deaths per 1,000 total births in 1998, the lowest rate ever achieved (ABS 1999e)(Figure 4.3). Foetal deaths (5.3 per 1,000 total births) accounted for 63.9% of perinataldeaths, and neonatal deaths (3.0 per 1,000 live births) for 36.1%. The perinatal death ratefor males (8.9 per 1,000 total births) was higher than for females (7.8 per 1,000 total births).
BirthweightA key indicator of the health of babies born in Australia is the proportion having abirthweight of less than 2,500 grams. These low-birthweight babies have a greater riskof dying, require a longer period of hospitalisation after birth, and are more likely todevelop significant disabilities. In 1997, there were 16,800 babies of low birthweight,6.6% of all births (AIHW NPSU: Day et al. 1999a), an increase on the 6.3% of babies withlow birthweight in the early 1990s. This change is at least partly attributable to anincrease in the number of multiple births. Low birthweight is more common in theNorthern Territory due to the relatively high proportion of Indigenous births. Of8,151 births to Indigenous mothers nationally in 1997, 13.1% were low birthweight.
(a) Per 1,000 total births for foetal deaths and perinatal deaths. Per 1,000 live births for neonatal deaths.
Note: Perinatal deaths comprise stillbirths (foetal deaths) and deaths of infants within the first 28 days of life (neonatal deaths). They include infants and foetuses weighing at least 400 grams or having a gestational age of at least 20 weeks.
Source: AIHW NPSU, derived from ABS data.
Figure 4.3: Foetal, neonatal and perinatal death rates, 1973 to 1998
1973 1975 1977 1979 1981 1983 1985 1987 1989 1991 1993 1995 19970
5
10
15
20
25Rate per 1,000 births
Year
(a)
Foetal deaths
Neonatal deaths
Perinatal deaths
01 AH2000 body Page 182 Thursday, June 1, 2000 3:06 PM

4 Health and determinants in population groups 183
TRIM SIZE 175 mm Wide x 250 mm Deep
Type of deliveryObstetric intervention may be needed if complications arise during pregnancy or labour,although there is debate about the most appropriate rate of intervention. Caesarean birthrates have increased markedly in the last few decades (AIHW NPSU 1993). In 1997,20.3% of deliveries were by caesarean section, the highest proportion ever recorded inAustralia (Table 4.1) (AIHW NPSU: Day et al. 1999a), slightly higher than the proportionrecorded in 1996 (19.5%). In 1997, South Australia (23.5%) had the highest proportion ofdeliveries by caesarean section and New South Wales (18.2%) had the lowest. Indigenousmothers had a slightly lower proportion of deliveries by caesarean section (18.2%) thanall mothers. There was also considerable variation among the States and Territories inthe rates of forceps deliveries and the use of vacuum extraction (Table 4.1).
Congenital malformationsAll States and Territories notify foetuses and infants with major congenitalmalformations to a national monitoring system (AIHW NPSU: Hurst et al. 1999). In 1996,the malformation rate was highest in the musculoskeletal system (47.1 per 10,000 births),malformations of the heart and circulatory system (48.4), genital malformations (26.6),and chromosomal abnormalities (22.8). The major individual congenital malformationsare shown in Table 4.2 (page 184).
Anencephalus, spina bifida and encephalocele are serious malformations of the brainand spine, known collectively as neural tube defects, which often result in death ormajor disability and handicap. In 1996, the reported malformation rate for neural tubedefects among births and terminations of pregnancy was 10.6 per 10,000 births,although this may be an understatement. A randomised controlled trial by the MedicalResearch Council in the United Kingdom has shown that supplements of the vitaminfolic acid are effective in preventing recurrence of these neural tube defects (MedicalResearch Council Vitamin Study Research Group 1991). Other studies indicate thatsupplements of folic acid also prevent many first occurrences of neural tube defects,and possibly some other birth defects. The National Health and Medical ResearchCouncil has recommended folic acid supplementation for women likely to become
Table 4.1: Type of delivery, States and Territories, 1997
NSW Vic Qld WA SA Tas (a) ACT NT Aust
(number)
Total confinements 86,920 61,311 47,278 24,856 18,394 5,378 4,708 3,525 252,370
(per cent)
Spontaneous vertex 70.4 66.3 68.1 63.3 62.5 68.3 65.4 73.1 67.6
Forceps 5.8 9.7 4.9 4.8 9.3 7.3 7.9 4.7 6.8
Vacuum extraction 4.5 2.9 4.4 9.4 4.0 2.9 5.0 — 4.5
Vaginal breech 1.1 0.9 0.6 0.5 0.7 0.6 1.0 1.4 0.8
Caesarean section 18.2 20.2 22.0 22.0 23.5 20.9 20.2 20.8 20.3
Other/unknown — — 0.1 — — — 0.4 — —
(a) Data for Tasmania incomplete.
Source: AIHW NPSU: Day et al. 1999a.
01 AH2000 body Page 183 Thursday, June 1, 2000 3:06 PM

184 AustraliaÕs Health 2000
TRIM SIZE 175 mm Wide x 250 mm Deep
pregnant and for those with a close family history of neural tube defects, stressing theimportance of commencing the supplementation before conception and continuing itfor the first 3 months of pregnancy (NHMRC 1993).
4.2 Children and young peopleThe majority of children and young people in Australia are healthy. They have low ratesof death, hospitalisation and reported illness compared with other age groups.However, some groups of young Australians do not share this good health, mostnotably Aboriginal and Torres Strait Islander peoples. Also, many young Australianshave to face important health issues during this period of life including injury, mentalhealth problems and asthma. In addition, factors such as diet, physical activity anddrug use will affect the health of the young person not only in childhood, adolescenceand young adulthood, but also later in life.
For the purposes of monitoring the health and wellbeing of this age group, recentnational work in relation to child and youth health has defined children as those aged0Ð14 years and young people as those aged 12Ð24 years. The overlap is intentional,reflecting the fact that the transition from childhood to adulthood is a gradual process,which does not occur at the same age for all individuals.
The overview of child and youth health given here is based on a comprehensiveanalysis using currently available data. However, it is important to note that there aregaps and deficiencies in the data which require attention.
Table 4.2: Selected congenital malformations, Australia, 1996
ICD-9 code Congenital malformation Number
Rate per10,000 births
740 Anencephalus 42 1.6
741 Spina bifida 77 3.0
742.3 Hydrocephalus 84 3.3
745.1 Transposition of great vessels 94 3.7
745.4 Ventricular septal defect 480 18.7
749 Cleft lip and/or cleft palate 382 14.9
750.3 Tracheo-oesophageal fistula, oesophageal atresia and stenosis 64 2.5
751.2 Atresia and stenosis of large intestine, rectum and anus 82 3.2
752.6 Hypospadias 604 23.5
753.0 Renal agenesis and dysgenesis 106 4.1
754.3 Congenital dislocation of hip 469 18.2
756.6 Diaphragmatic hernia 76 3.0
758.0 Down syndrome 312 12.1
Source: AIHW NPSU: Hurst et al. 1999.
01 AH2000 body Page 184 Thursday, June 1, 2000 3:06 PM

4 Health and determinants in population groups 185
TRIM SIZE 175 mm Wide x 250 mm Deep
ChildrenMost of this information has been drawn from the AIHW report AustraliaÕs Children:Their Health and Wellbeing 1998 (AIHW: Moon et al. 1998), with some updates usingmore recent data.
Compared with children in many other parts of the world, Australian children arehealthy. They have infant and child mortality rates (deaths in the first year of life andunder five years respectively) well below average (UNICEF 1999:84). In 1996, the infantmortality rate in Australia was around the average for OECD countries, and lower thanthe rate found in the United States, New Zealand, the United Kingdom and Canada(OECD 1999). Australian children also compare well in dental health, having the lowestdecay rates among OECD countries (AIHW: de Looper & Bhatia 1998).
One area in which Australian children have not compared so well internationally is inrelation to vaccine-preventable diseases: Australian rates for cases of both measles andpertussis (whooping cough) (as measured by compulsory notifications) were among thehighest for OECD countries in the mid-1990s. Using recent data, it has been shown thatthere are an average of nearly 5,000 disease notifications, nearly 1,000 hospitalisationsand just over 5 deaths per year among Australian children for diseases that arepreventable by vaccines. In addition, the childhood immunisation rates in Australiahave tended to be lower than in many of the OECD countries (AIHW: de Looper &Bhatia 1998).
There are some indications of improvements in the proportion of children fullyimmunised for diphtheria, tetanus, pertussis, polio and Haemophilus influenzae type b(Hib) since 1997. The Australian Childhood Immunisation Register shows a rate of fullimmunisation of 86.5% in late 1999 (AIHW: de Looper & Bhatia 2000).
There have been substantial declines in childhood death rates in recent years. Duringthe period 1979 to 1998, infant mortality rates more than halved for both males andfemales (Figure 4.4, page 186). The male infant mortality rate has remained 20Ð30%higher than the female rate over this period.
Although infant mortality rates include all deaths to children under the age of 1 year,the majority of these deaths occur at very young agesÑin 1998, one-third of infantdeaths occurred within the first day of life, more than half in the first week of life andaround two-thirds of the deaths in the first 4 weeks of life (ABS 1999b:52).
The decrease in the infant mortality rate shown in Figure 4.4 has occurred fairly equallybetween the neonatal period (the first 4 weeks of life) and the post-neonatal period(4 weeks to 1 year). Between 1979 and 1998, neonatal mortality decreased by 55% andpost-neonatal mortality decreased by 58%.
One reason for the decline in post-neonatal mortality has been the decline in deathsfrom sudden infant death syndrome (SIDS). In 1998, the SIDS rate for males was lessthan a quarter of the 1987 rate and less than a third of the 1979 rate. For females, the1998 rate was about one-third the 1987 rate (Figure 4.5, page 186). The decline in SIDSaccounts for 57% of the fall in the male post-neonatal mortality rate and 52% of the fallin the female post-neonatal mortality rate over the period 1979 to 1998. The role playedby the national prevention campaign begun in the early 1990s has been stressed bymany as a likely contributor to this decline.
01 AH2000 body Page 185 Thursday, June 1, 2000 3:06 PM

186 AustraliaÕs Health 2000
TRIM SIZE 175 mm Wide x 250 mm Deep
Source: ABS, Deaths Australia (ABS Cat. No. 3302.0 for 1998 and previous years).
Figure 4.4: Infant mortality rate, 1979 to 1998
Source: AIHW National Mortality Database.
Figure 4.5: Mortality rate from SIDS for infants under 1 year, 1979 to 1998
1979 1981 1983 1985 1987 1989 1991 1993 1995 19970
2
4
6
8
10
12
14
16Rate per 1,000 live births
Year
Males
Females
1979 1981 1983 1985 1987 1989 1991 1993 1995 19970
50
100
150
200
250
300Rate per 100,000 live births
Year
Males
Females
01 AH2000 body Page 186 Thursday, June 1, 2000 3:06 PM

4 Health and determinants in population groups 187
TRIM SIZE 175 mm Wide x 250 mm Deep
There have also been large decreases in the mortality rates for children aged 1Ð14 yearsin the period 1979 to 1998, by 45% for males and 44% for females. However, the rateplateaued somewhat in the second half of the 1990s at around 25 deaths per 100,000 formales and 19 per 100,000 for females (Figure 4.6).
Injury remains the leading cause of death among Australian children aged 0Ð14 years.This is despite a large fall (59%) in childhood injury deaths for both males and females(Figure 4.7, page 188). The rate for boys remains 1.6 times higher than that for girls.
Drowning replaced motor vehicle accidents as the leading cause of childhood deathsfrom injury in 1997, and remained so in 1998 (AIHW Mortality Database). The maincauses of injury deaths to children in 1998 were drowning (20% of injury deaths), motorvehicle accidents (17%) and pedestrian deaths (14%).
As well as being the leading cause of death in children, injury also accounts for a largeproportion of the childhood hospitalisationsÑ9% of hospitalisations of children in1997Ð98. Injury (which includes poisoning) was the third most common reason childrenwere hospitalised in that year, after respiratory conditions and conditions originating inthe perinatal period. Within injury, accidental falls were the most common causerequiring hospitalisation.
Although injury causes the most deaths to children, asthma is the most commonchronic condition. In 1995, 16% of children aged 0Ð14 years were reported to haveasthma as a long-term condition. Asthma was also the most common reason for
Source: AIHW National Mortality Database.
Figure 4.6: Mortality rate for children aged 1Ð14 years, 1979 to 1998
1979 1981 1983 1985 1987 1989 1991 1993 1995 19970
5
10
15
20
25
30
35
40
45
50Rate per 100,000 population
Year
Males
Females
01 AH2000 body Page 187 Thursday, June 1, 2000 3:06 PM

188 AustraliaÕs Health 2000
TRIM SIZE 175 mm Wide x 250 mm Deep
hospitalisation among children in 1997Ð98, with a hospitalisation rate of 8.6 per 1,000for boys and 5.1 per 1,000 for girls. As discussed in chapter 2, asthma is also the leadingcontributor to the burden of disease among Australian children.
Determinants of healthAs well as monitoring the health status of Australian children, it is also important tomonitor determinants of health, some of which may not affect health status until later inlife. In relation to children, information on determinants of health is less developed thanhealth status measures. National information available in late 1998 is contained inAustraliaÕs Children: Their Health and Wellbeing 1998, including information on physicalactivity, weight, diet and sun protection measures. In 1995, around 86% of 0Ð3-year-oldshad been breastfed, although the proportion that had been breastfed differed by socio-economic group, with higher proportions breastfed in the higher socioeconomic groups.
As well as these behavioural and biological determinants, the family and socialenvironment is also a major determinant of childrenÕs health, both within childhood andlater in life (Centre for Community Child Health 2000). Some of the risk factors for poorhealth outcomes, particularly in the preschool years, include difficult temperament,harsh parenting, abuse or neglect, parental mental illness or substance abuse, familyconflict, low socioeconomic status, and poor links with the community.
Source: AIHW National Mortality Database.
Figure 4.7: Injury mortality rates for children aged 0Ð14 years, 1979 to 1998
1979 1981 1983 1985 1987 1989 1991 1993 1995 19970
5
10
15
20
25
30
Rate per 100,000 population
Year
Males
Females
01 AH2000 body Page 188 Thursday, June 1, 2000 3:06 PM

4 Health and determinants in population groups 189
TRIM SIZE 175 mm Wide x 250 mm Deep
Health differentials
Many of the health concerns discussed above affect particular groups of children morethan others. Infant mortality among Indigenous babies was found to be 3Ð4 timeshigher than among non-Indigenous babies (see section 4.6). Similar mortalitydifferentials exist for children aged 1Ð14 years (ABS & AIHW 1999:132). Children fromlower socioeconomic backgrounds also have a health disadvantage, generally havingmore long-term conditions, lower rates of breastfeeding, and higher rates of someconditions including asthma.
Young peopleMost of this information has been drawn from the AIHW report AustraliaÕs Young People:Their Health and Wellbeing 1999 (AIHW: Moon et al. 1999).
There are divergent views about the health and wellbeing of those aged 12Ð24 years inAustralia. One opinion is that young people have better health than their oldercounterparts; another is that this age group is particularly vulnerable to some of the ill-effects of modern society. The evidence suggests that the actual situation is somewherebetween these two opinions.
There is evidence that Australian young people are in good health. Two-thirds of youngpeople aged 15Ð24 years rated their health as ÔexcellentÕ or Ôvery goodÕ. Further, youngpeople compare well in relation to other age groups. Mortality rates among people aged15Ð24 years are lower than most other age groups, with the exception of children aged1Ð14 years (ABS 1999b:40). Disability rates are also low in this age group: 8% of peopleaged 15Ð19 years and 9% of people aged 20Ð24 years self-reported as having a disability,the lowest of all age groups. In relation to weight, 67% of people aged 15Ð24 years wereclassified as being of Ôacceptable weightÕ (compared with only 38% of those aged25 years and over), 27% were overweight or obese and 6% were underweight.
There is also evidence that the health of young people is getting better. Notably, deathrates for people aged 12Ð24 years have fallen over time (a 29% decline between 1979and 1992), although there has been some levelling off in recent years (Figure 4.8,page 190). Part of the decline in death rates is due to a decline in motor vehicle accidentdeaths, which have fallen from 40 to 15 per 100,000 for males and 16 to 6 per 100,000 forfemales over the period 1979 to 1998.
There have also been reductions in both new HIV diagnoses among young people andteenage fertility rates. Among people aged 12Ð24 years, new HIV diagnoses in malesfell from 11 per 100,000 in 1991 to 3 per 100,000 in 1998. The female rate remainedconsistently much lower at about 1 per 100,000. Teenage fertility rates fell from 55 birthsper 1,000 women in 1971 to 20 in 1997 (ABS 1977, 1998b).
Despite these improvements in youth health, there are some areas of concern. Mentalhealth disorders (including drug dependence disorders) are the major burden of diseasefor this age group (AIHW: Mathers et al. 1999:71). Alcohol dependence and its harmfuluse, and motor vehicle accidents are the two leading specific causes of disease andinjury burden in people aged 15Ð24 years. Of people aged 18Ð24 years, 27% were foundto have a mental disorder in 1997 (ABS 1998c:19).
01 AH2000 body Page 189 Thursday, June 1, 2000 3:06 PM
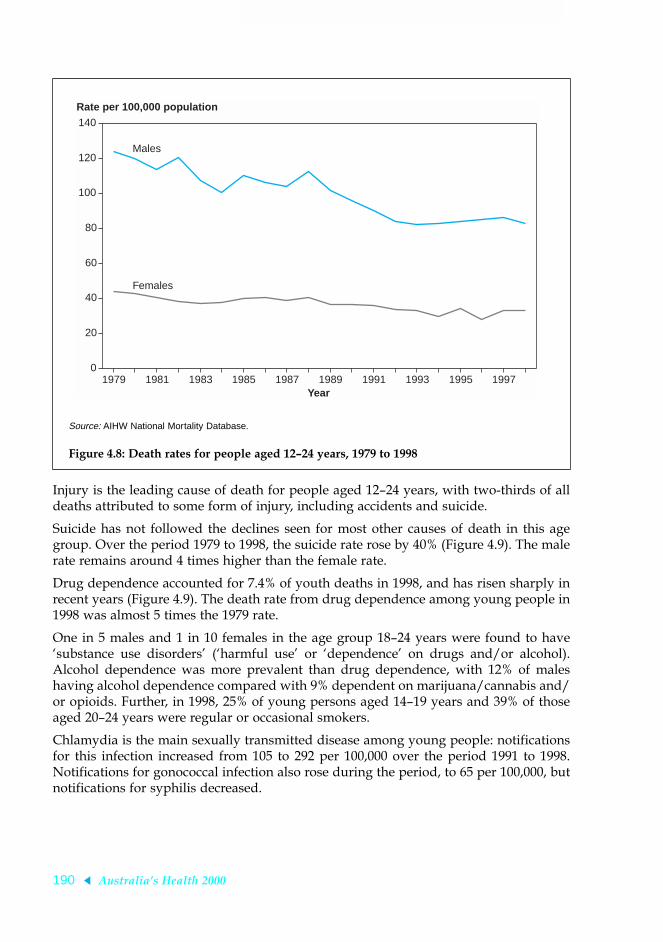
190 AustraliaÕs Health 2000
TRIM SIZE 175 mm Wide x 250 mm Deep
Injury is the leading cause of death for people aged 12Ð24 years, with two-thirds of alldeaths attributed to some form of injury, including accidents and suicide.
Suicide has not followed the declines seen for most other causes of death in this agegroup. Over the period 1979 to 1998, the suicide rate rose by 40% (Figure 4.9). The malerate remains around 4 times higher than the female rate.
Drug dependence accounted for 7.4% of youth deaths in 1998, and has risen sharply inrecent years (Figure 4.9). The death rate from drug dependence among young people in1998 was almost 5 times the 1979 rate.
One in 5 males and 1 in 10 females in the age group 18Ð24 years were found to haveÔsubstance use disordersÕ (Ôharmful useÕ or ÔdependenceÕ on drugs and/or alcohol).Alcohol dependence was more prevalent than drug dependence, with 12% of maleshaving alcohol dependence compared with 9% dependent on marijuana/cannabis and/or opioids. Further, in 1998, 25% of young persons aged 14Ð19 years and 39% of thoseaged 20Ð24 years were regular or occasional smokers.
Chlamydia is the main sexually transmitted disease among young people: notificationsfor this infection increased from 105 to 292 per 100,000 over the period 1991 to 1998.Notifications for gonococcal infection also rose during the period, to 65 per 100,000, butnotifications for syphilis decreased.
Source: AIHW National Mortality Database.
Figure 4.8: Death rates for people aged 12Ð24 years, 1979 to 1998
1979 1981 1983 1985 1987 1989 1991 1993 1995 19970
20
40
60
80
100
120
140
Rate per 100,000 population
Year
Males
Females
01 AH2000 body Page 190 Thursday, June 1, 2000 3:06 PM

4 Health and determinants in population groups 191
TRIM SIZE 175 mm Wide x 250 mm Deep
Determinants of health There are some areas of concern in relation to determinants of health among youngpeople. Social and economic disadvantages (e.g. poor education and unemployment)and issues such as lack of social ÔconnectednessÕ have been shown to have negativeeffects on health (Resnick et al. 1997). Of concern is that 40% of year 8 students in anAustralian study did not feel they had anyone who knew them well (Glover et al. 1998).In 1995, 20% of unemployed youth assessed their health status as being fair or poor,compared with 9% of employed youth and 8% of students.
The proportions of young people who reported in 1995 exercising at a ÔvigorousÕ orÔmoderateÕ level for sport or recreation declined with age, for males from about 61% ofthose aged 15Ð17 years to about 44% of those aged 20Ð24 years, and for females from41% of those aged 15Ð17 years to 31% of those aged 20Ð24 years. Similarly, theproportion of young people who reported that they ate cereals and the proportioneating fruit on the previous day decreased with age (ABS & DHAC 1999:38).
Source: AIHW National Mortality Database.
Figure 4.9: Suicide and drug dependency mortality rates for people aged 12Ð24 years, 1979 to 1998
1979 1981 1983 1985 1987 1989 1991 1993 1995 19970
5
10
15
20
25
Rate per 100,000 population
Year
Males, drug dependence
Females, drug dependence
Males, suicide
Females, suicide
01 AH2000 body Page 191 Thursday, June 1, 2000 3:06 PM

192 AustraliaÕs Health 2000
TRIM SIZE 175 mm Wide x 250 mm Deep
Health differentials
There are differences in health between young males and young females. Among youngAustralians, there are nearly 3 male deaths to every 1 female death (ABS 1999b:38).Across all ages, the difference in death rates between males and females is highest for theage group 20Ð24 years (ABS 1999b:29). Higher death rates for young males fromaccidents and suicide account for most of this difference. For some groups of males, thecomparative situation is getting worse: the gap in death rates between the lowest andhighest socioeconomic status groups widened between 1985Ð87 and 1995Ð97 for malesbut narrowed for females.
There are also some areas where females do worse than males; for example, rates ofdepressive disorders are three times higher for young females than for males. Thefemale hospitalisation rate for parasuicide (self-harm not resulting in death) was greaterat all ages, despite the higher suicide rate in males.
Among young people, some groups are comparatively worse off. Using data for theperiod 1995Ð97, death rates for young Aboriginal and Torres Strait Islander peopleswere found to be 2.8 times higher for males and 2.0 times higher for females than theirnon-Indigenous counterparts (ABS & AIHW 1999:132). The 20% of males in the lowestsocioeconomic group were 1.7 times more likely to die and 1.4 times more likely to behospitalised than the 20% of males in the highest socioeconomic group; for females,these ratios were 1.4 and 1.2 respectively.
4.3 Men and women aged 25 and overAspects of the health of males and females are discussed throughout this report, inparticular in reviewing the major disease areas (see chapter 2). Comparisons are madewhere appropriate. This section provides an overview of the health of adult males andfemales drawing on the results of the AIHW 1996 Australian Burden of Disease andInjury Study (AIHW: Mathers et al. 1999). Disease burden includes both prematuremortality (years of life lost due to premature mortality: YLL) and the impact of disability(equivalent ÔhealthyÕ years of life lost due to disability: YLD). The sum of YLL and YLDequals the total disability-adjusted life years (DALYs), a measure of total burden. OneDALY is the equivalent of one lost year of ÔhealthyÕ life (see section 2.2).
MenThe overall disease and injury burden for men aged 25 years and over is largelyattributable to mortality, with 61.6% of the total burden (DALYs) due to YLL (Table 4.3).The burden due to YLL increases with increasing age, from 47.1% for younger men(ages 25Ð44) to 70.8% for older men (aged 65 and over). Although most deaths occur atages 65 and over, the total burden of disease at ages 25Ð64 is slightly higher than that atages 65 and over.
Men aged 25–44 years
The disease and injury burden for men aged 25Ð44 years is dominated by mentaldisorders (Figure 4.10), which make up 27.3% of the total burden for this age group.Mental disorder is dominated by substance abuse disorders (alcohol and illicit drugs)
01 AH2000 body Page 192 Thursday, June 1, 2000 3:06 PM

4 Health and determinants in population groups 193
TRIM SIZE 175 mm Wide x 250 mm Deep
and depression, which make up 37.6% and 27.3% respectively of the burden of mentaldisorder. They contribute to the burden of disease mainly through disability rather thanmortality.
Unintentional and intentional injuries are the second and third leading causes ofdisease and injury burden in this age group, accounting for 15.5% and 12.1%respectively of the total disease burden. Almost half of the unintentional injury burdencomes from road traffic accidents (42.8%), and the majority of intentional injury burdencomes from suicide and self-inflicted injury (85.2%). These conditions contribute mainlythrough mortality rather than disability.
Table 4.3: The total burden of disease and injury in men aged 25 years and over, 1996
Age
YLD YLL
DALYsValuePer cent of
DALYs ValuePer cent of
DALYs
25–44 119,507 52.9 106,366 47.1 225,873
45–64 148,322 43.0 196,773 57.0 345,095
65 and over 152,995 29.2 370,779 70.8 523,774
Total 25 and over 420,824 38.4 673,918 61.6 1,094,743
Source: Australian Burden of Disease and Injury Study.
Source: Australian Burden of Disease and Injury Study.
Figure 4.10: Leading causes of burden of disease and injury in men aged 25Ð44 years, 1996
Other
Diseases of the digestive system
Nervous system/sense disorders
Musculoskeletal diseases
Chronic respiratory disease
Infectious and parasitic diseases
Cardiovascular disease
Malignant neoplasms
Intentional injuries
Unintentional injuries
Mental disorders
0 50 100 150 200DALYs (’000)
YLL
YLD
01 AH2000 body Page 193 Thursday, June 1, 2000 3:06 PM

194 AustraliaÕs Health 2000
TRIM SIZE 175 mm Wide x 250 mm Deep
The largest single cause of disease and injury burden in younger men is suicide andself-inflicted injury, which contributes 10.3% of the burden for this age group(Table 4.4). The other leading individual causes are depression (7.4%), road trafficaccidents (6.6%), alcohol dependence and harmful use (5.8%), and HIV/AIDS (4.5%).
Men aged 45–64 yearsThe two leading causes of disease and injury burden in men aged 45Ð64 arecardiovascular disease and cancer (malignant neoplasms) (Figure 4.11), whichcontribute 26.1% and 25.3% respectively of the total disease burden for this age group.The cardiovascular disease group is dominated by ischaemic heart disease (63.9%) andstroke (16.8%). The biggest contributors to the cancer group are lung cancer (25.8%) andcolorectal cancer (16.0%). Both cardiovascular disease and cancer contribute mainlythrough mortality rather than disability.
The largest single cause of disease and injury burden in men aged 45Ð64 is ischaemicheart disease, which contributes 16.7% of the total disease burden for this age group(Table 4.4). The other leading individual causes of the disease burden are lung cancer(6.5%), chronic obstructive pulmonary disease (4.9%), hearing loss (4.6%) and diabetes(4.6%).
Table 4.4: Leading single causes of burden of disease and injury in men by age, 1996
Condition DALYs Per cent of total
25–44 years
Suicide and self-inflicted injuries 23,296 10.3
Depression 16,827 7.4
Road traffic accidents 14,929 6.6
Alcohol dependence and harmful use 13,026 5.8
HIV/AIDS 10,250 4.5
All causes total 225,873
45–64 years
Ischaemic heart disease 57,521 16.7
Lung cancer 22,509 6.5
Chronic obstructive pulmonary disease 16,999 4.9
Hearing loss 15,861 4.6
Diabetes mellitus 15,711 4.6
All causes total 345,095
65 years and over
Ischaemic heart disease 113,681 21.7
Stroke 45,111 8.6
Lung cancer 36,206 6.9
Chronic obstructive pulmonary disease 30,348 5.8
Alzheimer’s disease and other dementias 27,804 5.3
All causes total 523,774
Source: Australian Burden of Disease and Injury Study.
01 AH2000 body Page 194 Thursday, June 1, 2000 3:06 PM

4 Health and determinants in population groups 195
TRIM SIZE 175 mm Wide x 250 mm Deep
Men aged 65 years and overCardiovascular disease and cancer are also the two leading causes of disease and injuryburden in older men (Figure 4.12, page 196), contributing 36.1% and 27.1% respectivelyof the total burden for this age group. Once again, the cardiovascular disease group isdominated by ischaemic heart disease (60.2%) and stroke (23.9%). The cancer group isdominated by three cancersÑlung cancer (25.5%), prostate cancer (18.8%) andcolorectal cancer (14.0%). Again, the contribution of cardiovascular disease and canceris mainly through mortality rather than disability.
The largest single cause of disease and injury burden in older men is ischaemic heartdisease, which contributes 21.7% of the total disease burden for this age group(Table 4.4). The other leading individual causes are stroke (8.6%), lung cancer (6.9%),chronic obstructive pulmonary disease (5.8%), and AlzheimerÕs disease and otherdementias (5.3%).
WomenDisability is a somewhat higher contributor to the overall disease and injury burden foradult women, with only 56.2% of the total disease burden due to YLL (Table 4.5). As withmen, the burden due to YLL increases with increasing age, from 26.4% for youngerwomen (ages 25Ð44) to 68.9% for older women (aged 65 and over).
Source: Australian Burden of Disease and Injury Study.
Figure 4.11: Leading causes of burden of disease and injury in men aged 45Ð64 years, 1996
Other
Genito-urinary diseases
Diseases of the digestive system
Musculoskeletal diseases
Unintentional injuries
Diabetes mellitus
Chronic respiratory disease
Mental disorders
Nervous system/sense disorders
Malignant neoplasms
Cardiovascular disease
0 50 100 150 200DALYs (’000)
YLL
YLD
01 AH2000 body Page 195 Thursday, June 1, 2000 3:06 PM

196 AustraliaÕs Health 2000
TRIM SIZE 175 mm Wide x 250 mm Deep
Women aged 25–44 yearsThe disease and injury burden for younger women, as for younger men, is dominatedby mental disorders (Figure 4.13), which make up 33.8% of the total burden for this agegroup. The principal mental disorders are depression and anxiety disorders, whichmake up 37.6% and 33.3% respectively of the burden of mental disorder. Theycontribute mainly through disability rather than mortality. Cancer is the second leadingcause of disease and injury burden in this age group, accounting for 13.1% of the totalburden. The biggest individual cancer is breast cancer, which makes up 37.1% of thecancer burden. Cancers contribute mainly through mortality rather than disability.
Source: Australian Burden of Disease and Injury Study.
Figure 4.12: Leading causes of burden of disease and injury in men aged 65 years and over, 1996
Table 4.5: The total burden of disease and injury in women aged 25 years and over, 1996
Age
YLD YLL
DALYsValuePer cent of
DALYs ValuePer cent of
DALYs
25–44 136,401 73.6 48,918 26.4 185,318
45–64 125,881 49.7 127,633 50.3 253,514
65 and over 170,730 31.1 378,498 68.9 549,228
Total 25 and over 433,012 43.8 555,049 56.2 988,060
Source: Australian Burden of Disease and Injury Study.
Other
Endocrine & metabolic disorders
Unintentional injuries
Musculoskeletal diseases
Diseases of the digestive system
Diabetes mellitus
Genito-urinary diseases
Chronic respiratory disease
Nervous system/sense disorders
Malignant neoplasms
Cardiovascular disease
0 50 100 150 200DALYs (’000)
YLL
YLD
01 AH2000 body Page 196 Thursday, June 1, 2000 3:06 PM

4 Health and determinants in population groups 197
TRIM SIZE 175 mm Wide x 250 mm Deep
The largest single cause of disease and injury burden in younger women is depression,which contributes 12.7% of the total burden for this age group (Table 4.6, page 199). Theother leading individual causes are generalised anxiety disorder (6.2%), breast cancer(4.9%), genito-urinary disease (4.2%) and asthma (3.5%).
Women aged 45–64 yearsThe leading cause of disease and injury burden in women aged 45Ð64 is cancer(Figure 4.14, page 198), which contributes 33.1% of the total disease burden for this agegroup. The three largest cancers in this age group are breast cancer, lung cancer andcolorectal cancer, which contribute 30.3%, 14.3% and 13.0% respectively to the cancerburden. The second and third largest causes are cardiovascular disease and mentaldisorders, which account for 13.7% and 10.1% respectively of the total disease burdenfor this age group. Cardiovascular disease is dominated by ischaemic heart disease(47.0%) and stroke (28.7%) and mental disorders are dominated by depression (51.5%)and anxiety disorders (32.7%). Cancer and cardiovascular disease contribute mainlythrough mortality, and mental disorders contribute mainly through disability.
The largest single cause of disease and injury burden in women aged 45Ð64 is breastcancer, which contributes 10.0% of the total burden for this age group (Table 4.6). Theother leading individual causes are osteoarthritis (6.6%), ischaemic heart disease (6.5%),diabetes (5.6%) and depression (5.2%).
Source: Australian Burden of Disease and Injury Study.
Figure 4.13: Leading causes of burden of disease and injury in women aged 25Ð44 years, 1996
Other
Nervous system/sense disorders
Diseases of the digestive system
Intentional injuries
Cardiovascular disease
Unintentional injuries
Musculoskeletal diseases
Genito-urinary diseases
Chronic respiratory disease
Malignant neoplasms
Mental disorders
0 50 100 150 200DALYs (’000)
YLL
YLD
01 AH2000 body Page 197 Thursday, June 1, 2000 3:06 PM

198 AustraliaÕs Health 2000
TRIM SIZE 175 mm Wide x 250 mm Deep
Source: Australian Burden of Disease and Injury Study.
Figure 4.14: Leading causes of burden of disease and injury in women aged 45Ð64 years, 1996
Source: Australian Burden of Disease and Injury Study.
Figure 4.15: Leading causes of burden of disease and injury in women aged 65 years and over, 1996
Other
Oral health
Diseases of the digestive system
Unintentional injuries
Diabetes mellitus
Chronic respiratory disease
Nervous system/sense disorders
Musculoskeletal diseases
Mental disorders
Cardiovascular disease
Malignant neoplasms
0 50 100 150 200DALYs (’000)
YLL
YLD
Other
Acute respiratory infections
Genito-urinary diseases
Unintentional injuries
Diseases of the digestive system
Diabetes mellitus
Musculoskeletal diseases
Chronic respiratory disease
Nervous/sense organ disorders
Malignant neoplasms
Cardiovascular disease
0 50 100 150 200DALYs (’000)
YLL
YLD
01 AH2000 body Page 198 Thursday, June 1, 2000 3:06 PM

4 Health and determinants in population groups 199
TRIM SIZE 175 mm Wide x 250 mm Deep
Women aged 65 years and overThe three leading causes of disease and injury burden in older women are cardio-vascular disease, cancer, and nervous system and sense organ disorders (Figure 4.15),which contribute 37.2%, 20.8% and 17.9% respectively to the total burden for this agegroup. Cardiovascular disease is dominated by ischaemic heart disease (54.4%) andstroke (28.8%). The three largest cancers are breast cancer (15.1%), colorectal cancer(16.4%) and lung cancer (15.1%). In the nervous system and sense organ disordersgroup, the leading causes are AlzheimerÕs disease and other dementias (49.7%), hearingand vision disorders (32.1%) and ParkinsonÕs disease (12.2%). Cardiovascular diseaseand cancer contribute mainly through mortality, and nervous system and sense organdisorders contribute mainly through disability.
The largest single cause of disease and injury burden in older women is ischaemic heartdisease, which contributes 20.3% of the total burden for this age group (Table 4.6). Theother leading individual causes are stroke (10.7%), AlzheimerÕs disease and otherdementias (8.9%), chronic obstructive pulmonary disease (4.0%) and breast cancer (3.6%).
Table 4.6: Leading single causes of burden of disease and injury in women by age, 1996
Condition DALYs Per cent of total
25–44 years
Depression 23,546 12.7
Generalised anxiety disorder 11,529 6.2
Breast cancer 9,025 4.9
Other genito-urinary diseases 7,836 4.2
Asthma 6,548 3.5
All causes total 185,318
45–64 years
Breast cancer 25,451 10.0
Osteoarthritis 16,665 6.6
Ischaemic heart disease 16,381 6.5
Diabetes mellitus 14,232 5.6
Depression 13,237 5.2
All causes total 253,514
65 years and over
Ischaemic heart disease 111,267 20.3
Stroke 58,894 10.7
Alzheimer’s disease and other dementias 48,946 8.9
Chronic obstructive pulmonary disease 21,838 4.0
Breast cancer 19,627 3.6
All causes total 549,228
Source: Australian Burden of Disease and Injury Study.
01 AH2000 body Page 199 Thursday, June 1, 2000 3:06 PM

200 AustraliaÕs Health 2000
TRIM SIZE 175 mm Wide x 250 mm Deep
4.4 Older peopleHealthy ageing was one of the primary themes identified by the National Strategy foran Ageing Australia as part of the work undertaken in Australia for the InternationalYear of Older Persons (1999). Declining mortality rates and increased life expectancyhave led to an extended period of life which is spent in Ôold ageÕ, and a growingrecognition of the many different activities, opportunities and contributions which cancharacterise this phase of the life cycle. The National Strategy for an Ageing Australiaidentified a number of key areas in promoting healthy ageing and preventing illness.These include maintaining physical and mental health, engaging in physical activity,preventing falls and injury, maintaining adequate nutrition, detecting sensory loss early,managing incontinence, and evaluating alcohol and other drug usage (Bishop 1999:23).Broader social factors are also an important contributor to good health in old age. Alifetime of higher education, higher income, supportive personal and socialenvironments, good medical care and good superannuation entitlements all contributeto better life chances in old age, and thus to a higher likelihood of maintaining goodhealth at advanced ages.
Life expectancy at age 65Life expectancy has increased for both men and women. Whereas most of the gainsearlier in the twentieth century resulted from a reduction in death rates at youngerages, the latter decades saw an increase in life expectancy at older ages. Life expectancyfor men at age 65 increased by only a single year between 1911 and 1963, and forwomen by less than 3 years over the same period (CBCS 1965:147). Between 1977 and1997, life expectancy for men at age 65 increased from 13 years to 16 years, and forwomen from 17 to 20 years. Just under half of the life years remaining after age 65 willbe spent free of disability (41% for men and 45% for women).
Disability levelsThe proportion of persons with a ÔdisabilityÕ is relatively high among the populationaged 65 and over (Table 4.7). However, it is important to understand the meaning ofdisability as used in the 1998 Survey of Disability, Ageing and Carers. Disability isdefined in this survey by the ABS as having one or more of 17 limitations, restrictions orimpairments (see Box 2.7, page 49). These range from conditions such as Ôloss of speechÕto ÔanyÉlong-term condition that restricts everyday activityÕ. Having a ÔdisabilityÕ doesnot, therefore, imply a need for assistance. The proportion of the population with aprofound or severe core activity restriction is a better indicator of need for assistance, asit includes those who sometimes or always require assistance with self-care, mobility orcommunication. These proportions are quite low in the aged population until age 75.For those aged 65Ð69 years, for example, only 7.8% of men and 9.2% of women have aprofound or severe core activity restriction. The proportions rise quite markedly afterage 75, so that by ages 75Ð79, 19% of men and 25% of women reported a profound orsevere core activity restriction, and at ages 80Ð84 the proportions had risen to 24% and36% respectively. By age 85 and over, more than half the population reported a severeor profound core activity restriction. At these advanced ages, the degree of differencebetween the sexes lessens somewhat, although the proportions for women are stillsubstantially higher than those for men (69% for women and 56% for men).
01 AH2000 body Page 200 Thursday, June 1, 2000 3:06 PM

4 Health and determinants in population groups 201
TRIM SIZE 175 mm Wide x 250 mm Deep
Main disabling condition The main disabling conditions of those aged 65Ð79 and those aged 80 and over wererelated to physical conditions (80.1% and 67.7% respectively). Within this category,arthritis, problems relating to the circulatory system and other musculoskeletalconditions were the major problems. Sensory problems (diseases of the eye or ear) werethe second most disabling set of conditions, affecting 14.2% of those aged 65Ð79 and17.4% of those aged 80 and over. Mental and behavioural problems were the main causeof disability for only 5.8% of those aged 65Ð79, but 14.9% of those aged 80 and over.Dementia and AltzheimerÕs disease were reported as the main disabling condition by2.6% of those aged 65Ð79, and 12.0% of those aged 80 and over.
Main reasons for hospitalisationThere are many reasons patients are admitted to hospitals. The data presented inTables 4.8 and 4.9 (page 202) report on the principal diagnosis and the main procedureperformed on the patient while in hospital care. In 1997Ð98, the most common diagnosisfor older Australians was dialysis (9.7% of separations), followed by cataract (5.4%).Diagnoses associated with heart disease totalled 8%. The most commonly reportedprocedures for older Australians during hospitalisation were other operations on vessels(including haemodialysis) (9.7%), followed by injection or infusion of other therapeutic orprophylatic substance (including chemotherapy) (5.4%) and extraction of eye lens (4.5%).
Main causes of deathThe main causes of death for both men and women aged 65 and over were diseases ofthe circulatory system, malignant neoplasms and diseases of the respiratory system.Together, these three categories accounted for well over three-quarters of deaths amongpeople aged 65 and over. The leading cause of death in 1998 among men aged 65Ð74was malignant neoplasms (40% of all deaths) closely followed by diseases of thecirculatory system (37%), and then diseases of the respiratory system (9%). Over the1990s, age-specific death rates from circulatory diseases, previously the leading cause ofdeath, fell markedly in this age group, whereas those for malignant neoplasmsincreased (Figure 4.16, page 203). Among men aged 75 and over, diseases of thecirculatory system accounted for 43% of deaths, followed by malignant neoplasms
Table 4.7: Persons aged 65 years and over: disability status, by sex and age group, 1998 (per cent)
Core activity restriction
Males Females
65–69 70–74 75–79 80–84 85+ 65–69 70–74 75–79 80–84 85+
Profound or severe 7.8 11.8 19.0 24.2 56.0 9.2 15.1 24.9 35.5 68.8
Moderate 10.8 10.3 15.3 *7.8 *10.4 8.9 10.4 10.2 6.9 6.9
Mild 16.0 21.6 20.3 24.8 16.9 14.8 16.5 18.3 22.6 7.5
All with specific restrictions 34.6 43.7 54.6 56.9 83.3 32.8 41.9 53.3 65.0 83.2
All with disability 43.4 51.1 60.9 63.4 84.3 37.6 47.3 56.6 66.8 84.2
* Subject to a relative standard error greater than 25%.
Source: ABS 1999c:15.
01 AH2000 body Page 201 Thursday, June 1, 2000 3:06 PM

202 AustraliaÕs Health 2000
TRIM SIZE 175 mm Wide x 250 mm Deep
(29%) and diseases of the respiratory system (12%). Among these men, age-specificdeath rates for diseases of the circulatory system also fell substantially over the decade,whereas those for malignant neoplasms increased (Figure 4.17).
In 1998, for women aged 65Ð74, malignant neoplasms were the leading cause of death(39%), followed by diseases of the circulatory system (34%) and diseases of therespiratory system (9%) (Figure 4.16). This represents a change from the pattern adecade earlier, when circulatory diseases were the major cause of death. For womenaged 75 and over, circulatory diseases continued to be the leading cause of death in1998 (49%), although to a lesser extent than that reported a decade earlier (59%).Malignant neoplasms (21%) and diseases of the respiratory system (11%), were the nextmost common causes (Figure 4.17). For both age groups, the age-specific death rates fordiseases of the circulatory system fell during the decade.
Table 4.8: Patients aged 65 and over: separations for the most frequently occurring principal diagnoses, 1997Ð98
Principal diagnosis Separations Per cent
Encounter for dialysis 166,822 9.7
Cataract 92,752 5.4
Other and unspecified procedures and aftercare 79,332 4.6
Care involving use of rehabilitation procedures 62,755 3.6
Heart failure 35,908 2.1
Other acute and subacute forms of ischaemic heart disease 34,530 2.0
Other malignant neoplasm of skin 34,150 2.0
Diseases of oesophagus 28,319 1.6
Osteoarthritis and allied disorders 27,978 1.6
Cardiac dysrhythmias 25,693 1.5
Follow-up examination 25,665 1.5
Pneumonia, organism unspecified 23,137 1.3
Angina pectoris 22,075 1.3
Source: Australian National Hospital Morbidity Database.
Table 4.9: Patients aged 65 and over: separations for the most frequently occurring principal procedures, 1997Ð98
Principal diagnosis Separations Per cent
Other operations on vessels 167,601 9.7
Injection or infusion of other therapeutic or prophylactic substance 92,759 5.4
Extracapsular extraction of lens by fragmentation & aspiration techniques 77,415 4.5
Diagnostic procedures on small intestine 74,203 4.3
Diagnostic procedures on large intestine 59,218 3.4
Diagnostic physical therapy 40,620 2.4
Transfusion of blood & blood components 33,754 2.0
Soft tissue X-ray of face, head and neck 32,072 1.9
Joint replacement of lower extremity 28,464 1.7
Source: Australian National Hospital Morbidity Database.
01 AH2000 body Page 202 Thursday, June 1, 2000 3:06 PM

4 Health and determinants in population groups 203
TRIM SIZE 175 mm Wide x 250 mm Deep
Source: ABS 1990, 1999b.
Figure 4.16: Deaths by major cause: men and women aged 65Ð74 years, 1988 and 1998 (per cent)
Source: ABS 1990, 1999b.
Figure 4.17: Deaths by major cause: men and women aged 75 years and over, 1988 and 1998 (per cent)
Malignant neoplasms Circulatory diseases Respiratory diseases0
10
20
30
40
50Per cent
Major cause of death
Males 1988
Males 1998
Females 1988
Females 1998
Malignant neoplasms Circulatory diseases Respiratory diseases0
10
20
30
40
50
60Per cent
Major cause of death
Males 1988
Males 1998
Females 1988
Females 1998
01 AH2000 body Page 203 Thursday, June 1, 2000 3:06 PM

204 AustraliaÕs Health 2000
TRIM SIZE 175 mm Wide x 250 mm Deep
4.5 Overseas-bornAustralia is an ethnically diverse nation. The 1998 ABS population estimates show thatabout 23% of Australians were born overseas. More than half of these Australianresidents were born in a non-English-speaking country.
A heterogenous mix, migrants bring to Australia their own unique health profiles. Thestringent health requirements for immigration ensure that most migrants enjoy good, ifnot better, health than the Australian-born population. This is known as the Ôhealthymigrant effectÕ. Immigrants have lower death rates and hospitalisation rates, as well aslower prevalence of certain lifestyle-related risk factors. There are also variations in thehealth status of migrants according to birthplace, age, socioeconomic status, fluency inthe English language and satisfaction with their job and life in Australia (Kliewer &Jones 1998). Illness and disability among migrant groups, however, increases withlength of residence in Australia (Young 1992).
For purposes of health comparison, immigrants may be grouped into four broadregional groups: the United Kingdom and Ireland, Other Europe, Asia and Other(Box 4.1). These regional groups exhibit significant variation in their age structures,depending on the recency of their arrival. Migrants from Asia and Other regions, forexample, are mainly young, with large numbers aged between 20 and 44 years, whereasmigrants from the United Kingdom and Ireland and Other Europe have median agesaround 50 years. To enable meaningful comparisons to be made, variation in the healthstatus among these populations due to different age structures has been removed byage standardisation.
MortalityTable 4.10 compares the death rates for the overseas-born with the Australian-born forthe period 1996Ð98 using standardised mortality ratios (SMRs). The SMRs for all causesare lower for both males and females in all four birthplace categories. Death ratesamong migrants from the United Kingdom and Ireland were closest to the rates for
Box 4.1: Country of birth categoriesCountries classified according to the Australian Standard Classification of Countries forSocial Statistics are grouped here into four birthplace groups:
United Kingdom and Ireland: Form a distinct category that is not easily separated inpopulation statistics.
Other Europe: Continental Europe including Eastern Europe, former USSR andBaltic States.
Asia: North-East, South-East and Southern Asia.
Other: Middle East, Northern and Southern Africa, the Americas, New Zealand and thePacific region. New Zealand is the largest source country, constituting around 30% of thisgroup.
01 AH2000 body Page 204 Thursday, June 1, 2000 3:06 PM

4 Health and determinants in population groups 205
TRIM SIZE 175 mm Wide x 250 mm Deep
Australian-born persons. In comparison, migrants from the Asian region have muchlower SMRs, with death rates 46% lower among Asian-born males and 38% loweramong Asian-born females than their Australian-born counterparts.
Mortality by cause of death shows significant variation between overseas-bornpopulation groups. Table 4.10 shows that migrant groups in Australia have lower levelsof cardiovascular mortality compared with the Australian-born population. However,studies show that rates tend to increase after the migrantsÕ first 10 years of residence inAustralia (NHF 1996). Research also indicates that physical inactivity, a risk factor forcardiovascular disease, is more common among people from southern, northern and
Table 4.10: Mortality differentials by birthplace, cause of death and sex, persons aged 15 years and over, 1996Ð98
ICD-9-CM
Males Females
Total
Standardised mortality ratio (a)
(Australian-born = 1.0)
Total
Standardised mortality ratio (a)
(Australian-born = 1.0)
UK andIreland
OtherEurope Asia Other
UK andIreland
OtherEurope Asia Other
Infectious 2,558 *0.79 1.01 *1.39 *1.39 1,742 *0.84 *1.36 *1.52 *1.24
AIDS(b) 1,005 *0.84 *0.76 *0.49 *1.44 95 0.95 *0.58 1.32 1.61
Cancers 58,685 *0.94 *0.90 *0.64 *0.84 45,508 *1.05 *0.85 *0.71 *0.94
Lung 14,092 *1.16 *1.07 *0.68 *0.91 6,139 *1.49 *0.66 *0.83 0.95
Skin 2,489 *0.42 *0.34 *0.10 *0.45 1,326 *0.63 *0.40 *0.10 *0.68
Prostate 7,592 *0.80 *0.64 *0.42 *0.83 n.a. n.a. n.a. n.a. n.a.
Breast n.a. n.a. n.a. n.a. n.a. 7,731 *1.09 *0.86 *0.61 *1.05
Cervix n.a. n.a. n.a. n.a. n.a. 861 1.03 *0.87 *1.23 *1.19
Diabetes mellitus 4,340 *0.83 *1.27 *1.18 *1.27 4,183 *0.76 *1.74 *1.54 *1.56
Cardiovascular 76,319 *0.88 *0.86 *0.61 *0.90 79,851 *0.87 *0.84 *0.70 *0.95
Ischaemic 46,251 *0.89 *0.88 *0.58 *0.92 39,287 *0.89 *0.85 *0.65 *0.94
Stroke 14,759 *0.84 *0.83 *0.71 *0.85 21,889 *0.85 *0.80 *0.88 *0.94
Respiratory 18,980 *0.95 *0.64 *0.58 *0.67 16,462 *1.03 *0.56 *0.58 *0.83
Digestive 5,892 *0.86 *0.84 *0.63 *0.71 5,719 0.99 *0.74 *0.65 *0.86
Injury and poisoning 15,631 *0.89 *0.84 *0.58 *0.90 6,393 1.05 0.96 0.94 1.04
Motor vehicle 3,663 *0.79 *0.79 *0.69 0.99 1,495 1.10 *1.21 *1.20 *1.16
Suicide 6,155 *0.93 *0.74 *0.40 *0.79 1,544 0.95 0.92 *0.83 0.97
Homicide 603 *0.79 *1.53 *1.44 *1.63 286 1.08 1.31 0.98 0.83
All causes 195,135 *0.88 *0.82 *0.54 *0.79 176,626 *0.93 *0.81 *0.62 *0.86
* Significantly different from 1.00 at the 5% level.
(a) The standardised mortality ratio (SMR) is a measure of death from a specific condition in the overseas-born population relative to the Australian-born population. The ratio for Australian-born is 1.00, and ratios that exceed 1.00 indicate a relatively greater mortality in that population than for the Australian-born. Likewise, ratios less than 1.00 indicate a lower death rate for a given cause of death than for the Australian-born.
(b) All deaths where AIDS is mentioned on the death certificate, regardless of whether it is identified as the primary cause of death.
Note: Age standardised to the Australian population at 30 June 1991.
Source: AIHW National Mortality Database.
01 AH2000 body Page 205 Thursday, June 1, 2000 3:06 PM

206 AustraliaÕs Health 2000
TRIM SIZE 175 mm Wide x 250 mm Deep
eastern Europe, Asia, the Middle East and North Africa in comparison with theirAustralian-born counterparts. Exercise levels are reported to increase with length ofstay in Australia (NHF 1996).
Deaths from cancers also show variation. Death rates from lung cancer for both malesand females born in the United Kingdom and Ireland, and for males born in OtherEurope were higher than for males and females born in Australia. Females born in theUnited Kingdom and Ireland had higher death rates for breast and cervical cancer.Cervical cancer death rates among women born in Asia and Other countries werehigher than among Australian-born women. However, Australian-born males hadhigher death rates for prostate cancer across all birthplace groups. Immigrants from allregions have much lower death rates for skin cancer compared with Australian-bornpersons. Smoking, diet, sun exposure, alcohol consumption, and utilisation of health-care services such as screening programs all play a role in creating the differentialsrelated to cancer risk. Culturally appropriate models of preventive health care deliveryare currently being developed to overcome access and equity concerns regarding thehealth of overseas-born persons (DHFS & AIHW 1998).
SMRs for diseases of the respiratory system and diseases of the digestive system amongpersons born overseas are lower than in the Australian-born population across allregions, except for females born in the United Kingdom and Ireland. Mortality rates fordiabetes are higher for those born in Other Europe, Asia and Other countries relative tothe Australian-born population. The prevalence of diabetes is high for certainimmigrant groups compared with the Australian-born group, particularly amongpersons of European, Pacific Islander and Asian origin (DHAC & AIHW 1999a). It hasbeen suggested that there is a need to provide information and education for effectiveself-management of diabetes, since poor glycaemic control is common and moremarked among migrant groups (FECCA 1997).
Motor vehicle accident and suicide death rates are higher among Australian-born males.Note, though, that in 1992 approximately 25% of all suicide deaths were among migrants,with 40% of these among persons from English-speaking countries (DHAC 1998).
HospitalisationHospitalisation rates for 1997Ð98 for overseas-born persons generally reflect thecorresponding mortality patterns and indicate lower morbidity in comparison toAustralian-born persons for both males and females (Table 4.11).
Asian-born migrants had the lowest hospitalisation rates in 1997Ð98. However, thehospitalisation rates for tuberculosis among Asian-born migrants were much higherthan for other population groups. The hospitalisation rates for cancer of the cervixamong females from Asia and Other countries were also higher than for the Australian-born females. Lung cancer among females born in the United Kingdom and Ireland wasthe only other principal diagnosis among immigrant groups having a significantlyhigher rate than the Australian-born population.
One of the most notable differences was for melanoma, for which the hospitalisationrate for the Australian-born population was more than double that for the overseas-born. Risk factors for melanoma include increased exposure to sun early in life, faircomplexion, freckles and ease of sunburn.
01 AH2000 body Page 206 Thursday, June 1, 2000 3:06 PM

4 Health and determinants in population groups 207
TRIM SIZE 175 mm Wide x 250 mm Deep
4.6 Aboriginal and Torres Strait Islander peoplesAustraliaÕs Aboriginal and Torres Strait Islander peoples continue to experience muchpoorer health than the general Australian population (see ABS & AIHW 1999 for a moredetailed report). Despite the relative lack of good-quality national health statistics forAustraliaÕs Indigenous population, evidence from those jurisdictions and collectionswhere the data are considered to be of reasonable quality indicates large differencesbetween the health of Indigenous and non-Indigenous populations across a range ofhealth status measures. This health disadvantage begins at an early age and continuesthroughout the life cycle. It reflects the broader social and economic disadvantagesfaced by Aboriginal and Torres Strait Islander Australians.
Table 4.11: Standardised hospital separation ratios by principal diagnosis, birthplace and sex, persons aged 15 years and over, 1997Ð98
ICD-9-CM
Males Females
Total
Standardised hospital separation ratio (a)
(Australian-born = 1.0)
Total
Standardised hospital separation ratio (a)
(Australian-born = 1.0)
UK andIreland
OtherEurope Asia Other
UK andIreland
OtherEurope Asia Other
Infectious 21,339 *0.72 *0.74 1.00 *0.92 22,027 *0.86 *0.75 *0.80 *0.83
Tuberculosis 419 1.01 *1.65 *14.89 *2.68 372 *0.64 1.18 *21.50 *2.39
Cancers 178,688 *0.70 *0.69 *0.44 *0.69 188,233 *0.79 *0.76 *0.61 *0.83
Skin 3,764 *0.40 *0.31 *0.10 *0.45 3,158 *0.56 *0.44 *0.09 *0.42
Lung 11,636 0.99 *1.04 *0.68 *0.77 5,252 *1.20 *0.64 *0.50 *0.78
Prostate 11,682 *0.70 *0.59 *0.39 *0.71 n.a. n.a. n.a. n.a. n.a.
Breast n.a. n.a. n.a. n.a. n.a. 17,730 *0.96 *0.79 *0.59 *0.91
Cervix n.a. n.a. n.a. n.a. n.a. 1,994 0.95 *0.79 *1.24 *1.52
Diabetes mellitus 11,809 *0.68 *0.81 *0.49 *0.66 10,150 *0.67 *0.92 *0.58 *0.78
Mental 104,173 *0.68 *0.68 *0.33 *0.67 119,847 *0.79 *0.59 *0.31 *0.81
Cardiovascular 244,185 *0.77 *0.88 *0.58 *0.92 187,274 *0.81 *0.92 *0.60 *0.94
Ischaemic 104,882 *0.78 *0.86 *0.64 1.00 54,944 *0.82 *0.86 *0.64 *0.97
Stroke 26,894 *0.69 *0.81 *0.58 *0.82 24,909 *0.74 *0.77 *0.78 *0.88
Respiratory 111,499 *0.72 *0.71 *0.52 *0.79 108,301 *0.81 *0.59 *0.45 *0.78
Asthma 11,253 *0.71 *0.51 *0.54 *0.93 21,948 *0.79 *0.38 *0.43 *0.80
Digestive 297,254 *0.76 *0.79 *0.56 *0.80 318,327 *0.79 *0.81 *0.54 *0.79
Injury and poisoning 190,734 *0.72 *0.62 *0.38 *0.74 144,288 *0.83 *0.71 *0.47 *0.77
All causes 2,231,442 *0.74 *0.82 *0.60 *0.84 2,778,141 *0.79 *0.83 *0.66 *0.91
* Significantly different from 1.00 at the 5% level.
(a) The standardised hospital separation ratio is a relative measure of hospital use between the overseas-born and Australian-born populations. The ratio for Australian-born is 1.00, and ratios that exceed 1.00 indicate relatively greater hospital use in that population than for the Australian-born. Likewise, ratios less than 1.00 indicate less hospital use due to a given cause than for the Australian-born population.
Note: Age standardised to the Australian population at 30 June 1991.
Source: AIHW National Morbidity Database.
01 AH2000 body Page 207 Thursday, June 1, 2000 3:06 PM

208 AustraliaÕs Health 2000
TRIM SIZE 175 mm Wide x 250 mm Deep
It is difficult at present to measure precisely the magnitude of this health disadvantageand the changes over time. The main factors limiting the quality and availability of datainclude incomplete identification of Aboriginal and Torres Strait Islander peoples inadministrative data collections (such as death registrations, hospital records, cancerregistries and communicable disease notifications); uncertainties in estimating the sizeand composition of the Indigenous population; and a relative lack of high-quality surveydata about this comparatively small population group (ABS & AIHW 1999). A number ofrecent initiatives in information development, such as the National Aboriginal andTorres Strait Islander Health Information Plan (ATSIHWIU 1997), may result in someimprovements to the quality and availability of data in the future. Some data-qualityproblems may take a great deal of time to overcome, if indeed they are solvable.
Life expectancyLife expectancy at birth for Indigenous Australians in the period 1991Ð96 was estimatedto be 56.9 years for males and 61.7 years for females, considerably lower than the all-Australian estimates of 75.2 years for males and 81.1 years for females (ABS & AIHW1999). The figures for the Australian Indigenous population are similar to those forAustralians born at the beginning of the twentieth century, when life expectancy was55 years for Australian males and 59 years for Australian females.
MortalityInformation on mortality comes from deaths that occurred among usual residents of theNorthern Territory, Western Australia and South Australia during calendar years1995Ð97 and were registered by the end of 1998. Despite efforts to improve data quality,the level of completeness of identification of Indigenous deaths in other jurisdictionswas not considered adequate during this time period to allow for reporting (ABS 1998a;ABS & AIHW 1999; Cunningham & Paradies 2000), although Queensland wasconsidered to have adequate data quality for 1998 (ABS 1999b). Even in the threejurisdictions reported here, however, there may be underestimation of Indigenousdeaths due to incomplete identification on death certificates.
Overall mortality
In 1995Ð97, in Western Australia, Northern Territory and South Australia combined,there were about three times as many deaths among Indigenous people as there wouldhave been if the Indigenous population had the same age-specific death rates as thetotal Australian population (Cunningham & Paradies 2000). The death rates forIndigenous people exceeded those for all Australians in every age group (Figure 4.18),but the differences were greatest, in relative terms, among those aged 35Ð54 years.
There are no reliable data at present to determine whether and to what extent the deathrates for the Indigenous population have been changing in recent years.
Age at death
The higher age-specific death rates and the lower life expectancy at birth for Aboriginaland Torres Strait Islander peoples are reflected in the younger age distribution ofIndigenous deaths. In 1995Ð97, more than half (53%) of the deaths of Indigenous malesand 41% of the deaths of Indigenous females were of people aged less than 50 years.
01 AH2000 body Page 208 Thursday, June 1, 2000 3:06 PM

4 Health and determinants in population groups 209
TRIM SIZE 175 mm Wide x 250 mm Deep
This is in stark contrast to the age distribution for all Australian deaths, with the vastmajority (72% of male deaths and 83% of females deaths) occurring among people aged65 years or more (Figure 4.19, page 210).
Causes of death
The major causes of deaths among Indigenous people were cardiovascular diseases,injury, respiratory diseases, cancer (neoplasms), and endocrine diseases (such asdiabetes), which together accounted for about three-quarters of all Indigenous deaths(Cunningham & Paradies 2000). While these same causes were also the most importantfor the Australian population overall, deaths from these and most other causes occurredat greater rates in the Indigenous population than among other Australians (Figure 4.20,page 211).
Birth outcomes for Indigenous mothersDespite reductions in infant and maternal mortality among Indigenous Australiansover the past 30 years (see, for example, Thomson 1991), there are still considerabledifferences in birth outcomes between the Indigenous and non-Indigenous populations.Low-birthweight babies, stillbirths and neonatal deaths (those occurring in the first28 days of life) are all about twice as common among births to Indigenous mothers thanamong births to other mothers. In 1994Ð96, about 12% of babies born to Indigenous
Note: Data are for deaths which occurred in 1995–97 and were registered by the end of 1998. Indigenous data are for usual residents of Western Australia, South Australia and the Northern Territory combined.
Source: Cunningham & Paradies 2000.
Figure 4.18: Age-specific death rates, 1995Ð97
<1 1–4 5–14 15–24 25–34 35–44 45–54 55–64 65–74 75+0
2,000
4,000
6,000
8,000
10,000
12,000Rate per 100,000 population
Age group (years)
Indigenous males
All Australian males
Indigenous females
All Australian females
01 AH2000 body Page 209 Thursday, June 1, 2000 3:06 PM

210 AustraliaÕs Health 2000
TRIM SIZE 175 mm Wide x 250 mm Deep
mothers were below 2,500 grams at birth, compared with about 6% of other babies. Theperinatal mortality rate (stillbirths and neonatal deaths) in the same period was almost22 per 1,000 births for babies born to Indigenous mothers, compared with just under10 per 1,000 for other babies (AIHW NPSU: Day et al. 1999b)(Figure 4.21).
Infant mortality (death in the first year of life) was also higher for Indigenous childrenthan for other children. In 1995Ð97, in the Northern Territory, Western Australia and SouthAustralia combined, the infant death rates were 3.1 times as high for Indigenous males(1,873 per 100,000) as for all Australian males (605) and 3.5 times as high for Indigenousfemales (1,731) as for all Australian females (495) (Cunningham & Paradies 2000).
Morbidity
HospitalisationAs with mortality and many other types of data, the rates of hospitalisation amongIndigenous people are underestimated to the extent that the identification ofIndigenous people in hospital records is incomplete. The level of under-identification islikely to vary from hospital to hospital and from State to State. Although the quality ofidentification has been assessed in a small number of hospitals, where coverage rangedfrom 55% to 100% (ATSIHWIU 1999), this has not yet occurred at a national orjurisdictional level, except in the Northern Territory (Condon et al. 1998).
Note: Indigenous data are for deaths of usual residents of Western Australia, South Australia and Northern Territory combined.
Source: Cunningham & Paradies 2000.
Figure 4.19: Age at death, 1995Ð97
Indigenousmales
Indigenousfemales
All Australianmales
All Australianfemales
0
20
40
60
80
100Per cent
Population group
<50 years 50–64 years 65+ years
01 AH2000 body Page 210 Thursday, June 1, 2000 3:06 PM

4 Health and determinants in population groups 211
TRIM SIZE 175 mm Wide x 250 mm Deep
Note: Data are for deaths of usual residents of Western Australia, South Australia and Northern Territory which occurred in 1995–97 and were registered by the end of 1998. Rates are age standardised to the Australian population at 30 June 1991.
Source: Cunningham & Paradies 2000.
Figure 4.20: Age-standardised death rates for selected causes, 1995Ð97
Infectious/parasitic
Nervous system
Genito-urinary
Mental disorders
Digestive
Endocrine/nutritional
Injury/poisoning
Respiratory
Neoplasms
Cardiovascular
0 100 200 300 400 500 600 700
Cause of death
Rate per 100,000 population
Indigenous males
Other males
Infectious/parasitic
Nervous system
Genito-urinary
Mental disorders
Digestive
Endocrine/nutritional
Injury/poisoning
Respiratory
Neoplasms
Cardiovascular
0 100 200 300 400 500 600 700
Cause of death
Rate per 100,000 population
Indigenous females
Other females
01 AH2000 body Page 211 Thursday, June 1, 2000 3:06 PM
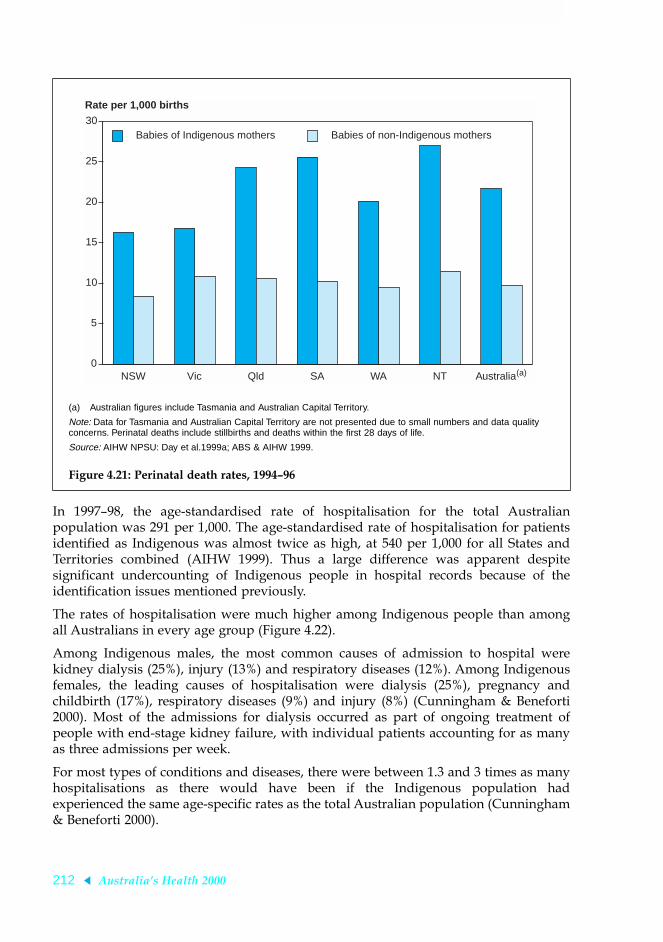
212 AustraliaÕs Health 2000
TRIM SIZE 175 mm Wide x 250 mm Deep
In 1997Ð98, the age-standardised rate of hospitalisation for the total Australianpopulation was 291 per 1,000. The age-standardised rate of hospitalisation for patientsidentified as Indigenous was almost twice as high, at 540 per 1,000 for all States andTerritories combined (AIHW 1999). Thus a large difference was apparent despitesignificant undercounting of Indigenous people in hospital records because of theidentification issues mentioned previously.
The rates of hospitalisation were much higher among Indigenous people than amongall Australians in every age group (Figure 4.22).
Among Indigenous males, the most common causes of admission to hospital werekidney dialysis (25%), injury (13%) and respiratory diseases (12%). Among Indigenousfemales, the leading causes of hospitalisation were dialysis (25%), pregnancy andchildbirth (17%), respiratory diseases (9%) and injury (8%) (Cunningham & Beneforti2000). Most of the admissions for dialysis occurred as part of ongoing treatment ofpeople with end-stage kidney failure, with individual patients accounting for as manyas three admissions per week.
For most types of conditions and diseases, there were between 1.3 and 3 times as manyhospitalisations as there would have been if the Indigenous population hadexperienced the same age-specific rates as the total Australian population (Cunningham& Beneforti 2000).
(a) Australian figures include Tasmania and Australian Capital Territory.
Note: Data for Tasmania and Australian Capital Territory are not presented due to small numbers and data quality concerns. Perinatal deaths include stillbirths and deaths within the first 28 days of life.
Source: AIHW NPSU: Day et al.1999a; ABS & AIHW 1999.
Figure 4.21: Perinatal death rates, 1994Ð96
NSW Vic Qld SA WA NT Australia(a)0
5
10
15
20
25
30
Rate per 1,000 births
Babies of Indigenous mothers Babies of non-Indigenous mothers
01 AH2000 body Page 212 Thursday, June 1, 2000 3:06 PM

4 Health and determinants in population groups 213
TRIM SIZE 175 mm Wide x 250 mm Deep
Dialysis accounted for over 40% of all procedures performed in hospital on patientsidentified as Indigenous (44% among Indigenous males and 41% among Indigenousfemales), compared with about 9% of procedures on other patients (12% among othermales and 7% among other females) (Cunningham & Beneforti 2000).
Use of general practitioners
Not all health problems are treated in hospital, but there is little national informationabout the use of other health care services by Indigenous people. The Bettering theEvaluation And Care of Health (BEACH) survey provides the first opportunity toexamine the use of general medical practitioners (GPs) by Aboriginal and Torres StraitIslander Australians.
About 1.2% of the encounters recorded in the first year of the survey (1998Ð99) were withpatients identified as Indigenous. As 2.1% of the population is Indigenous, this showsclearly the relative under-utilisation of GPs in private practice by Indigenous peoples.The most commonly managed problems for Indigenous patients were upper respiratorytract infections (9% of encounters), acute bronchitis/bronchiolitis (5%), diabetes (5%),acute otitis media/myringitis (5%), asthma (5%) and hypertension (4%). In contrast, themost commonly managed problems among patients overall were hypertension (8% ofencounters), upper respiratory tract infections (7%), immunisation/vaccination (5%) anddepression (4%) (AIHW GPSCU: Britt et al. 1999).
Note: Data from public and private hospitals, except in the Northern Territory (public hospitals only).
Source: Cunningham & Beneforti 2000.
Figure 4.22: Hospital separation rates, all causes excluding dialysis, 1997Ð98
<1 1–4 5–14 15–24 25–34 35–44 45–54 55–64 65–74 75+0
200
400
600
800
1,000
Rate per 1,000 population
Age group (years)
Indigenous males
All Australian males
Indigenous females
All Australian females
01 AH2000 body Page 213 Thursday, June 1, 2000 3:06 PM

214 AustraliaÕs Health 2000
TRIM SIZE 175 mm Wide x 250 mm Deep
No comparable information is available about the use of other primary health careproviders, such as Aboriginal health workers and nurses, or about GP-like interactionsin which they are involved.
Ill health in the communityThe use of health services does not necessarily indicate the prevalence or incidence ofillnesses and conditions in the Indigenous population, but sources of more exactindicators of incidence or prevalence at the national level are limited.
Some information was collected about self-reported illnesses and conditions as part ofthe ABS National Health Survey, which in 1995 included an enhanced sample ofAboriginal and Torres Strait Islander peoples. Although information was collected fromIndigenous people living in urban, rural and remote areas, there were concerns aboutthe quality of some data for some groups of Indigenous people, especially those livingin remote areas and/or who spoke a language other than English at home (ABS 1999a).People living in remote areas are excluded from the following analysis.
After adjusting for age differences, Indigenous people were more likely than non-Indigenous people to report a range of chronic diseases and conditions, such as asthma(Figure 4.23) and diabetes (Figure 4.24) (ABS 1999a).
Note: Excludes persons living in remote areas.
Source: ABS 1999a.
Figure 4.23: Reported asthma, 1995
<5 5–14 15–24 25–44 45–54 55+0
5
10
15
20
25Per cent
Age group (years)
Indigenous
Non-Indigenous
01 AH2000 body Page 214 Thursday, June 1, 2000 3:06 PM

4 Health and determinants in population groups 215
TRIM SIZE 175 mm Wide x 250 mm Deep
The reported use of medications for asthma and diabetes was correspondingly high(ABS & AIHW 1999), but the most commonly reported type of medication, for bothIndigenous and non-Indigenous people, was pain relievers (ABS 1999a).
Health risk factorsSome of the differences in health status can be explained by differences in the healthrisk factors to which people are exposed, such as low socioeconomic status, poor livingconditions, poor nutrition, the use of harmful substances, and violence. As a group,Indigenous people are more likely than other Australians to be exposed to such healthrisk factors.
Social and economic factorsCompared with other Australians, Indigenous people are less likely to be employed andless likely to have post-school educational qualifications. They also have lower personaland household incomes. At the time of the 1996 Census, the unemployment rate forthose aged 15 years or more was about 23% for Indigenous people, compared withabout 9% for other Australians. About 2% of Indigenous people aged 15 years or morereported a Bachelor degree or higher in 1996, compared with 11% of other Australians.The median weekly personal income of Indigenous people in 1996 was $218, below the
Note: Excludes persons living in remote areas.
Source: ABS 1999a.
Figure 4.24: Reported diabetes, 1995
25–44 45–54 55+0
5
10
15
20
25Per cent
Age group (years)
Indigenous
Non-Indigenous
01 AH2000 body Page 215 Thursday, June 1, 2000 3:06 PM

216 AustraliaÕs Health 2000
TRIM SIZE 175 mm Wide x 250 mm Deep
median weekly income recorded for the total population ($294). Median weeklyhousehold income was also lower for Indigenous households ($540) than for otherhouseholds ($632), despite the larger size of Indigenous households (ABS 1998a).
Housing and living conditions
Indigenous people are much less likely than other Australians to live in a home that isowned or being purchased by its occupants, which is generally taken as indicative ofsecurity of tenure. In the 1996 Census, about 31% of Indigenous households owned orwere purchasing their home, compared with 71% of other households (ABS 1998a).Among households renting their dwelling, the majority of Indigenous households(53%) rented their home from either a government agency or a community/cooperativehousing agency, whereas most other renter households (67%) rented from a privateowner (ABS 1998a).
Indigenous households in the 1996 Census were larger than other households(3.7 versus 2.7 people on average) and were much more likely to live in crowdeddwellings. About 2% of all Indigenous households (and almost 7% of Indigenouspeople) lived in dwellings with 10 or more people, compared with only 0.04% of otherhouseholds (and 0.14% of other people). Almost half (49%) of all private dwellings inAustralia with 10 or more people living in them were occupied by Indigenoushouseholds. Among large households (that is, with 10 or more people), Indigenoushouseholds were more likely than other households to live in smaller dwellings. Themajority (70%) of large Indigenous households lived in dwellings with three or fewerbedrooms. In contrast, there were five or more bedrooms in almost half (46%) of thedwellings occupied by other large households (ABS 1998a; ABS & AIHW 1999).
Indigenous households counted in the Census were more likely than other householdsto live in improvised dwellings, such as sheds, humpies or other roughaccommodation. Almost a third (31%) of all households counted in improviseddwellings were Indigenous households (ABS & AIHW 1999), even though Indigenoushouseholds account for less than 2% of all Australian households (ABS 1998a).Indigenous people were also more likely than other Australians to use the SupportedAccommodation Assistance Program, which provides services to people who arehomeless or at risk of being homeless (AIHW 1997).
Nutritional status
Adequate consumption of nutritious foods is important for good health, but littleinformation is currently available at the national level about the food intake of Indigenouspeople. However, it is likely that the economic and geographic disadvantages faced bythe Indigenous population are reflected in nutritional disadvantages as well.
One aspect of nutritional status for which national information does exist is relativeweight. Indigenous people are more likely than other Australians to be classified asobese based on their body mass index (BMI). Among Indigenous adults aged 18 yearsor more who were measured in the 1994 National Aboriginal and Torres Strait IslanderSurvey, about 28% of females and 25% of males were classified as obese (BMI greaterthan 30). This compares unfavourably with figures for all Australians from the 1995
01 AH2000 body Page 216 Thursday, June 1, 2000 3:06 PM

4 Health and determinants in population groups 217
TRIM SIZE 175 mm Wide x 250 mm Deep
National Nutrition Survey, in which 19% of females and the same proportion of malesaged 19 years and over were classified as obese, based on BMI derived from measuredheight and weight (Cunningham & Mackerras 1998).
Drugs and other harmful substances
Indigenous adults are about twice as likely to smoke cigarettes as non-Indigenousadults (Figure 4.25), which puts them at increased risk of heart disease, cancer,respiratory disease and other conditions. Although Indigenous people are more likelythan non-Indigenous people to abstain from alcohol, those who do drink are morelikely to drink at unsafe levels. The use of illicit drugs and other harmful substances(such as leaded petrol) is also of concern among the Indigenous population (ABS &AIHW 1999). For example, a recent study in Western Australia highlighted the rapidincrease in first-time hospital admission rates for Indigenous people for illicit-drugproblems, especially cannabis and amphetamines, during the first half of the 1990s(Patterson et al. 1999).
Exposure to violence
Although it is difficult to quantify precisely the extent of the impact of violence on thehealth and wellbeing of Indigenous Australians, there is strong evidence thatIndigenous people as a group are at increased risk of being exposed to violence.
Note: Excludes people living in remote areas.
Source: ABS 1999a.
Figure 4.25: Smoking prevalence by age group, 1995
18–24 25–44 45–54 55+0
20
40
60
80
100Per cent
Age group (years)
Indigenous males
Non-Indigenous males
Indigenous females
Non-Indigenous females
01 AH2000 body Page 217 Thursday, June 1, 2000 3:06 PM

218 AustraliaÕs Health 2000
TRIM SIZE 175 mm Wide x 250 mm Deep
Deaths from intentional injury are more common for Indigenous people than for otherAustralians. In 1995Ð97 in the Northern Territory, Western Australia and SouthAustralia combined, there were about seven times as many deaths among Indigenousfemales and almost eight times as many deaths among Indigenous males as would havebeen expected if the all-Australian rates had applied (Cunningham & Paradies 2000). Inthe period 1989 to 1996, it was estimated that about 20% of victims and 22% ofoffenders in intimate-partner homicides were Indigenous (Carcach & James 1998).
Indigenous females are grossly overrepresented in hospitalisations recorded as beingdue to intentional injury. Of all hospitalisations among females in 1997Ð98, almost half(46%) of those classified as being due to intentional injury were among femalesidentified as Indigenous. It is possible that some intentional injuries to non-Indigenousfemales were coded as another type of injury, such as Ôaccidental fallsÕ, but this cannotcompletely explain the disparity between the two groups because the rates ofhospitalisation were higher for Indigenous females than for non-Indigenous females foralmost every type of injury. Indigenous males were also at much greater risk ofhospitalisation for intentional injury compared with their non-Indigenous counterparts,but the differences were not as extreme (Cunningham & Beneforti 2000).
Although death registrations and hospital statistics on intentional injury point to aheavy burden of violence among Indigenous people, they do not tell the whole story.Not all victims of violence are admitted to hospital or killed, and not all the results ofviolence are physical. However, there is little good statistical information about otheraspects of violence, such as those relating to mental and emotional wellbeing.
Health services and expenditureAppropriate health services are necessary help reduce disparities in health statusbetween population groups. According to an analysis of health expenditure in thefinancial year 1995Ð96, about $2,320 per person was spent on health services toIndigenous people, compared with $2,163 for services to non-Indigenous people(Deeble et al. 1998). This difference in expenditure (8%) is much smaller than thedifferences for many of the health status measures shown above.
Aboriginal and Torres Strait Islander peoples appear to have a different pattern ofservice use from that for the rest of the population (Figure 4.26), with higher estimatedper person expenditure for Indigenous people for public hospital services andcommunity health services, and lower per person expenditure for Medicare, thePharmaceutical Benefits Scheme, nursing homes, dental and other professional services,and private hospitals (Deeble et al. 1998).
4.7 Socioeconomically disadvantagedThere has been considerable focus in Australia and overseas on the association betweensocioeconomic disadvantage and health. The relationship between increasing mortalityand morbidity with decreasing socioeconomic status has been well demonstrated (Turrellet al. 1999). Similarly, many of the differences in health between groups, such as betweenmen and women, between Indigenous people and non-Indigenous persons, and betweenurban and rural residents, also show a relationship with socioeconomic factors (AIHW:
01 AH2000 body Page 218 Thursday, June 1, 2000 3:06 PM

4 Health and determinants in population groups 219
TRIM SIZE 175 mm Wide x 250 mm Deep
Mathers 1994a). However, the reason for the relationship is not clear and requires furtherwork. A range of risk factors, as well as the social and economic elements, affect health.Health inequalities are caused by a complex interplay of these factors.
There are a number of elements that contribute to socioeconomic status, includingincome, level of education, employment status and occupation. These elements bythemselves, however, do not provide an ideal measure, and their use often depends onthe age group being analysed. Health information by socioeconomically graded areas ofresidence provides a useful way to analyse information for children, retired people and,in some cases, women, where data on occupation, education and income are not alwaysavailable or not relevant (AIHW: Mathers 1994a). The most common measure ofsocioeconomic status by area of residence is the Index of Relative SocioeconomicDisadvantage (IRSD), derived by the Australian Bureau of Statistics from populationcensus data (Box 4.2, page 220).
Analyses of inequalities in health were conducted in the first half of the 1990s by theNational Health Strategy (1992) and the Australian Institute of Health and Welfareusing mortality data for 1985 to 1987, data from the 1988 Survey of Disabled and AgedPersons, the 1989Ð90 National Health Survey, and the 1989 National Heart FoundationRisk Factor Prevalence Survey. These studies found that people of a low socioeconomicstatus generally have higher rates of mortality and are most likely to suffer from
(a) Includes inpatient and outpatient.
Source: Deeble et al. 1998.
Figure 4.26: Estimated per person health expenditure by type of service, 1995Ð96
Publichospitals
Communityhealth
Medicare Nursinghomes
PBS Dental/otherprofessional
Privatehospitals
0
200
400
600
800
1,000
1,200
1,400
Expenditure per person ($)
Type of service
Indigenous
Non-Indigenous
(a)
01 AH2000 body Page 219 Thursday, June 1, 2000 3:06 PM

220 AustraliaÕs Health 2000
TRIM SIZE 175 mm Wide x 250 mm Deep
disability, to have serious chronic illnesses or suffer recent illnesses, and to report beingin only fair or poor health as opposed to good or excellent health. The analysisconducted by the AIHW demonstrated substantial inequalities in health by all measuresof socioeconomic status (education level, employment status, occupation, occupationalprestige, family income and areas of socioeconomic disadvantage) and for all agegroups. People with lower socioeconomic status had higher death rates and reportedhigher levels of illness and reduced activity due to illness (AIHW: Mathers 1994a,1994b, 1995, 1996).
These analyses also demonstrated that the socioeconomically disadvantaged makegreater use of primary and secondary health services such as doctors, hospitals andoutpatient clinics, but are less likely to use preventive health services such as dentists,immunisation and cancer screening tests (e.g. mammograms and Pap smears).
More recently, mortality and morbidity data and data from the 1995 National HealthSurvey have been analysed with regard to socioeconomic status. The findings arereported in the following paragraphs.
Box 4.2: Measures of inequalityIndex of Relative Socioeconomic Disadvantage (IRSD). The IRSD is one of a groupof measures developed by the Australian Bureau of Statistics to categorise small geo-graphic areas according to their social and economic characteristics (ABS 1998d). Thismeasure was used to group people into quintiles of socioeconomic disadvantage accordingto the IRSD for their statistical local area of usual residence, with the first quintile corre-sponding to the group with the highest socioeconomic status and the fifth quintile thelowest.
YLL and YLD rate ratios. These are the age-standardised YLL (years of life lost due topremature mortality) or YLD (years of life lost due to disability) rate per 1,000 populationfor the least socioeconomically disadvantaged quintile divided by the corresponding age-standardised rate for the most socioeconomically disadvantaged quintile. This provides ameasure of the excess mortality or disability among the most disadvantaged which is inde-pendent of variations in age and sex distribution between groups with differentsocioeconomic status. Rate ratios greater than 1 indicate higher mortality or disability forthe most disadvantaged.
Gini coefficient. This is a summary measure of the degree of inequality in some charac-teristic within the population (Wagstaff et al. 1991). In this case the coefficient is calcu-lated for cause-specific YLL and YLD. Its values range from 0 (perfect equality) to 1(perfect inequality) and measure the degree of mortality or disability inequality across thequintiles of socioeconomic disadvantage as measured by the IRSD.
Excess burden. This measure identifies the burden of mortality or disability which maybe attributed to socioeconomic disadvantage (Kunst 1997). It is presented as the per-centage of YLL or YLD which could potentially be avoided if all quintiles had the sameage-standardised YLL or YLD rate as the least disadvantaged quintile.
01 AH2000 body Page 220 Thursday, June 1, 2000 3:06 PM

4 Health and determinants in population groups 221
TRIM SIZE 175 mm Wide x 250 mm Deep
MortalityThe most complete data on socioeconomic status and the burden of disease and injuryis available for mortality. Variability in the mortality burden with socioeconomic statuscan be examined using three measures: the YLL rate ratio, the Gini coefficient and theexcess mortality burden (see Box 4.2).
For all deaths registered for the years 1995Ð97, classified into quintiles of socioeconomicdisadvantage according to the IRSD (see Box 4.2) for their statistical local area of usualresidence (AIHW: Mathers et al. 1999), there is a marked gradient in the mortalityburden across these quintiles. The YLL rate ratio shows that the burden in the mostdisadvantaged group is 41% higher for males and 26% higher for females (Table 4.12,page 222). Looking at specific causes of death, the differentials in mortality burden aresmaller for infectious diseases and cancers but larger for cardiovascular disease, chronicrespiratory conditions, digestive system diseases and injuries.
The Gini coefficient indicates that the overall mortality burden for males is 50% higherthan females (with Gini coefficients of 0.06 and 0.04 respectively). A similar differencebetween males and females is shown in the excess mortality burden, with 19% of themortality burden for males associated with socioeconomic status compared with 12% ofthe burden for females.
This inequality in mortality burden is also reflected in the age-specific probability ofdeath, which is higher at all ages for people in the most disadvantaged quintilecompared with the least disadvantaged quintile.
Analysis of mortality for 1997 and 1998 found that males in the most disadvantagedquintile had 12% higher mortality than the average Australian male, and 30% higherthan males in the least disadvantaged quintile. For females, those in the mostdisadvantaged quintile had a 16% higher level of mortality than those in the leastdisadvantaged quintile (ABS 1999b).
Consistent with these results, analysis of 1995Ð97 mortality data by AIHW found thatamong those aged 15Ð24 years death rates of males in the most disadvantaged quintilewere 70% higher than males in the least disadvantaged quintile, with death rates of 112and 65 per 100,000 population, respectively. Similarly, females in the most disadvantagedquintile had death rates 40% higher than those in the least disadvantaged quintile(35 compared with 26 per 100,000 population) (AIHW: Moon et al. 1999).
This analysis also found that there is a 3.6-year gap in life expectancy at birth for malesbetween the top and bottom quintiles of socioeconomic disadvantage, and a 1.9-yeargap for females. That is, the most socioeconomically disadvantaged in society havelower life expectancies than the least socioeconomically disadvantaged, losing 35%more years of life in 1996 (AIHW: Mathers et al. 1999).
In interpreting these results, it should be borne in mind that the IRSD relates to theaverage disadvantage of all people living in a geographic area. Hence any variabilitybetween groups based on the IRSD will probably be smaller than if the variability hadbeen measured between individuals. In other words, these measures of inequality willin most cases understate the level of inequality in mortality burden by socioeconomicdisadvantage between individuals.
01 AH2000 body Page 221 Thursday, June 1, 2000 3:06 PM

222 AustraliaÕs Health 2000
TRIM SIZE 175 mm Wide x 250 mm Deep
DisabilityThere are no data to measure socioeconomic inequality in YLD for the wholepopulation, but this inequality can be examined for mental disorders. The 1997National Survey of Mental Health and Wellbeing collected data on mental disordersamong the Australian population aged 18 years and over. Survey respondents wereclassified into quintiles of socioeconomic disadvantage using the IRSD to classify placeof usual residence.
The YLD burden due to mental disorders in the most disadvantaged quintile is 45%higher for males and 41% higher for females than the burden in the least disadvantagedquintile. The Gini coefficients show similar levels of inequality for both males andfemales (with coefficients for the burden of mental disorders of 0.07 and 0.06respectively). The excess disability burden from mental disorders is slightly larger forwomen, with 20.0% of the disability burden for mental disorders among womenassociated with socioeconomic status compared with 17.5% of the burden among men(AIHW: Mathers et al. 1999).
Total disease burdenThe lack of data on the burden of disability means that a comprehensive analysis of thetotal disease burden associated with inequalities in socioeconomic status cannot becompleted. However, modelling techniques can be used to derive provisional totalburden estimates (Figure 4.27).
The total burden (DALY) for the most disadvantaged is 37% higher for males and 27%higher for females than the total burden for the least disadvantaged (Table 4.12). Theproportion of total burden associated with inequalities in socioeconomic disadvantageis 18.7% for males and 15.4% for females.
Findings from the 1995 National Health Survey reveal that a greater proportion of bothmales and females in the areas of greatest disadvantage rated their health as fair or poor(rather than good, very good or excellent) than did those from other areas. There was aclear gradient of more negative assessment of health with greater disadvantage of area.
Table 4.12: Differentials in the burden of disease and injury between top and bottom quintiles of socioeconomic disadvantage, age-standardised YLL, YLD and DALYs per 1,000 population, 1996
Males Females Persons
YLL ratio(a) 1.41 (1.38–1.45) 1.26 (1.22–1.29) 1.35 (1.32–1.37)
YLD ratio(a) 1.32 (1.13–1.46) 1.29 (1.05–1.53) 1.30 (1.09–1.44)
DALY ratio(a) 1.37 (1.28–1.43) 1.27 (1.14–1.41) 1.32 (1.22–1.39)
Excess burden (per cent)(b) 18.7 (15.1–21.5) 15.4 (9.3–19.6) 17.1 (13.7–19.4)
(a) Ratio of age-standardised rate per 1,000 population for bottom (5th) quintile of IRSD to the age-standardised rate per 1,000 population for the top (1st) quintile. Range given in brackets is the estimated 95% confidence or uncertainty interval.
(b) Percentage of total burden (DALYs) that would be avoided if all quintiles had the same age-standardised DALY rate as the least disadvantaged (1st) quintile. Range given in brackets is the estimated 95% confidence or uncertainty interval.
Source: AIHW: Mathers et al. 1999.
01 AH2000 body Page 222 Thursday, June 1, 2000 3:06 PM

4 Health and determinants in population groups 223
TRIM SIZE 175 mm Wide x 250 mm Deep
Among all people aged 15 years and over, 17% rated their health as fair or poor, withthis percentage ranging from 12% in the least disadvantaged areas to 22% of those inthe most disadvantaged areas (ABS 1999f).
Of the fifteen most common non-minor illnesses recorded in the survey, five were morecommon in the most disadvantaged areas, including arthritis, asthma, bronchitis/emphysema, ulcer and diabetes. As found in earlier studies, the more socio-economically disadvantaged also made greater use of doctors and outpatient/casualtyservices, but were less likely to use preventive health services (ABS 1999f).
4.8 Rural and remote populationsThe health of populations living in rural and remote areas of Australia is worse than ofthose living in capital cities and other metropolitan areas (AIHW 1998). Mortality andillness levels increase as the distance from metropolitan centres increases. Relativelypoor access to health services, lower socioeconomic status and employment levels,exposure to comparatively harsher environments and occupational hazards contributeto and may explain most of these inequalities. Also, a large proportion of the populationin the more remote parts of Australia are Aboriginal and Torres Strait Islander peoples,who generally have poorer health status.
Source: AIHW: Mathers et al. 1999.
Figure 4.27: Estimated burden of disease and injury (age-standardised DALYs per 1,000 population) by quintile of area of socioeconomic disadvantage, by sex, 1996
1stquintile
2ndquintile
3rdquintile
4thquintile
5thquintile
0
40
80
120
160
200
YLL
YLD
1stquintile
2ndquintile
3rdquintile
4thquintile
5thquintile
0
40
80
120
160
200DALYs per 1,000 population
Small area Index of Relative Socioeconomic Disadvantage
Males Females
01 AH2000 body Page 223 Thursday, June 1, 2000 3:06 PM

224 AustraliaÕs Health 2000
TRIM SIZE 175 mm Wide x 250 mm Deep
The geographical basis of reporting in this section is the Rural, Remote andMetropolitan Areas (RRMA) classification which is outlined in Table 4.13. Thisclassification is based mainly on population numbers and an index of remoteness (DPIE& DHSH 1994).
Demographic and environmental factorsAbout 29% of the Australian population (including 64% of the Indigenous population)live in rural and remote Australia. Although Aboriginal and Torres Strait Islanderpeoples constitute about 2.1% of the total Australian population, they make up 1% ofthe capital city population and 20% of the population of the remote zone. The remotezone also has a low or negative population growth rate, higher fertility rates, morechildren and fewer old people (AIHW 1998), and Year 12 high school completion ratestend to be 10% lower than in capital cities (SCRCSSP 1997). The Index of RelativeSocioeconomic Disadvantage tends to increase with increasing remoteness(AIHW 1998).
Risk factors Personal health risk factors tend to be worse in remote areas than in metropolitan areas.For example, a higher proportion of males in remote areas self-report high alcoholconsumption (8.0% compared with 4.4% in capital cities). Also, in remote areas a higherproportion of people smoke (approximately 10 percentage points higher for both sexes)and a lower proportion of men walk for exercise (AIHW 1998). Based on self-reportedmeasures of height and weight, a higher proportion of women from remote areas areoverweight.
Table 4.13: Population distribution by Rural, Remote and Metropolitan Areas classification
RRMA category
Population (1998)Population
growth1991–96
(per cent)
Indigenous population (1996)(a)
Number Per cent Number Per cent
Metropolitan
Capital cities 11,952,545 63.8 1.2 117,103 1.0
Other metropolitan centres 1,421,040 7.6 1.8 22,880 1.7
Rural
Large rural centres 1,119,312 6.0 1.5 33,435 3.1
Small rural centres 1,218,495 6.5 1.2 34,009 2.8
Other rural areas 2,466,695 13.2 0.9 63,807 2.6
Remote
Remote centres 224,168 1.2 0.1 27,530 12.6
Other remote areas 345,549 1.8 –0.3 87,088 25.9
Total 18,747,804 100.0 1.2 385,852 2.1
(a) 1998 estimates of the Indigenous population by statistical local area (SLA) were not available.
Source: AIHW, derived from ABS SLA population estimates.
01 AH2000 body Page 224 Thursday, June 1, 2000 3:06 PM

4 Health and determinants in population groups 225
TRIM SIZE 175 mm Wide x 250 mm Deep
Mortality and morbidityDeath rates show a graduated increase with increasing remoteness. Death rates varyaccording to age and sex grouping, but overall the rates for the Indigenous populationare two to three times higher than those of the non-Indigenous population. The higherdeath rates in remote areas for the population overall can be largely explained by thehigh proportion of Indigenous peoples living in those areas (Table 4.14).
The death rate for Indigenous people in the remote zone was about 10% higher than forIndigenous people in the metropolitan zone. A major reason for this was the higherrates of death from respiratory disease and injury in the remote zone.
The death rates for non-Indigenous males and females in the remote zone were lowerthan in the metropolitan zone, even though rates of injury-related death were higher inthe remote zone.
Indigenous males in the rural zone have a similar death rate to their metropolitancounterparts, and Indigenous females have a death rate 10% lower than theirmetropolitan counterparts (Table 4.14). Death rates for non-Indigenous people weresimilar or only slightly higher for the rural zone compared with the metropolitan zone.
Recent data indicate that the health of those in remote areas is generally poorer in eachof the National Health Priority Areas:
¥ Mortality from heart, stroke and vascular disease is marginally higher in remote areasthan in metropolitan areas. Mortality from rheumatic heart disease is almost threetimes higher in remote areas, reflecting the high rate in the Indigenous population.The hospital admission rate for coronary heart disease is 1.4 times higher, and theadmission rates for stroke are 1.4 times higher for males and 1.6 times higher forfemales in remote areas than in metropolitan areas (DHAC & AIHW 1999b).
¥ Whereas rural and metropolitan death rates from diabetes are similar, death rates inremote areas are approximately twice as high, reflecting the high rate in Indigenouspeople. Hospital admission rates for rural residents are a little higher, and admission
Table 4.14: Mortality rates for the Indigenous and non-Indigenous populations by geographic zone, 1994Ð98 (per 100,000 population)
Indigenous status
Death rate 1994–98
Metropolitan Rural Remote Total
Males Indigenous 1,763 1,721 1,916 1,825
Non-Indigenous 773 *800 746 778
Total males 779 *809 *948 805
Females Indigenous 1,215 1,097 1,361 1,286
Non-Indigenous 507 502 *454 505
Total females 511 509 *649 524
* Significantly different from the metropolitan zone at the 5% level.
Notes
1. Age standardised to the Australian population at 30 June 1991.
2. Based on data for South Australia, Western Australia and the Northern Territory.
Source: AIHW 1998a.
01 AH2000 body Page 225 Thursday, June 1, 2000 3:06 PM

226 AustraliaÕs Health 2000
TRIM SIZE 175 mm Wide x 250 mm Deep
rates for remote residents are more than 2.5 times higher than those for theirmetropolitan counterparts (DHAC & AIHW 1999a).
¥ Cancer mortality is similar in metropolitan, rural and remote areas. People living inthe remote zone show higher cervical cancer and slightly lower melanoma incidenceand death rates (AIHW 1998).
¥ Death rates and hospital admissions due to injury are moderately higher in rural areas,but two to three times higher in remote areas compared with capital cities (AIHW1998a). In remote areas, approximately 30% of these extra injury deaths are attributableto motor vehicle accidents, 20% to suicide and 10% to interpersonal violence.
¥ There are few comparative data available on mental health; however, higher suiciderates, particularly in young men from rural and remote areas, may indicate higherlevels of depression (DHAC & AIHW 1999c). In Ôother remote areasÕ, the male suiciderate is one-and-a-half times the capital cities rate, and the suicide rate of males aged15Ð24 years is almost twice that of their capital city counterparts.
¥ Asthma death rates are up to twice as high in more remote areas compared withmetropolitan centres (AIHW 1998).
Children and youthDeath rates for children aged less than 15 years are higher with increasing remoteness.Half of all deaths in this age group are due to injury, with smaller proportions due tocancer and asthma. In the remote zone, where the death rate is almost double that formetropolitan children, over 60% of these extra deaths were due to injury, and of thesehalf were as a result of motor vehicle accidents and a third were due to drowning (withboys having higher rates than girls for all these causes). Death rates for all childrenfrom the rural zone fall between the rates for metropolitan and remote zones (AIHW:Moon et al. 1998).
Death rates for Indigenous children in the metropolitan and remote zones wereapproximately double those for non-Indigenous children in those zones. Indigenouschildren from the remote zone had death rates double that of metropolitan and ruralzone Indigenous children.
Hospital admission rates for girls and boys were higher in the remote zone (172 and227 per 1,000 population respectively) than in the rural zone (113 and 156 per 1,000population respectively) and in the metropolitan zone (113 and 156 per 1,000 populationrespectively).
Death rates for young adults (those aged 15Ð24 years) increase with increasingremoteness. The death rate for young adult males in Ôother remote areasÕ was twice thatfor their capital city counterparts. Death from motor vehicle accidents was three timesmore likely for young adults in remote areas compared with those living in capitalcities. Young males from remote areas are almost twice as likely to commit suicidecompared with young males from capital cities. Injury death rates for young adults fellsubstantially in the last decade in all three zones, with rates for motor vehicle accidentdeaths decreasing by about 40%. However, rates for suicide death increased by about16% in the last decade.
01 AH2000 body Page 226 Thursday, June 1, 2000 3:06 PM

4 Health and determinants in population groups 227
TRIM SIZE 175 mm Wide x 250 mm Deep
Death rates for young Indigenous adults (15Ð24 years) are double the rate for all youngAustralian adults in this age group across all three zones. The death rate for youngIndigenous males in the remote zone was twice that of their metropolitan zoneIndigenous counterparts, but for young Indigenous females there was no significantdifference between death rates in each zone. Almost 70% of these Indigenous deathswere due to injury as for all young adults.
Hospital admission rates for young adults increase with increasing remoteness. Femaleswere admitted at twice the rate of males (though this difference was greater in moreremote areas). In Ôother remote areasÕ the hospital admission rate for males and femalesrespectively were one-and-a-half times and two-and-a-half times the admission rate oftheir capital city counterparts. Of the leading causes for male admission, only injuryshowed a clear and strong trend for significantly higher rates (three times higher) inÔother remote areasÕ compared with capital cities. Females in Ôother remote areasÕ wereadmitted for pregnancy-related reasons at a rate 2.5 times higher and for injury at a rate4 times higher than their capital city counterparts.
Oral healthMajor differences in oral health exist between the metropolitan, rural and remote areas.Variations in tooth loss indicate differing historical treatment patterns between urban,rural and remote locations.
Complete tooth loss increases with increasing age (Table 4.15). In total, less than 2% ofadults aged less than 45 years had lost all their natural teeth, but this increased to morethan one in five rural adults in the 45Ð64 age group. Adults aged 65 years and over fromrural areas had a higher rate of complete tooth loss than adults from remote ormetropolitan areas.
See page 285 for information on the use of dental services by persons in urban, ruraland remote areas.
Health workforce The number of healthcare professionals in an area is an important factor in influencingboth health status and access to care. The availability of healthcare professionals acrossthe geographic areas is described in section 5.4 (page 260)
Table 4.15: Complete tooth loss among adults aged 18 years and over, 1994Ð96 (per cent)
Age group Metropolitan Rural Remote Australia
18–24 years 0.1 0.2 0.0 0.1
25–44 years 1.4 2.1 *2.2 1.8
45–64 years 11.7 21.5 *14.8 14.2
65+ years 36.6 50.0 43.2 40.3
Total 9.3 16.2 9.4 10.9
* Estimate has a relative standard error greater than 25%.
Source: National Dental Telephone Interview Surveys 1994, 1995, 1996.
01 AH2000 body Page 227 Thursday, June 1, 2000 3:06 PM

228 AustraliaÕs Health 2000
TRIM SIZE 175 mm Wide x 250 mm Deep
Expenditure and accessThere are 65% more public hospital beds available per person in the rural zonecompared with capital cities. The per person amount spent on hospitalisation (asmeasured by average cost weight and ignoring length of stay) is similar for residents ofmetropolitan and rural zones (AIHW 1998). Hospital admission rates are 20Ð40% higherfor remote zone residents (due to higher rates of medical admission) compared withresidents of capital cities, but rates of admission for remote area residents requiringspecialist medical practitioners and equipment are lower, being 70Ð90% of capital cityrates (AIHW 1998).
ReferencesABS 1977. Births 1975. ABS Reference No. 4.4. Canberra: ABS.
ABS 1990. Causes of death, Australia, 1988. ABS Cat. No. 3303.0. Canberra: ABS.
ABS 1998a. 1996 Census of Population and Housing: Aboriginal and Torres StraitIslander people, Australia. ABS Cat. No. 2034.0. Canberra: ABS.
ABS 1998b. Births 1997. ABS Cat. No. 3301.0. Canberra: ABS.
ABS 1998c. Mental health and wellbeing: profile of adults, Australia, 1997. ABS Cat.No. 4326.0. Canberra: ABS.
ABS 1998d. 1996 Census of Population and Housing: socioeconomic indexes for areas.Information paper. ABS Cat. No. 2039.0. Canberra: ABS.
ABS 1999a. National Health Survey: Aboriginal and Torres Strait Islander results,Australia, 1995. ABS Cat. No. 4806.0. Canberra: ABS.
ABS 1999b. Deaths Australia, 1998. ABS Cat. No. 3302.0. Canberra: ABS.
ABS 1999c. Disability, ageing and carers: summary of findings. ABS Cat. No. 4430.0.Canberra: ABS.
ABS 1999d. Births Australia, 1998. ABS Cat. No. 3301.0. Canberra: ABS.
ABS 1999e. Causes of death, Australia, 1998. ABS Cat. No. 3303.0. Canberra: ABS.
ABS 1999f. Health and socio-economic disadvantage of area. Australian Social Trends.ABS Cat. No. 4102.0. Canberra: ABS.
ABS & AIHW 1999. The health and welfare of AustraliaÕs Aboriginal and Torres StraitIslander peoples. ABS Cat. No. 4704.0. AIHW Cat. No. IHW 3. Canberra: ABS & AIHW.
ABS & DHAC 1999. National Nutrition Survey 1995: foods eaten, Australia. ABS Cat.No. 4804.0. Canberra: ABS.
AIHW 1997. SAAP national data collection annual report 1996Ð97 Australia. AIHW Cat.No. HOU 10. Canberra: AIHW.
AIHW 1998. Health in rural and remote Australia. AIHW Cat. No. PHE 6. Canberra:AIHW.
AIHW 1999. Australian hospital statistics 1997Ð98. AIHW Cat. No. HSE 6. HealthServices Series. Canberra: AIHW.
01 AH2000 body Page 228 Thursday, June 1, 2000 3:06 PM

4 Health and determinants in population groups 229
TRIM SIZE 175 mm Wide x 250 mm Deep
AIHW GPSCU: Britt H, Sayer GP, Miller GC, Charles J, Scahill S, Horn F, Bhasale A &McGeechan K 1999. General practice activity in Australia, 1998Ð99. AIHW Cat. No.GEP 2. Canberra: AIHW GPSCU.
AIHW NPSU & Fertility Society of Australia 1999. Assisted conception, Australia andNew Zealand, 1997. Assisted Conception Series No. 4. Sydney: AIHW NPSU.
AIHW NPSU 1993. Caesarean births in Australia 1985Ð1990. Sydney: AIHW NPSU.
AIHW NPSU: Day P, Sullivan E, Ford J & Lancaster P 1999a. AustraliaÕs mothers andbabies 1997. Perinatal Statistics Series No. 9. AIHW Cat. No. PER 12. Sydney: AIHWNPSU.
AIHW NPSU: Day P, Sullivan E & Lancaster P 1999b. Indigenous mothers and theirbabies, Australia, 1994Ð96. Perinatal Statistics Series No. 8. Sydney: AIHW NPSU.
AIHW NPSU: Hurst T, Shafir E, Day P & Lancaster P 1999. Congenital malformations,Australia, 1995 and 1996. Birth Defects Series No. 3. Sydney: AIHW NPSU.
AIHW: de Looper M & Bhatia K 1998. International healthÑhow Australia compares.AIHW Cat. No. PHE 8. Canberra: AIHW.
AIHW: de Looper M & Bhatia K 2000 (forthcoming). Australian health trends 2000.Canberra: AIHW.
AIHW: Mathers C 1994a. Health differentials among adult Australians aged 25Ð64 years.AIHW Health Monitoring Series No. 1. Canberra: AGPS.
AIHW: Mathers C 1994b. Health differentials among older Australians. HealthMonitoring Series No. 2. Canberra: AGPS.
AIHW: Mathers C 1995. Health differentials among Australian children. HealthMonitoring Series No. 3. Canberra: AGPS.
AIHW: Mathers C 1996. Health differentials among young Australians adults. HealthMonitoring Series No. 4. Canberra: AGPS.
AIHW: Mathers C, Vos T & Stevenson C 1999. The burden of disease and injury inAustralia. AIHW Cat. No. PHE 17. Canberra: AIHW.
AIHW: Moon L, Meyer P & Grau J 1999. AustraliaÕs young people: their health andwellbeing 1999. AIHW Cat. No. PHE 19. Canberra: AIHW.
AIHW: Moon L, Rahman N & Bhatia K 1998. AustraliaÕs children: their health andwellbeing 1998. AIHW Cat. No. PHE 7. Canberra: AIHW.
ATSIHWIU 1997. The Aboriginal and Torres Strait Islander health information planÉthis time letÕs make it happen. AIHW Cat. No. HWI 12. Canberra: AHMAC, AIHW &ABS.
ATSIHWIU 1999. Assessing the quality of identification of Aboriginal and Torres StraitIslander people in hospital data. Canberra: AHMAC, AIHW & ABS.
Bishop B 1999. The National Strategy for an Ageing Australia: healthy ageingdiscussion paper. Canberra: AusInfo.
01 AH2000 body Page 229 Thursday, June 1, 2000 3:06 PM

230 AustraliaÕs Health 2000
TRIM SIZE 175 mm Wide x 250 mm Deep
Carcach C & James M 1998. Homicide between intimate partners in Australia. Trendsand Issues in Crime and Criminal Justice No. 90. Canberra: Australian Institute ofCriminology.
CBCS (Commonwealth Bureau of Census and Statistics) 1965. Demography 1965.Bulletin No. 83. Canberra: Government Printing Office.
Centre for Community Child Health 2000. A review of the early childhood literature.Canberra: Department of Family and Community Services (in press).
Chan A, Scott J, McCaul K & Keane R 1999. Pregnancy outcome in South Australia 1997.Adelaide: South Australian Health Commission.
Condon JR, Williams DJ, Pearce MC & Moss E 1998. Northern Territory hospitalmorbidity data set: validation of demographic data 1997. Darwin: Territory HealthServices.
Cunningham J & Beneforti M 2000 (forthcoming). Occasional paper: hospital statistics,Indigenous Australians. Canberra: ABS.
Cunningham J & Mackerras D 1998. Occasional paper: overweight and obesity,Indigenous Australians. ABS Cat. No. 4702.0. Canberra: ABS.
Cunningham J & Paradies Y 2000. Occasional paper: mortality of IndigenousAustralians. ABS Cat. No. 3315.0. Canberra: ABS.
Deeble J, Mathers C, Smith L, Goss J, Webb R & Smith V 1998. Expenditures on healthservices for Aboriginal and Torres Strait Islander people. AIHW Cat. No. HWE 6.Canberra: AIHW, DHFS & NCEPH.
DHAC & AIHW 1999a. National health priority areas report: diabetes mellitus 1998.AIHW Cat. No. PHE 10. Canberra: DHAC & AIHW.
DHAC & AIHW 1999b. National health priority areas report: cardiovascular health1998. AIHW Cat. No. PHE 9. Canberra: DHAC & AIHW.
DHAC & AIHW 1999c. National health priority areas report: mental health 1998. AIHWCat. No. PHE 11. Canberra: DHAC & AIHW.
DHAC 1998. National action plan for suicide. Canberra: DHAC.
DHFS & AIHW 1998. National Health Priority Areas report on cancer control 1997.AIHW Cat. No. PHE 4. Canberra: DHFS & AIHW.
DPIE & DHSH 1994. Rural, remote and metropolitan areas classification. 1991 Censusedition. Canberra: AGPS.
FECCA (Federation of Ethnic CommunitiesÕ Councils of Australia 1997). Dispelling themythÑa little bit of sugar. Canberra: Diabetes Australia.
Glover S, Burns J, Butler H & Patton G 1998. Social environments and the emotionalwellbeing of young people. Family Matters 49:11Ð6.
Kliewer E & Jones R 1998. Changing patterns of immigrant health and use of medicalservicesÑresults from the longitudinal survey of immigrants to Australia (LSIA).Canberra: Department of Immigration and Multicultural Affairs.
01 AH2000 body Page 230 Thursday, June 1, 2000 3:06 PM

4 Health and determinants in population groups 231
TRIM SIZE 175 mm Wide x 250 mm Deep
Kunst A 1997. Cross national comparisons of socio-economic differences in mortality.Rotterdam: Erasmus University.
Medical Research Council Vitamin Study Research Group 1991. Prevention of neuraltube defects: results of the Medical Research Council Vitamin Study Research Group.Lancet 338:131Ð7.
NHF 1996. Heart and stroke facts 1996 report. Canberra: National Heart Foundation ofAustralia.
NHMRC 1993. Revised statement on the relationship between dietary folic acid andneural tube defects such as spina bifida. Canberra: National Health and MedicalResearch Council.
NHMRC 1998. Report on maternal deaths in Australia 1991Ð1993. Canberra: NationalHealth and Medical Research Council.
OECD 1999. OECD Health data 99: a comparative analysis of 29 countries. Paris: OECD.
Patterson KM, Holman CDJ, English DR, Hulse GK & Unwin E 1999. First-time hospitaladmissions with illicit drug problems in Indigenous and non-Indigenous WesternAustralians: an application of record linkage to public health surveillance. Australianand New Zealand Journal of Public Health 23(5):460Ð3.
Resnick MD, Bearman PS, Blum RW, Bauman KE, Harris KM et al. 1997. Protectingadolescents from harm: findings from the National Longitudinal Study on AdolescentHealth. Journal of the American Medical Association 278 (10):823Ð32.
SCRCSSP (Steering Committee for the Review of Commonwealth/State ServiceProvision) 1997. Report on government service provision 1997. Melbourne: IndustryCommission.
Thomson N 1991. A review of Aboriginal health status. In: Reid J & Tromf P (eds). Thehealth of Aboriginal Australia. Sydney: Harcourt Brace Jovanovich.
Turrell G, Oldenburg B, McGuffog I & Dent R 1999. Socioeconomic determinants ofhealth: towards a national research program and a policy and intervention agenda.Canberra: AusInfo.
UNICEF 1999. The state of the worldÕs children 2000. New York: UNICEF.
Wagstaff A, Paci P & Doorslaer EV 1991. On the measurement of inequalities in health.Social Science and Medicine 33:545Ð57.
Young C 1992. Mortality: the ultimate indicator of survival: the differential experiencebetween birthplace groups. In: Donovan J, dÕEspaignet ET, Merton C & vanOmmeren M (eds). Immigrants in Australia: a health profile. Ethnic Health SeriesNo. 1. Canberra: AGPS.
01 AH2000 body Page 231 Thursday, June 1, 2000 3:06 PM

232 AustraliaÕs Health 2000
TRIM SIZE 175 mm Wide x 250 mm Deep
5 Health resources and use of services
The focus of this chapter is on:
¥ the resources or inputs (money, personnel, facilities) used in the delivery of healthservices; and
¥ use of these inputs to produce outputs (patients treated, health services delivered).
Resources provide the means by which health interventions are carried out, and theseinterventions produce outputs and outcomes which may contribute to health andwellbeing.
Clinical interventions can occur in a diverse range of settings such as large healthestablishments (hospitals), other health establishments (nursing homes, hospices,rehabilitation centres), community centres, small health clinics, ambulatory care services,the private rooms of health professionals, and the patientÕs home or workplace.Increasingly, telemedicine services and the Internet are being used to communicateinformation about health services. At the personal level, individuals may also choose touse information from reference material to self-manage minor medical conditions.
Public, occupational and environmental health interventions may be delivered in severalways: through information in the media; regulation; improved water, sewerage, andtransport infrastructure; and infectious disease identification and containment programs.
5.1 Health services funding and expenditureThe health expenditure statistics examined here relate largely to expenditure on healthservices provided to people who are ill and services provided within the health sectoraimed at health promotion and illness prevention. They do not include expendituresthat have a ÔhealthÕ outcome but which are undertaken outside the health sector, such asexpenditure on building safer transport systems.
Box 5.1: Health services expenditure to GDP ratioFrom November 1998, the Australian Bureau of Statistics (ABS) upgraded gross domesticproduct (GDP) measures in line with the recommendations of the revised internationalstandard for the System of National Accounts 1993 (SNA93). This increased the estimateof GDP by an average of 3.0%. In 1997Ð98, the GDP was revised upwards by $16.9 bil-lion, of which $15.9 billion was due to the SNA93 recommendations. These changes haveresulted in a reduction of about 0.3% in the health services expenditure to GDP ratios forall years.
For further details see the 1998 ABS publication Upgraded Australian NationalAccounts, ABS Cat. No. 5253.0.
01 AH2000 body Page 232 Thursday, June 1, 2000 3:06 PM

5 Health resources and use of services 233
TRIM SIZE 175 mm Wide x 250 mm Deep
Health services expenditure is looked at in terms of total health expenditure,expenditures on the different components of the health care system, and the sources offunding for health services. Some factors contributing to changes in health servicesexpenditure are examined and a comparison is made of health services expenditure bythe State and Territory Governments. AustraliaÕs expenditure on health services is alsocompared with that of other Organisation for Economic Co-operation and Development(OECD) member countries.
Funding health services in AustraliaIn 1997Ð98, total health services expenditure, including expenditure by both thegovernment and the non-government sectors, was $47,030 million. Health servicesexpenditure as a proportion of gross domestic product (GDP) almost doubled over thelast four decades of the twentieth century, from 4.3% in 1960Ð61 to 8.3% in 1997Ð98(Table 5.1, page 234). The preliminary estimate for 1998Ð99 is $50,335 million. Most ofthis increase was in the Ôpre-MedibankÕ period, from 1960Ð61 to 1974Ð75, and the firstyear of Medibank, and was largely due to reclassification of expenditure by States asthey moved towards cost-sharing of hospitals with the Commonwealth. Since theintroduction of Medibank in 1975, health expenditure as a proportion of GDP hasincreased from 6.3% to 8.3%.
More than two-thirds of the funding for health expenditure in 1997Ð98 was provided bygovernments (68.6%). Of this, the Commonwealth Government provided 45.2% andState and local governments 23.4%. The non-government sector provided the remaining31.4% of the total funding (Table 5.2, page 235).
The way health services are funded, particularly by the Commonwealth and the non-government sector, was quite different in 1997Ð98 from what had prevailed in 1960Ð61.Despite similarities in the overall proportions of expenditureÑthe CommonwealthGovernment was responsible for 39.2% of total expenditure in 1960Ð61 and 45.2% in1997Ð98Ñthere were major differences in the way that funding was provided. In1960Ð61, tax expenditures accounted for 30.0% of Commonwealth Governmentexpenditure on health services. In 1997Ð98, tax expenditures made up only 1.6% ofCommonwealth health services expenditure. Similarly, tax expenditures by theCommonwealth greatly reduced the net expenditure by non-government sources in1960Ð61, but this was not the case in 1997Ð98.
Between 1960Ð61 and 1997Ð98, real expenditure by the Commonwealth Governmentgrew at an average of 6.4% per year (Table 5.3, page 236). At the same time, State andlocal government real expenditure grew at an average of 4.7% per year, and the non-government sector at 4.0% per year. The rapid rate of growth in the CommonwealthÕsexpenditure was largely due to the influence of Medibank in permanently changing thedistribution of responsibility for the funding of hospital and medical services.
The relative share of responsibility for funding healthcare services in Australia over thelast quarter of the twentieth century was very largely influenced by the introduction ofMedibank and its modifications (1975 to 1984) and Medicare (from 1984).
With the introduction of Medibank in 1975, the Commonwealth took over responsibilityfor funding half the operating costs of the StatesÕ public hospitals and assumed most ofthe responsibility for funding medical services. This increased the CommonwealthÕs
01 AH2000 body Page 233 Thursday, June 1, 2000 3:06 PM
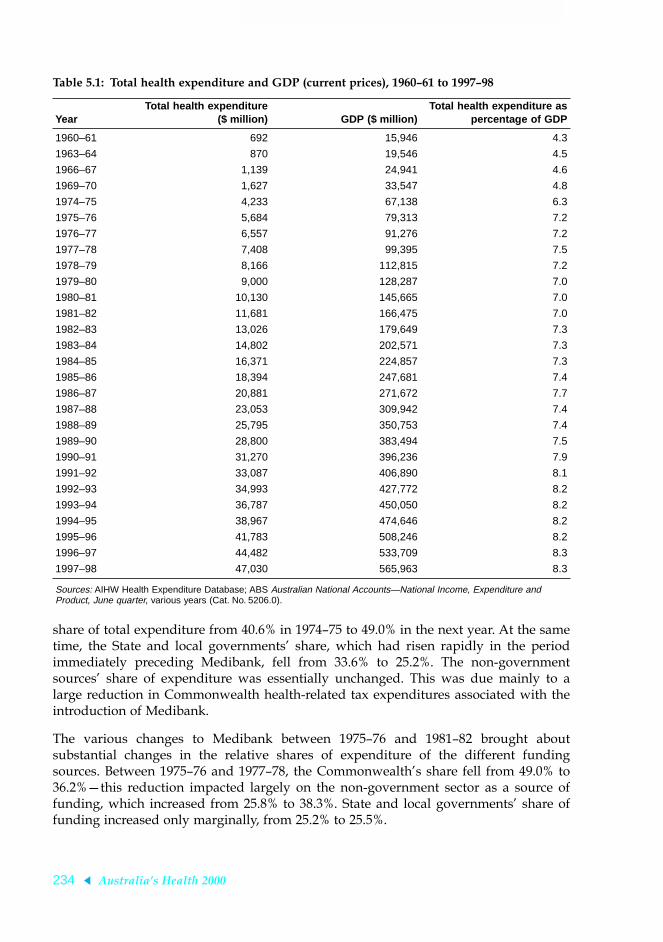
234 AustraliaÕs Health 2000
TRIM SIZE 175 mm Wide x 250 mm Deep
share of total expenditure from 40.6% in 1974Ð75 to 49.0% in the next year. At the sametime, the State and local governmentsÕ share, which had risen rapidly in the periodimmediately preceding Medibank, fell from 33.6% to 25.2%. The non-governmentsourcesÕ share of expenditure was essentially unchanged. This was due mainly to alarge reduction in Commonwealth health-related tax expenditures associated with theintroduction of Medibank.
The various changes to Medibank between 1975Ð76 and 1981Ð82 brought aboutsubstantial changes in the relative shares of expenditure of the different fundingsources. Between 1975Ð76 and 1977Ð78, the CommonwealthÕs share fell from 49.0% to36.2%Ñthis reduction impacted largely on the non-government sector as a source offunding, which increased from 25.8% to 38.3%. State and local governmentsÕ share offunding increased only marginally, from 25.2% to 25.5%.
Table 5.1: Total health expenditure and GDP (current prices), 1960Ð61 to 1997Ð98
YearTotal health expenditure
($ million) GDP ($ million)Total health expenditure as
percentage of GDP
1960–61 692 15,946 4.3
1963–64 870 19,546 4.5
1966–67 1,139 24,941 4.6
1969–70 1,627 33,547 4.8
1974–75 4,233 67,138 6.3
1975–76 5,684 79,313 7.2
1976–77 6,557 91,276 7.2
1977–78 7,408 99,395 7.5
1978–79 8,166 112,815 7.2
1979–80 9,000 128,287 7.0
1980–81 10,130 145,665 7.0
1981–82 11,681 166,475 7.0
1982–83 13,026 179,649 7.3
1983–84 14,802 202,571 7.3
1984–85 16,371 224,857 7.3
1985–86 18,394 247,681 7.4
1986–87 20,881 271,672 7.7
1987–88 23,053 309,942 7.4
1988–89 25,795 350,753 7.4
1989–90 28,800 383,494 7.5
1990–91 31,270 396,236 7.9
1991–92 33,087 406,890 8.1
1992–93 34,993 427,772 8.2
1993–94 36,787 450,050 8.2
1994–95 38,967 474,646 8.2
1995–96 41,783 508,246 8.2
1996–97 44,482 533,709 8.3
1997–98 47,030 565,963 8.3
Sources: AIHW Health Expenditure Database; ABS Australian National Accounts—National Income, Expenditure and Product, June quarter, various years (Cat. No. 5206.0).
01 AH2000 body Page 234 Thursday, June 1, 2000 3:06 PM

5 Health resources and use of services 235
TRIM SIZE 175 mm Wide x 250 mm Deep
The next significant event affecting the relativities between the different sectors was theintroduction of Medicare in February 1984. Medicare raised the CommonwealthÕs share ofexpenditure from 38.0% in 1983Ð84 to 45.8% in 1984Ð85. This was almost completely offsetby the fall in the share met by the non-government sector, which dropped from 35.6% to28.4%. Once again there was only a marginal impact on the share of expenditure met byState and local governments, which fell slightly, from 26.4% to 25.8%.
Table 5.2: Government and non-government sector expenditure as a proportion of total health services expenditure, 1960Ð61 to 1997Ð98 (current prices) (per cent)
Year
Government sector Non-governmentsector (a) All sectors totalCommonwealth (a) State and local Total
1960–61 39.2 23.3 62.5 37.5 100.0
1963–64 40.6 22.1 62.7 37.3 100.0
1966–67 41.7 22.5 64.3 35.7 100.0
1969–70 41.3 28.6 69.9 30.1 100.0
1974–75 40.6 33.6 74.3 25.7 100.0
1975–76 49.0 25.2 74.2 25.8 100.0
1976–77 42.2 25.1 67.3 32.7 100.0
1977–78 36.2 25.5 61.7 38.3 100.0
1978–79 35.6 26.7 62.3 37.7 100.0
1979–80 34.9 26.6 61.5 38.5 100.0
1980–81 35.6 27.1 62.7 37.3 100.0
1981–82 38.9 27.3 66.1 33.9 100.0
1982–83 37.7 27.1 64.8 35.2 100.0
1983–84 38.0 26.4 64.4 35.6 100.0
1984–85 45.8 25.8 71.6 28.4 100.0
1985–86 45.5 25.9 71.4 28.6 100.0
1986–87 44.1 26.3 70.4 29.6 100.0
1987–88 43.8 25.9 69.7 30.3 100.0
1988–89 42.5 25.7 68.2 31.8 100.0
1989–90 42.2 26.1 68.3 31.7 100.0
1990–91 42.2 25.5 67.7 32.3 100.0
1991–92 42.8 24.6 67.4 32.6 100.0
1992–93 43.7 23.4 67.1 32.9 100.0
1993–94 45.3 21.4 66.7 33.3 100.0
1994–95 45.0 21.7 66.7 33.3 100.0
1995–96 45.6 22.2 67.7 32.3 100.0
1996–97 44.6 22.4 66.9 33.1 100.0
1997–98 45.2 23.4 68.6 31.4 100.0
(a) Proportions for Commonwealth Government and non-government sector expenditure are calculated after adjusting for tax expenditure (see Box 5.3, page 237).
Sources: 1960–61, 1963–64 and 1966–67: Senate Select Committee on Medical and Hospital Costs 1970; 1974–75: WD Scott & Co. Pty Ltd 1978; 1975–76 to 1997–98: AIHW Health Expenditure Database.
01 AH2000 body Page 235 Thursday, June 1, 2000 3:06 PM

236 AustraliaÕs Health 2000
TRIM SIZE 175 mm Wide x 250 mm Deep
Box 5.2: Constant price estimatesIn previous editions of AustraliaÕs Health, the Australian Institute of Health and Welfareincluded estimates of expenditure at Ôconstant (average 1989Ð90) pricesÕ. These were, inthe main, calculated using implicit price deflators (IPDs) that were, in turn, based onfixed-weighted indexes (1989Ð90 base). The ABS has now ceased calculating constantprice expenditure estimates based on such fixed-weighted indexes and has moved to annu-ally reweighted chain volume measures. In the tables that follow, wherever Ôconstant priceÕestimates are shown they are intended to reflect changes in volume expressed in terms ofcurrent prices in the reference yearÑ1997Ð98 in this publication. These estimates are cal-culated using IPDs that are derived from the new series of annually reweighted chainvolume indexes produced by ABS.
These new IPDs are considered to be superior to those used previously in that they lessenthe effect of compositional change.
A full discussion of chain volume measures can be found in the 1997 ABS publicationChain Volume Measures in the Australian National Accounts, ABS Cat. No. 5248.0.
Table 5.3: Total health services expenditure, constant prices(a), and annual growth rates, by source of funds, 1960Ð61 to 1997Ð98
Year
Government sector Non-government sector (b) All sectors totalCommonwealth (b) State and local
Amount($m)
Rate ofgrowth
(%)Amount
($m)
Rate ofgrowth
(%)Amount
($m)
Rate ofgrowth
(%)Amount
($m)
Rate ofgrowth
(%)
1960–61 2,024 . . 1,952 . . 3,337 . . 7,313 . .
1963–64 2,466 6.8 2,127 3.1 3,902 5.4 8,505 5.2
1966–67 2,928 5.9 2,459 4.8 4,623 5.8 10,010 5.6
1969–70 3,482 6.0 3,482 14.1 5,078 3.2 12,275 7.0
1974–75 5,445 9.4 6,015 10.1 7,247 7.4 18,707 8.6
1975–76 9,943 82.6 5,214 –13.3 6,266 –13.5 21,423 14.5
1983–84 10,017 0.1 6,683 3.3 9,890 6.0 26,681 2.8
1984–85 12,406 3.8 6,690 0.1 8,334 –6.5 27,429 2.8
1988–89 14,020 3.1 8,269 5.4 10,829 6.8 33,118 4.8
1992–93 16,608 4.3 8,867 1.8 12,829 4.3 38,304 3.7
1997–98 21,411 5.2 10,990 7.8 14,628 2.7 47,030 4.9
Average annual growth rates
1960–61 to 1974–75 7.3 8.4 5.7 6.9
1975–76 to 1997–98 3.5 3.4 3.9 3.6
1984–95 to 1988–89 4.3 3.9 4.4 4.2
1960–61 to 1997–98 6.4 4.7 4.0 5.0
(a) See Box 5.2 for explanation of constant price estimating method.
(b) Commonwealth Government and non-government sector expenditure adjusted for tax expenditure (see Box 5.3).
Source: AIHW Health Expenditure Database.
01 AH2000 body Page 236 Thursday, June 1, 2000 3:06 PM

5 Health resources and use of services 237
TRIM SIZE 175 mm Wide x 250 mm Deep
Under Medicare, the Commonwealth and each of the States and Territories entered intohealth services financing agreements. This led to the CommonwealthÕs share of hospitalfunding increasing and the StatesÕ share decreasing. However, the StatesÕ share of allhealth funding decreased only marginally.
During the first set of Medicare agreements, 1984Ð85 to 1987Ð88, the CommonwealthÕsshare of health funding fell consistently each year (from 45.8% to 43.8%) while theproportion met by State and local governments generally remained at just under 26.0%.The share of funding borne by non-government sources increased from 28.4% to 30.3%to make up for the fall in the CommonwealthÕs share of funding.
The introduction of Medicare also led to a major increase in Commonwealth fundingfor private medical services provided out of hospitals.
Health services expenditure 1960–61 to 1997–98Between 1960Ð61 and 1997Ð98, real expenditure on health services more than doubled.Measured in 1997Ð98 prices, health services expenditure grew from $7,313 million in1960Ð61 to $47,030 million in 1997Ð98 (Table 5.3). This represented a real average annual
Box 5.3: Health-related tax expendituresTax expenditures refer to financial benefits that individuals and businesses derive fromtaxation concessions of various kinds. These concessions are usually delivered by taxexemptions, tax deductions, tax rebates or reduced tax rates. Tax expenditures lower thetax burden by either reducing or delaying the collection of taxation revenue, and the bene-fits provided by them could equally be delivered in the form of direct expenditures. Taxexpenditures are, therefore, regarded as an expenditure by the Commonwealth Governmentand are offset against the non-government sectorÕs total funding of health services. Becausehealth-related tax expenditures can relate to the whole range of areas of expenditure, it isnot possible to adjust Commonwealth Government and non-government expenditure onindividual areas for tax expenditures.
In the area of health services expenditure the main tax expenditures have been:
Before 1975Ð76 Taxation deduction on medical expenses (including any part refundedby private health insurance funds): 1960Ð61, $80m; 1963Ð64, $100m; 1966Ð67, $139m;1969Ð70, $206m; 1974Ð75, $452m.
1975Ð76 to 1980Ð81 Taxation rebate on medical expenses (not including any partrefunded through private health insurance): 1975Ð76, $87m; 1976Ð77, $46m; 1977Ð78,$7m; 1978Ð79, $11m; 1979Ð80, $13m; 1980Ð81, $17m.
1981Ð82 to 1982Ð83 Taxation rebate on medical expenses (not including any partrefunded through private health insurance) plus rebate on contributions to private healthinsurance: 1981Ð82, $477m; 1982Ð83, $591m.
1983Ð84 to 1997Ð98 Taxation rebates on medical expenses: 1983Ð84, $21m; 1984Ð85,$27m; 1985Ð86, $28m; 1986Ð87, $34m; 1987Ð88, $37m; 1988Ð89, $44m; 1989Ð90, $61m;1990Ð91, $85m; 1991Ð92, $82m; 1992Ð93, $91m; 1993Ð94, $95m; 1994Ð95, $91m;1995Ð96, $141m; 1996Ð97, $137m; 1997Ð98, $350m.
01 AH2000 body Page 237 Thursday, June 1, 2000 3:06 PM

238 AustraliaÕs Health 2000
TRIM SIZE 175 mm Wide x 250 mm Deep
increase of 5.0%. The population grew by 75.4%, at an average of 1.5% per year over theperiod. Consequently, real per person health services expenditure increased at anaverage rate of 3.6% per year (Table 5.5, page 241). This reflected the combined effects ofchange in the intensity of use of health service resources by individuals and the qualityof the services provided.
Health services expenditure as a proportion of GDP increased from 4.3% in 1960Ð61 to7.2% in 1975Ð76. Except for one year (1986Ð87) it fluctuated between 7.0% and 7.5%until 1989Ð90. In 1990Ð91 it increased to 7.9% and then to 8.1% in 1991Ð92. From 1992Ð93to 1997Ð98 it remained reasonably steady at between 8.2% and 8.3% (Table 5.1,page 234).
The increases that occurred in the health services expenditure to GDP ratio in 1990Ð91and 1991Ð92 were largely due to the recession in this period. Although growth in healthservices expenditure was not significantly higher during that time, real GDP declinedbetween 1989Ð90 and 1990Ð91 and increased marginally (0.3%) between 1990Ð91 and1991Ð92. As a consequence, the health services expenditure to GDP ratio increased overthose two years.
Between 1984Ð85, the first year of the first Medicare agreement, and 1988Ð89, the firstyear of the second agreement, the CommonwealthÕs share of funding for institutionalhealth care fell from 46.0% to 40.9% (Table 5.4). This was partly taken up by the Statesand Territories, whose share rose from 33.5% to 36.8% and partly by the non-government sector, whose share increased from 20.5% to 22.4%.
Expenditure during the period of the second Medicare agreement was influenced bythe 1990Ð91 recession. State and local governmentsÕ expenditure on health servicescontracted, resulting in a fall in their share from 25.7% in 1988Ð89 to 23.4% in 1992Ð93(Table 5.2, page 235). As a consequence, the shares of both the Commonwealth and non-government sources of funding increased during this period.
Table 5.4: Shares of total recurrent expenditure on institutional health services, current prices, 1960Ð61 to 1997Ð98 (per cent)
Year
Government Non-governmentsector TotalCommonwealth State and local Total
1960–61 26.6 46.0 72.6 27.4 100.0
1963–64 28.0 43.4 71.4 28.6 100.0
1966–67 24.9 42.6 67.4 32.6 100.0
1969–70 26.3 45.5 71.8 28.2 100.0
1974–75 21.8 51.4 73.2 26.8 100.0
1975–76 42.3 36.3 78.7 21.3 100.0
1983–84 38.7 35.5 74.2 25.8 100.0
1984–85 46.0 33.5 79.5 20.5 100.0
1988–89 40.9 36.8 77.6 22.4 100.0
1992–93 41.9 33.4 75.3 24.7 100.0
1997–98 43.2 32.9 76.0 24.0 100.0
Sources: 1960–61, 1963–64 and 1966–67: Senate Select Committee on Medical and Hospital Costs 1970; 1974–75: WD Scott & Co. Pty Ltd 1978; 1969–70 and 1975–76 to 1997–98: AIHW Health Expenditure Database.
01 AH2000 body Page 238 Thursday, June 1, 2000 3:06 PM

5 Health resources and use of services 239
TRIM SIZE 175 mm Wide x 250 mm Deep
Over the period of the third Medicare agreement, the Commonwealth GovernmentÕsshare of funding again increased, from 43.7% in 1992Ð93 to 45.2% in 1997Ð98 (Table 5.2,page 235). The proportion met by State and local governments was the same in both yearsat 23.4%, while the non-government sectorÕs share of funding fell from 32.9% to 31.4%.
Recurrent expenditure by area of health expenditure Recurrent expenditure on health services in 1997Ð98 (the latest year for which detaileddata are available) was $43,994 million. This represents 93.5% of the total expenditureon health services in that year ($47,030 million). Expenditure on hospitals was$16,900 million, made up of $12,852 million on public hospitals (recognised publichospitals and repatriation hospitals), $3,658 million on private hospitals, and$390 million on public psychiatric hospitals (Table S41, page 404).
In 1997Ð98, expenditure on nursing home care totalled $3,320 million (7.5% of recurrenthealth services expenditure), medical services $8,503 million (19.3%), pharmaceuticals$5,335 million (12.1%) and dental services $2,591 million (5.9%). A further $1,653 million(3.8%) was spent on other health professional services, such as physiotherapy,chiropractic and podiatry.
Source: AIHW Health Expenditure Database.
Figure 5.1: Proportional split of recurrent health expenditure by area of expenditure and source of funds (current prices), 1997Ð98
Publichospitals
Medicalservices
Pharma-ceuticalservices
Privatehospitals
Nursinghomes
Dentalservices
Public &commun-ity health
Otherprofes-sional
services
Other0
2,000
4,000
6,000
8,000
10,000
12,000
14,000
$ million
Commonwealth (total $20,964 million)
State/local government (total $9,053 million)
Non-government (total $13,978 million)
01 AH2000 body Page 239 Thursday, June 1, 2000 3:06 PM

240 AustraliaÕs Health 2000
TRIM SIZE 175 mm Wide x 250 mm Deep
The significance of each of the major sources of funding for health services variesaccording to the type of service (Figure 5.1, page 239). The Commonwealth Governmentprovides most of the funds for nursing homes and medical services. Public hospitalsand community and public health services are funded jointly by the Commonwealthand State Governments, while funding for pharmaceuticals is shared between theCommonwealth and the non-government sector. Private hospitals are mostly fundedfrom the non-government sector, with a small contribution by the CommonwealthGovernment in the form of payments made by the Department of VeteransÕ Affairs foreligible veterans and their dependants using private hospitals.
Between 1960Ð61 and 1975Ð76, the proportion of recurrent expenditure devoted tohospital services increased from 37.9% to 46.1% (Table S40, page 403). From 1975Ð76 theproportion steadily declined to 37.5% in 1995Ð96. By 1997Ð98, hospitals accounted for38.4% of total recurrent health expenditure. Much of the decline since 1975Ð76 wasconcentrated in the public hospitals. Expenditure on recognised public hospitals fellfrom 34.8% of recurrent expenditure in 1975Ð76 to 29.2% in 1997Ð98. Expenditure onrepatriation hospitals, which accounted for 1.8% in 1975Ð76, had all but ceased in1997Ð98, following the disposal by the Department of VeteransÕ Affairs of most of itsrepatriation hospitals.
Although expenditure on private hospitals continued to grow for much of the period,its rate of growth was greater under Medicare than it had been under Medibank. Nodata are available to allow a comparison with the earlier years. Expenditure on privatehospitals in 1975Ð76 represented 4.5% of recurrent expenditure and this had increasedto 5.6% in 1984Ð85. By 1997Ð98 it accounted for 8.3% of recurrent health expenditure.
There were increases in the proportions of most types of services in the non-institutional area. Expenditure on medical services rose from 15.4% of recurrentexpenditure in 1960Ð61 to 18.2% in 1975Ð76. By 1992Ð93, it was 19.6% of recurrentexpenditure and remained at about that level until 1997Ð98. Expenditure on dentalservices in 1960Ð61 is not available. Between 1974Ð75 and 1992Ð93 it increased from4.3% to 5.9% and remained at that general level until 1997Ð98. In 1975Ð76, otherprofessional health services accounted for 1.8% of recurrent health expenditure. Thishad risen to 4.0% by 1988Ð89 and remained at between 3.4% and 3.9% thereafter.
Expenditure on pharmaceuticals decreased between 1960Ð61 and 1984Ð85, and since1984Ð85 has grown each year. It was 12.1% of recurrent expenditure in 1997Ð98.
The changes in proportions of recurrent expenditure are due to the different growthrates for particular areas of expenditure over the period. Recognised public hospitals,repatriation hospitals and public psychiatric hospitals all experienced low or negativeaverage growth between 1975Ð76 and 1997Ð98 (3.1%, Ð13.0% and Ð3.9%, respectively).Expenditure on private hospitals, medical services and pharmaceuticals, on the otherhand, had relatively high rates of growth over the period (6.8%, 4.3% and 4.3%,respectively) (Table S42, page 405).
Health services expenditure per personIn 1997Ð98, the average rate of per person expenditure was $2,523 (Table 5.5). Theaverage annual real rate of growth in per person health expenditure from 1960Ð61 to1997Ð98 was 3.6%.
01 AH2000 body Page 240 Thursday, June 1, 2000 3:06 PM

5 Health resources and use of services 241
TRIM SIZE 175 mm Wide x 250 mm Deep
Aboriginal and Torres Strait Islander health services expenditureThe first comprehensive analysis of expenditure on health services for Aboriginal andTorres Strait Islander peoples was released in July 1998 (DHFS 1998), following a studyconducted by the Australian Institute of Health and Welfare (AIHW) in conjunctionwith the National Centre for Epidemiology and Population Health. The main focus wason public sector expenditure in 1995Ð96, although preliminary estimates of totalexpenditure were also made. In the next phase, 1998Ð99 data will be analysed, with areport scheduled for release in November 2000.
Total recurrent health services expenditure for Aboriginal and Torres Strait Islanderpeoples for all services and from all sources of funds, government and private, in 1995Ð96was estimated at $853 million (Table 5.6, page 242), or 2.2% of total Australian recurrenthealth expenditure. Total spending for and by Aboriginal and Torres Strait Islanderpeoples was $2,320 per person, about 8% higher than for non-Indigenous Australians.
Expenditure on health services for Aboriginal and Torres Strait Islander peoples in1995Ð96 through government-subsidised programs was estimated at $822 million,mainly through State and local government programs.
On a per person basis, gross expenditure on Aboriginal and Torres Strait Islanderpeoples through government-subsidised programs was $2,235, 44% higher than theamount for non-Indigenous Australians. State and local government spending per headon Indigenous peoples was more than twice that for non-Indigenous Australians. Onthe other hand, total gross expenditure through Commonwealth-subsidised programswas significantly less per head for Indigenous peoples, mainly because the per person
Table 5.5: Health services expenditure per person, current and constant prices(a), and annual growth rates, 1960Ð61 to 1997Ð98
Year
Amount ($) Average annual growth (%)
Current Constant Current Constant
1960–61 65 688 . . . .
1963–64 77 754 5.8 3.1
1966–67 95 838 7.3 3.6
1969–70 129 970 10.5 5.0
1974–75 306 1,354 19.0 6.9
1975–76 407 1,534 32.9 13.3
1983–84 956 1,723 11.3 1.5
1984–85 1,044 1,749 9.2 1.5
1988–89 1,546 1,914 10.3 2.3
1992–93 1,990 2,102 6.5 2.4
1997–98 2,523 2,523 4.9 3.7
Average annual growth rates
1960–61 to 1974–75 5.0
1975–76 to 1997–98 2.3
1984–95 to 1988–89 2.3
1960–61 to 1997–98 3.6
(a) See Box 5.2 (page 236) for explanation of constant price estimating method.
Source: AIHW Health Expenditure Database.
01 AH2000 body Page 241 Thursday, June 1, 2000 3:06 PM

242 AustraliaÕs Health 2000
TRIM SIZE 175 mm Wide x 250 mm Deep
Medicare and Pharmaceutical Benefits Scheme (PBS) expenditures were one-quarter ofexpenditures through Medicare and PBS for non-Indigenous Australians. Governmentexpenditure per person on health services for Aboriginal and Torres Strait Islanderpeoples appears to be similar to that for non-Indigenous Australians with similarly lowincomes, but their need for services is greater due to the poorer health of Indigenouspeoples.
For further information, see AustraliaÕs Health 1998, pages 38Ð40.
Health services expenditure by States and Territories The largest single area of health services expenditure by State and TerritoryGovernments is public hospitals. In 1997Ð98, State and Territory Governments spent$6,437 million or 58.6% of their total health expenditure in meeting the operating costs ofpublic hospitals. In addition, a large proportion of the State and Territory GovernmentsÕ$1,400 million capital expenditure and $538 million capital consumption related to publichospitals (Table S41, page 404).
There was a 7.0% increase in real terms in total health services expenditure per personby State and Territory Governments from $551 in 1996Ð97 to $590 in 1997Ð98. Tasmaniaand the Australian Capital Territory recorded declines in real expenditure of Ð19.7%and Ð8.3%, respectively, while New South Wales (1.2%), and the Northern Territory
Table 5.6: Gross expenditures(a) on health services for Indigenous and non-Indigenous people, by sector, 1995Ð96
Delivery
Totalexpenditure
on Indigenouspeoples ($m)
Per personexpenditure on
Indigenouspeoples ($)
Per personexpenditure on
non-Indigenouspeople ($)
Indigenous:non-
Indigenous(b)
Through State and local governments(c) 649 1,763 806 2.19:1
Through Commonwealth programs 173 472 748 0.63:1
Through Medicare and the PBS(d) 47 128 535 0.24:1
Through Aboriginal health organisations and other Commonwealth programs 126 344 213 1.62:1
Total through government-subsidised programs 822 2,235 1,554 1.44:1
Through private sector organisations 31 85 594 0.14:1
All sector total 853 2,320 2,148 1.08:1
(a) Gross expenditures include all private out-of-pocket payments and funding from non-government organisations. Services not covered are private hospitals, dentistry, optometry, private ancillary services (e.g. physiotherapy, chiropractic) and over-the-counter pharmaceuticals.
(b) Ratio of per person Indigenous expenditures to expenditures for non-Indigenous Australians.
(c) Includes Commonwealth Government transfers and expenditure funded by patient contributions.
(d) Pharmaceutical Benefits Scheme.
Source: DHFS 1998.
01 AH2000 body Page 242 Thursday, June 1, 2000 3:06 PM

5 Health resources and use of services 243
TRIM SIZE 175 mm Wide x 250 mm Deep
(0.8%) both had rates of growth that were below the national average. WesternAustralia had the highest rate of growth (18.6%), followed by Queensland (17.0%),Victoria (13.1%) and South Australia (12.3%) (Table 5.7, page 244).
In terms of the relative order of State and Territory GovernmentsÕ real expenditure perperson, Northern Territory was the by far the highest spender in both 1996Ð97 and1997Ð98, with the Australian Capital Territory ranked second. The VictorianGovernment was consistently the lowest spending jurisdiction over the period, justbelow South Australia. Tasmania, which was the third highest spender in 1996Ð97,exchanged places with Queensland, which went from being the third lowest spender tothe third highest in 1997Ð98.
Box 5.4: State and Territory expenditure data sourcesStatistics of health services expenditure by State and Territory Governments are availablefrom a variety of central agency sources, including the Australian Bureau of Statistics(ABS) public finance database, State and Territory health authoritiesÕ annual reports,State and Territory Budget papers, and the Commonwealth Grants Commission (CGC). Inaddition, the AIHW Health Expenditure Database substitutes data from its own Aus-tralian Hospital Statistics collection for expenditure on public acute hospitals and publicpsychiatric hospitals in Australia.
The different bodies involved in collecting State and Territory health expenditure data haveadopted different practices for defining and measuring that expenditure and this hasresulted in differences in statistics reported at the State level. There is also a lack of detailin the information collected. For example, the CGC database, one of the better databases onState health services expenditure for recent years, includes Commonwealth grants toStates. Also, it reports only recurrent expenditure, excluding both capital expenditure andcapital consumption (depreciation).
At the individual State level there are some marked annual differences between the ABSand CGC data. One way such differences occur is from the manner in which interstatepayments are treated. The aim of the CGC is to give each State Ôthe capacity to provide theaverage standard of State-type public services, assuming it does so at an average level ofoperational efficiency and makes an average effort to raise revenue from its own sourcesÕ(CGC 1997:1). Its statistical collations are, therefore, geared to determining the level ofexpenditure required by States to provide for the needs of their populations. The needs ofStatesÕ populations are assessed in terms of the expenditure involved in providing servicesto them, irrespective of whether or not those services are provided within the State con-cerned. The ABS, on the other hand, is responsible for recording expenditure incurred byeach State and Territory within its own jurisdiction. For example, services provided inVictoria to a person who is a resident of New South Wales would be counted by the CGCas New South Wales expenditure and by the ABS as Victorian expenditure.
In addition, the CGC and the ABS treat revenues differently, with the CGC including onlypatient-related revenues.
State and Territory expenditure data used in this publication are derived from the AIHWHealth Expenditure Database.
01 AH2000 body Page 243 Thursday, June 1, 2000 3:06 PM

244 AustraliaÕs Health 2000
TRIM SIZE 175 mm Wide x 250 mm Deep
Medicare levyAlmost all Commonwealth government funding for health services comes from generalrevenue sources. However, when Medicare was introduced in 1984 it replaced someexisting Commonwealth government programs and expanded eligibility to others. Itsintroduction was also associated with the abolition of an existing tax rebate oncontributions to basic health insurance. A levy of 1.0% of taxable earnings wasintroduced to help offset any additional costs to government of Medicare. In the firstfull year of operation of Medicare, 1984Ð85, the levy raised $1,223 million or 2.3% oftotal taxation revenue. The levy has been increased several times since 1984 and thebasic rate is currently set at 1.5% of taxable income. Total revenue collected by theCommonwealth through the Medicare levy in 1998Ð99 was $4,100 million (Table 5.8).
Since October 1997, high-income earners who do not have private insurance cover forhospitals paid an additional surcharge of 1.0% of taxable income.
Table 5.7: State and Territory government acute hospital and total health services expenditure per person, 1996Ð97 to 1997Ð98, constant prices(a) ($ per person)
State/Territory 1996Ð97 1997–98Change 1996–97
to 1997–98 (%)
Acute hospital services
NSW 350 390 11.6
Vic 294 310 5.6
Qld 265 269 1.4
WA 273 330 20.9
SA 206 256 24.3
Tas 201 150 –25.2
ACT 408 450 10.3
NT 301 296 –1.5
Australia 298 320 7.3
Total health services
NSW 572 579 1.2
Vic 459 519 13.1
Qld 536 627 17.0
WA 554 658 18.6
SA 473 531 12.3
Tas 714 574 –19.7
ACT 742 681 –8.3
NT 1,219 1,229 0.8
Australia 551 590 7.0
(a) See Box 5.2 (page 236) for explanation of constant price estimating method.
Source: AIHW Health Expenditure Database.
01 AH2000 body Page 244 Thursday, June 1, 2000 3:06 PM
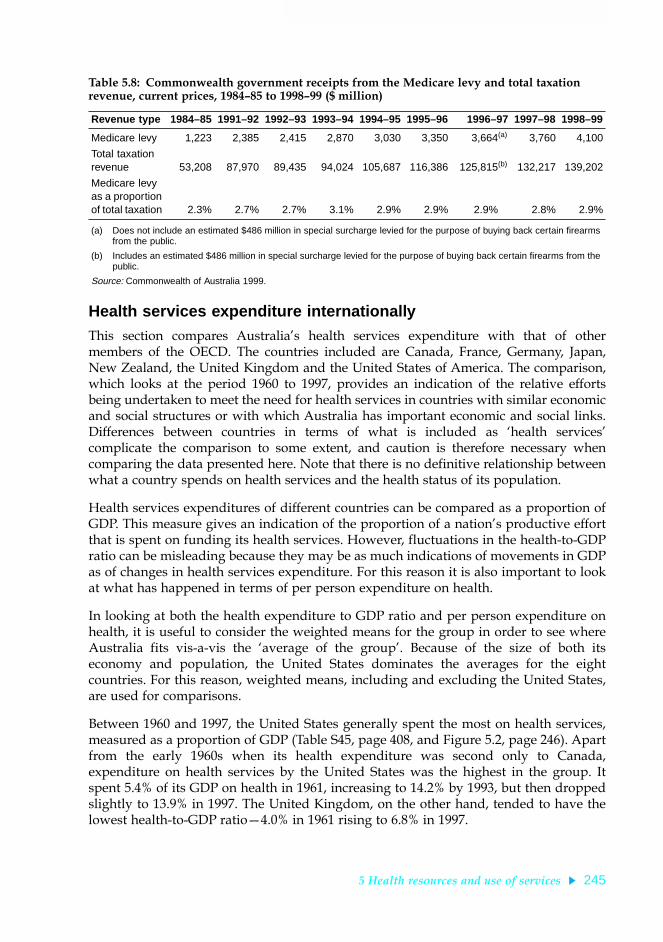
5 Health resources and use of services 245
TRIM SIZE 175 mm Wide x 250 mm Deep
Health services expenditure internationallyThis section compares AustraliaÕs health services expenditure with that of othermembers of the OECD. The countries included are Canada, France, Germany, Japan,New Zealand, the United Kingdom and the United States of America. The comparison,which looks at the period 1960 to 1997, provides an indication of the relative effortsbeing undertaken to meet the need for health services in countries with similar economicand social structures or with which Australia has important economic and social links.Differences between countries in terms of what is included as Ôhealth servicesÕcomplicate the comparison to some extent, and caution is therefore necessary whencomparing the data presented here. Note that there is no definitive relationship betweenwhat a country spends on health services and the health status of its population.
Health services expenditures of different countries can be compared as a proportion ofGDP. This measure gives an indication of the proportion of a nationÕs productive effortthat is spent on funding its health services. However, fluctuations in the health-to-GDPratio can be misleading because they may be as much indications of movements in GDPas of changes in health services expenditure. For this reason it is also important to lookat what has happened in terms of per person expenditure on health.
In looking at both the health expenditure to GDP ratio and per person expenditure onhealth, it is useful to consider the weighted means for the group in order to see whereAustralia fits vis-a-vis the Ôaverage of the groupÕ. Because of the size of both itseconomy and population, the United States dominates the averages for the eightcountries. For this reason, weighted means, including and excluding the United States,are used for comparisons.
Between 1960 and 1997, the United States generally spent the most on health services,measured as a proportion of GDP (Table S45, page 408, and Figure 5.2, page 246). Apartfrom the early 1960s when its health expenditure was second only to Canada,expenditure on health services by the United States was the highest in the group. Itspent 5.4% of its GDP on health in 1961, increasing to 14.2% by 1993, but then droppedslightly to 13.9% in 1997. The United Kingdom, on the other hand, tended to have thelowest health-to-GDP ratioÑ4.0% in 1961 rising to 6.8% in 1997.
Table 5.8: Commonwealth government receipts from the Medicare levy and total taxation revenue, current prices, 1984Ð85 to 1998Ð99 ($ million)
Revenue type 1984–85 1991–92 1992–93 1993–94 1994–95 1995–96 1996–97 1997–98 1998–99
Medicare levy 1,223 2,385 2,415 2,870 3,030 3,350 3,664(a) 3,760 4,100
Total taxation revenue 53,208 87,970 89,435 94,024 105,687 116,386 125,815(b) 132,217 139,202
Medicare levy as a proportion of total taxation 2.3% 2.7% 2.7% 3.1% 2.9% 2.9% 2.9% 2.8% 2.9%
(a) Does not include an estimated $486 million in special surcharge levied for the purpose of buying back certain firearms from the public.
(b) Includes an estimated $486 million in special surcharge levied for the purpose of buying back certain firearms from the public.
Source: Commonwealth of Australia 1999.
01 AH2000 body Page 245 Thursday, June 1, 2000 3:06 PM

246 AustraliaÕs Health 2000
TRIM SIZE 175 mm Wide x 250 mm Deep
Australia was ranked fifth behind the United States, Canada, France and Germany formuch of the period. Australia spent 4.3% of its GDP on health in 1961, which was belowthe average for the eight selected OECD nations and almost the same as France (4.5%).It was around the average when the influence of the United States was removed.AustraliaÕs health-to-GDP ratio was below the average for the whole group throughoutthe period 1961 to 1997.
Health spending for the group increased substantially. The average for the eightcountries, weighted according to GDP, rose from 4.9% in 1961 to 11.0% in 1997. This wasgreatly influenced by the United States, which grew from 5.4% to 13.9%. Even withoutthe influence of the United States, the weighted average still almost doubled from 4.3%to 8.4%.
Expenditure on health per person is another way of comparing health expenditure ofcountries. This method removes the complicating effect of GDP, which is inherent incomparisons that are based on health expenditure to GDP ratios. It is calculatedallowing for different purchasing power per dollar in different countries.
Source: AIHW from OECD data.
Figure 5.2: Health expenditure as a proportion of GDP, Australia and selected OECD member countries, 1960 to 1997
1960 1965 1970 1975 1980 1985 1990 19952
4
6
8
10
12
14
16
Percentage of GDP
Year
Australia
USA
Canada France
NZ
Japan
UK
01 AH2000 body Page 246 Thursday, June 1, 2000 3:06 PM

5 Health resources and use of services 247
TRIM SIZE 175 mm Wide x 250 mm Deep
The rankings of most countries, in terms of per person health expenditure, were similarto those based on expenditure as a share of GDP. The United States was again thehighest spending country. Its per person health spending in 1997 was 72% higher thanthe next highest spending country, Japan, and more than double that of Australia(Table 5.9). In 1997, Australia had the fifth highest per person expenditure on healthservices.
Factors contributing to the growth in health services expenditure are inflation (bothgeneral inflation and excess health inflation), and change in the level of services used,either from population growth or from more intensive per person use of services. Thegeneral rate of inflation is an indication of price pressures that apply throughout theeconomy, and the rate of excess health inflation indicates additional price rises specificto the health services sector. The ability of a nationÕs health financing system to controlhealth prices is an important factor in controlling growth in total expenditure on healthservices.
Table 5.9: Total health services expenditure per person, Australia and other selected OECD member countries, current prices, 1960 to 1997(a) (A$)
Year(a) Australia Canada France Germany (b) Japan NZ UK USA
1960 66 109 50 80 12 65 48 132
1965 96 143 94 111 37 n.a. 67 188
1970 148 248 145 198 79 106 88 316
1975 407 394 343 362 192 220 174 460
1980 684 684 819 725 520 376 473 956
1985 1,157 1,605 1,144 1,776 1,074 515 675 2,571
1986 1,294 1,789 1,675 1,928 1,646 699 871 2,874
1987 1,406 1,901 1,933 1,946 1,896 926 1,017 2,949
1988 1,546 1,975 1,879 1,902 1,956 1,084 1,091 2,926
1989 1,700 2,214 1,891 1,900 1,858 1,063 1,087 3,202
1990 1,820 2,410 2,388 2,050 1,868 1,149 1,310 3,580
1991 1,902 2,633 2,448 2,049 2,138 1,172 1,446 3,886
1992 1,990 2,756 2,942 2,487 2,575 1,202 1,702 4,453
1993 2,071 2,830 3,128 2,702 3,324 1,337 1,634 5,115
1994 2,169 2,508 3,054 2,703 3,541 1,444 1,662 4,981
1995 2,296 2,468 3,483 2,939 3,965 1,624 1,772 5,096
1996 2,403 2,365 3,293 2,928 3,339 1,645 1,738 5,025
1997 2,502 2,471 3,085 3,191 3,209 1,771 2,000 5,527
(a) Australian data relate to the year ending 30 June; data for France and Germany relate to the calender year indicated; data for New Zealand before 1990 relate to the year commencing 1 April in the year indicated, and data for 1990 onwards refer to the year ending 30 June; data for Canada, Japan and the United Kingdom relate to the year commencing 1 April in the year indicated; United States data relate to the year ending 30 September.
(b) Data up to and including 1990 relate to West Germany only; data for 1991 onwards refer to the unified Germany.
Note: Expenditures converted to Australian dollar (A$) values using GDP purchasing power parities.
Sources: AIHW Health Expenditure Database; OECD unpublished data.
01 AH2000 body Page 247 Thursday, June 1, 2000 3:06 PM

248 AustraliaÕs Health 2000
TRIM SIZE 175 mm Wide x 250 mm Deep
Even in countries with fairly similar approaches to health services provision, rates ofhealth inflation can vary markedly. At one end is New Zealand with a very high excesshealth inflation rateÑaveraging 3.6% between 1968 and 1996. At the other extreme isFrance, which had a negative excess health inflation rate of Ð0.5% (Table S46, page 408).Australia had an excess health inflation rate of 0.5%, the third lowest for the group.
In order to compare the level of expenditure without the complication of different ratesof population growth, it is useful to examine real growth in per person health servicesexpenditure. Australia and the United Kingdom (0.9%) had the second lowest averagereal growth in per person expenditure between 1960 and 1997. Japan experienced thehighest growth of 5.3% per year, and New ZealandÕs per person health expenditure felldramaticallyÑa drop of 4.2% in real terms.
5.2 Cost of diseasesThis section describes the way total direct healthcare expenditure is distributed amongspecific disease and injury groups, and by age groups and sex. The AIHW has analyseddirect health system costs of disease and injury in Australia for 1993Ð94, using diseaseand injury groups defined according to the International Classification of Diseases,9th Revision (see Box 5.7, page 274). The estimates were derived using a methodologythat ensures that they add across disease, age and sex groups to the total Australianhealth system expenditure by health sector for 1993Ð94. They provide a description ofthe utilisation and costs of health services in Australia, as well as a reference source forplanners and researchers interested in the costs and utilisation patterns for a particulardisease group.
The disease cost estimates allocate over 90% of the total recurrent health expenditure in1993Ð94, or just over $31 billion in total. The main components of health expenditurenot yet included in the disease cost estimates are capital expenditure, community healthservices (apart from specialised mental health services) and public health programs(apart from four cancer public health programs). The estimates have been revised sincetheir inclusion in AustraliaÕs Health 1998.
The six disease groups that account for the most health expenditure in Australia, indescending order, are:
¥ cardiovascular diseases $3.7 billion (11.8% of total health system costs)
¥ digestive system diseases $3.7 billion (11.8%)
¥ mental disorders $3.0 billion (9.6%)
¥ musculoskeletal problems $3.0 billion (9.6%)
¥ injury and poisoning $2.6 billion (8.3%)
¥ respiratory diseases $2.5 billion (8.0%).
Digestive system diseases are the second most expensive group in part because of thelarge expenditure on dental services ($1.8 billion).
01 AH2000 body Page 248 Thursday, June 1, 2000 3:06 PM

5 Health resources and use of services 249
TRIM SIZE 175 mm Wide x 250 mm Deep
The AIHW has published detailed estimates of costs for specific diseases and injurieswithin four of the six national health priority areas: cardiovascular diseases, cancer,injury and diabetes (AIHW: Mathers et al. 1998, 1999a, 1999b).
Health system costs for mental disorders in 1993Ð94 are shown in Table 5.10. Includingspecialised community mental health services, drug and alcohol residential centres andpublic health expenditure under the National Campaign Against Drug Abuse, the totalhealth system costs of mental disorders are estimated at $3.0 billion or 9.6% of totalhealth expenditure.
Asthma is the most recent addition to the list of national health priority areas.Provisional analysis of health system costs for asthma in 1993Ð94 indicate that it cost$478 million, of which $199 million was for pharmaceuticals.
Table 5.10: Mental health: health system costs by health sector, 1993Ð94 ($ million)
Hospital (a) Medical (b)Pharma-
ceuticals
Otherhealth
services (c) Other (d)All
sectorsPer cent
of total
Dementia 110 11 2 9 582 714 23.6
Substance abuse disorders 136 46 12 18 136 348 11.5
Schizophrenia 275 26 8 106 40 454 15.0
Other non-drug psychoses 63 5 1 6 53 128 4.2
Affective disorders 217 141 68 70 148 644 21.3
Anxiety disorders 24 102 51 25 37 239 7.9
Personality disorders 24 7 1 12 9 53 1.8
Stress and adjustment disorders 28 27 7 31 19 112 3.7
Mental retardation 16 1 0 3 5 26 0.9
Disorders of psychological development 2 2 0 3 10 16 0.5
Eating disorders 14 3 0 1 4 22 0.7
Disorders of childhood and adolescence 10 9 1 19 16 55 1.8
Behavioural syndromes and other mental disorders 17 53 45 9 50 174 5.8
Unspecified mental disorders, prevention and screening 5 6 2 23 1 37 1.2
Total 941 438 199 334 1,110 3,022 100.0
(a) Public and private acute hospitals, repatriation hospitals and psychiatric hospitals. Excludes public hospital non-admitted services.
(b) Medical services for private patients in hospitals are included under Hospitals.
(c) Includes hospital non-inpatient services, specialised community mental health services, residential and non-residential treatment services run by non-government organisations, and allied health services.
(d) Includes National Drug Strategy funding for prevention, research expenditure and other institutional, non-institutional and administration expenditure. Does not include expenditure for other public health services, non-specialised community health services, ambulances, or medical aids and appliances.
Source: AIHW analysis of health expenditure data.
01 AH2000 body Page 249 Thursday, June 1, 2000 3:06 PM

250 AustraliaÕs Health 2000
TRIM SIZE 175 mm Wide x 250 mm Deep
Table 5.11: Diseases and injuries in NHPAs(a) and musculoskeletal disorders: health system costs(b) by health sector, 1993Ð94 ($ million)
Hospital (c) Medical (d)Pharma-
ceuticals OtherAll
sectors
Ischaemic heart disease 574 88 105 127 894
Hypertension(e) 55 217 476 84 831
Accidental falls 501 112 32 166 810
Dementia 119 11 2 582 714
Back problems 239 133 62 266 700
Diabetes mellitus(f) 201 98 136 247 681
Affective disorders 287 141 68 148 644
Stroke 283 31 13 303 630
Osteoarthritis 301 80 58 185 624
Disorders of muscles, tendons and soft tissue 165 127 60 167 519
Asthma 94 102 199 82 478
Schizophrenia 381 26 8 40 454
Heart failure 157 47 45 162 411
Adverse effects of medical treatment(g) 300 38 23 43 403
Road traffic accidents 232 56 16 68 372
Substance abuse disorders 154 46 12 136 348
Chronic obstructive pulmonary disease(h) 112 61 66 61 300
Skin cancers 141 112 5 41 298
Anxiety disorders 49 102 51 37 239
Cardiac dysrhythmias(i) 114 36 31 43 224
Peripheral arterial disease 134 17 9 49 209
Colorectal cancer 171 11 3 19 205
High serum cholesterol 6 42 135 16 199
Breast cancer 80 11 16 77 184
Neck problems 54 25 18 62 160
Lung cancer 81 7 3 17 107
Prostate cancer 66 14 8 13 101
All causes 14,062 5,640 4,042 7,653 31,397
(a) The six National Health Priority Areas are cardiovascular disease, cancer, mental health, injury, diabetes mellitus and asthma.
(b) Diseases and injuries with health system costs of less than $150 million not included in this table.
(c) Public and private acute hospitals, repatriation hospitals and psychiatric hospitals. Includes public hospital non-admitted services. For mental health services, also includes specialised community mental health services and drug and alcohol residential treatment services.
(d) Medical services for private patients in hospitals are included under Hospitals.
(e) Hypertension comprises high blood pressure and hypertensive heart and renal disease.
(f) Includes health system costs of cardiovascular disease and complications due to diabetes.
(g) Part of the injury priority area; includes surgical and medical misadventure, and adverse effects of drugs in therapeutic use.
(h) Chronic bronchitis and emphysema.
(i) Inflammatory heart disease comprises cardiomyopathy, myocarditis, endocarditis, pericarditis and other diseases of the pericardium and endocardium.
Source: AIHW unpublished analysis of disease costs.
01 AH2000 body Page 250 Thursday, June 1, 2000 3:06 PM

5 Health resources and use of services 251
TRIM SIZE 175 mm Wide x 250 mm Deep
Table 5.11 ranks the health system costs of diseases and injuries in the six NationalHealth Priority Areas, together with musculoskeletal disorders. Other diseases have notbeen included in this table. Ischaemic heart disease and hypertension are the leadingcauses of health system expenditure, together accounting for 5.5% of total healthexpenditure. Following these are accidental falls, dementia and back problems, thendiabetes, affective disorders and stroke. The majority of health system costs fordementia are for nursing home patients. Osteoarthritis costs the Australian healthsystem almost as much as stroke.
Total health system costs for females are 32% higher than those for males: $17.9 billioncompared with $13.5 billion. Costs are higher for females than males for all diseasegroups apart from injury and congenital anomalies. Total health system costs perperson in 1993Ð94 ranged from a minimum of around $800 for boys aged 5Ð14 years to$7,500 for women aged 75 years and over. The maleÐfemale difference in per personcosts is greatest in the peak reproductive years, where average annual costs for womenaged 25Ð34 years were $1,716, almost double the average cost of $888 for men of thesame age.
It should be emphasised that this analysis does not attempt to estimate the totaleconomic impact of diseases in the Australian community and that, as well as the healthsystem costs described here, there are substantial costs relating to absenteeism, lostproductivity, the burden on carers and family, and lost quality and quantity of life.
5.3 Private health insurance
Funding of health services by health insurance fundsThe introduction of the Private Health Insurance Incentives Scheme (PHIIS) and itsreplacement by the 30% rebate on premiums substantially altered the role of the healthinsurance funds in the funding of health services after 1996Ð97. Total recurrent healthexpenditure in 1997Ð98 was $43,994 million. Of this, $4,685 million was directedthrough private health insurance funds. However, the Commonwealth Governmentsubsidised $459 million of that expenditure through the PHIIS.
The PHIIS was paid in two waysÑeither as a direct subsidy (in which case the privatehealth insurance fund would charge the contributor a reduced premium and claim thesubsidy from the Commonwealth) or as a rebate through the taxation system (in whichcase the contributor would be charged the full premium and would be reimbursed whenhe or she lodged a taxation return). A total of $252 million was paid through the directsubsidy during 1997Ð98 and $207 million was claimed through the taxation system.
As a result of the PHIIS, the amount paid from non-government sources through thehealth insurance funds was $4,434 million. The $207 million claimed through thetaxation system meant that the net, unsubsidised amount paid by health insurancefunds was $4,226 million. This represented 9.6% of recurrent health expenditure in1997Ð98. By 1998Ð99, total expenditure through private health insurers had increased to$4,840 million. The net expenditure by the funds (after deduction of Commonwealthsubsidies) was $3,785 million (Table 5.12, page 253).
01 AH2000 body Page 251 Thursday, June 1, 2000 3:06 PM

252 AustraliaÕs Health 2000
TRIM SIZE 175 mm Wide x 250 mm Deep
Expenditure on hospitals, both public and private, during 1997Ð98 was $16,510 million.Of this, $2,485 million was funded by the health insurance organisations. During1998Ð99, the health insurance funds paid $2,200 million for hospital services from theirown resources.
The hospital expenditure funded through health insurance was largely concentrated inprivate hospitals. In 1998Ð99, the benefits paid in respect of private hospital care($2,524 million) represented 89.7% of all hospital-related benefits paid through healthinsurance funds. Similarly, 84.1% of total hospital bed-days for which hospital benefitswere paid during 1998Ð99 were in respect of care in private hospitals.
Administration of health insurance funds accounted for $591 million in 1998Ð99. Thisrepresented 14 cents for each dollar of benefit paid from the funds and accounted for12% of contributions income receivable by the funds in that year.
Trends in private health insurance coverage, membership and premiums The proportion of the population with private health insurance at the end of March2000 was 32.7%, an increase on the 30.5% coverage at 30 June 1999. This was the samelevel as at 30 June 1998. However, between the time of the introduction of Medicare(February 1984) and 31 December 1998 the trend in private health insurance coveragehad been generally downwards. In June 1984 just over half of the total population(50.2%) were covered by some level of private health insurance. At 31 December 1998this had fallen to 30.1% (Figure 5.3, page 254).
Box 5.5: Private health insurance arrangementsSince the introduction of Medicare in 1984, health insurance funds operated by RegisteredHealth Benefits Organisations1 have offered benefits to members for approved services pro-vided in both public and private hospitals. They have also operated ancillary tables whichprovide benefits for a wide range of non-hospital health and health-related services.
There are four categories of health insurance membershipÑsingles, couples without chil-dren, sole parents, and couples with childrenÑproviding a wide range of benefits cover.These include Ôexclusionary tablesÕ under which funds are able to tailor the range of benefitsprovided to meet particular needs of different groups of contributors. They can, for example,offer tables that exclude benefits for obstetrics or hip replacements. The contribution ratesfor such tables reflect the particular exclusion(s) and are lower than similar tables that donot contain such exclusion(s). ÔFront-end deductibleÕ tables are also available, which allowcontributors to meet a set proportion of the charge for hospital care from their own pockets.
Changes to health insurance arrangements will be introduced from 1 July 2000, toencourage people to take out and retain private health insurance cover. From that date,people who join a health insurance fund early in life and maintain their hospital cover willpay lower premiums throughout their life compared with someone who joins later in life.
1. A Registered Health Benefits Organisation is an organisation registered under the National Health Act 1953 for the purpose of conducting a health benefits fund.
01 AH2000 body Page 252 Thursday, June 1, 2000 3:06 PM
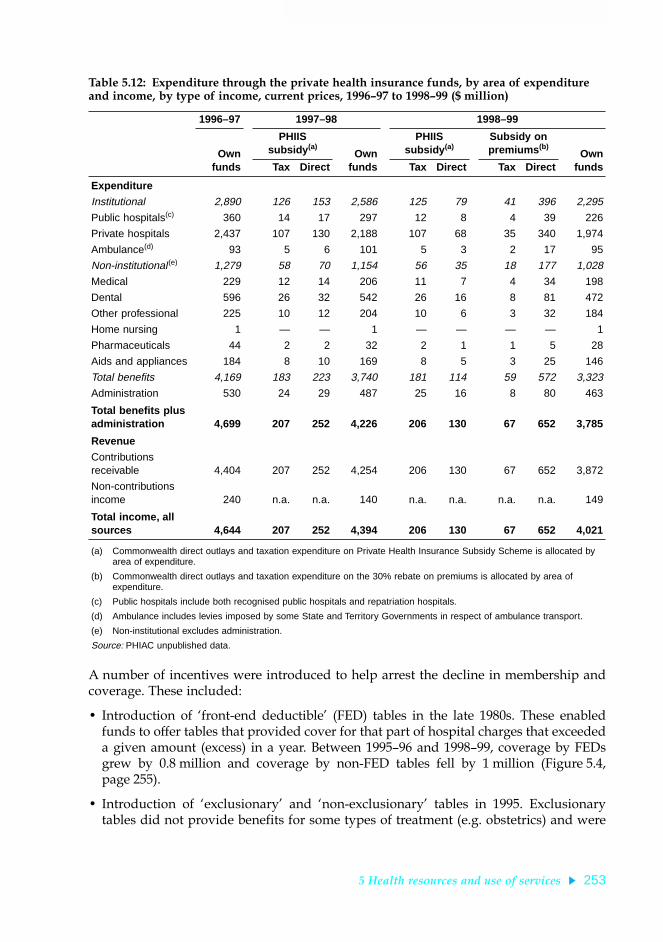
5 Health resources and use of services 253
TRIM SIZE 175 mm Wide x 250 mm Deep
A number of incentives were introduced to help arrest the decline in membership andcoverage. These included:
¥ Introduction of Ôfront-end deductibleÕ (FED) tables in the late 1980s. These enabledfunds to offer tables that provided cover for that part of hospital charges that exceededa given amount (excess) in a year. Between 1995Ð96 and 1998Ð99, coverage by FEDsgrew by 0.8 million and coverage by non-FED tables fell by 1 million (Figure 5.4,page 255).
¥ Introduction of ÔexclusionaryÕ and Ônon-exclusionaryÕ tables in 1995. Exclusionarytables did not provide benefits for some types of treatment (e.g. obstetrics) and were
Table 5.12: Expenditure through the private health insurance funds, by area of expenditure and income, by type of income, current prices, 1996Ð97 to 1998Ð99 ($ million)
1996–97 1997–98 1998–99
Ownfunds
PHIIS subsidy (a)
Ownfunds
PHIIS subsidy (a)
Subsidy on premiums (b)
OwnfundsTax Direct Tax Direct Tax Direct
Expenditure
Institutional 2,890 126 153 2,586 125 79 41 396 2,295
Public hospitals(c) 360 14 17 297 12 8 4 39 226
Private hospitals 2,437 107 130 2,188 107 68 35 340 1,974
Ambulance(d) 93 5 6 101 5 3 2 17 95
Non-institutional(e) 1,279 58 70 1,154 56 35 18 177 1,028
Medical 229 12 14 206 11 7 4 34 198
Dental 596 26 32 542 26 16 8 81 472
Other professional 225 10 12 204 10 6 3 32 184
Home nursing 1 — — 1 — — — — 1
Pharmaceuticals 44 2 2 32 2 1 1 5 28
Aids and appliances 184 8 10 169 8 5 3 25 146
Total benefits 4,169 183 223 3,740 181 114 59 572 3,323
Administration 530 24 29 487 25 16 8 80 463
Total benefits plus administration 4,699 207 252 4,226 206 130 67 652 3,785
Revenue
Contributions receivable 4,404 207 252 4,254 206 130 67 652 3,872
Non-contributions income 240 n.a. n.a. 140 n.a. n.a. n.a. n.a. 149
Total income, all sources 4,644 207 252 4,394 206 130 67 652 4,021
(a) Commonwealth direct outlays and taxation expenditure on Private Health Insurance Subsidy Scheme is allocated by area of expenditure.
(b) Commonwealth direct outlays and taxation expenditure on the 30% rebate on premiums is allocated by area of expenditure.
(c) Public hospitals include both recognised public hospitals and repatriation hospitals.
(d) Ambulance includes levies imposed by some State and Territory Governments in respect of ambulance transport.
(e) Non-institutional excludes administration.
Source: PHIAC unpublished data.
01 AH2000 body Page 253 Thursday, June 1, 2000 3:06 PM

254 AustraliaÕs Health 2000
TRIM SIZE 175 mm Wide x 250 mm Deep
aimed at enabling funds to tailor their benefits cover and premiums to meetparticular groups of low-drawing members.
¥ Increasing the number of membership categories from 2 (single and family) to 4(single, family, single parent and couples) in 1997. This was to enable funds to furtherdifferentiate their premiums.
¥ Introduction of the PHIIS in 1997.
¥ Replacement of the PHIIS with a 30% rebate on private health insurance premiums in1999.
Despite these incentives, coverage by health insurance continued to decline untilDecember 1998. At the same time, expenditure by the funds in the form of benefits,levies and administration continued to increase and the proportion of total healthexpenditure that was met by health insurance funds from their own resources remainedrelatively stable at between 10.6% and 11.5%. The introduction of the PHIIS and therebate on private health insurance premiums have both had an effect in slowing thedecline in coverage. After reaching 30.1% in December 1998, coverage increased in eachquarter of 1999 to reach 31.2% at the end of December 1999.
Sources: PHIAC 1999 and unpublished data.
Figure 5.3: Proportion of population covered by basic health insurance, 1984 to 1999
1984 1985 1986 1987 1988 1989 1990 1991 1992 1993 1994 1995 1996 1997 1998 19990
10
20
30
40
50
60Per cent
Year
Persons aged 65 years and overTotal population
Persons aged under 65 years
01 AH2000 body Page 254 Thursday, June 1, 2000 3:06 PM

5 Health resources and use of services 255
TRIM SIZE 175 mm Wide x 250 mm Deep
Growth in contributions incomeDespite their falling coverage, health insurance funds have maintained their capacity togenerate income through premiums.
Between 1984Ð85 and 1998Ð99 real growth in contributions income averaged 5.2% peryear. Between 1989Ð90 and 1998Ð99 the rate of growth averaged 4.1% and since 1995Ð96it has averaged 4.3% (Figure 5.5, page 256).
Growth in the total amount of benefits and levies payable by health insurance fundswas higher than that for contributions income between 1984Ð85 and 1998Ð99, averaging7.4%. However, since 1995Ð96 the rate of growth in benefits and levies payable has beenmuch lower (1.7%) than that of contributions income.
Ancillary benefits tablesIn addition to their hospital tables, health insurance funds offer tables providingancillary benefits in respect of services such as dental, optical, therapeutic and other(generally non-accommodation) non-medical services.
(a) Front-end deductable tables.
Source: PHIAC annual reports, various years.
Figure 5.4: Hospital insurance coverage by type of cover, 1995Ð96 to 1998Ð99
1995–96 1996–97 1997–98 1998–990
1,000
2,000
3,000
4,000
5,000
6,000
7,000Number of persons (’000)
Year
Total coverage
Coverage by non-FEDs
Coverage by FEDs
(a)
(a)
01 AH2000 body Page 255 Thursday, June 1, 2000 3:06 PM

256 AustraliaÕs Health 2000
TRIM SIZE 175 mm Wide x 250 mm Deep
About 6,049,000 persons (31.9% of the total resident population) had some form ofancillary cover at 30 June 1999 (Table 5.13). Of these, 4,423,000 were covered for bothhospital and ancillary cover with the same organisation. A further 1,626,000 either hadancillary cover only or had ancillary cover with one organisation and hospital insurancewith another organisation.
Changes in the characteristics of the insuredThe structure of the insured population changed substantially between 1983 and 1998.The proportion of contributor units with hospital insurance cover more than halvedover the period, from 62.1% to 30.3%.
In all age groups below 60 years, the level of coverage by hospital insurance fellmarkedly. Excluding the age groups 60 years and over, coverage ranged from 54.6% to75.6% in 1983 and from 16.3% to 41.9% in 1998 (Table 5.14). The largest falls were in theyoungest age groups. In the case of contributor units headed by persons aged 60 yearsand over, the fall-off in coverage was less dramatic. Coverage for contributor unitsheaded by persons aged 60Ð69 years fell from 45.3% to 39.6%, while those headed bypersons aged 70 years and over remained relatively constant at around 36%.
Source: PHIAC annual reports, various years.
Figure 5.5: Health insurance funds contributions income, benefits and levies payable at constant (1997Ð98) prices, 1984Ð85 to 1998Ð99
1984–85 1986–87 1988–89 1990–91 1992–93 1994–95 1996–97 1998–990
1,000
2,000
3,000
4,000
5,000
6,000$ million
Year
Contributions payable
Benefits and levies payable
01 AH2000 body Page 256 Thursday, June 1, 2000 3:06 PM

5 Health resources and use of services 257
TRIM SIZE 175 mm Wide x 250 mm Deep
Table 5.13: Membership and persons covered by ancillary tables, by type of membership, States and Territories, 30 June 1999 (Õ000)
Membership type NSW (a) Vic Qld WA SA Tas NT Australia
Combined with hospital insurance (b)
Single 353 183 135 111 86 29 6 904
Family 232 118 105 85 54 19 6 618
Single parent 10 5 4 4 2 1 (d) 26
Couples 173 81 91 77 47 15 4 488
Total members 768 387 335 277 189 64 17 2,036
Persons covered 1,653 834 745 617 399 136 39 4,423
Without hospital insurance cover (c)
Single 127 32 39 106 35 8 1 349
Family 96 34 24 48 28 4 1 236
Single parent 6 3 2 12 2 (d) (d) 26
Couples 50 12 12 38 16 2 (d) 131
Total members 280 80 76 204 82 15 3 741
Persons covered 635 202 163 400 189 31 6 1,626
All ancillaries
Single 480 215 174 217 121 37 7 1,253
Family 328 152 129 133 82 23 7 854
Single parent 16 8 6 16 4 1 (d) 52
Couples 223 93 103 115 63 17 4 619
Total members 1,048 467 411 481 271 79 20 2,777
Persons covered 2,288 1,036 908 1,017 588 167 45 6,049
(a) New South Wales includes the Australian Capital Territory.
(b) Members and persons covered where both hospital insurance and ancillary cover are provided with the same fund.
(c) Members and persons covered by ancillary tables only (may include members who have hospital insurance cover with a fund other than the fund providing ancillary cover).
(d) Less than 500.
Source: PHIAC 1999.
Table 5.14: Private health insurance, proportion of contributor units(a) with hospital insurance cover by age group, 1983 to 1998
Age group of head of contributor unit (years) 1983 1986 1988 1990 1992 1995 1998
15–24 54.6 29.3 30.0 29.5 29.3 20.8 16.3
25–34 70.4 46.5 43.0 40.1 35.8 27.2 22.1
35–49 75.6 55.5 53.8 52.7 46.7 40.3 32.0
50–59 71.4 56.4 56.5 55.6 52.2 48.4 41.9
60–69 45.3 42.0 43.4 45.1 45.5 42.9 39.6
70 and over 36.0 31.5 34.9 36.8 36.4 39.0 36.4
All ages 62.1 44.2 43.6 43.1 40.5 35.1 30.3
(a) A contributor unit includes all persons within a family unit or a single person unit that would be coverable by a health insurance policy. For example, a ‘couple with dependants’ contributor unit includes the parents and all dependent children and is counted as one contributor unit.
Sources: AIHW analysis of ABS Private Health Insurance Survey data.
01 AH2000 body Page 257 Thursday, June 1, 2000 3:06 PM

258 AustraliaÕs Health 2000
TRIM SIZE 175 mm Wide x 250 mm Deep
5.4 Health workforce
The health industryThe health industry is highly labour intensive. In 1997Ð98, total health servicesexpenditure in Australia was $47.03 billion. Based on the 1994Ð95 inputÐoutput tables ofthe Australian national accounts constructed by the Australian Bureau of Statistics (ABS),an estimated 65% of this expenditure can be attributed to the labour costs of wages andsalaries and employer contributions to workersÕ compensation and superannuation(ABS 1999b).
In 1998 there were 610,000 persons employed in the health industry, 7.1% of the totalcivilian workforce in Australia. Of these, 378,000 or 62.0% were employed in hospitalsand nursing homes.
In the health industry workforce, 38.1% of persons worked part-time, i.e. less than35 hours per week. Although 76.6% of persons employed were female, this proportionwas higher in hospitals and nursing homes in which 79.3% were female.
Between 1993 and 1998, the health industry workforce increased by 9.7%, comparedwith an 11.9% increase in the civilian workforce and a 6.1% increase in the population.In both, growth in part-time employment was much stronger than growth in full-timeemployment. In the health industry, male part-time employment growth of 13.6% wassimilar to full-time growth of 13.4%, but female part-time employment increased by14.0%, much faster than the full-time increase of 4.4% (Table 5.15).
Table 5.15: Composition of the health industry and civilian population workforces, 1993 and 1998
Full-time Part-time Total Per cent
Males Females Males Females Males Females Persons Part-time Female
Hospitals and nursing homes
1993 64,583 170,346 7,354 124,475 71,937 294,821 366,758 35.9 80.4
1998 69,755 167,249 8,445 132,599 78,200 299,848 378,048 37.3 79.3
Increase 8.0% –1.8% 14.8% 6.5% 8.7% 1.7% 3.1%
Other health industry
1993 47,322 70,282 6,838 65,121 54,160 135,403 189,563 38.0 71.4
1998 57,107 83,892 7,683 83,620 64,790 167,512 232,302 39.3 72.1
Increase 20.7% 19.4% 12.4% 28.4% 19.6% 23.7% 22.5%
Total health industry
1993 111,905 240,628 14,192 189,595 126,097 430,223 556,320 36.6 77.3
1998 126,862 251,141 16,127 216,218 142,989 467,359 610,348 38.1 76.6
Increase 13.4% 4.4% 13.6% 14.0% 13.4% 8.6% 9.7%
Total civilian workforce (’000s)
1993 3,958 1,889 438 1,359 4,396 3,248 7,644 23.5 42.5
1998 4,256 2,094 587 1,618 4,843 3,712 8,555 25.8 43.4
Increase 7.5% 10.9% 34.0% 19.1% 10.2% 14.3% 11.9%
Note: Quarterly survey statistics have been averaged for 1993 and 1998 to minimise volatility in estimates due to sampling.
Source: ABS Labour Force Survey.
01 AH2000 body Page 258 Thursday, June 1, 2000 3:06 PM

5 Health resources and use of services 259
TRIM SIZE 175 mm Wide x 250 mm Deep
International health workforce trendsThe OECD maintains a time series of selected health statistics for OECD countries. Thedata need to be interpreted with care because of inconsistencies in the definitions usedamong countries for enumerating doctors, dentists, pharmacists and nurses, andbecause of differences in the health systems.
Nevertheless, Australia appears to be similar in a number of respects to other countriesin some key workforce trends. The medical workforce has increased at a much fasterrate than population growth and the proportion of doctors who are female hasincreased from around 11% in 1960 to nearly 30% now (Table 5.16, page 260).
In nursing, Australia and New Zealand with almost 10 nurses per 1,000 population in1996 appear to have a relatively high level of nurse employment compared withCanada (7.6), the United States (8.1) and the United Kingdom (4.5). In Australia, nurseworkforce numbers per 1,000 population have been declining during the 1990s becauseof relatively stable total nurse employment numbers. According to the ABS labour forcesurvey, there were 197,700 employed nurses in 1998 compared with 197,100 in 1989.Part-time employment increased from 39.2% to 44.0% during the period, so that thenumbers of full-time equivalent nurses fell by 1.6%, and numbers of full-timeequivalent nurses per 1,000 population fell by 11.8%. In Canada, there has been asimilar, but more pronounced, pattern. Employed nurses per 1,000 population climbedfrom 5.3 in 1966 to 11.0 in 1986, and stayed at this level until 1992 after which there wasa sharp decline to 7.6 in 1997, the most recent year of data.
Growth in the dentist and pharmacist workforces per 1,000 population has been muchslower than in medicine. Supply requirements for dentists are influenced by changes inwork practices, productivity and labour force participation on the one hand andchanges in patient demand on the other. Influences on demand include populationgrowth, oral health status, cost and propensity to visit a dentist for preventive healthreasons. Largely as a result of public health measures (such as water fluoridation andchildhood screening) and rising education and real income levels, there has been aconsiderable improvement in the oral health of the population since the 1960s. This hasled to a change in both the nature and number of dental consultations, which haveincreased in annual number per capita in Australia from 1.1 in 1979 to 1.5 in 1995. Asimilar trend occurred overseas. In the United States dental consultations per capitahave increased from 1.6 in 1962 to 2.1 in 1989 and in the United Kingdom from 0.3 in1960 to 0.7 in 1990 (OECD 1999).
In pharmacy, there have been significant workforce productivity gains in Australiathrough pre-packaging drugs and economies of scale achieved through restructuringthe community pharmacy industry to increase the average number of pharmacists perpharmacy. The number of approved pharmacies fell from 5,606 in 1990 to 4,942 in 1999.The number of community pharmacists increased by 13.3% from 8,713 to 9,870 between1991 and 1996, with pharmacist registrations rising a further 4.9% between 1996 and1998. In 1996, pharmacist numbers of 0.6 per 1,000 population in Australia were thesame as in New Zealand, Canada and the United Kingdom, and only just below the0.7 per 1,000 population in the United States.
01 AH2000 body Page 259 Thursday, June 1, 2000 3:06 PM

260 AustraliaÕs Health 2000
TRIM SIZE 175 mm Wide x 250 mm Deep
Distribution of the medical practitioner, dental and nursing workforces
Medical practitionersIn 1998, there were substantial differences in the supply of doctors among the States andTerritories and between metropolitan, rural and remote areas. Both Western Australiaand Queensland, with 236 medical practitioners per 100,000 population, were below thenational average of 260, whereas South Australia (293) and the Australian CapitalTerritory (310 per 100,000 population) were well above this average. Supply inmetropolitan areas of 306 practitioners per 100,000 population was much higher than the144 practitioners per 100,000 population in rural and remote areas. In the latter, therewere also large differencesÑ267 per 100,000 population in large rural centres comparedwith 154 in small rural centres, 91 in other rural areas and 105 in remote areas.
Reducing this imbalance has been a high priority of government and the medicalprofession. Longer term strategies have included increasing the numbers of medicalstudents of rural origins and from the Aboriginal and Torres Strait Islander populations.
Table 5.16: Provision of doctors, dentists, pharmacists and nurses in selected countries, selected years
Medical practitioners Dentists Pharmacists Nurses
No.
No. per1,000popn
Per centfemale No.
No. per1,000popn No.
No. per1,000popn No.
No. per1,000popn
Australia
1961 10,881 1.1 11.0 3,315 0.3 8,351 0.8 63,821 5.9
1981 27,127 1.8 18.9 5,586 0.4 10,189 0.7 106,565 7.1
1996 45,416 2.5 27.4 7,601 0.4 12,310 0.6 174,770 9.5
New Zealand
1960 2,573 1.1 7.7 n.a. n.a. n.a. n.a. n.a. n.a.
1980 4,881 1.6 16.4 1,145 0.4 2,277 0.7 19,195 6.1
1996 7,634 2.2 29.4 1,364 0.4 2,401 0.6 36,303 9.8
Canada
1961 21,290 1.2 n.a. 5,708 0.3 n.a. n.a. n.a. n.a.
1981 45,542 1.8 17.1 11,484 0.5 13,034 0.5 235,606 9.7
1996 63,209 2.1 28.4 15,869 0.5 17,808 0.6 227,830 7.6
United States
1960 259,400 1.4 6.0 90,120 0.5 101,000 0.6 527,000 2.9
1980 453,165 2.0 10.8 126,240 0.6 142,400 0.6 1,272,900 5.6
1996 701,249 2.6 21.2 166,100 0.6 185,000 0.7 2,161,700 8.1
United Kingdom
1960 n.a. n.a. n.a. n.a. n.a. n.a. n.a. n.a. n.a.
1980 72,198 1.3 19.5 17,604 0.3 n.a. n.a. 197,900 3.5
1996 98,800 1.7 n.a. 22,200 0.4 34,418 0.6 264,744 4.5
Source: OECD 1999.
01 AH2000 body Page 260 Thursday, June 1, 2000 3:06 PM

5 Health resources and use of services 261
TRIM SIZE 175 mm Wide x 250 mm Deep
Because undergraduate and postgraduate medical training takes 10 years or more, littlechange will be seen in the characteristics of the workforce due to these strategies forsome years.
The medical colleges have greatly expanded rural outreach programs, includingtelemedicine, to improve access to medical services by rural populations, and StateGovernments have increased the numbers of temporary resident overseas-traineddoctors entering Australia from 667 in 1992Ð93 to 2,224 in 1998Ð99. There are also manyincentive schemes to attract doctors to rural areas and to reduce the level of attrition ofdoctors from rural areas.
Table 5.17: Distribution of Medicare general practice providers, 1984Ð85 and 1998Ð99
Locality 1984–85 1998–99Per cent change
1984–85 to 1998–99
Head count numbers
Capital city 12,135 16,512 36.1
Other metropolitan 1,024 1,709 66.9
Large rural centre 852 1,375 61.4
Small rural centre 948 1,374 44.9
Other rural 1,695 2,426 43.1
Remote centre 137 295 115.3
Other remote area 157 485 208.9
Total 16,948 24,176 42.6
Full-time workload equivalents (a)
Capital city 7,050 11,428 62.1
Other metropolitan 809 1,277 57.8
Large rural centre 596 939 57.6
Small rural centre 653 918 40.6
Other rural 1,116 1,458 30.6
Remote centre 87 115 32.2
Other remote area 98 133 35.7
Total 10,410 16,268 56.3
Population per full-time workload equivalent
Capital city 1,407 1,045 –25.7
Other metropolitan 1,353 1,115 –17.6
Large rural centre 1,517 1,190 –21.6
Small rural centre 1,491 1,328 –10.9
Other rural 1,906 1,690 –11.3
Remote centre 2,318 1,952 –15.8
Other remote area 3,421 2,674 –21.8
Total 1,494 1,153 –22.9
(a) The full-time workload equivalent (FWE) is defined by the Department of Health and Aged Care (DHAC) on the basis of income from fees charged for Medicare services rendered. The FWE for each doctor is calculated by dividing this income by the mean billing of doctors considered to be working full-time. The mean billing of full-time doctors was $183,332 in 1998–99.
Source: AIHW analysis of DHAC data.
01 AH2000 body Page 261 Thursday, June 1, 2000 3:06 PM

262 AustraliaÕs Health 2000
TRIM SIZE 175 mm Wide x 250 mm Deep
There has been considerable improvement in the provision of general practitioners(GPs) since the commencement of Medicare in 1984Ð85 (Table 5.17). Large rural centresnow have, on average, a similar supply of GPs per 100,000 population as non-capitalcity metropolitan areas. Between 1984Ð85 and 1998Ð99, the GP workforce per 100,000population for other rural and remote areas increased by about one-third, althoughsome areas are less well-off than others.
Dental workforceThe national dental workforce in clinical practice consists of dentists and dentalauxiliaries (dental therapists, dental prosthetists and dental hygienists). There are majorgeographic differences in the distribution of both dentists and dental auxiliaries inAustralia.
In 1994, there were 43.0 dentists per 100,000 population in Australia, with theAustralian Capital Territory and South Australia having the highest rates (57.5 and 49.7respectively) and Tasmania the lowest (25.2). Capital cities had 51.2 dentists per 100,000population and the rest of Australia 28.7 per 100,000 population.
The number of practising clinical dental auxiliaries per 100,000 population variesaccording to the type of auxiliary and the State and Territory of practice. Dentaltherapists who worked in School Dental Services were the most numerous in 1997,there being 7.1 per 100,000 population, which is equivalent to a full-time rate of 5.8.Western Australia (17.8), Tasmania (14.6) and Queensland (12.3) had the highestnumbers of dental therapists per 100,000 population, and New South Wales (3.6) andVictoria (2.7) had the lowest.
Dental prosthetists predominantly work in their own practices making removabledentures. In 1998 there were 4.2 per 100,000 population in Australia. Tasmania had thehighest number with 11.2 per 100,000 population, and South Australia had the lowestwith 1.7 per 100,000 population.
There were only 1.5 dental hygienists per 100,000 population in 1997. The AustralianCapital Territory (7.7) and South Australia (6.6) had the highest numbers per 100,000population.
In contrast, in the early 1990s the United States had 60.8 dentists and 39.5 hygienists per100,000 population, Canada 52.4 dentists and 22.8 hygienists per 100,000 population,and the Netherlands 52.8 dentists and 6.7 hygienists per 100,000 population.
Nursing workforceThere are significant differences in the supply of nurses among the States andTerritories and between metropolitan and rural areas, but not to the same extent as formedicine and dentistry.
In 1996, there were 1,064 full-time equivalent nurses per 100,000 population. WesternAustralia with 1,236 nurses per 100,000 population, Victoria 1,178, the AustralianCapital Territory 1,142 and Tasmania 1,120 were above the national average.Queensland with 962 nurses per 100,000 population and New South Wales with 984were well below the national average. South Australia and the Northern Territory hadclose to the national average.
01 AH2000 body Page 262 Thursday, June 1, 2000 3:06 PM

5 Health resources and use of services 263
TRIM SIZE 175 mm Wide x 250 mm Deep
Nurse employment in rural areas was much higher than employment of other healthprofessions. In 1996, nurse employment per 100,000 population in large rural centres(1,705), small rural centres (1,363) and remote centres (1,220) exceeded that of capitalcities (1,183). However, in small rural centres, other rural and remote areas, around 30%of nurses were enrolled nurses whose minimum training involves 1 year of post-schoolnursing education compared with 3 years for registered nurses. In capital cities, 17% ofnurses were enrolled nurses.
Tertiary education entrants to the health workforceThe number of Australian citizens and permanent residents who completedundergraduate degrees in health fields at universities increased only slightly between1992 and 1997, from 12,645 to 12,999. However, non-nursing course completionsincreased by 35.2%, from 4,373 to 5,914. Basic nursing course commencements fell by8.3% and post-basic commencements by just over two-thirds, mainly because of a fall inschool leavers applying to undertake nurse training.
Table 5.18: Undergraduate course commencements in health fields, 1993 and 1998
Field of study
1993 1998
TotalPer cent
female TotalPer cent
female
Medicine 1,293 47.3 1,221 50.3
Dentistry 224 48.7 267 50.2
Pharmacy 465 61.1 699 62.8
Physiotherapy 624 60.6 713 59.0
Medical radiography 396 63.6 574 62.9
Occupational therapy 549 85.2 749 88.1
Speech pathology 285 94.7 410 95.6
Optometry 180 63.3 231 63.6
Podiatry 120 47.5 193 59.6
Nursing
Basic 8,543 85.2 7,830 86.3
Post-basic 3,441 91.8 1,105 92.3
Dental therapy 24 91.7 28 85.7
Rehabilitation 162 82.1 363 83.2
Nutrition and dietetics 73 87.7 160 90.6
Health administration 404 79.0 341 75.7
Medical science 454 60.1 550 63.6
Medical technology 357 65.8 384 67.2
Science and technology 250 68.4 795 71.2
Health surveying and environmental health 215 53.0 203 57.1
Health counselling 48 89.6 142 83.8
Other health(a) 351 77.2 807 81.2
Total 18,458 79.2 18,050 76.8
Total excluding nursing 6,474 64.7 9,115 66.7
(a) Mainly public health and Aboriginal health courses.
Note: Australian citizen or permanent resident students only.
Source: AIHW analysis of Department of Education, Training and Youth Affairs data.
01 AH2000 body Page 263 Thursday, June 1, 2000 3:06 PM

264 AustraliaÕs Health 2000
TRIM SIZE 175 mm Wide x 250 mm Deep
Statistics on undergraduate course commencements provide a guide to futureworkforce supply. Between 1993 and 1998 there was a 40.8% increase in non-nursingcommencements, from 6,474 to 9,115, with the female proportion increasing from 64.7%to 66.7%. In 1998, female medical and dentistry commencements exceeded the numberof male commencements for the first time. Overall, 76.8% of all those commencingundergraduate health courses in 1998 were females (66.7% if nursing courses areexcluded) (Table 5.18), compared with 57.5% for undergraduate commencements in alluniversity courses in 1998.
Table 5.19: Undergraduate course commencements by Aboriginal and Torres Strait Islander persons in health fields, 1993 and 1998
Field of study
1993 1998
IndigenousNon-
IndigenousPer cent
Indigenous IndigenousNon-
IndigenousPer cent
Indigenous
Medicine 7 1,286 0.54 10 1,211 0.83
Dentistry 1 223 0.45 0 267 0.00
Pharmacy 0 465 0.00 2 697 0.29
Physiotherapy 4 620 0.64 4 709 0.56
Medical radiography 3 393 0.76 3 571 0.53
Occupational therapy 2 547 0.36 1 748 0.13
Speech pathology 2 283 0.70 2 408 0.49
Optometry 0 180 0.00 1 230 0.43
Podiatry 0 120 0.00 2 191 1.05
Nursing
Basic 80 8,463 0.94 102 7,728 1.32
Post-basic 10 3,431 0.29 6 1,099 0.55
Dental therapy 0 24 0.00 1 27 3.70
Rehabilitation 1 161 0.62 1 362 0.28
Nutrition and dietetics 0 73 0.00 1 159 0.63
Health administration 2 402 0.50 2 339 0.59
Medical science 0 454 0.00 2 548 0.36
Medical technology 2 355 0.56 4 380 1.05
Science and technology 26 224 10.40 17 878 1.94
Health surveying and environmental health 1 214 0.47 1 202 0.50
Health counselling 1 47 2.08 0 142 0.00
Other health(a) 67 284 19.09 171 821 20.83
Total 209 18,249 1.13 333 17,717 1.88
(a) Mainly public health and Aboriginal health courses.
Note: Australian citizen or permanent resident students only.
Source: AIHW analysis of Department of Education, Training and Youth Affairs data.
01 AH2000 body Page 264 Thursday, June 1, 2000 3:06 PM

5 Health resources and use of services 265
TRIM SIZE 175 mm Wide x 250 mm Deep
Aboriginal and Torres Strait Islanders peoples are underrepresented in all fields ofstudy except Aboriginal health and public health training. Excluding the latter,79 Aboriginal and Torres Strait Islander persons completed undergraduate degrees inhealth fields in 1997, with 62 of these in nursing. This is an increase on the54 undergraduate degree completions in 1992, when there were 40 nursing graduates.
Overall, there were 333 Aboriginal and Torres Strait Islander persons commencingundergraduate courses in 1998, with 162 in fields other than Aboriginal and publichealth, including 10 in medicine (Table 5.19).
Immigration of health professionalsThere are stringent immigration and professional registration board requirements forhealth professionals trained in overseas countries who wish to migrate permanently orwork temporarily in Australia. New Zealand is an exception to this as Australian healthprofessional registration boards recognise the qualifications of New Zealand graduatesas equivalent to those gained in Australian universities, and trans-Tasman immigrationagreements facilitate migration between the two countries.
During the 1990s, State health authorities have increasingly used temporary employmentof overseas-trained health professionals in an attempt to remedy shortages in theAustralian workforce, particularly in hospitals and in rural and remote areas. Between1993Ð94 and 1998Ð99, the numbers of temporary resident health professionals increasedfrom 1,282 to 3,395 (Table 5.20). The most popular countries of origin in 1998Ð99 were theUnited Kingdom and Ireland (1,867), New Zealand (632) and Asian countries (333).
During this period, the number of Australian health professionals travelling to overseascountries for temporary employment of 12 months or more increased from 1,569 to1,770, a 12.8% increase.
Table 5.20: Health professionals arriving in Australia, 1993Ð94 and 1998Ð99
Field of study
Permanent migrantsTemporary residents for the
purpose of employment
1993–94 1998–99Per centchange 1993–94 1998–99
Per centchange
Medical practitioners 445 408 –8.3 893 2,224 149.0
Nurses and midwives 870 1,080 24.1 261 772 195.8
Dental practitioners 79 80 1.3 11 42 281.8
Pharmacists 72 120 66.7 27 89 229.6
Occupational therapists 27 29 7.4 12 18 50.0
Optometrists 15 98 553.3 23 101 339.1
Physiotherapists 77 90 16.9 10 32 220.0
Speech pathologists 20 16 –20.0 3 6 100.0
Chiropractors and osteopaths 5 9 80.0 9 18 100.0
Podiatrists 7 8 14.3 3 7 133.3
Medical imaging professionals 44 53 20.5 18 68 277.8
Other health occupations 54 39 –27.8 12 19 58.3
Total 1,715 2,030 18.4 1,282 3,395 164.8
Source: AIHW analysis of Department of Immigration and Multicultural Affairs data.
01 AH2000 body Page 265 Thursday, June 1, 2000 3:06 PM
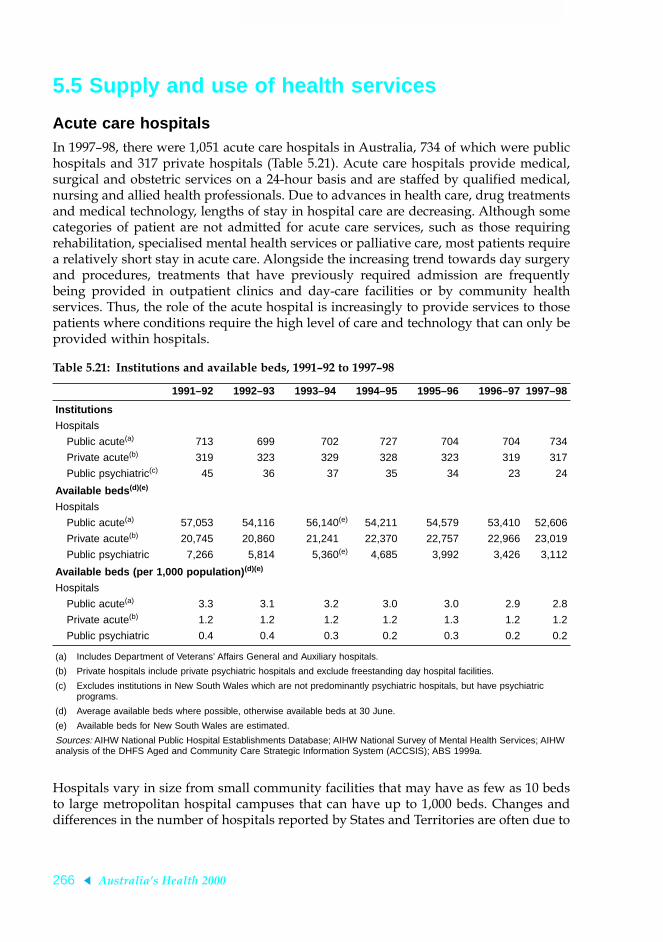
266 AustraliaÕs Health 2000
TRIM SIZE 175 mm Wide x 250 mm Deep
5.5 Supply and use of health services
Acute care hospitalsIn 1997Ð98, there were 1,051 acute care hospitals in Australia, 734 of which were publichospitals and 317 private hospitals (Table 5.21). Acute care hospitals provide medical,surgical and obstetric services on a 24-hour basis and are staffed by qualified medical,nursing and allied health professionals. Due to advances in health care, drug treatmentsand medical technology, lengths of stay in hospital care are decreasing. Although somecategories of patient are not admitted for acute care services, such as those requiringrehabilitation, specialised mental health services or palliative care, most patients requirea relatively short stay in acute care. Alongside the increasing trend towards day surgeryand procedures, treatments that have previously required admission are frequentlybeing provided in outpatient clinics and day-care facilities or by community healthservices. Thus, the role of the acute hospital is increasingly to provide services to thosepatients where conditions require the high level of care and technology that can only beprovided within hospitals.
Hospitals vary in size from small community facilities that may have as few as 10 bedsto large metropolitan hospital campuses that can have up to 1,000 beds. Changes anddifferences in the number of hospitals reported by States and Territories are often due to
Table 5.21: Institutions and available beds, 1991Ð92 to 1997Ð98
1991–92 1992–93 1993–94 1994–95 1995–96 1996–97 1997–98
Institutions
Hospitals
Public acute(a) 713 699 702 727 704 704 734
Private acute(b) 319 323 329 328 323 319 317
Public psychiatric(c) 45 36 37 35 34 23 24
Available beds (d)(e)
Hospitals
Public acute(a) 57,053 54,116 56,140(e) 54,211 54,579 53,410 52,606
Private acute(b) 20,745 20,860 21,241 22,370 22,757 22,966 23,019
Public psychiatric 7,266 5,814 5,360(e) 4,685 3,992 3,426 3,112
Available beds (per 1,000 population) (d)(e)
Hospitals
Public acute(a) 3.3 3.1 3.2 3.0 3.0 2.9 2.8
Private acute(b) 1.2 1.2 1.2 1.2 1.3 1.2 1.2
Public psychiatric 0.4 0.4 0.3 0.2 0.3 0.2 0.2
(a) Includes Department of Veterans’ Affairs General and Auxiliary hospitals.
(b) Private hospitals include private psychiatric hospitals and exclude freestanding day hospital facilities.
(c) Excludes institutions in New South Wales which are not predominantly psychiatric hospitals, but have psychiatric programs.
(d) Average available beds where possible, otherwise available beds at 30 June.
(e) Available beds for New South Wales are estimated.
Sources: AIHW National Public Hospital Establishments Database; AIHW National Survey of Mental Health Services; AIHW analysis of the DHFS Aged and Community Care Strategic Information System (ACCSIS); ABS 1999a.
01 AH2000 body Page 266 Thursday, June 1, 2000 3:06 PM

5 Health resources and use of services 267
TRIM SIZE 175 mm Wide x 250 mm Deep
changes in administrative or reporting arrangements and not necessarily due to achange in the number of hospital campuses or buildings. In addition, the servicedelivery structure differs between jurisdictions, so the count of hospitals in States andTerritories is not useful for comparative purposes.
A more reliable indicator of shifts in the availability of hospital services is the increasesor decreases in the number of available beds over time. Available beds are those that areimmediately available for use by admitted patients when required. Between 1991Ð92and 1997Ð98, there was a 3% reduction in available acute care beds, resulting in adecrease in the rate of available beds from 4.5 to 4.1 beds per 1,000 population(Table 5.21). Decreased length of stay has led to a lower requirement for hospital beds.The change in available beds was not evenly distributed between the public and privatesectors, with the number of private acute care beds increasing by 11% and public acutebeds decreasing by 8%.
Psychiatric hospitalsReforms in recent years in the provision of mental health services have led to a changein the way people with a severe mental disorder are treated, with a move away fromsegregated and custodial institutional care to a more balanced system that integrateshospital services with continuing care in community settings.
Between 1991Ð92 and 1997Ð98, there was a substantial reduction in the number ofpublic psychiatric hospitals, from 45 to 24 facilities. Over the same period, the numberof available beds in public psychiatric hospitals declined from 7,266 to 3,122 beds. Therehas been a corresponding increase in the number of beds provided in community-basedresidential services. The section on mental health services (page 282) containsadditional information on the changes that have occurred in the delivery of mentalhealth services over the past decade.
Regional variation in bed supplyThe number of beds per 1,000 population in health care institutions is a useful indicatorof the comparative supply of healthcare services across States and Territories. Forhospitals, there is a different mix between public and private beds across the States andTerritories. The national average for all hospital beds is 4.0 beds per 1,000 population. In1997Ð98, South Australia (4.7 beds per 1,000 population) and Queensland (4.4 beds)were above the national average (Table 5.22, page 268).
Other health servicesIn addition to the institutional care services provided in hospitals and residential agedcare facilities, there is a large range of community health services provided bothpublicly and privately. These include services provided directly to individuals as wellas other public and environmental health services that aim to protect and promote thehealth of communities as a whole (through activities such as food safety regulation,monitoring of radiation levels and tobacco control measures). For services delivereddirectly to individuals, care is largely delivered as ambulatory care, including servicesprovided in peopleÕs homes (e.g. home-based palliative care, domiciliary nursing) andoutreach services (e.g. mobile services to homeless people, health promotion inschools). Some health services delivered in the community also provide residential care,
01 AH2000 body Page 267 Thursday, June 1, 2000 3:06 PM

268 AustraliaÕs Health 2000
TRIM SIZE 175 mm Wide x 250 mm Deep
i.e. in 24-hour-staffed residential units that provide specialised treatment, rehabilitationor care. This includes residential mental health care services and residential alcohol anddrug treatment services.
A large number of community-based services available to individuals are provided byprivate healthcare practitioners. These include general practitioners, dentists, privatedomiciliary nursing services and private allied health professionals.
There are also a significant number of services available to individuals that areprovided publicly by governments, usually under the umbrella term Ôcommunityhealth servicesÕ. These services are often provided within models of care that emphasisethe availability of multidisciplinary care, disease prevention and early intervention,accessibility to those with high needs, and the provision of care in a way that reducesthe stigma that may be associated with some health issues (e.g. sexual health services,mental health services).
The services vary in terms of the extent to which they serve specific population groups(e.g. womenÕs health services, child health centres) or specialise in treating specifichealth problems (e.g. alcohol and other drug treatment services, dental services). Otherservices may provide a broad range of services to a broad client base (e.g. a communitynursing service may be involved in many aspects of postnatal care and post-dischargecare following a hospital admission, and provide ongoing care to the aged or peoplewho need long-term care. Community health services may also deliver services in otherways, such as services to groups (e.g. health education, support programs), and mayalso undertake health promotion, public health and community development activities.
Although comprehensive national data are lacking on many of the health services thatare provided in the community, data are available in some areas of community healthservice. Two are described below.
Family planning organisations Family planning organisations provide a range of services to promote the sexual andreproductive health of Australians, particularly for people who choose not to, or are notable to, access sexual and reproductive health services through other healthcare
Table 5.22: Available beds per 1,000 population(a), States and Territories, 1997Ð98
Institution type NSW Vic Qld WA SA Tas ACT NT Aust
Hospitals
Public acute(b) 2.9 2.6 2.9 2.7 3.2 2.3 2.5 3.1 2.8
Private acute(c) 1.0 1.3 1.5 1.3 1.5 1.7 (d) (e) 1.2
Public psychiatric 0.2 0.0 0.3 0.3 0.3 n.a. — — 0.2
Aged care facilities 87.7 83.5 91.7 89.4 88.8 85.8 87.2 98.3 87.5
(a) Rates per 1,000 population calculated using total population for hospitals and population aged 70 and over for aged care facilities.
(b) Includes Department of Veterans’ Affairs General and Auxiliary hospitals.
(c) Private hospitals include private psychiatric hospitals and exclude freestanding day hospital facilities.
(d) Included with New South Wales.
(e) Included with South Australia.
Sources: AIHW National Public Hospital Establishments Database; ABS 1999a.
01 AH2000 body Page 268 Thursday, June 1, 2000 3:06 PM
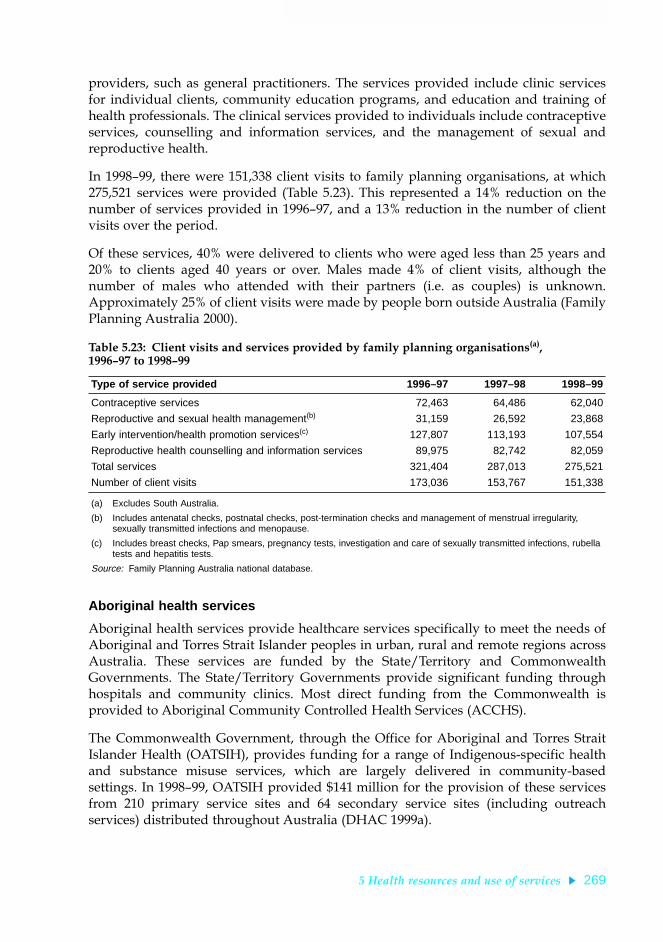
5 Health resources and use of services 269
TRIM SIZE 175 mm Wide x 250 mm Deep
providers, such as general practitioners. The services provided include clinic servicesfor individual clients, community education programs, and education and training ofhealth professionals. The clinical services provided to individuals include contraceptiveservices, counselling and information services, and the management of sexual andreproductive health.
In 1998Ð99, there were 151,338 client visits to family planning organisations, at which275,521 services were provided (Table 5.23). This represented a 14% reduction on thenumber of services provided in 1996Ð97, and a 13% reduction in the number of clientvisits over the period.
Of these services, 40% were delivered to clients who were aged less than 25 years and20% to clients aged 40 years or over. Males made 4% of client visits, although thenumber of males who attended with their partners (i.e. as couples) is unknown.Approximately 25% of client visits were made by people born outside Australia (FamilyPlanning Australia 2000).
Aboriginal health services
Aboriginal health services provide healthcare services specifically to meet the needs ofAboriginal and Torres Strait Islander peoples in urban, rural and remote regions acrossAustralia. These services are funded by the State/Territory and CommonwealthGovernments. The State/Territory Governments provide significant funding throughhospitals and community clinics. Most direct funding from the Commonwealth isprovided to Aboriginal Community Controlled Health Services (ACCHS).
The Commonwealth Government, through the Office for Aboriginal and Torres StraitIslander Health (OATSIH), provides funding for a range of Indigenous-specific healthand substance misuse services, which are largely delivered in community-basedsettings. In 1998Ð99, OATSIH provided $141 million for the provision of these servicesfrom 210 primary service sites and 64 secondary service sites (including outreachservices) distributed throughout Australia (DHAC 1999a).
Table 5.23: Client visits and services provided by family planning organisations(a), 1996Ð97 to 1998Ð99
Type of service provided 1996–97 1997–98 1998–99
Contraceptive services 72,463 64,486 62,040
Reproductive and sexual health management(b) 31,159 26,592 23,868
Early intervention/health promotion services(c) 127,807 113,193 107,554
Reproductive health counselling and information services 89,975 82,742 82,059
Total services 321,404 287,013 275,521
Number of client visits 173,036 153,767 151,338
(a) Excludes South Australia.
(b) Includes antenatal checks, postnatal checks, post-termination checks and management of menstrual irregularity, sexually transmitted infections and menopause.
(c) Includes breast checks, Pap smears, pregnancy tests, investigation and care of sexually transmitted infections, rubella tests and hepatitis tests.
Source: Family Planning Australia national database.
01 AH2000 body Page 269 Thursday, June 1, 2000 3:06 PM

270 AustraliaÕs Health 2000
TRIM SIZE 175 mm Wide x 250 mm Deep
The largest area of Commonwealth funding to Aboriginal health services is in the formof ÔglobalÕ grants to ACCHS, for the provision of services that are Ôculturallyappropriate, autonomous primary health services, initiated, planned and governed bylocal Aboriginal communities through their locally elected Aboriginal board ofdirectorsÕ (DHAC 2000a). They manage acute and chronic health conditions, conductpreventive health and health promotion activities, provide transport services, andprovide advocacy and assistance to clients in obtaining other community and healthservices. The services operate in different ways, with the emphasis being on theprovision of primary medical care within a multidisciplinary team framework.Aboriginal health workers are an important part of these teams. In 1997Ð98, 106 ACCHSprovided reports on their service activity. These services reported that approximately860,000 episodes of health care were provided to individual clients. Of clients whoreceived services, 90% were Aboriginal (DHAC 2000a).
In 1996, there were 703 employed Aboriginal and Torres Strait Islander health workers(ABS 1997a). In 1998, there were 698 medical practitioners who worked full-time orpart-time in an Aboriginal health service; 63% worked in metropolitan areas (AIHW2000). The Commonwealth has commissioned a National Workforce Modelling Projectto provide further data on the numbers and types of health professionals working inAboriginal health services.
Use of hospitals
Admitted patients, patient-days and length of stayThere were 5,563,074 separations from public acute, public psychiatric and privatehospitals reported to the National Hospital Morbidity Database for 1997Ð98 (AIHW1999c), representing 299 separations per 1,000 population (Table 5.24, page 273). Therewere 3,747,532 (67%) separations from public acute hospitals, 22,566 (0.4%) separationsfrom public psychiatric hospitals and 1,792,976 (32%) separations from privatehospitals. These separations accounted for 22,555,130 patient-days, 67% in publichospitals, 6% in public psychiatric hospitals and 27% in private hospitals.
With public psychiatric hospitals excluded, average length of stay in 1997Ð98 was3.8 days overall, 4.0 days in public acute hospitals and 3.3 days in private hospitals. Thedifference between these two hospital sectors at least in part reflects the different rangeof patients cared for and treatments undertaken (casemixes). For example, public acutehospitals had more children under the age of 5 years as patients (7.3% of separations)compared with private hospitals (2.7% of separations) and procedures were morecommonly reported for patients of private hospitals (87%) than for patients of publicacute hospitals (71%).
If same-day separations are excluded (as is the practice in most OECD countries), theaverage length of stay was 6.4 days in public acute hospitals and 6.0 days in privatehospitals. These figures are within the range of those reported for other OECDcountries (OECD 1999).
01 AH2000 body Page 270 Thursday, June 1, 2000 3:06 PM

5 Health resources and use of services 271
TRIM SIZE 175 mm Wide x 250 mm Deep
Box 5.6: Statistics and data sources relating to the use of hospitals
Admitted patient statistics
Statistics on admitted patients, although sometimes referred to as admission statistics, aremore correctly referred to as separation statistics. This is because most of the data on theuse of hospitals by admitted patients are based on information collected at the end ofpatientsÕ episodes of care, rather than at the beginning. The reason for this is that theactual length of stay and the procedures carried out are known and the diagnostic infor-mation is more accurate.
Admitted patient means a patient who undergoes a hospitalÕs formal admission process.
Patient-day means the occupancy of a hospital bed (or chair in the case of some same-daypatients) by an admitted patient for all or part of a day.
Separation is the term used to refer to the episode of care, which can be a total hospitalstay (from admission to discharge, transfer or death), or a portion of a hospital stay begin-ning or ending in a change of type of care (for example, from acute to rehabilitation). ÔSep-arationÕ also means the process by which an admitted patient completes an episode of careby being discharged, dying, transferring to another hospital or changing type of care.
For each separation, patients are assigned a principal diagnosis or the diagnosis estab-lished after study to be chiefly responsible for occasioning the patientÕs episode of admittedpatient care. The principal diagnosis recorded for each separation is usually a disease,injury or poisoning, but can also be specific treatment of an already diagnosed condition,such as dialysis for renal disease, or other reasons for hospitalisation.
If applicable, a principal procedure is also identified. This is the most significant proce-dure performed for treatment of the principal diagnosis or, if no procedure was performedfor that, another therapeutic or diagnostic procedure. Diagnoses and procedures werereported using the ICD-9-CM classification in 1997Ð98 and are now reported using theICD-10-AM classification (see Box 5.7, page 274).
The State and Territory health authorities compile information on separations and supplyit to the Australian Institute of Health and Welfare for collation into the National HospitalMorbidity Database. This database comprises an electronic record for each separation fromalmost all hospitals in Australia, including public acute and psychiatric hospitals (publicsector) and private hospitals, which include private psychiatric and private freestandingday hospital facilities (private sector).
As indicators of community morbidity, hospital separation data have limitations. Sickpeople who are not admitted to hospital are not counted and those who are admitted morethan once, or to more than one hospital, are counted on each occasion. Hospital separationdata also reflect differing admission practices and availability of and access to hospitals.
(continued)
01 AH2000 body Page 271 Thursday, June 1, 2000 3:06 PM

272 AustraliaÕs Health 2000
TRIM SIZE 175 mm Wide x 250 mm Deep
Between 1993Ð94 and 1997Ð98, there was a 10% increase in separations from publicacute hospitals and a 28% increase in separations from private hospitals. There was adecrease of 5% in patient-days for public hospitals over this period but an increase of14% for private hospitals. This is consistent with the larger increase in separations forprivate hospitals over this period.
In 1993Ð94, 72% of separations and 76% of patient days were in public acute hospitals,whereas in 1997Ð98 these percentages had fallen to 68% and 73% respectively. Withinpublic acute hospitals, the proportion of patients admitted as public patients increasedfrom 78% in 1993Ð94 to 86% in 1997Ð98.
Between 1993Ð94 and 1997Ð98, the crude separation rate per 1,000 population increasedby 15% and, after adjusting for changes in the age structure, there was still a 13%increase in separations over the period. Age-standardised patient-days per 1,000population fell by 1% over the 5-year period (Table 5.24). Thus, despite an increase inthe number of separations, total patient-days remained relatively stable.
The increase in separations may be accounted for, at least in part, by the introduction ofepisodes of care as the unit of reporting, rather than hospital stays (see Box 5.6). Thisreporting change may also account for part of the decline in average length of stay overthe last few years. The increased numbers of separations may also reflect improvedreporting by hospitals.
In 1997Ð98, there were 2,577,653 same-day separations, 1,622,339 from public acutehospitals, 2,390 from public psychiatric hospitals and 952,924 from private hospitals.There has been a marked upward trend over the period 1993Ð94 to 1997Ð98 in theproportion of separations that were day-only separations, reflecting changing medicalpractice and efforts to increase hospital productivity. In 1993Ð94, 37% of separationswere same-day separations, but by 1997Ð98 this had increased to 46% of all separations.
Box 5.6 (continued): Statistics and data sources relating to the use of hospitals
Non-admitted patients
Hospitals provide services to non-admitted patients through emergency departments, out-patient clinics and a range of other specialised services. Summary information on theseservices is collated nationally for public hospitals by the Australian Institute of Health andWelfare and for private hospitals by the Australian Bureau of Statistics.
An occasion of service for a non-admitted patient is defined as any examination, consul-tation, treatment or other service provided to a patient in each functional unit of a healthservice establishment on each occasion such service is provided. National data are catego-rised into broad clinic or service-based groupings.
Use of the national definition and categorisation for non-admitted patients is not com-pletely uniform among the States and Territories and has varied over time, and this affectsdata quality. Existing national systems for counting and classifying non-admitted patientservices are being revised.
01 AH2000 body Page 272 Thursday, June 1, 2000 3:06 PM

5 Health resources and use of services 273
TRIM SIZE 175 mm Wide x 250 mm Deep
Table 5.24: Hospital use by admitted patients, 1993Ð94 to 1997Ð98(a)
1993–94(b) 1994–95(b) 1995–96(c) 1996–97 1997–98
Separations per 1,000 population (g) Public acute hospitals(d)(e) 185.6 190.5 196.4 196.6 201.2
Public patients 144.0 151.5 163.1 166.0 173.0
Private patients 30.7 27.2 24.1 21.3 19.1
Private hospitals 74.7 82.1 87.7 92.4 97.3
Total (f) 259.5 271.9 284.6 289.1 298.7Total age-standardised rate 257.0 268.1 279.1 282.7 290.6
Patient-days per 1,000 population (g)
Public acute hospitals(d)(e) 895.6 867.2 859.1 824.1 813.6
Public patients 677.3 673.3 694.1 678.2 669.0
Private patients 142.4 121.0 103.4 88.0 76.2
Private hospitals 291.0 304.1 327.6 319.9 325.2
Total (f) 1,183.8 1,168.4 1,235.7 1,214.0 1,211.1Total age-standardised rate 1,157.7 1,133.8 1,187.9 1,161.4 1,149.9
Same-day separations as a percentage of totalPublic acute hospitals(d)(e) 34.2 37.7 39.8 42.0 43.3
Public patients 35.0 38.2 40.4 42.6 43.8
Private patients 33.2 36.5 38.4 40.9 42.7
Private hospitals 43.3 46.1 48.9 51.0 53.1
Total (f) 36.8 40.2 42.4 44.7 46.3
Average length of stay (days)Public acute hospitals(d)(e) 4.8 4.6 4.4 4.2 4.0
Public patients 4.7 4.4 4.3 4.1 3.9
Private patients 4.6 4.4 4.3 4.1 4.0
Private hospitals 3.9 3.7 3.7 3.5 3.3
Total (f) 4.8 4.3 4.3 4.2 4.1
Average length of stay, excluding same-day separations (days)Public acute hospitals(d)(e) 6.8 6.7 6.6 6.5 6.4
Public patients 6.7 6.6 6.5 6.4 6.1
Private patients 6.4 6.4 6.3 6.3 6.2
Private hospitals 6.1 6.0 6.4 6.0 6.0
Total (f) 6.6 6.5 6.8 6.8 6.7
(a) Some of these data have been updated since previously published.
(b) For 1993–94 and 1994–95, Victorian private hospital data are incomplete. About 81% of 1993–94 separations and 98% of 1994–95 separations were included.
(c) Statistical separations were introduced in 1995–96 and would have resulted in an increase in separations reported for that and subsequent years compared with previous years.
(d) Includes the Department of Veterans’ Affairs hospitals.
(e) Public and private patients account for the bulk of separations from these hospitals, but there are also separations for other categories of patients.
(f) Public psychiatric hospital data are included in totals from 1995–96. In 1995–96 Queensland was unable to report. Victoria was not able to provide patient-days data for all separations in 1995–96 and for 407 separations in 1996–97, as leave days could not be identified.
(g) Figures are crude rates per 1,000 population at 31 December of the relevant year or, if indicated as such, directly age standardised to the Australian population at 30 June 1991. For private hospitals, rates were derived using populations of the reporting States and Territories only, without adjustment for incomplete reporting.
Source: AIHW 1999c.
01 AH2000 body Page 273 Thursday, June 1, 2000 3:06 PM

274 AustraliaÕs Health 2000
TRIM SIZE 175 mm Wide x 250 mm Deep
This change has been accompanied by a substantial increase in the number offreestanding day hospital facilities now operating in the private sector. In 1993Ð94 therewere 111 private freestanding day hospital facilities but by 1997Ð98 there were 175(ABS 1999a).
Box 5.7: Classification of diseases, procedures and episodes for admitted patients
Diseases and proceduresHospital patient records contain a great deal of information about the patientÕs diagnosisand about any procedures performed during the hospital stay. To allow efÞcient storageand analysis of this information, detailed classiÞcation and coding systems are used todescribe and record diagnoses and procedures. The classiÞcation used in 1997Ð98 in Aus-tralia was the second Australian version of the International ClassiÞcation of Diseases,9th Revision, Clinical ModiÞcation (ICD-9-CM), developed by the National CodingCentre (NCC 1996). It comprises classiÞcations of diseases and external causes of injuriesand poisoning, based on the World Health Organization version of ICD-9, and a classiÞca-tion of procedures. These ICD-9-CM codes can be a source of information on the diseaseswhich are treated in hospitals and the operations which are performed, at very detailedlevels or aggregated into broad groupings such as the ICD-9-CM chapters.
The International Statistical ClassiÞcation of Diseases and Related Health Problems,10th Revision, Australian ModiÞcation (ICD-10-AM) has now replaced ICD-9-CM. Itwas developed by the National Centre for ClassiÞcation in Health (NCCH 1998) andimplemented on 1 July 1998 in four jurisdictions, and on 1 July 1999 in the other fourjurisdictions. National data for 1998Ð99 will be compiled and reported using this classiÞ-cation, with data from four jurisdictions mapped from ICD-9-CM to ICD-10-AM.
Diagnosis related groupsAustralian National Diagnosis Related Groups (AN-DRGs) is a classiÞcation system usedfor acute admitted patient episodes. This classiÞcation provides a means of summarisingand relating the number and type of acute admitted patients treated in a hospital (i.e. itscasemix) and relating this information to the resources required by the hospital. This clas-siÞcation groups episodes with similar clinical conditions and similar usage of hospitalresources using information in the hospital morbidity record such as diagnoses, proce-dures, and age and sex of the patients. A new diagnosis related group classiÞcation, theAustralian ReÞned Diagnosis Related Group (AR-DRG) has been developed by theDepartment of Health and Aged Care for implementation with ICD-10-AM.
Each AN-DRG or AR-DRG is associated with information on the average length of stayand estimated average cost for patients in the group in the public and private sectors. ThisclassiÞcation, therefore, has use in measuring outputs and performance of hospitals and inplanning and funding hospital service provision.
01 AH2000 body Page 274 Thursday, June 1, 2000 3:06 PM

5 Health resources and use of services 275
TRIM SIZE 175 mm Wide x 250 mm Deep
Diagnoses, procedures and diagnosis related groups for admitted patients
The conditions that hospitals treat are of interest to health service managers, planners,funders and epidemiologists. These conditions, the procedures that patients undergo inhospital and the consequent casemix of hospitals are detailed in the National HospitalMorbidity Database using the classification systems described in Box 5.7.
For patients with a disease, injury or poisoning recorded as a principal diagnosis, thebroad diagnosis groups (ICD-9-CM chapters) with the highest number of separations inAustralian hospitals (public acute, public psychiatric and private hospitals) in 1997Ð98were diseases of the digestive system, followed by diagnoses within the obstetriccategory (complications of pregnancy, childbirth and the puerperium, which includesnormal deliveries) and diseases of the circulatory system (Tables S34, page 397, and S35,page 398).
At a more detailed level (3-digit ICD-9-CM categories), the most common disease orinjury principal diagnoses (excluding diagnoses described as symptoms) in publichospitals were asthma (54,006 separations) and selected forms of acute and subacuteischaemic heart disease, not including acute myocardial infarction (46,499 separations).In private hospitals, the most common diagnoses were cataract (71,258 separations) anddiseases of the oesophagus (50,054 separations).
Principal diagnoses within the six National Health Priority Areas accounted for 29% ofhospital separations (1,637,689) and 42% of patient-days (9,500,510) in Australianhospitals. Cancer accounted for the largest number of these (477,927 separations),followed by cardiovascular disease (434,748 separations). Mental disorders accountedfor the highest number of patient-days (3,145,162), followed by cardiovascular disease(2,462,898 patient-days). Of the six priority areas, patients admitted with a principaldiagnosis of a mental disorder had the longest lengths of stay on average (Table 5.25,page 276).
A procedure was reported for 76% of separations in Australian hospitals in 1997Ð98. Ofthese, 63% were in public hospitals, although public hospitals accounted for 68% ofseparations overall. Similarly, although 73% of overall patient-days were in publichospitals, only 70% of patient-days associated with procedures were in public hospitals(10,999,725). This reflects the higher proportion of separations in the private sector thatwere associated with a procedure compared with the public sector, 87% and 71%respectively.
At the broad group (ICD-9-CM chapter) level, if miscellaneous diagnostic andtherapeutic procedures are not included (i.e. procedures that are not ÔoperationsÕ orobstetrical procedures), operations on the cardiovascular system were the principalprocedures associated with the largest proportion of public hospital separations forwhich a principal procedure was reported (489,280 separations)(Table S36, page 399).Haemodialysis was the principal procedure reported for 77% (378,466) of theseseparations. The most commonly reported procedure group for the private sector wasoperations on the digestive system (374,314 separations). Within that grouping,endoscopies and other diagnostic procedures on the small and large intestines werereported for 61% of the separations.
01 AH2000 body Page 275 Thursday, June 1, 2000 3:06 PM
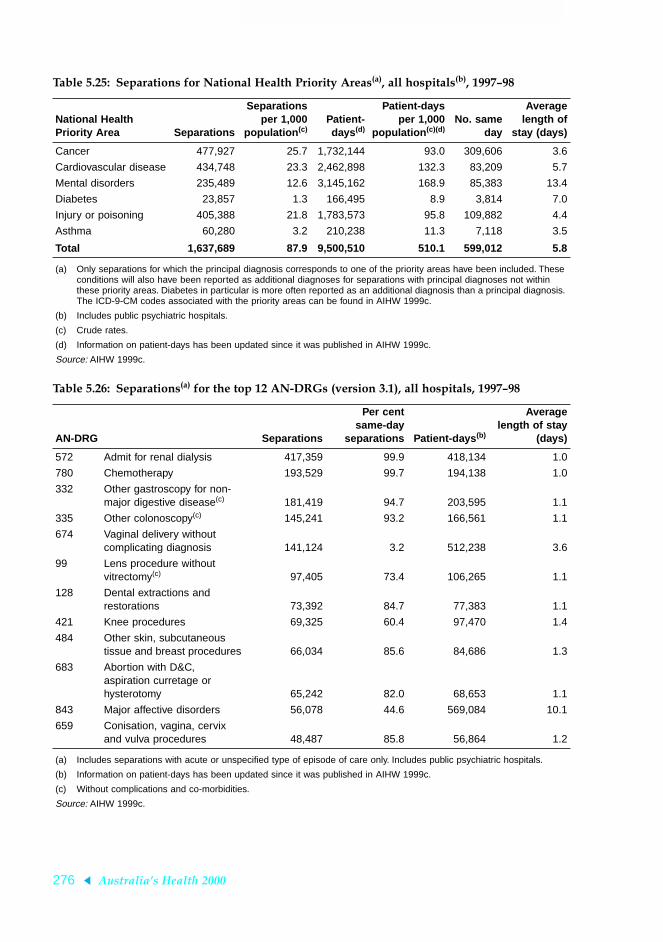
276 AustraliaÕs Health 2000
TRIM SIZE 175 mm Wide x 250 mm Deep
Table 5.25: Separations for National Health Priority Areas(a), all hospitals(b), 1997Ð98
National Health Priority Area Separations
Separationsper 1,000
population (c)Patient-days (d)
Patient-daysper 1,000
population (c)(d)No. same
day
Averagelength of
stay (days)
Cancer 477,927 25.7 1,732,144 93.0 309,606 3.6
Cardiovascular disease 434,748 23.3 2,462,898 132.3 83,209 5.7
Mental disorders 235,489 12.6 3,145,162 168.9 85,383 13.4
Diabetes 23,857 1.3 166,495 8.9 3,814 7.0
Injury or poisoning 405,388 21.8 1,783,573 95.8 109,882 4.4
Asthma 60,280 3.2 210,238 11.3 7,118 3.5
Total 1,637,689 87.9 9,500,510 510.1 599,012 5.8
(a) Only separations for which the principal diagnosis corresponds to one of the priority areas have been included. These conditions will also have been reported as additional diagnoses for separations with principal diagnoses not within these priority areas. Diabetes in particular is more often reported as an additional diagnosis than a principal diagnosis. The ICD-9-CM codes associated with the priority areas can be found in AIHW 1999c.
(b) Includes public psychiatric hospitals.
(c) Crude rates.
(d) Information on patient-days has been updated since it was published in AIHW 1999c.
Source: AIHW 1999c.
Table 5.26: Separations(a) for the top 12 AN-DRGs (version 3.1), all hospitals, 1997Ð98
AN-DRG Separations
Per centsame-day
separations Patient-days (b)
Averagelength of stay
(days)
572 Admit for renal dialysis 417,359 99.9 418,134 1.0
780 Chemotherapy 193,529 99.7 194,138 1.0
332 Other gastroscopy for non-major digestive disease(c) 181,419 94.7 203,595 1.1
335 Other colonoscopy(c) 145,241 93.2 166,561 1.1
674 Vaginal delivery without complicating diagnosis 141,124 3.2 512,238 3.6
99 Lens procedure without vitrectomy(c) 97,405 73.4 106,265 1.1
128 Dental extractions and restorations 73,392 84.7 77,383 1.1
421 Knee procedures 69,325 60.4 97,470 1.4
484 Other skin, subcutaneous tissue and breast procedures 66,034 85.6 84,686 1.3
683 Abortion with D&C, aspiration curretage or hysterotomy 65,242 82.0 68,653 1.1
843 Major affective disorders 56,078 44.6 569,084 10.1
659 Conisation, vagina, cervix and vulva procedures 48,487 85.8 56,864 1.2
(a) Includes separations with acute or unspecified type of episode of care only. Includes public psychiatric hospitals.
(b) Information on patient-days has been updated since it was published in AIHW 1999c.
(c) Without complications and co-morbidities.
Source: AIHW 1999c.
01 AH2000 body Page 276 Thursday, June 1, 2000 3:06 PM

5 Health resources and use of services 277
TRIM SIZE 175 mm Wide x 250 mm Deep
Procedures were reported for varying proportions of separations within the broadgroups of principal diagnoses. High proportions of separations for neoplasms (93%),diseases of the blood and blood-forming organs (91%) and diseases of the genito-urinary system (88%) had procedures reported. In contrast, there were fewer reportedfor separations for mental disorders (33%), infectious and parasitic diseases (39%) anddiseases of the respiratory system (50%).
The Australian National Diagnosis Related Groups (AN-DRGs) with the highestnumbers of separations in 1997Ð98 featured several for which same-day separationsdominated (Table 5.26). Among these were the top two groups in public hospitals,admit for renal dialysis (372,965 public sector separations) and chemotherapy (133,062public sector separations) and the top two groups in the private sector, gastroscopy(107,914 private sector separations) and colonoscopy (95,483 private sector separations)(AIHW 1999c).
Vaginal delivery without complicating diagnosis was the most common AN-DRG thatwas not usually a same-day hospitalisation. This group was the third most common inpublic hospitals (109,246 separations) and the eighth most common in private hospitals(31,878 separations). This category does not include deliveries by caesarean section orcomplicated deliveries.
Area of usual residence
Figures 5.6 (page 278) and 5.7 (page 279) show age-standardised separation rates per1,000 population by statistical division of the usual residence of the patient, for publicand private hospitals. In the public sector, the highest rates were reported for residentsof the statistical divisions of the Kimberley in Western Australia, north-westQueensland and northern South Australia. In the private sector, highest rates werereported for the Queensland statistical divisions of Mackay and Darling Downs and forthe Victorian statistical division of Melbourne.
Non-admitted patients
Public hospitals provide about 95% of non-admitted patient services. In 1997Ð98, therewere 32,764,972 non-admitted patient occasions of service reported for public acute andpsychiatric hospitals, or about 1,760 per 1,000 population (AIHW 1999c). In 1997Ð98,5,138,744 or 14.0% of these occasions of service were provided in accident andemergency departments and 2,683,371 or 8.2% were provided as radiology or organimaging. Note that there is considerable variation among States and Territories in theway data on non-admitted patient occasions of service are collected, and this may affectthe proportion of non-admitted patient occasions of service assigned to this category bydifferent jurisdictions.
Private hospitals also contribute to the provision of non-admitted patient services, witha different mix of types compared with the public hospitals. In 1997Ð98, privatehospitals reported 1,670,300 occasions of service (90 per 1,000 population) (ABS 1999a).The largest numbers were reported for allied health services (384,100 or 22.9%),radiology and organ imaging (248,000 or 14.8%) and accident and emergency (408,300or 24.4%).
01 AH2000 body Page 277 Thursday, June 1, 2000 3:06 PM

278 AustraliaÕs Health 2000
TRIM SIZE 175 mm Wide x 250 mm Deep
Aged care servicesAs well as using those health services provided for the general population, such ashospitals and community health services, older Australians use a number of healthservices provided specifically for the older, frail segment of the population. The coreelements of the Australian aged care system are aged care assessment teams, home- andcommunity-based services provided through the Home and Community Care (HACC)program, community aged care packages and residential aged care facilities. Currentpolicy directions include a continued emphasis on the role of assessment, containmentof the expansion of residential aged care facilities to the planning ratio of 90 places per1,000 persons aged 70 and over, continuing expansion of home-based services providedthrough both the HACC program and community aged care packages, the developmentand implementation of quality appraisal and accreditation procedures for both home-
Note: Data for statistical divisions were combined for mapping purposes for both the Northern Territory and the Australian Capital Territory because of the difference in the relative sizes of the populations between statistical divisions within these jurisdictions.
Source: AIHW National Hospital Morbidity Database.
Figure 5.6: Separations per 1,000 population by statistical division of usual residence, public hospitals, 1997Ð98
Separations per1,000 population
320 to <530280 to <320240 to <280200 to <240130 to <200
01 AH2000 body Page 278 Thursday, June 1, 2000 3:06 PM

5 Health resources and use of services 279
TRIM SIZE 175 mm Wide x 250 mm Deep
based and residential care, and an ongoing emphasis on providing support to carersthrough a range of support services including respite care. For a more detailed accountof these policy directions, see AustraliaÕs Welfare 1999 (AIHW 1999b).
Aged care assessment teamsAged care assessment teams play a central role in the Australian aged care system. Theydetermine eligibility for community aged care packages and for admission toresidential aged care facilities. They also function as a source of advice and referral fora range of services including the HACC program, although they do not determineeligibility for HACC services. Their aim is to Ôensure frail older people gain access toavailable care services appropriate to their needs, and improve coordination of agedcare services with other health and community support agenciesÕ (DHAC 1999a:213).In 1999, there were 123 assessment teams in Australia, 66 based in rural and remoteareas and 57 in metropolitan areas.
Note: Data for statistical divisions were combined for mapping purposes for both the Northern Territory and the Australian Capital Territory because of the difference in the relative sizes of the populations between statistical divisions within these jurisdictions.
Source: AIHW National Hospital Morbidity Database.
Figure 5.7: Separations per 1,000 population by statistical division of usual residence, private hospitals, 1997Ð98
Separations per1,000 population
100 to <14060 to <10040 to <6020 to <400 to <20
01 AH2000 body Page 279 Thursday, June 1, 2000 3:06 PM

280 AustraliaÕs Health 2000
TRIM SIZE 175 mm Wide x 250 mm Deep
In the 6 months from January to June 1999, 81,135 clients aged 65 and over wereassessed, an increase on the 55,746 clients assessed in the same period in 1994. Theproportion of the aged population assessed has also increased, from 2.6% in 1994 to3.5% in 1999. Rates of assessment were higher among women than among men, andsubstantially higher in the 80 and over age group (9.6%) than at younger ages (0.7% ofthose aged 65Ð69) (Table 5.27). Expenditure on aged care assessment teams was$36.1 million in 1997Ð98 (AIHW 1999b:200).
In 1998, 24% of persons assessed were recommended for nursing home accommodation,21% for hostel accommodation, and 9% to receive assistance through community agedcare packages or through community options projects (AIHW 1999b:184).
Home and Community Care program
The HACC program is funded jointly by the Commonwealth and State and TerritoryGovernments. The bulk of home- and community-based services are provided throughthis program, many of them by not-for-profit agencies. The program includes homenursing services, delivered meals, home help and home maintenance services, transportand shopping assistance, paramedical services, home- and centre-based respite care, andadvice and assistance of various kinds. HACC also provides special case managementservices for some clients through its community options or linkages projects.
In 1997Ð98, HACC agencies provided 441 hours of home help per month per 1,000people aged 70 and over. They also provided 506 hours of centre-based respite care and697 delivered meals per 1,000 persons aged 70 and over. The levels of provision werelower in the more intensive service typesÑfor home-based respite (196 hours), forpersonal care (143 hours) and for home nursing (127 hours). There was a substantialincrease in the level of services delivered in 1997Ð98 compared with 1993Ð94 forpersonal care, paramedical, respite care and centre day care. There was a substantialreduction in the level of provision of home nursing (Table 5.28).
Expenditure on HACC increased from $620.9 million in 1993Ð94 to $855.3 million in1998Ð99.
Table 5.27: Assessments of aged care assessment team clients aged 65 years and over by age group and sex, January to June 1994 and January to June 1999
1994 1999
65–69 70–79 80+ Total 65–69 70–79 80+ Total
Males
Assessments 2,145 7,372 9,930 19,447 2,176 10,519 15,873 28,568
% population assessed 0.6 1.7 6.5 2.1 0.7 2.1 8.6 2.8
Females
Assessments 2,421 11,601 22,277 36,299 2,478 15,354 34,735 52,567
% population assessed 0.7 2.1 7.6 3.0 0.7 2.5 10.1 4.0
Persons
Assessments 4,566 18,973 32,207 55,746 4,654 25,873 50,608 81,135
% population assessed 0.7 2.0 7.2 2.6 0.7 2.3 9.6 3.5
Source: AIHW 1999b:184.
01 AH2000 body Page 280 Thursday, June 1, 2000 3:06 PM
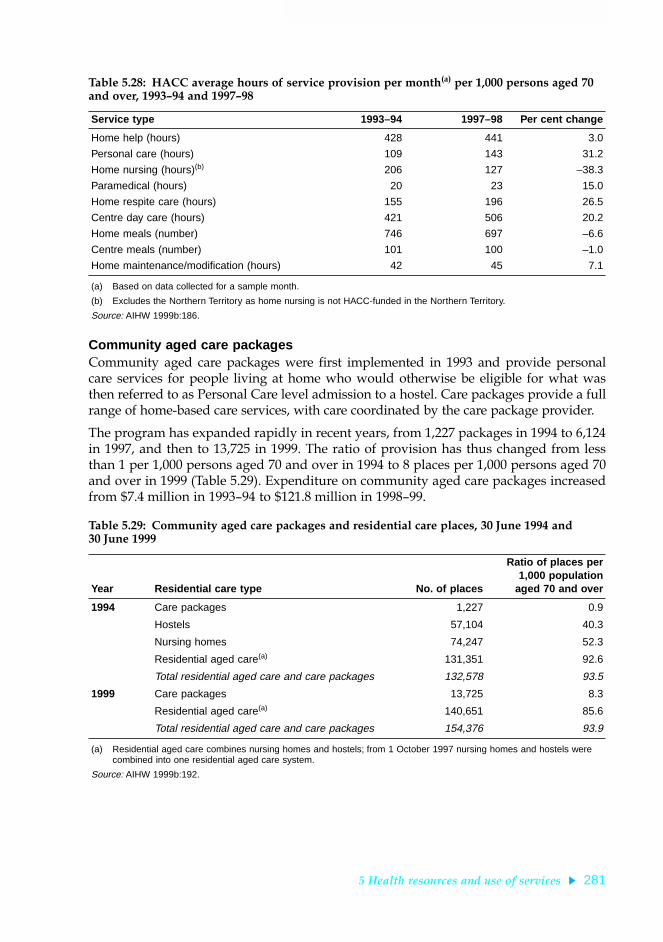
5 Health resources and use of services 281
TRIM SIZE 175 mm Wide x 250 mm Deep
Community aged care packagesCommunity aged care packages were first implemented in 1993 and provide personalcare services for people living at home who would otherwise be eligible for what wasthen referred to as Personal Care level admission to a hostel. Care packages provide a fullrange of home-based care services, with care coordinated by the care package provider.
The program has expanded rapidly in recent years, from 1,227 packages in 1994 to 6,124in 1997, and then to 13,725 in 1999. The ratio of provision has thus changed from lessthan 1 per 1,000 persons aged 70 and over in 1994 to 8 places per 1,000 persons aged 70and over in 1999 (Table 5.29). Expenditure on community aged care packages increasedfrom $7.4 million in 1993Ð94 to $121.8 million in 1998Ð99.
Table 5.28: HACC average hours of service provision per month(a) per 1,000 persons aged 70 and over, 1993Ð94 and 1997Ð98
Service type 1993–94 1997–98 Per cent change
Home help (hours) 428 441 3.0
Personal care (hours) 109 143 31.2
Home nursing (hours)(b) 206 127 –38.3
Paramedical (hours) 20 23 15.0
Home respite care (hours) 155 196 26.5
Centre day care (hours) 421 506 20.2
Home meals (number) 746 697 –6.6
Centre meals (number) 101 100 –1.0
Home maintenance/modification (hours) 42 45 7.1
(a) Based on data collected for a sample month.
(b) Excludes the Northern Territory as home nursing is not HACC-funded in the Northern Territory.
Source: AIHW 1999b:186.
Table 5.29: Community aged care packages and residential care places, 30 June 1994 and 30 June 1999
Year Residential care type No. of places
Ratio of places per1,000 population
aged 70 and over
1994 Care packages 1,227 0.9
Hostels 57,104 40.3
Nursing homes 74,247 52.3
Residential aged care(a) 131,351 92.6
Total residential aged care and care packages 132,578 93.5
1999 Care packages 13,725 8.3
Residential aged care(a) 140,651 85.6
Total residential aged care and care packages 154,376 93.9
(a) Residential aged care combines nursing homes and hostels; from 1 October 1997 nursing homes and hostels were combined into one residential aged care system.
Source: AIHW 1999b:192.
01 AH2000 body Page 281 Thursday, June 1, 2000 3:06 PM

282 AustraliaÕs Health 2000
TRIM SIZE 175 mm Wide x 250 mm Deep
Residential aged care facilitiesFrom 1 October 1997, nursing homes and hostels were integrated into a singleresidential aged care system. These changes were undertaken as part of the NationalAged Care Strategy, which was implemented during 1997Ð98. In addition to theamalgamation of nursing homes and hostels into a single system of care, the new eight-category Resident Classification Scale was introduced to determine the level ofpayment to which facilities were entitled for each resident (based on residentsÕ levels ofdependency); income and asset-tested fees were introduced; and a pre-existing systemof contributions to the capital costs of aged care facilities was modified and expandedto include all aged care facilities.
The number of residential aged care places has increased in recent years, from 131,351in 1994 to 140,651 in 1998. However, taking into account the increasing size of the agedpopulation, this is equivalent to a decline in the number of places per 1,000 personsaged 70 and over, from 92.6 places in 1994 to 85.6 places in 1998. When community agedcare packages are taken into account, there has been a slight increase in the total level ofprovision (care packages plus residential aged care places) from 93.5 in 1994 to 93.9 in1999. The average annual cost per bed has increased, from $22,784 in 1997Ð98 to $24,801in 1998Ð99 (DHAC 1999a:228).
The number of respite bed-days provided in residential aged care facilities is increasing,in line with the policy commitment to improve support for carers of frail older peopleor those with disabilities. In 1998Ð99, there were 969,838 bed-days of respite careprovided, compared with 872,128 in 1996Ð97, an increase of 11%.
Between 1993Ð94 and 1998Ð99, expenditure on residential aged care facilities increasedfrom $2,016.0 million to $2,963.3 million.
Public hospitals also provide nursing-home-type care to some patients. In 1997Ð98,there were 10,548 separations of nursing-home-type patients reported to the AIHWÕsNational Public Hospital Establishments Database, with an average length of stay of109 days.
Mental health servicesServices for Australians with a mental illness are provided in a number of settings. Inthe institutional setting, both psychiatric hospitals and designated wards or units inacute hospitals (Ôco-located facilitiesÕ) provide specialised psychiatric care. In thecommunity sector, ambulatory care services provide mental health assessment,treatment and rehabilitation programs, including mental health crisis teams andoutpatient clinic services. Residential facilities provide 24-hour care in the community.Non-government organisations provide services such as supported accommodationand advocacy programs. General practitioners also play a significant role in thetreatment of mental illness: in 1997, 77% of Australians with a mental disorder who usehealth services consulted a general practitioner about their condition (ABS 1998).
Over the last decade, the delivery of services to mental health patients has shifted frompredominantly institutional to a mix of institutional and community-based services suchas ambulatory and 24-hour residential care. This change in emphasis is demonstrated bythe shift in expenditure (Figure 5.8). Over the period 1992Ð93 to 1996Ð97, there has been
01 AH2000 body Page 282 Thursday, June 1, 2000 3:06 PM

5 Health resources and use of services 283
TRIM SIZE 175 mm Wide x 250 mm Deep
a decrease in spending per person on stand-alone psychiatric hospitals (from $31 to$23 per person) and a corresponding increase in spending in community areas,particularly ambulatory care (from $15 to $24 per person).
There have been marked decreases in the number of public psychiatric hospitals andavailable beds since 1989Ð90 (Figure 5.9, page 284, and Table 5.21, page 266). In 1997Ð98,there were 23 private and 24 public psychiatric hospitals in Australia, although publicpsychiatric hospitals had over twice the number of available beds compared withprivate psychiatric establishments (Table 5.30).
The number of staff per 1,000 patient-days was similar in both public and privatepsychiatric hospitals. However, the number of staff per 1,000 separations in publicpsychiatric hospitals was 10 times that for private psychiatric hospitals. This is consistentwith the difference in the type of mental health disorders treated between the sectors,with fewer separations and longer average lengths of stay in public psychiatric hospitals.
In the public sector, the major component of expenditure was for staff costs.Expenditure on psychiatric hospitals was about $489 million in 1997Ð98, of whicharound three-quarters was for public psychiatric hospitals.
As well as the services provided in psychiatric hospitals, there are specialised psychiatricunits in acute hospitals. One hundred and four public acute hospitals and 20 private acutehospitals had specialised psychiatric wards in 1997Ð98 (AIHW: Moore et al. 2000).
Note: Co-located facilities are designated wards/units in acute hospitals.
Source: DHAC 1998.
Figure 5.8: Gross per person expenditure on mental health services, 1992Ð93 and 1996Ð97
Stand-alonepsychiatrichospitals
Co-located Ambulatory Residential Non-governmentorganisations
0
5
10
15
20
25
30
35$ per capita
1992–93
1996–97
01 AH2000 body Page 283 Thursday, June 1, 2000 3:06 PM
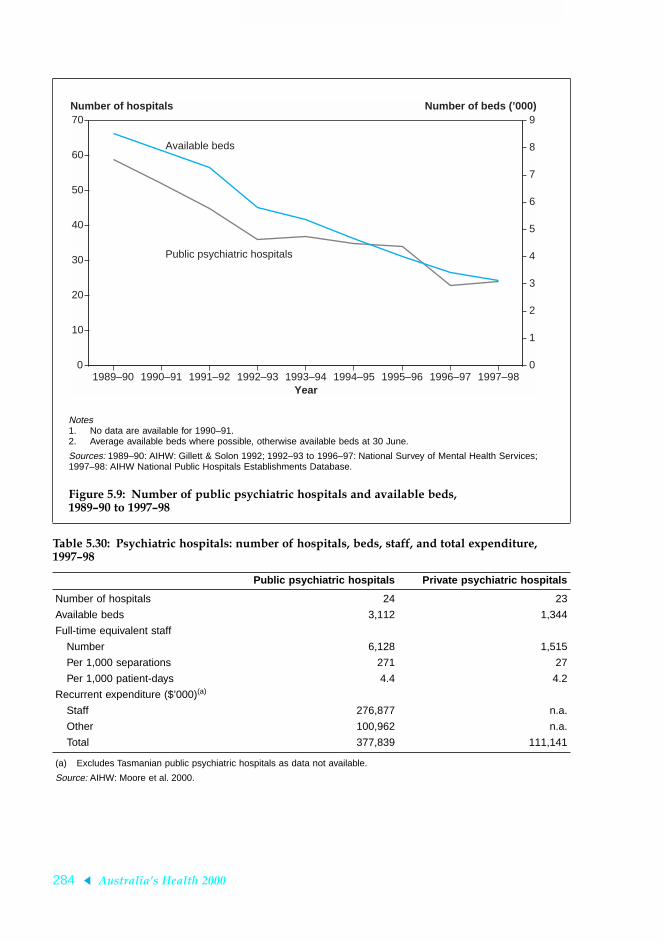
284 AustraliaÕs Health 2000
TRIM SIZE 175 mm Wide x 250 mm Deep
Notes1. No data are available for 1990–91.2. Average available beds where possible, otherwise available beds at 30 June.
Sources: 1989–90: AIHW: Gillett & Solon 1992; 1992–93 to 1996–97: National Survey of Mental Health Services; 1997–98: AIHW National Public Hospitals Establishments Database.
Figure 5.9: Number of public psychiatric hospitals and available beds, 1989Ð90 to 1997Ð98
Table 5.30: Psychiatric hospitals: number of hospitals, beds, staff, and total expenditure, 1997Ð98
Public psychiatric hospitals Private psychiatric hospitals
Number of hospitals 24 23
Available beds 3,112 1,344
Full-time equivalent staff
Number 6,128 1,515
Per 1,000 separations 271 27
Per 1,000 patient-days 4.4 4.2
Recurrent expenditure ($’000)(a)
Staff 276,877 n.a.
Other 100,962 n.a.
Total 377,839 111,141
(a) Excludes Tasmanian public psychiatric hospitals as data not available.
Source: AIHW: Moore et al. 2000.
1989–90 1990–91 1991–92 1992–93 1993–94 1994–95 1995–96 1996–97 1997–980
10
20
30
40
50
60
70
0
1
2
3
4
5
6
7
8
9Number of hospitals Number of beds (’000)
Year
Available beds
Public psychiatric hospitals
01 AH2000 body Page 284 Thursday, June 1, 2000 3:06 PM

5 Health resources and use of services 285
TRIM SIZE 175 mm Wide x 250 mm Deep
HospitalisationsAlthough patients with a mental health disorder as the principal diagnosis accountedfor only 4.2% of all hospital separations in 1997Ð98, they made up 13.9% of all patient-days (AIHW: Moore et al. 2000).
A patient with a mental health disorder as the principal diagnosis may or may notreceive specialised psychiatric treatment depending on the type and severity of theillness and the availability of specialised services. Patients who received any care in aspecialised psychiatric unit or ward are classified as receiving specialised care, whereasthose who were not in specialised units are referred to as receiving general care. Nearlyall patients in psychiatric hospitals received some specialised care. In public acutehospitals, 48% of all mental health disorder separations received some specialised care(Table 5.31, page 286). However, approximately two-thirds of the 6,741 patients whostayed 36 days or more in public acute hospitals received some specialised care.
Community-based facilitiesCurrently there are only limited data available on the number and size of communitymental health care facilities. However, recent collection agreements have providedmeans whereby these data will soon become available. Collection of information onresources and other establishment characteristics commenced on 1 July 1998. This dataset, along with the patient-level community mental health care collection to beintroduced from 1 July 2000, will provide more information on this growing sector ofmental health service delivery.
Use of dental servicesThis section focuses on the use of dental services with a particular emphasis on use bypersons in rural and remote communities, persons born overseas, and AustraliaÕsAboriginal and Torres Strait Islander peoples. The data presented here were collected inthree national telephone interview surveys in the period 1994 to 1996. A further surveywas conducted in late 1999.
Rural and remote dwellersThe time since a person last visited a dental professional is an indication of the level ofcontact with dental services.
In all age groups, 15.7% of dentate adults (those with some natural teeth) in remoteareas and 12.5% in rural areas had a period of 5 or more years since their last dentalvisit compared with 9.4% of urban adults (Table 5.32, page 287). Differences betweenurban and rural residents were most evident in the 45Ð64 and 65 years and over agegroups. The proportion of rural adults aged 45 years and over who had not visited adental professional for 5 or more years was almost double the urban rate.
The percentage of dentate adults who made a visit to a dental professional in theprevious 12 months is highest in urban areas and declines across rural to remote areas.Of urban persons who were not recipients of a government concession card, 58% hadmade a recent dental visit, compared with 54% of rural dwellers and 47% of those livingin remote areas. The pattern for holders of government concession cards was quitesimilar, although the overall percentage of cardholders who visited a dentalprofessional in the last year was lower than for non-cardholders (Figure 5.10, page 288).
01 AH2000 body Page 285 Thursday, June 1, 2000 3:06 PM

286 AustraliaÕs Health 2000
TRIM SIZE 175 mm Wide x 250 mm Deep
The reason for seeking dental care influences the treatment likely to be received.Visiting for a problem rather than a check-up may reflect the ability to access dentalservices in terms of availability and affordability. The lack of oral health facilities andthe scarcity of dentists, as well as the greater distances involved, present a barrier toregular dental care in rural and remote areas.
Table 5.31: Hospital separations and patient days for a mental health disorder principal diagnosis, type of care received, 1997Ð98
Public acute Private (a)Public
psychiatric Total
Same-day separations with a mental health disorder principal diagnosis
General care 18,574 15,380 105 34,059
Specialised care 19,581 29,818 1,925 51,324
Total 38,155 45,198 2,030 85,383
Short-stay(b) separations with a mental health principal diagnosis
General care 51,736 14,367 1,753 67,856
Specialised care 43,634 11,813 13,670 69,117
Total 95,370 26,180 15,423 136,973
Long-stay(b) separations with a mental health disorder principal diagnosis
General care 2,302 1,032 16 3,350
Specialised care 4,439 2,011 3,331 9,781
Total 6,741 3,043 3,347 13,131
Total separations with a mental health principal diagnosis 140,266 74,421 20,800 235,487
Per cent receiving specialised care 48.2 58.6 91.0 55.3
Same-day patient-days with a mental health disorder principal diagnosis
General care 18,574 15,380 105 34,059
Specialised care 19,581 29,818 1,925 51,324
Total 38,155 45,198 2,030 85,383
Short-stay(b) patient-days with a mental health principal diagnosis
General care 346,374 153,216 8,584 508,174
Specialised care 412,314 151,449 147,002 710,765
Total 758688 304665 155586 1218939
Long-stay(b) patient-days with a mental health disorder principal diagnosis
General care 266,377 71,686 1,449 339,512
Specialised care 300,153 116,195 1,084,957 1,501,305
Total 566,530 187,881 1,086,406 1,840,817
Total patient-days with a mental health principal diagnosis 1,363,373 537,744 1,244,022 3,145,139
Per cent receiving specialised care 53.7 55.3 99.2 72.0
(a) Includes some separations from private freestanding day hospitals.
(b) Short-stay separations are those with less than 36 patient-days, excluding same-day separations. Long-stay separations are those with 36 patient-days or more.
Source: AIHW: Moore et al. 2000.
01 AH2000 body Page 286 Thursday, June 1, 2000 3:06 PM

5 Health resources and use of services 287
TRIM SIZE 175 mm Wide x 250 mm Deep
A considerably higher proportion of adult non-cardholders in rural (55%) and remoteareas (58%) than in urban areas (45%) reported that their usual reason for making adental visit was for a dental problem (Figure 5.11, page 289). Cardholders in rural andremote areas reported even higher levels of problem-related visits to a dentalprofessional, 65% and 69% respectively, compared with 56% of urban cardholders.
Overseas-bornThere is little difference between Australian-born persons and those born overseas inthe percentage who had visited a dental professional in the previous 12 months(Figure 5.12, page 289). However, in each group there were some differences betweenEnglish-speakers and those who spoke a language other than English at home. Of thoseborn in Australia, a greater proportion of persons who spoke a language other thanEnglish at home had visited than those who spoke English at home. Of those bornoverseas, a higher percentage of those who spoke English at home had visited than ofthose who spoke a language other than English at home. Among persons aged 18Ð24years, the percentage who made a dental visit within the previous 2 years was 70.3% ofAustralian-born persons, compared with 80.9% of overseas-born persons. The patternof dental visits was similar for other age groups.
Table 5.32: Dentate adults: time since visit to a dental professional, 1994 to 1996 (per cent)
Urban Rural Remote Total
18–24 years
<12 months 54.7 50.2 47.6 53.6
1–4 years 35.5 37.3 36.3 35.9
5+ years 9.8 12.5 *16.1 10.5
25–44 years
<12 months 53.9 53.3 42.3 53.5
1–4 years 36.0 36.4 41.8 36.3
5+ years 10.0 10.3 15.8 10.2
45–64 years
<12 months 63.0 54.7 54.8 61.0
1–4 years 28.9 31.3 31.6 29.5
5+ years 8.1 14.0 *13.6 9.5
65+ years
<12 months 64.6 52.4 43.5 61.6
1–4 years 26.3 28.9 *37.2 27.0
5+ years 9.2 18.7 *19.3 11.4
Total
<12 months 57.6 53.2 45.8 56.3
1–4 years 33.0 34.3 38.5 33.5
5+ years 9.4 12.5 15.7 10.2
* Estimate has a relative standard error greater than 25%.
Source: National Dental Telephone Interview Surveys 1994, 1995, 1996.
01 AH2000 body Page 287 Thursday, June 1, 2000 3:06 PM

288 AustraliaÕs Health 2000
TRIM SIZE 175 mm Wide x 250 mm Deep
Overseas-born persons who spoke a language other than English at home weregenerally the most likely to report that their last dental visit was for a problem(Table 5.33, page 290). Overall, 61% of this group last visited for a problem, comparedwith 56% of Australian-born persons.
Among persons who received their dental care in the public system, there wereconsistent differences between the Australian-born and the overseas-born in the type ofcare received, with higher percentages of emergency treatment received by patientsborn overseas (65%) compared with those born in Australia (50%). However, patterns oforal health were not consistently better or worse for overseas-born patients.
Differences in public service provision by country of birth/language spoken persistedafter controlling for age, geographic location, type of care, Indigenous status, numbersof decayed teeth, numbers of missing teeth, numbers of decayed tooth roots, and thepresence of periodontal pockets. These findings may indicate variations in theavailability of fluoridated water and cultural differences in accessing dental services.
Source: National Dental Telephone Interview Surveys 1994, 1995, 1996.
Figure 5.10: Proportion of dentate adults who visited a dental professional in the last year, 1994 to 1996
Urban Rural Remote0
20
40
60
80
100Per cent
Non-cardholders
Cardholders
01 AH2000 body Page 288 Thursday, June 1, 2000 3:06 PM

5 Health resources and use of services 289
TRIM SIZE 175 mm Wide x 250 mm Deep
Source: National Dental Telephone Interview Surveys 1994, 1995, 1996.
Figure 5.11: Proportion of dentate adults who usually visit a dental professional for a dental problem, 1994 to 1996
Note: Non-English speakers are those who spoke a language other than English at home.
Source: National Dental Telephone Interview Surveys 1994, 1995, 1996.
Figure 5.12: Proportion of dentate adults who visited a dentist in the last year by place of birth, 1994 to 1996
Urban Rural Remote0
20
40
60
80
100Per cent
Non-cardholders
Cardholders
Australia Overseas0
20
40
60
80
100Per cent
English-speakers
Non-English-speakers
01 AH2000 body Page 289 Thursday, June 1, 2000 3:06 PM

290 AustraliaÕs Health 2000
TRIM SIZE 175 mm Wide x 250 mm Deep
Indigenous AustraliansAn analysis by Indigenous status of the time since the last visit to a dental professionalindicates that Indigenous adults are slightly less likely than non-Indigenous adults tohave visited a dental professional in the last 12 months (Table 5.34). They were alsomore likely than non-Indigenous adults to have reported a problem as their usualreason for a dental visit (64% compared with 50%). Indigenous adults also had a lowermean number of dental visits in a 12-month period (1.81 compared with 2.43 visits)than non-Indigenous Australians.
Table 5.33: Dentate adults whose last dental visit was less than 12 months ago: reason for last dental visit by country of birth, language spoken and age group, 1994 to 1996 (per cent)
Australian-born Overseas-born
English Non-English Total English Non-English Total
18–24 years
Problem 46.8 *22.3 44.8 38.1 50.6 45.2
Check-up 53.2 77.7 55.2 61.9 49.4 54.8
25–44 years
Problem 56.8 60.5 57.0 45.3 62.0 50.9
Check-up 43.2 39.5 43.0 54.7 38.0 49.1
45–64 years
Problem 61.5 76.7 61.8 58.9 64.5 60.7
Check-up 38.5 *23.3 38.2 41.1 35.5 39.3
65+ years
Problem 58.0 *55.1 58.0 61.6 64.6 62.5
Check-up 42.0 *44.9 42.0 38.4 35.4 37.5
Total
Problem 56.4 51.2 56.2 52.3 61.4 55.5
Check-up 43.6 48.8 43.8 47.7 38.6 44.5
* Estimate has a relative standard error greater than 25%.
Source: National Dental Telephone Interview Surveys 1994, 1995, 1996.
Table 5.34: Dentate adults: time since last dental visit by Indigenous status, 1994 to 1996 (per cent)
IndigenousNon-
Indigenous Total
Total
<12 months 53.7 56.4 56.3
1–4 years 37.3 33.3 33.5
5+ years *9.0 10.2 10.2
* Estimate has a relative standard error greater than 25%.
Note: Estimates are based on small numbers of Indigenous persons who have a younger age distribution than non-Indigenous persons.
Source: National Dental Telephone Interview Surveys 1994, 1995, 1996.
01 AH2000 body Page 290 Thursday, June 1, 2000 3:06 PM

5 Health resources and use of services 291
TRIM SIZE 175 mm Wide x 250 mm Deep
Use of allied health and other health servicesInformation on the number of people who consulted non-medical health professionalsis provided by the 1995 National Health Survey. This survey included questions aboutoccasions on which people had consulted an allied or other health professional fortreatment or discussion of a health-related matter. Occasions on which the person mayhave attended an allied or other health professional only to obtain medical supplies oraids (such as attending a chemist to fill a prescription) were not included (ABS 1997b).
Table 5.35 shows that 10% of people (8% of males and 12% of females) had consulted anallied or other health professional within the previous 2 weeks. Only 1% had visitedmore than one type of allied or other health professional within the previous 2 weeks.The allied or other health professionals most frequently consulted were chemists (by2.4% of the population), chiropractors (1.6%), physiotherapists/hydrotherapists (1.5%)and nurses (1.3%).
Table 5.35: Number and per cent of people who visited an allied or other health professional in previous 2 weeks, by sex and type of health professional visited, 1995
Males Females Total
Number(’000) Per cent
Number(’000) Per cent
Number(’000) Per cent
Acupuncturist 15.2 0.2 39.0 0.4 54.2 0.3
Audiologist/audiometrist 13.1 0.1 6.3 0.1 19.4 0.1
Chiropractor 126.5 1.4 159.9 1.8 286.3 1.6
Chemist 159.0 1.8 265.5 2.9 424.5 2.4
Chiropodist/podiatrist 34.0 0.4 77.1 0.9 111.1 0.6
Dietician/nutritionist 15.2 0.2 39.5 0.4 54.7 0.3
Herbalist 12.5 0.1 28.9 0.3 41.3 0.2
Hypnotherapist *1.4 *0.0 3.4 0.0 4.8 0.0
Naturopath 32.7 0.4 80.2 0.9 112.9 0.6
Nurse 100.2 1.1 132.9 1.5 233.1 1.3
Optician/optometrist 71.4 0.8 81.4 0.9 152.8 0.8
Osteopath 11.6 0.1 20.5 0.2 32.1 0.2
Occupational therapist 13.0 0.1 8.5 0.1 21.4 0.1
Physiotherapist/hydrotherapist 136.9 1.5 139.8 1.5 276.6 1.5
Psychologist 25.4 0.3 35.5 0.4 60.9 0.3
Social worker/welfare officer 27.5 0.3 44.3 0.5 71.8 0.4
Speech therapist/pathologist 29.8 0.3 9.6 0.1 39.4 0.2
Not stated 5.2 0.1 8.1 0.1 13.3 0.1
Total (a) 751.4 8.4 1,041.2 11.5 1,792.6 9.9
(a) Totals do not add to the sum of components as people may have consulted with more than one allied or other health professional within the previous 2 weeks.
* Relative standard error greater than 25%.
Source: ABS National Health Survey, unpublished data.
01 AH2000 body Page 291 Thursday, June 1, 2000 3:06 PM

292 AustraliaÕs Health 2000
TRIM SIZE 175 mm Wide x 250 mm Deep
People aged 65 years or over were more likely to have visited at least one allied or otherhealth professional within the previous 2 weeks than people in younger age groups. Inthis age group, the most frequently consulted health professionals were chiropodists/podiatrists (by 2.8% of those aged 65 years or over), nurses (2.1%), physiotherapists/hydrotherapists (1.7%) and opticians/optometrists (1.7%) (Table 5.36). For those agedunder 65, the most frequently consulted allied or other health professionals werechemists, chiropractors, physiotherapists/hydrotherapists and nurses.
People who had consulted a non-medical health professional were asked to provide upto five reasons for their most recent consultation. The most frequently mentioned healthconditions or reasons for which people had sought treatment from an allied or otherhealth professional were Ôcheck-up/examinationÕ, Ôother diseases of the musculo-skeletal system and connective tissueÕ, Ôunspecified back problemsÕ and Ôdislocations,sprains and strainsÕ. Information on the treatments provided in these consultations wasnot collected.
Table 5.36: Percentage of people who visited an allied or other health professional in previous 2 weeks, by age group and type of professional visited, 1995
Type of health professional 0–24 25–49 50–64 65+ Total
Acupuncturist 0.1 0.4 0.4 0.5 0.3
Audiologist/audiometrist 0.1 0.0 *0.1 0.4 0.1
Chiropractor 0.7 2.3 2.3 1.2 1.6
Chemist 2.8 2.6 1.7 1.0 2.4
Chiropodist/podiatrist 0.1 0.3 0.9 2.8 0.6
Dietician/nutritionist 0.2 0.3 0.5 0.3 0.3
Herbalist 0.2 0.3 0.2 *0.1 0.2
Hypnotherapist *0.0 0.0 n.p. *0.0 0.0
Naturopath 0.5 0.9 0.6 0.4 0.6
Nurse 1.8 0.8 0.6 2.1 1.3
Optician/optometrist 0.6 0.7 1.2 1.7 0.8
Osteopath 0.1 0.3 0.2 *0.1 0.2
Occupational therapist 0.1 0.1 0.1 0.2 0.1
Physiotherapist/hydrotherapist 1.0 1.8 2.1 1.7 1.5
Psychologist 0.3 0.5 0.2 *0.0 0.3
Social worker/welfare officer 0.5 0.4 0.2 0.3 0.4
Speech therapist/pathologist 0.5 *0.0 *0.0 *0.0 0.2
Not stated 0.0 0.1 0.1 *0.0 0.1
Total (a) 8.7 10.7 9.9 11.5 9.9
(a) Totals do not add to the sum of the components as people may have consulted with more than one allied or other health professional within the previous 2 weeks.
* Relative standard error greater than 25%.
Source: ABS National Health Survey, unpublished data.
01 AH2000 body Page 292 Thursday, June 1, 2000 3:06 PM

5 Health resources and use of services 293
TRIM SIZE 175 mm Wide x 250 mm Deep
Hearing servicesHearing problems or deafness are major problems for many Australians. In 1995, a totalof 2.25 million Australians reported that they suffered from diseases of the ear andmastoid process (ABS 1997b). The 1998 ABS Survey of Disability, Ageing and Carersestimated that there were 280,700 persons with a disability due to diseases of the earand mastoid process. Of these, 30,600 were severely or profoundly restricted in theircommunication, and 73,100 were restricted in their ability to successfully participate inschooling or employment (ABS 1999c). Permanent hearing impairment occurs inapproximately 3.5 children per 1,000 births and nearly 50% of people over the age of 60years have a hearing impairment (Australian Hearing Services 1999).
The Commonwealth Government funds Australian Hearing Services to provide hearingsupport services and to conduct research. In 1998Ð99, Australian Hearing Servicesassisted 167,827 clients, including 43,866 children and 115,783 pensioners and veterans(Table 5.37). Services provided included fitting 98,737 hearing aids.
Morbidity and its management in general practiceConsulting a doctor is the second most common health-related action taken byAustralians, after the use of medications (ABS 1997b). The clinical activities of GPs arenow the subject of an ongoing national survey known as BEACH (Bettering theEvaluation And Care of Health). The study is conducted by the General Practice Statisticsand Classification Unit (an AIHW collaborating unit within the Family Medicine ResearchCentre, University of Sydney). BEACH began in April 1998 and involves a randomsample of approximately 1,000 GPs per year. This section provides a brief summary of thefirst yearÕs results, covering the period April 1998 to March 1999 (AIHW GPSCU: Brittet al. 1999a, 1999b).
The patientsThe majority (57.7%) of patients were female. Approximately one in six encounters waswith a child aged less than 15 years (15.8%), one in ten with a young adult (9.8%), andone in four with a patient in each of the following age groups: 25Ð44 years (26.0%),45Ð64 years (24.4%), and 65 years and older (24.0%).
Table 5.37: Australian Hearing Services: client statistics and hearing aids fitted, 1996Ð97 to 1998Ð99
1996–97 1997–98 1998–99
Client programs
Pensioners and veterans 114,200 114,800 115,783
Children 41,500 43,700 43,866
Other services 6,400 8,300 8,178
Total clients 162,100 166,800 167,827
Hearing aids fitted
In the ear/in the ear canal 53,700 53,500 61,402
Behind the ear 41,600 34,300 36,708
Other 900 600 627
Total 96,200 88,400 98,737
Source: Australian Hearing Services 1999.
01 AH2000 body Page 293 Thursday, June 1, 2000 3:06 PM

294 AustraliaÕs Health 2000
TRIM SIZE 175 mm Wide x 250 mm Deep
Almost half the encounters (47.3%) were with patients who held a healthcare card and3.4% were with persons who held a Department of VeteransÕ Affairs card. In 14.5% ofencounters the patient was from a non-English-speaking background, and in 1.0% thepatient identified as an Aboriginal and/or a Torres Strait Islander person (Table 5.38).
Patients described an average 146.3 reasons for encounter (RFEs) per 100 encounters.Almost half (48.6%) of all reasons were symptom descriptions and 23.0% were describedin terms of a diagnostic label (e.g. Ôabout my diabetesÕ). The 10 most commonly recordedRFEs accounted for 35.4% of all RFEs and are listed in order of frequency in Table 5.39.
The need for a check-up was by far the most common RFE (13.7 per 100 encounters)and requests for medication were also frequent (8.2). It is notable that RFEs described asÔhypertensionÕ or Ôhigh blood pressureÕ were reported at a rate of 2.5 per 100 encountersand these are likely to be closely associated with the need for a check-up and/orrequest for medication. RFEs associated with immunisation or vaccination were thefourth most often reported RFE (4.9 per 100).
Table 5.38: GP consultations: patient characteristics, 1998Ð99
Patient characteristic Percentage of encounters
New patient to practice 9.2
Healthcare card 47.3
Veterans’ Affairs card 3.4
Non-English-speaking background 14.5
Aboriginal and Torres Strait Islander person 1.1
Note: Based on 96,901 encounters.
Source: AIHW GPSCU: Britt et al. 1999b.
Table 5.39: GP consultations: 10 most frequent patient reasons for encounter, 1998Ð99
Patient reason for encounter (RFE) Percentage of all reasons Rate per 100 encounters
Check-up 9.3 13.7
Prescription 5.6 8.2
Cough 4.3 6.2
Immunisation/vaccination 3.4 4.9
Throat complaint 2.6 3.8
Back complaint 2.4 3.6
Test results 2.3 3.4
Upper respiratory tract infection 2.0 2.9
Rash 1.8 2.6
Hypertension/high blood pressure 1.7 2.5
Subtotal 35.4 . .
Total RFEs 100.0 146.3
Note: Based on 141,766 reasons for encounter.
Source: AIHW GPSCU: Britt et al. 1999b.
01 AH2000 body Page 294 Thursday, June 1, 2000 3:06 PM

5 Health resources and use of services 295
TRIM SIZE 175 mm Wide x 250 mm Deep
Problems managedA total of 140,824 problems were managed at an average of 145.3 problems per 100encounters. The number of problems managed increased steadily with age of patientand ranged from 118 per 100 encounters for those aged 1Ð14 years to 170 per 100 forthose aged 65 years or more.
Half the problems managed in general practice related to four major body systemsÑtherespiratory (16.7%), musculoskeletal (11.7%), skin (11.3%) and circulatory (11.11%)systems. The 20 most frequently managed problems accounted for 39.0% of allproblems managed. Hypertension was the most common (8.3 per 100 encounters)followed by upper respiratory tract infection (6.8), immunisation/vaccination (5.2) anddepression (3.5) (Table 5.40).
Table 5.40: GP consultations: 20 most frequently managed problems, 1998Ð99
Problem managed Percentage of all problems Rate per 100 encounters
Hypertension 5.7 8.3
Upper respiratory tract infection 4.7 6.8
Immunisation/vaccination 3.6 5.2
Depression 2.4 3.5
Acute bronchitis/bronchiolitis 2.3 3.3
Asthma 2.2 3.2
Back complaint 1.8 2.7
Diabetes 1.8 2.6
Lipid disorder 1.7 2.5
Osteoarthritis 1.5 2.2
Sprain/strain 1.3 1.9
Contact dermatitis 1.3 1.8
Acute otitis media/myringitis 1.2 1.8
Anxiety 1.2 1.7
Sleep disturbance 1.1 1.6
Urinary tract infection 1.1 1.6
Female genital check-up/Pap smear 1.1 1.6
Sinusitis acute/chronic 1.1 1.6
General check-up 1.1 1.6
Oesophageal disease 1.0 1.5
Subtotal 39.0 . .
Total problems 100.0 145.3
Note: Based on 140,824 problems managed.
Source: AIHW GPSCU: Britt et al. 1999b.
01 AH2000 body Page 295 Thursday, June 1, 2000 3:06 PM

296 AustraliaÕs Health 2000
TRIM SIZE 175 mm Wide x 250 mm Deep
ManagementA total of 189,735 management activities were undertaken by GPs at rates of 196 per 100encounters and 135 per 100 problems. The most common management activity was theprescribing, advising (for purchase over the counter) or supply of medications(109.7 per 100 encounters or 75.5 per 100 problems). Other treatments of a clinical orprocedural nature were provided at a rate of 43.2 per 100 encounters, and referral(11.2 per 100), ordering of pathology (24.6) and imaging (7.1) were also significantmanagement activities (Table 5.41).
One or more medications were given for 59.1% of problems and at least one non-pharmacological treatment was used for 26.8% of problems. A referral was made for7.6% of problems and at least one investigation was ordered for 14.2%, more commonlyfor pathology (10.0% of problems) than for imaging (4.5% of problems).
Medicare servicesData on the operation of Medicare, AustraliaÕs universal system of health insurance,provide an overview of the use of private medical services. These include servicesprovided outside hospital as well as medical services for private patients in public andprivate hospitals. Note, however, that Medicare data do not provide a complete view ofthe use of medical services (see Box 5.8, page 297).
In 1998Ð99, Medicare provided benefits for 206.3 million services. This represents a2-year increase of 3.8% over the 198.8 million services in 1996Ð97. The increase over thisperiod was in part due to the effects of population growth (2.4%), a rise in the numberof items per person and the inclusion of additional items in the Medical BenefitsSchedule (MBS). Medicare items cover a range of different services, from a single doctorconsultation to multiple pathology tests for a single patient episode, each of which is
Table 5.41: GP consultations: summary of management activities, 1998Ð99
Management typeRate per
100 encountersRate per
100 problemsPercentage of
total problems (a)
Medications 109.7 75.5 59.1
Prescribed 93.6 64.4 51.3
Advised 8.8 6.1 5.5
GP supplied 7.3 5.0 4.0
Other treatments 43.2 29.7 26.8
Clinical 31.4 21.6 19.8
Procedural 11.8 8.1 7.7
Referrals 11.2 7.71 7.6
Specialist 7.4 5.1 5.0
Allied health 3.0 2.1 2.0
Hospital 0.7 0.5 0.5
Emergency department 0.1 0.0 0.0
Pathology 24.6 12.8 10.0
Imaging 7.1 3.7 4.5
(a) The percentage of total problems for which at least one of the specified management types was initiated by the GP.
Source: AIHW GPSCU: Britt et al. 1999b.
01 AH2000 body Page 296 Thursday, June 1, 2000 3:06 PM
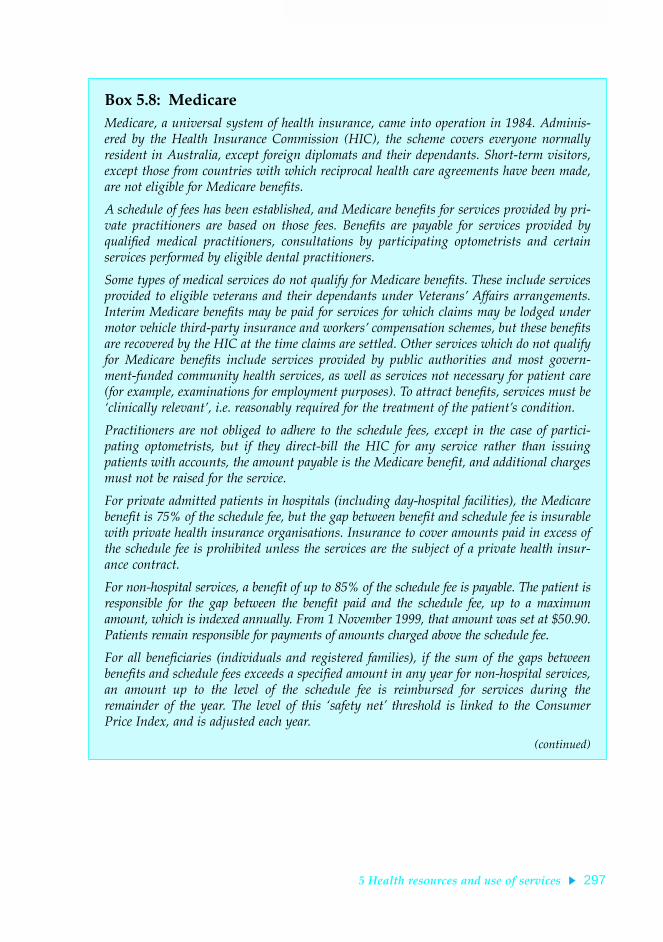
5 Health resources and use of services 297
TRIM SIZE 175 mm Wide x 250 mm Deep
Box 5.8: MedicareMedicare, a universal system of health insurance, came into operation in 1984. Adminis-ered by the Health Insurance Commission (HIC), the scheme covers everyone normallyresident in Australia, except foreign diplomats and their dependants. Short-term visitors,except those from countries with which reciprocal health care agreements have been made,are not eligible for Medicare beneÞts.
A schedule of fees has been established, and Medicare beneÞts for services provided by pri-vate practitioners are based on those fees. BeneÞts are payable for services provided byqualiÞed medical practitioners, consultations by participating optometrists and certainservices performed by eligible dental practitioners.
Some types of medical services do not qualify for Medicare beneÞts. These include servicesprovided to eligible veterans and their dependants under VeteransÕ Affairs arrangements.Interim Medicare beneÞts may be paid for services for which claims may be lodged undermotor vehicle third-party insurance and workersÕ compensation schemes, but these beneÞtsare recovered by the HIC at the time claims are settled. Other services which do not qualifyfor Medicare beneÞts include services provided by public authorities and most govern-ment-funded community health services, as well as services not necessary for patient care(for example, examinations for employment purposes). To attract beneÞts, services must beÔclinically relevantÕ, i.e. reasonably required for the treatment of the patientÕs condition.
Practitioners are not obliged to adhere to the schedule fees, except in the case of partici-pating optometrists, but if they direct-bill the HIC for any service rather than issuingpatients with accounts, the amount payable is the Medicare benefit, and additional chargesmust not be raised for the service.
For private admitted patients in hospitals (including day-hospital facilities), the Medicarebenefit is 75% of the schedule fee, but the gap between benefit and schedule fee is insurablewith private health insurance organisations. Insurance to cover amounts paid in excess ofthe schedule fee is prohibited unless the services are the subject of a private health insur-ance contract.
For non-hospital services, a benefit of up to 85% of the schedule fee is payable. The patient isresponsible for the gap between the benefit paid and the schedule fee, up to a maximumamount, which is indexed annually. From 1 November 1999, that amount was set at $50.90.Patients remain responsible for payments of amounts charged above the schedule fee.
For all beneficiaries (individuals and registered families), if the sum of the gaps betweenbenefits and schedule fees exceeds a specified amount in any year for non-hospital services,an amount up to the level of the schedule fee is reimbursed for services during theremainder of the year. The level of this Ôsafety netÕ threshold is linked to the ConsumerPrice Index, and is adjusted each year.
(continued)
01 AH2000 body Page 297 Thursday, June 1, 2000 3:06 PM

298 AustraliaÕs Health 2000
TRIM SIZE 175 mm Wide x 250 mm Deep
counted as a separate item. Consequently, it is not possible to directly compare differenttypes of services on the basis of the number of Medicare claims. Also for this reason, theterms ÔitemsÕ or Ôitems of serviceÕ are generally used when referring to Medicare claims.
In 1998Ð99, a total of $6,669 million was paid in Medicare benefits, of which $2,395 million(35.9%) was for unreferred attendances, i.e. general practitioner services, emergencyattendances after hours, other prolonged attendances, group therapy and acupuncture. Afurther $1,065 million (16.0%) was paid for diagnostic imaging, $1,008 million (15.1%) forpathology tests and $941 million (14.1%) for specialist attendances (Figure 5.13).
The largest increases in items of service from 1996Ð97 to 1998Ð99 were in radiotherapyand therapeutic nuclear medicine (39.1%), diagnostic imaging (21.5%) and pathology(17.6%).
Each person in Australia received, on average, 10.9 services under Medicare in 1998Ð99(or 9.9 services if patient episode initiation items, which cover the administrative costsassociated with collection of specimens for pathology, are excluded). These servicesincluded 5.4 unreferred attendances, 1.0 specialist attendance and 2.9 pathology items.
Since 1996Ð97, the annual number of services per person (including pathology patientepisode initiation items) has increased from 10.7 to 10.9, or an average annual increaseof 0.7% (Table 5.42, page 300). The largest increase was in pathology, in part due toprivatisation of Commonwealth pathology laboratories and the inclusion of new itemsin the MBS. The next largest increase was in diagnostic imaging, partly due to theinclusion of magnetic resonance imaging in the MBS from 1 September 1998.
Although the average use was 10.9 services overall, the number per person variedconsiderably. For example, in 1998Ð99, 2.7% of the population received 51 or moreservices, accounting for 20.2% of total benefits paid, whereas 39.6% of the populationreceived between one and five services, accounting for only 7.4% of total benefits.
The average number of consultations with general practitioners and specialists perperson increased steadily from 1986Ð87, until levelling out from 1995Ð96 (Figure 5.14).The data exclude obstetrics, pathology, radiology, anaesthetics, optometry and surgery.
Box 5.8 (continued): MedicareAgreements between the Commonwealth Government and State and Territory Govern-ments provide for all persons eligible for Medicare benefits to obtain inpatient and out-patient care at public hospitals without charge. Doctors appointed by the hospitals providemedical care for such ÔpublicÕ patients (at no cost to the patient). Inpatients in public hos-pitals may choose to be private patients, in which case they are liable for accommodationand nursing charges set at levels agreed by the Commonwealth and for medical feescharged by private practitioners. Private health insurance can be purchased to cover hos-pital charges for private patients of public hospitals and patients of private hospitals.Uninsured patients can also elect to be treated as private patients, and pay the accommo-dation and other fees charged themselves.
01 AH2000 body Page 298 Thursday, June 1, 2000 3:06 PM

5 Health resources and use of services 299
TRIM SIZE 175 mm Wide x 250 mm Deep
Note: Based on the amount paid in benefits ($), not the number of services.
Source: DHAC 2000b.
Figure 5.13: Medicare benefits paid by broad type, 1998Ð99
Note: Rates are age-adjusted to the Australian population at 30 June 1991.
Source: AIHW, derived from Medicare claims data provided by the DHAC.
Figure 5.14: GP and specialist consultations per person, 1986Ð87 to 1998Ð99
Unreferredattendances (35.9%)
Specialistattendances (14.1%)
Obstetrics (0.9%)Anaesthetics (2.0%)
Pathology (15.1%)
Diagnostic imaging (16.0%)
Operations (9.5%)
Optometry (2.2%) Other (4.4%)
1986–87 1988–89 1990–91 1992–93 1994–95 1996–97 1998–990
1
2
3
4
5
6
7
8
Number
Year
Females
Males
01 AH2000 body Page 299 Thursday, June 1, 2000 3:06 PM

300 AustraliaÕs Health 2000
TRIM SIZE 175 mm Wide x 250 mm Deep
In 1986Ð87, males consulted a general practitioner or specialist on average 4.3 times peryear and females 6.2 times per year. In 1998Ð99, these rates were 5.5 and 7.5 respectively,representing average annual increases of 2.3% and 1.7%, respectively. The increase inconsultation rates may be due in part to improved access to doctors, as there was a20.6% increase in the number of full-time equivalent Medicare providers of generalpractice services between 1986Ð87 and 1998Ð99 (DHAC 2000b).
Increased promotion and awareness of steps which individuals can take to maintaintheir own health and that of their families, such as immunisation, Pap smears, bloodpressure measurements and general health check-ups, may have also contributed to theincreased consultation rates.
Use of private medical services by StateVariations in the use of medical items occur across States. In 1998Ð99, the highestnumber of services was in New South Wales with 11.7 services per person, followed byVictoria (11.0), Queensland (10.8) and South Australia (10.3). The lowest per person useoccurred in the Northern Territory (5.7). The low rate in the Northern Territory is atleast partly due to services being provided to Aboriginal and Torres Strait Islanderpeoples through programs other than Medicare, and these services are not included inthe data reported here.
Table 5.42: Medicare items processed per capita, by broad type, 1996Ð97 and 1998Ð99
Type of item 1996–97 1998–99Total change
(per cent)Annual change
(per cent)
Unreferred attendances(a) 5.53 5.41 –2.3 –1.2
Specialist attendances 0.98 0.98 0.1 0.1
Obstetrics 0.09 0.08 –6.8 –3.4
Anaesthetics 0.09 0.09 –0.0 –0.0
Pathology
PEI items(b) 0.91 0.97 6.3 3.2
Other 1.80 1.96 8.9 4.4
Total 2.71 2.93 8.0 4.0
Diagnostic imaging 0.56 0.60 7.2 3.6
Operations 0.29 0.29 –1.2 –0.6
Optometry 0.20 0.21 4.1 2.0
Other(c) 0.26 0.27 6.9 3.4
Total including PEI items 10.73 10.88 1.4 0.7
Total excluding PEI items 9.82 9.91 0.9 0.5
(a) Includes general practitioner attendances, emergency attendances, attendances after hours, other prolonged attendances, group therapy and acupuncture.
(b) Patient episode initiation items. These items cover the administrative costs associated with the collection of specimens.
(c) Includes assistance at operations, radiotherapy and therapeutic nuclear medicine, and miscellaneous services.
Source: DHAC 2000b.
01 AH2000 body Page 300 Thursday, June 1, 2000 3:06 PM

5 Health resources and use of services 301
TRIM SIZE 175 mm Wide x 250 mm Deep
5.6 Use of medicationsUse of medications is the most common health-related action taken by Australians (ABS1997b). Prescription medications are provided through community pharmacies andhospitals, and non-prescription medicines and complementary and alternativemedicines are available from pharmacies and other retail outlets.
The 1995 National Health Survey provides the most recent data on the overall use ofmedicines in the total community. The survey estimated that 10.7 million Australians(59.1% of the population) used some form of prescribed or non-prescribed orthodoxmedication (medications other than homeopathic, herbal, nutritional and othercomplementary and alternative medicines) in the 2 weeks before interview, 4.7 million(25.8%) used vitamins or minerals and 1.7 million (9.4%) used herbal or naturalmedications. In general, the use of medication as a health-related action increased withage, with the lowest usage in the age group 5Ð14 years (48.9%) and the highest in theage group 75 years and over (91.6%). More females reported medication use than males(74.0% compared with 63.4%).
Use of orthodox medicines was also more common in females (64.0%) than in males(54.2%) and most common in persons aged 75 years or more (87.3%). Most types ofdrugs were most commonly used by persons aged 65 years or more; however,medications for coughs and colds were most commonly reported for children under theage of 5 years (16.7%), asthma medications were most common in children in the agegroup 5Ð14 years (9.6%) and use of medications for allergies and pain relievers wasmost often reported by persons in the age group 35Ð44 years (4.3% and 31.3% of peoplein that age group, respectively).
Prescribed medicinesThe 1995 National Health Survey estimated that 6.54 million Australians usedmedications that had been prescribed by a medical practitioner in the 2 weeks prior tointerview. The types of drugs most commonly used were medications for fluid, heart,blood pressure (1.93 million people), asthma medications (1.01 million people) and painrelievers (752,000 people).
Other information on the apparent use of prescription medicines in the community iscompiled from two sources (DHAC 1999b). The first is the Health InsuranceCommission records of prescriptions submitted for payment of a subsidy under thePharmaceutical Benefits Scheme or the Repatriation Pharmaceutical Benefits Scheme(PBS and RPBS, see Box 5.9, page 302). The second is the Pharmacy Guild of AustraliaÕsongoing survey of a representative sample of about 250 community pharmacies, whichprovides an estimate of the use of non-subsidised prescription medicines. These sourcesdo not cover use of medications in public hospitals and only cover use of somemedications in private hospitals.
In 1998Ð99, there were 128.4 million community PBS prescriptions (19.3 million togeneral patients, 109.1 million or 85.0% to concessional patients) and about 45 millionprescriptions which did not attract a subsidy (35 million below the copaymentthreshold and about 10 million private prescriptions, i.e. prescriptions for drugs not
01 AH2000 body Page 301 Thursday, June 1, 2000 3:06 PM
302 AustraliaÕs Health 2000
TRIM SIZE 175 mm Wide x 250 mm Deep
listed on the PBS or RPBS) (DHAC 1999b). The number of prescriptions per personremained fairly constant over the period 1995 to 1998, averaging around 6.7 PBSprescriptions and 2.5 non-PBS prescriptions per year.
Use of prescription medicine can be described using the defined daily dose per 1,000population per day (DDD/1,000/day) as the unit of measurement. The DDD is based onthe assumed average dose per day of the drug, used for its main indication (reason foruse) by adults. It provides an estimate of how many people per 1,000 population aretaking the standard dose of the drug each day, on average, and allows for comparisonsindependent of differences in quantities of drugs per prescription. In 1998, salbutamol(a bronchodilator used for asthma) was the most commonly used drug using the DDD/1,000/day measurement (Table 5.43), followed by frusemide (a diuretic) and simvastatin(used for serum lipid reduction). In contrast, the top three drugs by prescription volumewere paracetamol (an analgesic; 4.6 million PBS/RPBS prescriptions and 0.1 million
Box 5.9: The Pharmaceutical Benefits SchemeThe Pharmaceutical BeneÞts Scheme (PBS) aims to provide timely, reliable and affordableaccess for the Australian community to necessary and cost-effective medicines, subsidisingthe cost of a wide range of prescription medications. As at 1 February 2000, 574 genericdrugs, available in 1,391 forms and strengths (items) marketed as 2,084 different drugproducts (brands) were covered by the scheme. The items that attract beneÞts are reviewedfrequently, and the price of every item covered is negotiated with the supplier.
Australian residents and visitors from those countries with which Australia has a Recip-rocal Health Care Agreement are eligible for PBS beneÞts. Patients are grouped into twoclasses. General patients pay the Þrst $20.60 (from 1 January 2000) for each prescriptionitem. Concessional patients (people with low incomes and sickness beneÞciaries who hold ahealthcare card) make a copayment of $3.30 per item.
Individuals and families are protected from large overall expenses for PBS-listed medicinesby safety nets. Once a general patient and/or their immediate family has spent $631.20 ina calendar year, the patient copayment per item decreases from $20.60 to the concessionalrate of $3.30 per item. For concessional patients, the $3.30 copayment is not required oncetheir expenditure on PBS items exceeds $171.60 in a calendar year. These copayments andsafety net thresholds are indexed to movements in the Consumer Price Index from 1 Jan-uary each year.
Patients may pay more than the standard copayment where a PBS item is priced above thebenchmark price for different brands of the same drug or the benchmark price for a particulartherapeutic group of drugs. These additional payments do not count towards safety nets.
The PBS also funds a range of miscellaneous services including highly specialised drugs,IVF-centre hormones, growth hormones, emergency (DoctorÕs Bag) supplies and methadone.
The Commonwealth also helps in the provision and purchase of drugs through the Repatri-ation Pharmaceutical BeneÞts Scheme (RPBS), which provides assistance to speciÞcgroups of Australian war veterans and dependants. It is generally similar to the PBS forconcessional beneÞciaries.
01 AH2000 body Page 302 Thursday, June 1, 2000 3:06 PM

5 Health resources and use of services 303
TRIM SIZE 175 mm Wide x 250 mm Deep
other prescriptions), amoxycillin (an antibiotic; 2.3 million PBS/RPBS prescriptions and2.3 million other prescriptions) and salbutamol (3.6 million PBS/RPBS prescriptions and0.9 million other prescriptions).
The BEACH survey of general practice activity collects information on drugs prescribedby GPs. In 1998Ð99, antibiotics was the drug group most commonly prescribed bygeneral practitioners, accounting for 17.8% of all prescriptions. This was followed bycardiovascular drugs (14.8%), central nervous system drugs (12.0%), psychologicaldrugs (8.3%), respiratory drugs (7.3%) and hormones (6.9%).
The most frequently prescribed individual generic drugs are listed in Table 5.44(page 304). Five of the top ten drugs are from the antibiotic group. Simple analgesicswere very frequently prescribed, probably reflecting their prescription for health carecardholders for whom they are a cheaper option than over-the-counter purchase.Influenza vaccine represented 1.8% of all prescriptions, presumably reflecting aresponse by patients and GPs to public health campaigns to increase vaccination levelsin at-risk groups.
Non-prescribed medicinesThe 1995 National Health Survey estimated that 6.3 million people (34.6% of thepopulation) used orthodox medications that were not prescribed in the 2 weeks prior tointerview, and 178,900 Australians (1.0%) used medications provided by a doctor orhospital (ABS 1997b). The most commonly used types of non-prescribed drugs werepain relievers (used by 3.6 million people) and skin ointments and creams (1.1 millionpeople). Those drug types were also most commonly reported as provided by doctorsor hospitals (48,600 people and 14,500 people respectively).
The BEACH survey collects information on drugs that GPs advise patients to purchaseover the counter, and those that the GPs supply directly. About 8.0% of drugs wereadvised for over-the-counter purchase in 1998Ð99 and 6.7% were supplied by the GP,with the remainder being prescribed. Extrapolated, this represented about 8 millionrecommendations for purchase of drugs, and 6.7 million occasions at which at least one
Table 5.43: Top 10 drugs by defined daily dose per 1,000 population per day
Rank and drug name Action PBS/RPBSNon-PBS/
RPBS
Totalcommunity
use
1 Salbutamol Bronchodilator (used for asthma) 22.5 6.5 29.0
2 Frusemide Diuretic 20.3 2.2 22.6
3 Simvastatin Serum lipid reduction 21.9 0.1 22.0
4 Enalapril Anti-hypertensive 18.7 0.3 19.0
5 Ranitidine Peptic ulcer treatment 17.0 0.1 16.9
6 Ipratropium bromide Bronchodilator (used for asthma) 15.4 0.0 15.5
7 Amlodipine Anti-hypertensive 13.9 0.1 13.9
8 Budesonide Asthma preventative 13.5 0.0 13.6
9 Felodipine Anti-hypertensive 10.9 1.0 11.9
10 Thyroxine Thyroid hormone 7.1 4.6 11.7
Source: DHAC 1999b.
01 AH2000 body Page 303 Thursday, June 1, 2000 3:06 PM

304 AustraliaÕs Health 2000
TRIM SIZE 175 mm Wide x 250 mm Deep
drug was supplied from the GPsÕ stocks or samples. The drugs most commonly advisedfor over-the-counter purchase were paracetamol, chlorpheniramine/phenylephid (anexpectorant) and topical clotrimazole (an anti-infective). GPs most commonly suppliedinfluenza vaccine, triple antigen vaccine and oral polio vaccine.
Complementary and alternative medicinesIn addition to the prescribed pharmaceuticals and other orthodox drugs, someAustralians use a range of complementary and alternative medicines, includinghomoeopathic, herbal and nutritional medications. The 1995 National Health Surveyestimated that 25.8% of Australians used vitamin or mineral supplements in the2 weeks prior to interview, and 9.4% used herbal or natural medications (ABS 1997b).Vitamin or mineral supplements were used more commonly by females (30.3%) than bymales (21.3%), as were herbal or natural medications (12.0% and 6.9% respectively).Persons aged 45 to 54 years were most likely to have used vitamin and mineralsupplements (32.3%), and herbal or natural medications were most commonly used bypersons aged between 45 and 64 years (13.6%).
Table 5.44: GP consultations: 20 most frequently prescribed drugs, 1998Ð99
Generic drug Percentage ofprescriptions
Prescriptions per100 encounters
Paracetamol 4.2 3.9
Amoxycillin 3.5 3.2
Paracetamol/codeine 2.8 2.7
Salbutamol 2.6 2.4
Cefaclor monohydrate 2.3 2.2
Cephalexin 2.3 2.1
Roxithromycin 1.9 1.8
Amoxycillin/potassium clavulanate 1.9 1.8
Influenza virus vaccine 1.8 1.7
Temazepam 1.5 1.4
Diclofenac sodium systemic 1.4 1.3
Levonorgestrel/ethinyloestradiol 1.3 1.2
Doxycycline HCl 1.2 1.2
Diazepam 1.2 1.1
Erythromycin 1.2 1.1
Ranitidine 1.1 1.0
Atenolol 1.1 1.0
Frusemide (furosemide) 1.0 1.0
Betamethasone topical 1.0 0.9
Simvastatin 1.0 0.9
Subtotal 36.2 . .
Total prescribed 100.0 93.6
Note: Based on 90,710 prescriptions.
Source: AIHW GPSCU: Britt et al. 1999b.
01 AH2000 body Page 304 Thursday, June 1, 2000 3:06 PM

5 Health resources and use of services 305
TRIM SIZE 175 mm Wide x 250 mm Deep
In a 1993 representative survey of South Australian residents, 48.5% of respondents(54.8% of females and 33.8% of males) reported using at least one non-medicallyprescribed alternative medicine in the past year (MacLennan et al. 1996). Non-prescribedvitamins were most commonly reported (41.2% of females and 33.8% of males), followedby herbal medicines (11.1% of females and 8.6% of males), mineral supplements (10.3%of females and 8.1% of males) and evening primrose oil (12.7% of females and 2.7% ofmales). Respondents reported spending between $1 and $500 each on alternativemedicines each month, with a median expenditure of $10. Extrapolated to the totalAustralian population, this expenditure corresponded to an estimated $621 million spenton complementary and alternative medicines in 1993.
Expenditure on pharmaceuticalsTotal expenditure on non-hospital pharmaceuticals was $5,335 million in 1997Ð98:$3,377 million on benefit-paid pharmaceuticals and $1,958 million on other non-hospitalpharmaceuticals. The Commonwealth Government contributed $2,783 million to thebenefit-paid pharmaceuticals and individuals paid the remaining $593 million(Table 5.45). Public hospital expenditure reported to the AIHW National Public HospitalEstablishments Database was about $611 million.
The PBS was the largest single contributor to expenditure on pharmaceuticals. PBSexpenditure on prescriptions and other miscellaneous services was $2,785 million in1997Ð98 and increased by 10% to $3,070 million in 1998Ð99 (Table 5.46, page 306) (DHAC1999c). Costs of the scheme and patient copayments have both risen each year in recentyears, with the proportion met by the scheme remaining constant at about 82%.
Table 5.45: Expenditure on pharmaceuticals(a) in Australia, 1997Ð98 ($ million)
Benefit-paidpharmaceuticals
All otherpharmaceuticals
Totalpharmaceuticals
Public sector
Commonwealth Department of Veterans’ Affairs 205 . . 205
Commonwealth Department of Health and Aged Care 2,578 2 2,580
Public acute care and psychiatric hospitals . . 611 611
Other State, Territory and local government . . 16 16
Total public sector 2,783 629 3,412
Private sector
Health insurance funds . . 34 34
Individuals 593 1,869 2,463
Workers’ compensation insurance . . 27 27
Third party motor vehicle insurance . . 10 10
Private hospitals . . n.a. n.a.
Total private sector(b) 593 1,940 2,534
Total (b) 3,377 2,569 5,946
(a) Not including complementary and alternative medicines.
(b) Not including most expenditure in private hospitals.
Source: AIHW Health Expenditure Database.
01 AH2000 body Page 305 Thursday, June 1, 2000 3:06 PM

306 AustraliaÕs Health 2000
TRIM SIZE 175 mm Wide x 250 mm Deep
5.7 Health promotion and preventionHealth promotion and prevention are part of the suite of activities generally referred toas public health or population health. Health promotion and prevention activities havetraditionally included population screening (e.g. for breast cancer), mass immunisation,water fluoridation, food inspection and quarantine, communicable disease control andsurveillance, and health promoting communications (including social marketing), toname just a few.
In the last couple of decades, the scope of population health interventions andinfrastructure has extended to include surveillance of disease risk factors, managementof healthy growth and development (including, for example, parenting effectivenesstraining and support), mental health promotion, consumer product safety, and so on.
Population health interventions are characterised by a focus on:
¥ prevention, promotion and protection as opposed to treatment;
¥ population groups rather than the individual;
¥ the factors that affect health and causes of illness.
In its population health planning framework document, the National Public HealthPartnership (NPHP 2000) lists 10 types of public health interventions covering policyand program areas (see Box 5.10).
For a particular public health issue, a mixture of intervention types is typicallyemployed (constituting an intervention portfolio)Ñthis is another characteristic ofpublic health action, namely a comprehensive program of integrated activities to tacklethe health issue. This section presents a case study of an intervention portfolio in thearea of tobacco control.
Table 5.46: Cost of PBS items to the PBS and patients, 1994Ð95 to 1998Ð99 ($ million)
1994–95 1995–96 1996–97 1997–98 1998–99
Patient contributions for PBS prescription items (a) 445 478 530 570 601
General patients 230 252 278 294 318
Concessional patients 214 227 252 276 283
PBS payments for PBS prescription items (b) 1,882 2,191 2,333 2,527 2,782
General patients—no safety net 291 343 392 412 468
General patients—safety net 93 119 73 99 107
Total general patients 384 462 465 510 576
Concessional patients—no safety net 1,195 1,369 1,466 1,576 1,740
Concessional patients—safety net 303 360 402 440 467
Total concessional patients 1,497 1,730 1,867 2,016 2,207
Total cost of PBS prescription items (a) + (b) 2,326 2,669 2,863 3,097 3,384
Miscellaneous PBS service payments (c) 110 135 206 259 287
Total expenditure by the PBS (b) + (c) 1,991 2,327 2,538 2,785 3,070
Total cost of PBS items to the PBS and patients (a) + (b) + (c) 2,436 2,805 3,068 3,356 3,671
Source: DHAC 1999c.
01 AH2000 body Page 306 Thursday, June 1, 2000 3:06 PM

5 Health resources and use of services 307
TRIM SIZE 175 mm Wide x 250 mm Deep
Tobacco control—a case study in public health interventionsOver 18,000 deaths and 150,000 hospital separations each year in Australia areattributable to tobacco smoking (AIHW 1999a). Smoking-related conditions account foralmost 10% of the total burden of disease (AIHW: Mathers et al. 1999c). Tobaccosmoking is the single largest preventable cause of death.
The main elements of public health action in tobacco control are:
¥ taxation;
¥ regulation of tobacco products;
¥ promotion of (and, in some cases, legislation for) smoke-free indoor areas;
¥ education campaigns and social marketing; and
¥ community development and partnership building.
Taxation is a mechanism by which governments can affect the price of tobaccoproducts; increasing the price of tobacco in turn reduces its accessibility. TheCommonwealth Government levies the industry through excise payments on locallymanufactured products and customs duty tariffs on imported products.
Tobacco products are regulated in a number of ways: legislation banning or limitingtobacco advertising; regulations regarding health warnings on tobacco products;minimum age restrictions on the sale of cigarettes; and legislation prohibiting the sale ofindividual cigarettes.
Restrictions on the promotion of tobacco products have been introduced, with agradual phasing-in of bans on tobacco advertising in print, on television and radio, andin cinemas, with the exception of point-of-sale advertising. Point-of-sale advertising is
Box 5.10: Types of public health interventions1. Public policy development
2. Legislation and regulation
3. Resource allocation
4. Engineering and technical
5. Incentives (financial and non-financial)
6. Service development and delivery
7. Education (including in clinical care and skills development)
8. Communication (including social marketing)
9. Collaboration/partnership building (community and intersectoral)
10. Community and organisational development (including organisational policy)Source: NPHP 2000.
01 AH2000 body Page 307 Thursday, June 1, 2000 3:06 PM

308 AustraliaÕs Health 2000
TRIM SIZE 175 mm Wide x 250 mm Deep
prohibited in two States and restrictions are imposed in several other jurisdictions.There have been significant restrictions in the number of international sporting eventsgranted exemptions from the general ban on tobacco advertising in Australia.
In some jurisdictions, health promotion foundations have been established. Thesefoundations provide funding to arts and sporting bodies to replace tobacco sponsorship,resources for health promotion and, in some jurisdictions, funding for research.
In 1994 regulations were enacted to ensure uniform labelling of tobacco productsthroughout Australia and provision of appropriate product information to consumers.This includes six rotating health warnings and related information on tobacco products(see Box 5.11).
In all jurisdictions the minimum age for purchasing tobacco products is 18 years (withpenalties imposed on those selling or, in some cases, supplying to minors). Mostjurisdictions also restrict the location of cigarette vending machines to limit access byunder-aged persons.
Policy change over the last decade has sought to reduce environmental tobacco smoke.Industries have been encouraged to adopt non-smoking policies for enclosed publicplaces and in workplaces. More formal arrangements include the prohibition ofsmoking in commercial and government buildings, and on public transport. Legislationexists in some jurisdictions for smoke-free indoor areas in workplaces and other publicplaces such as restaurants, cafes, shops and theatres. All other jurisdictions are workingtowards similar legislation.
Box 5.11: Health warnings on tobacco productsUnder the system operating since 1994, tobacco products are required to display:
1. one of six rotating health warnings occupying 25% of the front of the pack:
SMOKING CAUSES LUNG CANCER
SMOKING IS ADDICTIVE
SMOKING KILLS
SMOKING CAUSES HEART DISEASE
SMOKING WHEN PREGNANT HARMS YOUR BABY
YOUR SMOKING CAN HARM OTHERS
2. detailed information (corresponding to the warning on the front of the pack) occupying33% of the back of the pack
3. information about the tar, nicotine and carbon monoxide content of the cigarettes, occu-pying one entire side of the pack.
Source: Trade Practices (Consumer Product Information Standards) (Tobacco) Regulations 1994 (Attachment W).
01 AH2000 body Page 308 Thursday, June 1, 2000 3:06 PM

5 Health resources and use of services 309
TRIM SIZE 175 mm Wide x 250 mm Deep
The multi-tiered National Tobacco Campaign combines a series of explicitadvertisements on television and radio, in newspapers and on buses with a nationallycoordinated Quitline service for smokers. At the national level, Quitline call activity hasbeen closely correlated with the volume of television advertising (Figure 5.15).
5.8 Health research in AustraliaHealth research focuses on understanding the influences on population health, and ondeveloping and testing health promotion and disease prevention strategies. Medicalresearch relates to understanding fundamental biological processes, disease and injurymechanisms, and the development and testing of clinical interventions for disease andinjury prevention, treatment, rehabilitation and palliation.
Research fundingAustralia invested a total of $853 million in health research and development during1996Ð97 (Table 5.47, page 310). General government sources provided 38.3% of thisfunding ($328 million). A further $268 million came from institutes of higher education,while businessesÑincluding government business enterprisesÑprovided $134 millionand private non-profit organisations and overseas sources funded the remaining$123 million.
Source: Ministerial Tobacco Advisory Group 1999.
Figure 5.15: National Tobacco Campaign: target audience rating points (TARPs) compared with calls to Quitline services, MayÐDecember 1997
0
100
200
300
400
500
600
0
2,000
4,000
6,000
8,000
10,000Target audience rating points (TARPs) Calls to Quitline services
TARPs
Calls
Wor
ld N
o T
obac
co D
ay 3
1 M
ay
Art
ery
& L
ung
laun
ched
8 J
une
Tum
our
laun
ched
16
July
18 M
ay
1 Ju
ne
15 J
une
29 J
une
13 J
uly
27 J
uly
10 A
ug.
24 A
ug.
7 S
ep.
21 S
ep.
5 O
ct.
19 O
ct.
2 N
ov.
16 N
ov.
30 N
ov.
14 D
ec.
28 D
ec.
01 AH2000 body Page 309 Thursday, June 1, 2000 3:06 PM

310 AustraliaÕs Health 2000
TRIM SIZE 175 mm Wide x 250 mm Deep
Institutes of higher education increased their share of the proportion of total fundingfor health research and development from 24.9% in 1994Ð95 to 31.4% in 1996Ð97. Theshare of funding by business enterprises also grew, from 10.6% in 1994Ð95 to 15.7% in1996Ð97. General government funding of research and development fell as a proportionof total expenditure from 49.9% in 1994Ð95 to 38.3% in 1996Ð97.
ReferencesABS 1997a. Census of population and housing: classification counts, Australia.
Occupation. ABS Cat. No. 2022.0. Canberra: ABS.
ABS 1997b. National Health Survey: summary of results. ABS Cat. No. 4364.0. Canberra:ABS.
ABS 1998. Mental health and wellbeing, profile of adults, Australia, 1997. ABS Cat.No. 4326.0. Canberra: ABS.
ABS 1999a. 1997Ð98 private hospitals, Australia. ABS Cat. No. 4390.0. Canberra: ABS.
ABS 1999b. Australian national accounts. InputÐoutput tables 1994Ð95. ABS Cat.No. 5209.0. Canberra: ABS.
ABS 1999c. Disability, ageing and carers: summary of findings. ABS Cat. No. 4430.0.Canberra: ABS.
AIHW 1999a. 1998 National Drug Strategy Household Survey: first results. AIHW Cat.No. PHE 15. Drug Statistics Series. Canberra: AIHW.
AIHW 1999b. AustraliaÕs welfare 1999: services and assistance. Canberra: AIHW.
AIHW 1999c. Australian hospital statistics, 1997Ð98. AIHW Cat. No. HSE 6. HealthServices Series No. 10. Canberra: AIHW.
AIHW 2000. Medical labour force 1998. AIHW Cat. No. HWL 15. National HealthLabour Force Series. Canberra: AIHW
AIHW GPSCU: Britt H, Sayer GP, Miller GC, Charles J, Scahill S, Horn F & Bhasale A1999a. BEACH Bettering the Evaluation And Care of Health: a study of generalpractice activity, six-month interim report. Canberra: AIHW GPSCU.
Table 5.47: Expenditure on health research and development by source of funds, 1994Ð95 to 1996Ð97 ($ million)
Source 1994–95 1995–96 1996–97
Higher education institutions 170 231 268
Private non-profit and other 87 95 101
Overseas 14 18 22
Business enterprises(a) 72 135 134
Commonwealth Government 198 192 196
State and Territory Governments 137 131 127
Government (nec) 5 4 4
All funding sources 682 806 853
(a) Includes government business enterprises.
Source: AIHW Health Expenditure Database.
01 AH2000 body Page 310 Thursday, June 1, 2000 3:06 PM

5 Health resources and use of services 311
TRIM SIZE 175 mm Wide x 250 mm Deep
AIHW GPSCU: Britt H, Sayer GP, Miller GC, Charles J, Scahill S, Horn F, Bhasale A &McGeechan K 1999b. General practice activity in Australia 1998Ð99. AIHW Cat. No.GEP 2. General Practice Series No. 2. Canberra: AIHW GPSCU.
AIHW: Gillett S & Solon R 1992. Hospital utilisation and costs study 1989Ð90. Vol. 1:A survey of public hospitals and related data. Canberra: AIHW.
AIHW: Mathers C & Penm R 1999a. Health system costs of cardiovascular diseases anddiabetes in Australia 1993Ð94. Health and Welfare Expenditure Series No. 5.Canberra: AIHW.
AIHW: Mathers C & Penm R 1999b. Health system costs of injury, poisoning andmusculoskeletal disorders in Australia 1993Ð94. Health and Welfare ExpenditureSeries No. 6. Canberra: AIHW.
AIHW: Mathers C, Penm R, Sanson-Fisher R, Carter R & Campbell L 1998. Healthsystem costs of cancer in Australia, 1993Ð94. Canberra: AIHW.
AIHW: Mathers C, Vos T & Stevenson C 1999c. The burden of disease and injury inAustralia. AIHW Cat. No. PHE 17. Canberra: AIHW.
AIHW: Moore M, Shaw J, Grant B & Braddock D 2000. Institutional mental healthservices in Australia 1997Ð98. AIHW Cat. No. HSE 7. Canberra: AIHW.
Australian Hearing Services 1999. 1999 annual report. Sydney: Australian HearingServices.
CGC 1997. Report on general revenue grant relativities 1997 update. Canberra: AGPS.
Commonwealth of Australia 1999. Budget Statements 1999Ð2000, Budget Paper No. 1.Canberra: AGPS.
DHAC 1998. National mental health report 1997. Canberra: DHAC.
DHAC 1999a. Annual report 1998Ð99. Canberra: DHAC.
DHAC 1999b. Australian statistics on medicines 1998. Canberra: DHAC.
DHAC 1999c. Pharmaceutical Benefits Scheme. Canberra: DHAC [cited 15 February2000]. Available from Internet: URL: http://www.health.gov.au:80/haf/branch/pbb/phbensch.htm and linked pages.
DHAC 2000a. General practice in Australia, 2nd ed. Canberra: DHAC (in press).
DHAC 2000b. Medicare statistics, June quarter 1999. Canberra: DHAC.
DHFS 1998. Expenditures on health services for Aboriginal and Torres Strait Islanderpeople. Canberra: DHFS.
Family Planning Australia 2000. Annual report 1998Ð99. Canberra: Family PlanningAustralia.
MacLennan AH, Wilson DH & Taylor AW 1996. Prevalence and cost of alternativemedicine in Australia. Lancet 347:569Ð73.
Ministerial Tobacco Advisory Group 1999. AustraliaÕs national tobacco campaign:evaluation report, Vol. 1. Canberra: DHAC.
01 AH2000 body Page 311 Thursday, June 1, 2000 3:06 PM

312 AustraliaÕs Health 2000
TRIM SIZE 175 mm Wide x 250 mm Deep
NCC 1996. The Australian version of the International Classification of Diseases,9th revision, clinical modification (ICD-9-CM), Vols 1Ð4, effective 1 July 1995. Sydney:University of Sydney.
NCCH 1998. The international statistical classification of diseases and related healthproblems, 10th revision, Australian modification (ICD-10-AM), Vols 1Ð5, effective1 July 1998. Sydney: University of Sydney.
NPHP (National Public Health Program) 2000 (forthcoming). A planning framework forpublic health practiceÑa system perspective. Canberra: NPHP.
OECD 1999. OECD health data 1999: a software for the comparative analysis of29 health systems (CD-ROM). Paris: OECD.
PHIAC (Private Health Insurance Administration Council) 1999. Operations of theregistered health benefits organisations, annual report 1998Ð99. Canberra: AGPS.
Report of the Senate Select Committee on Medical and Hospital Costs (chaired by DameIvy Wedgwood, DBE), 1970.
WD Scott & Co. Pty Ltd 1978. Joint management review on health data for policyevaluation, final report.
01 AH2000 body Page 312 Thursday, June 1, 2000 3:06 PM

6 Health service strategies, performance and monitoring 313
TRIM SIZE 175 mm Wide x 250 mm Deep
6 Health service strategies, performance and monitoring
In view of the importance, high cost and complexity of maintaining health, it isnecessary to coordinate activities, set priorities and monitor the performance of thehealth system. This is a very challenging task, given the large number of agencies, bothgovernment and non-government, responsible for the delivery of health services, therange of potential health interventions and the difficulty of measuring theirindependent effects. This chapter describes the efforts being made at the national levelto deal with these problems.
Commonwealth, State and Territory Health Ministers meet regularly as the AustralianHealth MinistersÕ Conference to coordinate health policy matters across jurisdictions.Their high-level advisory body, the Australian Health MinistersÕ Advisory Council(AHMAC), includes the heads of Commonwealth, State and Territory health authoritiesand the Commonwealth Department of VeteransÕ Affairs. In recent years these bodieshave adopted a range of strategic plans for a national approach to deal with majorhealth issues.
Performance indicators exist for Aboriginal and Torres Strait Islander health, the sixNational Health Priority Areas (NHPAs) and hospital services. The National PublicHealth Partnership and a new National Health Performance Committee, established byHealth Ministers in 1999, are coordinating the development of frameworks for publichealth and for monitoring the performance of the overall health system.
Section 6.1 provides background on general issues associated with health servicesplanning, including the evidence base needed to support priority setting. Section 6.2describes some emerging and contemporary issues that are influencing decisions onhealth priorities. Section 6.3 describes the information frameworks that have beendeveloped for monitoring performance against the objectives of high-level nationalhealth strategies. Section 6.4 reports on performance in some specific areas wherenational information has been developed and collected.
6.1 Issues in health services planningThe type of evidence and information required to support informed priority setting inhealth depends on the societal goals for health. Improving the overall health of thepopulation is a major goal of all societies. However, priority setting based on the potentialfor health gain is not the only goal that Australians might value. Others might be:
¥ to give priority to those most disadvantaged, so that inequalities in health arereduced;
01 AH2000 body Page 313 Thursday, June 1, 2000 3:06 PM

314 AustraliaÕs Health 2000
TRIM SIZE 175 mm Wide x 250 mm Deep
¥ to attach greater priority to large benefits than to the sum of many small ones, withlife-saving counting the most of all;
¥ to attach greater importance to giving everyone some benefits as opposed to largerbenefits for a few; and
¥ to attach less importance to life extension past a normal lifespan, thus attachinggreater moral weight to achieving a Ôfair inningsÕ (Williams 1999).
The World Health Organization sees three goals for the health sector: healthimprovement, responsiveness and fair financing (Murray 1999). Responsiveness refersto the non-health aspects of the health sector which society values, and includesattributes such as privacy, accountability, informed choice and consumer participation.In principle, societies will generally be interested in improving both the level and thedistribution of health and of responsiveness. Fair financing relates to distribution only;the level of health financing usually depends on broader social and political choices.
The evidence base needed to support priority setting in relation to these goals requiresthe following basic types of information (AIHW: Mathers et al. 1999):
¥ evidence based on scientific research on the nature and causes of health problems andthe efficacy of prevention and treatment interventions;
¥ a detailed assessment of the magnitude and impact of health problems in thepopulation, including information on the causes of loss of health (both in terms ofdisease and injury, and risk factors or broader determinants);
¥ information on health expenditure and health infrastructure (a national system ofhealth accounts) detailing the availability of resources for health improvement, whatthe resources are currently used for, and the sources and distribution of healthfinancing;
¥ information on the cost-effectiveness of available technologies and strategies forimproving health; and
¥ information on variations and inequalities in health status, health determinants, andaccess to and use of health services (including both prevention and treatment services).
Australian and international health research aims to provide the first of these types ofinformation. The National Health and Medical Research Council is the principal adviserto Government on health research matters.
A wide range of health information is collected in Australia to attempt to improve thesecond of these information needs. Health Ministers and administrators attach a highpriority to this national task, which is led by the Australian Institute of Health andWelfare.
The third type of information is obtained through a range of statistical activity tomonitor health expenditure, workforce numbers and infrastructure (see chapter 5).
The fourth type of information is still largely unexplored territory and will remain so,although there are increasing numbers of cost-effectiveness studies into particularaspects of health. An example is presented in Box 6.1.
01 AH2000 body Page 314 Thursday, June 1, 2000 3:06 PM

6 Health service strategies, performance and monitoring 315
TRIM SIZE 175 mm Wide x 250 mm Deep
Confronting a major health problem comprehensively may require a combination ofpreventive and curative interventions and continuing care. Resource allocationdecisions are influenced by information, not always empirically derived, on the cost-effectiveness of interventions across this continuum. Most ÔhealthÕ data in Australia stillrelate mainly to the inputs and throughputs of the healthcare system rather than tohealth outcomes and cost-effectiveness.
Box 6.1: Pharmaceutical Benefits Scheme: evidence-based case studyThe Commonwealth subsidises a wide range of prescription medications through the Phar-maceutical Benefits Scheme (PBS). Before a new pharmaceutical is listed on the PBS, it isevaluated for safety and effectiveness by the Pharmaceutical Benefits Advisory Committee(PBAC). Since 1991Ð92, the PBAC has taken into consideration the costs as well as thebenefits of new pharmaceuticals.
The guidelines for the PBAC state:
ÔA new drug entity may be recommended for listing if
(a) it is needed for the prevention or treatment of significant medical conditions notalready covered, or inadequately covered, by drugs in the exiting list and is of accept-able cost-effectiveness;
(b) it is more effective, less toxic (or both) than a drug already listed for the same indica-tions and is of acceptable cost-effectiveness; or
(c) it is at least as effective as a drug already listed for the same indications and is of sim-ilar or better cost-effectiveness.Õ
When pharmaceutical companies make submissions for listing their new products on thePBS, they have to supply an economic analysis of the expected costs and benefits of thepharmaceutical as well as information on the chemistry of the product, stability, qualitycontrol, in vitro studies, animal studies and clinical trials. There are specific guidelines toensure that the economic analyses are undertaken in a way that enables the different phar-maceuticals to be evaluated consistently.
Analysis of the recommendations of the PBAC in the period November 1993 to March1996 shows significant consistency in the decisions. Where the cost per additional life-yeargained due to the pharmaceutical was less than $37,000, then 10 of the 11 pharmaceuticalsin this category were recommended for listing on the PBS. All pharmaceuticals with a costeffectiveness greater than $70,000 per life-year were rejected at that price, and for thosewith a cost-effectiveness between $37,000 and $70,0000 per life-year some were accepted,and some rejected (George et al. 1997).
A pharmaceutical that does not get listed on the PBS, but is considered safe, can still bepurchased in Australia. However, consumers have to pay the full cost.
A considerable number of pharmaceuticals approved before 1992Ð93 have not been consid-ered for cost-effectiveness. In 1998Ð99, 34% of drugs listed on the PBS had been subjectedto a cost-effectiveness evaluation.
01 AH2000 body Page 315 Thursday, June 1, 2000 3:06 PM

316 AustraliaÕs Health 2000
TRIM SIZE 175 mm Wide x 250 mm Deep
Analyses of health information for population subgroups defined by a range of factors(area, socioeconomic status, Indigenous status, country of birth, etc.) are a source ofinformation on variations and inequalities in health. Chapter 4 provides information ofthis nature.
The evidence base needed to help society set priorities for health interventions shouldallow assessment of the trade-offs between efficiency (maximising health outcomes)and equity (providing health benefits to all groups and reducing inequalities in healthoutcomes). Thus society needs information not only on the size of health problems andthe potential for cost-effective health gain, but also on measures of the distribution ofhealth in the population and the distributional impacts of health-related interventions.Equity concerns can then be tackled explicitly in any priority-setting or resource-allocation process, along with the potential to improve health.
6.2 Emerging and contemporary issuesThere are a number of issues that are influencing decisions on health priorities to someextent at present, but which are likely to take on greater significance in coming years.These include demographic changes such as population ageing, changes in servicedelivery models including a move to more emphasis on community care, andcoordinated care. A brief review of these emerging and contemporary issues follows.
Population ageing The Australian population, like that of most other industrialised countries, is ageing,with an increasing proportion of men and women aged 65 and over. This is due toincreases in life expectancy and lower fertility rates. In 1999, 12.2% (2.3 million) of thepopulation were aged 65 and over; this is projected to rise to 18.0% (4.0 million) by 2021(ABS 1998).
Turning to the older ages, some 2.0% of men were aged 80 and over in 1999; this isprojected to reach 3.2% in 2021. For women, the comparable figures are 3.6% and 4.9%.This older age group (80 and over) is then projected to increase more rapidly, reaching6.7% of men and 10.1% of women in 2051.
Expenditure on health services in the future depends on the interaction between supplyand demand factors, each of which is difficult to predict. On the demand side, ageingadds only 0.6% to expenditure per year, so does not have a major impact on costs.However, changes in medical practice due to changes in technology add significantly tohealth costs each year (1.9% per person per year in the last 22 years). On the supplyside, there has been an excess supply of general practitioners (GPs) in the metropolitanareas and shortages in the rural GP workforce. Whether supply shortages occur in thefuture will depend on workforce planning decisions now. In the nursing area, studentnurse entrants have dropped from a peak of 9,300 in 1991 to 7,900 in 1998. Theimplications of this decline for the future, and the reasons for it, merit close attention.
Shift to community careA move away from institutional-based care has occurred in the areas of mental health,disability and aged care, and there have been new models to replace some traditionalhospital treatment, such as birthing centres and day surgery.
01 AH2000 body Page 316 Thursday, June 1, 2000 3:06 PM

6 Health service strategies, performance and monitoring 317
TRIM SIZE 175 mm Wide x 250 mm Deep
Between the early 1960s and 1992, the psychiatric bed ratio declined from 281 beds per100,000 population to 40 beds per 100,000. As a consequence, thousands of people weredischarged from long-stay institutions into the community, as were somewhat smallernumbers of people with physical or intellectual disabilities (Burdekin et al. 1993:166). Inline with policy driving the first National Mental Health Strategy from 1992Ð93 to1996Ð97, this Ôde-institutionalisationÕ continued, with the proportion of State andTerritory mental health service expenditure going to psychiatric hospital servicesreducing from 49% to 32%, and the proportion going to ambulatory services increasingfrom 23% to 34% (DHAC 1999b).
Average lengths of stay in public acute hospitals have fallen from 5.1 days in 1993Ð94 to4.0 days in 1997Ð98 and in private hospitals from 3.9 to 3.3 days over the same period.A major contributor to this trend in recent years has been an increase in the number ofsame-day patients, whose treatment does not require an overnight stay in hospital.Same-day separations as a proportion of separations from all hospitals increased from36.8% in 1993Ð94 to 46.3% in 1997Ð98.
Since 1985, the mix of aged care services has changed. There has been an increase in theavailability of community-based care and no increase in the ratio of residential places tothe population aged 70 and over. Similarly, in the last two decades there has been alarge increase in the number of people with a disability with ongoing support needsliving in the community, mainly with their families, and a relatively small decline in thenumber living in institutions (AIHW 1999c).
The cumulative effect of these coinciding policy directions is one of increasing need forand use of services that are home- and community-based.
Coordinated carePeople with complex health service needs, such as those with chronic conditions,multiple health issues or other complex health needs, present a particular challenge tothe health system. The number of people in this group is growing, in part due to theageing of the population. Their needs are a challenge when faced with a complex healthsystem and with care being needed from a number of different, and quite often separate,service providers. To better meet the needs of such people, Commonwealth, State andTerritory governments have cooperated to establish coordinated care trials. There arecurrently nine trials being conducted throughout Australia. They have involvednomination of a formal care coordinator who undertakes multidisciplinary care planningand service coordination, along with pooled funding arrangements to support access toservices needed for optimal patient care. These trials are in the final stages of datacollection, with interim evaluation results recently released (DHAC 1999a).
6.3 Performance indicatorsWell-designed and clearly defined indicators enable the systematic analysis of trends inhealth outcomes and factors affecting those outcomes. Indicators also enablecomparisons across populations, help identify problem areas and are used to establishbenchmarks. A number of high-level indicator frameworks have been established, orare under development, to enable the objectives of particular national health strategiesto be monitored.
01 AH2000 body Page 317 Thursday, June 1, 2000 3:06 PM

318 AustraliaÕs Health 2000
TRIM SIZE 175 mm Wide x 250 mm Deep
Performance indicators for Aboriginal and Torres Strait Islander healthIn early 1996, the AHMAC agreed to develop a set of performance indicators forAboriginal and Torres Strait Islander health. One of the intentions behind developingthese indicators was to allow jurisdictions to monitor their efforts and progress intackling the health disadvantages of Indigenous Australians, described in section 4.6.
Interim performance indicators, incorporating targets for selected indicators, wereendorsed by AHMAC in April 1997, and later endorsed by all Australian HealthMinisters and Ministers responsible for Aboriginal Affairs.
The interim indicator set includes over 50 indicators in the areas of:
¥ health outcomes, such as various aspects of mortality (age-specific, age-standardised,premature, by selected causes, stillbirths, etc.), childrenÕs hearing loss, lowbirthweight, hospitalisation, infectious diseases and sexually transmitted diseases;
¥ access to services, such as travel time to primary healthcare services and to hospital,per capita expenditure on health services, and measures of community control andcommunity participation;
¥ health service outputs, such as health promotion programs targeted at Indigenouspeople, cervical cancer screening, childhood immunisation, protocols for effectivemanagement of selected conditions, hospital inpatient and outpatient activity, andprimary care activity;
¥ health workforce development, such as Indigenous people in training, availability ofan appropriate workforce in hospitals and primary care centres, number of identifiedpositions and cross-cultural awareness programs;
¥ risk factors, including smoking, obesity, and hazardous consumption of alcohol andother substances; and
¥ intersectoral issues, such as household after-tax income relative to the poverty lineand the presence of functioning household utilities (water, sewerage, power).
A first report comparing selected indicators from different jurisdictions was published inearly 2000 (NHIMG 2000), but is characterised by much missing and poor-quality data.
All jurisdictions have experienced difficulty in reporting on a number of the indicators,although the extent of such problems has varied. Reporting problems have generallybeen due to inadequacies in the availability and quality of the necessary data, but somedifficulties have arisen because of shortcomings in some of the indicators themselves.Refinement of the performance indicators is under way, taking into account theexperiences of jurisdictions in the reporting process to date. Among the issues to beconsidered are the total number of indicators, the balance of measures of inputs,outputs and outcomes, the relevance of individual indicators, and the feasibility ofcollecting adequate data to allow for reporting on a regular basis.
01 AH2000 body Page 318 Thursday, June 1, 2000 3:06 PM

6 Health service strategies, performance and monitoring 319
TRIM SIZE 175 mm Wide x 250 mm Deep
National Health Priority Area indicatorsSets of indicators have been developed or are under development to monitor healthinterventions and outcomes in each of the National Health Priority Areas (NHPAs) ofcardiovascular health, cancer control, injury prevention and control, mental health,diabetes mellitus and asthma (the last still under development). The indicators havebeen designed as summary measures, rates and ratios, to monitor the results ofinterventions at process, risk and primary outcome levels. A framework to guide thedevelopment of these indicators was prepared by the National Health InformationManagement Group in 1996 (see Box 6.2, page 320).
Extensive information on NHPAs is included in other parts of this report. However, anupdate of the indicator sets that have been adopted for NHPA reporting is provided inTables S52Ð57, pages 415Ð425.
As NHPA strategies are developed, strategic tracking indicators will be included toenable more precise monitoring and evaluation.
National public health performance indicatorsPublic health is characterised by planning and intervening for better health inpopulations rather than focusing on the health of the individual. The activity of publichealth is concerned with those factors that determine health and causes of illness ratherthan responding to episodes of illness or injury, which is the major role of clinical healthservices. Therefore, public health indicators must be able to monitor health determinantsas well as health status in populations.
The National Public Health Partnership (NPHP) is currently developing a set of publichealth performance indicators. It is working concurrently on a Planning Framework forPublic Health Practice, which will define the principles that characterise public healthaction and the domains in which action takes place, and provide a framework for publichealth performance indicators. An AIHW discussion paper on National Public HealthIndicators (AIHW 1999b) and recently developed overseas models, such as the UnitedStatesÕ Leading Indicators for Healthy People 2010 (Institute of Medicine 1999) and theCanadian health indicators framework (Canadian Institute for Health Information2000), are helping to shape the process. The NPHP is working in conjunction with theNational Health Performance Committee (NHPC) in this task.
National health performance indicatorsIn 1999, the Australian Health MinistersÕ Conference, on advice from AHMAC, agreedto the establishment of the NHPC, whose terms of reference include developing andmaintaining a national performance measurement framework for the health system.This framework will provide a basis for reporting to the Australian Health MinistersÕConference and other national authorities with a comparative analysis and informationon national health system performance. The scope of the NHPCÕs brief is broad and sowill encompass reporting on the acute healthcare sector, as previously undertaken bythe National Health MinistersÕ Benchmarking Working Group (see Performanceindicators in the hospital sector, page 321), community health care and public health.
01 AH2000 body Page 319 Thursday, June 1, 2000 3:06 PM

320 AustraliaÕs Health 2000
TRIM SIZE 175 mm Wide x 250 mm Deep
Outside of the health sector, the performance of the national health system is monitoredin annual reports by the Steering Committee for the Review of Commonwealth/StateService Provision. Health agencies, including the AIHW, are represented on the SteeringCommitteeÕs Health Working Group, which draws principally on data already availableacross the health sector (SCRCSSP 2000).
Box 6.2: NHIMG health outcome indicator frameworkIn 1996, the National Health Information Management Group responded to a request fromAHMAC for development of a framework for health outcome indicators. The frameworkwas required to be applicable to generic and clinically specified measures and indicators ofhealth outcomes, including outcomes pertaining to the national goals and targets. TheNHPA initiative, which replaced previous activity under the banner ÔNational HealthGoals and TargetsÕ, adopted the framework to guide specification and development of indi-cator sets.
The framework consists of a two-dimensional grid made up of four types of indicators:
¥ primary outcome indicators
¥ risk indicators
¥ process and quality indicators
¥ system indicators
and three intervention strategies:
¥ prevention
¥ management
¥ maintenance.
The primary outcome indicators cover incidence, prevalence and sequelae ranging frommortality to quality of life. Risk indicators provide information about characteristics, vari-ables or hazards, which, if present in a given individual, make it more (or less) likely thatthis individual will develop a health problem. The process and quality indicators refer tothe performance of interventions on health or risk. System indicators relate to policies,resources and infrastructure for dealing with the health problem area.
The term ÔpreventionÕ is reserved for interventions that occur before the diagnosis of anevent is made. There are three different types of prevention targeted at populations or indi-viduals with different risk levels: universal, selective and indicated. ÔManagementÕ refersto interventions that are therapeutic in nature and are provided to individuals who meetdiagnostic criteria. Management involves case identification and standard treatment forthe known disorder, which includes interventions to reduce the likelihood of future associ-ated disorders. ÔMaintenanceÕ interventions include the provision of support and after-careservices to the patient, including rehabilitation.
Further information is contained in the First Report on National Health Priority Areas1996 (AIHW & DHFS 1997).
01 AH2000 body Page 320 Thursday, June 1, 2000 3:06 PM

6 Health service strategies, performance and monitoring 321
TRIM SIZE 175 mm Wide x 250 mm Deep
6.4 Service delivery monitoringThis section presents information illustrative of the current state of information that canbe reported on performance in health service delivery. It covers admitted patientservices in the hospital sector and palliative care services. Performance reporting forservices delivered in community and ambulatory settings remains developmental. Acase study in the preventive care field, breast cancer screening, is also included toillustrate the kind of performance monitoring that is emerging for public health activity.
Performance indicators in the hospital sectorAdvances in drug treatments and medical technology have led to substantial changes inthe hospital sector. Health care delivered in hospitals has become more and more thedomain of specialist services that provide a high level of medical and technical care forpatients with the most severe conditions. There have also been reductions in the lengthof stay of patients and a shift towards the provision of care in community settings.
Efficiency and effectiveness
The National Health MinistersÕ Benchmarking Working Group, which operated under theauspices of the Australian Health MinistersÕ Conference from 1994 to 1999, has developeda set of indicators to measure the efficiency and effectiveness of hospital performance(Table 6.1, page 322). Data are not currently available to allow a comprehensive report onall these indicators. Data are presented in this section on cost per casemix-adjustedseparation, the main indicator of efficiency of hospital operations, on elective surgerywaiting times and, to the extent possible with limited data, on quality of care in hospitalsand other healthcare delivery settings. Other indicators have been reported by theNational Health MinistersÕ Benchmarking Working Group (DHAC 1999c).
Cost per casemix-adjusted separation
The cost per casemix-adjusted separation can be used to compare the average cost oftreating an admitted patient after adjusting for differences in the complexity of case types(i.e. the overall casemix) treated by different hospitals. Table 6.2 (page 322) shows the costper casemix-adjusted separation for each jurisdiction. In 1997Ð98, the cost per casemix-adjusted separation for acute hospital care for States and Territories ranged from $2,354 inQueensland to $3,623 in the Australian Capital Territory. A major portion of these costs isnursing and medical staff salaries, which nationally accounted for 45% (27% in nursingsalaries and 18% in medical salaries) of the cost per casemix-adjusted separation.
In Victoria, psychiatric patients are included in the total separations used to calculatethe cost figures in Table 6.2. This follows the mainstreaming of specialised psychiatriccare into the public acute hospital system so that, for the period reported, theseseparations cannot be separately identified. For other States, much of their specialisedpsychiatric care is in public psychiatric hospitals which are not included in thiscalculation. Separations and expenditure for rehabilitation and non-acute patients couldalso not be excluded from the Victorian data. The Victorian Department of HumanServices has estimated that the combined effect of these differences is to inflate the costper casemix-adjusted separation for Victoria by approximately 10%.
01 AH2000 body Page 321 Thursday, June 1, 2000 3:06 PM

322 AustraliaÕs Health 2000
TRIM SIZE 175 mm Wide x 250 mm Deep
Elective surgery waiting times Waiting lists for elective surgery, and the associated waiting times, are often used toevaluate the status of health services within a community, particularly the ability ofpublic hospitals to provide access to their services, i.e. to provide appropriate,affordable and timely care according to need.
The National Elective Surgery Waiting Times Data Collection is maintained by theAIHW (see Box 6.3 for definitions used). The focus of the national collection is waitingtimes, rather than waiting lists, because, without knowledge of the rate of turnover of
Table 6.1: Performance indicators developed for benchmarking in the hospital sector
Category Indicator
Efficiency Cost per casemix-adjusted separation
Cost of treatment per outpatient
Average length of stay for top twenty Australian National Diagnosis Related Groups(AN-DRGs)
User cost of capital (per casemix-adjusted separation)
Ratio of depreciated replacement value to total replacement value
Total replacement value per casemix-adjusted separation
Labour costs per casemix-adjusted separation
Effectiveness Rate of emergency patient readmission within 28 days of separation
Rate of hospital-acquired infection
Rate of unplanned return to theatre
Patient satisfaction
Proportion of beds accredited by Australian Council on Healthcare Standards
Waiting times for elective surgery
Accident and emergency waiting times
Outpatient waiting times
Variations in intervention rates
Separations per 1,000 population
Source: NHMBWG 1996.
Table 6.2: Cost per casemix-adjusted separation ($), selected public acute hospitals(a), 1997Ð98
Cost component NSW Vic Qld WA SA Tas ACT NT Aust
Medical labour(b) 542 440 376 484 472 453 685 481 471
Non-medical labour(c) 1,431 1,384 1,359 1,631 1,237 1,486 1,856 1,858 1,419
Non-salary costs(d) 664 638 619 851 749 800 1,082 1,024 685
Total 2,637 2,462 2,354 2,966 2,458 2,739 3,623 3,363 2,575
(a) Excludes psychiatric hospitals, drug and alcohol services, mothercraft hospitals, dental hospitals, hospices, community non-acute hospitals, rehabiliation facilities and multipurpose facilities.
(b) Salaried/sessional staff, payments to Visiting Medical Officers and private patient costs.
(c) Salary costs for nursing, diagnostic/allied health staff, administrative staff, other personal care and domestic staff and superannuation payments.
(d) Non-salary costs for domestic services, repairs/maintenance, medical supplies, drug supplies, food supplies, administration, transport and insurance.
Source: AIHW 1999a.
01 AH2000 body Page 322 Thursday, June 1, 2000 3:06 PM

6 Health service strategies, performance and monitoring 323
TRIM SIZE 175 mm Wide x 250 mm Deep
patients on a waiting list, its size is not a reliable indicator of access to the hospitalsystem or of the amount of time that a patient would be likely to have to wait, or tohave waited, for surgery. Two summary measures are used:
¥ the proportion of patients admitted for elective surgery after extended waits onwaiting lists (throughput data); and
¥ the proportion of patients on waiting lists on a particular date who had already hadan extended wait (census data).
Waiting times for patients admitted during a certain period of time are generally used asthe main summary measure of elective surgery waiting times, although they providemeasures of waiting times only for patients who complete their wait and are admitted.Most patients are admitted after waiting, but 10% to 20% of patients are removed fromwaiting lists for other reasons (e.g. they were admitted as an emergency patient for theawaited procedure; or they were not contactable, had died, had been treated elsewhere,or had declined the surgery). In contrast, census data are collected on all patients onwaiting lists, not just those who actually receive elective surgery at the end of their wait.
Box 6.3: Elective surgery waiting times: definitionsNational Health Data Dictionary (AIHW 1998b) definitions are the basis of theNational Elective Surgery Waiting Times Data Collection, but the definitions used variedslightly among the States and Territories in 1997Ð98 and compared with previousreporting periods.
Clinical urgency categoryThe patients waiting for elective surgery are classified according to their clinical urgencyinto three categories. ÔExtended waitsÕ are waits longer than 30 days for clinical urgencycategory 1, waits longer than 90 days for clinical urgency category 2 and waits longerthan 12 months for clinical urgency category 3.
Calculation of waiting timesWaiting times are generally calculated by comparing the date a patient was added to awaiting list with the date the patient was admitted (for throughput data) or the censusdate (for census data). In 1997Ð98, there was some variation in the method by whichwaiting times were calculated by the States and Territories for patients who change clinicalurgency category while they are on the waiting list.
Emergency admissionsMost States and Territories provided data separately for patients admitted for the awaitedprocedure as an elective admission and for patients admitted as an emergency patient forthe awaited procedure. In that case, only the data on elective admissions were included,because patients who were admitted as emergency patients for the awaited procedure canno longer be regarded as having Ôelective surgeryÕ. However, small numbers of records foremergency admissions were not able to be excluded from the patient-level admissions datafor some States and Territories.
01 AH2000 body Page 323 Thursday, June 1, 2000 3:06 PM

324 AustraliaÕs Health 2000
TRIM SIZE 175 mm Wide x 250 mm Deep
National elective surgery waiting times data are for public acute care hospitals. Privatehospitals are not included, except for two hospitals in New South Wales that are fundedby the New South Wales Health Department to provide services for public patients. Somepublic patients treated under contract in private hospitals in Victoria are also included.
The most recent data available are for 1997Ð98 (AIHW 2000b). In that year all publicacute care hospitals in New South Wales, the Australian Capital Territory and theNorthern Territory were included in the data collection. In other States and Territories,all public hospitals that perform elective surgery were generally included, althoughdata were not collected for some smaller public hospitals.
Table 6.3 shows the proportion of patients admitted for elective surgery during 1997Ð98after extended waits on waiting lists (throughput data). Nationally, 11% of patientsadmitted for elective surgery from the two most urgent groups (clinical urgencycategories 1 and 2) had extended waits. In clinical urgency category 3, 4% of patientshad extended waits.
The proportion of patients in clinical urgency category 1 admitted with extended waitsvaried among the jurisdictions, from 6% in Queensland hospitals to 15% in Tasmanianhospitals. There was more variation in the proportion with extended waits in clinicalurgency categories 2 (from 9% to 35%) and 3 (from 0% to 13%). Some of this variationcould be due to differences in coverage and use of definitions, or to differences in thetypes of elective surgery performed in each jurisdiction.
Quality
Frameworks for health sector performance measurement all incorporate quality as anaspect of health care that should be monitored, but there is variation in the way in whichit is included. Some frameworks, such as that developed by the National HealthMinistersÕ Benchmarking Working Group for acute care hospitals, have viewed qualityas a component of effectiveness, monitored with indicators such as patient satisfaction,
Table 6.3: Proportion of patients admitted after extended waits, by State and Territory and clinical urgency, 1997Ð98 (per cent)
State or Territory Coverage
Clinical urgency (a)
All patientsCategory 1 Category 2 Category 3
New South Wales 100 14.3 8.5 5.6 9.6
Victoria(b) 76 n.a. n.a. n.a. n.a.
Queensland 95 6.4 15.5 0.0 8.3
Western Australia 68 10.0 12.0 9.0 9.9
South Australia 73 8.6 8.9 2.7 5.2
Tasmania 88 15.3 35.3 13.2 20.4
Australian Capital Territory 100 7.7 25.7 10.7 16.9
Northern Territory 100 10.3 19.0 3.7 9.8
Total 11.2 11.2 4.0 8.2
(a) See Box 6.3, page 323.
(b) For the period 1 January to 30 June 1998 only.
Source: AIHW 2000b.
01 AH2000 body Page 324 Thursday, June 1, 2000 3:06 PM

6 Health service strategies, performance and monitoring 325
TRIM SIZE 175 mm Wide x 250 mm Deep
rates of unplanned re-admissions, rates of hospital-acquired infection and the proportionof hospital beds that are accredited. Other frameworks, such as that proposed by Boyceet al. (1997), and frameworks currently under consideration by the National HealthPerformance Committee to be applicable to the wider health sector, have includedquality not as a separate category but as encompassing effectiveness, appropriateness,safety, consumer experience, acceptability, accessibility and equity, continuity, capabilityand/or other aspects of service delivery.
Considered together, the range of frameworks can be seen to summarise quality asbeing assessable in two major ways. The first is whether the health service has achievedwhat was intended, i.e. whether it has been effective in producing a desired outcome.The second is whether it was safe, i.e. whether there were adverse effects or unintendedor undesired outcomes resulting from the intervention or the healthcare environment.
Reliable national information on these aspects of the quality of the health services is,however, not readily available. Most data collection and indicator development havefocused on clinical care and, in particular, on the acute care hospital setting, withprogress in the areas of prevention and population health much more limited. Evenwithin clinical care and hospitals, the availability of information has been limited bydifficulties in specifying valid indicators and in generating reliable and consistent data.Because desired and undesired outcomes can be difficult to assess (because they occur along time after the health service provision, for example), ÔprocessÕ indicators aresometimes used instead of outcome indicators. Process indicators, which should be ableto predict outcomes, are often based on specialist and evidence-based opinion onmethods for managing particular conditions, for example, and can be more sensitive toerrors or deficiencies in healthcare provision than are outcome indicators.
Desired outcomes
National information on whether health services have achieved desired outcomes isparticularly scarce. In the hospital setting, a wide range of clinical indicators (includinghealth outcome indicators and process indicators) are being developed for theAustralian Council on Healthcare Standards (ACHS) Evaluation and QualityImprovement Program by the ACHS itself and by medical colleges, associations andspecial societies. Reports published for the Program summarise data from over 500healthcare organisations and may provide directions for the development of nationalhealth outcome indicators (ACHS 1998).
The evaluation of some population health programs has included assessment of healthoutcomes, but these outcomes are necessarily influenced by other factors, includingother health services, and non-health factors such as socioeconomic status.Nevertheless, national programs such as those for controlling HIV/AIDS, forimproving immunisation against measles and for breast cancer screening have beenlinked with reduced incidence, impact and/or mortality of the diseases that theytargeted.
The effectiveness of healthcare services has also been indirectly assessed using processindicators such as the proportion of hospitals that are accredited by the ACHS or otherbodies. The proportion of hospitals and hospital beds accredited by the ACHS is theonly data available on a national basis for this assessment for hospitals. In 1997Ð98, 47%
01 AH2000 body Page 325 Thursday, June 1, 2000 3:06 PM
326 AustraliaÕs Health 2000
TRIM SIZE 175 mm Wide x 250 mm Deep
of public hospitals, 49% of private freestanding day hospital facilities and 78% of otherprivate hospitals were accredited. Larger hospitals were more likely to be accreditedthan smaller hospitals, such that 75% of beds in public hospitals, 52% of beds in privatefreestanding day hospital facilities and 90% in other private hospitals were accredited.Because accreditation is voluntary, can be relatively costly for small hospitals and canbe sought from other bodies, these data provide only indicative information about thequality of care provided in Australian hospitals.
Accreditation measures have also been reported as an indicator related to quality forgeneral practitioners (SCRCSSP 2000). In 1998Ð99, the proportion of full-time GPs withvocational registration was 91% in 1998Ð99 and, at end of 1999, almost half of the generalpractices were accredited with Australian General Practice Accreditation Limited.
Patient perspectives on the quality of health care, gathered through patient satisfactionsurveys, can also potentially provide measures of whether health care has produceddesired outcomes. These surveys, which have included questions to assess aspects ofhealth care related to effectiveness, safety, accessibility and acceptability, have beenconducted on a population basis in some jurisdictions, and for hospital patients inothers. Methods and questionnaires used differ among the surveys so the data have notbeen collated or reported on a national basis. However, State reports indicate highlevels of satisfaction with care provided in public acute care hospitals (SCRCSSP 2000).
Undesired outcomes
Information from the patientÕs perspective has also been used to assess the occurrenceof adverse events and other undesired outcomes of health care. Each State and Territoryhas an independent health complaint body that investigates and conciliates complaintsmade by consumers about health services, and compiles information about thecomplaints. In 1996, the National Health Complaints Information Project wasestablished to work towards a national database of health complaint data. It wasanticipated that collation and analysis of the national database would lead toinformation being available to improve health care services. The ProjectÕs main focus sofar has been on developing the reporting infrastructures and definitions to be used inthe national database, with national data yet to be reported.
In the hospital setting, the last large-scale assessment of the occurrence of adverseevents was in the Quality in Australian Health Care Study (Wilson et al. 1995), whichused information collected in a review of medical records for hospitalisations in NewSouth Wales and South Australia in 1992. Since then, potential hospital-level indicatorsof undesired outcomes (unplanned re-admission to hospital, unexpected return tooperating theatre, and hospital-acquired infections) have been tested for validity andreliability and for the ease of collection of the data required for their measurement.However, a valid relationship between quality of care and the indicators tested couldnot be demonstrated and the data to measure these outcomes could not be extractedfrom the databases available of routinely collected data.
The Australian and New Zealand College of Anaesthetists has been compiling andpublishing reports on anaesthesia-related mortality in Australia since 1985. In the 1994Ð96triennium, there were 135 deaths that were definitely or probably attributable toanaesthesia, or were attributable to anaesthesia in combination with other factors (about
01 AH2000 body Page 326 Thursday, June 1, 2000 3:06 PM

6 Health service strategies, performance and monitoring 327
TRIM SIZE 175 mm Wide x 250 mm Deep
2.6 deaths per million population per year). Of these, 55 deaths (1.0 death per millionpopulation per year) were considered to be definitely attributable to anaesthesia. It wasestimated that there was 1 death definitely, probably or jointly attributable to anaesthesiafor every 63,000 operative or diagnostic procedures performed in Australia in thetriennium, with 1 death definitely attributable to anaesthesia for every 150,000 procedures(Davis 1999).
The Australian Incident Monitoring Scheme, run by the Australian Patient SafetyFoundation, compiles anonymously reported detailed data on incidents in hospitalsand other healthcare facilities, with incidents defined broadly as any event orcircumstance which could have harmed or did harm anyone or which could result in acomplaint. This type of incident reporting may be a source of national adverse-eventdata in the future, but reporting is voluntary and, at present, only a minority ofhospitals and other facilities report. Some data on the occurrence of adverse events arealso collected in the routinely compiled hospital morbidity databases and in thenational mortality data. However, the sensitivity and specificity of these data sourcesfor adverse events are probably not high enough for them to be used to routinelymeasure adverse outcomes.
The development of a national reporting system for errors that result in serious injuryand death of patients in the healthcare system has been identified as an area forimmediate action by the recently established Australian Council for Safety and Qualityin Health Care. The role of the Council, established in 2000 by the Commonwealth,State and Territory Health Ministers, is to lead national efforts to promote systemicimprovements in the safety and quality of health care in Australia with a particularfocus on minimising the likelihood and effects of error. Its main aims include thedevelopment of a national strategy to improve the safety and quality of health care inhospitals and other health settings; the development of a national framework foradverse-event monitoring, management and prevention including incident monitoringand complaints; and effective reporting and measurement of performance, includingresearch and development of clinical and administrative information systems.
Palliative care Palliative care is Ôthe active total care of people whose disease is not responsive to curativetreatmentÕ (DHFS 1998:2). Most palliative care is provided to patients with cancer,although a significant amount of care is also provided to people with non-malignantdiseases such as heart failure, end-stage renal failure and motor neurone disease.
In 1997Ð98, there were 17,824 hospital separations in Australia where the patient wasidentified as receiving palliative care. The average length of stay was 13.3 days, and84% of separations were from public hospitals. Over one-third of palliative careseparations were patients aged 75 years or over, and approximately two-thirds of allpalliative care separations were patients aged 65 years or over. Males accounted for 54%of the palliative care separations, and 70% of palliative care separations had a principaldiagnosis of cancer.
To support the monitoring of the provision of palliative care, all States and Territoriesare cooperating in the development of a National Minimum Data Set (NMDS) forpalliative care.
01 AH2000 body Page 327 Thursday, June 1, 2000 3:06 PM

328 AustraliaÕs Health 2000
TRIM SIZE 175 mm Wide x 250 mm Deep
The NMDS for institutional palliative care will be used to collect data on palliative carepatients seen in public and private hospitals and hospices from 1 July 2000. The data setwill include demographic, clinical and administrative data on all admitted patients.Patients who do not receive care from specialised palliative care staff, but where theprincipal clinical intent is palliative, will be separately identified. Much of these dataare already collected as part of the National Hospital Morbidity Database, and existingdata relating to palliative-care patients has been summarised in Palliative CareInformation Development: Progress Report on the National Minimum Data Set for PalliativeCare (AIHW: Jellie & Shaw 1999).
An NMDS for community palliative care is currently being developed by all States andTerritories in collaboration with the AIHW and the Commonwealth Department ofHealth and Aged Care. This data set will be used to collect information in all servicesfunded by governments which provide home- or community-based palliative care.
These data will be used to underpin the derivation of a suite of national palliative careperformance indicators. This information will be used to monitor the current delivery ofpalliative care and to provide a basis for future policy development relating to this area.
Breast cancer screeningFollowing a review of international evidence and an evaluation of breast cancerscreening in Australia, AHMAC implemented, in 1991, the National Program for theEarly Detection of Breast Cancer (now called BreastScreen Australia).
The key aims of BreastScreen Australia are:
¥ to ensure that the program is implemented in such a way that significant reductionscan be achieved in morbidity and mortality attributable to breast cancer;
¥ to maximise the early detection of breast cancer in the target population;
¥ to ensure that screening for breast cancer is provided in dedicated, accreditedscreening and assessment services;
¥ to ensure equitable access for women aged 50Ð69 years to breast cancer screening;and
¥ to ensure that services are acceptable and appropriate to the needs of the eligiblepopulation.
Indicators have been developed in areas of participation, detection, sensitivity,incidence and mortality to monitor the performance of the program (AIHW 1998a).
In the two years 1996 and 1997, about 1.25 million Australian women were screenedthrough the program, including just over half of all women in the target group (aged50Ð69 years, Table 6.4).
The rate of small cancer detection measures the number of women with small invasivebreast cancers of 10 mm or less in size. Early detection of small cancers gives a womana better chance for a good prognosis, as small tumours have a greater chance of beingremoved with less extensive surgery, requiring less after-care. The greater the rate of
01 AH2000 body Page 328 Thursday, June 1, 2000 3:06 PM

6 Health service strategies, performance and monitoring 329
TRIM SIZE 175 mm Wide x 250 mm Deep
detection of small cancers, the greater the likelihood of achieving reductions inmortality and morbidity from breast cancer. The small-cancer detection rate for womenaged 50Ð69 years in 1997 was 13.2 cancers per 10,000 women screened (Table 6.4).
Sensitivity refers to the effectiveness of screening mammography and/or theBreastScreen Australia program at detecting the presence of breast cancer in wellwomen. There are two sensitivity measures. The first is the interval cancer rate, whichmeasures the sensitivity of the mammography screening test. The second is programsensitivity, which takes into account the accuracy of the test, the processes of theprogram and the length of the screening interval. The aim is for an interval cancer rateas low as possible and high program sensitivity (AIHW 2000a).
Incidence is the rate of new cases of breast cancer. After peaking in the mid-1990s, theincidence rate for women aged 50Ð69 years appears to have declined slightly.
Reducing the death rate from breast cancer is the main objective of BreastScreenAustralia. The effect of the program on death rates may not be evident until severalyears after the introduction of screening. However, the death rate for breast canceramong women aged 50Ð69 years has fallen slightly in recent years from 65.0 per 100,000in 1996 to 59.4 per 100,000 women in 1998 (Table 6.4).
ReferencesABS 1998. Population projections 1997 to 2051. ABS Cat. No. 3222.0. Canberra: ABS.
ACHS (Australian Council on Healthcare Standards) 1998. Measurement of care inAustralian hospitals. Volume 5, November 1998. Quantitative and qualitative data for1997. Sydney: ACHS.
AIHW 1998a. Breast and cervical cancer screening in Australia 1996Ð97. AIHW Cat. No.CAN 3. Canberra: AIHW.
AIHW 1998b. National Health Data Dictionary, version 7.0. AIHW Cat. No. HWI 15.Canberra: AIHW.
AIHW 1999a. Australian hospital statistics, 1997Ð98. AIHW Cat. No. HSE 6. Canberra:AIHW.
Table 6.4: Summary indicators for breast cancer screening, women aged 50Ð69 years
Indicator Year Proportion/rate
Per cent of women screened in 24-month period 1996–1997 52.2
Rate of small diameter (≤10 mm) invasive cancers detected (per 10,000 women screened) 1997 14.4
Incidence rate of breast cancer cases (new cases per 100,000 women) 1996 270.2
1997 281.5
Death rate for breast cancer (per 100,000 women) 1996 65.0
1997 62.8
1998 59.4
Source: AIHW 1998a.
01 AH2000 body Page 329 Thursday, June 1, 2000 3:06 PM

330 AustraliaÕs Health 2000
TRIM SIZE 175 mm Wide x 250 mm Deep
AIHW 1999b. Development of national public health indicators: discussion paper.Canberra: AIHW.
AIHW 1999c. AustraliaÕs welfare 1999: services and assistance. Canberra: AIHW.
AIHW 2000a (forthcoming). BreastScreen Australia achievement report 1997Ð1998.AIHW Cat. No. CAN 8. Canberra: AIHW.
AIHW 2000b (forthcoming). Waiting times for elective surgery, 1997Ð98. Canberra:AIHW.
AIHW & DHFS 1997. First report on National Health Priority Areas 1996. AIHW Cat.No. PHE 1. Canberra: AIHW & DHFS.
AIHW: Jellie C & Shaw J 1999. Palliative care information development: progress reporton the national minimum data set for palliative care. AIHW Cat. No. HSE 8.Canberra: AIHW.
AIHW: Mathers C, Vos T & Stevenson C 1999. The burden of disease and injury inAustralia. AIHW Cat. No. PHE 17. Canberra: AIHW.
Boyce N, McNeil J, Graves D & Dunt D 1997. Quality and outcome indicators for acutehealthcare services. Canberra: AGPS.
Burdekin B, Guilfoyle M & Hall D 1993. Human rights and mental illness: report of theNational Inquiry into the Human Rights of People with Mental Illness. Canberra:AGPS.
Canadian Institute for Health Information 2000. Roadmap initiativeÉlaunching theprocess. Ottawa: Canadian Institute for Health Information.
Davis NJ (ed.) 1999. Anaesthesia related mortality in Australia 1994Ð1996. Australianand New Zealand College of Anaesthetists.
DHAC 1999a. The Australian coordinated care trials: interim technical nationalevaluation report. Canberra: DHAC.
DHAC 1999b. Mental health information development: national information prioritiesand strategies under the second national mental health plan 1998 to 2003. Canberra:AGPS.
DHAC 1999c. Third national report on health sector performance indicators. Canberra:AGPS.
DHFS 1998. A national strategy for palliative care in Australia 1998Ð2003. Canberra:AGPS.
George B, Harris A & Mitchell A 1997. Reimbursement decisions and the implied valueof life: cost effectiveness analysis and decisions to reimburse pharmaceuticals inAustralia 1993Ð1996. Paper presented at the conference of the Australian HealthEconomists Society, Melbourne, July 1997.
Institute of Medicine 1999. Leading healthy indicators for healthy people 2010: finalreport. Chrvala CA & Bulger RJ (eds). Washington DC: National Academy Press.
01 AH2000 body Page 330 Thursday, June 1, 2000 3:06 PM

6 Health service strategies, performance and monitoring 331
TRIM SIZE 175 mm Wide x 250 mm Deep
Murray CJL 1999. WHO framework for measuring health inequality. Second Meeting ofthe International Burden of Disease Network, Lorne, Victoria, Australia, 15Ð17November 1999.
NHIMG (National Health Information Management Group) 2000. National summary ofthe 1998 jurisdictional reports against the Aboriginal and Torres Strait Islander healthperformance indicators. Canberra: AIHW.
NHMBWG (National Health MinistersÕ Benchmarking Working Group) 1996. Firstnational report on health sector performance indicators: public hospitalsÑthe state ofplay. Canberra: AIHW.
SCRCSSP (Steering Committee for the Review of Commonwealth/State ServiceProvision) 2000. Report on government services 2000. Melbourne: Commonwealth ofAustralia.
Williams A 1999. Calculating the global burden of disease: time for a strategicreappraisal? [editorial]. Health Economics 8(1):1Ð8.
Wilson RM, Runciman WB, Gibberd RW, Harrison BT, Newby L & Hamilton JD 1995.The Quality in Australian Health Care Study. Medical Journal of Australia 163:458Ð71.
01 AH2000 body Page 331 Thursday, June 1, 2000 3:06 PM

332 AustraliaÕs Health 2000
TRIM SIZE 175 mm Wide x 250 mm Deep
7 Challenges for national health information
The large amount of material presented in preceding chapters describes the current stateof health in Australia at the end of the twentieth century. Australia has a well-developedstatistical system, and is well served by institutions with a major commitment to nationalhealth information. Among these, the Australian Institute of Health and Welfare (AIHW)and the Australian Bureau of Statistics (ABS) play leading roles in the collection,coordination and reporting of information on health and wellbeing. These two agencies,together with the Commonwealth, State and Territory health departments and theHealth Insurance Commission, are responsible for implementing the National HealthInformation Agreement (NHIA). The bulk of the information presented in this report issourced from one or more of the NHIA members.
The National Health Information Management Group (NHIMG), which oversees theNHIA on behalf of the Australian Health MinistersÕ Advisory Council (AHMAC),advises on health information priorities. Its National Health Information DevelopmentPlan (AIHW & AHMAC 1995) identified priority directions for a projected 10-yearperiod. Since the release of the plan, progress has been achieved in each of its highestpriority areas. However, new information demands have emerged, and NHIMGcurrently has the plan under review.
This chapter presents an overview of progress with the National Health InformationDevelopment Plan and outlines the emerging information requirements of new nationalhealth strategies. Information gaps that constrain reporting in the earlier chapters ofAustraliaÕs Health 2000 are also identified.
7.1 The National Health Information Development Plan
The objectives of the Plan are to Ôpromote the development of high priority healthinformation and to increase the cost-effectiveness of Australian national healthinformationÕ. Highest priority development directions of the Plan are:
¥ work with Aboriginal and Torres Strait Islander peoples to develop a plan to improveall aspects of information about their health and health services;
¥ develop a national health and welfare information model;
¥ in consultation with health service consumers and providers, undertake acomprehensive examination of the feasibility and usefulness of potential approachesto developing and enhancing the ability to link health records, and identify thelinkages that will result in the greatest community benefit;
01 AH2000 body Page 332 Thursday, June 1, 2000 3:06 PM

7 Challenges for national health information 333
TRIM SIZE 175 mm Wide x 250 mm Deep
¥ develop a plan to improve health outcomes information by developing clinicallyspecific measures of health outcomes for major health problems and enhancing theusefulness of clinical information systems for measuring the effectiveness andoutcomes of interventions;
¥ develop and collect standardised information on the incidence, prevalence,consequences and outcomes of care of severe mental illness;
¥ develop and collect standardised information on primary and other non-institutionalhealthcare encounter data;
¥ undertake a systematic review of current major health data collections and makerecommendations regarding rationalisation and improvements in the cost-effectiveness of collections; and
¥ develop ongoing surveillance of potentially modifiable, major disease risk factors,including biological measurements where necessary, ensuring adequate coverage ofsmall, priority populations.
Achievements since 1995Progress has been made in each of the priority directions.
Aboriginal and Torres Strait Islander health
In 1998, AHMAC endorsed The Aboriginal and Torres Strait Islander Health InformationPlanÉThis Time LetÕs Make it Happen (ATSIHWIU 1997) and established a process for itsimplementation, to be managed by NHIMG. The ABS accepted responsibility forimproving the quality of Indigenous identification in vital statistics collections. Goodprogress has been made in Queensland, which was the last State to commenceIndigenous identification in birth and death records. Nevertheless, the quality ofidentification in the other eastern States has not improved sufficiently to permitpublication of data on deaths.
The joint ABS/AIHW Aboriginal and Torres Strait Islander Health and WelfareInformation Unit has taken the lead role in improving hospital morbidity data for theIndigenous populations. A pilot study has provided indicative results on the extent ofcoverage of Indigenous patients in hospitals (which ranged from 55% to 100%) and amethodology for testing coverage in other hospitals. AIHW has accepted the lead rolein relation to cancer registries (where it is working with the Australasian Association ofCancer Registries) and in perinatal statistics (where it is working through its NationalPerinatal Statistics Unit to standardise and improve coverage in perinatal datacollections).
National health and welfare information model
The National Health Information Model, version 1 (AIHW 1995), has been furtherdeveloped and replaced by a draft version 2. Version 2 has been constructed as a high-level, conceptual model, quite different from version 1 which was constructed as anentity-relationship model. Unlike version 1, version 2 does not attempt to describerelationships between the entities in the model, as it is considered that these are moreappropriately described at enterprise or operational levels of information modelling.
01 AH2000 body Page 333 Thursday, June 1, 2000 3:06 PM

334 AustraliaÕs Health 2000
TRIM SIZE 175 mm Wide x 250 mm Deep
Version 2 provides an organising structure for the National Health Data Dictionary, whichis now structured to present data elements in accordance with their relationship toModel entities (NHDC 1998).
Record linkageThe AIHW has built considerable record linkage experience using its National DeathIndex and the National Cancer Statistics Clearing House. The AIHWÕs Health EthicsCommittee approved 41 projects involving linkage using these databases during1998Ð99, a number that has increased markedly over 5 years. Studies have contributed toknowledge about health patterns in occupational cohorts (e.g. Radium Hill workers),specific population groups (e.g. older women, Vietnam veterans), selected communities(Western Sydney Area Health Service) and for specific diseases (e.g. hepatitis C,cardiovascular surgery outcomes). Other linkage projects have been undertaken toexamine the potential for creating person-based records from hospital separations toexamine the patterns of re-admission for cardio-revascularisation procedures.
Several States have established linked data sets with matched records from local hospitalmorbidity, mortality and other health records. Western Australia, in particular, has usedhealth record linkage extensively in health studies, including prostate cancer survivalanalysis (Holman et al. 1999), an examination of hospitalisation of the elderly during thelast year of life (Brameld et al. 1998), and estimation of the incidence of aortic aneurysm(Semmens et al. 1998). A study into the linking of data from the Western Australianlinked data set with national data sets (e.g. Medicare data, data from the PharmaceuticalBenefits Scheme and the National Death Index) for people with diabetes is in theplanning stages. Protocols for such studies are complicated by the need to meet privacyprotection requirements under various administrative and legislative regimes.Identifying and resolving such issues is one of the objectives of the study.
Following a review of its household survey program, the ABS has announced that itwill pursue the linking of survey data to administrative records with consent. Thelinkage would be done within the ABS under the protection of the secrecy provisions ofthe Census and Statistics Act 1905.
Health outcomesThe NHIMG, in response to a specific request from AHMAC, has developed a healthoutcomes indicator framework. The framework encompasses outcome and otherindicators spanning prevention, management and maintenance services. It has beenadopted for reporting under the National Health Priority Areas (NHPA) program.NHPA reports on injury and diabetes and a forthcoming report on asthma have appliedthe framework. The framework also provides a planning basis for data development forfuture NHPA reporting.
A register to monitor new cases and prevalence of acute rheumatic fever and rheumaticheart disease among the Indigenous populations has been established in the Top End ofthe Northern Territory. Data in the register permits monitoring of rates of compliancewith treatment and provides data on the outcome of intervention. For cardiovasculardisease in general, the AIHW has reported on medical care of cardiovascular diseaseand, in collaboration with the National Heart Foundation of Australia, on the use ofcardiac surgery and coronary angioplasty procedures. The feasibility of establishing a
01 AH2000 body Page 334 Thursday, June 1, 2000 3:06 PM

7 Challenges for national health information 335
TRIM SIZE 175 mm Wide x 250 mm Deep
national cardiovascular procedures register is being investigated. This would providereliable, longitudinal, risk-adjusted data for monitoring national indicators of qualityand outcomes for cardiac procedures and cardiology interventions.
One of the indicator sets developed under the health outcomes indicator framework isthat for monitoring the performance of the BreastScreen Australia program. Theseindicators seek to highlight progress towards the program objectives relating toparticipation, cancer detection, program sensitivity, cancer incidence and mortality. Themortality indicator is the ultimate test of the programÕs effectiveness, and between 1994and 1998 there has been evidence of a reduction in mortality rates due to breast cancerof 2.5% per annum (AIHW & AACR 1999).
Severe mental illness
An ABS Survey of Mental Health and Wellbeing, conducted in 1995, reported on theprevalence of mental illness among adults in the community (ABS 1998). Acomplementary multijurisdiction study of people living with psychotic illness hasprovided information on people attending mental health services for treatment ofpsychotic disorders, including schizophrenia (Jablensky et al. 1999). New administrativedata in mental health services have become available through implementation of a newNational Minimum Data Set for Institutional Mental Health Services from 1997Ð98(AIHW 2000). Progressive implementation of a National Minimum Data Set forCommunity Mental Health Services is proceeding, following its adoption by NHIMG.
Non-institutional healthcare data
Progress in this area has included the establishment in 1998 of a Survey of GeneralPractice Activity (BEACHÑBettering the Evaluation And Care of HealthÑsee chapter 5).The survey commenced in April 1998 with funding from a consortium of privatepharmaceutical companies and several government agencies. A report on the first year ofthe survey was published in 1999.
A National Community Based Health Services Codeset, prepared by a consortium ofCommonwealth and State health agencies, has provided the basis for implementingdata collections that will fill a large gap in national health services information.
Improving cost-effectiveness of collections
The ABS has conducted a wide-ranging review of its household survey system,including the National Health Survey, and plans to introduce a new 3-yearly cycle ofhealth surveys. Sample supplementation for the Aboriginal and Torres Strait Islanderpopulations will be introduced over the first two surveys in the new program (2001 and2004) and continue at 6-year intervals thereafter. Also included in the program is a3-yearly General Social Survey that will permit analysis of the social determinants ofthe health of the population. An Indigenous General Social Survey will be conducted inconjunction with every second General Social Survey from 2002.
Some rationalisation has occurred in national hospital statistics, with a withdrawal bythe Department of Heath and Aged Care from publication of its hospital casemix series.Re-establishment of the AIHWÕs Australian Hospital Statistics series on a regular andtimely basis has permitted this rationalisation of publication activities.
01 AH2000 body Page 335 Thursday, June 1, 2000 3:06 PM
336 AustraliaÕs Health 2000
TRIM SIZE 175 mm Wide x 250 mm Deep
Potentially modifiable disease risk factorsABS National Health Surveys have provided information on disease risk factors,including smoking, alcohol consumption, exercise and unhealthy weight, based on self-report methods. National Drug Household Surveys, conducted by the Department ofHealth and Aged Care and its predecessors, provide information about use of andattitudes towards tobacco, alcohol and illicit drugs. Biomedical risk factor information,of the kind collected by the National Heart Foundation in three surveys during the1980s, has not been collected during the past decade. A one-off survey of diabetesprevalence is being undertaken during 1999 and 2000 by the International DiabetesInstitute, Melbourne, but plans for ongoing national monitoring of biomedical riskfactors are still at the development stage. Options include a survey in conjunction withthe ABSÕs National Health Survey in 2004 or a stand-alone survey.
7.2 Newly emerging information challengesSince the release of the National Health Information Development Plan, new issueshave raised unanticipated challenges for national health information. Major emergingthemes are:
¥ plans to incorporate new communications technology into health care;
¥ increased focus on the health of rural and remote populations;
¥ increased focus on factors affecting the health and wellbeing of children; and
¥ coordinated attention to public health, brought by the National Public HealthPartnership.
Plans Ôto provide a basis for a national strategic approach to using information in thehealth systemÕ have been released in a report by the National Health InformationManagement Advisory Council entitled Health Online (NHIMAC 1999). The PlanÕsscope includes information collection, privacy and confidentiality, and access, but alsoinformation transfer in interactive services and situations. Under the planÕs informationobjectives, two strands of information development have been identified. One isconcerned with development and adoption of information technology standards, forwhich much of the work occurs under the auspices of Standards Australia, itscommittee processes and international connections. The other strand is concerned withdata standards, for which the NHIMGÕs management of the National Health DataDictionary (NHDD) provides a well-established basis for future development.
Electronic health records offer an opportunity for expanded availability of statisticaldata, including linked data sets. The challenge for national health information will arisefrom the strict business requirements for an electronic health record that is transferableacross healthcare settings. This will require standard definitions for data elements thatare included in an electronic health record. The NHIMGÕs processes are well placed tohandle this expanded requirement. As well, classification and coding schemes arerequired that are flexible enough to support the expected interchange of informationacross settings while continuing to meet the different business requirements for specificcare settings. The World Health OrganizationÕs development of a Family ofInternational Health Classifications is pertinent. The AIHW is a WHO Collaborating
01 AH2000 body Page 336 Thursday, June 1, 2000 3:06 PM

7 Challenges for national health information 337
TRIM SIZE 175 mm Wide x 250 mm Deep
Centre on health classifications (including the International Classification of Diseasesand the International Classification of Impairments, Disabilities and Handicaps) and isactively participating in this work.
Increased attention to rural and remote health and health services presents challengesto improve the flexibility of geographic coding in major health data sets. Fixed regionalboundaries, whether administrative (such as postcodes or local government areas) orstatistical (such as statistical local area or statistical division), currently coded in mostdata sets, limit the capacity to support the area-specific analysis that is increasinglyrequired to meet rural and remote health and environmental health management needs.Remote health issues are confounded by the poorer health of Aboriginal and TorresStrait Islander people who constitute a significant proportion of the population inremote areas (see chapter 4).
Demands for information about child and youth health and wellbeing are increasinglyconcerned with the influence of early social development as a determinant. Existinginformation systems are extensive, but are cross-sectional, not longitudinal.Opportunities exist through linkage of data sets to create longitudinal views at low cost.
Public health information has a higher profile since the establishment in 1996 of theNational Public Health Partnership. Through its National Public Health InformationWorking Group, the Partnership has developed a National Public Health InformationDevelopment Plan (AIHW 1999). The challenges contained in this plan includeestablishment of an infrastructure for monitoring health determinants, health andcauses of ill health of Aboriginal and Torres Strait Islander populations, socioeconomicdisadvantage and health, intersectoral information on the physical environment andfinancial information on public health programs.
Across a number of health fields there is increasing demand for analytical work for thespecification and production of broad health indicators and of performance indicators,either within specific program areas or more generally focused on the health system asa whole. General health indicator requirements cover fields such as burden of diseaseand health inequalities. Performance indicators include efficiency and effectiveness ofservices, including quality and outcomes.
The 1998 Australian Health Care Agreements include requirements for development ofperformance indicators across the health sector. This work is being led by the NationalHealth Performance Committee.
7.3 Major gaps in this reportThe requirement to report on AustraliaÕs health itself raises awareness of the gaps thatare unable to be filled. This section provides an alternative view, from a reportingperspective, of the development required to augment information presented in thepreceding chapters of this report.
The health of Australians (chapter 2)As reported in chapter 2, mental health is the third most important contributor to theburden of disease. Although information available on mental health services continuesto improve (chapter 5), there is no provision in the work programs of relevant agencies
01 AH2000 body Page 337 Thursday, June 1, 2000 3:06 PM

338 AustraliaÕs Health 2000
TRIM SIZE 175 mm Wide x 250 mm Deep
for any ongoing data collection on population mental health. Information from the ABS1997 Survey of Mental Health and Wellbeing was reported in AustraliaÕs Health 1998 andsome further information from that survey has been included in chapter 2. However,ongoing coverage of population mental health is not included in a comprehensivemanner in the new ABS population survey program.
Chapter 2 is able to report in only a limited way on the oral health of Australians,particularly of adults. As reported in AustraliaÕs Health 1998, fluoridation of watersupplies has reduced the prevalence of dental decay in cohorts that have lived all ormost of their lives with such protection. Some information on decayed, missing or filledteeth (DMFT status) is available from self-report through telephone surveys conductedby the AIHW Dental Statistics Research Unit. However, periodic surveys including anoral examination are needed to verify reports on DMFT status and to measure otheraspects of oral health.
Determinants of health (chapter 3)Chapter 3 is devoted to the environmental and individual factors that determine health.This reflects the increasing attention being given to managing determinants throughpublic health practice, evident at the national level in the establishment in 1996 of theNational Public Health Partnership. However, only limited information could bepresented in many areas of chapter 3. In particular, biomedical risk factor information isneeded to monitor levels of modifiable risks to health from major disease categories,especially cardiovascular disease, diabetes and some cancers. Better information is alsoneeded on environmental health risks, and on attitudinal and lifestyle factors, an areawhere the National Public Health Partnership has begun efforts to coordinate existinginformation activities.
Health and determinants in population groups (chapter 4)The inability to report comprehensively on the health of Aboriginal and Torres StraitIslander people has already been discussed, as has the lack of longitudinal data tomonitor child and youth health. Health of people with disabilities is another area wheredata is almost non-existent (see AustraliaÕs Welfare 1999). A particularly difficult group tomonitor is homeless people.
Health resources and use of services (chapter 5)Chapter 5 presents only limited information about health services other than thoseprovided to admitted patients in hospitals and consultations with general practitioners.Ambulatory services provided within hospitals (accident and emergency units andhospital-based clinics) and in the community are important in their own right and ascontributors to integrated care regimes that are emerging. A Community Based HealthServices Codeset, developed by a consortium of jurisdictions, provides a basis fordevelopment of community services information, but will require a major coordinatedeffort to implement.
Health service strategies, performance and monitoring (chapter 6)A number of frameworks for health system performance monitoring are receivingattention from national bodies such as the National Health Performance Committee.Information systems are being developed to support these frameworks, but some
01 AH2000 body Page 338 Thursday, June 1, 2000 3:06 PM

7 Challenges for national health information 339
TRIM SIZE 175 mm Wide x 250 mm Deep
components require prior work to develop concepts and specifications for indicators.For instance, in line with many countries, Australia has not developed valid andreliable indicators of the quality of health care.
Data systems for monitoring the performance of services and activities aimed at thehealth of Aboriginal and Torres Strait Islander peoples are a priority, as are performanceinformation systems related to community-based health care.
ReferencesABS 1998. 1997 National Survey of Mental Health and Wellbeing: adult component,
Australia. ABS Cat. No. 4326.0. Canberra: ABS.
AIHW 1995. The national health information model, version 1. Canberra: AIHW.
AIHW 1999. National public health information development plan: directions andrecommendations 1999. AIHW Cat. No. HWI 22. Canberra: AIHW.
AIHW 2000. Institutional mental health services in Australia 1997Ð98. AIHW Cat. No.HSE 7. Canberra: AIHW.
AIHW & AACR 1999. Cancer in Australia 1996: incidence and mortality data for 1996and selected data for 1997 and 1998. Cancer Series. AIHW Cat. No. CAN 7. Canberra:AIHW.
AIHW & AHMAC 1995. National health information development plan. Canberra:AGPS.
ATSIHWIU 1997. The Aboriginal and Torres Strait Islander health informationplanÉthis time letÕs make it happen. AIHW Cat. No. HWI 12. Canberra: AHMAC,AIHW & ABS.
Brameld KJ, Holman CD, Bass AJ, Codde JP & Rouse IL 1998. Hospitalisation of theelderly in the last year of life: an application of record linkage in Western Australia1985Ð1994. Journal of Epidemiology and Community Health 52(11):740Ð4.
Holman CD, Wisniewski ZS, Semmens JB, Rouse IL & Bass AJ 1999. Mortality andprostate cancer risk in 19,598 men after surgery for benign prostatic hyperplasia.British Journal of Urology 84(1):37Ð42.
Jablensky A, McGrath J, Herman H, Castle D, Gureje O, Morgan V & Korten A 1999.National Survey of Mental Health and Wellbeing. Report 4. People living withpsychotic illness: an Australian study. Canberra: AGPS.
NHDC (National Health Data Committee) 1998. National health data dictionary,version 7.0. AIHW Cat. No. HWI 15. Canberra: AIHW.
NHIMAC (National Health Information Management Advisory Council) 1999. Healthonline: a health information action plan for Australia. Canberra: Commonwealth ofAustralia.
Semmens JB, Norman PE, Lawrence-Brown MM, Bass AJ & Holman CD 1998.Population-based record linkage study of the incidence of abdominal aorticaneurysm in Western Australia in 1985Ð1994. British Journal of Surgery 85(5):648Ð52.
01 AH2000 body Page 339 Thursday, June 1, 2000 3:06 PM

340 AustraliaÕs Health 2000
TRIM SIZE 175 mm Wide x 250 mm Deep
8 Changes in Australia’s disease profile: a view of the twentieth century
The twentieth century was a period of great social, economic and scientific developmentin Australia. In health, these developments brought better nutrition and livingconditions from the start of the century, widespread immunisation and improvements inmedical treatment in the second half, and a growing awareness in more recent times ofthe effect of lifestyle and socioeconomic factors on health. Such advances have resultedin death rates that are now less than half what they were in 1900, an improvement in lifeexpectancy at birth of over 20 years, and a dramatic decline in perinatal mortality anddeaths from infectious diseases. But there has also been a greater prominence of thechronic diseases (e.g. cardiovascular diseases and cancer) and the rise and partial fall oftwo epidemics, coronary heart disease and lung cancer.
This chapter examines these and other mortality trends in Australia over the past100 years. Although mortality trends provide a limited picture of AustraliaÕs health,they are one of the few statistical series that were collected with some consistency overthe whole century (AIHW: Taylor 1992). This chapter also highlights some criticalfactors that have influenced patterns of deaths in Australia.
8.1 General trends in health over the twentieth century
Mortality has shown a remarkably consistent decline during the century despite someshort-term impacts of specific diseases (Figure 8.1). This decline has been consistent inboth males and females, although there are differences in the timing and make-up inthe patterns of causes of death. Age-standardised mortality rates declined by 61% inmales and 71% in females between 1907 and 1998 (Knibbs 1909; ABS 1999). This is inline with mortality reductions seen elsewhere in the developed world. The death rate inmales is consistently above that of females.
As expected, these mortality declines are reflected in the substantial increases in lifeexpectancy that have occurred over the century (Figure 8.2, page 342). However, what isnot evident from these declines are the significant changes in the main causes of deathduring the twentieth century. Also, these mortality declines may not have been equallydistributed among all population groups such as the immigrant and Indigenouspopulations. For example, there is presently a substantial difference in life expectancybetween Indigenous and non-Indigenous Australians and death rates are higher for theIndigenous populations for most causes of death. Indeed, the mortality patterns forAustralian Indigenous peoples are strikingly worse than their indigenous counterpartsin Canada, New Zealand and the United States, as shown by their lower lifeexpectancies at birth and higher age- and cause-specific death rates (Hogg 1992). It is
01 AH2000 body Page 340 Thursday, June 1, 2000 3:06 PM
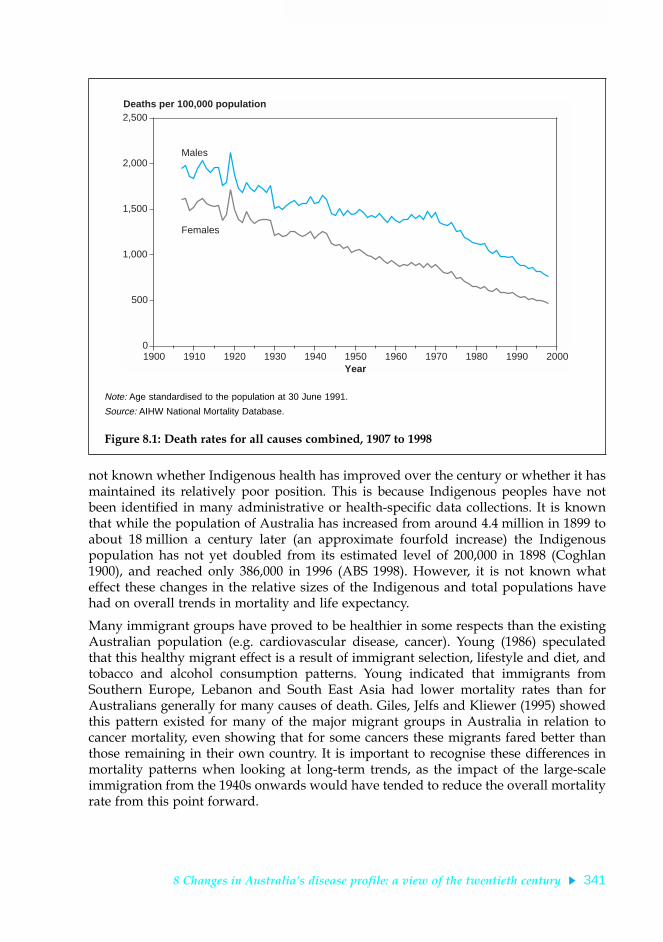
8 Changes in AustraliaÕs disease profile: a view of the twentieth century 341
TRIM SIZE 175 mm Wide x 250 mm Deep
not known whether Indigenous health has improved over the century or whether it hasmaintained its relatively poor position. This is because Indigenous peoples have notbeen identified in many administrative or health-specific data collections. It is knownthat while the population of Australia has increased from around 4.4 million in 1899 toabout 18 million a century later (an approximate fourfold increase) the Indigenouspopulation has not yet doubled from its estimated level of 200,000 in 1898 (Coghlan1900), and reached only 386,000 in 1996 (ABS 1998). However, it is not known whateffect these changes in the relative sizes of the Indigenous and total populations havehad on overall trends in mortality and life expectancy.
Many immigrant groups have proved to be healthier in some respects than the existingAustralian population (e.g. cardiovascular disease, cancer). Young (1986) speculatedthat this healthy migrant effect is a result of immigrant selection, lifestyle and diet, andtobacco and alcohol consumption patterns. Young indicated that immigrants fromSouthern Europe, Lebanon and South East Asia had lower mortality rates than forAustralians generally for many causes of death. Giles, Jelfs and Kliewer (1995) showedthis pattern existed for many of the major migrant groups in Australia in relation tocancer mortality, even showing that for some cancers these migrants fared better thanthose remaining in their own country. It is important to recognise these differences inmortality patterns when looking at long-term trends, as the impact of the large-scaleimmigration from the 1940s onwards would have tended to reduce the overall mortalityrate from this point forward.
Note: Age standardised to the population at 30 June 1991.
Source: AIHW National Mortality Database.
Figure 8.1: Death rates for all causes combined, 1907 to 1998
0
500
1,000
1,500
2,000
2,500
1900 1910 1920 1930 1940 1950 1960 1970 1980 1990 2000
Deaths per 100,000 population
Year
Males
Females
01 AH2000 body Page 341 Thursday, June 1, 2000 3:06 PM

342 AustraliaÕs Health 2000
TRIM SIZE 175 mm Wide x 250 mm Deep
Increased life expectancyFor the overall population, life expectancy at birth rose from 55.2 and 58.8 years at thebeginning of the twentieth century to 75.9 and 81.5 years in the late 1990s for males andfemales respectively (ABS 1999) (Figure 8.2). This rise in life expectancy was relativelyconstant over the century, apart from a plateau during the 1960s that was related to anincrease in deaths from heart disease.
However, in the late 1990s, the life expectancy of Indigenous Australians was estimatedto be 20 years less than the general population, at 56.9 years for males and 61.7 years forfemales (ABS & AIHW 1999). So life expectancies for Indigenous Australians are100 years behind those for non-Indigenous people, and show that the high standard ofhealth achieved by the general population over the last 100 years has not been sharedby all Australians.
Reductions in infant mortalityIncreases in life expectancy are largely related to the substantial decrease in perinataland infant mortality that occurred in the first half of the century (Figure 8.3). Infantmortality rates were very high in the 1880s (130.5 deaths per 1,000 live births in malesand 114.1 in females) but had fallen to nearly half that by 1910Ð20 (Lancaster 1956). Inthe first decade of the twentieth century, 1 in 10 children died before the age of 5, mostfrom infections such as diarrhoeal diseases and enteritis (Cumpston 1989:111).
Source: AIHW unpublished data.
Figure 8.2: Life expectancy at birth, 1905 to 1998
50
55
60
65
70
75
80
85
90
1900 1910 1920 1930 1940 1950 1960 1970 1980 1990 2000
Age
Year
Males
Females
01 AH2000 body Page 342 Thursday, June 1, 2000 3:06 PM

8 Changes in AustraliaÕs disease profile: a view of the twentieth century 343
TRIM SIZE 175 mm Wide x 250 mm Deep
By 1926, the infant mortality rate had been reduced by half and there had been adramatic decline in deaths from gastrointestinal diseases. This followed the introductionof improved sanitation, such as the systematic collection and removal of ÔnightsoilÕ(Cumpston 1989:113). Improvements in the quality of water and milk supplies, anincrease in breast-feeding, better access to education and a decreasing number of birthsper woman were also likely to have played a part in the dramatic declines in childdeaths through better infant health and increased resistance to infection (Gandevia 1978).Infant mortality continued to decrease after the 1940s with the introduction of antibioticsand improved perinatal care, and reached a low of between 5 and 7 deaths per 1,000 livebirths in the late 1990s (AIHW 1998). Few infants (other than Indigenous infants) nowdie from infection or from conditions in the perinatal period such as low birthweight orbirth trauma. Congenital anomalies, sudden infant death syndrome (SIDS) and accidentshave become the leading causes of death in young children (AIHW 1998). Indigenousinfant mortality was around 18 per 1,000 live births at the end of the twentieth century(ABS & AIHW 1999).
Reductions in maternal mortalityAs well as improvements in infant mortality, there has been a dramatic decline inmortality rates for women during childbirth in Australia. Childbirth was responsible forthe death of around 6 women in every 1,000 live births (Cumpston 1989:138) in 1900.ÔPuerperal feverÕ, a condition now known as post-partum infection, was responsible forabout one-third of these deaths. In the 1920s and 1930s, doctors attributed maternaldeath rates partly to the poor standards of obstetric care practised by some of their
Source: AIHW unpublished data.
Figure 8.3: Trends in infant mortality, 1901 to 1998
0
20
40
60
80
100
120
1900 1910 1920 1930 1940 1950 1960 1970 1980 1990 2000
Deaths per 1,000 live births
Year
01 AH2000 body Page 343 Thursday, June 1, 2000 3:06 PM

344 AustraliaÕs Health 2000
TRIM SIZE 175 mm Wide x 250 mm Deep
peers, especially the use of unnecessary caesarean sections (Hughes 1939). Maternaldeath rates remained relatively high until a dramatic decline in 1937, when antibacterialdrugs became available (Taylor et al. 1998). Improved nutrition, better general health,the advent of medical interventions such as antiseptic procedures, a decrease inpregnancies (from contraception and family planning), use of blood transfusions andthe professional training of those attending births have all contributed to a sustaineddecrease in deaths of women following childbirth (Weil & Fernandez 1999). By the late1990s, maternal mortality in Australia was rare and it remains among the lowest in theworld. In the early 1990s, maternal mortality was 10.9 per 100,000 confinements(NHMRC 1998), around 2% of the rate in 1900.
The transition from infectious to chronic diseaseAs in many other developed nations, Australia has experienced a Ôhealth transitionÕ frominfectious to chronic diseases, with influenza and tuberculosis being replaced bycirculatory (cardiovascular) diseases and cancer as the major causes of death (Beaglehole& Bonita 1997:6) (Figure 8.4). More specifically, there was a decrease in death rates frominfectious diseases, particularly from the early 1900s, and an increase in coronary heartdisease, stroke and lung cancer from the 1920s and 1930s.
Note: Age standardised to the population at 30 June 1991.
Source: AIHW National Mortality Database.
Figure 8.4: Death rates by major causes, 1907 to 1998
0
100
200
300
400
500
600
700
1900 1910 1920 1930 1940 1950 1960 1970 1980 1990 2000
Deaths per 100,000 population
Year
Infectious diseases
Respiratory diseases
Circulatory diseases
Injury
Cancer
01 AH2000 body Page 344 Thursday, June 1, 2000 3:06 PM

8 Changes in AustraliaÕs disease profile: a view of the twentieth century 345
TRIM SIZE 175 mm Wide x 250 mm Deep
Better nutrition and public health measures such as improved sanitation and housingmade a major contribution to the decrease in deaths from infectious diseases. Lifestylefactors such as changes in diet and smoking are considered responsible for the increase(and partly for the subsequent decline) in deaths from circulatory diseases and somecancers, and the increasing number of motor vehicles led to an increase in transport-related deaths.
Since the late 1960s, death rates from cardiovascular causes (in particular heart attack andstroke) have declined steadily and more recently there has been a slight rise in death ratesfrom infectious disease in males. The reduction in cardiovascular death rates is related tothe success of prevention strategies and better treatment of cardiovascular conditions. Therise in infectious disease death rates, although slight in Australia, has been seen aroundthe world with the emergence of infections such as the human immunodeficiency virus(HIV) and hepatitis C. This has led to speculation that a further transition in the diseaseprofile of Western countries may occur (Beaglehole & Bonita 1997:7).
8.2 Trends in the major causes of death in Australia
The following sections describe trends in the major causes of death for Australians overthe twentieth century. The disease categories are defined by the InternationalClassification of Diseases and include infectious diseases, cardiovascular disease(circulatory system diseases), cancer (malignant neoplasms), respiratory diseases, anddeaths from external causes (injury and poisoning). Interpreting trends in deathstatistics poses some difficulties as international definitions, classification frameworksand diagnoses of disease have changed over time (AIHW: Taylor 1992; Taylor et al.1998). In the early 1900s, causes of death were classified initially using a system devisedby Dr William Farr, and then according to the Bertillon Index. The InternationalClassification of Diseases, version 2 (ICD-2) was used in Australia from 1918, and ICD-10 was introduced in 1999. Because of the different classifications used, the followingsections focus on broad trends in the data.
Infectious diseasesInfectious diseases were the main cause of death in Australia in the first 100 years afterEuropean settlement. Dysentery, scurvy and typhus were the major infections, butepidemics of smallpox, cholera, tuberculosis and other infections were also common(Sax 1984:15). Children bore the brunt of infectious diseases as did the Indigenouspopulations who, having not encountered these diseases before, had no resistance tothem and suffered very high death rates (Gordon 1976:182).
In the early 1800s, infectious diseases were of enormous public and political concernaround the industrialised world, and governments in many countries were called uponto enact public health measures to reduce their spread. At the time, it was thought thatinfections were the result of ÔmiasmasÕ or foul vapours that arose from decaying matter,and sanitation was seen as an important way of arresting the spread of disease (Davis &George 1988:166). During the late 1800s, a range of public health measures wasintroduced in Australia including publicly financed water and sewerage schemes,improved sanitation and better housing to reduce overcrowding (Davis & George
01 AH2000 body Page 345 Thursday, June 1, 2000 3:06 PM

346 AustraliaÕs Health 2000
TRIM SIZE 175 mm Wide x 250 mm Deep
1988:167). These measures were largely responsible for the decreases in infectiousdiseases that were already under way at the beginning of the twentieth century(Cumpston 1989:114).
Despite declines, infectious diseases remained a major cause of death in the early 1900s(Figure 8.5) with tuberculosis and venereal diseases being the most common(Sax 1984:16). Public health legislation had been enacted across Australia but wasbeginning to extend beyond sanitation to the compulsory notification of infectious casesand the isolation of infected individuals. In 1900, for example, when bubonic plaguearrived in Sydney, officials isolated infected individuals in the quarantine station at NorthHead, closed their dwellings and coated their possessions in lime (Hickman 2000). AnAustralian researcher, Ashburton Thompson, established the connection between rats,fleas and the spread of the plague (and was the first in the world to do so) and publichealth inspectors were despatched to find and destroy rats and their breeding grounds(Hickman 2000). Despite a public outcry about the plague and its effects, only 463 peopledied from the disease in Australia between 1900 and 1909 (Cumpston 1978). This smallnumber was undoubtedly due to the timely action of public health officials. The plagueoutbreak was the trigger for the first Commonwealth action in quarantine.
Note: Age standardised to the population at 30 June 1991.
Source: AIHW National Mortality Database.
Figure 8.5: Death rates from infectious and parasitic diseases, 1907 to 1998
0
50
100
150
200
250
300
1900 1910 1920 1930 1940 1950 1960 1970 1980 1990 2000
Deaths per 100,000 population
Year
Males
Females
01 AH2000 body Page 346 Thursday, June 1, 2000 3:06 PM

8 Changes in AustraliaÕs disease profile: a view of the twentieth century 347
TRIM SIZE 175 mm Wide x 250 mm Deep
Influenza, although classified as a respiratory condition, has been responsible for alarge numbers of deaths over the twentieth century, none more significant than the 1919pandemic (see Figure 8.11, page 358). In that year approximately 12,000 Australiansdied, making influenza the most common cause of death, exceeding the number ofdeaths attributed to circulatory disease (Cumpston 1989). This outbreak was alsoresponsible for the deaths of approximately 20 million people worldwide. A smaller butsignificant influenza outbreak also occurred in 1907Ð1908 and was responsible foraround 700 deaths in each of those years, compared with an expected 200Ð300 deaths.
There was a steady decline in deaths from infectious diseases over the century(Figure 8.5). Mass vaccination occurred from the 1930s for diphtheria, from the 1950s forpertussis (whooping cough), tetanus and poliomyelitis (for which no cases have beenreported since 1978), and from the 1960s for measles (Hall 1993). Widespreadimmunisation continued in the 1980s and 1990s, as other vaccines became available, andhas been the focus of recent public health campaigns as immunisation levels have fallen.Some declines have also been attributed to the introduction of antibiotics from 1937onwards, the anti-tuberculosis campaign, and to continued improvements inenvironmental health and socioeconomic conditions (Taylor et al. 1998).
During the 1970s and 1980s a number of viral infections including hepatitis B, hepatitis Cand the human papilloma virus were newly described, although it is likely that thesediseases existed before this but had not been recognised. Viral conditions were largelyuntreatable and became a significant concern, especially with the emergence of HIV inthe early 1980s. Acquired immunodeficiency syndrome (AIDS) (caused by HIV) has nowled to the deaths of 13.9 million people worldwide and is among the top four causes ofdeath globally (WHO 2000). The effect on overall life expectancy in many countries hasbeen dramatic. In Australia, the epidemic has been controlled by relatively rapid publichealth interventions, and, although over 6,000 people have died in Australia from AIDS,the epidemic appears to have been slowing since 1994 (WHO 2000). Further informationis contained in section 2.5 (page 112). Safe-sex and safe-injecting campaigns, bloodsupply regulation, infection-control guidelines and the introduction of new treatmentshave all contributed to the control of mortality from AIDS in this country.
In Australia, a combination of improved living conditions and access to readilyavailable treatments over the twentieth century has resulted in many infectious diseasesbecoming comparatively rare (the 1998 death rate from infectious diseases was less than1% of that in the 1930s). However, the levels of infectious diseases remain relativelyhigh in the Indigenous populations. Diarrhoeal infections and infections that result inpre-term birth are still major problems for some Indigenous communities, reflected intheir higher infant mortality rates (ABS & AIHW 1999).
Cardiovascular diseasesAnother striking trend in mortality in Australia in the first half of the twentieth centurywas the significant increase in death rates from circulatory system diseases, followed byan even greater fall beginning in the late 1960s (Figure 8.6). The main conditionscontributing to this pattern were heart attack and stroke.
01 AH2000 body Page 347 Thursday, June 1, 2000 3:06 PM

348 AustraliaÕs Health 2000
TRIM SIZE 175 mm Wide x 250 mm Deep
The evolution of the epidemic of cardiovascular disease was paralleled by a rapidincrease in the understanding of how the heart functions and of the contribution of riskfactors to heart disease. It was also a time of significant development in methods todiagnose and treat heart and other circulatory problems. The application of thisknowledge ultimately resulted in a decline in cardiovascular death rates.
In the first years of the twentieth century, cardiovascular disease was alreadyrecognised as a significant contributor to the mortality of Australians. It was the fourthmost common cause of death in Australia after pneumonia, tuberculosis, and diarrhoealdisease, and it was much more common than cancer (Cumpston 1989:133). In 1916, theCommonwealth Departmental Committee on Invalidity and Mortality, concerned atpossible declines in the Australian population and its health status, recognised the risksof Ômiddle ageÕ thus:
It is commonly said that a man is as old as his arteries É about the age of 40, slow changesbegin, which tend to make the coats more rigid É But at the age of 40 É when these quietchanges in the main arteries should be slowly beginning É more serious evil often sets inÉ more rapid in evolution É the whole circulation is in a condition of strain. The personsaffected think themselves robust É But they often die suddenly É Men suffer in this wayfar more than women, but even women are affected in large numbers. What are the causesof this disastrous series of changes which cut off thousands of people in their fullmaturity?
Note: Age standardised to the population at 30 June 1991.
Source: AIHW National Mortality Database.
Figure 8.6: Death rates from circulatory system diseases, 1907 to 1998
0
100
200
300
400
500
600
700
800
900
1900 1910 1920 1930 1940 1950 1960 1970 1980 1990 2000
Deaths per 100,000 population
Year
Males
Females
01 AH2000 body Page 348 Thursday, June 1, 2000 3:06 PM

8 Changes in AustraliaÕs disease profile: a view of the twentieth century 349
TRIM SIZE 175 mm Wide x 250 mm Deep
In the early 1900s, knowledge of the heart was limited to an understanding of itsanatomy, and relatively little was known about how it worked. There was only arudimentary appreciation of the relationship between the heart and other importantfacets of the circulation such as blood pressure, and the function of the heart as anÔelectrically driven pumpÕ within the body was largely unknown. The introduction of aportable instrument, the sphygmomanometer, and the interpretation of the sounds heardvia the stethoscope, enabled doctors to measure blood pressure for the first time, andthis became part of a routine physical examination. However, there were no effectiveremedies for the treatment of elevated blood pressure once it had been diagnosed. Therecognition of disturbances in heart rhythm had developed as a clinical skill, but it wasdifficult for doctors to predict which rhythms were harmful, and treatments were largelyunavailable, other than bed rest and the use of digitalis (derived from the foxgloveflower) which had been available since Roman times (Porter 1997).
By 1910, circulatory system disease had become the most common cause of death inAustralia and, except for a brief period following the great influenza epidemic in 1919,it has remained the leading cause of death. Over the first half of the century, thepercentage of deaths due to cardiovascular disease increased substantially in all agegroups and in both sexes, and by mid-century the disease accounted for more than halfof all deaths, not only in Australia but also in most of the industrialised world(Braunwald 1997). The link between heart disease and infections such as rheumaticfever and syphilis was well known, and by 1950 antibiotics were available to treat theseconditions, thereby preventing their cardiac consequences for the first time. However,the major causes of death from heart diseaseÑsudden death and heart attackÑwerestill unexplained and continuing to rise. Lancaster (1990) observed that part of thisincrease could be explained by better cause-of-death coding, with ill-defined causes ofdeath falling to near zero as the epidemic gathered momentum.
During the first half of the twentieth century, changes in death rates from heart diseaseoccurred in Western countries, with rises tending to follow increasing prosperity.Increasing rates were noted, for example, in the United States among affluent men whosmoked (Keys et al. 1963), but in postwar Europe, cardiovascular disease ratesdecreased sharply in the wake of reduced food supplies. Changes in incidence ratesseemed to reflect powerful socioeconomic and behavioural influences in newly richcountries operating with a relatively short incubation period for the disease, perhaps asshort as a decade (Rose 1989).
In 1941, new X-ray techniques allowed doctors to view the pumping action of the heart(and, later, the health of the coronary arteries) using radio-opaque dye introducedthrough a fine tube inserted into an arm or groin blood vessel in a conscious person(cardiac catheterisation).
With improved diagnosis, attention was directed at treatment. In 1945 Blalockattempted surgical repair in a child with congenital heart disease, and this led to thedevelopment of open-heart surgery within a decade, providing some relief for thosewith congenital heart disease, disease of the heart valves and other conditions. In themid-1950s, the invention of the heartÐlung bypass machine (the pump-oxygenator),taking over the function of the heart and lungs outside the body, allowed surgeonsenough time to undertake more complicated procedures.
01 AH2000 body Page 349 Thursday, June 1, 2000 3:06 PM

350 AustraliaÕs Health 2000
TRIM SIZE 175 mm Wide x 250 mm Deep
From 1967 onwards, surgical techniques were used in Australia to bypass obstructionsin the coronary arteries and so relieve the debilitating pain suffered by those withcoronary artery disease. This operation, coronary artery bypass grafting, became one ofthe most frequently performed surgical procedures around the world (Mueller et al.1997). Initially undertaken to relieve symptoms, it was also found to decrease mortality(Julian 1989). Other interventions followed including the use of specific drugs and anti-clotting agents. In-hospital care improved through the setting up of coronary care unitswith specifically trained nursing staff and intensive monitoring of patients. Otheradvances, including drugs and devices for correcting abnormal heart rhythm(pacemakers and defibrillators) and better training of emergency services personnel,also assisted survival in those with established coronary heart disease.
Attention was increasingly focused on the social and lifestyle factors that contribute tothe development of cardiovascular disease in the healthy population. From thisemerged the concept of risk factors for coronary heart disease and stroke. In 1961,results were published from a research project in the United States, the FraminghamHeart Study, which became one of the cornerstones of cardiac epidemiology (Kannelet al. 1961). High blood pressure, smoking, elevated cholesterol in the blood and dietaryfactors (especially dietary saturated fat and salt) were identified as major contributorsto the epidemic of cardiovascular disease. The importance of other factors such associoeconomic status, obesity and physical inactivity was acknowledged (NHLBI 1994)as well as the significance of social, cultural and environmental factors.
Mortality rates from coronary heart disease increased dramatically after World War II,peaked in Australia in 1968 and then decreased substantially by over 60% among malesand females (AIHW & HFA 1999) (Figure 8.7). Death rates for stroke remained constantthrough the 1950s and 1960s and have fallen by more than two-thirds since 1968(Figure 8.7). These improvements are considerable, particularly as mortality from non-cardiovascular diseases decreased by about 20% only (AIHW & HFA 1999). The declinein coronary heart disease occurred in all age groups and for both sexes, with greaterdeclines in the younger age groups and a greater rate of decrease for males than forfemales (Beaglehole et al. 1989). This implied that broadly operating effects such asmarket-led dietary change were responsible, more so than individual efforts to alterlifestyle, and that those changes acted with only a short lag period (Rose 1989). Onesuggested factor in Australia was the change in the balance and types of fats in thenational diet (Hetzel & McMichael 1987).
Mortality rates from coronary heart disease in Australia declined by about 25% over the1970s but the greatest declines were experienced by the professional occupations,whereas lower socioeconomic groups had higher mortality rates at the beginning of theperiod and experienced smaller declines. From a national survey in 1980, lower risklevels of blood pressure, cigarette smoking, body weight and exercise were significantlyand consistently found among higher status occupation groups. This suggested thatthere was a pattern of coronary prevention behaviour spanning multiple risk factorsthat was associated with a reduction in coronary heart disease (Dobson et al. 1985).
01 AH2000 body Page 350 Thursday, June 1, 2000 3:06 PM

8 Changes in AustraliaÕs disease profile: a view of the twentieth century 351
TRIM SIZE 175 mm Wide x 250 mm Deep
The relative contributions of alterations in lifestyle and changed levels of risk factors inthe population, and of medical interventions to declines in mortality rates forcardiovascular disease is still being assessed. The most important advances in medicalcare for coronary heart disease and stroke may well have occurred after the beginningof the decline in mortality (Hetzel & McMichael 1987). Recent Australian research hasfound a decline in rates of coronary heart disease events as well as deaths, consistentwith reductions in risk-factor levels and improved acute medical treatment for theperiod 1985 to 1993 (Dobson et al. 1999).
Although a significant proportion of cardiovascular disease is preventable, the prevalenceof risk factors, such as tobacco smoking, high blood pressure, physical inactivity and poornutrition, that are amenable to change still remains high in the Australian population. Ithas been estimated that 80% of all adult Australians have one modifiable cardiovascularrisk factor and 10% have three or more such factors (Tonkin et al. 1999).
In Indigenous people, death rates from cardiovascular disease are about twice those ofnon-Indigenous people. Among Indigenous Australians living in the Northern Territorythe occurrence of rheumatic heart disease is the highest recorded in the world; theannual incidence of its precursor, acute rheumatic fever, for the years 1989 to 1993 wasbetween two and seven cases for every 1,000 children aged 5Ð14 years. In contrast, notone non-Indigenous child suffered rheumatic fever over the same period (Carapetis &Currie 1998).
Note: Age standardised to the population at 30 June 1991.
Source: AIHW National Mortality Database.
Figure 8.7: Death rates from cardiovascular causes, 1950 to 1998
0
50
100
150
200
250
300
350
400
450
500
1950 1955 1960 1965 1970 1975 1980 1985 1990 1995 2000
Deaths per 100,000 population
Year
Males—coronary heart disease
Males—stroke
Females—coronary heart disease
Females—stroke
01 AH2000 body Page 351 Thursday, June 1, 2000 3:06 PM

352 AustraliaÕs Health 2000
TRIM SIZE 175 mm Wide x 250 mm Deep
CancerOver the twentieth century, there has been an increase in the proportion of deaths inAustralia due to cancer. At the beginning of the century, cancer was the fifth leadingcause of death among Australians after deaths from infectious diseases, cardiovasculardisease, respiratory disease and injury (Cumpston 1989:133). Since then, cancer deathrates have increased as a proportion of all-cause mortality, and cancer is now secondonly to cardiovascular disease as a major cause of death (AIHW 1998). Both theincidence and mortality of cancer are higher among males than among females, andthere is also significant geographical and socioeconomic variation in cancer mortalitywithin the Australian population (Armstrong 1985).
Trends in cancer mortality are difficult to interpret because there are many differenttypes of cancer, each having different causes and some more amenable to treatmentthan others. Identifying carcinogens (cancer-causing agents) has been controversial, butit is now generally accepted that over 75% of cancers are associated with exposure toenvironmental factors that interact with an individualÕs genetic make-up (Carroquinoet al. 1998). There is also a lag time of many years between contact with carcinogens andthe emergence of disease which makes it difficult to identify all the factors which mayhave influenced the trends in death rates for cancer.
Over the century, public health turned its attention to environmental factors such astobacco smoke, alcohol, air pollution, some industrial processes, manufacturedproducts, sun exposure, certain viruses and diet in order to understand theirrelationship with cancer. Although some of these factors have proven amenable topublic health control measures, others have proved more difficult. Changes indiagnosis, treatment and classification of cancers have also contributed to variations inmortality patterns, particularly for certain types of cancer (Armstrong 1985).
The overall increases in mortality from cancer over the twentieth century reflectchanges in the age distribution of the population (due to increased life expectancy,postwar baby booms and significant immigration) and in exposure to variouscarcinogens, particularly tobacco.
Analyses of trends in death rates over the century (Figure 8.8) have indicated thatoverall cancer death rates among females increased between 1907 and 1920, plateaueduntil approximately 1942, then declined through to the 1960s. Female cancer death rateswere stable in the 1960s and 1970s before increasing slightly in the 1980s through to themid-1990s. In males, there was an increase in cancer death rates during the period1907Ð30 and then a significant increase after 1945, largely the result of a substantial risein lung cancer (Armstrong 1985).
Tobacco consumption is by far the largest contributor to the increase in total cancerdeaths in the twentieth century, having its greatest effect on lung and oral cancers. Bythe 1950s, Australia was in the grip of a smoking epidemic with 92 different types ofcigarettes on the market (Office of Prices, Victoria 1990). A rise in lung cancer deathsfollowed as a direct result of increased tobacco consumption (Giles, Hill & Silver 1991).Smoking rates have declined substantially in males over the last several decades(AIHW 1996) and male deaths from lung cancer have subsequently declined since the1970s (Figure 8.9, page 354). Smoking rates in females were much lower than in males
01 AH2000 body Page 352 Thursday, June 1, 2000 3:06 PM

8 Changes in AustraliaÕs disease profile: a view of the twentieth century 353
TRIM SIZE 175 mm Wide x 250 mm Deep
until recent times, and consequently females have lower lung cancer rates. The declinein smoking in females was less than in males and began much later. Due to the timelagof about 20 years between exposure to carcinogens in tobacco smoke and the diagnosisof cancer, lung cancer rates in females are expected to increase in the early 2000s.Further information on trends in tobacco smoking can be found in section 3.4, page 148.
At the end of the twentieth century, tobacco smoking continued to be by far the mostimportant cause of cancer of the lung and is estimated to be responsible forapproximately 80% of lung cancer and 20% of all cancer deaths (English et al. 1995).Reductions in the lung cancer death rate in the 1980s and 1990s was influenced bychanges in prices of tobacco products, decreases in tar content, tobacco advertisingreforms, and behavioural changes, resulting in smoking cessation (Giles, Hill & Silver1991). However, although there have been overall reductions in smoking by Australiansover the last three decades, the gap in smoking prevalence between groups is widening;individuals of higher socioeconomic status are more likely to avoid smoking, whereasthose who are socioeconomically disadvantaged continue to smoke at higher rates (Hillet al. 1998).
Note: Age standardised to the population at 30 June 1991.
Source: AIHW National Mortality Database.
Figure 8.8: Trends in death rates from all cancers in Australia, 1907 to 1998
100
120
140
160
180
200
220
240
260
1900 1910 1920 1930 1940 1950 1960 1970 1980 1990 2000
Deaths per 100,000 population
Year
Males
Females
01 AH2000 body Page 353 Thursday, June 1, 2000 3:06 PM

354 AustraliaÕs Health 2000
TRIM SIZE 175 mm Wide x 250 mm Deep
Occupational exposures, including exposure to asbestos, are estimated to be responsiblefor 15% of lung cancers in males and air pollution is perhaps responsible for 5% of allcases of lung cancer (Giles et al. 1988). Asbestos was used widely throughout Australiaby the 1950s and could be found in most homes, cars and workplaces. A substantialmining industry also existed, exposing thousands of workers to large doses of asbestosdust. In 1955, it was demonstrated that asbestos caused lung cancer.
In women, breast cancer is currently the major cause of cancer deaths (AIHW 1998) withdeaths from colorectal (bowel) cancer and lung cancer in second and third placesrespectively. Breast cancer mortality rose steadily from the early decades of the twentiethcentury to peak in the early 1940s, decreased to the 1960s and 1970s before rising againin the late 1980s (Smith et al. 1998). It is thought that the increase to the mid-1940s wascaused mainly by rapidly falling fertility in the late nineteenth century and the earlytwentieth century. The increase in mortality of women born in the first 30 years of thetwentieth century is probably related to larger body size due to changes in nutritionresulting in an earlier age of menarche and, therefore, greater oestrogen exposure (Smithet al. 1998). Subsequent increases in fertility and earlier diagnosis may have contributedto the fall in mortality between the 1940s and early 1960s. However, it is also likely thatimprovements in survival have resulted from earlier detection through screening andnewer medical treatments for breast cancer (Hermon & Beral 1996).
Note: Death rates are age standardised to the population at 30 June 1991.
Source: ABS Yearbooks, various years; AIHW National Mortality Database.
Figure 8.9: Per capita consumption of tobacco products in Australia and death rates for lung cancer, 1903 to 1998
0
0.5
1
1.5
2
2.5
3
0
10
20
30
40
50
60
70
80
1900 1910 1920 1930 1940 1950 1960 1970 1980 1990 2000
Kilograms consumed Deaths per 100,000 population
Year
Tobacco consumption Male lung cancer
Female lung cancer
01 AH2000 body Page 354 Thursday, June 1, 2000 3:06 PM

8 Changes in AustraliaÕs disease profile: a view of the twentieth century 355
TRIM SIZE 175 mm Wide x 250 mm Deep
Alcohol consumption has been associated with cancers of the upper gastrointestinaltract and the liver and there is some evidence of changes in alcohol consumptionparalleling a trend in death rates from these cancers (Armstrong 1985). Sun exposure isthe main cause of skin cancers, and malignant melanoma of the skin is more common inAustralia than anywhere else in the world. Increases in deaths from other types ofcancer have been associated with a variety of carcinogens in the Australianenvironment. During the twentieth century, an array of potentially carcinogenicsubstances emerged as new industries and products were developed. These includedradiation, pesticides, mining dusts, benzene (in petrol, paints and printing inks),chemicals used in the production of plastics and pharmaceuticals, and environmentalpollutants. The contribution of many of these substances to the trends in cancermortality remains to be measured.
Not all cancers have shown an increase in death rates. Mortality rates for cancers of thestomach, cervix, bowel (in females) and testes have all shown significant declines in theadult population. Mortality rates in children have fallen substantially for leukaemia andcancers of the brain and nervous system, due to an improvement in survival rates.
Patterns of exposure to risk factors differ according to occupation, socioeconomicgroupings such as education and income, sex, race and ethnicity, and geographicallocation, and some of these patterns have changed over the twentieth century. In general,there is evidence of an inverse socioeconomic gradient for cancer mortality among bothmales and females in Australia (Glover et al. 1999). The persisting socioeconomicdifferences in cancer mortality at the end of the twentieth century are a reminder thatthere is much in the social environment that contributes to malignant disease.
InjuryOver the twentieth century, although the contribution of injury to overall deaths inAustralia has remained relatively stable at around 6Ð7% of all deaths, there has been asteady decline in death rates from this cause (AIHW 1998). Injury rates have beenconsistently higher in males than in females in all categories for the entire period(AIHW: dÕEspaignet et al. 1991) and there have been some substantial changes withinthe injury categories (Figure 8.10, page 356). Most change has occurred in the accidentaldeath category with the emergence of motor vehicle accident deaths offset by a largedecrease in deaths from all other accidental causes (AIHW NISU 1999). Thecontributions made by both suicide and homicide have remained relatively stable. Inthe 1990s, injury was the fourth leading cause of death in Australia and is a major causeof premature death.
Accidental deathsAccidental deaths were relatively common in the early part of the twentieth centurywith drowning, burns, falls, work-related injuries and accidents with horses the mostsignificant contributors to mortality rates (Gordon 1976:217). Deaths from accidentshave always tended to have a greater impact on the younger age groups. In 1925,deaths from external causes were the leading cause of death (26%) for those aged 15 to24 years (Cumpston 1989:132). This pattern still applies today, particularly to deathsfrom motor vehicle accidents. Drowning also remains a significant cause of injurydeaths for children aged 1 to 4 years, many of whom drown in swimming pools.
01 AH2000 body Page 355 Thursday, June 1, 2000 3:06 PM
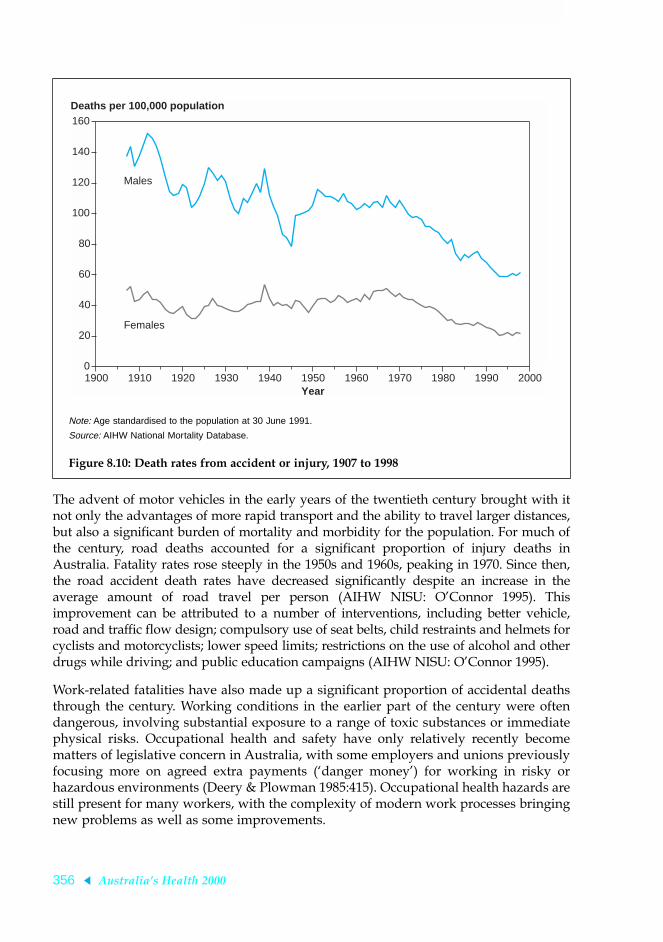
356 AustraliaÕs Health 2000
TRIM SIZE 175 mm Wide x 250 mm Deep
The advent of motor vehicles in the early years of the twentieth century brought with itnot only the advantages of more rapid transport and the ability to travel larger distances,but also a significant burden of mortality and morbidity for the population. For much ofthe century, road deaths accounted for a significant proportion of injury deaths inAustralia. Fatality rates rose steeply in the 1950s and 1960s, peaking in 1970. Since then,the road accident death rates have decreased significantly despite an increase in theaverage amount of road travel per person (AIHW NISU: OÕConnor 1995). Thisimprovement can be attributed to a number of interventions, including better vehicle,road and traffic flow design; compulsory use of seat belts, child restraints and helmets forcyclists and motorcyclists; lower speed limits; restrictions on the use of alcohol and otherdrugs while driving; and public education campaigns (AIHW NISU: OÕConnor 1995).
Work-related fatalities have also made up a significant proportion of accidental deathsthrough the century. Working conditions in the earlier part of the century were oftendangerous, involving substantial exposure to a range of toxic substances or immediatephysical risks. Occupational health and safety have only relatively recently becomematters of legislative concern in Australia, with some employers and unions previouslyfocusing more on agreed extra payments (Ôdanger moneyÕ) for working in risky orhazardous environments (Deery & Plowman 1985:415). Occupational health hazards arestill present for many workers, with the complexity of modern work processes bringingnew problems as well as some improvements.
Note: Age standardised to the population at 30 June 1991.
Source: AIHW National Mortality Database.
Figure 8.10: Death rates from accident or injury, 1907 to 1998
0
20
40
60
80
100
120
140
160
1900 1910 1920 1930 1940 1950 1960 1970 1980 1990 2000
Deaths per 100,000 population
Year
Males
Females
01 AH2000 body Page 356 Thursday, June 1, 2000 3:06 PM

8 Changes in AustraliaÕs disease profile: a view of the twentieth century 357
TRIM SIZE 175 mm Wide x 250 mm Deep
SuicideAn analysis of trends in suicide over the past 100 years shows that the overall suiciderate has remained relatively stable, fluctuating within a range between about10Ð14 deaths per 100,000 population (DHAC 1998). The highest rates were recordedduring the Depression of the 1930s, and in the 1960s and into the 1990s (Hassan 1996).The higher rates in the 1960s are likely to be related to the availability of medicationssuch as barbiturates that were then restricted in subsequent years (Oliver & Hetzel 1972).
However, this relative stability hides some significant internal differences in the rates ofsuicide of males and females in Australian society. The most striking feature over thelast 100 years is the change that has occurred in the age groups affected. Until the mid-1960s, suicide was a problem mainly among the older age groups but since then therehas been a dramatic shift to the young. This increase in the suicide rate for the youngerage groups has been largely offset by significant reductions in suicide in middle-agedand older Australians (Goldney & Harrison 1998).
Suicide rates for males are significantly greater than those for females. The rate ofsuicide among males aged 15Ð29 years has been increasing gradually over the last30 years, although this upward trend may be levelling off (Glover et al. 1999). The rateof suicide among males aged 15Ð24 years has trebled since 1960. There has been noequivalent rise in the rate of suicide among young females. However, there is evidenceto suggest a higher rate of attempted suicide among females than males, particularly forwomen under the age of 25 years (Ruzicka & Choi 1999; AIHW: Moon et al. 1999).
There is some evidence that risks for suicide increase significantly with decreasingsocioeconomic status in males, but this is not the case in females. It has been noted thatthe fluctuations in male suicide rates over the century have coincided with periods ofhigh unemployment, whereas the rates for females have remained fairly stable at thosetimes (Morrell et al. 1993). Studies of the recent increase in suicides among the younghave suggested a number of contributing factors, including unemployment, changingfamily structure, increasing violence and loss of autonomy (Hassan 1996). Suicide arisesfrom a complex interaction of psychological, social and environmental factors. Socialissues are important and there are also substantial data indicating the presence ofpsychiatric illness in the majority of those who commit suicide (Goldney 1993).Prevention efforts are now focusing on earlier detection of symptoms of illness and arange of other interventions.
Deaths from interpersonal violenceDeath rates from interpersonal violence have remained fairly constant during thetwentieth century and homicide remains a rare event relative to other forms of violentdeath in Australia, such as suicide and road traffic accidents (James & Carcach 1997).Between 1915 and 1997, the average homicide rate per year was 1.6 per 100,000population (AIC 1999). The present rates of homicide are similar to those prevailingfrom 1915 to 1925 (James & Carcach 1997). The homicide rate in Australia fell during theperiod between 1930 and 1950 but then increased to a plateau of about 1.5 per 100,000population in the 1960s and 1970s. An upward trend then once again became apparent,reaching a level of around 2.0 per 100,000 population in the late 1980s and 1990s (James& Carcach 1997). The lowest homicide rate this century was recorded in 1941, 0.8 per100,000 population (AIC 1999).
01 AH2000 body Page 357 Thursday, June 1, 2000 3:06 PM

358 AustraliaÕs Health 2000
TRIM SIZE 175 mm Wide x 250 mm Deep
Respiratory diseasesThe death rate from respiratory diseases has decreased significantly over the twentiethcentury (Figure 8.11) to a rate now less than half of that in the early decades (AIHW1998). The dramatic spike in death rates from respiratory disease in 1919Ð20 reflects theinfluenza pandemic. In 1921, the death rate from respiratory disease was 207 per100,000 population. By 1941, the rate had fallen to 104 per 100,000 population. Between1950 and 1996, the standardised death rate for diseases of the respiratory system fell formales from 107 to 61 per 100,000 and for females from 63 to 38 per 100,000 population(AIHW 1998). The causes of these respiratory deaths have also altered over the century.For example, the contribution of occupational exposure to substances that causerespiratory disease is thought to have decreased in importance. Early in the twentiethcentury, mining activity was responsible for various lung diseases and became thesubject of government inquiries and trade union action, leading to major reformsthroughout mining and related industries (Cumpston 1989:166). In contrast, tobaccosmoking increased steadily throughout the century (with the exception of a fall in1931Ð32) with substantial reductions in tobacco consumption occurring only since the1970s. Pollution has also been associated with deaths from respiratory disease (Gileset al. 1988), and it is likely that levels of different pollutants have been significantcontributors to deaths from respiratory disease over the twentieth century.
Note: Age standardised to the population at 30 June 1991.
Source: AIHW National Mortality Database.
Figure 8.11: Death rates from respiratory diseases, 1907 to 1998
0
50
100
150
200
250
300
350
400
450
500
1900 1910 1920 1930 1940 1950 1960 1970 1980 1990 2000
Deaths per 100,000 population
Year
Males
Females
01 AH2000 body Page 358 Thursday, June 1, 2000 3:06 PM

8 Changes in AustraliaÕs disease profile: a view of the twentieth century 359
TRIM SIZE 175 mm Wide x 250 mm Deep
Chronic obstructive pulmonary disease is the fourth leading cause of death in Australia(AIHW 1998). There was a marked increase in death rates for this condition in thepostwar years with the death rate from chronic bronchitis in males doubling between1950 and 1964 (Gordon 1976:222). This upward trend, like the rise in lung cancer, wasassociated with increased tobacco consumption over the century. Male age-standardised death rates for chronic obstructive pulmonary disease increased 160%between 1964 and 1970, followed by a decline (Crockett et al. 1994). By 1990, the deathrate was 5% less than in 1964. Female age-standardised mortality, on the other hand,showed a 260% increase from 1964 to 1990 (Crockett et al. 1994). These trends inmortality from chronic obstructive pulmonary disease for males and females reflectsignificant differences in their smoking habits over time (Hill et al. 1998).
Deaths from pneumonia have fallen markedly with the availability of antibiotics in the1940s. However, an even greater fall occurred in the three decades before this, probablyas a result of improvements in living conditions (Gordon 1976:233). The proportion ofdeaths from pneumonia dropped from 47% of all male deaths from diseases of therespiratory system in 1950 to 14% in 1986, and a similar trend occurred for females.Death from pneumonia is now seen mainly in people at the extremes of the lifespan andin those whose immunity is impaired. However, death from pneumonia is stillrelatively frequent among Indigenous peoples.
Rates of death from asthma have risen in Australia, as they have worldwide from themiddle of the century onwards (Meza & Gershwin 1997), although asthma is still arelatively infrequent cause of death. Asthma is a disease that is exacerbated by a widerange of factors including infection, allergens, tobacco smoke and some environmentalpollutants (Landrigan et al. 1998). Early Australian studies found that the mortality ratefor asthma remained stable between 1900 and 1948. There was then an upward trendwith some peaking of death rates in the 1960s (AIH 1988). The evidence for an upwardtrend in asthma deaths since the late 1940s appears to be real, despite changes inclassifications and differences in medical treatments (Bauman & Lee 1990). Death ratesfor asthma peaked again in 1989 but have since declined. This may be partly due topublic health campaigns aimed at improving the awareness and management of thedisease (AIHW: Abraham et al. 1995).
ConclusionThe decline in mortality over the twentieth century in Australia has been dramatic.Growth in income, increased educational levels and consequent improvements in foodintake, water quality and sanitation have accounted for much of the decline. Access tonew knowledge, medical treatments and vaccines has also been important. There havebeen far-reaching consequences for every aspect of life: populations have aged, fertilityrates have decreased and better health has, in turn, contributed to social and economicwellbeing. This has led to a major shift in causes of death from infectious diseases tonon-communicable diseases.
As the twenty-first century unfolds, there will be a number of challenges. Ironically, oneof these challenges results from the success of the twentieth centuryÑas a consequenceof ageing and the effects of an affluent lifestyle, epidemics of non-communicablediseases may persist, driving the demand for health resources for some years to come.There is also the possibility of an emergence of new infectious diseases and the
01 AH2000 body Page 359 Thursday, June 1, 2000 3:06 PM

360 AustraliaÕs Health 2000
TRIM SIZE 175 mm Wide x 250 mm Deep
re-emergence of others. Finally, not everyone has shared equally in the benefits of betterhealth over the last 100 years. In the year 2000, although life expectancy for mostAustralians has increased significantly, that of Indigenous peoples is at levels not seenin the rest of the population since 1900. Large inequalities in death rates from manycauses also persist for disadvantaged populations in Australia, in spite of the long list ofachievements in health during the twentieth century. Reducing the inequalities will alsobe a priority for the twenty-first century.
ReferencesABS 1998. Experimental estimates of the Aboriginal and Torres Strait Islander
population. ABS Cat. No. 3230.0. Canberra: ABS.
ABS 1999. Deaths, Australia 1998. ABS Cat. No. 3302.0. Canberra: ABS.
ABS & AIHW 1999. The health and welfare of AustraliaÕs Aboriginal and Torres StraitIslander peoples 1999. ABS Cat. No. 4704.0. AIHW Cat. No. IHW 3. Canberra: ABS.
AIC (Australian Institute of Criminology) 1999. Australian crimeÑfacts and figures1999. Canberra: AIC.
AIH (Australian Institute of Health) 1988. AustraliaÕs health. Canberra: AGPS.
AIHW 1996. Tobacco use and its health impact in Australia. AIHW Cat. No. CVD 1.Canberra: AIHW.
AIHW 1998. AustraliaÕs health 1998: the sixth biennial health report of the AustralianInstitute of Health and Welfare. Canberra: AIHW.
AIHW 1999. Cancer in Australia: incidence and mortality data for 1996 and selecteddata for 1997 and 1998. AIHW Cat. No. CAN 7. Canberra: AIHW.
AIHW NISU 1999. Australian Injury Prevention Bulletin. Issue 20. Adelaide: AIHWNISU.
AIHW & HFA (Heart Foundation of Australia) 1999. Heart, stroke and vascular disease:Australian facts 1999. AIHW Cat. No. CVD 7. Cardiovascular Disease Series No. 10.Canberra: AIHW.
AIHW: Abraham B, dÕEspaignet ET & Stevenson C 1995. Australian health trends, 1995.Canberra: AIHW.
AIHW: dÕEspaignet ET, van Ommeren M, Taylor F, Briscoe N & Pentony P 1991. Trendsin Australian mortality 1921Ð1988. Mortality Series No. 1. Canberra: AGPS.
AIHW: Moon L, Meyer P & Grau J 1999. AustraliaÕs young people: their health andwellbeing 1999. AIHW Cat. No. PHE 19. Canberra: AIHW.
AIHW NISU: OÕConnor PJ 1995. Road injury in Australia 1991. Adelaide: AIHW NISU.
AIHW: Taylor F 1992. Guide to use of international classifications of diseases inAustralia. Classification in Health Series No. 1. Canberra: AGPS.
Armstrong BK 1985. Epidemiology of cancer in Australia. Medical Journal of Australia142:124Ð30.
01 AH2000 body Page 360 Thursday, June 1, 2000 3:06 PM

8 Changes in AustraliaÕs disease profile: a view of the twentieth century 361
TRIM SIZE 175 mm Wide x 250 mm Deep
Bauman A & Lee S 1990. Trends in asthma mortality in Australia, 1911Ð1986. MedicalJournal of Australia 153:366Ð7.
Beaglehole R & Bonita R 1997. Public health at the crossroads: achievements andprospects. Cambridge: Cambridge University Press.
Beaglehole R, Dobson A, Hobbs MST, Jadeson R & Martin CA 1989. CHD in Australiaand New Zealand. International Journal of Epidemiology 18(3 Suppl. 1):S145Ð8.
Braunwald E 1997. The Shattuck lectureÑcardiovascular medicine at the turn of themillennium: triumphs, concerns, and opportunities. New England Journal ofMedicine 337(19):1360Ð9.
Carapetis JR & Currie BJ 1998. Preventing rheumatic heart disease in Australia. MedicalJournal of Australia 168:428Ð9.
Carroquino MJ, Galson SK, Licht J, Amler RW et al. 1998. The U.S. EPA Conference onpreventable causes of cancer in children: a research agenda. Environmental HealthPerspectives 106(Suppl. 3):867Ð73.
Coghlan TA 1900. A statistical account of the seven colonies of Australasia, 1899Ð1900.Sydney: William Applegate Gullick, Government Printer.
Crockett AJ, Cranston JM, Moss JR & Alpers JH 1994. Trends in chronic obstructivepulmonary disease mortality in Australia. Medical Journal of Australia 161:600Ð3.
Cumpston JHL 1978. The health of the people. Canberra: Roebuck.
Cumpston JHL 1989. Health and disease in Australia: a history (Lewis ML ed.).Canberra: AGPS.
Davis A & George J 1988. States of healthÑhealth and illness in Australia. Sydney:Harper & Row Publishers.
Deery S & Plowman D 1985. Australian industrial relations. 2nd ed. Sydney:McGraw-Hill.
DHAC 1998. Youth suicide in Australia, a background monograph, 2nd ed. Canberra:DHAC.
Dobson AJ, Gibberd RW, Leeder SR & OÕConnell DL 1985. Occupational differences inischaemic heart disease mortality and risk factors in Australia. American Journal ofEpidemiology 122(2):283Ð90.
Dobson AJ, McElduff P, Heller R, Alexander H, Colley P & DÕEste K 1999. Changingpatterns of coronary heart disease in the Hunter region of New South Wales,Australia. Journal of Clinical Epidemiology 52(8):761Ð71.
English DR, Holman CDJ, Milne E, Winter MG, Hulse GK, Cudde JP et al. 1995. Thequantification of drug caused morbidity and mortality in Australia 1995. Canberra:DHSH.
Gandevia B 1978. Tears often shedÑchild health and welfare in Australia from 1788.Sydney: Charter Books.
Giles G, Hill DJ & Silver B 1991. The lung cancer epidemic in Australia 1910 to 1989.Australian Journal of Public Health 15:245Ð7.
01 AH2000 body Page 361 Thursday, June 1, 2000 3:06 PM

362 AustraliaÕs Health 2000
TRIM SIZE 175 mm Wide x 250 mm Deep
Giles G, Jelfs P & Kliewer E 1995. Cancer mortality in migrants to Australia 1979Ð1988.Cancer Series No. 4. Canberra: AGPS.
Giles G, Jolley D, Lecatsas S & Handsjuk H 1988. Atlas of cancer in Victoria. Melbourne:Anti-Cancer Council of Victoria.
Glover J, Harris K & Tennant S 1999. A social health atlas of Australia, volume 1:Australia, 2nd ed. Department of Health and Aged Care. Adelaide: OpenbookPublishers.
Goldney R & Harrison J 1998. Suicide in the elderly: some good news. AustralasianJournal on Ageing 17(2):54Ð5.
Goldney RD 1993. Suicide in the young. Journal of Paediatrics & Child Health 29(Suppl. 1):S50Ð2.
Gordon D 1976. Health, sickness and society. Theoretical concepts in social andpreventive medicine. Brisbane: University of Queensland Press.
Hall R 1993. Notifiable diseases surveillance, 1917 to 1991. Communicable DiseasesIntelligence 17(11):226Ð36.
Hassan R 1996. Social factors in suicide in Australia. Trends and Issues in Crime andCriminal Justice No. 52. Canberra: Australian Institute of Criminology.
Hermon C & Beral V 1996. Breast cancer mortality rates are levelling off or beginning todecline in many western countries. British Journal of Cancer 73(7):955Ð60.
Hetzel BS & McMichael A 1987. The LS factor: lifestyle and health. Maryborough, Vic.:Penguin Books, 87Ð91.
Hickman B 2000. Terror of the black death. The Australian, 19 January, 11.
Hill DJ, White VM & Scollo MM 1998. Smoking behaviours of Australian adults in 1995:trends and concerns. Medical Journal of Australia 168:209Ð13.
Hogg RS 1992. Indigenous mortality: placing Australian aboriginal mortality within abroader context. Social Science & Medicine 35(3):335Ð46.
Hughes TD 1939. Excessive use of caesarean section rates. Medical Journal of AustraliaII:947Ð8; cited in Cumpston 1989.
James M & Carcach C 1997. Homicide in Australia 1989Ð96. Research and Public PolicySeries No. 13. Canberra: Australian Institute of Criminology.
Julian D 1989. Treatment of chronic coronary heart disease. International Journal ofEpidemiology 18(3 Suppl. 1):S228Ð30.
Kannel WB, Dawber TR, Kagan A, Revotskie N & Stokes J 1961. Factors of risk in thedevelopment of coronary heart disease: the Framingham Study. Annals of InternalMedicine 55:33Ð50.
Keys A, Taylor HL, Blackburn H, Brozek J, Andreson JT & Simonson E 1963. Coronaryheart disease among Minnesota business and professional men followed 15 years.Circulation 28:381Ð95.
01 AH2000 body Page 362 Thursday, June 1, 2000 3:06 PM

8 Changes in AustraliaÕs disease profile: a view of the twentieth century 363
TRIM SIZE 175 mm Wide x 250 mm Deep
Knibbs GH 1909. Official Year Book of the Commonwealth of Australia, containingauthorative statistics for the period 1901Ð1908 and corrected statisitcs for the period1788 to 1900. Melbourne: Commonwealth Bureau of Census and Statistics.
Kosky R 1987. Is suicide behaviour increasing among Australian youth? MedicalJournal of Australia 147(4):164Ð6.
Lancaster HO 1956. Infant mortality in Australia. Medical Journal of Australia 2:100Ð8.
Lancaster HO 1990. Expectations of life: a study in the demography statistics, andhistory of world mortality. New York: Springer-Verlag.
Landrigan PJ, Carlson JE, Bearer CF, Spyker Cranmer J, Bullard RD et al. 1998.ChildrenÕs health and the environment: a new agenda for prevention research.Environmental Health Perspectives 106(Suppl. 3):787Ð94.
Meza C & Gershwin ME 1997. Why is asthma becoming more of a problem? CurrentOpinion In Pulmonary Medicine 3(1):6Ð9.
Morrell S, Taylor R, Quine S & Kerr C 1993. Suicide and unemployment in Australia,1970Ð1990. Social Science and Medicine 36:749Ð56.
Mueller RL, Rosengart TK & Isom OW 1997. The history of surgery for ischemic heartdisease. Annals of Thoracic Surgery 63(3):869Ð78.
NHLBI (National Heart, Lung and Blood Institute) 1994. Report of the task force onresearch in epidemiology and prevention of cardiovascular diseases. Rockville,Maryland: US National Institutes of Health.
NHMRC 1998. Report on maternal deaths in Australia 1991Ð1993. Canberra: NHMRC.
Office of Prices, Victoria 1990. Does smoking make cents? An Australian economicstudy of the relationship between cigarette pricing, consumption and health costs.Melbourne: VicHealth.
Oliver RG & Hetzel BS 1972. Rise and fall of suicide rates in Australia: relation tosedative availability. Medical Journal of Australia 2(17):919Ð23.
Porter R 1997. The greatest benefit to mankind: a medical history of humanity fromantiquity to the present. London: Harper Collins Publishers.
Rose G 1989. Causes of the trends and variations in CHD mortality in differentcountries. International Journal of Epidemiology 18(3 Suppl 1):S174Ð9.
Ruzicka L & Choi CY 1999. Youth suicide in Australia. Journal of the AustralianPopulation Association 16:29Ð46.
Sax S 1984. A strife of interests: politics and policies in Australian health services.Sydney: Allen & Unwin, 3Ð28.
Smith CL, Kricker A & Armstrong BK 1998. Breast cancer mortality trends in Australia:1921 to 1994. Medical Journal of Australia 168:11Ð14.
Taylor R, Lewis M & Powles J 1998. The Australian mortality decline: all-causemortality 1788Ð1990. Australian and New Zealand Journal of Public Health22(1):27Ð36.
01 AH2000 body Page 363 Thursday, June 1, 2000 3:06 PM
364 AustraliaÕs Health 2000
TRIM SIZE 175 mm Wide x 250 mm Deep
Tonkin A, Bauman AE, Bennett S, Dobson AJ, Hankey GJ & Ring IT 1999.Cardiovascular health in Australia: current state and future directions. The AsiaPacific Heart Journal 8(3):183Ð7.
Weil O & Fernandez H 1999. Is safe motherhood an orphan initiative? Lancet 354:940Ð3.
WHO 2000. Communicable disease surveillance and response. Geneva: WHO [citedMarch 2000] Available from Internet: URL: http://www.who.int/emc/diseases/hiv/index.html
Young C 1986. Selection and survival: immigrant mortality in Australia. Department ofImmigration and Ethnic Affairs. Canberra: AGPS.
01 AH2000 body Page 364 Thursday, June 1, 2000 3:06 PM

Statistical tables 365
TRIM SIZE 175 mm Wide x 250 mm Deep
Statistical tables
1.1 PopulationTable S1: Estimated resident population by sex and age group, selected years, 1901 to 1999 (number)
Age group 1901 1921 1941 1961 1981 1991 1999 (a)
Males
0–4 172,957 307,300 299,900 573,700 583,218 652,302 653,209
5–14 450,067 570,800 575,300 1,056,600 1,321,340 1,290,729 1,357,900
15–24 366,146 457,900 627,900 776,100 1,320,618 1,405,897 1,378,722
25–34 320,455 451,800 593,900 728,000 1,244,663 1,416,512 1,447,687
35–44 279,558 369,500 496,000 737,900 931,360 1,319,366 1,460,891
45–54 156,674 281,300 432,400 627,800 772,879 960,260 1,277,628
55–64 99,170 208,400 307,600 427,800 661,984 734,081 845,044
65–74 64,716 90,900 173,100 266,300 426,174 548,636 621,531
75–84 18,731 29,300 70,900 102,300 158,247 243,406 323,697
85+ 2,207 4,700 7,500 15,800 27,784 44,220 74,189
All ages 1,977,928 2,771,900 3,584,500 5,312,300 7,448,267 8,615,409 9,440,498
Females
0–4 168,836 296,300 288,700 546,400 556,400 619,401 619,341
5–14 441,003 557,300 556,000 1,008,300 1,264,582 1,223,098 1,291,639
15–24 365,792 462,800 614,900 729,300 1,278,293 1,354,941 1,316,396
25–34 293,424 458,400 573,300 664,400 1,212,261 1,408,886 1,444,118
35–44 216,135 353,200 471,900 706,100 891,517 1,303,292 1,466,414
45–54 118,574 257,400 436,400 595,700 737,394 915,819 1,256,014
55–64 80,302 179,300 307,600 435,500 691,752 728,737 829,803
65–74 48,935 82,000 186,400 333,100 511,502 633,509 675,403
75–84 14,757 31,000 79,700 149,200 256,487 370,917 460,358
85+ 2,038 5,500 10,500 27,900 74,805 110,027 166,804
All ages 1,795,873 2,683,200 3,525,400 5,195,900 7,474,993 8,668,627 9,526,290
(a) Preliminary data.
Note: Population estimates are for 30 June of each year.
Sources: Commonwealth Statistician 1925; ABS Cat. No. 3201.0; AIHW National Population Database.
02 AH2000 stat tables Page 365 Thursday, June 1, 2000 2:18 PM

366 AustraliaÕs Health 2000
TRIM SIZE 175 mm Wide x 250 mm Deep
Fertility and pregnancyTable S2: Age-specific birth rates(a) and total fertility rates(b), 1921 to 1998 (live births per 1,000 females)
Age group of mother (years) Totalfertility
rateLess
than 20 20–24 25–29 30–34 35–39 40–4445 and
over
Annual averages
1921–1925 27.3 133.7 167.0 137.0 96.9 40.4 4.2 3,032
1941–1945 23.9 126.9 152.8 114.3 66.3 21.1 1.7 2,535
1961–1965 46.5 204.0 207.2 122.4 59.2 17.5 1.2 3,289
1981–1985 25.7 100.8 144.5 82.0 25.4 4.4 0.3 1,915
1991–1995 21.2 71.6 128.3 104.2 39.3 6.4 0.3 1,857
Annual rates
1996 20.1 65.2 117.1 105.7 43.7 7.5 0.3 1,797
1997 19.5 62.3 113.8 106.7 44.9 7.5 0.3 1,775
1998 18.5 60.0 111.2 107.2 45.7 8.0 0.3 1,755
(a) Age-specific birth rates are the live births registered during the calendar year, according to age of mother, per 1,000 of the female resident population of the same age as estimated for 30 June.
(b) Total fertility rate is obtained by summing the 5-year age-specific birth rates and multiplying by 5. It represents the number of children 1,000 women would bear during their lifetimes if they experienced the rates of the year shown.
Sources: ABS 1977; ABS Cat. No. 3301.0.
Table S3: Age-specific birth rates(a) and total fertility rates(b), States and Territories, 1998 (live births per 1,000 females)
State/ Territory
Age group of mother (years) Totalfertility
rateLess
than 20 20–24 25–29 30–34 35–39 40–4445 and
over
NSW 18.5 63.3 113.4 107.6 46.8 8.7 0.3 1,793
Vic 12.4 46.9 104.7 113.2 49.4 8.3 0.3 1,676
Qld 23.3 70.2 115.0 101.9 40.8 6.7 0.3 1,791
WA 20.9 61.1 113.5 105.5 44.0 7.3 0.4 1,764
SA 15.3 55.1 109.4 107.1 44.8 8.6 0.4 1,704
Tas 24.2 75.9 121.2 96.7 37.4 6.1 0.4 1,810
ACT 11.9 40.2 100.3 102.9 46.9 8.6 0.2 1,555
NT 68.7 105.0 118.7 93.6 44.9 7.6 0.7 2,196
Australia 18.5 60.0 111.2 107.2 45.7 8.0 0.3 1,755
(a) Age-specific birth rates are the live births registered during the calendar year, according to age of mother, per 1,000 of the female resident population of the same age as estimated for 30 June.
(b) Total fertility rate is obtained by summing the 5-year age-specific birth rates and multiplying by 5. It represents the number of children 1,000 women would bear during their lifetimes if they experienced the rates of the year shown.
Source: ABS 1999a.
02 AH2000 stat tables Page 366 Thursday, June 1, 2000 2:18 PM

Statistical tables 367
TRIM SIZE 175 mm Wide x 250 mm Deep
Table S4: Total fertility rates(a), crude birth rates(b) and male:female birth ratio, selected countries (latest available year)
Country
Total fertility rate Crude birth rate M:F birth ratio
Year Rate Year Rate Year ratio
Australia 1998 1,755 1998 13.3 1998 1.05
Australia 1996 1,797 1997 13.6 1996 1.06Canada 1995 1,638 1997 12.1 1995 1.05
China 1990–95 1,918 1995–2000 16.2 1994 1.12
Denmark 1995 1,807 1997 12.8 1995 1.06
France 1996 1,721 1996 12.6 1994 1.05
Germany 1996 1,316 1997 9.6 1996 1.06
Greece 1995 1,319 1996 9.7 1995 1.08
Ireland 1996 1,879 1997 14.3 1996 1.09
Israel 1995 2,881 1996 21.3 1995 1.05
Italy 1995 1,187 1997 9.4 1995 1.06
Japan 1996 1,425 1997 9.5 1996 1.06
Korea, Republic of 1995 1,658 1995 15.6 1995 1.13
Malaysia 1990–95 3,620 1997 25.8 1996 1.06
Netherlands 1996 1,529 1997 12.3 1996 1.06
New Zealand 1994 2,040 1997 15.4 1993 1.07
Norway 1996 1,889 1997 13.6 1996 1.07
Philippines 1994 3,522 1995–2000 28.4 1993 1.09
Poland 1996 1,580 1997 10.7 1996 1.06
Russian Federation 1995 1,344 1995 9.2 1995 1.06
Singapore 1997 1,637 1997 12.7 1997 1.08
Spain 1995 1,170 1996 9.0 1995 1.06
Sweden 1996 1,606 1997 10.1 1996 1.04
Switzerland 1996 1,500 1997 11.2 1996 1.06
United Kingdom 1996 1,725 1996 12.5 1996 1.05
United States 1995 2,019 1996 14.8 1994 1.05
(a) Total fertility rate is obtained by summing the 5-year age-specific birth rates and multiplying by 5. It represents the number of children 1,000 women would bear during their lifetimes if they experienced the rates of the year shown.
(b) Live births per 1,000 mid-year population.
Sources: UN 1999; WHO 1998; ABS 1999a.
02 AH2000 stat tables Page 367 Thursday, June 1, 2000 2:18 PM

368 AustraliaÕs Health 2000
TRIM SIZE 175 mm Wide x 250 mm Deep
Table S5: Birthweight distribution of total births(a), States and Territories, 1997
Births/birthweight NSW Vic Qld WA SA Tas ACT NT Australia
Births (Number)
Less than 2,500 g 5,414 4,056 3,310 1,675 1,307 320 360 358 16,800
All births 88,133 62,307 48,038 25,253 18,674 5,447 4,785 3,561 256,198
Birthweight (g) (Per cent)
Less than 500 0.2 0.3 0.3 0.3 0.4 0.4 0.2 0.4 0.3
500 to 999 0.5 0.5 0.6 0.5 0.6 0.4 0.7 0.7 0.5
1,000 to 1,499 0.5 0.6 0.7 0.7 0.7 0.5 1.1 0.8 0.6
1,500 to 1,999 1.2 1.2 1.4 1.3 1.3 1.1 1.5 2.0 1.3
2,000 to 2,499 3.8 3.8 3.9 3.9 4.1 3.5 4.0 6.3 3.9
Less than 2,500 6.1 6.5 6.9 6.6 7.0 5.9 7.5 10.2 6.6
2,500 to 2,999 15.3 15.5 14.6 16.3 14.7 13.4 13.4 18.2 15.2
3,000 to 3,499 36.2 36.3 35.6 36.4 35.5 33.3 35.1 35.5 36.0
3,500 to 3,999 30.6 30.2 30.7 30.0 31.0 33.9 32.0 27.1 30.5
4,000 to 4,499 10.0 9.7 10.4 9.3 10.0 11.3 10.0 7.6 9.9
4,500+ 1.7 1.8 1.8 1.4 1.8 2.2 1.9 1.3 1.7
(a) Includes live births and foetal deaths (stillbirths) with known birthweight. Totals include births with unstated birthweights.
Source: AIHW NPSU 1999.
Table S6: Infant mortality rates, States and Territories, selected years, 1901 to 1998 (per 1,000 live births)
Year NSW Vic Qld WA SA Tas ACT NT Australia
1901 103.7 102.9 101.9 128.9 100.1 89.0 (a) 62.5 103.6
1921 62.6 72.5 54.2 78.3 65.5 78.0 74.1 63.3 65.7
1941 43.8 36.2 39.1 35.3 32.5 49.0 16.4 83.3 39.7
1961 20.8 17.8 20.0 19.7 20.0 16.8 15.6 23.9 19.5
1981 10.2 9.3 10.4 8.9 8.0 12.3 8.9 23.5 10.0
1991 7.2 6.5 7.6 7.2 5.5 9.0 7.6 14.2 7.1
1992 7.4 5.6 7.9 7.0 6.1 6.6 6.3 15.5 7.0
1993 6.2 5.4 7.0 5.9 5.2 5.9 4.3 15.3 6.1
1994 6.3 5.1 6.2 5.6 4.7 7.5 4.7 11.3 5.9
1995 5.7 4.9 6.3 5.1 5.8 5.8 4.8 13.3 5.7
1996 5.8 5.0 6.4 6.5 4.9 4.5 5.7 11.5 5.8
1997 5.2 4.9 5.8 5.3 4.7 6.5 3.8 12.5 5.3
1998 4.3 4.7 6.4 5.0 4.0 5.7 6.0 12.4 5.0
(a) Part of New South Wales prior to 1911.
Source: ABS Cat. No. 3101.0.
02 AH2000 stat tables Page 368 Thursday, June 1, 2000 2:18 PM
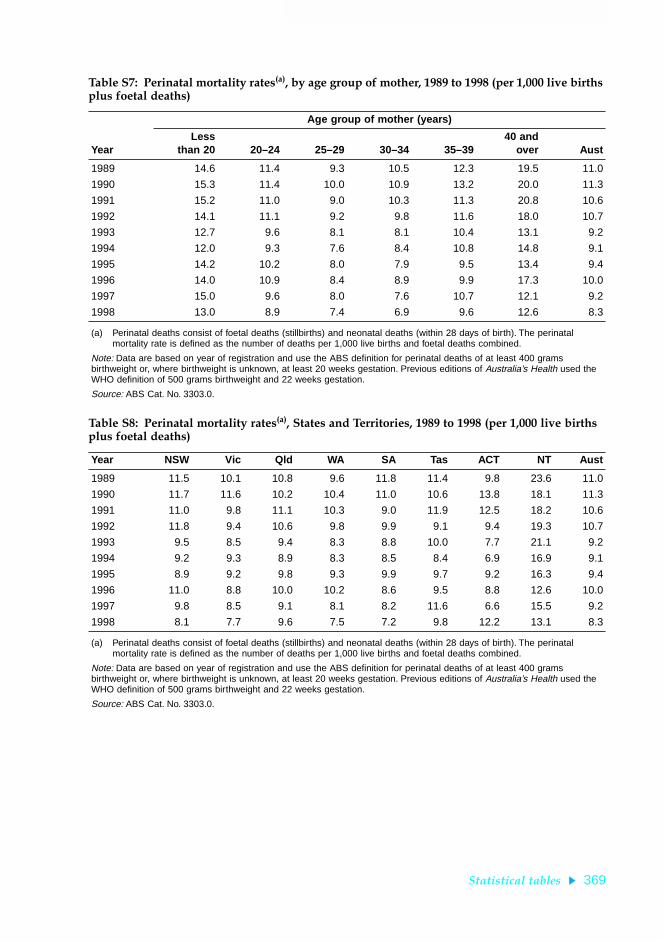
Statistical tables 369
TRIM SIZE 175 mm Wide x 250 mm Deep
Table S7: Perinatal mortality rates(a), by age group of mother, 1989 to 1998 (per 1,000 live births plus foetal deaths)
Year
Age group of mother (years)
Lessthan 20 20–24 25–29 30–34 35–39
40 andover Aust
1989 14.6 11.4 9.3 10.5 12.3 19.5 11.0
1990 15.3 11.4 10.0 10.9 13.2 20.0 11.3
1991 15.2 11.0 9.0 10.3 11.3 20.8 10.6
1992 14.1 11.1 9.2 9.8 11.6 18.0 10.7
1993 12.7 9.6 8.1 8.1 10.4 13.1 9.2
1994 12.0 9.3 7.6 8.4 10.8 14.8 9.1
1995 14.2 10.2 8.0 7.9 9.5 13.4 9.4
1996 14.0 10.9 8.4 8.9 9.9 17.3 10.0
1997 15.0 9.6 8.0 7.6 10.7 12.1 9.2
1998 13.0 8.9 7.4 6.9 9.6 12.6 8.3
(a) Perinatal deaths consist of foetal deaths (stillbirths) and neonatal deaths (within 28 days of birth). The perinatal mortality rate is defined as the number of deaths per 1,000 live births and foetal deaths combined.
Note: Data are based on year of registration and use the ABS definition for perinatal deaths of at least 400 grams birthweight or, where birthweight is unknown, at least 20 weeks gestation. Previous editions of Australia’s Health used the WHO definition of 500 grams birthweight and 22 weeks gestation.
Source: ABS Cat. No. 3303.0.
Table S8: Perinatal mortality rates(a), States and Territories, 1989 to 1998 (per 1,000 live births plus foetal deaths)
Year NSW Vic Qld WA SA Tas ACT NT Aust
1989 11.5 10.1 10.8 9.6 11.8 11.4 9.8 23.6 11.0
1990 11.7 11.6 10.2 10.4 11.0 10.6 13.8 18.1 11.3
1991 11.0 9.8 11.1 10.3 9.0 11.9 12.5 18.2 10.6
1992 11.8 9.4 10.6 9.8 9.9 9.1 9.4 19.3 10.7
1993 9.5 8.5 9.4 8.3 8.8 10.0 7.7 21.1 9.2
1994 9.2 9.3 8.9 8.3 8.5 8.4 6.9 16.9 9.1
1995 8.9 9.2 9.8 9.3 9.9 9.7 9.2 16.3 9.4
1996 11.0 8.8 10.0 10.2 8.6 9.5 8.8 12.6 10.0
1997 9.8 8.5 9.1 8.1 8.2 11.6 6.6 15.5 9.2
1998 8.1 7.7 9.6 7.5 7.2 9.8 12.2 13.1 8.3
(a) Perinatal deaths consist of foetal deaths (stillbirths) and neonatal deaths (within 28 days of birth). The perinatal mortality rate is defined as the number of deaths per 1,000 live births and foetal deaths combined.
Note: Data are based on year of registration and use the ABS definition for perinatal deaths of at least 400 grams birthweight or, where birthweight is unknown, at least 20 weeks gestation. Previous editions of Australia’s Health used the WHO definition of 500 grams birthweight and 22 weeks gestation.
Source: ABS Cat. No. 3303.0.
02 AH2000 stat tables Page 369 Thursday, June 1, 2000 2:18 PM

370 AustraliaÕs Health 2000
TRIM SIZE 175 mm Wide x 250 mm Deep
Table S9: Neonatal, postneonatal and infant mortality rates(a), selected countries (latest available year) (per 1,000 live births)
Males Females
NeonatalPost-
neonatal Infant NeonatalPost-
neonatal Infant
Australia (1998) 3.7 1.8 5.5 3.0 1.5 4.5
Australia (1996) 4.2 2.3 6.5 3.4 1.6 5.0Canada (1995) 4.5 2.2 6.7 3.8 1.7 5.5
China—rural (1994) n.a. n.a. 22.8 n.a. n.a. 22.2
China—urban (1994) n.a. n.a. 14.0 n.a. n.a. 12.1
Denmark (1995) 4.1 1.5 5.6 3.4 1.1 4.5
France (1995) 3.2 2.2 5.4 2.6 1.7 4.3
Germany (1996) 3.4 2.2 5.6 2.7 1.7 4.4
Greece (1995) 6.4 2.6 9.0 5.2 2.1 7.3
Ireland (1996) 4.3 1.6 5.9 3.5 1.6 5.1
Israel (1995) 5.1 2.4 7.5 4.0 2.2 6.2
Italy (1994) 5.3 1.9 7.2 4.3 1.5 5.8
Japan (1996) 2.2 1.9 4.1 1.8 1.6 3.4
Korea, Republic of (1995) n.a. n.a. 2.9 n.a. n.a. 2.4
Malaysia (1996) 6.7 3.3 10.0 5.3 2.8 8.1
Netherlands (1996) 4.6 1.7 6.3 3.8 1.3 5.1
New Zealand (1993) 3.8 3.9 7.7 3.6 3.1 6.7
Norway (1996) 2.8 1.7 4.5 2.2 1.4 3.6
Philippines (1993) 11.3 11.7 23.0 8.6 9.4 18.0
Poland (1996) 9.9 3.5 13.4 7.8 3.1 10.9
Russian Federation (1995) 12.8 7.9 20.7 9.1 6.5 15.6
Singapore (1996) 2.4 1.4 3.8 2.2 1.5 3.6
Spain (1995) 3.9 2.0 5.9 3.2 1.9 5.1
Sweden (1996) 2.5 1.7 4.2 2.5 1.2 3.7
Switzerland (1996) 3.7 1.6 5.3 2.8 1.2 4.0
United Kingdom (1996) 4.5 2.3 6.8 3.6 1.8 5.3
United States (1995) 5.3 3.0 8.3 4.4 2.4 6.8
(a) Neonatal: less than 28 days. Postneonatal: 28 to 364 days. Infant: less than 1 year.
Sources: ABS 1999b; UN 1999.
02 AH2000 stat tables Page 370 Thursday, June 1, 2000 2:18 PM

Statistical tables 371
TRIM SIZE 175 mm Wide x 250 mm Deep
Mortality
Table S10: Life expectancy at selected ages by sex, 1901 to 1996Ð98 (years)
Year
At birth At age 15 At age 65
Males Females Males Females Males Females
Annual averages
1901–10 55.2 58.8 49.0 51.9 11.3 12.9
1920–22 59.2 63.3 51.4 54.6 12.0 13.6
1946–48 66.1 70.6 54.3 58.3 12.3 14.4
1960–62 67.9 74.2 55.1 61.0 12.5 15.7
1980–82 71.2 78.3 57.4 64.3 13.8 18.0
Annual rates
1990 73.9 80.1 59.8 65.8 15.2 19.0
1991 74.4 80.4 60.2 66.0 15.4 19.1
1992 74.5 80.4 60.3 66.1 15.4 19.2
1993 75.0 80.9 60.8 66.5 15.7 19.5
1994 75.0 80.9 60.8 67.0 15.7 19.7
1994–96(a) 75.2 81.1 60.9 66.7 15.8 19.6
1995–97(a) 75.6 81.3 61.3 66.9 16.1 19.8
1996–98(a) 75.9 81.5 61.5 67.1 16.3 20.0
(a) The methodology used to calculate this table has changed since 1995. Data on population and deaths averaged over 3 years are now used to minimise year-to-year statistical variations.
Sources: ABS Cat. No. 3302.0; ABS unpublished data.
Table S11: Life expectancy at selected ages by sex, States and Territories, 1996Ð98 (years)
State/Territory
At birth At age 15 At age 65
Males Females Males Females Males Females
New South Wales 75.8 81.6 61.4 67.1 16.3 20.0
Victoria 76.3 81.7 61.9 67.2 16.4 20.0
Queensland 75.6 81.5 61.4 67.2 16.5 20.2
Western Australia 76.1 81.9 61.8 67.4 16.6 20.3
South Australia 76.0 81.6 61.6 67.1 16.3 20.0
Tasmania 75.1 80.4 60.9 66.0 15.7 19.3
Australian Capital Territory 77.5 81.6 63.0 67.2 17.1 20.0
Northern Territory 70.6 75.0 56.8 61.2 15.0 16.9
Australia 75.9 81.5 61.5 67.1 16.3 20.0
Note: The methodology used to calculate this table has changed since 1995. Data on population and deaths averaged over 3 years are now used to minimise year-to-year statistical variations.
Sources: ABS Cat. No. 3302.0; ABS unpublished data.
02 AH2000 stat tables Page 371 Thursday, June 1, 2000 2:18 PM

372 AustraliaÕs Health 2000
TRIM SIZE 175 mm Wide x 250 mm Deep
Table S12: Life expectancy at selected ages, selected countries, latest year (years)
Country/year
At birth At age 15 At age 65
Males Females Males Females Males Females
Australia (1996–98) 75.9 81.5 61.5 67.1 16.3 20.0
Australia (1995–97) 75.6 81.3 61.3 66.9 16.1 19.8Canada (1995) 75.2 81.2 61.0 66.9 16.1 20.1
China (1990) 66.9 70.5 55.4 59.2 12.2 14.7
Denmark (1995) 72.8 77.9 58.5 63.4 14.1 17.6
France (1995) 73.9 81.9 59.5 67.4 16.1 20.6
Germany (1995) 73.3 79.8 58.9 65.4 14.7 18.6
Greece (1995) 75.0 80.2 60.9 66.0 16.1 18.4
Ireland (1993) 72.5 78.1 58.3 63.7 13.4 17.0
Israel (1995) 75.3 79.3 61.1 65.0 15.8 17.8
Italy (1994) 74.3 80.7 60.1 66.4 15.4 19.2
Japan (1996) 77.0 83.6 62.6 69.1 16.9 21.5
Korea, Republic of (1991) 67.7 75.7 53.9 61.9 12.3 16.1
Malaysia (1996) 69.3 74.1 55.7 60.2 12.7 14.7
Netherlands (1995) 74.6 80.4 60.3 66.0 14.7 19.1
New Zealand (1992–94) 73.4 79.1 59.3 64.9 15.0 18.8
Norway (1996) 75.4 81.1 60.9 66.5 15.5 19.5
Philippines (1991) 63.1 66.7 53.5 56.3 12.3 13.7
Poland (1995) 67.6 76.4 53.9 62.5 12.9 16.5
Russian Federation (1995) 58.3 71.7 45.1 58.4 10.8 14.9
Singapore (1997) 75.0 79.2 60.5 64.6 15.2 17.6
Spain (1994) 74.2 81.5 60.0 67.2 16.0 19.9
Sweden (1996) 76.5 81.5 62.0 66.9 16.1 19.7
Switzerland (1995–96) 75.7 81.9 61.3 67.4 16.3 20.3
United Kingdom (1996) 74.3 79.5 60.0 65.1 14.8 18.3
United States (1995) 72.5 78.9 58.4 64.7 15.6 18.9
Sources: UN 1999; ABS 1999b.
02 AH2000 stat tables Page 372 Thursday, June 1, 2000 2:18 PM

Statistical tables 373
TRIM SIZE 175 mm Wide x 250 mm Deep
Table S13: Age-specific, crude and age-standardised death rates, all causes by sex, selected years, 1921 to 1998 (per 100,000 population)
Sex/age group (years) 1921 1941 1961 1981 1991 1998
Males0–4 2,213 1,289 564 281 191 137
5–9 200 139 49 34 20 15
10–14 172 108 52 29 22 19
15–19 219 159 123 124 88 75
20–24 321 205 161 153 128 125
25–29 373 199 146 133 127 134
30–34 442 232 169 123 133 151
35–39 584 339 229 165 161 152
40–44 730 461 380 261 198 188
45–49 994 737 588 455 313 248
50–54 1,299 1,161 992 790 517 398
55–59 1,895 1,775 1,614 1,294 885 684
60–64 2,878 2,774 2,619 1,983 1,543 1,180
65–69 4,199 4,251 4,117 3,231 2,489 2,002
70–74 6,199 6,479 6,252 5,195 3,927 3,359
75–79 10,076 10,054 9,312 8,018 6,547 5,351
80–84 15,368 15,264 14,084 12,112 10,548 9,292
85+ 26,213 29,453 23,772 20,814 17,571 16,484
Crude rate 1,106 1,099 946 815 744 719
ASR(a) 1,733 1,578 1,358 1,109 885 758
Females0–4 1,771 1,022 443 216 151 111
5–9 192 103 38 18 14 9
10–14 128 73 30 20 15 14
15–19 205 104 47 45 37 37
20–24 290 155 61 48 45 39
25–29 377 202 74 51 54 42
30–34 426 234 92 57 54 53
35–39 535 311 146 87 77 77
40–44 563 374 209 143 111 108
45–49 690 565 347 265 187 163
50–54 943 780 542 378 307 264
55–59 1,289 1,103 785 617 484 398
60–64 1,915 1,805 1,298 971 797 654
65–69 3,112 2,884 2,178 1,568 1,305 1,043
70–74 5,041 4,789 3,652 2,552 2,187 1,819
75–79 8,295 8,275 6,271 4,426 3,797 3,145
80–84 13,136 12,704 10,241 7,597 6,487 5,994
85+ 22,345 25,457 20,670 16,035 14,351 13,414
Crude rate 873 901 745 646 635 638
ASR(a) 1,394 1,225 875 633 537 468
(a) Age standardised to the total Australian population at 30 June 1991.
Source: AIHW National Mortality Database.
02 AH2000 stat tables Page 373 Thursday, June 1, 2000 2:18 PM

374 AustraliaÕs Health 2000
TRIM SIZE 175 mm Wide x 250 mm Deep
Table S14: Age-specific, crude and age-standardised death rates, all causes by sex, State or Territory of usual residence, 1998 (per 100,000 population)
Sex/age group (years) NSW Vic Qld WA SA Tas ACT NT Aust
Males0–4 124 127 178 131 111 150 130 253 137
5–9 13 13 23 10 16 6 9 45 15
10–14 23 18 17 17 10 6 9 50 19
15–19 70 76 71 83 73 91 47 228 75
20–24 134 102 117 154 141 91 126 221 125
25–29 136 119 119 162 143 156 137 280 134
30–34 155 137 152 160 158 134 75 347 151
35–39 170 111 165 156 144 154 130 360 152
40–44 186 167 197 188 205 153 163 545 188
45–49 256 227 270 215 262 182 198 618 248
50–54 394 374 416 345 442 520 272 861 398
55–59 700 624 755 602 693 811 593 921 684
60–64 1,214 1,098 1,230 1,149 1,138 1,204 1,267 1,987 1,180
65–69 1,958 1,965 2,053 2,034 2,110 2,054 1,723 3,235 2,002
70–74 3,349 3,288 3,589 3,126 3,331 3,501 3,262 3,668 3,359
75–79 5,290 5,214 5,533 5,166 5,433 6,090 5,916 7,851 5,351
80–84 9,419 9,179 9,368 8,897 9,391 9,436 7,715 10,870 9,292
85+ 16,593 16,310 16,398 16,273 16,710 17,493 18,695 6,707 16,484
Crude rate 742 711 713 624 830 806 473 526 719
ASR(a) 761 730 781 737 768 795 733 997 758
Females0–4 97 113 135 99 93 90 183 232 111
5–9 8 10 11 6 12 6 9 49 9
10–14 11 12 17 11 18 17 0 53 14
15–19 28 33 50 45 48 24 9 132 37
20–24 40 39 36 43 18 33 38 126 39
25–29 41 37 42 52 48 36 23 63 42
30–34 51 50 51 60 48 42 49 178 53
35–39 75 64 75 86 92 111 62 202 77
40–44 95 110 117 100 108 117 105 428 108
45–49 169 144 168 141 171 194 213 346 163
50–54 261 261 260 246 284 343 200 495 264
55–59 413 380 386 379 401 403 492 606 398
60–64 647 630 728 529 692 682 503 1,710 654
65–69 1,020 1,005 1,157 1,013 989 1,035 1,216 2,311 1,043
70–74 1,880 1,711 1,822 1,814 1,743 1,981 2,377 3,090 1,819
75–79 3,241 3,070 3,064 3,048 3,032 3,470 3,127 7,828 3,145
80–84 5,957 6,189 5,771 5,812 6,235 5,930 5,794 4,063 5,994
85+ 13,256 13,813 13,202 12,773 13,513 13,860 15,440 13,200 13,414
Crude rate 661 661 588 541 750 713 449 378 638
ASR(a) 467 464 472 450 469 489 503 783 468
(a) Age standardised to the total Australian population at 30 June 1991.
Source: AIHW National Mortality Database.
02 AH2000 stat tables Page 374 Thursday, June 1, 2000 2:18 PM

Statistical tables 375
TRIM SIZE 175 mm Wide x 250 mm Deep
Table S15: Age-specific, crude and age-standardised death rates, all causes, by sex, selected countries, latest year (per 100,000 population)
Country/year
Age group (years)
0(a) 1–4 5–14 15–24 25–34 35–44
Males
Australia (1998) 551 37 17 101 143 170
Australia (1995) 614 39 18 102 133 176Canada (1995) 673 30 20 93 122 194
China—selected rural areas (1994) 2,275 158 69 95 164 289
China—selected urban areas (1994) 1,404 59 39 52 94 201
Denmark (1995) 557 37 19 74 127 239
France (1994) 671 33 21 102 175 290
Germany (1995) 592 35 17 89 113 241
Greece (1995) 896 23 21 98 124 191
Ireland (1993) 666 34 25 85 117 164
Israel (1995) 748 42 19 80 92 146
Italy (1993) 765 37 23 90 141 180
Japan (1994) 471 45 19 63 76 153
Korea, Republic of (1995) 289 67 42 111 172 354
Malaysia (1991) 1,350 95 59 142 182 293
Netherlands (1995) 625 38 19 61 77 158
New Zealand (1993) 784 47 19 159 134 210
Norway (1994) 579 22 18 73 97 175
Philippines (1990) 2,714 379 101 185 338 497
Poland (1995) 1,471 47 28 111 199 473
Russian Federation (1995) 2,067 122 69 334 649 1,195
Singapore (1995) 455 40 26 92 131 198
Spain (1994) 670 42 22 87 206 250
Sweden (1995) 453 20 13 56 81 160
Switzerland (1994) 573 41 25 112 160 200
United Kingdom (1995) 692 28 18 77 99 170
United States (1994) 881 47 27 146 209 333
(continued)
(a) Infant mortality per 100,000 births.
02 AH2000 stat tables Page 375 Thursday, June 1, 2000 2:18 PM

376 AustraliaÕs Health 2000
TRIM SIZE 175 mm Wide x 250 mm Deep
Table S15 (continued): Age-specific, crude and age-standardised death rates, all causes, by sex, selected countries, latest year (per 100,000 population)
Country/year
Age group (years) Cruderate ASR (b)45–54 55–64 65–74 75+
Males
Australia (1998) 320 909 2,622 8,550 720 742
Australia (1995) 349 1,025 2,889 9,135 737 802Canada (1995) 402 1,112 2,933 9,184 760 853
China—selected rural areas (1994) 642 1,644 4,469 11,047 691 1,212
China—selected urban areas (1994) 422 1,238 3,898 11,483 628 1,099
Denmark (1995) 505 1,477 3,965 11,691 1,204 1,073
France (1994) 570 1,297 2,803 9,684 960 878
Germany (1995) 565 1,380 3,481 11,662 1,034 1,013
Greece (1995) 423 1,126 2,800 9,922 1,024 846
Ireland (1993) 447 1,489 4,317 12,456 959 1,133
Israel (1995) 376 1,124 3,014 10,153 657 859
Italy (1993) 433 1,228 3,106 10,050 1,029 907
Japan (1994) 380 1,039 2,387 8,895 783 768
Korea, Republic of (1995) 821 1,771 4,330 11,218 588 1,230
Malaysia (1991) 721 1,879 4,239 10,967 520 1,166
Netherlands (1995) 381 1,173 3,413 11,250 893 955
New Zealand (1993) 445 1,296 3,368 10,307 831 970
Norway (1994) 396 1,157 3,325 10,385 1,043 912
Philippines (1990) 922 1,822 3,765 10,832 610 1,247
Poland (1995) 1,052 2,395 4,810 12,831 1,095 1,423
Russian Federation (1995) 2,228 3,885 6,479 14,154 1,693 2,171
Singapore (1995) 493 1,489 3,772 9,192 589 975
Spain (1994) 500 1,194 2,876 9,544 939 893
Sweden (1995) 370 986 2,835 10,075 1,088 826
Switzerland (1994) 407 988 2,833 9,868 914 847
United Kingdom (1995) 422 1,267 3,669 11,016 1,082 974
United States (1994) 599 1,444 3,332 9,431 915 990
(continued)(b) Age-standardised rate. Reference population is the European standard population (WHO 1995). Standard death rates
in this table are different from standard rates in other tables because of the use of a different reference population.
02 AH2000 stat tables Page 376 Thursday, June 1, 2000 2:18 PM

Statistical tables 377
TRIM SIZE 175 mm Wide x 250 mm Deep
Table S15 (continued): Age-specific, crude and age-standardised death rates, all causes, by sex, selected countries, latest year (per 100,000 population)
Country/year
Age group (years)
0(a) 1–4 5–14 15–24 25–34 35–44
Females
Australia (1998) 449 29 12 38 47 92
Australia (1995) 515 30 16 38 50 89Canada (1995) 553 25 16 33 47 96
China—selected rural areas (1994) 2,216 145 46 80 125 189
China—selected urban areas (1994) 1,208 50 25 33 55 116
Denmark (1995) 452 24 13 30 50 149
France (1994) 504 25 15 35 62 117
Germany (1995) 464 26 14 34 47 117
Greece (1995) 728 21 14 28 44 88
Ireland (1993) 555 28 13 25 44 106
Israel (1995) 615 39 13 30 35 94
Italy (1993) 645 35 17 29 51 94
Japan (1994) 376 36 12 25 38 84
Korea, Republic of (1995) 244 60 28 53 68 123
Malaysia (1991) 1,160 80 38 57 88 171
Netherlands (1995) 464 28 14 28 45 110
New Zealand (1993) 677 48 20 53 64 116
Norway (1994) 463 30 16 30 39 91
Philippines (1990) 2,122 340 81 90 146 240
Poland (1995) 1,243 38 17 34 56 157
Russian Federation (1995) 1,562 96 39 95 155 317
Singapore (1995) 330 28 21 39 50 109
Spain (1994) 536 32 17 28 65 96
Sweden (1995) 349 14 9 26 40 86
Switzerland (1994) 446 30 13 39 62 99
United Kingdom (1995) 541 24 13 29 46 107
United States (1994) 720 38 18 48 78 146
(continued)
(a) Infant mortality per 100,000 births.
02 AH2000 stat tables Page 377 Thursday, June 1, 2000 2:18 PM
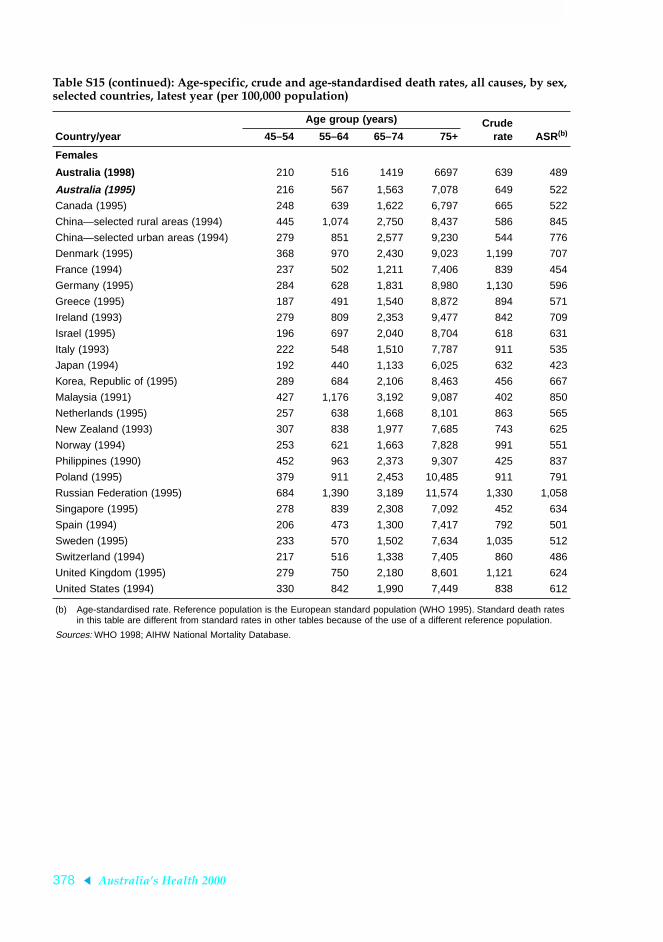
378 AustraliaÕs Health 2000
TRIM SIZE 175 mm Wide x 250 mm Deep
Table S15 (continued): Age-specific, crude and age-standardised death rates, all causes, by sex, selected countries, latest year (per 100,000 population)
Country/year
Age group (years) Cruderate ASR (b)45–54 55–64 65–74 75+
Females
Australia (1998) 210 516 1419 6697 639 489
Australia (1995) 216 567 1,563 7,078 649 522
Canada (1995) 248 639 1,622 6,797 665 522
China—selected rural areas (1994) 445 1,074 2,750 8,437 586 845
China—selected urban areas (1994) 279 851 2,577 9,230 544 776
Denmark (1995) 368 970 2,430 9,023 1,199 707
France (1994) 237 502 1,211 7,406 839 454
Germany (1995) 284 628 1,831 8,980 1,130 596
Greece (1995) 187 491 1,540 8,872 894 571
Ireland (1993) 279 809 2,353 9,477 842 709
Israel (1995) 196 697 2,040 8,704 618 631
Italy (1993) 222 548 1,510 7,787 911 535
Japan (1994) 192 440 1,133 6,025 632 423
Korea, Republic of (1995) 289 684 2,106 8,463 456 667
Malaysia (1991) 427 1,176 3,192 9,087 402 850
Netherlands (1995) 257 638 1,668 8,101 863 565
New Zealand (1993) 307 838 1,977 7,685 743 625
Norway (1994) 253 621 1,663 7,828 991 551
Philippines (1990) 452 963 2,373 9,307 425 837
Poland (1995) 379 911 2,453 10,485 911 791
Russian Federation (1995) 684 1,390 3,189 11,574 1,330 1,058
Singapore (1995) 278 839 2,308 7,092 452 634
Spain (1994) 206 473 1,300 7,417 792 501
Sweden (1995) 233 570 1,502 7,634 1,035 512
Switzerland (1994) 217 516 1,338 7,405 860 486
United Kingdom (1995) 279 750 2,180 8,601 1,121 624
United States (1994) 330 842 1,990 7,449 838 612
(b) Age-standardised rate. Reference population is the European standard population (WHO 1995). Standard death rates in this table are different from standard rates in other tables because of the use of a different reference population.
Sources: WHO 1998; AIHW National Mortality Database.
02 AH2000 stat tables Page 378 Thursday, June 1, 2000 2:18 PM

Statistical tables 379
TRIM SIZE 175 mm Wide x 250 mm Deep
Table S16: Age-standardised death rates(a), by sex and ICD-9 chapter, selected years, 1921 to 1998 (per 100,000 population)
ICD-9 chapter or disease 1921 1941 1961 1971 1981 1991 1996 1997 1998
Males
Infectious and parasitic(b) 210 93 17 10 5 6 12 10 8
Neoplasms 157 179 197 222 242 237 234 223 220
Endocrine, nutritional(c) 16 24 16 23 18 24 24 22 22
Blood diseases 10 6 4 3 3 3 2 2 2
Mental disorders 7 4 5 9 9 13 19 17 18
Nervous system diseases 47 26 15 12 13 16 19 15 16
Circulatory diseases 387 635 759 763 565 381 326 305 284
Respiratory diseases 207 149 108 124 98 78 71 84 77
Digestive diseases 59 57 39 31 36 29 24 23 22
Genito-urinary diseases 126 138 44 24 16 14 13 13 13
Skin diseases 5 3 2 1 1 1 1 1 1
Musculoskeletal diseases 7 5 4 4 3 3 3 2 2
Congenital diseases 9 10 10 8 7 5 4 5 4
Perinatal diseases 54 43 20 17 7 5 4 4 4
Ill-defined conditions 315 103 15 7 6 5 3 3 4
Injury and poisoning 117 104 104 105 81 65 61 60 61
All causes 1,733 1,577 1,358 1,361 1,109 885 820 790 758
Females
Infectious and parasitic(b) 158 58 9 6 4 4 5 5 5
Neoplasms 159 163 139 138 136 144 141 137 133
Endocrine, nutritional(c) 26 40 20 22 15 15 16 16 15
Blood diseases 13 6 5 3 3 2 2 2 2
Mental disorders 3 3 2 6 6 9 15 12 12
Nervous system diseases 36 22 9 9 8 12 13 12 11
Circulatory diseases 345 523 514 509 347 246 211 200 187
Respiratory diseases 160 115 45 43 32 34 38 48 43
Digestive diseases 58 40 23 18 20 19 15 15 15
Genito-urinary diseases 67 76 20 17 12 10 10 10 10
Complications of pregnancy 24 14 2 1 — — — — —
Skin diseases 5 3 2 1 — 1 1 1 1
Musculoskeletal diseases 9 6 4 5 4 5 5 4 4
Congenital diseases 7 9 8 8 6 4 3 4 3
Perinatal diseases 40 33 15 13 5 4 4 3 3
Ill-defined conditions 250 74 14 6 4 3 2 2 2
Injury and poisoning 34 40 42 46 30 25 21 22 22
All causes 1,394 1,225 875 848 633 537 501 494 468
(a) Age standardised to the total Australian population at 30 June 1991.
(b) From 1996, includes AIDS and AIDS-related deaths.
(c) Prior to 1996, includes AIDS and AIDS-related deaths.
Source: AIHW National Mortality Database.
02 AH2000 stat tables Page 379 Thursday, June 1, 2000 2:18 PM
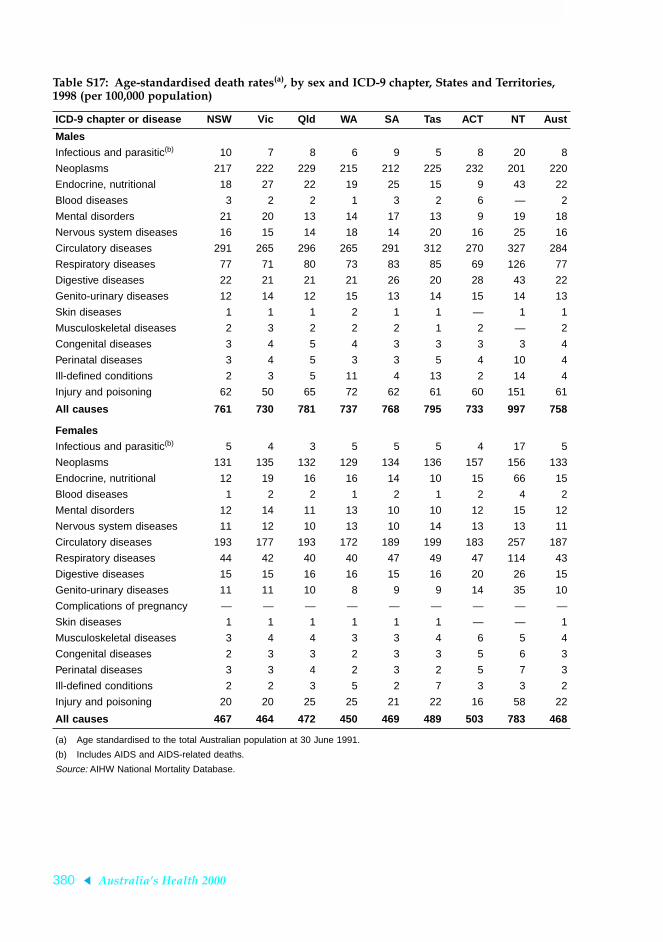
380 AustraliaÕs Health 2000
TRIM SIZE 175 mm Wide x 250 mm Deep
Table S17: Age-standardised death rates(a), by sex and ICD-9 chapter, States and Territories, 1998 (per 100,000 population)
ICD-9 chapter or disease NSW Vic Qld WA SA Tas ACT NT Aust
Males
Infectious and parasitic(b) 10 7 8 6 9 5 8 20 8
Neoplasms 217 222 229 215 212 225 232 201 220
Endocrine, nutritional 18 27 22 19 25 15 9 43 22
Blood diseases 3 2 2 1 3 2 6 — 2
Mental disorders 21 20 13 14 17 13 9 19 18
Nervous system diseases 16 15 14 18 14 20 16 25 16
Circulatory diseases 291 265 296 265 291 312 270 327 284
Respiratory diseases 77 71 80 73 83 85 69 126 77
Digestive diseases 22 21 21 21 26 20 28 43 22
Genito-urinary diseases 12 14 12 15 13 14 15 14 13
Skin diseases 1 1 1 2 1 1 — 1 1
Musculoskeletal diseases 2 3 2 2 2 1 2 — 2
Congenital diseases 3 4 5 4 3 3 3 3 4
Perinatal diseases 3 4 5 3 3 5 4 10 4
Ill-defined conditions 2 3 5 11 4 13 2 14 4
Injury and poisoning 62 50 65 72 62 61 60 151 61
All causes 761 730 781 737 768 795 733 997 758
Females
Infectious and parasitic(b) 5 4 3 5 5 5 4 17 5
Neoplasms 131 135 132 129 134 136 157 156 133
Endocrine, nutritional 12 19 16 16 14 10 15 66 15
Blood diseases 1 2 2 1 2 1 2 4 2
Mental disorders 12 14 11 13 10 10 12 15 12
Nervous system diseases 11 12 10 13 10 14 13 13 11
Circulatory diseases 193 177 193 172 189 199 183 257 187
Respiratory diseases 44 42 40 40 47 49 47 114 43
Digestive diseases 15 15 16 16 15 16 20 26 15
Genito-urinary diseases 11 11 10 8 9 9 14 35 10
Complications of pregnancy — — — — — — — — —
Skin diseases 1 1 1 1 1 1 — — 1
Musculoskeletal diseases 3 4 4 3 3 4 6 5 4
Congenital diseases 2 3 3 2 3 3 5 6 3
Perinatal diseases 3 3 4 2 3 2 5 7 3
Ill-defined conditions 2 2 3 5 2 7 3 3 2
Injury and poisoning 20 20 25 25 21 22 16 58 22
All causes 467 464 472 450 469 489 503 783 468
(a) Age standardised to the total Australian population at 30 June 1991.
(b) Includes AIDS and AIDS-related deaths.
Source: AIHW National Mortality Database.
02 AH2000 stat tables Page 380 Thursday, June 1, 2000 2:18 PM

Statistical tables 381
TRIM SIZE 175 mm Wide x 250 mm Deep
Table S18: Age-standardised death rates(a), by selected ICD-9 chapters and sex, selected countries, latest year (per 100,000 population)
ICD-9 chapter
Infectious& parasitic Neoplasms Circulatory Respiratory
Injury &poisoning All causes
Males
Australia (1998) 8 221 273 72 59 742
Australia (1995) 7 235 320 66 57 802Canada (1995) 6 238 307 79 63 841
China—selected rural areas (1994) 40 206 371 326 106 1,212
China—selected urban areas (1994) 18 234 428 203 58 1,099
Denmark (1995) 14 275 408 94 75 1,073
France (1994) 12 285 240 60 92 878
Germany (1995) 7 263 443 72 60 1,013
Greece (1995) 6 221 381 48 61 846
Ireland (1993) 6 274 515 159 55 1,133
Israel (1995) 14 197 366 37 52 859
Italy (1993) 4 276 350 62 59 907
Japan (1994) 14 228 233 117 64 768
Korea, Republic of (1995) 31 276 316 73 131 1,230
Netherlands (1995) 7 282 358 100 40 955
New Zealand (1993) 5 261 421 100 71 970
Norway (1994) 7 229 390 83 61 912
Poland (1995) 11 301 687 59 123 1,423
Russian Federation (1995) 38 307 1,052 142 395 2,171
Singapore (1995) 23 257 338 208 60 975
Spain (1994) 11 261 292 93 59 893
Sweden (1995) 6 191 393 60 58 826
Switzerland (1994) 20 248 322 64 82 847
United Kingdom (1995) 6 258 411 144 41 974
United States (1994) 14 244 389 90 85 990
(continued)(a) Reference population is the European standard population (WHO 1998). Standard death rates in this table are different
from the rates in other tables because of the use of a different reference population.
02 AH2000 stat tables Page 381 Thursday, June 1, 2000 2:18 PM

382 AustraliaÕs Health 2000
TRIM SIZE 175 mm Wide x 250 mm Deep
Table S18 (continued): Age-standardised death rates(a), by selected ICD-9 chapters and sex, selected countries, latest year (per 100,000 population)
ICD-9 chapter
Infectious& parasitic Neoplasms Circulatory Respiratory
Injury &poisoning All causes
Females
Australia (1998) 5 139 194 45 22 489
Australia (1995) 4 146 222 36 23 522
Canada (1995) 5 156 185 42 25 515
China—selected rural areas (1994) 22 115 267 241 71 845
China—selected urban areas (1994) 8 126 319 142 38 776
Denmark (1995) 6 209 247 62 38 707
France (1994) 7 127 140 27 39 454
Germany (1995) 4 156 278 29 24 596
Greece (1995) 4 115 303 31 19 571
Ireland (1993) 4 181 308 95 22 709
Israel (1995) 10 160 268 26 26 631
Italy (1993) 2 144 235 23 24 535
Japan (1994) 7 111 154 48 25 423
Korea, Republic of (1995) 9 109 212 32 48 667
Netherlands (1995) 6 159 205 43 20 565
New Zealand (1993) 3 179 267 59 27 625
Norway (1994) 5 154 219 52 26 551
Poland (1995) 4 156 421 21 34 791
Russian Federation (1995) 8 140 633 38 94 1,058
Singapore (1995) 15 146 254 125 20 634
Spain (1994) 6 119 206 34 17 501
Sweden (1995) 5 142 221 36 24 512
Switzerland (1994) 8 139 198 29 36 486
United Kingdom (1995) 4 174 245 90 17 624
United States (1994) 10 162 245 55 29 612
(a) Reference population is the European standard population (WHO 1998). Standard death rates in this table are different from the rates in other tables because of the use of a different reference population.
Sources: WHO 1996, 1998.
02 AH2000 stat tables Page 382 Thursday, June 1, 2000 2:18 PM

Statistical tables 383
TRIM SIZE 175 mm Wide x 250 mm Deep
Table S19: Age-standardised death rates(a), States and Territories, by major causes of death, 1994Ð98 and changes from 1989Ð93 to 1994Ð98
Cause of death NSW Vic Qld WA SA Tas ACT NT
Ischaemic heart disease
Males 195.3 182.4 203.2 181.3 196.2 207.7 170.6 184.4
% change 89–93 to 94–98 –17.9 –20.6 –16.9 –19.8 –21.0 –16.7 –8.7 –16.5
Females 111.2 100.7 113.0 98.3 105.9 110.2 85.2 97.5
% change 89–93 to 94–98 –21.7 –20.0 –17.0 –18.0 –21.3 –22.5 –12.9 –18.8
Cerebrovascular disease (stroke)
Males 67.1 59.1 62.0 60.7 64.3 70.8 60.8 81.7
% change 89–93 to 94–98 –11.9 –8.6 –14.4 –10.4 –14.9 –2.9 4.7 20.0
Females 60.4 52.6 56.6 52.7 57.4 61.3 53.1 68.5
% change 89–93 to 94–98 –21.4 –19.0 –14.2 –8.7 –9.4 –16.6 5.8 42.8
Lung cancer
Males 53.8 55.9 56.2 55.0 52.9 61.2 40.1 88.2
% change 89–93 to 94–98 –8.6 –7.6 –4.9 –6.6 –8.5 –8.5 –23.0 28.4
Females 18.3 19.8 17.3 19.8 16.7 21.4 16.9 34.8
% change 89–93 to 94–98 14.9 22.4 35.4 8.7 14.5 12.3 –9.3 49.5
Chronic obstructive pulmonary disease
Males 44.7 45.5 43.9 39.7 39.3 55.6 38.7 86.8
% change 89–93 to 94–98 –15.9 –19.0 –19.4 –19.8 –24.2 –15.1 –25.7 –26.6
Females 19.0 18.8 15.9 15.7 15.0 25.0 18.2 58.6
% change 89–93 to 94–98 13.2 13.6 19.4 20.1 28.2 26.2 –9.3 –0.9
Colorectal cancer
Males 27.6 30.9 28.5 28.8 28.0 33.7 32.9 20.7
% change 89–93 to 94–98 –5.1 –4.9 –2.2 6.6 –1.9 9.2 –4.2 –8.2
Females 17.7 20.7 18.3 18.4 18.9 23.8 22.3 22.3
% change 89–93 to 94–98 –7.6 –7.4 –5.1 –6.7 –0.3 2.1 –11.2 47.6
All causes
Males 816.3 793.5 807.0 784.9 805.4 885.1 729.2 1,107.2
% change 89–93 to 94–98 –8.6 –10.8 –9.7 –7.4 –9.9 –9.1 –8.0 –14.7
Females 499.0 492.2 484.5 474.6 489.0 548.8 456.0 764.1
% change 89–93 to 94–98 –10.3 –8.5 –5.3 –2.0 –4.9 –7.7 –4.2 –3.1
(a) Age standardised to the total Australian population at 30 June 1991.
Source: AIHW National Mortality Database.
02 AH2000 stat tables Page 383 Thursday, June 1, 2000 2:18 PM
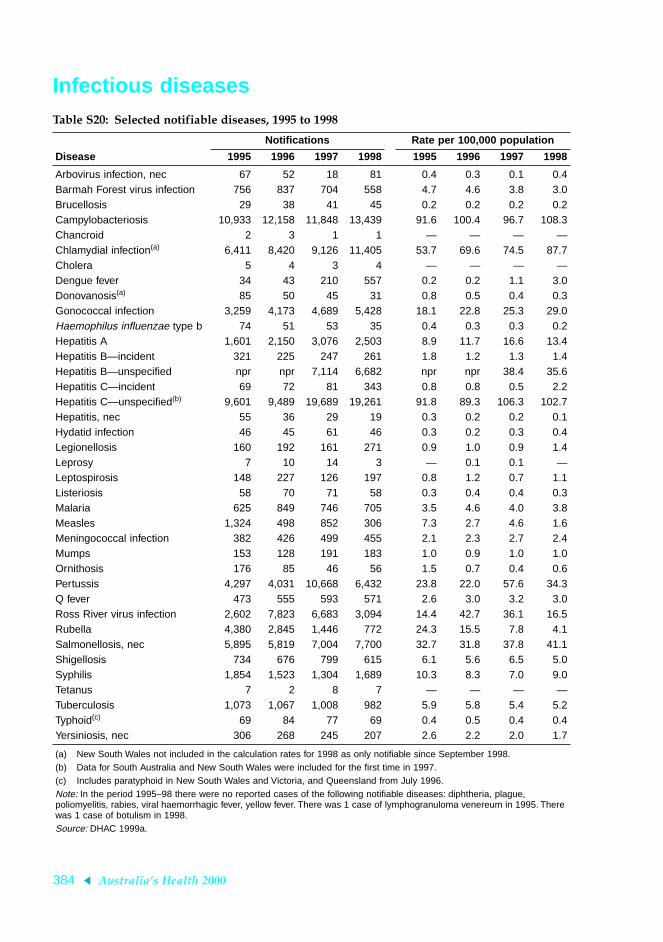
384 AustraliaÕs Health 2000
TRIM SIZE 175 mm Wide x 250 mm Deep
Infectious diseases Table S20: Selected notifiable diseases, 1995 to 1998
Disease
Notifications Rate per 100,000 population
1995 1996 1997 1998 1995 1996 1997 1998
Arbovirus infection, nec 67 52 18 81 0.4 0.3 0.1 0.4Barmah Forest virus infection 756 837 704 558 4.7 4.6 3.8 3.0Brucellosis 29 38 41 45 0.2 0.2 0.2 0.2Campylobacteriosis 10,933 12,158 11,848 13,439 91.6 100.4 96.7 108.3Chancroid 2 3 1 1 — — — —Chlamydial infection(a) 6,411 8,420 9,126 11,405 53.7 69.6 74.5 87.7Cholera 5 4 3 4 — — — —Dengue fever 34 43 210 557 0.2 0.2 1.1 3.0Donovanosis(a) 85 50 45 31 0.8 0.5 0.4 0.3Gonococcal infection 3,259 4,173 4,689 5,428 18.1 22.8 25.3 29.0Haemophilus influenzae type b 74 51 53 35 0.4 0.3 0.3 0.2Hepatitis A 1,601 2,150 3,076 2,503 8.9 11.7 16.6 13.4Hepatitis B—incident 321 225 247 261 1.8 1.2 1.3 1.4Hepatitis B—unspecified npr npr 7,114 6,682 npr npr 38.4 35.6Hepatitis C—incident 69 72 81 343 0.8 0.8 0.5 2.2Hepatitis C—unspecified(b) 9,601 9,489 19,689 19,261 91.8 89.3 106.3 102.7Hepatitis, nec 55 36 29 19 0.3 0.2 0.2 0.1Hydatid infection 46 45 61 46 0.3 0.2 0.3 0.4Legionellosis 160 192 161 271 0.9 1.0 0.9 1.4Leprosy 7 10 14 3 — 0.1 0.1 —Leptospirosis 148 227 126 197 0.8 1.2 0.7 1.1Listeriosis 58 70 71 58 0.3 0.4 0.4 0.3Malaria 625 849 746 705 3.5 4.6 4.0 3.8Measles 1,324 498 852 306 7.3 2.7 4.6 1.6Meningococcal infection 382 426 499 455 2.1 2.3 2.7 2.4Mumps 153 128 191 183 1.0 0.9 1.0 1.0Ornithosis 176 85 46 56 1.5 0.7 0.4 0.6Pertussis 4,297 4,031 10,668 6,432 23.8 22.0 57.6 34.3Q fever 473 555 593 571 2.6 3.0 3.2 3.0Ross River virus infection 2,602 7,823 6,683 3,094 14.4 42.7 36.1 16.5Rubella 4,380 2,845 1,446 772 24.3 15.5 7.8 4.1Salmonellosis, nec 5,895 5,819 7,004 7,700 32.7 31.8 37.8 41.1Shigellosis 734 676 799 615 6.1 5.6 6.5 5.0Syphilis 1,854 1,523 1,304 1,689 10.3 8.3 7.0 9.0Tetanus 7 2 8 7 — — — —Tuberculosis 1,073 1,067 1,008 982 5.9 5.8 5.4 5.2Typhoid(c) 69 84 77 69 0.4 0.5 0.4 0.4Yersiniosis, nec 306 268 245 207 2.6 2.2 2.0 1.7
(a) New South Wales not included in the calculation rates for 1998 as only notifiable since September 1998.(b) Data for South Australia and New South Wales were included for the first time in 1997.(c) Includes paratyphoid in New South Wales and Victoria, and Queensland from July 1996.Note: In the period 1995–98 there were no reported cases of the following notifiable diseases: diphtheria, plague, poliomyelitis, rabies, viral haemorrhagic fever, yellow fever. There was 1 case of lymphogranuloma venereum in 1995. There was 1 case of botulism in 1998.Source: DHAC 1999a.
02 AH2000 stat tables Page 384 Thursday, June 1, 2000 2:18 PM

Statistical tables 385
TRIM SIZE 175 mm Wide x 250 mm Deep
Table S21: Characteristics of AIDS cases, by age, sex, State/Territory, exposure category and defining condition, 1987 to 1998
Description 1987–89 1990 1991 1992 1993 1994 1995 1996 1997 1998
Total cases 1,947 674 802 787 844 950 798 653 351 265
Median age (years)
Males 36 37 37 38 37 37 37 37 39 39
Females 35 33 32 32 38 31 34 34 31 35
Per cent males 96.6 97.2 96.4 95.2 94.4 94.8 95.5 95.0 92.3 94.0
State/Territory (per cent)
NSW 62.4 62.9 55.1 54.5 57.0 57.8 58.0 54.8 51.9 57.4
Vic 20.2 18.2 23.0 21.1 21.3 20.0 20.2 20.7 20.8 19.2
Qld 7.5 8.5 10.5 11.4 10.8 10.3 12.6 11.5 16.2 12.5
WA 4.7 4.2 4.7 5.8 3.8 4.3 3.8 5.8 4.0 4.2
SA 3.4 3.7 4.7 4.2 5.3 5.3 3.8 4.6 5.7 3.0
Tas 0.5 0.6 0.4 1.3 0.1 0.5 0.2 1.1 0.6 0.7
NT 0.1 0.4 0.6 0.6 0.6 0.3 0.4 0.1 0.8 1.1
ACT 1.1 1.5 1.0 1.0 1.1 1.5 1.0 1.4 — 1.9
Exposure category (per cent)
Male homosexual/bisexual contact 88.1 87.3 83.5 82.1 81.0 83.3 81.7 79.9 75.5 69.7
Male homosexual/bisexual contact and ID use 3.2 2.9 3.9 5.0 6.9 5.0 5.2 5.8 3.3 3.3
ID use (female and heterosexual male) 1.6 2.3 3.9 2.1 3.3 3.2 3.5 3.9 4.9 6.6
Heterosexual contact 1.3 3.1 4.9 6.6 6.4 5.8 6.4 8.3 14.5 18.0
Haemophilia/coagulation disorder 1.8 1.8 1.4 1.7 1.4 1.1 2.0 1.0 1.2 0.4
Receipt of blood/tissue 3.9 2.1 2.0 2.0 1.0 1.0 0.7 1.1 0.3 1.2
Mother with/at risk for HIV infection 0.1 0.5 0.4 0.5 — 0.6 0.5 — 0.3 0.8
Other/undetermined 1.8 2.7 3.1 3.2 3.8 3.6 4.4 5.5 6.0 7.9
AIDS-defining condition (per cent)
Pneumocystis carinii pneumonia (PCP) 38.8 29.8 31.3 26.9 22.1 22.4 19.8 22.5 25.9 23.8
Kaposi’s sarcoma (KS) 15.8 10.7 12.1 12.3 11.0 10.0 10.9 11.5 10.0 9.4
PCP and other (not KS) 6.6 8.5 6.0 6.3 3.8 2.5 4.1 4.4 7.4 8.3
Oesophageal candidiasis 5.1 7.5 7.7 8.8 11.7 14.4 16.4 14.7 8.8 8.7
Other(a) 33.7 47.5 42.8 45.7 51.4 50.7 48.8 46.9 47.8 49.8
(a) Includes Mycobacterium avium and HIV wasting disease.
Source: NCHECR 1999.
02 AH2000 stat tables Page 385 Thursday, June 1, 2000 2:18 PM

386 AustraliaÕs Health 2000
TRIM SIZE 175 mm Wide x 250 mm Deep
Cancer Table S22: Leading cancers(a), new cases and deaths by type and sex, 1996
Cancer
New cases Deaths
Number Per cent ASR (b)Lifetime
risk (c) Number Per cent ASR (b) PYLL(d)
Males
Prostate 10,055 23.5 117.4 1 in 10 2,644 13.8 33.0 6,228
Colorectal 6,067 14.2 69.2 1 in 17 2,474 12.9 28.8 17,788
Lung 5,228 12.2 60.1 1 in 19 4,743 24.7 55.0 31,038
Melanoma 4,313 10.1 48.0 1 in 25 580 3.0 6.7 6,955
Bladder 1,921 4.5 22.4 1 in 56 543 2.8 6.6 2,108
NHL(e) 1,718 4.0 19.4 1 in 63 707 3.7 8.2 6,750
Unknown primary 1,625 3.8 19.0 1 in 72 1,189 6.2 14.1 7,663
Kidney 1,209 2.8 13.7 1 in 84 460 2.4 5.4 3,583
Stomach 1,190 2.8 13.8 1 in 91 752 3.9 8.8 5,373
Lip 826 1.9 9.2 1 in 131 5 0.0 0.1 63
All cancers 42,733 100.0 489.1 1 in 3 19,196 100.0 225.5 140,070
Females
Breast 9,621 27.5 95.5 1 in 12 2,619 17.6 24.9 30,955
Colorectal 4,931 14.1 46.0 1 in 26 2,132 14.3 19.0 13,115
Melanoma 3,448 9.9 35.0 1 in 34 323 2.2 3.0 3,820
Lung 2,393 6.9 23.0 1 in 47 2,021 13.6 19.1 14,983
Unknown primary 1,406 4.0 12.5 1 in 109 1,142 7.7 10.0 6,015
NHL(e) 1,387 4.0 13.3 1 in 85 681 4.6 6.2 5,135
Uterus 1,316 3.8 12.9 1 in 83 273 1.8 2.5 1,468
Ovary 1,166 3.3 11.4 1 in 98 797 5.4 7.6 7,290
Cervix 923 2.6 9.4 1 in 130 301 2.0 2.9 4,253
Pancreas 801 2.3 7.2 1 in 201 822 5.5 7.2 3,413
All cancers 34,933 100.0 338.8 1 in 4 14,893 100.0 136.9 121,228
(a) Rankings are based on the number of new cases; excludes non-melanocytic skin cancers.
(b) Per 100,000 population, age standardised to the Australian population at 30 June 1991.
(c) Lifetime risk—a measure which approximates the risk of contracting a particular cancer in a lifetime if the risks at the year of estimation remained throughout a person’s life. For the purposes of this table, ‘lifetime’ is defined as ages 0–74.
(d) Potential years of life lost between the ages of 0 and 74 years.
(e) Non-Hodgkin’s lymphoma.
Sources: AIHW & AACR 1999; AIHW National Mortality Database.
02 AH2000 stat tables Page 386 Thursday, June 1, 2000 2:18 PM

Statistical tables 387
TRIM SIZE 175 mm Wide x 250 mm Deep
Table S23: Major cancers, age-standardised incidence rates(a), by sex, 1988 to 1996 (per 100,000 population)
Cancer 1988 1989 1990 1991 1992 1993 1994 1995 1996
Males
Prostate 70.6 75.5 85.3 92.4 104.2 140.9 158.3 144.0 117.4
Colorectal 62.1 63.8 64.3 67.4 66.0 66.3 67.4 68.1 69.2
Lung 66.9 67.0 68.5 66.0 64.9 62.7 64.8 60.6 60.1
Melanoma 40.9 38.7 39.0 39.1 42.4 43.8 43.7 46.4 48.0
Bladder 23.6 22.4 21.9 20.5 22.1 22.4 23.9 23.7 22.4
NHL(b) 15.8 16.0 17.3 18.2 19.0 18.7 17.7 17.6 19.4
Stomach 16.5 15.3 16.4 15.3 15.2 15.3 14.7 15.1 13.8
Kidney 10.9 11.4 12.0 13.3 13.0 12.8 13.1 13.7 13.7
Pancreas 9.4 9.7 10.0 9.6 9.7 9.5 10.2 9.3 9.4
Testis 4.3 4.6 4.8 5.2 5.6 5.5 6.0 5.7 6.0
All cancers 427.7 431.6 448.4 457.9 476.5 507.5 530.6 510.4 489.1
Females
Breast 79.1 81.9 83.2 88.2 85.7 92.7 100.3 101.1 95.5
Colorectal 43.4 44.3 44.5 47.2 47.3 46.0 47.5 46.1 46.0
Melanoma 33.4 29.6 30.5 30.7 32.5 32.7 32.6 34.4 35.0
Lung 19.5 20.0 21.0 21.5 21.3 22.4 22.5 22.7 23.0
NHL(b) 10.8 11.2 11.1 12.2 12.6 12.3 12.7 13.4 13.3
Uterus 12.3 11.8 12.0 12.6 13.2 13.1 13.9 13.6 12.9
Cervix 12.8 12.3 12.3 12.4 11.2 11.0 11.9 9.9 9.4
Kidney 6.6 6.3 6.8 7.4 8.1 7.4 7.2 7.3 7.6
Pancreas 6.9 6.5 6.8 7.1 7.3 7.2 7.0 7.2 7.2
Stomach 6.8 6.7 6.5 6.8 6.4 6.1 5.9 6.4 6.0
Bladder 6.9 6.1 5.9 5.3 5.3 5.9 6.1 6.1 5.7
All cancer 309.8 308.0 314.2 327.0 327.9 332.2 342.1 345.7 338.8
(a) Age standardised to the Australian population at 30 June 1991.
(b) Non-Hodgkin’s lymphoma.
Source: AIHW & AACR 1999.
02 AH2000 stat tables Page 387 Thursday, June 1, 2000 2:18 PM

388 AustraliaÕs Health 2000
TRIM SIZE 175 mm Wide x 250 mm Deep
Table S24: Major cancers, average annual age-standardised incidence rates(a), by sex, States and Territories 1992Ð96 and Australia 1996 (per 100,000 population)
Cancer NSW Vic Qld WA SA Tas ACT NT Aust (b)
Males
Prostate 135.2 124.0 127.0 150.5 142.8 156.7 149.0 74.7 117.4
Colorectal 66.5 68.8 69.7 64.1 67.0 67.8 65.9 50.5 69.2
Lung 61.2 62.0 66.0 64.7 61.8 68.2 46.4 85.5 60.1
Melanoma 45.8 33.3 63.2 49.5 39.4 34.7 37.4 32.8 48.0
Bladder 18.3 30.0 28.9 15.1 17.0 28.5 17.6 11.5 22.4
NHL(c) 19.2 19.3 18.0 16.1 18.0 16.5 20.5 10.7 19.4
Stomach 14.3 15.5 14.2 16.0 14.6 16.0 14.7 10.2 13.8
Kidney 13.9 12.1 15.0 10.3 13.5 14.3 11.9 10.1 13.7
Pancreas 9.6 9.5 9.8 9.7 9.8 10.7 9.4 11.0 9.4
Testis 5.7 5.8 6.0 5.5 6.0 5.9 5.6 4.5 6.0
Females
Breast 94.4 96.6 93.5 98.2 96.3 93.8 95.2 65.2 95.5
Colorectal 44.3 47.6 50.3 43.5 48.2 50.9 44.3 42.7 46.0
Melanoma 30.8 28.3 45.6 36.1 34.5 30.5 28.4 18.9 35.0
Lung 56.1 57.8 58.0 57.4 55.3 60.7 46.4 92.8 23.0
NHL(c) 12.9 13.4 12.7 11.8 13.0 12.3 14.8 9.5 13.3
Uterus 12.3 14.9 14.0 11.8 14.6 12.4 11.8 12.7 12.9
Cervix 10.8 10.5 12.0 11.1 7.8 11.5 9.0 21.8 9.4
Kidney 8.2 6.7 8.7 6.2 7.1 5.8 5.5 6.0 7.6
Pancreas 7.7 6.8 6.9 6.9 7.3 6.9 5.7 5.6 7.2
Stomach 5.7 6.6 6.3 6.5 6.3 6.7 5.5 4.9 6.0
Bladder 4.6 7.5 8.2 3.2 4.0 6.7 3.7 4.6 5.7
(a) Age standardised to the Australian population at 30 June 1991.
(b) State and Territory averages for 1992–96 do not equate to a single-year average for Australia.
(c) Non-Hodgkin’s lymphoma.
Source: AIHW & AACR 1999.
02 AH2000 stat tables Page 388 Thursday, June 1, 2000 2:18 PM

Statistical tables 389
TRIM SIZE 175 mm Wide x 250 mm Deep
Table S25: Major cancers, age-standardised incidence rates(a), by sex, selected countries 1988Ð92 and Australia 1992 and 1996 (per 100,000 population)
Males Colorectal Lung Melanoma Prostate Stomach All cancers (b)
Australia 1992 46.6 44.3 32.4 63.4 10.4 327.2Australia 1996 49.5 41.9 37.3 79.1 9.3 351.6
Canada 43.0 65.4 7.7 64.7 10.6 322.1
England and Wales(c) 33.9 62.4 4.6 28.0 16.1 261.1
Italy (Venice) 35.4 81.9 6.1 26.8 19.9 355.9
Japan (Osaka) 34.2 43.5 0.2 6.8 65.0 272.8
Netherlands 36.4 73.0 6.9 39.6 15.4 288.4
New Zealand (non-Maori) 51.3 46.5 25.0 37.8 11.0 290.3
United States (black) 46.4 99.1 0.7 137.0 14.5 454.5
United States (white) 42.4 61.3 13.1 100.8 7.5 370.9
Females Colorectal Lung Melanoma Breast Stomach All cancers (b)
Australia 1992 32.6 15.0 26.3 69.4 4.1 247.2Australia 1996 33.0 16.9 29.0 78.4 4.1 263.5
Canada 30.5 28.0 6.9 76.8 4.5 252.8
England and Wales(c) 23.7 22.8 6.6 68.8 6.3 225.5
Italy (Venice) 24.3 13.9 7.0 72.6 8.8 230.6
Japan (Osaka) 19.9 12.4 0.2 24.3 27.3 154.8
Netherlands 27.8 13.0 9.8 79.6 6.1 225.0
New Zealand (non-Maori) 40.8 18.2 29.8 77.2 4.8 274.6
United States (black) 35.3 38.5 0.5 79.3 5.9 271.6
United States (white) 29.5 33.8 10.2 90.7 3.1 280.9
(a) Age standardised to the World Standard Population.
(b) Excludes non-melanocytic skin cancer.
(c) 1988–90.
Source: Parkin et al. 1997.
02 AH2000 stat tables Page 389 Thursday, June 1, 2000 2:18 PM

390 AustraliaÕs Health 2000
TRIM SIZE 175 mm Wide x 250 mm Deep
Oral health Table S26: Primary teeth with caries experience(a), 5- to 10-year-old school children, 1989 to 1996 (mean number of teeth)
Age (years)
5 6 7 8 9 10
1989 2.07 2.15 2.38 2.31 2.26 1.88
1990 1.85 2.06 2.20 2.31 2.28 1.78
1991 1.78 1.94 2.13 2.24 2.22 1.81
1992 1.80 1.95 1.93 2.21 2.11 1.74
1993 1.76 1.90 2.01 2.15 2.13 1.73
1994 1.56 1.79 1.95 2.13 2.01 1.71
1995 1.49 1.73 1.87 2.05 1.97 1.61
1996 1.26 1.45 1.66 1.68 1.72 1.47
(a) As measured by dmft index (number of decayed, missing and filled primary teeth).
Source: AIHW Dental Statistics and Research Unit Child Dental Health Survey.
Table S27: Permanent teeth with caries experience(a), 6- to 12-year-old school children, 1989 to 1996 (mean number of teeth)
Age (years)
6 7 8 9 10 11 12
1989 0.09 0.26 0.46 0.65 0.83 1.37 1.56
1990 0.10 0.24 0.42 0.63 0.76 1.00 1.44
1991 0.09 0.24 0.40 0.56 0.83 0.91 1.29
1992 0.09 0.21 0.38 0.53 0.69 0.90 1.22
1993 0.08 0.22 0.36 0.51 0.66 0.90 1.10
1994 0.11 0.23 0.37 0.47 0.65 0.88 1.09
1995 0.10 0.20 0.36 0.46 0.57 0.79 1.01
1996 0.07 0.18 0.30 0.38 0.49 0.66 0.90
(a) As measured by DMFT index (number of decayed, missing and filled permanent teeth).
Source: AIHW Dental Statistics and Research Unit Child Dental Health Survey.
02 AH2000 stat tables Page 390 Thursday, June 1, 2000 2:18 PM

Statistical tables 391
TRIM SIZE 175 mm Wide x 250 mm Deep
Table S28: Dental caries experience(a) of 6-year-old and 12-year-old school children, States and Territories, 1989 to 1996 (mean number of teeth)
NSW Vic Qld WA SA Tas ACT NT Aust
6-year-olds (dmft)
1989 2.21 2.16 2.34 1.62 2.21 1.70 1.17 2.04 2.15
1990 2.20 2.10 2.43 1.54 1.88 1.59 1.15 2.08 2.06
1991 2.05 2.04 2.48 1.29 1.98 1.57 1.14 1.96 1.94
1992 2.00 2.05 2.37 1.32 1.53 1.48 1.09 1.99 1.95
1993 2.04 1.81 2.18 1.48 1.38 1.35 1.33 1.81 1.90
1994 1.93 1.67 2.27 1.37 1.17 (c) 1.17 1.99 1.79
1995 1.75 1.78 1.99 1.39 1.47 1.48 1.39 1.99 1.73
1996 0.94 1.61 2.25 1.30 1.17 1.37 0.89 1.79 1.45
12-year-olds (DMFT)
1989 1.32 1.54 1.65 2.04 1.52 1.06 1.14 1.08 1.56
1990 1.32 (b) 1.69 1.75 1.26 1.11 1.03 1.18 1.44
1991 1.18 1.38 1.54 1.43 1.06 1.18 0.91 1.26 1.29
1992 1.19 1.77 1.50 1.22 1.04 0.98 0.76 0.91 1.22
1993 1.04 1.52 1.44 1.20 0.64 0.96 0.77 0.85 1.10
1994 1.11 1.28 1.37 1.07 0.59 (c) 0.69 0.81 1.09
1995 0.93 1.02 1.37 1.04 0.64 0.86 0.61 0.82 1.01
1996 0.64 1.09 1.30 0.99 0.47 0.96 0.56 0.71 0.90
(a) As measured by dmft or DMFT index (number of decayed, missing and filled primary or permanent teeth).
(b) Insufficient numbers examined to provide an estimate.
(c) Data not available for Tasmania in 1994.
Source: AIHW Dental Statistics and Research Unit unpublished data.
02 AH2000 stat tables Page 391 Thursday, June 1, 2000 2:18 PM

392 AustraliaÕs Health 2000
TRIM SIZE 175 mm Wide x 250 mm Deep
Cardiovascular risk factorsTable S29: Cardiovascular disease risk factors by age, 1995 (per cent)
Risk factor Sex
Age group
18–24 25–34 35–44 45–54 55–64 65–74 75+ 18+(a)
Diabetes type 2 Male 0.0(b) 0.1* 0.8 2.7 5.3* 8.7 8.7* 1.9(c)
Female 0.2(b)* 0.4* 0.6 2.2 4.1 6.6* 6.8 1.5(c)
High blood cholesterol(d) Male 18.1(e) 32.4 52.7 66.7 60.5 61.7(f) — 46.6(g)
Female 17.2(e) 32.2 30.9 52.3 66.7 97.0(f) — 38.6(g)
High blood pressure(h) Male 2.5* 3.7 9.6 20.2 34.3* 45.3* 49.0* 17.3
Female 0.6 0.9* 4.3 15.1 32.2* 46.8 60.8* 15.0
Overweight(i) Male 35.6 58.1 66.0 75.6 75.6 70.5 60.1 63.1
Female 25.9 33.9 44.4 56.4 66.5 62.1 53.1 47.8
Physical inactivity(j) Male 24.1 30.7 35.9 38.6 38.4 35.7 45.5 33.5
Female 27.4 30.0 34.2 34.7 36.9 43.6 54.1 33.8
Smoking(k) Male 29.7 34.4 29.7 25.6 21.6* 16.4 10.0 27.1
Female 26.8 ** 21.3 18.2 16.0 10.6 6.1 20.3
* Should be interpreted with caution as the relative standard error is between 25% and 50%.
** Not included as the relative standard error is greater than 50%.
(a) Age standardised to the Australian population at 30 June 1991.
(b) Persons aged 15–24 years.
(c) Persons aged 15 years and over.
(d) Most recent data are for 1989. High blood cholesterol is defined as above 5.5 mmol/L.
(e) Persons aged 20–24 years.
(f) Persons aged 65–69 years.
(g) Persons aged 20–69 years.
(h) High blood pressure is defined as systolic blood pressure ≥ 160 mm Hg and/or diastolic blood pressure ≥ 95 mm Hg and/or receiving treatment for high blood pressure.
(i) Overweight is defined as Body Mass Index (BMI) ≥ 25.
(j) Physical inactivity is defined as no leisure-time physical activity for recreation or exercise in the previous two weeks.
(k) The daily smoking of tobacco products, including packet cigarettes, roll-your-own cigarettes, pipes and cigars.
Sources: AIHW analysis of the 1995 National Health Survey and 1995 National Nutrition Survey; Risk Factor Prevalence Study Management Committee 1990.
02 AH2000 stat tables Page 392 Thursday, June 1, 2000 2:18 PM

Statistical tables 393
TRIM SIZE 175 mm Wide x 250 mm Deep
Use of hospitals Table S30: Separations from public hospitals, by age group and sex, States and Territories,1997Ð98
Age group NSW Vic Qld WA SA Tas ACT NT Total
Males
Under 1 25,586 16,342 12,608 5,916 6,380 964 919 1,619 70,334
1–4 32,779 19,738 17,849 8,768 8,758 1,453 1,303 1,586 92,234
5–14 39,815 22,865 21,397 10,276 9,687 1,915 1,548 1,340 108,843
15–24 41,599 27,943 29,460 11,190 10,458 2,569 2,436 1,652 127,307
25–34 50,372 37,465 33,919 18,172 14,884 3,946 2,457 2,731 163,946
35–44 56,557 43,170 38,479 18,871 17,101 4,221 3,871 4,625 186,895
45–54 66,933 50,877 41,854 19,821 19,037 4,687 4,245 3,838 211,292
55–64 77,202 65,174 46,375 21,060 20,839 5,814 4,445 3,221 244,130
65–74 108,680 85,736 51,233 27,299 28,261 7,444 4,530 2,191 315,374
75+ 92,155 62,257 36,702 20,212 26,593 5,965 2,273 636 246,793
Total 591,679 431,569 329,876 161,585 161,998 38,978 28,027 23,441 1,767,153
Females
Under 1 18,213 11,210 9,797 4,006 4,380 711 724 1,377 50,418
1–4 21,387 12,580 12,529 6,213 5,937 1,151 1,009 1,182 61,988
5–14 25,636 16,128 15,136 7,590 7,287 1,537 1,093 959 75,366
15–24 69,650 51,273 46,758 21,280 21,431 4,892 3,147 4,146 222,577
25–34 118,654 96,493 66,422 34,182 34,059 7,506 5,670 6,224 369,210
35–44 79,017 62,602 44,954 25,112 22,272 5,196 4,121 4,920 248,194
45–54 66,257 53,800 39,136 20,109 18,854 5,015 3,328 4,234 210,733
55–64 69,614 52,939 35,537 18,793 17,960 4,038 3,566 3,758 206,205
65–74 94,701 64,557 40,894 22,535 23,865 5,620 3,718 1,465 257,355
75+ 117,988 75,691 44,306 24,955 28,739 5,737 2,772 672 300,860
Total 681,118 497,277 355,469 184,775 184,784 41,403 29,148 28,940 2,002,914
Total separations 1,272,797 928,847 685,345 346,363 346,782 80,389 57,175 52,400 3,770,098
Note: Totals include separations for which age and/or sex was not reported.
Source: AIHW 1999.
02 AH2000 stat tables Page 393 Thursday, June 1, 2000 2:18 PM

394 AustraliaÕs Health 2000
TRIM SIZE 175 mm Wide x 250 mm Deep
Table S31: Separations from private hospitals, by age group and sex, States and Territories,1997Ð98
Age group NSW Vic Qld WA SA Tas ACT NT Total
Males
Under 1 3,332 3,150 2,360 1,274 626 626 738 n.a. 12,106
1–4 5,176 3,846 4,168 1,976 1,479 628 215 n.a. 17,488
5–14 7,049 6,026 5,599 2,712 1,899 1,032 341 n.a. 24,658
15–24 14,500 13,340 9,048 5,155 4,404 1,197 671 n.a. 48,315
25–34 18,993 15,986 10,508 6,109 5,020 1,481 537 n.a. 58,634
35–44 27,074 22,613 15,991 7,631 6,984 2,241 764 n.a. 83,298
45–54 39,216 31,723 26,578 11,209 10,520 3,508 1,083 n.a. 123,837
55–64 38,737 34,090 28,016 10,483 9,709 3,008 1,087 n.a. 125,130
65–74 47,368 42,850 36,541 12,040 12,637 4,044 1,241 n.a. 156,721
75+ 38,852 36,610 36,444 12,524 10,819 3,563 958 n.a. 139,770
Total 240,297 210,234 175,253 71,113 64,097 21,328 7,635 n.a. 789,957
Females
Under 1 2,156 2,007 1,559 896 387 495 660 n.a. 8,160
1–4 3,052 2,348 2,787 1,368 1,000 390 130 n.a. 11,075
5–14 5,956 5,232 4,524 2,260 1,685 808 235 n.a. 20,700
15–24 24,133 17,774 12,912 8,546 5,096 2,403 744 n.a. 71,608
25–34 50,411 41,951 32,397 16,535 10,575 5,103 1,879 n.a. 158,851
35–44 46,437 39,458 29,959 14,268 10,968 4,326 1,743 n.a. 147,159
45–54 46,297 42,309 32,110 13,822 13,287 4,495 1,499 n.a. 153,819
55–64 37,908 34,441 26,810 10,518 10,512 3,244 1,098 n.a. 124,531
65–74 43,493 40,785 33,505 9,999 12,728 3,833 1,039 n.a. 145,382
75+ 44,140 47,660 36,262 11,030 17,085 4,572 908 n.a. 161,657
Total 303,999 273,965 212,825 89,242 83,323 29,669 9,935 n.a. 1,002,958
Total separations 544,351 484,201 388,078 160,358 147,420 50,997 17,571 n.a. 1,792,976
Note: Totals include separations for which age and/or sex was not reported.
Source: AIHW 1999.
02 AH2000 stat tables Page 394 Thursday, June 1, 2000 2:18 PM

Statistical tables 395
TRIM SIZE 175 mm Wide x 250 mm Deep
Table S32: Patient-days in public hospitals, by age group and sex, States and Territories,1997Ð98(a)
Age group NSW Vic Qld WA SA Tas ACT NT Total
Males
Under 1 128,242 90,705 61,661 31,832 30,319 4,343 7,198 11,240 365,540
1–4 64,392 35,590 33,394 18,188 15,540 2,732 2,933 7,097 179,866
5–14 79,855 45,036 72,626 24,774 19,951 4,205 3,673 5,057 255,177
15–24 175,560 91,404 174,292 45,563 38,061 8,416 10,034 7,160 550,490
25–34 252,224 120,330 173,207 65,306 49,661 17,982 7,904 10,214 696,828
35–44 213,862 138,006 163,151 62,007 53,917 32,993 13,974 13,731 691,641
45–54 274,117 165,420 173,645 75,563 65,338 16,116 12,425 11,253 793,877
55–64 374,446 216,218 196,317 81,876 76,905 20,912 15,430 10,874 992,978
65–74 580,883 360,979 250,083 115,074 137,215 41,719 23,002 9,877 1,518,832
75+ 687,921 437,745 270,916 149,148 203,419 49,039 17,940 4,814 1,820,942
Total 2,831,520 1,701,448 1,569,292 669,331 690,326 198,457 114,513 91,337 7,866,224
Females
Under 1 99,416 69,192 51,977 23,621 25,612 4,164 5,291 10,171 289,444
1–4 43,970 22,906 23,877 13,426 11,410 2,004 2,018 5,994 125,605
5–14 57,807 34,959 33,126 19,369 15,502 3,327 2,636 4,023 170,749
15–24 208,225 134,380 125,873 67,323 53,860 14,922 9,487 14,111 628,181
25–34 399,124 276,274 201,875 111,361 97,726 23,042 18,105 18,653 1,146,160
35–44 268,074 177,174 156,034 80,009 67,457 16,120 12,751 13,056 790,675
45–54 234,674 157,255 143,471 69,931 58,613 15,499 11,619 10,496 701,558
55–64 267,807 180,426 170,199 65,272 61,007 19,139 18,341 8,339 790,530
65–74 489,553 311,301 216,353 111,184 118,870 38,967 18,987 5,432 1,310,647
75+ 1,066,911 662,837 398,002 229,838 286,489 61,347 29,496 5,350 2,740,270
Total 3,135,563 2,027,013 1,520,787 791,334 796,546 198,531 128,731 95,643 8,694,148
Total patient- days 5,967,083 3,728,462 3,090,079 1,460,677 1,486,872 396,996 243,244 187,016 16,560,429
(a) Information on patient-days has been updated since it was published in AIHW 1999.
Note: Totals include separations for which age and/or sex was not reported.
Source: AIHW 1999.
02 AH2000 stat tables Page 395 Thursday, June 1, 2000 2:18 PM

396 AustraliaÕs Health 2000
TRIM SIZE 175 mm Wide x 250 mm Deep
Table S33: Patient-days in private hospitals, by age group and sex, States and Territories,1997Ð98(a)
Age group NSW Vic Qld WA SA Tas ACT NT Total
Males
Under 1 16,227 12,744 11,956 5,968 2,301 2,552 4,085 n.a. 55,838
1–4 7,121 4,558 5,525 2,496 1,619 790 223 n.a. 22,427
5–14 12,153 12,092 8,242 3,487 2,479 1,674 390 n.a. 40,518
15–24 24,687 27,799 17,129 8,473 8,529 2,415 1,035 n.a. 90,066
25–34 35,724 40,608 20,570 11,532 9,651 3,099 931 n.a. 122,115
35–44 51,222 47,539 34,022 15,183 15,464 5,234 1,564 n.a. 170,228
45–54 85,271 72,523 65,285 24,984 25,182 9,122 2,696 n.a. 285,063
55–64 97,530 86,823 73,195 28,127 27,455 8,893 3,592 n.a. 325,615
65–74 154,371 148,791 137,983 46,498 43,550 15,740 4,807 n.a. 551,740
75+ 183,413 203,856 212,840 70,775 56,528 19,590 5,992 n.a. 752,994
Total 667,719 657,333 586,747 217,523 192,758 69,109 25,315 n.a. 2,416,504
Females
Under 1 12,750 9,825 9,904 5,121 1,879 2,294 3,783 n.a. 45,556
1–4 4,219 2,792 3,895 1,705 1,115 558 131 n.a. 14,415
5–14 11,130 9,281 6,717 2,983 2,272 1,365 290 n.a. 34,038
15–24 45,095 40,088 29,166 16,056 11,224 5,637 1,523 n.a. 148,789
25–34 144,649 137,542 102,216 54,310 36,474 16,206 7,632 n.a. 499,029
35–44 113,474 108,977 80,662 39,831 34,193 12,746 5,945 n.a. 395,828
45–54 111,235 110,534 81,080 36,393 38,942 13,086 4,642 n.a. 395,912
55–64 102,074 101,145 73,914 31,002 34,690 11,214 3,845 n.a. 357,884
65–74 152,754 159,594 129,529 41,773 56,478 18,053 5,029 n.a. 563,210
75+ 265,661 347,064 270,531 75,935 126,734 30,716 6,726 n.a. 1,123,369
Total 963,076 1,026,842 787,614 305,109 344,001 111,875 39,546 n.a. 3,578,063
Total patient- days 1,630,910 1,684,185 1,374,361 522,636 536,759 180,984 64,866 n.a. 5,994,701
(a) Information on patient-days has been updated since it was published in AIHW 1999.
Note: Totals include separations for which age and/or sex was not reported.
Source: AIHW 1999.
02 AH2000 stat tables Page 396 Thursday, June 1, 2000 2:18 PM

Statistical tables 397
TRIM SIZE 175 mm Wide x 250 mm Deep
Table S34: Separations, same-day separations, patient-days and average length of stay by principal diagnosis, grouped into ICD-9-CM chapters, public hospitals, 1997Ð98
Principal diagnosis Separations
Per centsame-day
separationsPatient-days (a)
ALOS(days)
ALOS(days)
excludingsame-day
001–139 Infectious and parasitic 67,861 21.4 259,010 3.8 4.6
140–239 Neoplasms 221,538 40.4 1,181,853 5.3 8.3
240–279 Endocrine, nutritional 53,892 32.6 280,775 5.2 7.2
280–289 Blood diseases 53,060 59.3 129,169 2.4 4.5
290–319 Mental disorders 160,651 25.0 2,652,540 16.5 21.7
320–389 Nervous system diseases 152,063 54.5 470,354 3.1 5.6
390–459 Circulatory diseases 313,282 17.6 1,828,424 5.8 6.9
460–519 Respiratory diseases 260,595 12.0 1,173,208 4.5 5.0
520–579 Digestive diseases 351,952 46.6 1,023,890 2.9 4.6
580–629 Genito-urinary diseases 218,135 48.2 612,599 2.8 4.5
630–677 Complications of pregnancy 330,624 22.0 1,039,342 3.1 3.7
680–709 Skin disorders 68,104 36.6 319,765 4.7 6.8
710–739 Musculoskeletal diseases 142,081 37.3 628,340 4.4 6.5
740–759 Congenital anomalies 25,067 42.5 96,161 3.8 5.9
760–779 Perinatal diseases 39,033 8.9 378,955 9.7 10.6
780–799 Ill-defined conditions 228,293 36.5 593,884 2.6 3.5
800–999 Injuries and poisoning 328,652 28.1 1,372,673 4.2 5.4
V01–V82 Other 754,186 86.5 2,462,850 3.3 17.8
Not reported 1,029 18.2 56,637 55.0 67.0
Total 3,770,098 43.1 16,560,429 4.4 7.0
(a) Information on patient-days has been updated since it was published in AIHW 1999.
Note: ALOS = average length of stay.
Source: AIHW 1999.
02 AH2000 stat tables Page 397 Thursday, June 1, 2000 2:18 PM

398 AustraliaÕs Health 2000
TRIM SIZE 175 mm Wide x 250 mm Deep
Table S35: Separations, same-day separations, patient-days and average length of stay by principal diagnosis, grouped into ICD-9-CM chapters, private hospitals, 1997Ð98
Principal diagnosis Separations
Per centsame-day
separationsPatient-days (a)
ALOS(days)
ALOS(days)
excludingsame-day
001–139 Infectious and parasitic 11,313 28.3 48,587 4.3 5.6
140–239 Neoplasms 156,532 52.9 595,599 3.8 7.0
240–279 Endocrine, nutritional 14,713 26.6 73,948 5.0 6.5
280–289 Blood diseases 14,612 53.3 37,633 2.6 4.4
290–319 Mental disorders 74,306 60.8 535,559 7.2 16.8
320–389 Nervous system diseases 143,573 67.1 240,088 1.7 3.0
390–459 Circulatory diseases 120,300 22.9 631,892 5.3 6.5
460–519 Respiratory diseases 70,899 10.8 329,843 4.7 5.1
520–579 Digestive diseases 311,589 70.3 575,739 1.8 3.9
580–629 Genito-urinary diseases 145,205 58.2 340,524 2.3 4.2
630–677 Complications of pregnancy 103,510 30.6 428,610 4.1 5.5
680–709 Skin disorders 29,874 57.6 107,438 3.6 7.1
710–739 Musculoskeletal diseases 170,302 37.2 662,923 3.9 5.6
740–759 Congenital anomalies 9,546 48.8 21,451 2.2 3.4
760–779 Perinatal diseases 9,066 6.0 66,046 7.3 7.7
780–799 Ill-defined conditions 89,795 49.4 195,062 2.2 3.3
800–999 Injuries and poisoning 74,734 22.6 392,803 5.3 6.5
V01–V82 Other 242,601 80.7 706,880 2.9 10.9
Not reported 506 54.9 4,076 8.1 16.7
Total 1,792,976 53.1 5,994,701 3.3 6.0
(a) Information on patient-days has been updated since it was published in AIHW 1999.
Note: ALOS = average length of stay.
Source: AIHW 1999.
02 AH2000 stat tables Page 398 Thursday, June 1, 2000 2:18 PM

Statistical tables 399
TRIM SIZE 175 mm Wide x 250 mm Deep
Table S36: Separations, same-day separations, patient-days and average length of stay by principal procedure, grouped into ICD-9-CM chapters, public hospitals, 1997Ð98
Principal procedure Separations
Per centsame-day
separationsPatient-days (a)
ALOS(days)
ALOS(days)
excludingsame-day
010–059 Operations on the nervous system 51,577 41.3 238,030 4.6 7.9
060–079 Operations on the endocrine system 5,433 2.9 23,177 4.3 4.4
080–169 Operations on the eye 63,053 67.1 99,620 1.6 4.8
180–209 Operations on the ear 27,566 70.9 36,600 1.3 4.6
210–299 Operations on the nose, mouth and pharynx 86,410 48.0 170,908 2.0 3.8
300–349 Operations on the respiratory system 33,901 36.4 251,046 7.4 11.6
350–399 Operations on the cardiovascular system 489,280 81.9 1,000,362 2.0 11.3
400–419 Operations on the haemic and lymphatic system 15,669 45.7 98,384 6.3 11.6
420–549 Operations on the digestive system 379,546 54.7 1,284,139 3.4 7.5
550–599 Operations on the urinary system 67,328 48.6 242,519 3.6 7.0
600–649 Operations on the male genital organs 40,858 53.3 106,732 2.6 5.6
650–719 Operations on the female genital organs 165,188 64.5 322,108 1.9 5.5
720–759 Obstetrical procedures 167,728 6.2 703,431 4.2 4.5
760–849 Operations on the musculoskeletal system 189,156 28.6 935,857 4.9 6.9
850–869 Operations on the integumentary system(b) 123,586 51.6 489,428 4.0 8.2
870–999 Miscellaneous diagnostic and therapeutic proceudres 766,870 38.1 4,997,384 6.5 10.5
No principal procedure or not reported 1,096,949 26.5 5,560,704 5.1 6.9
Total 3,770,098 43.1 16,560,429 4.4 7.0
(a) Information on patient-days has been updated since it was published in AIHW 1999.
(b) Breast, skin and subcutaneous tissue.
Source: AIHW 1999.
02 AH2000 stat tables Page 399 Thursday, June 1, 2000 2:18 PM

400 AustraliaÕs Health 2000
TRIM SIZE 175 mm Wide x 250 mm Deep
Table S37: Separations, same-day separations, patient-days and average length of stay by principal procedure, grouped into ICD-9-CM chapters, private hospitals, 1997Ð98
Principal procedure Separations
Per centsame-day
separationsPatient-days (a)
ALOS(days)
ALOS(days)
excludingsame-day
010–059 Operations on the nervous system 37,473 54.5 115,362 3.1 6.8
060–079 Operations on the endocrine system 3,414 1.6 12,987 3.8 3.9
080–169 Operations on the eye 100,754 70.5 117,474 1.2 4.0
180–209 Operations on the ear 27,389 78.1 31,602 1.2 5.3
210–299 Operations on the nose, mouth and pharynx 108,904 57.0 132,946 1.2 2.8
300–349 Operations on the respiratory system 10,499 45.6 58,713 5.6 10.3
350–399 Operations on the cardiovascular system 108,220 52.2 332,797 3.1 6.4
400–419 Operations on the haemic and lymphatic system 5,868 48.0 23,887 4.1 7.8
420–549 Operations on the digestive system 374,314 75.1 758,067 2.0 8.1
550–599 Operations on the urinary system 54,688 59.8 134,678 2.5 6.1
600–649 Operations on the male genital organs 31,832 47.5 89,328 2.8 5.3
650–719 Operations on the female genital organs 123,006 72.5 242,038 2.0 7.2
720–759 Obstetrical procedures 54,826 1.1 332,636 6.1 6.1
760–849 Operations on the musculoskeletal system 178,671 36.4 684,907 3.8 6.0
850–869 Operations on the integumentary system(b) 90,922 58.3 224,992 2.5 5.9
870–999 Miscellaneous diagnostic and therapeutic proceudres 257,579 47.2 1,468,021 5.7 10.8
No principal procedure or not reported 224,617 24.7 1,234,266 5.5 7.3
Total 1,792,976 53.1 5,994,701 3.3 6.0
(a) Information on patient-days has been updated since it was published in AIHW 1999.
(b) Breast, skin and subcutaneous tissue.
Source: AIHW 1999.
02 AH2000 stat tables Page 400 Thursday, June 1, 2000 2:18 PM
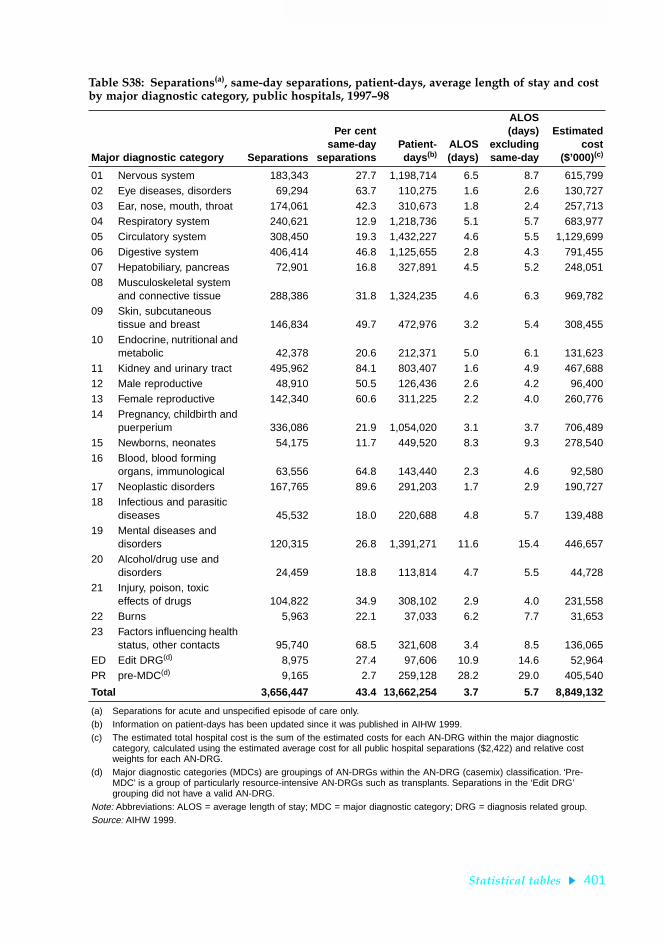
Statistical tables 401
TRIM SIZE 175 mm Wide x 250 mm Deep
Table S38: Separations(a), same-day separations, patient-days, average length of stay and cost by major diagnostic category, public hospitals, 1997Ð98
Major diagnostic category Separations
Per centsame-day
separationsPatient-days (b)
ALOS(days)
ALOS(days)
excludingsame-day
Estimatedcost
($’000)(c)
01 Nervous system 183,343 27.7 1,198,714 6.5 8.7 615,79902 Eye diseases, disorders 69,294 63.7 110,275 1.6 2.6 130,72703 Ear, nose, mouth, throat 174,061 42.3 310,673 1.8 2.4 257,71304 Respiratory system 240,621 12.9 1,218,736 5.1 5.7 683,97705 Circulatory system 308,450 19.3 1,432,227 4.6 5.5 1,129,69906 Digestive system 406,414 46.8 1,125,655 2.8 4.3 791,45507 Hepatobiliary, pancreas 72,901 16.8 327,891 4.5 5.2 248,05108 Musculoskeletal system
and connective tissue 288,386 31.8 1,324,235 4.6 6.3 969,78209 Skin, subcutaneous
tissue and breast 146,834 49.7 472,976 3.2 5.4 308,45510 Endocrine, nutritional and
metabolic 42,378 20.6 212,371 5.0 6.1 131,62311 Kidney and urinary tract 495,962 84.1 803,407 1.6 4.9 467,68812 Male reproductive 48,910 50.5 126,436 2.6 4.2 96,40013 Female reproductive 142,340 60.6 311,225 2.2 4.0 260,77614 Pregnancy, childbirth and
puerperium 336,086 21.9 1,054,020 3.1 3.7 706,48915 Newborns, neonates 54,175 11.7 449,520 8.3 9.3 278,54016 Blood, blood forming
organs, immunological 63,556 64.8 143,440 2.3 4.6 92,58017 Neoplastic disorders 167,765 89.6 291,203 1.7 2.9 190,72718 Infectious and parasitic
diseases 45,532 18.0 220,688 4.8 5.7 139,48819 Mental diseases and
disorders 120,315 26.8 1,391,271 11.6 15.4 446,65720 Alcohol/drug use and
disorders 24,459 18.8 113,814 4.7 5.5 44,72821 Injury, poison, toxic
effects of drugs 104,822 34.9 308,102 2.9 4.0 231,55822 Burns 5,963 22.1 37,033 6.2 7.7 31,65323 Factors influencing health
status, other contacts 95,740 68.5 321,608 3.4 8.5 136,065ED Edit DRG(d) 8,975 27.4 97,606 10.9 14.6 52,964PR pre-MDC(d) 9,165 2.7 259,128 28.2 29.0 405,540
Total 3,656,447 43.4 13,662,254 3.7 5.7 8,849,132
(a) Separations for acute and unspecified episode of care only.(b) Information on patient-days has been updated since it was published in AIHW 1999.(c) The estimated total hospital cost is the sum of the estimated costs for each AN-DRG within the major diagnostic
category, calculated using the estimated average cost for all public hospital separations ($2,422) and relative cost weights for each AN-DRG.
(d) Major diagnostic categories (MDCs) are groupings of AN-DRGs within the AN-DRG (casemix) classification. ‘Pre-MDC’ is a group of particularly resource-intensive AN-DRGs such as transplants. Separations in the ‘Edit DRG’ grouping did not have a valid AN-DRG.
Note: Abbreviations: ALOS = average length of stay; MDC = major diagnostic category; DRG = diagnosis related group.Source: AIHW 1999.
02 AH2000 stat tables Page 401 Thursday, June 1, 2000 2:18 PM

402 AustraliaÕs Health 2000
TRIM SIZE 175 mm Wide x 250 mm Deep
Table S39: Separations(a), same-day separations, patient-days, average length of stay and cost by major diagnostic category, private hospitals, 1997Ð98
Major diagnostic category Separations
Per centsame-day
separationsPatient-days (b)
ALOS(days)
ALOS(days)
excludingsame-day
Estimatedcost
($’000)(c)
01 Nervous system 50,183 32.0 288,551 5.7 8.0 131,58002 Eye diseases, disorders 99,322 70.0 116,934 1.2 1.6 153,07803 Ear, nose, mouth, throat 132,418 56.3 180,016 1.4 1.8 137,69004 Respiratory system 57,141 10.6 342,916 6.0 6.6 138,12905 Circulatory system 103,869 16.4 507,523 4.9 5.6 342,60606 Digestive system 330,718 72.8 667,651 2.0 4.8 414,59807 Hepatobiliary, pancreas 25,525 8.9 111,923 4.4 4.7 70,26308 Musculoskeletal system
and connective tissue 222,701 35.5 928,272 4.2 5.9 646,71009 Skin, subcutaneous
tissue and breast 106,747 59.8 266,263 2.5 4.7 182,66410 Endocrine, nutritional and
metabolic 13,382 17.5 65,043 4.9 5.7 34,55411 Kidney and urinary tract 99,647 70.7 198,825 2.0 4.4 100,10712 Male reproductive 34,543 48.7 95,573 2.8 4.4 57,30913 Female reproductive 101,670 64.1 235,105 2.3 4.7 168,83014 Pregnancy, childbirth and
puerperium 106,843 29.7 444,960 4.2 5.5 220,11015 Newborns, neonates 13,243 11.9 84,086 6.3 7.1 29,52416 Blood, blood forming
organs, immunological 17,255 57.8 41,453 2.4 4.3 19,92117 Neoplastic disorders 74,210 89.8 117,840 1.6 6.8 49,95718 Infectious and parasitic
diseases 9,023 10.5 55,079 6.1 6.7 25,81919 Mental diseases and
disorders 55,407 63.8 357,168 6.4 16.0 101,14220 Alcohol/drug use and
disorders 6,721 43.1 46,536 6.9 11.4 14,98421 Injury, poison, toxic
effects of drugs 15,475 24.8 62,091 4.0 5.0 30,87022 Burns 429 19.3 2,894 6.7 8.1 1,88923 Factors influencing health
status, other contacts 63,702 79.5 148,897 2.3 7.5 95,171ED Edit DRG(d) 9,527 60.2 41,200 4.3 9.3 33,888PR Pre-MDC(d) 943 1.6 28,305 30.0 30.5 29,244
Total 1,750,644 53.3 5,435,104 3.1 5.5 3,230,637
(a) Separations for acute and unspecified episode of care only.(b) Information on patient-days has been updated since it was published in AIHW 1999.(c) The estimated total hospital cost is the sum of the estimated costs for each AN-DRG within the major diagnostic
category, calculated using the estimated average cost for all private hospital separations ($1,932) and relative cost weights for each AN-DRG.
(d) Major diagnostic categories (MDCs) are groupings of AN-DRGs within the AN-DRG (casemix) classification. Pre-MDC’ is a group of particularly resource-intensive AN-DRGs such as transplants. Separations in the ‘Edit DRG’ grouping did not have a valid AN-DRG.
Note: Abbreviations: ALOS = average length of stay; MDC = major diagnostic category; DRG = diagnosis related group.Source: AIHW 1999.
02 AH2000 stat tables Page 402 Thursday, June 1, 2000 2:18 PM

Statistical tables 403
TRIM SIZE 175 mm Wide x 250 mm Deep
Health expenditure Table S40: Proportion of recurrent expenditure on health services (current prices), by area of expenditure, 1960Ð61 to 1997Ð98 (per cent)
Area of expenditure1960–
611975–
761984–
851988–
891992–
931993–
941994–
951995–
961996–
971997–
98
Total hospitals 37.9 46.1 43.9 41.8 38.6 37.7 37.6 37.5 37.9 38.4
Recognised public hospitals (a) 34.8 32.7 31.5 28.2 27.8 27.8 28.3 28.5 29.2
Repatriation hospitals (a) 1.8 1.6 1.7 1.5 1.0 0.6 — — —
Private hospitals (a) 4.5 5.6 5.6 7.3 7.5 7.8 8.1 8.4 8.3
Public psychiatric hospitals 5.5 5.0 4.0 3.0 1.6 1.4 1.3 1.1 1.0 0.9
Nursing homes 4.3 7.5 9.2 8.7 8.1 7.8 7.5 7.5 7.5 7.5
Ambulance 0.9 1.3 1.7 1.4 1.4 1.4 1.2 1.3 1.2 1.5
Other institutional (nec) n.a. 0.1 0.2 0.2 0.2 0.3 0.3 0.4 — —
Total institutional 43.2 54.9 55.0 52.1 48.3 47.2 46.6 46.7 46.6 47.4
Medical services 15.4 18.2 17.6 18.1 19.6 20.0 20.2 20.0 19.6 19.3
Other professional services 0.1 (b) 1.8 3.2 4.0 3.7 3.6 3.6 3.4 3.9 3.8
Total pharmaceuticals 22.2 11.1 8.7 9.0 10.4 11.0 11.6 11.8 12.1 12.1
Benefit-paid pharmaceuticals (c) 8.1 5.6 5.3 6.0 6.6 7.0 7.6 7.8 7.7
All other pharmaceuticals (c) 3.0 3.1 3.7 4.5 4.4 4.6 4.2 4.3 4.5
Aids and appliances 2.2 1.4 2.0 2.1 2.2 2.2 2.1 2.0 2.0 1.9
Community and public health(d) 4.2 3.5 3.9 4.4 4.9 5.2 4.7 5.1 5.0 4.8
Dental services 7.5 (b) 4.2 4.7 5.2 5.9 6.0 5.9 6.0 6.1 5.9
Administration 3.3 4.2 3.5 3.6 3.6 3.2 3.6 3.3 3.0 3.3
Research 1.7 0.7 1.4 1.4 1.5 1.6 1.6 1.6 1.6 1.5
Total non-institutional 56.8 45.1 45.0 47.9 51.7 52.8 53.4 53.3 53.4 52.6
Total recurrent expenditure 100.0 100.0 100.0 100.0 100.0 100.0 100.0 100.0 100.0 100.0
(a) Separate estimates not available, included in total hospitals.
(b) Some other professional services were included with dental services in 1960–61 data.
(c) Separate estimates not available, included in total pharmaceuticals.
(d) Includes expenditure classified as ‘Other non-institutional’.
Source: AIHW Health Expenditure Database.
02 AH2000 stat tables Page 403 Thursday, June 1, 2000 2:18 PM

404 AustraliaÕs Health 2000
TRIM SIZE 175 mm Wide x 250 mm Deep
Table S41: Total health services expenditure (current prices), by area of expenditure and source of funds, 1997Ð98(a) ($ million)
Area of expenditure
Government sector Non-government sector
Total allsectors
Common-wealth
Stateand
local Total
Healthinsurance
fundsIndi-
viduals Other (b) Total
Total hospitals 6,343 6,437 12,780 2,607 418 1,095 4,120 16,900
Recognised public hospitals 5,771 6,080 11,851 311 79 595 986 12,836
Private hospitals 550 — 550 2,295 321 493 3,109 3,658
Repatriation hospitals 15 — 15 — — — — 15
Public psychiatric hospitals 7 357 365 — 18 7 25 390
Nursing homes 2,575 137 2,712 — 608 — 608 3,320
Ambulance 90 281 370 106 129 38 273 643
Total institutional 9,007 6,855 15,862 2,712 1,155 1,133 5,000 20,863
Medical services 6,970 — 6,970 217 897 419 1,533 8,503
Other professional services 219 — 219 214 1,046 173 1,434 1,653
Total pharmaceuticals 2,785 16 2,801 34 2,463 37 2,534 5,335
Benefit paid pharmaceuticals 2,783 — 2,783 — 593 — 593 3,377
All other pharmaceuticals 2 16 18 34 1,869 37 1,941 1,959
Aids and appliances 174 — 174 177 435 38 649 823
Other non-institutional services 1,380 2,086 3,466 1,080 1,611 8 2,699 6,165
Community and public health(c) 775 1,357 2,132 1 — — 1 2,133
Dental services 76 328 404 568 1,611 8 2,187 2,591
Administration 529 401 930 511 — — 511 1,441
Research 427 96 523 — — 129 129 652
Total non-institutional 11,956 2,197 14,154 1,721 6,452 805 8,978 23,132
Total recurrent expenditure 20,964 9,053 30,016 4,434 7,606 1,938 13,978 43,994
Capital expenditure 70 1,400 1,470 n.a. n.a. n.a. 994 (d) 2,464
Capital consumption 34 538 572 .. .. .. .. (e) 572
Total health expenditure 21,068 10,990 32,058 n.a. n.a. n.a. 14,972 47,030
(a) This table shows the amounts provided by the Commonwealth Government, State and Territory Governments, local government authorities and by the non-government sector to fund expenditure on health services. It does not show gross outlays on health services by the different levels of government or by the non-government sector.
(b) ‘Other’ includes expenditure on health services by providers of Workers’ Compensation and Compulsory Motor Vehicle Third Party insurance cover.
(c) Includes expenditure classified as ‘Other non-institutional’.
(d) Capital outlays for the non-government sector cannot be allocated according to ‘source of funds’.
(e) Private capital consumption (depreciation) expenditure is included as part of recurrent expenditure.
Source: AIHW Health Expenditure Database.
02 AH2000 stat tables Page 404 Thursday, June 1, 2000 2:18 PM

Statistical tables 405
TRIM SIZE 175 mm Wide x 250 mm Deep
Tab
le S
42:
An
nu
al g
row
th i
n r
ecu
rren
t ex
pen
dit
ure
on
hea
lth
ser
vice
s (c
onst
ant
pri
ces)
(a) , b
y ar
ea o
f ex
pen
dit
ure
, 196
0Ð61
to
1997
Ð98
(per
cen
t)
Are
a of
exp
endi
ture
1960
–61 to
1974
–75
1975
–76 to
1984
–85
1984
–85 to
1988
–89
1988
–89 to
1992
–93
1993
–94 to
1994
–95
1994
–95 to
1995
–96
1995
–96 to
1996
–97
1996
–97 to
1997
–98
1960
–61 to
1997
–98
1975
–76 to
1997
–98
1992
–93 to
1997
–98
Tota
l hos
pita
ls6.
42.
44.
02.
34.
25.
35.
34.
74.
63.
14.
2
Rec
ogni
sed
publ
ic h
ospi
tals
(b)
2.3
4.3
1.5
4.7
7.1
5.3
5.6
n.a.
3.1
5.0
Rep
atria
tion
hosp
itals
(b)
1.7
7.2
1.2
–35.
1–9
3.4
3.6
–8.9
n.a.
–13.
0–5
0.9
Priv
ate
hosp
itals
(b)
5.4
5.1
11.4
9.6
8.9
7.8
2.8
n.a.
6.8
7.2
Pub
lic p
sych
iatr
ic h
ospi
tals
5.1
0.5
–2.0
–11.
4–4
.2–7
.3–1
1.1
–6.5
–0.5
–3.9
–6.9
Nur
sing
hom
es9.
35.
43.
82.
41.
05.
64.
93.
36.
14.
02.
9
Am
bula
nce
8.1
5.8
1.4
4.6
–7.6
11.8
–3.0
24.1
5.9
4.5
4.6
Oth
er in
stitu
tiona
l (ne
c)n.
a.12
.015
.21.
65.
27.
6—
—n.
a.n.
a.—
Tota
l ins
titut
iona
l6.
83.
03.
92.
43.
45.
54.
24.
94.
30.
1–2
6.7
Med
ical
ser
vice
s7.
73.
06.
45.
05.
74.
92.
91.
96.
14.
34.
3
Oth
er p
rofe
ssio
nal s
ervi
ces
30.0
(c)
9.9
11.8
0.9
4.1
1.2
17.8
0.9
15.5
7.4
5.0
Tota
l pha
rmac
eutic
als
3.7
2.3
3.6
7.4
7.1
6.7
4.1
4.0
3.8
4.3
6.0
Ben
efit-
paid
pha
rmac
eutic
als
(d)
0.9
1.3
6.6
6.8
14.5
4.6
1.8
n.a.
3.6
8.2
All
othe
r ph
arm
aceu
tical
s(d
)5.
67.
58.
47.
5–5
.03.
47.
9n.
a.5.
82.
8
Aid
s an
d ap
plia
nces
5.8
9.4
3.7
5.0
–3.0
–1.3
2.3
–3.7
5.0
5.3
–0.3
Oth
er n
on-in
stitu
tiona
l ser
vice
s6.
22.
75.
35.
22.
75.
41.
01.
44.
83.
62.
6
Com
mun
ity a
nd p
ublic
hea
lth2.
75.
58.
96.
7–5
.414
.62.
4–0
.15.
05.
44.
0
Den
tal s
ervi
ces
7.6
(c)
2.8
3.2
4.7
1.5
4.2
3.0
–2.2
4.8
3.0
1.6
Adm
inis
trat
ion
6.3
1.1
5.5
4.4
18.6
–2.9
–5.0
11.2
4.5
2.8
2.6
Res
earc
h–7
.112
.44.
75.
28.
95.
85.
2–6
.34.
17.
94.
8
Tota
l non
-inst
itutio
nal
5.8
3.5
5.7
5.2
4.8
5.1
3.7
1.7
5.1
4.4
4.1
Tota
l rec
urre
nt e
xpen
ditu
re6.
33.
24.
83.
84.
15.
33.
93.
25.
03.
84.
0
(a)
See
Box
5.2
, pa
ge 2
36,
for
expl
anat
ion
of c
onst
ant
pric
e es
timat
ing
met
hod.
(b
)S
epar
ate
estim
ates
not
ava
ilabl
e, in
clud
ed in
tot
al h
ospi
tals
.(c
)S
ome
othe
r pr
ofes
sion
al s
ervi
ces
wer
e in
clud
ed w
ith d
enta
l ser
vice
s in
196
0–61
dat
a.(d
)S
epar
ate
estim
ates
not
ava
ilabl
e, in
clud
ed in
tot
al p
harm
aceu
tical
s.S
ourc
e: A
IHW
Hea
lth E
xpen
ditu
re D
atab
ase.
02 AH2000 stat tables Page 405 Thursday, June 1, 2000 2:18 PM

406 AustraliaÕs Health 2000
TRIM SIZE 175 mm Wide x 250 mm Deep
Table S43: Total recurrent expenditure on health services, constant prices(a), by area of expenditure, selected years ($ million)
Area of expenditure 1960–61 1974–75 1975–76 1984–85 1988–89 1992–93 1997–98
Total hospitals 3,191 7,573 8,644 10,740 12,571 13,747 16,900
Recognised public hospitals (b) 5,765 6,522 7,996 9,476 10,063 12,836
Repatriation hospitals (b) 324 334 390 516 541 15
Private hospitals (b) 557 853 1,375 1,678 2,587 3,658
Public psychiatric hospitals 463 928 935 979 902 556 390
Nursing homes 366 1,269 1,403 2,250 2,612 2,874 3,320
Ambulance 78 233 245 405 429 513 643
Other institutional (nec) n.a. 13 15 41 73 77 —
Total institutional 3,635 9,087 10,307 13,436 15,684 17,211 20,863
Medical services 942 2,659 3,390 4,427 5,668 6,897 8,503
Other professional services 460 1,278 1,366 1,758 1,991 2,395 2,591
Total pharmaceuticals 1,354 2,263 2,110 2,600 3,001 3,986 5,335
Benefit-paid pharmaceuticals (c) 1,442 1,541 1,675 1,765 2,277 3,377
All other pharmaceuticals (c) 821 569 926 1,236 1,709 1,959
Aids and appliances 137 302 264 593 687 836 823
Other non-institutional services 1,091 2,452 2,736 3,568 4,395 5,396 6,165
Community and public health 350 509 586 948 1,335 1,733 2,133
Dental services 460 1,278 1,366 1,758 1,991 2,395 2,591
Administration 281 665 783 862 1,069 1,268 1,441
Research 146 52 122 351 422 517 652
Total non-institutional 3,678 8,114 9,044 12,357 15,441 18,943 23,132
Total recurrent expenditure 7,313 17,201 19,350 25,793 31,124 36,154 43,994
(a) See Box 5.2, page 236, for explanation of constant price estimating method.
(b) Separate estimates not available, included in total hospitals.
(c) Separate estimates not available, included in total pharmaceuticals.
Source: AIHW Health Expenditure Database.
02 AH2000 stat tables Page 406 Thursday, June 1, 2000 2:18 PM

Statistical tables 407
TRIM SIZE 175 mm Wide x 250 mm Deep
Table S44: Total health expenditure, current and constant prices (a) and average annual growth rates, 1960Ð61 to 1997Ð98
Year
Amount ($ million) Average annual growth rates (%)
Current Constant Current Constant
1960–61 692 7,313 . . . .
1963–64 870 8,505 7.9 5.2
1966–67 1,139 10,010 9.4 5.6
1969–70 1,627 12,275 12.6 7.0
1974–75 4,233 18,707 21.1 8.8
1975–76 5,684 21,423 34.3 14.5
1983–84 14,802 26,681 12.7 2.8
1984–85 16,371 27,429 10.6 2.8
1988–89 25,795 33,118 12.0 4.8
1992–93 34,993 38,304 7.9 3.7
1993–94 36,787 39,798 5.1 3.9
1994–95 38,967 41,324 5.9 3.8
1995–96 41,783 43,392 7.2 5.0
1996–97 44,482 45,330 6.5 4.5
1997–98 47,030 47,030 6.1 4.2
1960–61 to 1974–75 13.8 6.9
1975–76 to 1997–98 10.1 3.6
1960–61 to 1997–98 11.7 5.0
(a) See Box 5.2, page 236, for explanation of constant price estimating method.
Source: AIHW Health Expenditure Database.
02 AH2000 stat tables Page 407 Thursday, June 1, 2000 2:18 PM
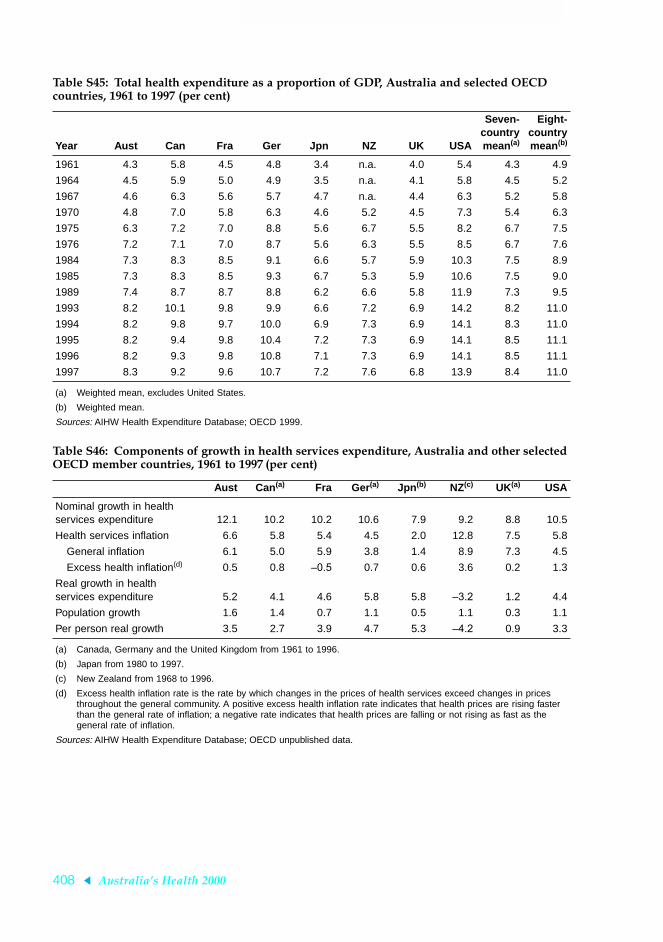
408 AustraliaÕs Health 2000
TRIM SIZE 175 mm Wide x 250 mm Deep
Table S45: Total health expenditure as a proportion of GDP, Australia and selected OECD countries, 1961 to 1997 (per cent)
Year Aust Can Fra Ger Jpn NZ UK USA
Seven-countrymean(a)
Eight-countrymean(b)
1961 4.3 5.8 4.5 4.8 3.4 n.a. 4.0 5.4 4.3 4.9
1964 4.5 5.9 5.0 4.9 3.5 n.a. 4.1 5.8 4.5 5.2
1967 4.6 6.3 5.6 5.7 4.7 n.a. 4.4 6.3 5.2 5.8
1970 4.8 7.0 5.8 6.3 4.6 5.2 4.5 7.3 5.4 6.3
1975 6.3 7.2 7.0 8.8 5.6 6.7 5.5 8.2 6.7 7.5
1976 7.2 7.1 7.0 8.7 5.6 6.3 5.5 8.5 6.7 7.6
1984 7.3 8.3 8.5 9.1 6.6 5.7 5.9 10.3 7.5 8.9
1985 7.3 8.3 8.5 9.3 6.7 5.3 5.9 10.6 7.5 9.0
1989 7.4 8.7 8.7 8.8 6.2 6.6 5.8 11.9 7.3 9.5
1993 8.2 10.1 9.8 9.9 6.6 7.2 6.9 14.2 8.2 11.0
1994 8.2 9.8 9.7 10.0 6.9 7.3 6.9 14.1 8.3 11.0
1995 8.2 9.4 9.8 10.4 7.2 7.3 6.9 14.1 8.5 11.1
1996 8.2 9.3 9.8 10.8 7.1 7.3 6.9 14.1 8.5 11.1
1997 8.3 9.2 9.6 10.7 7.2 7.6 6.8 13.9 8.4 11.0
(a) Weighted mean, excludes United States.
(b) Weighted mean.
Sources: AIHW Health Expenditure Database; OECD 1999.
Table S46: Components of growth in health services expenditure, Australia and other selected OECD member countries, 1961 to 1997 (per cent)
Aust Can (a) Fra Ger (a) Jpn (b) NZ(c) UK(a) USA
Nominal growth in health services expenditure 12.1 10.2 10.2 10.6 7.9 9.2 8.8 10.5
Health services inflation 6.6 5.8 5.4 4.5 2.0 12.8 7.5 5.8
General inflation 6.1 5.0 5.9 3.8 1.4 8.9 7.3 4.5
Excess health inflation(d) 0.5 0.8 –0.5 0.7 0.6 3.6 0.2 1.3
Real growth in health services expenditure 5.2 4.1 4.6 5.8 5.8 –3.2 1.2 4.4
Population growth 1.6 1.4 0.7 1.1 0.5 1.1 0.3 1.1
Per person real growth 3.5 2.7 3.9 4.7 5.3 –4.2 0.9 3.3
(a) Canada, Germany and the United Kingdom from 1961 to 1996.
(b) Japan from 1980 to 1997.
(c) New Zealand from 1968 to 1996.
(d) Excess health inflation rate is the rate by which changes in the prices of health services exceed changes in prices throughout the general community. A positive excess health inflation rate indicates that health prices are rising faster than the general rate of inflation; a negative rate indicates that health prices are falling or not rising as fast as the general rate of inflation.
Sources: AIHW Health Expenditure Database; OECD unpublished data.
02 AH2000 stat tables Page 408 Thursday, June 1, 2000 2:18 PM

Statistical tables 409
TRIM SIZE 175 mm Wide x 250 mm Deep
Health labour forceTable S47: Employment in the health industry, August 1981 to August 1999
Year
Employed inhealth industry
(’000)All employed
persons (’000)
Proportion ofall employedpersons (%)
Civilian labourforce (a) (’000)
Proportion ofcivilian labour
force (a) (%)
1981 406.1 6,393.7 6.4 6,774.3 6.0
1982 424.5 6,379.3 6.7 6,840.7 6.2
1983 440.6 6,241.1 7.1 6,927.9 6.4
1984 453.6 6,466.1 7.0 7,070.1 6.4
1985 461.6 6,675.6 6.9 7,248.3 6.4
1986 489.2 6,918.6 7.1 7,516.2 6.5
1987 510.5 7,092.3 7.2 7,694.4 6.6
1988 530.7 7,353.4 7.2 7,892.1 6.7
1989 520.3 7,727.6 6.7 8,197.0 6.3
1990 557.9 7,825.0 7.1 8,412.5 6.6
1991 580.0 7,669.2 7.6 8,475.2 6.8
1992 575.3 7,679.3 7.5 8,585.7 6.7
1993 561.4 7,621.0 7.4 8,537.0 6.6
1994 547.2 7,885.7 6.9 8,683.5 6.3
1995 591.9 8,217.7 7.2 8,939.6 6.6
1996 590.2 8,319.7 7.1 9,090.8 6.5
1997 610.2 8,315.5 7.3 9,080.1 6.7
1998 598.7 8,535.9 7.0 9,261.5 6.5
1999 600.4 8,731.6 6.9 9,384.4 6.4
1989 to 1999 increase (%) 15.4 13.0 14.5
(a) Includes unemployed persons looking for work.
Sources: ABS Cat No. 6203.0; Labour Force Survey estimates on microfiche.
02 AH2000 stat tables Page 409 Thursday, June 1, 2000 2:18 PM

410 AustraliaÕs Health 2000
TRIM SIZE 175 mm Wide x 250 mm Deep
Use of professional services Table S48: Medical and optometrical services, fees and benefits under Medicare, 1992Ð93 to 1998Ð99
Year Number of
services (million)Fees charged
($ million) Schedule fees
($ million)Benefits paid
($ million)
GP attendances1992–93 93.2 2,166.2 2,353.4 1,997.81993–94 96.7 2,288.7 2,503.1 2,126.11994–95 98.4 2,361.5 2,582.7 2,195.61995–96 102.1 2,484.4 2,722.3 2,314.41996–97 102.5 2,517.8 2,752.6 2,339.71997–98 103.1 2,564.5 2,786.6 2,367.81998–99 102.6 2,605.0 2,818.6 2,395.4
Special attendances1992–93 16.3 930.9 908.0 763.31993–94 16.8 977.4 957.4 806.21994–95 17.5 1,031.2 1,005.7 847.31995–96 18.1 1,084.0 1,053.5 887.81996–97 18.2 1,109.3 1,066.6 897.71997–98 18.2 1,133.1 1,078.9 907.51998–99 18.6 1,183.3 1,119.2 941.3
Obstetrics1992–93 0.7 93.7 71.8 55.31993–94 0.7 92.0 70.0 54.11994–95 0.7 93.9 70.8 55.01995–96 1.3 100.7 74.1 58.71996–97 1.6 98.9 70.7 56.81997–98 1.6 97.4 68.2 54.91998–99 1.6 101.3 71.9 57.7
Anaesthetics1992–93 1.6 165.4 137.9 104.41993–94 1.6 171.2 142.4 107.71994–95 1.7 184.0 152.1 115.01995–96 1.7 201.6 160.6 121.61996–97 1.7 218.6 166.0 125.71997–98 1.7 225.2 168.9 127.91998–99 1.8 235.2 175.5 132.9
Pathology (a)
1992–93 39.7 734.5 757.0 634.01993–94 42.9 795.5 837.8 703.11994–95 47.0 869.9 926.3 778.31995–96 48.6 901.4 966.7 812.81996–97 50.3 945.3 1,020.2 857.81997–98 52.4 1,014.5 1,099.6 924.21998–99 55.6 1,096.3 1,199.0 1,008.4
(continued)(a) In February 1992, a patient episode initiation item was introduced artificially inflating the number of pathology services.
02 AH2000 stat tables Page 410 Thursday, June 1, 2000 2:18 PM

Statistical tables 411
TRIM SIZE 175 mm Wide x 250 mm Deep
Table S48 (continued): Medical and optometrical services, fees and benefits under Medicare, 1992Ð93 to 1998Ð99
Year Number of
services (million)Fees charged
($million) Schedule fees
($million)Benefits paid
($million)
Diagnostic imaging1992–93 9.1 762.7 765.7 655.2
1993–94 9.5 833.7 848.4 728.7
1994–95 9.9 904.2 925.9 797.1
1995–96 10.5 983.7 1,016.1 875.9
1996–97 10.4 992.2 1,029.9 880.1
1997–98 10.8 1,063.8 1,105.6 938.2
1998–99 11.4 1,199.9 1,250.9 1,064.7
Operations1992–93 4.9 718.4 643.4 509.3
1993–94 5.0 727.6 652.6 515.8
1994–95 5.2 761.6 679.6 537.2
1995–96 5.3 799.6 708.6 560.7
1996–97 5.4 841.2 736.2 682.1
1997–98 5.4 861.4 744.7 587.2
1998–99 5.5 898.0 770.6 607.8
Optometry1992–93 3.0 119.1 137.6 117.0
1993–94 3.2 125.7 145.6 123.9
1994–95 3.3 131.5 152.7 129.8
1995–96 3.6 143.2 166.9 141.9
1996–97 3.7 147.3 172.0 146.2
1997–98 3.8 144.2 167.8 142.7
1998–99 3.9 147.9 171.7 146.1
All other services (b)
1992–93 3.8 197.0 193.4 165.1
1993–94 4.2 227.9 225.0 191.2
1994–95 4.4 257.9 255.0 216.4
1995–96 4.5 283.3 280.9 238.2
1996–97 4.7 301.2 292.9 247.6
1997–98 4.8 321.0 309.8 260.7
1998–99 5.5 394.8 377.7 314.9
Total services1992–93 172.3 5,922.1 5,998.5 5,023.7
1993–94 180.6 6,275.2 6,414.0 5,380.1
1994–95 188.1 6,633.3 6,784.2 5,696.4
1995–96 196.0 7,022.4 7,185.0 6,038.4
1996–97 198.8 7,209.1 7,339.5 6,158.0
1997–98 202.2 7,460.7 7,560.1 6,333.5
1998–99 206.3 7,861.8 7,955.2 6,669.1
(a) In February 1992, a patient episode initiation item was introduced artificially inflating the number of pathology services.
(b) Includes radiotherapy and nuclear medicine therapy, assistance at operations and other miscellaneous services.
Source: DHAC 1999b.
02 AH2000 stat tables Page 411 Thursday, June 1, 2000 2:18 PM

412 AustraliaÕs Health 2000
TRIM SIZE 175 mm Wide x 250 mm Deep
Table S49: Medicare services, age-specific rates, by sex, 1991Ð92 to 1998Ð99 (services per person)
Sex/age group 1991–92 1992–93 1993–94 1994–95 1995–96 1996–97 1997–98 1998–99
Males
0–4 8.90 9.73 9.85 9.60 9.80 9.60 9.47 9.27
5–9 5.00 5.39 5.43 5.24 5.30 5.31 5.25 5.12
10–14 4.22 4.50 4.60 4.50 4.54 4.48 4.53 4.44
15–19 4.37 4.68 4.68 4.67 4.86 4.83 4.77 4.73
20–24 4.57 4.90 5.00 5.02 5.32 5.26 5.12 5.02
25–34 5.14 5.49 5.58 5.77 5.97 5.93 5.84 5.75
35–44 6.00 6.39 6.60 6.91 7.11 7.07 7.05 7.08
45–54 7.66 8.22 8.82 9.23 9.48 9.45 9.54 9.61
55–64 11.70 12.72 13.35 14.01 14.41 14.42 14.59 14.74
65–74 12.55 14.18 15.82 17.11 18.35 19.07 20.11 21.09
75+ 17.35 18.85 19.85 20.38 20.69 20.54 20.66 20.26
Crude rate 7.11 7.73 8.07 8.35 8.68 8.71 8.81 8.87
ASR(a) 7.24 7.85 8.20 8.45 9.01 9.01 8.79 8.81
Females
0–4 8.10 8.88 9.01 8.80 8.98 8.82 8.67 8.52
5–9 4.99 5.39 5.44 5.23 5.26 5.21 5.23 5.15
10–14 4.39 4.68 4.79 4.67 4.66 4.60 4.64 4.62
15–19 7.63 8.18 8.27 8.37 8.64 8.43 8.26 8.28
20–24 10.20 11.13 11.43 11.64 12.12 11.72 11.35 11.16
25–34 11.38 12.40 12.62 13.05 13.57 13.51 13.36 13.30
35–44 10.36 11.27 11.61 12.11 12.23 12.17 12.13 12.21
45–54 11.71 12.77 13.52 14.00 14.06 14.02 14.04 14.19
55–64 13.85 15.03 15.54 16.20 16.67 16.87 17.19 17.56
65–74 16.46 17.73 18.57 19.21 20.08 20.45 20.97 21.60
75+ 20.41 21.94 22.87 23.43 24.10 24.36 24.63 24.88
Crude rate 10.81 11.75 12.14 12.49 12.84 12.85 12.89 13.01
ASR(a) 10.61 11.51 11.88 12.19 12.28 12.24 12.46 12.53
(a) Age standardised to the Australian population at 30 June 1991.
Sources: HIC 1992, 1993, 1994, 1995, 1996, 1997, 1998, 1999.
02 AH2000 stat tables Page 412 Thursday, June 1, 2000 2:18 PM

Statistical tables 413
TRIM SIZE 175 mm Wide x 250 mm Deep
Table S50: Medicare services, age-specific rates, by sex, States and Territories, 1998Ð99 (services per person)
Sex/age group NSW Vic Qld WA SA Tas ACT NT Aust
Males
0–4 9.88 9.34 9.41 7.85 9.25 7.77 8.32 5.36 9.27
5–9 5.54 5.29 5.01 4.27 4.98 4.23 4.74 2.63 5.12
10–14 4.68 4.43 4.61 3.96 4.28 3.78 4.24 2.17 4.44
15–19 5.05 4.67 4.88 4.16 4.59 4.07 4.25 2.27 4.73
20–24 5.47 5.18 4.95 4.11 4.90 4.49 4.01 2.29 5.02
25–34 6.31 5.93 5.52 4.76 5.48 5.10 4.87 3.07 5.75
35–44 7.83 7.11 6.95 5.99 6.49 5.92 5.92 4.59 7.08
45–54 10.56 9.45 9.63 8.49 8.58 8.39 8.02 6.67 9.61
55–64 16.22 14.56 14.63 12.99 12.84 12.87 12.44 9.95 14.74
65–74 22.75 21.19 20.64 19.02 18.80 17.78 18.51 12.86 21.09
75+ 21.00 21.26 19.25 19.41 19.27 15.09 18.85 11.90 20.26
Crude rate 9.70 8.98 8.66 7.52 8.46 7.67 7.08 4.47 8.87
ASR(a) 9.54 8.88 8.69 7.71 8.16 7.46 7.65 5.28 8.81
Females
0–4 9.15 8.40 8.69 7.27 8.56 7.18 7.90 4.84 8.52
5–9 5.52 5.32 5.06 4.34 4.99 4.37 4.86 2.62 5.15
10–14 4.81 4.63 4.79 4.14 4.56 4.07 4.38 2.47 4.62
15–19 8.52 7.89 8.99 7.99 7.64 8.22 7.66 5.08 8.28
20–24 11.78 10.95 11.67 10.34 10.05 11.36 9.35 7.33 11.16
25–34 13.86 13.63 13.21 12.64 12.08 12.53 11.74 8.73 13.30
35–44 12.97 12.29 12.24 11.36 11.02 10.97 10.69 8.49 12.21
45–54 15.12 14.02 14.48 13.10 12.73 13.21 12.21 10.06 14.19
55–64 18.79 17.37 17.94 15.76 15.49 15.92 15.61 11.11 17.56
65–74 22.90 21.44 22.06 19.73 19.16 19.09 19.05 12.86 21.60
75+ 25.27 25.70 25.38 22.92 23.22 21.90 23.11 15.39 24.88
Crude rate 13.79 13.15 13.04 11.69 12.19 11.96 10.98 7.28 13.01
ASR(a) 13.20 12.54 12.75 11.53 11.42 11.48 11.13 8.03 12.53
(a) Age standardised to the Australian population at 30 June 1991.
Source: HIC 1999.
02 AH2000 stat tables Page 413 Thursday, June 1, 2000 2:18 PM

414 AustraliaÕs Health 2000
TRIM SIZE 175 mm Wide x 250 mm Deep
Table S51: Medicare services, percentage of enrolled persons by number of items, by age group and sex, 1998Ð99
Sex/age group
Number of services
0 1 2 3 4 5 or more
Males
0–4 8.60 5.93 6.70 7.00 6.98 64.79
5–9 12.83 11.85 11.32 10.05 8.65 45.30
10–14 18.28 14.95 12.77 10.52 8.46 35.02
15–19 19.52 14.93 12.19 9.84 7.84 35.68
20–24 21.20 14.02 11.15 8.88 7.22 37.53
25–34 23.74 13.81 10.56 8.26 6.73 36.90
35–44 21.30 12.66 9.65 7.58 6.30 42.51
45–54 16.34 10.79 8.20 6.55 5.72 52.40
55–64 11.98 7.10 5.63 4.81 4.49 65.99
65–74 10.79 3.94 3.48 3.15 3.15 75.49
75+ 24.87 3.81 3.10 2.49 2.53 63.20
All ages 17.94 11.00 8.92 7.33 6.24 48.57
Females
0–4 9.17 6.72 7.46 7.70 7.61 61.34
5–9 13.26 12.31 11.50 10.14 8.68 44.11
10–14 18.12 15.14 12.90 10.47 8.39 34.98
15–19 13.97 12.18 10.84 8.99 7.51 46.51
20–24 7.87 6.31 6.44 6.30 6.07 67.01
25–34 9.28 5.56 5.33 5.39 5.30 69.14
35–44 9.99 6.64 5.78 5.95 5.71 65.93
45–54 8.21 5.95 5.09 5.10 5.04 70.61
55–64 7.09 4.26 3.96 3.96 4.02 76.71
65–74 8.23 2.97 2.86 2.86 3.01 80.07
75+ 15.84 2.04 2.10 2.09 2.24 75.69
All ages 10.57 6.84 6.28 5.95 5.56 64.80
Source: HIC 1999.
02 AH2000 stat tables Page 414 Thursday, June 1, 2000 2:18 PM

Statistical tables 415
TRIM SIZE 175 mm Wide x 250 mm Deep
National Health Priority Areas Table S52: Indicators for cardiovascular health
Descriptor
Baseline Most recent data
Year Value Year Value
Incidence rate for myocardial infarction, ages 30–79 (a) (events per 100,000 population)
Males 1993–94 441 1997–98 377
Females 1993–94 144 1997–98 119
Hospital separation rate for principal diagnosis of unstable angina pectoris, ages 0–79 (per 100,000 population)
Males 1993–94 178 1997–98 333
Females 1993–94 100 1997–98 166
Hospital separation rate for principal diagnosis of congestive heart failure, ages 0–79 (per 100,000 population)
Males 1993–94 102 1997–98 98
Females 1993–94 63 1997–98 56
Death rate for coronary heart disease, ages 0–79 (deaths per 100,000 population)
Males 1986 200.8 1998 103.3
Females 1986 87.9 1998 41.6
Death rate for coronary heart disease among rural and remote area residents, ages 0–79 (deaths per 100,000 population)
Males, remote 1988–90 199.9 1996–98 143.8
Males, rural 1988–90 182.3 1996–98 118.7
Males, urban 1988–90 174.3 1996–98 106.6
Females, remote 1988–90 100.3 1996–98 63.6
Females, rural 1988–90 81.5 1996–98 47.8
Females, urban 1988–90 73.6 1996–98 43.9
Proportion of people whose main/underlying disabling condition is stroke, ages 25 or more (b) (per 100,000 population)
Males 1993 297 1998 474
Females 1993 268 1998 490
Death rate for stroke, ages 0–79 (deaths per 100,000 population)
Males 1986 47.4 1998 26.4
Females 1986 36.4 1998 19.5
Death rate for stroke among rural and remote area residents, ages 0–79 (deaths per 100,000 population)
Males, remote 1988–90 49.7 1996–98 31.3
Males, rural 1988–90 42.0 1996–98 29.8
Males, urban 1988–90 41.0 1996–98 27.9
Females, remote 1988–90 37.7 1996–98 27.0
Females, rural 1988–90 31.6 1996–98 21.8
Females, urban 1988–90 30.9 1996–98 20.5
(continued)(a) Currently data are available only for ages 35–69. Rates are standardised to the 1993 Australian population.(b) Although the prevalence of stroke may have increased between 1993 and 1998, a change in the data collection method
may also have contributed to the increased reported rate. In 1993, it was based on the underlying cause of the main disabling condition, whereas in 1998, survey participants were asked directly whether they had had a stroke.
02 AH2000 stat tables Page 415 Thursday, June 1, 2000 2:18 PM

416 AustraliaÕs Health 2000
TRIM SIZE 175 mm Wide x 250 mm Deep
Table S52 (continued): Indicators for cardiovascular health
Descriptor
Baseline Most recent data
Year Value Year Value
Hospital separation rate for major amputation for peripheral vascular disease, ages 0–79 (per 100,000 population)
Males 1993–94 0.8 1997–98 3.6
Females 1993–94 0.3 1997–98 1.5
Hospital separation rate for emergency and elective surgery for abdominal aortic aneurysm, ages 0–79 (per 100,000 population)
Males 1993–94 19.0 1997–98 17.8
Females 1993–94 3.4 1997–98 3.3
(a) Currently data are available only for ages 35–69. Rates are standardised to the 1993 Australian population.(b) Although the prevalence of stroke may have increased between 1993 and 1998, a change in the data collection
methods may also have contributed to the increased rate reported. In 1993, it was based on the underlying cause ofthe main disabling condition, whereas in 1998, survey participants were asked directly whether they had had a stroke.
Note: Except for the incidence of myocardial infarction, rates have been age standardised to the 1991 Australian population.Sources: AIHW National Mortality Database; AIHW National Hospital Morbidity Database; DHAC & AIHW 1999a.
02 AH2000 stat tables Page 416 Thursday, June 1, 2000 2:18 PM

Statistical tables 417
TRIM SIZE 175 mm Wide x 250 mm Deep
Table S53: Indicators for health risk factors
Descriptor
Baseline Most recent data
Year Value Year Value
Proportion of adults who smoke regularly, ages 18 or more (per cent)
Males 1989–90 31.6 1995 27.1
Females 1989–90 25.1 1995 20.8
Proportion of secondary school students who smoke, age 15 (per cent) (a)
Males 1984 29 1996 24
Females 1984 34 1996 29
Proportion of adults not engaged in regular physical activity, ages 18 or more (per cent)
Males 1989–90 35.6 1995 33.5
Females 1989–90 36.0 1995 33.8
Proportion of adults who are overweight, ages 18 or more (per cent)
Males 1989–90 44.4 1995 51.0
Females 1989–90 30.9 1995 36.1
Proportion of adults with high blood pressure and/or on antihypertensive treatment, ages 20–69 (per cent)
Males 1989 19.5 1995 17.1
Females 1989 12.6 1995 10.1
Mean blood pressure levels, ages 20–69 (mm Hg)
Males, systolic BP 1989 129 1995 128
Males, diastolic BP 1989 82 1995 78
Females, systolic BP 1989 122 1995 122
Females, diastolic BP 1989 76 1995 74
Proportion of adults with high blood cholesterol, ages 20–69 (per cent)
Males 1989 46.6 n.a. n.a.
Females 1989 38.6 n.a. n.a.
Contribution of saturated fat as a proportion of total energy intake, ages 25–64 (per cent)
Males 1983 15.9 1995 12.7
Females 1983 16.3 1995 12.8
(a) Age-specific smoking rate among 15-year-olds.
Note: Age standardised to the 1991 Australian population.
Source: DHAC & AIHW 1999a.
02 AH2000 stat tables Page 417 Thursday, June 1, 2000 2:18 PM

418 AustraliaÕs Health 2000
TRIM SIZE 175 mm Wide x 250 mm Deep
Table S54: Indicators for cancer control
Descriptor
Baseline Most recent data
Year Value Year Value
Incidence of cancer of the trachea, bronchus and lung (new cases per 100,000 population)Males 1983 74.8 1996 60.1Females 1983 17.1 1996 23.0
Death rate for cancer of the trachea, bronchus and lung (deaths per 100,000 population)Males 1986 64.4 1998 53.1Females 1986 16.1 1998 18.6
Incidence of melanoma of the skin (new cases per 100,000 population)Males 1988 40.1 1996 48.0Females 1988 32.9 1996 35.0
Death rate for melanoma of the skin (deaths per 100,000 population)Males 1991 6.5 1998 6.9Females 1991 3.2 1998 3.0
Incidence of (treated) non-melanocytic skin cancer (new cases per 100,000 population)Males 1990 1,187 n.a. n.a.Females 1990 769 n.a. n.a.
Death rate for non-melanocytic skin cancer (deaths per 100,000 population)Males 1991 2.8 1998 2.5Females 1991 0.6 1998 0.8
Incidence of cervical cancer among women aged 20–74 years (new cases per 100,000 population)Females 1988 17.6 1996 13.0
Death rate for cervical cancer among women aged 20–74 years (deaths per 100,000 population)Females 1991 4.3 1998 2.9
Incidence of breast cancer among women aged 50–74 years (new cases per 100,000 population)Females 1988 202.4 1997 286.0
Death rate for breast cancer among women aged 50–74 years (deaths per 100,000 population)Females 1992 68.7 1998 62.6
Incidence of colorectal cancer (new cases per 100,000 population)Males 1988 60.2 1996 69.2Females 1988 42.0 1996 46.0
Death rate for colorectal cancer (deaths per 100,000 population)Males 1992 29.7 1998 27.3Females 1992 19.7 1998 18.6
Incidence of prostate cancer (new cases per 100,000 population)Males 1988 68.4 1996 117.4
Death rate for prostate cancer (deaths per 100,000 population)Males 1992 33.7 1998 29.2
Proportion of females aged 50–69 years screened for breast cancer (per cent)Females 1996–97 52.2 n.a. n.a.
Proportion of females aged 20–69 years screened within specified intervals for cervical cancer (per cent)Females 1996–97 62.4 n.a. n.a.
Five-year survival rate for breast cancer (per cent)Females 1982–94 76.8 n.a. n.a.
Note: Age standardised to the Australian population at 30 June 1991.Sources: AIHW National Mortality Database; AIHW National Hospital Morbidity Database; DHFS & AIHW 1998a.
02 AH2000 stat tables Page 418 Thursday, June 1, 2000 2:18 PM
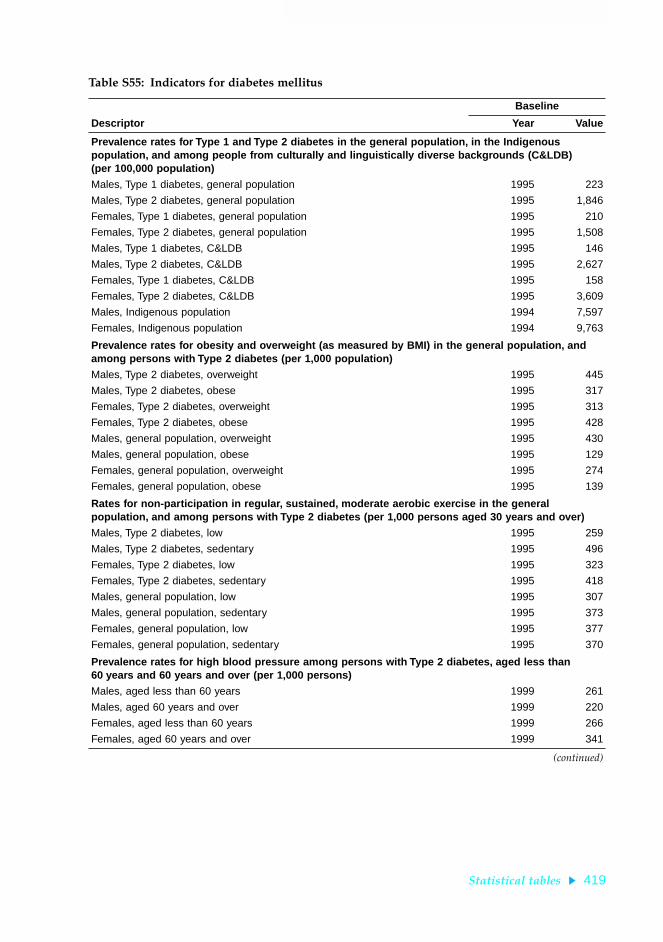
Statistical tables 419
TRIM SIZE 175 mm Wide x 250 mm Deep
Table S55: Indicators for diabetes mellitus
Descriptor
Baseline
Year Value
Prevalence rates for Type 1 and Type 2 diabetes in the general population, in the Indigenous population, and among people from culturally and linguistically diverse backgrounds (C&LDB)(per 100,000 population)
Males, Type 1 diabetes, general population 1995 223
Males, Type 2 diabetes, general population 1995 1,846
Females, Type 1 diabetes, general population 1995 210
Females, Type 2 diabetes, general population 1995 1,508
Males, Type 1 diabetes, C&LDB 1995 146
Males, Type 2 diabetes, C&LDB 1995 2,627
Females, Type 1 diabetes, C&LDB 1995 158
Females, Type 2 diabetes, C&LDB 1995 3,609
Males, Indigenous population 1994 7,597
Females, Indigenous population 1994 9,763
Prevalence rates for obesity and overweight (as measured by BMI) in the general population, and among persons with Type 2 diabetes (per 1,000 population)
Males, Type 2 diabetes, overweight 1995 445
Males, Type 2 diabetes, obese 1995 317
Females, Type 2 diabetes, overweight 1995 313
Females, Type 2 diabetes, obese 1995 428
Males, general population, overweight 1995 430
Males, general population, obese 1995 129
Females, general population, overweight 1995 274
Females, general population, obese 1995 139
Rates for non-participation in regular, sustained, moderate aerobic exercise in the general population, and among persons with Type 2 diabetes (per 1,000 persons aged 30 years and over)
Males, Type 2 diabetes, low 1995 259
Males, Type 2 diabetes, sedentary 1995 496
Females, Type 2 diabetes, low 1995 323
Females, Type 2 diabetes, sedentary 1995 418
Males, general population, low 1995 307
Males, general population, sedentary 1995 373
Females, general population, low 1995 377
Females, general population, sedentary 1995 370
Prevalence rates for high blood pressure among persons with Type 2 diabetes, aged less than 60 years and 60 years and over (per 1,000 persons)
Males, aged less than 60 years 1999 261
Males, aged 60 years and over 1999 220
Females, aged less than 60 years 1999 266
Females, aged 60 years and over 1999 341
(continued)
02 AH2000 stat tables Page 419 Thursday, June 1, 2000 2:18 PM

420 AustraliaÕs Health 2000
TRIM SIZE 175 mm Wide x 250 mm Deep
Table S55 (continued): Indicators for diabetes mellitus
Descriptor
Baseline
Year Value
Prevalence rates for high levels of lipoproteins among persons with Type 1 and Type 2 diabetes (per 1,000 persons aged 20 years and over)
Males, Type 1 diabetes 1999 208
Males, Type 2 diabetes 1999 328
Females, Type 1 diabetes 1999 260
Females, Type 2 diabetes 1999 355
Prevalence rates for fasting hypertriglyceridaemia among persons with Type 1 and Type 2 diabetes (per 1,000 persons aged 20 years and over)
Males, Type 1 diabetes 1999 14.8
Males, Type 2 diabetes 1999 107
Females, Type 1 diabetes 1999 13.3
Females, Type 2 diabetes 1999 114
Proportion of persons with end-stage renal disease with diabetic nephropathy as a causal factor (per 1,000 persons aged 25–84 years)
Type 1 1997 68.0
Type 2, non-insulin-requiring 1997 64.5
Type 2, insulin-requiring 1997 83.5
Prevalence rate for foot problems among clinically diagnosed persons with diabetes (per 1,000 persons aged 20 years and over)
Current foot ulcers 1999 20.4
Previous foot ulcers 1999 40.3
Incidence rates for myocardial infarction and stroke among clinically diagnosed persons with diabetes (per 1,000 persons aged 35–69 years)
Myocardial infarction 1999 18.6
Stroke 1999 12.6
Hospital separations for end-stage renal disease (ICD 584–585) as the principal diagnosis with diabetes (ICD 250) as an associated diagnosis (per 1,000 persons)
Males 1997–98 0.15
Females 1997–98 0.13
Hospital separations for coronary heart disease (ICD 410-414) or stroke (ICD 430-438) as the principal diagnosis with diabetes as an associated diagnosis (per 1,000 persons)
Males 1997–98 2.39
Females 1997–98 1.32
Hospital separations for diabetes both as a principal diagnosis and as an associated diagnosis with conditions other than end-stage renal disease and coronary heart disease/stroke (per 1,000 persons)
Males 1997–98 14.87
Females 1997–98 12.01
(continued)
02 AH2000 stat tables Page 420 Thursday, June 1, 2000 2:18 PM

Statistical tables 421
TRIM SIZE 175 mm Wide x 250 mm Deep
Table S55 (continued): Indicators for diabetes mellitus
Descriptor
Baseline
Year Value
Death rates for diabetes in the general population, in the Indigenous population, and among people from culturally and linguistically diverse backgrounds (C&LDB) (per 100,000 population)
Males, Indigenous population 1998 102.26
Females, Indigenous population 1998 108.69
Males, C&LDB 1998 19.84
Females, C&LDB 1998 15.32
Males, general population 1998 16.05
Females, general population 1998 10.62
Self-assessed health status of persons with and without diabetes (per 1,000 persons aged 30 years and over)
Good, very good or excellent
Males, with diabetes 1995 543
Males, without diabetes 1995 827
Females, with diabetes 1995 626
Females, without diabetes 1995 834
Fair or poor
Males, with diabetes 1995 457
Males, without diabetes 1995 173
Females, with diabetes 1995 374
Females, without diabetes 1995 166
Sources: AIHW National Mortality Database; AIHW National Hospital Morbidity Database; DHAC & AIHW 1999b; NADC 1999 Australian National Diabetes Information Audit and Benchmarking Survey unpublished data; Disney et al. 1998.
02 AH2000 stat tables Page 421 Thursday, June 1, 2000 2:18 PM

422 AustraliaÕs Health 2000
TRIM SIZE 175 mm Wide x 250 mm Deep
Table S56: Indicators for injury prevention and control
Descriptor
Baseline Most recent data
Year Value Year Value
Death rate for injury and poisoning (per 100,000 population)
Persons 1992 42.0 1998 40.8
Hospital separation rate for injury and poisoning in the total population (per 100,000 population)
Persons 1991–92 1,714 1997–98 1,932
Death rate ratio comparing the injury status of Indigenous and non-Indigenous populations
Males 1991–92 3.7 1996–98 3.0
Females 1991–92 4.2 1996–98 3.3
Death rate ratio comparing the injury status of males and females
Male:female 1992 2.6 1998 2.9
Death rate ratio comparing the injury status among people living in rural and remote areas with the general population
Males, capital cities 1991–95 0.89 1994–98 0.88
Males, other metropolitan centres 1991–95 0.98 1994–98 1.00
Males, large rural centres 1991–95 1.10 1994–98 1.12
Males, small rural centres 1991–95 1.08 1994–98 1.13
Males, other rural areas 1991–95 1.28 1994–98 1.30
Males, remote centres 1991–95 1.51 1994–98 1.63
Males, other remote areas 1991–95 1.90 1994–98 1.84
Females, capital cities 1991–95 0.94 1994–98 0.92
Females, other metropolitan centres 1991–95 0.98 1994–98 1.04
Females, large rural centres 1991–95 0.98 1994–98 1.00
Females, small rural centres 1991–95 1.03 1994–98 1.02
Females, other rural areas 1991–95 1.19 1994–98 1.19
Females, remote centres 1991–95 1.33 1994–98 1.74
Females, other remote areas 1991–95 1.96 1994–98 1.87
Death rate for road transport-related injury in the total population, and among males aged 15–24 years (per 100,000 population)
Total population 1992 12.0 1998 9.4
Males aged 15–24 years 1992 31.5 1998 27.0
Hospital separation rate for road transport-related injury in the total population, and among males aged 15–24 years (per 100,000 population)
Total population 1990 232 1997–98 234
Males aged 15–24 years 1990 858 1997–98 596
Death rate due to falls among people aged 65 years and over (per 100,000 population)
Persons aged 65 years and over 1992 39.9 1998 38.9
Hospital separation rate due to falls among people aged 65 years and over (per 100,000 population)
Males aged 65–74 years 1991–92 668 1997–98 851
Males aged 75 years and over 1991–92 2,242 1997–98 3,198
Females aged 65–74 years 1991–92 1,225 1997–98 1,408
Females aged 75 years and over 1991–92 4,554 1997–98 5,519
(continued)
02 AH2000 stat tables Page 422 Thursday, June 1, 2000 2:18 PM

Statistical tables 423
TRIM SIZE 175 mm Wide x 250 mm Deep
Table S56 (continued): Indicators for injury prevention and control
Descriptor
Baseline Most recent data
Year Value Year Value
Hospital separation rate due to falls among children aged 0–4 and 5–9 years (per 100,000 population)
Children aged 0–4 years 1991–92 502 1997–98 571
Children aged 5–9 years 1991–92 868 1997–98 778
Death rate for homicide among people aged 20–39 years (per 100,000 population)
Males 1992 3.4 1998 3.7
Females 1992 2.4 1998 1.5
Death rate for homicide among children aged 0–9 years (per 100,000 population)
Children aged 0–9 years 1992 0.6 1998 1.0
Death rate for injury resulting from fire, burns and scalds among people aged 55 years and over (per 100,000 population)
Persons aged 55 years and over 1992 2.4 1998 1.4
Hospital separation rate for injury resulting from fire, burns and scalds among children aged 0–4 years (per 100,000 population)
Boys 1991–92 167 1997–98 106
Girls 1991–92 127 1997–98 79
Hospital separation rate due to poisoning among children aged 0–4 years (per 100,000 population)
Children aged 0–4 years 1991–92 302 1997–98 288
Death rate for drowning in the total population and among children aged 0–4 years (per 100,000 population)
Total population 1992 1.7 1998 1.3
Children aged 0–4 years 1992 5.9 1998 3.7
Hospital separation rate for near drowning among children aged 0–4 years (per 100,000 population)
Children aged 0–4 years 1991–92 29.5 1997–98 23.0
Incidence rate for persistent spinal cord injury from traumatic causes (per 100,000 population)
Persons 1995–96 1.34 1998–99 1.45
Sources: AIHW National Mortality Database; AIHW National Morbidity Database; AIHW NISU unpublished data; DHFS & AIHW 1998b.
02 AH2000 stat tables Page 423 Thursday, June 1, 2000 2:18 PM

424 AustraliaÕs Health 2000
TRIM SIZE 175 mm Wide x 250 mm Deep
Table S57: Indicators for mental health, focusing on depression
Descriptor
Baseline Most recent data
Year Value Year Value
Prevalence rates for depressive disorders (per 100,000 population)
Males 1997 4.2 n.a. n.a.
Females 1997 7.4 n.a. n.a.
Prevalence rates for anxiety disorders (per 100,000 population)
Males 1997 7.1 n.a. n.a.
Females 1997 12.1 n.a. n.a.
Hospital separations for suicide and self-inflicted injury among young adults aged 15–24 years, and older people aged 65 years and over (per 100,000 population)
Males, aged 15–24 years 1993–94 142.4 1997–98 164.0
Females, aged 15–24 years 1993–94 235.6 1997–98 280.8
Males, aged 65 years and over 1993–94 38.0 1997–98 42.5
Females, aged 65 years and over 1993–94 30.4 1997–98 33.1
Death rates for suicide among young adults aged 15–24 years and older people aged 65 years and over (per 100,000 population)
Males, aged 15–24 years 1986 21.3 1998 26.6
Females, aged 15–24 years 1986 5.4 1998 6.3
Males, aged 65 years and over 1986 30.7 1998 23.7
Females, aged 65 years and over 1986 7.0 1998 6.2
Death rates for suicide in urban, rural and remote areas among young adults aged 15–24 years (per 100,000 population)
Males, 15–24 years, capital cities 1986–96 22.7 1988–98 23.2
Males, 15–24 years, other metropolitan 1986–96 24.9 1988–98 26.0
Males, 15–24 years, large rural centres 1986–96 27.9 1988–98 29.8
Males, 15–24 years, small rural centres 1986–96 31.5 1988–98 30.6
Males, 15–24 years, other rural areas 1986–96 34.4 1988–98 37.6
Males, 15–24 years, remote centres 1986–96 31.0 1988–98 35.3
Males, 15–24 years, other remote areas 1986–96 42.5 1988–98 51.3
Females, 15–24 years, capital cities 1986–96 5.2 1988–98 5.2
Females, 15–24 years, other metropolitan 1986–96 4.1 1988–98 4.1
Females, 15–24 years, large rural centres 1986–96 4.0 1988–98 5.1
Females, 15–24 years, small rural centres 1986–96 4.1 1988–98 4.8
Females, 15–24 years, other rural areas 1986–96 4.8 1988–98 5.3
Females, 15–24 years, remote centres 1986–96 5.5 1988–98 6.4
Females, 15–24 years, other remote areas 1986–96 6.1 1988–98 6.3
(continued)
02 AH2000 stat tables Page 424 Thursday, June 1, 2000 2:18 PM

Statistical tables 425
TRIM SIZE 175 mm Wide x 250 mm Deep
Table S57 (continued): Indicators for mental health, focusing on depression
Descriptor
Baseline Most recent data
Year Value Year Value
Death rates for suicide in urban, rural and remote areas among older people aged 65 years and over (per 100,000 population)
Males, 65+ years, capital cities 1986–96 26.7 1988–98 25.4
Males, 65+ years, other metropolitan 1986–96 30.7 1988–98 30.7
Males, 65+ years, large rural centres 1986–96 29.2 1988–98 27.3
Males, 65+ years, small rural centres 1986–96 31.1 1988–98 28.7
Males, 65+ years, other rural areas 1986–96 34.4 1988–98 33.2
Males, 65+ years, remote centres 1986–96 51.1 1988–98 53.3
Males, 65+ years, other remote areas 1986–96 40.4 1988–98 36.5
Females, 65+ years, capital cities 1986–96 8.2 1988–98 7.8
Females, 65+ years, other metropolitan 1986–96 5.5 1988–98 5.9
Females, 65+ years, large rural centres 1986–96 6.9 1988–98 6.0
Females, 65+ years, small rural centres 1986–96 4.9 1988–98 5.0
Females, 65+ years, other rural areas 1986–96 4.6 1988–98 5.0
Females, 65+ years, remote centres 1986–96 0.0 1988–98 0.0
Females, 65+ years, other remote areas 1986–96 6.8 1988–98 7.5
Sources: AIHW National Mortality Database; AIHW National Morbidity Database; DHAC & AIHW 1999c.
02 AH2000 stat tables Page 425 Thursday, June 1, 2000 2:18 PM

426 AustraliaÕs Health 2000
TRIM SIZE 175 mm Wide x 250 mm Deep
ReferencesABS. Australian demographic statistics. ABS Cat. No. 3101.0. Canberra: ABS.
ABS. Population by age and sex. ABS Cat. No. 3201.0. Canberra: ABS.
ABS. Births Australia. ABS Cat. No. 3301.0. Canberra: ABS.
ABS. Deaths Australia. ABS Cat. No. 3302.0. Canberra: ABS.
ABS. Causes of death. ABS Cat. No. 3303.0. Canberra: ABS.
ABS. Labour force Australia. ABS Cat. No. 6203.0. Canberra: ABS.
ABS 1977. Births 1975. ABS Cat. No. 4.4. Canberra: ABS.
ABS 1999a. Births Australia, 1998. ABS Cat. No. 3301.0. Canberra: ABS.
ABS 1999b. Deaths Australia, 1998. ABS Cat. No. 3302.0. Canberra: ABS.
AIHW 1999. Australian hospital statistics 1997Ð98. AIHW Cat. No. HSE 6. HealthServices Series. Canberra: AIHW.
AIHW NPSU 1999. AustraliaÕs mothers and babies 1997. AIHW Cat. No. PER 12.Perinatal Statistics Series No. 9. Sydney: AIHW NPSU.
AIHW & AACR 1999. Cancer in Australia 1996: incidence and mortality data for 1996and selected data for 1997 and 1998. AIHW Cat. No. CAN 7. Cancer Series. Canberra:AIHW.
Commonwealth Statistician 1925. Census of the Commonwealth of Australia taken forthe night between the 3rd and 4th April, 1921. Part 1ÑAges. Melbourne: GovernmentPrinter.
DHAC 1999a. Communicable Diseases Intelligence 23(11), 28 October 1999. Canberra:DHAC.
DHAC 1999b. Medicare statistics, June quarter 1999. Canberra: DHAC.
DHAC & AIHW 1999a. National Health Priority Areas report: cardiovascular health1998. AIHW Cat. No. PHE 9. Canberra: AIHW.
DHAC & AIHW 1999b. National Health Priority Areas report: diabetes mellitus. AIHWCat. No. PHE 10. Canberra: AIHW.
DHAC & AIHW 1999c. National Health Priority Areas report: mental health 1998.AIHW Cat. No. PHE 13. Canberra: AIHW.
DHFS & AIHW 1998a. National Health Priority Areas report: cancer control 1997.AIHW Cat. No. PHE 4. Canberra: AIHW.
DHFS & AIHW 1998b. National Health Priority Areas report: injury prevention and control 1997. AIHW Cat. No. PHE 3. Canberra: AIHW.
Disney APS, Russ GR, Waker R, Collins J, Herbert K & Kerr P (eds) 1998. ANZDATARegistry report 1998. Adelaide: ANZDATA Registry.
HIC (Health Insurance Commission) 1992. Annual report 1991Ð92. Canberra: HIC.
HIC (Health Insurance Commission) 1993. Annual report 1992Ð93. Canberra: HIC.
02 AH2000 stat tables Page 426 Thursday, June 1, 2000 2:18 PM

Statistical tables 427
TRIM SIZE 175 mm Wide x 250 mm Deep
HIC (Health Insurance Commission) 1994. Annual report 1993Ð94. Canberra: HIC.
HIC (Health Insurance Commission) 1995. Annual report 1994Ð95. Canberra: HIC.
HIC (Health Insurance Commission) 1996. Annual report 1995Ð96. Canberra: HIC.
HIC (Health Insurance Commission) 1997. Annual report 1996Ð97. Canberra: HIC.
HIC (Health Insurance Commission) 1998. Annual report 1997Ð98. Canberra: HIC.
HIC (Health Insurance Commission) 1999. Annual report 1998Ð99. Canberra: HIC.
NCHECR (National Centre in HIV Epidemiology and Clinical Research) 1999. HIV/AIDS, hepatitis C and sexually transmissable infections in Australia: annualsurveillance report 1999. Sydney: NCHECR.
OECD 1999. OECD health data 1999: a comparative analysis of 29 countries (CD-ROM).Paris: OECD.
Parkin DM, Whelan SL, Ferlay J, Raymond L & Young J (eds) 1997. Cancer incidence infive continents, Volume 7. IARC Scientific Publications No. 143. Lyon: InternationalAgency for Research on Cancer.
Risk Factor Prevalence Study Management Committee 1990. Risk Factor PrevalenceStudy. Survey No. 3 1989. Canberra: National Heart Foundation of Australia &Australian Institute of Health.
UN 1999. 1997 demographic yearbook. New York: Department for Economic and SocialInformation and Policy Analysis.
WHO 1995. World health statistics annual, 1994. Geneva: WHO.
WHO 1996. World health statistics annual, 1995. Geneva: WHO.
WHO 1998. World health statistics annual, 1996. Geneva: WHO.
02 AH2000 stat tables Page 427 Thursday, June 1, 2000 2:18 PM

428 AustraliaÕs Health 2000
TRIM SIZE 175 mm Wide x 250 mm Deep
Methods and conventions
MethodsDetails of methods used in particular sections of the report are included in the text andboxes, and in footnotes to figures and tables. Entries in columns of tables may not addto the totals shown, due to rounding.
Age standardisation has been used to facilitate the comparison of populations withdiffering age compositions, either different populations at one time or the samepopulation at different times. The 1991 Australian population (ABS 1993) has been usedas the standard population for all intra-Australia comparisons. The 1988 Australianpopulation was used for these comparisons in editions of AustraliaÕs Health prior to the1996 edition; some statistics may thus differ slightly from those in previous editions.
The European and the World Standard Populations have been used for someinternational comparisons. Details of these standard populations are provided.
Table A1: Age composition of the Australian population at 30 June 1991, and of European and World Standard Populations
Age group (years) Australia, 30 June 1991 European Std World Std
0 259,085 1,600 2,400
1–4 1,012,618 6,400 9,600
5–9 1,272,208 7,000 10,000
10–14 1,241,619 7,000 9,000
15–19 1,364,074 7,000 9,000
20–24 1,396,764 7,000 8,000
25–29 1,399,663 7,000 8,000
30–34 1,425,735 7,000 6,000
35–39 1,328,387 7,000 6,000
40–44 1,294,271 7,000 6,000
45–49 1,029,145 7,000 6,000
50–54 846,934 7,000 5,000
55–59 725,950 6,000 4,000
60–64 736,868 5,000 4,000
65–69 671,390 4,000 3,000
70–74 510,755 3,000 2,000
75–79 384,495 2,000 1,000
80–84 229,828 1,000 500
85 and over 154,247 1,000 500
Total 17,284,036 100,000 100,000
Sources: ABS 1993; WHO 1996.
03 AH2000 end matter Page 428 Thursday, June 1, 2000 2:31 PM

Methods and conventions 429
TRIM SIZE 175 mm Wide x 250 mm Deep
Within Australia, most regional comparisons are among States and Territories. Forwithin-State comparisons, Australian Bureau of Statistics sources use capital citystatistical areas and the rest of each State. Definitions for regional comparisons fromother sources are not consistent, and are stated at appropriate places in the text.
Average annual rates of change or growth rates have been calculated as geometric rates:
Average rate of change = ((Pn/Po)1/N Ð 1) × 100
where Pn = value in later time period
Po = value in earlier time period
N = number of years between the two time periods.
The classification of deaths follows the Ninth Revision of the InternationalClassification of Diseases (WHO 1977). Diseases treated in hospitals and the proceduresperformed during a hospital stay are classified using the Australian version of theInternational Classification of Diseases, 9th Revision, Clinical Modification (ICD-9-CM(see Box 5.7, page 274).
Symbols$ Australian dollars, unless otherwise specified
Ñ nil or rounded to zero
% per cent
g gram
kcal kilocalorie
kg kilogram
kJ kilojoule
km2 square kilometres
Õ000 thousands
m million
mm millimetre
mm Hg millimetres of mercury
mmol/L millimoles per litre
n.a. not available
. . not applicable
nec not elsewhere classified
n.p. not published by the data source
npr not previously reported
wk week
03 AH2000 end matter Page 429 Thursday, June 1, 2000 2:31 PM

430 AustraliaÕs Health 2000
TRIM SIZE 175 mm Wide x 250 mm Deep
> more than
< less than
³ more than or equal to
² less than or equal to
* value subject to sampling variability too high for most practical purposesand/or the relative standard error is 25% to 50%.
** value subject to sampling variability too high for most practical purposesand/or the relative standard error is more than 50%.
ReferencesABS 1993. Estimated resident population by sex and age, States and Territories of
Australia, June 1991 and preliminary June 1992. ABS Cat. No. 3201.0. Canberra: ABS.
WHO 1977. Manual of the international statistical classification of diseases, injuries andcauses of death, 9th Revision, Volumes 1 and 2. Geneva: WHO.
WHO 1996. World health statistics annual, 1995. Geneva: WHO.
03 AH2000 end matter Page 430 Thursday, June 1, 2000 2:31 PM

Abbreviations 431
TRIM SIZE 175 mm Wide x 250 mm Deep
Abbreviations
AACR Australian Association of Cancer Registries
ABS Australian Bureau of Statistics
ACCHS Aboriginal Community Controlled Health Services
ACCSIS Aged and Community Care Strategic Information System
ACCV Anti-Cancer Council of Victoria
ACHS Australian Council on Healthcare Standards
ACIR Australian Childhood Immunisation Register
AGPS Australian Government Publishing Service
AHMAC Australian Health MinistersÕ Advisory Council
AIC Australian Institute of Criminology
AIDS Acquired immune deficiency syndrome
AIH Australian Institute of Health
AIHW Australian Institute of Health and Welfare
ALOS Average length of stay
AN-DRG Australian National Diagnosis Related Group
ANZDATA Australian and New Zealand Dialysis and Transplant Registry
APA American Psychiatric Association
APSU Australian Paediatric Surveillance Unit
AR-DRG Australian Refined Diagnosis Related Group
ARI Acute respiratory infections
ASCCSS Australian Standard Classification of Countries for Social Statistics
ASR Age-standardised rate
ASVS Australian Standard Vaccination Schedule
ATSIHWIU Aboriginal and Torres Strait Islander Health and Welfare Information Unit
BEACH Bettering the Evaluation And Care of Health
BMI Body mass index
CABG Coronary artery bypass grafting
CATI Computer-assisted telephone interview
03 AH2000 end matter Page 431 Thursday, June 1, 2000 2:31 PM

432 AustraliaÕs Health 2000
TRIM SIZE 175 mm Wide x 250 mm Deep
CBCS Commonwealth Bureau of Census and Statistics
CFCs Chlorofluorocarbons
CGC Commonwealth Grants Commission
CHD Coronary heart disease
CNS Central nervous system
COAG Council of Australian Governments
COPD Chronic obstructive pulmonary disease
CSIRO Commonwealth Scientific and Industrial Research Organisation
CT Computerised tomographic (scan)
CVD Cardiovascular disease
DALY Disability-adjusted life year
DASET Department of Art, Sport, the Environment and Territories
DBP Diastolic blood pressure
DDD Defined daily dose
DEETYA Department of Employment, Education, Training and Youth Affairs
DHAC Department of Health and Aged Care
DHCS Department of Health and Community Services
DHFS Department of Health and Family Services
DHHST Department of Health and Human Services, Tasmania
DHSH Department of Human Services and Health
DMFT Decayed, missing or filled permanent teeth
dmft Decayed, missing or filled primary teeth
DNA Deoxyribonucleic acid
DPIE Department of Primary Industries and Energy
DRG Diagnosis related group
DSRU Dental Statistics and Research Unit
DTP Diphtheria, tetanus, pertussis (triple antigen vaccine)
FECCA Federation of Ethnic CommunitiesÕ Councils of Australia
FED Front-end deductible
FORS Federal Office of Road Safety
FWE Full-time workload equivalent
GBD Global Burden of Disease Study
GDM Gestational diabetes mellitus
03 AH2000 end matter Page 432 Thursday, June 1, 2000 2:31 PM

Abbreviations 433
TRIM SIZE 175 mm Wide x 250 mm Deep
GDP Gross domestic product
GIFT Gamete intra-fallopian transfer
GP General practitioner
GPSCU General Practice Statistics and Classification Unit
HACC Home and Community Care
HCV Hepatitis C virus
HFA Heart Foundation of Australia
HGP Human Genome Project
Hib Haemophilus influenzae type b
HIC Health Insurance Commission
HIV Human immunodeficiency virus
HLA Human leukocyte antigen
HUS Haemolytic uraemic syndrome
ICD International Classification of Diseases
ICD-10 International Classification of Diseases, 10th Revision
ICD-10-AM International Classification of Diseases, 10th Revision, Australian Modification
ICD-9 International Classification of Diseases, 9th Revision
ICD-9-CM International Classification of Diseases, 9th Revision, Clinical Modification
ICIDH International Classification of Impairments, Disabilities and Handicaps
ICPEMC International Commission for Protection against Environmental Mutagensand Carcinogens
IHD Ischaemic heart disease
IPD Implicit price deflator
IRSD Index of relative socioeconomic disadvantage
IUD Intra-uterine device
IVF In-vitro fertilisation
KS KaposiÕs sarcoma
LIPID Long-term Intervention with Pravastatin in Ischaemic Disease
MBS Medicare Benefits Schedule
MCC Measles Control Campaign
MCS Mental component summary (of the SF-36)
MDBS MurrayÐDarling Basin Commission
MDC Major diagnostic category
03 AH2000 end matter Page 433 Thursday, June 1, 2000 2:31 PM
434 AustraliaÕs Health 2000
TRIM SIZE 175 mm Wide x 250 mm Deep
MEAC Measles Elimination Advisory Committee
MMR Measles, mumps and rubella (vaccine)
MRI Magnetic resonance imaging
MS Multiple sclerosis
NADC National Association of Diabetes Centres
NCATSIS National Centre for Aboriginal and Torres Strait Islander Statistics
NCC National Coding Centre
NCCH National Centre for Classification in Health
NCEPH National Centre for Epidemiology and Population Health
NCHECR National Centre in HIV Epidemiology and Clinical Research
NDR National Diabetes Register
NHDC National Health Data Committee
NHDD National Health Data Dictionary
NHF National Heart Foundation
NHIA National Health Information Agreement
NHIMAC National Health Information Management Advisory Committee
NHIMG National Health Information Management Group
NHL Non-HodgkinÕs lymphoma
NHLBI National Heart, Lung and Blood Institute
NHMBWG National Health MinistersÕ Benchmarking Working Group
NHMRC National Health and Medical Research Council
NHPA National Health Priority Area
NHPC National Health Performance Committee
NHS National Health Survey
NISAD Neuroscience Institute of Schizophrenia and Allied Disorders
NISU National Injury Surveillance Unit
NMDS National minimum data set
NMSC Non-melanocytic skin cancer
NNDSS National Notifiable Diseases Surveillance System
NPHP National Public Health Partnership
NPSU National Perinatal Statistics Unit
NTD Neural tube defect
OATSIH Office for Aboriginal and Torres Strait Islander Health
03 AH2000 end matter Page 434 Thursday, June 1, 2000 2:31 PM

Abbreviations 435
TRIM SIZE 175 mm Wide x 250 mm Deep
OECD Organisation for Economic Co-operation and Development
OGIT Oral glucose tolerance test
Pap Papanicolaou
PBAC Pharmaceutical Benefits Advisory Committee
PBS Pharmaceutical Benefits Scheme
PCP Pneumocystis carinii pneumonia
PCS Physical component score (of the SF-36)
PEI Patient episode initiation
PHIAC Private Health Insurance Advisory Council
PHIIS Private Health Insurance Incentives Scheme
PSA Prostate-specific antigen
PSD Post-traumatic stress disorder
PYLL Potential years of life lost
RDI Recommended Dietary Intake
RFE Reason for encounter
RNA Ribonucleic acid
RPBS Repatriation Pharmaceutical Benefits Scheme
RRMA Rural, Remote and Metropolitan Areas classification
RRV Ross River virus
SAAP Supported Accommodation Assistance Program
SBP Systolic blood pressure
SCRCSSP Steering Committee for the Review of Commonwealth/State Service Provision
SEIFA Socio-Economic Indexes for Areas
SF-12 Medical Outcomes Study Short-Form 12
SF-36 Medical Outcomes Study Short-Form 36
SIDS Sudden infant death syndrome
SIGNAL Strategic Intergovernmental Nutrition Alliance
SLA Statistical local area
SMR Standardised mortality ratio
SSPE Subacute sclerosing panencephalitis
STD Sexually transmitted disease
TFR Total fertility rate
03 AH2000 end matter Page 435 Thursday, June 1, 2000 2:31 PM

436 AustraliaÕs Health 2000
TRIM SIZE 175 mm Wide x 250 mm Deep
UN United Nations
UNEP United Nations Environment Program
UNICEF United Nations ChildrenÕs Fund
WHO World Health Organization
WHR Waist-to-hip-ratio
YLD Years lost due to disability
YLL Years of life lost (due to mortality)
Abbreviations of placesACT Australian Capital Territory
Aust Australia
Can Canada
Fra France
Ger Germany
Jpn Japan
NSW New South Wales
NT Northern Territory
NZ New Zealand
Qld Queensland
SA South Australia
Tas Tasmania
UK United Kingdom
USA United States of America
USSR Former Union of Soviet Socialist Republics
Vic Victoria
WA Western Australia
03 AH2000 end matter Page 436 Thursday, June 1, 2000 2:31 PM

Glossary 437
TRIM SIZE 175 mm Wide x 250 mm Deep
Glossary
Aboriginal: A person of Aboriginal descent who identifies as an Aboriginal and isaccepted as such by the community in which he or she lives.
accommodation (of eye): How the eye automatically adjusts so it can focus at variousdistances, mainly by changing the shape of its lens.
acute: Coming on sharply to a crisis and often brief, intense and severe.
acute hospitals: Public, Department of VeteransÕ Affairs (repatriation) and privatehospitals which provide services primarily to admitted patients with acute ortemporary ailments. The average length of stay is relatively short.
admission: Admission to hospital. In this report, the number of separations has beentaken as the number of admissions. Hence an admission rate is the same as a separationrate.
admitted patient: A patient who undergoes a hospitalÕs formal admission process.See Box 5.6, page 271.
affective disorders: Mood disorders such as depression, mania and bipolar affectivedisorder. (Do not include anxiety disorders, which are classified as a separate group.)
age-specific death rate: See Box 2.6, page 39.
age-specific rate: A rate for a specific age group. The numerator and denominator relateto the same age group.
age standardisation: A method of removing the influence of age when comparingpopulations with different age structures.
age-standardised death rate: See Box 2.6, page 39.
agoraphobia: Fear of being in public places from which it may be difficult to escape.
AlzheimerÕs disease: A disease (named after a German physician) in which there isprogressive loss of brainpower shown by worsening short-term memory, confusion anddisorientation.
ambulatory care: Care provided to hospital patients who are not admitted to thehospital, such as patients of emergency departments and outpatients clinics. The term isalso used to refer to care provided to patients of community-based (non-hospital) healthcare services.
AN-DRGs: See DRGs.
angina: Temporary chest pain or discomfort when the heartÕs own blood supply isinadequate to meet extra needs, as in exercise. See also cardiovascular disease.
03 AH2000 end matter Page 437 Thursday, June 1, 2000 2:31 PM

438 AustraliaÕs Health 2000
TRIM SIZE 175 mm Wide x 250 mm Deep
angioplasty: A method of reducing a blockage in an artery by opening out a balloonplaced inside the artery at the point of narrowing.
anxiety disorders: A group of mental disorders marked by excessive feelings ofapprehension, worry, nervousness and stress. Includes panic disorder, various phobias,generalised anxiety disorder, obsessiveÐcompulsive disorder and post-traumatic stressdisorder.
arrhythmia: A disturbed rhythm of the heart beatÑeither too fast, too slow or irregular.
arthritis: A group of disorders in which there is inflammation of the joints, which canbecome stiff, painful, swollen or deformed. The two main types of arthritis areosteoarthritis and rheumatoid arthritis.
asthma: An inflammatory disease of the air passages that makes them prone to narrowtoo easily and too much in response to ÔtriggersÕ, causing episodes of shortness ofbreath and wheezing or coughing. The triggers include exercise, pollens, the house dustmite, cold weather, throat and chest infections, tobacco smoke and other factors.
atherosclerosis: A process that gradually clogs arteries, through fatty and fibre-likedeposits that build up on the inner walls of the arteries.
available beds: Beds immediately available for use by admitted patients.
average length of stay (ALOS): The average of the length of stay for admitted patientepisodes.
benchmark: A standard or point of reference for measuring quality or performance. Seealso benchmarking.
benchmarking: A continuous process of measuring quality or performance against thehighest standards. See also benchmark.
bipolar affective disorder: A mental disorder where the person may be depressed at onetime and manic at another. Formerly known as manic depression.
blood cholesterol: Fatty substance produced by the liver and carried by the blood tosupply the rest of the body.
body mass index (BMI): The most commonly used method of assessing whether aperson is normal weight, underweight, overweight or obese. Calculated by dividing thepersonÕs weight (in kilograms) by their height (in metres) squared, i.e. kg ÷ m2. Alsoknown as QueteletÕs Index. For both men and women, underweight is a BMI below 18.5,acceptable weight is from 18.5 to less than 25, overweight is 25 and above but lessthan 30, and obese is 30 and over.
campylobacteriosis: A disease usually marked by diarrhoea, abdominal pain, fever,nausea and vomiting for a few days, caused by some types of Campylobacter bacteriaand often food-borne.
cancer: A range of diseases where some of the bodyÕs cells begin to multiply out ofcontrol, can invade and damage the area around them, and can also spread to otherparts of the body to cause further damage.
03 AH2000 end matter Page 438 Thursday, June 1, 2000 2:31 PM

Glossary 439
TRIM SIZE 175 mm Wide x 250 mm Deep
cardiovascular disease: Any disease of the heart or blood vessels, including heart attack,angina, stroke and peripheral vascular disease. Also known as circulatory disease.
capital expenditure: Expenditure on large-scale fixed assets (for example, new buildingsand equipment with a useful life extending over a number of years).
casemix: The range and types of patients (the mix of cases) treated by a hospital or otherhealth service. This provides a way of describing and comparing hospitals and otherservices for planning and managing health care. Casemix classifications put patients intomanageable numbers of groups with similar conditions that use similar healthcareresources, so that the activity and cost-efficiency of different hospitals can be compared.
cause of death: From information reported on the medical certificate of cause of death,each death is classified by the underlying cause of death according to rules andconventions of the 9th revision of the International Classification of Diseases. Theunderlying cause is defined as the disease which initiated the train of events leadingdirectly to death. Deaths from injury or poisoning are classified according to thecircumstances of the violence which produced the fatal injury, rather than to the natureof the injury.
cerebrovascular disease: See stroke.
chemotherapy: The use of drugs (chemicals) to prevent or treat disease, with the termusually being applied to treatment for cancer rather than for other conditions.
chronic: Persisting over a long period.
chronic bronchitis: Long-term lung condition with inflammation of the main airpassages causing frequent coughing attacks and coughing up of mucus.
chronic obstructive pulmonary disease: A combination of emphysema and chronicbronchitis-related conditions, where damage to the lungs tends to obstruct their oxygenintake.
cohort: A group of individuals being studied who have experienced the same event at aspecified period in time, e.g. Ôbirth cohortÕ refers to people born in the same year.
colonoscopy: A procedure whereby the inside of the large bowel (colon) is viewedusing a long flexible tube inserted through the anus.
colorectal cancer: Cancer of the colon (the lower 1.5 to 2 metres of the intestine) or ofthe rectum (the final 15 cm at the end of the colon, ending with the anus).
co-morbidity: When a person has two or more health problems at the same time.
confidence interval: A statistical term describing a range (interval) of values withinwhich we can be ÔconfidentÕ that the true value lies, usually because it has a 95% orhigher chance of doing so.
congenital: A condition that is recognised at birth, or that is believed to have beenpresent since birth, including conditions which are inherited or caused byenvironmental factors.
coronary heart disease: See ischaemic heart disease.
crude death rate: See Box 2.6, page 39.
03 AH2000 end matter Page 439 Thursday, June 1, 2000 2:31 PM

440 AustraliaÕs Health 2000
TRIM SIZE 175 mm Wide x 250 mm Deep
cryptosporidiosis: A disease usually marked by diarrhoea with cramping abdominalpain and other symptoms, caused by Cryptosporidiosis parvum, a protozoan parasite andtransmitted directly from person to person, or food-borne.
dementia: A general and worsening loss of brain power such as memory,understanding and reasoning.
dentate: Having one or more natural teeth.
depression: A mood disorder with prolonged feelings of being sad, hopeless, low andinadequate, with a loss of interest or pleasure in activities and often with suicidalthoughts or self-blame.
diphtheria: A bacterial infection that usually starts with soreness of the throat andtonsils but which can also affect other parts of the body and become severe enough toblock breathing. Preventable by vaccine.
direct bill: The process by which a medical practitioner or optometrist sends the bill forservices direct to Medicare, often referred to as bulk billing.
disability: The presence of one or more of seventeen limitations, restrictions orimpairments (see Box 2.7, page 49).
disability-adjusted life year (DALY): Years of healthy life lost through premature deathor living with disability due to illness or injury.
DRGs (diagnosis related groups): A widely used type of casemix classification system.In the case of Australian acute hospitals, AN-DRGs (Australian National DiagnosisRelated Groups) classify admissions into groups with similar clinical conditions (relateddiagnoses) and similar resource usage. This allows the activity and performance ofhospitals to be compared on a common basis. See Box 5.7, page 274. See also casemix.
dysthymia: A disorder characterised by constant or constantly recurring chronicdepression of mood, lasting at least 2 years.
emphysema: A long-term lung disease where over expansion or destruction of the lungtissue blocks oxygen intake, leading to shortness of breath and other problems.
endoscopy: The viewing of internal parts of the body, such as the inside of the lowerbowel (the colon) with a colonoscope.
encephalitis: Inflammation of the brain.
enterohaemorrhagic E. coli infection: A disease marked by diarrhoea that can be mild orsevere and bloody, and sometimes also the haemolytic-uraemic syndrome (suddenkidney failure and anaemia in children) and other symptoms. It is caused by sometypes of E. coli bacteria and is usually food-borne.
epidemiology: The study of the patterns and causes of health and disease inpopulations, and the application of this study to improve health.
expectation of life: See life expectancy.
external cause: Environmental event, circumstance and/or condition as the cause ofinjury, poisoning and/or other adverse effect. Used in disease classification.
03 AH2000 end matter Page 440 Thursday, June 1, 2000 2:31 PM

Glossary 441
TRIM SIZE 175 mm Wide x 250 mm Deep
foetal death: Birth of a foetus weighing at least 400 grams (or, where birthweight isunavailable, of at least 20 weeks gestation), which shows no signs of life. Commonlyreferred to as stillbirth.
foetal death rate: Number of foetal deaths per 1,000 total births (foetal deaths plus livebirths).
freestanding day hospital facility: A private hospital where only minor operations andother procedures not requiring overnight stay are performed, not forming part of anyprivate hospital providing overnight care.
gastroscopy: A procedure whereby the inside of the stomach is viewed using a flexibletube passed down into it via the mouth.
generalised anxiety disorder: A mental disorder where a person is overly andunrealistically anxious and worried about many things over a long period. One of thegroup of anxiety disorders.
gestational diabetes: Diabetes which is first diagnosed during pregnancy (gestation). Itmay disappear after pregnancy but signals a high risk of diabetes occurring later on.
gross domestic product (GDP): A statistic commonly used to indicate national wealth. Itis the total market value of goods and services produced within a given period afterdeducting the cost of goods and services used up in the process of production butbefore deducting allowances for the consumption of fixed capital.
haemodyalisis/dialysis: Process used to treat kidney failure with a machine that isconnected to the patientÕs bloodstream so it can take on the role of the kidneys byremoving excess substances from the blood.
handicap: A disadvantage resulting from impairment or disability that limits orprevents the fulfilment of a role that is normal (see Box 2.7, page 49).
health indicator: See indicator.
health outcome: A change in the health of an individual or population due to apreventive or clinical intervention.
health promotion: Activities to improve health and prevent disease.
health status: An individualÕs or populationÕs overall level of health, taking account ofvarious aspects such as life expectancy, amount of disability, levels of disease riskfactors and so forth.
heart attack: Emergency illness that occurs when a vessel supplying blood to the heartmuscle is suddenly blocked completely by a blood clot. The medical term commonlyused for a heart attack is myocardial infarction. See also cardiovascular disease.
heart failure: When the heart cannot pump strongly enough to keep the bloodcirculating around the body at adequate rate.
hepatitis: Inflammation of the liver, which can be due to certain viral infections, alcoholexcess or a range of other causes.
Hib (Haemophilus influenzae type b): A bacterial infection of infants and children thatcan cause meningitis, pneumonia and other serious effects. Preventable by vaccine.
03 AH2000 end matter Page 441 Thursday, June 1, 2000 2:31 PM

442 AustraliaÕs Health 2000
TRIM SIZE 175 mm Wide x 250 mm Deep
HodgkinÕs disease (HodgkinÕs lymphoma): A cancer marked by progressive painlessenlargement of lymph nodes throughout the body. A form of lymphoma. Named afterthe English physician who described it.
hostels: Establishments providing board, lodging or accommodation for the aged,distressed, or disabled who cannot live independently but who do not need nursing carein a hospital or nursing home. Residents are generally responsible for their ownprovisions, but may be provided with domestic assistance (meals, laundry, personal care).
hypertensive disease: Occurs when blood pressure is high long term, especially whenthis leads to damage of the heart, brain or kidneys.
hypomania: A lesser degree of mania characterised by a persistent mild abnormalelevation of mood and increased activity lasting at least 4 days.
immunisation: Inducing immunity against infection by the use of antigen to stimulatethe body to produce its own antibodies. See vaccination.
impairment: Any loss or abnormality of psychological, physiological or anatomicalstructure or function.
incidence: The number of new cases (of an illness or event etc.) occurring during a givenperiod. Compare with prevalence.
indicator (health indicator): A key statistic that indicates an aspect of population healthstatus, health determinants, interventions, services or outcomes. Indicators are designedto help assess progress and performance, as a guide to decision making. They may havean indirect meaning as well as a direct one; for example, AustraliaÕs overall death rate isa direct measure of mortality but is often used as a major indicator of population health.
Indigenous: A person of Aboriginal and/or Torres Strait Islander descent who identifiesas an Aboriginal and/or Torres Strait Islander and is accepted as such by thecommunity with which he or she is associated.
inflammation: Local response to injury or infection, marked by local redness, heat,swelling and pain. Can also occur when there is no clear external cause and the bodyreacts against itself, as in the auto-immune disorders.
International Classification of Diseases: The World Health OrganizationÕsinternationally accepted classification of death and disease. The 9th Revision (ICD-9) iscurrently in use. In this report, causes of death classified before 1979 under previousrevisions have been reclassified to ICD-9 by the AIHW.
intervention (for health): Any action taken by society or an individual which Ôsteps inÕ(intervenes) to improve health, such as medical treatment and preventive campaigns.
ischaemia: Reduced or blocked blood supply. See also ischaemic heart disease.
ischaemic heart disease: Heart attack and angina (chest pain). Also known as coronaryheart disease.
length of stay: Duration of hospital stay, calculated by subtracting the date the patient isadmitted from the day of separation. All leave days, including the day the patient wenton leave, are excluded. A same-day patient is allocated a length of stay of 1 day.
03 AH2000 end matter Page 442 Thursday, June 1, 2000 2:31 PM

Glossary 443
TRIM SIZE 175 mm Wide x 250 mm Deep
life expectancy: An indication of how long a person can expect to live. Technically itis the number of years of life remaining to a person at a particular age if death rates donot change.
listeriosis: A disease which normally appears in otherwise healthy people as an acute,mild fever, sometimes with influenza-like symptoms, caused by the bacteria Listeriamonocytogenes and usually food-borne. It can cause more severe symptoms innewborns, the elderly, people with poor immunity and pregnant women (in whom itcan also cause abortion).
low birthweight: Birth of a baby weighing less than 2,500 grams.
lymphoma: A cancer of the lymphatic system, which includes the lymph nodes and thechannels linking them. Lymphomas are divided into two broad types, HodgkinÕs disease/lymphoma and non-HodgkinÕs lymphoma (NHL).
major diagnostic categories (MDCs): A high level of groupings of patients used in theAN-DRG classification.
malignancy: See cancer.
mammogram: X-ray of the breast. May be used to assess a breast lump or as a screeningtest in women with no evidence of cancer.
mania: A mental disorder where the person is overexcited, overactive and excessivelyand unrealistically happy and expansive. It is the opposite of depression and canalternate with it in the same person in what is known as bipolar affective disorder(formerly known as manic depression).
manic depression; manic depressive disorder: See bipolar affective disorder; mania; anddepression.
measles: A highly contagious infection, usually of children, that causes flu-likesymptoms, fever, a typical rash and sometimes serious secondary problems such asbrain damage. Preventable by vaccine.
median: The midpoint of a list of observations ranked from the smallest to the largest.
Medicare: A national, government-funded scheme that subsidises the cost of personalmedical services, and that covers all Australians to help them afford medical care.
melanoma: A cancer of the bodyÕs cells that contain pigment (melanin), mainly affectingthe skin.
meningitis: Inflammation of the brainÕs covering (the meninges), as can occur withsome viral or bacterial infections.
mental disorder: A disturbance of mood or thought that can affect behaviour anddistress the person or those around them, so the person cannot function normally.Includes anxiety disorders, depression and schizophrenia.
metastasis: The spread of a cancer from its original site to other parts of the body.
morbidity: Refers to ill health in an individual and to levels of ill health in a populationor group.
03 AH2000 end matter Page 443 Thursday, June 1, 2000 2:31 PM
444 AustraliaÕs Health 2000
TRIM SIZE 175 mm Wide x 250 mm Deep
motor neurone disease: A disease of the nervous system with progressive wasting ofmuscles, weakness and paralysis.
multiple sclerosis: One of the most common nervous system disorders, with variedsymptoms such as loss of control of limbs, sudden vision problems and disturbedsensations.
mumps: A contagious viral disease marked by acute and painful swelling of the saliva-producing glands, often similarly affecting the testicles and sometimes other parts.
myocardial infarction: Term still commonly used to mean a heart attack, but morecorrectly refers only to those heart attacks which have caused some death of heart muscle.
neonatal death: Death of an infant within 28 days of birth.
neonatal mortality rate: Number of neonatal deaths per 1,000 live births.
neural tube defects: Defects such as spina bifida and anencephalus that have arisen inthe neural tube, the part of the embryo that develops into the brain and spinal cord.
neurosis/neurotic disorders: A broad category of mental disorders with anxiety as theirmain feature and whose symptoms are mostly exaggerations of normal emotions orbehaviour. Includes anxiety disorders, obsessiveÐcompulsive disorder, stress reactionsand other problems.
non-HodgkinÕs lymphoma: A range of cancers of the lymphatic system (lymph glandsand the channels they are linked to) which are not of the HodgkinÕs variety.
non-admitted patient: A patient who receives care from a recognised non-admittedpatient service/clinic of a hospital.
nursing homes: Establishments which provide long-term care involving regular basicnursing care to chronically ill, frail, disabled or convalescent people or senile inpatients.
obesity: Marked degree of overweight defined as body mass index 30 and over. See alsooverweight.
obsessiveÐcompulsive disorder: A form of anxiety disorder where repeated andunwanted thoughts and impulses disturb and dominate a person. Often involves ritualssuch as excessive-hand washing, checking and counting, which in turn cause anxiety ifthey are prevented or out of control.
occasion of service: Occurs when a patient receives some form of service from afunctional unit of the hospital, but is not admitted.
ophthalmology: A medical specialty dealing with eye diseases.
Organisation for Economic Co-operation and Development (OECD): An organisationof 24 developed countries, including Australia.
outcome (health outcome): A health-related change due to a preventive or clinicalintervention or service. (The intervention may be single or multiple and the outcomemay relate to a person, group or population or be partly or wholly due to theintervention.)
overweight: Defined as a body mass index 25 and over but less than 30. See also obesity.
03 AH2000 end matter Page 444 Thursday, June 1, 2000 2:31 PM

Glossary 445
TRIM SIZE 175 mm Wide x 250 mm Deep
panic disorder: Marked by panic attacks (episodes of intense fear or discomfort) thatoccur suddenly and unpredictably.
Pap smear: Papanicolaou smear, a procedure to detect cancer and pre-cancerousconditions of the female genital tract.
parasuicide: The deliberate or ambivalent act of self-damage which is potentially life-threatening, but not resulting in death.
pathology: General term for the study of disease, but often used more specifically fordiagnostic services which examine specimens, such as samples of blood or tissue.
patient-days: The number of full or partial days of stay for patients who were admittedfor an episode of care and who underwent separation during the reporting period. Apatient who is admitted and separated on the same day is allocated 1 patient-day.
performance indicators: Measures of the efficiency and effectiveness of health services(hospitals, health centres, etc.) in providing health care.
perinatal: Pertaining to or occurring in the period shortly before or (usually 28 days)after birth.
perinatal death: Foetal or neonatal death.
perinatal mortality rate: Number of perinatal deaths per 1,000 total births (foetaldeaths plus live births).
peripheral vascular disease: Pain in the legs due to an inadequate blood supply tothem.
pertussis (whooping cough): A highly infectious bacterial disease of the air passagesmarked by explosive fits of coughing and often a whooping sound on breathing in.Preventable by vaccine.
Pharmaceutical Benefits Scheme (PBS): A national, government-funded scheme thatsubsidises the cost of a wide range of pharmaceutical drugs, and that covers allAustralians to help them afford standard medications.
phobia: A form of anxiety disorder in which there is persistent, unrealistic fear of anobject or situation and which interferes with the personÕs life as they seek to avoid theobject of their fear. Different phobias include fear of heights, flying, open spaces, socialgatherings, animals such as spiders and snakes, etc.
poliomyelitis (polio): Muscle paralysis, wasting and deformity of limbs after infectionby a common virus (poliovirus) that can damage the so-called motor nerves in thespinal cord. Preventable by vaccine.
post-traumatic stress disorder (PSD): A form of anxiety disorder in which a person hasa delayed and prolonged reaction after being in an extremely threatening orcatastrophic situation such as a war, natural disaster, terrorist attack, serious accident orwitnessing violent deaths.
potential years of life lost (PYLL): Number of potential years of life lost in a populationas a result of premature death.
03 AH2000 end matter Page 445 Thursday, June 1, 2000 2:31 PM

446 AustraliaÕs Health 2000
TRIM SIZE 175 mm Wide x 250 mm Deep
prescription drugs: Pharmaceutical drugs available only on the prescription of aregistered medical practitioner and available only from pharmacies.
prevalence: The number or proportion (of cases, instances, etc.) present in a populationat a given time. Compare with incidence.
prevention (of disease): Action to reduce or eliminate the onset, causes, complications orrecurrence of disease.
principal diagnosis: The diagnosis describing the problem that was chiefly responsiblefor the patientÕs episode of care in hospital.
principal procedure: The most significant procedure that was performed for treatmentof the principal diagnosis.
private health insurance: See Box 5.5, page 252.
private hospital: A privately owned and operated institution, catering for patients whoare treated by a doctor of their own choice. Patients are charged fees foraccommodation and other services provided by the hospital and relevant medical andparamedical practitioners. Includes private freestanding day hospital facilities.
private patients: Persons admitted to a private hospital; or persons admitted to a publichospital who decide to choose the doctor(s) who will treat them and to have privateward accommodation. This means they will be charged for medical services, food andaccommodation.
prostate cancer: Cancer of the prostate, the male organ that sits next to the urinarybladder and contributes to the semen (sperm fluid).
psychiatric hospitals: Establishments devoted primarily to the treatment and care ofinpatients with psychiatric disorders.
public health: Health activities which aim to benefit a population. Prevention,protection and promotion of health are emphasised, as distinct from treatment tailoredto individuals with symptoms. Examples include provision of a clean water supply andgood sewerage, conduct of anti-smoking education campaigns and screening fordiseases such as cancer of the breast and cervix.
public hospital: A hospital controlled by a State or Territory health authority. InAustralia public hospitals offer free diagnostic services, treatment, care andaccommodation to all who need it.
public patient: A patient admitted to a public hospital who has agreed to be treated bydoctors of the hospitalÕs choice and to accept shared ward accommodation. This meansthe patient is not charged.
quintile: A group derived by ranking the population according to specified criteria anddividing it into five equal parts.
radiology: The use or study of X-rays and other rays to help view internal parts of thebody as a guide to diagnosis as well as to treatment and its progress.
03 AH2000 end matter Page 446 Thursday, June 1, 2000 2:31 PM
Glossary 447
TRIM SIZE 175 mm Wide x 250 mm Deep
real expenditure: Expenditure expressed in terms which have been adjusted for inflation(for example, in 1989Ð90 dollars). This enables comparisons to be made betweenexpenditures in different years.
recurrent expenditure: Expenditure on goods and services which are used up during theyear, for example, salaries. It may be contrasted with capital expenditure, such asexpenditure on hospital buildings and large-scale diagnostic equipment, the useful lifeof which extends over a number of years.
refraction: The eyeÕs ability to bend light rays that enter it, to form an image at the backof the eye.
renal dialysis: A treatment for kidney failure where the patient is connected to amachine which does the kidneysÕ work by filtering the blood to control its contents.
rheumatic heart disease: Disease from damaged heart valves caused by childhoodattack of rheumatic fever.
risk factor: Any factor which represents a greater risk of a health disorder or otherunwanted condition. Some risk factors are regarded as causes of disease, others are notnecessarily so.
rubella (German measles): A contagious viral disease of children and young adultswhich has mild symptoms but which often causes serious birth defects if it occurs in amother during the first 3 months of pregnancy. Preventable by vaccine.
salmonellosis: a disease commonly marked by sudden onset of headache, abdominalpain, fever, diarrhoea, nausea and sometimes vomiting, caused by some types ofSalmonella bacteria and often food-borne.
same-day patients: Admitted patients who are admitted and separated on the sameday.
schizophrenia: A group of serious mental disorders where imagined and disorderedthoughts are key features, often with problems of behaviour, mood and motivation, anda retreat from social life.
separation: The formal process by which a hospital records the completion of treatmentand/or care for an admitted patient. See Box 5.6, page 271.
SF-36: Short Form 36Ñwidely used questionnaire to measure general health andwellbeing.
shigellosis: A disease characterised by acute diarrhoea with fever, nausea andsometimes other symptoms, usually transmitted directly from person to person via thefaecalÐoral route. It is caused by Shigella species bacteria, including Shigella dysenteriae 1,the cause of dysentery.
sign (clinical): An indication of a disorder that is apparent to a clinician or otherobserver and not necessarily to the person affected. Compare with symptom.
social phobia: A persistent, irrational fear of being the focus of attention, or fear ofbehaving in a way that will be embarrassing or humiliating.
03 AH2000 end matter Page 447 Thursday, June 1, 2000 2:31 PM

448 AustraliaÕs Health 2000
TRIM SIZE 175 mm Wide x 250 mm Deep
statistical significance: An indication from a statistical test that the result of acomparison, suggesting a difference or change, may be significant or meaningfulbecause it is unlikely to be due just to chance. A statistical result is usually said to beÔsignificantÕ if it would occur by chance only once in twenty times or less.
stillbirth: See foetal death.
stroke: When an artery supplying blood to the brain suddenly becomes blocked orbleeds, often causing paralysis of parts of the body or speech problems.
substance use disorders: Result from harmful use and/or dependence on illicit or licitdrugs, including alcohol, tobacco and prescription drugs.
suicide: Deliberately ending oneÕs own life.
symptom: Any indication of a disorder that is apparent to the person affected. Comparewith sign.
tetanus: A serious infection with a bacterial nerve poison causing spasm of the jawmuscles (lockjaw) and body muscles generally, from a bacterium entering through awound. The disease is preventable by vaccine.
thrombolysis: Emergency Ôclot-bustingÕ drug treatment for a heart attack.
Torres Strait Islander: A person of Torres Strait Islander descent who identifies as aTorres Strait Islander and is accepted as such by the community in which he or she lives.
tuberculosis: A bacterial disease that affects the lungs especially, with serious fever-likesymptoms and destruction of tissue. It can spread to other parts of the body, causingsecondary problems and often death if not treated.
underweight: Defined as a body mass index less than 18.5.
vaccination: The process of administering a vaccine to a person to produce immunityagainst infection. See immunisation.
whooping cough: See pertussis.
yersiniosis: a disease typically involving acute diarrhoea, fever, and other abdominalsymptoms, caused by the bacteria Yersinia pseudotuberculosis and Yersinia enterocoliticaand often food-borne.
03 AH2000 end matter Page 448 Thursday, June 1, 2000 2:31 PM

Index 449
TRIM SIZE 175 mm Wide x 250 mm Deep
IndexAboriginal and Torres Strait Islander
Health and Welfare Information Unit, 333
Aboriginal Australians, see Indigenous Australians
Aboriginal Community Controlled Health Services, 269Ð70
abortion, 162, 181, 276
abuse, see violence
accident (emergency) departments, 92, 277, 296
accidents, see injuries and poisonings; road traffic accidents
accredited hospitals, 325Ð6
ACIR, 35Ð6, 158Ð9
Active Australia, 155
acupuncturists, consultations with, 291, 292
acute bronchitis/bronchiolitis, 213, 295
acute care hospitals, 266Ð7, 268, 270Ð3
expenditure on, 244
length of stay, 317
performance indicators, 321Ð7
psychiatric wards, 283
see also public hospitals
acute encephalitis, 160
acute otitis media/myringitis, 213, 295
acute respiratory infections, see respiratory diseases/infections
administration, 403Ð6
health insurance funds costs, 252, 253
undergraduate course commencements, 263, 264
admissions, see hospitalisation
adolescents
mental problems and disorders, 76
pregnancy terminations, 181
smokers, 150Ð1
see also age; young people
adverse events, 250, 326Ð7
aerobic capacity, 18
aerobics, 155
affective disorders, 78, 82, 84, 249, 250, 276
age, 4, 142, 179Ð203, 365, 428
acute respiratory infections (ARI), 111, 112
allied health service patients, 292
asthma, 90, 91, 92, 214
attitudes and beliefs, 143
blood cholesterol, 170, 392
blood pressure, 167, 392
body weight, 164Ð5, 392
cancer, 66: survival following, 67
cardiovascular diseases, 58, 392
contraception use, 163
dental (oral) health, 227, 285, 287, 290
diabetes, 86, 215, 392
epilepsy risk factors, 104
family planning clients, 269
general practitioner patients, 293
health system costs, 251
hepatitis B, 114
hepatitis C, 115
03 AH2000 end matter Page 449 Thursday, June 1, 2000 2:31 PM

450 AustraliaÕs Health 2000
TRIM SIZE 175 mm Wide x 250 mm Deep
hospital use, 393Ð6
Indigenous Australians, 214Ð15, 217
Medicare services, 412Ð14
medication use, 301
mental problems and disorders, 76, 77, 84
mothers, 28, 179, 366, 369
musculoskeletal disorders, 100, 101, 102, 103
physical activity, 154Ð5, 392
private health insurance coverage, 257
self-assessed health, 14Ð15
sun protection measures, 156, 157
tetanus, 120
waist-to-hip ratio (WHR), 166
see also children; life expectancy; older people; young people
age, at death, 39Ð40, 373Ð8
asthma, 93
cancer, 66, 67Ð8
cardiovascular diseases, 61Ð2
Indigenous Australians, 208Ð9, 210
socioeconomic status, 221
suicide, 79Ð80
tuberculosis, 119
aged care assessment teams, 279Ð80
aged care residents, oral health of, 23Ð6
aged care services, 239, 278Ð82, 403Ð6
aged people, see older people
ageing, 316
AIDS, see HIV/AIDS
aids and appliances, 253, 293, 403Ð6
alcohol consumption, 146Ð8, 355
attitudes to, 144
Indigenous Australians, 217
rural and remote Australians, 224
alcohol dependence and abuse, 46, 47, 52, 55, 78, 194
young people, 189, 190
allergies, 36Ð7, 90, 301
allied health services, 263, 264, 277, 291Ð2, 296
alternative medicines, 304Ð5
Alzheimer's disease, 103Ð4, 194, 199
see also dementia
ambulance services, 8, 253, 403Ð6
amlodipine, 303
amoxycillin, 303, 304
amphetamines, 143, 144, 152, 153
AN-DRGs, 274, 276, 277
anaemia, 46
anaesthetics, 299, 300, 410
mortality related to, 326Ð7
analgesic nephropathy, 106
analgesics/pain killers, 144, 152, 153, 301, 302, 303
ancillary benefits tables, 255Ð6
anencephalus, 183Ð4
angina pectoris, 46, 47, 202
angioplasty, 59, 60, 334
antibiotics, 123, 303
anxiety disorders, 46, 47, 82, 84, 197, 199
general practitioner consultations, 295
health system costs, 249, 250
arbovirus infection, 384
arthritis, 37Ð8, 45, 98, 100Ð3, 201
see also musculoskeletal disorders; osteoarthritis
03 AH2000 end matter Page 450 Thursday, June 1, 2000 2:31 PM

Index 451
TRIM SIZE 175 mm Wide x 250 mm Deep
asbestos, 354
assisted conception, 27, 180Ð1
asthma, 36Ð7, 45, 46, 47, 90Ð4, 359
burden of disease, 54, 93Ð4, 199
drugs, 91, 92, 94, 301, 303
general practitioner consultations, 213, 295
health outcomes indicator framework, 334
health system costs, 94, 250
hospitalisation, 92, 187Ð8, 276
Indigenous Australians, 213, 214
medications, 92, 94, 301: can trigger, 91
overseas-born Australians, 207
rural and remote Australians, 226
atenolol, 304
atmosphere, 136Ð7
atresia, 184
attention-deficit disorder, 46
attitudes and beliefs, 143Ð4
audiologists/audiometrists, consultations with, 291, 292
Australian Burden of Disease and Injury Study, 48Ð55
Australian Bureau of Statistics, 6, 332, 334, 335, 336
constant price estimates, 236
health services expenditure to GDP ratio, 232
Australian Capital Territory, see States and Territories
Australian Childhood Immunisation Register (ACIR), 35Ð6, 158Ð9
Australian Council for Safety and Quality in Health Care, 327
Australian Council on Healthcare Standards, 325
Australian Health Care Agreements, 337
Australian Health MinistersÕ Benchmarking Working Group, 319, 321
Australian Health Ministers' Conference, 313
Australian Hearing Services, 293
Australian Incident Monitoring Scheme, 327
Australian Institute of Health and Welfare, 6, 86, 328, 332, 335
Health Ethics Committee, 334
Australian National Diagnosis Related Groups (AN-DRGs), 274, 276, 277
Australian Patient Safety Foundation, 327
Australian Standard Vaccination Schedule, 158
auto-immunity, 37Ð8
autosomal deletion, 141
babies, see births
back complaints/problems, 46, 47, 98, 99, 100
depression and, 84
general practitioner consultations, 294, 295
health system costs, 99, 250
barbiturates, 144, 152, 153
Barmah Forest virus, 118, 384
bed accreditation, 325Ð6
bed availability, 228, 266Ð7, 268, 284
beer consumption, 148
behaviour (lifestyle), 3, 144Ð64, 169, 350Ð1
03 AH2000 end matter Page 451 Thursday, June 1, 2000 2:31 PM

452 AustraliaÕs Health 2000
TRIM SIZE 175 mm Wide x 250 mm Deep
beliefs and attitudes, 143Ð4
benign prostatic hypertrophy, 46, 47
betamethasone topical, 304
Bettering the Evaluation And Care of Health (BEACH), 293, 335
biomedical risk factors, 164Ð70
bipolar affective disorder, 46
birth defects, 39, 53, 122, 138Ð40, 183Ð4, 397Ð8
birthplace, 86, 135, 204Ð7, 265
births, 27Ð9, 179Ð84, 366Ð70, 342Ð4, 410
family planning organisations, 268Ð9
hospital separations, 276
Indigenous children, 209Ð10, 212
Medicare benefits paid, 299, 300
pregnancy complications, 397Ð8
birthweight, 182, 209Ð10, 368
bladder cancer, 65, 66, 67, 386Ð8
blindness, and diabetes and, 87, 88
blood-borne diseases, 112Ð15, 384
see also HIV/AIDS
blood cholesterol, 169Ð70, 250, 392, 417
blood diseases, 277, 379Ð80, 397Ð8
blood lead levels, 137Ð8
blood pressure, 167Ð9, 294, 392, 417
blood vessel diseases, 44
body weight, 164Ð7, 189, 216Ð17, 392, 417
brain cancer, 66, 67
breast cancer, 65, 67, 68Ð9, 386Ð9
burden of disease, 54, 196, 197, 199
health system costs, 250
overseas-born Australians, 207
physical activity and, 154
screening, 328Ð9, 335
breast cancer: mortality, 40, 42, 43, 65, 67, 68Ð9, 329, 354Ð5, 386
burden of premature (YLL), 51
overseas-born Australians, 205, 206
breastfeeding, 188
BreastScreen Australia, 328Ð9, 335
bronchitis/bronchiolitis, 213, 295
see also chronic obstructive pulmonary disease
bronchopneumonia, 160
brucellosis, 384
bubonic plague, 346
budesonide, 303
burden of disease, 38Ð55, 192Ð9
acute respiratory infections (ARI), 112
alcohol consumption, 146
asthma, 54, 93Ð4, 199
chronic obstructive pulmonary disease, 97, 194, 199
communicable diseases, 122, 193
diabetes, 53, 54, 89, 194
illicit drug use, 151
mental illness, 82, 193
musculoskeletal disorders, 52, 53, 98, 101, 193, 195Ð9
nervous system disorders, 103, 193, 195Ð8
socioeconomic status, 221Ð3
tobacco smoking, 148
unsafe sex, 162
burns/scalds, 46, 401Ð2
bypass operations, 59, 60, 350
03 AH2000 end matter Page 452 Thursday, June 1, 2000 2:31 PM

Index 453
TRIM SIZE 175 mm Wide x 250 mm Deep
campylobacteriosis, 115Ð16, 384
cancer, 47, 63Ð71, 140Ð1, 386Ð9
burden of disease, 53, 193Ð9
health system costs, 250
hospital separations, 276, 397Ð8: procedures reported, 277
overseas-born Australians, 207
ozone depletion and, 137
palliative care, 327
physical activity and, 154
status of indicators, 418
see also breast cancer; colorectal cancer; lung cancer; prostate cancer
cancer mortality, 40, 52, 63, 64, 65, 67Ð8, 344, 352Ð5, 379Ð83, 386
associated with ischaemic heart disease, 44
burden of disease, 54, 195, 197, 199
burden of premature mortality (YLL), 51
health system costs, 250
caused by smoking, 149
Indigenous Australians, 211
melanoma, 70Ð1, 386
older people, 201, 202, 203
overseas-born Australians, 205, 206
record linkage, 334
rural and remote Australians, 226
cannabis/marijuana use, 151Ð2, 153
attitudes to, 143, 144
dependence/abuse, 46
young people, 190
carbon dioxide, 136
cardiac check-ups, 57
cardiac dysrhythmias, 57, 202, 250
cardiorespiratory fitness, 18Ð19
cardiovascular (circulatory) diseases, 45, 55Ð63, 303
burden of disease, 52, 53, 193Ð9
health system costs, 248, 250
hospitalisation, 57Ð60, 225, 276, 397Ð402
Indigenous Australians, 56Ð7, 58, 211, 334Ð5, 351
overseas-born Australians, 207
predictors, 154, 166, 168, 392
rural and remote Australian, 225
status of indicators, 415Ð16
see also coronary hear disease; stroke
cardiovascular diseases: mortality, 60Ð3, 201, 202, 203, 344, 347Ð51, 379Ð382
caused by smoking, 149
Indigenous Australians, 211
overseas-born Australians, 205Ð6
rural and remote Australian, 225
caries, see oral health
casearean sections, 183
casemix, 274, 276, 277, 335, 321Ð2
cataracts, 46, 87, 201, 202
causes of death, 39Ð44, 342Ð59, 379Ð82
AIDS, 114, 205
alcohol, 146
anaesthesia, 326Ð7
asthma, 90, 93, 359
auto-immune diseases and conditions, 37
burden of premature mortality (YLL), 51Ð2
children, 39Ð40, 185Ð7, 189, 209Ð10, 226, 342Ð3, 347, 355
03 AH2000 end matter Page 453 Thursday, June 1, 2000 2:31 PM

454 AustraliaÕs Health 2000
TRIM SIZE 175 mm Wide x 250 mm Deep
chronic obstructive pulmonary disease, 40, 41, 42, 43Ð4, 95, 96, 359, 383
diabetes, 37, 40, 44, 89, 205, 225
digestive system diseases, 205, 211, 379Ð80
diphtheria, 120
drug dependence and, 190
drugs, 51, 52, 73Ð4, 81, 152, 191
Haemophilus influenzae type b (Hib), 120
hepatitis B, 114, 115
Indigenous Australians, 209, 211, 218
infectious and parasitic diseases, 379Ð82, 345Ð7
injecting drug users, 152
injuries, 72Ð4, 75, 79Ð82, 379Ð82, 190, 205, 211, 226, 344, 355Ð7
kidney diseases, 89, 107, 108
liver, cirrhosis of, 108Ð9
malaria, 118
measles, 121, 160
mental problems and disorders, 79Ð82, 211
mothers, 181, 343Ð4
mumps, 121
musculoskeletal disorders, 98, 379Ð80
nervous system disorders, 103, 379Ð80
older people, 201Ð3
overseas-born Australians, 205Ð6
pertussis, 120
respiratory diseases, 39, 111, 205, 206, 211, 344, 358Ð9
rubella, 122
rural and remote Australia, 225Ð6
subacute sclerosing panencephalitis (SSPE), 121
tetanus, 120
tuberculosis, 119
vaccine-preventable diseases, 120Ð2, 160, 211
violence, 205, 218, 357
young people, 190
see also cancer mortality; cardiovascular diseases; road traffic fatalities; suicide
cefaclor monohydrate, 304
central nervous system drugs, 303
cephalexin, 304
cereal consumption, 191
cerebrovascular disease, see stroke
cervical cancer, 66, 67, 162, 386Ð8
overseas-born Australians, 205, 206, 207
CFCs, 136Ð7
chancroid, 384
check-ups
general practitioner consultations, 28, 294, 295
allied health consultations, 292
dental consultations, 290
chemists, see pharmacists
chemotherapy, 276
children, 185Ð9, 337
blood lead levels, 137Ð8
dental (oral) health, 19, 20Ð2, 390Ð1
diabetes, 86
diet, 145
epilepsy risk factors, 104
fitness, 18
03 AH2000 end matter Page 454 Thursday, June 1, 2000 2:31 PM

Index 455
TRIM SIZE 175 mm Wide x 250 mm Deep
haemolytic uraemic syndrome (HUS), 116
hearing impairment, 293
hospital separations, 270
Indigenous, 57, 226, 347
injury prevention, 75
mental problems and disorders, 76
mortality, 39Ð40, 185Ð7, 189, 209Ð10, 226, 342Ð3, 347, 355
rural and remote Australians, 226
vaccination, 33, 36, 143, 158Ð61
see also age; births
chiropodists/podiatrists, 265, 291, 292
chiropractors and osteopaths, 265, 291, 292
chlamydia, 29Ð30, 190, 384
chlorpheniramine/phenylephid, 304
cholera, 384
cholesterol, 169Ð70, 250, 392, 417
chromosomal abnormalities, 138Ð40, 141
chronic back pain, 46, 47, 99, 100
chronic obstructive pulmonary disease (COPD), 46, 95Ð7
burden of disease, 51, 52, 54, 194, 199
health system costs, 250
mortality, 40, 41, 42, 43Ð4, 359, 383: burden of premature (YLL), 51, 52
chronic respiratory diseases, 52, 53, 193Ð9
cigarette smoking, see tobacco smoking
circulatory diseases, see cardiovascular diseases
cirrhosis of liver, 108Ð9
cleft lip/palate, 184
climate, 136
clothing (sun protection measure), 156, 157
clotrimazole, 304
co-morbidity, 44, 86Ð9, 78, 84, 92
cocaine, 143, 144, 152, 153
colon cancer, 154
colonoscopy, 276
colorectal cancer, 40, 41, 42, 43, 65, 66, 67, 383, 386Ð9
burden of disease, 54, 195, 197, 199
burden of premature mortality (YLL), 51
health system costs, 250
Commonwealth Department of Health and Aged Care, 328, 335, 336
Commonwealth Department of VeteransÕ Affairs, 240
Commonwealth Government expenditure, 7, 8, 233Ð40
Indigenous health services, 241Ð2, 269Ð70
pharmaceuticals, 305Ð6
private health insurance, 251
research and development, 310
Commonwealth Government receipts, 244Ð5
communicable (infectious/parasitic) diseases, 109Ð23, 344, 345Ð7, 379Ð82, 384Ð5, 397Ð8, 401Ð2
burden of disease, 53, 193
Indigenous Australians, 211
international comparisons, 185
overseas-born Australians, 205, 207
procedures reported, 277
sexually transmitted, 29Ð31, 116Ð17, 162, 190, 384
03 AH2000 end matter Page 455 Thursday, June 1, 2000 2:31 PM

456 AustraliaÕs Health 2000
TRIM SIZE 175 mm Wide x 250 mm Deep
vaccination status, 157Ð61
community aged care packages, 281
community-based health care organisations, 7Ð8
community health services, 267Ð70, 280Ð1, 316Ð17
mental health, 282Ð3, 285, 316Ð17
community palliative care, 328
complementary medicines, 304Ð5
computers and computing, 336
conception (assisted), 27, 180Ð1
condoms, 28, 31, 163
congenital anomalies/malformations, 39, 53, 122, 138Ð40, 183Ð4, 379Ð80, 397Ð8
constant price estimates, 236, 241, 407
consultations with health professionals, 45, 285Ð300, 410Ð14
contact dermatitis, 295
contagious diseases, see communicable diseases
contraception, 28, 31, 162Ð4, 269
coordinated care, 317
coronary angiograms, 59, 60
coronary angioplasty, 59, 60, 334
coronary artery bypass grafting, 59, 60, 350
coronary heart disease, 56, 57Ð63, 347Ð51
pravastatin, 170
rural and remote Australia, 225
coronary stenting, 59, 60
cost of diseases, see health system costs
cost per casemix-adjusted separation, 321Ð2
coughs and colds, 294, 301
country of birth, 86, 135, 204Ð7, 265
CT brain scans, 59, 60
cultural health determinants, 135
DALYs, see disability-adjusted life years
day hospital facilities, 274
de-institutionalisation, 316Ð17
deafness (hearing loss), 46, 47, 52, 54, 194, 293
death, see causes of death; mortality
definitions
disability, 49
elective surgery waiting times, 323
genetic terms, 139
health, 2Ð3
high blood pressure, 169
delivery monitoring, 321Ð9, 338Ð9
delivery method (births), 183, 276
dementia, 52, 78, 103, 194, 199, 201
health system costs, 249, 250
mortality, 40, 103Ð4: burden of premature (YLL), 51
dengue fever, 118, 384
dental (oral) health, 19Ð26, 45, 46, 47, 338
burden of disease, 53, 198
expenditure on, 239, 240, 248, 403Ð6: private health insurance funds, 253
hospital separations, 276
rural and remote Australians, 227, 285Ð7
use of dental services, 285Ð90
dental workforce, 259, 260, 262, 263, 264, 265
Department of Health and Aged Care, 328, 335, 336
03 AH2000 end matter Page 456 Thursday, June 1, 2000 2:31 PM

Index 457
TRIM SIZE 175 mm Wide x 250 mm Deep
Department of VeteransÕ Affairs, 240
depression, 46, 47, 78, 83Ð4
burden of disease, 54, 55, 82, 193, 194, 197, 199
diabetes and, 88
general practitioner consultations, 295
status of indicators, 424Ð5
young people, 192
see also suicide
dermatitis, 295
designer drug use, attitudes to, 144
determinants of health, 2Ð4, 133Ð78, 338
children, 188Ð9
young people, 191
diabetes, 37Ð8, 46, 84Ð9, 336, 392
burden of disease, 52, 53, 54, 55, 89, 194Ð9
general practitioner consultations, 213, 295
health outcomes indicator framework, 334
health system costs, 89, 250
hospital separations, 37, 276
Indigenous Australians, 213, 215
mortality, 37, 40, 44, 89, 205, 225; burden of premature (YLL), 51
overseas-born Australians, 205, 206, 207
rural and remote Australia, 225Ð6
status of indicators, 419Ð21
diabetic nephropathy, 106, 108
diagnosis related groups (casemix), 274, 276, 277, 335
diagnostic imaging, 265, 296, 298, 299, 300, 411
dialysis, 106Ð7, 108, 202, 212Ð13, 276
diaphragmatic hernia, 184
diarrhoeal diseases/infections, 47, 48, 342, 347
diastolic blood pressure, 168
diazepam, 304
diclofenac sodium systemic, 304
diet and nutrition, 63, 68, 142, 144Ð6
consultations with dietitians/nutritionists, 291, 292
eating disorders, 82, 84, 249
Indigenous Australians, 216Ð17
undergraduate course commencements, 263, 264
young people, 191
digestive system diseases, 45, 276, 379Ð80, 397Ð402
burden of disease, 53, 193, 195Ð8
health system costs, 248
Indigenous Australians, 211
overseas-born Australians, 205, 206, 207
diphtheria, 120, 159, 347
disability, 48Ð55
asthma, 93
chronic obstructive pulmonary disease, 95
community care, 316Ð17
musculoskeletal disorders, 98
older people, 200Ð1
psychiatric, 78
socioeconomic status, 222
young people, 189
03 AH2000 end matter Page 457 Thursday, June 1, 2000 2:31 PM

458 AustraliaÕs Health 2000
TRIM SIZE 175 mm Wide x 250 mm Deep
disability-adjusted life years (DALYs), 48Ð55, 192Ð9
mental illness, 82
respiratory diseases, 97
socioeconomic status, 222Ð3
unsafe sex, 162
disability burden (YLDs), 52Ð4, 193, 195, 196
diabetes, 53, 54, 89
respiratory diseases, 97
socioeconomic status, 222Ð3
unsafe sex, 162
disadvantage, see Indigenous Australians; socioeconomic status
disease risk factors, see risk factors
diseases, 2Ð4, 19Ð26, 29Ð123
classification, 274Ð7
cost of, 248Ð51
ear diseases/disorders, 46, 47, 52, 54, 194, 293
eye diseases/disorders, 45, 46, 87, 88, 201, 202
genito-urinary diseases, 53, 195Ð9, 211, 277, 379Ð80
Indigenous Australians, 210Ð15
rural and remote Australians, 225Ð7
see also cancer; cardiovascular diseases; causes of death; communicable diseases; digestive system diseases; disability; hospitalisation; injuries and poisonings; mental health/disorders; respiratory diseases/infections
dislocations, strains and sprains, 74, 295
diverticulitis, 47
doctors, see medical practitioners
donovanosis, 384
Down syndrome, 141
doxycycline HCI, 304
drinking water, fluoride in, 20, 22
drowning, 75, 187, 355
drug deaths, 51, 52, 73Ð4, 81, 152, 191
drugs and drug use, 146Ð54, 301Ð6, 401Ð2
asthma and, 91, 92, 94, 301, 303
attitudes to, 143, 144
cardiovascular disease, 57, 170
dependence/drug use disorders, 78
general practitioner prescribed/advised/supplied, 296
Indigenous Australians, 217
rural and remote Australians, 224
see also pharmaceutical services
ear diseases/disorders, 46, 47, 52, 54, 194, 293, 399Ð402
eating disorders, 82, 84, 249
economic health determinants, 135
ecstasy, use of, 144, 152, 153
edentulism, 19Ð20, 23, 25, 46, 227
education and training, 215
health and medical, 263Ð5
see also socioeconomic status
EdwardÕs syndrome, 141
elective surgery waiting times, 322Ð4
electronic health records, 336
emergency departments, 92, 277, 296
emotional stress, 36
see also depression
emphysema, see chronic obstructive pulmonary disease
03 AH2000 end matter Page 458 Thursday, June 1, 2000 2:31 PM

Index 459
TRIM SIZE 175 mm Wide x 250 mm Deep
employment, 191, 215
see also health workforce; socioeconomic status
enalapril, 303
encephalitis, 118, 160
encephalocele, 183Ð4
end-stage renal disease, 88, 105Ð9, 212
endocrine disorders, 196, 211, 379Ð80, 397Ð402
energy intake, 145Ð6, 417
environmental determinants of health, 133Ð8
epilepsy, 103, 104
erythromycin, 304
evening primrose oil, 305
evidence base to support priority setting, 313Ð16
exercise, see physical activity
expenditure, see health expenditure; health system costs
extrinsic aleolitis, see chronic obstructive pulmonary disease
eye diseases/disorders, 45, 46, 87, 88, 201, 202, 399Ð402
falls, 47, 74, 75, 187, 250
family planning, 28, 162Ð4, 268Ð9
far-sightedness, 45
fat intakes, 145Ð6, 169, 417
fatalities, see mortality
felodipine, 303
females, see women
fertility, see births
finance, see health expenditure; health system costs
firearms, suicide by, 81
fires/burns/scalds, 46, 401Ð2
fitness, 17Ð19
flexibility and muscle strength, 18Ð19
fluoridated drinking water, 20, 22
foetal deaths (stillbirths), 27, 182, 209
folic acid, 183Ð4
food, see diet and nutrition
forceps delivery, 183
fractures, 74
fruit and vegetable consumption, 145, 191
frusemide, 303, 304
full-time employment, 258, 259
funding, see health expenditure; health system costs
gall bladder and bile duct disease, 47
gamete intra-fallopian transfer (GIFT), 181
gas emissions, 136
gastrointestinal infections, 115Ð16, 384
general practitioners (GPs), 7, 158, 316
general practitioners, consultations with, 293Ð6, 299, 300, 410
blood pressure, 168
cardiovascular diseases, 57
depression, 84
diabetes and complications, 88, 213, 295
drugs prescribed/supplied during, 303Ð4
Indigenous Australians, 213Ð14
mental problems and disorders, 76Ð7
musculoskeletal disorders, 98, 100
03 AH2000 end matter Page 459 Thursday, June 1, 2000 2:31 PM

460 AustraliaÕs Health 2000
TRIM SIZE 175 mm Wide x 250 mm Deep
generalised anxiety disorder, 46, 199
genetic diseases, 39, 53, 122, 138Ð40, 183Ð4, 379Ð80, 397Ð8
genitals, 28Ð9, 183, 295, 399Ð402
genito-urinary diseases, 53, 195Ð9, 211, 277, 379Ð80, 399Ð402
gestational diabetes, 85, 86
GIFT, 181
Gini coefficient, 220, 221, 222
glaucoma, 87
Global Burden of Disease Study, 48
global warming, 136
glomerulonephritis, 105, 106
golf, 155
gonococcal infection, 30, 117, 190, 384
gout, 102Ð3
government concession cardholders
Australian Hearing Service clients, 293
dental (oral) health, 24, 285, 288, 289
general practitioner consultations, 294
government expenditure, 7, 233Ð40, 241Ð4, 305, 309Ð10
see also Commonwealth Government expenditure
greenhouse gases, 136
gross domestic product (GDP), 2
health services expenditure ratio, 232, 233, 234, 238, 245Ð7, 408
gum-related diseases, 22
HACC program, 279, 280Ð1
haemodialysis, 106Ð7, 108, 202, 212Ð13, 276
haemolytic uraemic syndrome (HUS), 116
Haemophilus influenzae type b (Hib), 120, 159, 384
haemorrhoids, 57
hallucinogens, 144, 152, 153
hanging, suicide by, 81
hats, 156, 157
hay fever, 36, 45
headaches, 45
health administration, 403Ð6
undergraduate course commencements, 263, 264
health counselling undergraduate course commencements, 263, 264
health determinants, see determinants of health
health expenditure, 7, 232Ð53, 403Ð8
aged care, 239, 280, 281, 282, 403Ð6
ageing and, 316
Indigenous Australians, services for, 218, 219
medications/pharmaceuticals, 305Ð6
mental health services, 282Ð3, 284
private health insurance funds, 251Ð2
research and development, 309Ð10, 403Ð6
rural zone, 228
see also health system costs
health information, see statistical developments, gaps and deficiencies
Health Information Agreement, 6Ð7
health insurance, 8, 251Ð7
see also Medicare
Health Insurance Commission, 7, 297, 332
03 AH2000 end matter Page 460 Thursday, June 1, 2000 2:31 PM
Index 461
TRIM SIZE 175 mm Wide x 250 mm Deep
health outcomes indicator framework, 320, 334
health planning issues, 313Ð17
health promotion and prevention, 306Ð9
health research, 94, 309Ð10, 314, 403Ð6
health resources, 232Ð312, 338
health risk factors, see risk factors
health services supply and use, 266Ð300, 393Ð402, 410Ð14
Indigenous Australians, 218
see also general practitioners, consultations with; hospitalisation
health status, 10Ð132, 337Ð8
health system, 7Ð8
health system costs, 248Ð51
asthma, 94, 250
diabetes, 89, 250
mental disorders, 83, 248, 249, 250
musculoskeletal disorders, 99, 248, 250
health workforce, 258Ð65, 316, 409
Indigenous, 264Ð5, 270
psychiatric hospitals, 283, 284
public hospital labour costs, 322
healthcare cards, see government concession cardholders
hearing loss, 46, 47, 52, 54, 194, 293
hearing services, 293
heart attack risk, 84
heart diseases
diabetes and, 87
older people, 201
rural and remote Australians, 225
rheumatic, 37Ð8, 56Ð7, 58, 61, 334Ð5, 351
see also coronary heart disease; ischaemic heart disease
heart failure, 57, 58, 60, 61
diabetes and, 88
health system costs, 250
ischaemic heart disease and, 44
older people, 202
hepatitis A, 384
hepatitis B, 114, 115, 162, 384
hepatitis C, 114Ð15, 162, 384
hepatitis D, 115
hepatitis, nec, 384
herbal medications, 91, 304, 305
herbalists, consultations with, 291, 292
herd immunity, 33Ð6
heroin, 51, 52, 143, 144, 152, 153
Hib, 120, 159, 384
high blood cholesterol, 169Ð70, 250, 392, 417
high blood pressure, 167Ð9, 294, 417
higher education, 263Ð5, 310
hip, congenital dislocation of, 184
histamines, 36
HIV/AIDS, 112Ð14, 162, 164, 347, 385
burden of disease, 52, 194
injecting drug users, 153Ð4
overseas-born Australians, 205
young people, 31, 189
Home and Community Care program, 279, 280Ð1
home nursing services, 253
home tenure, 216
homicide, 205, 357
homosexual men, 154, 164, 385
03 AH2000 end matter Page 461 Thursday, June 1, 2000 2:31 PM

462 AustraliaÕs Health 2000
TRIM SIZE 175 mm Wide x 250 mm Deep
hormones, 303
hospitalisation, 270Ð8, 393Ð402
acute respiratory infections (ARI), 111
auto-immune diseases and conditions, 37
alcohol caused, 146
asthma, 92, 94, 187Ð8
cardiovascular disease, 57Ð60, 225, 276
children, 187Ð8, 226
chronic obstructive pulmonary disease, 95, 96
dengue fever, 118
diabetes, 37, 88Ð9, 225Ð6
dialysis procedures, 107
haemolytic uraemic syndrome (HUS), 116
Haemophilus influenzae type b (Hib), 120
hepatitis B, 114
hepatitis C, 115
HIV/AIDS, 113Ð14
illicit drug users, 152
Indigenous Australians, 210Ð13, 217, 218, 333
infectious and parasitic diseases, 110
injuries, 74, 75, 187, 218, 226, 227
liver, cirrhosis of, 108
malaria, 118
measles, 121
meningitis, 110
mental problems and disorders, 77Ð8, 285, 286
multiple sclerosis, 105
mumps, 121
musculoskeletal disorders, 98, 99, 100, 101, 102, 103
nervous system disorders, 103, 105
older people, 201, 202
overseas-born Australians, 206Ð7
palliative care, 327
pertussis, 119
pneumonia and influenza, 110
reproduction and reproductive organs, 28Ð9
rubella, 122
rural and remote Australian, 225Ð6, 227, 228
smoking as cause, 149
subacute sclerosing panencephalitis (SSPE), 121
suicide and self-harm attempts, 81, 192
tetanus, 120
tuberculosis, 118
vaccine-preventable diseases, 119Ð22, 185
young people, 192
hospitals, 7, 8, 270Ð8, 335
bed availability, 228, 266Ð7, 268, 284
expenditure on, 237, 249, 250, 403Ð6: private health insurance funds, 252, 253
general practitioner referrals to, 296
performance indicators, 321Ð7
see also public hospitals
hostels, 281, 282
housing, 216
Human Genome Project, 140
HUS, 116
03 AH2000 end matter Page 462 Thursday, June 1, 2000 2:31 PM

Index 463
TRIM SIZE 175 mm Wide x 250 mm Deep
hydatid infection, 384
hydrocephalus, 184
hydrotherapists, see physiotherapists
hynotherapists, consultations with, 291, 292
hypertension/hypertensive disease, 45, 57, 58, 61
cause of renal failure, 106
diabetes and, 87, 88, 89
depression and, 84
general practitioner consultations, 213, 294, 295
health system costs, 250
ischaemic heart disease and, 44
Indigenous Australians, 213
hypospadias, 184
illicit drugs, see drugs
illness, see diseases
imaging, 265, 296, 298, 299, 300, 411
immigrants, 86, 118, 204Ð7, 265, 287Ð90, 294, 341
immunisation, see vaccination
Immunise Australia program, 158
immunodeficiency, 38
immunological health, 31Ð8
in-vitro fertilisation (IVF), 181
inactivity, 154Ð5, 205Ð6, 417
income
Commonwealth Government receipts, 244Ð5
Indigenous Australians, 215Ð16
private health insurance funds, 253, 255, 256
see also socioeconomic status
incontinence, 46
Index of Relative Socioeconomic Disadvantage, 220, 221, 224
Indigenous Australians, 7, 207Ð19, 224, 333, 335
birthweight, 182, 209Ð10
cardiovascular diseases, 56Ð7, 58, 211, 334Ð5, 351
dental (oral) health, 22, 290
general practitioner patients, 294
health education and training, 264Ð5
health performance indicators, 318
health services, 241Ð2, 269Ð70
kidney disease, 108, 212
life expectancy, 12, 208
Indigenous Australians: mortality, 208Ð9, 211, 340Ð1
children, 209Ð10, 226, 347
kidney disease, 108
metropolitan/rural, 225
rheumatic heart disease, 61
young people, 192
industrial lead, 137Ð8
infants, 401Ð2
mortality, 39, 182, 189, 185Ð6, 342Ð3, 379Ð80: Indigenous, 209Ð10, 347
epilepsy risk factors, 104
immunisation, 159
infectious agents, 63
infectious diseases, see communicable diseases
influenza, 347
vaccine, 303, 304
information technology, 336
inhalants, 144, 152, 153
03 AH2000 end matter Page 463 Thursday, June 1, 2000 2:31 PM

464 AustraliaÕs Health 2000
TRIM SIZE 175 mm Wide x 250 mm Deep
injected drugs, 152, 153Ð4
injuries and poisonings, 47, 71Ð5, 176, 344, 355Ð7, 379Ð82, 397Ð8, 401Ð2
burden of disease, 53, 193Ð8
children, 75, 187, 355
health outcomes indicator framework, 334
health system costs, 248
Indigenous Australians, 211, 212, 227
overseas-born Australians, 205, 207
rural and remote Australians, 226, 227
status of indicators, 422Ð3
young people, 189, 190, 192, 227
see also suicide
institutional care, 238, 316Ð17
aged people, 239, 281Ð2: oral health of residents, 23Ð6
see also hospitals
intentional injuries, 74, 193, 197
see also suicide
international comparisons, 428
alcohol consumption, 148
asthma mortality, among young people, 90
cancer incidence, 389
childrenÕs health, 185
death rates, 375Ð8: cardiovascular diseases, 62Ð3
fertility and pregnancy, 367, 370
health expenditure, 245Ð8, 408
health workforce, 259Ð60, 262
hospital length of stay, 270
Indigenous peoplesÕ mortality patterns, 340Ð1
life expectancy, 12, 13, 372
melanoma, 70
International Diabetes Institute, 336
interpersonal violence, see violence
intracranial injuries, 74
intra-uterine devices (IUDs), 28, 29, 163
ipratropium bromide, 303
iron-deficiency anaemia, 46
ischaemic heart disease, 54, 194, 197, 199, 202
diabetes and, 88, 89
health system costs, 250
overseas-born Australians, 205, 207
ischaemic heart disease: mortality, 40, 41Ð2, 89, 205, 383
additional causes of death associated with, 44
burden of premature mortality (YLL), 51
IUDs, 28, 29, 163
IVF, 181
Japanese encephalitis, 118
juvenile chronic arthritis, 102
kidney diseases, 105Ð9
cancer, 65, 66, 67, 386Ð8
diabetes and, 87, 88, 89
dialysis, 106Ð7, 108, 202, 212Ð13, 276
haemolytic uraemic syndrome (HUS), 116
Indigenous Australians, 108, 212Ð13
KlinefelterÕs syndrome, 141
knee procedures, 276
knowledge, about sexual health, 31
03 AH2000 end matter Page 464 Thursday, June 1, 2000 2:31 PM

Index 465
TRIM SIZE 175 mm Wide x 250 mm Deep
labour force, see health workforce
language spoken at home, use of dental services and, 287Ð8, 289Ð90
larynx, cancer of, 66, 67
lead, health effects of, 137Ð8
legionellosis, 384
length of hospital stay, 270, 272, 273, 276, 317, 397Ð402
acute respiratory infections (ARI), 111
cardiovascular diseases, 58Ð9
chronic obstructive pulmonary disease, 95
diabetes, 89
liver, cirrhosis of, 108
reproductive organs, 28Ð9
injuries, 74
musculoskeletal disorders, 98
palliative care, 327
leprosy, 384
leptospirosis
leukaemia, 66, 67
levonorgestrel/ethinyloestradiol, 304
life expectancy, 11Ð12, 13, 200, 208, 342, 371Ð2
disability-free, 48
see also disability-adjusted life years
lifestyle, 3, 144Ð64, 169, 350Ð1
lip cancer, 65, 386
lipid disorder, 57, 88, 295
listeriosis, 384
liver diseases, 108Ð9
living conditions, 216
see also socioeconomic status
local government, 8, 233Ð40, 241Ð2
longevity, see life expectancy
lower respiratory tract infections, 47, 110Ð12
LSD, 144
lung cancer, 65, 66, 67, 69Ð70, 386Ð9
burden of disease, 54, 194, 195, 197, 199
health system costs, 250
overseas-born Australians, 206, 207
lung cancer mortality, 40, 41, 42Ð3, 65, 67, 69Ð70, 352Ð4, 383, 386
burden of premature (YLL), 51, 52
overseas-born Australians, 205, 206
lung function, 18Ð19
lymphatic system, operations on, 399Ð400
lymphatic tissue, cancer of, 40
malaria, 118, 384
males, see sex of population groups
male homosexuals, 164, 154, 385
marijuana, see cannabis
maternal mortality, 181, 343Ð4
MCS (mental health component summary) scores, 12Ð17
meal services, for older people, 280, 281
measles, 33, 121, 159, 160Ð1, 185, 347, 384
Measles Control Campaign (MCC), 161
Medibank, 233Ð4, 240
medical imaging, 265, 296, 298, 299, 300, 411
medical practitioners, 7, 8, 259, 260Ð2
in Aboriginal health services, 270
consultations with, 293Ð6, 298Ð300
overseas trained, 265
03 AH2000 end matter Page 465 Thursday, June 1, 2000 2:31 PM

466 AustraliaÕs Health 2000
TRIM SIZE 175 mm Wide x 250 mm Deep
undergraduate course commencements, 263, 264
see also general practitioners
medical radiography, 263, 264
medical science, 263, 264
medical services, expenditure on, 239, 240, 249, 403Ð6
private health insurance funds, 253
medical technology, 263, 264, 336
medical treatment, adverse effects of, 250, 326Ð7
Medicare, 7, 8, 296Ð300, 410Ð14
Australian Health Care Agreements 1998, 337
distribution of general practice providers, 261, 262
expenditure and, 235, 237, 238Ð9, 240, 242
Medicare levy, 244Ð5
medications, see drugs; pharmaceutical services
medicine (field of study), 263, 264
melanoma, 65, 67, 70Ð1, 206, 386Ð9
men, see sex of population groups
men who have sex with men, 164, 154, 385
meningitis, 110, 120, 384
menopausal complaints, 28, 84
menstrual problems, 47
mental health/disorders, 46, 47, 76Ð84, 335, 337Ð8, 379Ð80
burden of disease, 52, 53, 55, 192Ð9
health system costs, 83, 248, 249, 250
Indigenous Australians, 211
mental component summary (MCS) scores, 12Ð17
older people, 201
overseas-born Australians, 207
psychiatric hospitals, 240, 267, 268, 283Ð5, 317
psychiatric patients, 77Ð8, 82, 285, 286, 277, 397Ð8, 401Ð2
rural and remote Australians, 226
status of indicators, 424Ð5
young people, 76, 77, 189
mental health services, 240, 267, 282Ð5, 316Ð7
mental retardation, 249
metabolic and endocrine disorders, 196, 379Ð80
methadone, 144, 153
methods and conventions, 428Ð9
migrants, 86, 118, 204Ð7, 265, 287Ð90, 294, 341
mineral supplements, 304, 305
monitoring service delivery, 321Ð9, 338Ð9
morbidity, see diseases
mortality, 39Ð44, 135, 340Ð64, 368Ð83
children, 39Ð40, 185Ð7, 209Ð10, 226, 342Ð3, 347, 355
Indigenous Australians, 192, 208Ð10, 225, 226, 227, 347
infants, 39, 182, 189, 185Ð6, 209Ð10, 342Ð3, 347, 379Ð80
maternal, 181
overseas-born Australians, 204Ð6, 341
palliative care, 327Ð8
rural and remote Australians, 225Ð7
socioeconomic status, 221Ð2
young people, 189, 190, 191, 192, 226
03 AH2000 end matter Page 466 Thursday, June 1, 2000 2:31 PM

Index 467
TRIM SIZE 175 mm Wide x 250 mm Deep
see also causes of death; life expectancy
mortality (premature), burden of (YLLs), 50, 51Ð4, 193, 195, 196
diabetes, 53, 54, 89
respiratory diseases, 97
socioeconomic status, 221, 222, 223
unsafe sex, 162
mothers, 28, 179, 181, 343Ð4, 366, 369
motor vehicle accidents, see road traffic accidents
motor vehicle exhaust gas suicides, 81
multiple births, 180Ð1
multiple sclerosis (MS), 37Ð8, 103, 105
mumps, 121, 159, 384
muscle strength and flexibility, 18Ð19
musculoskeletal disorders, 97Ð103, 379Ð80, 397Ð8, 401Ð2
burden of disease, 52, 53, 98, 101, 193, 195Ð9
congenital malformations, 183
health system costs, 99, 248, 250
older people, 100, 101, 102, 201
see also arthritis
myringitis/otitis media, 213, 295
National Cancer Statistics Clearing House, 64, 334
National Community Based Health Services Codeset, 335
National Death Index, 334
National Diabetes Register, 87
National Elective Surgery Waiting Times Data Collection, 322Ð4
National Health and Medical Research Council, 314
National Health Information Agreement, 6Ð7
National Health Information Development Plan, 332Ð6
National Health Information Management Advisory Council, 336
National Health Information Management Group (NHIMG), 320, 332, 334
National Health Information Model, 333Ð4
National Health Priority Areas (NHPAs), 55Ð94, 276, 319, 334
status of indicators, 415Ð25
see also asthma; cancer; cardiovascular diseases; diabetes; injuries and poisonings; mental health
National Heart Foundation, 334, 336
National Minimum Data Sets, 327Ð8, 335
National Program for the Early Detection of Breast Cancer (BreastScreen Australia), 328Ð9, 335
National Public Health Partnership, 319, 337
National Tobacco Campaign, 309
natural medications, 304
naturopaths, consultations with, 291, 292
neck problems, 250
neonatal conditions, 53
neonates, see infants
neoplasm, see cancer
nephritis, 44
nephropathy, 106, 108
nervous system disorders, 52, 53, 103Ð5, 193, 195Ð8, 379Ð80, 397Ð402
drugs, 303
03 AH2000 end matter Page 467 Thursday, June 1, 2000 2:31 PM

468 AustraliaÕs Health 2000
TRIM SIZE 175 mm Wide x 250 mm Deep
Indigenous Australians, 211
see also dementia
neural tube defects, 183Ð4
neurotic disorders, 78
New South Wales, see States and Territories
NHPAs, see National Health Priority Areas
non-admitted patients, 92, 277, 296
non-Hodginkin's lymphoma, 65, 66, 67, 386Ð8
non-prescribed medicines, 303Ð5
Northern Territory, see States and Territories
notifiable diseases, see cancer; communicable diseases
nurses and nursing, 259, 262Ð3, 264, 265, 316
consultations, 291, 292
nursing homes, 94, 239, 281, 282, 403Ð6
oral health of residents, 23Ð6
nutrition, see diet and nutrition
obesity, 164Ð7, 189, 216Ð17, 417
obstetrics, see births
occupation, see health workforce; socioeconomic status
occupational asthma, 91
occupational fatalities, 357
occupational therapists/therapy, 263, 264, 265, 291, 291
oesophagus, 67, 184, 202, 295
Office for Aboriginal and Torres Strait Islander Health, 269
older people, 200Ð3
aged care services, 239, 278Ð82, 403Ð6
epilepsy risk factors, 104
private health insurance, 254
online information, 336Ð7
open wounds, 74
operations, 299, 300, 399Ð400, 411
elective surgery waiting times, 322Ð4
oral surgery, 22
waiting times for elective surgery, 322Ð4
see also procedures
opiate-related deaths, 51, 52, 73Ð4, 81, 191
optometrists, opticians and optometry, 263, 264, 265
consultations with, 291, 292, 411
Medicare benefits paid, 299, 300
oral contraceptive pill, 28, 31, 163
oral health, see dental health
ornithosis, 384
osteoarthritis, 46, 98, 100Ð1
burden of disease, 52, 54, 101, 199
diabetes and, 88
general practitioner consultations, 295
health system costs, 99, 250
osteopaths and chiropractors, 265, 291, 292
osteoporosis, 46, 99, 100, 101
otitis media, 47, 160, 213, 295
outcomes indicator framework, 320, 334
overseas-born Australians, 86, 118, 204Ð7, 265, 287Ð90, 294, 341
overseas-trained health professionals, 265
overweight, 164Ð7, 189, 216Ð17, 392, 417
ozone layer, 136Ð7
03 AH2000 end matter Page 468 Thursday, June 1, 2000 2:31 PM

Index 469
TRIM SIZE 175 mm Wide x 250 mm Deep
pain killers/relievers (analgesics), 144, 152, 153, 301, 302, 303
palliative care, 327Ð8
pancreas, cancer of, 66, 67, 386Ð8
Pap smears, 28, 295
paracetamol, 302Ð3, 304
paranoid states, 78
parasitic diseases, see communicable diseases
Parkinson's disease, 103, 104Ð5, 199
part-time employment, 258, 259
Patau's syndrome, 141
pathology, 57, 296, 298, 299, 300, 410
patient-days, 74, 270, 271, 272, 276, 285, 286, 395Ð402
PCS (physical component summary) scores, 12Ð17
pedestrian deaths, 187
pensioners, see government concession cardholders
peptic ulcer disease, 46, 47, 303
per person expenditure, 228, 240Ð4, 246Ð8
performance indicators, 317Ð29, 337, 338Ð9
perinatal mortality, 182, 210, 212, 369Ð70, 379Ð80, 397Ð8
periodontal disease, 46, 47
peripheral vascular disease, 57, 58, 60, 61, 88, 250
personality disorders, 78, 82, 249
pertussis, 119Ð20, 159, 185, 347, 384
Pharmaceutical Benefits Advisory Committee, 315
Pharmaceutical Benefits Scheme, 242, 301Ð2, 305Ð6, 315, 403Ð6
pharmaceutical services, expenditure on, 239, 240, 249, 250, 305Ð6, 403Ð6
private health insurance funds, 253
see also drugs
pharmacists (chemists), 259, 260
consultations with, 291, 291
undergraduate course commencements, 263, 264
overseas-trained, 265
physical activity/inactivity, 19, 154Ð5, 205Ð6
overseas-born Australians, 205Ð6
rural and remote Australians, 224
status of indicators, 417
young people, 191
physical component summary (PCS) scores, 12Ð17
physical environmental health determinants, 135Ð8
physical fitness, 17Ð19
physical stress, 36
physicians, see medical practitioners
physiotherapists/hydrotherapists, 263, 264, 265
consultations with, 291, 292
plague, 346
planning issues, 313Ð17
pneumonia, 40, 44, 110, 111, 202, 359
podiatrists/chiropodists, 263, 264, 265
consultations with, 291, 292
poisoning, 74, 75
poliomyelitis, 120, 159, 347
population ageing, 316
03 AH2000 end matter Page 469 Thursday, June 1, 2000 2:31 PM
470 AustraliaÕs Health 2000
TRIM SIZE 175 mm Wide x 250 mm Deep
population groups, 179Ð231, 338, 365, 428
overseas-born Australians, 204Ð7, 265, 287Ð90, 294, 341
private health insurance coverage, 252Ð5, 256Ð7
see also age; Indigenous Australians; sex of population groups; socioeconomic status
pravastatin, 170
pregnancy, see births
prescribed medicines, 294, 296, 301Ð3
prevention and promotion, 306Ð9
priority setting, 313Ð16
private acute care hospitals, 266, 268, 283
private health insurance, 8, 251Ð7
private health research and development, 309Ð10
private hospitals, 8, 270Ð3, 286, 394, 396, 398, 400, 402
Australian Council on Healthcare Standards (ACHS) accreditation, 327
dialysis procedures, 107
expenditure on, 239, 240, 403Ð6: private health insurance funds, 252, 253
freestanding day facilities, 274
non-admitted patients, 277
private patients, 8, 273, 297
private psychiatric hospitals, 283, 284
procedures, 271, 274, 275Ð7
cardiovascular, 59Ð60, 334Ð5, 349Ð50
dialysis, 106Ð7, 108, 202, 212Ð13, 276
older people, 201, 202
promotion and prevention, 306Ð9
prostate cancer, 40, 41, 43, 64Ð5, 66, 386Ð9
burden of disease, 195
burden of premature mortality (YLL), 51
health system costs, 250
overseas-born Australians, 205, 206, 207
survival rate, 67
prostatic hypertrophy, 46, 47
PSA tests, 64Ð5
psychiatric hospitals, 240, 267, 268, 283Ð5, 317, 403Ð6
psychiatric patients, 77Ð8, 82, 285, 286, 277
psychological development, disorders of, 249
psychological drugs, 303
psychologists, consultations with, 291, 291
psychotic disorders, 78, 84, 249
public attitudes, 143Ð4
public health, 6Ð8, 319, 337
interventions, 306Ð9
public (acute care) hospitals, 7, 8, 228, 233, 266Ð7, 268
dialysis procedures, 107
expenditure on, 239, 240, 244, 403Ð6: private health insurance funds, 253
length of stay, 317, 397, 399, 401
non-admitted patients, 277
palliative care, 327
patient days, 395, 397, 399, 401
performance indicators, 321Ð7
psychiatric wards, 283
03 AH2000 end matter Page 470 Thursday, June 1, 2000 2:31 PM

Index 471
TRIM SIZE 175 mm Wide x 250 mm Deep
separations, 270Ð3, 393, 397, 399, 401: mental health disorder, 286
public psychiatric hospitals, 240, 267, 268, 270Ð3, 283, 284, 286, 403Ð6
pulmonary diseases, see chronic obstructive pulmonary disease
Q disease, 384
qualifications, 215
health and medical, 263Ð5
see also socioeconomic status
quality of health services, 324Ð7
quarantine, 346
Queensland, see States and Territories
radiation, 63, 71, 136Ð7
radiography, 263, 264
rainfall, 136
ranitidine, 303, 304
rashes, 294
record linkage, 334
recreational activity, participation in, 155, 191
recurrent expenditure, 238, 239Ð40, 241, 403Ð6
referrals, by general practitioners, 296
regulatory framework, 8
rehabilitation undergraduate course commencements, 263, 264
remote Australia, see rural and remote Australians
renal agenesis and dysgenesis, 184
renal dialysis, 106Ð7, 108, 202, 212Ð13, 276
renal diseases, see kidney diseases
repatriation hospitals, 240, 403Ð6
Repatriation Pharmaceutical Benefits Scheme, 302
reproduction, see births; genitals
research and development, 94, 309Ð10, 314, 403Ð6
residential aged care, 239, 281Ð2, 403Ð6
oral health of residents, 23Ð6
resources, 232Ð312, 338
respiratory diseases/infections, 45, 47, 110Ð12, 379Ð82, 397Ð402
burden of disease, 52, 53, 97, 193Ð9
drugs, 303
general practitioner consultations, 213, 294, 295
health system costs, 248
Indigenous Australians, 211, 212, 213
mortality, 39, 111, 205, 206, 211, 344, 358Ð9
older people, 201, 202, 203
overseas-born Australians, 205, 206, 207
procedures reported, 277
see also chronic obstructive pulmonary disease
respite aged care, 280, 282
rheumatic fever/heart disease, 37Ð8, 56Ð7, 58, 61, 334Ð5, 351
rheumatoid arthritis, 37Ð8, 99, 101Ð2
risk factors, 133Ð78, 336, 338
asthma, 90Ð2
cancers, 63, 68, 69Ð70, 71
cardiovascular diseases, 392
children, 188
diabetes, 85, 86Ð7
03 AH2000 end matter Page 471 Thursday, June 1, 2000 2:31 PM

472 AustraliaÕs Health 2000
TRIM SIZE 175 mm Wide x 250 mm Deep
epilepsy, 104
Indigenous Australians, 215Ð18
rural and remote Australians, 224
road traffic accidents, 47, 52, 54, 193, 194
health system costs, 250
young people, 189
road traffic fatalities, 72, 73, 356
burden of premature mortality (YLL), 51
children, 187
overseas-born Australians, 205
rural and remote Australians, 226
young people, 189
Ross River virus, 117, 384
roxithromycin, 304
rubella, 121Ð2, 159, 384
rural and remote Australians, 223Ð8, 285Ð7, 337
health workers, 260Ð2, 263
safer sex practices, 31
salbutamol, 303, 304
salmonellosis, 384
salt consumption, 146
same-day patients, 272Ð4, 276, 286, 317, 397Ð402
saturated fat intake, 145Ð6, 169, 417
scalds/burns, 46, 401Ð2
schizophrenia, 78, 82, 84, 249, 250
School Dental Services, 262
science undergraduate course commencements, 263, 264
self-reported health, 12Ð17
young people, 189, 191
separation anxiety disorder, 47
service delivery monitoring, 321Ð9, 338Ð9
sex of population groups, 4, 192Ð9, 365, 393Ð6
acute respiratory infections (ARI), 111Ð12
aged care assessments, 280
aged 80 and over, 316
alcohol consumption, 147, 148
allied health service use, 291
asthma, 90
attitudes and beliefs, 143Ð4
auto-immune diseases and conditions, 37Ð8
birth ratios, 367
blood cholesterol, 170, 392
blood pressure, 168, 392
body weight, 164Ð7, 392
burden of disease, 52
cancer, 63Ð71, 386Ð9
cardiovascular diseases, 56, 57Ð9, 350, 392
chronic obstructive pulmonary disease, 95Ð7
dengue fever, 118
diabetes, 87, 88, 392
disability, 48, 78
family planning clients, 269
general practitioner patients, 293
health system costs, 251
health workforce, 258, 259, 260, 263
hepatitis B, 114
hepatitis C, 115
HIV/AIDS, 112, 114, 153Ð4, 385
03 AH2000 end matter Page 472 Thursday, June 1, 2000 2:31 PM

Index 473
TRIM SIZE 175 mm Wide x 250 mm Deep
illicit drug use, 152, 153Ð4
Indigenous Australians, 208, 215, 216Ð17, 218
injuries, 75
kidney diseases, 105, 107
life expectancy, 11, 12, 13, 20, 208, 342, 371Ð2
malaria, 118
medical practitioner consultations, 300
Medicare services, 412Ð14
medication use, 301, 304Ð5
mental problems and disorders, 76, 78, 82, 84
morbidity, 45Ð7, 52
multiple sclerosis, 105
musculoskeletal disorders, 98, 100, 101, 102, 103
older people, 200Ð3: oral health, 25
palliative care, 327
Parkinson's disease, 105
physical activity, 154Ð5, 392
rubella, 121, 122
rural and remote Australians, 224, 227
saturated fat intakes, 145
self-assessed health status, 14Ð17
socioeconomic status, 222Ð3
sexual health, 28Ð9
sexually transmitted diseases, 29Ð30
subacute sclerosing panencephalitis, 121
tetanus, 120
tobacco smoking, 148Ð51, 392
tuberculosis, 118
young people, 192
sex of population groups, and mortality, 39Ð44, 51, 52, 54, 340, 341, 371Ð83
auto-immune diseases and conditions, 37
cancer, 63Ð71, 352Ð5, 386
cardiovascular diseases, 60Ð3, 211
children, 75, 185, 186, 187, 210
chronic obstructive pulmonary disease, 95, 96
coronary heart disease, 350Ð1
dementia, 104
diabetes, 89
Indigenous Australians, 208Ð9, 210, 211, 218, 225, 227
infectious and parasitic diseases, 346
injuries, 72Ð4, 75, 226, 227, 379Ð82
kidney disease, 107, 108
liver, cirrhosis of, 108Ð9
mental problems and disorders, 79Ð82, 211
musculoskeletal disorders, 98
overseas-born Australians, 205Ð6
respiratory diseases, 111, 358
road traffic accidents, 189, 226
rural and remote Australians, 225, 226
socioeconomic status, 221Ð2
suicide, 79Ð82, 191, 226, 357
young people, 190, 191, 192
sex chromosome anomalies, 141
sexual deviations and disorders, 78
sexual health/practice, 26Ð31, 162Ð4, 268Ð9
see also births
03 AH2000 end matter Page 473 Thursday, June 1, 2000 2:31 PM

474 AustraliaÕs Health 2000
TRIM SIZE 175 mm Wide x 250 mm Deep
sexually transmitted diseases, 29Ð31, 116Ð17, 162, 190, 384
see also HIV/AIDS
SF-12 questionnaire, 14
shigellosis, 384
shooting, suicide by, 81
sickness, see diseases
SIDS, 185, 186
sight, see eye diseases/disorders
simvastatin, 303, 304
sinusitis, 295
skin cancers, 47, 137, 155Ð7, 250
melanoma, 65, 67, 70Ð1, 206
older people, 202
overseas-born Australians, 205, 206, 207
skin diseases/disorders, 379Ð80, 397Ð8
skin ointments and creams, 303
skin procedures, 276
sleep disturbance, 84, 295
slipped disc, 46, 47, 99, 100
smoking, see tobacco smoking
social health determinants, 135
social phobia, 46
social workers/welfare officers, consultations with, 291, 291
socioeconomic status, 5, 135, 142, 218Ð23
children, 188, 189
coronary heart disease mortality rates, 350
Indigenous Australians, 215Ð16
life expectancy, 11
oral health, 22, 24
self-reported health status, 16Ð17
suicide, 357
young people, 191, 192
see also government concession cardholders
South Australia, see States and Territories
specialist medical attendances, 298, 299, 300, 410
referrals, 296
speech therapists/pathologists, 263, 264, 291, 292
spina bifida, 183Ð4
sports, participation in, 155, 191
sports injuries, 47
sprains, strains and dislocations, 74, 295
SSPE, 121, 160
States and Territories, 8
acute care hospital beds, 268
AIDS cases, 385
asthma prevalence, 90
births, 183, 212, 366, 368, 369
cancer incidence, 388
child dental health, 20, 22, 391
children immunised, 159
cost per casemix-adjusted separation, 321Ð2
death rates, 374
elective surgery waiting times, 324
health expenditure, 7, 233Ð40, 241Ð4, 310
health workforce, 260, 262
hospital costs, 322
hospital use, 277, 278, 279, 393Ð6
Indigenous Australians, 22, 108, 212, 218
03 AH2000 end matter Page 474 Thursday, June 1, 2000 2:31 PM

Index 475
TRIM SIZE 175 mm Wide x 250 mm Deep
kidney failure deaths, 108
life expectancy, 12, 371
multiple sclerosis, 105
perinatal deaths, 212, 369
private health insurance coverage, 257
private medical service use, 300
statistical developments, gaps and deficiencies, 6Ð7, 313Ð39
cancer surveillance and monitoring, 64
constant price estimates, 236
diabetes, 86
health services expenditure to GDP ratio, 232
HIV/AIDS hospital separations, 113
hospital use, 271Ð2
immunisation levels, 35Ð6
Indigenous Australians, 207Ð8, 333
National Diabetes Register, 87
SF-12 questionnaire, 14
State and Territory expenditure sources, 243
sun protection estimates, 157
statistical methods and conventions, 428Ð30
STDs, 29Ð31, 116Ð17, 162, 190, 384
see also HIV/AIDS
stenosis, 184
stenting, 59, 60
sterilisation, 28, 163
steroids, 144, 152, 153
stillbirths (foetal deaths), 27, 182, 209
stomach cancer, 52, 65, 66, 386Ð9
strains, sprains and dislocations, 74, 295
stratospheric ozone, 136Ð7
stress, 36, 249
stroke (cerebrovascular disease), 47, 56, 57Ð8
burden of disease, 54, 194, 197, 199
CT brain scans, 59, 60
diabetes and, 88, 89
health system costs, 250
overseas-born Australians, 207
rural and remote Australians, 225
stroke: mortality, 40, 41, 42, 44, 60Ð3, 89, 351, 383
burden of premature (YLL), 51
overseas-born Australians, 205
rural and remote Australians, 225
subacute sclerosing panencephalitis (SSPE), 121, 160
substance abuse, 82, 84, 192Ð3
health system costs, 249, 250
Indigenous Australians, 217
young people, 190
sudden infant death syndrome (SIDS), 185, 186
suicide, 40, 72, 73Ð4, 79Ð82, 357
burden of disease, 54, 193, 194
burden of premature mortality (YLL), 51
overseas-born Australians, 205, 206
rural and remote Australians, 226
schizophrenia sufferers, 84
young people, 190, 191, 192, 226
see also depression
sun exposure, 155Ð7
sunglasses, 156, 157
sunscreen, 156Ð7
supply of health services, 266Ð300
03 AH2000 end matter Page 475 Thursday, June 1, 2000 2:31 PM

476 AustraliaÕs Health 2000
TRIM SIZE 175 mm Wide x 250 mm Deep
surgery, see operations
survival, following cancer, 67, 68
swimming, 155
syphilis, 30, 190, 384
systemic lupus erythmatosus, 37
systolic blood pressure, 168
Tasmania, see States and Territories
tax expenditures, 233, 251, 237
technology undergraduate course commencements, 263, 264
teenagers, see adolescents; young people
teeth, see dental health
temazepam, 304
temperatures (climate), 136
tennis, 155
tenure of housing, 216
termination of pregnancy, 162, 181, 276
tertiary education entrants to workforce, 263Ð5
test results, consultations about, 294
testis, cancer of, 66, 387Ð8
tetanus, 120, 159, 347, 384
throat complaints, 294
thyroxine, 303
tobacco smoking, 43, 63, 69, 148Ð51, 352Ð4
asthma and, 91
attitudes to, 143, 144
Indigenous Australians, 217
public health interventions, 307Ð9
status of indicators, 417
young people, 190
see also chronic obstructive pulmonary disease; lung cancer
Torres Strait Islanders, see Indigenous Australians
toxic effects, 74
tracheo-oesophageal fistula, 184
traffic accidents, see road traffic accidents
tranquillisers, 152, 153
transplants, 106Ð7, 108
transposition of great vessels, 184
Trisomy, 141
tubal ligation, 29
tuberculosis, 118Ð19, 206, 207, 384
Turner's syndrome, 141
twins, 180Ð1
Type 1 diabetes, 37Ð8, 85, 86
Type 2 diabetes, 46, 85, 86, 87, 392
typhoid, 384
ultraviolet (UV) radiation, 136Ð7
umbrellas, 157
undergraduate course commencements, 263Ð5
underweight, 164, 189
unemployment, 191, 215
see also socioeconomic status
unintentional injuries, 74, 193, 196, 197, 198, 355Ð6
see also road traffic accidents
university course entrants, 263Ð5
unknown primary cancers, 65, 66, 67, 386
unsafe sex, 162, 164
03 AH2000 end matter Page 476 Thursday, June 1, 2000 2:31 PM

Index 477
TRIM SIZE 175 mm Wide x 250 mm Deep
upper respiratory tract infections, 47, 110Ð12, 213, 294, 295
urinary incontinence, 46
urinary tract infection, 295
use of health services, 266Ð300
uterus, cancer of, 65, 66, 67, 386Ð8
vaccination (immunisation), 33Ð6, 119Ð22, 185, 347, 157Ð61
attitudes to, 143
influenza vaccine, 303
general practitioner consultations, 294, 295
vacuum extraction deliveries, 183
vaginal breech deliveries, 183
varicose veins, 57
vasectomies, 29
vector-borne diseases, 117Ð18, 384
vegetable consumption, 145
ventricular septal defect, 184
Veterans Affairs cardholders, see government concession cardholders
Victoria, see States and Territories
violence, 47, 74, 217Ð18
alcohol caused, 147
deaths from, 205, 218, 357
vision, see eye diseases/disorders
vitamin and mineral supplements, 304, 305
waist-to-hip ratio (WHR), 166Ð7
waiting times for elective surgery, 322Ð4
walking, 155, 224
water fluoridation, 20, 22
weather, 136
weight, 164Ð7, 189, 216Ð17, 392, 417
welfare officers/social workers, consultations with, 291, 291
wellbeing, 2Ð4, 12Ð17
Western Australia, see States and Territories
whooping cough (pertussis), 119Ð20, 159, 185, 347, 384
wine consumption, 148
women, 196Ð9
contraception used by, 163
mothers, 28, 179, 181, 343Ð4, 366, 369
see also sex of population groups
work-related fatalities, 357
workforce, see health workforce
World Health Organization, 2Ð3, 49, 314, 336Ð7
wounds, 74
yersiniosis, 384
YLDs, see disability burden
YLLs, see mortality (premature), burden of
young people, 189Ð92, 337
asthma, 90
epilepsy risk factors, 104
Indigenous, 192, 227
mortality, 40, 189Ð90, 191, 192, 226Ð7, 355
oral health, 22Ð3
rural and remote Australians, 226Ð7
sexual practices and knowledge, 31, 190
smoking, 150Ð1
suicide, 79Ð80
03 AH2000 end matter Page 477 Thursday, June 1, 2000 2:31 PM

03 AH2000 end matter Page 478 Thursday, June 1, 2000 2:31 PM

AustraliaÕs Welfare is the most comprehensive andauthoritative source of national information on welfareservices in Australia.
Topics include welfare services expenditure, childrenÕs andfamily services, child protection, housing assistance, crisisaccommodation and support services, aged care servicesand disability services.
AustraliaÕs Welfare 1999 features a special chapter on theinteractions between changing work patterns and demandfor, and supply of, welfare services. Both formal andinformal care services are explored, as well as changes inthe nature of the welfare labour force.
Australia’s Health 1999
03 AH2000 end matter Page 479 Thursday, June 1, 2000 2:31 PM

03 AH2000 end matter Page 480 Thursday, June 1, 2000 2:31 PM