UNINSURABLE NATION: AUSTRALIA'S MOST CLIMATE ...
35
UNINSURABLE NATION: AUSTRALIA’S MOST CLIMATE-VULNERABLE PLACES CLIMATECOUNCIL.ORG.AU
-
Upload
khangminh22 -
Category
Documents
-
view
0 -
download
0
Transcript of UNINSURABLE NATION: AUSTRALIA'S MOST CLIMATE ...
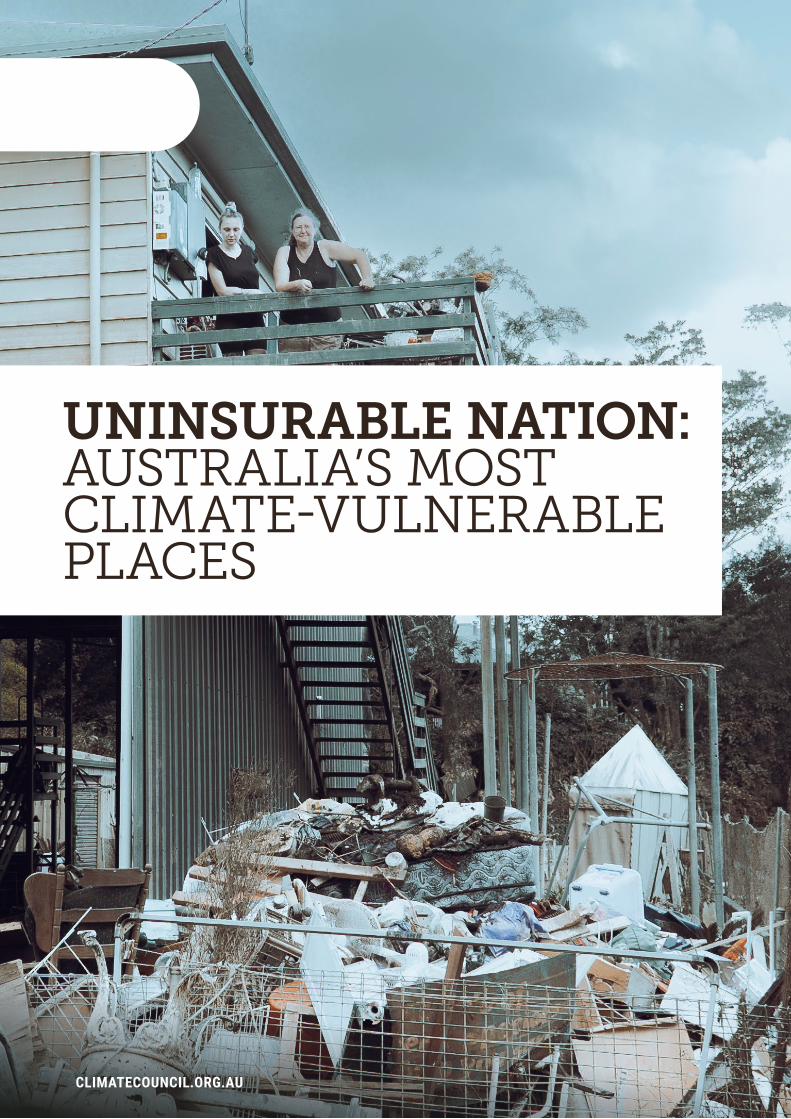
UNINSURABLE NATION: AUSTRALIA’S MOST CLIMATE-VULNERABLE PLACES
CLIMATECOUNCIL.ORG.AU
The Climate Council is an independent, crowd-funded organisation providing
quality information on climate change to the Australian public. If you’d like to
support more reports like this, head to www.climatecouncil.org.au/donate.
Thank you for supporting the Climate Council.
twitter.com/climatecouncil
facebook.com/climatecouncil [email protected]
climatecouncil.org.au
Published by the Climate Council of Australia Limited.
ISBN: 978-1-922404-46-6 (print) 978-1-922404-47-3 (digital)
© Climate Council of Australia Ltd 2022.
This work is copyright the Climate Council of Australia Ltd. All material contained in this work is copyright the Climate Council of Australia Ltd except where a third party source is indicated.
Climate Council of Australia Ltd copyright material is licensed under the Creative Commons Attribution 3.0 Australia License. To view a copy of this license visit http://creativecommons.org.au.
You are free to copy, communicate and adapt the Climate Council of Australia Ltd copyright material so long as you attribute the Climate Council of Australia Ltd and the authors in the following manner: Uninsurable Nation: Australia’s most climate-vulnerable places.
Authors: Nicki Hutley, Dr Annika Dean, Nathan Hart and Jordie Daley.
The Climate Council is grateful to the team at Climate Valuation for supporting this project and providing data. Special thanks to Karl Mallon, George Woods, Tim McEwan and Max McKinlay.
The information in this report is for general information only. It represents the views of the Climate Council of Australia Ltd based on climate risk analysis undertaken by Climate Valuation and should not be taken as constituting professional advice. Because it is intended only as a general guide, it may contain generalisations. You should consider seeking independent legal, financial, taxation or other advice to check how the information contained in this report relates to your unique circumstances. Climate Council of Australia Ltd is not liable for any loss caused, whether due to negligence or otherwise arising from the use of, or reliance on, the information provided directly or indirectly, by use of this report.
Baseline data for this report was provided by Climate Valuation. All reproduction, aggregations and conclusions drawn from the data are the work of the Climate Council.
— Cover image: Cassandra Scott-Finn. Image subject: Kim & daughter. Lismore, March, 2022.
The Climate Council acknowledges the Traditional Custodians of the lands on which we live, meet and work. We wish to pay our respects to Elders past, present and emerging and recognise the continuous connection of Aboriginal and Torres Strait Islander people to Country.
This report is printed on 100% recycled paper.
Dr Annika DeanSenior Researcher
Nathan HartCampaigner
Jordie DaleyResearch and Communications Intern
Nicki HutleyClimate Councillor (Economics)
ContentsKey findings ..................................................................................................................................................................................... ii
1. Introduction ..............................................................................................................................................................................1
2. Methods .................................................................................................................................................................................... 5
About the data 5
About the ranking 6
3. Ranking results .......................................................................................................................................................................7
Profiles of the top ten most at-risk federal electorates 9
Rankings by state and territory 22
4. Conclusion and recommendations ................................................................................................................................ 26
References ......................................................................................................................................................................................28
Image credits ................................................................................................................................................................................. 29
ICLIMATE COUNCIL

II
Key findings
1Climate change is creating an insurability crisis in Australia due to worsening extreme weather and sky-rocketing insurance premiums.
› Worsening extreme weather means increased
costs of maintenance, repair and replacement
to properties – our homes, workplaces and
commercial buildings. As the risk of being
affected by extreme weather events is increasing,
insurers are raising premiums to cover the
increased cost of claims and reinsurance.
› The Climate Council has produced a ranking of the
top 10 most at-risk electorates from climate change
and extreme weather events (covering bushfires,
extreme wind and different types of flooding),
based on the percentage of ‘high risk’ properties
in each federal electorate across Australia.
These properties have projected annual damage
costs equivalent to 1% or more of the property
replacement cost, and are referred to in this report
as uninsurable, as – whilst policies might still be
available – premiums are expected to become too
expensive for people to afford.
› Across Australia approximately 520,940 properties,
or one in every 25, will be ‘high risk’ and
uninsurable. In addition, 9% of properties (1 in 11)
will reach the ‘medium risk’ classification by 2030,
with annual damage costs that equate to 0.2-1% of
the property replacement cost. These properties
are at risk of becoming underinsured.
2Climate change affects all Australians, but some federal electorates face far greater risks than others.
› The top 10 most at-risk federal electorates by 2030 are:
1. Nicholls (Vic)
2. Richmond (NSW)
3. Maranoa (QLD)
4. Moncrieff (QLD),
5. Wright (QLD),
6. Brisbane (QLD),
7. Griffith (QLD),
8. Indi (Vic)
9. Page (NSW) and
10. Hindmarsh (SA).
› In these at-risk electorates, 15% of properties
(165,646), or around one in every seven properties,
will be uninsurable this decade.
› In the electorate of Nicholls in Victoria, which
covers the Local Government Areas (LGAs) of
Campaspe, Greater Shepparton, Moira, and parts
of Strathbogie and Mitchell, 26.5% properties will
be uninsurable by 2030. In the LGA of Greater
Shepparton, it is as many as half (56% of properties),
and almost 90% in the locality of Shepparton.
› By 2030, 40 federal electorates across Australia will
have 4% of properties classified as uninsurable.
Eighteen of these electorates (or 45%) are in
Queensland. The top five most at-risk electorates
in Queensland are: Maranoa, Moncrieff, Wright,
Brisbane and Griffith.
› The percentage of properties that will be
uninsurable by 2030 in each state and territory is
6.5% in Queensland; 3.3% in NSW; 3.2% in South
Australia; 2.6% in Victoria; 2.5% in the Northern
Territory; 2.4% in Western Australia; 2% in Tasmania
and 1.3% in the ACT.
II UNINSURABLE NATION: AUSTRALIA’S MOST CLIMATE-VULNERABLE PLACES
KEY FINDINGS III
3Riverine floods are the most costly disaster in Australia.
› Riverine flooding poses the biggest risk to
properties. Of the properties classified as ‘high risk’
by 2030, 80% of that risk is due to riverine flooding.
› Bushfires and surface water flooding (sometimes
called flash flooding) are the other major
worsening hazards causing properties to
become uninsurable by 2030.
› The five most at-risk electorates for riverine
flooding are: Nicholls in Victoria, Richmond in
New South Wales (including the towns of Ballina,
Bangalow, Brunswick Heads, Byron Bay, Hastings
Point, Kingscliff, Lennox Head, Mullumbimby,
and Tweed Heads), and Maranoa (in rural
southwestern Queensland, including the towns
of Roma, Stanthorpe, Winton and Warwick),
Brisbane, and Moncrieff in Queensland (part of
the Gold Coast).
› Across Australia, 2.5% of properties (360,691
properties) will be at ‘high risk’ of riverine
flooding by 2030, with a further 372,684 at
‘medium risk’ of riverine flooding.
4Decisions and actions over this next term of government will influence the future impacts of climate change for generations to come.
› Unfortunately over the last eight years the
Federal Government has failed to meaningfully
tackle climate change or prepare Australians for
worsening extreme weather.
› A key test for all candidates in the upcoming
Federal Election is whether they are supporting
policies that drive deep emissions cuts now
through the 2020s, aligned with limiting the global
average temperature rise to well below 2°C.
› There is also an urgent need to upscale investment
in national adaptation and disaster risk reduction
to help Australians better prepare for worsening
extreme weather events.
III
climatecouncil.org.au

Climate change, driven by the burning of coal, oil and gas, is leading to worsening fires, floods, and heatwaves.
1. IntroductionClimate Change, driven by the burning of coal, oil and gas is supercharging our weather systems. Already, temperatures have risen around 1.47°C in Australia since 1910, leading to an increase in extreme heat events (BoM 2022a).
Southern Australia is becoming drier – with
declines in cool season (April - October)
rainfall in southwest Western Australia and
southeastern Australia over recent decades.
There has been an increase in the length of
the fire season and extreme fire weather over
large areas of Australia, particularly southern
Australia, since around the 1950s. At the
same time, northern Australia has become
wetter – particularly during the monsoon,
and there has been an observed increase
in the proportion of rain falling as short-
duration intense rainfall events, increasing
the risk of flooding (CSIRO and BoM 2020).
Rates of sea level rise around the Australian
continent have been similar to the global
average around much of the coastline (~ 25
cm since 1880), with significantly higher
rates of sea level rise to the north and
southeast of the continent (CSIRO and BoM
2020). Coastal communities are already
experiencing the impacts on properties and
infrastructure, including coastal inundation,
erosion and more damaging storm surges.
Worsening extreme weather means
increased costs of maintenance, repair and
replacement to properties – our homes,
workplaces and commercial buildings.
As the risk of being affected by extreme
weather events increases, insurers will raise
premiums to cover the increased cost of
claims and reinsurance.
1 UNINSURABLE NATION: AUSTRALIA’S MOST CLIMATE-VULNERABLE PLACES
CHAPTER 01 INTRODUCTION
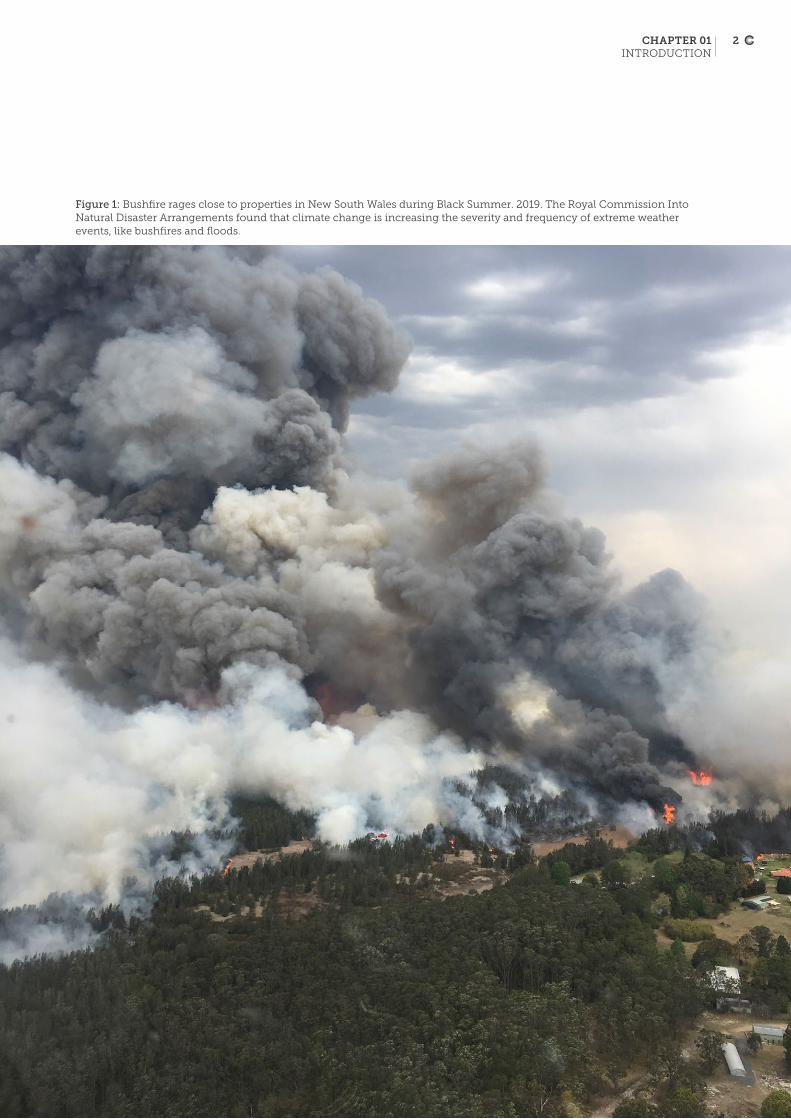
Figure 1: Bushfire rages close to properties in New South Wales during Black Summer. 2019. The Royal Commission Into Natural Disaster Arrangements found that climate change is increasing the severity and frequency of extreme weather events, like bushfires and floods.
2

Australia’s general insurers paid out $5.47
billion from over 300,000 claims related
to the bushfires, floods and hailstorms in
the 2019-20 summer (ICA 2021). This led
Insurance Australia Group (IAG) and Suncorp
to draw on their reinsurance contracts and
prompted Swiss Re to publicly criticise
the companies for consistently failing to
predict the cost of natural disasters (The
Guardian 2021). The world’s second biggest
reinsurer, Swiss Re, has noted that climate
change is already resulting in a “new world”
of weather uncertainty, driving increased
losses from more local flooding, torrential
rain, prolonged drought, severe wildfires and
other extreme weather events – and that
this will push up the cost of insurance in
Australia (AFR 2020; Swiss Re 2019).
Already, many Australians do not have
insurance, or are underinsured (ICA 2021;
ACCC 2019). The rate of home building
non-insurance is about 20% in Northern
Australia and 11% across the rest of Australia,
and this is growing in Northern Australia
due largely to unaffordability (ACCC 2019).
Underinsurance is also widespread in
Australia (i.e. when the level of insurance
taken out by a policyholder doesn’t
fully cover the cost to rebuild or repair),
though the extent of underinsurance is
not fully known (ICA 2021). High levels
of underinsurance, particularly amongst
businesses, was one of the major issues
revealed in the aftermath of the Black
Summer bushfires, and this has also been
apparent following the recent flooding
events in northern New South Wales and
southeast Queensland. Being uninsured or
underinsured makes it much more difficult
to recover following extreme weather events
(ICA 2021).
The availability of affordable insurance is
paramount to the safety and well-being
of communities, as well as the broader
economic resilience of Australia. Households
and businesses rely on insurance to protect
them financially, to give them the confidence
to invest, and to rebuild when extreme
weather events strike. People who do not
have insurance, or are underinsured, are
more likely to experience homelessness
after an extreme weather event strikes.
Communities that have low levels of
insurance will take longer to recover, and
more of the financial burden of recovery
will fall on governments, and by extension,
taxpayers. This can also lead to broader
economic impacts, such as higher debt
levels and reduced economic productivity
(Summerhayes 2020).
The affordability of insurance is particularly
relevant for financially vulnerable people,
and increasing premiums will exacerbate
existing inequities. Insurance companies
may also decide that offering policies
in some high-risk areas is not viable,
withdrawing the option of taking out
insurance entirely.
For high risk properties, banks may reduce
access to credit, and credit risk for existing
loans may rise, leading to declining property
values. In some severe instances, areas may
Insurance will become increasingly unaffordable or unavailable in large parts of Australia due to worsening extreme weather.
3 UNINSURABLE NATION: AUSTRALIA’S MOST CLIMATE-VULNERABLE PLACES
CHAPTER 01 INTRODUCTION
While climate change affects all Australians, the risks are not shared equally. In the most extreme instances, areas may become uninhabitable.
even become uninhabitable as banks no
longer consider high-risk properties sensible
for lending (RBA 2021).
Although all Australians are affected by
climate change, certain areas are at greater
risk. The factors that determine risk include
not only the probability of an extreme weather
event occurring (for example a bushfire),
but also how exposed a property is to that
event (for example how close a property is
to bushland), and how vulnerable it is (for
example what the building materials are).
The address level climate risk data used
for analysis in this report – provided to the
Climate Council by Climate Valuation –
combine projections from climate models
with historical hazard data, and with data on
particular localities (for example elevation
etc.) to determine where properties are
likely to be most severely affected by climate
change and extreme weather.
The report outlines the top 20 most at-risk
federal electorates to climate change-related
extreme weather events, providing a brief
profile of the top 10. The report also outlines
the most at-risk electorates for each state and
territory. The metric used for the ranking
is the percentage of ‘high risk’ properties,
which have annual damage costs equating
to 1% or more of the replacement cost of the
property. These properties are referred to
throughout this report as being uninsurable.
Australia is one of most vulnerable developed
countries to climate impacts. The decisions
of the next Federal Government will influence
the future impacts of climate change for
generations to come. Every fraction of a
degree matters and will be measured in lost
lives and livelihoods. If every country in
the world was doing as Australia, the world
would be on a track for around 3°C to 4°C of
warming (Climate Action Tracker 2021). This
would be catastrophic.
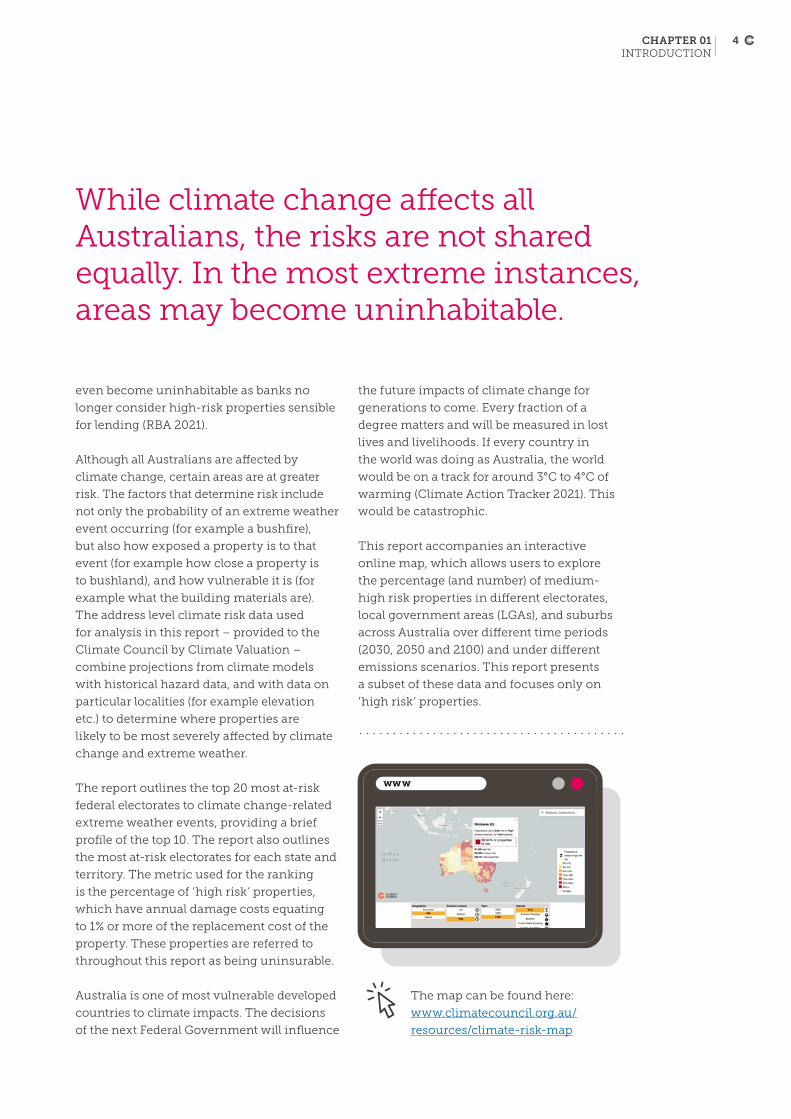
This report accompanies an interactive
online map, which allows users to explore
the percentage (and number) of medium-
high risk properties in different electorates,
local government areas (LGAs), and suburbs
across Australia over different time periods
(2030, 2050 and 2100) and under different
emissions scenarios. This report presents
a subset of these data and focuses only on
‘high risk’ properties.
The map can be found here:
www.climatecouncil.org.au/
resources/climate-risk-map
www
4
2. Methods ABOUT THE DATA
The data used to develop this ranking were
provided by Climate Valuation.1 Climate
Valuation analyse climate risk in terms
of the probability of property damage —
specifically, the Maximum to Date Value at
Risk (MVAR) of extreme weather and climate-
related hazards. This has been done using
purpose-built ‘Climate Risk Engines’, which
compute the threshold at which the various
key components of a building would fail if
exposed to various hazards (such as riverine
flooding, coastal inundation and bushfires).
MVAR is a measure of the annual risk of
damage to an asset. The MVAR captures the
costs of expected extreme weather and climate-
related damage, relative to the replacement cost
of the building. For example, an MVAR of 1% is
equivalent to climate-related damage costs of
$3,140 per year for a building that costs $314,000
(a conservative estimate of the average home
replacement cost for many regions of Australia),
noting that this does not include the value of
the land. Properties that have an MVAR that
is 1% or more of the replacement cost of the
dwelling are considered ‘high risk’ consistent
with definitions used by the US Federal
Emergency Management Agency.
The ‘Climate Risk Engines’ combine long-
term data from local meteorological stations
with information about the specific location,
such as flood mapping and depths, elevation
above sea level, tides and waves, soil type,
and forest cover; and data on the assumed
building at that address, such as age,
construction materials and design.
The influence of future climate change is
derived by extracting the changes in the
statistical distribution of key parameters such
as heat, precipitation, wind and humidity from
global climate change models from agencies
such as CSIRO, University of New South Wales,
University of Queensland, and the US National
Oceanic and Atmospheric Administration
(NOAA). Models that predict a wetter future
are used to assess flood risks, models that
predict a drier future are used to assess
drought risks etc. In this way, the models
are structured to provide a ‘stress test’ and
alert property owners to the upper range of
possible risks, rather than average projections.
To overcome the high levels of variability in
climate data a Maximum to Date approach is
used, which shows the maximum amount
of the Value at Risk up to and including the
year being quoted. This avoids a misleading
focus on a low impact year which may be
anomalous with the trend.
All of these data are then processed to
calculate the probability of property damage
from climate change and extreme weather
for every address in Australia. The Climate
Risk Engines assume a standard modern
dwelling is located at each address, i.e. a
single story detached house which uses
design specifications and materials typical
of a recent building. The replacement cost of
each dwelling is assumed to be $314,000. This
is a very conservative estimate given that
the average cost of building a new dwelling
across Australia was $320,000 in 2018-19
according to the ABS (last update) and that
construction costs have risen considerably
over the past two years (ABS 2020).
For more on the methodology used by
the Climate Risk Engines, visit: www.
climateriskengines.com/methodology.html
1 Climate Valuation are leaders in residential climate risk analysis. To find out information on the climate risks facing a particular residential address, visit their website at: https://climatevaluation.com/
5 UNINSURABLE NATION: AUSTRALIA’S MOST CLIMATE-VULNERABLE PLACES
ABOUT THE RANKING
The ranking used in this report is based
on the percentage of properties in each
electorate across Australia that are classified
as ‘high-risk’. These properties are referred
to in this report as uninsurable, as premiums
are expected to become so expensive that
insurance becomes inaccessible. This does
not necessarily mean that insurance policies
are not available, but in regions with a high
percentage of ‘high risk’ properties insurers
may decide to refuse to offer policies entirely.
For this report, Climate Valuation forecasted
an MVAR for each dwelling in Australia.
All properties with an MVAR of 1% or more
(i.e. all ‘high risk’ dwellings) were then
aggregated by federal electorates, providing
a standardised metric for comparing climate
risk. The percentage of ‘high risk’ properties
in each electorate was used (as opposed
to the raw number), so the ranking is not
biassed towards electorates with a higher
number of dwellings.
The ranking used a timeframe of 2030
for comparing climate risks, and a high
emissions scenario. Unfortunately, the
impacts of climate change in 2030 will be
driven by greenhouse gas emissions that
have already been released, so the emissions
scenario chosen essentially does not have
any bearing on the projected impacts.
The total risk from hazards that significantly
impact buildings are used in this report:
bushfires, riverine flooding, extreme wind,
coastal inundation and surface water
flooding. The definitions for each of these
hazards are as follows:
Riverine flooding is when a river
exceeds its capacity, inundating
nearby areas.
Coastal inundation is when seawater
temporarily or permanently floods an
area due to a combination of sea level
rise, high tides, wind, low air pressure
and/or waves. This definition does
not include coastal erosion.
Extreme wind is high-wind conditions
that may exceed a building’s design
specifications (due to projected
changes in sea surface temperature,
wind regimes and wind speeds).
Bushfires are destructive fires that
spread via trees, forests and ground
cover. This definition does not include
grass fires.
Surface water flooding (sometimes
called pluvial flooding or flash flooding)
is overland flooding. This occurs when
sustained rainfall or short-duration
heavy rainfall events cause the ground
to reach saturation point and drainage
systems to overflow, resulting in the
build-up of excess water.
It should be emphasised that this ranking
is based on climate change impacts to
buildings. In some ways, this provides a
proxy for areas that are more at risk than
others, but it does not fully reflect the
risks of climate change to human health,
ecosystems, and other sectors of the
economy. For example, whilst extreme heat
has killed more Australians than all other
natural hazards combined (Coates et al. 2014;
Coates et al. 2022), extreme heat does not
significantly affect the structural integrity
of buildings. Likewise, although declining
rainfall in some parts of Australia will
significantly affect agricultural yields and
ecosystems, it will have a marginal impact
on the structural integrity of buildings.
6CHAPTER 02 METHODS

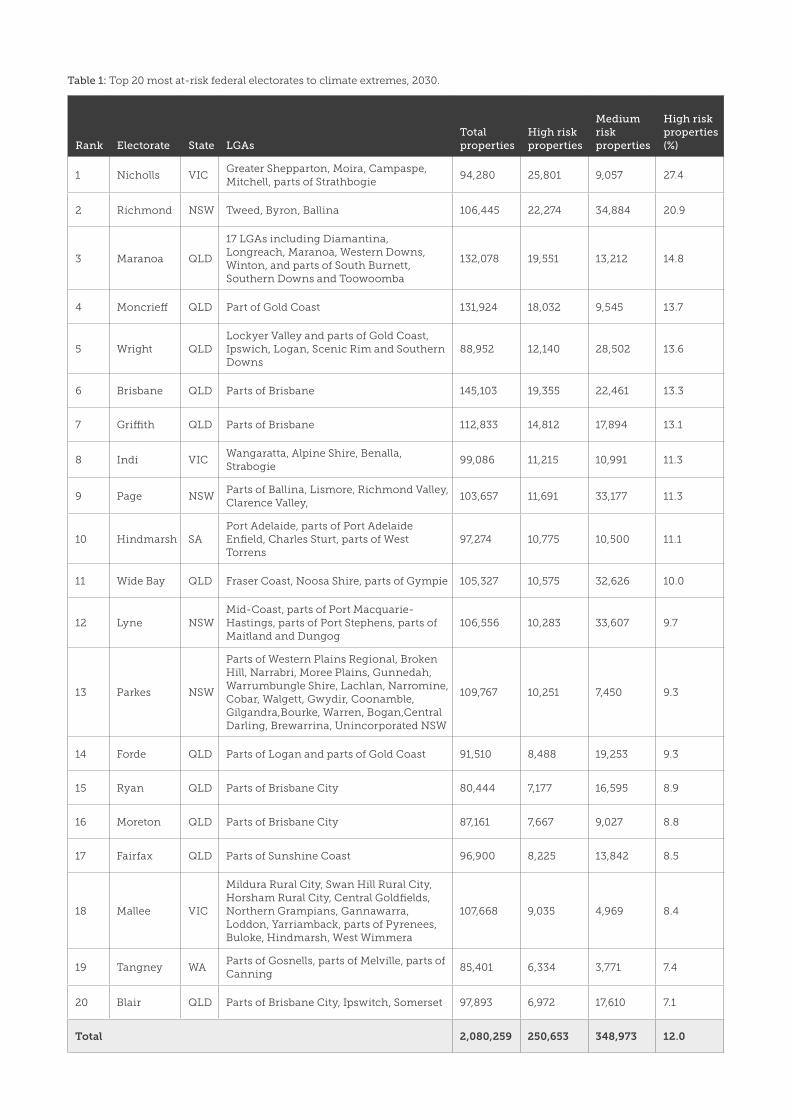
3. Ranking results
In these 10 electorates alone 15% of properties
(165,646 properties) or around one in seven
properties will be uninsurable within 10 years.
Profiles of the top 10 electorates, including a
breakdown of the main hazards driving risk,
are in the following section.
The top 20 most at-risk electorates are shown
in Table 1. In the top 20 most at-risk electorates
12% of properties (250,653 properties) either
already are, or will be classed as uninsurable
within ten years.
The top 10 most at-risk federal electorates by 2030 are:
1. Nicholls (Vic)
2. Richmond (NSW)
3. Maranoa (Qld)
4. Moncrieff (Qld)
5. Wright (Qld)
6. Brisbane (Qld)
7. Griffith (Qld)
8. Indi (Vic)
9. Page (NSW)
10. Hindmarsh (SA)
7 UNINSURABLE NATION: AUSTRALIA’S MOST CLIMATE-VULNERABLE PLACES
Rank Electorate State LGAsTotal properties
High risk properties
Medium risk properties
High risk properties (%)
1 Nicholls VICGreater Shepparton, Moira, Campaspe, Mitchell, parts of Strathbogie
94,280 25,801 9,057 27.4
2 Richmond NSW Tweed, Byron, Ballina 106,445 22,274 34,884 20.9
3 Maranoa QLD
17 LGAs including Diamantina, Longreach, Maranoa, Western Downs, Winton, and parts of South Burnett, Southern Downs and Toowoomba
132,078 19,551 13,212 14.8
4 Moncrieff QLD Part of Gold Coast 131,924 18,032 9,545 13.7
5 Wright QLDLockyer Valley and parts of Gold Coast, Ipswich, Logan, Scenic Rim and Southern Downs
88,952 12,140 28,502 13.6
6 Brisbane QLD Parts of Brisbane 145,103 19,355 22,461 13.3
7 Griffith QLD Parts of Brisbane 112,833 14,812 17,894 13.1
8 Indi VICWangaratta, Alpine Shire, Benalla, Strabogie
99,086 11,215 10,991 11.3
9 Page NSWParts of Ballina, Lismore, Richmond Valley, Clarence Valley,
103,657 11,691 33,177 11.3
10 Hindmarsh SAPort Adelaide, parts of Port Adelaide Enfield, Charles Sturt, parts of West Torrens
97,274 10,775 10,500 11.1
11 Wide Bay QLD Fraser Coast, Noosa Shire, parts of Gympie 105,327 10,575 32,626 10.0
12 Lyne NSWMid-Coast, parts of Port Macquarie-Hastings, parts of Port Stephens, parts of Maitland and Dungog
106,556 10,283 33,607 9.7
13 Parkes NSW
Parts of Western Plains Regional, Broken Hill, Narrabri, Moree Plains, Gunnedah, Warrumbungle Shire, Lachlan, Narromine, Cobar, Walgett, Gwydir, Coonamble, Gilgandra,Bourke, Warren, Bogan,Central Darling, Brewarrina, Unincorporated NSW
109,767 10,251 7,450 9.3
14 Forde QLD Parts of Logan and parts of Gold Coast 91,510 8,488 19,253 9.3
15 Ryan QLD Parts of Brisbane City 80,444 7,177 16,595 8.9
16 Moreton QLD Parts of Brisbane City 87,161 7,667 9,027 8.8
17 Fairfax QLD Parts of Sunshine Coast 96,900 8,225 13,842 8.5
18 Mallee VIC
Mildura Rural City, Swan Hill Rural City, Horsham Rural City, Central Goldfields, Northern Grampians, Gannawarra, Loddon, Yarriamback, parts of Pyrenees, Buloke, Hindmarsh, West Wimmera
107,668 9,035 4,969 8.4
19 Tangney WAParts of Gosnells, parts of Melville, parts of Canning
85,401 6,334 3,771 7.4
20 Blair QLD Parts of Brisbane City, Ipswitch, Somerset 97,893 6,972 17,610 7.1
Total 2,080,259 250,653 348,973 12.0
Table 1: Top 20 most at-risk federal electorates to climate extremes, 2030.
PROFILES OF THE TOP TEN MOST AT-RISK FEDERAL ELECTORATES
The top 10 most at-risk electorates are
profiled below. Riverine flooding drives
most of the risk to properties in the top 10
riskiest electorates in 2030. Around 80% of
the ‘high risk’ properties in the top 10 riskiest
electorates are classified as such due to the
probability and impact of riverine flooding.
Bushfire and surface water flooding are the
major other hazards affecting ‘high risk’
properties in 2030 (see Figure 2).
Riverine flooding poses the biggest risk to properties. Of the properties classified as ‘high risk’ by 2030, 80% of that risk is due to riverine flooding.
9 UNINSURABLE NATION: AUSTRALIA’S MOST CLIMATE-VULNERABLE PLACES
Hazards
Riverine Flooding
Bushfire
Surface Water Flooding
Coastal Inundation
Extreme Wind
TO CLIMATE EXTREMES BY 2030MOST AT-RISK FEDERAL ELECTORATESTOP 10
WRIGHT (QLD)#5 13.6% of properties at high risk (12,140 properties)
3.6% of properties at high risk to riverine flooding
9% of properties at high risk to bushfire
GRIFFITH (QLD)#7 13.1% of properties at high risk (14,812 properties)
11.4% of properties at high risk to riverine flooding
BRISBANE (QLD)#6 13.3% of properties at high risk (19,355 properties)
12.5% of properties at high risk to riverine flooding
MONCRIEFF (QLD)#4 13.7% of properties at high risk (18,032 properties)
11.9% of properties at high risk to riverine flooding
HINDMARSH (SA)#10 11.1% of propertiesat high risk (10,775 properties)
9.5% of properties at high risk to riverine flooding
1.2% of properties at high risk to surface flooding water
NICHOLLS (VIC)#1 27.4% of properties at high risk (25,801 properties)
26.5% of properties at high risk to riverine flooding
RICHMOND (NSW)#2 20.9% of properties at high risk (22,274 properties)
14.5% of properties at high risk to riverine flooding
5.2% of properties at high risk to bushfire
1.5% of properties at high risk to surface flooding water
1.7% of properties at high risk to surface flooding water
MARANOA (QLD)#3 14.8% of properties at high risk (19,551 properties)
13.9% of properties at high risk to riverine flooding
0.6% of properties at high risk to bushfire
3.3% of properties at high risk to surface flooding water
2.2% of properties at high risk to surface flooding water
INDI (VIC)#8 11.3% of properties at high risk (11,215 properties)
10.7% of properties at high risk to riverine flooding
1.1% of properties at high risk to surface flooding water
PAGE (NSW)#9 11.3% of properties at high risk (11,691 properties)
5.4% of properties at high risk to riverine flooding
5.3% of properties at high risk to bushfire
Figure 2: Riverine flooding poses the biggest risk to properties. Of the properties classified as ‘high risk’ by 2030, 80% of that risk is due to riverine flooding.

The federal electorate of Nicholls replaced the electorate of Murray
in 2019 and covers over 14,000 square kilometres. It starts south
of the township of Seymore in central Victoria and heads north
past Shepparton to the Murray River in Yarrawonga. It borders the
federal electorate of Indi to the east and Bendigo and Mallee to the
west. It’s home to prime agricultural land, dairy farms, orchards
and world class wineries. Agriculture, manufacturing, healthcare
and retail account for almost 50% of all employment in this area.
The rivers that support the agriculture industry in Nicholls also
present the greatest risk. The Goulburn River for example, just one
of the rivers that winds its way through Nicholls, has a long history
of flooding, with major floods occurring in 1916, 1917, 1939, 1956,
1958, 1974, 1993 and 2010/11/12 in the Shepparton, Mooroopna and
Murchison areas.
A warmer atmosphere can hold more moisture and has more energy
to fuel storms. With climate change we are getting more of our rain
in the form of intense downpours, raising the risk of flooding.
In 2030 there will be 24,976 properties in the electorate of Nicholls
at high risk – rendering them uninsurable – due to the risk of
riverine flooding. In some localities around the township of
Shepparton (for example Shepparton, Shepparton North, Kialla, and
Kialla West), between 80% and 90% of homes will be uninsurable
by 2030. Around 6,000 homes in the electorate of Nicholls will also
reach a ‘medium risk’ of riverine flooding by 2030.
In addition to riverine flooding, many properties in localities
around Shepparton are also at risk of surface water flooding due
to the flat topography, effectively meaning these properties have
been built on floodplains. By 2030, there will be 1,607 properties in
Nicholls at high risk for surface water flooding and a further 2,140
properties at ‘medium risk’.
Demonstrating the multifaceted nature of climate change
supercharging extreme weather, in the same electorate, by 2030
there will also be 654 properties that will reach a medium risk of
being impacted by bushfires.
#1 NICHOLLS (VIC)
94,280 total property
count
27.4% of properties at high
risk (25,801 properties)
26.5% of properties at high
risk to riverine flooding
1.5% of properties at high
risk to surface water
flooding
Figure 3: Broken River Pedestrian Bridge, Shepparton, Victoria, during floods in 2010. Up to 90% of properties in some localities around the township of Shepparton will be uninsurable by 2030.
11 UNINSURABLE NATION: AUSTRALIA’S MOST CLIMATE-VULNERABLE PLACES
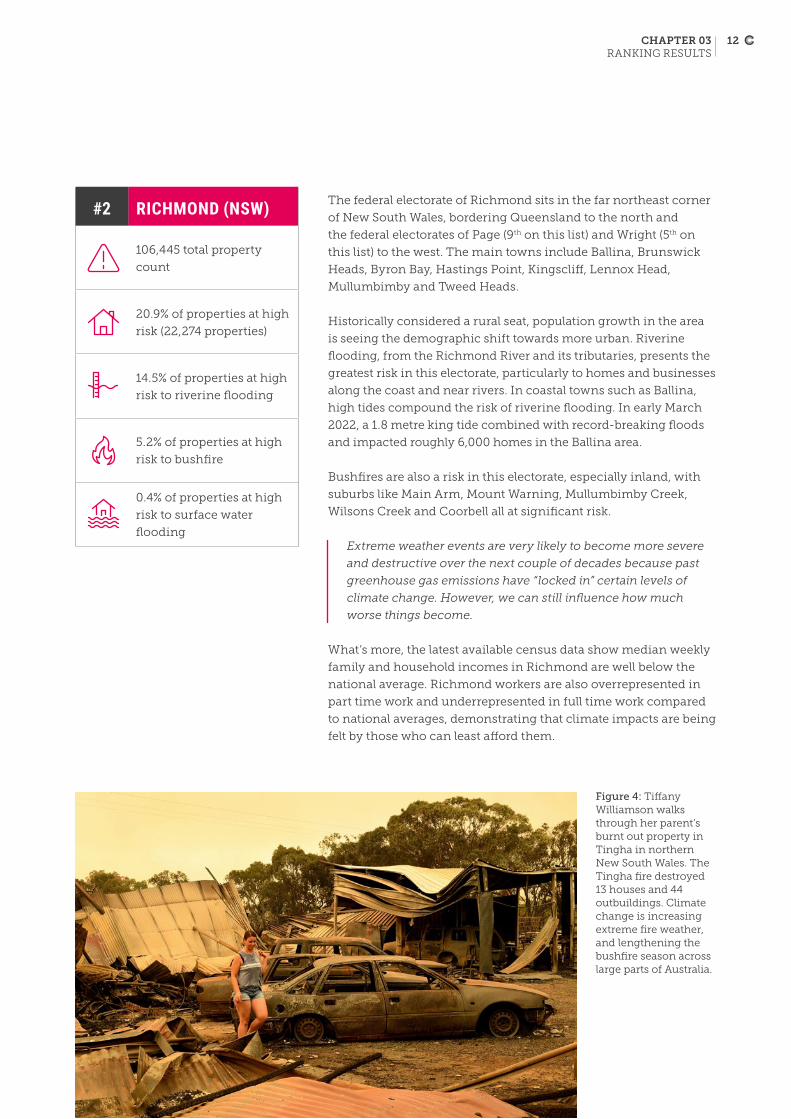
The federal electorate of Richmond sits in the far northeast corner
of New South Wales, bordering Queensland to the north and
the federal electorates of Page (9th on this list) and Wright (5th on
this list) to the west. The main towns include Ballina, Brunswick
Heads, Byron Bay, Hastings Point, Kingscliff, Lennox Head,
Mullumbimby and Tweed Heads.
Historically considered a rural seat, population growth in the area
is seeing the demographic shift towards more urban. Riverine
flooding, from the Richmond River and its tributaries, presents the
greatest risk in this electorate, particularly to homes and businesses
along the coast and near rivers. In coastal towns such as Ballina,
high tides compound the risk of riverine flooding. In early March
2022, a 1.8 metre king tide combined with record-breaking floods
and impacted roughly 6,000 homes in the Ballina area.
Bushfires are also a risk in this electorate, especially inland, with
suburbs like Main Arm, Mount Warning, Mullumbimby Creek,
Wilsons Creek and Coorbell all at significant risk.
Extreme weather events are very likely to become more severe
and destructive over the next couple of decades because past
greenhouse gas emissions have “locked in” certain levels of
climate change. However, we can still influence how much
worse things become.
What’s more, the latest available census data show median weekly
family and household incomes in Richmond are well below the
national average. Richmond workers are also overrepresented in
part time work and underrepresented in full time work compared
to national averages, demonstrating that climate impacts are being
felt by those who can least afford them.
#2 RICHMOND (NSW)
106,445 total property
count
20.9% of properties at high
risk (22,274 properties)
14.5% of properties at high
risk to riverine flooding
5.2% of properties at high
risk to bushfire
0.4% of properties at high
risk to surface water
flooding
Figure 4: Tiffany Williamson walks through her parent’s burnt out property in Tingha in northern New South Wales. The Tingha fire destroyed 13 houses and 44 outbuildings. Climate change is increasing extreme fire weather, and lengthening the bushfire season across large parts of Australia.
12CHAPTER 03 RANKING RESULTS
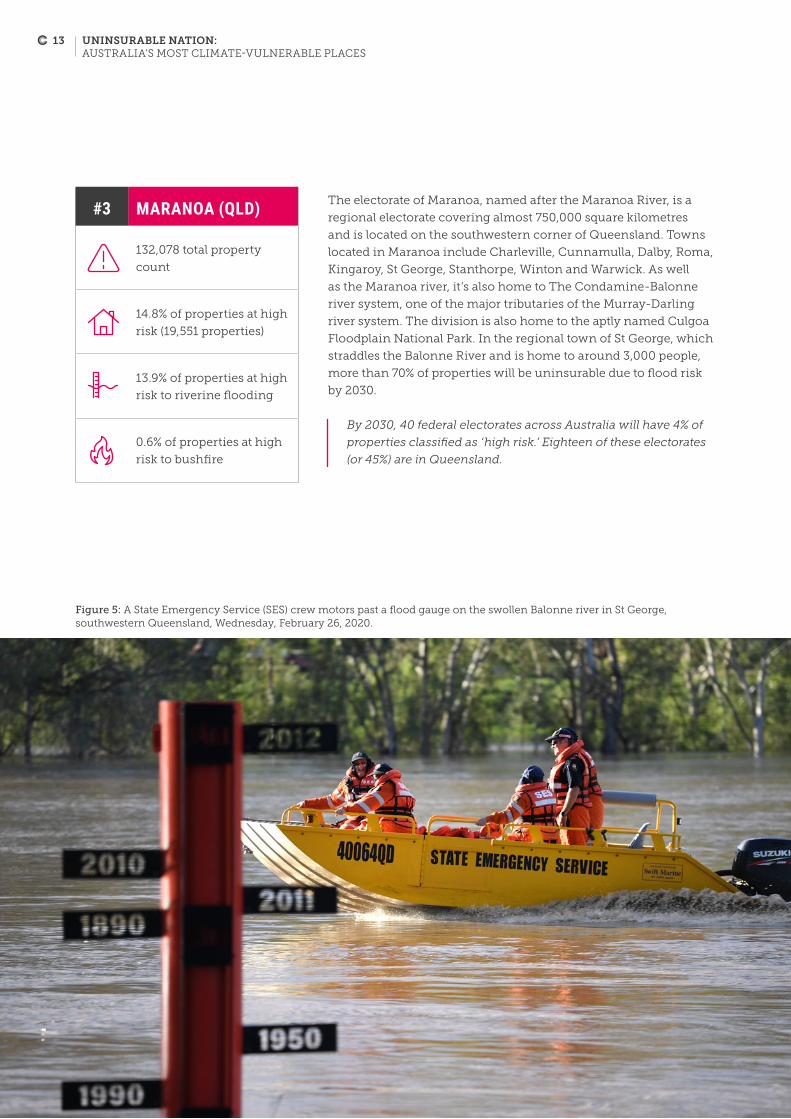
The electorate of Maranoa, named after the Maranoa River, is a
regional electorate covering almost 750,000 square kilometres
and is located on the southwestern corner of Queensland. Towns
located in Maranoa include Charleville, Cunnamulla, Dalby, Roma,
Kingaroy, St George, Stanthorpe, Winton and Warwick. As well
as the Maranoa river, it’s also home to The Condamine-Balonne
river system, one of the major tributaries of the Murray-Darling
river system. The division is also home to the aptly named Culgoa
Floodplain National Park. In the regional town of St George, which
straddles the Balonne River and is home to around 3,000 people,
more than 70% of properties will be uninsurable due to flood risk
by 2030.
By 2030, 40 federal electorates across Australia will have 4% of
properties classified as ‘high risk.’ Eighteen of these electorates
(or 45%) are in Queensland.
#3 MARANOA (QLD)
132,078 total property
count
14.8% of properties at high
risk (19,551 properties)
13.9% of properties at high
risk to riverine flooding
0.6% of properties at high
risk to bushfire
Figure 5: A State Emergency Service (SES) crew motors past a flood gauge on the swollen Balonne river in St George, southwestern Queensland, Wednesday, February 26, 2020.
13 UNINSURABLE NATION: AUSTRALIA’S MOST CLIMATE-VULNERABLE PLACES
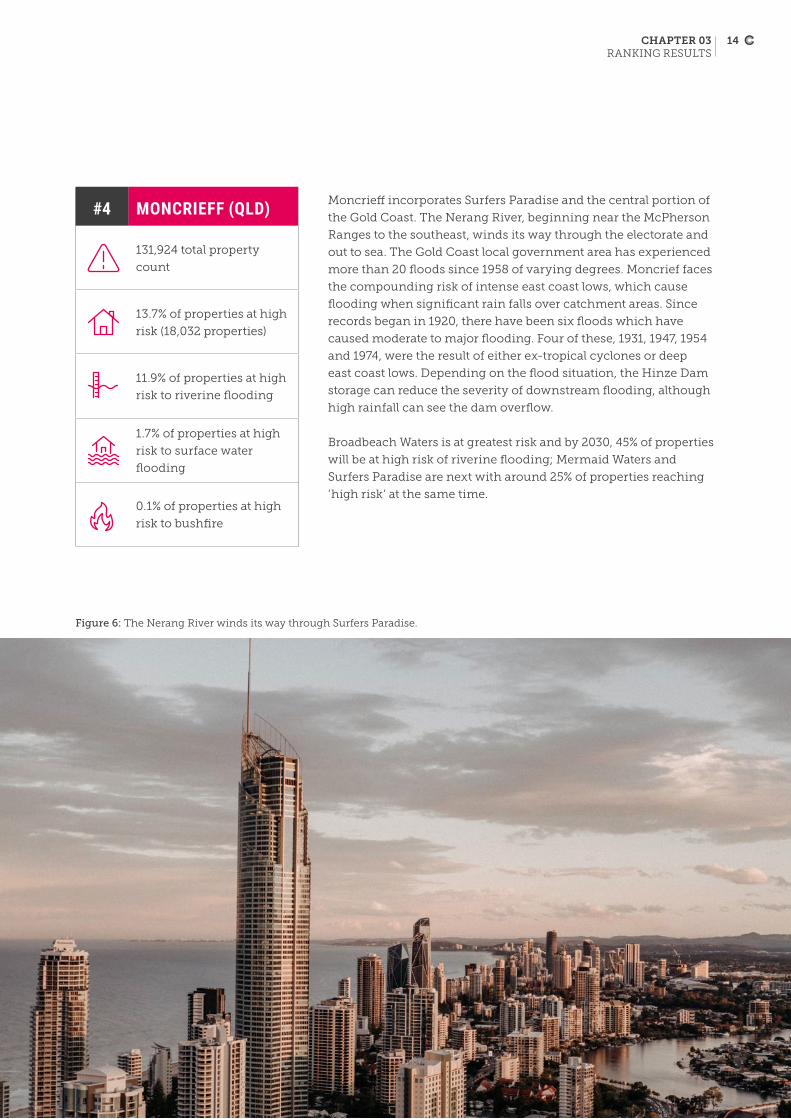
Moncrieff incorporates Surfers Paradise and the central portion of
the Gold Coast. The Nerang River, beginning near the McPherson
Ranges to the southeast, winds its way through the electorate and
out to sea. The Gold Coast local government area has experienced
more than 20 floods since 1958 of varying degrees. Moncrief faces
the compounding risk of intense east coast lows, which cause
flooding when significant rain falls over catchment areas. Since
records began in 1920, there have been six floods which have
caused moderate to major flooding. Four of these, 1931, 1947, 1954
and 1974, were the result of either ex-tropical cyclones or deep
east coast lows. Depending on the flood situation, the Hinze Dam
storage can reduce the severity of downstream flooding, although
high rainfall can see the dam overflow.
Broadbeach Waters is at greatest risk and by 2030, 45% of properties
will be at high risk of riverine flooding; Mermaid Waters and
Surfers Paradise are next with around 25% of properties reaching
‘high risk’ at the same time.
#4 MONCRIEFF (QLD)
131,924 total property
count
13.7% of properties at high
risk (18,032 properties)
11.9% of properties at high
risk to riverine flooding
1.7% of properties at high
risk to surface water
flooding
0.1% of properties at high
risk to bushfire
Figure 6: The Nerang River winds its way through Surfers Paradise.
14CHAPTER 03 RANKING RESULTS
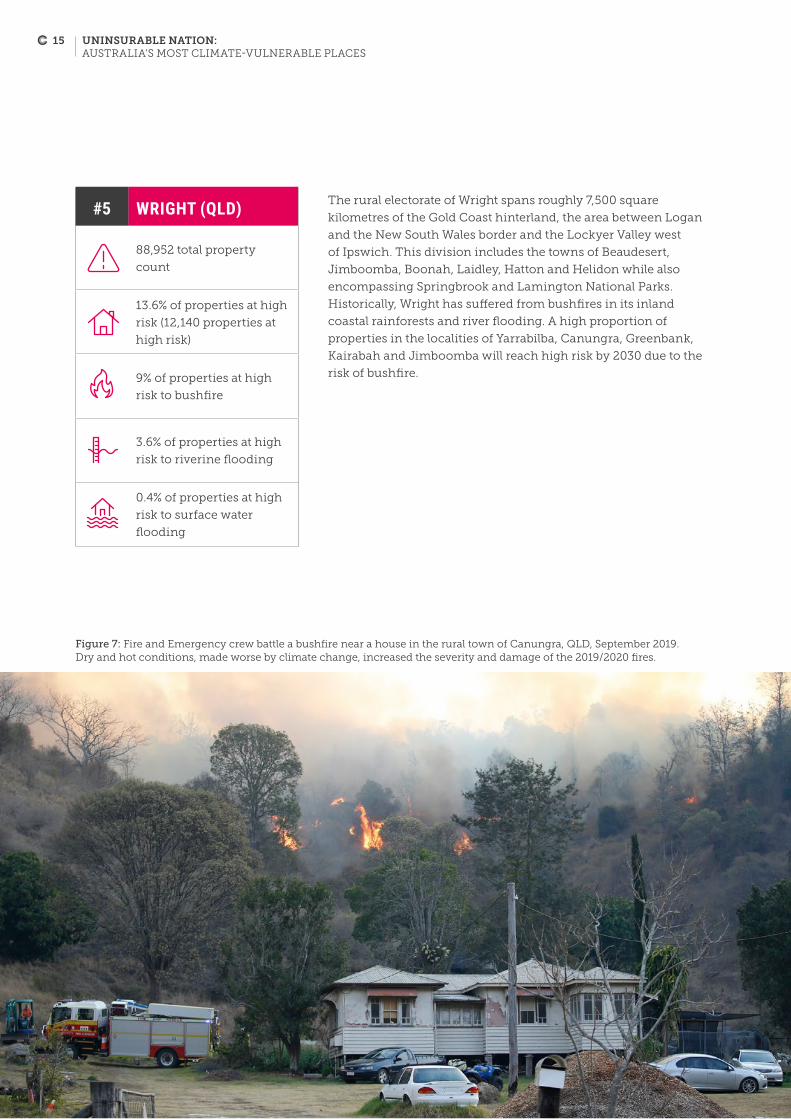
The rural electorate of Wright spans roughly 7,500 square
kilometres of the Gold Coast hinterland, the area between Logan
and the New South Wales border and the Lockyer Valley west
of Ipswich. This division includes the towns of Beaudesert,
Jimboomba, Boonah, Laidley, Hatton and Helidon while also
encompassing Springbrook and Lamington National Parks.
Historically, Wright has suffered from bushfires in its inland
coastal rainforests and river flooding. A high proportion of
properties in the localities of Yarrabilba, Canungra, Greenbank,
Kairabah and Jimboomba will reach high risk by 2030 due to the
risk of bushfire.
#5 WRIGHT (QLD)
88,952 total property
count
13.6% of properties at high
risk (12,140 properties at
high risk)
9% of properties at high
risk to bushfire
3.6% of properties at high
risk to riverine flooding
0.4% of properties at high
risk to surface water
flooding
Figure 7: Fire and Emergency crew battle a bushfire near a house in the rural town of Canungra, QLD, September 2019. Dry and hot conditions, made worse by climate change, increased the severity and damage of the 2019/2020 fires.
15 UNINSURABLE NATION: AUSTRALIA’S MOST CLIMATE-VULNERABLE PLACES
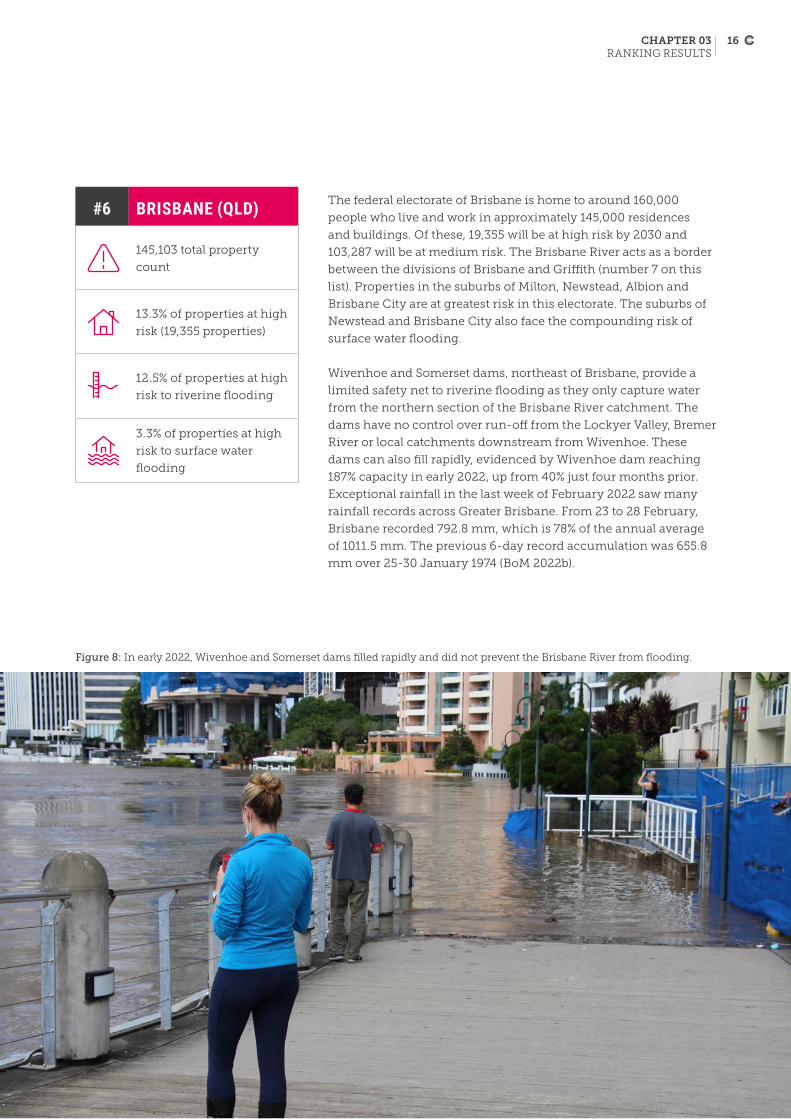
The federal electorate of Brisbane is home to around 160,000
people who live and work in approximately 145,000 residences
and buildings. Of these, 19,355 will be at high risk by 2030 and
103,287 will be at medium risk. The Brisbane River acts as a border
between the divisions of Brisbane and Griffith (number 7 on this
list). Properties in the suburbs of Milton, Newstead, Albion and
Brisbane City are at greatest risk in this electorate. The suburbs of
Newstead and Brisbane City also face the compounding risk of
surface water flooding.
Wivenhoe and Somerset dams, northeast of Brisbane, provide a
limited safety net to riverine flooding as they only capture water
from the northern section of the Brisbane River catchment. The
dams have no control over run-off from the Lockyer Valley, Bremer
River or local catchments downstream from Wivenhoe. These
dams can also fill rapidly, evidenced by Wivenhoe dam reaching
187% capacity in early 2022, up from 40% just four months prior.
Exceptional rainfall in the last week of February 2022 saw many
rainfall records across Greater Brisbane. From 23 to 28 February,
Brisbane recorded 792.8 mm, which is 78% of the annual average
of 1011.5 mm. The previous 6-day record accumulation was 655.8
mm over 25-30 January 1974 (BoM 2022b).
#6 BRISBANE (QLD)
145,103 total property
count
13.3% of properties at high
risk (19,355 properties)
12.5% of properties at high
risk to riverine flooding
3.3% of properties at high
risk to surface water
flooding
Figure 8: In early 2022, Wivenhoe and Somerset dams filled rapidly and did not prevent the Brisbane River from flooding.
16CHAPTER 03 RANKING RESULTS
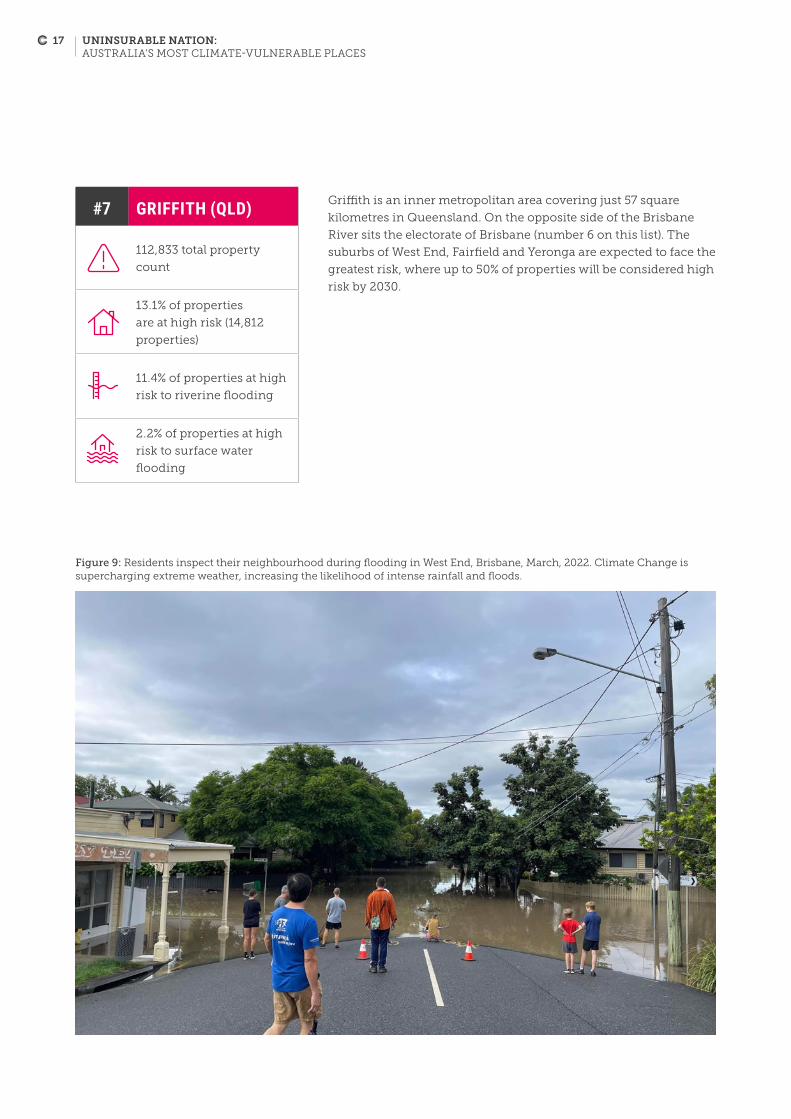
Griffith is an inner metropolitan area covering just 57 square
kilometres in Queensland. On the opposite side of the Brisbane
River sits the electorate of Brisbane (number 6 on this list). The
suburbs of West End, Fairfield and Yeronga are expected to face the
greatest risk, where up to 50% of properties will be considered high
risk by 2030.
#7 GRIFFITH (QLD)
112,833 total property
count
13.1% of properties
are at high risk (14,812
properties)
11.4% of properties at high
risk to riverine flooding
2.2% of properties at high
risk to surface water
flooding
Figure 9: Residents inspect their neighbourhood during flooding in West End, Brisbane, March, 2022. Climate Change is supercharging extreme weather, increasing the likelihood of intense rainfall and floods.
17 UNINSURABLE NATION: AUSTRALIA’S MOST CLIMATE-VULNERABLE PLACES

The division of Indi is a roughly 30,000 square kilometre rural area
encompassing the towns of Wodonga, Wangaratta, Glenrowan,
Benalla, Bright and the Victorian snowfields and Lake Eildon. It runs
along part of the northeast New South Wales border and extends as
far south as Kinglake. This part of Victoria is home to many rivers
and comprises sections of the Murray-Darling Basin. Significant
rivers in the division include the Goulburn River, Broken River,
King River, Buffalo River, Ovens River and the Kiewa River.
By 2030, up to 60% of properties in Wangaratta, where the King
River joins the Ovens River, will be considered high risk to riverine
flooding. Upstream of the Ovens River, in the picturesque tourist
town of Bright, almost 20% of properties will be considered high
risk by 2030.
#8 INDI (VIC)
99,086 total property
count
11.3% of properties at high
risk (11,215 properties)
10.7% of properties at high
risk to riverine flooding
1.1% of properties at high
risk to surface water
flooding
Figure 10: The Ovens River floods in the rural town of Myrtleford in 2016.
18CHAPTER 03 RANKING RESULTS

The electorate of Page covers an approximate 20,000 square
kilometres of rural and coastal New South Wales. This
encompasses the coastal area between Sapphire Beach (just north
of Coffs Harbour) and Nimbin and from the inland Nymboida
region in the south to the Queensland border. It also includes the
towns of Lismore, Casino, Dunoon, Yamba, Evans Head, Grafton,
Iluka, Kyogle and Wooli. Due to its geography, Page’s greatest
climate threats are bushfire and riverine flooding. This electorate
saw record breaking floods in early 2022. The Wilsons River, in
Lismore, reached 14.37 metres, two metres above the 1954 and
1974 levels. In the aftermath the town was said to resemble a war
zone; thousands of homes were destroyed completely or deemed
no longer safe for habitation. Just a few weeks later the flood
waters returned, topping the levee for the second time.
In Australia, extreme rainfall events are projected, with high
confidence, to increase in intensity.
#9 PAGE (NSW)
103,657 total property
count
11.3% of properties
are at high risk (11,691
properties)
5.4% of properties at high
risk to riverine flooding
5.3% of properties at high
risk to bushfire
0.4% of properties at high
risk to surface water
flooding
Figure 8: Cassandra Scott-Finn, at her home in Lismore, New South Wales, contemplates the daunting task of cleaning up after the record breaking floods in March 2022 that saw thousands of homes destroyed. The town of Lismore was said to resemble a war zone.
Figure 11: Rhonda, saved by her two boats, was fully prepared, many were not. Lismore, New South Wales. March. 2022.
19 UNINSURABLE NATION: AUSTRALIA’S MOST CLIMATE-VULNERABLE PLACES
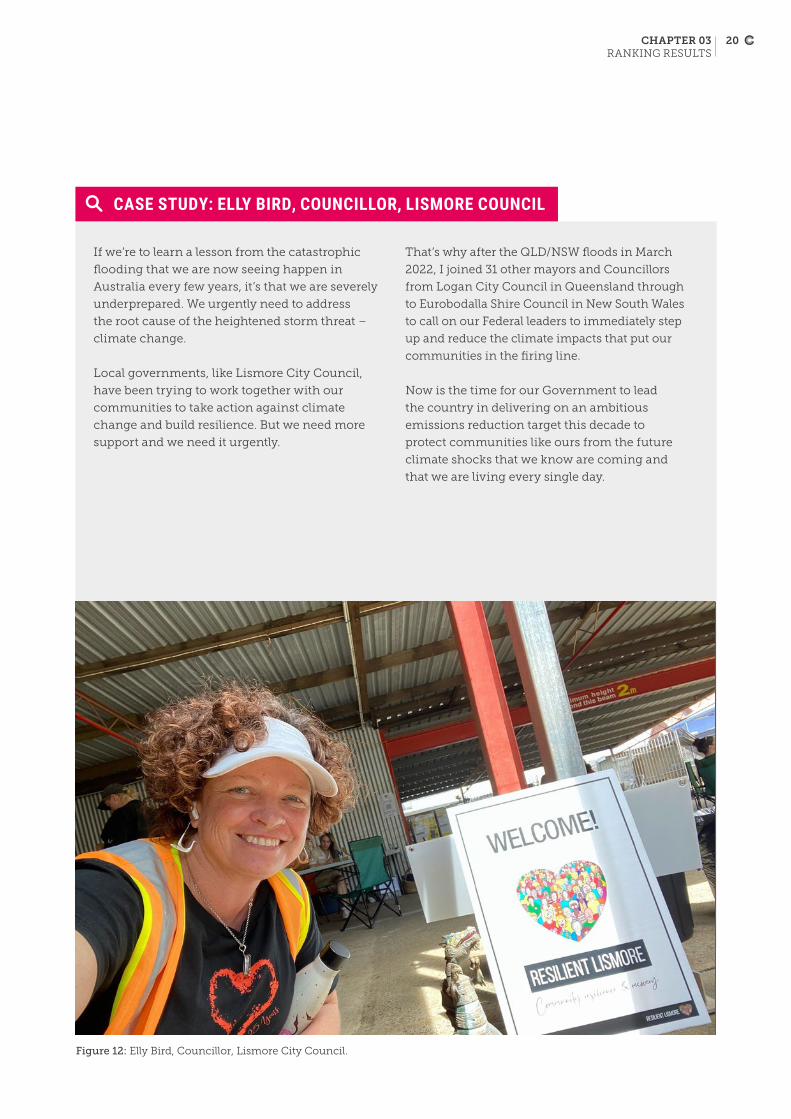
Figure 12: Elly Bird, Councillor, Lismore City Council.
If we’re to learn a lesson from the catastrophic
flooding that we are now seeing happen in
Australia every few years, it’s that we are severely
underprepared. We urgently need to address
the root cause of the heightened storm threat –
climate change.
Local governments, like Lismore City Council,
have been trying to work together with our
communities to take action against climate
change and build resilience. But we need more
support and we need it urgently.
That’s why after the QLD/NSW floods in March
2022, I joined 31 other mayors and Councillors
from Logan City Council in Queensland through
to Eurobodalla Shire Council in New South Wales
to call on our Federal leaders to immediately step
up and reduce the climate impacts that put our
communities in the firing line.
Now is the time for our Government to lead
the country in delivering on an ambitious
emissions reduction target this decade to
protect communities like ours from the future
climate shocks that we know are coming and
that we are living every single day.
CASE STUDY: ELLY BIRD, COUNCILLOR, LISMORE COUNCIL
20CHAPTER 03 RANKING RESULTS
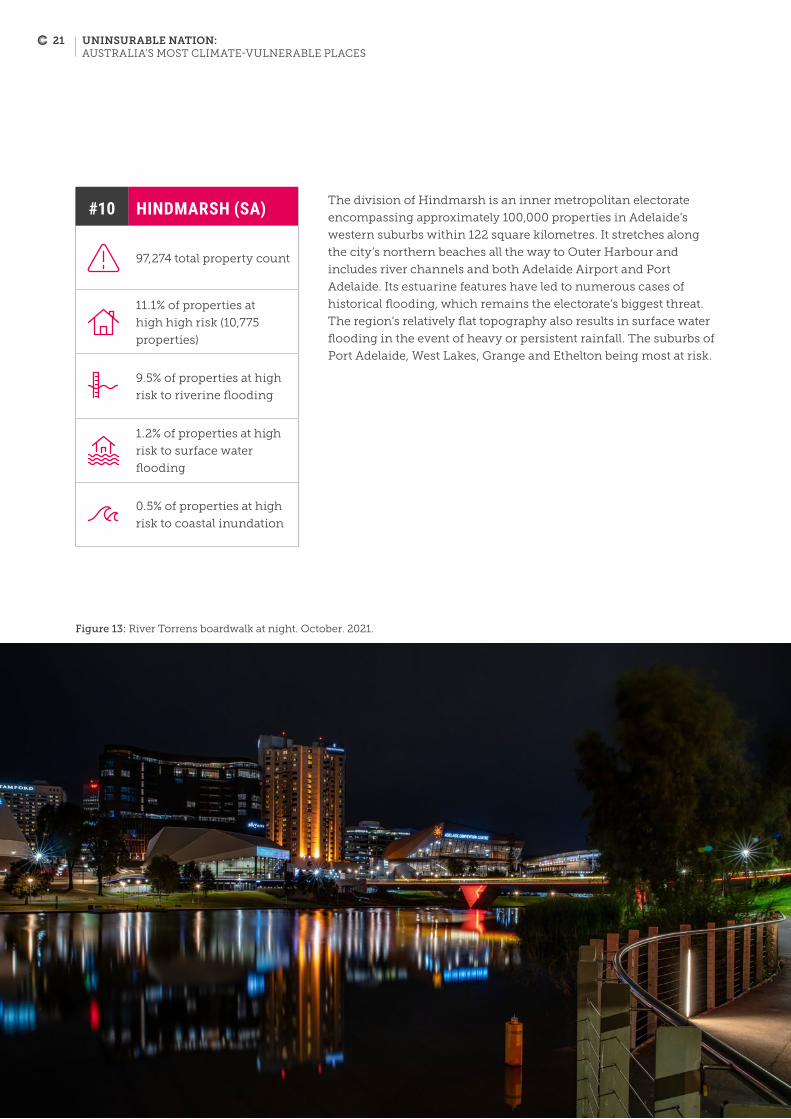
The division of Hindmarsh is an inner metropolitan electorate
encompassing approximately 100,000 properties in Adelaide’s
western suburbs within 122 square kilometres. It stretches along
the city’s northern beaches all the way to Outer Harbour and
includes river channels and both Adelaide Airport and Port
Adelaide. Its estuarine features have led to numerous cases of
historical flooding, which remains the electorate’s biggest threat.
The region’s relatively flat topography also results in surface water
flooding in the event of heavy or persistent rainfall. The suburbs of
Port Adelaide, West Lakes, Grange and Ethelton being most at risk.
#10 HINDMARSH (SA)
97,274 total property count
11.1% of properties at
high high risk (10,775
properties)
9.5% of properties at high
risk to riverine flooding
1.2% of properties at high
risk to surface water
flooding
0.5% of properties at high
risk to coastal inundation
Figure 13: River Torrens boardwalk at night. October. 2021.
21 UNINSURABLE NATION: AUSTRALIA’S MOST CLIMATE-VULNERABLE PLACES
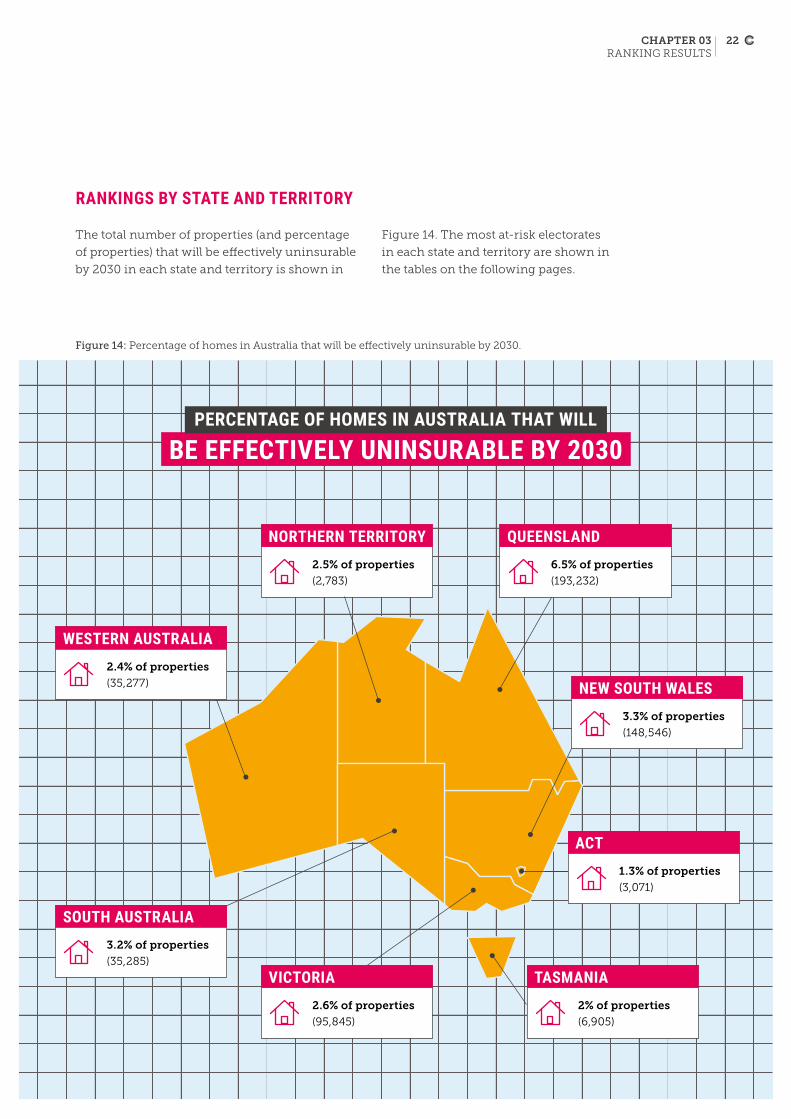
RANKINGS BY STATE AND TERRITORY
The total number of properties (and percentage
of properties) that will be effectively uninsurable
by 2030 in each state and territory is shown in
PERCENTAGE OF HOMES IN AUSTRALIA THAT WILL
BE EFFECTIVELY UNINSURABLE BY 2030
QUEENSLAND6.5% of properties
(193,232)
NORTHERN TERRITORY2.5% of properties
(2,783)
ACT1.3% of properties
(3,071)
TASMANIA2% of properties
(6,905)
NEW SOUTH WALES3.3% of properties
(148,546)
VICTORIA2.6% of properties
(95,845)
SOUTH AUSTRALIA3.2% of properties
(35,285)
WESTERN AUSTRALIA2.4% of properties
(35,277)
Figure 14: Percentage of homes in Australia that will be effectively uninsurable by 2030.
Figure 14. The most at-risk electorates
in each state and territory are shown in
the tables on the following pages.
22CHAPTER 03 RANKING RESULTS

New South Wales
Electorate Total properties High risk properties Medium risk properties High risk properties (%)
Richmond 106,445 22,274 34,884 20.9
Page 103,657 11,691 33,177 11.3
Lyne 106,556 10,283 33,607 9.7
Parkes 109,767 10,251 7,450 9.3
Farrer 114,512 7,745 6,009 6.8
Total 540,937 62,244 115,127 11.5
Queensland
Electorate Total properties High risk properties Medium risk properties High risk properties (%)
Maranoa 132,078 19,551 13,212 14.8
Moncrieff 131,924 18,032 9,545 13.7
Wright 88,952 12,140 28,502 13.6
Brisbane 145,103 19,355 22,461 13.3
Griffith 112,833 14,812 17,894 13.1
TOTAL 610,890 83,890 91,614 13.7
Across all electorates in Australia, around 3.6% of properties (520,944) or one in every 25 properties will be uninsurable by 2030.
23 UNINSURABLE NATION: AUSTRALIA’S MOST CLIMATE-VULNERABLE PLACES
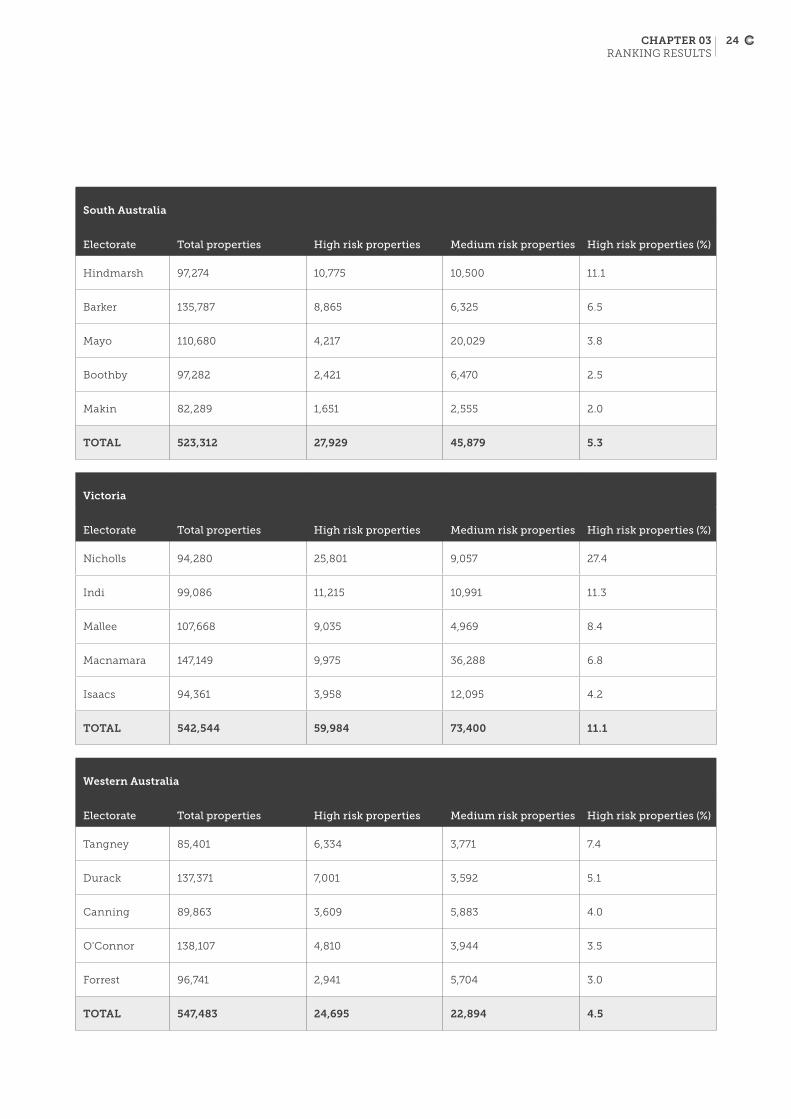
South Australia
Electorate Total properties High risk properties Medium risk properties High risk properties (%)
Hindmarsh 97,274 10,775 10,500 11.1
Barker 135,787 8,865 6,325 6.5
Mayo 110,680 4,217 20,029 3.8
Boothby 97,282 2,421 6,470 2.5
Makin 82,289 1,651 2,555 2.0
TOTAL 523,312 27,929 45,879 5.3
Victoria
Electorate Total properties High risk properties Medium risk properties High risk properties (%)
Nicholls 94,280 25,801 9,057 27.4
Indi 99,086 11,215 10,991 11.3
Mallee 107,668 9,035 4,969 8.4
Macnamara 147,149 9,975 36,288 6.8
Isaacs 94,361 3,958 12,095 4.2
TOTAL 542,544 59,984 73,400 11.1
Western Australia
Electorate Total properties High risk properties Medium risk properties High risk properties (%)
Tangney 85,401 6,334 3,771 7.4
Durack 137,371 7,001 3,592 5.1
Canning 89,863 3,609 5,883 4.0
O'Connor 138,107 4,810 3,944 3.5
Forrest 96,741 2,941 5,704 3.0
TOTAL 547,483 24,695 22,894 4.5
24CHAPTER 03 RANKING RESULTS

Tasmania
Note: There are only five electoral divisions in Tasmania.
Electorate Total properties High risk properties Medium risk properties High risk properties (%)
Bass 67,320 2,463 2,027 3.7
Lyons 75,297 2,098 2,399 2.8
Braddon 68,227 967 1,035 1.4
Franklin 60,933 698 942 1.1
Clark 65,747 679 780 1.0
TOTAL 337,524 6,905 7,183 2.0
The Northern Territory and Australian Capital Territory
Note: There are only two electoral divisions in the NT: Lingiari (4.5% properties at high risk) and Solomon (1% of properties at high risk). There are only three electoral divisions in the ACT.
Electorate Total properties High risk properties Medium risk properties High risk properties (%)
Canberra 86,905 1,443 2,944 1.7
Bean 74,077 1,008 323 1.4
Fenner 71,247 620 1,002 0.9
TOTAL 232,229 3,071 4,269 1.3
25 UNINSURABLE NATION: AUSTRALIA’S MOST CLIMATE-VULNERABLE PLACES
CHAPTER 04 CONCLUSION AND RECOMMENDATIONS
4. Conclusion and recommendations
Australians are paying a high price for the lack of meaningful national action to tackle climate change, and prepare for its impacts. Worsening disaster after disaster – with fewer reprieves between – is frequently exceeding the capacity of communities to cope, and we must work hard to avoid catastrophe. Unless we rapidly and drastically cut greenhouse gas emissions this decade – aligned with a path to limit the global average temperature rise to well below 2°C – extreme weather will get much, much worse.
To limit temperature rise to well below
2°C, global emissions need to be halved by
2030, and there is a need to get to net zero
by 2040 at the latest. Australia, amongst
other countries, must urgently escalate
efforts to reduce emissions before the
end of this decade. Australia should aim
higher than the global average and adopt a
target of 75% emissions reductions by 2030
reaching net zero by 2035, given its distinct
advantages and the many social benefits
and economic opportunities associated
with emissions reductions.
As a wealthy nation with a remarkable
abundance of renewable energy resources
and critical minerals, Australia has
boundless potential to become an economic
powerhouse in a world that is racing towards
net zero. If Australia moves quickly, we
have the opportunity to drastically reduce
emissions, save money through reduced fuel
and power bills, boost economic growth,
generate tens of thousands of additional jobs
and translate our renewable energy resources
into clean energy export industries worth
hundreds of billions per annum. Moving
away from fossil fuels would also translate
into tangible health benefits for Australians.
A key test for all candidates in the upcoming
Federal Election is whether they are
supporting policies that can drive deep
emissions cuts now through the 2020s,
aligned with limiting the global average
temperature rise to well below 2°C. Warming
avoided can be measured in lives, species
and ecosystems saved, as well as avoided
economic shocks. The decisions and actions
of governments this decade will determine
how much worse things get.
26

The Climate Council calls on all federal political
parties and candidates to adopt policies that:
4. Account for climate risks
in land use planning
Too many Australians live in dangerous
locations that put them at higher risk
of being impacted by floods, bushfires,
cyclones and actions from the sea. This
is because not enough consideration was
given to the risks from extreme weather
– including worsening risks from climate
change – at the time that planning approval
was given. Improved policy settings are
required across all levels of government to
prevent new buildings and infrastructure
being constructed in areas that are, or will be,
highly exposed to climate change hazards.
5. Improve building
standards and compliance
Embedding resilience into building codes is
a key tool for reducing the risks associated
with worsening extreme weather. The
National Construction Code should be
amended to ensure that buildings are able to
better withstand the risks posed by climate
change and worsening extreme weather –
whilst simultaneously improving the energy
efficiency and thermal comfort of buildings.
This should be accompanied by improved
compliance and enforcement.
6. Support communities
to ‘build back better’
Towns, cities and communities must be
rebuilt – where appropriate to do so – in a
way that takes into account the inevitable
future changes in climate and makes them
more resilient. In some very high-risk
locations, this may mean not rebuilding at
all – managed relocations must be discussed
as an option for some of the most vulnerable
and exposed communities.
1. Enable swift and deep emissions
reductions across the whole of the
Australian economy
With a target of cutting emissions by 75%
below 2005 levels by 2030 and reaching net
zero emissions by 2035.
2. Eliminate fossil
fuel subsidies
In 2021-22, Australian Federal and state
governments provided a total of $11.6 billion
worth of spending and tax breaks to assist
fossil fuel industries – 56 times the budget of
the National Recovery and Resilience Agency
(TAI 2022). This is completely at odds with
addressing the risks from climate change
and extreme weather.
3. Prioritise investment
in resilience
Investing in risk reduction and resilience
provides a ‘triple dividend’ of avoided loss
and suffering, reduced disaster costs and
potential economic and social benefits even
in the absence of hazards occurring. There
is a need to upscale public investments in
resilience and develop innovative financing
pathways. The process for allocating public
funds towards resilience projects must be
independent and data driven, focusing on
the most vulnerable communities.
27 UNINSURABLE NATION: AUSTRALIA’S MOST CLIMATE-VULNERABLE PLACES

REFERENCES
ABS (Australian Bureau of Statistics) (2020) Characteristics of new residential dwellings - A 15 year summary. Accessed: https://www.abs.gov.au/articles/characteristics-new-residential-dwellings-15-year-summary
ACCC (Australian Competition and Consumer Commission) (2019) Northern Australia Insurance Inquiry -- Second Interim Report. Accessed: https://www.accc.gov.au/system/files/Northern%20Australia%20Insurance%20Inquiry%20second%20interim%20report%202019_0.PDF
AFR (Australian Financial Review) (2020) Climate change will force up premiums: Swiss Re by James Fernyhough (2 March 2020). Accessed: https://www.afr.com/companies/financial-services/climate-change-will-force-up-premiums-swiss-re-20200228-p545c1
BoM (Bureau of Meteorology) (2022a) Annual climate statement 2021: Analysis of Australia’s temperature, rainfall, water, oceans, significant weather and influences during 2021. Accessed: http://www.bom.gov.au/climate/current/annual/aus/#tabs=Highlights.
BoM (2022b) Greater Brisbane in February 2022: exceptional rainfall. Accessed: http://www.bom.gov.au/climate/current/month/qld/archive/202202.brisbane.shtml.
Climate Action Tracker (2021) Australia: Country Summary. 15 September 2021. Accessed: https://climateactiontracker.org/countries/australia/.
CSIRO and BoM (Commonwealth Scientific and Industrial Research Organisation and Bureau of Meteorology) (2020) State of the Climate 2020. Accessed: file:///Users/annika/Downloads/State-of-the-Climate-2020%20(1).pdf
Coates L, Haynes K, O’Brien J, McAneney J, De Oliveira FD (2014) Exploring 167 years of vulnerability: an examination of extreme heat events in Australia 1844-2010. Environmental Science and Policy, 42, pp. 33-44. http://www.sciencedirect.com/science/article/pii/S1462901114000999
Coates L, van Leeuwen J, Browning S, Gissing A, Bratchell J, Avci A (2022) Heatwave fatalities in Australia, 2001–2018: An analysis of coronial records. International Journal of Disaster Risk Reduction, 67: 102671. https://doi.org/10.1016/j.ijdrr.2021.102671.
ICA (Insurance Council of Australia) (2021) Insurance Catastrophe Resilience Report 2020-21. Accessed: https://insurancecouncil.com.au/wp-content/uploads/2021/09/ICA008_CatastropheReport_6.5_FA1_online.pdf
RBA (Reserve Bank of Australia) (2021) Climate Change Risks to Australian Banks. Bulletin (September). Accessed: https://www.rba.gov.au/publications/bulletin/2021/sep/climate-change-risks-to-australian-banks.html
Summerhayes G (2020) Executive Board Member Geoff Summerhayes - Speech to Australian Business Roundtable for Disaster Resilience and Safer Communities webinar. Australian Prudential Regulatory Authority (APRA) (14 October). Accessed: https://www.apra.gov.au/news-and-publications/executive-board-member-geoff-summerhayes-speech-to-australian-business
Swiss Re (2019) Insurance in a World of Climate Extremes: What Latest Science Tells Us. Accessed: https://www.swissre.com/media/press-release/nr-20191219-global-catastrophes-estimate.html
TAI (2022) Fossil fuel subsidies in Australia: Federal and state government assistance to fossil fuel producers and major users in 2021-22. Accessed: https://australiainstitute.org.au/wp-content/uploads/2022/03/P1198-Fossil-fuel-subsidies-2022-WEB.pdf
The Guardian (2021) ‘Fire and Flood’: Whole Areas of Australia will be Uninsurable by Royce Kurmelovs (2 April). Accessed: https://www.theguardian.com/australia-news/2021/apr/02/fire-and-flood-whole-areas-of-australia-will-be-uninsurable
References
28

Cover photo: Cassandra Scott-Finn. Kim & daughter. Lismore, March, 2022. https://www.instagram.com/soft_urge__/
Page 2 - Figure 1: Ash Hogan. Bushfire, Crescent Head, Forster, New South Wales. 2019.
Page 11 - Figure 3: Neville Larson for Greater Shepparton City Council. Broken River Pedestrian Bridge. Shepparton, Victoria. September, 2010.
Page 12 - Figure 4: Dave Hunt for AAP. Tiffany Williamson walks through her parent’s burnt out property in Tingha in northern New South Wales. February, 2019.
Page 13 - Figure 5: Dan Peled for AAP. A State Emergency Service (SES) crew motors past a flood gauge on the swollen Balonne river in St George, southwestern Queensland. February, 2020.
Page 14 - Figure 6: Josh Withers for Unsplash. August, 2020. https://www.instagram.com/hellojoshwithers
Page 15 - Figure 7: Regi Varghese for AAP. Fire and Emergency crew battle bushfire near a house in the rural town of Canungra in the Scenic Rim region of southeast Queensland. September 6, 2019.
Page 16 - Figure 8: Valley Guide for Unsplash. May 2022. https://www.instagram.com/valleyguide/
Page 17 - Figure 9: Ruby Fletcher. Montague Road, corner Ryan Street, West End. Queensland. February, 2022.
Page 18 - Figure 10: Facebook: Ness Leonard. Myrtleford 2016. Used with permission.
Page 19 - Figure 11: Cassandra Scott-Finn. Lismore, New South Wales, March 2022.
Page 20 - Figure 12: Elly Bird, Councillor, Lismore City Council.
Page 21 - Figure 13: Gilly Tanabose for Unsplash. October. 2021. https://www.instagram.com/gshakwon23/
Image credits
29 UNINSURABLE NATION: AUSTRALIA’S MOST CLIMATE-VULNERABLE PLACES

The Climate Council acknowledges the Traditional Custodians of the lands on which we live, meet and work. We wish to pay our respects to Elders past, present and emerging and recognise the continuous connection of Aboriginal and Torres Strait Islander peoples to Country.
The Climate Council is an independent, crowd-funded organisation providing quality information on climate change to the Australian public.
CLIMATE COUNCIL
twitter.com/climatecouncil
facebook.com/climatecouncil
climatecouncil.org.au
The Climate Council is a not-for-profit organisation. We rely upon donations from the public. We really appreciate your contributions.
climatecouncil.org.au/donateDONATE