Educating the Nation - Planipolis
100
Republic of Zambia EDUCATION SECTOR MINISTRIES Educating the Nation Strategic Framework for Implementation Of Education For All May 2005
-
Upload
khangminh22 -
Category
Documents
-
view
3 -
download
0
Transcript of Educating the Nation - Planipolis

Republic of Zambia
EDUCATION SECTOR MINISTRIES
Educating the Nation
Strategic Framework for Implementation Of Education For All
May 2005

II
CONTENTS
FOREWORD...................................................................................................... VII
ACKNOWLEDGEMENTS..............................................................................VIII
ACRONYMS ........................................................................................................IX
PART I .................................................................................................................... 1
1. INTRODUCTION: CONTEXT OF EDUCATION PROVISION ............. 1
1.1 Socio-Political ......................................................................................................................1 1.2 Economy...............................................................................................................................1 1.3 Structure of Education System ..........................................................................................2 1.4 Education Delivery and Institutional Arrangements.......................................................3
2. THE EFA VISION, GOALS AND OBJECTIVES ...................................... 4
3. EDUCATION FOR ALL: POLICY CONTEXT FOR PROGRAMME IMPLEMENTATION .................................................................................... 5
3.1 Overview ..............................................................................................................................5 3.2 Centrality of Curriculum Quality in the Provision of Education for All.......................6
3.2.1. Purpose of Education as Philosophy of Education...................................................7 3.2.2. Schooling and Society: The Missing Link ...............................................................7 3.2.3. Educating Society Versus Schooling .......................................................................9
3.3 Perspectives in Programme Implementation..................................................................11 3.4 Basic Education Sub-Sector Investment Programme (BESSIP) ..................................13 3.5 Technical Education Sub-Sector Investment Programme (TESSIP)...........................14 3.6 Programme Implementation Strategies ..........................................................................14 3.7 Early Childhood Care, Development and Education (ECCDE)...................................15 3.8 Basic Education .................................................................................................................15 3.9 Literacy Education............................................................................................................16 3.10 Basic Skills Education.......................................................................................................16 3.11 Relationship between EFA and Non EFA Sub-Sectors .................................................18 4. PREPARATON FOR EFA DATA COLLECTION ......................................................19
5. SYNOPSIS OF POLICY MILESTONES AND ASSUMPTIONS ........... 20
III
Early Childhood Care, Development and Education ...............................................................20 Basic Education ............................................................................................................................20 Literacy Education.......................................................................................................................21 Skills Education ............................................................................................................................21 Non EFA Sub-sector.....................................................................................................................21 General ..........................................................................................................................................21
PART II................................................................................................................. 22
6. SUB-SECTOR DATA PROFILES.............................................................. 22
PRESENTATION OF DATA AND FINANCIAL PROJECTIONS ............... 22
6.1 Early Childhood Care, Development and Education (ECCDE)...................................22 6.1.1 Access to and Participation in ECCDE..................................................................24 6.1.2 Financing of ECCDE .............................................................................................24 6.1.3 Quality and Relevance of ECCDE.........................................................................24 6.1.4 Projected access and Participation .........................................................................25 6.1.5 Costs .......................................................................................................................27
6.2 Basic Education .................................................................................................................28 6.2.1 Infrastructure for Basic Education .........................................................................29 6.2.2 Access and Participation in Basic Education .........................................................29 6.2.3 Enrolments and Participation (Gross and Net Enrolments) ...................................33 6.2.4 Efficiency (Progression, Repetition, Dropout and Completion Rates) ..................35 6.2.5 Quality Indicators in Basic Education....................................................................38 6.2.6 Teacher-Pupil Ratios ..............................................................................................39 6.2.7 Learning Achievement and Changes over Time ....................................................40 6.2.8 Curriculum and Educational Materials ..................................................................40 6.2.9 Financing of Basic Education ................................................................................41 6.2.10 Access and participation.........................................................................................41 6.2.11 Basis for Costings...................................................................................................44 6.2.12 Annual Additional Construction ............................................................................46 6.2.13 Annual Additional Construction of Fully-fledged Basic Schools..........................47 6.2.14 Quality....................................................................................................................47
6.3 Literacy Education............................................................................................................48 6.3.1 Available Facilities for Provision of Literacy Education.......................................49 6.3.2 Access to and Participation in Literacy Education.................................................50 6.3.3 Financing of Literacy Education ............................................................................50 6.3.4 Literacy Levels in Zambia......................................................................................50 6.3.5 Equity in Literacy Education..................................................................................51 6.3.6 Quality and Relevance of Literacy Education........................................................51 6.3.7 Projected Access and participation ........................................................................52 6.3.8 Costs and Scenarios................................................................................................52
6.4 Basic Skills Education............................................................................................................53

IV
6.4.1 Participation in Provision of Basic Skills Education .............................................54 6.4.2 Gender and Equity in Basic Skills Provision .........................................................54 6.4.3 Quality of Basic Skills Education ..........................................................................55 6.4.4 Financing Basic Skills Education...........................................................................55 6.4.5 Access, Participation and Quality ..........................................................................56 6.4.6 Costs .......................................................................................................................57
7. RELATIONSHIP BETWEEN EFA AND NON EFA SECTORS: HIGH SCHOOL & TERTIARY EDUCATION.................................................... 59
7.1 High Schools.......................................................................................................................60 7.2 Tertiary Education............................................................................................................65
PART III ............................................................................................................... 70
8. EXISTING OPPORTUNITIES FOR THE PROVISION OF EFA ......... 70
8.1 Public Support for the EFA Context of Education ........................................................70 8.2 Special Issues of Concern .................................................................................................71
8.2.1 Manifestation of Poverty in the Education Sector .................................................72 8.2.2 Impact of HIV/AIDS on Education........................................................................72 8.2.3 Access to and Quality of Special Needs Education ...............................................73
8.2 Place of Physical Education, Sport and Talent Development in EFA..........................74
9. CONCLUSION: Towards Achieving Provision of Comprehensive Education ...................................................................................................... 75
PART IV ............................................................................................................... 77
10. EFA LOGICAL FRAMEWORK................................................................ 77
10.1 EFA Cross-Cutting Strategic Objectives.................................................... 78
10.2 EFA Operational Objectives by Target Area............................................. 82
10.2.1 Early Childhood Care, Development and Education (ECCDE) ............................82 10.2.2 Basic Education......................................................................................................84 10.2.3 Literacy Education .................................................................................................87 10.2.5 Basic Skills Education............................................................................................88 10.2.6 Non EFA Sub-Sectors ............................................................................................90
V
LIST OF TABLES Table 1: Available Facilities for Provision of ECCDE ................................................................................. 22 Table 2: Number of Institutions by Running Agency and Province............................................................... 23 Table 3: ECCDE Requisites/Support Services by Provider........................................................................... 23 Table 4: Learner Enrolment ....................................................................................................................... 24 Table 5: Projected Recurrent Costs in ECCDE (US Dollars) ...................................................................... 27 Table 6: Classrooms in Grades 1-9 by Type and Province............................................................................ 29 Table 7: Basic Schools by Level and Province ............................................................................................ 30 Table 8: Basic Schools by Urban/Rural and Province .................................................................................. 30 Table 9: Basic Schools by Running Agency and Province............................................................................ 30 Table 10: Gross Intake Rates by gender and Province.................................................................................. 31 Table 11: Net Intake Rate by Gender and Province...................................................................................... 32 Table 12: Grade 1 Entrants by Gender and Province.................................................................................... 32 Table 13: Grade 1 Enrolments by Age, Gender and Province (excluding repeaters) ....................................... 33 Table 14: Enrolment in Basic Schools in Grades 1 - 9 by Gender and Province ............................................. 33 Table 15: Enrolment in Basic Schools in Grades 1 - 7 by Agency/Type and Province.................................... 34 Table 16: Gross Enrolments....................................................................................................................... 34 Table 17: Net Enrolment Ratio in Grades 1 - 7 by Gender and Province ....................................................... 35 Table 18: Progression Rates for Grades 7 - 8 and Grades 9 - 10 by Gender and Province (single year data)..... 35 Table 19: Repetition Rates for Grades 1 - 9 by Gender and Province ............................................................ 36 Table 20: Completion Rates for Grades 1 - 7 and Grades 1 - 9 by Gender and Province ................................. 37 Table 21: Basic School Teachers by Agency/Type and Province .................................................................. 38 Table 22: Teachers for Grades 1 - 9 by Gender and Province ....................................................................... 39 Table 23: Proportion of Pupils Attaining Defined Levels of Competencies ................................................... 40 Table 24: Enrolment Projections for Grades 1 to 7 ...................................................................................... 42 Table 25: Basic Education Projected Recurrent Expenditure for Publicly Financed Enrolments...................... 44 Table 26: Facilities for Literacy Education by Type, 2004 ........................................................................... 49 Table 27: Number of Institutions by Running Agency and Province (2004) ........................................ 49 Table 28: Literacy Education for Target Population and the Projected Costs Scenarios .................................. 52 Table 29: Basic Skills requisites/Support Services by Provider..................................................................... 54 Table 30: Basic Skills Education by Provider/Learner Participation by Gender ............................................. 54 Table 31: Basic Skills Education by Location and Participation by Gender ................................................... 55 Table 32: Number of Learners and Teachers by Gender............................................................................... 55 Table 33: Projected Numbers of Dropouts to Benefit from Basic Skills Education......................................... 56 Table 34: 2003 High School Enrolment by Grade and Sex........................................................................... 60 Table 35: High School Projections ............................................................................................................. 62 Table 36: Recurrent Costs for Academic Production Units (A.P.U) .............................................................. 65 Table 37: 2003 UNZA, School of Education Enrolment ....................................................................... 66 Table 38: Graduate Output in Teacher Education Programmes..................................................................... 66 Table 39: 2004 Staffing Levels per Programme, UNZA, School of Education............................................... 66 Table 40: Teacher Requirements ................................................................................................................ 67
VI
LIST OF FIGURES Figure 1: Education Structure in Zambia....................................................................................................... 3 Figure 2: Projected Trends in Early Childhood Participation ................................................................ 26 Figure 3: Projected Enrolments for Privately and Publicly Financed Early Childhood Education.................... 27 Figure 4: IRI Centres by Province .............................................................................................................. 31 Figure 5: Repetition Rates by Province.................................................................................................. 36 Figure 6: Drop Out Rates by Grade ............................................................................................................ 37 Figure 7: Population of Under and Over Age Children in the System .................................................. 38 Figure 8: Teacher-Pupil Ratios for Grade 1 to 7 .......................................................................................... 39 Figure 9: Grade 1 new Entrants.................................................................................................................. 41 Figure 10: Projected trends in Net Intake Rates for Grade 1 ................................................................. 42 Figure 11: Gross Enrolment Trends (2004 to 2015) .............................................................................. 43 Figure 12: Basic Education Enrolment Projections (2004-2015)................................................................... 44 Figure 13: Grade 7 To 8 Transition Rates.............................................................................................. 44 Figure 14: First Scenario: New Infrastructure Capital Investment Projections (1-7) ............................ 45 Figure 15: Second Scenario (all community schools taken as GRZ) New infrastructure capital
investments projections (Grade 1 to 7) .......................................................................................... 46 Figure 16: Annual Additional Construction of Fully Fledged Basic Schools........................................ 46 Figure 17: Projected Capital Costs for the Construction of Fully Fledged Basic Schools US
Dollar.............................................................................................................................................. 47 Figure 18: Illiteracy rate Projections at 50% and 80% Reduction ......................................................... 52 Figure 19: Skills Education At 50 % of Dropouts ................................................................................. 57 Figure 20: Projected Additional Places for Skills Education................................................................. 58 Figure 21: Projected Recurrent Costs for Skills Education.................................................................... 58 Figure 22: Projected Infrastructural Investments for Skills Education .................................................. 59 Figure 23: Progression Rates for Grade 9/10 ......................................................................................... 62 Figure 24: Enrolment Annual Variation Projections (Grade 10-12)...................................................... 63 Figure 25: High School Expenditure Projections................................................................................... 63 Figure 26: New Infrastructure Capital Investments Projections (Grades 10 To 12).............................. 64 Figure 27: Projected Academic Production Units (A.P.U) Enrolment Figures ..................................... 64 Figure 28: Recurrent Teacher Training Costs in US Dollars ................................................................. 68 Figure 29: Infrastructure Investments for Additional Teacher Training Colleges Enrolments ............. 69
VII
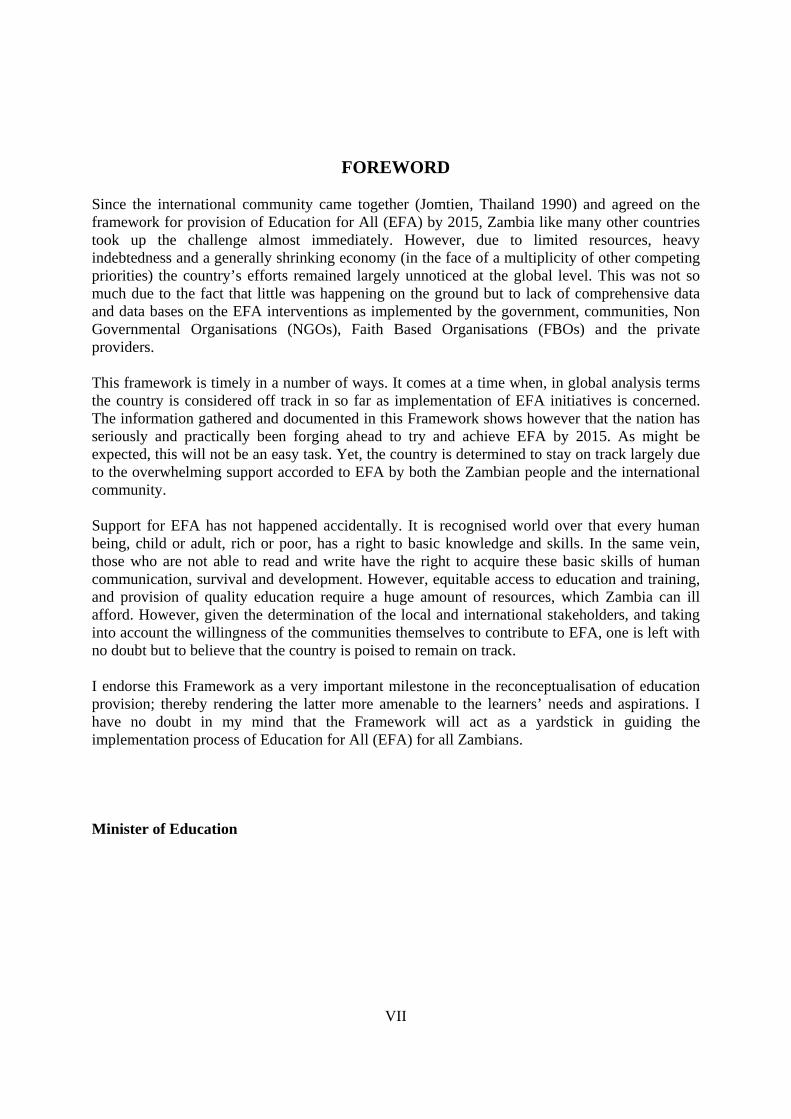
FOREWORD
Since the international community came together (Jomtien, Thailand 1990) and agreed on the framework for provision of Education for All (EFA) by 2015, Zambia like many other countries took up the challenge almost immediately. However, due to limited resources, heavy indebtedness and a generally shrinking economy (in the face of a multiplicity of other competing priorities) the country’s efforts remained largely unnoticed at the global level. This was not so much due to the fact that little was happening on the ground but to lack of comprehensive data and data bases on the EFA interventions as implemented by the government, communities, Non Governmental Organisations (NGOs), Faith Based Organisations (FBOs) and the private providers. This framework is timely in a number of ways. It comes at a time when, in global analysis terms the country is considered off track in so far as implementation of EFA initiatives is concerned. The information gathered and documented in this Framework shows however that the nation has seriously and practically been forging ahead to try and achieve EFA by 2015. As might be expected, this will not be an easy task. Yet, the country is determined to stay on track largely due to the overwhelming support accorded to EFA by both the Zambian people and the international community. Support for EFA has not happened accidentally. It is recognised world over that every human being, child or adult, rich or poor, has a right to basic knowledge and skills. In the same vein, those who are not able to read and write have the right to acquire these basic skills of human communication, survival and development. However, equitable access to education and training, and provision of quality education require a huge amount of resources, which Zambia can ill afford. However, given the determination of the local and international stakeholders, and taking into account the willingness of the communities themselves to contribute to EFA, one is left with no doubt but to believe that the country is poised to remain on track. I endorse this Framework as a very important milestone in the reconceptualisation of education provision; thereby rendering the latter more amenable to the learners’ needs and aspirations. I have no doubt in my mind that the Framework will act as a yardstick in guiding the implementation process of Education for All (EFA) for all Zambians. Minister of Education
VIII
ACKNOWLEDGEMENTS The following Ministries; Education, Community Development and Social Services, Sport ,Youth and Child Development, and Science, Technology and Vocational Training are grateful for the contributions made to this document by all the key stakeholders operating in the Education Sector. These include members of the civil society, through the Zambia National Education Coalition (ZANEC), the aid donor community and the Faith Based Organisations. We also recognise and appreciate the invaluable data in-puts made by officials from the Education Sector Ministries without which this work would not have been complete. Special thanks go to the members of the EFA Steering Committee who have guided the preparation of this Implementation Framework since June 2003 as well as the members of the Technical Writing Team and Contributors for their courage and commitment to the realisation of this document. These are: Dr Sichalwe M Kasanda (Team Leader), Mr Joe Kanyika (Member), Mr Bernard M Simpokolwe (Member), Mr Arnold Chengo (Member), Dr Yizenge Chondoka (Member), Dr. Peter Manchishi (Member), Mrs Grace Mauka Mukanu (Member), Mrs Roseby Musuku (Member), Mrs Sophie Ng’andu (Member), Mr Michael Chilala (Member), Mrs Teza Musakanya (Member), Mr Austin Chibesakunda (Member) and Ms Irene Malambo (Member) Above all, our sincere thanks go to UNICEF for having facilitated the establishment of the EFA Secretariat and for having provided initial funding for the Framework, and to UNESCO for having made funds available for all the project activities through the FIT Project funding arrangement. It is our hope that the rest of the aid donor community will also put their resources at the nation’s disposal as we move into the next stage i.e. formal implementation of this EFA Strategic Framework. Permanent Secretary Ministry of Education
IX
ACRONYMS
APU - Academic Production Unit or (Afternoon Classes) BESSIP - Basic Education Sub-Sector Investment Programme CBO - Community Based Organisation CBU - Copperbelt University CSO - Civil Society Organisation CSO - Central Statistical Office DHS - Demographic and Health Survey ECCDE - Early Childhood Care, Development and Education ECCDEC - Early Childhood Care, Development and Education Council ECZ - Examinations Council of Zambia EFA - Education for All ESIP - Education Sector Investment Programme FBO - Faith Based Organisation FIT - Italian Project Fund GDP - Gross Domestic Product GER - Gross Enrolment Ratio GNP - Gross National Product GRZ - Government of the Republic of Zambia HIPC - Highly Indebted Poor Countries HIV/AIDS - Human Immuno Virus/Acquired Immuno Deficiency Syndrome INGO - International Non Governmental Organisation IRI - Interactive Radio Instruction LU - Literacy Unit MCDSS - Ministry of Community Development and Social Services MDGs - Millennium Development Goals MOE - Ministry of Education MSTVT - Ministry of Science, Technology and Vocational Training. NAC - National Aids Council NESA - National Education Sector Authority NGO - Non Governmental Organisation NLC - National Literacy Council NPA - National Programme of Action PRSP - Poverty Reduction Strategy Paper PSRP - Public Service Reform Programme SEN - Special Education Needs TDP - Technical Development Programme TESSIP - Technical Education Sub-Sector Investment Programme TEVET - Technical Education, Vocational and Entrepreneurship Training TEVETA - Technical Education, Vocational and Entrepreneurship Training Authority UNESCO - United Nations Educational, Scientific and Cultural Organisation UNICEF - United Nations International Children’s Education Fund UNZA - University of Zambia UPE - Universal Primary Education US D - United States Dollar ZNC-UNESCO - Zambia National Commission for UNESCO ZANEC - Zambia National Education Coalition ZOU - Zambian Open University
1
PART I 1. INTRODUCTION: CONTEXT OF EDUCATION PROVISION
In order to appreciate the current scenario regarding education provision in Zambia, one needs to be acquainted with the country’s macro indicators pertaining to education and how these affect or would affect its delivery. The key ones of these are highlighted below:
1.1 Socio-Political
Zambia is a sovereign Republic. The country got its independence in 1964 and stayed as a multi-party democracy until 1972 (First Republic) when it became a One-party State (Second Republic) that lasted up to 1990. Under the Third Republic (1991 – to present), Zambia reverted to a multi-party system of democratic governance. The country has an area of 752,614 square kilometres in extent and a total population of 10.3 million as by the 2000 Census (CSO). The majority of the population (60%) live in the rural areas while the rest (40%) live in the urban areas. This makes Zambia one of the most urbanised countries in Sub-Saharan Africa.
The population is unevenly skewed with children in the age range of 0-14 making up 45% and women 50.7% of the total population. The under-five mortality rate in 2000 was estimated at 202 out of 1000 live births while recent data show that approximately 60% of the children in Zambia are malnourished. Also, the HIV/AIDS pandemic has dealt a severe blow on the population. According to the National Aids Council Report, it is estimated that 20% of the population in their productive years i.e. those between the ages of 15 and 49 is infected, 35% of these are in urban areas. (NAC Strategic Plan, 2002-2005).
Since the mid 1990s, poverty levels continued to increase for the most part. Official figures indicate a rise from 69.2% in 1996 to 72.9% in 1998 with only a modest drop to 67% by 2004. It is estimated that to-day, over 80% of Zambians live below the poverty datum line of one US dollar a day. Additionally, life expectancy by 2000 was estimated to have dropped to below 40 years compared with 54 years at the end of the 1980s.
1.2 Economy
The Zambian economy is expected to significantly improve in the future. This will however depend on its diversification, exploitation of the existing resources and the development of sound and sustainable economic policies. The government has, since 1991 forged ahead with the privatisation scheme, which if fully and effectively achieved should bring prospects for further growth. However, in spite of this, the socio-economic situation has somewhat continued to deteriorate in the last decades. This has been due to several factors including financial constraints due to poor economic growth, servicing of the external debt, high population growth, and the impact of HIV/AIDS pandemic on the economy.
2
Although copper production, Zambia’s principal export commodity is steadily picking up as at 2004, low international prices and demand for it have hardly improved over the years. Focus on agriculture is showing signs of yielding positive results except for the unfavourable climatic conditions that have, from time to time, continued to negatively affect local production of staple foods.
A major external factor that has affected the Zambian government expenditure is the external debt. In 2004 the debt was USD 7.2 bn with the debt-service ratio at approximately 20% of the gross domestic product. The servicing of the debt and other fixed costs has brought the total statutory expenditures to over 40% of the budget, which has limited the government’s capacity to increase funding to other sectors. In addition, the Kwacha has continued to depreciate against the USD in the last years and the government has remained dependent on the international development agencies, with 39.6% of the present budget externally financed. In 2001, Zambia begun to receive debt relief under the Highly Indebted Poor Countries (HIPC) initiative. This represented 6% of the total approved budget. Under this initiative the budget allocations that were going towards debt servicing were shifted to the social sectors, i.e. education and health. As at 2003, total public expenditure to education stood at 20% (recurrent) with nothing going to capital projects. The country’s Gross Domestic Product (GDP) generally performed well in 2004 with a positive growth rate of around 4.5 per cent. This rise was largely attributed to growth in agriculture, mining and tourism (Ministry of Finance and Economic Planning, 2004). In as far as disbursements to education (sub-sector by sub-sector) are concerned, Zambia’s expenditure (as at 2003 and as a % of GDP) was as follows: Pre-primary 0, Primary 1.9, Secondary 0.4, University 0.4, other tertiary colleges 0.2, Distance Education 0.01 and Administration 0.2, (Ministry of Education Data Base, 2004).
1.3 Structure of Education System
Zambia’s formal education system consists of academic learning at the primary, secondary and tertiary levels. The system is in transition, being moved from a 7-5-4 structure (seven years of primary, five of secondary and four years of university education) to a 9-3-4 structure (nine years of basic, three years of high school and four years of university education up to first degree). The figure below gives an illustration of the new structure:

3
Age Ed. Yr Type of schooling Others 30 24 29 23 28 22 27 21 26 20 25 19 24 18 23 17 22 16 21 15 20 14
Various Training Programmes
19 13
University Education
(Doctorate,
Masters And
Bachelors Degrees)
18 12 17 11 16 10
HIGH SCHOOL (Grade 10-12)
Various Vocational Training Prog.
15 9 14 8
UPPER BASIC (Grade 8-9)
13 7 12 6
MIDDLE BASIC (Grade 5-7)
11 5 10 4 9 3 8 2 7 1
B
A
S I
C
LOWER BASIC (Grade 1-4)
C O N T I N U I N G E D U C A T I O N A N D L I T E R A C Y
6 5 4 3
PRE-SCHOOL EDUCATION
Figure 11: Education Structure in Zambia
1.4 Education Delivery and Institutional Arrangements
As can be seen from figure 1 above, the current structure starts from pre-school education which concerns children from 3-6 years of age. The Ministry of Education is responsible for pre-school, basic (lower, middle and upper basic), high school and university education. It also runs some continuing education institutions which combine academic learning with basic skills training such as tailoring, domestic science, basketry etc. The various vocational training programmes offered to learners after attaining grade 9 are a
1 In the context of EFA, the lower and upper age limits of learners start from 0 years (Early Childhood Education) to beyond 30 years (life long learning ). Therefore, the lower and upper limits of 3 and 30 year age limits as reflected under the current system are not EFA friendly.
4
responsibility of the Ministry of Sport, Youth and Child Development whereas those offered after attainment of Grade 12 are principally under the custody of the Ministry of Science, Technology and Vocational Training. However, both these Ministries offer certain courses for which recruitment is open to either Grade 9 or 12 school leavers. The public institution that is responsible for literacy education is the Ministry of Community Development and Social Services. It also offers some basic skills training programmes as does the Ministry of Sport, Youth and Child Development. It is clear, as can be seen in figure 1 above that the education structure in Zambia does not include the entire spectrum of early childhood learning (from 0-6 years) as it only concerns itself with pre-schooling for children aged 3 to 6 years. Although, however it is the Ministry of Education that is responsible for pre-schools, it is in fact the Ministry of Local Government and Housing (through Local Councils) that keeps records of this level of education provision. This is so because they are the ones who are responsible for their registration under the Day Nurseries Act of 1967. In addition to the line Ministries concerned with education provision are many other key stakeholders from the donor community, the civil society notably NGOs, Faith-Based organisations and the private sector. Coordination of all these players poses some serious challenges especially in the areas of policy formulation and implementation, curriculum, standards and monitoring, information sharing and financing of education.
2. THE EFA VISION, GOALS AND OBJECTIVES
Globally, EFA vision is derived from the Universal Declaration of Human Rights (1948) which states that ‘everyone has the right to education.’ Based on this premise, the World Conference on Education for All in Jomtien, Thailand (1990), adopted two texts i.e. the World Declaration on Education for All and the Framework for Action to Meet Basic Learning Needs. After several decades of studying human survival, growth and development, the international community finally agreed that ‘if the capacity of people to shape and improve their own lives is the measure of development, then basic education for all is surely a necessary condition.’
Basic education, in the context of EFA is not conceived to refer only to the basic knowledge, values, attitudes or life skills as offered in formal schooling situations, but also to basic acquisitions and skills that are dispensed in the diversity of non-formal environments. Therefore, the concept and practice of Basic Education refer to providing basic learning/training opportunities for all the people of the world; taking into account their rights, needs, talents etc., as human beings. Hence, the aim of EFA is to afford every learner (child, youth, adult, man and woman) the chance to access the necessary basic knowledge, values and skills for their own qualitative survival, growth and development.
At the World Education Forum, held in Dakar in April 2000, the aim of EFA was reaffirmed and operationalised as six major goals; two of which (2 and 5 below) were also

5
adopted in the same year as constituting the Millennium Development Goals. These goals are:
1. expanding and improving comprehensive early childhood care and education,
especially for the most vulnerable and disadvantaged children; 2. ensuring that by 2015 all children, particularly girls, children in difficult
circumstances and those belonging to ethnic minorities, have access to and complete free and compulsory primary education of good quality;
3. ensuring that the learning needs of all young people and adults are met through equitable access to appropriate learning and life skills programmes;
4. achieving a 50% improvement in levels of adult literacy by 2015, especially for women, and equitable access to basic and continuing education for all adults;
5. eliminating gender disparities in primary and secondary education by 2005, and achieving gender equality in education by 2015, with a focus on ensuring girls’ full and equal access to and achievement in basic education of good quality;
6. improving all aspects of the quality of education and ensuring excellence of all so that recognized and measurable learning outcomes are achieved by all, especially in literacy, numeracy and essential life skills, (World Education Forum, Dakar, Senegal, 26-28 April 2000).
It was agreed further, at the same Forum that all parties should be accountable for their record in meeting the commitments they had made to EFA. Whereas the national governments vowed to dedicate themselves to achieving the EFA goals, the international agencies ‘pledged that no country thus committed would be prevented from achieving them by a lack of resources (EFA Global Monitoring Report, 2002). It is for the purpose of following up on practical commitment by governments to EFA goals that eighteen indicators (objectives) were operationalised as shown in appendix 1. By 2002 however, the EFA Global Monitoring Report indicated that many countries, Zambia included, were still far off the mark of achieving EFA goals by 2015.
3. EDUCATION FOR ALL: POLICY CONTEXT FOR PROGRAMME
IMPLEMENTATION 3.1 Overview
Programme implementation for the Education for All sub-sector, is to be guided by the goals of education (1996) as spelt out in the National Policy on Education (Educating our Future, Pages 5-6) which reads as follows: “a) producing a learner capable of
(i) being animated by a personally held set of civic, moral and spiritual values;
(ii) developing an analytical, innovative, creative and constructive mind;
6
(iii) appreciating the relationship between scientific thought, action and technology on the one hand, and sustenance of the quality of life on the other;
(iv) demonstrating free expression of one’s own ideas and exercising tolerance for other people’s views;
(v) cherishing and safeguarding individual liberties and human rights; (vi) appreciating in the preservation of the ecosystems in one’s
immediate and distant environments; (vii) participation in the preservation of the ecosystems in one’s
immediate and distant environments; (viii) maintaining and observing discipline and hard work as the
cornerstones of personal and national development.
b) increasing access to education and life skills training c) building capacity for the provision of quality education d) creating conditions for effective coordination of policies, plans and
programmes e) rationalizing resource mobilization and utilization.”
The document further adds: ‘These goals will inform the education policies and practices of all partners in education provision and they will also be the basis for teaching and learning in schools and colleges.’ Although the National Policy on Education (1996), cites only five critical goals in the country’s education provision, it should be noted that there are up to eight quality elements involving the learner who, as everyone knows, is the most important product of any educational enterprise. In order to produce the kind of learner as espoused in the Policy, one would have to place curriculum relevance in the centre of any learning, teaching or training activity. This Framework will therefore, and for that reason and purpose be guided by, among other benchmarks, learner quality through curriculum conceptualisation.
3.2 Centrality of Curriculum Quality in the Provision of Education for All Curriculum quality, in the context of this Framework refers to the knowledge, values/attitudes and skill types acquired, and the extent to which the mix contributes to building an all-round learner as espoused in the National Policy on Education (ibid.). The foregoing definition requires that the starting point for true educational reform cannot be about increasing or decreasing the number of subjects learnt, interchanging these or substituting them with others, or even merely moving away from the straight-jacket culture of subjects to the more encompassing concept of learning areas. Also, curriculum quality is not about making improvements (however important these may be) in pupil-
7
teacher contact time, pupil-book or pupil-teacher ratios or even how much teaching should be done of the knowledge based learning (theory), practical skills or values to be inculcated. Rather, the starting point for curriculum re-conceptualisation should be the purpose of educating itself i.e. learning for what?, as opposed to the reason (s) for going to school or why learn? The latter would refer to such reasons for engaging in a learning activity as:- being a proud holder of a degree qualification, securing better employment opportunities, being more competitive and earning more money or simply for the sake of ‘knowledge is better than ignorance.’ The truth however is that, as we all know, there are forms of knowledge, skills and attitudes that one may acquire at great cost but which could only be nearly as good as ignorance itself! 3.2.1. Purpose of Education as Philosophy of Education
In their analysis of the purpose of education, the International Commission on Education for the 21st Century (UNESCO, 1996) identified four pillars of learning as follows: 1. Learning to know i.e. continually acquiring the instruments of understanding
and being able to recognise challenges; 2. Learning to do and acting with determination; 3. Learning to live together and being party to collective responsibility and
engaging in constructive partnerships and; 4. Learning to be i.e. respecting the individuality of human dignity.
However, due to the nature of the Zambian culture and what it expects, especially of a young learner in terms of behaviour, actions and intellectual operations, a fifth pillar has been included as follows: 5. Learning to become or promoting the personality of human creativity.
The foregoing five pillars of education provision have huge implications on curriculum and educational programming, notably for EFA.
Thus far, the Zambian education system has, to varying degrees of success, provided for the first four pillars of learning while (most probably for cultural reasons) less ambitiously exploited the last but not the least of these key principles of education as highlighted below.
3.2.2. Schooling and Society: The Missing Link
In order for education to make a positive impact on society, the knowledge, skills and attitudes acquired in school must have applications that are beneficial (within that society) to both the collective and the individuals involved. It should be stated at this point however, that since independence in 1964, the relationship between school acquisitions and societal expectations has essentially been through formal employment. But given the wide-spread unemployment in the country, more and more citizens have had a feeling that education is failing the nation. Yet, little is said about

8
the fact that society could itself have been failing to make meaningful applications of school knowledge to real life situations.
When schools or training institutions teach and ensure that learners, through participatory methodology, acquire the skills of decision-making and problem-solving, creative and critical thinking (as opposed to criticism), self-awareness and empathy etc., the latter soon learn that the said skills are hardly welcome in their society. The adult world, notably the men continue to make all important decisions while regarding critical thinking of the younger members of society as a form of insolence, creativity as belittling and questioning the wisdom of the old folk; let alone accosting the realm of madness. In this way, conforming to the old world order becomes the norm, refusal to change an honour and denial of the personality of human creativity, the pride of Africa.
In as far as individual differences, abilities and accomplishments are concerned, teachers often do their best to ensure that their teaching is answerable to the aptitude, interest and motivation of individual learners and to the latter’s socio-economic and environmental challenges and opportunities. As the learners get back to their communities however, they discover that society is hardly prepared to accept an individual’s success story, outstanding performance or achievement unless the same have to do with non economic benefits and are about imitation or reproduction of the existing order of things. They also become aware that the real worth of an individual is in exhibiting conformity to the existing social norms of the collective rather than in free expression of one’s thought opinion and feelings. This phenomenon has significantly contributed to failure to define the relationship between societal and individual wealth and worth; thereby unnecessarily heightening tension between them. Property grabbing, as practised across the country is a good illustration of the extent to which expression of individuality has been stifled and cultural familism glorified.
When an average Zambian high school or college student is asked to say what national (as opposed to personal) wealth is, answers are known to range between confusion and ‘I don’t know’. In the same vein, the concept of national wealth being defined as the sum total of that which individuals own and which, through various investment incentives, tax regimes, employment creation and donations ends up benefiting the majority of the poor in the long run, is perceived as unacceptable except for non citizens. Otherwise, the local context sees national wealth as that which must belong to nobody for everybody’s use’. Like wise, the income of a working relation is perceived as income for every member of the extended family.
The foregoing strongly suggests that expressions of individuality in thought, feelings, property ownership and creativity are hardly recognised and valued as part of societal treasure. Instead, those who achieve individual excellence of one form or the other (especially in economic performance) become objects of ridicule, jealousy and envy (including within the same family) unless they are able, as a result of their success , to offer free services to all’ in preparation, (eventually) for their own economic down fall.
9
Experience from many a Third World country shows that when the outputs and outcomes of education do not tally with societal expectations, the first person to be blamed is the teacher and the first structure, the education system. Yet, real responsibility lies with society itself as outlined above and as will be illustrated below.
When human beings act in the way they do, it is not because they possess the ‘schooled hands’ but because they hold on to a conceptual framework or a world view (also referred to as mentality or mind set) and embrace an attitude, values or ethics that commit the hands to the intended action. This implies that the sources and forms of knowledge, values and skills to which a learner may be subjected for his/her own survival and development cannot be products of schooling alone but also and most importantly, of society at large. In many cases, the school may even be powerless to impart and enforce forms of knowledge, values and skills perceived as peripheral or unacceptable in the wider society. For instance, a teacher’s attempt to inculcate a culture of entrepreneurship through respect for scientific/technological attitude of meticulous observation and recording of phenomena, record keeping and use, critical review of one’s accomplishments and failures etc., may not easily change many a learner’s world view which has it that magical or witchcraft powers are largely responsible for any observable changes in one’s health and economic success. In addition to the foregoing, one would further note that, it will not be easy for a teacher to explain to the learners that employment is as much to mere survival as self employment, trade (offering the goods and services one sources, possesses or manufactures out of one’s savings) and investment are to human development. This would be so because self-employment and trade are, among many a Zambian perceived as appropriate for the unfortunate jobless persons while investment is seen as an exclusive club for the rich non citizens. In addition, it is not easy for the teacher to convince his/her learners that team work is as rewarding as individual achievements in school while the real life situations in society are, to a large extent, indifferent to role-modelling, biographical inspiration and promotion of value-added productivity in business, science, technology etc. In any case, basic education, like socialisation is still largely seen as a custodian of integration of the child into society rather than one of contribution to achieving positive change within that society.
3.2.3. Educating Society Versus Schooling
Thus far, it has been demonstrated that when the fundamental purposes of education are not clear, lost or confused, the outcomes of education (desired knowledge, skills, positive attitudes and values that a learner is expected to demonstrate by society) also get lost notably in the maze of a culture of blame. Additionally, this affects, not only curriculum quality but also other inputs such as teacher preparation, textbooks, teaching and assessment methods as well as the key output or product of education itself i.e. the learner. Arising out of the confusion is the emphasis, in education and training, on programme designs in which teacher/instructor supply and demand, pupil access, participation and output take precedence over strategy -driven systems of performance. This means that, in teacher preparation for instance, either hundreds upon hundreds of teachers may be trained to teach subjects ranging from history
10
through civics to Science and Mathematics (supply-based approach) or little training may be going on except for those areas where there is evident demand for expertise in a given learning area (demand-driven approach). Yet, there would be no country-driven strategy to prepare a given number of teachers to serve as a critical mass for attaining (an) identified national objective (s) in a given-learning area (s) such as business, science, technology and general entrepreneurship. It should further be pointed out at this point, that in societies where reading and writing skills are still a preserve of a few and where schooling is perceived as the education and where socialisation is seen as fulfilling a different purpose from that of both schooling and education, there is a general understanding that learning is for those who go to school notably from grade 1 to high school. Other forms of education such as early childhood learning, adult literacy and acquisition of general skills are perceived as of incidental occurrence and taken to be literally informal or non formal. The starting point for Education for All, in view of the foregoing and in the context of this Framework, is that everyone, including the most learned must continue to learn in order to understand, appreciate and recognise new challenges in a constantly changing world. Only in this way can every citizen be expected to act more intelligibly and with determination, work with others to contribute to the welfare and development of the self and the collective; while at the same time, respecting their individuality as well as promoting the personality of human creativity for the benefit of all peoples of the world. In fact, it is when a nation gears itself to creating a learning environment for all its peoples that the school systems begin to reflect the real wishes and aspirations of the citizens who will then be in a better position to demand for certain things to happen within the school system. This is so because the aspirations and the demands of schooling and socialisation can only be harmonised through education of the entire society. Therefore, the success of Basic Education for All, which is the focus of this Framework, will only be achieved in the context of a culture of life-long learning for all; a culture in which national will should be closely knit with an obligation to making learn, for life for all. Basic learning for all, as highlighted in this Framework will therefore seek to create an environment in which emphasis on schooling will be fundamentally shifted to provision of Education for All; the key strategic inputs, processes and outcomes of which are as follows: 1. Promotion of an educational culture in which creativity, critical analysis and
discernment of truth from falsehood are an integral part of general knowledge, values and skills acquisition;
2. Re-conceptualisation of curriculum in schools, teacher training institutions, and other learning centres in such a way that it empowers the learners to know, to be skilled and to implement sustainable decisions with determination, commitment and confidence; a curriculum that equips the learners with skills to deal with issues related to their environment, their health and that of society;
3. Strengthening of assessment systems and taking into account project-oriented assignments (to promote research, scientific observation, experimentation and
11
investigative learning) as opposed to rote learning, memorisation and reproduction of stale knowledge in an examination;
4. Design of educational governance systems and programmes that are linked and coordinated beyond promotion of integrated knowledge, skills acquisition and value inculcation, to include deliberate talent development initiatives for and among individual learners;
5. Emphasis on the methods, procedures and steps that culminate in the realisation of a final product. This is intended to keep the learners off the mentality, attitude and actions that lead to mere admiration and acquisition of the finished products of magical and technological dependency;
6. Breaking the culture of poverty that has mainly been facilitated by unbridled jealousy (in so far as personal (economic) achievements are concerned) through inculcation of values in which one person’s success must be seen and supported as everyone else’s success;
7. Promotion of not only reading and numeracy but also writing, to cultivate among learners the culture of record keeping, information storage, institutional memory as well as good governance and civic and social responsibility;
8. Investment in education for economic empowerment of the citizenry; education that places emphasis on the achieving individual, an achieving society and on the value-added accomplishments of the human kind. This should help, in the long run, to stamp out the mental docility of raw material production, of just ‘having money’ instead of making it through genuine profit, and of directing investments in pleasurable skills of the dancing cultures instead of in the marketable skills of the technological age;
9. Distinguish welfare and survival activities that promote consumption and dependency from development undertakings which enable one to access economic opportunities of productivity;
10. Refusal to treat poverty, hunger and disease as if they were independent variables or causes of underdevelopment but as symptoms of something that should have been done but did not happen;
11. Respect for the rigour, transparency and accountability of the scientific method, hard work, commitment and perseverance of spiritual well-being and rejection of the inconsistencies of magic and witchcraft; as a mentality and as a practice;
12. Acceptance of the fact that, from an educational viewpoint the major cause of underdevelopment is failure to change one’s world view, beliefs, thought, feelings and the manner of doing things - in spite of the new circumstances, knowledge and information placed at one’s disposal.
The foregoing EFA Philosophy gives credence to the MDGs and provides a more sustainable instrument for fighting against the ravages of hunger, disease and general poverty.
3.3 Perspectives in Programme Implementation
In as far as the historical perspective for provision of EFA is concerned Zambia (one year after the 1990 Leaders’ World Summit in Jomtien Thailand) organised a National
12
Conference on Education for All (1991). In 1992, a new national policy titled Focus on Learning was born. The new policy concerned itself mainly with the provision of primary education from grades 1-7. The advent of Focus on Learning as new blue print for education provision meant that the structure of the education system would continue to be 7-5-4 i.e. seven years of primary, five of secondary and four years of tertiary/university education. By that time however, there had been a national outcry to the effect that need had arisen to keep children longer in school. This was in order for them to gain more knowledge and skills to better cope with life after school, notably for the children who failed to proceed to secondary level. Therefore, the National Policy on Education of 1996 opted for a new structure of education (which had earlier been adopted in the 1977 Educational Reform) of 9-3-4 as illustrated under 1.3 above. In the meantime, the country had since produced and approved its first National Programme of Action (NPA) on children (1994). The Plan concerned itself with growth, education and development of children and provided a focus for specific actions to improve the living conditions of the latter. The programmes of economic recovery and social mobilisation that were articulated and which directly addressed the needs of the country’s children as at 1994 were: maternal and child health, basic education, food security and nutrition, water and sanitation and family welfare. The holistic approach adopted in the NPA had also been influenced by the declaration of 1992 as ‘The Year of the Zambian Child. It should be noted that the Plan appropriately reflected what later came to be known as the Poverty Reduction Strategy Paper (PRSP) (2002-2004) which was itself guided by the Millennium Development Goals (MDGs) alluded to above. The goals of which are: 1. Eradicate extreme poverty and hunger; 2. Achieve universal primary education; 3. Promote gender equality and women empowerment; 4. Reduce child mortality; 5. Improve maternal health; 6. Combat HIV/AIDS, malaria and other diseases; 7. Ensure environmental sustainability; and, 8. Develop a global partnership for development.
In the context of the expanded vision of Basic Education, the NPA (Ibid) focussed on only three (of the four EFA target areas i.e. early childhood, primary and literacy education) for which three major national goals were articulated as follows:
1. Expansion of Early Childhood Care, Development and Education activities, for
children under seven with emphasis on community-based interaction; 2. Provision of universal access to the complete primary education cycle by the year
2000. 3. Reduction of the adult illiteracy rate from 25 per cent in 1990 to 12 per cent by the
year 2000, with female illiteracy no higher than that among males.
13
Although NPA did not have a programme targeted at basic skills acquisition, which is the fourth EFA target area, reference was made to it through literacy education; the supporting goal of which reads:
4. Training provision to be expanded in essential skills required by youth and adults.
(NPA, August 1994, Page 54).
In as far as design and implementation of programmes in the context of NPA are concerned, only goal two, and to some extent four above were later taken on board. However, it is worth noting that many of the initiatives that the country implemented in the mid nineties, especially in matters of child welfare and primary health care were a product of the NPA. The second major attempt to implement the expanded vision of EFA was in 1996 when the first Education Sector policy framework (Investing in Our People) was published under the Integrated Education Sector Investment Programme (ESIP). Thus, ESIP was concerned with the entire sector i.e. with all the three major dimensions of education – formal, non-formal and informal. Among its priority objectives were to:
(a) enhance cooperation and collaboration among the various partners in education provision (government ministries, NGOs, Faith Based Organisations and private providers);
(b) promote rational and coordinated use of resources allocated to the education sector;
(c) improve quality in the delivery of education and training; (d) put in place institutional and legal frameworks for coordinating EFA
(expanded vision) initiatives; (e) increase access to formal and non-formal education and skills training
through:
(i) expanding opportunities for the access of all children to basic education; (ii) expansion of the range, scope and provision of skills training opportunities
for youths; and effecting a substantial reduction in the rates of adult illiteracy (ESIP Policy Framework, May 1996).
It should be noted that unlike in the NPA (1994), the ESIP policy framework (1996) did not include, as a priority the provision of Early Childhood Care, Development and Education.
3.4 Basic Education Sub-Sector Investment Programme (BESSIP)
In 1999 the Ministry of Education together with international development agencies embarked on the Basic Education Sub-Sector Investment Programme (BESSIP) to address the needs of grades 1 – 7. The programme covered the years from 1999 – 2002. The two main goals of BESSIP were to increase enrolment levels and improve the quality

14
of education. In order to achieve these goals, nine components were established, namely: Overall Management; Infrastructure; Teacher Development, Deployment and Compensation; Educational Materials; Equity and Gender; School Health and Nutrition; Basic School Curriculum; Capacity Building and Decentralisation; and HIV/AIDS.
By the time BESSIP wound up in 2002, its full impact could not be ascertained. However, some notable targets had been achieved. The gross and net enrolment rates had surpassed the number of classrooms and teachers’ houses had been constructed and rehabilitated. Additionally, teacher output had increased significantly as had done educational materials. Also, key issues concerning school attendance by the girl child, HIV/AIDS and school health and nutrition had been successfully incorporated into the BESSIP programme. Access to free primary education (grades 1-7) was declared in 2002 as a consequence of PRSP implementation. However, the move was not accompanied by any new legal framework or financing commitment to sustain the new policy - notwithstanding the fact that bursaries for basic clothing & school requisites had been introduced for the vulnerable children.
3.5 Technical Education Sub-Sector Investment Programme (TESSIP)
The government, through the Ministry of Science, Technology and Vocational Training implemented the TESSIP (2003-2005) under the supervision of the Technical Education, Vocational and Entrepreneurship Training Authority (TEVETA). The programme was born out of the realisation that there was a mismatch between the skills acquired by grade 12 school leavers and those demanded by the workplace – particularly in so far as quality and curriculum relevance were concerned. Therefore, the country’s TEVET reforms (2002-2007) are essentially to do with vocational training and is based on the need to develop a demand-driven national training system.
It can be argued, in view of the foregoing that training in essential skills that are associated with basic education from grades 1-9 had not been implemented (as a new programme) by 2004. In the meantime, provision and expansion of Early Childhood Care, Development and Education and Literacy Education remained uncoordinated and un-quantified by end of the year. It is of no wonder that the 2003/4 EFA Monitoring Report identified Zambia as one of the countries that were seriously off-track in the implementation of EFA initiatives – despite the effort shown since 1994.
3.6 Programme Implementation Strategies
The current national policy on education, (Educating Our Future, (1996) recognises the primacy of integral development (in the education of the child, teacher and society at large) of values inherent in physical, emotional, rational, aesthetic, ethical and spiritual well being for all. Further, the policy notes unreservedly, that in a pluralist and democratic society there can be no single institution/organisation capable of delivering educational services efficiently and effectively, at all levels without collaborative effort among key stakeholders. The policy and strategic frameworks earlier alluded to above notably in the design of the NPA (1994) and the ESIP (1996) testify to that fact.
15
Additionally, data collected from the field in the context of this report also show practically, the extent to which some of the major providers of educational services are not public but private and voluntary institutions.
Although the philosophy of education and the policy context for education/training provision are articulated on the basis of EFA fundamentals as highlighted under NPA and ESIP, the actual implementation strategies and programmes were later designed to operate on a sector by sector basis as shown in the design and implementation of BESSIP 1999-2002, TESSIP (2003-2005) and the Education Sector Strategic Plan (2003-2007).
3.7 Early Childhood Care, Development and Education (ECCDE)
In as far as ECCDE was concerned, the Ministry of Education, took the position that ‘the provision and funding of ECCDE and pre-school education would be the responsibility of councils, local communities, Non-Governmental Organisations, private individuals and families’ (National Policy on Education, ‘Educating Our Future’ 1996, Page 7). However, the Ministry’s role has to-date remained that of encouraging and facilitating the putting in place of pre-school programmes and training of teachers for the sub-sector. In a number of studies and reviews carried out in 2004, the most recurring challenges facing ECCDE were cited as follows:
(a) lack of common curriculum; (b) absence of set standards; (c) lack of clear ECCDE policy; (d) lack of monitoring and supervision; (e) inadequate training/trained human resources for ECCDE; (f) lack of mechanism for coordinating and collaboration among ECCDE
providers and stakeholders; (g) lack of responsible authority for moving ECCDE forward; (h) greater emphasis placed on pre-school and not on the other lower levels of
ECCDE and; (i) poor buildings and teaching materials for ECCDE.
3.8 Basic Education
It is generally agreed that in spite of the many challenges that the Ministry of Education is faced with in the provision of basic education; its policy to increase access to basic education; improve quality and (for equity reasons) promote girls education, it is on course to achieve UPE by 2015. Not only was free education from grade 1-7 declared in 2002, but there is also in place an education Sector Strategic Plan (2003-2007). These efforts are a follow-up to a fairly successful BESSIP initiative that the country implemented with the assistance of cooperating partners in 1999 and wound up in 2002. There are still a number of strategic challenges for this level of education and which the Ministry of Education will need to deal with notably:
16
(a) high teacher attrition, demotivation and other related issues; (b) lack of textbooks, equipment and laboratory infrastructure; (c) problems in information sharing and its flow within the system and among
stakeholders; (d) poor quality of learning, fewer classroom places and learning hours; (e) dependency on external financing; (f) insufficient monitoring and evaluation to set and implement standards of
curriculum, its quality and relevance etc. (g) low participation and completion rates especially among girls.
3.9 Literacy Education
Currently, government policy on literacy education is closely linked to poverty reduction, disease control and elimination of hunger. As such, attempts have been made to align functional literacy programmes with those on health, agriculture, environmental management, gender and HIV/AIDS (MCDSS Report, 2004). The obvious and expected link between literacy, non-formal education and skills training has thus been effectively established – at least conceptually. The Ministry of Community Development and Social Services is responsible for literacy education. In order to build capacity to disseminate the policy and coordinate its implementation, the Ministry has since been restructured in line with the Public Service Reform Programme (PSRP) of 1993. In the meantime, establishment of the National Literacy Council has been proposed to advise government on policy matters relating to literacy education. Some of the major challenges that literacy education still faces to-date are:
(a) low investment in literacy programmes; (b) current programmes hardly involve members of society with various
impairments; (c) lack of programme monitoring and evaluation to determine desired effect in
terms of contribution to human resource development; (d) shortage of literacy officers; (e) long distances to learning centres; (f) absence of appropriate policy and institutional arrangements to coordinate
effort and guide curriculum options among stakeholders. (g) lack of community sensitisation.
3.10 Basic Skills Education
In Zambia today, there are a number of policies governing basic skills provision in Zambia today but there is yet to be a comprehensive policy on basic skills education. At vocational and technical education level, the country’s TEVET system, through its Development Programme (2002-2007) is mainly targeted at post secondary entrants. Its

17
aim is to develop a TEVET system that will improve the skills for both the formal and informal sectors of the economy through creation of:
(a) a high quality training system; (b) a sustainable training system; (c) an equitable training system; (d) a demand-driven training system.
TEVET’s strategic and implementation components are: Organisation and Management of TEVET; Training Systems, Trade Testing and Examinations; Entrepreneurship Development and Informal Sector Training; Human Resource Development; Information Management Systems; Infrastructure and Equipment; Cross-cutting Issues; TEVET Financing System and Management of TEVET Development Programme. TEVET’s current institutional arrangement is that MSTVT is responsible for policy, TEVETA for regulation of training standards and provision of support services, Government and the NGOs for ownership and governance of their own institutions and colleges.
Skills training at a lower and more general level, is the responsibility of the Ministry of Sport, Youth and Child Development. Since 1980, the Ministry undertook to develop skills training and construct or convert old structures originally meant to serve the Zambia National Service cadre into youth training centres for out-of-school youths throughout the country. The target beneficiaries were to be street kids and post primary school dropouts. On its part, the Ministry of Education established Schools for Continuing Education that offered both formal education courses and basic skills programmes for early school leavers (drop-outs) and adults who had not managed to attain secondary education.
Since the country’s liberalised economic and political environment in 1991, many other NGOs, FBOs, voluntary agencies and private providers of a variety of basic skills have come on the scene. However, due to wide spread unemployment in the country, all the players have tended to recruit grade 12 school leavers to their skills programmes other than take primary or basic school level drop-outs. Also, due to absence of a comprehensive skills education policy framework, the majority of players in the field tend to perceive skills not as part of education for human development but as that which one acquires (after receiving formal education) only for the purpose of earning one’s livelihood. The country’s 1994 campaign to rid the city streets of children who inhabit them (as was the case in the 1980s), and placing them in skills training centres, is indicative of who is perceived as destined for skills acquisition rather than for formal education in the country.
The foregoing suggests that some of the major challenges in basic skills acquisition and programming are and have been as follows:
(a) basic skills education is rooted in the utilitarian philosophy of livelihoods, survival
and existence rather than in the education of an all-rounded and holistic human growth and development of the mind, heart and hand;
18
(b) lack of a comprehensive, purpose and strategy-driven skills-education policy that would challenge the adhocism of the demand-driven models and effectively face the current challenges of:
(i) lack of a standard curriculum and of standard training materials; (ii) uncoordinated basic skills education;
(c) basic skills education still regarded as inferior to formal mastery and reproduction of
‘school’ knowledge. (d) Basic skills education largely understood to refer to practical acquisitions (in the use
of one’s hands to work and produce for survival) and not linked to talent-given skills that need to be systematically guided and developed by the education system.
(e) delinkage of skills acquisition from the foundations of general knowledge and values education.
3.11 Relationship between EFA and Non EFA Sub-Sectors
In order for Zambia to meaningfully work towards attaining the EFA goals and the MDGs by the year 2015, there is need for the non EFA sub-sectors to prepare and mobilise their human, material and financial resources for the practical benefit of the EFA sub-sector. Yet, the current ‘stand alone’ stakeholder policies and strategies in education and training (except, to some extent in the implementation of BESSIP and the TEVET system) have tended to spend more time and resources on highlighting matters of advocacy and consensus building, administrative arrangements, political commitment, sector analyses, strategic considerations and other socio-economic challenges. This has often been done at the expense of coordinating and harmonising policies and curricular, providing the actual learning space and the necessary teaching and learning materials, monitoring and evaluating the teaching/learning process and, above all ensuring that standards, quality and relevance of basic education are guaranteed. The main challenges of the non-EFA sub-sector, in view of the foregoing are:
(a) absence of the culture of professional volunteerism among the citizenry who are or have acquired education/training beyond basic EFA level and who would other wise, (through their contribution) impact positively on the sub-sector;
(b) lack of capacity at high school level to absorb the large number of qualifying basic school leavers. An average of only (35%) find school places in high school every year.
(c) lack of flexible avenues for accessing alternative modes of education; and training opportunities;
(d) lack of capacity in the existing learning/training institutions to prepare the human resources in sufficient numbers, and with requisite qualifications to satisfy the needs of each of the EFA target groups;
(e) restricted budgets in the non EFA sub-sectors;
19
(f) absence of an all-embracing EFA development policy within which the non EFA sub-sector would work to contribute to the attainment of EFA and the MDGs;
(g) lack of capacity in higher institutions of learning to absorb the large number of qualifying school leavers. Less than 2,000 of these are admitted in universities out of over 20,000 eligible candidates every year.
4. PREPARATON FOR EFA DATA COLLECTION
Given the EFA goals (as shown under 2.0), the policy guidelines of the National Policy on Education (referred to on page 7 of this Framework) and the main sub-sectoral challenges highlighted under 3.0 above, a deliberate decision was taken to collect appropriate data; data which would facilitate understanding of the current EFA environment. Further, the same would ensure that the projections and costings to be made are backed by the concrete situation on the ground. Hence, the EFA Secretariat was entrusted with the responsibility of coordinating data gathering for which (the Secretariat) the key
Terms of Reference were, in the final analysis, drawn up as follows:
(a) Coordinate the process for preparation of the EFA Plan of Action; (b) Coordinate EFA meetings for the purpose of facilitating consensus building among
stakeholders; (c) Collect and analyse data; (d) Facilitate finalisation of the EFA Plan of Action (Strategic Framework).
Therefore, prior to the data collection exercise, policy makers, the Steering Committee and the Technical Writing Team members held several meetings to map out a strategy for embarking on this activity. By the end of 2003, the EFA Steering Committee and the Stakeholders’ Forum had agreed that establishment of EFA database be given priority in the Plan preparation process. Data collection instruments were therefore prepared to collect data at provincial level for Early Childhood Care, Development and Education (ECCDE), Literacy Education and Basic Skills Education. There was already sufficient information on Basic Education within the Ministry of Education. Due to the fact that much of the data available at the province were scanty and unreliable, it was decided that the same be obtained from the district level. When it became clear that the district EFA database was equally unreliable, the data collection instruments were further re-designed to collect the relevant information directly from the point of delivery institutions.
The 72 District Planning Officers of the Ministry of Education facilitated data collection from the field. They were tasked to collect information from all the institutions offering early childhood, literacy and basic skills education in their districts – without having recourse to sampling techniques. The exercise was concluded in October 2004. The data profiles pertaining to the EFA sub-sector are presented in Part II of this Framework.
20
5. SYNOPSIS OF POLICY MILESTONES AND ASSUMPTIONS
Thus far, this Framework has shown that Zambia’s vision and concerted effort to provide EFA that is accessible, equitable and of acceptable quality and relevance to the needs of the country emerged in the early 1990s when the Ministry of Education articulated the first EFA landmark targets as evidenced in the Focus on Learning (1992), the National Programme of Action (1994), the Education Sector Investment Programme (1996) and the National Policy on Education (1996) documents. In order to ensure that the country stayed on track, in so far as attainment of EFA targets are concerned, the government put in place, since 1996, various operational frameworks and interventions. Notable among these were the Basic Education Sub-sector Investment Programme (BESSIP – 1999-2003/4), the Technical Education Sub-Sector Investment Programme (TESSIP - 2003-2005) and the Education Sector Strategy (2003 – 2007).
As can be seen from the foregoing the EFA global goals and targets are not at variance with any national policies or strategic interventions. Therefore, the data collected and the enrolment and participation projections made in this Framework (using 2004 as the base year) reflect the already pronounced policy targets of the Ministry of Education, while at the same time, taking into account the policies and strategies of other sector Ministries as they relate to education provision. However, it should be noted at this point that the population figures, trends and projections used in this Framework are based on the Central Statistics Office (CSO). This was necessitated by the fact that the EFA data, collected from the field was a one time activity and therefore not sufficient to inform on some trends in the sub-sector. It is in view of the foregoing policy goals, strategic and programme parameters, and challenges associated with the EFA sub-sector that some key national milestones were identified and operationalised as targets to be attained in the context of this framework as follows:
Early Childhood Care, Development and Education
1) By 2006, government to commence offer of pre-school learning to children aged
5-6 years. 2) By 2015, 50 per cent of new grade 1 entrants to have had access to early
childhood and/or pre-school learning experience.
Basic Education
3) By 2005, achieve Universal Primary Education. 4) By 2005, achieve Gender Parity at lower and middle basic levels. 5) By 2008, achieve automatic promotion and progression for Grades 1 to 7. 6) By 2008, achieve total elimination of wastage through dropouts. 7) By 2005, no girl child should be withdrawn from school for marriage or any other
unjustified reasons.
21
8) By 2015, every child graduating from grade 7 to have access to high quality upper basic education in a fully-fledged upper basic school2 .
9) By 2005, progression rate from grade 7 to 8 should be 50%. 10) By 2015, should achieve one hundred percent transition rate from grade 7-8. To
achieve this, transition rates should be increasing by an average annual rate of five percent from 2005.
11) By 2006, carry out a review of basic school curriculum with a view to integrating basic skills (handiwork, life skills, talent development activities and civic responsibilities).
Literacy Education
12) By 2015, reduce illiteracy rate by eighty percent.
Skills Education
13) By 2015, create basic skills physical space to cater for 50% of the push- outs and foster creation of alternative opportunities for education for the out-of school youths.
Non EFA Sub-sector
14) By 2013, eliminate APU through corresponding expansion of High Schools. 15) By 2006, admission of students to teacher training colleges and universities for
high school teaching should target, as a matter of priority, teachers of maths, science and technology (design).
16) By 2007, put in place notably in teacher resource centres, and in conjunction with community libraries, structures for promoting a culture of reading and writing to make language learning a productive and creative activity; even at community level.
General
17) By 2006, undertake comprehensive review of curriculum at all levels in order to
determine its quality and relevance in meeting the aspirations of the Zambian people.
2 Fully-fledged upper basic school is a school that is to have all the basic requirements; including basic laboratories, workshops and specialised rooms and facilities.
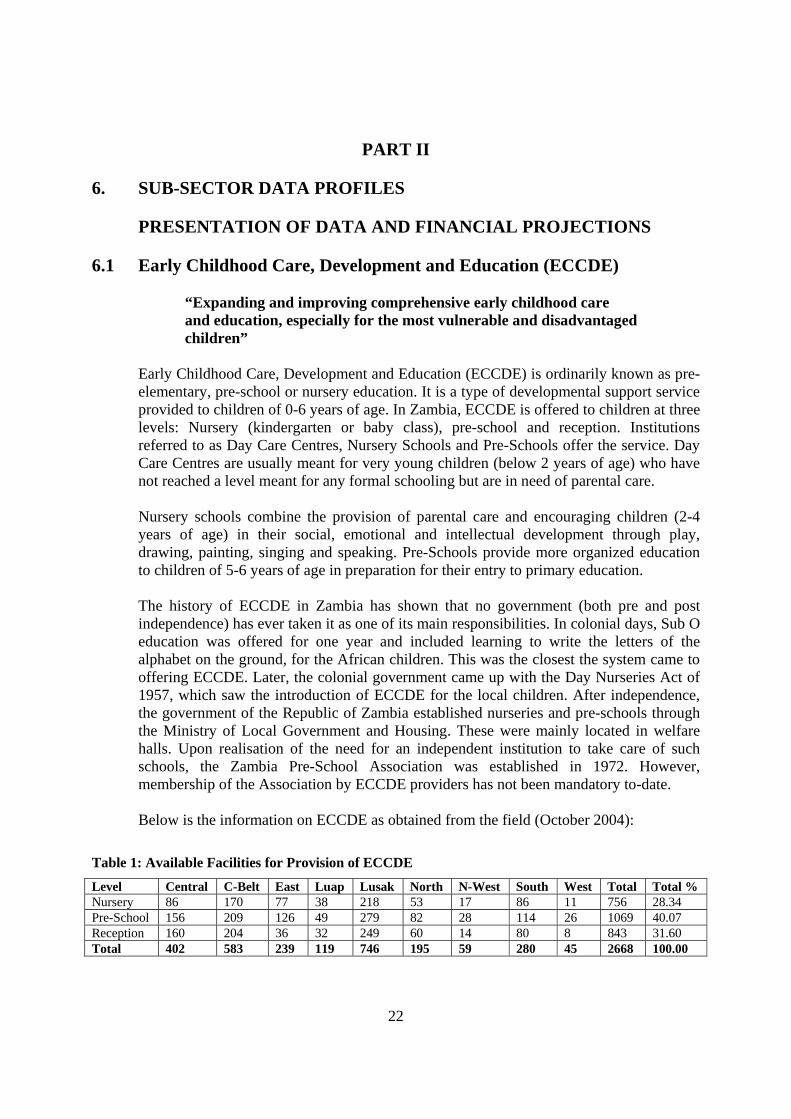
22
PART II 6. SUB-SECTOR DATA PROFILES
PRESENTATION OF DATA AND FINANCIAL PROJECTIONS 6.1 Early Childhood Care, Development and Education (ECCDE)
“Expanding and improving comprehensive early childhood care and education, especially for the most vulnerable and disadvantaged children”
Early Childhood Care, Development and Education (ECCDE) is ordinarily known as pre-elementary, pre-school or nursery education. It is a type of developmental support service provided to children of 0-6 years of age. In Zambia, ECCDE is offered to children at three levels: Nursery (kindergarten or baby class), pre-school and reception. Institutions referred to as Day Care Centres, Nursery Schools and Pre-Schools offer the service. Day Care Centres are usually meant for very young children (below 2 years of age) who have not reached a level meant for any formal schooling but are in need of parental care.
Nursery schools combine the provision of parental care and encouraging children (2-4 years of age) in their social, emotional and intellectual development through play, drawing, painting, singing and speaking. Pre-Schools provide more organized education to children of 5-6 years of age in preparation for their entry to primary education.
The history of ECCDE in Zambia has shown that no government (both pre and post independence) has ever taken it as one of its main responsibilities. In colonial days, Sub O education was offered for one year and included learning to write the letters of the alphabet on the ground, for the African children. This was the closest the system came to offering ECCDE. Later, the colonial government came up with the Day Nurseries Act of 1957, which saw the introduction of ECCDE for the local children. After independence, the government of the Republic of Zambia established nurseries and pre-schools through the Ministry of Local Government and Housing. These were mainly located in welfare halls. Upon realisation of the need for an independent institution to take care of such schools, the Zambia Pre-School Association was established in 1972. However, membership of the Association by ECCDE providers has not been mandatory to-date.
Below is the information on ECCDE as obtained from the field (October 2004):
Table 1: Available Facilities for Provision of ECCDE
Level Central C-Belt East Luap Lusak North N-West South West Total Total % Nursery 86 170 77 38 218 53 17 86 11 756 28.34 Pre-School 156 209 126 49 279 82 28 114 26 1069 40.07 Reception 160 204 36 32 249 60 14 80 8 843 31.60 Total 402 583 239 119 746 195 59 280 45 2668 100.00
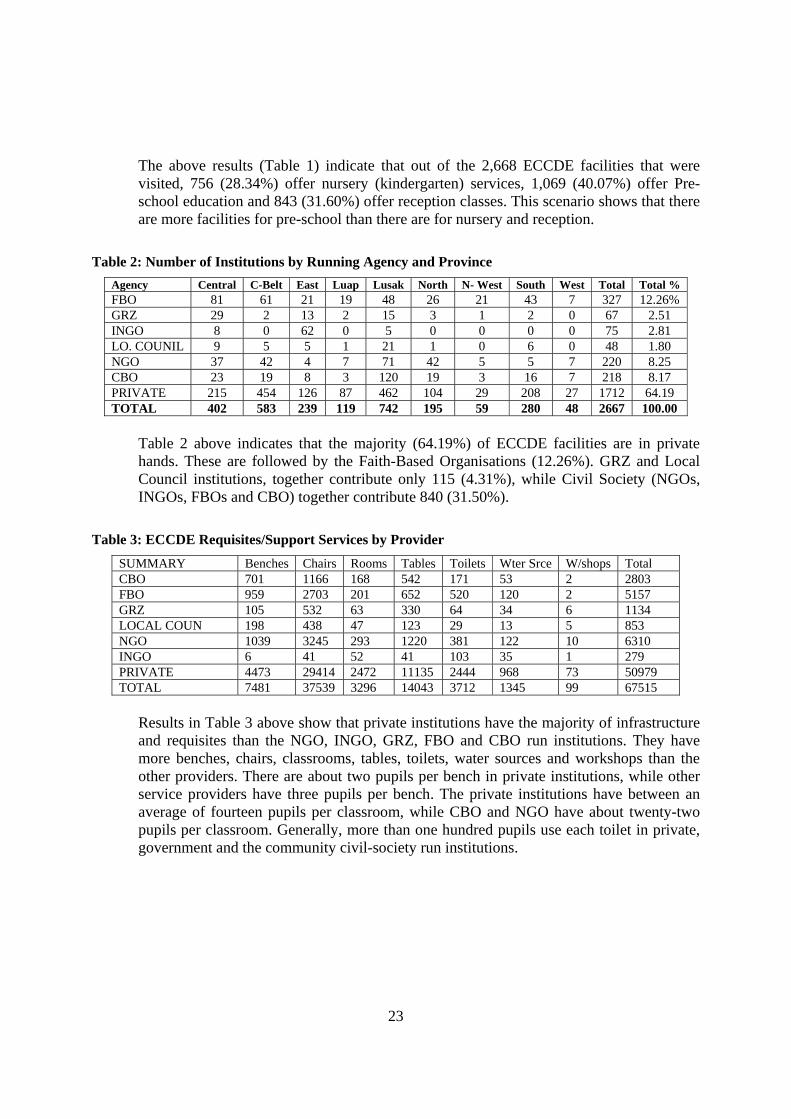
23
The above results (Table 1) indicate that out of the 2,668 ECCDE facilities that were visited, 756 (28.34%) offer nursery (kindergarten) services, 1,069 (40.07%) offer Pre-school education and 843 (31.60%) offer reception classes. This scenario shows that there are more facilities for pre-school than there are for nursery and reception.
Table 2: Number of Institutions by Running Agency and Province
Agency Central C-Belt East Luap Lusak North N- West South West Total Total % FBO 81 61 21 19 48 26 21 43 7 327 12.26% GRZ 29 2 13 2 15 3 1 2 0 67 2.51 INGO 8 0 62 0 5 0 0 0 0 75 2.81 LO. COUNIL 9 5 5 1 21 1 0 6 0 48 1.80 NGO 37 42 4 7 71 42 5 5 7 220 8.25 CBO 23 19 8 3 120 19 3 16 7 218 8.17 PRIVATE 215 454 126 87 462 104 29 208 27 1712 64.19 TOTAL 402 583 239 119 742 195 59 280 48 2667 100.00
Table 2 above indicates that the majority (64.19%) of ECCDE facilities are in private hands. These are followed by the Faith-Based Organisations (12.26%). GRZ and Local Council institutions, together contribute only 115 (4.31%), while Civil Society (NGOs, INGOs, FBOs and CBO) together contribute 840 (31.50%).
Table 3: ECCDE Requisites/Support Services by Provider
SUMMARY Benches Chairs Rooms Tables Toilets Wter Srce W/shops Total CBO 701 1166 168 542 171 53 2 2803 FBO 959 2703 201 652 520 120 2 5157 GRZ 105 532 63 330 64 34 6 1134 LOCAL COUN 198 438 47 123 29 13 5 853 NGO 1039 3245 293 1220 381 122 10 6310 INGO 6 41 52 41 103 35 1 279 PRIVATE 4473 29414 2472 11135 2444 968 73 50979 TOTAL 7481 37539 3296 14043 3712 1345 99 67515
Results in Table 3 above show that private institutions have the majority of infrastructure and requisites than the NGO, INGO, GRZ, FBO and CBO run institutions. They have more benches, chairs, classrooms, tables, toilets, water sources and workshops than the other providers. There are about two pupils per bench in private institutions, while other service providers have three pupils per bench. The private institutions have between an average of fourteen pupils per classroom, while CBO and NGO have about twenty-two pupils per classroom. Generally, more than one hundred pupils use each toilet in private, government and the community civil-society run institutions.
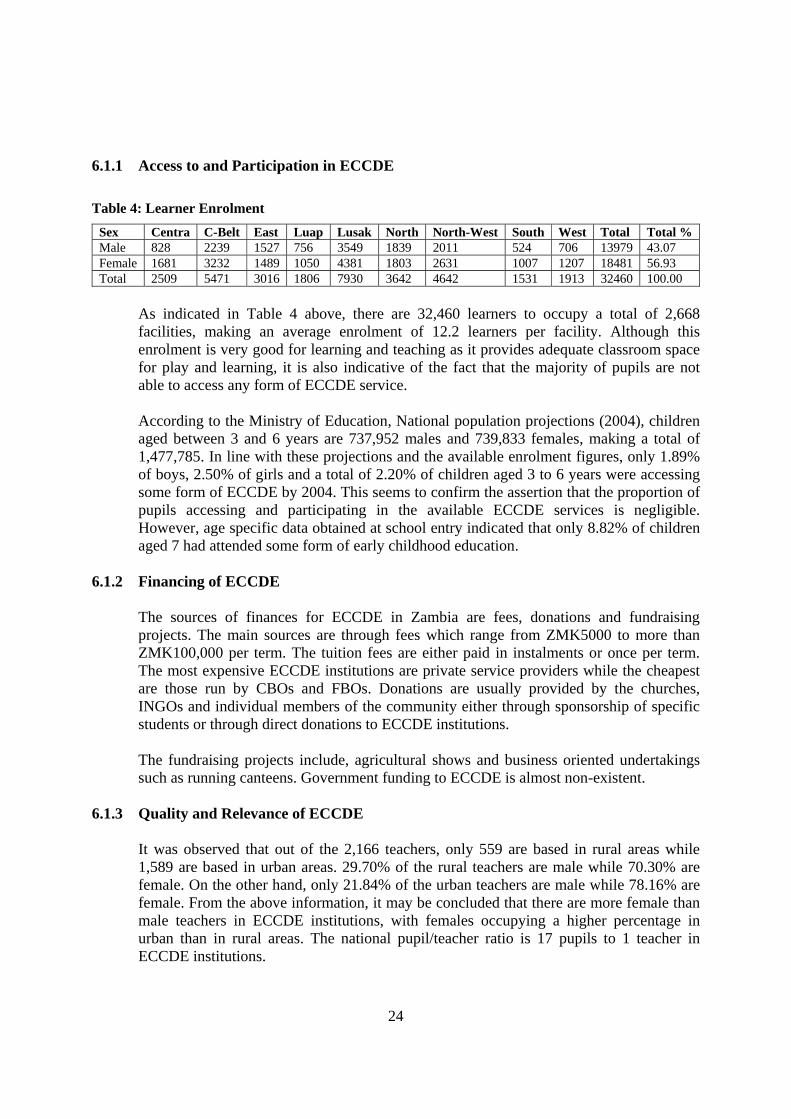
24
6.1.1 Access to and Participation in ECCDE Table 4: Learner Enrolment
Sex Centra C-Belt East Luap Lusak North North-West South West Total Total % Male 828 2239 1527 756 3549 1839 2011 524 706 13979 43.07 Female 1681 3232 1489 1050 4381 1803 2631 1007 1207 18481 56.93 Total 2509 5471 3016 1806 7930 3642 4642 1531 1913 32460 100.00
As indicated in Table 4 above, there are 32,460 learners to occupy a total of 2,668 facilities, making an average enrolment of 12.2 learners per facility. Although this enrolment is very good for learning and teaching as it provides adequate classroom space for play and learning, it is also indicative of the fact that the majority of pupils are not able to access any form of ECCDE service.
According to the Ministry of Education, National population projections (2004), children aged between 3 and 6 years are 737,952 males and 739,833 females, making a total of 1,477,785. In line with these projections and the available enrolment figures, only 1.89% of boys, 2.50% of girls and a total of 2.20% of children aged 3 to 6 years were accessing some form of ECCDE by 2004. This seems to confirm the assertion that the proportion of pupils accessing and participating in the available ECCDE services is negligible. However, age specific data obtained at school entry indicated that only 8.82% of children aged 7 had attended some form of early childhood education.
6.1.2 Financing of ECCDE
The sources of finances for ECCDE in Zambia are fees, donations and fundraising projects. The main sources are through fees which range from ZMK5000 to more than ZMK100,000 per term. The tuition fees are either paid in instalments or once per term. The most expensive ECCDE institutions are private service providers while the cheapest are those run by CBOs and FBOs. Donations are usually provided by the churches, INGOs and individual members of the community either through sponsorship of specific students or through direct donations to ECCDE institutions. The fundraising projects include, agricultural shows and business oriented undertakings such as running canteens. Government funding to ECCDE is almost non-existent.
6.1.3 Quality and Relevance of ECCDE
It was observed that out of the 2,166 teachers, only 559 are based in rural areas while 1,589 are based in urban areas. 29.70% of the rural teachers are male while 70.30% are female. On the other hand, only 21.84% of the urban teachers are male while 78.16% are female. From the above information, it may be concluded that there are more female than male teachers in ECCDE institutions, with females occupying a higher percentage in urban than in rural areas. The national pupil/teacher ratio is 17 pupils to 1 teacher in ECCDE institutions.

25
When desegregated according to rural and urban locations, the rural pupil/teacher ratio is 22 pupils to every teacher, while in urban areas there are 15 pupils to every teacher. This suggests that although the pupil/teacher ratio is generally satisfactory, the rural children are less likely to receive quality teaching than urban children. This is so because the rural ratio is higher, while the urban ratio is lower than the national ratio, giving individualized attention an advantage to urban children. It was also observed that there is lack of clarity with regard to the organization of the services provided by ECCDE facilities. The service providers label similar services by different names and most of them are not sure of when to enrol a child, when to move the learners from one level to another or even when to consider them ready for Grade 1 enrolment. There are no defined competencies that the learners have to attain at each level of learning. In addition, the teaching methods at ECCDE level are not aligned with the policies at lower basic education level. Despite the education policy emphasizing, for instance teaching in local (familiar) languages in order to enhance literacy at Grade 1, most, if not all ECCDE institutions use English as a medium of instruction.
6.1.4 Projected access and Participation
The Ministry of Education will contribute to the provision of Early Childhood Care, Development and Education for children aged 5 and 6 years and who reside closer to basic and high schools offering this service. On the other hand communities will be encouraged to open early childhood learning centres where formal schools are not within easy reach. They will do this in collaboration with the organizations that run community schools. A Committee of key stakeholders or an Early Childhood Care, Development and Education (ECCDE) Council should be mandated to harmonize ECCDE categories in terms of the curriculum offered, programmes followed and the activities carried out and for a given age group, e.g. zero to two years (Day Care Centres), three to four years (Nursery Schools) or five to six years (Pre-school). Data capture for early childhood education as reflected under section 6.1 above shows significantly lower participation rates compared to the proportion of children who upon entry to Grade 1 indicate having participated in early childhood education. Due to the nature of early childhood centres, collection of comprehensive information has always been elusive in the country. Therefore, the most reliable estimate used for projections in this report is that of the proportion of children enrolling in Grade 1 with early childhood experience. Data presented in figure 2 below suggests that only 8.82% of those aged 7 indicated having attended some form of early childhood education. It is however important to note that when other ages are included, the proportion of those who attended some form of early childhood education was about 14%.

26
Projected Trends in Early Childhood Participation Rates
0.00%
10.00%
20.00%
30.00%
40.00%
50.00%
60.00%
Series1 8.82% 10.00% 11.00% 12.30% 14.70% 18.00% 22.10% 26.50% 33.00% 40.50% 46.30% 50.0%
2004 2005 2006 2007 2008 2009 2010 2011 2012 2013 2014 2015
Figure 2: Projected Trends in Early Childhood Participation
Projection of the enrolments in early childhood centres for both Private and Government interventions.
Early childhood provision will also become an important component of formal education and will initially be targeted at those aged 5 and 6 years. It is therefore proposed that the Ministry will progressively facilitate for the increase in early childhood provision especially for those aged 5 and 6 from 8.82% in 2004 to 50.0% by the year 2015 (see figure 2).
It is proposed that the Ministry of Education offer ECCDE by 2006 in line with the articulated vision in ‘Educating Our Future’ and according to the policies outlined in the Sector Plan. In this respect, as indicated in figure 3, the Ministry should enrol a total of 15,175 early childhood learners. The public provision of early childhood education is projected to rise to 395,490 by the year 2015. Correspondingly, private provision of early childhood education is expected to rise from 56,779 in 2004 to 84,727 in 2015 (see figure 3).

27
Figure 3: Projected Enrolments for Privately and Publicly Financed Early Childhood Education
In view of the critical role that ECCDE plays in contributing to effective learning in school, it is proposed that a reduced subsidy in favour of the private providers of the early childhood learning starting with pre-school education (age 5 and 6) be commenced at 5 percent of the cost of those who will be catered for under the public education system for the same targets. This subsidy, by and large will be in the area of standards monitoring, educational materials and curriculum reform and implementation. The total expenditure for publicly financed ECCDE is proposed at 12.9 US Dollars unit costs, this being slightly less than 50 percent of unit cost at basic education level. It should also be noted that the proposed expenditures are only in the area of recurrent costs and therefore excludes capital expenditure for a start.
6.1.5 Costs Table 5: Projected Recurrent Costs in ECCDE (US Dollars)
Year Age 5 - 6 Privately Financed
Incremental to 50% Publicly Financed
Projected Costs Priv.
Projected Costs Pub.
2004 643,753 56,779 56,779 8.82% - 2005 642,032 56,627 56,627 8.82% - 2006 696,106 61,397 76,572 11.00% 15,175 39,601 987,774 2007 771,460 68,043 94,890 12.30% 26,847 43,888 1,224,076 2008 806,537 71,137 118,561 14.70% 47,424 45,883 1,529,436 2009 829,066 73,124 149,232 18.00% 76,108 47,165 1,925,091 2010 850,781 75,039 188,023 22.10% 112,984 48,400 2,425,492 2011 871,886 76,900 231,050 26.50% 154,149 49,601 2,980,542 2012 894,192 78,868 295,083 33.00% 216,216 50,870 3,806,573 2013 916,408 80,827 371,145 40.50% 290,318 52,134 4,787,771 2014 937,957 82,728 434,274 46.30% 351,546 53,359 5,602,138 2015 960,392 84,707 480,196 50.0% 395,490 54,636 6,194,531
Projected Enrolments for Privately and Publicly Financed Early Childhood Education
-
100,000
200,000
300,000
400,000
500,000
600,000
Pub. - - 15,175 26,847 47,424 76,108 112,984 154,149 216,216 290,318 351,546 395,490
Priv. 56,779 56,627 61,397 68,043 71,137 73,124 75,039 76,900 78,868 80,827 82,728 84,707
2004 2005 2006 2007 2008 2009 2010 2011 2012 2013 2014 2015
28
Note3: New Projected costs @US Dollar 12.9 for public and @ 5% Subsidy of public towards Private ($0.65)
Table 5 presents information on the proposed financing of Early Childhood Education starting for the period 2006 - 2015. In 2006, a subsidy towards privately financed ECCDE is proposed at 39,601 US dollars and this will rise to 54,636 by 2015. Publicly financed costs will rise from 987,774 to 6,194,531 in 2015.
6.1.6 Equity
As much as possible, ECCDE should have an inbuilt capacity to identify and provide adequate support to children with special education needs. Strategies for community sensitisation on the need to diagnose children with these needs early should be put in place at all levels.
6.1.7 Quality
An elaborate and comprehensive curriculum framework that defines and prescribes the relationship and linkages between learning, play, work and living as well as harmonises these with the basic education curriculum framework will be introduced. In addition, the Education Sector Ministries through the Curriculum Development Centre (hopefully, also to assume the role of a Book Development Council) will set up an inter-sectoral curriculum Committee to be responsible for the development of early childhood education materials. They will also make useful inputs into pre-school teacher training.
6.2 Basic Education “ Ensuring that by 2015 all children, particularly girls, children in difficult circumstances and those belonging to ethnic minorities, have access to and complete free and compulsory primary education of good quality”
The first most determined adoption and use of the term Basic Education in Zambia surfaced in the Educational Reform of 1977 – as earlier alluded to under 3.1 above. At that time, emphasis was to be shifted from what was seen as ‘theoretical knowledge’ of academic disciplines of the school culture to Education with Production. It was widely expected that the latter would enable pupils to learn about and participate in practical skills that would be relevant to meeting their employment needs in society. For this reason, it was argued, they needed two additional years in school after grade 7; time by which they would have matured to 15 years of age, acquired more practical knowledge and able to effectively work as artisans, bricklayers, carpenters etc.
Due to wide spread unemployment in the country and to lack of sufficient places at secondary level to absorb the majority of grade seven school leavers, the National Policy on Education, (1996) re-institutionalised the legitimacy of nine years of basic schooling.
3 2004 US Dollar Constant Prices
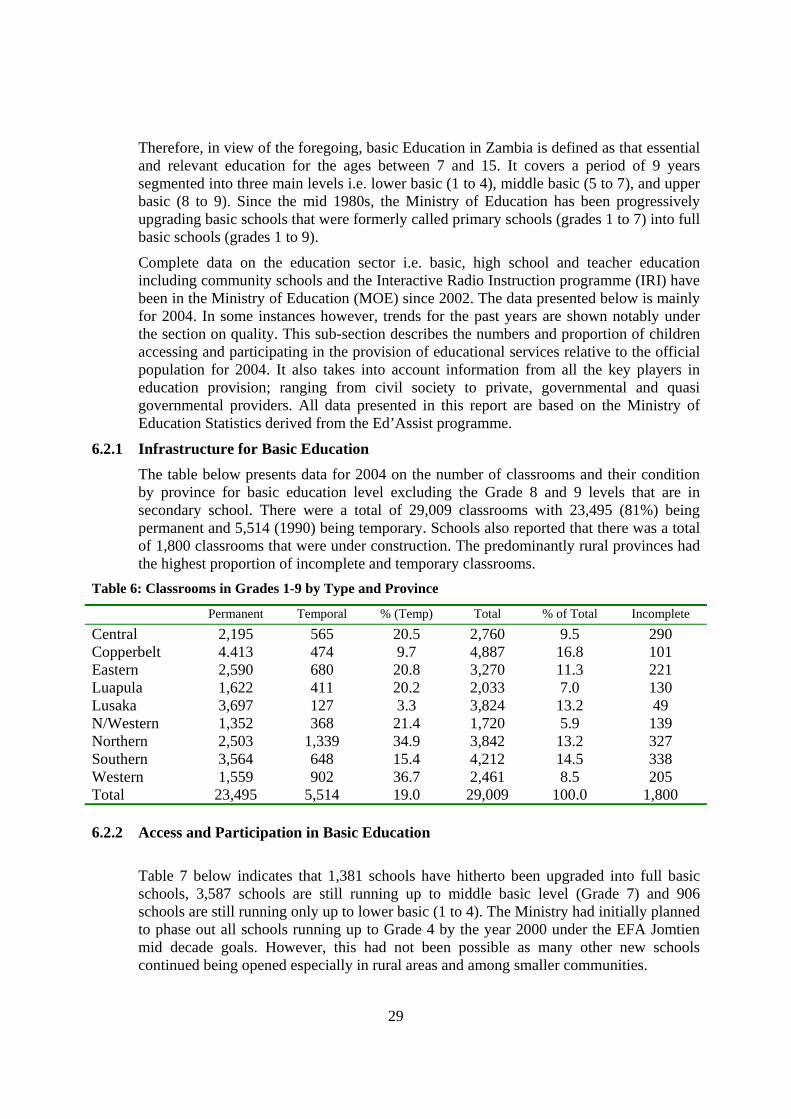
29
Therefore, in view of the foregoing, basic Education in Zambia is defined as that essential and relevant education for the ages between 7 and 15. It covers a period of 9 years segmented into three main levels i.e. lower basic (1 to 4), middle basic (5 to 7), and upper basic (8 to 9). Since the mid 1980s, the Ministry of Education has been progressively upgrading basic schools that were formerly called primary schools (grades 1 to 7) into full basic schools (grades 1 to 9).
Complete data on the education sector i.e. basic, high school and teacher education including community schools and the Interactive Radio Instruction programme (IRI) have been in the Ministry of Education (MOE) since 2002. The data presented below is mainly for 2004. In some instances however, trends for the past years are shown notably under the section on quality. This sub-section describes the numbers and proportion of children accessing and participating in the provision of educational services relative to the official population for 2004. It also takes into account information from all the key players in education provision; ranging from civil society to private, governmental and quasi governmental providers. All data presented in this report are based on the Ministry of Education Statistics derived from the Ed’Assist programme.
6.2.1 Infrastructure for Basic Education
The table below presents data for 2004 on the number of classrooms and their condition by province for basic education level excluding the Grade 8 and 9 levels that are in secondary school. There were a total of 29,009 classrooms with 23,495 (81%) being permanent and 5,514 (1990) being temporary. Schools also reported that there was a total of 1,800 classrooms that were under construction. The predominantly rural provinces had the highest proportion of incomplete and temporary classrooms.
Table 6: Classrooms in Grades 1-9 by Type and Province
Permanent Temporal % (Temp) Total % of Total Incomplete Central 2,195 565 20.5 2,760 9.5 290 Copperbelt 4.413 474 9.7 4,887 16.8 101 Eastern 2,590 680 20.8 3,270 11.3 221 Luapula 1,622 411 20.2 2,033 7.0 130 Lusaka 3,697 127 3.3 3,824 13.2 49 N/Western 1,352 368 21.4 1,720 5.9 139 Northern 2,503 1,339 34.9 3,842 13.2 327 Southern 3,564 648 15.4 4,212 14.5 338 Western 1,559 902 36.7 2,461 8.5 205 Total 23,495 5,514 19.0 29,009 100.0 1,800 6.2.2 Access and Participation in Basic Education
Table 7 below indicates that 1,381 schools have hitherto been upgraded into full basic schools, 3,587 schools are still running up to middle basic level (Grade 7) and 906 schools are still running only up to lower basic (1 to 4). The Ministry had initially planned to phase out all schools running up to Grade 4 by the year 2000 under the EFA Jomtien mid decade goals. However, this had not been possible as many other new schools continued being opened especially in rural areas and among smaller communities.

30
There was also a smaller number of schools (14) running Grades 8 and 9 only, another 58 running from Grade 1 to 12 and 119 schools offering multigrade session. The responding school heads (2004) did not classify a total of 731 schools.
Table 7: Basic Schools by Level and Province
Province Gr. 1-4 Gr. 1-7 Gr. 8-9 Gr. 1-9 Multigr Gr. 1-12 Unk. Total Central 51 388 1 133 4 3 73 653 Copperbelt 104 313 5 187 34 12 205 860 Eastern 97 578 0 106 11 5 65 862 Luapula 67 264 3 151 4 3 37 529 Lusaka 24 191 2 154 7 20 106 504 N. Western 90 278 2 113 16 1 38 538 Northern 248 696 1 177 14 5 66 1,207 Southern 141 482 0 259 12 6 95 995 Western 84 397 0 101 17 3 46 648 Total 906 3,587 14 1,381 119 58 731 6,796
In Table 8 below, a total of 5,388 schools were classified as rural accounting for 79.3 percent while 993 schools were classified as urban with 415 schools remaining unclassified by the responding head teachers.
Table 8: Basic Schools by Urban/Rural and Province
Province Urban Rural Unk. % (Rur) TotalCentral 71 555 27 85.0% 653Copperbelt 364 328 168 38.1% 860Eastern 35 808 19 93.7% 862Luapula 34 482 13 91.1% 529Lusaka 290 154 60 30.6% 504N. Western 22 492 24 91.4% 538Northern 47 1,131 29 93.7% 1,207Southern 100 846 49 85.0% 995Western 30 592 26 91.4% 648Total 993 5,388 415 79.3% 6,796
Out of a total of 6,796, the government ran 4,409 schools, 174 were Grant Aided, 395 were Private, 1,388 were Community and 430 remained unclassified as can be observed in Table 9 below.
Table 9: Basic Schools by Running Agency and Province
Province GRZ Grant Aid. Private Comm. Unk. TotalCentral 496 11 26 93 27 653Copperbelt 381 40 134 134 171 860Eastern 599 27 19 194 23 862Luapula 387 10 6 110 16 529Lusaka 199 14 129 97 65 504N. Western 398 17 11 85 27 538Northern 805 24 19 330 29 1207
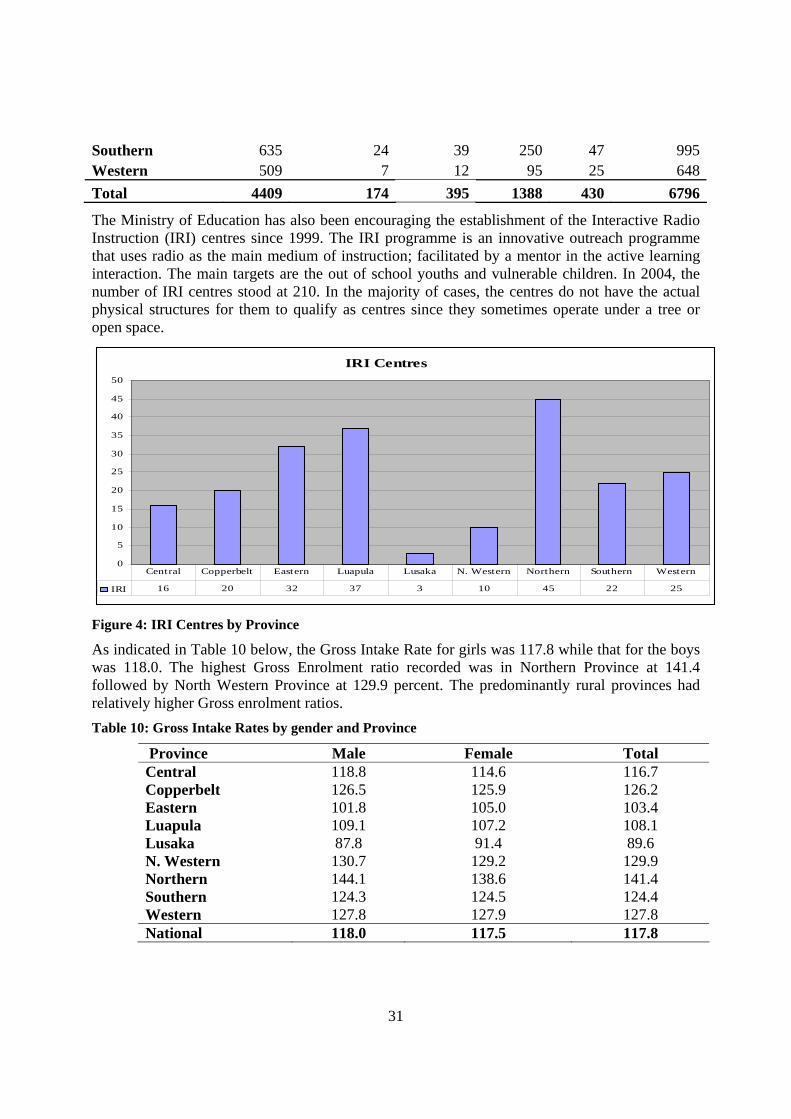
31
Southern 635 24 39 250 47 995Western 509 7 12 95 25 648Total 4409 174 395 1388 430 6796
The Ministry of Education has also been encouraging the establishment of the Interactive Radio Instruction (IRI) centres since 1999. The IRI programme is an innovative outreach programme that uses radio as the main medium of instruction; facilitated by a mentor in the active learning interaction. The main targets are the out of school youths and vulnerable children. In 2004, the number of IRI centres stood at 210. In the majority of cases, the centres do not have the actual physical structures for them to qualify as centres since they sometimes operate under a tree or open space.
IRI Centres
0
5
10
15
20
25
30
35
40
45
50
IRI 16 20 32 37 3 10 45 22 25
Central Copperbelt Eastern Luapula Lusaka N. Western Northern Southern Western
Figure 4: IRI Centres by Province
As indicated in Table 10 below, the Gross Intake Rate for girls was 117.8 while that for the boys was 118.0. The highest Gross Enrolment ratio recorded was in Northern Province at 141.4 followed by North Western Province at 129.9 percent. The predominantly rural provinces had relatively higher Gross enrolment ratios. Table 10: Gross Intake Rates by gender and Province
Province Male Female Total Central 118.8 114.6 116.7 Copperbelt 126.5 125.9 126.2 Eastern 101.8 105.0 103.4 Luapula 109.1 107.2 108.1 Lusaka 87.8 91.4 89.6 N. Western 130.7 129.2 129.9 Northern 144.1 138.6 141.4 Southern 124.3 124.5 124.4 Western 127.8 127.9 127.8 National 118.0 117.5 117.8
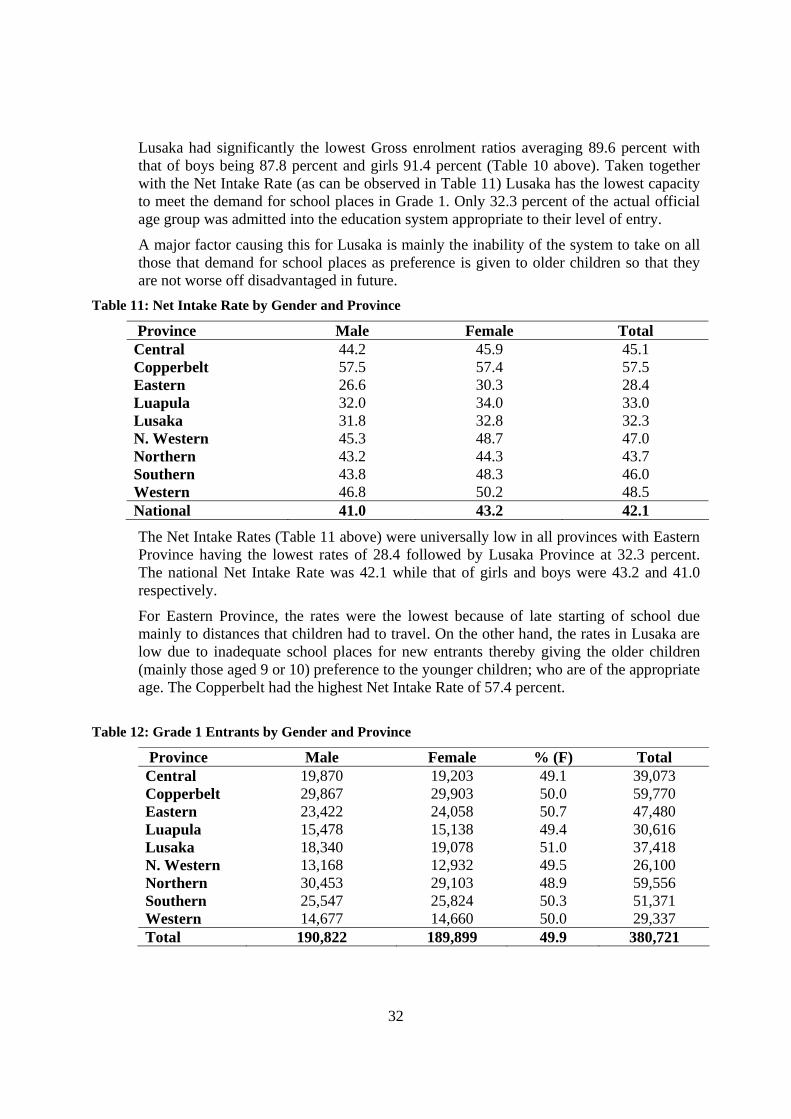
32
Lusaka had significantly the lowest Gross enrolment ratios averaging 89.6 percent with that of boys being 87.8 percent and girls 91.4 percent (Table 10 above). Taken together with the Net Intake Rate (as can be observed in Table 11) Lusaka has the lowest capacity to meet the demand for school places in Grade 1. Only 32.3 percent of the actual official age group was admitted into the education system appropriate to their level of entry.
A major factor causing this for Lusaka is mainly the inability of the system to take on all those that demand for school places as preference is given to older children so that they are not worse off disadvantaged in future.
Table 11: Net Intake Rate by Gender and Province
Province Male Female Total Central 44.2 45.9 45.1 Copperbelt 57.5 57.4 57.5 Eastern 26.6 30.3 28.4 Luapula 32.0 34.0 33.0 Lusaka 31.8 32.8 32.3 N. Western 45.3 48.7 47.0 Northern 43.2 44.3 43.7 Southern 43.8 48.3 46.0 Western 46.8 50.2 48.5 National 41.0 43.2 42.1
The Net Intake Rates (Table 11 above) were universally low in all provinces with Eastern Province having the lowest rates of 28.4 followed by Lusaka Province at 32.3 percent. The national Net Intake Rate was 42.1 while that of girls and boys were 43.2 and 41.0 respectively.
For Eastern Province, the rates were the lowest because of late starting of school due mainly to distances that children had to travel. On the other hand, the rates in Lusaka are low due to inadequate school places for new entrants thereby giving the older children (mainly those aged 9 or 10) preference to the younger children; who are of the appropriate age. The Copperbelt had the highest Net Intake Rate of 57.4 percent.
Table 12: Grade 1 Entrants by Gender and Province
Province Male Female % (F) Total Central 19,870 19,203 49.1 39,073 Copperbelt 29,867 29,903 50.0 59,770 Eastern 23,422 24,058 50.7 47,480 Luapula 15,478 15,138 49.4 30,616 Lusaka 18,340 19,078 51.0 37,418 N. Western 13,168 12,932 49.5 26,100 Northern 30,453 29,103 48.9 59,556 Southern 25,547 25,824 50.3 51,371 Western 14,677 14,660 50.0 29,337 Total 190,822 189,899 49.9 380,721
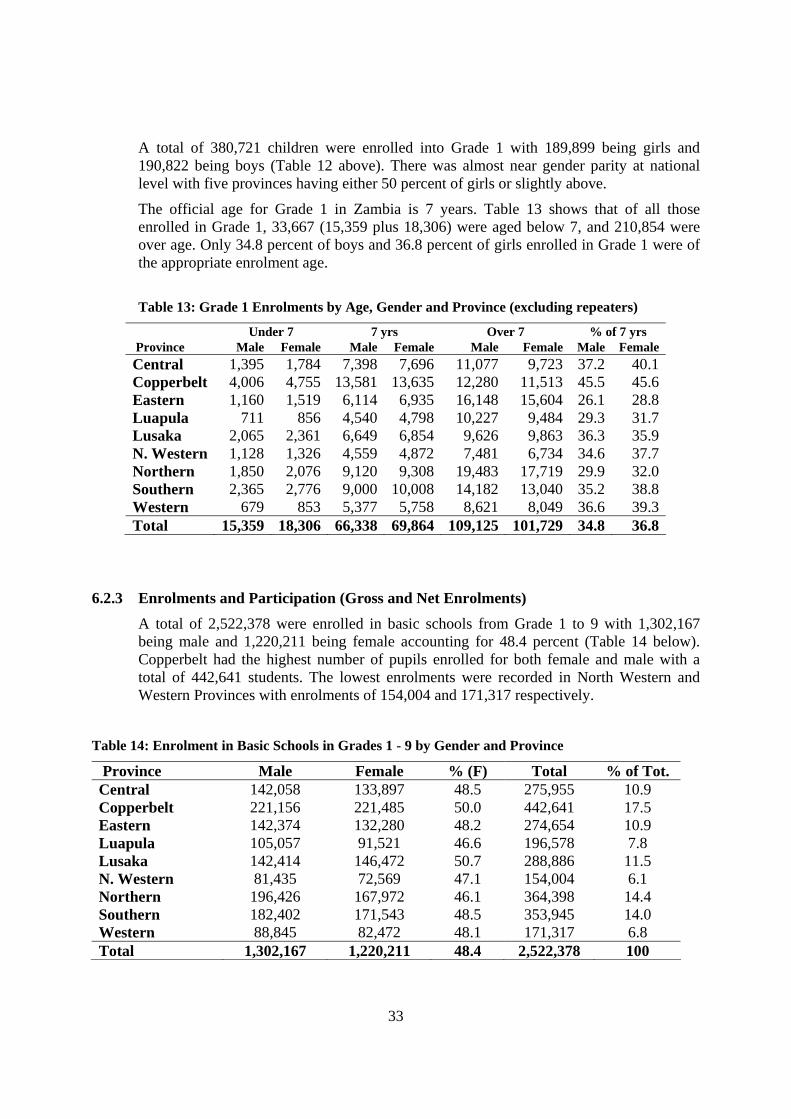
33
A total of 380,721 children were enrolled into Grade 1 with 189,899 being girls and 190,822 being boys (Table 12 above). There was almost near gender parity at national level with five provinces having either 50 percent of girls or slightly above.
The official age for Grade 1 in Zambia is 7 years. Table 13 shows that of all those enrolled in Grade 1, 33,667 (15,359 plus 18,306) were aged below 7, and 210,854 were over age. Only 34.8 percent of boys and 36.8 percent of girls enrolled in Grade 1 were of the appropriate enrolment age.
Table 13: Grade 1 Enrolments by Age, Gender and Province (excluding repeaters)
Under 7 7 yrs Over 7 % of 7 yrs Province Male Female Male Female Male Female Male Female Central 1,395 1,784 7,398 7,696 11,077 9,723 37.2 40.1Copperbelt 4,006 4,755 13,581 13,635 12,280 11,513 45.5 45.6Eastern 1,160 1,519 6,114 6,935 16,148 15,604 26.1 28.8Luapula 711 856 4,540 4,798 10,227 9,484 29.3 31.7Lusaka 2,065 2,361 6,649 6,854 9,626 9,863 36.3 35.9N. Western 1,128 1,326 4,559 4,872 7,481 6,734 34.6 37.7Northern 1,850 2,076 9,120 9,308 19,483 17,719 29.9 32.0Southern 2,365 2,776 9,000 10,008 14,182 13,040 35.2 38.8Western 679 853 5,377 5,758 8,621 8,049 36.6 39.3Total 15,359 18,306 66,338 69,864 109,125 101,729 34.8 36.8
6.2.3 Enrolments and Participation (Gross and Net Enrolments)
A total of 2,522,378 were enrolled in basic schools from Grade 1 to 9 with 1,302,167 being male and 1,220,211 being female accounting for 48.4 percent (Table 14 below). Copperbelt had the highest number of pupils enrolled for both female and male with a total of 442,641 students. The lowest enrolments were recorded in North Western and Western Provinces with enrolments of 154,004 and 171,317 respectively.
Table 14: Enrolment in Basic Schools in Grades 1 - 9 by Gender and Province
Province Male Female % (F) Total % of Tot. Central 142,058 133,897 48.5 275,955 10.9 Copperbelt 221,156 221,485 50.0 442,641 17.5 Eastern 142,374 132,280 48.2 274,654 10.9 Luapula 105,057 91,521 46.6 196,578 7.8 Lusaka 142,414 146,472 50.7 288,886 11.5 N. Western 81,435 72,569 47.1 154,004 6.1 Northern 196,426 167,972 46.1 364,398 14.4 Southern 182,402 171,543 48.5 353,945 14.0 Western 88,845 82,472 48.1 171,317 6.8 Total 1,302,167 1,220,211 48.4 2,522,378 100
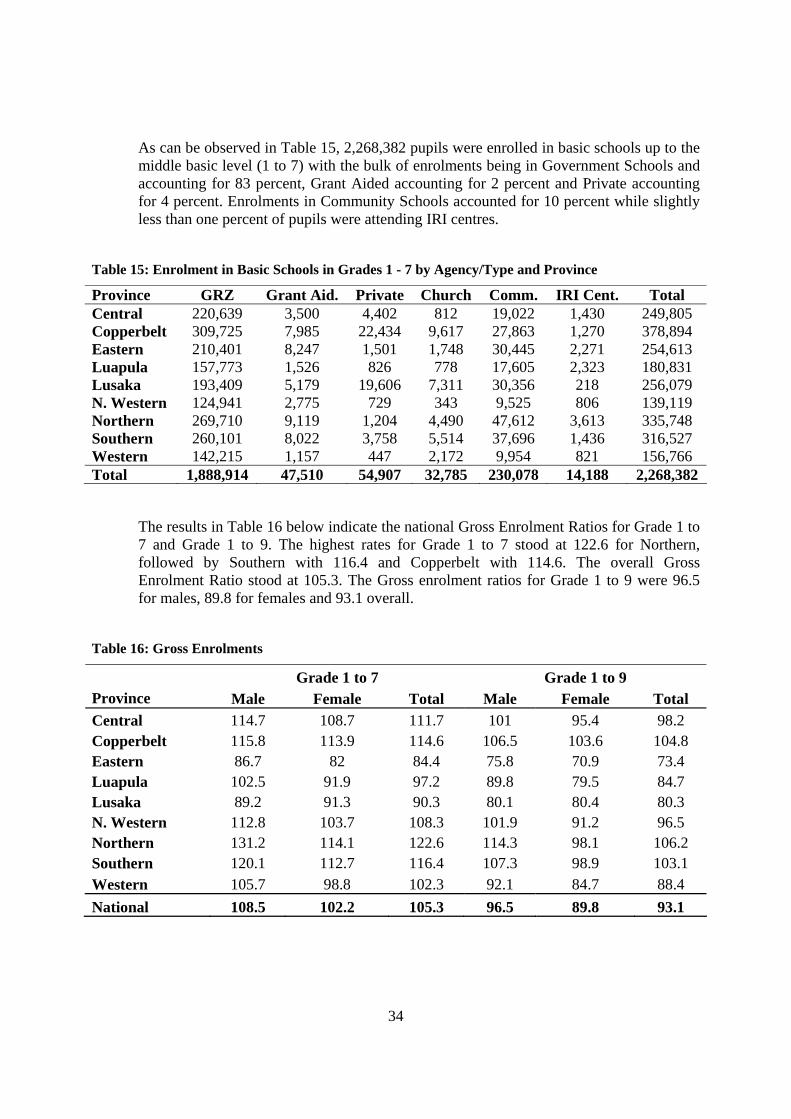
34
As can be observed in Table 15, 2,268,382 pupils were enrolled in basic schools up to the middle basic level (1 to 7) with the bulk of enrolments being in Government Schools and accounting for 83 percent, Grant Aided accounting for 2 percent and Private accounting for 4 percent. Enrolments in Community Schools accounted for 10 percent while slightly less than one percent of pupils were attending IRI centres.
Table 15: Enrolment in Basic Schools in Grades 1 - 7 by Agency/Type and Province
Province GRZ Grant Aid. Private Church Comm. IRI Cent. Total Central 220,639 3,500 4,402 812 19,022 1,430 249,805 Copperbelt 309,725 7,985 22,434 9,617 27,863 1,270 378,894 Eastern 210,401 8,247 1,501 1,748 30,445 2,271 254,613 Luapula 157,773 1,526 826 778 17,605 2,323 180,831 Lusaka 193,409 5,179 19,606 7,311 30,356 218 256,079 N. Western 124,941 2,775 729 343 9,525 806 139,119 Northern 269,710 9,119 1,204 4,490 47,612 3,613 335,748 Southern 260,101 8,022 3,758 5,514 37,696 1,436 316,527 Western 142,215 1,157 447 2,172 9,954 821 156,766 Total 1,888,914 47,510 54,907 32,785 230,078 14,188 2,268,382
The results in Table 16 below indicate the national Gross Enrolment Ratios for Grade 1 to 7 and Grade 1 to 9. The highest rates for Grade 1 to 7 stood at 122.6 for Northern, followed by Southern with 116.4 and Copperbelt with 114.6. The overall Gross Enrolment Ratio stood at 105.3. The Gross enrolment ratios for Grade 1 to 9 were 96.5 for males, 89.8 for females and 93.1 overall.
Table 16: Gross Enrolments
Grade 1 to 7 Grade 1 to 9 Province Male Female Total Male Female Total Central 114.7 108.7 111.7 101 95.4 98.2 Copperbelt 115.8 113.9 114.6 106.5 103.6 104.8 Eastern 86.7 82 84.4 75.8 70.9 73.4 Luapula 102.5 91.9 97.2 89.8 79.5 84.7 Lusaka 89.2 91.3 90.3 80.1 80.4 80.3 N. Western 112.8 103.7 108.3 101.9 91.2 96.5 Northern 131.2 114.1 122.6 114.3 98.1 106.2 Southern 120.1 112.7 116.4 107.3 98.9 103.1 Western 105.7 98.8 102.3 92.1 84.7 88.4 National 108.5 102.2 105.3 96.5 89.8 93.1
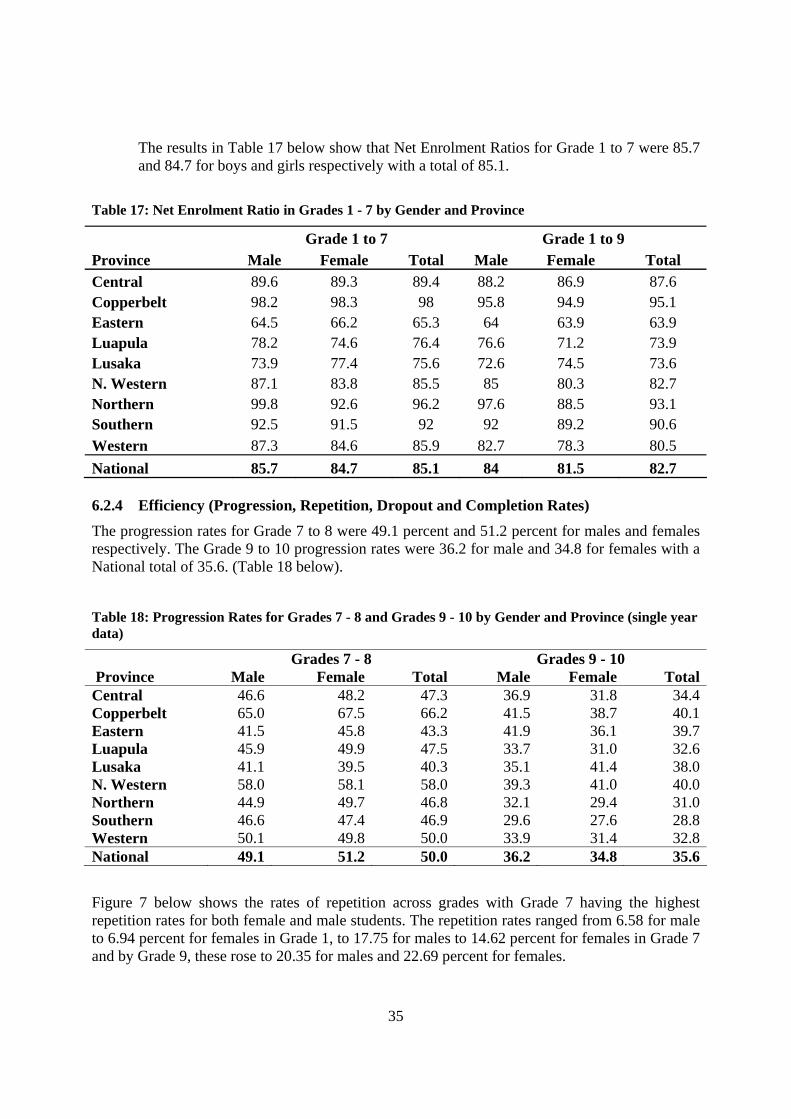
35
The results in Table 17 below show that Net Enrolment Ratios for Grade 1 to 7 were 85.7 and 84.7 for boys and girls respectively with a total of 85.1.
Table 17: Net Enrolment Ratio in Grades 1 - 7 by Gender and Province
Grade 1 to 7 Grade 1 to 9 Province Male Female Total Male Female Total Central 89.6 89.3 89.4 88.2 86.9 87.6 Copperbelt 98.2 98.3 98 95.8 94.9 95.1 Eastern 64.5 66.2 65.3 64 63.9 63.9 Luapula 78.2 74.6 76.4 76.6 71.2 73.9 Lusaka 73.9 77.4 75.6 72.6 74.5 73.6 N. Western 87.1 83.8 85.5 85 80.3 82.7 Northern 99.8 92.6 96.2 97.6 88.5 93.1 Southern 92.5 91.5 92 92 89.2 90.6 Western 87.3 84.6 85.9 82.7 78.3 80.5 National 85.7 84.7 85.1 84 81.5 82.7 6.2.4 Efficiency (Progression, Repetition, Dropout and Completion Rates)
The progression rates for Grade 7 to 8 were 49.1 percent and 51.2 percent for males and females respectively. The Grade 9 to 10 progression rates were 36.2 for male and 34.8 for females with a National total of 35.6. (Table 18 below).
Table 18: Progression Rates for Grades 7 - 8 and Grades 9 - 10 by Gender and Province (single year data)
Grades 7 - 8 Grades 9 - 10 Province Male Female Total Male Female TotalCentral 46.6 48.2 47.3 36.9 31.8 34.4Copperbelt 65.0 67.5 66.2 41.5 38.7 40.1Eastern 41.5 45.8 43.3 41.9 36.1 39.7Luapula 45.9 49.9 47.5 33.7 31.0 32.6Lusaka 41.1 39.5 40.3 35.1 41.4 38.0N. Western 58.0 58.1 58.0 39.3 41.0 40.0Northern 44.9 49.7 46.8 32.1 29.4 31.0Southern 46.6 47.4 46.9 29.6 27.6 28.8Western 50.1 49.8 50.0 33.9 31.4 32.8National 49.1 51.2 50.0 36.2 34.8 35.6
Figure 7 below shows the rates of repetition across grades with Grade 7 having the highest repetition rates for both female and male students. The repetition rates ranged from 6.58 for male to 6.94 percent for females in Grade 1, to 17.75 for males to 14.62 percent for females in Grade 7 and by Grade 9, these rose to 20.35 for males and 22.69 percent for females.
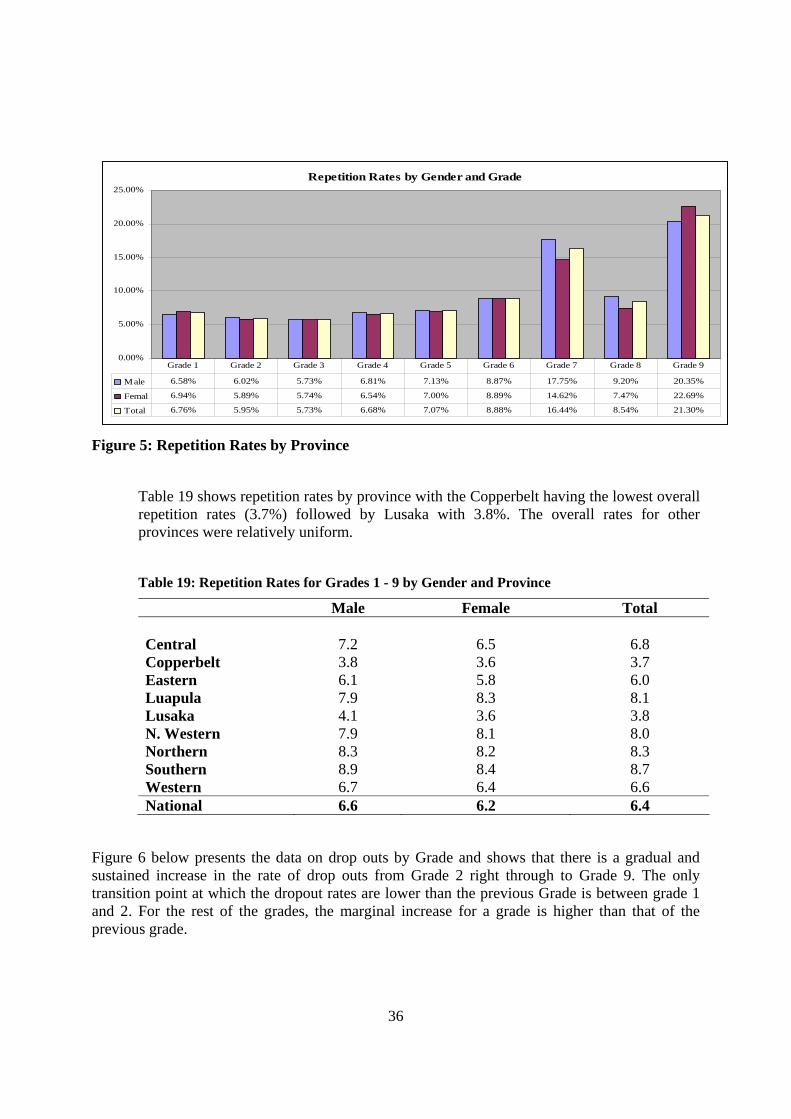
36
Repetition Rates by Gender and Grade
0.00%
5.00%
10.00%
15.00%
20.00%
25.00%
Male 6.58% 6.02% 5.73% 6.81% 7.13% 8.87% 17.75% 9.20% 20.35%
Femal 6.94% 5.89% 5.74% 6.54% 7.00% 8.89% 14.62% 7.47% 22.69%
Total 6.76% 5.95% 5.73% 6.68% 7.07% 8.88% 16.44% 8.54% 21.30%
Grade 1 Grade 2 Grade 3 Grade 4 Grade 5 Grade 6 Grade 7 Grade 8 Grade 9
Figure 5: Repetition Rates by Province
Table 19 shows repetition rates by province with the Copperbelt having the lowest overall repetition rates (3.7%) followed by Lusaka with 3.8%. The overall rates for other provinces were relatively uniform.
Table 19: Repetition Rates for Grades 1 - 9 by Gender and Province
Male Female Total Central 7.2 6.5 6.8 Copperbelt 3.8 3.6 3.7 Eastern 6.1 5.8 6.0 Luapula 7.9 8.3 8.1 Lusaka 4.1 3.6 3.8 N. Western 7.9 8.1 8.0 Northern 8.3 8.2 8.3 Southern 8.9 8.4 8.7 Western 6.7 6.4 6.6 National 6.6 6.2 6.4
Figure 6 below presents the data on drop outs by Grade and shows that there is a gradual and sustained increase in the rate of drop outs from Grade 2 right through to Grade 9. The only transition point at which the dropout rates are lower than the previous Grade is between grade 1 and 2. For the rest of the grades, the marginal increase for a grade is higher than that of the previous grade.

37
Drop Out rates by Grade
0.00%
2.00%
4.00%
6.00%
8.00%
10.00%
12.00%
14.00%
16.00%
18.00%
20.00%
Male 2.63% 2.17% 2.37% 2.45% 2.90% 2.91% 3.37% 4.44% 10.67%
Femal 2.17% 2.35% 2.57% 3.19% 3.96% 5.11% 7.23% 10.13% 17.52%
Total 2.40% 2.26% 2.47% 2.80% 3.39% 3.92% 4.98% 6.62% 13.46%
Grade 1 Grade 2 Grade 3 Grade 4 Grade 5 Grade 6 Grade 7 Grade 8 Grade 9
Figure 6: Drop Out Rates by Grade
Table 20 below presents information on the Completion Rates using the method of treating the age group for the end of cycle year as the base and the enrolment of those of the official age group as the denominator. The overall completion rates of the Grade 1 to 7 cycle for males was 78.3 and that for females was 65.8 where as that for Grade 1 to 9 was 42.8 for males and 34.4 for females. Table 20: Completion Rates for Grades 1 - 7 and Grades 1 - 9 by Gender and Province
Grades 1 - 7 Grades 1 - 9 Province Male Female Total Male Female TotalCentral 85.2 76.0 80.6 38.2 37.1 37.7Copperbelt 92.1 85.3 88.6 63.7 57.7 60.6Eastern 56.2 42.4 49.3 26.8 19.3 23.1Luapula 62.8 43.2 53.1 33.4 21.7 27.7Lusaka 84.1 82.1 83.1 42.6 35.0 38.7N. Western 74.9 55.9 65.4 47.6 30.5 39.0Northern 83.9 56.4 70.2 39.9 27.2 33.6Southern 86.9 75.1 80.9 50.1 38.3 44.1Western 66.7 54.7 60.7 34.2 25.9 30.0National 78.3 65.8 72.0 42.8 34.4 38.5
Note: Does not include APU pupils
Figure 9 presents data on the proportion of categories of pupils in various levels that were of the wrong age group in 2004, a total of 206,062 children were under age in 2004 for Grades 1 to 7, 23,597 for 8 to 9 and 38,937 for Grades 10 to 12 respectively, In order for the Ministry to achieve favourable target in both the areas of access, participation and completion it is imperative that very radical and far reaching measures be put in place to reduce the under age and over age children from the educational system.
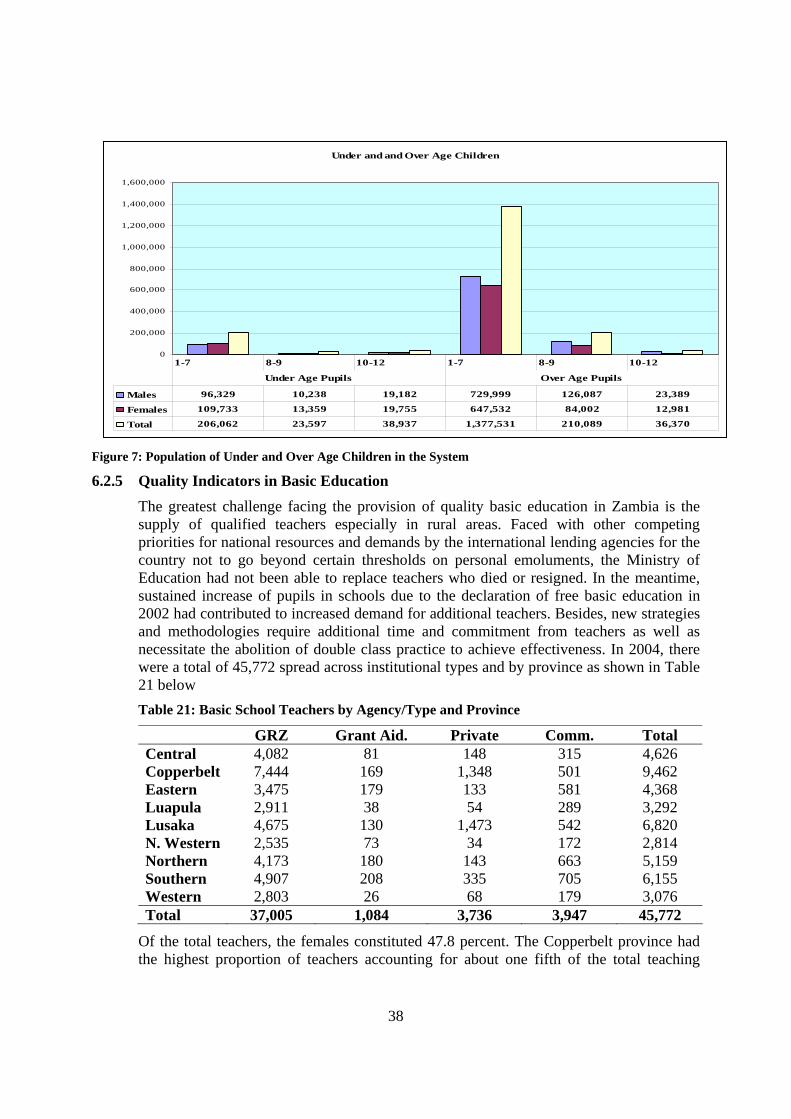
38
Under and and Over Age Children
0
200,000
400,000
600,000
800,000
1,000,000
1,200,000
1,400,000
1,600,000
Males 96,329 10,238 19,182 729,999 126,087 23,389
Females 109,733 13,359 19,755 647,532 84,002 12,981
Total 206,062 23,597 38,937 1,377,531 210,089 36,370
1-7 8-9 10-12 1-7 8-9 10-12
Under Age Pupils Over Age Pupils
Figure 7: Population of Under and Over Age Children in the System
6.2.5 Quality Indicators in Basic Education
The greatest challenge facing the provision of quality basic education in Zambia is the supply of qualified teachers especially in rural areas. Faced with other competing priorities for national resources and demands by the international lending agencies for the country not to go beyond certain thresholds on personal emoluments, the Ministry of Education had not been able to replace teachers who died or resigned. In the meantime, sustained increase of pupils in schools due to the declaration of free basic education in 2002 had contributed to increased demand for additional teachers. Besides, new strategies and methodologies require additional time and commitment from teachers as well as necessitate the abolition of double class practice to achieve effectiveness. In 2004, there were a total of 45,772 spread across institutional types and by province as shown in Table 21 below Table 21: Basic School Teachers by Agency/Type and Province
GRZ Grant Aid. Private Comm. Total Central 4,082 81 148 315 4,626 Copperbelt 7,444 169 1,348 501 9,462 Eastern 3,475 179 133 581 4,368 Luapula 2,911 38 54 289 3,292 Lusaka 4,675 130 1,473 542 6,820 N. Western 2,535 73 34 172 2,814 Northern 4,173 180 143 663 5,159 Southern 4,907 208 335 705 6,155 Western 2,803 26 68 179 3,076 Total 37,005 1,084 3,736 3,947 45,772
Of the total teachers, the females constituted 47.8 percent. The Copperbelt province had the highest proportion of teachers accounting for about one fifth of the total teaching
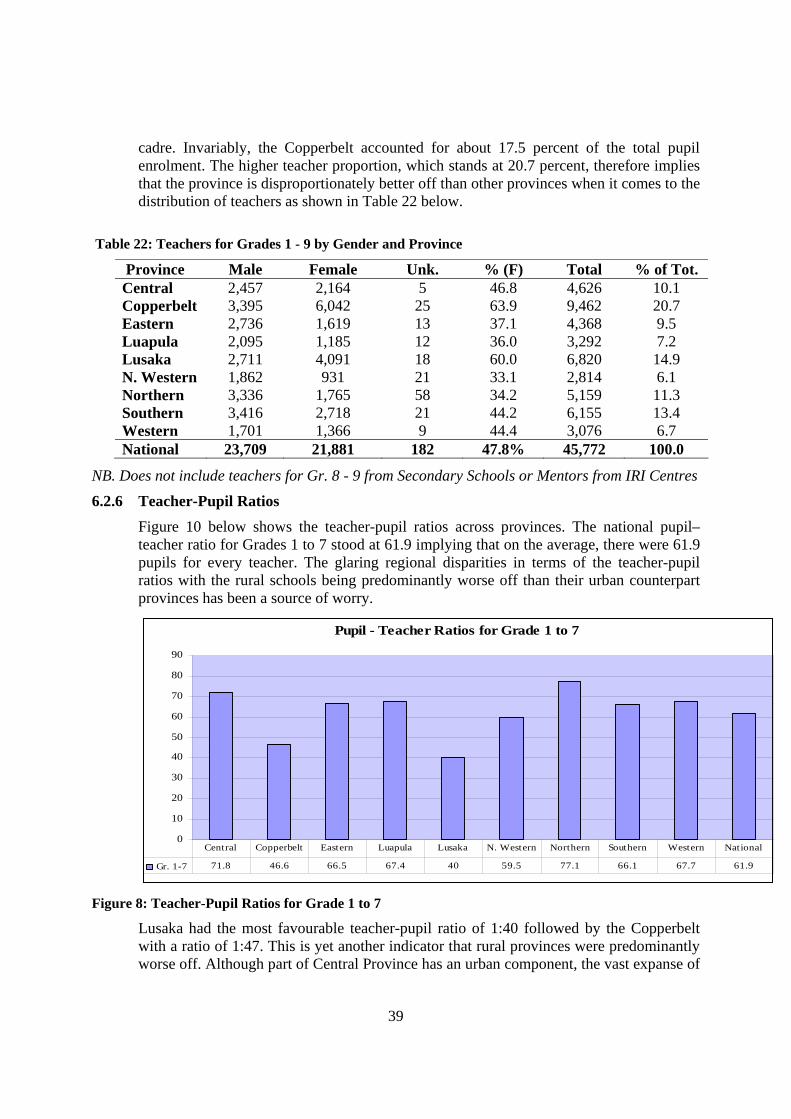
39
cadre. Invariably, the Copperbelt accounted for about 17.5 percent of the total pupil enrolment. The higher teacher proportion, which stands at 20.7 percent, therefore implies that the province is disproportionately better off than other provinces when it comes to the distribution of teachers as shown in Table 22 below.
Table 22: Teachers for Grades 1 - 9 by Gender and Province
Province Male Female Unk. % (F) Total % of Tot. Central 2,457 2,164 5 46.8 4,626 10.1 Copperbelt 3,395 6,042 25 63.9 9,462 20.7 Eastern 2,736 1,619 13 37.1 4,368 9.5 Luapula 2,095 1,185 12 36.0 3,292 7.2 Lusaka 2,711 4,091 18 60.0 6,820 14.9 N. Western 1,862 931 21 33.1 2,814 6.1 Northern 3,336 1,765 58 34.2 5,159 11.3 Southern 3,416 2,718 21 44.2 6,155 13.4 Western 1,701 1,366 9 44.4 3,076 6.7 National 23,709 21,881 182 47.8% 45,772 100.0
NB. Does not include teachers for Gr. 8 - 9 from Secondary Schools or Mentors from IRI Centres
6.2.6 Teacher-Pupil Ratios
Figure 10 below shows the teacher-pupil ratios across provinces. The national pupil–teacher ratio for Grades 1 to 7 stood at 61.9 implying that on the average, there were 61.9 pupils for every teacher. The glaring regional disparities in terms of the teacher-pupil ratios with the rural schools being predominantly worse off than their urban counterpart provinces has been a source of worry.
Pupil - Teacher Ratios for Grade 1 to 7
0
10
20
30
40
50
60
70
80
90
Gr. 1-7 71.8 46.6 66.5 67.4 40 59.5 77.1 66.1 67.7 61.9
Central Copperbelt Eastern Luapula Lusaka N. Western Northern Southern Western National
Figure 8: Teacher-Pupil Ratios for Grade 1 to 7
Lusaka had the most favourable teacher-pupil ratio of 1:40 followed by the Copperbelt with a ratio of 1:47. This is yet another indicator that rural provinces were predominantly worse off. Although part of Central Province has an urban component, the vast expanse of
40
the province is rural in nature and has one of the most challenging terrains to traverse in the country.
6.2.7 Learning Achievement and Changes over Time
Zambia has been conducting a National Assessment Survey of Learning Achievement at the middle basic education level every other year since 1999. The first survey was conducted in 1999, the second in 2001 and the third one in 2003. The primary aim of the National Assessment survey is to provide information to the Ministry of Education on how learning achievement is changing over time relative to the broader spectrum of educational inputs and process. Underlining the assessment of learning achievement are the defined performance benchmarks against which the learning achievement of pupils are assessed. In this respect, practising teachers and other educational experts define for each assessment year, the proportion of items a child should get right to be described as having attained the minimum required competencies on the one hand and the desirable competencies on the other; relative to the curriculum objectives and content. Table 19 below presents data that show trends in Learning Achievement.
Table 23: Proportion of Pupils Attaining Defined Levels of Competencies
Number of Pupils Minimum Level Desirable Level
Subject 1999 2001 2003 1999 2001 2003 1999 2001 2003
English 7,156 7,233 7,332 23.1 29.3 30.4 2.8 5.4 5.9 Maths 7,117 7,249 7,278 26.5 28.7 44.9 3.8 6.1 9.4 Icibemba 1,467 1,626 2,111 31.3 28.4 38.5 9.5 8.4 10.6 Silozi 548 511 676 36.5 31.1 53.8 13.0 7.8 22.4 Chitonga 539 733 18.4 23.9 4.6 5.9 Chinyanja 650 1,518 18.2 26.4 4.3 5.8
In Reading in English, the proportion of pupils attaining the minimum defined performance threshold rose from 23.1 percent in 1999 to 29.3 and 30.4 percent in 2001 and 2003 respectively. On the other hand the proportion of pupils attaining the defined desirable level of performance rose from 2.8 percent in 1999 to 5.4 percent in 2001 and to 5.9 percent in 2003. The proportion of pupils obtaining the minimum defined level of competence in numeracy rose from 3.8 percent in 1999 to 6.1 percent in 2001 and to a further 9.4 percent in 2003 showing somewhat a much better performance.
6.2.8 Curriculum and Educational Materials
The Ministry of Education launched a new Basic Education curriculum in 2003 which is more in line with the national and community aspirations The curriculum, at the basic education level has had long standing problems such as being overloaded, highly compartmentalized, exam oriented and not attuned to the needs of the Zambian people.

41
The realigned curriculum focuses on critical elements of education that are cardinal for further learning notably the development of literacy, numeracy and personality. The curriculum also focuses on the strengthening of skills. The revised syllabi are outcome-based, learner centred and continuous assessment oriented.
The new curriculum has five learning areas: Literacy and Languages; Mathematics; Integrated Science; Creative and Technology Studies; and Social and Development Studies. Additionally, a sixth learning area has been included called Community Studies that focuses on localized curriculum to enable formal education respond to environmental and community imperatives in a more systematic manner.
Focus has also been placed on the development and provision of relevant and appropriate educational materials for the new curriculum; the target being to achieve a pupil book ratio of 2 to 1 in every case in both rural and urban areas.
6.2.9 Financing of Basic Education
Latest information available on education expenditure is for 2003 in which year the Ministry of Education was allocated 4.21 percent of the Gross Domestic Product (GDP), of which 1.1 percent was externally financed. The proportion going to basic education stood at 1.9 percent. The total public budget allocation to the education sector was K688, 587,855,215 or translated to 143,455,803 United States Dollars at the exchange rate of K4, 800. The proportion of this total public expenditure going to basic education on the other hand stood at 45.7 percent. Ironically, of the total expenditure to Basic Education, 97.9 percent was for personal emoluments, with no allocation reflected under capital.
6.2.10 Access and participation
The figures below (11 and 12) show the numbers involved in terms of access and participation up to 2015
Grade 1 New Entrants
0
100,000
200,000
300,000
400,000
500,000
600,000
Grade 1 311,317 411,339 435,546 476,105 398,087 371,541 395,416 406,825 421,914 436,237 454,623 474,330 495,068
2003 2004 2005 2006 2007 2008 2009 2010 2011 2012 2013 2014 2015
Figure 9: Grade 1 new Entrants
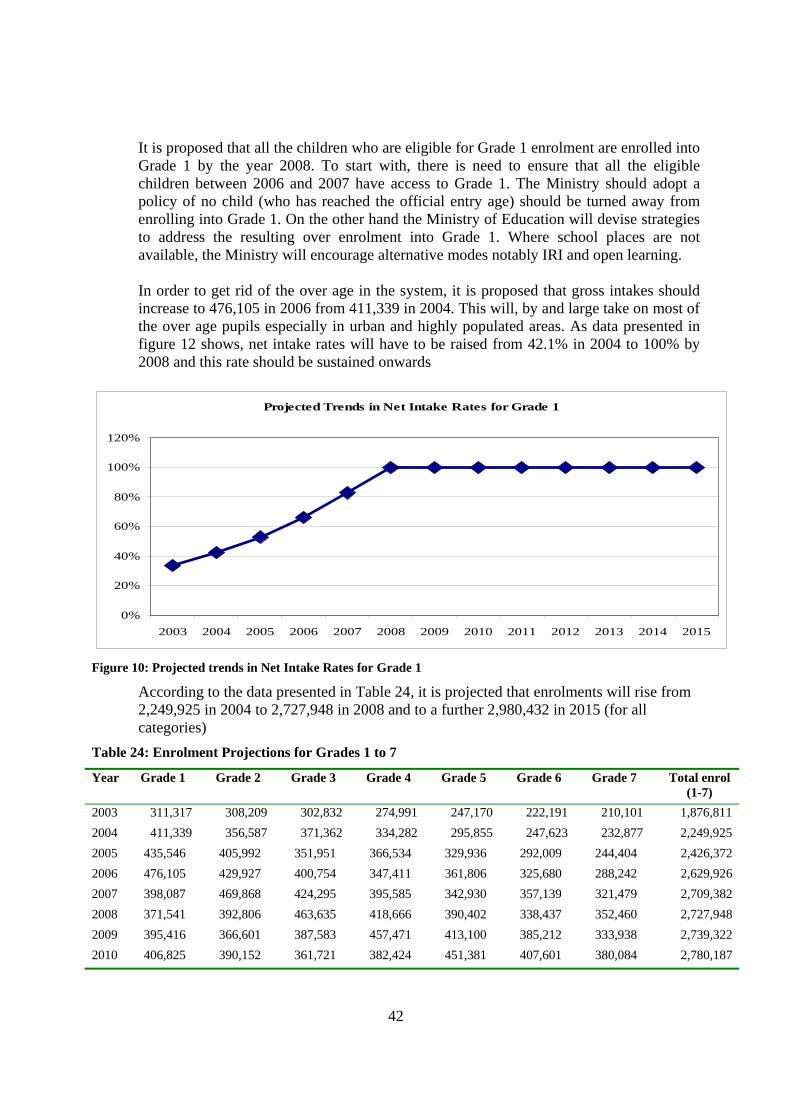
42
It is proposed that all the children who are eligible for Grade 1 enrolment are enrolled into Grade 1 by the year 2008. To start with, there is need to ensure that all the eligible children between 2006 and 2007 have access to Grade 1. The Ministry should adopt a policy of no child (who has reached the official entry age) should be turned away from enrolling into Grade 1. On the other hand the Ministry of Education will devise strategies to address the resulting over enrolment into Grade 1. Where school places are not available, the Ministry will encourage alternative modes notably IRI and open learning. In order to get rid of the over age in the system, it is proposed that gross intakes should increase to 476,105 in 2006 from 411,339 in 2004. This will, by and large take on most of the over age pupils especially in urban and highly populated areas. As data presented in figure 12 shows, net intake rates will have to be raised from 42.1% in 2004 to 100% by 2008 and this rate should be sustained onwards
Projected Trends in Net Intake Rates for Grade 1
0%
20%
40%
60%
80%
100%
120%
2003 2004 2005 2006 2007 2008 2009 2010 2011 2012 2013 2014 2015
Figure 10: Projected trends in Net Intake Rates for Grade 1
According to the data presented in Table 24, it is projected that enrolments will rise from 2,249,925 in 2004 to 2,727,948 in 2008 and to a further 2,980,432 in 2015 (for all categories)
Table 24: Enrolment Projections for Grades 1 to 7
Year Grade 1 Grade 2 Grade 3 Grade 4 Grade 5 Grade 6 Grade 7 Total enrol (1-7)
2003 311,317 308,209 302,832 274,991 247,170 222,191 210,101 1,876,811 2004 411,339 356,587 371,362 334,282 295,855 247,623 232,877 2,249,925 2005 435,546 405,992 351,951 366,534 329,936 292,009 244,404 2,426,372 2006 476,105 429,927 400,754 347,411 361,806 325,680 288,242 2,629,926 2007 398,087 469,868 424,295 395,585 342,930 357,139 321,479 2,709,382 2008 371,541 392,806 463,635 418,666 390,402 338,437 352,460 2,727,948 2009 395,416 366,601 387,583 457,471 413,100 385,212 333,938 2,739,322 2010 406,825 390,152 361,721 382,424 451,381 407,601 380,084 2,780,187

43
2011 421,914 401,536 385,080 357,019 377,452 445,513 402,302 2,790,816 2012 436,237 416,640 396,517 380,267 352,556 372,734 439,944 2,794,894 2013 454,623 430,958 411,598 391,719 375,665 348,290 368,224 2,781,078 2014 474,330 449,259 425,873 406,741 387,097 371,232 344,180 2,858,713 2015 495,068 468,828 444,047 420,933 402,023 382,607 366,926 2,980,432
Gross Enrolment Trends (2004 to 2015)
0%
20%
40%
60%
80%
100%
120%
140%
GER (1to7) 91% 107% 112% 119% 122% 120% 117% 116% 112% 108% 103% 101% 102%
GER (1to9) 81% 95% 98% 104% 108% 109% 108% 108% 106% 105% 104% 104% 102%
2003 2004 2005 2006 2007 2008 2009 2010 2011 2012 2013 2014 2015
Figure 11: Gross Enrolment Trends (2004 to 2015)
By the year 2015, the Grade 7 composite examinations should cease being selection examinations and should be transformed into a truly meaningful assessment instrument of learning achievement.
Basic Education Enrollment Projections (2004-2015)
0
500,000
1,000,000
1,500,000
2,000,000
2,500,000
3,000,000
3,500,000
4,000,000
Total enrol (1-7) 1,876,811 2,249,925 2,426,372 2,629,926 2,709,382 2,727,948 2,739,322 2,780,187 2,790,816 2,794,894 2,781,078 2,858,713 2,980,432
Total enrol (1-9) 2,090,319 2,483,984 2,656,131 2,870,703 3,015,485 3,113,648 3,195,399 3,264,060 3,313,188 3,386,166 3,456,656 3,566,354 3,652,763
2003 2004 2005 2006 2007 2008 2009 2010 2011 2012 2013 2014 2015
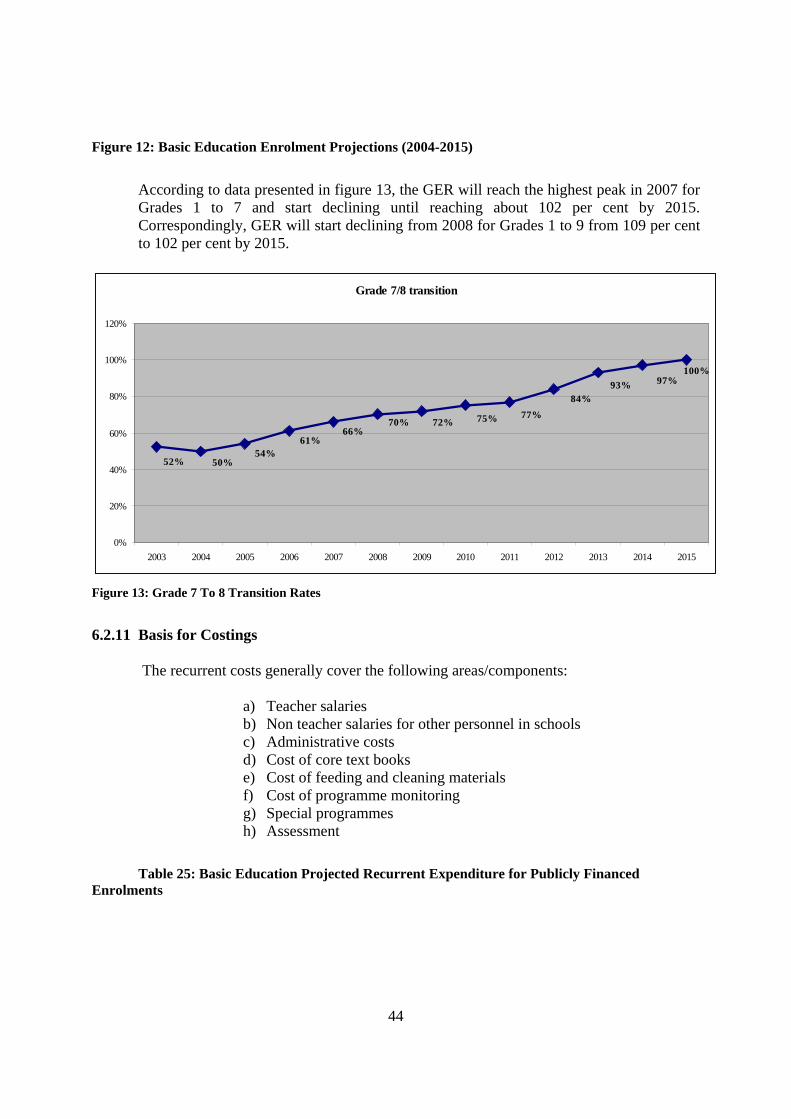
44
Figure 12: Basic Education Enrolment Projections (2004-2015)
According to data presented in figure 13, the GER will reach the highest peak in 2007 for Grades 1 to 7 and start declining until reaching about 102 per cent by 2015. Correspondingly, GER will start declining from 2008 for Grades 1 to 9 from 109 per cent to 102 per cent by 2015.
Grade 7/8 transition
100%97%93%
84%77%
72% 75%
52% 50%54%
61%66%
70%
0%
20%
40%
60%
80%
100%
120%
2003 2004 2005 2006 2007 2008 2009 2010 2011 2012 2013 2014 2015
Figure 13: Grade 7 To 8 Transition Rates
6.2.11 Basis for Costings
The recurrent costs generally cover the following areas/components:
a) Teacher salaries b) Non teacher salaries for other personnel in schools c) Administrative costs d) Cost of core text books e) Cost of feeding and cleaning materials f) Cost of programme monitoring g) Special programmes h) Assessment
Table 25: Basic Education Projected Recurrent Expenditure for Publicly Financed
Enrolments
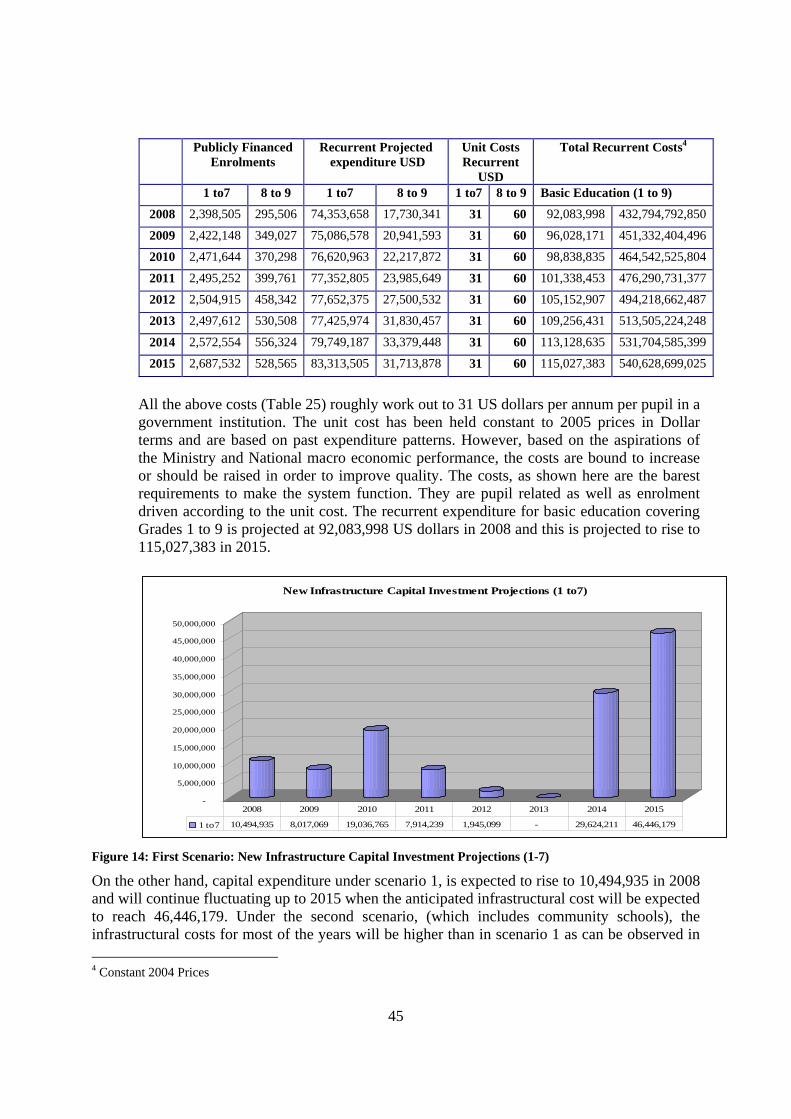
45
Publicly Financed Enrolments
Recurrent Projected expenditure USD
Unit Costs Recurrent
USD
Total Recurrent Costs4
1 to7 8 to 9 1 to7 8 to 9 1 to7 8 to 9 Basic Education (1 to 9)
2008 2,398,505 295,506 74,353,658 17,730,341 31 60 92,083,998 432,794,792,850
2009 2,422,148 349,027 75,086,578 20,941,593 31 60 96,028,171 451,332,404,496
2010 2,471,644 370,298 76,620,963 22,217,872 31 60 98,838,835 464,542,525,804
2011 2,495,252 399,761 77,352,805 23,985,649 31 60 101,338,453 476,290,731,377
2012 2,504,915 458,342 77,652,375 27,500,532 31 60 105,152,907 494,218,662,487
2013 2,497,612 530,508 77,425,974 31,830,457 31 60 109,256,431 513,505,224,248
2014 2,572,554 556,324 79,749,187 33,379,448 31 60 113,128,635 531,704,585,399
2015 2,687,532 528,565 83,313,505 31,713,878 31 60 115,027,383 540,628,699,025
All the above costs (Table 25) roughly work out to 31 US dollars per annum per pupil in a government institution. The unit cost has been held constant to 2005 prices in Dollar terms and are based on past expenditure patterns. However, based on the aspirations of the Ministry and National macro economic performance, the costs are bound to increase or should be raised in order to improve quality. The costs, as shown here are the barest requirements to make the system function. They are pupil related as well as enrolment driven according to the unit cost. The recurrent expenditure for basic education covering Grades 1 to 9 is projected at 92,083,998 US dollars in 2008 and this is projected to rise to 115,027,383 in 2015.
-
5,000,000
10,000,000
15,000,000
20,000,000
25,000,000
30,000,000
35,000,000
40,000,000
45,000,000
50,000,000
New Infrastructure Capital Investment Projections (1 to7)
1 to7 10,494,935 8,017,069 19,036,765 7,914,239 1,945,099 - 29,624,211 46,446,179
2008 2009 2010 2011 2012 2013 2014 2015
Figure 14: First Scenario: New Infrastructure Capital Investment Projections (1-7)
On the other hand, capital expenditure under scenario 1, is expected to rise to 10,494,935 in 2008 and will continue fluctuating up to 2015 when the anticipated infrastructural cost will be expected to reach 46,446,179. Under the second scenario, (which includes community schools), the infrastructural costs for most of the years will be higher than in scenario 1 as can be observed in 4 Constant 2004 Prices
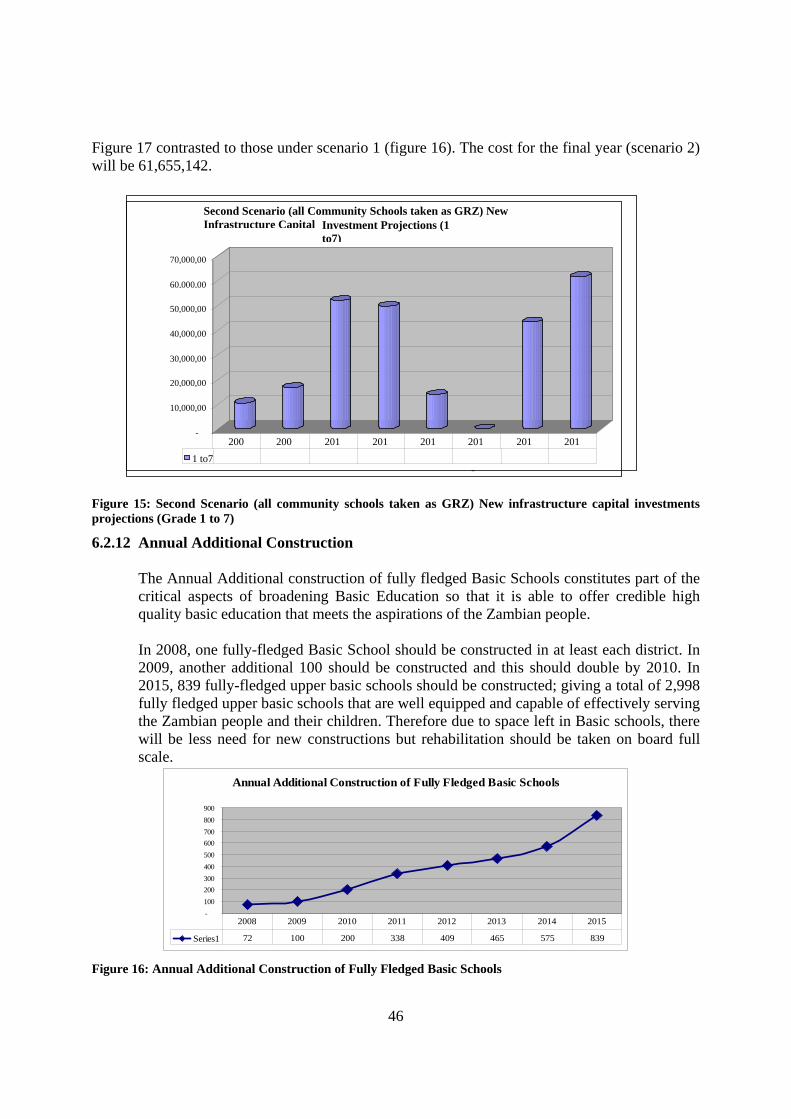
46
Figure 17 contrasted to those under scenario 1 (figure 16). The cost for the final year (scenario 2) will be 61,655,142.
Figure 15: Second Scenario (all community schools taken as GRZ) New infrastructure capital investments projections (Grade 1 to 7)
6.2.12 Annual Additional Construction
The Annual Additional construction of fully fledged Basic Schools constitutes part of the critical aspects of broadening Basic Education so that it is able to offer credible high quality basic education that meets the aspirations of the Zambian people. In 2008, one fully-fledged Basic School should be constructed in at least each district. In 2009, another additional 100 should be constructed and this should double by 2010. In 2015, 839 fully-fledged upper basic schools should be constructed; giving a total of 2,998 fully fledged upper basic schools that are well equipped and capable of effectively serving the Zambian people and their children. Therefore due to space left in Basic schools, there will be less need for new constructions but rehabilitation should be taken on board full scale.
Annual Additional Construction of Fully Fledged Basic Schools
-100200300400500600700800900
Series1 72 100 200 338 409 465 575 839
2008 2009 2010 2011 2012 2013 2014 2015
Figure 16: Annual Additional Construction of Fully Fledged Basic Schools
-
10,000,00
20,000,00
30,000,00
40,000,00
50,000,00
60,000,00
70,000,00
Second Scenario (all Community Schools taken as GRZ) New Infrastructure Capital Investment Projections (1
to7)
1 to7 -
200 200 201 201 201 201 201 201
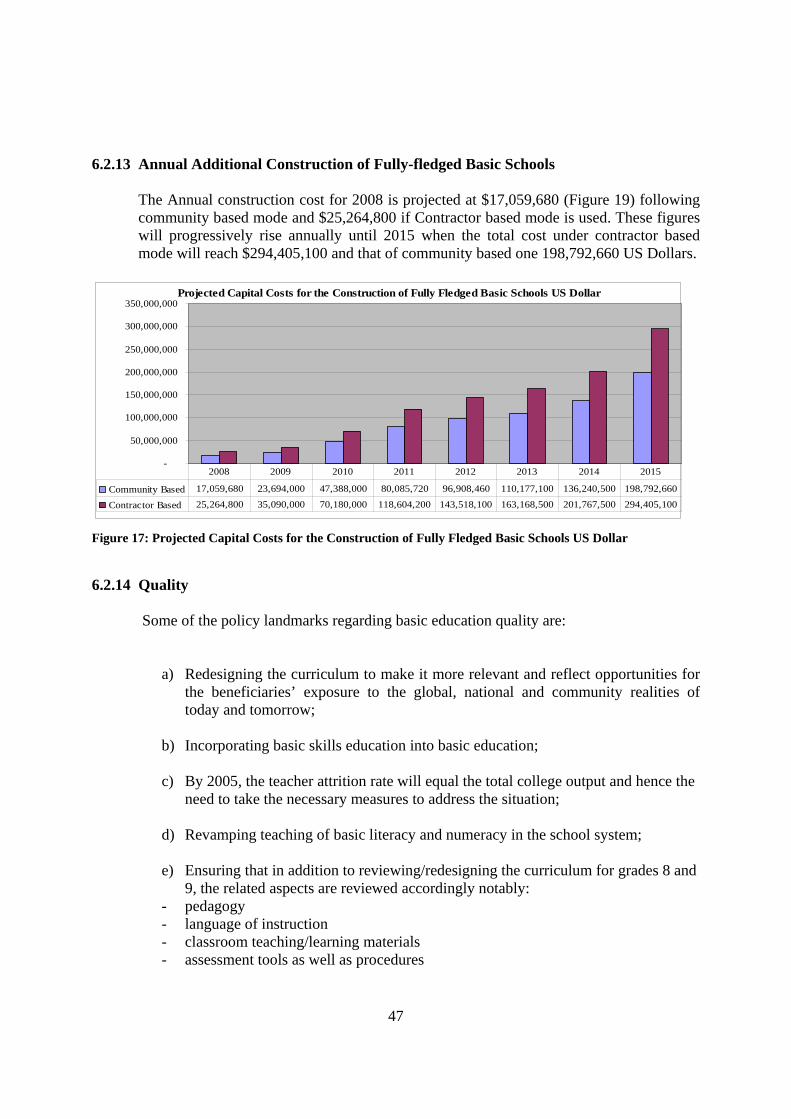
47
6.2.13 Annual Additional Construction of Fully-fledged Basic Schools
The Annual construction cost for 2008 is projected at $17,059,680 (Figure 19) following community based mode and $25,264,800 if Contractor based mode is used. These figures will progressively rise annually until 2015 when the total cost under contractor based mode will reach $294,405,100 and that of community based one 198,792,660 US Dollars.
Projected Capital Costs for the Construction of Fully Fledged Basic Schools US Dollar
-
50,000,000
100,000,000
150,000,000
200,000,000
250,000,000
300,000,000
350,000,000
Community Based 17,059,680 23,694,000 47,388,000 80,085,720 96,908,460 110,177,100 136,240,500 198,792,660
Contractor Based 25,264,800 35,090,000 70,180,000 118,604,200 143,518,100 163,168,500 201,767,500 294,405,100
2008 2009 2010 2011 2012 2013 2014 2015
Figure 17: Projected Capital Costs for the Construction of Fully Fledged Basic Schools US Dollar
6.2.14 Quality Some of the policy landmarks regarding basic education quality are:
a) Redesigning the curriculum to make it more relevant and reflect opportunities for the beneficiaries’ exposure to the global, national and community realities of today and tomorrow;
b) Incorporating basic skills education into basic education; c) By 2005, the teacher attrition rate will equal the total college output and hence the
need to take the necessary measures to address the situation;
d) Revamping teaching of basic literacy and numeracy in the school system;
e) Ensuring that in addition to reviewing/redesigning the curriculum for grades 8 and 9, the related aspects are reviewed accordingly notably:
- pedagogy - language of instruction - classroom teaching/learning materials - assessment tools as well as procedures
48
- basic competencies - pupil-teacher contact time
6.3 Literacy Education
“achieving a 50% improvement in levels of adult literacy by 2015, especially for women, and equitable access to basic and continuing education for all adults”
Literacy programmes in Zambia began in 1965 in the Ministry of Community Development and Social Services (MCDSS). From 1965 to 1970, these programmes were placed under one Unit, the Literacy Unit (LU). The Unit operated as a semi-independent wing and was separately and directly funded by the government. Its employees were non civil servants but experts in literacy education and were on contract conditions of service. However, from 1971, the government changed the status of the Unit. The employees were incorporated into the Civil Service and the Unit became part of the Department of Community Development. Since 1971, the institutional arrangement regarding the Literacy Unit has not, however changed i.e. it has not been transformed into a separate department of Literacy Education. To date, government has been funding the Unit through the Department of Community Development. Until now, Literacy Education has been perceived to be an affair for only the Zambian adult population i.e. a matter for adult education. It has been understood that unless one were an adult, one could not benefit from the services of Literacy Education as provided by government and other organisations. In the new context of understanding, Literacy Education does not only focus on adults but also on children and the youth. It concerns illiterate children with no opportunity to attend school or those who dropped out of school too early and who are not able to read, write or count. Literacy rates in accordance with international norms and notably under EFA will focus on those aged fifteen and above.
According to the UNESCO definition (1995) a person is literate ‘when he/she has acquired knowledge and skills in reading and writing, which enable a person to engage in those activities in which literacy is assumed’ (Cited in ZNC-UNESCO Report on Literacy and Non-Formal Education, 2003, page 23). Arising from this definition, the same report proposes an operational definition for Zambia as follows, ‘a literate person is one with ability to read, write, calculate, keep records and accounts and apply knowledge, know-how and attitudes acquired critically, creatively and effectively to functioning of the self, family, community, nation and the environment in which one is found’.
Literacy Education may be categorised as Basic, Functional or Integrated. Basic Literacy is the ability to read, write and count. This type and level of education brings fundamental changes in the life of an individual who, prior to that time was illiterate. Since basic literacy empowers the individuals concerned with skills to read, write and count, it increases opportunities in one’s life in so far as understanding and acting on the basis of the written word is concerned. Functional Literacy is the ability to perform a function (a duty, service or business) by the individual who has acquired basic skills in reading, writing and counting in order to understand issues related to income-generating activities such as crop-growing, nutrition, health, childcare and issues of household management.
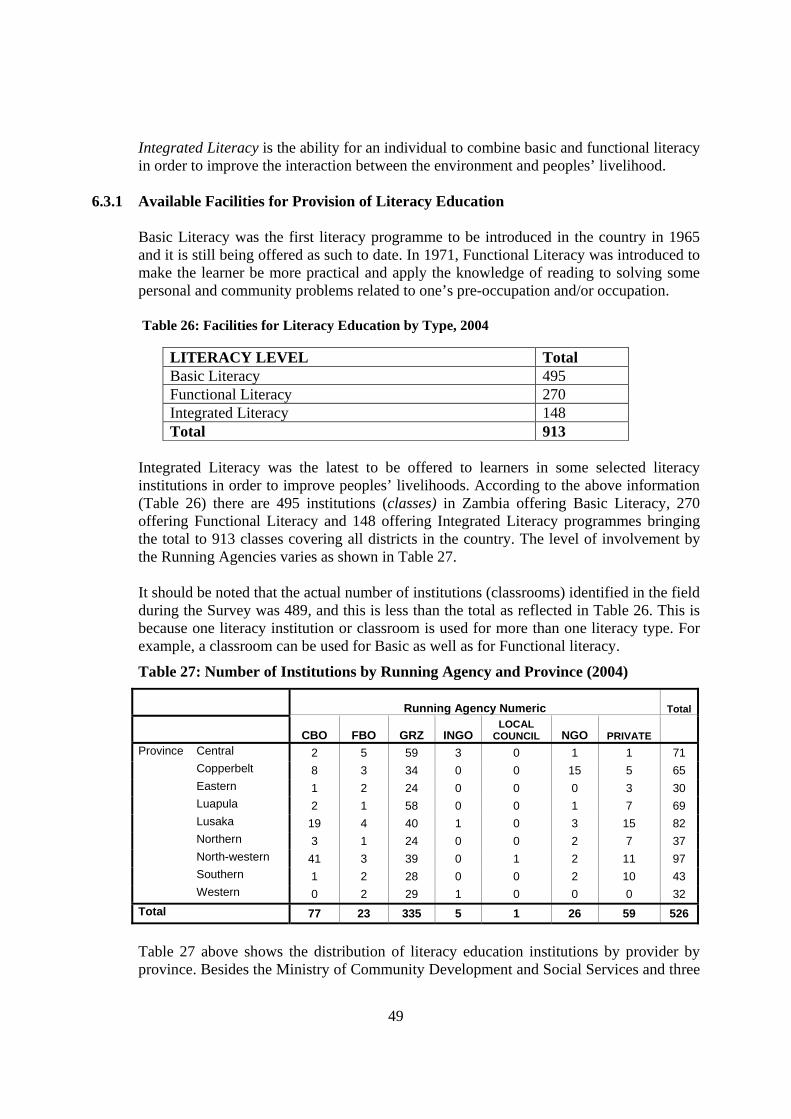
49
Integrated Literacy is the ability for an individual to combine basic and functional literacy in order to improve the interaction between the environment and peoples’ livelihood.
6.3.1 Available Facilities for Provision of Literacy Education
Basic Literacy was the first literacy programme to be introduced in the country in 1965 and it is still being offered as such to date. In 1971, Functional Literacy was introduced to make the learner be more practical and apply the knowledge of reading to solving some personal and community problems related to one’s pre-occupation and/or occupation.
Table 26: Facilities for Literacy Education by Type, 2004
Integrated Literacy was the latest to be offered to learners in some selected literacy institutions in order to improve peoples’ livelihoods. According to the above information (Table 26) there are 495 institutions (classes) in Zambia offering Basic Literacy, 270 offering Functional Literacy and 148 offering Integrated Literacy programmes bringing the total to 913 classes covering all districts in the country. The level of involvement by the Running Agencies varies as shown in Table 27.
It should be noted that the actual number of institutions (classrooms) identified in the field during the Survey was 489, and this is less than the total as reflected in Table 26. This is because one literacy institution or classroom is used for more than one literacy type. For example, a classroom can be used for Basic as well as for Functional literacy.
Table 27: Number of Institutions by Running Agency and Province (2004)
Running Agency Numeric Total
CBO FBO GRZ INGO LOCAL
COUNCIL NGO PRIVATE Province Central 2 5 59 3 0 1 1 71 Copperbelt 8 3 34 0 0 15 5 65 Eastern 1 2 24 0 0 0 3 30 Luapula 2 1 58 0 0 1 7 69 Lusaka 19 4 40 1 0 3 15 82 Northern 3 1 24 0 0 2 7 37 North-western 41 3 39 0 1 2 11 97 Southern 1 2 28 0 0 2 10 43 Western 0 2 29 1 0 0 0 32 Total 77 23 335 5 1 26 59 526
Table 27 above shows the distribution of literacy education institutions by provider by province. Besides the Ministry of Community Development and Social Services and three
LITERACY LEVEL Total Basic Literacy 495 Functional Literacy 270 Integrated Literacy 148 Total 913
50
other Line-Ministries are offering literacy education. These are: Ministry of Education, Ministry of Local Government and Housing and the Ministry of Science, Technology and Vocational Training.
6.3.2 Access to and Participation in Literacy Education
The literacy institutions referred to above had a total of 33,157 learners, of whom 14,391 were male and 18,766 were female. The learners were taught by 1,933 teachers. Of this figure, 885 were female and 1,048 were male; giving a teacher-pupil ratio of 17 learners per teacher. These teachers are mainly volunteers or part-time and with little or no formal training in teaching skills. The majority of teachers have humble education of Grade 9, while only a few of them completed Grade 12.
6.3.3 Financing of Literacy Education
The major difficulties that Literacy education has faced in Zambia for a long time have had to do with finances to run the institutions. The government, which is the single most important provider of Literacy education and in charge of more institutions than any other organisation has been providing inadequate funds since 1965. The amounts released for literacy education have been very small; with district allocations ranging from K330,000 to K570,000 per year. While government does not impose any charges for literacy education, one of the key sources of funding for some FBOs, NGOs, INGOs and Private organisations included student fees, This is in addition to funds generated through donations and fundraising ventures. The amounts reflected in these institutions in 2004 ranged from K350,000 to K1,500,000 per institution. But whether government institution or not, the funds raised or allocated to literacy education were mainly used for teachers/instructors allowances and purchase of teaching and learning materials.
6.3.4 Literacy Levels in Zambia
The illiteracy rates in Zambia have been fluctuating since 1965. At the time of political independence in 1964, Zambia had a population of about 3,000,000 people. Of this number, 67% of age 15 years and above were illiterate. In 1980, the number dropped to 41.2% for the same category of the population. In 1990, Zambia had a population of 8.6 million people. Out of this figure, 27% of age 15 years and above were illiterate. However, in the same year, the population between ages 7 and 9 years had 2.5% illiteracy rate while the population between 9 and 14 years had 14 percent illiteracy rate. Literacy rate in 2004 for those aged 15 and above was estimated to be 67.2 percent per cent, while illiteracy was at 32.8 percent.
An examination of the enrolment figures for literacy education for the period 1990 to 1995 (Central Statistics Office) shows a serious decline from 15,514 in 1990 to 10,330 in
51
1995 and it continued to decline to about 2,500 participants annually thereafter. According to the same figures, illiteracy rates were much higher for women than for men.
6.3.5 Equity in Literacy Education
It has been explained, in the previous paragraphs that the practice in Zambia has been to define literacy education in terms of ‘adults learning how to read, write and count.’ An adult was defined, (irrespective of age), as an order, elderly or even married person. Children, youths and adolescents who were unable to read, write and count were therefore not perceived as beneficiaries of the adult literacy programmes.
The literacy figures from the MCDSS before 2004 show that from 1966 to 1985, 14,581 male adults and 91,456 female adults enrolled for Basic literacy. Between 1990 and 1995, the Department of Community Development trained 46,522 literacy participants of which 32,565 (70%) were women. However, a survey undertaken in 2004 revealed that there were 14,391 males and 18,766 female learners in literacy education in the country (EFA Secretariat, 2004)5.
The 2004 statistics show that the total figure for male participants is slightly less than that of females. Generally, there are more females participating in literacy programmes than males. Cumulatively therefore, equity in literacy education has been in favour of women for since 1965, statistics have shown that more women have participated in literacy education than men.
It should be noted though that currently, the Literacy Programmes in the Department of Community Development, the main source of data since 1996, do not cater for the handicapped persons; thereby worsening cases of illiteracy among this population group. It should also be further noted that data supplied centrally by the Department of Distance and Continuing Education were deleted from the data base because of the distortions in the figures.
6.3.6 Quality and Relevance of Literacy Education
Literate parents, unlike the non-literate ones, tend to be more predisposed to sending their children to school and encourage them to be educated. They understand developmental issues of their country better than their illiterate counterparts and they are also in a better position to reduce their own levels of poverty. Literate farmers will for instance, apply the inputs more correctly and improve their crop yields. Their knowledge is normally transferred to their literate children and eventually it helps in harnessing wealth, reducing poverty and improving their general health. Thus, from the National Development Objectives point of view, literacy education is very relevant to the national aspirations in as far as poverty reduction is concerned. However, the desired quality of literacy education in Zambia has not yet been achieved mainly due to a number of reasons as earlier highlighted.
5 The data supplied by the Directorate of Distance and Continuing Education in Lusaka (HQ) and Northern Province have been excluded

52
6.3.7 Projected Access and participation
Literacy rates are projected to be halved by 2015. However, when that happens, at the current population growth rate, there will still be 1,537,067 illiterate persons as can be noted in Table 28, under scenario 1. However, if a decision is taken to target reduction of illiteracy by 80% by 2015, this will result in having only (approximately) 618,576 illiterate adults.
Literacy Projections
-
500,000
1,000,000
1,500,000
2,000,000
2,500,000
3,000,000
3,500,000
Reduced by 50% 2,062,386 2,050,873 2,028,670 2,002,074 1,970,944 1,949,674 1,908,626 1,893,428 1,843,509 1,717,908 1,537,067
Reduced by 80% 2,062,386 1,985,972 1,914,850 1,836,385 1,757,484 1,627,172 1,529,992 1,381,471 1,143,658 867,902 618,576
Constant at 32.8% 2,062,386 2,128,754 2,196,052 2,264,414 2,333,825 2,404,110 2,534,532 2,665,427 2,799,402 2,934,760 3,074,135
2005 2006 2007 2008 2009 2010 2011 2012 2013 2014 2015
Figure 18: Illiteracy rate Projections at 50% and 80% Reduction
6.3.8 Costs and Scenarios Ironically the cost differentials are very low; given that an estimated literacy programme in total costs 3 US dollars. Table 28: Literacy Education for Target Population and the Projected Costs Scenarios Second
Scenario First
Scenario Second Scenario First Scenario Second
Scenario First Scenario
15 + pop Illit. proj. reduce by
80%
Illit.proj. reduce by
50%
Targeted students
Trainees per year
US dollars US dollars
2005 6,287,762 2,062,386 2,062,386 - 2006 6,490,104 1,985,972 2,050,873 190,745 190,745 1,192,060 179,604 2007 6,695,281 1,914,850 2,028,670 368,971 178,226 1,109,495 346,362 2008 6,903,702 1,836,385 2,002,074 558,592 189,621 1,224,064 414,906 2009 7,115,320 1,757,484 1,970,944 759,588 200,996 1,230,851 485,627 2010 7,329,603 1,627,172 1,949,674 1,101,729 342,142 2,032,870 331,800 2011 7,727,232 1,529,992 1,908,626 1,682,710 580,980 1,516,007 640,350 2012 8,126,302 1,381,471 1,893,428 2,144,310 461,600 2,316,921 237,088
53
2013 8,534,763 1,143,658 1,843,509 2,409,948 265,638 3,709,884 778,745 2014 8,947,439 867,902 1,717,908 2,857,399 447,451 4,301,804 1,959,368 2015 9,372,362 800,000 2,061,920 3,230,116 372,717 3,889,481 2,821,118 6.4 Basic Skills Education
“Ensuring that the learning needs of all young people and adults are met through equitable access to appropriate learning and life skills programmes”
In the context of Zambia’s history of basic skills education, the concept has almost always been understood to refer to technical and vocational training and also as it is opposed to formal learning of such school subjects as mathematics, geography, history, English etc. Throughout the colonial period, technical and vocational training and practice for Africans was relegated to the menial or bottom-ladder jobs (carpentry, bricklaying, plumbing etc) that offered no real socio-economic upward mobility for them – unlike their white counterparts who appeared to place emphasis on studying academic subjects. At the time of independence in 1964, technical and vocational training had therefore become the most undervalued and the most underdeveloped educational area (Kelly, 1999, Page 114). Basic Skills Education, in the context of EFA refers not so much to technical and vocational training, usually offered out-of-school e.g. at tertiary level but to the acquisition within school of pre-vocational and life skills, and the development of individual learner talents for one’s survival, development and self-worth. The framework provides for a meaningful linkage in the acquisition of knowledge, skills, values and attitudes; in light of the five pillars of education i.e. learning to know (continually acquiring the instruments of understanding and recognising challenges), to do (acting with determination), to live together (being party to collective responsibility and engaging in constructive partnerships), to be (answering to the individuality of human dignity) and learning to become or promoting the personality of human creativity.6 In this regard, skills education also refers to acquisition of values, including customs and traditions and practices that allow the learner to effectively fit into or hive him/herself out of that society and community. But as earlier pointed out under 3.2.4 above, basic skills are not provided as part of over all education for children in Zambia. It is in fact perceived and offered as a career pathway for later use in life, i.e. after the school leaver is no longer in a school-learning situation. The limited approach in programming this aspect of education makes it less accessible and barely relevant to school going populations. Therefore, opportunities in this area of learning are not evenly distributed, as the bulk of learners are not exposed to skills acquisition as part of their basic education curriculum. Data collected countrywide show that basic skills education is not readily examinable – even where it is offered. Besides, it does not count highly in scoring the learners’
6 The first four of the five pillars of learning were proposed by the International Commission on Education for the 21st century (UNESCO, 1996).

54
competences and it is seen as only a stop gap measure before one finds something more useful to do in life. The information obtained from the field on the current profile of Basic Skills Education is provided below.
6.4.1 Participation in Provision of Basic Skills Education Table 29: Basic Skills requisites/Support Services by Provider
Running Agency
Benches Chairs C/rooms Tables Toilets Water Source
W/Shops
CBO 149 458 55 173 60 19 12 FBO 640 2,152 81 1,167 144 52 46 GRZ 595 3,573 216 2,287 410 90 108 INGO 19 200 7 78 15 4 4 LOCAL COUNCIL
10 0 6 0 2 3 6
NGO 216 452 67 145 84 24 12 PRIVATE 313 1,087 80 614 132 46 34
The above statistics show that government (GRZ) institutions have more infrastructure than other institutions; hence giving the former a lead in the provision of skills education opportunities to trainees than the other players.
The GRZ is followed by the Faith Based Organisations (FBOs), the Non-Governmental Organisations (NGOs) and finally, the Private Institutions. The water sources range from boreholes, tap water and wells. The data further show that Local Councils are running the least number of skills education facilities. Table 30: Basic Skills Education by Provider/Learner Participation by Gender
Organisation Type Learners Female Male CBO 566 427 FBO 2166 707 GRZ 2113 2515 INGO 106 101 Private 510 620 Total 5481 4370
Table 30 above shows that government provides skills education for 4,628 (male plus female learners country-wide) while CBOs, FBOs and INGOs combined do so for 4,073 and private providers for 1,130. This ranks the non governmental organisations in first position in skills education provision.
6.4.2 Gender and Equity in Basic Skills Provision
In as far as gender and equity are concerned, Table 30 also shows that of the total number of 9,851 participants in Basic Skills Education, 5,481 are female while 4,370 are male.
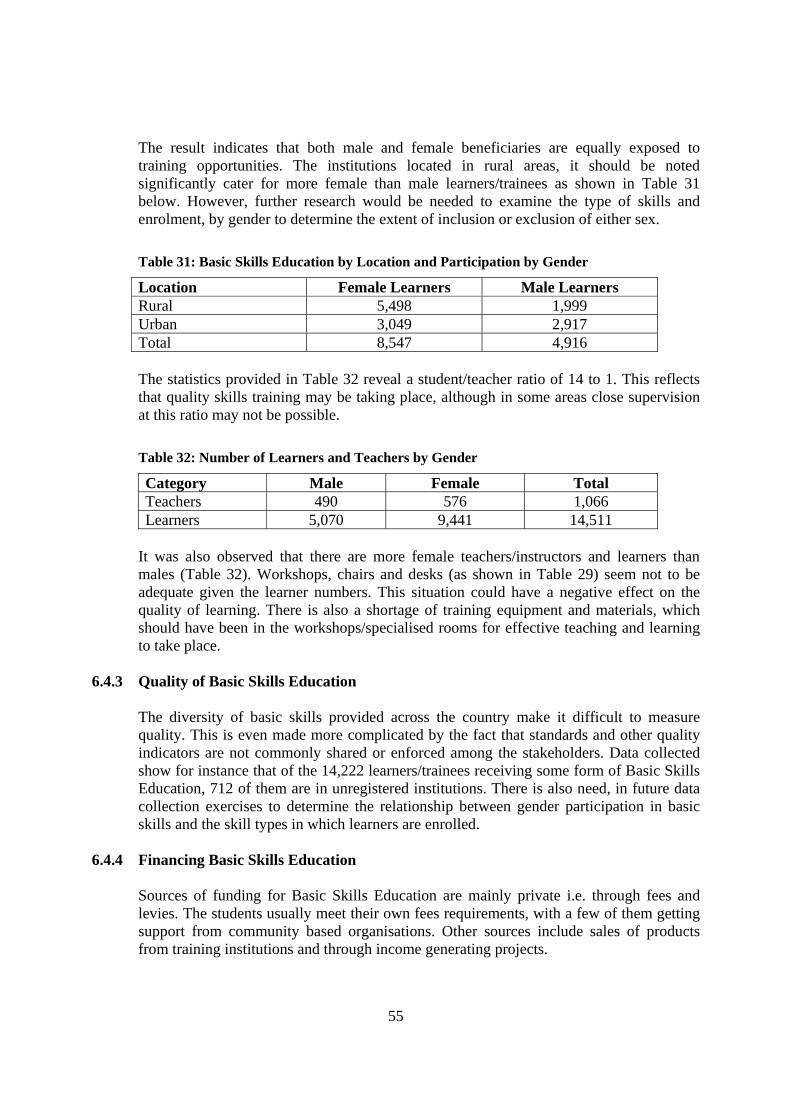
55
The result indicates that both male and female beneficiaries are equally exposed to training opportunities. The institutions located in rural areas, it should be noted significantly cater for more female than male learners/trainees as shown in Table 31 below. However, further research would be needed to examine the type of skills and enrolment, by gender to determine the extent of inclusion or exclusion of either sex.
Table 31: Basic Skills Education by Location and Participation by Gender
Location Female Learners Male Learners Rural 5,498 1,999 Urban 3,049 2,917 Total 8,547 4,916 The statistics provided in Table 32 reveal a student/teacher ratio of 14 to 1. This reflects that quality skills training may be taking place, although in some areas close supervision at this ratio may not be possible. Table 32: Number of Learners and Teachers by Gender
Category Male Female Total Teachers 490 576 1,066 Learners 5,070 9,441 14,511
It was also observed that there are more female teachers/instructors and learners than males (Table 32). Workshops, chairs and desks (as shown in Table 29) seem not to be adequate given the learner numbers. This situation could have a negative effect on the quality of learning. There is also a shortage of training equipment and materials, which should have been in the workshops/specialised rooms for effective teaching and learning to take place.
6.4.3 Quality of Basic Skills Education
The diversity of basic skills provided across the country make it difficult to measure quality. This is even made more complicated by the fact that standards and other quality indicators are not commonly shared or enforced among the stakeholders. Data collected show for instance that of the 14,222 learners/trainees receiving some form of Basic Skills Education, 712 of them are in unregistered institutions. There is also need, in future data collection exercises to determine the relationship between gender participation in basic skills and the skill types in which learners are enrolled.
6.4.4 Financing Basic Skills Education
Sources of funding for Basic Skills Education are mainly private i.e. through fees and levies. The students usually meet their own fees requirements, with a few of them getting support from community based organisations. Other sources include sales of products from training institutions and through income generating projects.
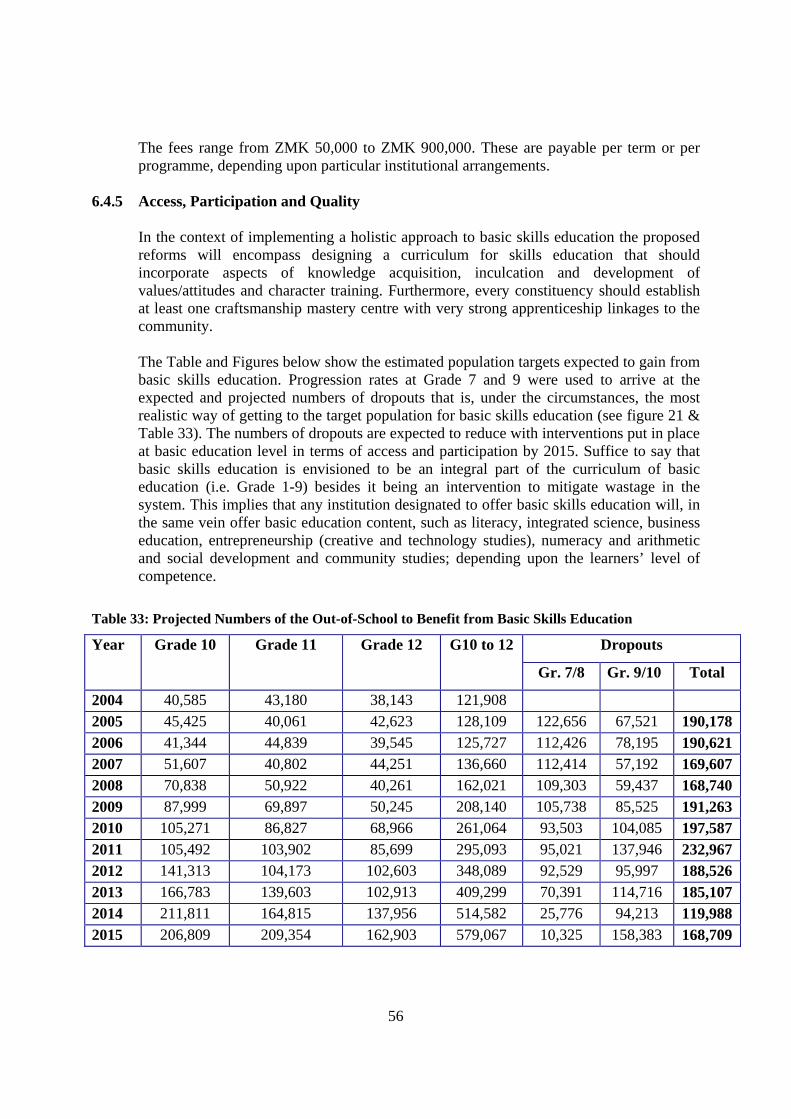
56
The fees range from ZMK 50,000 to ZMK 900,000. These are payable per term or per programme, depending upon particular institutional arrangements.
6.4.5 Access, Participation and Quality In the context of implementing a holistic approach to basic skills education the proposed reforms will encompass designing a curriculum for skills education that should incorporate aspects of knowledge acquisition, inculcation and development of values/attitudes and character training. Furthermore, every constituency should establish at least one craftsmanship mastery centre with very strong apprenticeship linkages to the community. The Table and Figures below show the estimated population targets expected to gain from basic skills education. Progression rates at Grade 7 and 9 were used to arrive at the expected and projected numbers of dropouts that is, under the circumstances, the most realistic way of getting to the target population for basic skills education (see figure 21 & Table 33). The numbers of dropouts are expected to reduce with interventions put in place at basic education level in terms of access and participation by 2015. Suffice to say that basic skills education is envisioned to be an integral part of the curriculum of basic education (i.e. Grade 1-9) besides it being an intervention to mitigate wastage in the system. This implies that any institution designated to offer basic skills education will, in the same vein offer basic education content, such as literacy, integrated science, business education, entrepreneurship (creative and technology studies), numeracy and arithmetic and social development and community studies; depending upon the learners’ level of competence.
Table 33: Projected Numbers of the Out-of-School to Benefit from Basic Skills Education
Dropouts Year Grade 10 Grade 11 Grade 12 G10 to 12
Gr. 7/8 Gr. 9/10 Total
2004 40,585 43,180 38,143 121,908 2005 45,425 40,061 42,623 128,109 122,656 67,521 190,1782006 41,344 44,839 39,545 125,727 112,426 78,195 190,6212007 51,607 40,802 44,251 136,660 112,414 57,192 169,6072008 70,838 50,922 40,261 162,021 109,303 59,437 168,7402009 87,999 69,897 50,245 208,140 105,738 85,525 191,2632010 105,271 86,827 68,966 261,064 93,503 104,085 197,5872011 105,492 103,902 85,699 295,093 95,021 137,946 232,9672012 141,313 104,173 102,603 348,089 92,529 95,997 188,5262013 166,783 139,603 102,913 409,299 70,391 114,716 185,1072014 211,811 164,815 137,956 514,582 25,776 94,213 119,9882015 206,809 209,354 162,903 579,067 10,325 158,383 168,709
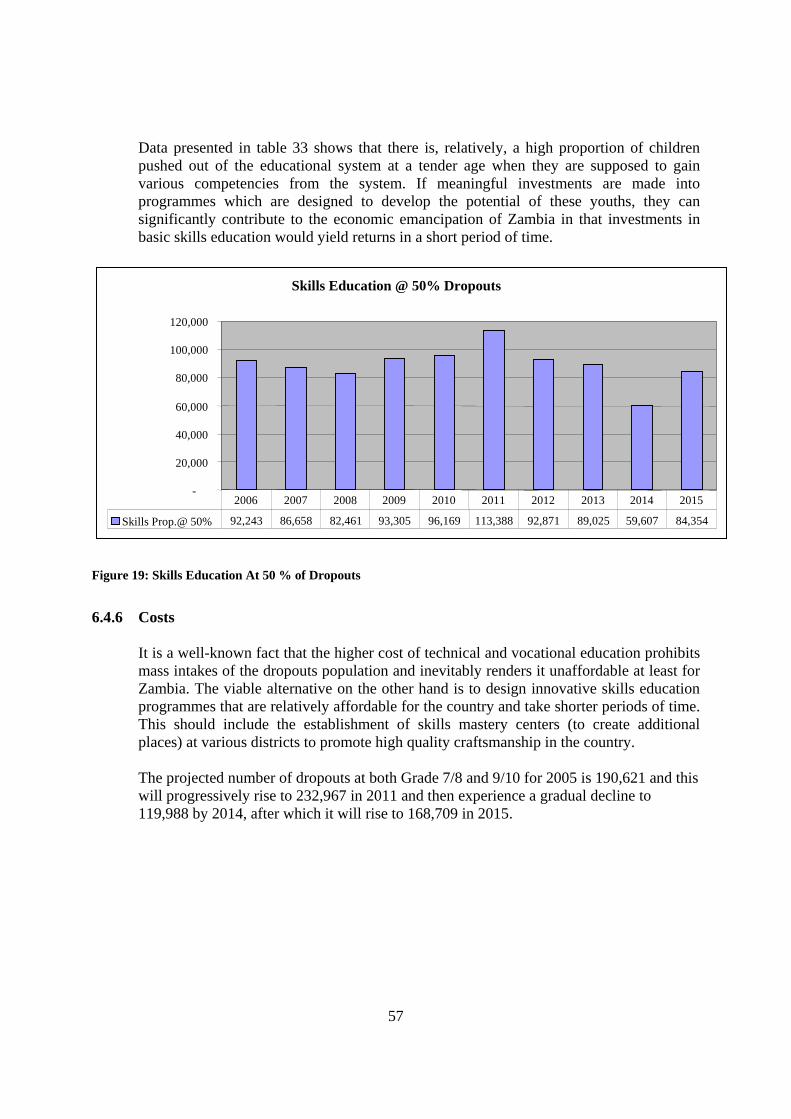
57
Data presented in table 33 shows that there is, relatively, a high proportion of children pushed out of the educational system at a tender age when they are supposed to gain various competencies from the system. If meaningful investments are made into programmes which are designed to develop the potential of these youths, they can significantly contribute to the economic emancipation of Zambia in that investments in basic skills education would yield returns in a short period of time.
Skills Education @ 50% Dropouts
-
20,000
40,000
60,000
80,000
100,000
120,000
Skills Prop.@ 50% 92,243 86,658 82,461 93,305 96,169 113,388 92,871 89,025 59,607 84,354
2006 2007 2008 2009 2010 2011 2012 2013 2014 2015
Figure 19: Skills Education At 50 % of Dropouts
6.4.6 Costs
It is a well-known fact that the higher cost of technical and vocational education prohibits mass intakes of the dropouts population and inevitably renders it unaffordable at least for Zambia. The viable alternative on the other hand is to design innovative skills education programmes that are relatively affordable for the country and take shorter periods of time. This should include the establishment of skills mastery centers (to create additional places) at various districts to promote high quality craftsmanship in the country.
The projected number of dropouts at both Grade 7/8 and 9/10 for 2005 is 190,621 and this will progressively rise to 232,967 in 2011 and then experience a gradual decline to 119,988 by 2014, after which it will rise to 168,709 in 2015.
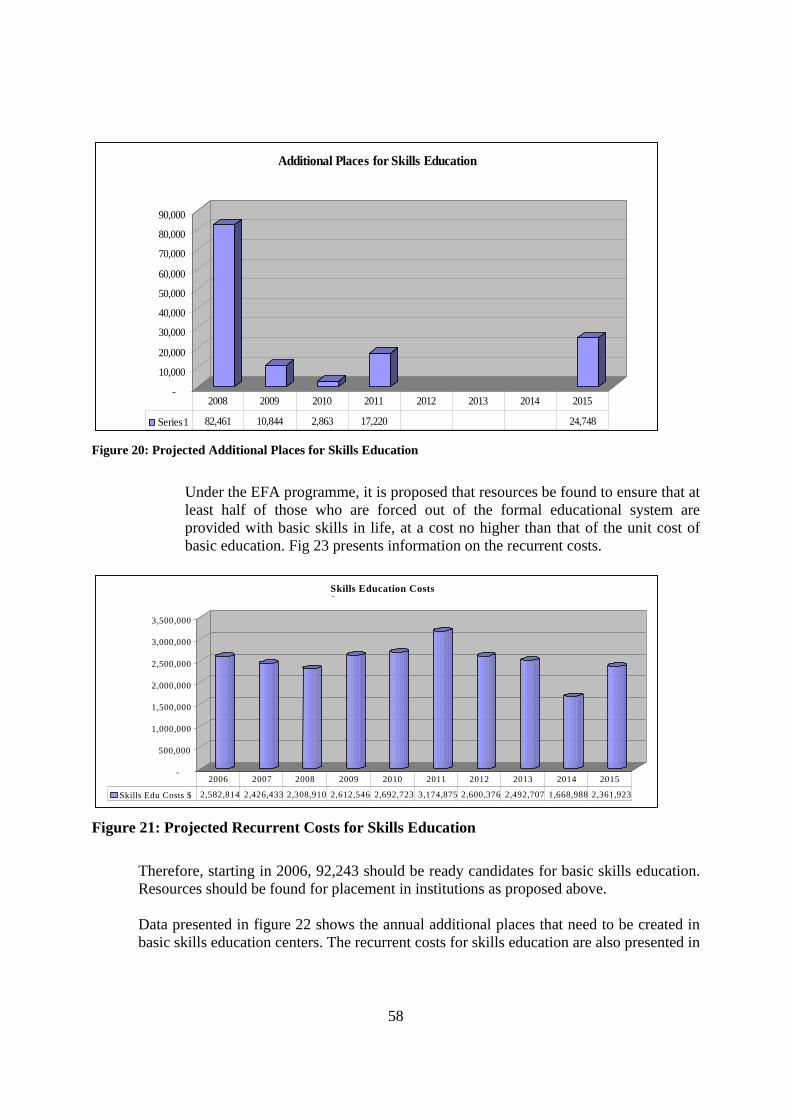
58
-
10,000
20,000
30,000
40,000
50,000
60,000
70,000
80,000
90,000
Additional Places for Skills Education
Series1 82,461 10,844 2,863 17,220 24,748
2008 2009 2010 2011 2012 2013 2014 2015
Figure 20: Projected Additional Places for Skills Education
Under the EFA programme, it is proposed that resources be found to ensure that at least half of those who are forced out of the formal educational system are provided with basic skills in life, at a cost no higher than that of the unit cost of basic education. Fig 23 presents information on the recurrent costs.
- 500,000
1,000,000 1,500,000 2,000,000 2,500,000 3,000,000 3,500,000
Skills Education Costs $
Skills Edu Costs $ 2,582,814 2,426,433 2,308,910 2,612,546 2,692,723 3,174,875 2,600,376 2,492,707 1,668,988 2,361,923 2006 2007 2008 2009 2010 2011 2012 2013 2014 2015
Figure 21: Projected Recurrent Costs for Skills Education
Therefore, starting in 2006, 92,243 should be ready candidates for basic skills education. Resources should be found for placement in institutions as proposed above.
Data presented in figure 22 shows the annual additional places that need to be created in basic skills education centers. The recurrent costs for skills education are also presented in
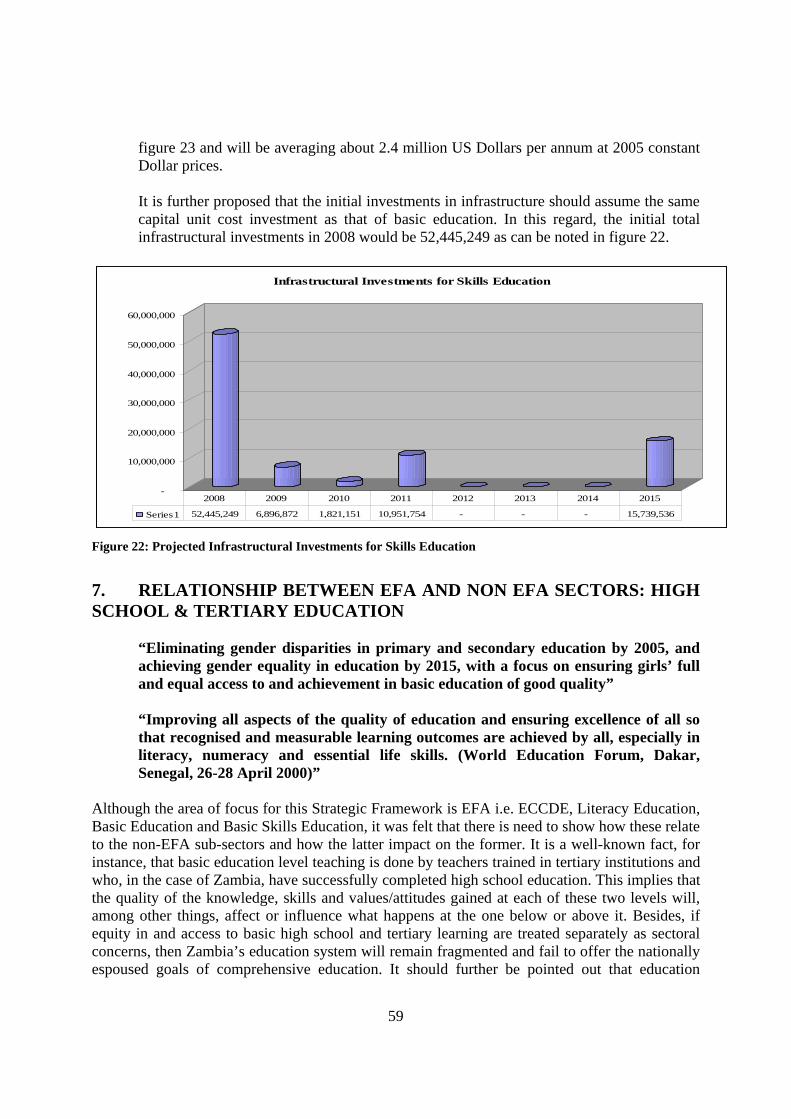
59
figure 23 and will be averaging about 2.4 million US Dollars per annum at 2005 constant Dollar prices.
It is further proposed that the initial investments in infrastructure should assume the same capital unit cost investment as that of basic education. In this regard, the initial total infrastructural investments in 2008 would be 52,445,249 as can be noted in figure 22.
-
10,000,000
20,000,000
30,000,000
40,000,000
50,000,000
60,000,000
Infrastructural Investments for Skills Education
Series1 52,445,249 6,896,872 1,821,151 10,951,754 - - - 15,739,536
2008 2009 2010 2011 2012 2013 2014 2015
Figure 22: Projected Infrastructural Investments for Skills Education
7. RELATIONSHIP BETWEEN EFA AND NON EFA SECTORS: HIGH SCHOOL & TERTIARY EDUCATION
“Eliminating gender disparities in primary and secondary education by 2005, and achieving gender equality in education by 2015, with a focus on ensuring girls’ full and equal access to and achievement in basic education of good quality” “Improving all aspects of the quality of education and ensuring excellence of all so that recognised and measurable learning outcomes are achieved by all, especially in literacy, numeracy and essential life skills. (World Education Forum, Dakar, Senegal, 26-28 April 2000)”
Although the area of focus for this Strategic Framework is EFA i.e. ECCDE, Literacy Education, Basic Education and Basic Skills Education, it was felt that there is need to show how these relate to the non-EFA sub-sectors and how the latter impact on the former. It is a well-known fact, for instance, that basic education level teaching is done by teachers trained in tertiary institutions and who, in the case of Zambia, have successfully completed high school education. This implies that the quality of the knowledge, skills and values/attitudes gained at each of these two levels will, among other things, affect or influence what happens at the one below or above it. Besides, if equity in and access to basic high school and tertiary learning are treated separately as sectoral concerns, then Zambia’s education system will remain fragmented and fail to offer the nationally espoused goals of comprehensive education. It should further be pointed out that education

60
managers, planners, curriculum specialists and supervisors of all basic learning and training in Zambia, like elsewhere are products of high school and tertiary education. Therefore, it is they who serve as role models and take decisions that affect access, quality, gender parity as well as other forms of vulnerability in education and training. 7.1 High Schools
High school education in Zambia is offered in Grades 10-12. Admission to high school is based on performance in the terminal examinations at Grade 9. Historically, primary (Grades 1-7) and secondary (Grades 8-12) education was offered in separate schools but this has now changed with the introduction of a nine-year basic education system (M.O.E 1996). It is a well-known fact that the colonial administration neglected secondary education. As a result, when the country became independent in 1964 there were less than 1000 Africans enrolled in secondary schools. This prompted the new government to expand the sub-sector and by 1968, enrolment had increased by 206% (Wina 1968). It was in this vein, that the new government built a secondary school in each of the 72 districts. The last secondary school was built in 1970. Since 1998, focus has been on the basic education sub-sector (Grades 1-7) under BESSIP (1999-2002). It the meantime, the Ministry of Education has acknowledged that high school education should also be given the importance it deserves and hence the carrying out by the MOE of the 2004 high school review. The goal of high school education is to enable every pupil to become a well educated person who is useful to society and who is adequately prepared to better his or her education and become a self-supporting worker (M.O.E 1996:59) Therefore, it is those individuals who access high school (and beyond) who are best placed to support themselves as well as impact positively in furtherance of the aims of the EFA sub-sector.
7.1.1 Access to High School Education
There are three types of high schools in Zambia viz government owned, those owned by faith-based organisations and the privately owned ones. Government schools, have since 1996 been offering, in addition to normal morning session, parallel classes in the afternoon known as Academic Production Units (APU). Pupils in APU classes pay tuition fees, unlike their counterparts attending morning sessions. Table 34: 2003 High School Enrolments by Grade and Sex
Grade Male Female Total 10 21,179 16,496 37,675 11 21,739 16,887 38,626 12 20,940 15,622 36,562 Total 63,858 49,005 112,863
(Source MOE 2004)

61
According to information in Table 34, there were a total of 112,863 pupils enrolled in public high schools of which 63,858 were male, while the remaining 49,005 were female. The above statistics show that there were more boys than girls enrolled in high schools. This is an area of concern that needs to be addressed through various interventions. The repetition rate and the dropout rate at high school level are low i.e. 0.5 percent and 1.3 percent respectively. The number of pupils completing high school education has remained constant over the years with between 62% and 65% of the pupils passing the school certificate examination. Out of these, about 20% access tertiary education while the rest try to look for employment (M.O.E 2002) which they rarely find due to the serious unemployment situation in the country.
7.1.2 Quality of High School Education:
Because high school education has been neglected for some time, quality has been compromised especially through run-down infrastructure, high teacher attrition and lack of adequate educational materials. In the meantime examination results have not been getting better either. In 2003 for instance, 35,566 pupils wrote the school certificate examination. Of these only 64.53% passed compared to 69.50% in 2002. The high growth of basic schools under BESSIP (1999-2002) has created a situation where many pupils from basic schools are not accessing high school education as places are not enough at this level. Only 25.9% progress to Grade 10; with the rest left to roam the streets. And since high school curriculum has no relevance to either the world of work or to the socio-economic realities in the country (largely due to its lack of emphasis on practical subjects) high school graduates hardly make any positive and practical impact on the needs and aspirations of the EFA Sub-Sector. Paradoxically, the majority of them are also not able to access training opportunities in colleges and universities because of the critical shortage of places in these institutions.
7.1.3 Staffing in High Schools
In 2003, there were a total of 7,879 teachers in public high schools broken down as follows: 5,442 male and 2,394 female. Although, on paper staffing levels seem to be adequate, the reality on the ground is that most of the teachers in high schools are diploma holders from Teacher Training Colleges who were trained to teach in the upper basic classes of grades 8 and 9. This situation has been created mainly because UNZA is not producing enough graduate teachers especially in Maths-Science subjects.
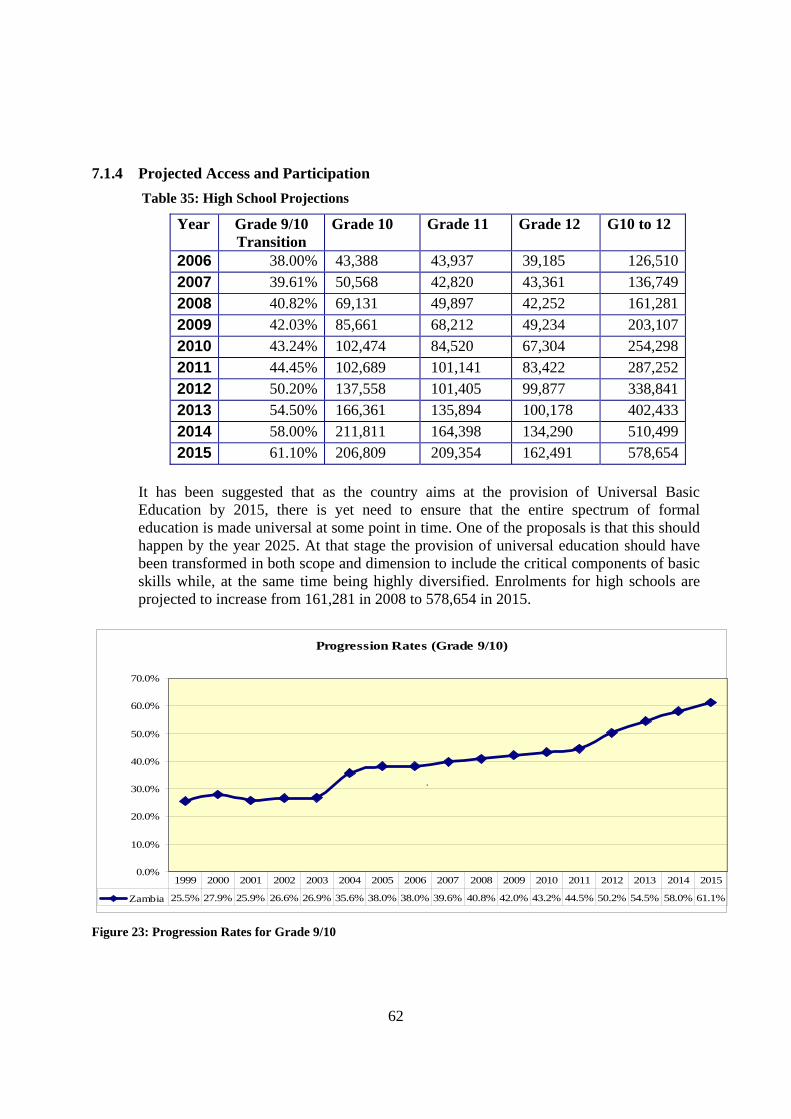
62
7.1.4 Projected Access and Participation Table 35: High School Projections
Year Grade 9/10 Transition
Grade 10 Grade 11 Grade 12 G10 to 12
2006 38.00% 43,388 43,937 39,185 126,5102007 39.61% 50,568 42,820 43,361 136,7492008 40.82% 69,131 49,897 42,252 161,2812009 42.03% 85,661 68,212 49,234 203,1072010 43.24% 102,474 84,520 67,304 254,2982011 44.45% 102,689 101,141 83,422 287,2522012 50.20% 137,558 101,405 99,877 338,8412013 54.50% 166,361 135,894 100,178 402,4332014 58.00% 211,811 164,398 134,290 510,4992015 61.10% 206,809 209,354 162,491 578,654
It has been suggested that as the country aims at the provision of Universal Basic Education by 2015, there is yet need to ensure that the entire spectrum of formal education is made universal at some point in time. One of the proposals is that this should happen by the year 2025. At that stage the provision of universal education should have been transformed in both scope and dimension to include the critical components of basic skills while, at the same time being highly diversified. Enrolments for high schools are projected to increase from 161,281 in 2008 to 578,654 in 2015.
Progression Rates (Grade 9/10)
0.0%
10.0%
20.0%
30.0%
40.0%
50.0%
60.0%
70.0%
Zambia 25.5% 27.9% 25.9% 26.6% 26.9% 35.6% 38.0% 38.0% 39.6% 40.8% 42.0% 43.2% 44.5% 50.2% 54.5% 58.0% 61.1%
1999 2000 2001 2002 2003 2004 2005 2006 2007 2008 2009 2010 2011 2012 2013 2014 2015
.
Figure 23: Progression Rates for Grade 9/10
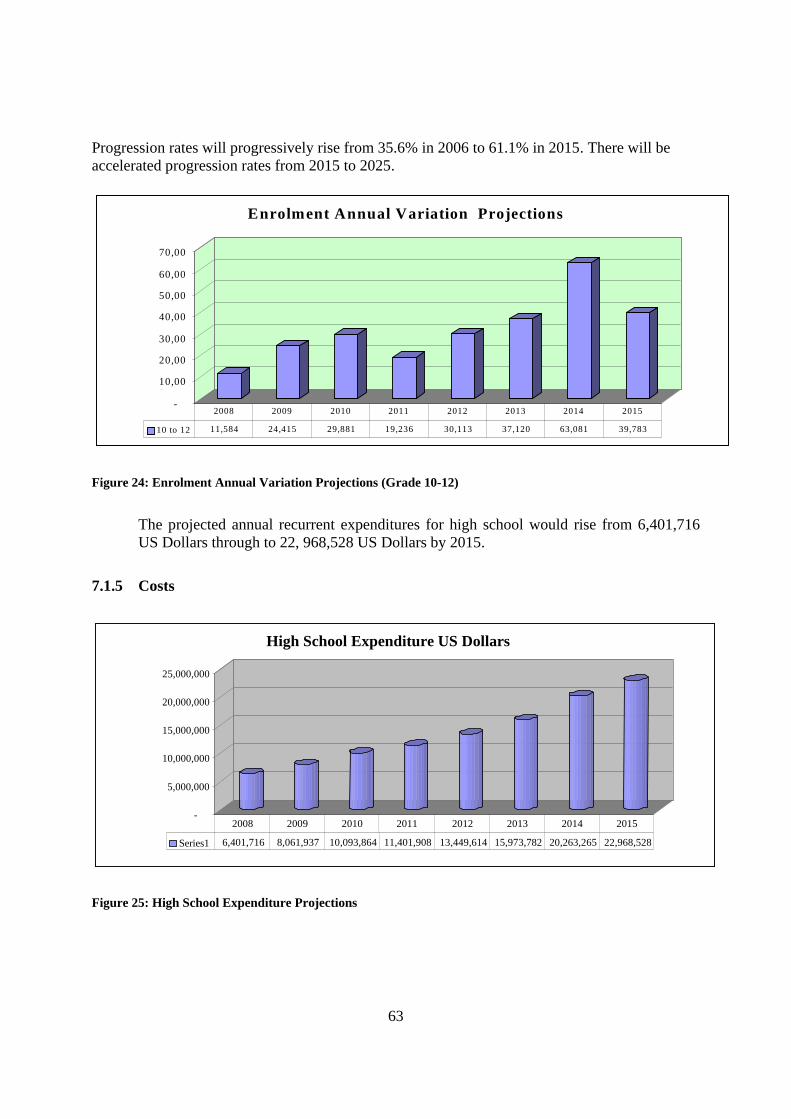
63
Progression rates will progressively rise from 35.6% in 2006 to 61.1% in 2015. There will be accelerated progression rates from 2015 to 2025.
- 10,000
20,000
30,000
40,00
50,000
60,000
70,000
Enrolment Annual Variation Projections
10 to 12 11,584 24,415 29,881 19,236 30,113 37,120 63,081 39,783 2008 2009 2010 2011 2012 2013 2014 2015
Figure 24: Enrolment Annual Variation Projections (Grade 10-12)
The projected annual recurrent expenditures for high school would rise from 6,401,716 US Dollars through to 22, 968,528 US Dollars by 2015.
7.1.5 Costs
-
5,000,000
10,000,000
15,000,000
20,000,000
25,000,000
High School Expenditure US Dollars
Series1 6,401,716 8,061,937 10,093,864 11,401,908 13,449,614 15,973,782 20,263,265 22,968,528
2008 2009 2010 2011 2012 2013 2014 2015
Figure 25: High School Expenditure Projections
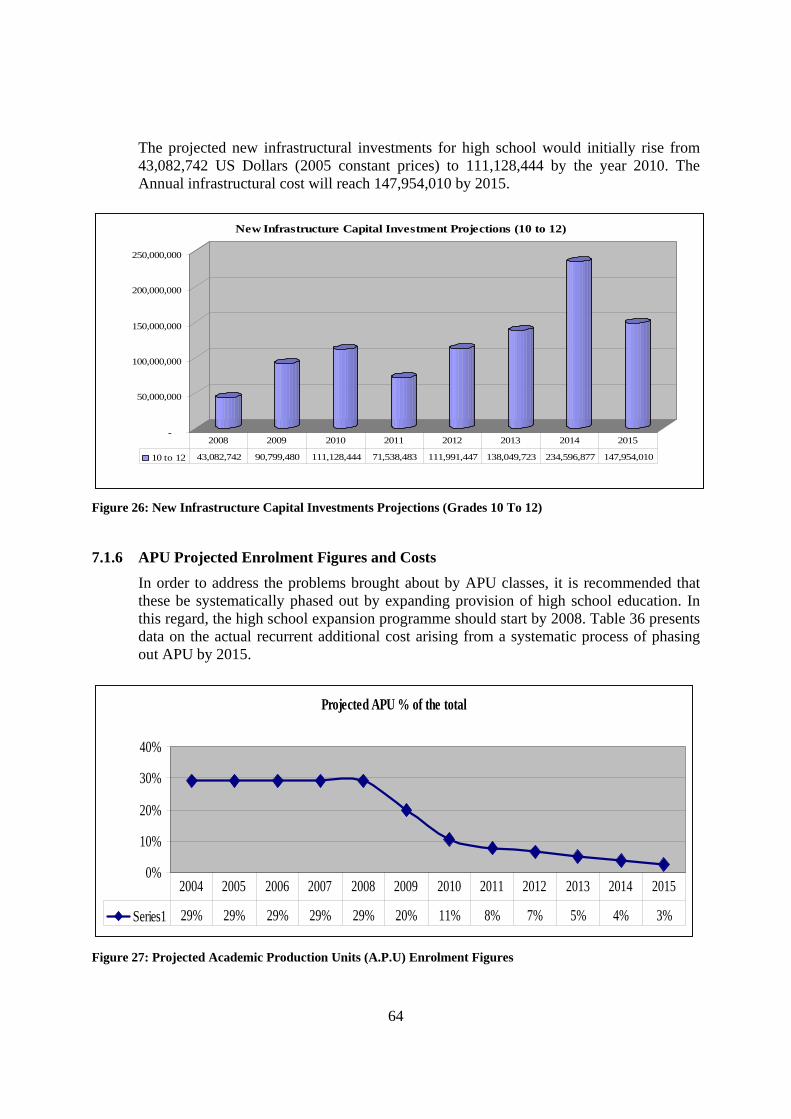
64
The projected new infrastructural investments for high school would initially rise from 43,082,742 US Dollars (2005 constant prices) to 111,128,444 by the year 2010. The Annual infrastructural cost will reach 147,954,010 by 2015.
-
50,000,000
100,000,000
150,000,000
200,000,000
250,000,000
New Infrastructure Capital Investment Projections (10 to 12)
10 to 12 43,082,742 90,799,480 111,128,444 71,538,483 111,991,447 138,049,723 234,596,877 147,954,010
2008 2009 2010 2011 2012 2013 2014 2015
Figure 26: New Infrastructure Capital Investments Projections (Grades 10 To 12)
7.1.6 APU Projected Enrolment Figures and Costs In order to address the problems brought about by APU classes, it is recommended that these be systematically phased out by expanding provision of high school education. In this regard, the high school expansion programme should start by 2008. Table 36 presents data on the actual recurrent additional cost arising from a systematic process of phasing out APU by 2015.
Projected APU % of the total
0%
10%
20%
30%
40%
Series1 29% 29% 29% 29% 29% 20% 11% 8% 7% 5% 4% 3%
2004 2005 2006 2007 2008 2009 2010 2011 2012 2013 2014 2015
Figure 27: Projected Academic Production Units (A.P.U) Enrolment Figures
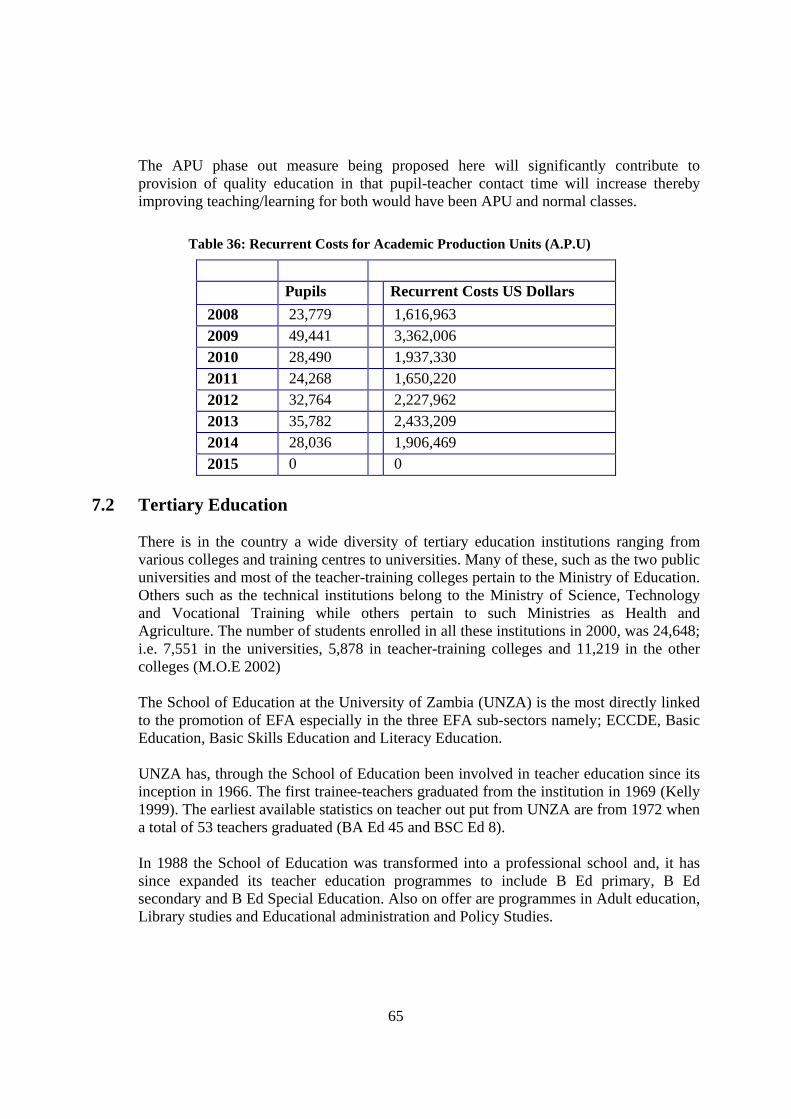
65
The APU phase out measure being proposed here will significantly contribute to provision of quality education in that pupil-teacher contact time will increase thereby improving teaching/learning for both would have been APU and normal classes.
Table 36: Recurrent Costs for Academic Production Units (A.P.U)
Pupils Recurrent Costs US Dollars 2008 23,779 1,616,963 2009 49,441 3,362,006 2010 28,490 1,937,330 2011 24,268 1,650,220 2012 32,764 2,227,962 2013 35,782 2,433,209 2014 28,036 1,906,469 2015 0 0
7.2 Tertiary Education
There is in the country a wide diversity of tertiary education institutions ranging from various colleges and training centres to universities. Many of these, such as the two public universities and most of the teacher-training colleges pertain to the Ministry of Education. Others such as the technical institutions belong to the Ministry of Science, Technology and Vocational Training while others pertain to such Ministries as Health and Agriculture. The number of students enrolled in all these institutions in 2000, was 24,648; i.e. 7,551 in the universities, 5,878 in teacher-training colleges and 11,219 in the other colleges (M.O.E 2002) The School of Education at the University of Zambia (UNZA) is the most directly linked to the promotion of EFA especially in the three EFA sub-sectors namely; ECCDE, Basic Education, Basic Skills Education and Literacy Education. UNZA has, through the School of Education been involved in teacher education since its inception in 1966. The first trainee-teachers graduated from the institution in 1969 (Kelly 1999). The earliest available statistics on teacher out put from UNZA are from 1972 when a total of 53 teachers graduated (BA Ed 45 and BSC Ed 8). In 1988 the School of Education was transformed into a professional school and, it has since expanded its teacher education programmes to include B Ed primary, B Ed secondary and B Ed Special Education. Also on offer are programmes in Adult education, Library studies and Educational administration and Policy Studies.

66
7.1.7 Access and Participation in Teacher Education at UNZA Table 37: 2003 UNZA, School of Education Enrolment
Programme Male Female Total BA Ed 616 394 1,010 BSc Ed 175 7 182 B Ed Primary 54 62 116 B Ed Secondary 86 42 128 B Ed Special Ed 79 57 136
It is evident that enrolments in all the programmes were low especially for women. Only 7 women were enrolled in the BSc Ed programme, representing 4.9%. The BA Ed programme attracted the highest number of students, totalling 1,010. The graduate output in the School of Education in the teacher education programmes from 2000-2004 were as shown in Table 39.
Table 38: Graduate Output in Teacher Education Programmes7
Programme 2000 2001 2002 2003 2004 BA Ed 193 - 189 92 161 BSc Ed 44 - 41 35 31 B Ed Primary 19 - 10 21 39 B Ed Secondary - - - - 41 B Ed Special Ed 18 - 26 27 37
The figures above show, clearly that UNZA is not producing enough teachers especially in the Maths-Science subjects. In fact, it is common knowledge that most of these graduate teachers find jobs elsewhere and end up not teaching at all. This has created a situation where diploma holders have been called upon to teach in high schools. Table 39: 2004 Staffing Levels per Programme, UNZA, School of Education
Programme Male Female Total BA Ed 17 2 19 BSc Ed/B Ed 5 1 6 B Ed Primary 4 0 4 B Ed Special Ed 4 1 5
The number of female lecturers in the School was extremely small. The overall staffing levels in the School were generally very low and were, in all cases below the stipulated official establishment.
7 The dashes in Table 38 above represent years when there was no graduate output for the programmes as shown.
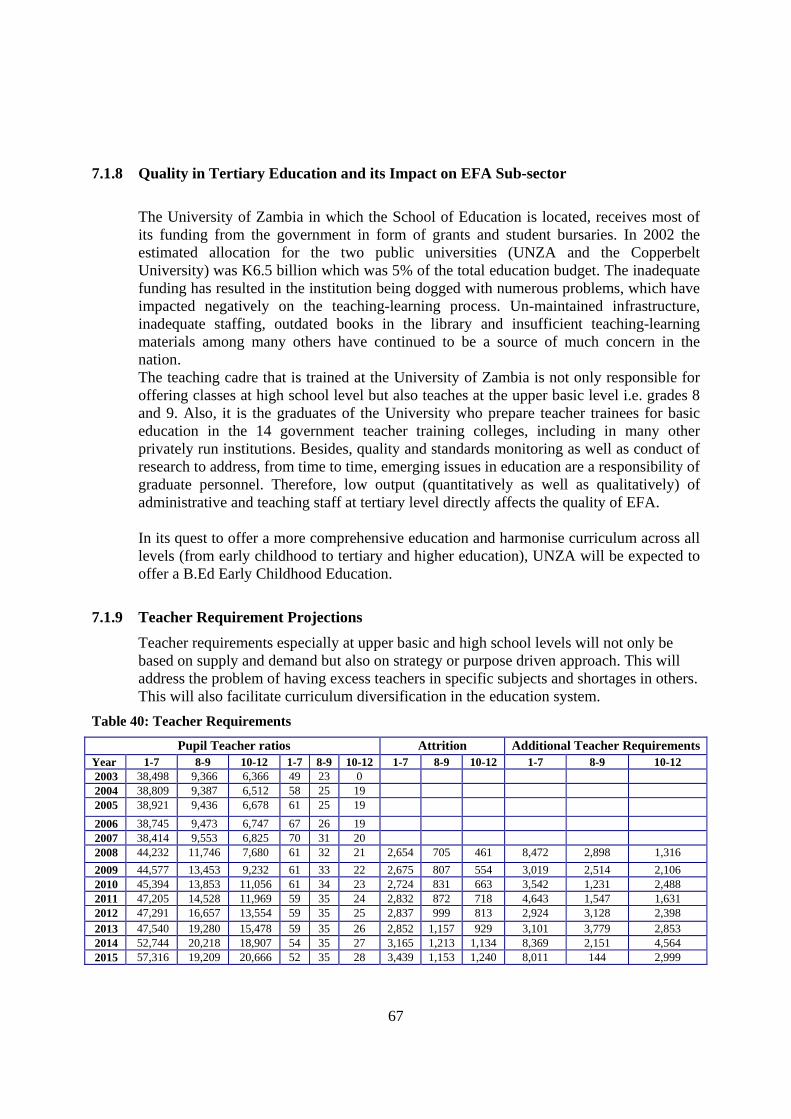
67
7.1.8 Quality in Tertiary Education and its Impact on EFA Sub-sector
The University of Zambia in which the School of Education is located, receives most of its funding from the government in form of grants and student bursaries. In 2002 the estimated allocation for the two public universities (UNZA and the Copperbelt University) was K6.5 billion which was 5% of the total education budget. The inadequate funding has resulted in the institution being dogged with numerous problems, which have impacted negatively on the teaching-learning process. Un-maintained infrastructure, inadequate staffing, outdated books in the library and insufficient teaching-learning materials among many others have continued to be a source of much concern in the nation. The teaching cadre that is trained at the University of Zambia is not only responsible for offering classes at high school level but also teaches at the upper basic level i.e. grades 8 and 9. Also, it is the graduates of the University who prepare teacher trainees for basic education in the 14 government teacher training colleges, including in many other privately run institutions. Besides, quality and standards monitoring as well as conduct of research to address, from time to time, emerging issues in education are a responsibility of graduate personnel. Therefore, low output (quantitatively as well as qualitatively) of administrative and teaching staff at tertiary level directly affects the quality of EFA. In its quest to offer a more comprehensive education and harmonise curriculum across all levels (from early childhood to tertiary and higher education), UNZA will be expected to offer a B.Ed Early Childhood Education.
7.1.9 Teacher Requirement Projections
Teacher requirements especially at upper basic and high school levels will not only be based on supply and demand but also on strategy or purpose driven approach. This will address the problem of having excess teachers in specific subjects and shortages in others. This will also facilitate curriculum diversification in the education system.
Table 40: Teacher Requirements
Pupil Teacher ratios Attrition Additional Teacher Requirements Year 1-7 8-9 10-12 1-7 8-9 10-12 1-7 8-9 10-12 1-7 8-9 10-12 2003 38,498 9,366 6,366 49 23 0 2004 38,809 9,387 6,512 58 25 19 2005 38,921 9,436 6,678 61 25 19 2006 38,745 9,473 6,747 67 26 19 2007 38,414 9,553 6,825 70 31 20 2008 44,232 11,746 7,680 61 32 21 2,654 705 461 8,472 2,898 1,316 2009 44,577 13,453 9,232 61 33 22 2,675 807 554 3,019 2,514 2,106 2010 45,394 13,853 11,056 61 34 23 2,724 831 663 3,542 1,231 2,488 2011 47,205 14,528 11,969 59 35 24 2,832 872 718 4,643 1,547 1,631 2012 47,291 16,657 13,554 59 35 25 2,837 999 813 2,924 3,128 2,398 2013 47,540 19,280 15,478 59 35 26 2,852 1,157 929 3,101 3,779 2,853 2014 52,744 20,218 18,907 54 35 27 3,165 1,213 1,134 8,369 2,151 4,564 2015 57,316 19,209 20,666 52 35 28 3,439 1,153 1,240 8,011 144 2,999

68
The teacher requirement projections as indicated in Table 40 above, are not shown until 2008 when this Framework will have effectively become operational.
7.2.4 Teacher Training Costs
The underlying assumption in making the teacher requirement projections is that for grades1 to 7, the pupil/teacher ratios will be 52:1 by 2015 with the provision that 17 percent of the teachers will continue having double shifts; for Grade 8 to 9 pupil/teacher ratios will be 35:1 by 2015 while the secondary school, pupil/teacher ratio will be 28:1 by 2015.
-
1,000,000
2,000,000
3,000,000
4,000,000
5,000,000
6,000,000
Recurrent Teacher Training Costs US $
Series1 4,390,720 2,643,957 2,512,861 2,706,426 2,924,600 3,368,936 5,220,428 3,860,293
2008 2009 2010 2011 2012 2013 2014 2015
Figure 28: Recurrent Teacher Training Costs in US Dollars
Table 40 presents data on the additional teacher requirements arising from projected enrolment increase as well as projected attrition rates. Data presented in Figure 30 indicate that recurrent teacher training cost in 2008 would be 4,390,720 US Dollars (2005 constant prices). Current costs would average the same rates across the years up to 2015.
7.2.5 Teacher Infrastructure Costs
Figure 31 presents data that show the capital investments arising from the additional enrolments. It is projected that significant expansion in capital investment would be needed effective 2010. The highest expansion requirements will be in 2013.

69
-
5,000,000
10,000,000
15,000,000
20,000,000
25,000,000
30,000,000
35,000,000
Infrastructure Investments for Additional Teacher Training College Enrolment
Series1 3,411,005 3,844,693 7,830,122 32,627,124 680,264 2010 2011 2012 2013 2014 2015
Figure 29: Infrastructure Investments for Additional Teacher Training Colleges Enrolments
70
PART III 8. EXISTING OPPORTUNITIES FOR THE PROVISION OF EFA
8.1 Public Support for the EFA Context of Education Delivery
In terms of structure, Zambia’s education system shows a clear and obvious linkage between levels. The same cannot, however be said of curriculum linkages. There has been a general outcry that the country’s education system is so fragmented that the learning that goes on in school does not allow the learner to convincingly exhibit the relevance, quality and expected competences at each grade level and in relation to other levels.
Secondly, the system of education as it exists today has been condemned for encouraging parroting and memorisation of facts as well as for being skewed towards passing examinations as earlier highlighted in this report.
Thirdly, the system has been widely discredited for offering knowledge, values and skills that do not relate to real life situations for the learners. It has been pointed out, for instance that the system has failed to impart skills that are relevant and necessary for survival in an economy that is mostly informal and where, because of HIV/AIDS related mortality there are fewer adults to transmit skills to the young and where many children must assume adult household and economic responsibilities at a very young age.
Many changes have taken place in Zambia since independence in 1964. Politically; the country became, after a seventeen year break, a multiparty State in 1991, economically; Zambia has continued to perform poorly especially since the fall in copper prices in the 1970s while socially; poverty, unemployment and HIV/AIDS have caused much suffering in the population. Unfortunately, the school system has not been quick enough to effect and implement any significant curriculum reforms in the face of the afore-mentioned changes among many others.
Above all, the school system has often been labelled as monolithic, inflexible and:
(a) lacking a holistic view of learning; with few meaningful linkages and integration
between: early learning, pre-school, basic education, adult and non-formal education and
(b) failing to meaningfully relate educational programmes to national aspirations and priorities such as for the purpose of survival and development and, therefore in the acquisition of basic life skills and welfare.
Political will and practical initiative to reform the country’s basic education system to make it more practical, is well documented in the Educational Reform (1977), Focus on
71
Learning (1992) and the National Policy on Education (1996). At a more general level, government and its cooperating partners have been involved in the Public Service reforms i.e. restructuring and decentralisation of the governance system since 1993. Also, there has been overwhelming involvement in basic education by NGOs, private providers and communities since the liberalisation of the sub-sector in 1991. Additionally, Zambia is party to many international agreements notably in the area of upholding human and child rights, promoting the education of the girl child and reducing or eliminating (first and foremost through education) illiteracy, disease and unemployment among its citizens. Therefore, there has been, so far genuine political will and attempts to reform basic education as well as willingness to increase public spending to education generally. Besides, given the massive participation in the sector by several key players, one is left with no doubt that opportunities for comprehensive educational reform could best be achieved in the context of Education for All, since the current Strategy (see Part IV of this Framework for details) seeks to:
(a) be inclusive and take everyone on board in educational programming for the street
kid, the disabled, the vulnerable groups etc.); (b) emphasise putting in place of institutional and legal frameworks that will make
coordination and collaboration, among all stakeholders more sustainable and therefore more meaningful;
(c) provide for a more comprehensive mechanism on curriculum harmonisation at all levels (including in teacher training), between and among all major players, while relating education to real life situations and being on course towards meeting the EFA and Millennium Development Goals;
(d) bring together all players in basic education to achieve consensus and rationalise their interventions notably in resource mobilisation and utilisation, setting standards and in programme;
(e) establish an EFA data base for planning and use by all stakeholders.
The foregoing shows clearly that the challenges posed in the education sector provide a rare and real opportunity for meaningful reform of the national education system and of the curriculum, in particular, to make learning more meaningful. To this effect, the Ministry of Education embarked on High School Review programme for the period 2004-2005; period during which the present EFA Strategy was in the process of preparation. Due to persistent calls for a more meaningful curriculum as it relates to EFA, this Framework provides for some key reform measures (of not business as usual) within the context of an EFA national Philosophy.
8.2 Special Issues of Concern
In addition to the supportive environment for EFA strategic planning and programming as presented above, there are a number of key cross-cutting issues of concern which impact negatively on education generally and on EFA in particular. Some of these are highlighted below – but as opportunities for urgent reforms in education provision.
72
8.2.1 Manifestation of Poverty in the Education Sector
In its Poverty Reduction Strategy Paper (PRSP) 2002-2004, the Zambian government recognised that there are several ways in which poverty manifests itself in the country’s education sector today. Cited among these are low enrolments, low progression and high drop-out rates, poor performance, poor attendance, long distances to school, poor learning environments, lack of opportunities for appropriate skills training, malnourished learners, demotivated and ill-qualified teachers, high illiteracy levels, ill health among teachers, pupils and others in the education system, lack of motivation for parents to send their children to school; and wide gender gaps in school attendance between girls and boys.
PRSP further observes that secondary education had, over the years not received adequate attention, while most of the Technical Education, Vocational and Entrepreneurship Authority (TEVETA) registered institutions have had obsolete equipment while distance education has not been fully exploited to provide the necessary learning opportunities. In the same vein, illiteracy rates and gender disparities, it has been observed, have been increasing rather than reducing. It should be pointed out however that much progress has been made notably at basic education level, towards attaining gender parity. However, this has been more in terms of enrolments rather than in participation and completion.
Closely linked to the question of poverty is failure by parents to afford the cost of schooling for their children. Hence the declaration by government in 2002 of free basic education from grades 1-7. But due to low public funding to education, quality is not likely to be sustained as even more children access education.
Girls are still not able to stay in school long enough (notably in rural areas) due to early marriages and a myriad of other enduring stereotypes. But this is also due to the fact that girls are seen by society as merely adding up to the school bill; compared to the privileged position of boy children.
Also of much concern in education provision, notably at basic education level is the aspect of children’s health, nutrition and general hygiene especially today when Community schooling is expanding at a fast rate; just as are pupil numbers notably in urban areas. Therefore, the strategies for feeding the school-going children within their communities and in community and public schools, and for providing water and sanitation facilities for them require coordinated effort among all stakeholders and at all levels.
8.2.2 Impact of HIV/AIDS on Education
Zambia, like most other sub-Saharan African countries is seriously affected by the HIV/AIDS pandemic. According to the Demographic and Health Survey (DHS) of 2002, the HIV prevalence rate for the whole country was nearly 16% for people
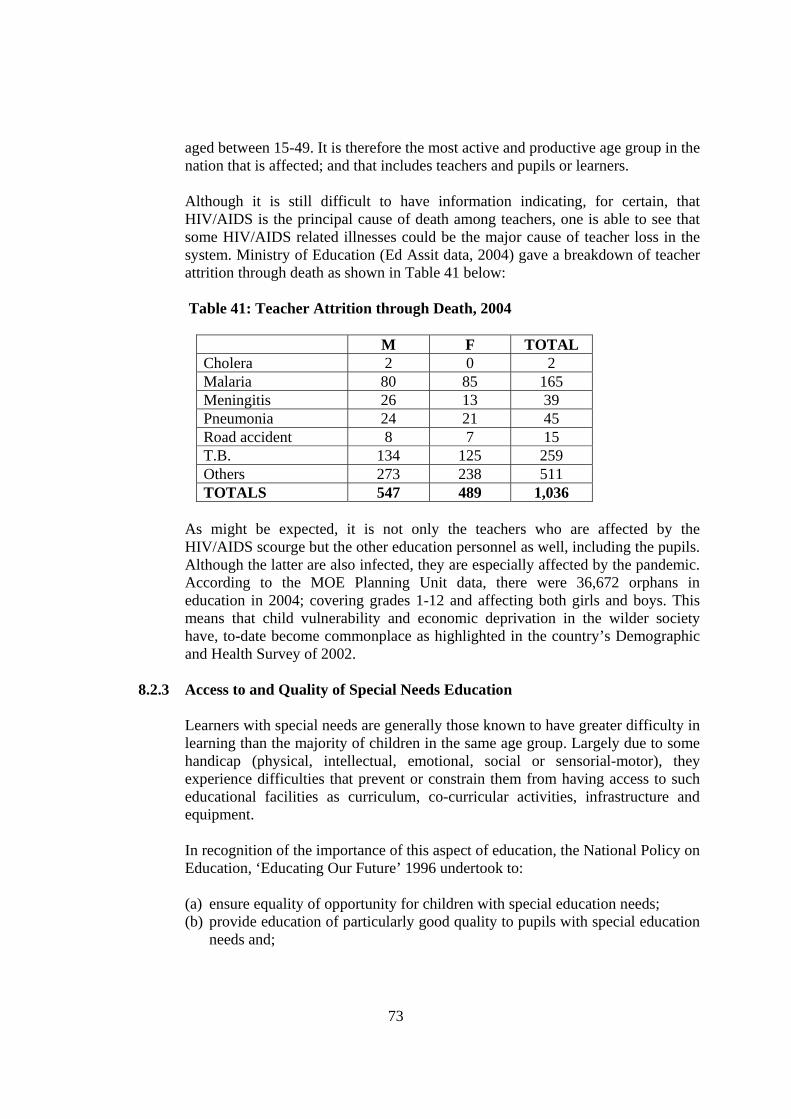
73
aged between 15-49. It is therefore the most active and productive age group in the nation that is affected; and that includes teachers and pupils or learners.
Although it is still difficult to have information indicating, for certain, that HIV/AIDS is the principal cause of death among teachers, one is able to see that some HIV/AIDS related illnesses could be the major cause of teacher loss in the system. Ministry of Education (Ed Assit data, 2004) gave a breakdown of teacher attrition through death as shown in Table 41 below:
Table 41: Teacher Attrition through Death, 2004
M F TOTAL Cholera 2 0 2 Malaria 80 85 165 Meningitis 26 13 39 Pneumonia 24 21 45 Road accident 8 7 15 T.B. 134 125 259 Others 273 238 511 TOTALS 547 489 1,036
As might be expected, it is not only the teachers who are affected by the HIV/AIDS scourge but the other education personnel as well, including the pupils. Although the latter are also infected, they are especially affected by the pandemic. According to the MOE Planning Unit data, there were 36,672 orphans in education in 2004; covering grades 1-12 and affecting both girls and boys. This means that child vulnerability and economic deprivation in the wilder society have, to-date become commonplace as highlighted in the country’s Demographic and Health Survey of 2002.
8.2.3 Access to and Quality of Special Needs Education
Learners with special needs are generally those known to have greater difficulty in learning than the majority of children in the same age group. Largely due to some handicap (physical, intellectual, emotional, social or sensorial-motor), they experience difficulties that prevent or constrain them from having access to such educational facilities as curriculum, co-curricular activities, infrastructure and equipment.
In recognition of the importance of this aspect of education, the National Policy on Education, ‘Educating Our Future’ 1996 undertook to:
(a) ensure equality of opportunity for children with special education needs; (b) provide education of particularly good quality to pupils with special education
needs and;

74
(c) improve and strengthen management and supervision of this type of education in the country.
The Policy document further advocated for a decentralised structure of special education delivery system, modification of infrastructure, local production of learning materials/equipment and recasting the curriculum to suit the needs of learners with SEN. It also emphasised the need for integrating pupils with SEN into the mainstream learning institutions as well as on early identification, assessment and intervention strategies for children with SEN.
In the context of Education for All, learners with SEN have as much right to education, training and counselling (rehabilitative guidance) as the rest of the learner population; irrespective of the origin, nature and seriousness of the handicaps and disabilities (United Nations Charter on Human Rights, 1975).
In order to overcome stigma that is usually associated with SEN in the country, a decision was taken in the late 1990s to implement the concept of inclusive schooling. Reports from the field indicate however that even this new approach will need to be more carefully scrutinised if children with SEN are to be saved from being marginalized even further. Hence the need to:
a) spell out the institutional and/or legal frameworks under which all
stakeholders, and at all levels, will positively contribute to lessening the impact of exclusion and marginalisation associated with SEN in the country;
b) ensure that inclusive schooling does not become one other way of denying learners the opportunity of having well trained teachers, specialised learning materials and equipment, appropriate infrastructure and the funding required to provide quality education;
c) provide for a flexible curriculum for both teachers and learners and encourage design, production and use of local learning/teaching materials.
8.2 Place of Physical Education, Sport and Talent Development in EFA
As has already been alluded to under section three of this Framework, quality and relevance, in education has always been a matter for national concern. Poor funding to education, use of untrained or inadequately trained teachers, lack of learning/teaching materials and equipment, poor teacher motivation and conditions of service, high pupil-teacher ratios, problematic relationship between curriculum and assessment objectives etc, are often cited as key contributors to what many perceive as low educational standards in Zambia. A cursory look at the country’s educational system however, reveals that one of the most fundamental tenets of education provision i.e. the purpose of education has not yet been fully discussed, analysed and accepted by the majority of citizens. The relationship, for instance, between the nature and amount of knowledge required at a given level of learning, the supporting attitudes and character and the accompanying practical ‘doings’

75
that should be demonstrated by the learner have remained a privilege of curriculum specialists only. Yet, elsewhere in the world it is society which has had to agree with these fundamentals before turning to technocrats for their operationalisation. As a result of this situation, The Education of the Mind, the Heart And the Hand remains largely unharmonised as seen through the:
a) unsatisfactory curriculum interfacing from one level to the other and the lack of flexibility in the curriculum options offered (even within the same learning area);
b) undefined role of education in societal change and individual performance as a contribution to that change;
c) uncoordinated packaging of knowledge, values/attitudes/virtues and practical achievements and realisations; for the benefit of society on the one hand, and for that of the individual members on the other.
The current national outcry (2005) regarding child streetism and youth unemployment, the disappearance of children’s play parks in the country, child labour and the ‘severe forms’ of begging by able bodied persons are, from an educational view point, not products of poverty or unemployment but of failure by society to define and agree on the acceptable relationship between and among the following fundamentals: LIVING, LEARNING, PLAYING AND WORKING as they rate to what one does with his/her head, heart and hands. In this vein, basic skills acquisition is dealt with, in this Framework, not as focusing only on practical subjects but also on the basic forms of knowledge, ideals, ideas and concepts as well as on the values, attitudes and dispositions (communication and life skills) that make it possible for one to achieve excellence with one’s thought, feelings, hands, feet, voice etc. Hence the importance, in this Framework of highlighting physical education, sport and talent development as some of the key indicators in the provision of comprehensive basic education for all.
9. CONCLUSION: Towards Achieving Provision of Comprehensive
Education
Thus far, this Strategic Framework has, among other things, drawn the attention of the policy makers and the practitioners to the major thrust of the EFA challenges (under each of the four EFA and non EFA target areas), the EFA Philosophy as well as to the special issues of concern in education. Also, the Framework has shown that since the Jomtien Conference on Education for All in 1990, the Zambian government, the local and international NGOs, the faith based organisations, aid donors and the private sector have all worked hard to turn both the challenges and the major issues of concern as highlighted above, among others into opportunities for providing equitable and quality education in the country. Some of the major lessons learnt over the years however, and now being applied (as can be seen in the individual education sector Strategic Plans) have to do with the realisation that education is a sophisticated enterprise that cannot be effectively dispensed through individual
76
departmental or institutional portfolios of any one Ministry, NGO, aid donor, private provider or faith based organisation. There is not a single stakeholder strategic plan to-day (2005) which has not alluded to the need to collaborate with other stakeholders if the Education for All goals have to be attained by 2015. The establishment of the Zambia National Education Coalition (ZANEC) in 2001 and of the National Education for All Secretariat in 2003, the proposal to establish a National Education Sector Authority (NESA) in 2002 to coordinate activities and programmes for all education providers, signify the consensus built to eliminate fragmentation in the sector. In view of the foregoing, all the stakeholders will need to use the coordinating institutions so established to provide realistic pathways for effective collaboration. The present strategic framework has, in this regard identified some key policies, strategies and programme milestones that need to be widely shared, and implemented upon and implemented for the purpose of filling the gaps in the sector as follows: 1) working in collaboration with all the other stakeholders to achieve access to
education for every learner, including those faced with all types of vulnerabilities and providing quality education;
2) supporting the establishment of some new institutional mechanisms with new functions and responsibilities to enable stakeholders harmonise and coordinate policies, strategic plans, EFA programme elements, monitoring and supervision in the sector;
3) rendering support for increased funding to meet the new levels of need in the education sector;
4) giving support to the enactment of new laws and legal frameworks aimed at promoting such human and civic values as rights, responsibilities and obligations as they relate to provision of EFA;
5) focusing on building capabilities and utilising the existing teaching cadre rather than only on traditional capacity building initiatives;
6) re-orienting teacher education and making it adapt to the new requirements for providing comprehensive education for all;
7) re-focusing on curriculum harmonisation and creating the necessary linkages, introducing flexibility in the curriculum and eliminating uncalled for rigidities;
8) promoting production of local learning/teaching materials and equipment for the levels of education where this is feasible;
9) making research and data collection for EFA initiatives a regular undertaking, establishing the necessary data bases and ensuring that information is shared among all key stakeholders;
10) developing appropriate assessment tools for each level of education to satisfy the needs of comprehensive learning and curriculum diversification.
This Framework has, given the foregoing, made the first attempt towards achieving a common Strategic Plan for the EFA sub-sector as shown in the projections, the costing and the logical framework presented in this document.
77
PART IV
10. EFA LOGICAL FRAMEWORK
Provision of Education for All in Zambia, as already highlighted above, is in the hands of many stakeholders; a number of whom have their own policies and strategic plans. This framework recognises the fact that it is not possible for one single Ministry (of Education in this case) to offer EFA single handedly and hence the need for everyone to collaborate through coordination of effort. But for this to happen there is need, at least in the context of this Framework, to provide for the necessary guidelines that will facilitate coordination as well as gap-filling; and which need to be taken into account in the preparation of the individual Strategic Plans.
It is in view of the foregoing that some key cross-cutting strategic objectives (as regards access, equity, quality and relevance, building of and/or utilisation of human and institutional capacity, curriculum re-conceptualisation, etc.) are highlighted first before their operationalisation under each of the EFA target areas as shown below.
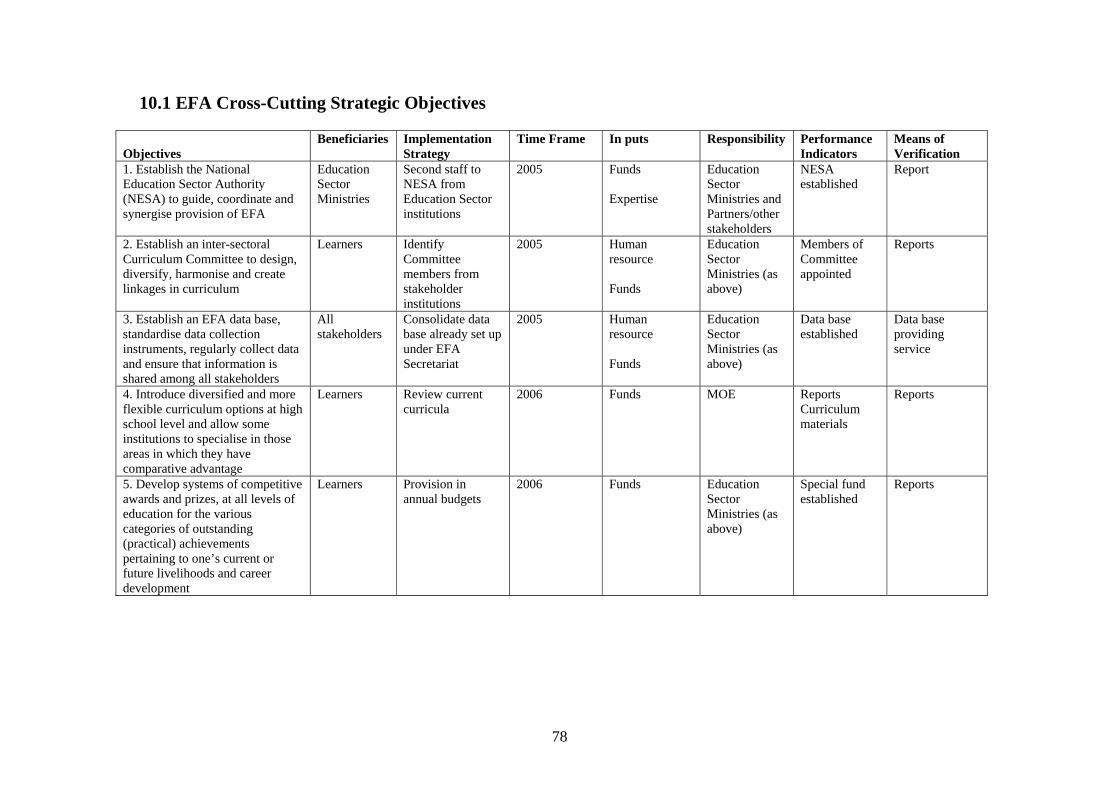
78
10.1 EFA Cross-Cutting Strategic Objectives
Objectives
Beneficiaries Implementation Strategy
Time Frame In puts Responsibility Performance Indicators
Means of Verification
1. Establish the National Education Sector Authority (NESA) to guide, coordinate and synergise provision of EFA
Education Sector Ministries
Second staff to NESA from Education Sector institutions
2005 Funds Expertise
Education Sector Ministries and Partners/other stakeholders
NESA established
Report
2. Establish an inter-sectoral Curriculum Committee to design, diversify, harmonise and create linkages in curriculum
Learners Identify Committee members from stakeholder institutions
2005 Human resource Funds
Education Sector Ministries (as above)
Members of Committee appointed
Reports
3. Establish an EFA data base, standardise data collection instruments, regularly collect data and ensure that information is shared among all stakeholders
All stakeholders
Consolidate data base already set up under EFA Secretariat
2005 Human resource Funds
Education Sector Ministries (as above)
Data base established
Data base providing service
4. Introduce diversified and more flexible curriculum options at high school level and allow some institutions to specialise in those areas in which they have comparative advantage
Learners Review current curricula
2006 Funds MOE Reports Curriculum materials
Reports
5. Develop systems of competitive awards and prizes, at all levels of education for the various categories of outstanding (practical) achievements pertaining to one’s current or future livelihoods and career development
Learners Provision in annual budgets
2006 Funds Education Sector Ministries (as above)
Special fund established
Reports
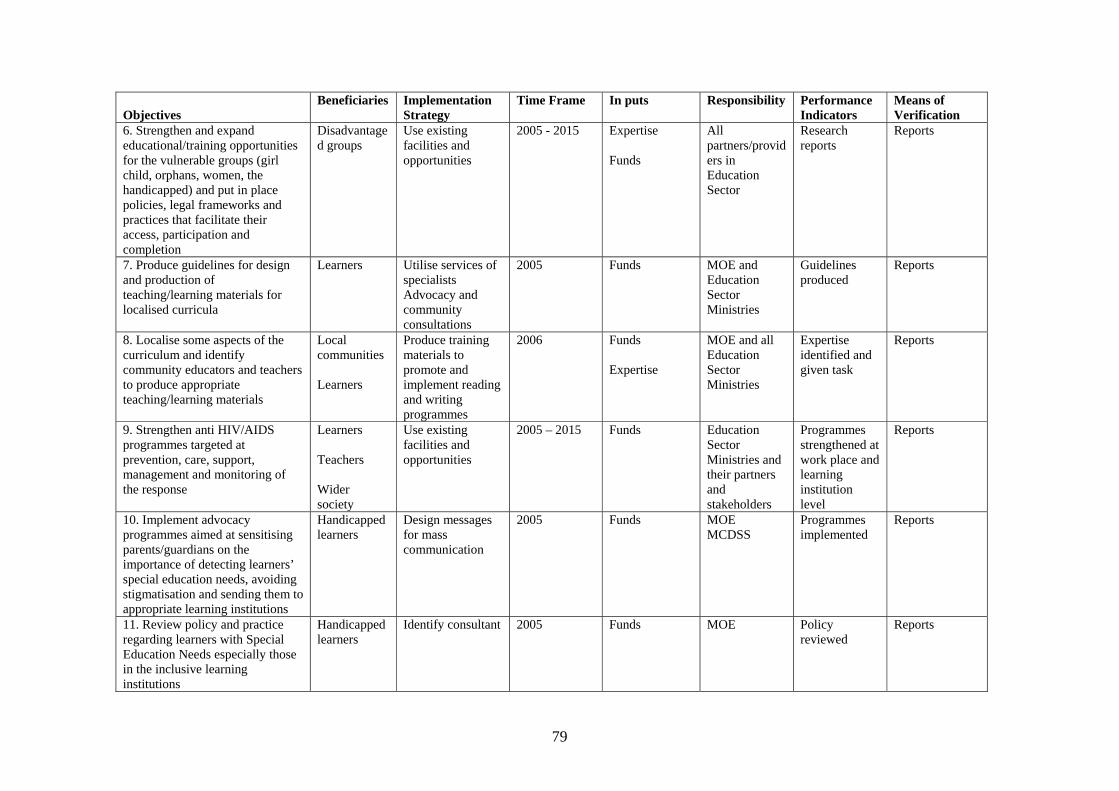
79
Objectives
Beneficiaries Implementation Strategy
Time Frame In puts Responsibility Performance Indicators
Means of Verification
6. Strengthen and expand educational/training opportunities for the vulnerable groups (girl child, orphans, women, the handicapped) and put in place policies, legal frameworks and practices that facilitate their access, participation and completion
Disadvantaged groups
Use existing facilities and opportunities
2005 - 2015 Expertise Funds
All partners/providers in Education Sector
Research reports
Reports
7. Produce guidelines for design and production of teaching/learning materials for localised curricula
Learners Utilise services of specialists Advocacy and community consultations
2005 Funds MOE and Education Sector Ministries
Guidelines produced
Reports
8. Localise some aspects of the curriculum and identify community educators and teachers to produce appropriate teaching/learning materials
Local communities Learners
Produce training materials to promote and implement reading and writing programmes
2006 Funds Expertise
MOE and all Education Sector Ministries
Expertise identified and given task
Reports
9. Strengthen anti HIV/AIDS programmes targeted at prevention, care, support, management and monitoring of the response
Learners Teachers Wider society
Use existing facilities and opportunities
2005 – 2015 Funds Education Sector Ministries and their partners and stakeholders
Programmes strengthened at work place and learning institution level
Reports
10. Implement advocacy programmes aimed at sensitising parents/guardians on the importance of detecting learners’ special education needs, avoiding stigmatisation and sending them to appropriate learning institutions
Handicapped learners
Design messages for mass communication
2005 Funds MOE MCDSS
Programmes implemented
Reports
11. Review policy and practice regarding learners with Special Education Needs especially those in the inclusive learning institutions
Handicapped learners
Identify consultant 2005 Funds MOE Policy reviewed
Reports
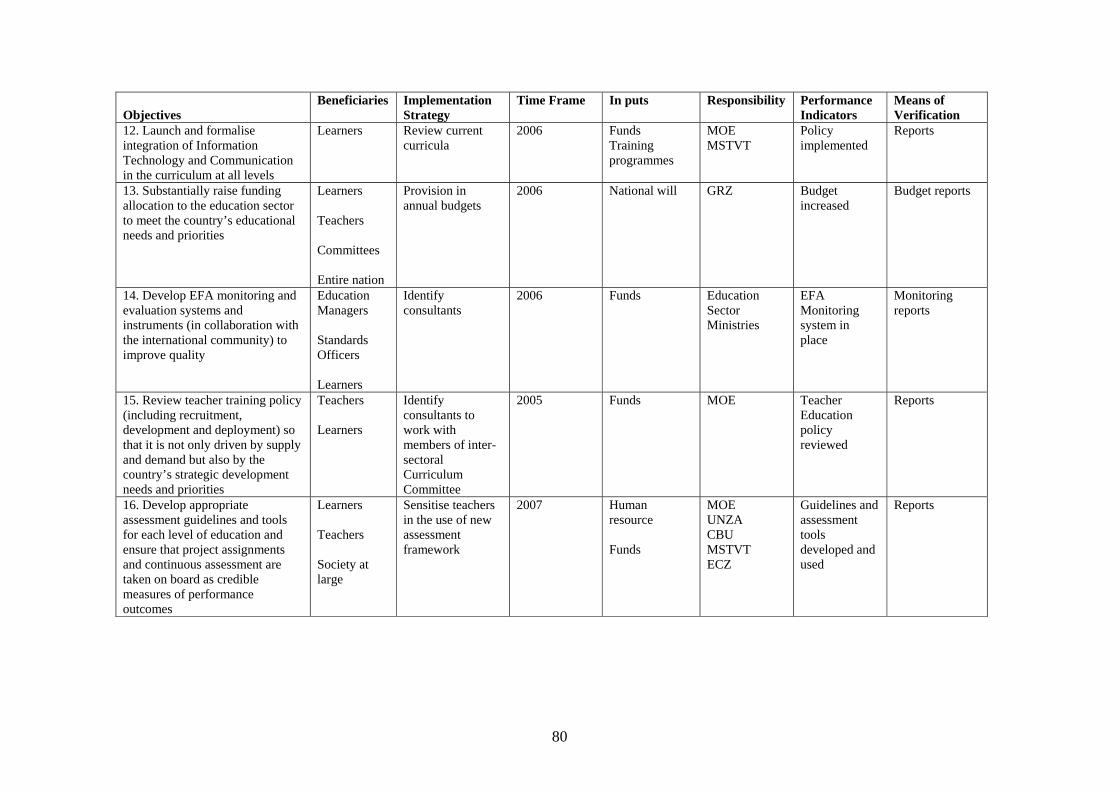
80
Objectives
Beneficiaries Implementation Strategy
Time Frame In puts Responsibility Performance Indicators
Means of Verification
12. Launch and formalise integration of Information Technology and Communication in the curriculum at all levels
Learners Review current curricula
2006 Funds Training programmes
MOE MSTVT
Policy implemented
Reports
13. Substantially raise funding allocation to the education sector to meet the country’s educational needs and priorities
Learners Teachers Committees Entire nation
Provision in annual budgets
2006 National will GRZ Budget increased
Budget reports
14. Develop EFA monitoring and evaluation systems and instruments (in collaboration with the international community) to improve quality
Education Managers Standards Officers Learners
Identify consultants
2006 Funds Education Sector Ministries
EFA Monitoring system in place
Monitoring reports
15. Review teacher training policy (including recruitment, development and deployment) so that it is not only driven by supply and demand but also by the country’s strategic development needs and priorities
Teachers Learners
Identify consultants to work with members of inter-sectoral Curriculum Committee
2005 Funds MOE Teacher Education policy reviewed
Reports
16. Develop appropriate assessment guidelines and tools for each level of education and ensure that project assignments and continuous assessment are taken on board as credible measures of performance outcomes
Learners Teachers Society at large
Sensitise teachers in the use of new assessment framework
2007 Human resource Funds
MOE UNZA CBU MSTVT ECZ
Guidelines and assessment tools developed and used
Reports
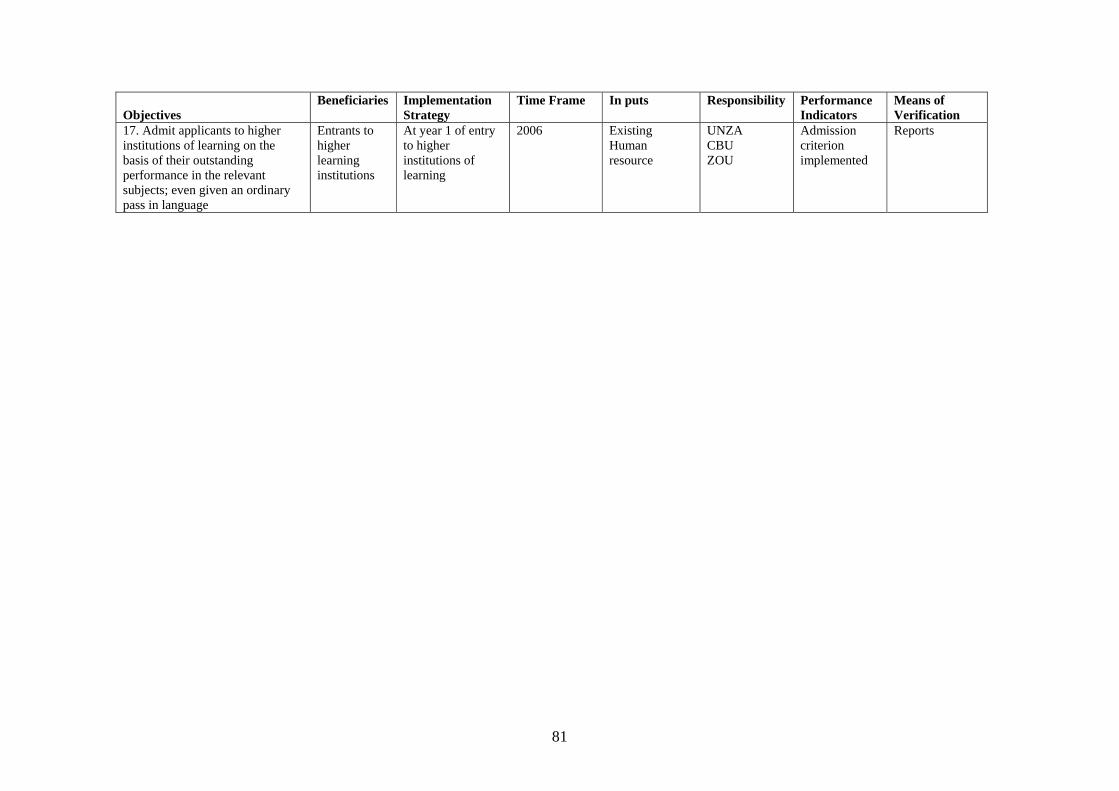
81
Objectives
Beneficiaries Implementation Strategy
Time Frame In puts Responsibility Performance Indicators
Means of Verification
17. Admit applicants to higher institutions of learning on the basis of their outstanding performance in the relevant subjects; even given an ordinary pass in language
Entrants to higher learning institutions
At year 1 of entry to higher institutions of learning
2006 Existing Human resource
UNZA CBU ZOU
Admission criterion implemented
Reports
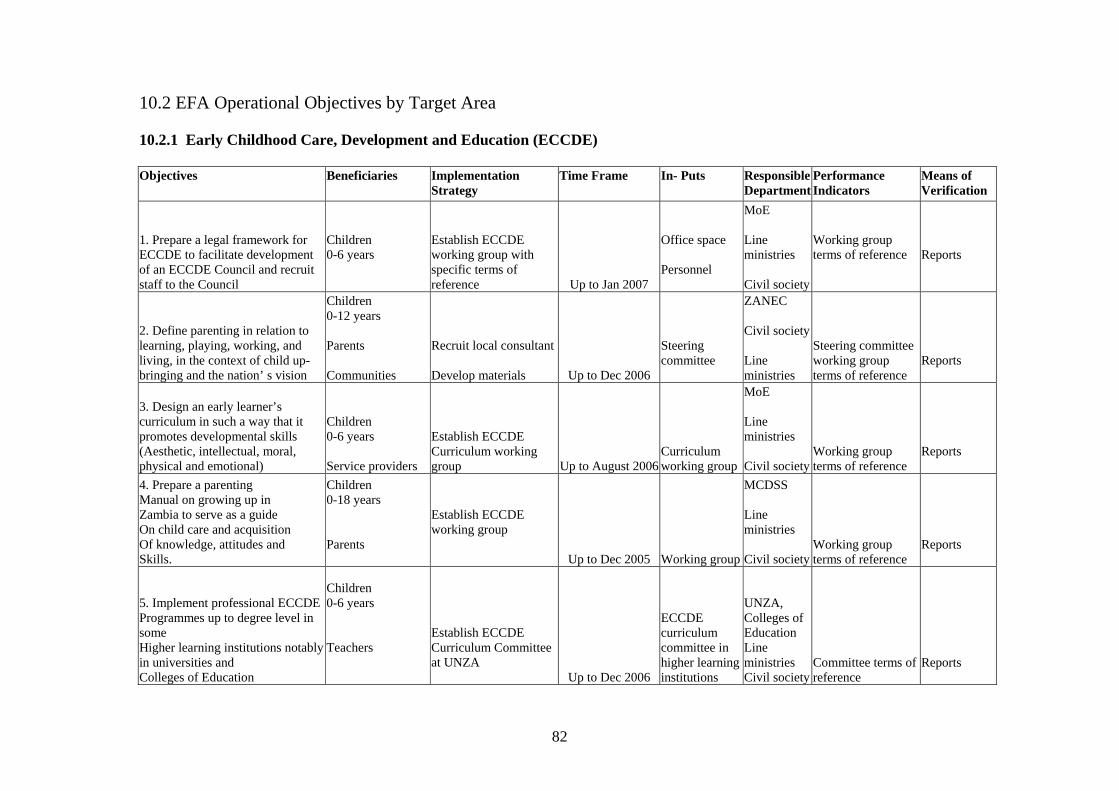
82
10.2 EFA Operational Objectives by Target Area 10.2.1 Early Childhood Care, Development and Education (ECCDE) Objectives Beneficiaries Implementation
Strategy Time Frame In- Puts Responsible
DepartmentPerformance Indicators
Means of Verification
1. Prepare a legal framework for ECCDE to facilitate development of an ECCDE Council and recruit staff to the Council
Children 0-6 years
Establish ECCDE working group with specific terms of reference Up to Jan 2007
Office space Personnel
MoE Line ministries Civil society
Working group terms of reference
Reports
2. Define parenting in relation to learning, playing, working, and living, in the context of child up-bringing and the nation’ s vision
Children 0-12 years Parents Communities
Recruit local consultant Develop materials Up to Dec 2006
Steering committee
ZANEC Civil society Line ministries
Steering committee working group terms of reference
Reports
3. Design an early learner’s curriculum in such a way that it promotes developmental skills (Aesthetic, intellectual, moral, physical and emotional)
Children 0-6 years Service providers
Establish ECCDE Curriculum working group Up to August 2006
Curriculum working group
MoE Line ministries Civil society
Working group terms of reference
Reports
4. Prepare a parenting Manual on growing up in Zambia to serve as a guide On child care and acquisition Of knowledge, attitudes and Skills.
Children 0-18 years Parents
Establish ECCDE working group Up to Dec 2005 Working group
MCDSS Line ministries Civil society
Working group terms of reference
Reports
5. Implement professional ECCDE Programmes up to degree level in some Higher learning institutions notably in universities and Colleges of Education
Children 0-6 years Teachers
Establish ECCDE Curriculum Committee at UNZA Up to Dec 2006
ECCDE curriculum committee in higher learning institutions
UNZA, Colleges of Education Line ministries Civil society
Committee terms of reference
Reports
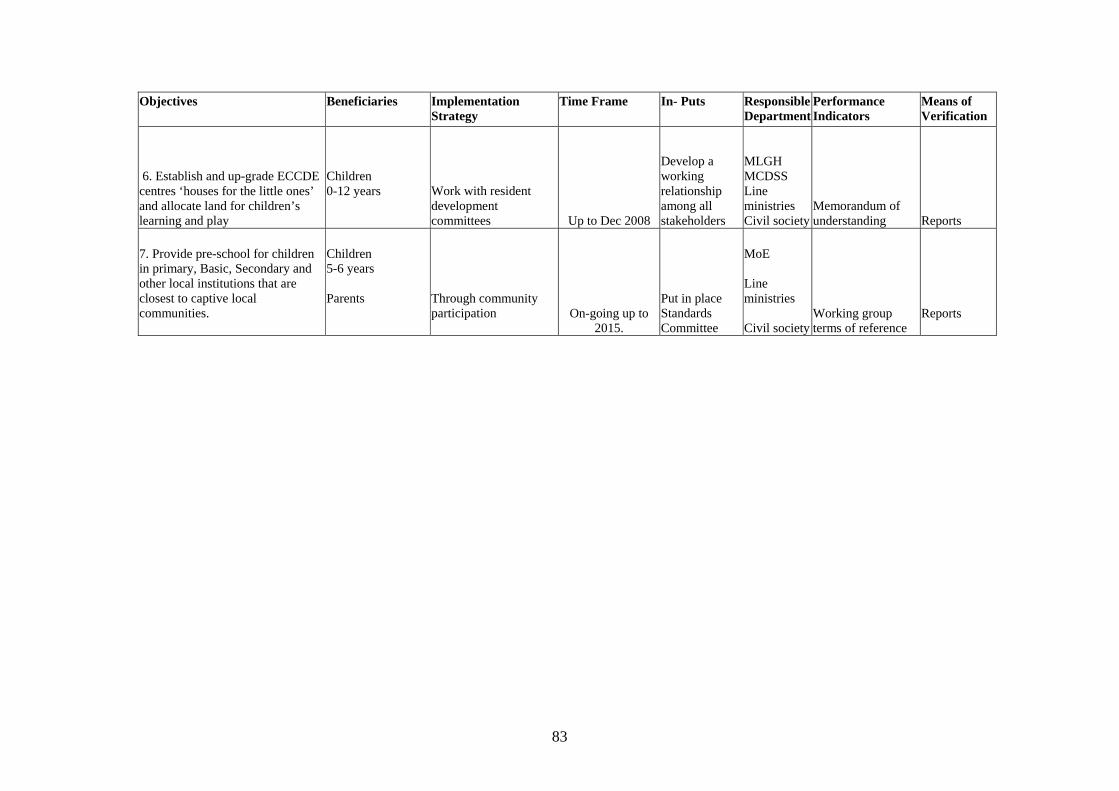
83
Objectives Beneficiaries Implementation Strategy
Time Frame In- Puts Responsible Department
Performance Indicators
Means of Verification
6. Establish and up-grade ECCDE centres ‘houses for the little ones’ and allocate land for children’s learning and play
Children 0-12 years
Work with resident development committees Up to Dec 2008
Develop a working relationship among all stakeholders
MLGH MCDSS Line ministries Civil society
Memorandum of understanding Reports
7. Provide pre-school for children in primary, Basic, Secondary and other local institutions that are closest to captive local communities.
Children 5-6 years Parents
Through community participation
On-going up to 2015.
Put in place Standards Committee
MoE Line ministries Civil society
Working group terms of reference
Reports
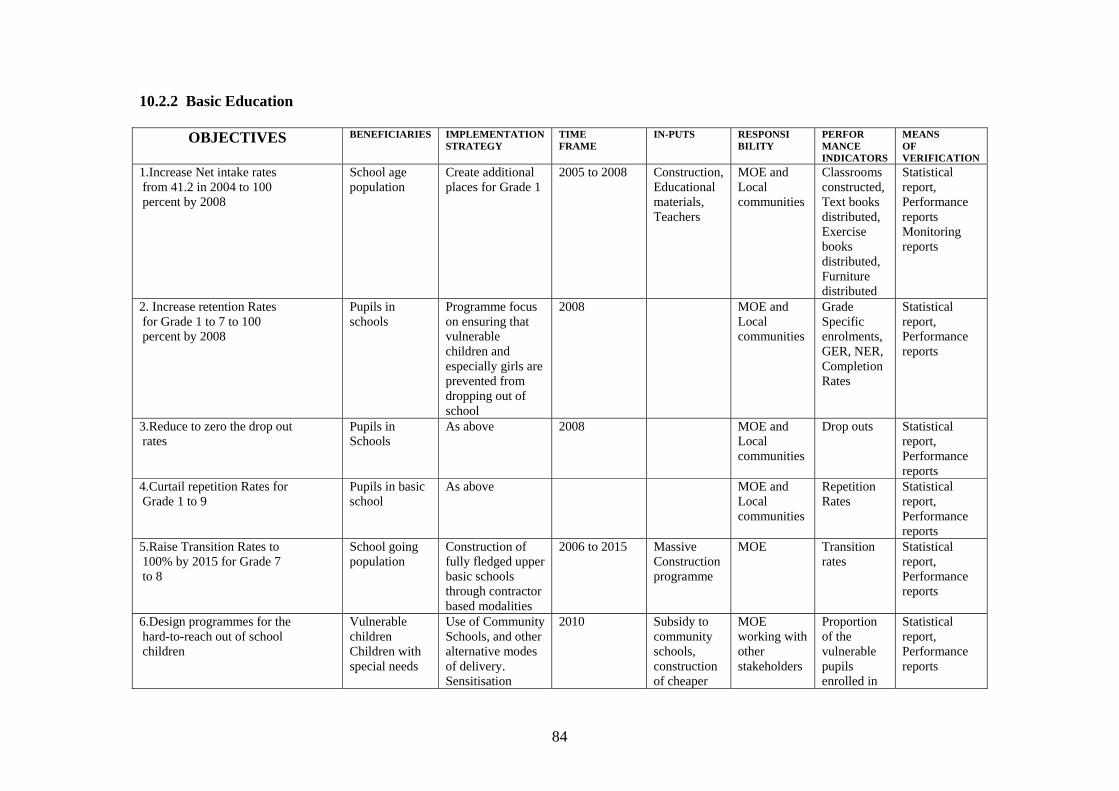
84
10.2.2 Basic Education
OBJECTIVES BENEFICIARIES IMPLEMENTATION STRATEGY
TIME FRAME
IN-PUTS RESPONSI BILITY
PERFOR MANCE INDICATORS
MEANS OF VERIFICATION
1.Increase Net intake rates from 41.2 in 2004 to 100 percent by 2008
School age population
Create additional places for Grade 1
2005 to 2008 Construction, Educational materials, Teachers
MOE and Local communities
Classrooms constructed, Text books distributed, Exercise books distributed, Furniture distributed
Statistical report, Performance reports Monitoring reports
2. Increase retention Rates for Grade 1 to 7 to 100 percent by 2008
Pupils in schools
Programme focus on ensuring that vulnerable children and especially girls are prevented from dropping out of school
2008 MOE and Local communities
Grade Specific enrolments, GER, NER, Completion Rates
Statistical report, Performance reports
3.Reduce to zero the drop out rates
Pupils in Schools
As above 2008 MOE and Local communities
Drop outs Statistical report, Performance reports
4.Curtail repetition Rates for Grade 1 to 9
Pupils in basic school
As above MOE and Local communities
Repetition Rates
Statistical report, Performance reports
5.Raise Transition Rates to 100% by 2015 for Grade 7 to 8
School going population
Construction of fully fledged upper basic schools through contractor based modalities
2006 to 2015 Massive Construction programme
MOE Transition rates
Statistical report, Performance reports
6.Design programmes for the hard-to-reach out of school children
Vulnerable children Children with special needs
Use of Community Schools, and other alternative modes of delivery. Sensitisation
2010 Subsidy to community schools, construction of cheaper
MOE working with other stakeholders
Proportion of the vulnerable pupils enrolled in
Statistical report, Performance reports

85
OBJECTIVES BENEFICIARIES IMPLEMENTATION STRATEGY
TIME FRAME
IN-PUTS RESPONSI BILITY
PERFOR MANCE INDICATORS
MEANS OF VERIFICATION
programme for parents and children on the value of education. Increase specialised and well equipped centres for children with special needs
education facilities
schools
7.Sustain pro girls programmes for enrolling Grade 1
Girl children especially in rural areas
Strengthen programmes for the advancement of girls’ education. Strengthen community sensitisation programmes
2006 Sensitization programmes
MOE working with other key stakeholders such as FAWEZA
Increased enrolment for girls at grade 1 level. More PAGE schools
Enrolment registers
8.Increase retention rate especially for girls in rural areas
Girls in rural areas
Sensitisation programmes, Making learning environment girl friendly
2006 Circulars Fliers MOE officers
MOE in collaboration with NGOs, Chiefs and other key stakeholders
Higher numbers of girls completing Basic and Secondary education
Annual reports
9. Consolidate bursary scheme for girls especially in rural areas
Girls in rural areas and those in vulnerable circumstances
Establish elaborate and traceable mechanisms for disbursement of bursaries
2005 Circulars Fliers
MOE MCDSS
More vulnerable girls access bursaries
Statistical report
10. Increase learning achievement levels for pupils in basic schools by ensuring that 75% of pupils attain the defined minimum levels of performance expected for their level
All pupils in basic schools
Pupils in basic schools Increase learning achievement levels for pupils in basic schools by ensuring that 75%
Continuous professional teachers development programme Creation of incentive
Staff to spearhead change Funding
MOE Standards and ECZ
Learning achievement levels
Assessment Surveys Performance reports

86
OBJECTIVES BENEFICIARIES IMPLEMENTATION STRATEGY
TIME FRAME
IN-PUTS RESPONSI BILITY
PERFOR MANCE INDICATORS
MEANS OF VERIFICATION
of pupils attaining the defined minimum levels of performance expectation for their level
packages for teachers serving in rural areas Transformation of the Grade 7 selection examinations for the purpose of assessing learning achievement through the establishment of a National Assessment Unit
Staff to spearhead change
11.Continue teacher develop- ment in relation to need and in relation to national strategic need and demand especially in rural areas.
Pupils in basic schools
Streamline pre-service teacher education programme framework
On-going New construction and increased unit costs
Teacher Education
Number of teachers trained both in-service and pre-service
Annual reports for Teacher Education
12.Train, deploy and ensure continued stay of teachers in the system especially in rural areas
Pupils in basic schools
Apply strategic driven deployment of teachers with innovative approaches to retaining teachers in rural areas
2010 Re-allocation incentives especially for rural female teachers
Teacher Education
Number of teachers deployed to rural areas (especially females)
Annual reports for Teacher Education
13.Redesign the curriculum for grades 1 to 9 and incorporate basic skills education
All categories of children aged between 7 and 14
Prepare guidelines through Consultancy services and hold symposium involving ke stakeholders
2008 Increased unit allocation
Curriculum Development
New integrated curriculum in place
Performance reports Curriculum Framework document
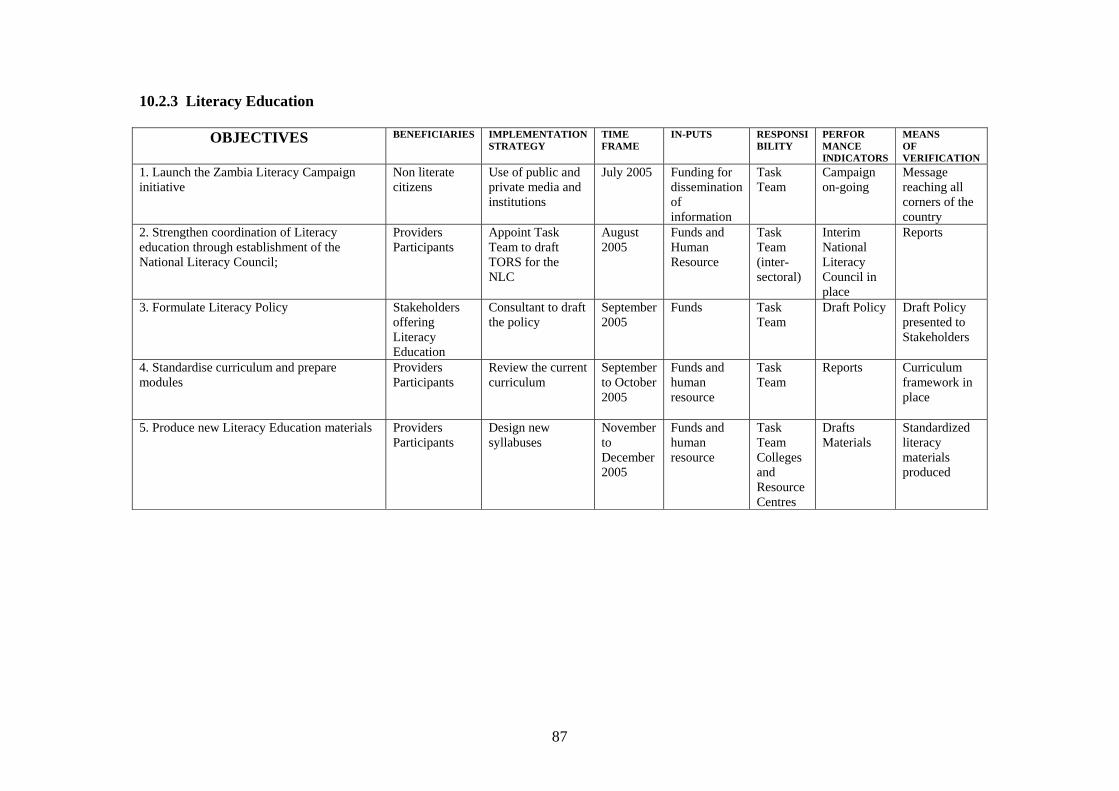
87
10.2.3 Literacy Education
OBJECTIVES BENEFICIARIES IMPLEMENTATION STRATEGY
TIME FRAME
IN-PUTS RESPONSI BILITY
PERFOR MANCE INDICATORS
MEANS OF VERIFICATION
1. Launch the Zambia Literacy Campaign initiative
Non literate citizens
Use of public and private media and institutions
July 2005 Funding for dissemination of information
Task Team
Campaign on-going
Message reaching all corners of the country
2. Strengthen coordination of Literacy education through establishment of the National Literacy Council;
Providers Participants
Appoint Task Team to draft TORS for the NLC
August 2005
Funds and Human Resource
Task Team (inter-sectoral)
Interim National Literacy Council in place
Reports
3. Formulate Literacy Policy Stakeholders offering Literacy Education
Consultant to draft the policy
September 2005
Funds Task Team
Draft Policy Draft Policy presented to Stakeholders
4. Standardise curriculum and prepare modules
Providers Participants
Review the current curriculum
September to October 2005
Funds and human resource
Task Team
Reports Curriculum framework in place
5. Produce new Literacy Education materials Providers Participants
Design new syllabuses
November to December 2005
Funds and human resource
Task Team Colleges and Resource Centres
Drafts Materials
Standardized literacy materials produced

88
10.2.5 Basic Skills Education
OBJECTIVES BENEFICIARIES IMPLEMENTATION STRATEGY
TIME FRAME
IN-PUTS RESPONSI BILITY
PERFOR MANCE INDICATORS
MEANS OF VERIFICATION
1. Integrate basic skills curriculum into basic education curriculum
All learners Educators Society
Establish and assign task to the inter-sectoral curriculum committee
2006 Infrastructure NESA Trained teachers and trainers Skilled learners
Reports Products Assessment and monitoring instruments
2. Redefine Basic Skills Education to include practical (survival), life, learning and communication skills and talent development
All learners Educators Society
Inter-sectoral Curriculum Committee task
2006 Secondment of staff to the Inter-sectoral Curriculum Committee
NESA Diversification of available skills on offer Quality and variety of products
Reports Products
3. Strengthen co-ordination, monitoring and harmonisation of Basic Skills and Education and provide for Data Collection, data base, dissemination and utilisation
Providers of education Learners Society
Provide for an inventory of stakeholders and their core (business) skills at all levels
2006 Human Resources as above
NESA Number of times monitoring is carried out Trained staff
Reports Assessment instruments
4. Re-introduce apprenticeship schemes for skills transfer and acquisition at community and other levels.
All learners Educators Master Craftsmen Society
As above 2006 Introduce incentives and establish systems to link community initiatives to the national (monitoring) grid
NESA Production of Master Craftsmen directory Skilled learners Community based training arrangements
Improved quality of products Increased skills transfer facilities at community level. Willingness by Master Craftsmen to offer skills
5. Establish gender participation in skills education and determine levels of inclusion/exclusion based on gender.
All learners Educators Society
Devise new guidelines for assessing participation by gender at all levels
2006 Advocacy and monitoring
NESA High rates of participation Reduction in stereotyping courses to take
Tracer studies Monitoring and Evaluation reports Annual Reports
6. Provide for teacher/ tutor training and retraining
All learners All teachers and tutors
Design integrated teacher/instructor training
2007 As above NESA Numbers of trained teachers/tutors Improved
Reports Assessments Curriculum
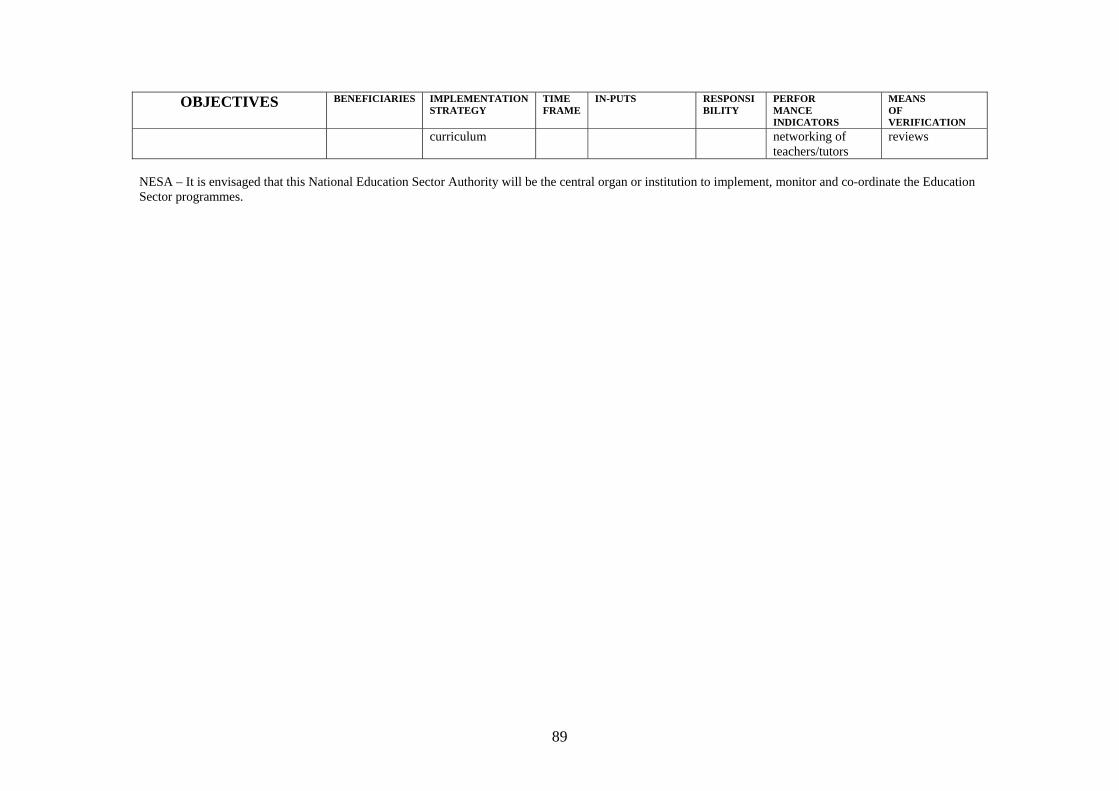
89
OBJECTIVES BENEFICIARIES IMPLEMENTATION STRATEGY
TIME FRAME
IN-PUTS RESPONSI BILITY
PERFOR MANCE INDICATORS
MEANS OF VERIFICATION
curriculum networking of teachers/tutors
reviews
NESA – It is envisaged that this National Education Sector Authority will be the central organ or institution to implement, monitor and co-ordinate the Education Sector programmes.

90
10.2.6 Non EFA Sub-Sectors
Objectives
Beneficiaries Implementation Strategy
Time Frame In puts Responsibility Performance Indicators
Means of Verification
1. Rehabilitate existing infrastructure in High Schools and Teacher Education Institutions
Learners Engage local (community) contractors
Continued rehabilitation
Pool funds Expertise (Human resource)
MOE PTA (Community)
Number of Institutions rehabilitated
Quarterly reports
2. Expand high school and Teacher Education Institutions
Learners Constructing new high schools Converting some colleges into University Colleges (Nkrumah and COTSECO)
On-going Funds Expertise (human resource)
MOE PTA (Community)
20 high schools per year.8 2 colleges converted into University Colleges courses running
Monitoring Reports
3. Design and diversify high school curriculum
Learners Society
• Reviewing existing curriculum
• Diversifying the areas of study
2006 (1 year) Expertise Funds
MOE
New curriculum in place and disseminated
Reports Curriculum Framework Document
4. Review teacher education curriculum and harmonise it with curricula in skills training centres, trades training institutes and vocational training institutions
Learners Trainees
Reviewing the existing curricula and harmonising them with the teacher training and school curriculum
2006 (1 year) Expertise Funds
MOE School of Education (UNZA) MSTVT MSYCD and MCDSS
Reviewed curriculum in place and disseminated
Reports
8 A concerted High School building programme is necessary to ensure that basic schools are not upgraded to high schools as this would limit the chances of providing basic education for all by 2015. Also, this is the surest way of improving progression rate from basic to high school.
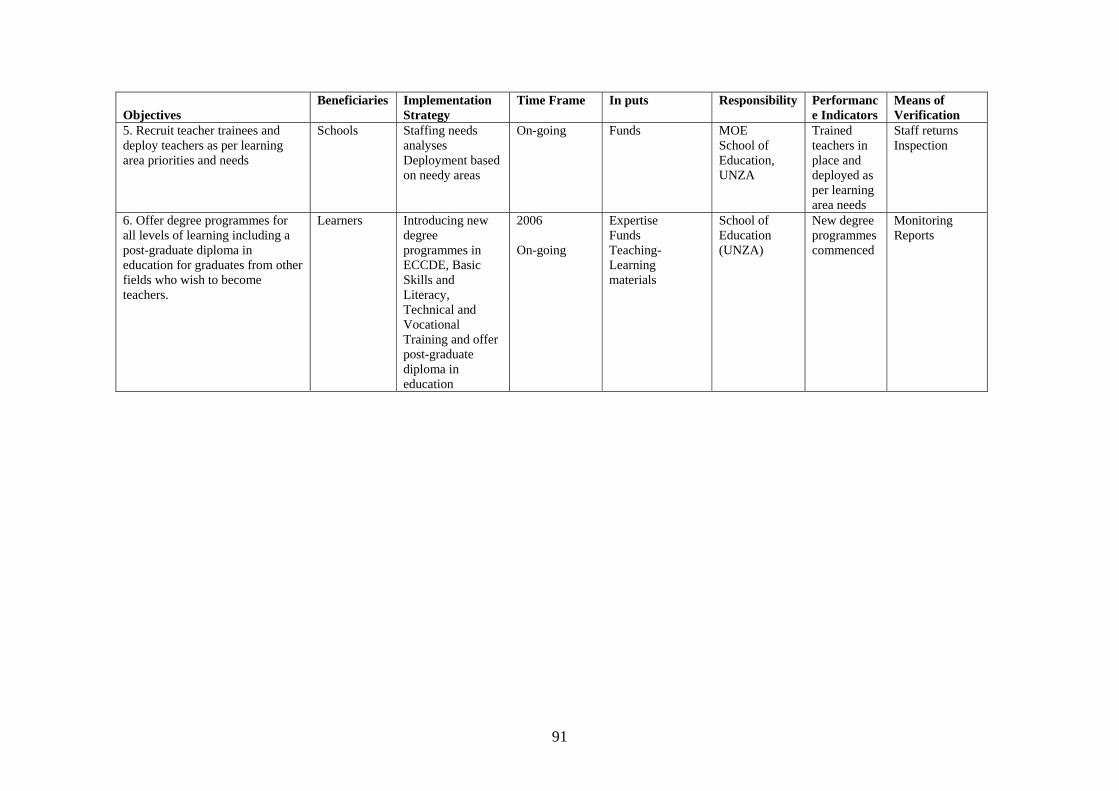
91
Objectives
Beneficiaries Implementation Strategy
Time Frame In puts Responsibility Performance Indicators
Means of Verification
5. Recruit teacher trainees and deploy teachers as per learning area priorities and needs
Schools Staffing needs analyses Deployment based on needy areas
On-going Funds
MOE School of Education, UNZA
Trained teachers in place and deployed as per learning area needs
Staff returns Inspection
6. Offer degree programmes for all levels of learning including a post-graduate diploma in education for graduates from other fields who wish to become teachers.
Learners Introducing new degree programmes in ECCDE, Basic Skills and Literacy, Technical and Vocational Training and offer post-graduate diploma in education
2006 On-going
Expertise Funds Teaching-Learning materials
School of Education (UNZA)
New degree programmes commenced
Monitoring Reports