INDONESIA - Planipolis
157
February 2004 INDONESIA Progress Report on the Millennium Development Goals
-
Upload
khangminh22 -
Category
Documents
-
view
2 -
download
0
Transcript of INDONESIA - Planipolis
February 2004
INDONESIAProgress Report on the
Millennium Development Goals

February 2004
INDONESIAProgress Report on the
Millennium Development Goals
2
TABLE OF CONTENTS
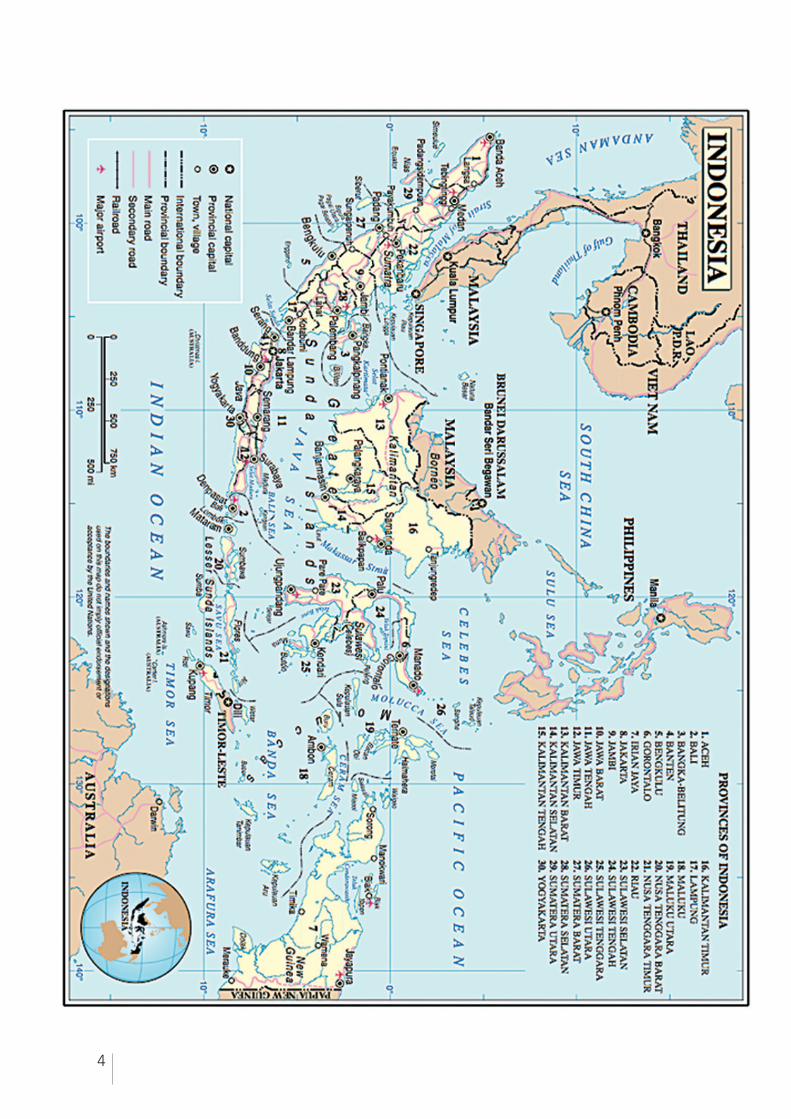
4 Map of Indonesia
5 Foreword by the Coordinating Minister for People’s Welfare
6 Preface by the State Minister for National Development Planning
7 Statement from the United Nations Country Team in Indonesia
8 Acknowledgements
9 Summary of national data for monitoring the MDGs: Indonesia 19902002
13 Part 1. Background
14 1. Introduction14 The Millennium Development
Goals: background14 The purpose of Indonesia’s first
MDG Report15 Data sources and availability
17 2. Indonesia: Development Context
17 Political context17 Economic and social development
context19 Natural resources and the
environment20 Decentralization and
regional disparities21 International context
23 Part 2. Progress towards goals
25 Goal 1: Eradicating Extreme Poverty and Hunger
26 Target 1: Halve, between 1990 and 2015, the proportion of people whose income is less than one dollar a day
26 Status and trends28 Challenges28 Policies and programmes
30 Target 2: Halve, between 1990 and 2015, the proportion of people who suffer from hunger
30 Status and trends31 Challenges31 Policies and programmes
33 Goal 2: Achieving Universal Basic Education
34 Target 3: Ensure that, by 2015, children everywhere, boys and girls alike, will be able to complete basic education
34 Status and trends38 Challenges39 Policies and programmes
41 Goal 3: Promoting Gender Equality and Empowering Women
42 Target 4: Eliminate gender disparity in primary and secondary education preferably by 2005 and in all levels of education no later than 2015
42 Status and trends46 Challenges46 Policies and programmes
3
49 Goal 4: Reducing Child Mortality
50 Target 5: Reduce by two-thirds, between 1990 and 2015, the under-five mortality rate
50 Status and trends51 Challenges53 Policies and programmes
55 Goal 5: Improving Maternal Health
56 Target 6: Reduce by three-quarters, between 1990 and 2015, the maternal mortality ratio
56 Status and trends58 Challenges59 Policies and programmes
61 Goal 6: Combating HIV/AIDS, Malaria and Other Diseases
62 Target 7: Have halted by 2015 and begun to reverse the spread of HIV/AIDS
62 Status and trends63 Challenges64 Policies and programmes
65 Target 8: Have halted by 2015 and begun to reverse the incidence of malaria and other major diseases
65 Malaria65 Status and trends66 Challenges67 Policies and programmes68 Tuberculosis 68 Status and trends69 Challenges70 Policies and programmes
71 Tobacco 71 Status and trends71 Challenges72 Policies and programmes
75 Goal 7: Ensuring Environmental Sustainability
76 Target 9: Integrate the principles of sustainable development into country policies and programmes and reverse the loss of environmental resources
76 Status and trends79 Challenges80 Policies and programmes
81 Target 10: Halve, by 2015, the proportion of people without sustainable access to safe drinking water and basic sanitation
81 Status and trends83 Challenges84 Policies and programmes
86 Target 11: By 2020, to have achieved a significant improvement in the lives of slum dwellers
86 Status and trends87 Challenges87 Policies and programmes
89 Tables
154 Glossary
4
5
FOREWORD
Assalamualaikum Warahmatulahi Wabarokatuh,
This First Progress Report on the Millennium Development Goals serves as a basis for monitoring
development progress in Indonesia, which with 188 other countries, has committed itself to the eight
Millennium Development Goals as a measure of human development. There is, thus, an obligation—to the
public, to communities and the country—to meet the Millennium Development Goals in efforts to ensure
the well-being of the people of Indonesia.
Out of the eight goals, the first seven fall under the responsibility of sectors and institutions coordinated
by the Coordinating Ministry for People’s Welfare. We, therefore, urge all concerned to work together and
make the implementation of this commitment a success.
Data are still not available for all indicators related to the Millennium Development Goals. Nevertheless,
this First Progress Report has been completed with hard work and efforts from all concerned. For this, we
thank all those who were involved in developing and preparing this Report.
In future, more complete and accurate data and information are needed on a continual basis, so that all
indicators for the Millennium Development Goals can be monitored. It will be necessary to obtain data
that can be used locally for regional development, as well as accurate data that can be used nationally
for macro-planning. Data also have to be timely and comparable, for use in examining trends, while
internationally recognized indicators are necessary for comparison with other countries. All these are steps
that lead towards realizing the wellbeing of society.
Let us work together with enthusiasm, seriousness and sincerity so that Indonesia can realize the
Millennium Development Goals.
Wassalamualaikum Wr.Wb.
M. Jusuf Kalla
Coordinating Minister for People’s Welfare
by His Excellency the Coordinating Minister for People’s Welfare
6
PREFACE
by His Excellency the State Minister for National Development Planning
In September 2000, the Government of Indonesia attended the Millennium Summit and signed the
Millennium Declaration, agreeing on a set of development goals, designated as the Millennium
Development Goals. One of the signatories of this Declaration, the Government of Indonesia has
an obligation to take action in order to realize these goals and to monitor progress towards their
achievement.
This First Progress Report on the Millennium Development Goals captures Indonesia’s situation over the
period 1990 to 2003, and examines trends up to 2015. The Report also summarizes the challenges, the
policies and the programmes relating to the realization of these goals in Indonesia.
Using the Millennium Development Goals will allow better comparison between Indonesia and other
countries, and will also provide a sound basis for improving development cooperation between
developing and developed countries. At national level, the Millennium Development Goals play an
important role in measuring development progress in the relevant sectors. The Millennium Development
Goals are, therefore, an important input for Indonesia’s national development planning.
Realizing the Millennium Development Goals will not be easy, especially when Indonesia is still
experiencing transition to a more democratic form of government and carrying out reforms in almost every
sector. At the same time, the country is still feeling the impact of the 1997 economic crisis. Nonetheless,
the Government remains optimistic about achieving these goals and targets. This will require much effort
and the support of all stakeholders—from the Government, from civil society, the business sector, the
political arena and academic institutions—who will need to work together to meet these commitments.
Finally, we would like to congratulate the team who prepared this Report, which represents an important
step in the efforts to achieve the Millennium Development Goals in Indonesia. We hope that it will be
useful to all stakeholders.
Kwik Kian Gie
Minister of Development Planning/
National Development Planning Agency
7
STATEMENT
Indonesia’s First Progress Report on the Millennium Development Goals is the outcome of a process that
was led and owned by the Government of Indonesia. The Report provides us with a clear analysis of where
Indonesia is and what needs to be done.
It has been a pleasure and a privilege for the United Nations System in Indonesia to work with the
Government on the preparation of this report. This was a very collaborative process: the Government
team and its five Working Groups involved all relevant Ministries and institutions, while the United Nations
Task Force supporting the Government in this endeavour was drawn from all concerned UN agencies
and chaired by UNICEF. We would like to thank the Government of Indonesia for the close cooperation
throughout this process.
We look forward to continuing our support to the Government of Indonesia’s efforts to create an
environment conducive to the elimination of poverty, and—in the words of the Millennium Declaration—to
make “the right to development a reality for everyone.”
Bo Asplund Steven Allen
United Nations Resident Coordinator UNICEF Representative and Task Force
Manager for UN support to the Government’s
MDG Report
from the United Nations Country Team in Indonesia
8
ACKNOWLEDGEMENTS
Coordinators: Prasetijono Widjojo, Syahrial Loetan, Delthy S. Simatupang
Bappenas, Government of Indonesia
Contributors:
Government of Indonesia:
Bappenas: Koensatwanto Inpasihardjo, Dedi M. Masykur Riyadi, Leila Retna Komala, Agus Prabowo, Nina
Sardjunani, Arum Atmawikarta, Basah Hernowo, Tuti Riyati, Obrian Saragih, Agus Sutiadi, Teni Widuriyanti,
Agustin Arry Yana, Suryadi, Ade Kuswoyo, Suharti, Taufik Hanafi, Pungkas Bahdjuri Ali, Nizhar Marizi,
Rohmad Supriyadi, Wawan, Maraita Listyasari
Coordinating Ministry for People’s Welfare: Djoharis Lubis, Sugihartatmo
Ministry of Health: Azrul Azwar, Umar Fahmi Ahmadi, Haikin Rahmat, Ina Herawati, Lukman Hendro, Siti
Nadia, Eko Saputro
Ministry of National Education: Indradjati Sidi, Hamid Muhamad
State Ministry of Environment: Effendy Sumardja
BPS—Statistics Indonesia: Wynandin Imawan
United Nations System:
UNICEF (UN Taskforce Manager): Steven Allen, Yin Yin Nwe, Saptono Priyadi, Nikensari Setiadi
Asian Development Bank: Amanah Abdul Kadir
FAO: Tsukasa Kimoto
UN HABITAT: Sean McCarthy
ILO: Oktaviano Pasaribu
UNAIDS: Jane Wilson
UNDP: Romeo Reyes
UNESCO: Cecilia Barbieri
UNFPA: Melania Hidayat
UN Resident Coordinator’s Office: Gro Skaaren-Fystro
UNSFIR: Roland Lindenthal
World Bank: Menno Pradhan
WFP: Pascale Micheau
WHO: Sarah Barber
9
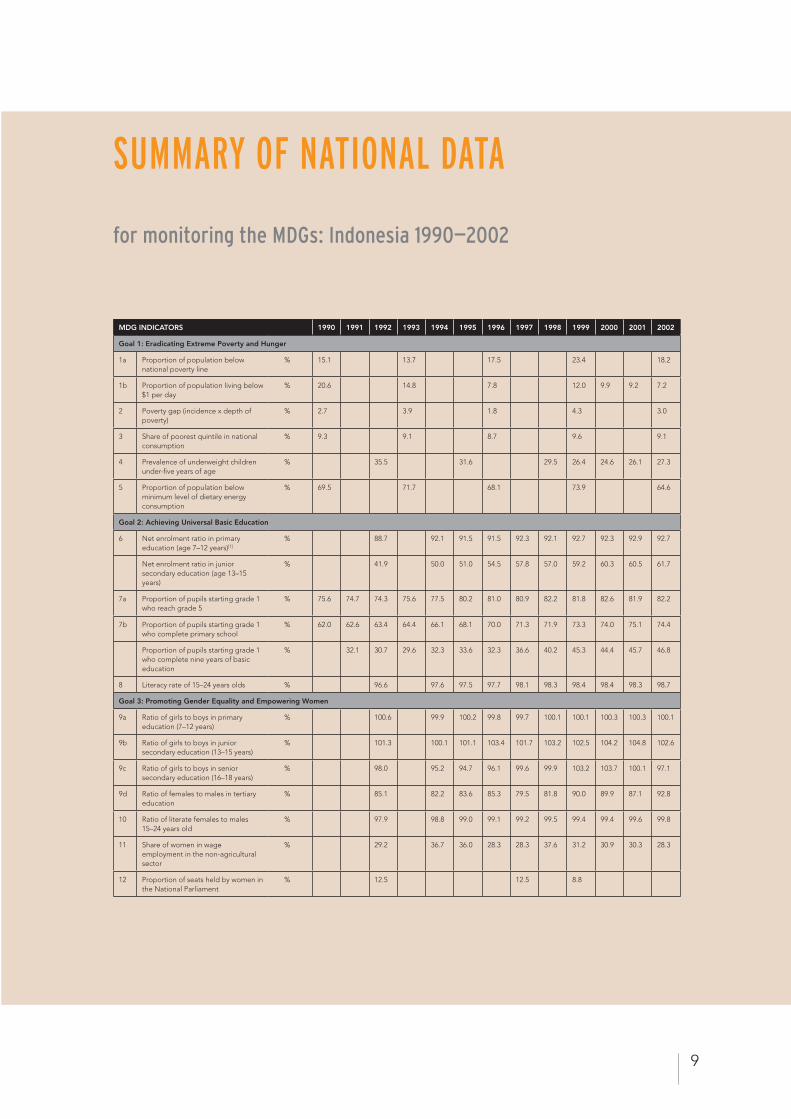
SUMMARY OF NATIONAL DATA
for monitoring the MDGs: Indonesia 1990—2002
MDG INDICATORS 1990 1991 1992 1993 1994 1995 1996 1997 1998 1999 2000 2001 2002
Goal 1: Eradicating Extreme Poverty and Hunger
1a Proportion of population below national poverty line
% 15.1 13.7 17.5 23.4 18.2
1b Proportion of population living below $1 per day
% 20.6 14.8 7.8 12.0 9.9 9.2 7.2
2 Poverty gap (incidence x depth of poverty)
% 2.7 3.9 1.8 4.3 3.0
3 Share of poorest quintile in national consumption
% 9.3 9.1 8.7 9.6 9.1
4 Prevalence of underweight children under-five years of age
% 35.5 31.6 29.5 26.4 24.6 26.1 27.3
5 Proportion of population below minimum level of dietary energy consumption
% 69.5 71.7 68.1 73.9 64.6
Goal 2: Achieving Universal Basic Education
6 Net enrolment ratio in primary education (age 7–12 years)[1]
% 88.7 92.1 91.5 91.5 92.3 92.1 92.7 92.3 92.9 92.7
Net enrolment ratio in junior secondary education (age 13–15 years)
% 41.9 50.0 51.0 54.5 57.8 57.0 59.2 60.3 60.5 61.7
7a Proportion of pupils starting grade 1 who reach grade 5
% 75.6 74.7 74.3 75.6 77.5 80.2 81.0 80.9 82.2 81.8 82.6 81.9 82.2
7b Proportion of pupils starting grade 1 who complete primary school
% 62.0 62.6 63.4 64.4 66.1 68.1 70.0 71.3 71.9 73.3 74.0 75.1 74.4
Proportion of pupils starting grade 1 who complete nine years of basic education
% 32.1 30.7 29.6 32.3 33.6 32.3 36.6 40.2 45.3 44.4 45.7 46.8
8 Literacy rate of 15–24 years olds % 96.6 97.6 97.5 97.7 98.1 98.3 98.4 98.4 98.3 98.7
Goal 3: Promoting Gender Equality and Empowering Women
9a Ratio of girls to boys in primary education (7–12 years)
% 100.6 99.9 100.2 99.8 99.7 100.1 100.1 100.3 100.3 100.1
9b Ratio of girls to boys in junior secondary education (13–15 years)
% 101.3 100.1 101.1 103.4 101.7 103.2 102.5 104.2 104.8 102.6
9c Ratio of girls to boys in senior secondary education (16–18 years)
% 98.0 95.2 94.7 96.1 99.6 99.9 103.2 103.7 100.1 97.1
9d Ratio of females to males in tertiary education
% 85.1 82.2 83.6 85.3 79.5 81.8 90.0 89.9 87.1 92.8
10 Ratio of literate females to males 15–24 years old
% 97.9 98.8 99.0 99.1 99.2 99.5 99.4 99.4 99.6 99.8
11 Share of women in wage employment in the non-agricultural sector
% 29.2 36.7 36.0 28.3 28.3 37.6 31.2 30.9 30.3 28.3
12 Proportion of seats held by women in the National Parliament
% 12.5 12.5 8.8
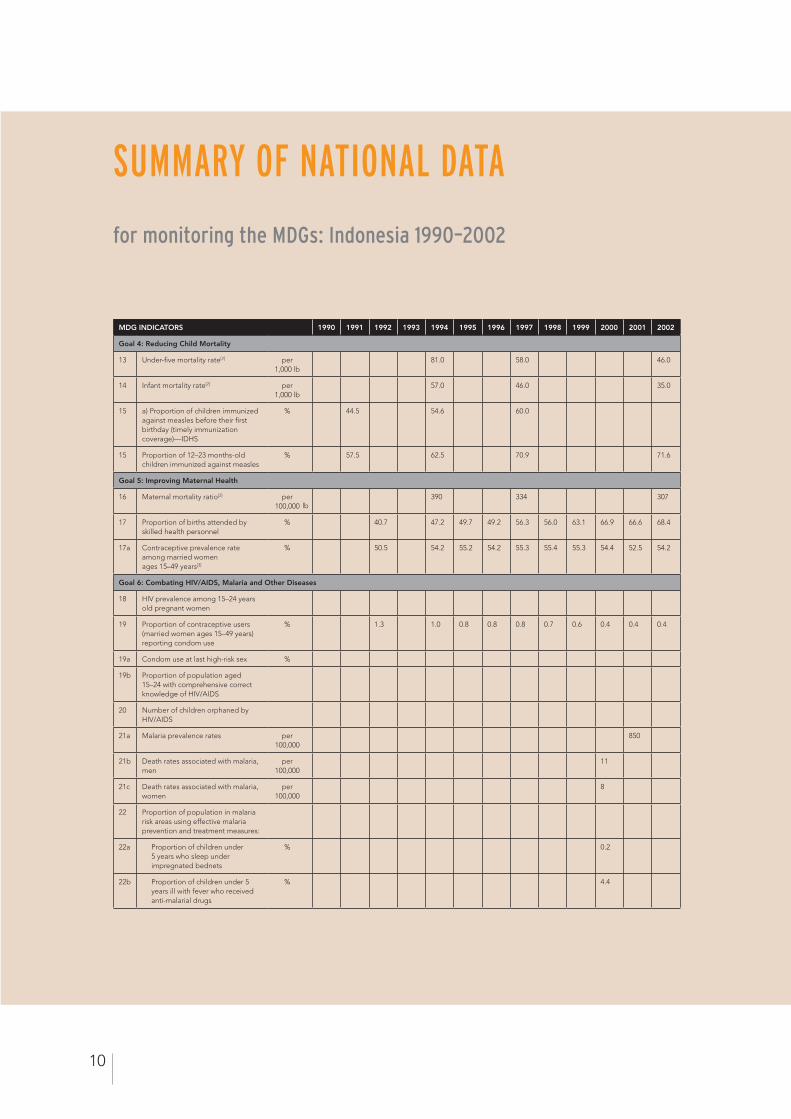
10
SUMMARY OF NATIONAL DATA
for monitoring the MDGs: Indonesia 1990–2002
MDG INDICATORS 1990 1991 1992 1993 1994 1995 1996 1997 1998 1999 2000 2001 2002
Goal 4: Reducing Child Mortality
13 Under-five mortality rate[2] per 1,000 lb
81.0 58.0 46.0
14 Infant mortality rate[2] per 1,000 lb
57.0 46.0 35.0
15 a) Proportion of children immunized against measles before their first birthday (timely immunization coverage)—IDHS
% 44.5 54.6 60.0
15 Proportion of 12–23 months-old children immunized against measles
% 57.5 62.5 70.9 71.6
Goal 5: Improving Maternal Health
16 Maternal mortality ratio[2] per 100,000
390 334 307
17 Proportion of births attended by skilled health personnel
% 40.7 47.2 49.7 49.2 56.3 56.0 63.1 66.9 66.6 68.4
17a Contraceptive prevalence rate among married women ages 15–49 years[3]
% 50.5 54.2 55.2 54.2 55.3 55.4 55.3 54.4 52.5 54.2
Goal 6: Combating HIV/AIDS, Malaria and Other Diseases
18 HIV prevalence among 15–24 years old pregnant women
19 Proportion of contraceptive users (married women ages 15–49 years) reporting condom use
% 1.3 1.0 0.8 0.8 0.8 0.7 0.6 0.4 0.4 0.4
19a Condom use at last high-risk sex %
19b Proportion of population aged 15–24 with comprehensive correct knowledge of HIV/AIDS
20 Number of children orphaned by HIV/AIDS
21a Malaria prevalence rates per 100,000
850
21b Death rates associated with malaria, men
per 100,000
11
21c Death rates associated with malaria, women
per 100,000
8
22 Proportion of population in malaria risk areas using effective malaria prevention and treatment measures:
22a Proportion of children under 5 years who sleep under impregnated bednets
% 0.2
22b Proportion of children under 5 years ill with fever who received anti-malarial drugs
% 4.4
lb
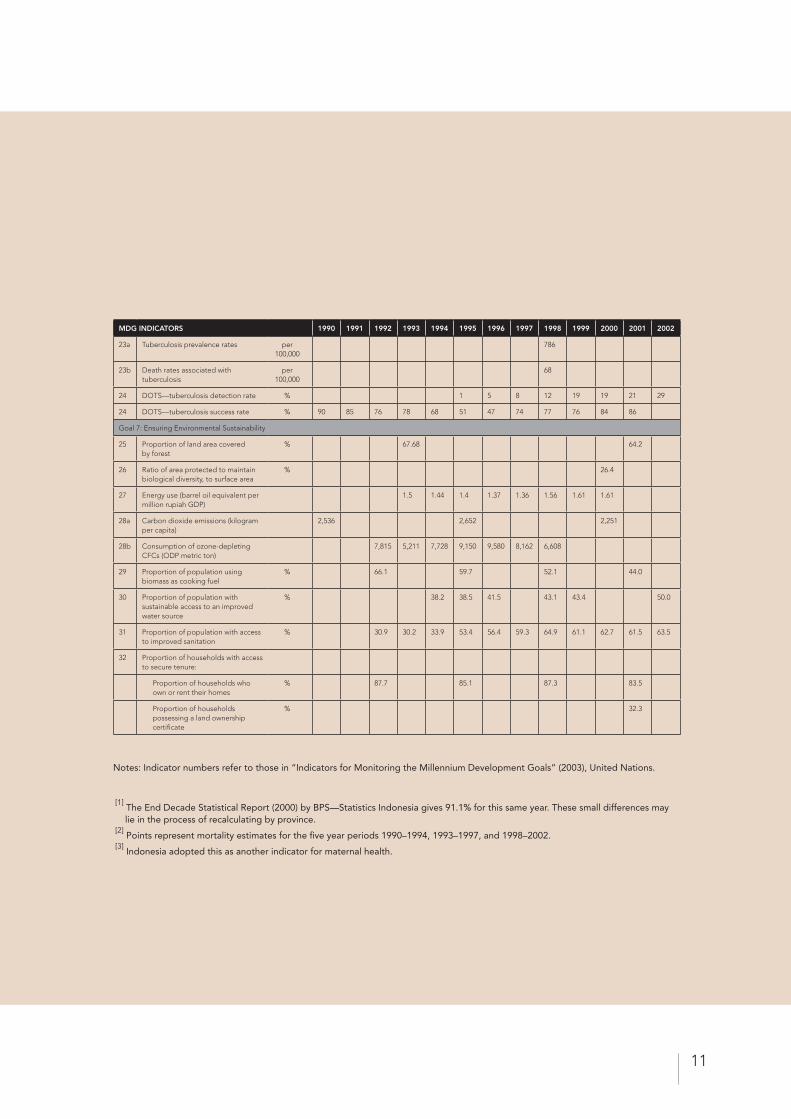
11
MDG INDICATORS 1990 1991 1992 1993 1994 1995 1996 1997 1998 1999 2000 2001 2002
23a Tuberculosis prevalence rates per 100,000
786
23b Death rates associated with tuberculosis
per 100,000
68
24 DOTS—tuberculosis detection rate % 1 5 8 12 19 19 21 29
24 DOTS—tuberculosis success rate % 90 85 76 78 68 51 47 74 77 76 84 86
Goal 7: Ensuring Environmental Sustainability
25 Proportion of land area covered by forest
% 67.68 64.2
26 Ratio of area protected to maintain biological diversity, to surface area
% 26.4
27 Energy use (barrel oil equivalent per million rupiah GDP)
1.5 1.44 1.4 1.37 1.36 1.56 1.61 1.61
28a Carbon dioxide emissions (kilogram per capita)
2,536 2,652 2,251
28b Consumption of ozone-depleting CFCs (ODP metric ton)
7,815 5,211 7,728 9,150 9,580 8,162 6,608
29 Proportion of population using biomass as cooking fuel
% 66.1 59.7 52.1 44.0
30 Proportion of population with sustainable access to an improved water source
% 38.2 38.5 41.5 43.1 43.4 50.0
31 Proportion of population with access to improved sanitation
% 30.9 30.2 33.9 53.4 56.4 59.3 64.9 61.1 62.7 61.5 63.5
32 Proportion of households with access to secure tenure:
Proportion of households who own or rent their homes
% 87.7 85.1 87.3 83.5
Proportion of households possessing a land ownership certificate
% 32.3
Notes: Indicator numbers refer to those in “Indicators for Monitoring the Millennium Development Goals” (2003), United Nations.
[1] The End Decade Statistical Report (2000) by BPS—Statistics Indonesia gives 91.1% for this same year. These small differences may lie in the process of recalculating by province.
[2] Points represent mortality estimates for the five year periods 1990–1994, 1993–1997, and 1998–2002.
[3] Indonesia adopted this as another indicator for maternal health.

Indonesia Progress Report on the Millenium Development Goals
12

Indonesia Progress Report on the Millenium Development Goals
PART I
BACKGROUND
13
Indonesia Progress Report on the Millenium Development Goals
14
The Millennium DevelopmentGoals: Background
The Millennium Summit. The Millennium Declara-
tion was issued at the Millennium Summit in New
York in September 2000, attended by 189 Member
States of the United Nations (UN), with 147 of them
represented by Heads of State or Government. It
covers issues of peace, security and development—
including the environment, the protection of vulner-
able groups, human rights and governance—and
brings a set of interconnected development goals
into a global agenda. Called the Millennium Devel-
opment Goals (MDGs), the eight goals are: to eradi-
cate extreme poverty and hunger; achieve universal
basic education; promote gender equality and em-
power women; reduce child mortality; improve ma-
ternal health; combat HIV/AIDS, malaria and other
diseases; ensure environmental sustainability; and
develop a global partnership for development. Sev-
en of these were translated into targets that can be
measured and their progress reported through veri-
fiable and internationally comparable indicators.
Other development goals. Successive UN devel-
opment decades, from the 1960s through to the
1980s, have set development goals, while other
goals emerged from UN conferences and summits
during the 1990s, including: the 1990 World Sum-
mit for Children in New York; the 1990 World Con-
ference on Education for All in Jomtien; the 1992
UN Conference on Environment and Development
in Rio de Janeiro; and the 1995 World Summit for
Social Development in Copenhagen. Many of these
earlier goals and targets were consolidated into the
International Development Goals (IDGs) initially by
the Organization for Economic Co-operation and
Development (OECD) in 1996 and subsequently
endorsed by the UN, World Bank and International
Monetary Fund (IMF).1 The MDGs incorporate the
IDGs and therefore do not contradict agreements
reached at previous global conferences.
Interdependence. The MDGs are not UN goals, al-
though the UN has embarked on a global campaign
to help to realize them. Rather, the MDGs are goals
adopted by countries through the governments
which represented them at the Millennium Summit.
However, the goals are to be achieved not only by
the central government but also by local govern-
ments, parliamentarians, civil society, the mass me-
dia and other stakeholders. The MDGs are closely
linked to one another. For example, eradicating
extreme poverty and hunger (Goal 1) is a necessary
but insufficient condition for achieving the goals
that relate to education, gender equality, health and
environmental sustainability. Similarly, the progress
towards the first seven MDGs is also dependent on
progress towards Goal 8—which calls for more and
better development assistance, a more open and
fair framework for trade and a new international fi-
nancial architecture. The MDGs imply a concerted
global effort to monitor progress, raise awareness,
catalyze action, reform policies, build capacities and
mobilize resources towards meeting the goals.
The purpose of Indonesia’s first MDG Report
Reaching agreement and setting benchmarks.
This first MDG Report represents the Government
of Indonesia’s attempt to take stock of the country’s
human development situation in relation to the first
1. INTRODUCTION
Indonesia Progress Report on the Millenium Development Goals
15
a Developing countries, such as Indonesia, are expected to report on Goals 1 to 7, while developed countries have primary
responsibility for reporting on Goal 8. b Or the closest year to 1990, depending on the available data.c However, the core component is also subject to revision. Since 2001, for example, birth registration has become part of the core component.
seven MDGs;a to measure and analyze progress;
identify challenges; and review the policies and pro-
grammes necessary to meet the targets. The report
uses existing data sources and goes back to 1990,b
the baseline year for the MDGs. Wherever possible,
this report examines the situation at both national
and provincial levels. A primary purpose of this MDG
Report is to establish consensus and reach agree-
ment on Indonesia’s progress with its MDG targets
and to set benchmarks for future work.
Advocacy. Another purpose of this report is to pro-
vide a sound basis for advocacy with policy makers,
government institutions, parliamentarians, non-gov-
ernmental organizations (NGOs), civil society orga-
nizations, the Indonesian public and international
organizations and bodies. The information in this
report may be used in various forms (for example,
a popular version) to promote the MDGs and en-
courage various stakeholders to take action at each
level.
Not a planning instrument. This report shows na-
tional goals and targets where they already exist,
but this report should not be seen as a planning
instrument which formulates and sets national plan-
ning targets. Target-setting is a linked but separate
step within the ongoing national development plan-
ning processes, which include formulating poverty-
reduction strategies and targets that are appropri-
ately localized, or adjusted to the national or local
situation. It is expected that the information in this
report will be useful for such planning and costing
processes.2
National and regional targets. Central and region-
al governments, and other stakeholders, need to
reach a consensus on how national or international
targets will be localized and how resources will be al-
located and mobilized. To this end, the Government
is planning a social summit as a forum for dialogue
between the central and regional governments.
Data sources and availability
Data sources. The Government of Indonesia’s five
Working Groups for the MDG Report, supported by
the Central Statistical Office of Indonesia (BPS—Sta-
tistics Indonesia) and the UN Task Force, reviewed
several data sources for the MDG indicators which
can conveniently be grouped into surveys and cen-
suses, and institutional reporting systems.
Survey data. The National Socio-Economic Surveys
(called Susenas), implemented by BPS—Statistics
Indonesia, are a major source of data for the MDGs.
Indonesia first introduced the Susenas in 1963, with
subsequent surveys conducted in 1964, 1965, 1967,
1969, 1970, 1976, 1978, 1979, 1981, 1982, 1985 and
1989.3 However, these Susenas were not standard-
ized and the modules varied according to specific
years. Starting from 1992, BPS—Statistics Indonesia
revised and standardized the Susenas, with a view
to establishing a regular monitoring system for wel-
fare indicators. The 1992 Susenas were launched
with core and module components and since then
the Susenas have been implemented every year
with the same core componentc but with different
module components, depending on the year. The
periodicity of a module component is normally
three years, unless special funding becomes avail-
able. For example, before 1998, child nutrition—a
module component—was measured through an an-
thropometric module only once every three years.
From 1998 to 2002, BPS—Statistics Indonesia ob-
tained extra funding to measure child malnutrition
every year.
Institutional sources. Data for some MDG indica-
tors are only available from institutional sources. Like
survey data, the reliability and use of institutional
data have to be considered on a case-by-case ba-
sis. Institutional data can still have the drawback of
having incomplete coverage; incomplete reporting,
especially since decentralization; and a non-func-
tioning vital registration system, which means that
population denominators estimates use projections
from censuses. Estimates may vary by ministry, and
even within the same ministry, which leads to large
differences in reporting.
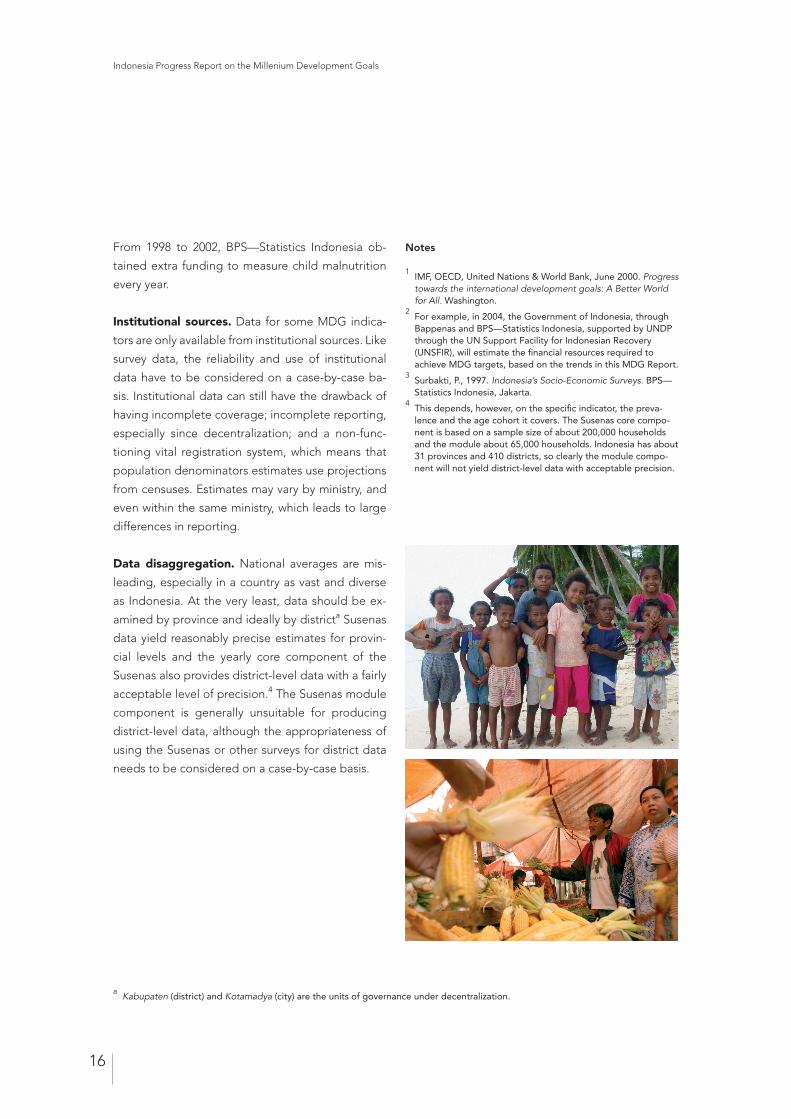
Data disaggregation. National averages are mis-
leading, especially in a country as vast and diverse
as Indonesia. At the very least, data should be ex-
amined by province and ideally by districta Susenas
data yield reasonably precise estimates for provin-
cial levels and the yearly core component of the
Susenas also provides district-level data with a fairly
acceptable level of precision.4 The Susenas module
component is generally unsuitable for producing
district-level data, although the appropriateness of
using the Susenas or other surveys for district data
needs to be considered on a case-by-case basis.
a Kabupaten (district) and Kotamadya (city) are the units of governance under decentralization.
Notes
1 IMF, OECD, United Nations & World Bank, June 2000. Progress towards the international development goals: A Better World for All. Washington.
2 For example, in 2004, the Government of Indonesia, through Bappenas and BPS—Statistics Indonesia, supported by UNDP through the UN Support Facility for Indonesian Recovery (UNSFIR), will estimate the financial resources required to achieve MDG targets, based on the trends in this MDG Report.
3 Surbakti, P., 1997. Indonesia’s Socio-Economic Surveys. BPS—Statistics Indonesia, Jakarta.
4 This depends, however, on the specific indicator, the preva-lence and the age cohort it covers. The Susenas core compo-nent is based on a sample size of about 200,000 households and the module about 65,000 households. Indonesia has about 31 provinces and 410 districts, so clearly the module compo-nent will not yield district-level data with acceptable precision.
Indonesia Progress Report on the Millenium Development Goals
16
Indonesia Progress Report on the Millenium Development Goals
17
2. INDONESIA: DEVELOPMENT CONTEXT
Political context
Old Order. The Independence Proclamation was
made in 1945, but it was not until late 1949 that
the Dutch formally transferred sovereignty over the
archipelago to Indonesia. The liberal democratic
Republic of Indonesia established in 1950 was char-
acterized by frequent changes in cabinets, regional
tensions and economic difficulties. The first 15 years
of Indonesia’s history as an independent state were
marked by political instability and economic decline.
The political situation deteriorated towards the end
of the Old Order regime, leading to an abortive
coup d’état in September 1965.
New Order. In 1966, the New Order regime was
established with the transfer of government to Gen-
eral Soeharto, who became president in 1967 and
for the next six five-year terms. The Government
emphasized maintaining national stability, and for-
mulated and implemented policies in successive
five-year development plans. Although economic
development was fairly successful, it was not ac-
companied by political participation, human rights,
justice and transparency in public decision-making.
In particular, financial transactions were often tinged
with corruption, collusion and nepotism (KKN). The
increasingly vocal opposition to the New Order re-
gime gained extra momentum from the severe eco-
nomic crisis that hit Indonesia in late 1997. On 21
May 1998, President Soeharto resigned.
Reform Order (Reformasi). From 1998, Indonesia
entered a period of political, economic and social
reforms, and has evolved towards a multi-party
system and more democratic form of government.
Since then, there have been three changes in gov-
ernment. Governance reforms include the strength-
ening of existing institutions and the creation of
new ones to ensure more democratic and effective
governance, and greater accountability and trans-
parency in the exercise of government functions.
Constitutional reforms have brought a more equita-
ble system of legislative representation. From 2004,
the public—rather than the People’s Consultative
Assembly—will directly elect the Head of Govern-
ment. Human rights are now more freely exercised
than they were during the New Order era.
Economic and social develop-ment context
A diversified economy. Agriculture has historically
been a dominant sector in both employment and
output. Indonesia also has a vast range of mineral
resources, which have been exploited over the past
three decades. The manufacturing sector began a
rapid expansion in the mid-1980s and the share of
manufacturing in Gross Domestic Product (GDP) ex-
ceeded that of agriculture for the first time in 1991.
More recently, the services sector has also expand-
ed rapidly. Exports have been the primary engine
of growth. Before the mid-1970s, exports consisted
mainly of a small number of primary commodities.
But the decline in petroleum prices after 1983 result-
ed in a concerted push towards industrialization in
which semi-processed and manufactured products
increasingly dominated exports. Determined efforts
to promote tourism since the mid-1980s have also
had an impact on export earnings.
Indonesia Progress Report on the Millenium Development Goals
18
New Order economy. The New Order regime
began economic rehabilitation by reassessing
economic objectives. Stability, growth and eq-
uity—which became known as the “Trilogy of De-
velopment”—were to be achieved through a series
of five-year development plans known as Repelita. a
From 1976 to 1996, consistently high rates of eco-
nomic growth helped to dramatically reduce pover-
ty. This growth, averaging around 6 per cent a year
between 1970 and 1996, was achieved despite some
external shocks.
Asian economic crisis. The 1997–1998 economic
crisis led to a slowing of GDP growth to 4.7 per cent
in 1997 and a decline of 13.1 per cent in 1998. Eco-
nomic growth was restored as GDP expanded by
0.8 per cent in 1999 and by 4.8 per cent in 2000. It
slowed again to 3.3 per cent in 2001, partly as a re-
sult of the global economic slowdown.
Growth strategy. Restoration of economic growth
is being pursued in the context of a longer-term
development strategy that is people-centered and
environmentally sustainable, and with an overarch-
ing goal of poverty reduction. Greater emphasis
will be placed on the more equitable distribution of
economic growth. This strategy continues to be out-
ward looking, taking into account the globalization
process while pursuing a policy of decentralizing
authority and responsibility. Enhancing competitive-
ness is a key component, given the huge domestic
market and its potential for generating economies
of scale, and the abundant human resources.
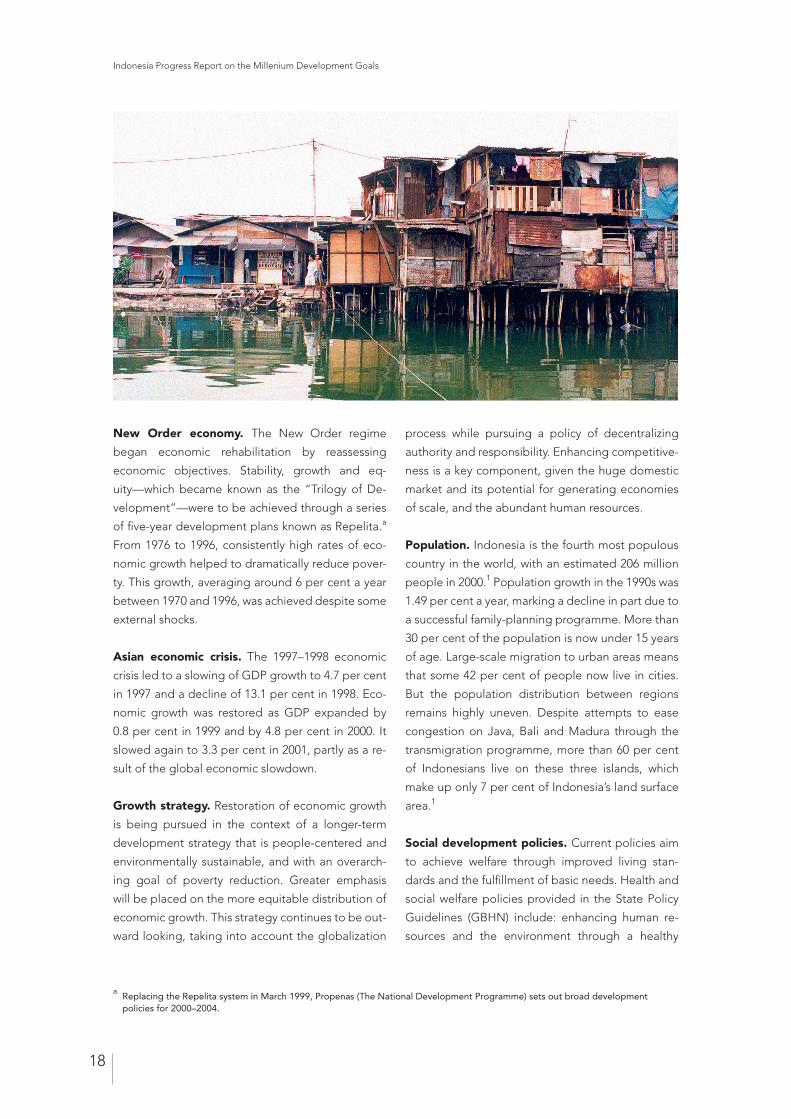
Population. Indonesia is the fourth most populous
country in the world, with an estimated 206 million
people in 2000.1 Population growth in the 1990s was
1.49 per cent a year, marking a decline in part due to
a successful family-planning programme. More than
30 per cent of the population is now under 15 years
of age. Large-scale migration to urban areas means
that some 42 per cent of people now live in cities.
But the population distribution between regions
remains highly uneven. Despite attempts to ease
congestion on Java, Bali and Madura through the
transmigration programme, more than 60 per cent
of Indonesians live on these three islands, which
make up only 7 per cent of Indonesia’s land surface
area.1
Social development policies. Current policies aim
to achieve welfare through improved living stan-
dards and the fulfillment of basic needs. Health and
social welfare policies provided in the State Policy
Guidelines (GBHN) include: enhancing human re-
sources and the environment through a healthy
a Replacing the Repelita system in March 1999, Propenas (The National Development Programme) sets out broad development
policies for 2000–2004.
Indonesia Progress Report on the Millenium Development Goals
19
paradigm approach; strengthening the quality of
health institutions and services; developing a social
insurance system for the workforce; developing so-
cial resilience; giving more attention to the needs
of senior citizens and veterans; increasing the public
awareness about groups with social problems; and
eradicating drug trafficking and abuse.
Education policies. The major policies emphasize
human resource development and focus on: ex-
tending and creating more equitable educational
opportunities; improving the quality and welfare
of teachers; empowering educational institutions
as centers for nurturing values, attitudes and capa-
bilities; reforming and consolidating the education
system, including through curriculum reform and
decentralization; and improving the quality of edu-
cational institutions to help them to keep up with
advances in science, technology and the arts. Edu-
cation improved greatly under the New Order, lead-
ing to a decline in illiteracy rates.
Health policies. The health sector has seen signifi-
cant investments since the late 1960s. Health poli-
cies have focused on establishing health facilities in
rural areas. Preventive health care has also been pri-
oritized, in particular, the provision of a clean drink-
ing-water supply, immunization, improved nutrition
and pest control.
Natural resources and the environment
Natural resources. Indonesia’s natural resources
are the backbone of its subsistence and formal
economies. Millions of people depend on subsis-
tence farming, fishing and tree-crop and cash-crop
cultivation for a living. The country also has large
marine resources. Since the 1970s, commercial log-
ging has reduced Indonesia’s once-vast forests. Rich
deposits of oil, gas, coal, copper, tin, nickel, bauxite,
gold, silver, kaolin, marble and other resources are
the mainstays of an important mining and quarrying
sector.
National commitment. As a demonstration of its
commitment to the sustainable use of natural re-
sources and protecting the environment, the Gov-
ernment established the State Ministry for Environ-
ment in 1978. Indonesia also made substantial con-
tributions to the 1993 UN Conference on Environ-
ment and Development, and was one of the first sig-
natories to the UN Convention on Biological Diver-
sity and the UN Framework Convention on Climate
Change. The sustainable use of natural resources
has been prominently mentioned in its national de-
velopment plans from Repelita II (1973-1978) to the
current National Development Programme (Prope-
nas). Despite these commitments and the impor-
tance of natural resources to the economy, the use
of natural resources has not always been carried
out in a sustainable manner. Environmental laws are
not always followed and violations—illegal logging,
mining and fishing—are often in collusion with local
and provincial officials.
Outlook. Natural resources will need to be man-
aged in a more sustainable way and in line with the
decentralization policy and regional autonomy. Ac-
cordingly, laws and regulations relating to sustain-
able use of natural resources and environmental
protection will need to be harmonized with the au-
thority devolved to local governments. Preventing
human and industrial activities from damaging the
environment is a key concern.
Indonesia Progress Report on the Millenium Development Goals
20
Decentralization and regional disparities
Regional development policies. These policies—
in the GBHN, in line with Laws 22 and 25 on regional
autonomy and fiscal decentralization—focus on:
developing extensive, real and responsible regional
autonomy; reviewing local autonomy policies for
the provincial, district/city and village levels; realiz-
ing a just fiscal balance between central and local
administrations; and empowering local parliaments
(DPRD) to carry out their functions and roles.
Challenges. Injustices in sharing fiscal resources be-
tween the central and regional administrations have
led to discrepancies in economic growth among re-
gions, a lack of regional independence and general
dissatisfaction in the regions. Also, in many regions,
the economic crisis increased unemployment, pov-
erty and other social problems. A decline in eco-
nomic activity has led to decreased local revenues
and constrained local governments in implement-
ing development activities and providing public
services.
Regional patterns of development. Indonesia’s
regions have developed in an unequal manner.
The western areas of Indonesia (Sumatra, Java and
Bali) have enjoyed the fastest rates of growth over
the past three decades, leading to a concentration
of wealth in these densely populated islands. The
disparity between western areas and the rest of
the country widened during the boom years of the
1980s and 1990s. Growth in the peripheral regions
of the country concentrated on areas suitable for
the cultivation of cash crops or exploitation of min-
eral resources. The pace of development has been
particularly slow in many of the eastern provinces,
which mostly have relatively small populations and
are far from the centers of political and economic
power. Later chapters in this report give specific ex-
amples of disparities in social indicators.
Policy implementation. To address inter-regional
disparities, the Government has implemented vari-
ous policies to increase the direct budget allocation
to the regions, strengthen poverty alleviation ef-
forts, promote economic activities and provide op-
portunities for natural resources management in the
regions.
International context
International influences. Indonesia’s path to devel-
opment has been greatly influenced by changes in
nearly all aspects of international relations, includ-
ing the rapid, inevitable process of globalization
of business, economic and financial transactions.
A major contributor to sustained economic growth
during the New Order era was the inflow of inter-
national capital through foreign direct and equity
investment, commercial loans and Official Devel-
opment Assistance (ODA) in the form of grants
and loans with concessional terms. Indonesia is an
active member of the UN and its many agencies,
programmes and funds, as well as other inter-gov-
ernmental organizations, such as the Non-Aligned
Movement (NAM). It is also a signatory of many in-
ternational and regional treaties and conventions,
including multilateral trading arrangements such as
those established under the auspices of the World
Trade Organization (WTO), Asia-Pacific Economic
Cooperation (APEC) and Association of Southeast
Asian Nations (ASEAN). As a demonstration of its
internationalism, Indonesia is also an active propo-
nent of South-South Cooperation (cooperation be-
tween developing countries) and has been involved
in the TCDC (Technical Cooperation between De-
veloping Countries) programme by sharing with
other developing countries its capacities in various
Indonesia Progress Report on the Millenium Development Goals
21
areas, hosting training programmes and providing
expert services to the least-developed countries of
Asia and Africa.
Commitment to the MDGs. Apart from being a
signatory to the Millennium Declaration, Indonesia
shows its commitment to the MDGs in the GBHN
and the Five-Year National Development Plan. This
is further demonstrated by ongoing efforts to for-
mulate poverty-reduction strategies at national and
sub-national levels, which are explicitly aimed at re-
alizing the MDG targets.
Realizing the MDG targets. Indonesia will need
support from the international community, particu-
larly from developed countries as development
cooperation partners. Due to insufficient domestic
capital, Indonesia needs a continued net inflow of
foreign capital. To retain current foreign investments
and attract new investment, Indonesia has taken
concrete steps to improve its investment climate, in-
cluding reforms in the business legal and regulatory
framework and other measures explicitly provided
in the Government’s IMF exit strategy, otherwise
known as the White Paper. There is a net outflow of
ODA loans, as debt service payments (principal and
interest) for outstanding ODA loans exceed new in-
flows. Net inflow must be restored as a source of
investment financing, which could be achieved by
increased inflow and domestic capacity to absorb
new loans with more concessional terms, or by out-
right debt forgiveness and other forms of debt relief
from creditors. Debt relief and more generous ODA
for countries committed to poverty reduction, such
as Indonesia, are in fact included as targets, albeit
neither time-bound nor quantified, for the eighth
MDG (a global partnership for development). As ex-
ports have been one of the major sources of growth
in Indonesia, cooperation from developed countries
is critical to increase the access to markets in these
countries, another Goal 8 target. Without such co-
operation from developed countries—as asked for
in the Millennium Development Compact2—the re-
alization of the MDG targets by Indonesia would be
jeopardized.
Notes
1 BPS—Statistics Indonesia, 2003. Statistical Year Book of Indonesia 2002.
2 UNDP, 2003. Human Development Report.

Indonesia Progress Report on the Millenium Development Goals
22
Indonesia Progress Report on the Millenium Development Goals
23
PART 2.
PROGRESS TOWARDS GOALS
24
GOAL 1: Eradicating Extreme Poverty and Hunger
GOAL 2: Achieving Universal Basic Education
GOAL 3: Promoting Gender Equality and
Empowering Women
GOAL 4: Reducing Child Mortality
GOAL 5: Improving Maternal Health
GOAL 6: Combating HIV/AIDS, Malaria and
Other Diseases
GOAL 7: Ensuring Environmental Sustainability

25
GOAL 1
Eradicating Extreme Poverty and Hunger
Indonesia Progress Report on the Millenium Development Goals
26
Status and trends
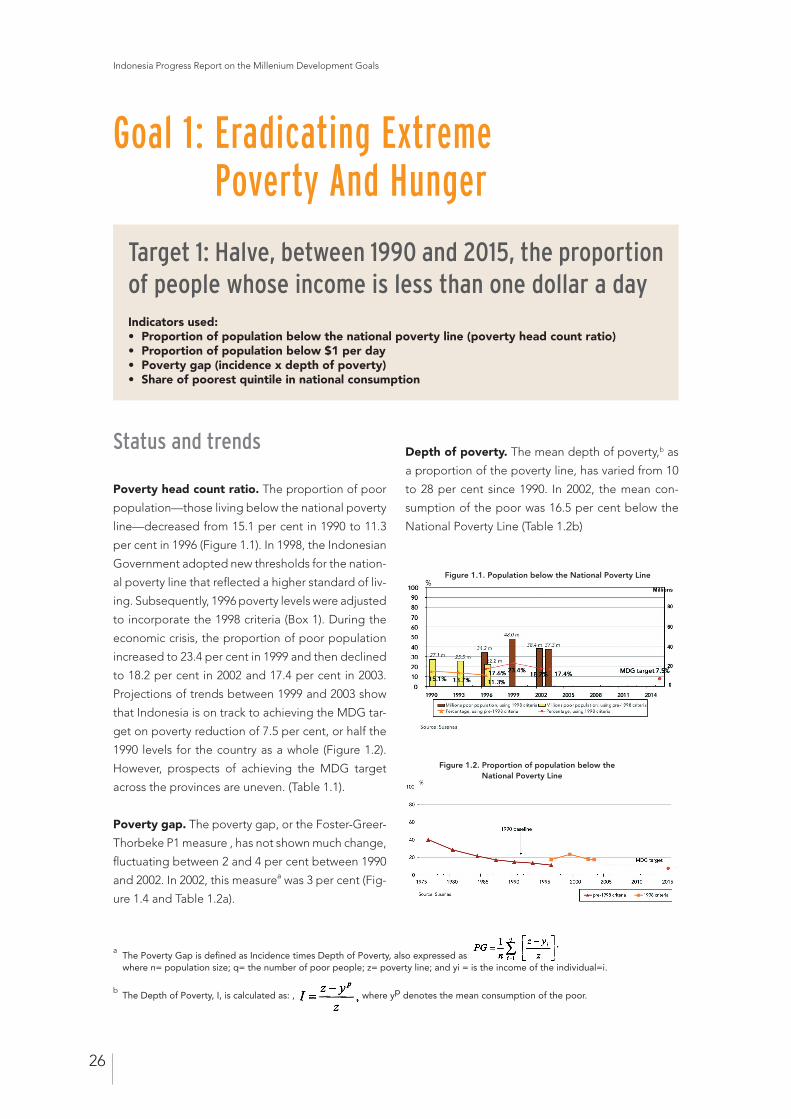
Poverty head count ratio. The proportion of poor
population—those living below the national poverty
line—decreased from 15.1 per cent in 1990 to 11.3
per cent in 1996 (Figure 1.1). In 1998, the Indonesian
Government adopted new thresholds for the nation-
al poverty line that reflected a higher standard of liv-
ing. Subsequently, 1996 poverty levels were adjusted
to incorporate the 1998 criteria (Box 1). During the
economic crisis, the proportion of poor population
increased to 23.4 per cent in 1999 and then declined
to 18.2 per cent in 2002 and 17.4 per cent in 2003.
Projections of trends between 1999 and 2003 show
that Indonesia is on track to achieving the MDG tar-
get on poverty reduction of 7.5 per cent, or half the
1990 levels for the country as a whole (Figure 1.2).
However, prospects of achieving the MDG target
across the provinces are uneven. (Table 1.1).
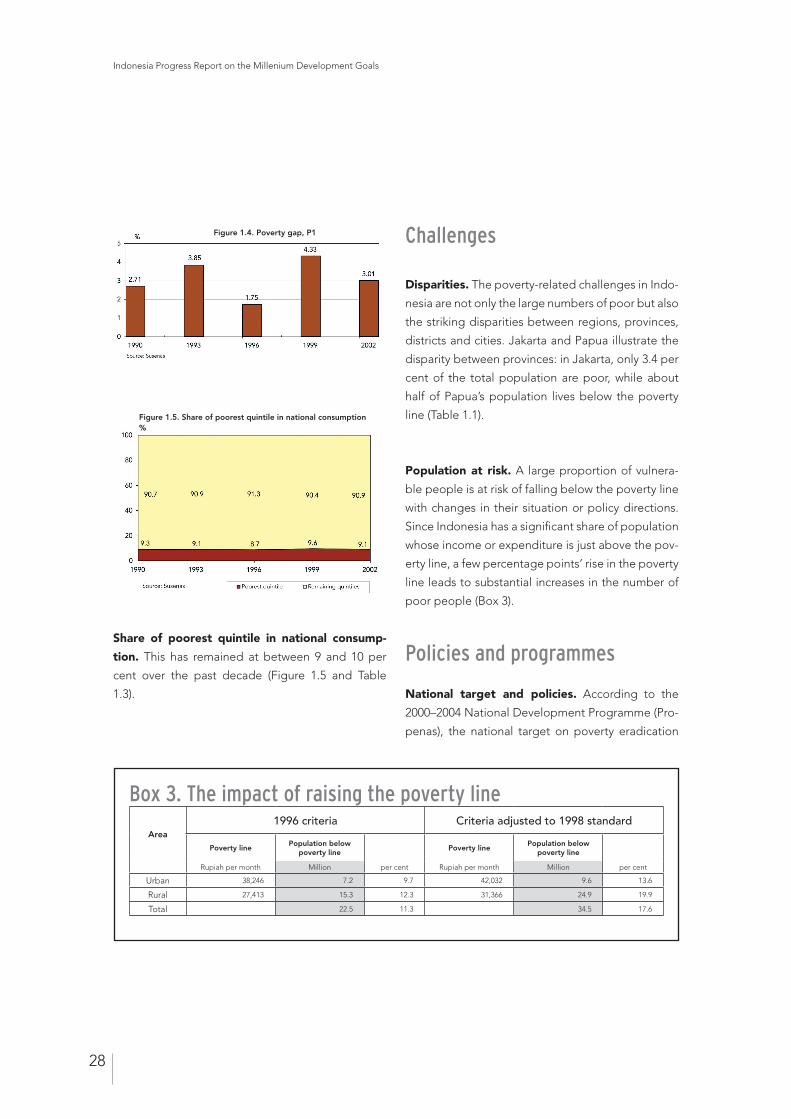
Poverty gap. The poverty gap, or the Foster-Greer-
Thorbeke P1 measure , has not shown much change,
fluctuating between 2 and 4 per cent between 1990
and 2002. In 2002, this measurea was 3 per cent (Fig-
ure 1.4 and Table 1.2a).
Depth of poverty. The mean depth of poverty,b as
a proportion of the poverty line, has varied from 10
to 28 per cent since 1990. In 2002, the mean con-
sumption of the poor was 16.5 per cent below the
National Poverty Line (Table 1.2b)
Goal 1: Eradicating Extreme Poverty And Hunger
Target 1: Halve, between 1990 and 2015, the proportion of people whose income is less than one dollar a dayIndicators used: • Proportion of population below the national poverty line (poverty head count ratio)• Proportion of population below $1 per day • Poverty gap (incidence x depth of poverty)• Share of poorest quintile in national consumption
a The Poverty Gap is defined as Incidence times Depth of Poverty, also expressed as
where n= population size; q= the number of poor people; z= poverty line; and yi = is the income of the individual=i.
b The Depth of Poverty, I, is calculated as: , where yp denotes the mean consumption of the poor.
Figure 1.1. Population below the National Poverty Line
Figure 1.2. Proportion of population below the National Poverty Line
Indonesia Progress Report on the Millenium Development Goals
27
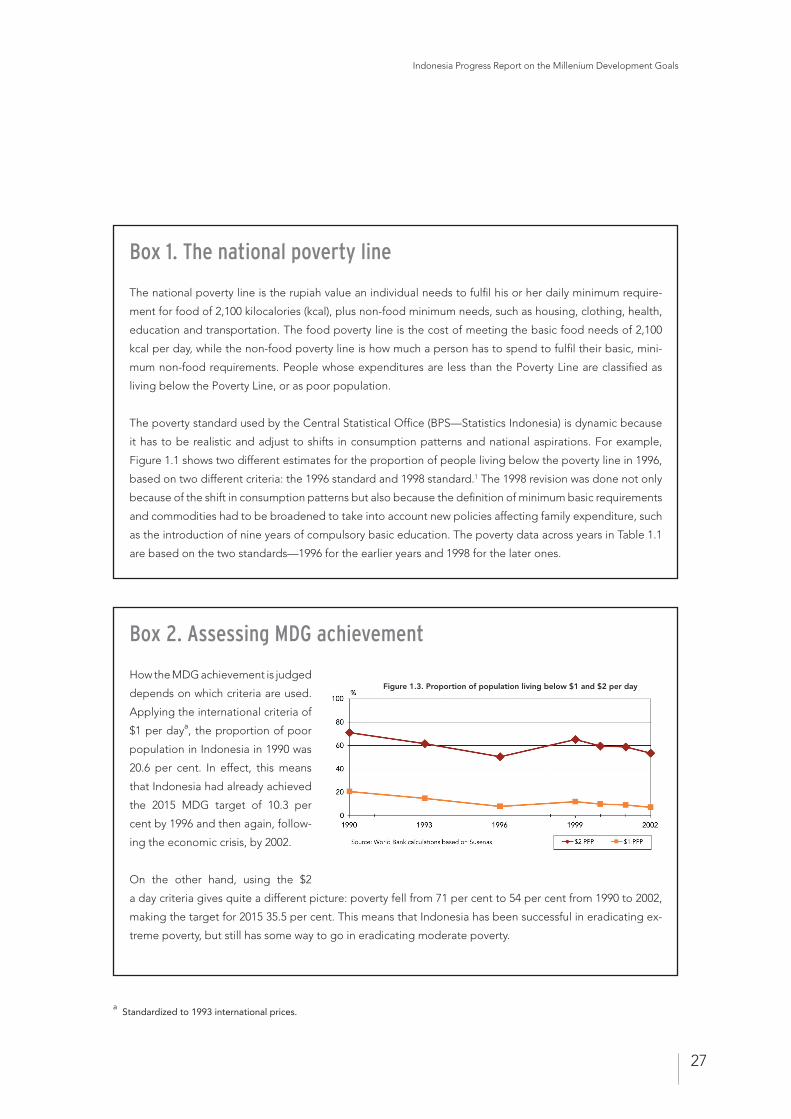
Box 2. Assessing MDG achievement
How the MDG achievement is judged
depends on which criteria are used.
Applying the international criteria of
$1 per daya, the proportion of poor
population in Indonesia in 1990 was
20.6 per cent. In effect, this means
that Indonesia had already achieved
the 2015 MDG target of 10.3 per
cent by 1996 and then again, follow-
ing the economic crisis, by 2002.
On the other hand, using the $2
a day criteria gives quite a different picture: poverty fell from 71 per cent to 54 per cent from 1990 to 2002,
making the target for 2015 35.5 per cent. This means that Indonesia has been successful in eradicating ex-
treme poverty, but still has some way to go in eradicating moderate poverty.
Box 1. The national poverty line
The national poverty line is the rupiah value an individual needs to fulfil his or her daily minimum require-
ment for food of 2,100 kilocalories (kcal), plus non-food minimum needs, such as housing, clothing, health,
education and transportation. The food poverty line is the cost of meeting the basic food needs of 2,100
kcal per day, while the non-food poverty line is how much a person has to spend to fulfil their basic, mini-
mum non-food requirements. People whose expenditures are less than the Poverty Line are classified as
living below the Poverty Line, or as poor population.
The poverty standard used by the Central Statistical Office (BPS—Statistics Indonesia) is dynamic because
it has to be realistic and adjust to shifts in consumption patterns and national aspirations. For example,
Figure 1.1 shows two different estimates for the proportion of people living below the poverty line in 1996,
based on two different criteria: the 1996 standard and 1998 standard.1 The 1998 revision was done not only
because of the shift in consumption patterns but also because the definition of minimum basic requirements
and commodities had to be broadened to take into account new policies affecting family expenditure, such
as the introduction of nine years of compulsory basic education. The poverty data across years in Table 1.1
are based on the two standards—1996 for the earlier years and 1998 for the later ones.
a Standardized to 1993 international prices.
Figure 1.3. Proportion of population living below $1 and $2 per day
Indonesia Progress Report on the Millenium Development Goals
28
Share of poorest quintile in national consump-
tion. This has remained at between 9 and 10 per
cent over the past decade (Figure 1.5 and Table
1.3).
Challenges
Disparities. The poverty-related challenges in Indo-
nesia are not only the large numbers of poor but also
the striking disparities between regions, provinces,
districts and cities. Jakarta and Papua illustrate the
disparity between provinces: in Jakarta, only 3.4 per
cent of the total population are poor, while about
half of Papua’s population lives below the poverty
line (Table 1.1).
Population at risk. A large proportion of vulnera-
ble people is at risk of falling below the poverty line
with changes in their situation or policy directions.
Since Indonesia has a significant share of population
whose income or expenditure is just above the pov-
erty line, a few percentage points’ rise in the poverty
line leads to substantial increases in the number of
poor people (Box 3).
Policies and programmes
National target and policies. According to the
2000–2004 National Development Programme (Pro-
penas), the national target on poverty eradication
Box 3. The impact of raising the poverty line
Area1996 criteria Criteria adjusted to 1998 standard
Poverty linePopulation below
poverty linePoverty line
Population below poverty line
Rupiah per month Million per cent Rupiah per month Million per cent
Urban 38,246 7.2 9.7 42,032 9.6 13.6
Rural 27,413 15.3 12.3 31,366 24.9 19.9
Total 22.5 11.3 34.5 17.6
Figure 1.4. Poverty gap, P1
Figure 1.5. Share of poorest quintile in national consumption%
Indonesia Progress Report on the Millenium Development Goals
29
is to reduce the proportion of poor population to
14 per cent by 2004. This target is to be achieved
through two strategies: first, by raising income lev-
els through expanding employment and business
opportunities and increasing the productivity of the
poor; and second, by reducing the cost of food, ed-
ucation, health and infrastructure for poor families.
The four main policies in reducing poverty focus on
the expansion of opportunities, empowerment of
communities, improvement of human resource ca-
pacities, and social protection.
Programmes. Poverty eradication is the main prior-
ity in the Propenas. Based on Law No. 25/2000, pov-
erty eradication is articulated by three programmes:
equitable fulfilment of basic needs, such as essential
food, basic health, education and housing services
for poor families and communities; the develop-
ment of an entrepreneurial culture among the poor
to enable them to be more productive economically
and self-reliant; and the development of a social se-
curity system to protect vulnerable groups, in par-
ticular, poor families, vulnerable children, the elderly
and the disabled.
Activities. The first programme is implemented
through providing essential food supplies; imple-
menting price controls; providing basic services,
especially in health and education; expanding out-
reach services; and improving the environment and
housing, including a clean water supply. The second
programme will be implemented through: provid-
ing education and training in entrepreneurial skills;
providing technical assistance; promoting entrepre-
neurial networks and partnerships supported by lo-
cal organizations, local governments, the private sec-
tor and universities; improving access to resources;
providing infrastructure and facilities that enable the
poor to conduct economic activities; and supplying
transmigration settlements for landless farmers. The
third programme will be implemented through de-
veloping culturally appropriate and effective social
security systems; maintaining existing social security
systems; and strengthening community and govern-
ment capacities in managing social security systems.
All these poverty eradication programmes are com-
prehensive and cross-sectoral in nature. There are
also other development programmes with activities
supporting poverty reduction.
Indonesia Progress Report on the Millenium Development Goals
30
Status and trends
Prevalence of underweight children
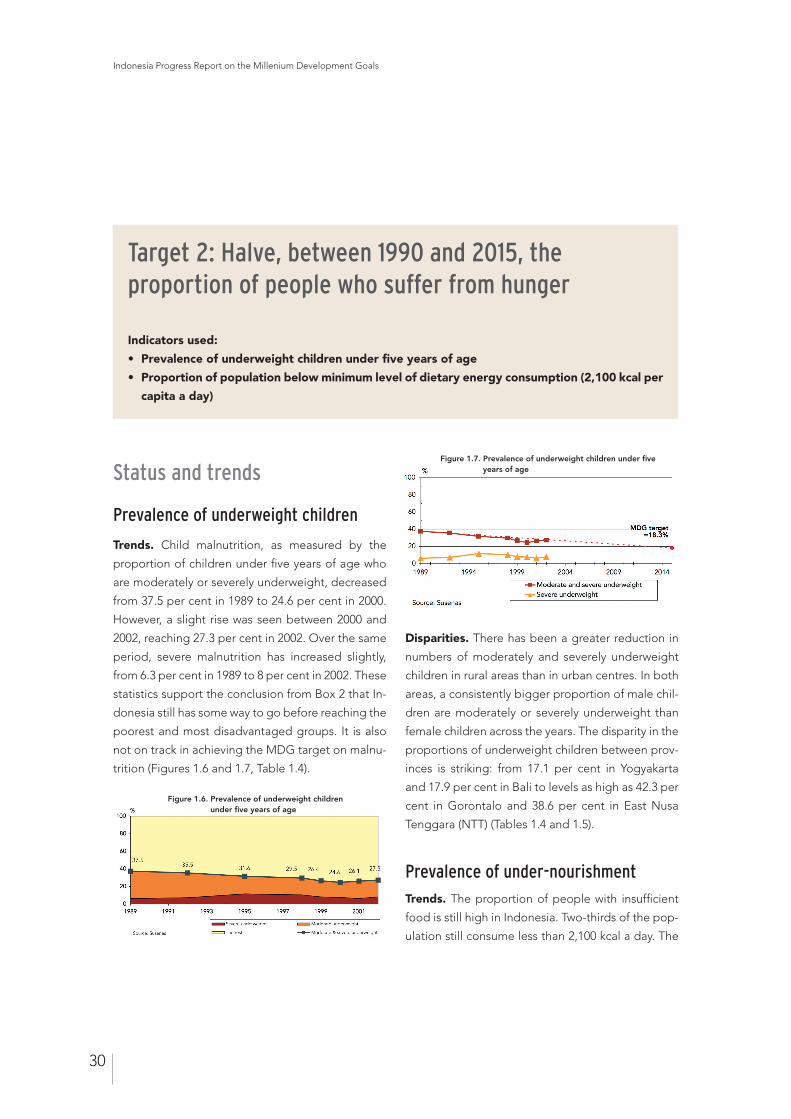
Trends. Child malnutrition, as measured by the
proportion of children under five years of age who
are moderately or severely underweight, decreased
from 37.5 per cent in 1989 to 24.6 per cent in 2000.
However, a slight rise was seen between 2000 and
2002, reaching 27.3 per cent in 2002. Over the same
period, severe malnutrition has increased slightly,
from 6.3 per cent in 1989 to 8 per cent in 2002. These
statistics support the conclusion from Box 2 that In-
donesia still has some way to go before reaching the
poorest and most disadvantaged groups. It is also
not on track in achieving the MDG target on malnu-
trition (Figures 1.6 and 1.7, Table 1.4).
Disparities. There has been a greater reduction in
numbers of moderately and severely underweight
children in rural areas than in urban centres. In both
areas, a consistently bigger proportion of male chil-
dren are moderately or severely underweight than
female children across the years. The disparity in the
proportions of underweight children between prov-
inces is striking: from 17.1 per cent in Yogyakarta
and 17.9 per cent in Bali to levels as high as 42.3 per
cent in Gorontalo and 38.6 per cent in East Nusa
Tenggara (NTT) (Tables 1.4 and 1.5).
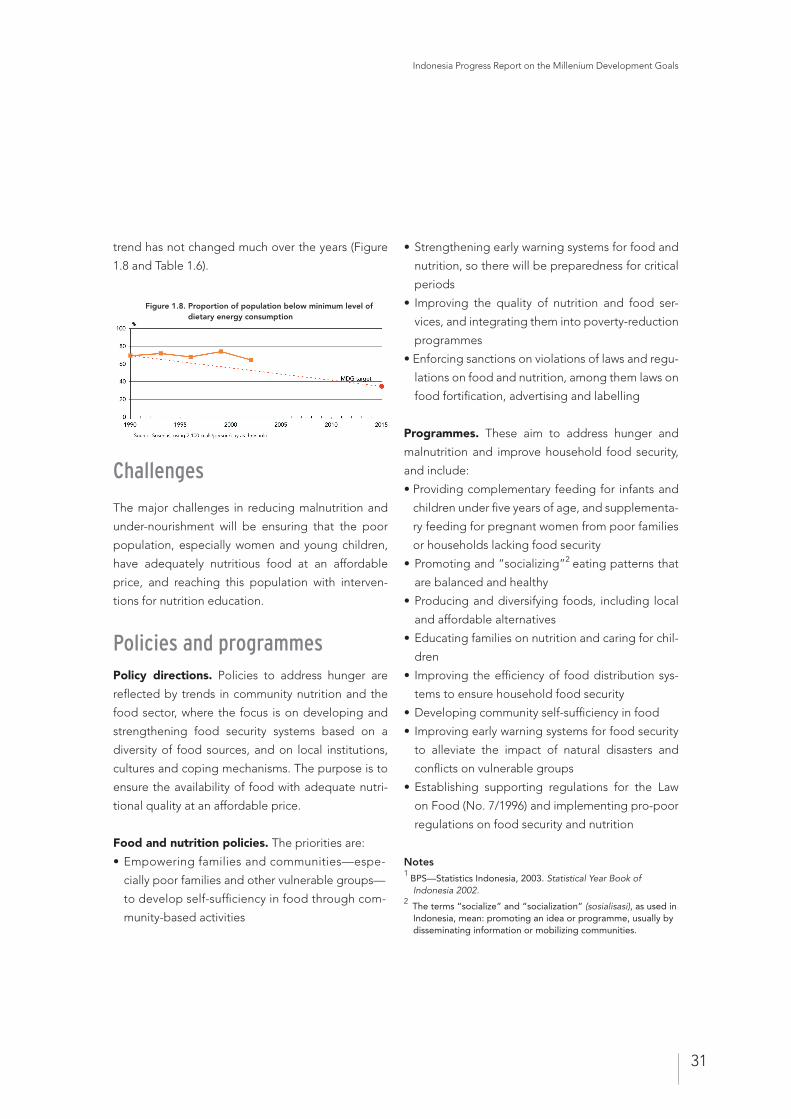
Prevalence of under-nourishmentTrends. The proportion of people with insufficient
food is still high in Indonesia. Two-thirds of the pop-
ulation still consume less than 2,100 kcal a day. The
Target 2: Halve, between 1990 and 2015, the proportion of people who suffer from hunger
Indicators used:
• Prevalence of underweight children under five years of age
• Proportion of population below minimum level of dietary energy consumption (2,100 kcal per
capita a day)
Figure 1.6. Prevalence of underweight children under five years of age
Figure 1.7. Prevalence of underweight children under five years of age
Indonesia Progress Report on the Millenium Development Goals
31
trend has not changed much over the years (Figure
1.8 and Table 1.6).
Challenges
The major challenges in reducing malnutrition and
under-nourishment will be ensuring that the poor
population, especially women and young children,
have adequately nutritious food at an affordable
price, and reaching this population with interven-
tions for nutrition education.
Policies and programmes Policy directions. Policies to address hunger are
reflected by trends in community nutrition and the
food sector, where the focus is on developing and
strengthening food security systems based on a
diversity of food sources, and on local institutions,
cultures and coping mechanisms. The purpose is to
ensure the availability of food with adequate nutri-
tional quality at an affordable price.
Food and nutrition policies. The priorities are:
• Empowering families and communities—espe-
cially poor families and other vulnerable groups—
to develop self-sufficiency in food through com-
munity-based activities
• Strengthening early warning systems for food and
nutrition, so there will be preparedness for critical
periods
• Improving the quality of nutrition and food ser-
vices, and integrating them into poverty-reduction
programmes
• Enforcing sanctions on violations of laws and regu-
lations on food and nutrition, among them laws on
food fortification, advertising and labelling
Programmes. These aim to address hunger and
malnutrition and improve household food security,
and include:
• Providing complementary feeding for infants and
children under five years of age, and supplementa-
ry feeding for pregnant women from poor families
or households lacking food security
• Promoting and “socializing”2 eating patterns that
are balanced and healthy
• Producing and diversifying foods, including local
and affordable alternatives
• Educating families on nutrition and caring for chil-
dren
• Improving the efficiency of food distribution sys-
tems to ensure household food security
• Developing community self-sufficiency in food
• Improving early warning systems for food security
to alleviate the impact of natural disasters and
conflicts on vulnerable groups
• Establishing supporting regulations for the Law
on Food (No. 7/1996) and implementing pro-poor
regulations on food security and nutrition
Notes1
BPS—Statistics Indonesia, 2003. Statistical Year Book of Indonesia 2002.
2 The terms “socialize” and “socialization” (sosialisasi), as used in Indonesia, mean: promoting an idea or programme, usually by disseminating information or mobilizing communities.
Figure 1.8. Proportion of population below minimum level of dietary energy consumption

Indonesia Progress Report on the Millenium Development Goals
32
33
GOAL 2
Achieving Universal Basic Education
Indonesia Progress Report on the Millenium Development Goals
34
Status and trends
Introduction. The development of a nation requires
a critical mass in education; in other words, a signifi-
cant percentage of the population having a level of
education adequate for supporting rapid economic
and social development. Indonesia’s Nine-Year
Compulsory Basic Education Programme aims to
develop this critical mass and equip society with ba-
sic knowledge and skills—whether for going on to
higher levels of education, earning a living, making
choices or being able to benefit from technological
advances and compete with other countries.
Targets. The MDG target for Indonesia is to ensure
that by 2015, all children everywhere, boys and girls
alike, are able to complete basic education. This
target is in accordance with the Nine-Year Com-
pulsory Basic Education Programme, which aims to
increase enrolment in primary and junior secondary
education,b achieve by 2008 a gross enrolment ratio
(GER) of 90 per cent in junior secondary education
and improve the quality of basic education, which is
still far below the national standard.
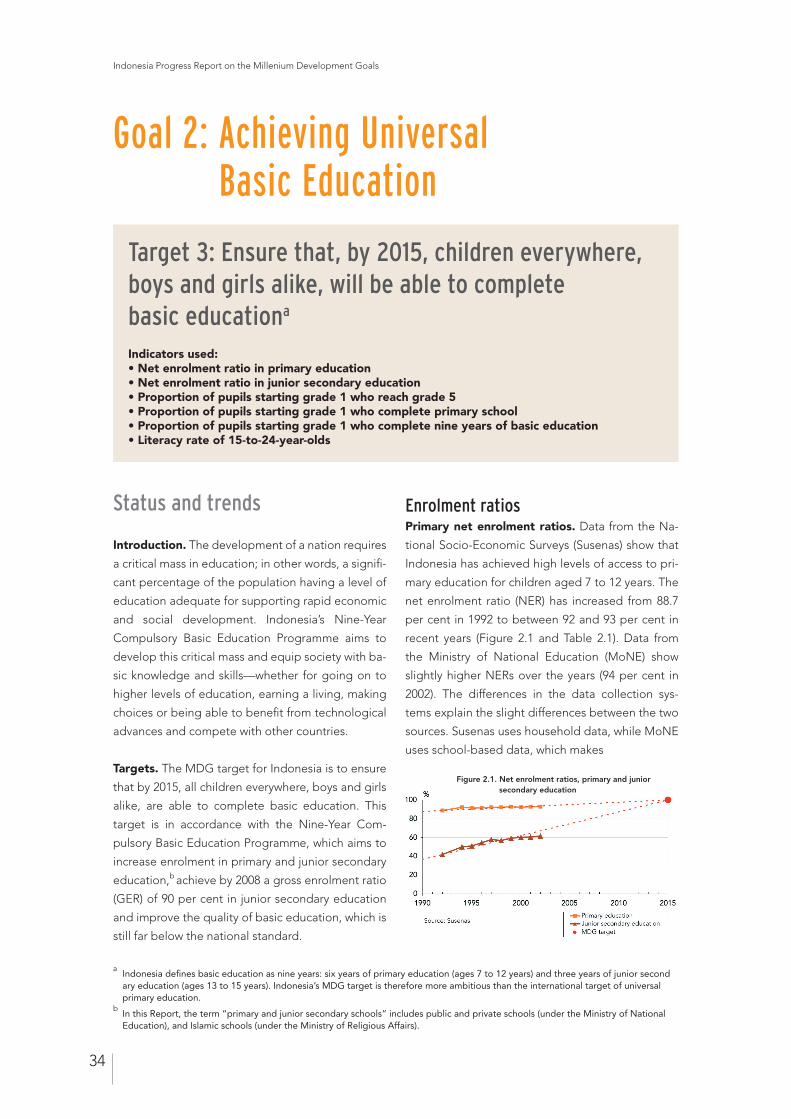
Enrolment ratiosPrimary net enrolment ratios. Data from the Na-
tional Socio-Economic Surveys (Susenas) show that
Indonesia has achieved high levels of access to pri-
mary education for children aged 7 to 12 years. The
net enrolment ratio (NER) has increased from 88.7
per cent in 1992 to between 92 and 93 per cent in
recent years (Figure 2.1 and Table 2.1). Data from
the Ministry of National Education (MoNE) show
slightly higher NERs over the years (94 per cent in
2002). The differences in the data collection sys-
tems explain the slight differences between the two
sources. Susenas uses household data, while MoNE
uses school-based data, which makes
Goal 2: Achieving Universal Basic Education
Target 3: Ensure that, by 2015, children everywhere, boys and girls alike, will be able to complete basic educationa Indicators used: • Net enrolment ratio in primary education• Net enrolment ratio in junior secondary education• Proportion of pupils starting grade 1 who reach grade 5• Proportion of pupils starting grade 1 who complete primary school• Proportion of pupils starting grade 1 who complete nine years of basic education• Literacy rate of 15-to-24-year-olds
a Indonesia defines basic education as nine years: six years of primary education (ages 7 to 12 years) and three years of junior second
ary education (ages 13 to 15 years). Indonesia’s MDG target is therefore more ambitious than the international target of universal primary education.b In this Report, the term “primary and junior secondary schools” includes public and private schools (under the Ministry of National
Education), and Islamic schools (under the Ministry of Religious Affairs).
Figure 2.1. Net enrolment ratios, primary and junior secondary education
Indonesia Progress Report on the Millenium Development Goals
35
multiple counting a possibility, as there are children
who go to more than one school. Also, MoNE data
are collected at the beginning of a school year,
while Susenas data may not always be.
Primary gross enrolment ratios. The NERs are
significantly different from the GERs. For example,
MoNE data show the primary GER in 2002 at 112
per cent, which is significantly higher than the NER
of 94 per cent. This indicates a high number of un-
der-age (under seven years of age) and over-age
pupils (over 12 years of age). According to MoNE
data, 10.3 and 4.9 per cent of primary school stu-
dents are under-age and over-age, respectively.
Under-age children can enrol in primary schools, a
trend that has increased, especially in urban areas.
Over-age students may be a result of late enrol-
ment—for example, 42.2 per cent of newly enrolled
primary-school students were aged eight years and
older in the 2000-2001 school year. Also, by repeat-
ing grades, students will complete primary school
when they are older than 12 years.
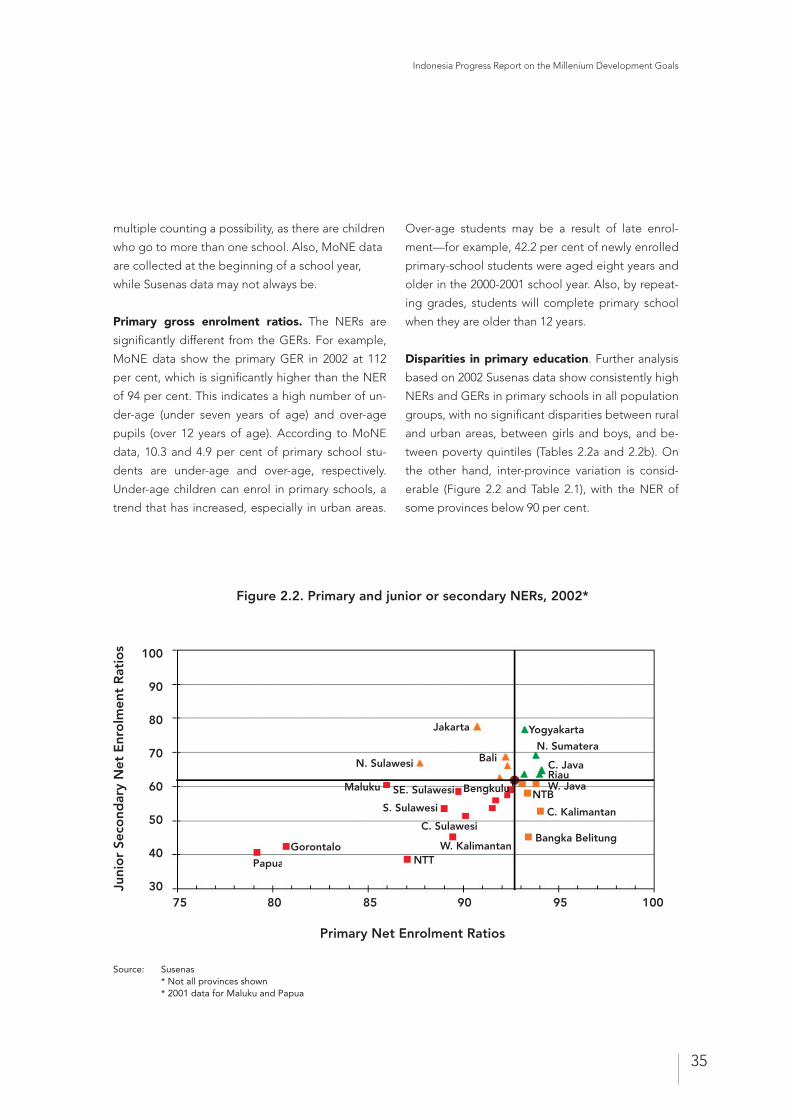
Disparities in primary education. Further analysis
based on 2002 Susenas data show consistently high
NERs and GERs in primary schools in all population
groups, with no significant disparities between rural
and urban areas, between girls and boys, and be-
tween poverty quintiles (Tables 2.2a and 2.2b). On
the other hand, inter-province variation is consid-
erable (Figure 2.2 and Table 2.1), with the NER of
some provinces below 90 per cent.
Figure 2.2. Primary and junior or secondary NERs, 2002*
Source: Susenas * Not all provinces shown * 2001 data for Maluku and Papua
100
90
80
70
60
50
40
3075 80 85 90 95 100
Jakarta Yogyakarta
C. Sulawesi
Papua
Bangka BelitungW. KalimantanGorontalo
C. KalimantanS. SulawesiNTB
W. JavaBengkuluSE. SulawesiMalukuRiauC. Java
BaliN. Sulawesi
N. Sumatera
NTT
Primary Net Enrolment Ratios
Juni
or
Seco
ndar
y N
et E
nro
lmen
t R
atio
s
Indonesia Progress Report on the Millenium Development Goals
36
Junior secondary education. The access to junior
secondary education has increased significantly
since 1994, following the implementation of the
Nine-Year Compulsory Basic Education Programme.
The NER at junior secondary level increased from
41.9 per cent in 1992 to 61.7 per cent in 2002 (Table
2.3), while the GER increased from 65.7 per cent in
1995 to 79.8 per cent in 2002. However this is still
some way from the Nine-Year Compulsory Basic Ed-
ucation Programme’s objective of a 90 per cent GER
by 2008. To capture the high number of pupils aged
younger than 13 and older than 15 in junior second-
ary schools requires using the GER.
Disparities in junior secondary education. Unlike
in primary education, junior secondary education
enrolment numbers show considerable disparities
between rural and urban areas, and between pov-
erty quintiles, but not, however, between girls and
boysa (Tables 2.4a and 2.4b). For 2002, the NER in
rural areas (54.1 per cent) is significantly lower than
in urban areas (71.9 per cent) and the NER of the
poorest quintile (49.9 per cent) contrasts starkly
with that of the richest quintile (72.3 per cent). The
junior secondary GERs also vary widely between
rural (69.7 per cent) and urban (93.5 per cent), and
poor (64.8 per cent) and rich (94.6 per cent) popula-
tions. Between provinces, there are wide disparities
in junior secondary NERs (Figure 2.2). The NERs of
several provinces are still below 60 per cent (Cen-
tral Kalimantan, Central Sulawesi, East Nusa Teng-
gara, Gorontalo, Papua, South Kalimantan, South
Sulawesi, South Sumatra, Southeast Sulawesi, West
Kalimantan and West Nusa Tenggara). According to
2001 Susenas data, Papua has a much lower NER
(40.5 per cent).
Proportion of pupils completing
basic education
Survival rate to grade 5. The proportion of pupils
who start grade 1 and reach grade 5 has increased
from 74.7 per cent in 1991 to 82.2 per cent in 2002.
a See also Goal 3.
Figure 2.3. Proportion of grade 1 cohorts completing basic education
Primary Junior SecondaryPriode
Grade 1 Grade 6 Graduate Year 1 Year 2 Year 3 Graduate
82/83
87/8888/89
90/01
School year 1982/83 to 1990/91
School year 1993/94 to 2001/02
100%
100%93/94
98/9999/00
01/02
68.6 65.442.3 42.8
34.6 32.1
75.0 73.352.4 52.6
50.5 46.8
Source: Ministry of National Education
Indonesia Progress Report on the Millenium Development Goals
37
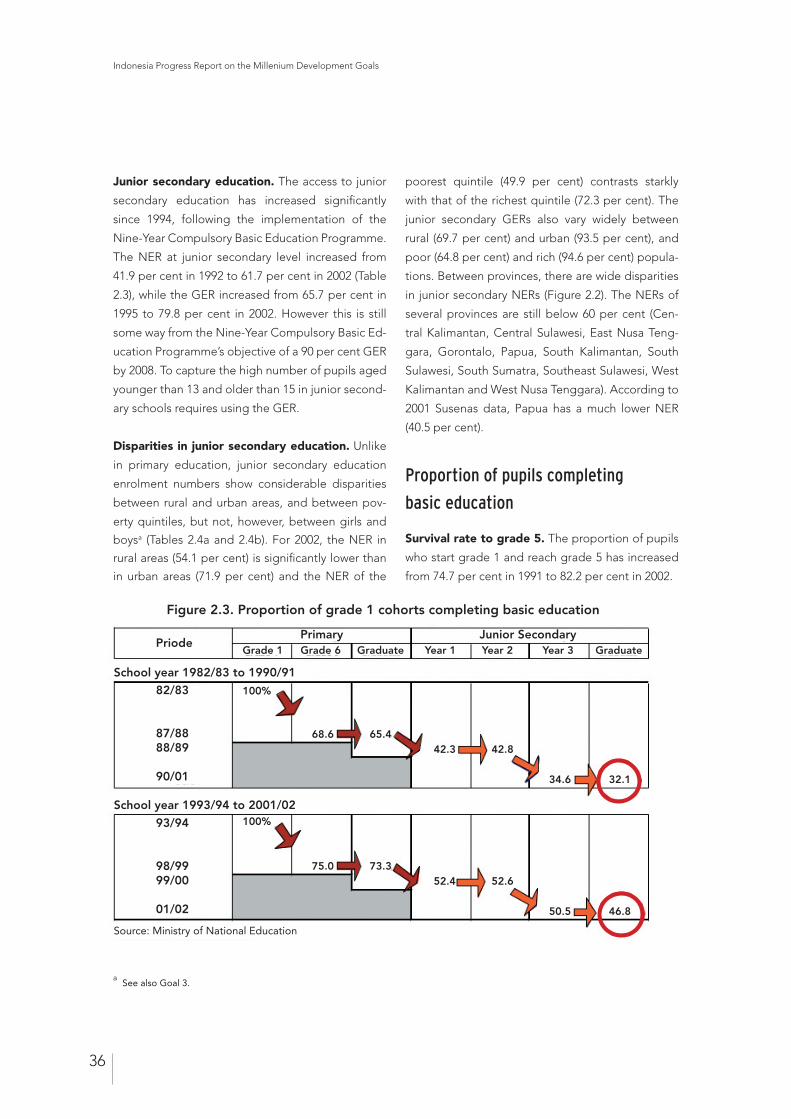
Graduation from primary and basic education.
Figure 2.3 shows the proportion of pupils
starting grade 1 who complete primary school
and subsequently complete nine years of basic
education, in the form of cohort data for each of
the two components of the basic education cycle.
This chart indicates the success of the Nine-Year
Compulsory Basic Education Programme, as well
as the progress in basic education graduation rates
over 11 years. Of the students enrolling in grade 1
in 1982–1983, only 32.1 per cent graduated from
junior secondary school in 1990–1991 and finished
nine years of basic education. In contrast, 46.8 per
cent of the those enrolling in grade 1 in 1993-1994
completed the basic education cycle.
Non-completion of basic education. Substantial
proportions of children still do not complete the
basic education cycle within the required nine
years—for example, Figure 2.3 shows that more
than half (53.2 per cent) of the 1993–1994 cohort
did not. This phenomenon is the result of: children
who repeat grades; children who drop out at either
the primary or junior secondary level and do not
re-enrol in an alternative educational institution;
and children who graduate from primary school
but do not continue on to junior secondary school
or an equivalent institution offering out-of-school
education. Children who are not able to complete
basic education, especially at the primary level, risk
becoming illiterate adults.
Repetition and dropout rates. The improvement
seen between the two cohorts (1982–1983 and 1993–
1994) in Figure 2.3 can be attributed to reduced
repetition and dropout rates, a bigger proportion of
students continuing from the primary to the junior
secondary level, or a combination of these factors.
While the Nine-Year Compulsory Basic Education
Programme has had a positive impact, the percent-
age of primary school graduates who go on to the
junior secondary level is still low, and repetition and
dropout rates could still be further reduced. At the
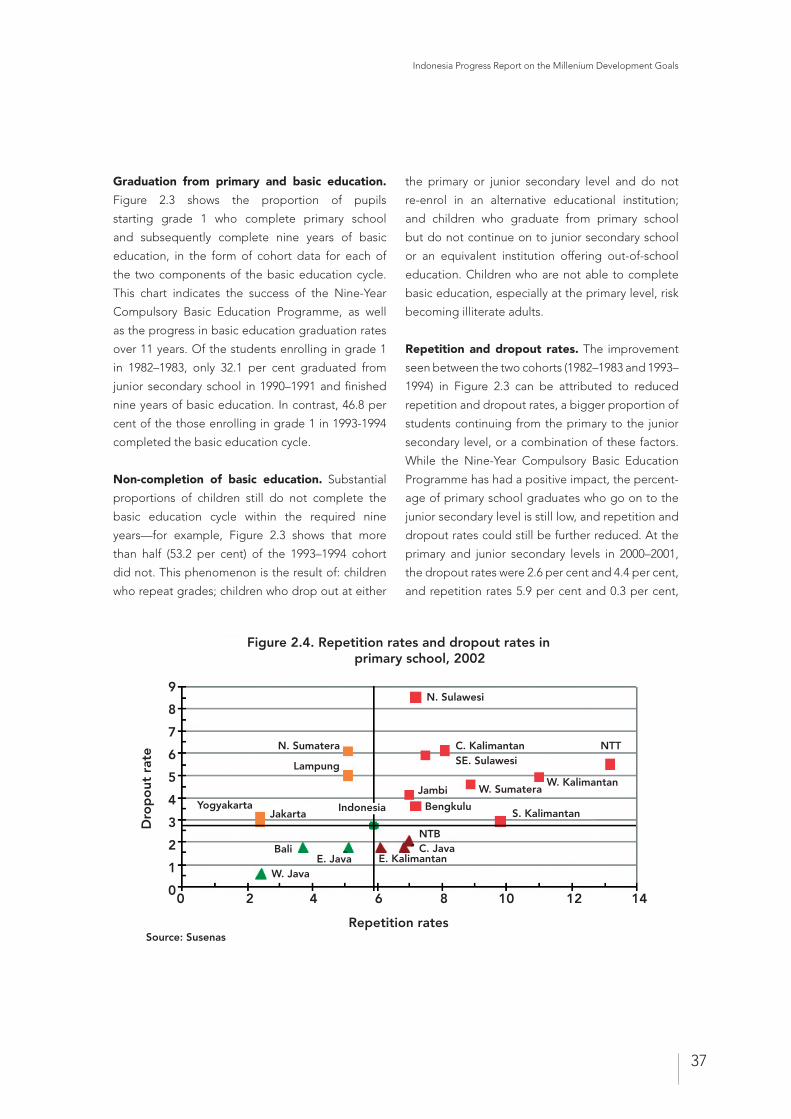
primary and junior secondary levels in 2000–2001,
the dropout rates were 2.6 per cent and 4.4 per cent,
and repetition rates 5.9 per cent and 0.3 per cent,
Figure 2.4. Repetition rates and dropout rates in primary school, 2002
Repetition rates
Source: Susenas
Dro
po
ut r
ate
0 2 4 6 8 10 12 14
9
8
7
6
5
4
3
2
1
0
N. Sulawesi
C. KalimantanN. Sumatera NTTSE. SulawesiLampung
W. KalimantanJambi W. Sumatera
BengkuluYogyakartaJakarta
Bali
W. JavaE. Java E. Kalimantan
C. JavaNTB
S. KalimantanIndonesia
Repetition rates
Indonesia Progress Report on the Millenium Development Goals
38
respectively. Special attention needs to be given to
repetition rates, especially at the primary level be-
cause they have a significant impact on graduation
rates and strong links to dropout rates (Figure 2.4).
Alternative educational institutions suitable for the
seven-to-15 age group need to be made accessible
for children who have dropped out.
Disparities. The national figures mask significant
variations in repetition and dropout rates between
provinces. Repetition rates range from 2.4 to 13.2
per cent, while dropout rates vary from less than 1
per cent to more than 8.5 per cent.
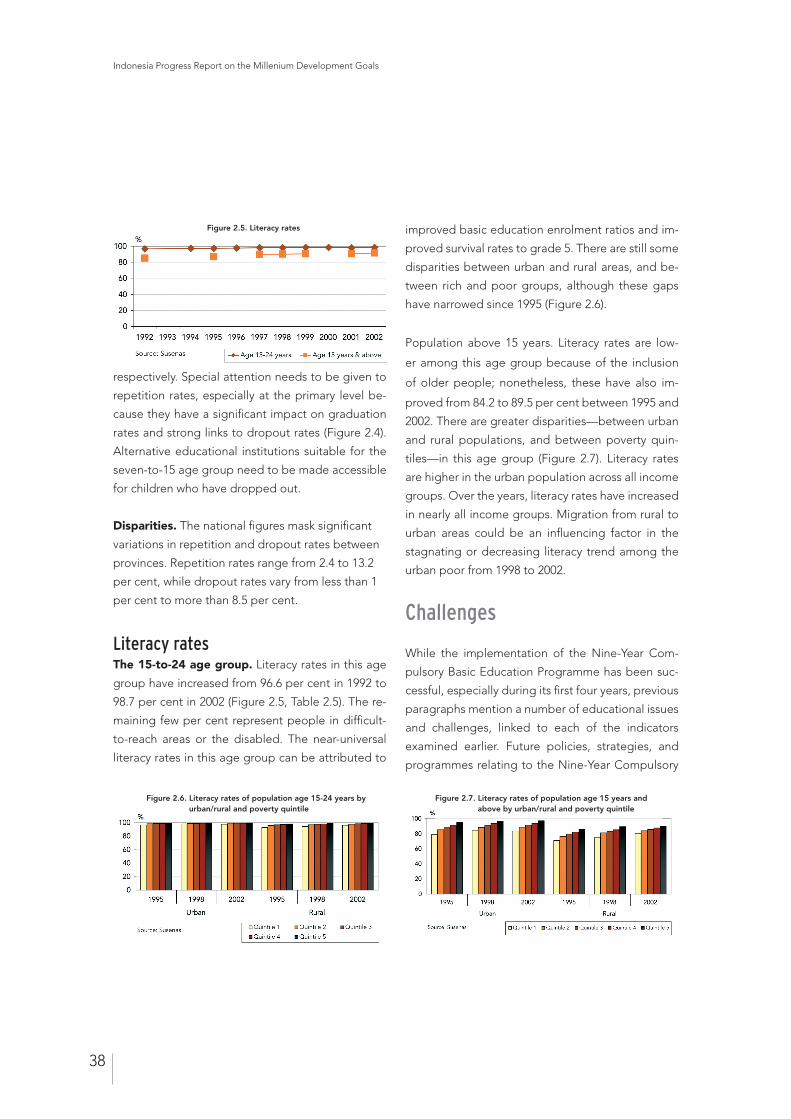
Literacy rates The 15-to-24 age group. Literacy rates in this age
group have increased from 96.6 per cent in 1992 to
98.7 per cent in 2002 (Figure 2.5, Table 2.5). The re-
maining few per cent represent people in difficult-
to-reach areas or the disabled. The near-universal
literacy rates in this age group can be attributed to
improved basic education enrolment ratios and im-
proved survival rates to grade 5. There are still some
disparities between urban and rural areas, and be-
tween rich and poor groups, although these gaps
have narrowed since 1995 (Figure 2.6).
Population above 15 years. Literacy rates are low-
er among this age group because of the inclusion
of older people; nonetheless, these have also im-
proved from 84.2 to 89.5 per cent between 1995 and
2002. There are greater disparities—between urban
and rural populations, and between poverty quin-
tiles—in this age group (Figure 2.7). Literacy rates
are higher in the urban population across all income
groups. Over the years, literacy rates have increased
in nearly all income groups. Migration from rural to
urban areas could be an influencing factor in the
stagnating or decreasing literacy trend among the
urban poor from 1998 to 2002.
Challenges
While the implementation of the Nine-Year Com-
pulsory Basic Education Programme has been suc-
cessful, especially during its first four years, previous
paragraphs mention a number of educational issues
and challenges, linked to each of the indicators
examined earlier. Future policies, strategies, and
programmes relating to the Nine-Year Compulsory
Figure 2.5. Literacy rates
Figure 2.6. Literacy rates of population age 15-24 years by urban/rural and poverty quintile
Figure 2.7. Literacy rates of population age 15 years and above by urban/rural and poverty quintile
39
Basic Education Programme will need to prioritize
these issues.
Policies and programmes
Key policies. Basic education policies focus on:
• Improving access to and expanding learning op-
portunities for all school-aged children, especially
targeting poor and remote communities and ar-
eas.
• Increasing the quality and relevance of basic edu-
cation to ensure that all graduating students have
the basic skills required for coping with life or con-
tinuing to higher levels of education.
• Increasing the efficiency of educational resources
management and enabling all basic educational
institutions to carry out their functions more effi-
ciently and effectively.
• Implementing, at the same time, actions to in-
crease access to basic education and actions to
improve its quality, because basic education.
completion cannot be separated from enhanced
education quality.
Strategies. To implement these policies, strategies
have been formulated and include:
• Creating a national movement for the completion
of basic education, involving parents and com-
munity leaders, non-governmental organizations
(NGOs) and the private and industrial sectors.
• Enhancing and strengthening existing essential pro-
grammes for increasing school enrolment; reassess-
ing less essential programme activities; and mobi-
lizing resources for maintaining and improving the
Nine-Year Compulsory Basic Education Programme.
• Giving more opportunities to private schools and
community-based educational institutions to pro-
vide basic education.
• Using alternative educational approaches and
programmes to reach previously unreached poor
and remote communities and to improve equity in
access to basic education.
• Providing district and city governments with full
authority and responsibility for the local imple-
mentation of the Nine-Year Compulsory Basic Ed-
ucation Programme, to empower them in dealing
with opportunities and challenges specific to their
region, while providing support from the central
and provincial governments.

Indonesia Progress Report on the Millenium Development Goals
40
Indonesia Progress Report on the Millenium Development Goals
41
GOAL 3
Promoting Gender Equality and Empowering Women
Indonesia Progress Report on the Millenium Development Goals
42
Goal 3: Promoting Gender Equality and Empowering Women
Target 4: Eliminate gender disparity in primary and secondary education preferably by 2005 and in all levels of education no later than 2015Indicators used:• Ratio of girls to boys in primary, secondary and tertiary education, as measured by net
enrolment for girls and for boys• Ratio of literate women to men 15 to 24 years old, as measured by female/male literacy
rates (literacy gender parity index)• Share of women in wage employment in the non-agricultural sector• Proportion of seats held by women in the National Parliament
Status and trends
Indonesia has achieved much progress in reducing
gender disparity in education and literacy, and has
also increased the participation of women in the po-
litical and legislative sectors. Gender ratios for this
report were obtained by using both net and gross
enrolment ratios (NERs and GERs) of girls and boysa
Using enrolment ratios, rather than absolute num-
bers, reflects the actual differences between girls’
and boys’ enrolment, and minimizes the influence
of the gender structure in the school-age popula-
tion.1 Examining GERs is important, as both public
and Islamic schools still have high numbers of over-
age students.
Primary, secondary and
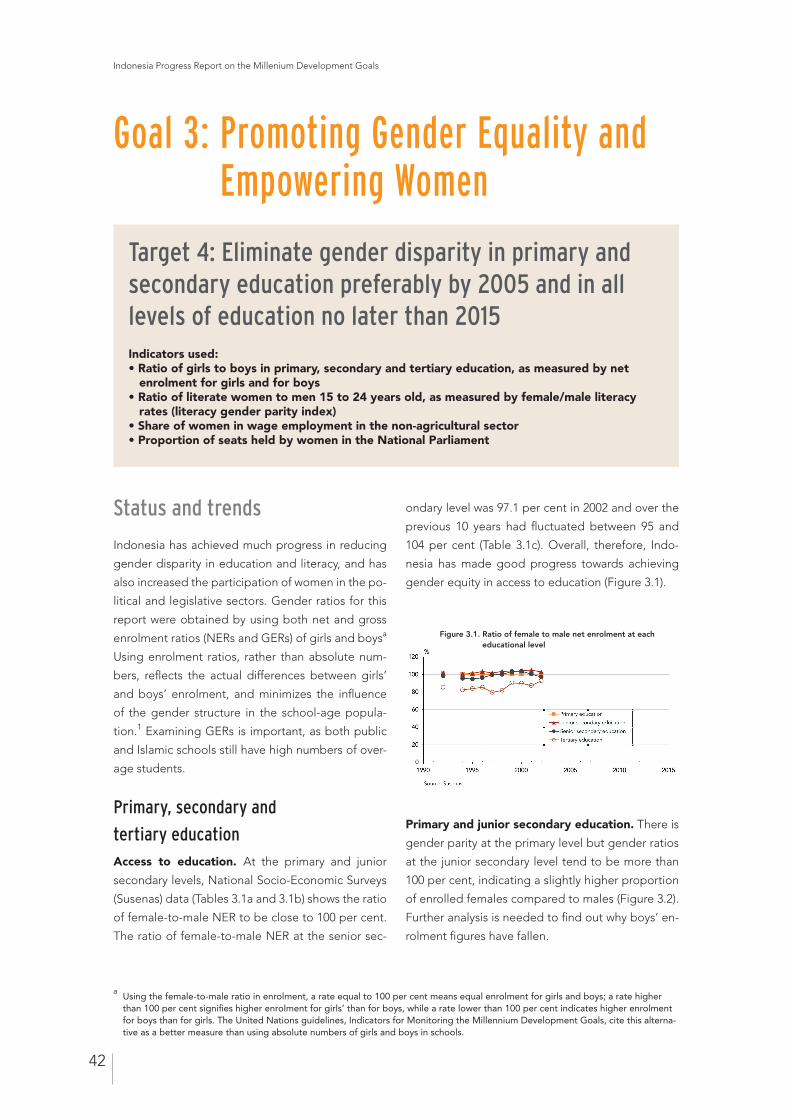
tertiary educationAccess to education. At the primary and junior
secondary levels, National Socio-Economic Surveys
(Susenas) data (Tables 3.1a and 3.1b) shows the ratio
of female-to-male NER to be close to 100 per cent.
The ratio of female-to-male NER at the senior sec-
ondary level was 97.1 per cent in 2002 and over the
previous 10 years had fluctuated between 95 and
104 per cent (Table 3.1c). Overall, therefore, Indo-
nesia has made good progress towards achieving
gender equity in access to education (Figure 3.1).
Primary and junior secondary education. There is
gender parity at the primary level but gender ratios
at the junior secondary level tend to be more than
100 per cent, indicating a slightly higher proportion
of enrolled females compared to males (Figure 3.2).
Further analysis is needed to find out why boys’ en-
rolment figures have fallen.
a Using the female-to-male ratio in enrolment, a rate equal to 100 per cent means equal enrolment for girls and boys; a rate higher
than 100 per cent signifies higher enrolment for girls’ than for boys, while a rate lower than 100 per cent indicates higher enrolment for boys than for girls. The United Nations guidelines, Indicators for Monitoring the Millennium Development Goals, cite this alterna-tive as a better measure than using absolute numbers of girls and boys in schools.
Figure 3.1. Ratio of female to male net enrolment at each educational level
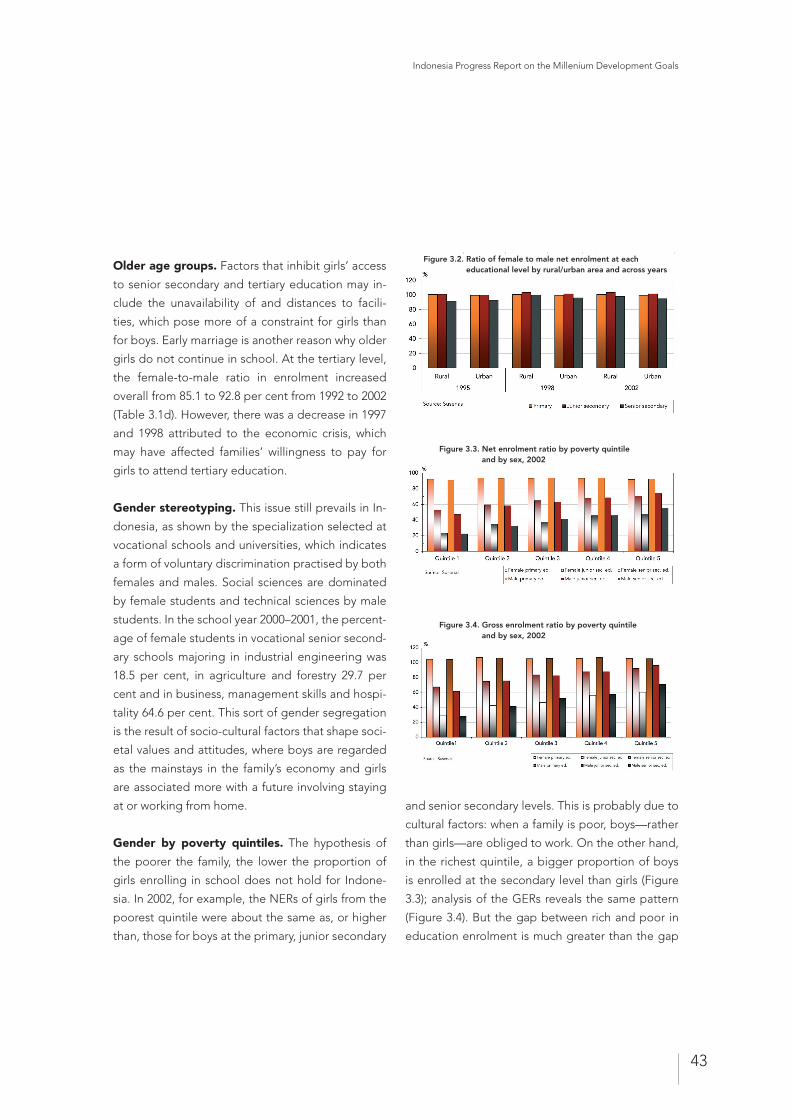
Indonesia Progress Report on the Millenium Development Goals
43
Older age groups. Factors that inhibit girls’ access
to senior secondary and tertiary education may in-
clude the unavailability of and distances to facili-
ties, which pose more of a constraint for girls than
for boys. Early marriage is another reason why older
girls do not continue in school. At the tertiary level,
the female-to-male ratio in enrolment increased
overall from 85.1 to 92.8 per cent from 1992 to 2002
(Table 3.1d). However, there was a decrease in 1997
and 1998 attributed to the economic crisis, which
may have affected families’ willingness to pay for
girls to attend tertiary education.
Gender stereotyping. This issue still prevails in In-
donesia, as shown by the specialization selected at
vocational schools and universities, which indicates
a form of voluntary discrimination practised by both
females and males. Social sciences are dominated
by female students and technical sciences by male
students. In the school year 2000–2001, the percent-
age of female students in vocational senior second-
ary schools majoring in industrial engineering was
18.5 per cent, in agriculture and forestry 29.7 per
cent and in business, management skills and hospi-
tality 64.6 per cent. This sort of gender segregation
is the result of socio-cultural factors that shape soci-
etal values and attitudes, where boys are regarded
as the mainstays in the family’s economy and girls
are associated more with a future involving staying
at or working from home.
Gender by poverty quintiles. The hypothesis of
the poorer the family, the lower the proportion of
girls enrolling in school does not hold for Indone-
sia. In 2002, for example, the NERs of girls from the
poorest quintile were about the same as, or higher
than, those for boys at the primary, junior secondary
and senior secondary levels. This is probably due to
cultural factors: when a family is poor, boys—rather
than girls—are obliged to work. On the other hand,
in the richest quintile, a bigger proportion of boys
is enrolled at the secondary level than girls (Figure
3.3); analysis of the GERs reveals the same pattern
(Figure 3.4). But the gap between rich and poor in
education enrolment is much greater than the gap
Figure 3.2. Ratio of female to male net enrolment at each educational level by rural/urban area and across years
Figure 3.3. Net enrolment ratio by poverty quintile and by sex, 2002
Figure 3.4. Gross enrolment ratio by poverty quintile and by sex, 2002
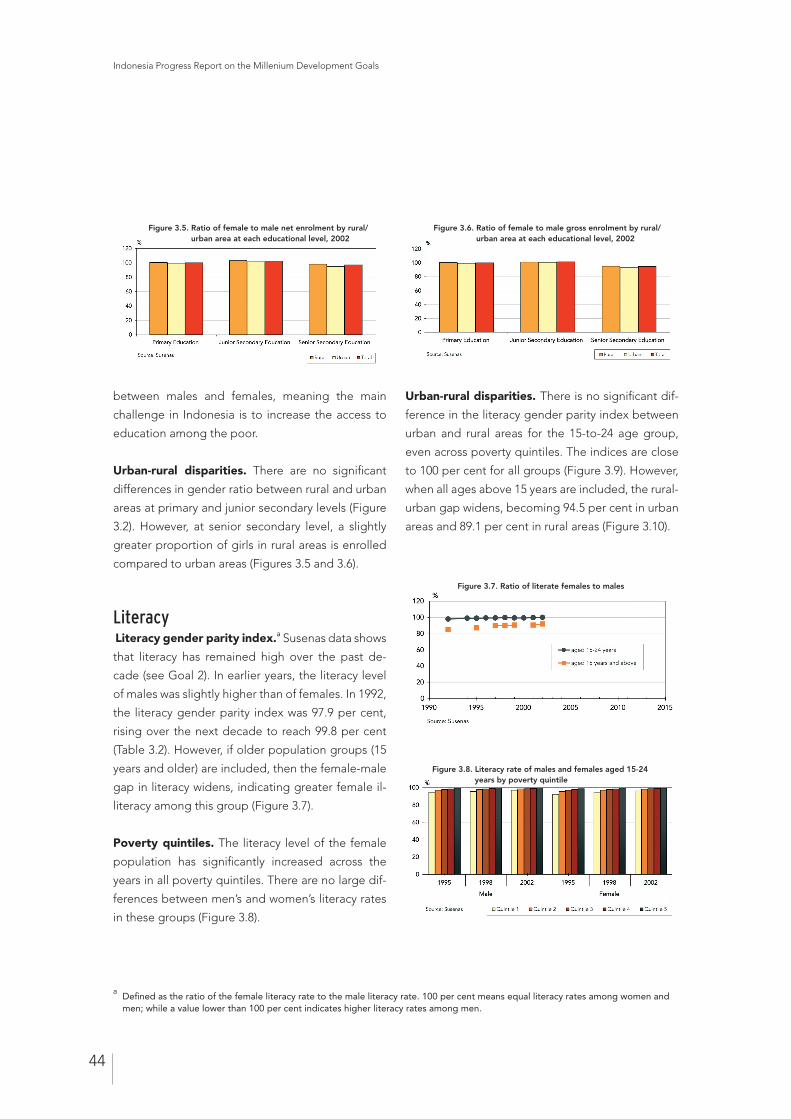
Indonesia Progress Report on the Millenium Development Goals
44
between males and females, meaning the main
challenge in Indonesia is to increase the access to
education among the poor.
Urban-rural disparities. There are no significant
differences in gender ratio between rural and urban
areas at primary and junior secondary levels (Figure
3.2). However, at senior secondary level, a slightly
greater proportion of girls in rural areas is enrolled
compared to urban areas (Figures 3.5 and 3.6).
Literacy Literacy gender parity index.a Susenas data shows
that literacy has remained high over the past de-
cade (see Goal 2). In earlier years, the literacy level
of males was slightly higher than of females. In 1992,
the literacy gender parity index was 97.9 per cent,
rising over the next decade to reach 99.8 per cent
(Table 3.2). However, if older population groups (15
years and older) are included, then the female-male
gap in literacy widens, indicating greater female il-
literacy among this group (Figure 3.7).
Poverty quintiles. The literacy level of the female
population has significantly increased across the
years in all poverty quintiles. There are no large dif-
ferences between men’s and women’s literacy rates
in these groups (Figure 3.8).
Urban-rural disparities. There is no significant dif-
ference in the literacy gender parity index between
urban and rural areas for the 15-to-24 age group,
even across poverty quintiles. The indices are close
to 100 per cent for all groups (Figure 3.9). However,
when all ages above 15 years are included, the rural-
urban gap widens, becoming 94.5 per cent in urban
areas and 89.1 per cent in rural areas (Figure 3.10).
a Defined as the ratio of the female literacy rate to the male literacy rate. 100 per cent means equal literacy rates among women and
men; while a value lower than 100 per cent indicates higher literacy rates among men.
Figure 3.5. Ratio of female to male net enrolment by rural/urban area at each educational level, 2002
Figure 3.6. Ratio of female to male gross enrolment by rural/urban area at each educational level, 2002
Figure 3.7. Ratio of literate females to males
Figure 3.8. Literacy rate of males and females aged 15-24 years by poverty quintile
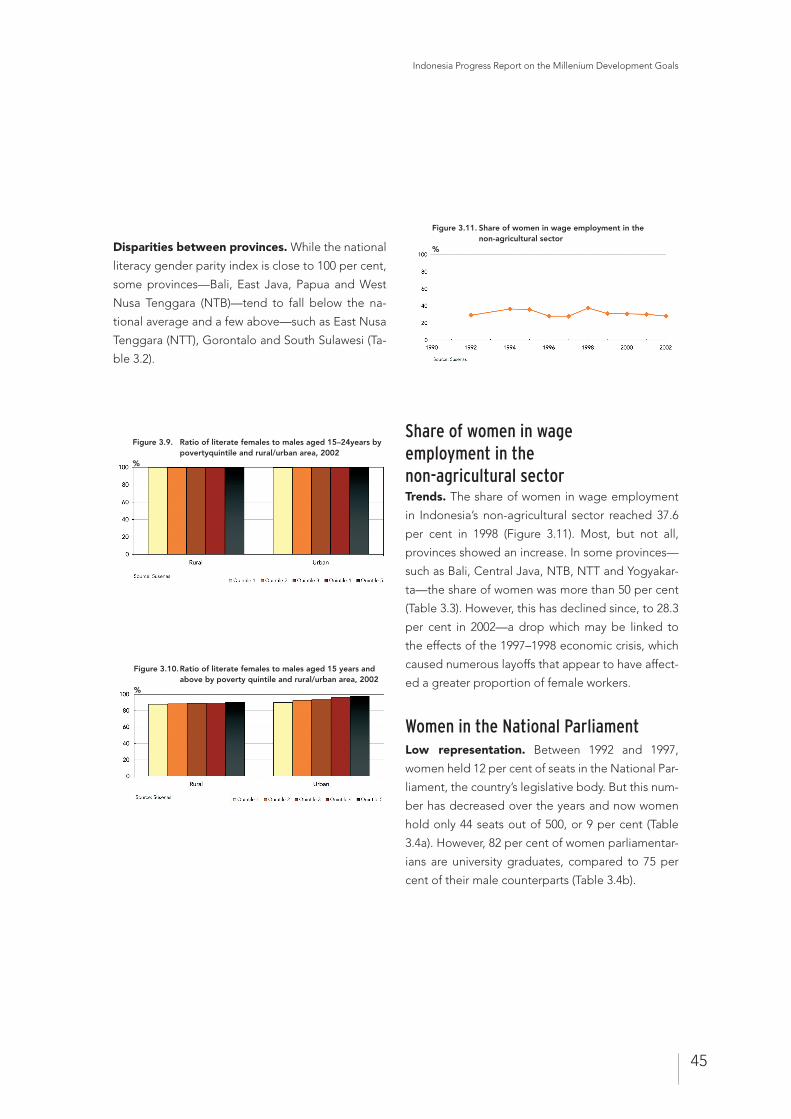
Indonesia Progress Report on the Millenium Development Goals
45
Disparities between provinces. While the national
literacy gender parity index is close to 100 per cent,
some provinces—Bali, East Java, Papua and West
Nusa Tenggara (NTB)—tend to fall below the na-
tional average and a few above—such as East Nusa
Tenggara (NTT), Gorontalo and South Sulawesi (Ta-
ble 3.2).
Share of women in wageemployment in the non-agricultural sectorTrends. The share of women in wage employment
in Indonesia’s non-agricultural sector reached 37.6
per cent in 1998 (Figure 3.11). Most, but not all,
provinces showed an increase. In some provinces—
such as Bali, Central Java, NTB, NTT and Yogyakar-
ta—the share of women was more than 50 per cent
(Table 3.3). However, this has declined since, to 28.3
per cent in 2002—a drop which may be linked to
the effects of the 1997–1998 economic crisis, which
caused numerous layoffs that appear to have affect-
ed a greater proportion of female workers.
Women in the National ParliamentLow representation. Between 1992 and 1997,
women held 12 per cent of seats in the National Par-
liament, the country’s legislative body. But this num-
ber has decreased over the years and now women
hold only 44 seats out of 500, or 9 per cent (Table
3.4a). However, 82 per cent of women parliamentar-
ians are university graduates, compared to 75 per
cent of their male counterparts (Table 3.4b).
Figure 3.9. Ratio of literate females to males aged 15–24years by povertyquintile and rural/urban area, 2002
%
Figure 3.10. Ratio of literate females to males aged 15 years and above by poverty quintile and rural/urban area, 2002
%
Figure 3.11. Share of women in wage employment in the non-agricultural sector%
Indonesia Progress Report on the Millenium Development Goals
46
Challenges
Challenges to achieving gender equality and em-
powering women include:
• Improving the quality and relevance of education,
so that parents see an added value in keeping
their children—both girls and boys—at school.
• Making education services accessible to all—both
girls and boys—and closer to home, to overcome
parents’ objections to higher costs and sending
their daughters away.
• Instilling values of gender equity and fairness
among children from a young age, which will re-
quire teaching-learning materials to be more gen-
der responsive.
• Addressing the socio-cultural factors that influ-
ence parents’ and communities’ perceptions
about the role of girls. These perceptions and
practices are frequently the cause of girls’ lower
academic performance, and even dropping out of
school. Parents need to be persuaded that girls
need an adequate education and that education
is a necessary investment for women, even if they
do not work outside the home. Parents also need
to be made aware of the links between women’s
education and children’s health, nutrition and ed-
ucation.
• Meeting security concerns, especially in conflict
areas, which affect girls’ access to education. Par-
ents need to be assured that schools offer a se-
cure environment for their children.
• Eliminating legal practices that encourage in-
equality and discriminate against women. Such
occurrences are still frequently seen, although
Article 27 of the 1945 Constitution assures equal
rights for all citizens, male as well as female.
Policies and programmes
Policies. To achieve the Millennium Development
Goal (MDG) of gender equality and women’s em-
powerment, polices focus on: equal access to qual-
ity and gender-sensitive education for all—boys and
girls alike; the reduction of adult illiteracy—specifi-
cally among the female population—by enhancing
performance at all levels in formal and non-formal
education, as well as in equivalency education and
functional literacy programmes; and strengthening
the capacity of educational institutions to manage
and promote gender-sensitive education.
Strategies. There are five strategies for implement-
ing these policies: providing equal access for boys
and girls to quality education through formal and
non-formal channels, especially at the primary level;
providing access to equivalency education for adults
who cannot undertake formal education; providing
access to literacy education services, specifically for
the female population; mainstreaming gender-sen-
sitive education through better coordination, infor-
mation and education; and developing institutions
for gender-sensitive education at both the central
and provincial levels.
Targets. The targets for gender equality and wom-
en’s empowerment are: increased enrolment ratios
with a balanced female-male ratio at all educational
levels among the school-age population; increased
enrolment rates—both female and male—among
the poor, especially those in rural areas; and in-
creased literacy rates with a balanced female-male
ratio.
Indonesia Progress Report on the Millenium Development Goals
47
Priorities. It will be crucial to tailor various strate-
gies to the specific situation—whether the reason
for a child not staying in school is child labour or
early marriage. Attention will need to be paid to re-
gional disparities and specific groups. For example,
although female education enrolment is still lower
than male overall, certain regions and groups—for
example, the 13-to-15 age group in the poorer seg-
ments of the population—show lower enrolment
rates for boys compared to girls. Specific efforts
are required to raise boys’ enrolment in this case.
Similarly, while the gender ratio is satisfactory at the
primary level, local variations exist among areas or
groups. For literacy, the priority needs are among
poor rural women older than 25 years of age, fol-
lowed by poor rural males in the same age group.
Actions will need to be supported by building insti-
tutional capacities in gender-responsive education
planning, and increasing understanding among all
stakeholders of the equal importance of education
for girls and boys, women and men.
Notes
1 United Nations Development Group, 2003. Indicators for Monitoring the Millennium Development Goals: Definitions, Rationale, Concepts and Sources. United Nations, New York.

Indonesia Progress Report on the Millenium Development Goals
48
49
GOAL 4
Reducing Child Mortality
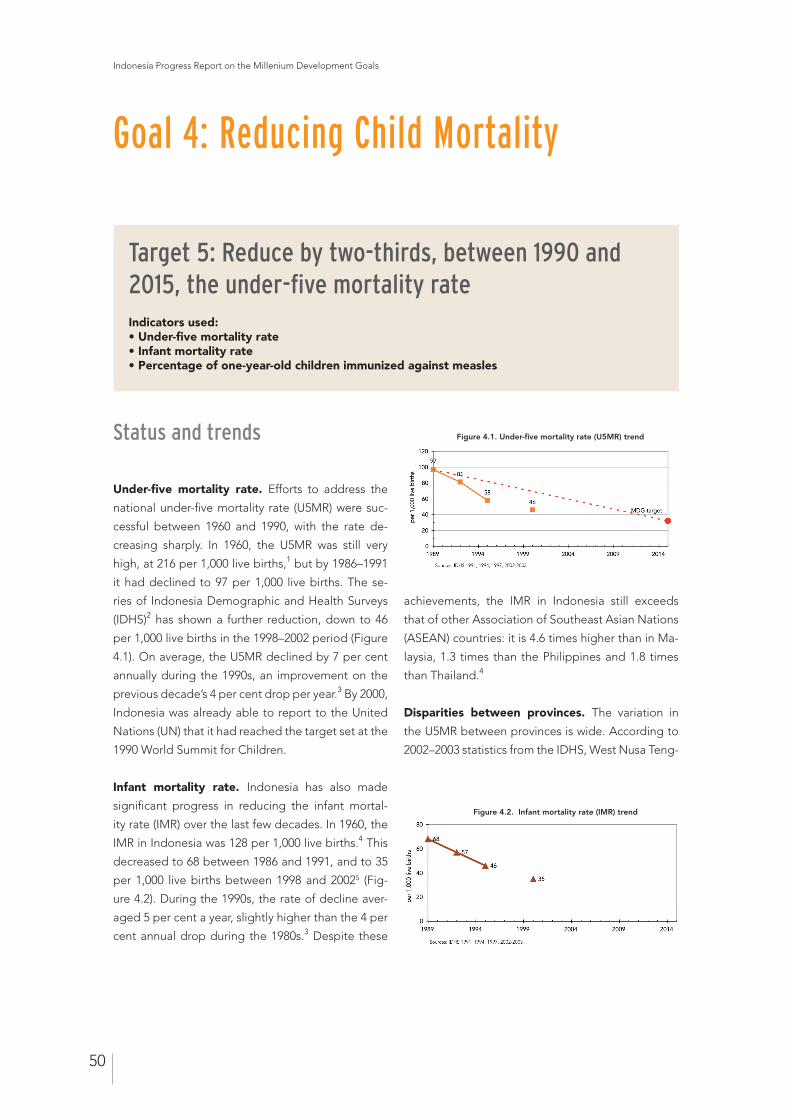
Indonesia Progress Report on the Millenium Development Goals
50
Status and trends
Under-five mortality rate. Efforts to address the
national under-five mortality rate (U5MR) were suc-
cessful between 1960 and 1990, with the rate de-
creasing sharply. In 1960, the U5MR was still very
high, at 216 per 1,000 live births,1 but by 1986–1991
it had declined to 97 per 1,000 live births. The se-
ries of Indonesia Demographic and Health Surveys
(IDHS)2 has shown a further reduction, down to 46
per 1,000 live births in the 1998–2002 period (Figure
4.1). On average, the U5MR declined by 7 per cent
annually during the 1990s, an improvement on the
previous decade’s 4 per cent drop per year.3 By 2000,
Indonesia was already able to report to the United
Nations (UN) that it had reached the target set at the
1990 World Summit for Children.
Infant mortality rate. Indonesia has also made
significant progress in reducing the infant mortal-
ity rate (IMR) over the last few decades. In 1960, the
IMR in Indonesia was 128 per 1,000 live births.4 This
decreased to 68 between 1986 and 1991, and to 35
per 1,000 live births between 1998 and 20025 (Fig-
ure 4.2). During the 1990s, the rate of decline aver-
aged 5 per cent a year, slightly higher than the 4 per
cent annual drop during the 1980s.3 Despite these
achievements, the IMR in Indonesia still exceeds
that of other Association of Southeast Asian Nations
(ASEAN) countries: it is 4.6 times higher than in Ma-
laysia, 1.3 times than the Philippines and 1.8 times
than Thailand.4
Disparities between provinces. The variation in
the U5MR between provinces is wide. According to
2002–2003 statistics from the IDHS, West Nusa Teng-
Goal 4: Reducing Child Mortality
Target 5: Reduce by two-thirds, between 1990 and 2015, the under-five mortality rateIndicators used:• Under-five mortality rate• Infant mortality rate• Percentage of one-year-old children immunized against measles
Figure 4.1. Under-five mortality rate (U5MR) trend
Figure 4.2. Infant mortality rate (IMR) trend
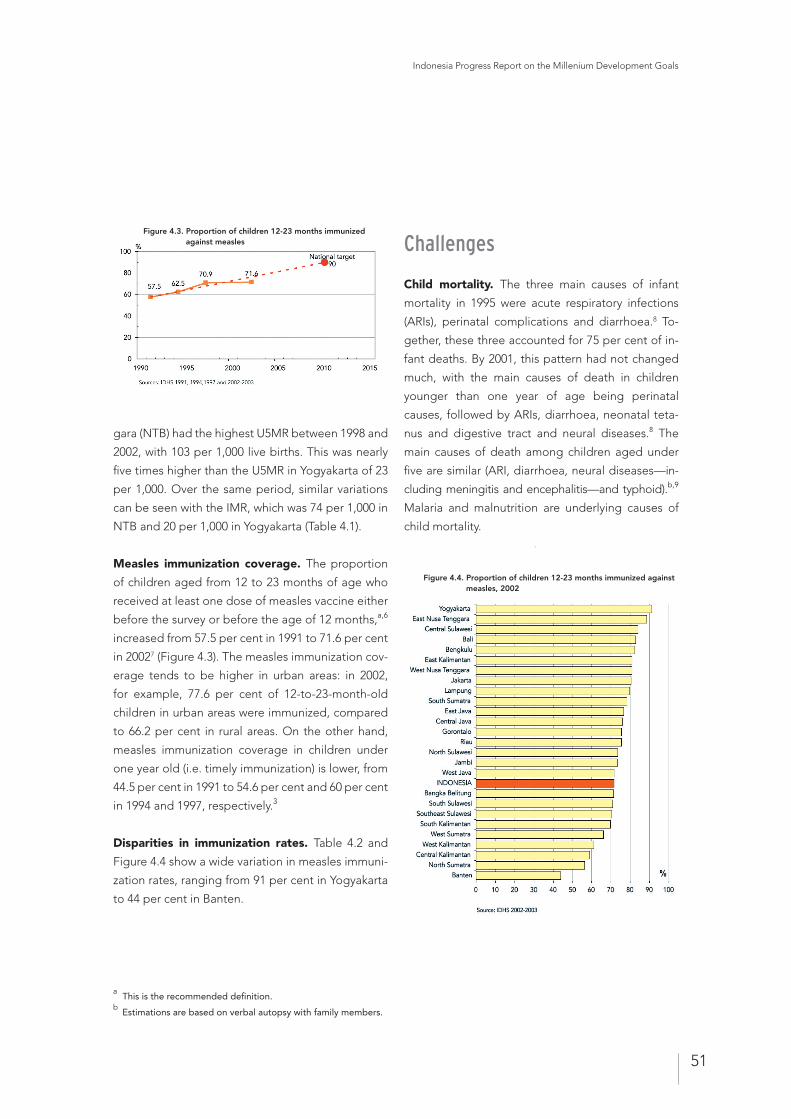
Indonesia Progress Report on the Millenium Development Goals
51
gara (NTB) had the highest U5MR between 1998 and
2002, with 103 per 1,000 live births. This was nearly
five times higher than the U5MR in Yogyakarta of 23
per 1,000. Over the same period, similar variations
can be seen with the IMR, which was 74 per 1,000 in
NTB and 20 per 1,000 in Yogyakarta (Table 4.1).
Measles immunization coverage. The proportion
of children aged from 12 to 23 months of age who
received at least one dose of measles vaccine either
before the survey or before the age of 12 months,a,6
increased from 57.5 per cent in 1991 to 71.6 per cent
in 20027 (Figure 4.3). The measles immunization cov-
erage tends to be higher in urban areas: in 2002,
for example, 77.6 per cent of 12-to-23-month-old
children in urban areas were immunized, compared
to 66.2 per cent in rural areas. On the other hand,
measles immunization coverage in children under
one year old (i.e. timely immunization) is lower, from
44.5 per cent in 1991 to 54.6 per cent and 60 per cent
in 1994 and 1997, respectively.3
Disparities in immunization rates. Table 4.2 and
Figure 4.4 show a wide variation in measles immuni-
zation rates, ranging from 91 per cent in Yogyakarta
to 44 per cent in Banten.
Challenges
Child mortality. The three main causes of infant
mortality in 1995 were acute respiratory infections
(ARIs), perinatal complications and diarrhoea.8 To-
gether, these three accounted for 75 per cent of in-
fant deaths. By 2001, this pattern had not changed
much, with the main causes of death in children
younger than one year of age being perinatal
causes, followed by ARIs, diarrhoea, neonatal teta-
nus and digestive tract and neural diseases.8 The
main causes of death among children aged under
five are similar (ARI, diarrhoea, neural diseases—in-
cluding meningitis and encephalitis—and typhoid).b,9
Malaria and malnutrition are underlying causes of
child mortality.
a This is the recommended definition.
b Estimations are based on verbal autopsy with family members.
Figure 4.3. Proportion of children 12-23 months immunized against measles
Figure 4.4. Proportion of children 12-23 months immunized against measles, 2002
Indonesia Progress Report on the Millenium Development Goals
52
Maternal and neonatal health. One third of infant
deaths occurs within the first month after birth and
approximately 80 per cent of these during the first
week of life. Clearly, these are the result of poor
maternal and neonatal health status; sub-standard
access to and quality of maternal and child health
services, especially during and immediately after
delivery; and the care-seeking (both preventive and
curative) behaviour of pregnant women, families and
communities, which are not conducive to a healthy
pregnancy, safe delivery and early childhood survival
and development.
Behavioural challenges. The direct and most im-
portant causes of infant and under-five mortality
are easier to address compared with the more dif-
ficult challenges of improving family and community
health-seeking behaviour and making it conducive
to a healthy pregnancy, safe delivery and appropri-
ate care immediately after birth. Measures to ad-
dress these challenges include improving access
to health care; strengthening the quality of delivery
care and the integrated management of childhood
diseases; improving environmental health, including
the provision of clean water and sanitation; control-
ling communicable diseases; and improving mater-
nal nutrition.
Disparities. Another challenge is to reduce urban-
rural gaps and regional disparities between provinc-
es and districts in health indicators. A key strategy is
to target poor, vulnerable groups and populations
living in remote areas. However, pockets of high
mortality in urban areas cannot be neglected. These
are high population-density areas, with greater num-
bers of children and, consequently, greater numeri-
cal weight in decreasing infant and under-five mor-
tality rates nationally, especially neonatal mortality.
Synchronization and coordination of programmes.
Given the complexity of factors influencing infant and
under-five mortality, support from different sectors is
necessary for achieving the targets. Institutions, the
government, the private sector, communities and
non-governmental organizations (NGOs) very much
need to synchronize and coordinate programmes.
These contributions should fit within an overall child
health policy, with specific strategies depending on
the beneficiaries and service providers at different
levels.
Poor families. Health protection and services for
poor families are crucial, given their already-poor
health and nutrition status. In 1995, the IMR of the
poorest families was almost twice that of the richest
families. While this disparity has decreased, in 2001
the IMR in the poor population was still 1.5 times that
of the rich.10 Considering a significant proportion of
Indonesians are poor (37.3 million, or 17.4 per cent,
in 2003)11, ensuring health protection and services for
this group remains a daunting challenge. Cost-effec-
tive interventions, sustainable health protection—in-
cluding health insurance, inter-sectoral cooperation
and efforts to eradicate poverty all play important
roles in improving maternal and child health.
Decentralization. Since 2001, the decentralization
of health services has created a significant challenge
to efforts to reduce the IMR and U5MR. The man-
agement and flow of information, especially facility-
based data collection, is not functioning properly.
The delineation of roles and authorities between
the central, provincial and district governments is
still unclear. District health planning still needs to be
improved.
Indonesia Progress Report on the Millenium Development Goals
53
Policies and programmes
National Development Programme 2000–2004.
Reducing the IMR and U5MR is a priority in national
health development. In the National Development
Programme 2000–2004 (Propenas), this aim is re-
flected in three national health programmes: the
Healthy Environment, Healthy Behaviour and Com-
munity Empowerment Programme; the Health Pro-
motion Programme and the Nutrition Improvement
Programme.12
Supporting activities and strategies. Plans to re-
duce the IMR and U5MR include: improving hygiene
and sanitation at individual, family and community
levels—through the provision of clean water; im-
proving health awareness and behaviour relating
to early childhood illness and child development;
controlling communicable diseases; increasing im-
munization coverage; and improving reproductive
health services, including contraceptive and mater-
nal services; controlling malnutrition, chronic energy
deficiency and anaemia; and promoting exclusive
breastfeeding and growth monitoring.
National Social Safety Net Programme. The eco-
nomic crisis and population growth since 1998 has
limited the access of the poor to health services. In
response, the Government launched a National So-
cial Safety Net Programme, which supports routine
maternal and child health services. There are other
programmes that provide free basic and referral
health services for poor families, pregnant mothers,
deliveries, post-partum mothers and infants, as well
as help to develop health facilities.
Legislation. Law No. 23 on Child Protection (2002)
aims to ensure better and more opportunities for
children to live healthy lives and grow and develop
to their optimal level. It states that every child has
the right to obtain health services and social security,
according to his or her physical, mental, spiritual and
social needs.
National Programme for Indonesian Children. Re-
ducing infant and child mortality is an important part
of the National Programme for Indonesian Children
(PNBAI). The programme is part of the 2015 Vision
for Indonesian Children and emphasizes promot-
ing healthy lives for children. National strategies
to reduce the IMR and U5MR include empowering
families and communities, improving inter-sectoral
cooperation and coordination, and improving the
coverage of comprehensive, quality child-health
services.
Notes
1 UNICEF, 2000. The State of the World’s Children 2000.
New York. 2 BPS—Statistics Indonesia & ORC Macro, 2003. Indonesia
Demographic and Health Surveys (IDHS) 2002–2003. Maryland. USA. Also previous IDHS in 1992, 1994 and 1997 (mortality estimates cover the previous five-year period of each).
3 BPS—Statistics Indonesia, 2000. End Decade Statistical Report: Data and Descriptive Analysis. Jakarta.
4 Government of Indonesia—UNICEF, 2000. Challenges for a New Generation: The Situation of Children and Women in Indonesia. Jakarta.
5 IDHS, 1992, 1994, 1997 and 2002–2003. 6 United Nations, 2003. Indicators for Monitoring the
Millennium Development Goals: Definitions, Rationale, Concepts and Sources. United Nations, New York.
7 IDHS, 2002–2003.8 National Institute for Health Research and Development,
1995. National Household Health Survey 1995. Ministry of Health, Indonesia, Jakarta.
9 Ministry of Health, Indonesia, 2001. Rencana Strategi Nasional: “Making Pregnancy Safer” di Indonesia 2001-2010. Jakarta.
10 Bappenas & Lembaga Demografi Universitas Indonesia, 2003. Kajian Awal Perencanaan Jangka Panjang Bidang Sumber Daya Manusia: Draft Awal. Jakarta.
11 See Goal 1. 12 Government of Indonesia, National Development Programme,
2000-2004.

Indonesia Progress Report on the Millenium Development Goals
54
55
GOAL 5
Improving Maternal Health
Indonesia Progress Report on the Millenium Development Goals
56
Goal 5: Improving Maternal Health
Status and trends
Maternal mortality ratio. Maternal mortality ratio.
Indonesia does not have the vital statistics systems
to directly collect information on this indicator. Di-
rect age-specific estimates of maternal mortality
from the reported survivorship of sisters were ob-
tained from the series of Indonesia Demographic
and Health Surveys (IDHS). While the data indicate
some reduction in maternal mortality—down to 307
per 100,000 live births for the period 1998–20021—
the IDHS caution that, given the technique, it may
be premature to judge a substantial decline in the
maternal mortality ratio (MMR). Among the five mil-
lion deliveries in Indonesia annually, an estimated
20,000 women die due to complications related to
pregnancy and delivery.2 With the current trends,
the Millennium Development Goal (MDG) target is
unlikely to be achieved unless extra efforts are made
to reduce the MMR.
Disparities. Like other health indicators, there are
variations in the MMR between regions. Using es-
timates of the proportion of maternal deaths in fe-
males of reproductive age (PMDF) in 1995 for five
provinces, calculations showed that the MMR of
Central Java (248) was much lower than that in Ma-
luku (796), Papua (1,025), West Java (686) and East
Nusa Tenggara (NTT; 554).3
Other countries. Indonesia has a relatively high
MMR when compared with some other Southeast
Asian countries. The lifetime risk of a mother dying
related to childbirth in Indonesia is estimated to be
1 in 65, compared with 1 in 1,100 in Thailand.4
Major medical causes. Haemorrhage, eclampsia or
convulsions resulting from hypertensive disorders
of pregnancy, abortion complications, obstructed
labour and infections are the main medical causes
of maternal death. Haemorrhage, responsible for 28
per cent of all maternal deaths, is usually unpredict-
able and sudden in onset. Most haemorrhages hap-
pen in the post-partum period, reported as due to
retained placenta and atonia uteri. This indicates in-
adequate management of the third stage of labour
and the failure to provide timely emergency obstet-
ric and neonatal care in the health system. Eclamp-
sia is the second major cause of maternal mortality
in Indonesia (13 per cent of deaths, compared with
12 per cent globally). Deaths from eclampsia can be
prevented by careful monitoring during pregnancy
and ensuring access to simple and low-cost treat-
ment.
Target 6: Reduce by three-quarters, between 1990 and 2015, the maternal mortality ratioIndicators:• Maternal mortality ratio• Percentage of births attended by skilled health personnel• Contraceptive prevalence rate
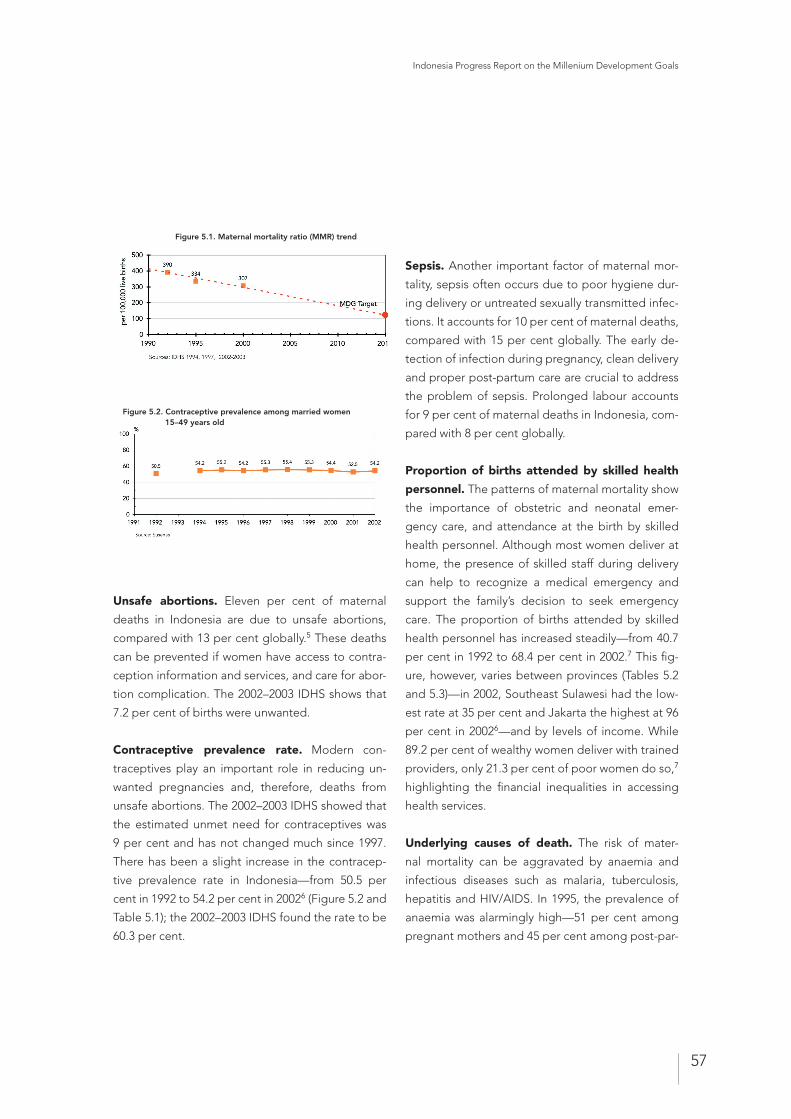
Indonesia Progress Report on the Millenium Development Goals
57
Unsafe abortions. Eleven per cent of maternal
deaths in Indonesia are due to unsafe abortions,
compared with 13 per cent globally.5 These deaths
can be prevented if women have access to contra-
ception information and services, and care for abor-
tion complication. The 2002–2003 IDHS shows that
7.2 per cent of births were unwanted.
Contraceptive prevalence rate. Modern con-
traceptives play an important role in reducing un-
wanted pregnancies and, therefore, deaths from
unsafe abortions. The 2002–2003 IDHS showed that
the estimated unmet need for contraceptives was
9 per cent and has not changed much since 1997.
There has been a slight increase in the contracep-
tive prevalence rate in Indonesia—from 50.5 per
cent in 1992 to 54.2 per cent in 20026 (Figure 5.2 and
Table 5.1); the 2002–2003 IDHS found the rate to be
60.3 per cent.
Sepsis. Another important factor of maternal mor-
tality, sepsis often occurs due to poor hygiene dur-
ing delivery or untreated sexually transmitted infec-
tions. It accounts for 10 per cent of maternal deaths,
compared with 15 per cent globally. The early de-
tection of infection during pregnancy, clean delivery
and proper post-partum care are crucial to address
the problem of sepsis. Prolonged labour accounts
for 9 per cent of maternal deaths in Indonesia, com-
pared with 8 per cent globally.
Proportion of births attended by skilled health
personnel. The patterns of maternal mortality show
the importance of obstetric and neonatal emer-
gency care, and attendance at the birth by skilled
health personnel. Although most women deliver at
home, the presence of skilled staff during delivery
can help to recognize a medical emergency and
support the family’s decision to seek emergency
care. The proportion of births attended by skilled
health personnel has increased steadily—from 40.7
per cent in 1992 to 68.4 per cent in 2002.7 This fig-
ure, however, varies between provinces (Tables 5.2
and 5.3)—in 2002, Southeast Sulawesi had the low-
est rate at 35 per cent and Jakarta the highest at 96
per cent in 20026—and by levels of income. While
89.2 per cent of wealthy women deliver with trained
providers, only 21.3 per cent of poor women do so,7
highlighting the financial inequalities in accessing
health services.
Underlying causes of death. The risk of mater-
nal mortality can be aggravated by anaemia and
infectious diseases such as malaria, tuberculosis,
hepatitis and HIV/AIDS. In 1995, the prevalence of
anaemia was alarmingly high—51 per cent among
pregnant mothers and 45 per cent among post-par-
Figure 5.1. Maternal mortality ratio (MMR) trend
Figure 5.2. Contraceptive prevalence among married women 15–49 years old
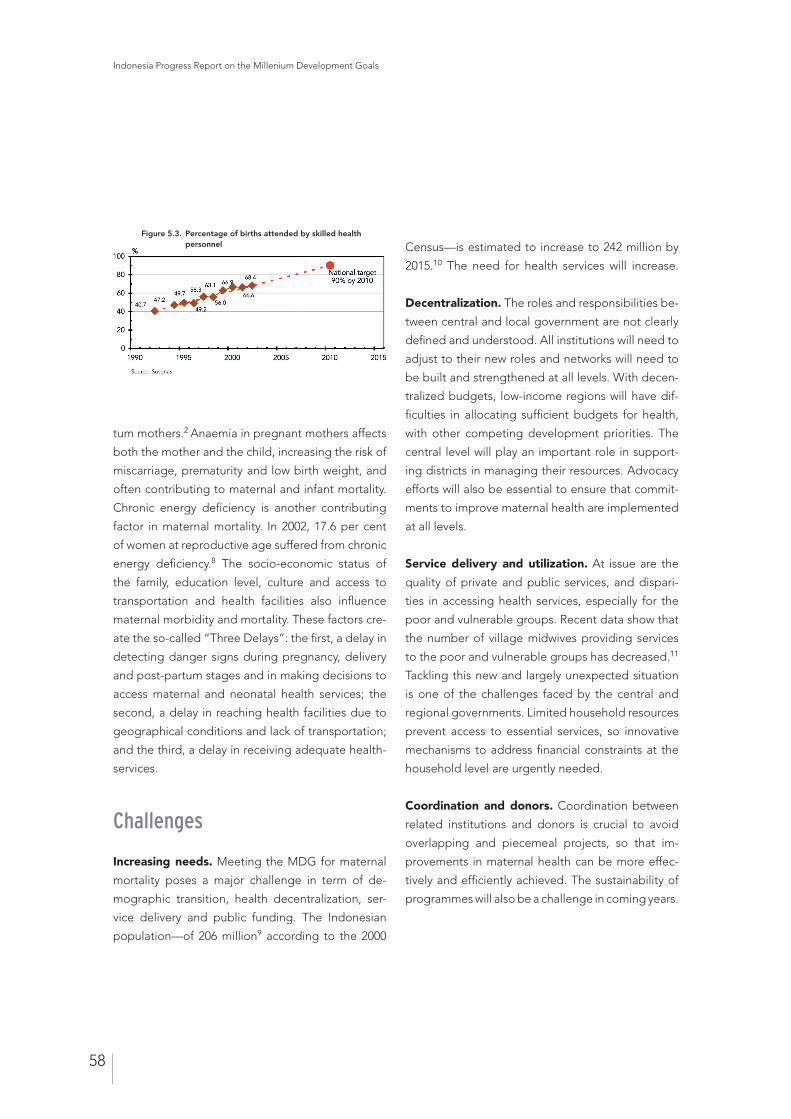
Indonesia Progress Report on the Millenium Development Goals
58
tum mothers.2 Anaemia in pregnant mothers affects
both the mother and the child, increasing the risk of
miscarriage, prematurity and low birth weight, and
often contributing to maternal and infant mortality.
Chronic energy deficiency is another contributing
factor in maternal mortality. In 2002, 17.6 per cent
of women at reproductive age suffered from chronic
energy deficiency.8 The socio-economic status of
the family, education level, culture and access to
transportation and health facilities also influence
maternal morbidity and mortality. These factors cre-
ate the so-called “Three Delays”: the first, a delay in
detecting danger signs during pregnancy, delivery
and post-partum stages and in making decisions to
access maternal and neonatal health services; the
second, a delay in reaching health facilities due to
geographical conditions and lack of transportation;
and the third, a delay in receiving adequate health-
services.
Challenges
Increasing needs. Meeting the MDG for maternal
mortality poses a major challenge in term of de-
mographic transition, health decentralization, ser-
vice delivery and public funding. The Indonesian
population—of 206 million9 according to the 2000
Census—is estimated to increase to 242 million by
2015.10 The need for health services will increase.
Decentralization. The roles and responsibilities be-
tween central and local government are not clearly
defined and understood. All institutions will need to
adjust to their new roles and networks will need to
be built and strengthened at all levels. With decen-
tralized budgets, low-income regions will have dif-
ficulties in allocating sufficient budgets for health,
with other competing development priorities. The
central level will play an important role in support-
ing districts in managing their resources. Advocacy
efforts will also be essential to ensure that commit-
ments to improve maternal health are implemented
at all levels.
Service delivery and utilization. At issue are the
quality of private and public services, and dispari-
ties in accessing health services, especially for the
poor and vulnerable groups. Recent data show that
the number of village midwives providing services
to the poor and vulnerable groups has decreased.11
Tackling this new and largely unexpected situation
is one of the challenges faced by the central and
regional governments. Limited household resources
prevent access to essential services, so innovative
mechanisms to address financial constraints at the
household level are urgently needed.
Coordination and donors. Coordination between
related institutions and donors is crucial to avoid
overlapping and piecemeal projects, so that im-
provements in maternal health can be more effec-
tively and efficiently achieved. The sustainability of
programmes will also be a challenge in coming years.
Figure 5.3. Percentage of births attended by skilled health personnel
Indonesia Progress Report on the Millenium Development Goals
59
Policies and programmes
A national priority. Reducing maternal morbidity
and mortality has become a central priority in health
sector development, as stated in the National De-
velopment Programme (Propenas). Its components
include: improving reproductive health services,
communicable disease control and basic and refer-
ral health services; and reducing chronic energy de-
ficiency and anaemia among women of reproductive
age during pregnancy, delivery and the post-partum
period.12
Making Pregnancy Safer. Within the framework of
the Healthy Indonesia 2010 vision, a national strat-
egy called Making Pregnancy Safer (MPS) has been
set up as a continuation of the Government’s Safe
Motherhood Programme to accelerate the reduc-
tion of maternal and neonatal morbidity and mortal-
ity. MPS promotes a systematic, integrated planning
approach to clinical interventions and health sys-
tems, relying on partnerships between government
institutions, donors, lenders, the private sector,
communities and families. It emphasizes providing
appropriate and continuous skilled care, with a fo-
cus on the availability of skilled birth attendants, and
pays special attention to community-based actions
to ensure women and newborns have appropriate
access to care.
Strategies. There are four main strategies for re-
ducing maternal morbidity and mortality. The first
is to improve access to and coverage of cost-effec-
tive and quality maternal and neonatal health care.
The second is to build more effective partnerships
through cooperation between programmes, institu-
tions and partners. The third is to empower women
and families by improving their knowledge of and
attitudes towards health behaviour. The fourth is to
involve communities in the provision and utilization
of available maternal and neonatal health services.
Messages. The three key messages of MPS are that
every delivery should be assisted by a trained health
provider; every obstetric and neonatal complication
should be managed adequately; and every woman
of reproductive age should have access to services
for preventing unwanted pregnancy and managing
the complications of unsafe abortions.
Special groups. Special attention is needed for low-
income and vulnerable groups in peri-urban and rural
areas, as well as people in remote areas, particularly
young women who do not have adequate access to
health services. The Social Safety Net Programme,
launched in 1998, ensured funding for basic service
provision and will need to be maintained.
Factors in maternal deaths. The wider context in
which maternal death occurs also needs to be ad-
dressed. Maternal death is often the result of com-
plex and multiple factors in more than one sector.
The correlation between safe deliveries, a woman’s
educational level and her use of contraceptives is
well known. Adequate reproductive health services
for adolescents are also needed. Gender issues and
reproductive rights for both men and women still
need to be emphasized and promoted at all levels
Indonesia Progress Report on the Millenium Development Goals
60
Notes
1 BPS—Statistics Indonesia & ORC Macro, 2003. Indonesia Demographic and Health Surveys (IDHS) 2002–2003. Maryland, USA. Also IDHS 1994 and 1997.
2 Ministry of Health, Indonesia, 2001. Rencana Strategis Nasional “Making Pregnancy Safer” di Indonesia 2001–2010. Jakarta.
3 Soemantri, Soeharsono et al (eds), 1999. Maternal Morbidity and Mortality Study: CHN-III/Household Health Survey 1995. Ministry of Health, Indonesia & National Institute of Health Research and Development, Jakarta.
4 Government of Indonesia & UNICEF, 2000. Challenges for a New Generation: The Situation of Children and Women in Indonesia. Jakarta.
5 Ministry of Health, Indonesia, 2003. The Director General of Public Health. Upaya Penurunan AKI di Indonesia. Presentation for the MDG Working Group. 2003.
6 BPS—Statistics Indonesia, 2003. Susenas data calculated for MDG Report.
7 WHO—Indonesia, 2002. The Millennium Development Goals for Health: A Review of the Indicators. Jakarta.
8 From the measurement of mid-upper arm circumference. In: BPS—Statistics Indonesia, World Bank & Ministry of Health, 2002. Report of Household Iodized Salt Consumption Survey 2002. Jakarta.
9 BPS—Statistics Indonesia. 2002. Indonesia Population based on 2000 Census. Jakarta.
10 Bappenas & Demographic Institute University of Indonesia. 2003. Preliminary Study on Long Term National Planning: Human Resources Sector. Jakarta.
11 The XIII IBI Congress (National Conference of the Professional Midwives’ Organization), September 2003.
12 Government of Indonesia. 2000–2004 National Development Programme (Propenas).
61
GOAL 6
Combating HIV/AIDS, Malaria, and Other Diseases
Indonesia Progress Report on the Millenium Development Goals
62
Goal 6: Combating HIV/AIDS, Malaria, and Other Diseases
Status and trends
Status. The first AIDS case reported in Indonesia
was a foreign citizen in Bali in 1987. In the follow-
ing years, reports came from more provinces. The
number of reported AIDS cases has continued to
rise since 1987, affecting all age groups, particularly
adolescents and adults of productive age. By the
end of September 2003, 1,239 AIDS and 2,685 HIV
cases had been officially reported. Experts estimate
that to date, there are 90,000 to 130,000 Indonesians
living with HIV.1 With a 2.5 per cent birth rate, it is
thought that 2,250 to 3,250 infants at risk of HIV in-
fection will be born each year. The most common
mode of transmission is through sexual intercourse,
followed by injecting drug use.
Injecting drug users. Surveillance data in hospitals
for drug addiction in Jakarta showed an increase in
HIV infection among injecting drug users from 15
per cent in 1999 to 48.8 per cent in 2000 and 47.9
per cent in 2002.2 Data from these hospitals also re-
corded that 15 per cent of young people seeking
medical services are HIV-infected.
Commercial sex workers and other high-risk
groups. The sex industry comprises approximately
150,000 female sex workers. Among these women,
HIV rates are high: in Merauke, Papua, 26.5 per cent
of female sex workers are already infected by HIV.
Infection rates are also high in prisons and correc-
tional institutions; for example, at one institution in
Jakarta, 22 per cent of the inmates are HIV-infect-
ed.
Condom use at last high-risk sex. Among commer-
cial sex workers, the rate of condom use when they
last had high-risk sexual intercourse was reported to
be 41 per cent, but this is by no means consistent.
There are approximately seven to 10 million male
clients of sex workers in Indonesia but fewer than
10 per cent of commercial sex workers consistently
use condoms to protect themselves from infection.3
A survey on commercial sex workers in 13 provinces
showed that condom use during last sexual inter-
course varied between regions, ranging from 18.9
per cent in Karawang, West Java, to 88.4 per cent in
Merauke, Papua.4
Target 7: Have halted by 2015 and begun to reverse the spread of HIV/AIDSIndicators used:• HIV prevalence among 15-to-24-year-old pregnant women• Condom use at last high-risk sex• Condom use rate of the contraceptive prevalence rate• Percentage of population aged 15 to 24 with comprehensive correct knowledge of
HIV/AIDS
Indonesia Progress Report on the Millenium Development Goals
63
Condom use rate of the contraceptive prevalence
rate. Among the general population, National So-
cio-Economic Surveys (Susenas) data show that the
proportion of contraceptive-using married women
of reproductive age (from 15 to 49 years) who use
condoms is very low, at 0.4 per cent in 2002, and has
remained under 1 per cent since 1994 (Table 6.1).
Knowledge of HIV/AIDS. The percentage of young
people (aged 15 to 24) with comprehensive correct
knowledge of HIV/AIDS,a,5 can be estimated through
proxy indicators from surveys. In 2002–2003, 65.8
per cent of women and 79.4 per cent of men in the
15-to-24 age group had heard of HIV/AIDS.6 Among
women of reproductive age, the majority had heard
of HIV/AIDS (62.4 per cent), but only 20.7 per cent
knew that using a condom every time would prevent
them from HIV/AIDS and 28.5 per cent knew that
a healthy person could be infected with HIV/AIDS.7
One study showed that only 38.4 per cent of Jakarta
high school students, aged from 15 to 19, in 2002
correctly identified ways of preventing sexual trans-
mission of HIV/AIDS and rejected major misconcep-
tions.3 Another study in West Java, South Kaliman-
tan and East Nusa Tenggara (NTT) found that 93.3
per cent of young people knew that HIV could be
transmitted by sexual intercourse but only 35 per
cent knew that sharing needles could also transmit
the disease and 15.2 per cent still believed that nor-
mal social contact could transmit HIV.3
Pregnant women and infants. The prevalence
among pregnant women was 0.35 per cent in Riau
and 0.25 per cent in Papua. Voluntary counselling
and testing (VCT) programmes in North Jakarta
showed that 1.5 per cent of pregnant women in
2000, and 2.7 per cent in 2001,3 were HIV-positive.
Those using VCT services probably knew they were
at risk and the data are not representative of HIV
infection among pregnant women in general. None-
theless, these high rates indicate that transmission
into communities is taking place through the bridg-
ingb population. Passive reportsc from 1996 to 2000
showed 26 pregnant women and 13 infants who
were infected by HIV from East Java, Jakarta, Papua,
Riau and West Java.
Young people and children. To date, the preva-
lence of HIV/AIDS among people aged 15 to 29 is
estimated to be still below 0.1 per cent.8 The num-
ber of HIV-infected children is still low compared to
that of some other countries. Twelve HIV/AIDS cases
were reported among children under four years of
age, four in the five-to-14 age group and 67 in the
15-to-19 age group.9 Reported cases are probably
much less than the real numbers, so strengthening
surveillance systems at every level of administration
will be crucial.
Challenges
Large-scale epidemic. The biggest challenge will
be preventing a large-scale generalized HIV epi-
demic. The HIV epidemic in Indonesia is concen-
trated, with still-low HIV infection rates in the gen-
eral population but a high incidence among certain
populations. Trends indicate that Indonesia is at risk
from an epidemic on a much larger scale in the near
future. The alarming rise in HIV infection in high-risk
groups in several parts of the country is one indica-
tion of the sharp increases to come. It is estimated
that by 2010, there will be approximately 110,000
people suffering from AIDS or who have died be-
cause of AIDS, and one million more who are HIV-
infected.10
a As defined by the United Nations, this is the percentage of men and women aged 15 to 24 who know that a person can protect himself or herself from HIV infection by the consistent use of condoms and the percentage of men and women of this age group who know a healthy-looking person can transmit HIV.b The bridging population are the clients of sex workers and the partners of injecting drug users.c Information incidentally obtained from medical examinations for other conditions.
Indonesia Progress Report on the Millenium Development Goals
64
Risk factors. In Indonesia, risk factors fuelling the
spread of HIV/AIDS transmission include: high HIV
prevalence rates among high-risk groups; the in-
creasing use of injecting drugs; risky practices such
as needle sharing; high rates of sexually transmitted
diseases among children working and living on the
street; a general unwillingness among male clients
of sex workers to use condoms; high migration rates,
population displacement and movement; and the
lack of adequate knowledge of and information on
how to prevent HIV/AIDS, especially among young
people. Effective programmes to address these risk
factors include harm reduction among injecting drug
users. Other challenges include the limited supplies
and high prices of anti-retroviral drugs.
Policies and programmes
National and international commitments. The rap-
id spread of HIV/AIDS, especially among high-risk
groups, is a major concern for the Government of In-
donesia. National responses in HIV/AIDS control are
a reflection of the Government’s international com-
mitments to the United Nations (UN) Declaration of
Commitment of the UN General Assembly Special
Session (UNGASS) on HIV/AIDS (2001), the Associa-
tion of Southeast Asian Nations (ASEAN) Declara-
tion on HIV/AIDS (2001) and the UN Declaration
“A World Fit for Children” (2002). HIV/AIDS control
in Indonesia comprises prevention; care, support
and treatment for people living with HIV/AIDS; and
surveillance.
Prevention. Particularly relevant to the situation and
of high priority, the strategy of HIV/AIDS prevention
is implemented through information, education and
communication campaigns conducted in ways ap-
propriate to cultural and religious values. Pregnant
women are encouraged to visit antenatal care clinics
to obtain HIV information, counselling and services,
including information on preventing mother-to-child
transmission. Other interventions for disease control
are aimed at high-risk groups, such as commercial
sex workers and their clients, infected people and
their partners, injecting drug users and health work-
ers exposed to HIV/AIDS.
Care, support and treatment for people living
with HIV/AIDS. VCT clinics at existing health facili-
ties provide care, support and treatment for people
with HIV/AIDS. VCT is conducted not only by the
government but also by private health facilities and
non-governmental organizations (NGOs). Such ef-
forts emphasize the importance of caring for people
living with HIV/AIDS while protecting their human
rights by reducing or eliminating stigma and dis-
crimination. To improve the quality of services, more
training and education are needed, especially for
service personnel, as well as supplies of the required
drugs and more guidance on care, support, treat-
ment and counselling.
Surveillance. The surveillance of HIV/AIDS and oth-
er sexually transmitted diseases includes systemati-
cally collecting, processing and analyzing data, and
provides information on the numbers, prevalence
and trends among population groups with different
risk levels.
Indonesia Progress Report on the Millenium Development Goals
65
Malaria
Status and trends
Malaria prevalence and death rates. Nearly half
the Indonesian population—more than 90 million
people—lives in malaria endemic areas.11 About 30
million cases of malaria are expected to occur an-
nually, only 10 per cent of which will be treated in
health facilities. The highest disease burden is in the
eastern provinces where malaria is endemic. Most
rural areas outside Java-Bali also have a risk of ma-
laria, which has re-emerged in Central Java and West
Java. Data from public facilities in 2001 estimate ma-
laria prevalence as 850.2 per 100,000 people, with
rates as high as 20 per cent in Gorontalo province,
13 per cent in NTT and 10 per cent in Papua. The
National Household Health Survey12 (2001) estimat-
ed the malaria-specific death rate at 11 per 100,000
for men and 8 per 100,000 for women.
Percentage of population using effective pre-
vention against malaria. Prevention efforts focus
on minimizing the contact between humans and
mosquitoes via bed nets and residual house spray-
ing. Environmental management and larviciding can
be used in selective ecological settings dependent
on the vector species. Insecticide-treated mosquito
bed nets are an effective way to prevent malaria,
particularly for the most vulnerable groups, i.e. preg-
nant women and children under five years old. Na-
tionally, about one in three children under the age
of five years sleeps under a bed net (32 per cent),
although this proportion is higher (40.1 per cent)
among children younger than one year-old.7 About
0.2 per cent of children sleep under an insecticide-
treated bed net. One obstacle to the widespread
use is the cost of bed nets, which can be relatively
high for poor families.
Percentage of people with malaria effectively
treated. Among children under five years who ex-
perienced clinical symptoms of malaria, an estimat-
ed 4.4 per cent received anti-malarial drugs, while
the vast majority was given other drugs to reduce
fever (67.6 per cent). Self-medication is an important
Target 8: Have halted by 2015 and begun to reverse the incidence of malaria and other major diseasesIndicators used:• Malaria prevalence and death rates• Percentage of population using effective prevention against malaria • Percentage of population with malaria effectively treated • Tuberculosis prevalence and death rates• Directly observed treatment—short course (DOTS) tuberculosis detection rate• Directly observed treatment—short course (DOTS) tuberculosis success rate
Indonesia Progress Report on the Millenium Development Goals
66
but neglected area of care-seeking behaviour that
needs strengthening in Indonesia through better
health education.
Diagnosis and treatment. The basis of accurate di-
agnosis is a well-functioning laboratory. About half
of the cases reported, however, are diagnosed only
by clinical symptoms with no laboratory confirma-
tion, which can potentially lead to inaccurate and in-
appropriate treatment. The use of rapid diagnostics,
such as dipsticks, could be phased in, particularly
for emergency outbreaks or remote areas. Outside
of Java–Bali, people with severe malaria find it dif-
ficult to access referral centres due to a lack of basic
infrastructure and communication.
Impact on economy. Illness from malaria takes a toll
on the Indonesian economy. The loss of individual
income from malaria is estimated at US$56.5 million
annually.13 This does not take into consideration rev-
enue lost from foregone business investment and
tourism in malaria-endemic areas.
Challenges
Links with poverty. Malaria is a preventable condi-
tion. Its high prevalence, therefore, reflects financial
and cultural obstacles to prompt and effective treat-
ment and prevention. Malaria is linked to poverty as
both cause and effect. The disease disproportion-
ately afflicts the poor living in remote areas out of
the reach of health services. The natural environment
provides ample breeding sites for malaria-spreading
Anopheles mosquitoes, such as stagnant rivers and
streams during the dry season, or rain puddles in the
forest during rainy season. But unhealthy environ-
ments are also created, such as borrow pits left by
sand-excavation or mining, unattended shrimp and
fish hatcheries, and denuded mangrove swamps—
leading to increased vector-borne illnesses.
Political unrest, natural disaster or population
movements. These factors may contribute to out-
breaks and re-emerging endemic areas. Man-made
disasters often exacerbate malaria within internally
displaced communities. High population mobility
has resulted in outbreaks within areas that were pre-
viously declared free of malaria.14 Increased popula-
tion density has encouraged people to move into
forest and forest-fringe areas, where malaria is en-
demic. Negligent private businesses, such as those
that abandoned fish and shrimp hatcheries during
the economic crisis, created breeding grounds for
Anopheles sundaicus or Anopheles subpictus mos-
quitoes (because of growing moss covering the wa-
ter surface). The likelihood of continuing economic
pressures and social turmoil will continue to chal-
lenge malaria-control efforts.
Limited human resources. Since the economic cri-
sis, health workers have retired without replacement.
In Java-Bali, the number of village malaria workers
(Juru Malaria Desa, or JMD) is decreasing. This is
particularly alarming given that malaria workers are
key to early detection and treatment. In areas that
are central to Indonesia’s economic development,
but have a high incidence of malaria, extra village
malaria workers need to be recruited to intensify
detection and treatment of malaria, while refresher
training remains a continuing need.
Funding. The funds for malaria-control activities are
inadequate. The changes in roles and responsibili-
ties associated with decentralization may threaten
funding for malaria control activities. This may be
Indonesia Progress Report on the Millenium Development Goals
67
especially true for public-health activities such as
disease surveillance and vector control—given that
bed nets and insecticides for house spraying are
relatively expensive, for example.
Resistance. In all provinces, resistance has been re-
ported—both for existing drug regimes and also for
insecticides. Chloroquine-resistant strains of malaria
were first identified in Indonesia in 1974 and are now
prevalent across the archipelago. Inadequate treat-
ment compliance, inappropriate medication, high
population mobility along with intense transmission
dynamics lead to this situation. Drug resistance im-
plies that the existing treatment will become less
and less effective and that more expensive drugs
will be required in the future.
Policies and programmes
International commitments. Malaria control and
prevention will be intensified through the Roll Back
Malaria (RBM) approach, an international commit-
ment, with the following strategies: detecting early
patients who need to be treated with appropriate
medication; actively involving community compo-
nents in malaria prevention; and improving the qual-
ity of malaria control through strengthening health-
staff capacity. Also important is the approach of
integrating malaria eradication activities into other
health initiatives, such as Integrated Management of
Childhood Illnesses (IMCI), and health promotion.
Strategies. These include: early warning systems
and containment of epidemics, intensification of
control through surveillance intensification, early di-
agnosis and prompt treatment, and selective vector
control. Policies focus on emphasizing decentraliza-
tion, community involvement and building partner-
ship between sectors, NGOs and donor agencies.
The Gebrak Malaria movement, which started in
2000, is the operational form of RBM and prioritizes
partnerships between government institutions, the
private sector and communities in preventing the
spread of malaria.
Activities. The Malaria Control Programme in Indo-
nesia includes eight main groups of activities: early
diagnosis and prompt treatment; insecticide-treat-
ed net programmes; indoor spraying; surveillance of
active and passive case detection; mass fever survey
and migrant surveillance; epidemic detection and
control; other control measures such as larvicid-
ing and source reduction; and capacity building.
To overcome the problem of chloroquine-resistant
strains of malaria, central and local governments
will begin to use new combination drugs to improve
treatment success. Because these drugs are more
expensive, their distribution is targeted at areas with
a high prevalence of proven drug resistance.
Disease surveillance. Ensuring the timely flow of
data from health facilities, including hospitals, closer
monitoring of incidences of malaria to detect and
contain outbreaks, and organizing prevalence sur-
veys as needed are essential disease surveillance ac-
tivities. To accurately target interventions, including
rational insecticide spraying, research to determine
the types of mosquito populations and their habits
is needed. Ideally, each province will regularly survey
drug efficacy to monitor areas of parasite resistance
to anti-malaria drugs.
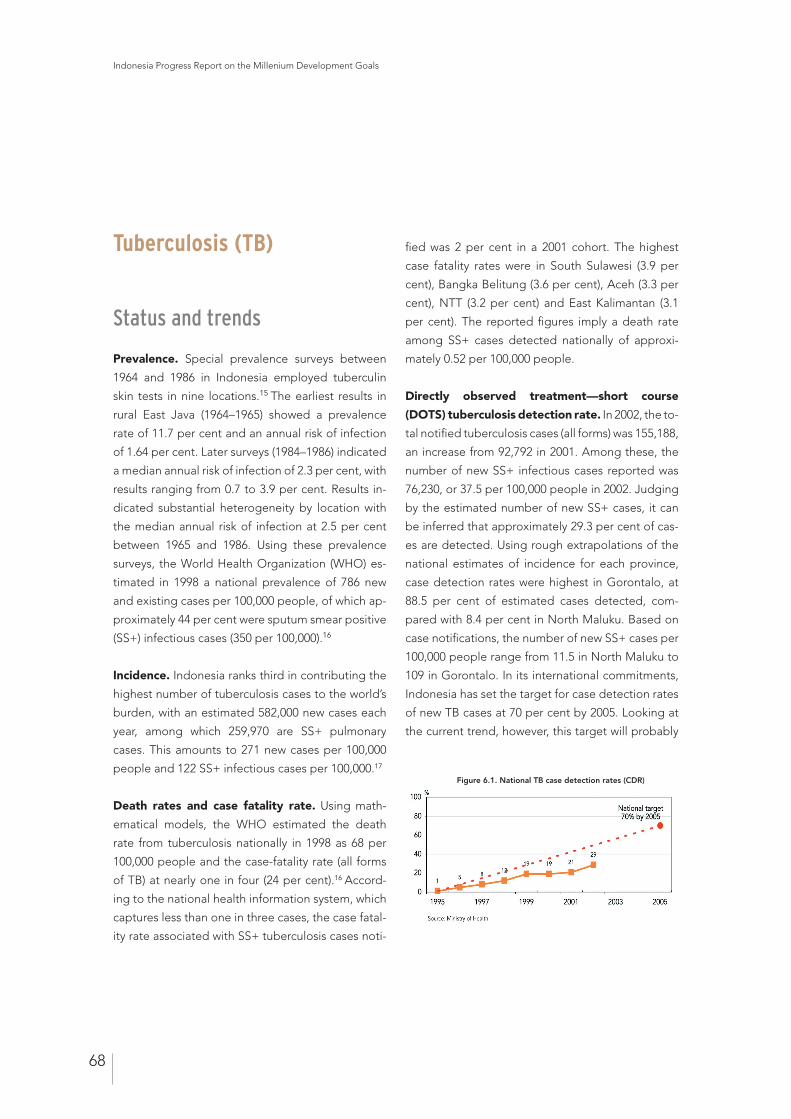
Indonesia Progress Report on the Millenium Development Goals
68
Tuberculosis (TB)
Status and trends
Prevalence. Special prevalence surveys between
1964 and 1986 in Indonesia employed tuberculin
skin tests in nine locations.15 The earliest results in
rural East Java (1964–1965) showed a prevalence
rate of 11.7 per cent and an annual risk of infection
of 1.64 per cent. Later surveys (1984–1986) indicated
a median annual risk of infection of 2.3 per cent, with
results ranging from 0.7 to 3.9 per cent. Results in-
dicated substantial heterogeneity by location with
the median annual risk of infection at 2.5 per cent
between 1965 and 1986. Using these prevalence
surveys, the World Health Organization (WHO) es-
timated in 1998 a national prevalence of 786 new
and existing cases per 100,000 people, of which ap-
proximately 44 per cent were sputum smear positive
(SS+) infectious cases (350 per 100,000).16
Incidence. Indonesia ranks third in contributing the
highest number of tuberculosis cases to the world’s
burden, with an estimated 582,000 new cases each
year, among which 259,970 are SS+ pulmonary
cases. This amounts to 271 new cases per 100,000
people and 122 SS+ infectious cases per 100,000.17
Death rates and case fatality rate. Using math-
ematical models, the WHO estimated the death
rate from tuberculosis nationally in 1998 as 68 per
100,000 people and the case-fatality rate (all forms
of TB) at nearly one in four (24 per cent).16 Accord-
ing to the national health information system, which
captures less than one in three cases, the case fatal-
ity rate associated with SS+ tuberculosis cases noti-
fied was 2 per cent in a 2001 cohort. The highest
case fatality rates were in South Sulawesi (3.9 per
cent), Bangka Belitung (3.6 per cent), Aceh (3.3 per
cent), NTT (3.2 per cent) and East Kalimantan (3.1
per cent). The reported figures imply a death rate
among SS+ cases detected nationally of approxi-
mately 0.52 per 100,000 people.
Directly observed treatment—short course
(DOTS) tuberculosis detection rate. In 2002, the to-
tal notified tuberculosis cases (all forms) was 155,188,
an increase from 92,792 in 2001. Among these, the
number of new SS+ infectious cases reported was
76,230, or 37.5 per 100,000 people in 2002. Judging
by the estimated number of new SS+ cases, it can
be inferred that approximately 29.3 per cent of cas-
es are detected. Using rough extrapolations of the
national estimates of incidence for each province,
case detection rates were highest in Gorontalo, at
88.5 per cent of estimated cases detected, com-
pared with 8.4 per cent in North Maluku. Based on
case notifications, the number of new SS+ cases per
100,000 people range from 11.5 in North Maluku to
109 in Gorontalo. In its international commitments,
Indonesia has set the target for case detection rates
of new TB cases at 70 per cent by 2005. Looking at
the current trend, however, this target will probably
Figure 6.1. National TB case detection rates (CDR)
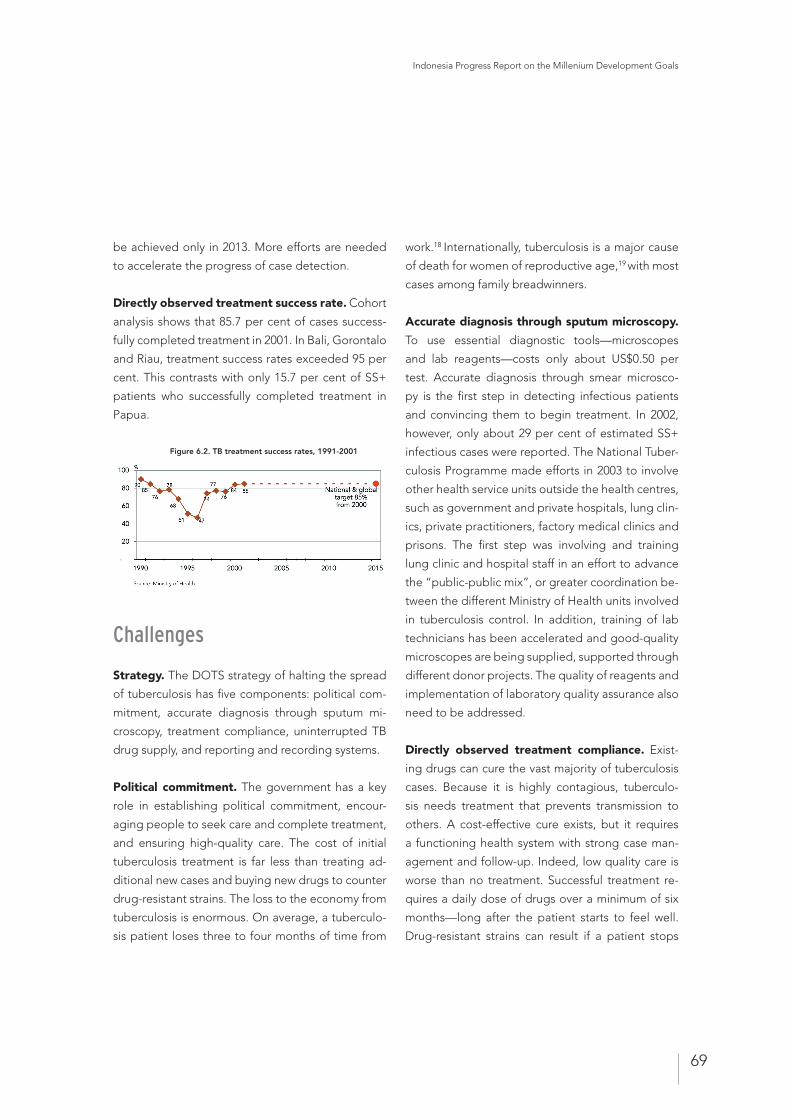
Indonesia Progress Report on the Millenium Development Goals
69
be achieved only in 2013. More efforts are needed
to accelerate the progress of case detection.
Directly observed treatment success rate. Cohort
analysis shows that 85.7 per cent of cases success-
fully completed treatment in 2001. In Bali, Gorontalo
and Riau, treatment success rates exceeded 95 per
cent. This contrasts with only 15.7 per cent of SS+
patients who successfully completed treatment in
Papua.
Challenges
Strategy. The DOTS strategy of halting the spread
of tuberculosis has five components: political com-
mitment, accurate diagnosis through sputum mi-
croscopy, treatment compliance, uninterrupted TB
drug supply, and reporting and recording systems.
Political commitment. The government has a key
role in establishing political commitment, encour-
aging people to seek care and complete treatment,
and ensuring high-quality care. The cost of initial
tuberculosis treatment is far less than treating ad-
ditional new cases and buying new drugs to counter
drug-resistant strains. The loss to the economy from
tuberculosis is enormous. On average, a tuberculo-
sis patient loses three to four months of time from
work.18 Internationally, tuberculosis is a major cause
of death for women of reproductive age,19 with most
cases among family breadwinners.
Accurate diagnosis through sputum microscopy.
To use essential diagnostic tools—microscopes
and lab reagents—costs only about US$0.50 per
test. Accurate diagnosis through smear microsco-
py is the first step in detecting infectious patients
and convincing them to begin treatment. In 2002,
however, only about 29 per cent of estimated SS+
infectious cases were reported. The National Tuber-
culosis Programme made efforts in 2003 to involve
other health service units outside the health centres,
such as government and private hospitals, lung clin-
ics, private practitioners, factory medical clinics and
prisons. The first step was involving and training
lung clinic and hospital staff in an effort to advance
the “public-public mix”, or greater coordination be-
tween the different Ministry of Health units involved
in tuberculosis control. In addition, training of lab
technicians has been accelerated and good-quality
microscopes are being supplied, supported through
different donor projects. The quality of reagents and
implementation of laboratory quality assurance also
need to be addressed.
Directly observed treatment compliance. Exist-
ing drugs can cure the vast majority of tuberculosis
cases. Because it is highly contagious, tuberculo-
sis needs treatment that prevents transmission to
others. A cost-effective cure exists, but it requires
a functioning health system with strong case man-
agement and follow-up. Indeed, low quality care is
worse than no treatment. Successful treatment re-
quires a daily dose of drugs over a minimum of six
months—long after the patient starts to feel well.
Drug-resistant strains can result if a patient stops
Figure 6.2. TB treatment success rates, 1991-2001
Indonesia Progress Report on the Millenium Development Goals
70
taking drugs before the treatment is complete, or
if the wrong drugs are given. Not only will this pa-
tient require different, more expensive drugs but
she or he will also remain infectious. Those newly
infected from this patient will acquire the drug-re-
sistant strains. Multi-drug resistance tuberculosis in
Indonesia, however, is estimated as less than 1 per
cent of total estimated cases.20 DOTS providers in
Indonesia are mainly family members. The National
Tuberculosis Programme is planning to embark on
further community involvement through the Com-
munity Based Initiative, or COMBI, approach in 2004
and will also be undertaking some operational re-
search about family members as DOTS providers.
Uninterrupted drug supply. Treatment compli-
ance is also affected by the drug supply, which must
be of good quality, regular and uninterrupted dur-
ing each patient’s treatment. TB drugs are catego-
rized as Very Essential Drugs so that their supply and
availability is secured by the central government.
Data comparing times when basic drugs were out
of stock in 2000 between public and private facilities
in 13 provinces indicated that, even before decen-
tralization, several basic drugs, including INH, were
out of stock in 1.8 per cent to 8.4 per cent of public
facilities. During the six months preceding the sur-
vey, the average number of weeks when drugs were
out of stock ranged from 3.6 to 7.8 weeks in public
facilities (Table 6.3).21 Fewer private facilities carried
the basic drugs evaluated but the average length of
time when drugs were out of stock was shorter com-
pared with public facilities. The major organizational
changes under the fiscal decentralization policies
implemented in 2001, and the concomitant changes
in roles and responsibilities at all levels in the system,
may interrupt drug procurement and system deliv-
ery. Efforts have been made to maintain an uninter-
rupted drug supply to health centres. A pilot project
of fixed dose combination (FDC) will be implement-
ed in Central Java, East Java, South Sulawesi and
Yogyakarta in 2004. In these pilot provinces, buffer
stock at the provincial level will be maintained at 100
per cent to ensure an uninterrupted supply.
Reporting and recording systems. Accurate in-
formation is central in determining the magnitude
and extent of the tuberculosis epidemic, the quality
and effectiveness of existing treatment regimes and
the extent of drug resistance. After the fiscal decen-
tralization policies were put into place, there were
problems with incomplete health information sys-
tem reporting from the districts. Centrally-conduct-
ed exercises began in 2002 to validate the record-
ing and reporting system from the peripheral health
service units. These validation exercises confirmed
higher treatment success rates compared with those
previously recorded. Existing health information
systems do not yet include cases detected in hos-
pitals and private-sector services. It will be crucial
to strengthen the existing surveillance systems and
prevalence surveys that employ physiologic testing,
which can establish the prevalence of tuberculosis
in Indonesia.
Policies and programmes
Gerdunas. The Government of Indonesia consid-
ers tuberculosis control a national health prior-
ity. In 1999, the Minister of Health established the
National Integrated Movement to Control TB, or
Gerdunas. Gerdunas is a cross-sectoral movement,
promoting the acceleration of tuberculosis control
measures and seeking an integrated approach to
tuberculosis control, involving the hospital and pri-
Indonesia Progress Report on the Millenium Development Goals
71
vate sector, and all other stakeholders, including
patient and community representatives. In 2001,
all provinces and districts had established Gerdu-
nas chapters, although not all are fully operational.
Also, the Five-Year Tuberculosis Control Strategic
Plan (2002–2006), which provides the foundation for
tuberculosis control activities nationwide, has been
developed.
International commitments. The Millennium De-
velopment Goals (MDGs) support existing politi-
cal commitments to halt and reverse the spread of
tuberculosis by 2015. Other important international
commitments include the Amsterdam Declaration
of 2000, in which the Ministry of Health agreed to
achieve a 70 per cent case detection rate and 85 per
cent treatment success by 2005. As proof of these
commitments, the Government of Indonesia con-
tributes considerably to financing tuberculosis con-
trol programs and has pledged US$19.8 million for
drugs and staff salaries, accounting for more than
half (54 per cent) of the estimated US$36.5 million
required for full programme implementation.
Tobacco
Status and trends
Prevalence. Tobacco use is a major contributor to
ill health among the poorest families in Indonesia.
In 2001, 31.5 per cent of Indonesian adults smoked,
the vast majority of them men. About 62.2 per cent
of male adults smoke regularly, with higher rates in
rural areas (67 per cent).22 At the provincial level, the
highest male smoking rates are in Gorontalo (69 per
cent) and the lowest in Bali (45.7 per cent).
Age of first use. In Indonesia, it is perceived that
people make an informed choice about whether
or not to smoke. About 70 per cent of Indonesian
smokers, however, start their habit before they are
19 years old, during a time when they may not have
the capacity to evaluate the health risks of smoking
and the highly addictive nature of nicotine.22
Challenges
The health burden. In Indonesia, tobacco use ac-
counted for a large proportion of the total burden of
disease. One of two smokers die of their habit and
half of these deaths occur during economically pro-
ductive years.23 Conclusive evidence shows that in-
fants and young children exposed to passive smoke
have increased rates of lower respiratory tract in-
fections, middle ear disease, chronic respiratory
symptoms, asthma, decreased lung function due to
reduced lung growth and an increased rate of sud-
den infant death syndrome (SIDS).24 Given that the
vast majority of smokers aged older than 10 years
smoke at home (91.8 per cent), it is estimated that
43 million Indonesian children are regularly exposed
to passive smoke.22
The economic burden. Tobacco not only inflicts
on society the cost of chronic care for those suf-
fering from lung cancer and other tobacco-related
illnesses, but it also decreases the productivity
of workers who smoke. The poor are harmed the
most by tobacco use. In 2001, the poorest Indo-
nesian households spent, on average, 9.1 per cent
of their monthly expenditure on tobacco products,
compared with 7.5 per cent among the wealthy.22
Spending scarce household resources on tobacco
products instead of food or other essential needs
can have a significant impact on the health and nu-
Indonesia Progress Report on the Millenium Development Goals
72
trition of poor families.25 The poor are also less likely
to be able to afford health insurance and health care
costs for chronic conditions associated with tobacco
use, such as lung cancer, cardiovascular disease and
hypertension.
Lack of resources. Despite this enormous health
burden, there is little financial support to advance
tobacco control. Outside of important analytical
work by the WHO and the World Bank, no major
donor supports tobacco control in Indonesia and
government resources to address this major health
issue are negligent.
Policies and programmes
The components of effective tobacco control in-
clude the following.
Keeping the price of tobacco products high. The
World Bank has concluded that a price rise of 10 per
cent would reduce the global demand for tobacco
products by between 4 and 8 per cent on average.26
Simulations showed that a 10 per cent price increase
worldwide (via an increase in taxes) would prevent
at least 10 million tobacco-related deaths globally.
Increasing the price of tobacco products, therefore,
is the single-most effective strategy for reducing the
devastating health burden of tobacco use. Indone-
sia has some of the lowest cigarette excise tax rates
in the region (averaging 31 per cent of the retail
price), next to Cambodia.22
Total bans on advertising, promotion and spon-
sorship. Advertising is a major public health issue
because tobacco advertising creates an environ-
ment where tobacco use is familiar and positive, and
encourages children to experiment with tobacco.27
Existing legislation in Indonesia enforces a partial
ban on daytime television advertising only.
Clean air laws. The majority of Indonesian adults
do not smoke. Clean air laws are needed to protect
both non-smoking adults and children exposed to
the carcinogens in environmental tobacco smoke.
Indonesia Progress Report on the Millenium Development Goals
73
Notes
1 Ministry of Health, Indonesia, 2002. Estimasi Nasional Infeksi HIV pada Orang Dewasa Indonesia Tahun 2002. Jakarta.
2 Ministry of Health, 2002. Rencana Strategis Penanggulangan HIV/AIDS Indonesia 2003–2007. Jakarta.
3 National AIDS Commission, May 2003. Country Report on Follow-Up to the Declaration of Commitment on HIV/AIDS (UNGASS). Reporting period 2001–2003.
4 Ministry of Health, Indonesia & BPS—Statistics Indonesia, 2002–2003. Behaviour Surveillance Survey of 15 Kabupaten/Kotamadya in 13 provinces.
5 United Nations, 2003. Indicators for Monitoring the Millennium Development Goals: Definitions, Rationale, Concept and Sources.
6 BPS—Statistics Indonesia & ORC Macro, 2003. Indonesia Demographic and Health Surveys (IDHS) 2002–2003. Maryland, USA.
7 UNICEF & BPS Statistics-Indonesia, 2000. Multi-Indicator Survey on the Education and Health of Mothers and Children. Indonesia.
8 National AIDS Commission. 2003 HIV/AIDS Country Progress Report.
9 Rachmat, Hakin, 2003. “HIV/AIDS Prevention Strategy for Children and Young People”. Presentation at IFPPD Meeting, Ministry of Health, Indonesia, November 2003.
10 Ahmadi, U. Fahmi, 2003. Combating HIV/AIDS, Malaria and other Diseases. Presentation paper for MDG Working Group.
11 Development of Rollback Malaria Model in Indonesia: Strategic Plan 2001–2005. Population exposure estimates based on 46.2 per cent of the 1998 population.
12 National Institute for Health Research and Development, 2001. National Household Health Survey 2001 (Survei Kesehatan Rumah Tangga, SKRT). Ministry of Health, Indonesia, Jakarta.
13 Development of Rollback Malaria Model in Indonesia: Strategic Plan 2001–2005. Population exposure estimates based on 46.2 per cent of the 1998 population
14 Such as in Banyumas District. This area had been declared safe from malaria since the last 15 years.
15 Cauthen, G.M., Pio, A., & ten Dam, H.G., 1988. Annual Risk of Tuberculosis Infection. WHO/TB/88.154. WHO, Geneva.
16 Dye, C., Scheele, S., Dolin, P., et al, 1999. Global Burden of Tuberculosis: Estimates of Incidence, Prevalence, and Mortality by Country. JAMA 282:7.
17 Global Tuberculosis Control, WHO 2003 http://www.who.int/gtb/publications/globrep/index.html .
18 Ministry of Health, Indonesia. TB strategic plan 2002–2008.
19 Connolly, N. & Nunn, P., 1996. Women and Tuberculosis. World Health Stat Q. 49(2): 115–9
20 Dye, C., Espinal, M., Watt, C., Mbiaga, C., & Williams, B.G., 2002. Worldwide Incidence of Multi-drug Resistance Tuberculosis. Journal of Infectious Diseases, 185: 1197–202.
21 Beegle, et al 2001. Analysis of the IFLS.22 Ministry of Health, Indonesia, 2003. The Tobacco Sourcebook:
The empirical basis for a national tobacco control strategy. 23 World Bank, 1999. Curbing the Epidemic: governments and
the economics of tobacco control. http://www1.worldbank.org/tobacco/reports.htm
24 WHO, 1999. International Consultation on Environmental Tobacco Smoke and Child Health. NCD/TFI/ETS/99. http://www.who.int/tobacco/health_impact/youth/ets/en/
25 de Bayer, Lovelace, & Yurekli, 2001. Poverty and Tobacco. Tobacco Control 10. http://tc.bmjjournals.com/cgi/content/full/10/3/210
26 World Bank, 2002. Tobacco Control in Developing Countries. http://www1.worldbank.org/tobacco/tcdc/fact_sheets/Tobacco%20Facts1-6.pdf
27 US Surgeon General’s Report 1989. Reducing the Health Consequences of Smoking; and Smoking and Health: A National Status Report 1990. http://www.cdc.gov/tobacco/sgrpage.htm#1980s

Indonesia Progress Report on the Millenium Development Goals
74
Indonesia Progress Report on the Millenium Development Goals
75
GOAL 7
Ensuring environmental sustainability
Indonesia Progress Report on the Millenium Development Goals
76
Goal 7: Ensuring environmental sustainability
Status and trends
Declining proportion of forested areas. In 2002,
the Ministry of Forestry demarcated 91.22 million
hectares as forested area, which does not include
three provinces still in the process of demarcation
(Central Kalimantan, North Sumatra and Riau). Sat-
ellite dataa from 1999–2000 show Indonesia to have
72 million hectares of forested area, the rest being
non-forested or areas without data. Ministry of For-
estry data (Table 7.1) indicate a decrease in forested
area from 130.1 to 123.4 million hectares over the
period 1993 to 2001, with the proportion of forest
to total land area dropping from 67.7 to 64.2 per
cent. Reasons for the decrease include plundering,
conversion of forested land to other uses and fire.
Between 1985 and 1997, the rate of deforestation in
Kalimantan, Maluku, Papua, Sulawesi and Sumatra
was 1.8 million hectares a year. The economic crisis
and decentralization probably accelerated this rate,
raising serious concerns about ecology and water-
shed management.
Categories of protected areas. Protected areas
are defined as areas dedicated to the protection
and maintenance of biodiversity and ecology. Parks
and conservation areas in Indonesia are classified as
either totally protected areas (national parks, nature
reserves and wildlife reserves) or partially protected
areas (forest parks, hunting parks and natural recre-
ation parks).
Ratio of protected areas. In 2000, the total pro-
tected land areab in Indonesia was 50.68 million
hectares (comprising 32.34 million hectares of pro-
tected forest and 18.34 million hectares of con-
servation land areas), or 26.4 per cent of the total
land area of Indonesia (Table 7.2).1 The bio-region
of Papua has the highest proportion of protected
areas (41.3 per cent), followed by Sulawesi (32.8 per
cent), Maluku (26.6 per cent), Nusa Tenggara (24.4
per cent), Sumatra (23.5 per cent) and Kalimantan
(19.5 per cent). The lowest proportion is in Java-Bali
(9.5 per cent). Being an archipelago, Indonesia also
has a significant proportion of protected maritime
areas (4.7 million hectares), which include nature
Target 9: Integrate the principles of sustainable development into country policies and programmes and reverse the loss of environmental resourcesIndicators used: • Proportion of land area covered by forest• Ratio of area protected to maintain biological diversity to surface area• Energy use (barrel oil equivalent) per million rupiah GDP• Emissions of carbon dioxide-carbon dioxide equivalents per capita• Consumption of ozone-depleting CFCs (metric tons)• Proportion of population by type of cooking fuel used• Proportion of population using biomass as cooking fuel
a This data comes from 7 ETM + Landsat imagery.b The protected land areas are 61.6 per cent national parks, 19.2 per cent wildlife reserves, 14.6 per cent nature reserves, 1.8 per cent forest parks, 1.5 per cent natural recreation parks and 1.2 per cent hunting parks.
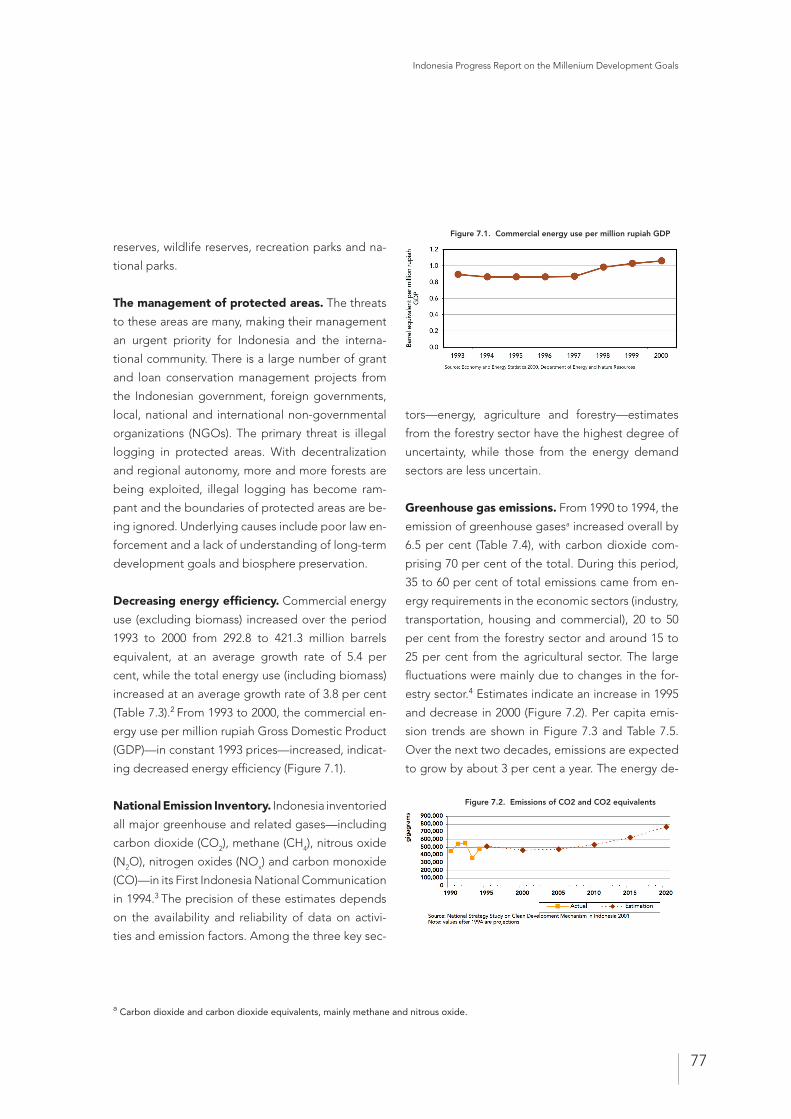
Indonesia Progress Report on the Millenium Development Goals
77
reserves, wildlife reserves, recreation parks and na-
tional parks.
The management of protected areas. The threats
to these areas are many, making their management
an urgent priority for Indonesia and the interna-
tional community. There is a large number of grant
and loan conservation management projects from
the Indonesian government, foreign governments,
local, national and international non-governmental
organizations (NGOs). The primary threat is illegal
logging in protected areas. With decentralization
and regional autonomy, more and more forests are
being exploited, illegal logging has become ram-
pant and the boundaries of protected areas are be-
ing ignored. Underlying causes include poor law en-
forcement and a lack of understanding of long-term
development goals and biosphere preservation.
Decreasing energy efficiency. Commercial energy
use (excluding biomass) increased over the period
1993 to 2000 from 292.8 to 421.3 million barrels
equivalent, at an average growth rate of 5.4 per
cent, while the total energy use (including biomass)
increased at an average growth rate of 3.8 per cent
(Table 7.3).2 From 1993 to 2000, the commercial en-
ergy use per million rupiah Gross Domestic Product
(GDP)—in constant 1993 prices—increased, indicat-
ing decreased energy efficiency (Figure 7.1).
National Emission Inventory. Indonesia inventoried
all major greenhouse and related gases—including
carbon dioxide (CO2), methane (CH4), nitrous oxide
(N2O), nitrogen oxides (NOx) and carbon monoxide
(CO)—in its First Indonesia National Communication
in 1994.3 The precision of these estimates depends
on the availability and reliability of data on activi-
ties and emission factors. Among the three key sec-
tors—energy, agriculture and forestry—estimates
from the forestry sector have the highest degree of
uncertainty, while those from the energy demand
sectors are less uncertain.
Greenhouse gas emissions. From 1990 to 1994, the
emission of greenhouse gasesa increased overall by
6.5 per cent (Table 7.4), with carbon dioxide com-
prising 70 per cent of the total. During this period,
35 to 60 per cent of total emissions came from en-
ergy requirements in the economic sectors (industry,
transportation, housing and commercial), 20 to 50
per cent from the forestry sector and around 15 to
25 per cent from the agricultural sector. The large
fluctuations were mainly due to changes in the for-
estry sector.4 Estimates indicate an increase in 1995
and decrease in 2000 (Figure 7.2). Per capita emis-
sion trends are shown in Figure 7.3 and Table 7.5.
Over the next two decades, emissions are expected
to grow by about 3 per cent a year. The energy de-
Figure 7.1. Commercial energy use per million rupiah GDP
Figure 7.2. Emissions of CO2 and CO2 equivalents
a Carbon dioxide and carbon dioxide equivalents, mainly methane and nitrous oxide.
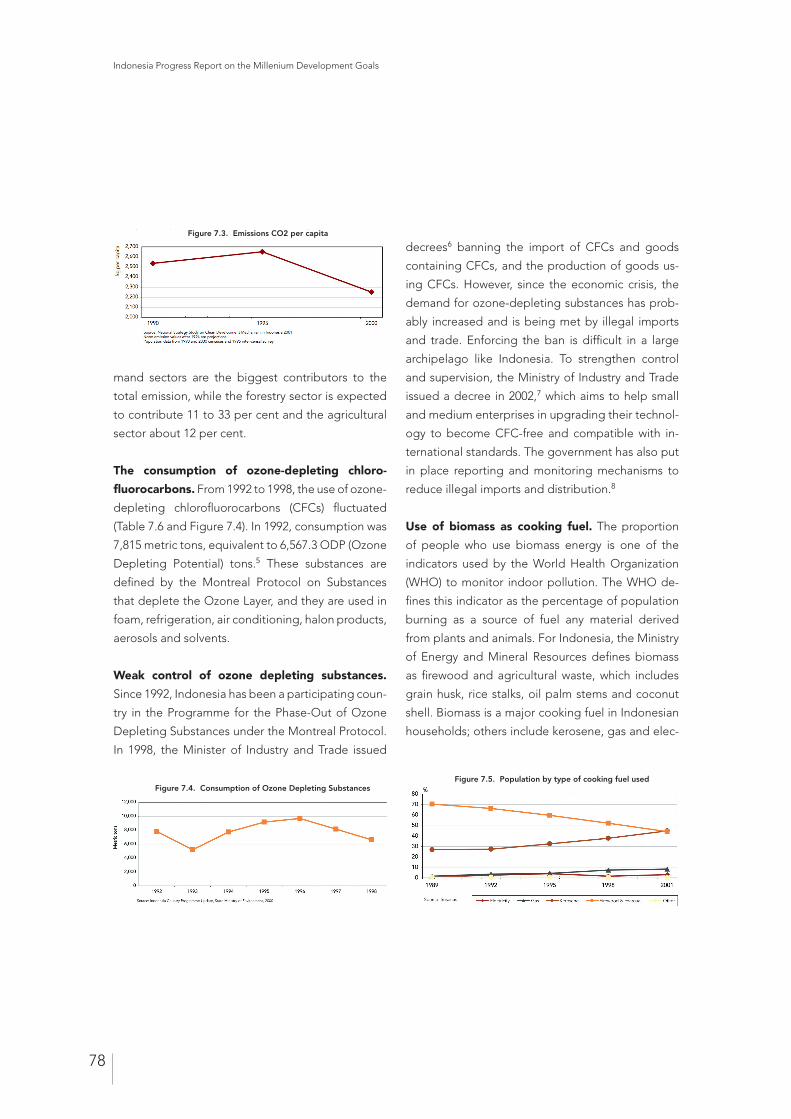
Indonesia Progress Report on the Millenium Development Goals
78
mand sectors are the biggest contributors to the
total emission, while the forestry sector is expected
to contribute 11 to 33 per cent and the agricultural
sector about 12 per cent.
The consumption of ozone-depleting chloro-
fluorocarbons. From 1992 to 1998, the use of ozone-
depleting chlorofluorocarbons (CFCs) fluctuated
(Table 7.6 and Figure 7.4). In 1992, consumption was
7,815 metric tons, equivalent to 6,567.3 ODP (Ozone
Depleting Potential) tons.5 These substances are
defined by the Montreal Protocol on Substances
that deplete the Ozone Layer, and they are used in
foam, refrigeration, air conditioning, halon products,
aerosols and solvents.
Weak control of ozone depleting substances.
Since 1992, Indonesia has been a participating coun-
try in the Programme for the Phase-Out of Ozone
Depleting Substances under the Montreal Protocol.
In 1998, the Minister of Industry and Trade issued
decrees6 banning the import of CFCs and goods
containing CFCs, and the production of goods us-
ing CFCs. However, since the economic crisis, the
demand for ozone-depleting substances has prob-
ably increased and is being met by illegal imports
and trade. Enforcing the ban is difficult in a large
archipelago like Indonesia. To strengthen control
and supervision, the Ministry of Industry and Trade
issued a decree in 2002,7 which aims to help small
and medium enterprises in upgrading their technol-
ogy to become CFC-free and compatible with in-
ternational standards. The government has also put
in place reporting and monitoring mechanisms to
reduce illegal imports and distribution.8
Use of biomass as cooking fuel. The proportion
of people who use biomass energy is one of the
indicators used by the World Health Organization
(WHO) to monitor indoor pollution. The WHO de-
fines this indicator as the percentage of population
burning as a source of fuel any material derived
from plants and animals. For Indonesia, the Ministry
of Energy and Mineral Resources defines biomass
as firewood and agricultural waste, which includes
grain husk, rice stalks, oil palm stems and coconut
shell. Biomass is a major cooking fuel in Indonesian
households; others include kerosene, gas and elec-
Figure 7.3. Emissions CO2 per capita
Figure 7.4. Consumption of Ozone Depleting Substances Figure 7.5. Population by type of cooking fuel used
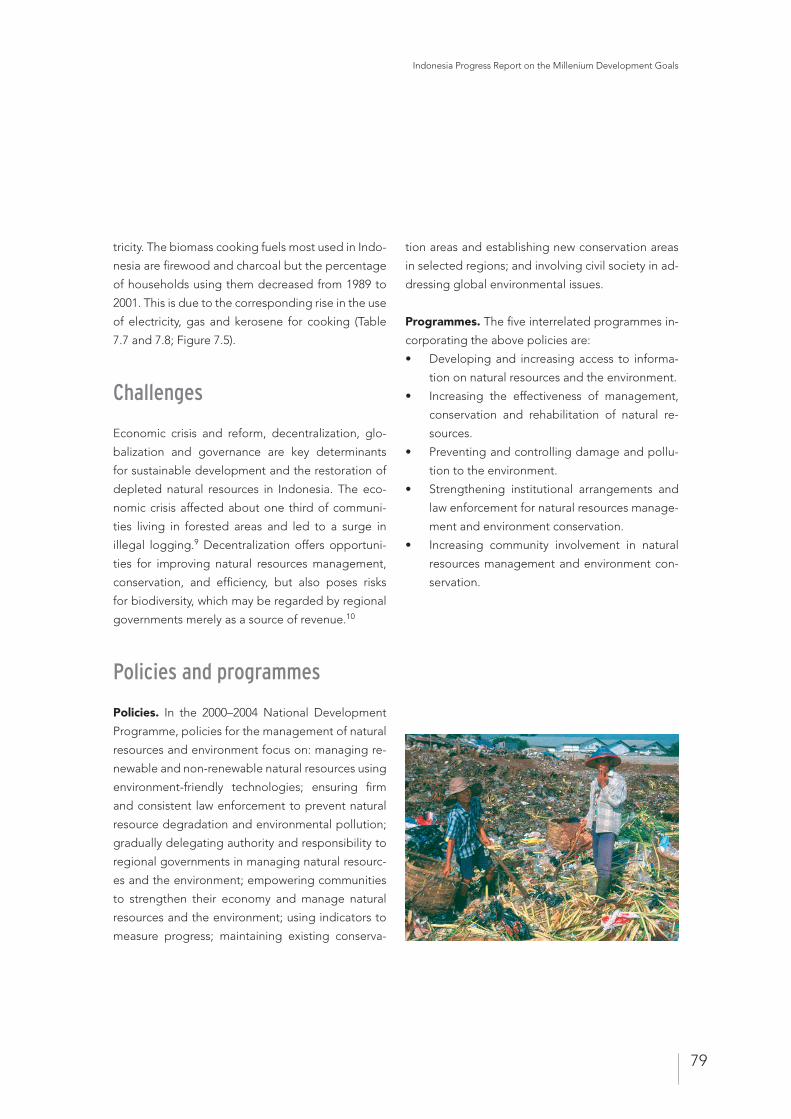
Indonesia Progress Report on the Millenium Development Goals
79
tricity. The biomass cooking fuels most used in Indo-
nesia are firewood and charcoal but the percentage
of households using them decreased from 1989 to
2001. This is due to the corresponding rise in the use
of electricity, gas and kerosene for cooking (Table
7.7 and 7.8; Figure 7.5).
Challenges
Economic crisis and reform, decentralization, glo-
balization and governance are key determinants
for sustainable development and the restoration of
depleted natural resources in Indonesia. The eco-
nomic crisis affected about one third of communi-
ties living in forested areas and led to a surge in
illegal logging.9 Decentralization offers opportuni-
ties for improving natural resources management,
conservation, and efficiency, but also poses risks
for biodiversity, which may be regarded by regional
governments merely as a source of revenue.10
Policies and programmes
Policies. In the 2000–2004 National Development
Programme, policies for the management of natural
resources and environment focus on: managing re-
newable and non-renewable natural resources using
environment-friendly technologies; ensuring firm
and consistent law enforcement to prevent natural
resource degradation and environmental pollution;
gradually delegating authority and responsibility to
regional governments in managing natural resourc-
es and the environment; empowering communities
to strengthen their economy and manage natural
resources and the environment; using indicators to
measure progress; maintaining existing conserva-
tion areas and establishing new conservation areas
in selected regions; and involving civil society in ad-
dressing global environmental issues.
Programmes. The five interrelated programmes in-
corporating the above policies are:
• Developing and increasing access to informa-
tion on natural resources and the environment.
• Increasing the effectiveness of management,
conservation and rehabilitation of natural re-
sources.
• Preventing and controlling damage and pollu-
tion to the environment.
• Strengthening institutional arrangements and
law enforcement for natural resources manage-
ment and environment conservation.
• Increasing community involvement in natural
resources management and environment con-
servation.
Indonesia Progress Report on the Millenium Development Goals
80
Status and trends
Water
Definitions. While there are no criteria for defining
sustainable access, there are several definitions for
“improved water source.” The status of coverage in
Indonesia varies according to the definitions used:
1. Percentage of households using piped water, a
definition regarded as the most reliable and clos-
est to health standards.
2. Percentage of population using water from “im-
proved sources” more than 10 meters away from
an excreta disposal site. The “improved sources”
include: piped water, pumped water, packaged
water, water from a protected well or protected
spring or rain water.
3. Percentage of households using water from the
“improved sources” defined as above but re-
gardless of distance from excreta disposal sites.
This definition is most likely to include contami-
nated water.
Indonesia still has very low coverage in piped water
(definition 1) and progress has been negligible over
the past decade. If definition 2 is used, currently
only 50 per cent of the population have access to
water from improved sources (Figure 7.6 and Tables
7.9a,b,c).
Non-compliance with drinking water standards.a
The quality of water supplied to communities by re-
gional drinking water companies (PDAMs) does not
comply with Ministry of Health drinking-water stan-
dards. Rather, it is better described as clean water.b
While the PDAMs water has been treated for direct
drinking from the tap, the poor condition of distri-
bution networks and the irregular nature of services
lead to contamination, and that water is no longer
safe for direct drinking. Investment is needed to
improve the distribution, the carrying capacity and
regularity of services.
Lack of government priority. It was agreed at the
2002 World Summit on Sustainable Development
that water is a human right.11 But in Indonesia, the
provision of drinking water is not a development
priority, particularly among regional governments.
While the management of this function has been
delegated to district and city governments, financ-
ing mechanisms for drinking-water facilities and in-
frastructure are still centralized and the central gov-
ernment is still regarded as fully responsible for the
a Terminology used follows the draft government decree on Drinking Water and National Policy on Community Based Drinking Water and Environmental Sanitation.b The Decree from the Ministry of Health No. 907, 2002 defines drinking water as treated or untreated water that meets health requirements and can be drunk directly. Clean water is defined as water used for daily needs, which meets health requirements and can be drunk after being boiled.
Target 10: Halve, by 2015, the proportion of people without sustainable access to safe drinking water and basic sanitation
Indicators used: • Proportion of population with sustainable access to an improved water source• Proportion of population with access to improved sanitation
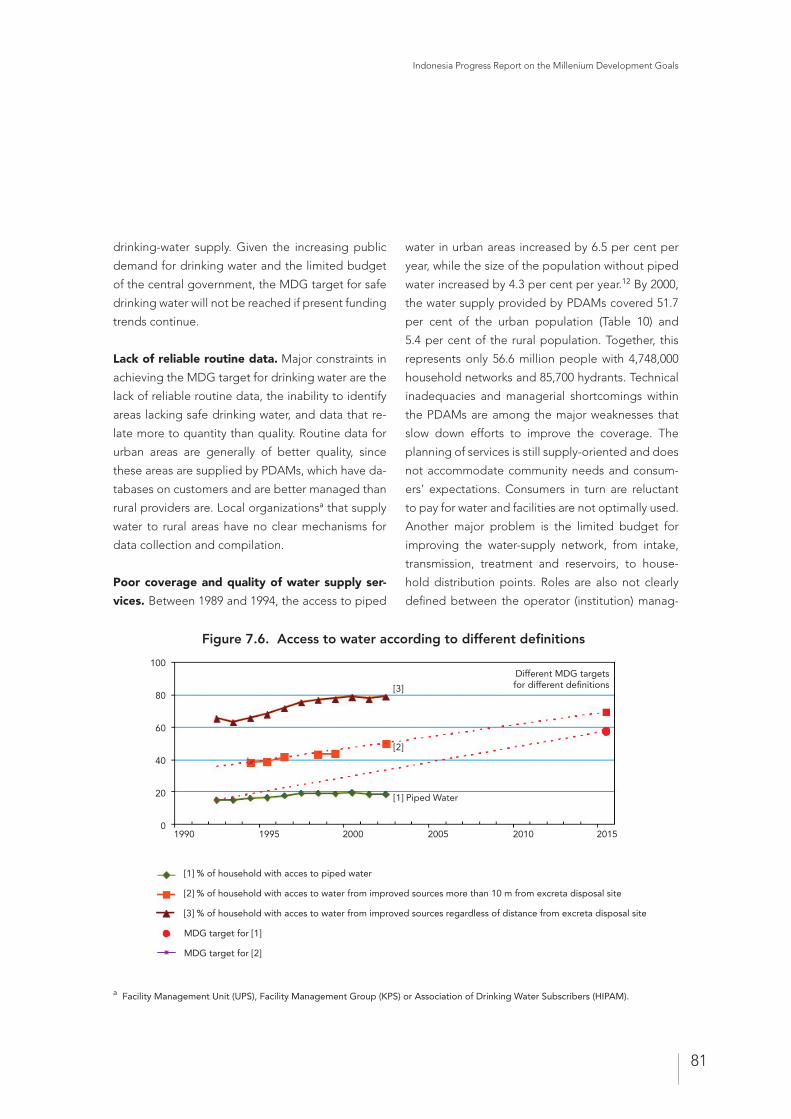
Indonesia Progress Report on the Millenium Development Goals
81
drinking-water supply. Given the increasing public
demand for drinking water and the limited budget
of the central government, the MDG target for safe
drinking water will not be reached if present funding
trends continue.
Lack of reliable routine data. Major constraints in
achieving the MDG target for drinking water are the
lack of reliable routine data, the inability to identify
areas lacking safe drinking water, and data that re-
late more to quantity than quality. Routine data for
urban areas are generally of better quality, since
these areas are supplied by PDAMs, which have da-
tabases on customers and are better managed than
rural providers are. Local organizationsa that supply
water to rural areas have no clear mechanisms for
data collection and compilation.
Poor coverage and quality of water supply ser-
vices. Between 1989 and 1994, the access to piped
water in urban areas increased by 6.5 per cent per
year, while the size of the population without piped
water increased by 4.3 per cent per year.12 By 2000,
the water supply provided by PDAMs covered 51.7
per cent of the urban population (Table 10) and
5.4 per cent of the rural population. Together, this
represents only 56.6 million people with 4,748,000
household networks and 85,700 hydrants. Technical
inadequacies and managerial shortcomings within
the PDAMs are among the major weaknesses that
slow down efforts to improve the coverage. The
planning of services is still supply-oriented and does
not accommodate community needs and consum-
ers’ expectations. Consumers in turn are reluctant
to pay for water and facilities are not optimally used.
Another major problem is the limited budget for
improving the water-supply network, from intake,
transmission, treatment and reservoirs, to house-
hold distribution points. Roles are also not clearly
defined between the operator (institution) manag-
a Facility Management Unit (UPS), Facility Management Group (KPS) or Association of Drinking Water Subscribers (HIPAM).
Figure 7.6. Access to water according to different definitions
100
80
60
40
20
01990 1995 2000 2005 2010 2015
Different MDG targets for different definitions[3]
[2]
[1] Piped Water
[1] % of household with acces to piped water
[2] % of household with acces to water from improved sources more than 10 m from excreta disposal site
[3] % of household with acces to water from improved sources regardless of distance from excreta disposal site
MDG target for [1]
MDG target for [2]
Indonesia Progress Report on the Millenium Development Goals
82
ing the water services and the regulator making the
rules. The lack of independence in determining and
managing investment programmes has led many
PDAMs to financial difficulties. At present, 201 out
of 293 PDAMs are in debt, owing a total sum of Ru-
piah 4.2 trillion.
High levels of unaccounted for water. “Unac-
counted-for water,” also known as water leakage, is
water that does not generate income for PDAMs. In
2000, the leakage rate for PDAMs varied between
22 and 43 per cent, with an average of 36 per cent.
The leakage may be due to poor governance and
management, such as water theft and weaknesses in
recording, or to technical reasons, such as physical
leakages within the network. Efforts to reduce the
leakage include technical training, salary restructur-
ing, monitoring and pipeline replacement. Cutting
back the leakage linked to poor management is less
costly and can be tackled through measures such as
improving managerial skills.
Investments required for drinking water. In 2000,
the installed capacity reached 95,000 litre/second.
To achieve the target of 168,000 litre/second in
2015, required to meet the MDG target for drinking
water based on PDAMs calculations, an extra 93,000
litre/second is needed. Calculations based on facili-
ties and infrastructure requirements for safe drink-
ing water show that a special budget of Rupiah 42.8
trillion will be needed for drinking-water services up
to 2015—in other words, Rupiah 3.3 trillion a year.a
Also, institutional capacity building requirements for
the sector up to 2015 are estimated at US$40 per
capita. The budget increases are necessary to repair
and improve existing systems, and build new facili-
ties and infrastructure for safe drinking water.
Limited involvement of the private sector. In-
volvement of the private sector has so far been lim-
ited: only six private water supply companies are op-
erating. This is partly because of the uncertainty of
laws regulating privatization and public-private part-
nerships in building and developing water services.
Clear-cut laws and a guarantee of law enforcement
will be critical, since the construction and develop-
ment of water-supply systems are long-term invest-
ments requiring substantial funds.
Deteriorating quality and quantity of primary wa-
ter resources. Environmental degradation greatly
affects the quality and quantity of primary water
resources. The availability of water from primary
sources in Java and Bali has reached a critical point.
Decentralization has exacerbated the situation: the
authority of the regional water-supply companies
extends only to the boundaries of each region, mak-
ing it difficult for regions that do not have a primary
water source. Factors affecting water quality include
rapid industrialization, particularly in urban areas;
population density; and pollution from household
and industrial waste, mining and pesticides.
Low levels of community awareness. The low level
of access to safe water in rural area—resulting in di-
arrhoea, skin diseases and other illnesses—is related
to low community awareness. Several water-supply
projectsb include awareness raising and there are
also projects implemented by communities them-
selves with NGO assistance. But further promotional
activities and campaigns are still needed, as well as
technical guidance to communities on using, oper-
ating and maintaining water-supply facilities.
a Assumes a population growth rate of 1.63 per cent a year up to 2015; and an exchange rate of Rupiah 8,500 for US$1.b WSLIC 2 (Water and Sanitation for Low Income Communities – Phase 2), ProAir (Clean Water Supply for Rural Areas in NTT), Rural Water Supply in NTB and NTT, and CWSH (Community Water Services and Health).
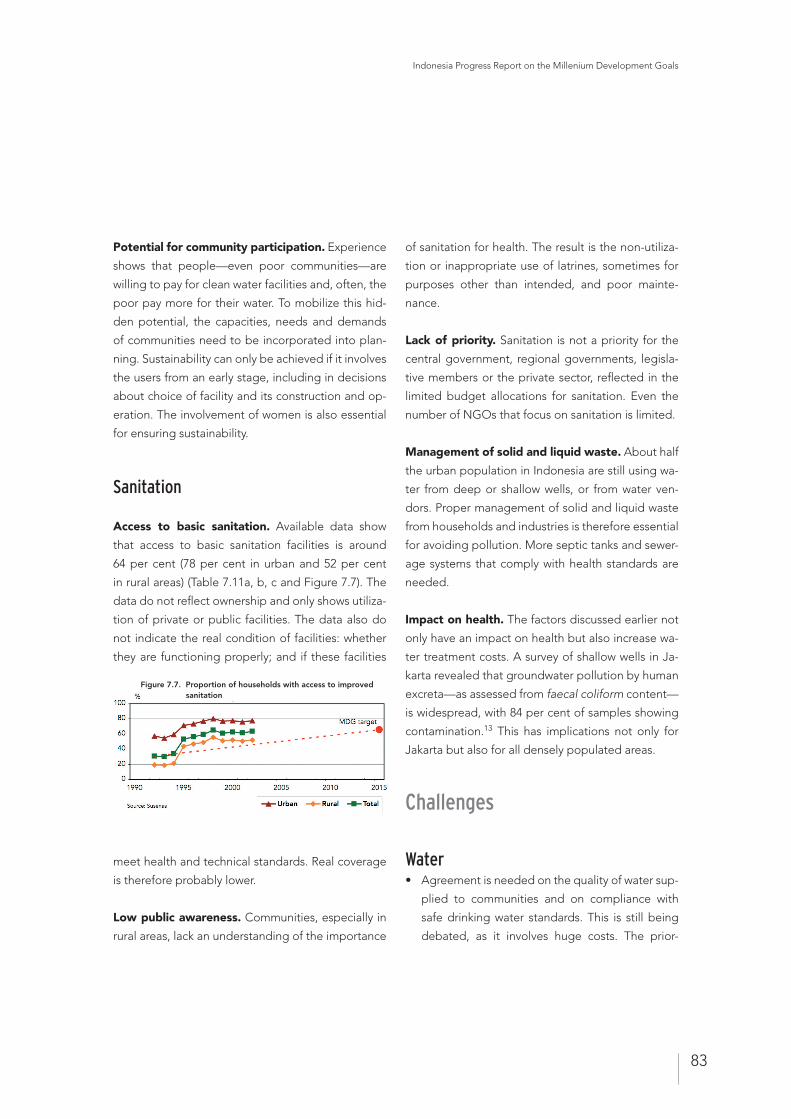
Indonesia Progress Report on the Millenium Development Goals
83
Potential for community participation. Experience
shows that people—even poor communities—are
willing to pay for clean water facilities and, often, the
poor pay more for their water. To mobilize this hid-
den potential, the capacities, needs and demands
of communities need to be incorporated into plan-
ning. Sustainability can only be achieved if it involves
the users from an early stage, including in decisions
about choice of facility and its construction and op-
eration. The involvement of women is also essential
for ensuring sustainability.
Sanitation
Access to basic sanitation. Available data show
that access to basic sanitation facilities is around
64 per cent (78 per cent in urban and 52 per cent
in rural areas) (Table 7.11a, b, c and Figure 7.7). The
data do not reflect ownership and only shows utiliza-
tion of private or public facilities. The data also do
not indicate the real condition of facilities: whether
they are functioning properly; and if these facilities
meet health and technical standards. Real coverage
is therefore probably lower.
Low public awareness. Communities, especially in
rural areas, lack an understanding of the importance
of sanitation for health. The result is the non-utiliza-
tion or inappropriate use of latrines, sometimes for
purposes other than intended, and poor mainte-
nance.
Lack of priority. Sanitation is not a priority for the
central government, regional governments, legisla-
tive members or the private sector, reflected in the
limited budget allocations for sanitation. Even the
number of NGOs that focus on sanitation is limited.
Management of solid and liquid waste. About half
the urban population in Indonesia are still using wa-
ter from deep or shallow wells, or from water ven-
dors. Proper management of solid and liquid waste
from households and industries is therefore essential
for avoiding pollution. More septic tanks and sewer-
age systems that comply with health standards are
needed.
Impact on health. The factors discussed earlier not
only have an impact on health but also increase wa-
ter treatment costs. A survey of shallow wells in Ja-
karta revealed that groundwater pollution by human
excreta—as assessed from faecal coliform content—
is widespread, with 84 per cent of samples showing
contamination.13 This has implications not only for
Jakarta but also for all densely populated areas.
Challenges
Water• Agreement is needed on the quality of water sup-
plied to communities and on compliance with
safe drinking water standards. This is still being
debated, as it involves huge costs. The prior-
Figure 7.7. Proportion of households with access to improved sanitation
Indonesia Progress Report on the Millenium Development Goals
84
ity is to ensure access to water of a quality that
communities themselves can treat at reasonable
cost, by boiling or filtering to make it suitable for
drinking.
• PDAMs need to increase the independence of
management to operate efficiently and improve
accountability.
• Key challenges include: ensuring that planning
is linked to demand; mobilizing funds through
investment, government budget allocations or
through setting rates according to production
costs and consumer capacity; improving service
quality to communities; and promoting health
and hygiene among communities to create a de-
mand for and increase ownership of safe water
facilities.
• A budget of Rupiah 42.8 trillion up to 2015, or Ru-
piah 3.3 trillion a year, is needed to increase the
supply capacity for drinking-water services. The
challenge for the government will be to use the
available funds strategically. Given the limited
government budget, it will be crucial to increase
the participation of businesses, the private sector
and communities in water-supply investment and
to mobilize funds from communities.
• More community involvement is needed in plan-
ning, developing and operating water-supply
services.
• A valid and accurate database for both urban
and rural areas still does not exist and will be
needed for measuring progress towards MDG
achievement.
Sanitation
• One of the challenges is to improve the quality of
sanitation facilities to meet technical and health
standards, while ensuring that communities can
maintain them easily.
• Another is to raise awareness among communities
on health and hygiene issues and the importance
of using proper latrines. The central and regional
governments, legislators and the private sector
also need to be mobilized to provide greater
support to sanitation.
Policies and programmes
Water
Policies. To address issues of safe drinking water,
policies include:
• Developing an action plan and strategies to
achieve the MDG targets.
• Developing alternative financial resources for
drinking-water facilities and infrastructure,
through local governments. This means setting
up a more conducive business environment,
providing clear and transparent laws and regula-
tions, enforcing laws, and adjusting financing sys-
tems in accordance with the capacities of com-
munities. It also means issuing municipal bonds
supported by local governments and/or through
securitization; selling PDAMs shares to the com-
munity and private sector; and improving tariff
mechanisms for independent, self-supporting
operations of water suppliers.
• Protecting primary water resources across sec-
tors and regions, through water board authorities
that comprise all stakeholders, and developing
conservation programmes for the environment
and water resources.
Indonesia Progress Report on the Millenium Development Goals
85
• Improving the technical and management skills
of the PDAMs and clearly separating the func-
tions of operator and regulator.
• Empowering rural communities through public
education and campaigns; strengthening the
role and ownership of rural communities in pro-
viding and managing water resources, through
an investment-sharing approach; giving techni-
cal assistance and training to rural communities
in operating and maintaining water infrastruc-
ture and facilities, and in water management.
• Improving, monitoring and evaluating systems
using a participatory approach and applying
these approaches in policies to improve data
systems.
Programmes. Developed and implemented by the
Government of Indonesia, programmes include:
• Drafting and socializing the National Policy on
Development of Drinking Water Infrastructure
and Facilities and Environmental Sanitation,
which aims to help local governments in achiev-
ing MDG targets.
• Assisting PDAMs in improving their performance
and professionalism.
• Increasing the active role of communities
through an investment-sharing approach in ru-
ral drinking-water projects, where technical as-
sistance and training are given to communities
to operate, maintain and manage water facilities
and infrastructures. The central and local gov-
ernments are expected to replicate these activi-
ties, including in urban areas.
• Developing databases for water service cover-
age in urban and rural areas.
Sanitation
Policies. Sanitation policies include:
• Raising awareness of sanitation as a basic need
among government decision-makers and leg-
islators, the private sector and communities—
through sustained public campaigns, media
and educational programmes, and through the
implementation of pilot projects to demonstrate
success and achievability.
• Encouraging the use of latrines by making avail-
able basic sanitation infrastructure models that
are affordable, efficient and easy to maintain.
• Developing strategies for achieving the MDG
targets, including an action plan.
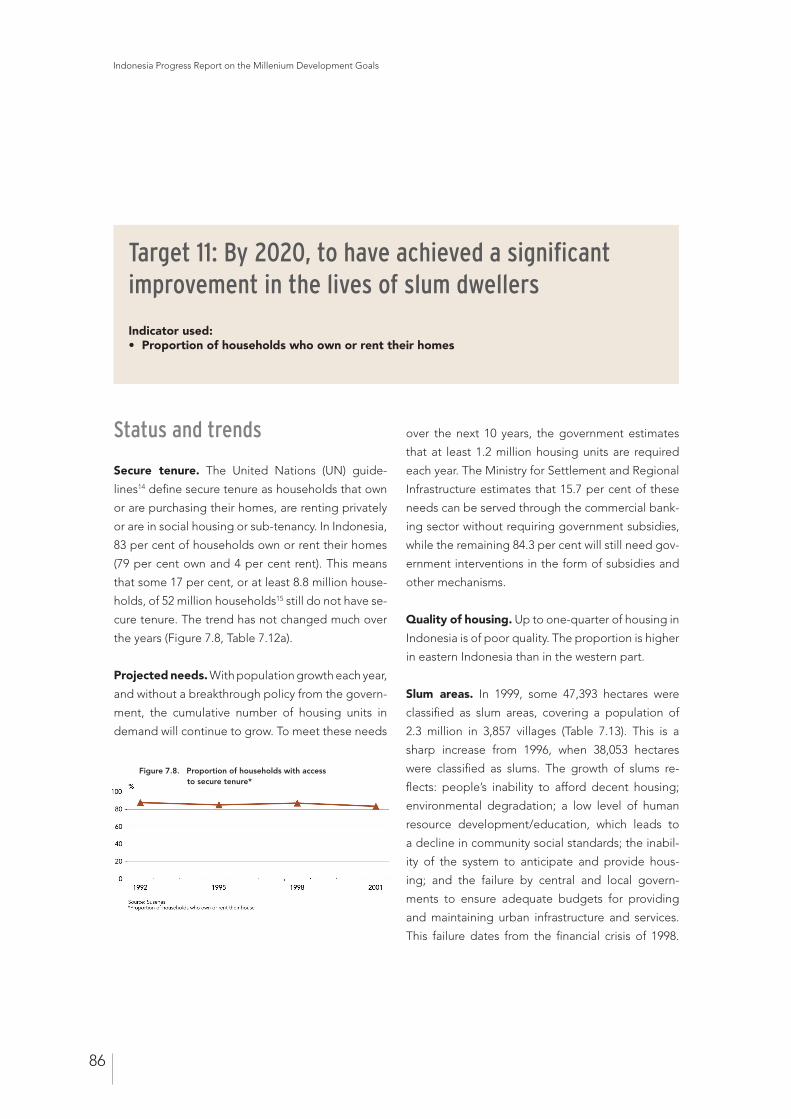
Indonesia Progress Report on the Millenium Development Goals
86
Status and trends
Secure tenure. The United Nations (UN) guide-
lines14 define secure tenure as households that own
or are purchasing their homes, are renting privately
or are in social housing or sub-tenancy. In Indonesia,
83 per cent of households own or rent their homes
(79 per cent own and 4 per cent rent). This means
that some 17 per cent, or at least 8.8 million house-
holds, of 52 million households15 still do not have se-
cure tenure. The trend has not changed much over
the years (Figure 7.8, Table 7.12a).
Projected needs. With population growth each year,
and without a breakthrough policy from the govern-
ment, the cumulative number of housing units in
demand will continue to grow. To meet these needs
over the next 10 years, the government estimates
that at least 1.2 million housing units are required
each year. The Ministry for Settlement and Regional
Infrastructure estimates that 15.7 per cent of these
needs can be served through the commercial bank-
ing sector without requiring government subsidies,
while the remaining 84.3 per cent will still need gov-
ernment interventions in the form of subsidies and
other mechanisms.
Quality of housing. Up to one-quarter of housing in
Indonesia is of poor quality. The proportion is higher
in eastern Indonesia than in the western part.
Slum areas. In 1999, some 47,393 hectares were
classified as slum areas, covering a population of
2.3 million in 3,857 villages (Table 7.13). This is a
sharp increase from 1996, when 38,053 hectares
were classified as slums. The growth of slums re-
flects: people’s inability to afford decent housing;
environmental degradation; a low level of human
resource development/education, which leads to
a decline in community social standards; the inabil-
ity of the system to anticipate and provide hous-
ing; and the failure by central and local govern-
ments to ensure adequate budgets for providing
and maintaining urban infrastructure and services.
This failure dates from the financial crisis of 1998.
Target 11: By 2020, to have achieved a significant improvement in the lives of slum dwellers
Indicator used: • Proportion of households who own or rent their homes
Figure 7.8. Proportion of households with access to secure tenure*
Indonesia Progress Report on the Millenium Development Goals
87
Weak institutional capacity. There is no framework
for regulations supporting the development of an
effective and efficient housing system. Institutional
capacities are also lacking in the housing sector at
the central, regional and local levels. Regional ca-
pacities remain weak in identifying needs and prob-
lems; formulating policies, plans and strategies; and
coordinating and evaluating implementation.
Low commitment of decision-makers. Commit-
ment among decision makers (executive and legis-
lative) needs strengthening, especially with regard
to meeting the needs of low-income groups and
giving housing the important role it deserves in city
and regional development.
Land ownership. Data from the Central Statistical
Office of Indonesia (BPS—Statistics Indonesia) in
2001 showed that 32 per cent of households in Indo-
nesia (51 per cent of urban households and 22 per
cent of rural) had a land ownership (BPN) certificate.
(Table 7.12b).a Another 35 per cent owned a sales
deed, which, if processed further, can lead to the is-
suance of a BPN certificate.
Challenges
The main challenge is to meet the need and de-
mand for housing, particularly for poor and low-in-
come groups, a considerable task that will require
resources and hard work. Other challenges are to
improve and build up slum areas, and improve land-
ownership status.
Policies and programmes
Policies. Housing policies include:
• Creating a healthy, orderly environment with ad-
equate facilities.
• Creating a conducive climate through fiscal in-
centives for the private sector and communities
to contribute to housing, particularly for poor
and low-income groups.
• Revitalizing the housing market by improving
laws and regulations on investment, land, bank-
ing and civil affairs.
• Creating a long-term source of financing for
housing through mechanisms such as second-
ary mortgage facility, secondary mortgage mar-
ket and other innovations.
• Undertaking land reform and revising land poli-
cies to discourage speculation and monopoly of
land.
• Developing designs and structures for housing
based on local culture and materials, with a view
to increasing affordability.
• Supporting the National Housing Authority to
become an institution with full authority to han-
dle and solve problems and formulate policies
on housing.
• Exploring other possibilities to address slums,
especially in urban areas, such as voluntary re-
settlement programmes and transferring devel-
opment rights.
a Land ownership is judged by a certificate from the BPN (National Agency for Land Affairs).
Indonesia Progress Report on the Millenium Development Goals
88
Notes
1 Directorate General of Forest Protection and Nature Conservation, Ministry of Forestry, 2002.
2 Ministry of Energy and Mineral Resources, 2000. Energy and Economy Statistics 2000.
3 State Ministry for the Environment, 1994. Indonesia: The First Indonesia National Communication on Climate Change Convention. Jakarta
4 Government of Indonesia, 2001. National Strategy Study on Clean Development Mechanism in Indonesia, 2001.
5 State Ministry of Environment, 2000. Indonesia Country Programme Update for the phase-out of Ozone Depleting Substances under the Montreal Protocol. December 2000.
6 Decrees of the Minister of Industry and Trade No. 110/MPP/Kep/1/98 and No. 111/MPP/Kep/1/98, amended by Decrees No. 410/MPP/Kep/9/98 and No. 411/MPP/Kep/9/98.
7 Decree of Minister of Industry and Trade No. 789/MPP/Kep /12/2002
8 Laporan Realisasi Impor CFC; Laporan Pendistribusian CFC Asal Impor
9 Sunderlin, W.D. 2002. The Effects of Economic Crisis and Political Change on Indonesia’s Forest Sector, 1997–99. Which Way Forward? Forest, Policy and People in Indonesia. Editors C.J.P. Colfer & I.A.P Resosudarmo. Resource for the Future, Washington DC.
10 World Bank, 2001. The Imperative for Reform: Brief for the Consultative Group on Indonesia.
11 United Nations, 2002. Report of the World Summit on Sustainable Development, Johannesburg, South Africa, 26 August–4 September 2002. A/CONF.199/20. New York.
12 Locussol, A., et al, 1997. Indonesia Urban Water Supply Sector Policy Framework. World Bank.
13 Pemerintah Republik Indonesia, 1997. Agenda 21 Indonesia: Strategi Nasional untuk Pembangunan Berkelanjutan. Jakarta.
14 United Nations Development Group, 2003. Indicators for Monitoring the Millennium Development Goals: Definitions, Rationale, Concepts and Sources. United Nations, New York.
15 Household estimates based on 2000 population census.

Tables
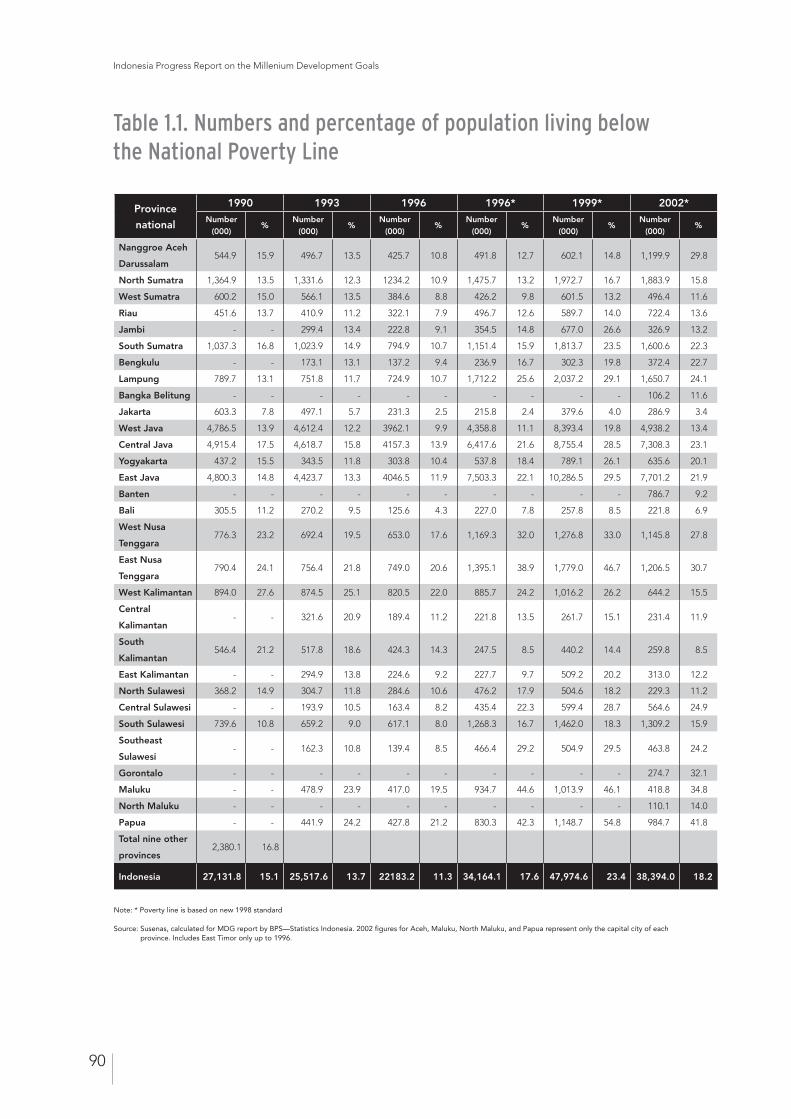
Indonesia Progress Report on the Millenium Development Goals
90
Province
national
1990 1993 1996 1996* 1999* 2002*Number
(000)%
Number(000)
%Number
(000)%
Number(000)
%Number
(000)%
Number(000)
%
Nanggroe Aceh
Darussalam544.9 15.9 496.7 13.5 425.7 10.8 491.8 12.7 602.1 14.8 1,199.9 29.8
North Sumatra 1,364.9 13.5 1,331.6 12.3 1234.2 10.9 1,475.7 13.2 1,972.7 16.7 1,883.9 15.8
West Sumatra 600.2 15.0 566.1 13.5 384.6 8.8 426.2 9.8 601.5 13.2 496.4 11.6
Riau 451.6 13.7 410.9 11.2 322.1 7.9 496.7 12.6 589.7 14.0 722.4 13.6
Jambi - - 299.4 13.4 222.8 9.1 354.5 14.8 677.0 26.6 326.9 13.2
South Sumatra 1,037.3 16.8 1,023.9 14.9 794.9 10.7 1,151.4 15.9 1,813.7 23.5 1,600.6 22.3
Bengkulu - - 173.1 13.1 137.2 9.4 236.9 16.7 302.3 19.8 372.4 22.7
Lampung 789.7 13.1 751.8 11.7 724.9 10.7 1,712.2 25.6 2,037.2 29.1 1,650.7 24.1
Bangka Belitung - - - - - - - - - - 106.2 11.6
Jakarta 603.3 7.8 497.1 5.7 231.3 2.5 215.8 2.4 379.6 4.0 286.9 3.4
West Java 4,786.5 13.9 4,612.4 12.2 3962.1 9.9 4,358.8 11.1 8,393.4 19.8 4,938.2 13.4
Central Java 4,915.4 17.5 4,618.7 15.8 4157.3 13.9 6,417.6 21.6 8,755.4 28.5 7,308.3 23.1
Yogyakarta 437.2 15.5 343.5 11.8 303.8 10.4 537.8 18.4 789.1 26.1 635.6 20.1
East Java 4,800.3 14.8 4,423.7 13.3 4046.5 11.9 7,503.3 22.1 10,286.5 29.5 7,701.2 21.9
Banten - - - - - - - - - - 786.7 9.2
Bali 305.5 11.2 270.2 9.5 125.6 4.3 227.0 7.8 257.8 8.5 221.8 6.9
West Nusa
Tenggara776.3 23.2 692.4 19.5 653.0 17.6 1,169.3 32.0 1,276.8 33.0 1,145.8 27.8
East Nusa
Tenggara790.4 24.1 756.4 21.8 749.0 20.6 1,395.1 38.9 1,779.0 46.7 1,206.5 30.7
West Kalimantan 894.0 27.6 874.5 25.1 820.5 22.0 885.7 24.2 1,016.2 26.2 644.2 15.5
Central
Kalimantan- - 321.6 20.9 189.4 11.2 221.8 13.5 261.7 15.1 231.4 11.9
South
Kalimantan546.4 21.2 517.8 18.6 424.3 14.3 247.5 8.5 440.2 14.4 259.8 8.5
East Kalimantan - - 294.9 13.8 224.6 9.2 227.7 9.7 509.2 20.2 313.0 12.2
North Sulawesi 368.2 14.9 304.7 11.8 284.6 10.6 476.2 17.9 504.6 18.2 229.3 11.2
Central Sulawesi - - 193.9 10.5 163.4 8.2 435.4 22.3 599.4 28.7 564.6 24.9
South Sulawesi 739.6 10.8 659.2 9.0 617.1 8.0 1,268.3 16.7 1,462.0 18.3 1,309.2 15.9
Southeast
Sulawesi- - 162.3 10.8 139.4 8.5 466.4 29.2 504.9 29.5 463.8 24.2
Gorontalo - - - - - - - - - - 274.7 32.1
Maluku - - 478.9 23.9 417.0 19.5 934.7 44.6 1,013.9 46.1 418.8 34.8
North Maluku - - - - - - - - - - 110.1 14.0
Papua - - 441.9 24.2 427.8 21.2 830.3 42.3 1,148.7 54.8 984.7 41.8
Total nine other
provinces2,380.1 16.8
Indonesia 27,131.8 15.1 25,517.6 13.7 22183.2 11.3 34,164.1 17.6 47,974.6 23.4 38,394.0 18.2
Table 1.1. Numbers and percentage of population living below the National Poverty Line
Note: * Poverty line is based on new 1998 standard Source: Susenas, calculated for MDG report by BPS—Statistics Indonesia. 2002 figures for Aceh, Maluku, North Maluku, and Papua represent only the capital city of each
province. Includes East Timor only up to 1996.
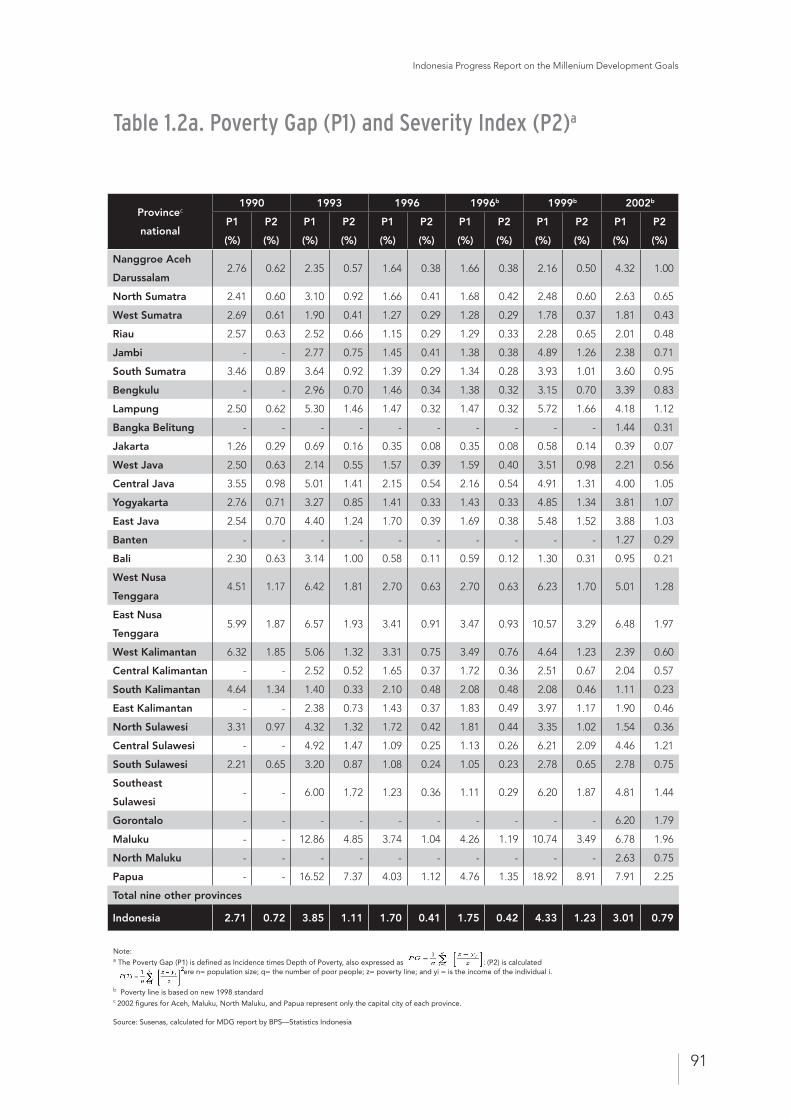
Indonesia Progress Report on the Millenium Development Goals
91
Provincec
national
1990 1993 1996 1996b 1999b 2002b
P1
(%)
P2
(%)
P1
(%)
P2
(%)
P1
(%)
P2
(%)
P1
(%)
P2
(%)
P1
(%)
P2
(%)
P1
(%)
P2
(%)
Nanggroe Aceh
Darussalam2.76 0.62 2.35 0.57 1.64 0.38 1.66 0.38 2.16 0.50 4.32 1.00
North Sumatra 2.41 0.60 3.10 0.92 1.66 0.41 1.68 0.42 2.48 0.60 2.63 0.65
West Sumatra 2.69 0.61 1.90 0.41 1.27 0.29 1.28 0.29 1.78 0.37 1.81 0.43
Riau 2.57 0.63 2.52 0.66 1.15 0.29 1.29 0.33 2.28 0.65 2.01 0.48
Jambi - - 2.77 0.75 1.45 0.41 1.38 0.38 4.89 1.26 2.38 0.71
South Sumatra 3.46 0.89 3.64 0.92 1.39 0.29 1.34 0.28 3.93 1.01 3.60 0.95
Bengkulu - - 2.96 0.70 1.46 0.34 1.38 0.32 3.15 0.70 3.39 0.83
Lampung 2.50 0.62 5.30 1.46 1.47 0.32 1.47 0.32 5.72 1.66 4.18 1.12
Bangka Belitung - - - - - - - - - - 1.44 0.31
Jakarta 1.26 0.29 0.69 0.16 0.35 0.08 0.35 0.08 0.58 0.14 0.39 0.07
West Java 2.50 0.63 2.14 0.55 1.57 0.39 1.59 0.40 3.51 0.98 2.21 0.56
Central Java 3.55 0.98 5.01 1.41 2.15 0.54 2.16 0.54 4.91 1.31 4.00 1.05
Yogyakarta 2.76 0.71 3.27 0.85 1.41 0.33 1.43 0.33 4.85 1.34 3.81 1.07
East Java 2.54 0.70 4.40 1.24 1.70 0.39 1.69 0.38 5.48 1.52 3.88 1.03
Banten - - - - - - - - - - 1.27 0.29
Bali 2.30 0.63 3.14 1.00 0.58 0.11 0.59 0.12 1.30 0.31 0.95 0.21
West Nusa
Tenggara4.51 1.17 6.42 1.81 2.70 0.63 2.70 0.63 6.23 1.70 5.01 1.28
East Nusa
Tenggara5.99 1.87 6.57 1.93 3.41 0.91 3.47 0.93 10.57 3.29 6.48 1.97
West Kalimantan 6.32 1.85 5.06 1.32 3.31 0.75 3.49 0.76 4.64 1.23 2.39 0.60
Central Kalimantan - - 2.52 0.52 1.65 0.37 1.72 0.36 2.51 0.67 2.04 0.57
South Kalimantan 4.64 1.34 1.40 0.33 2.10 0.48 2.08 0.48 2.08 0.46 1.11 0.23
East Kalimantan - - 2.38 0.73 1.43 0.37 1.83 0.49 3.97 1.17 1.90 0.46
North Sulawesi 3.31 0.97 4.32 1.32 1.72 0.42 1.81 0.44 3.35 1.02 1.54 0.36
Central Sulawesi - - 4.92 1.47 1.09 0.25 1.13 0.26 6.21 2.09 4.46 1.21
South Sulawesi 2.21 0.65 3.20 0.87 1.08 0.24 1.05 0.23 2.78 0.65 2.78 0.75
Southeast
Sulawesi- - 6.00 1.72 1.23 0.36 1.11 0.29 6.20 1.87 4.81 1.44
Gorontalo - - - - - - - - - - 6.20 1.79
Maluku - - 12.86 4.85 3.74 1.04 4.26 1.19 10.74 3.49 6.78 1.96
North Maluku - - - - - - - - - - 2.63 0.75
Papua - - 16.52 7.37 4.03 1.12 4.76 1.35 18.92 8.91 7.91 2.25
Total nine other provinces
Indonesia 2.71 0.72 3.85 1.11 1.70 0.41 1.75 0.42 4.33 1.23 3.01 0.79
Table 1.2a. Poverty Gap (P1) and Severity Index (P2)a
Note: a The Poverty Gap (P1) is defined as Incidence times Depth of Poverty, also expressed as and the Severity Index (P2) is calculated as where n= population size; q= the number of poor people; z= poverty line; and yi = is the income of the individual i. b Poverty line is based on new 1998 standard c 2002 figures for Aceh, Maluku, North Maluku, and Papua represent only the capital city of each province.
Source: Susenas, calculated for MDG report by BPS—Statistics Indonesia
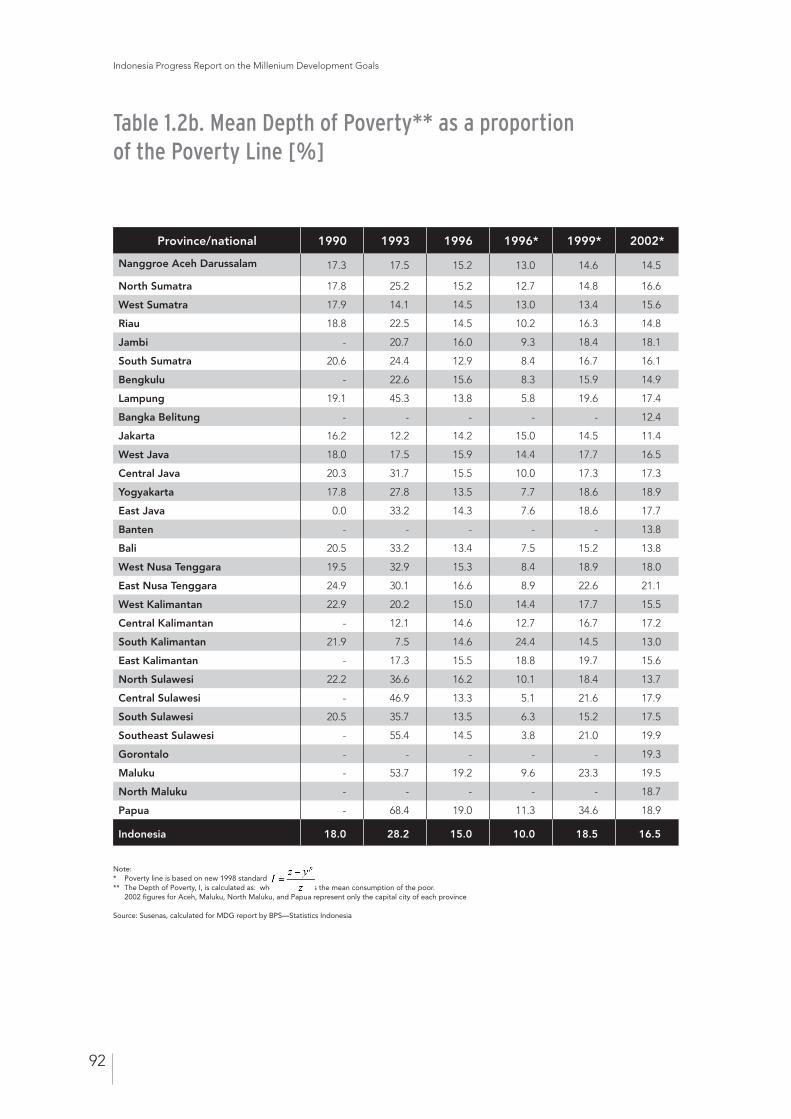
Indonesia Progress Report on the Millenium Development Goals
92
Province/national 1990 1993 1996 1996* 1999* 2002*
Nanggroe Aceh Darussalam 17.3 17.5 15.2 13.0 14.6 14.5
North Sumatra 17.8 25.2 15.2 12.7 14.8 16.6
West Sumatra 17.9 14.1 14.5 13.0 13.4 15.6
Riau 18.8 22.5 14.5 10.2 16.3 14.8
Jambi - 20.7 16.0 9.3 18.4 18.1
South Sumatra 20.6 24.4 12.9 8.4 16.7 16.1
Bengkulu - 22.6 15.6 8.3 15.9 14.9
Lampung 19.1 45.3 13.8 5.8 19.6 17.4
Bangka Belitung - - - - - 12.4
Jakarta 16.2 12.2 14.2 15.0 14.5 11.4
West Java 18.0 17.5 15.9 14.4 17.7 16.5
Central Java 20.3 31.7 15.5 10.0 17.3 17.3
Yogyakarta 17.8 27.8 13.5 7.7 18.6 18.9
East Java 0.0 33.2 14.3 7.6 18.6 17.7
Banten - - - - - 13.8
Bali 20.5 33.2 13.4 7.5 15.2 13.8
West Nusa Tenggara 19.5 32.9 15.3 8.4 18.9 18.0
East Nusa Tenggara 24.9 30.1 16.6 8.9 22.6 21.1
West Kalimantan 22.9 20.2 15.0 14.4 17.7 15.5
Central Kalimantan - 12.1 14.6 12.7 16.7 17.2
South Kalimantan 21.9 7.5 14.6 24.4 14.5 13.0
East Kalimantan - 17.3 15.5 18.8 19.7 15.6
North Sulawesi 22.2 36.6 16.2 10.1 18.4 13.7
Central Sulawesi - 46.9 13.3 5.1 21.6 17.9
South Sulawesi 20.5 35.7 13.5 6.3 15.2 17.5
Southeast Sulawesi - 55.4 14.5 3.8 21.0 19.9
Gorontalo - - - - - 19.3
Maluku - 53.7 19.2 9.6 23.3 19.5
North Maluku - - - - - 18.7
Papua - 68.4 19.0 11.3 34.6 18.9
Indonesia 18.0 28.2 15.0 10.0 18.5 16.5
Table 1.2b. Mean Depth of Poverty** as a proportion of the Poverty Line [%]
Note: * Poverty line is based on new 1998 standard ** The Depth of Poverty, I, is calculated as: where yp denotes the mean consumption of the poor. 2002 figures for Aceh, Maluku, North Maluku, and Papua represent only the capital city of each province
Source: Susenas, calculated for MDG report by BPS—Statistics Indonesia
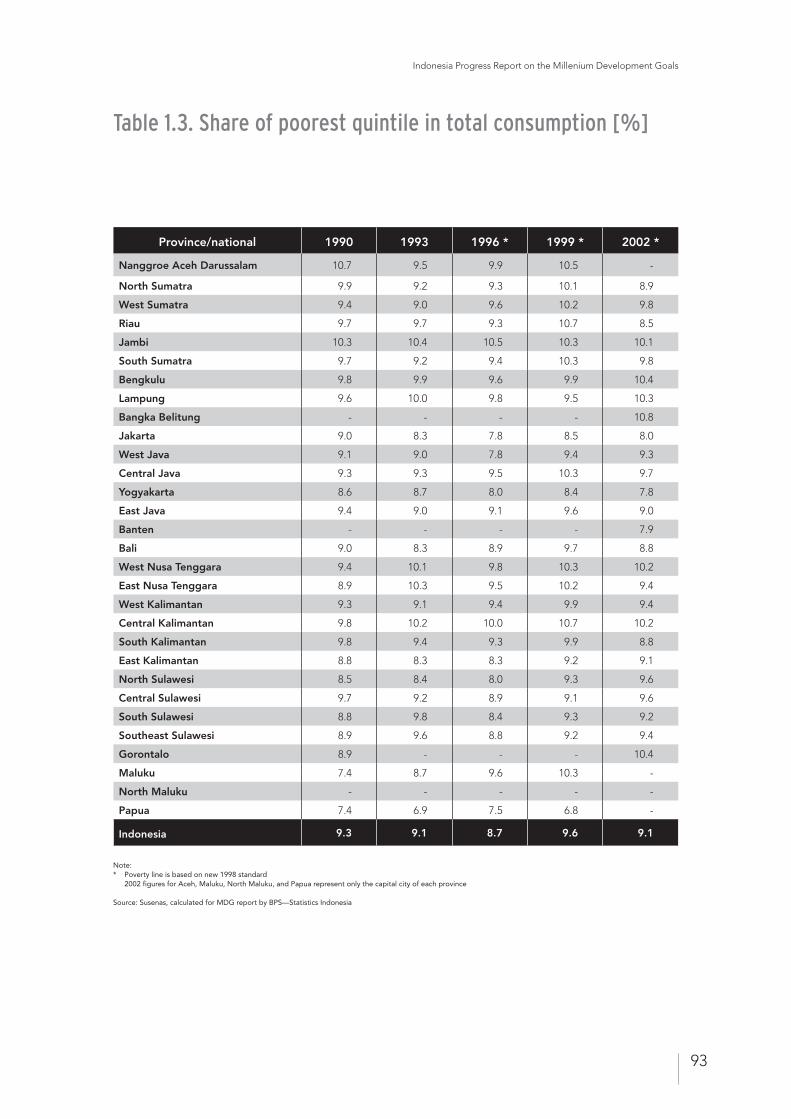
Indonesia Progress Report on the Millenium Development Goals
93
Province/national 1990 1993 1996 * 1999 * 2002 *
Nanggroe Aceh Darussalam 10.7 9.5 9.9 10.5 -
North Sumatra 9.9 9.2 9.3 10.1 8.9
West Sumatra 9.4 9.0 9.6 10.2 9.8
Riau 9.7 9.7 9.3 10.7 8.5
Jambi 10.3 10.4 10.5 10.3 10.1
South Sumatra 9.7 9.2 9.4 10.3 9.8
Bengkulu 9.8 9.9 9.6 9.9 10.4
Lampung 9.6 10.0 9.8 9.5 10.3
Bangka Belitung - - - - 10.8
Jakarta 9.0 8.3 7.8 8.5 8.0
West Java 9.1 9.0 7.8 9.4 9.3
Central Java 9.3 9.3 9.5 10.3 9.7
Yogyakarta 8.6 8.7 8.0 8.4 7.8
East Java 9.4 9.0 9.1 9.6 9.0
Banten - - - - 7.9
Bali 9.0 8.3 8.9 9.7 8.8
West Nusa Tenggara 9.4 10.1 9.8 10.3 10.2
East Nusa Tenggara 8.9 10.3 9.5 10.2 9.4
West Kalimantan 9.3 9.1 9.4 9.9 9.4
Central Kalimantan 9.8 10.2 10.0 10.7 10.2
South Kalimantan 9.8 9.4 9.3 9.9 8.8
East Kalimantan 8.8 8.3 8.3 9.2 9.1
North Sulawesi 8.5 8.4 8.0 9.3 9.6
Central Sulawesi 9.7 9.2 8.9 9.1 9.6
South Sulawesi 8.8 9.8 8.4 9.3 9.2
Southeast Sulawesi 8.9 9.6 8.8 9.2 9.4
Gorontalo 8.9 - - - 10.4
Maluku 7.4 8.7 9.6 10.3 -
North Maluku - - - - -
Papua 7.4 6.9 7.5 6.8 -
Indonesia 9.3 9.1 8.7 9.6 9.1
Table 1.3. Share of poorest quintile in total consumption [%]
Note: * Poverty line is based on new 1998 standard 2002 figures for Aceh, Maluku, North Maluku, and Papua represent only the capital city of each province
Source: Susenas, calculated for MDG report by BPS—Statistics Indonesia
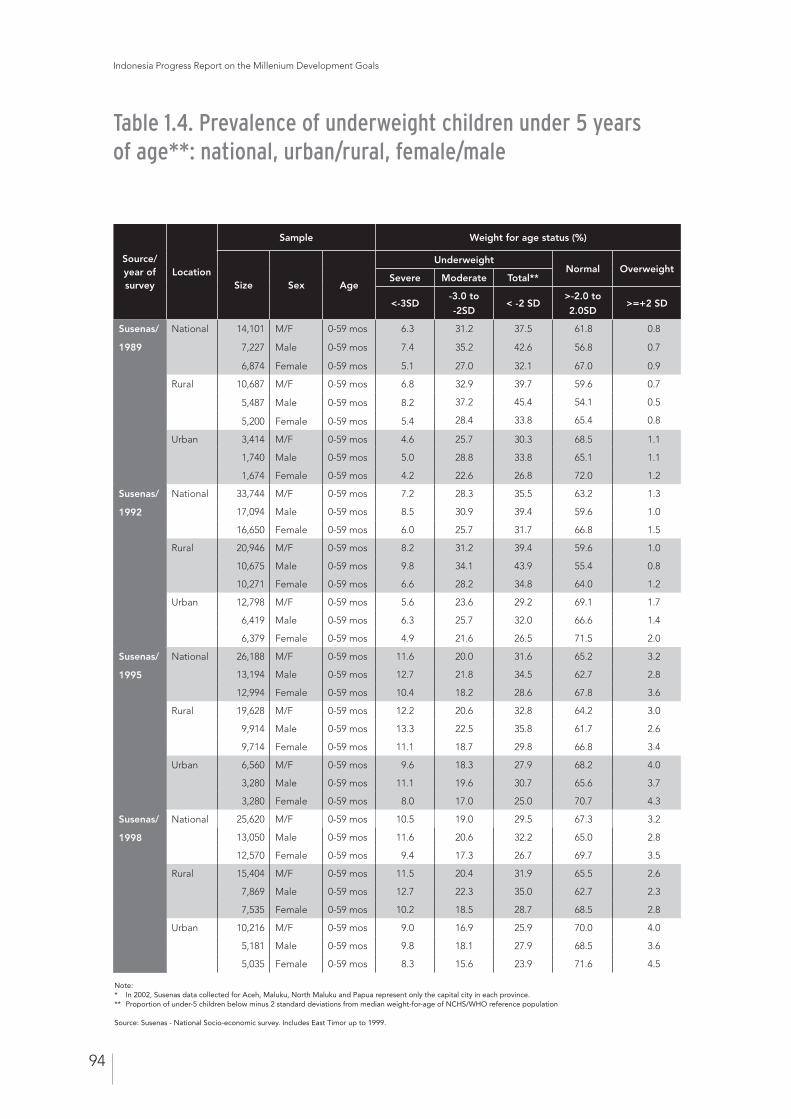
Indonesia Progress Report on the Millenium Development Goals
94
Source/year of survey
Location
Sample Weight for age status (%)
Size Sex Age
UnderweightNormal Overweight
Severe Moderate Total**
<-3SD-3.0 to
-2SD< -2 SD
>-2.0 to
2.0SD>=+2 SD
Susenas/
1989
National 14,101
7,227
6,874
M/F
Male
Female
0-59 mos
0-59 mos
0-59 mos
6.3
7.4
5.1
31.2
35.2
27.0
37.5
42.6
32.1
61.8
56.8
67.0
0.8
0.7
0.9
Rural 10,687
5,487
5,200
M/F
Male
Female
0-59 mos
0-59 mos
0-59 mos
6.8
8.2
5.4
32.9 39.7 59.6 0.7
37.2 45.4 54.1 0.5
28.4 33.8 65.4 0.8
Urban 3,414 M/F 0-59 mos 4.6 25.7 30.3 68.5 1.1
1,740 Male 0-59 mos 5.0 28.8 33.8 65.1 1.1
1,674 Female 0-59 mos 4.2 22.6 26.8 72.0 1.2
Susenas/
1992
National 33,744 M/F 0-59 mos 7.2 28.3 35.5 63.2 1.3
17,094 Male 0-59 mos 8.5 30.9 39.4 59.6 1.0
16,650 Female 0-59 mos 6.0 25.7 31.7 66.8 1.5
Rural 20,946 M/F 0-59 mos 8.2 31.2 39.4 59.6 1.0
10,675 Male 0-59 mos 9.8 34.1 43.9 55.4 0.8
10,271 Female 0-59 mos 6.6 28.2 34.8 64.0 1.2
Urban 12,798 M/F 0-59 mos 5.6 23.6 29.2 69.1 1.7
6,419 Male 0-59 mos 6.3 25.7 32.0 66.6 1.4
6,379 Female 0-59 mos 4.9 21.6 26.5 71.5 2.0
Susenas/
1995
National 26,188 M/F 0-59 mos 11.6 20.0 31.6 65.2 3.2
13,194 Male 0-59 mos 12.7 21.8 34.5 62.7 2.8
12,994 Female 0-59 mos 10.4 18.2 28.6 67.8 3.6
Rural 19,628 M/F 0-59 mos 12.2 20.6 32.8 64.2 3.0
9,914 Male 0-59 mos 13.3 22.5 35.8 61.7 2.6
9,714 Female 0-59 mos 11.1 18.7 29.8 66.8 3.4
Urban 6,560 M/F 0-59 mos 9.6 18.3 27.9 68.2 4.0
3,280 Male 0-59 mos 11.1 19.6 30.7 65.6 3.7
3,280 Female 0-59 mos 8.0 17.0 25.0 70.7 4.3
Susenas/
1998
National 25,620 M/F 0-59 mos 10.5 19.0 29.5 67.3 3.2
13,050 Male 0-59 mos 11.6 20.6 32.2 65.0 2.8
12,570 Female 0-59 mos 9.4 17.3 26.7 69.7 3.5
Rural 15,404 M/F 0-59 mos 11.5 20.4 31.9 65.5 2.6
7,869 Male 0-59 mos 12.7 22.3 35.0 62.7 2.3
7,535 Female 0-59 mos 10.2 18.5 28.7 68.5 2.8
Urban 10,216 M/F 0-59 mos 9.0 16.9 25.9 70.0 4.0
5,181 Male 0-59 mos 9.8 18.1 27.9 68.5 3.6
5,035 Female 0-59 mos 8.3 15.6 23.9 71.6 4.5
Table 1.4. Prevalence of underweight children under 5 years of age**: national, urban/rural, female/male
Note: * In 2002, Susenas data collected for Aceh, Maluku, North Maluku and Papua represent only the capital city in each province. ** Proportion of under-5 children below minus 2 standard deviations from median weight-for-age of NCHS/WHO reference population
Source: Susenas - National Socio-economic survey. Includes East Timor up to 1999.
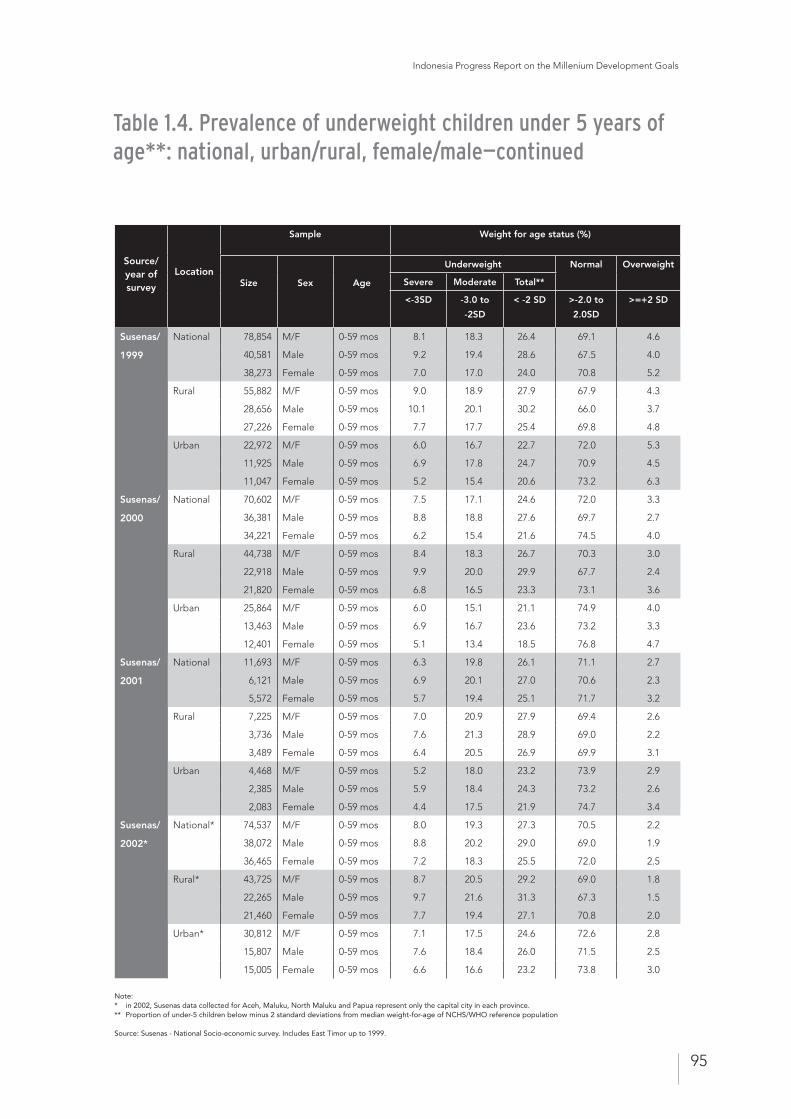
Indonesia Progress Report on the Millenium Development Goals
95
Source/year of survey
Location
Sample Weight for age status (%)
Size Sex Age
Underweight Normal Overweight
Severe Moderate Total**
<-3SD -3.0 to
-2SD
< -2 SD >-2.0 to
2.0SD
>=+2 SD
Susenas/
1999
National 78,854 M/F 0-59 mos 8.1 18.3 26.4 69.1 4.6
40,581 Male 0-59 mos 9.2 19.4 28.6 67.5 4.0
38,273 Female 0-59 mos 7.0 17.0 24.0 70.8 5.2
Rural 55,882 M/F 0-59 mos 9.0 18.9 27.9 67.9 4.3
28,656 Male 0-59 mos 10.1 20.1 30.2 66.0 3.7
27,226 Female 0-59 mos 7.7 17.7 25.4 69.8 4.8
Urban 22,972 M/F 0-59 mos 6.0 16.7 22.7 72.0 5.3
11,925 Male 0-59 mos 6.9 17.8 24.7 70.9 4.5
11,047 Female 0-59 mos 5.2 15.4 20.6 73.2 6.3
Susenas/
2000
National 70,602 M/F 0-59 mos 7.5 17.1 24.6 72.0 3.3
36,381 Male 0-59 mos 8.8 18.8 27.6 69.7 2.7
34,221 Female 0-59 mos 6.2 15.4 21.6 74.5 4.0
Rural 44,738 M/F 0-59 mos 8.4 18.3 26.7 70.3 3.0
22,918 Male 0-59 mos 9.9 20.0 29.9 67.7 2.4
21,820 Female 0-59 mos 6.8 16.5 23.3 73.1 3.6
Urban 25,864 M/F 0-59 mos 6.0 15.1 21.1 74.9 4.0
13,463 Male 0-59 mos 6.9 16.7 23.6 73.2 3.3
12,401 Female 0-59 mos 5.1 13.4 18.5 76.8 4.7
Susenas/
2001
National 11,693 M/F 0-59 mos 6.3 19.8 26.1 71.1 2.7
6,121 Male 0-59 mos 6.9 20.1 27.0 70.6 2.3
5,572 Female 0-59 mos 5.7 19.4 25.1 71.7 3.2
Rural 7,225 M/F 0-59 mos 7.0 20.9 27.9 69.4 2.6
3,736 Male 0-59 mos 7.6 21.3 28.9 69.0 2.2
3,489 Female 0-59 mos 6.4 20.5 26.9 69.9 3.1
Urban 4,468 M/F 0-59 mos 5.2 18.0 23.2 73.9 2.9
2,385 Male 0-59 mos 5.9 18.4 24.3 73.2 2.6
2,083 Female 0-59 mos 4.4 17.5 21.9 74.7 3.4
Susenas/
2002*
National* 74,537 M/F 0-59 mos 8.0 19.3 27.3 70.5 2.2
38,072 Male 0-59 mos 8.8 20.2 29.0 69.0 1.9
36,465 Female 0-59 mos 7.2 18.3 25.5 72.0 2.5
Rural* 43,725 M/F 0-59 mos 8.7 20.5 29.2 69.0 1.8
22,265 Male 0-59 mos 9.7 21.6 31.3 67.3 1.5
21,460 Female 0-59 mos 7.7 19.4 27.1 70.8 2.0
Urban* 30,812 M/F 0-59 mos 7.1 17.5 24.6 72.6 2.8
15,807 Male 0-59 mos 7.6 18.4 26.0 71.5 2.5
15,005 Female 0-59 mos 6.6 16.6 23.2 73.8 3.0
Note: * in 2002, Susenas data collected for Aceh, Maluku, North Maluku and Papua represent only the capital city in each province.** Proportion of under-5 children below minus 2 standard deviations from median weight-for-age of NCHS/WHO reference population
Source: Susenas - National Socio-economic survey. Includes East Timor up to 1999.
Table 1.4. Prevalence of underweight children under 5 years of age**: national, urban/rural, female/male—continued
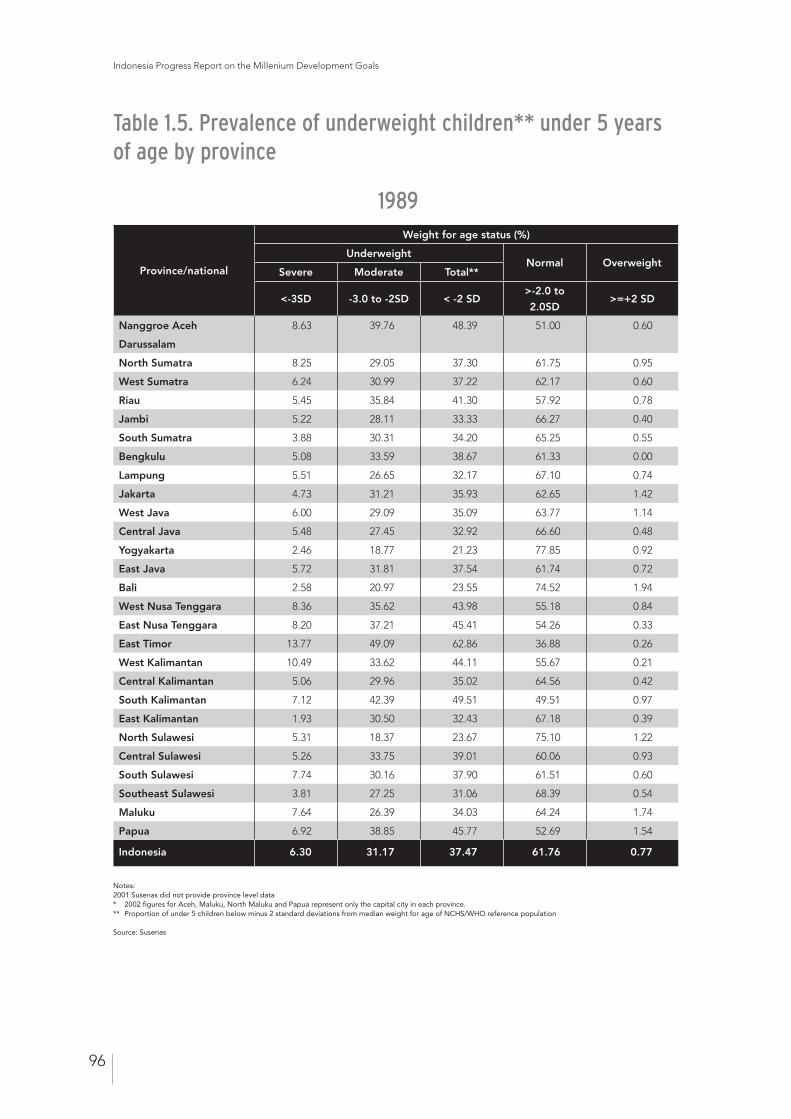
Indonesia Progress Report on the Millenium Development Goals
96
Table 1.5. Prevalence of underweight children** under 5 years of age by province
Province/national
Weight for age status (%)
UnderweightNormal Overweight
Severe Moderate Total**
<-3SD -3.0 to -2SD < -2 SD>-2.0 to
2.0SD>=+2 SD
Nanggroe Aceh
Darussalam
8.63 39.76 48.39 51.00 0.60
North Sumatra 8.25 29.05 37.30 61.75 0.95
West Sumatra 6.24 30.99 37.22 62.17 0.60
Riau 5.45 35.84 41.30 57.92 0.78
Jambi 5.22 28.11 33.33 66.27 0.40
South Sumatra 3.88 30.31 34.20 65.25 0.55
Bengkulu 5.08 33.59 38.67 61.33 0.00
Lampung 5.51 26.65 32.17 67.10 0.74
Jakarta 4.73 31.21 35.93 62.65 1.42
West Java 6.00 29.09 35.09 63.77 1.14
Central Java 5.48 27.45 32.92 66.60 0.48
Yogyakarta 2.46 18.77 21.23 77.85 0.92
East Java 5.72 31.81 37.54 61.74 0.72
Bali 2.58 20.97 23.55 74.52 1.94
West Nusa Tenggara 8.36 35.62 43.98 55.18 0.84
East Nusa Tenggara 8.20 37.21 45.41 54.26 0.33
East Timor 13.77 49.09 62.86 36.88 0.26
West Kalimantan 10.49 33.62 44.11 55.67 0.21
Central Kalimantan 5.06 29.96 35.02 64.56 0.42
South Kalimantan 7.12 42.39 49.51 49.51 0.97
East Kalimantan 1.93 30.50 32.43 67.18 0.39
North Sulawesi 5.31 18.37 23.67 75.10 1.22
Central Sulawesi 5.26 33.75 39.01 60.06 0.93
South Sulawesi 7.74 30.16 37.90 61.51 0.60
Southeast Sulawesi 3.81 27.25 31.06 68.39 0.54
Maluku 7.64 26.39 34.03 64.24 1.74
Papua 6.92 38.85 45.77 52.69 1.54
Indonesia 6.30 31.17 37.47 61.76 0.77
1989
Notes: 2001 Susenas did not provide province level data * 2002 figures for Aceh, Maluku, North Maluku and Papua represent only the capital city in each province. ** Proportion of under 5 children below minus 2 standard deviations from median weight for age of NCHS/WHO reference population
Source: Susenas
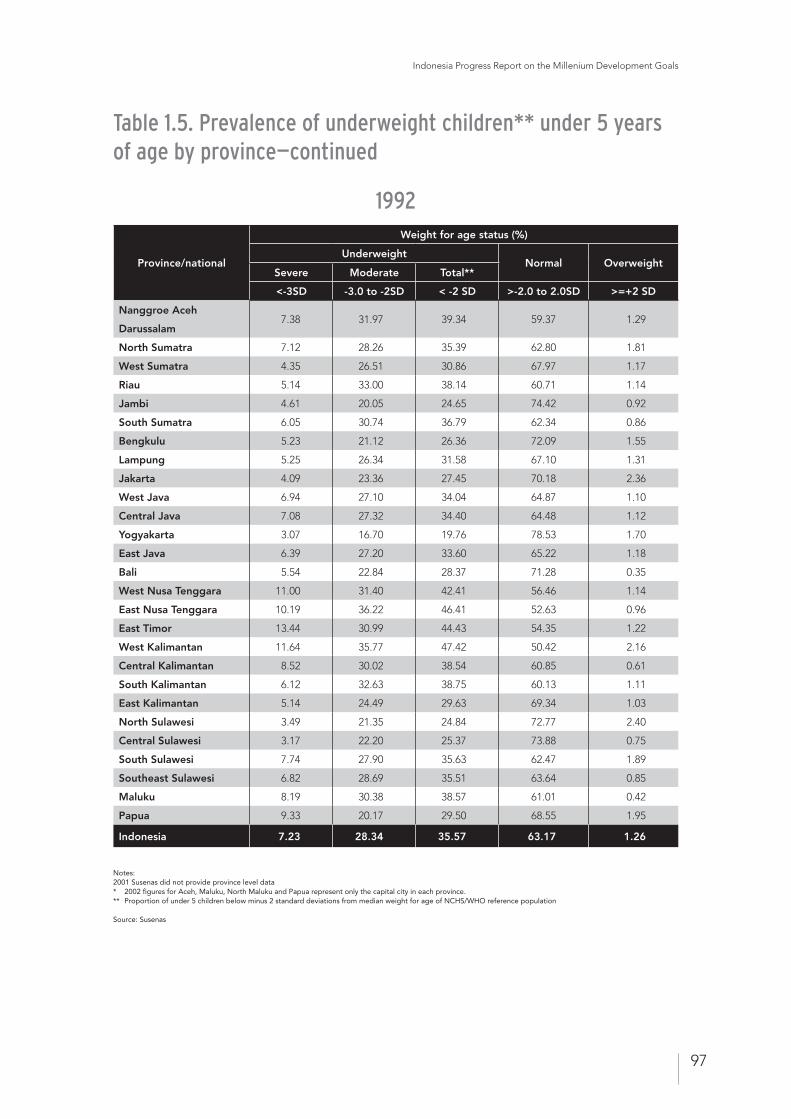
Indonesia Progress Report on the Millenium Development Goals
97
Province/national
Weight for age status (%)
UnderweightNormal Overweight
Severe Moderate Total**
<-3SD -3.0 to -2SD < -2 SD >-2.0 to 2.0SD >=+2 SD
Nanggroe Aceh
Darussalam7.38 31.97 39.34 59.37 1.29
North Sumatra 7.12 28.26 35.39 62.80 1.81
West Sumatra 4.35 26.51 30.86 67.97 1.17
Riau 5.14 33.00 38.14 60.71 1.14
Jambi 4.61 20.05 24.65 74.42 0.92
South Sumatra 6.05 30.74 36.79 62.34 0.86
Bengkulu 5.23 21.12 26.36 72.09 1.55
Lampung 5.25 26.34 31.58 67.10 1.31
Jakarta 4.09 23.36 27.45 70.18 2.36
West Java 6.94 27.10 34.04 64.87 1.10
Central Java 7.08 27.32 34.40 64.48 1.12
Yogyakarta 3.07 16.70 19.76 78.53 1.70
East Java 6.39 27.20 33.60 65.22 1.18
Bali 5.54 22.84 28.37 71.28 0.35
West Nusa Tenggara 11.00 31.40 42.41 56.46 1.14
East Nusa Tenggara 10.19 36.22 46.41 52.63 0.96
East Timor 13.44 30.99 44.43 54.35 1.22
West Kalimantan 11.64 35.77 47.42 50.42 2.16
Central Kalimantan 8.52 30.02 38.54 60.85 0.61
South Kalimantan 6.12 32.63 38.75 60.13 1.11
East Kalimantan 5.14 24.49 29.63 69.34 1.03
North Sulawesi 3.49 21.35 24.84 72.77 2.40
Central Sulawesi 3.17 22.20 25.37 73.88 0.75
South Sulawesi 7.74 27.90 35.63 62.47 1.89
Southeast Sulawesi 6.82 28.69 35.51 63.64 0.85
Maluku 8.19 30.38 38.57 61.01 0.42
Papua 9.33 20.17 29.50 68.55 1.95
Indonesia 7.23 28.34 35.57 63.17 1.26
1992
Table 1.5. Prevalence of underweight children** under 5 years of age by province—continued
Notes: 2001 Susenas did not provide province level data * 2002 figures for Aceh, Maluku, North Maluku and Papua represent only the capital city in each province. ** Proportion of under 5 children below minus 2 standard deviations from median weight for age of NCHS/WHO reference population
Source: Susenas
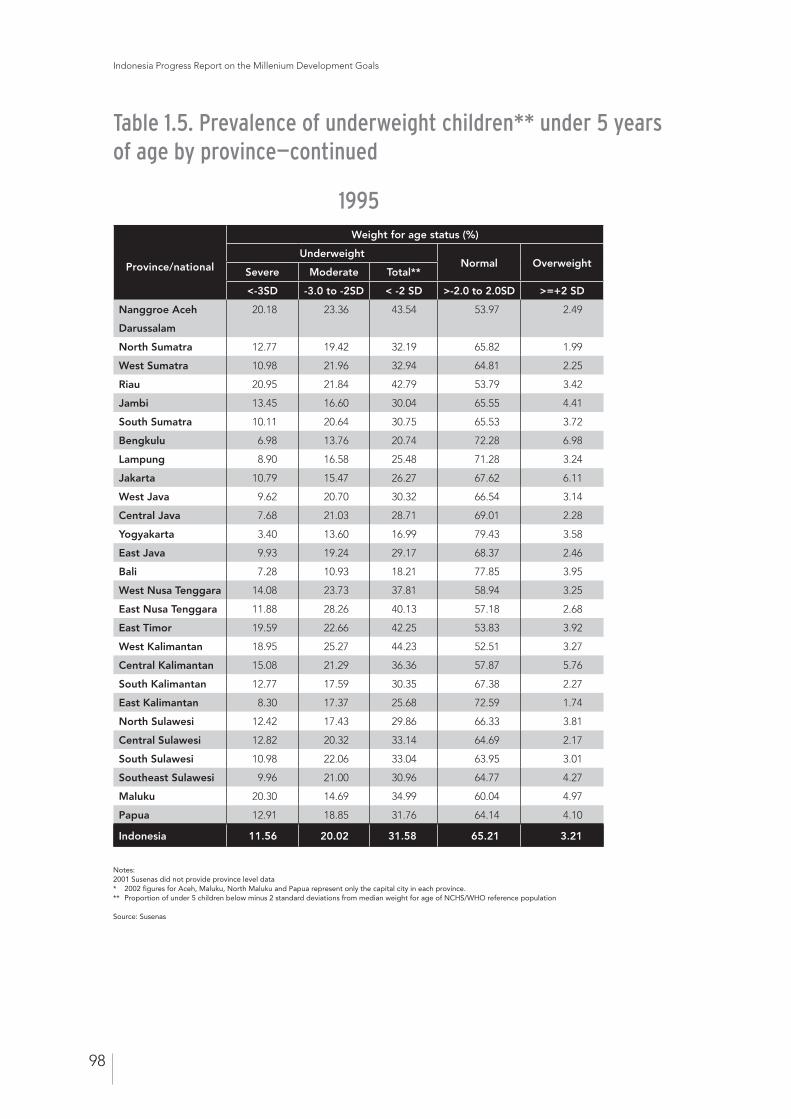
Indonesia Progress Report on the Millenium Development Goals
98
Province/national
Weight for age status (%)
UnderweightNormal Overweight
Severe Moderate Total**
<-3SD -3.0 to -2SD < -2 SD >-2.0 to 2.0SD >=+2 SD
Nanggroe Aceh
Darussalam
20.18 23.36 43.54 53.97 2.49
North Sumatra 12.77 19.42 32.19 65.82 1.99
West Sumatra 10.98 21.96 32.94 64.81 2.25
Riau 20.95 21.84 42.79 53.79 3.42
Jambi 13.45 16.60 30.04 65.55 4.41
South Sumatra 10.11 20.64 30.75 65.53 3.72
Bengkulu 6.98 13.76 20.74 72.28 6.98
Lampung 8.90 16.58 25.48 71.28 3.24
Jakarta 10.79 15.47 26.27 67.62 6.11
West Java 9.62 20.70 30.32 66.54 3.14
Central Java 7.68 21.03 28.71 69.01 2.28
Yogyakarta 3.40 13.60 16.99 79.43 3.58
East Java 9.93 19.24 29.17 68.37 2.46
Bali 7.28 10.93 18.21 77.85 3.95
West Nusa Tenggara 14.08 23.73 37.81 58.94 3.25
East Nusa Tenggara 11.88 28.26 40.13 57.18 2.68
East Timor 19.59 22.66 42.25 53.83 3.92
West Kalimantan 18.95 25.27 44.23 52.51 3.27
Central Kalimantan 15.08 21.29 36.36 57.87 5.76
South Kalimantan 12.77 17.59 30.35 67.38 2.27
East Kalimantan 8.30 17.37 25.68 72.59 1.74
North Sulawesi 12.42 17.43 29.86 66.33 3.81
Central Sulawesi 12.82 20.32 33.14 64.69 2.17
South Sulawesi 10.98 22.06 33.04 63.95 3.01
Southeast Sulawesi 9.96 21.00 30.96 64.77 4.27
Maluku 20.30 14.69 34.99 60.04 4.97
Papua 12.91 18.85 31.76 64.14 4.10
Indonesia 11.56 20.02 31.58 65.21 3.21
1995
Table 1.5. Prevalence of underweight children** under 5 years of age by province—continued
Notes: 2001 Susenas did not provide province level data * 2002 figures for Aceh, Maluku, North Maluku and Papua represent only the capital city in each province.** Proportion of under 5 children below minus 2 standard deviations from median weight for age of NCHS/WHO reference population
Source: Susenas
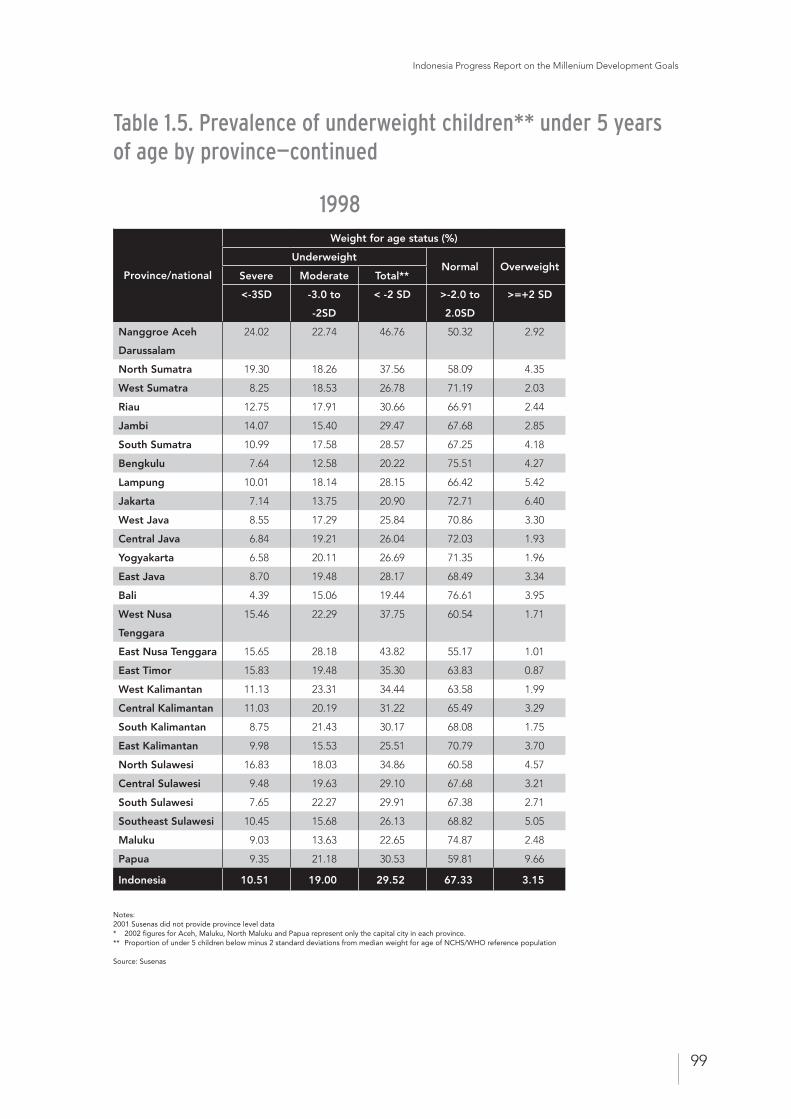
Indonesia Progress Report on the Millenium Development Goals
99
Province/national
Weight for age status (%)
UnderweightNormal Overweight
Severe Moderate Total**
<-3SD -3.0 to
-2SD
< -2 SD >-2.0 to
2.0SD
>=+2 SD
Nanggroe Aceh
Darussalam
24.02 22.74 46.76 50.32 2.92
North Sumatra 19.30 18.26 37.56 58.09 4.35
West Sumatra 8.25 18.53 26.78 71.19 2.03
Riau 12.75 17.91 30.66 66.91 2.44
Jambi 14.07 15.40 29.47 67.68 2.85
South Sumatra 10.99 17.58 28.57 67.25 4.18
Bengkulu 7.64 12.58 20.22 75.51 4.27
Lampung 10.01 18.14 28.15 66.42 5.42
Jakarta 7.14 13.75 20.90 72.71 6.40
West Java 8.55 17.29 25.84 70.86 3.30
Central Java 6.84 19.21 26.04 72.03 1.93
Yogyakarta 6.58 20.11 26.69 71.35 1.96
East Java 8.70 19.48 28.17 68.49 3.34
Bali 4.39 15.06 19.44 76.61 3.95
West Nusa
Tenggara
15.46 22.29 37.75 60.54 1.71
East Nusa Tenggara 15.65 28.18 43.82 55.17 1.01
East Timor 15.83 19.48 35.30 63.83 0.87
West Kalimantan 11.13 23.31 34.44 63.58 1.99
Central Kalimantan 11.03 20.19 31.22 65.49 3.29
South Kalimantan 8.75 21.43 30.17 68.08 1.75
East Kalimantan 9.98 15.53 25.51 70.79 3.70
North Sulawesi 16.83 18.03 34.86 60.58 4.57
Central Sulawesi 9.48 19.63 29.10 67.68 3.21
South Sulawesi 7.65 22.27 29.91 67.38 2.71
Southeast Sulawesi 10.45 15.68 26.13 68.82 5.05
Maluku 9.03 13.63 22.65 74.87 2.48
Papua 9.35 21.18 30.53 59.81 9.66
Indonesia 10.51 19.00 29.52 67.33 3.15
1998
Table 1.5. Prevalence of underweight children** under 5 years of age by province—continued
Notes: 2001 Susenas did not provide province level data * 2002 figures for Aceh, Maluku, North Maluku and Papua represent only the capital city in each province.** Proportion of under 5 children below minus 2 standard deviations from median weight for age of NCHS/WHO reference population
Source: Susenas
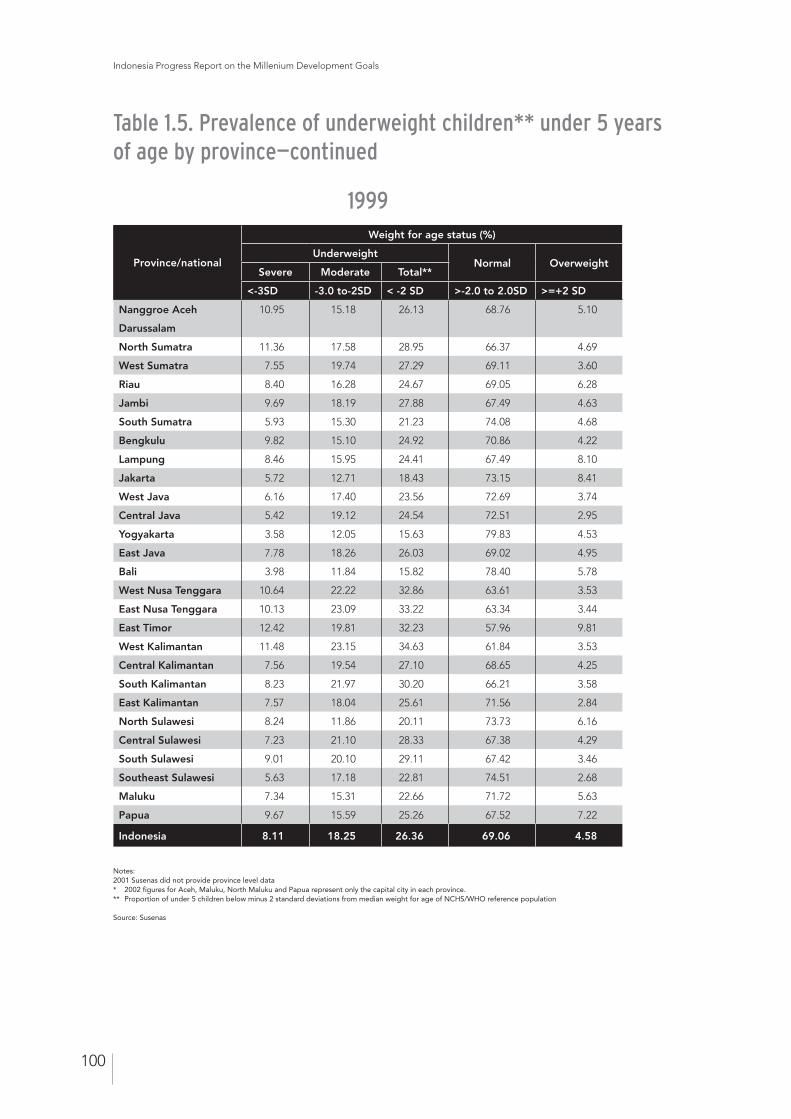
Indonesia Progress Report on the Millenium Development Goals
100
Province/national
Weight for age status (%)
UnderweightNormal Overweight
Severe Moderate Total**
<-3SD -3.0 to-2SD < -2 SD >-2.0 to 2.0SD >=+2 SD
Nanggroe Aceh
Darussalam
10.95 15.18 26.13 68.76 5.10
North Sumatra 11.36 17.58 28.95 66.37 4.69
West Sumatra 7.55 19.74 27.29 69.11 3.60
Riau 8.40 16.28 24.67 69.05 6.28
Jambi 9.69 18.19 27.88 67.49 4.63
South Sumatra 5.93 15.30 21.23 74.08 4.68
Bengkulu 9.82 15.10 24.92 70.86 4.22
Lampung 8.46 15.95 24.41 67.49 8.10
Jakarta 5.72 12.71 18.43 73.15 8.41
West Java 6.16 17.40 23.56 72.69 3.74
Central Java 5.42 19.12 24.54 72.51 2.95
Yogyakarta 3.58 12.05 15.63 79.83 4.53
East Java 7.78 18.26 26.03 69.02 4.95
Bali 3.98 11.84 15.82 78.40 5.78
West Nusa Tenggara 10.64 22.22 32.86 63.61 3.53
East Nusa Tenggara 10.13 23.09 33.22 63.34 3.44
East Timor 12.42 19.81 32.23 57.96 9.81
West Kalimantan 11.48 23.15 34.63 61.84 3.53
Central Kalimantan 7.56 19.54 27.10 68.65 4.25
South Kalimantan 8.23 21.97 30.20 66.21 3.58
East Kalimantan 7.57 18.04 25.61 71.56 2.84
North Sulawesi 8.24 11.86 20.11 73.73 6.16
Central Sulawesi 7.23 21.10 28.33 67.38 4.29
South Sulawesi 9.01 20.10 29.11 67.42 3.46
Southeast Sulawesi 5.63 17.18 22.81 74.51 2.68
Maluku 7.34 15.31 22.66 71.72 5.63
Papua 9.67 15.59 25.26 67.52 7.22
Indonesia 8.11 18.25 26.36 69.06 4.58
1999
Table 1.5. Prevalence of underweight children** under 5 years of age by province—continued
Notes: 2001 Susenas did not provide province level data * 2002 figures for Aceh, Maluku, North Maluku and Papua represent only the capital city in each province. ** Proportion of under 5 children below minus 2 standard deviations from median weight for age of NCHS/WHO reference population
Source: Susenas
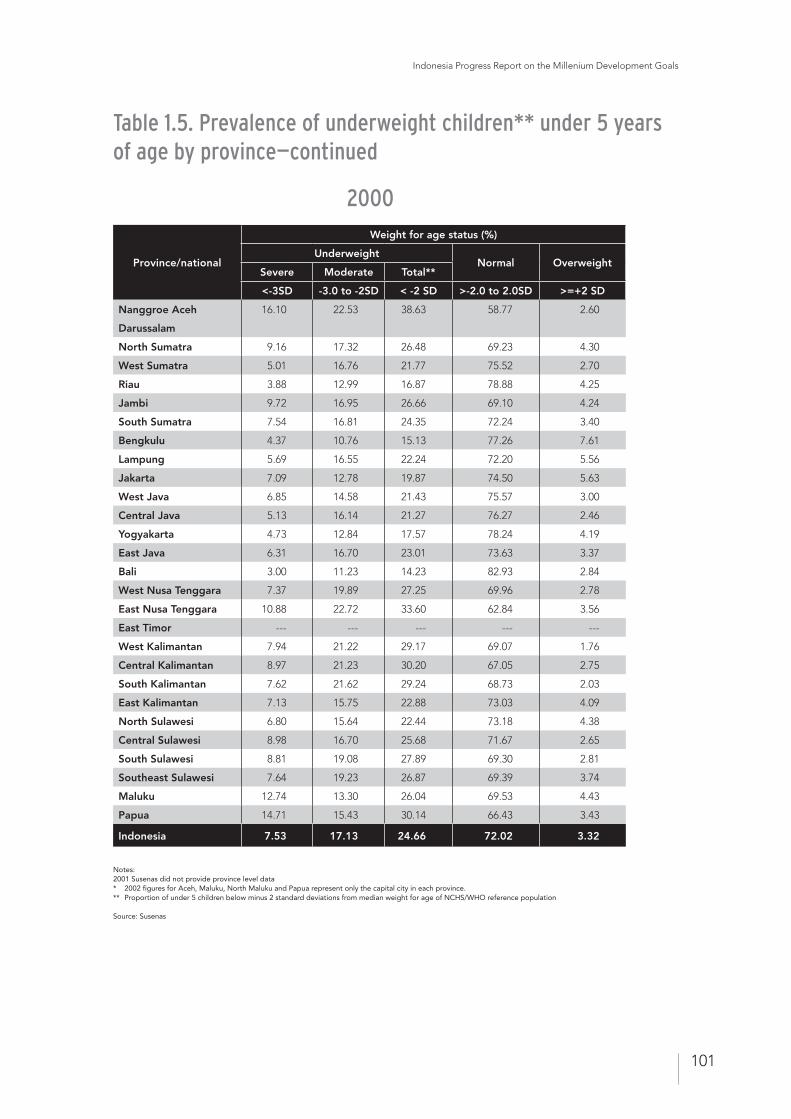
Indonesia Progress Report on the Millenium Development Goals
101
Province/national
Weight for age status (%)
UnderweightNormal Overweight
Severe Moderate Total**
<-3SD -3.0 to -2SD < -2 SD >-2.0 to 2.0SD >=+2 SD
Nanggroe Aceh
Darussalam
16.10 22.53 38.63 58.77 2.60
North Sumatra 9.16 17.32 26.48 69.23 4.30
West Sumatra 5.01 16.76 21.77 75.52 2.70
Riau 3.88 12.99 16.87 78.88 4.25
Jambi 9.72 16.95 26.66 69.10 4.24
South Sumatra 7.54 16.81 24.35 72.24 3.40
Bengkulu 4.37 10.76 15.13 77.26 7.61
Lampung 5.69 16.55 22.24 72.20 5.56
Jakarta 7.09 12.78 19.87 74.50 5.63
West Java 6.85 14.58 21.43 75.57 3.00
Central Java 5.13 16.14 21.27 76.27 2.46
Yogyakarta 4.73 12.84 17.57 78.24 4.19
East Java 6.31 16.70 23.01 73.63 3.37
Bali 3.00 11.23 14.23 82.93 2.84
West Nusa Tenggara 7.37 19.89 27.25 69.96 2.78
East Nusa Tenggara 10.88 22.72 33.60 62.84 3.56
East Timor --- --- --- --- ---
West Kalimantan 7.94 21.22 29.17 69.07 1.76
Central Kalimantan 8.97 21.23 30.20 67.05 2.75
South Kalimantan 7.62 21.62 29.24 68.73 2.03
East Kalimantan 7.13 15.75 22.88 73.03 4.09
North Sulawesi 6.80 15.64 22.44 73.18 4.38
Central Sulawesi 8.98 16.70 25.68 71.67 2.65
South Sulawesi 8.81 19.08 27.89 69.30 2.81
Southeast Sulawesi 7.64 19.23 26.87 69.39 3.74
Maluku 12.74 13.30 26.04 69.53 4.43
Papua 14.71 15.43 30.14 66.43 3.43
Indonesia 7.53 17.13 24.66 72.02 3.32
2000
Table 1.5. Prevalence of underweight children** under 5 years of age by province—continued
Notes: 2001 Susenas did not provide province level data * 2002 figures for Aceh, Maluku, North Maluku and Papua represent only the capital city in each province. ** Proportion of under 5 children below minus 2 standard deviations from median weight for age of NCHS/WHO reference population
Source: Susenas
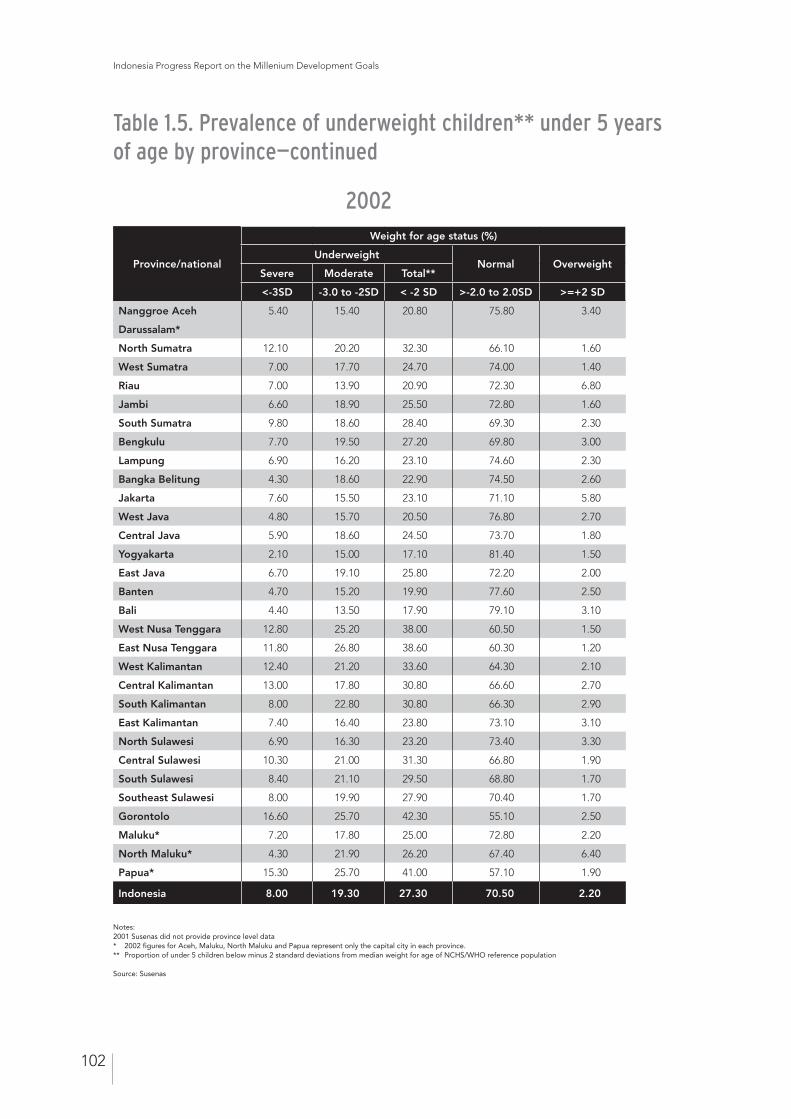
Indonesia Progress Report on the Millenium Development Goals
102
Province/national
Weight for age status (%)
UnderweightNormal Overweight
Severe Moderate Total**
<-3SD -3.0 to -2SD < -2 SD >-2.0 to 2.0SD >=+2 SD
Nanggroe Aceh
Darussalam*
5.40 15.40 20.80 75.80 3.40
North Sumatra 12.10 20.20 32.30 66.10 1.60
West Sumatra 7.00 17.70 24.70 74.00 1.40
Riau 7.00 13.90 20.90 72.30 6.80
Jambi 6.60 18.90 25.50 72.80 1.60
South Sumatra 9.80 18.60 28.40 69.30 2.30
Bengkulu 7.70 19.50 27.20 69.80 3.00
Lampung 6.90 16.20 23.10 74.60 2.30
Bangka Belitung 4.30 18.60 22.90 74.50 2.60
Jakarta 7.60 15.50 23.10 71.10 5.80
West Java 4.80 15.70 20.50 76.80 2.70
Central Java 5.90 18.60 24.50 73.70 1.80
Yogyakarta 2.10 15.00 17.10 81.40 1.50
East Java 6.70 19.10 25.80 72.20 2.00
Banten 4.70 15.20 19.90 77.60 2.50
Bali 4.40 13.50 17.90 79.10 3.10
West Nusa Tenggara 12.80 25.20 38.00 60.50 1.50
East Nusa Tenggara 11.80 26.80 38.60 60.30 1.20
West Kalimantan 12.40 21.20 33.60 64.30 2.10
Central Kalimantan 13.00 17.80 30.80 66.60 2.70
South Kalimantan 8.00 22.80 30.80 66.30 2.90
East Kalimantan 7.40 16.40 23.80 73.10 3.10
North Sulawesi 6.90 16.30 23.20 73.40 3.30
Central Sulawesi 10.30 21.00 31.30 66.80 1.90
South Sulawesi 8.40 21.10 29.50 68.80 1.70
Southeast Sulawesi 8.00 19.90 27.90 70.40 1.70
Gorontolo 16.60 25.70 42.30 55.10 2.50
Maluku* 7.20 17.80 25.00 72.80 2.20
North Maluku* 4.30 21.90 26.20 67.40 6.40
Papua* 15.30 25.70 41.00 57.10 1.90
Indonesia 8.00 19.30 27.30 70.50 2.20
Notes: 2001 Susenas did not provide province level data* 2002 figures for Aceh, Maluku, North Maluku and Papua represent only the capital city in each province.** Proportion of under 5 children below minus 2 standard deviations from median weight for age of NCHS/WHO reference population
Source: Susenas
2002
Table 1.5. Prevalence of underweight children** under 5 years of age by province—continued
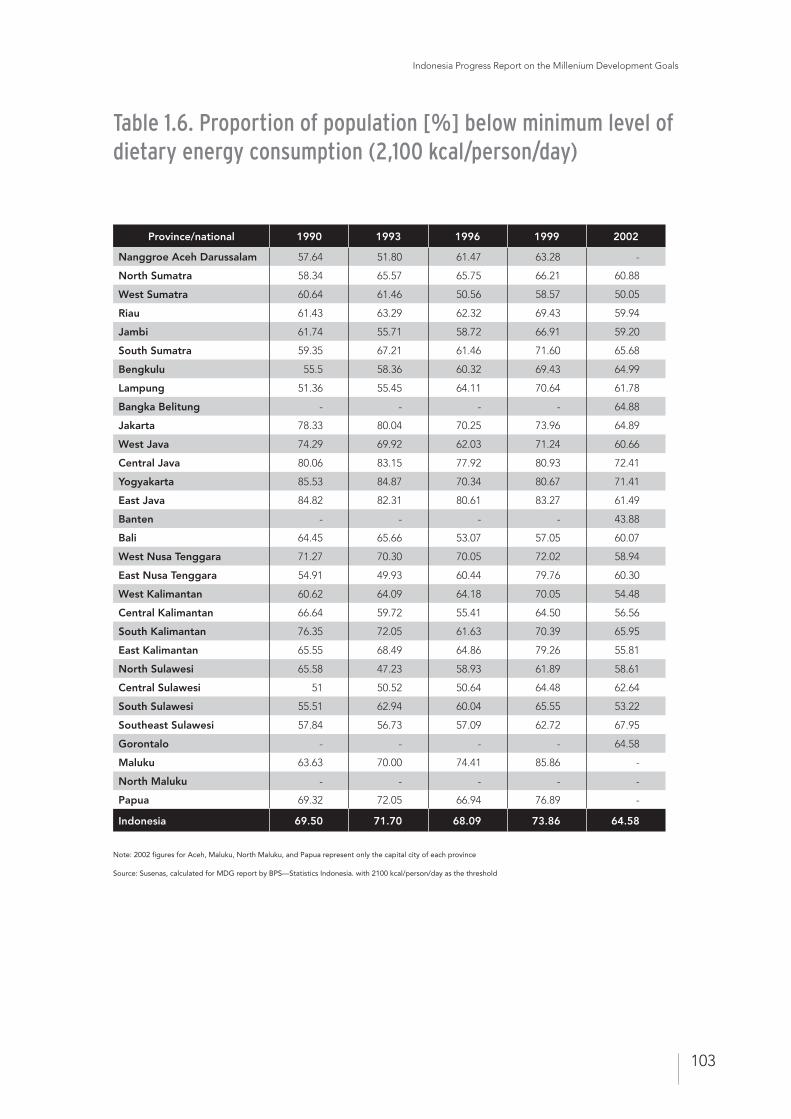
Indonesia Progress Report on the Millenium Development Goals
103
Province/national 1990 1993 1996 1999 2002
Nanggroe Aceh Darussalam 57.64 51.80 61.47 63.28 -
North Sumatra 58.34 65.57 65.75 66.21 60.88
West Sumatra 60.64 61.46 50.56 58.57 50.05
Riau 61.43 63.29 62.32 69.43 59.94
Jambi 61.74 55.71 58.72 66.91 59.20
South Sumatra 59.35 67.21 61.46 71.60 65.68
Bengkulu 55.5 58.36 60.32 69.43 64.99
Lampung 51.36 55.45 64.11 70.64 61.78
Bangka Belitung - - - - 64.88
Jakarta 78.33 80.04 70.25 73.96 64.89
West Java 74.29 69.92 62.03 71.24 60.66
Central Java 80.06 83.15 77.92 80.93 72.41
Yogyakarta 85.53 84.87 70.34 80.67 71.41
East Java 84.82 82.31 80.61 83.27 61.49
Banten - - - - 43.88
Bali 64.45 65.66 53.07 57.05 60.07
West Nusa Tenggara 71.27 70.30 70.05 72.02 58.94
East Nusa Tenggara 54.91 49.93 60.44 79.76 60.30
West Kalimantan 60.62 64.09 64.18 70.05 54.48
Central Kalimantan 66.64 59.72 55.41 64.50 56.56
South Kalimantan 76.35 72.05 61.63 70.39 65.95
East Kalimantan 65.55 68.49 64.86 79.26 55.81
North Sulawesi 65.58 47.23 58.93 61.89 58.61
Central Sulawesi 51 50.52 50.64 64.48 62.64
South Sulawesi 55.51 62.94 60.04 65.55 53.22
Southeast Sulawesi 57.84 56.73 57.09 62.72 67.95
Gorontalo - - - - 64.58
Maluku 63.63 70.00 74.41 85.86 -
North Maluku - - - - -
Papua 69.32 72.05 66.94 76.89 -
Indonesia 69.50 71.70 68.09 73.86 64.58
Note: 2002 figures for Aceh, Maluku, North Maluku, and Papua represent only the capital city of each province
Source: Susenas, calculated for MDG report by BPS—Statistics Indonesia. with 2100 kcal/person/day as the threshold
Table 1.6. Proportion of population [%] below minimum level of dietary energy consumption (2,100 kcal/person/day)
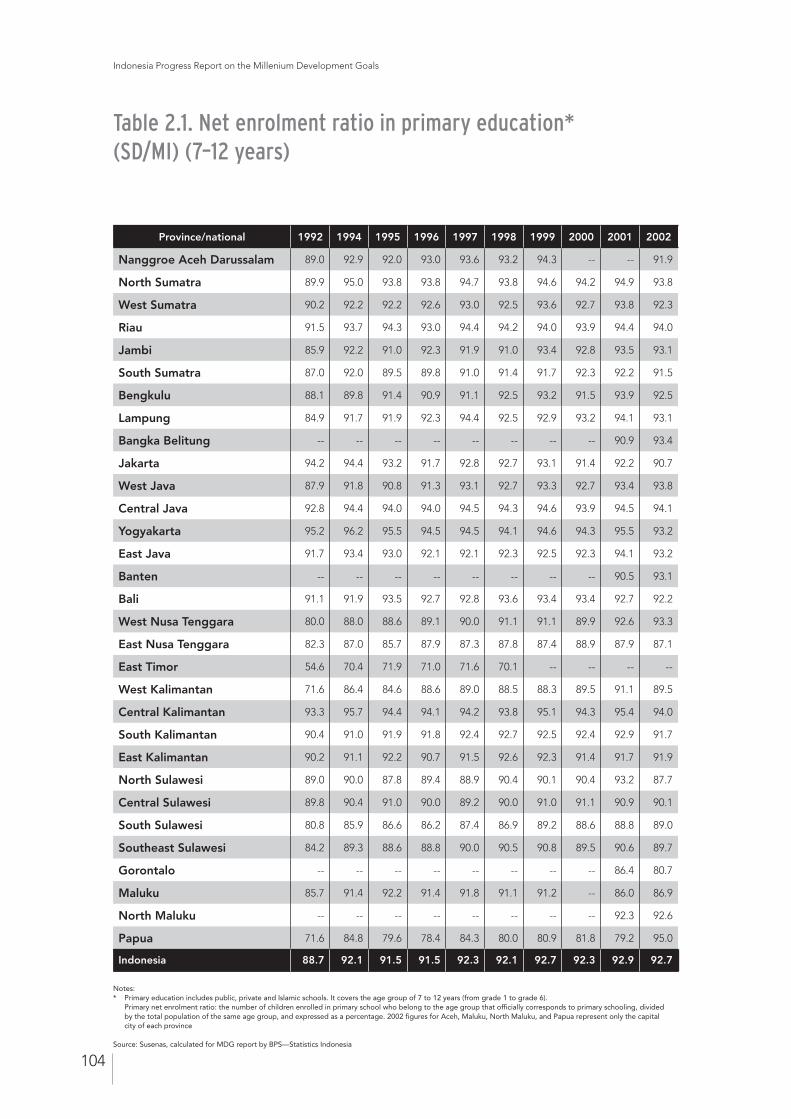
Indonesia Progress Report on the Millenium Development Goals
104
Province/national 1992 1994 1995 1996 1997 1998 1999 2000 2001 2002
Nanggroe Aceh Darussalam 89.0 92.9 92.0 93.0 93.6 93.2 94.3 -- -- 91.9
North Sumatra 89.9 95.0 93.8 93.8 94.7 93.8 94.6 94.2 94.9 93.8
West Sumatra 90.2 92.2 92.2 92.6 93.0 92.5 93.6 92.7 93.8 92.3
Riau 91.5 93.7 94.3 93.0 94.4 94.2 94.0 93.9 94.4 94.0
Jambi 85.9 92.2 91.0 92.3 91.9 91.0 93.4 92.8 93.5 93.1
South Sumatra 87.0 92.0 89.5 89.8 91.0 91.4 91.7 92.3 92.2 91.5
Bengkulu 88.1 89.8 91.4 90.9 91.1 92.5 93.2 91.5 93.9 92.5
Lampung 84.9 91.7 91.9 92.3 94.4 92.5 92.9 93.2 94.1 93.1
Bangka Belitung -- -- -- -- -- -- -- -- 90.9 93.4
Jakarta 94.2 94.4 93.2 91.7 92.8 92.7 93.1 91.4 92.2 90.7
West Java 87.9 91.8 90.8 91.3 93.1 92.7 93.3 92.7 93.4 93.8
Central Java 92.8 94.4 94.0 94.0 94.5 94.3 94.6 93.9 94.5 94.1
Yogyakarta 95.2 96.2 95.5 94.5 94.5 94.1 94.6 94.3 95.5 93.2
East Java 91.7 93.4 93.0 92.1 92.1 92.3 92.5 92.3 94.1 93.2
Banten -- -- -- -- -- -- -- -- 90.5 93.1
Bali 91.1 91.9 93.5 92.7 92.8 93.6 93.4 93.4 92.7 92.2
West Nusa Tenggara 80.0 88.0 88.6 89.1 90.0 91.1 91.1 89.9 92.6 93.3
East Nusa Tenggara 82.3 87.0 85.7 87.9 87.3 87.8 87.4 88.9 87.9 87.1
East Timor 54.6 70.4 71.9 71.0 71.6 70.1 -- -- -- --
West Kalimantan 71.6 86.4 84.6 88.6 89.0 88.5 88.3 89.5 91.1 89.5
Central Kalimantan 93.3 95.7 94.4 94.1 94.2 93.8 95.1 94.3 95.4 94.0
South Kalimantan 90.4 91.0 91.9 91.8 92.4 92.7 92.5 92.4 92.9 91.7
East Kalimantan 90.2 91.1 92.2 90.7 91.5 92.6 92.3 91.4 91.7 91.9
North Sulawesi 89.0 90.0 87.8 89.4 88.9 90.4 90.1 90.4 93.2 87.7
Central Sulawesi 89.8 90.4 91.0 90.0 89.2 90.0 91.0 91.1 90.9 90.1
South Sulawesi 80.8 85.9 86.6 86.2 87.4 86.9 89.2 88.6 88.8 89.0
Southeast Sulawesi 84.2 89.3 88.6 88.8 90.0 90.5 90.8 89.5 90.6 89.7
Gorontalo -- -- -- -- -- -- -- -- 86.4 80.7
Maluku 85.7 91.4 92.2 91.4 91.8 91.1 91.2 -- 86.0 86.9
North Maluku -- -- -- -- -- -- -- -- 92.3 92.6
Papua 71.6 84.8 79.6 78.4 84.3 80.0 80.9 81.8 79.2 95.0
Indonesia 88.7 92.1 91.5 91.5 92.3 92.1 92.7 92.3 92.9 92.7
Table 2.1. Net enrolment ratio in primary education* (SD/MI) (7–12 years)
Notes:* Primary education includes public, private and Islamic schools. It covers the age group of 7 to 12 years (from grade 1 to grade 6). Primary net enrolment ratio: the number of children enrolled in primary school who belong to the age group that officially corresponds to primary schooling, divided
by the total population of the same age group, and expressed as a percentage. 2002 figures for Aceh, Maluku, North Maluku, and Papua represent only the capital city of each province
Source: Susenas, calculated for MDG report by BPS—Statistics Indonesia
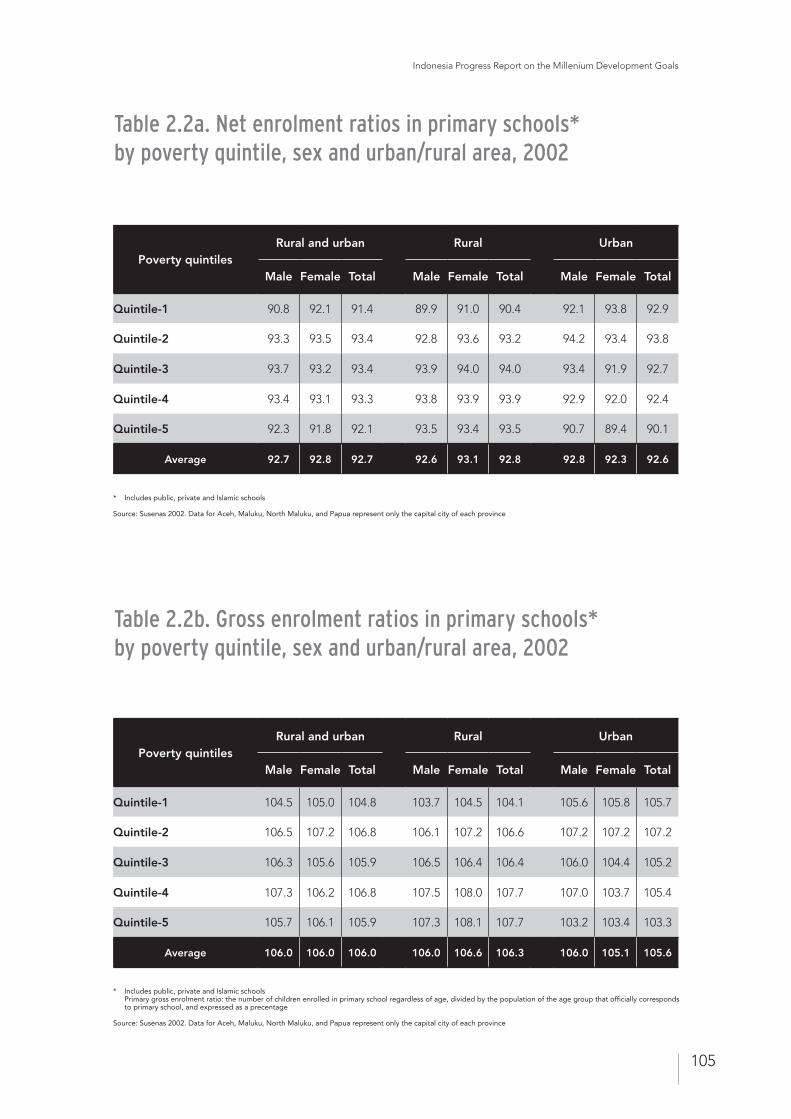
Indonesia Progress Report on the Millenium Development Goals
105
Table 2.2a. Net enrolment ratios in primary schools* by poverty quintile, sex and urban/rural area, 2002
Poverty quintilesRural and urban Rural Urban
Male Female Total Male Female Total Male Female Total
Quintile-1 90.8 92.1 91.4 89.9 91.0 90.4 92.1 93.8 92.9
Quintile-2 93.3 93.5 93.4 92.8 93.6 93.2 94.2 93.4 93.8
Quintile-3 93.7 93.2 93.4 93.9 94.0 94.0 93.4 91.9 92.7
Quintile-4 93.4 93.1 93.3 93.8 93.9 93.9 92.9 92.0 92.4
Quintile-5 92.3 91.8 92.1 93.5 93.4 93.5 90.7 89.4 90.1
Average 92.7 92.8 92.7 92.6 93.1 92.8 92.8 92.3 92.6
Table 2.2b. Gross enrolment ratios in primary schools* by poverty quintile, sex and urban/rural area, 2002
* Includes public, private and Islamic schools
Source: Susenas 2002. Data for Aceh, Maluku, North Maluku, and Papua represent only the capital city of each province
Poverty quintilesRural and urban Rural Urban
Male Female Total Male Female Total Male Female Total
Quintile-1 104.5 105.0 104.8 103.7 104.5 104.1 105.6 105.8 105.7
Quintile-2 106.5 107.2 106.8 106.1 107.2 106.6 107.2 107.2 107.2
Quintile-3 106.3 105.6 105.9 106.5 106.4 106.4 106.0 104.4 105.2
Quintile-4 107.3 106.2 106.8 107.5 108.0 107.7 107.0 103.7 105.4
Quintile-5 105.7 106.1 105.9 107.3 108.1 107.7 103.2 103.4 103.3
Average 106.0 106.0 106.0 106.0 106.6 106.3 106.0 105.1 105.6
* Includes public, private and Islamic schools Primary gross enrolment ratio: the number of children enrolled in primary school regardless of age, divided by the population of the age group that officially corresponds
to primary school, and expressed as a precentage
Source: Susenas 2002. Data for Aceh, Maluku, North Maluku, and Papua represent only the capital city of each province
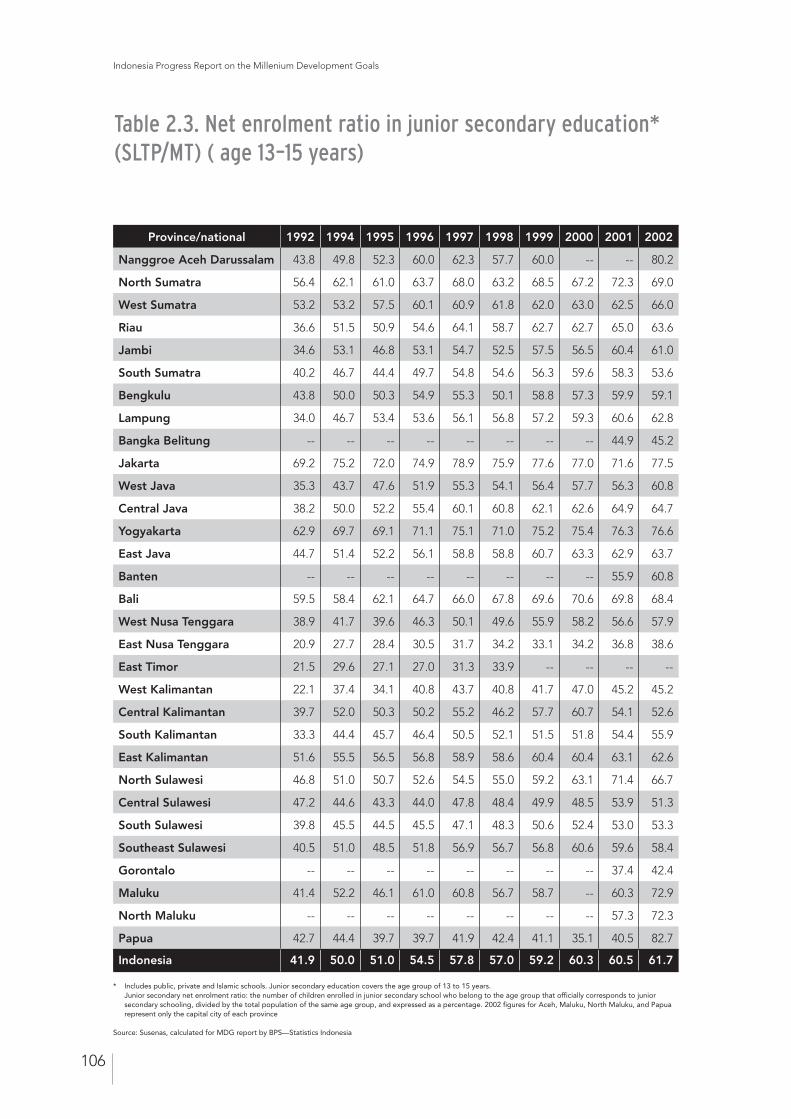
Indonesia Progress Report on the Millenium Development Goals
106
Table 2.3. Net enrolment ratio in junior secondary education* (SLTP/MT) ( age 13–15 years)
Province/national 1992 1994 1995 1996 1997 1998 1999 2000 2001 2002
Nanggroe Aceh Darussalam 43.8 49.8 52.3 60.0 62.3 57.7 60.0 -- -- 80.2
North Sumatra 56.4 62.1 61.0 63.7 68.0 63.2 68.5 67.2 72.3 69.0
West Sumatra 53.2 53.2 57.5 60.1 60.9 61.8 62.0 63.0 62.5 66.0
Riau 36.6 51.5 50.9 54.6 64.1 58.7 62.7 62.7 65.0 63.6
Jambi 34.6 53.1 46.8 53.1 54.7 52.5 57.5 56.5 60.4 61.0
South Sumatra 40.2 46.7 44.4 49.7 54.8 54.6 56.3 59.6 58.3 53.6
Bengkulu 43.8 50.0 50.3 54.9 55.3 50.1 58.8 57.3 59.9 59.1
Lampung 34.0 46.7 53.4 53.6 56.1 56.8 57.2 59.3 60.6 62.8
Bangka Belitung -- -- -- -- -- -- -- -- 44.9 45.2
Jakarta 69.2 75.2 72.0 74.9 78.9 75.9 77.6 77.0 71.6 77.5
West Java 35.3 43.7 47.6 51.9 55.3 54.1 56.4 57.7 56.3 60.8
Central Java 38.2 50.0 52.2 55.4 60.1 60.8 62.1 62.6 64.9 64.7
Yogyakarta 62.9 69.7 69.1 71.1 75.1 71.0 75.2 75.4 76.3 76.6
East Java 44.7 51.4 52.2 56.1 58.8 58.8 60.7 63.3 62.9 63.7
Banten -- -- -- -- -- -- -- -- 55.9 60.8
Bali 59.5 58.4 62.1 64.7 66.0 67.8 69.6 70.6 69.8 68.4
West Nusa Tenggara 38.9 41.7 39.6 46.3 50.1 49.6 55.9 58.2 56.6 57.9
East Nusa Tenggara 20.9 27.7 28.4 30.5 31.7 34.2 33.1 34.2 36.8 38.6
East Timor 21.5 29.6 27.1 27.0 31.3 33.9 -- -- -- --
West Kalimantan 22.1 37.4 34.1 40.8 43.7 40.8 41.7 47.0 45.2 45.2
Central Kalimantan 39.7 52.0 50.3 50.2 55.2 46.2 57.7 60.7 54.1 52.6
South Kalimantan 33.3 44.4 45.7 46.4 50.5 52.1 51.5 51.8 54.4 55.9
East Kalimantan 51.6 55.5 56.5 56.8 58.9 58.6 60.4 60.4 63.1 62.6
North Sulawesi 46.8 51.0 50.7 52.6 54.5 55.0 59.2 63.1 71.4 66.7
Central Sulawesi 47.2 44.6 43.3 44.0 47.8 48.4 49.9 48.5 53.9 51.3
South Sulawesi 39.8 45.5 44.5 45.5 47.1 48.3 50.6 52.4 53.0 53.3
Southeast Sulawesi 40.5 51.0 48.5 51.8 56.9 56.7 56.8 60.6 59.6 58.4
Gorontalo -- -- -- -- -- -- -- -- 37.4 42.4
Maluku 41.4 52.2 46.1 61.0 60.8 56.7 58.7 -- 60.3 72.9
North Maluku -- -- -- -- -- -- -- -- 57.3 72.3
Papua 42.7 44.4 39.7 39.7 41.9 42.4 41.1 35.1 40.5 82.7
Indonesia 41.9 50.0 51.0 54.5 57.8 57.0 59.2 60.3 60.5 61.7
* Includes public, private and Islamic schools. Junior secondary education covers the age group of 13 to 15 years. Junior secondary net enrolment ratio: the number of children enrolled in junior secondary school who belong to the age group that officially corresponds to junior
secondary schooling, divided by the total population of the same age group, and expressed as a percentage. 2002 figures for Aceh, Maluku, North Maluku, and Papua represent only the capital city of each province
Source: Susenas, calculated for MDG report by BPS—Statistics Indonesia
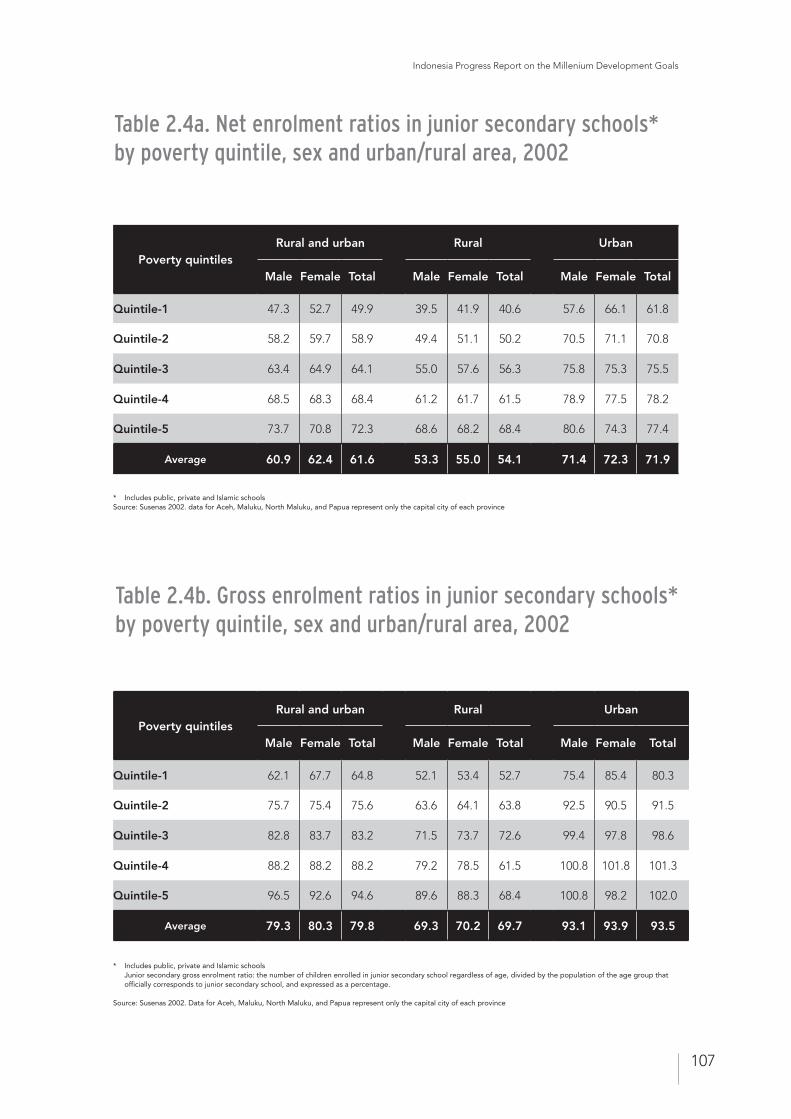
Indonesia Progress Report on the Millenium Development Goals
107
Table 2.4a. Net enrolment ratios in junior secondary schools* by poverty quintile, sex and urban/rural area, 2002
Table 2.4b. Gross enrolment ratios in junior secondary schools* by poverty quintile, sex and urban/rural area, 2002
Poverty quintilesRural and urban Rural Urban
Male Female Total Male Female Total Male Female Total
Quintile-1 47.3 52.7 49.9 39.5 41.9 40.6 57.6 66.1 61.8
Quintile-2 58.2 59.7 58.9 49.4 51.1 50.2 70.5 71.1 70.8
Quintile-3 63.4 64.9 64.1 55.0 57.6 56.3 75.8 75.3 75.5
Quintile-4 68.5 68.3 68.4 61.2 61.7 61.5 78.9 77.5 78.2
Quintile-5 73.7 70.8 72.3 68.6 68.2 68.4 80.6 74.3 77.4
Average 60.9 62.4 61.6 53.3 55.0 54.1 71.4 72.3 71.9
* Includes public, private and Islamic schools Source: Susenas 2002. data for Aceh, Maluku, North Maluku, and Papua represent only the capital city of each province
Poverty quintilesRural and urban Rural Urban
Male Female Total Male Female Total Male Female Total
Quintile-1 62.1 67.7 64.8 52.1 53.4 52.7 75.4 85.4 80.3
Quintile-2 75.7 75.4 75.6 63.6 64.1 63.8 92.5 90.5 91.5
Quintile-3 82.8 83.7 83.2 71.5 73.7 72.6 99.4 97.8 98.6
Quintile-4 88.2 88.2 88.2 79.2 78.5 61.5 100.8 101.8 101.3
Quintile-5 96.5 92.6 94.6 89.6 88.3 68.4 100.8 98.2 102.0
Average 79.3 80.3 79.8 69.3 70.2 69.7 93.1 93.9 93.5
* Includes public, private and Islamic schools Junior secondary gross enrolment ratio: the number of children enrolled in junior secondary school regardless of age, divided by the population of the age group that
officially corresponds to junior secondary school, and expressed as a percentage.
Source: Susenas 2002. Data for Aceh, Maluku, North Maluku, and Papua represent only the capital city of each province
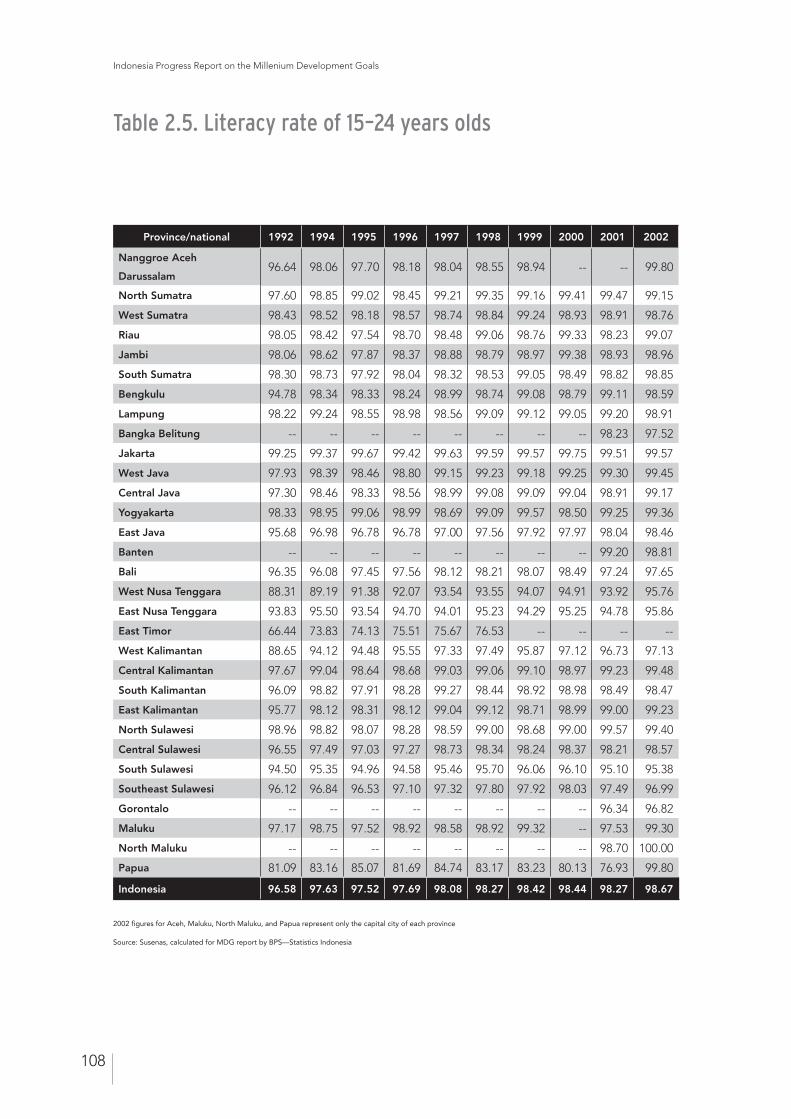
Indonesia Progress Report on the Millenium Development Goals
108
Table 2.5. Literacy rate of 15–24 years olds
2002 figures for Aceh, Maluku, North Maluku, and Papua represent only the capital city of each province
Source: Susenas, calculated for MDG report by BPS—Statistics Indonesia
Province/national 1992 1994 1995 1996 1997 1998 1999 2000 2001 2002
Nanggroe Aceh
Darussalam96.64 98.06 97.70 98.18 98.04 98.55 98.94 -- -- 99.80
North Sumatra 97.60 98.85 99.02 98.45 99.21 99.35 99.16 99.41 99.47 99.15
West Sumatra 98.43 98.52 98.18 98.57 98.74 98.84 99.24 98.93 98.91 98.76
Riau 98.05 98.42 97.54 98.70 98.48 99.06 98.76 99.33 98.23 99.07
Jambi 98.06 98.62 97.87 98.37 98.88 98.79 98.97 99.38 98.93 98.96
South Sumatra 98.30 98.73 97.92 98.04 98.32 98.53 99.05 98.49 98.82 98.85
Bengkulu 94.78 98.34 98.33 98.24 98.99 98.74 99.08 98.79 99.11 98.59
Lampung 98.22 99.24 98.55 98.98 98.56 99.09 99.12 99.05 99.20 98.91
Bangka Belitung -- -- -- -- -- -- -- -- 98.23 97.52
Jakarta 99.25 99.37 99.67 99.42 99.63 99.59 99.57 99.75 99.51 99.57
West Java 97.93 98.39 98.46 98.80 99.15 99.23 99.18 99.25 99.30 99.45
Central Java 97.30 98.46 98.33 98.56 98.99 99.08 99.09 99.04 98.91 99.17
Yogyakarta 98.33 98.95 99.06 98.99 98.69 99.09 99.57 98.50 99.25 99.36
East Java 95.68 96.98 96.78 96.78 97.00 97.56 97.92 97.97 98.04 98.46
Banten -- -- -- -- -- -- -- -- 99.20 98.81
Bali 96.35 96.08 97.45 97.56 98.12 98.21 98.07 98.49 97.24 97.65
West Nusa Tenggara 88.31 89.19 91.38 92.07 93.54 93.55 94.07 94.91 93.92 95.76
East Nusa Tenggara 93.83 95.50 93.54 94.70 94.01 95.23 94.29 95.25 94.78 95.86
East Timor 66.44 73.83 74.13 75.51 75.67 76.53 -- -- -- --
West Kalimantan 88.65 94.12 94.48 95.55 97.33 97.49 95.87 97.12 96.73 97.13
Central Kalimantan 97.67 99.04 98.64 98.68 99.03 99.06 99.10 98.97 99.23 99.48
South Kalimantan 96.09 98.82 97.91 98.28 99.27 98.44 98.92 98.98 98.49 98.47
East Kalimantan 95.77 98.12 98.31 98.12 99.04 99.12 98.71 98.99 99.00 99.23
North Sulawesi 98.96 98.82 98.07 98.28 98.59 99.00 98.68 99.00 99.57 99.40
Central Sulawesi 96.55 97.49 97.03 97.27 98.73 98.34 98.24 98.37 98.21 98.57
South Sulawesi 94.50 95.35 94.96 94.58 95.46 95.70 96.06 96.10 95.10 95.38
Southeast Sulawesi 96.12 96.84 96.53 97.10 97.32 97.80 97.92 98.03 97.49 96.99
Gorontalo -- -- -- -- -- -- -- -- 96.34 96.82
Maluku 97.17 98.75 97.52 98.92 98.58 98.92 99.32 -- 97.53 99.30
North Maluku -- -- -- -- -- -- -- -- 98.70 100.00
Papua 81.09 83.16 85.07 81.69 84.74 83.17 83.23 80.13 76.93 99.80
Indonesia 96.58 97.63 97.52 97.69 98.08 98.27 98.42 98.44 98.27 98.67
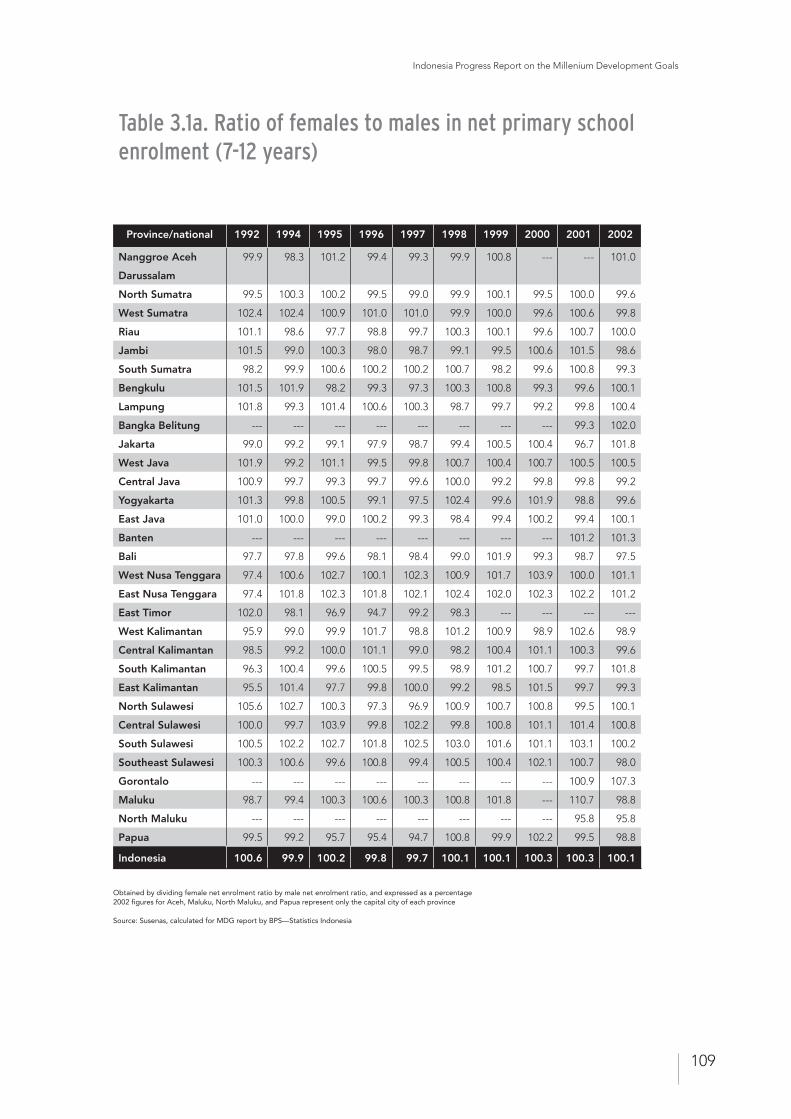
Indonesia Progress Report on the Millenium Development Goals
109
Province/national 1992 1994 1995 1996 1997 1998 1999 2000 2001 2002
Nanggroe Aceh
Darussalam
99.9 98.3 101.2 99.4 99.3 99.9 100.8 --- --- 101.0
North Sumatra 99.5 100.3 100.2 99.5 99.0 99.9 100.1 99.5 100.0 99.6
West Sumatra 102.4 102.4 100.9 101.0 101.0 99.9 100.0 99.6 100.6 99.8
Riau 101.1 98.6 97.7 98.8 99.7 100.3 100.1 99.6 100.7 100.0
Jambi 101.5 99.0 100.3 98.0 98.7 99.1 99.5 100.6 101.5 98.6
South Sumatra 98.2 99.9 100.6 100.2 100.2 100.7 98.2 99.6 100.8 99.3
Bengkulu 101.5 101.9 98.2 99.3 97.3 100.3 100.8 99.3 99.6 100.1
Lampung 101.8 99.3 101.4 100.6 100.3 98.7 99.7 99.2 99.8 100.4
Bangka Belitung --- --- --- --- --- --- --- --- 99.3 102.0
Jakarta 99.0 99.2 99.1 97.9 98.7 99.4 100.5 100.4 96.7 101.8
West Java 101.9 99.2 101.1 99.5 99.8 100.7 100.4 100.7 100.5 100.5
Central Java 100.9 99.7 99.3 99.7 99.6 100.0 99.2 99.8 99.8 99.2
Yogyakarta 101.3 99.8 100.5 99.1 97.5 102.4 99.6 101.9 98.8 99.6
East Java 101.0 100.0 99.0 100.2 99.3 98.4 99.4 100.2 99.4 100.1
Banten --- --- --- --- --- --- --- --- 101.2 101.3
Bali 97.7 97.8 99.6 98.1 98.4 99.0 101.9 99.3 98.7 97.5
West Nusa Tenggara 97.4 100.6 102.7 100.1 102.3 100.9 101.7 103.9 100.0 101.1
East Nusa Tenggara 97.4 101.8 102.3 101.8 102.1 102.4 102.0 102.3 102.2 101.2
East Timor 102.0 98.1 96.9 94.7 99.2 98.3 --- --- --- ---
West Kalimantan 95.9 99.0 99.9 101.7 98.8 101.2 100.9 98.9 102.6 98.9
Central Kalimantan 98.5 99.2 100.0 101.1 99.0 98.2 100.4 101.1 100.3 99.6
South Kalimantan 96.3 100.4 99.6 100.5 99.5 98.9 101.2 100.7 99.7 101.8
East Kalimantan 95.5 101.4 97.7 99.8 100.0 99.2 98.5 101.5 99.7 99.3
North Sulawesi 105.6 102.7 100.3 97.3 96.9 100.9 100.7 100.8 99.5 100.1
Central Sulawesi 100.0 99.7 103.9 99.8 102.2 99.8 100.8 101.1 101.4 100.8
South Sulawesi 100.5 102.2 102.7 101.8 102.5 103.0 101.6 101.1 103.1 100.2
Southeast Sulawesi 100.3 100.6 99.6 100.8 99.4 100.5 100.4 102.1 100.7 98.0
Gorontalo --- --- --- --- --- --- --- --- 100.9 107.3
Maluku 98.7 99.4 100.3 100.6 100.3 100.8 101.8 --- 110.7 98.8
North Maluku --- --- --- --- --- --- --- --- 95.8 95.8
Papua 99.5 99.2 95.7 95.4 94.7 100.8 99.9 102.2 99.5 98.8
Indonesia 100.6 99.9 100.2 99.8 99.7 100.1 100.1 100.3 100.3 100.1
Table 3.1a. Ratio of females to males in net primary school enrolment (7-12 years)
Obtained by dividing female net enrolment ratio by male net enrolment ratio, and expressed as a percentage2002 figures for Aceh, Maluku, North Maluku, and Papua represent only the capital city of each province
Source: Susenas, calculated for MDG report by BPS—Statistics Indonesia
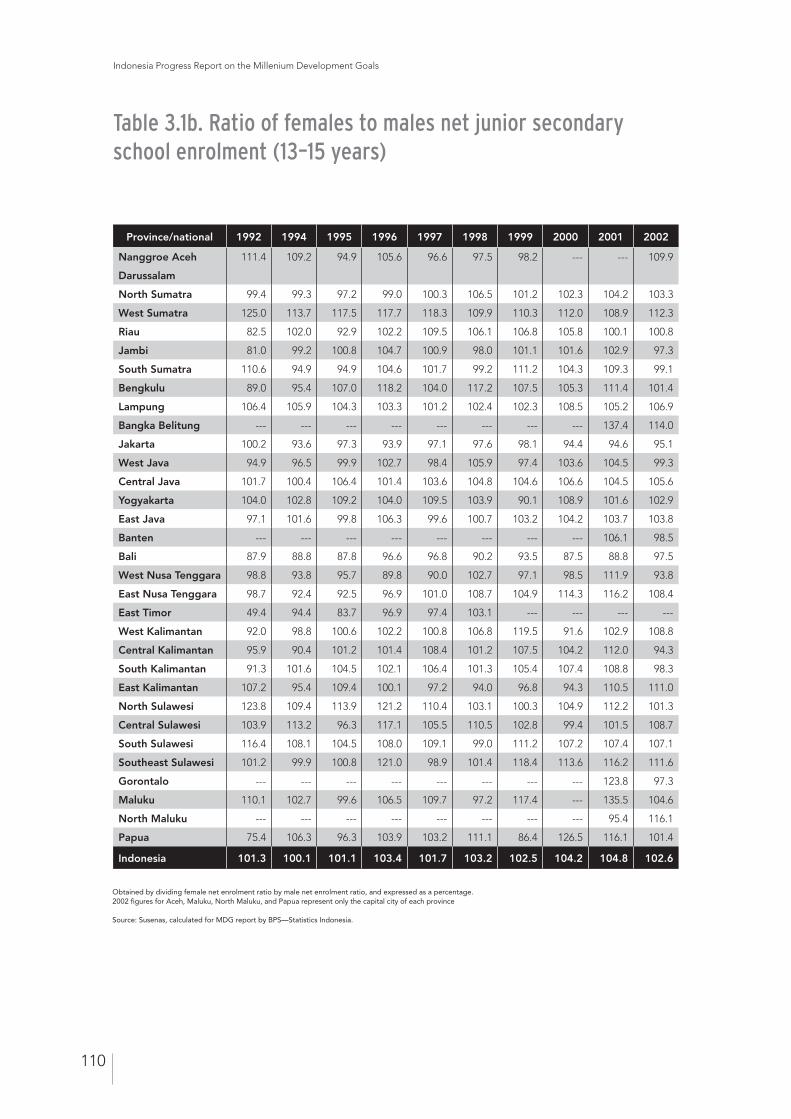
Indonesia Progress Report on the Millenium Development Goals
110
Province/national 1992 1994 1995 1996 1997 1998 1999 2000 2001 2002
Nanggroe Aceh
Darussalam
111.4 109.2 94.9 105.6 96.6 97.5 98.2 --- --- 109.9
North Sumatra 99.4 99.3 97.2 99.0 100.3 106.5 101.2 102.3 104.2 103.3
West Sumatra 125.0 113.7 117.5 117.7 118.3 109.9 110.3 112.0 108.9 112.3
Riau 82.5 102.0 92.9 102.2 109.5 106.1 106.8 105.8 100.1 100.8
Jambi 81.0 99.2 100.8 104.7 100.9 98.0 101.1 101.6 102.9 97.3
South Sumatra 110.6 94.9 94.9 104.6 101.7 99.2 111.2 104.3 109.3 99.1
Bengkulu 89.0 95.4 107.0 118.2 104.0 117.2 107.5 105.3 111.4 101.4
Lampung 106.4 105.9 104.3 103.3 101.2 102.4 102.3 108.5 105.2 106.9
Bangka Belitung --- --- --- --- --- --- --- --- 137.4 114.0
Jakarta 100.2 93.6 97.3 93.9 97.1 97.6 98.1 94.4 94.6 95.1
West Java 94.9 96.5 99.9 102.7 98.4 105.9 97.4 103.6 104.5 99.3
Central Java 101.7 100.4 106.4 101.4 103.6 104.8 104.6 106.6 104.5 105.6
Yogyakarta 104.0 102.8 109.2 104.0 109.5 103.9 90.1 108.9 101.6 102.9
East Java 97.1 101.6 99.8 106.3 99.6 100.7 103.2 104.2 103.7 103.8
Banten --- --- --- --- --- --- --- --- 106.1 98.5
Bali 87.9 88.8 87.8 96.6 96.8 90.2 93.5 87.5 88.8 97.5
West Nusa Tenggara 98.8 93.8 95.7 89.8 90.0 102.7 97.1 98.5 111.9 93.8
East Nusa Tenggara 98.7 92.4 92.5 96.9 101.0 108.7 104.9 114.3 116.2 108.4
East Timor 49.4 94.4 83.7 96.9 97.4 103.1 --- --- --- ---
West Kalimantan 92.0 98.8 100.6 102.2 100.8 106.8 119.5 91.6 102.9 108.8
Central Kalimantan 95.9 90.4 101.2 101.4 108.4 101.2 107.5 104.2 112.0 94.3
South Kalimantan 91.3 101.6 104.5 102.1 106.4 101.3 105.4 107.4 108.8 98.3
East Kalimantan 107.2 95.4 109.4 100.1 97.2 94.0 96.8 94.3 110.5 111.0
North Sulawesi 123.8 109.4 113.9 121.2 110.4 103.1 100.3 104.9 112.2 101.3
Central Sulawesi 103.9 113.2 96.3 117.1 105.5 110.5 102.8 99.4 101.5 108.7
South Sulawesi 116.4 108.1 104.5 108.0 109.1 99.0 111.2 107.2 107.4 107.1
Southeast Sulawesi 101.2 99.9 100.8 121.0 98.9 101.4 118.4 113.6 116.2 111.6
Gorontalo --- --- --- --- --- --- --- --- 123.8 97.3
Maluku 110.1 102.7 99.6 106.5 109.7 97.2 117.4 --- 135.5 104.6
North Maluku --- --- --- --- --- --- --- --- 95.4 116.1
Papua 75.4 106.3 96.3 103.9 103.2 111.1 86.4 126.5 116.1 101.4
Indonesia 101.3 100.1 101.1 103.4 101.7 103.2 102.5 104.2 104.8 102.6
Table 3.1b. Ratio of females to males net junior secondary school enrolment (13–15 years)
Obtained by dividing female net enrolment ratio by male net enrolment ratio, and expressed as a percentage.2002 figures for Aceh, Maluku, North Maluku, and Papua represent only the capital city of each province Source: Susenas, calculated for MDG report by BPS—Statistics Indonesia.
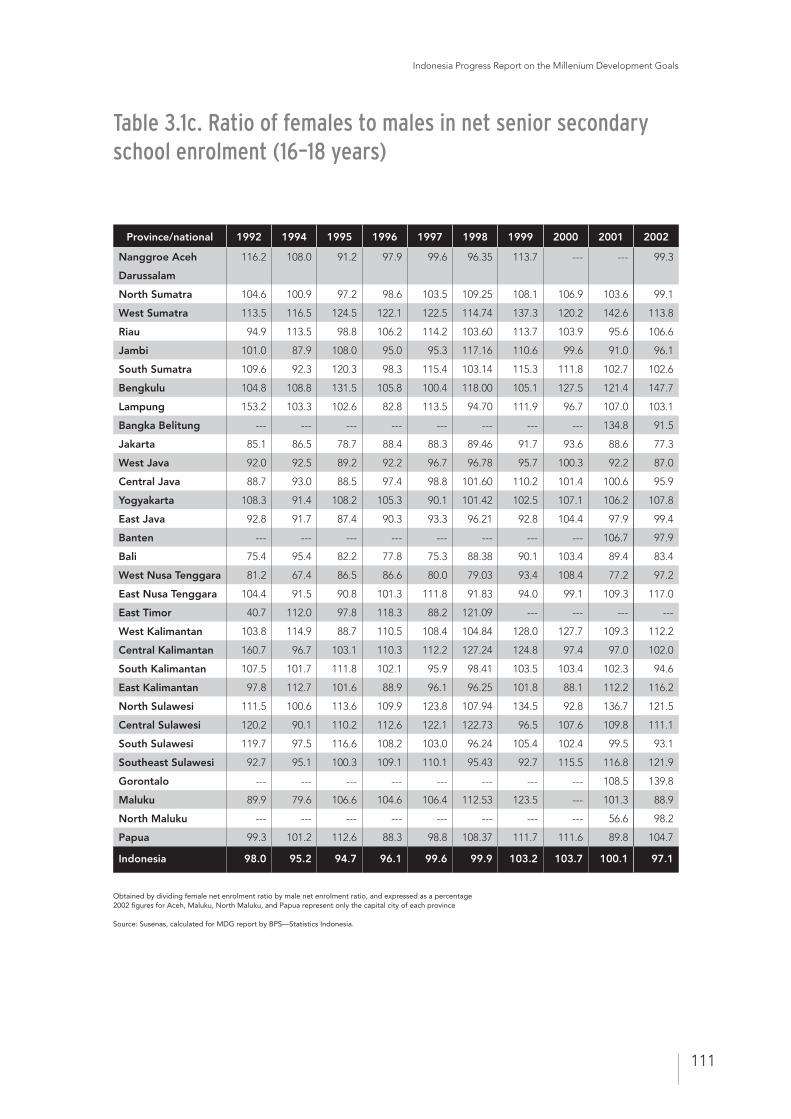
Indonesia Progress Report on the Millenium Development Goals
111
Table 3.1c. Ratio of females to males in net senior secondary school enrolment (16–18 years)
Obtained by dividing female net enrolment ratio by male net enrolment ratio, and expressed as a percentage 2002 figures for Aceh, Maluku, North Maluku, and Papua represent only the capital city of each province
Source: Susenas, calculated for MDG report by BPS—Statistics Indonesia.
Province/national 1992 1994 1995 1996 1997 1998 1999 2000 2001 2002
Nanggroe Aceh
Darussalam
116.2 108.0 91.2 97.9 99.6 96.35 113.7 --- --- 99.3
North Sumatra 104.6 100.9 97.2 98.6 103.5 109.25 108.1 106.9 103.6 99.1
West Sumatra 113.5 116.5 124.5 122.1 122.5 114.74 137.3 120.2 142.6 113.8
Riau 94.9 113.5 98.8 106.2 114.2 103.60 113.7 103.9 95.6 106.6
Jambi 101.0 87.9 108.0 95.0 95.3 117.16 110.6 99.6 91.0 96.1
South Sumatra 109.6 92.3 120.3 98.3 115.4 103.14 115.3 111.8 102.7 102.6
Bengkulu 104.8 108.8 131.5 105.8 100.4 118.00 105.1 127.5 121.4 147.7
Lampung 153.2 103.3 102.6 82.8 113.5 94.70 111.9 96.7 107.0 103.1
Bangka Belitung --- --- --- --- --- --- --- --- 134.8 91.5
Jakarta 85.1 86.5 78.7 88.4 88.3 89.46 91.7 93.6 88.6 77.3
West Java 92.0 92.5 89.2 92.2 96.7 96.78 95.7 100.3 92.2 87.0
Central Java 88.7 93.0 88.5 97.4 98.8 101.60 110.2 101.4 100.6 95.9
Yogyakarta 108.3 91.4 108.2 105.3 90.1 101.42 102.5 107.1 106.2 107.8
East Java 92.8 91.7 87.4 90.3 93.3 96.21 92.8 104.4 97.9 99.4
Banten --- --- --- --- --- --- --- --- 106.7 97.9
Bali 75.4 95.4 82.2 77.8 75.3 88.38 90.1 103.4 89.4 83.4
West Nusa Tenggara 81.2 67.4 86.5 86.6 80.0 79.03 93.4 108.4 77.2 97.2
East Nusa Tenggara 104.4 91.5 90.8 101.3 111.8 91.83 94.0 99.1 109.3 117.0
East Timor 40.7 112.0 97.8 118.3 88.2 121.09 --- --- --- ---
West Kalimantan 103.8 114.9 88.7 110.5 108.4 104.84 128.0 127.7 109.3 112.2
Central Kalimantan 160.7 96.7 103.1 110.3 112.2 127.24 124.8 97.4 97.0 102.0
South Kalimantan 107.5 101.7 111.8 102.1 95.9 98.41 103.5 103.4 102.3 94.6
East Kalimantan 97.8 112.7 101.6 88.9 96.1 96.25 101.8 88.1 112.2 116.2
North Sulawesi 111.5 100.6 113.6 109.9 123.8 107.94 134.5 92.8 136.7 121.5
Central Sulawesi 120.2 90.1 110.2 112.6 122.1 122.73 96.5 107.6 109.8 111.1
South Sulawesi 119.7 97.5 116.6 108.2 103.0 96.24 105.4 102.4 99.5 93.1
Southeast Sulawesi 92.7 95.1 100.3 109.1 110.1 95.43 92.7 115.5 116.8 121.9
Gorontalo --- --- --- --- --- --- --- --- 108.5 139.8
Maluku 89.9 79.6 106.6 104.6 106.4 112.53 123.5 --- 101.3 88.9
North Maluku --- --- --- --- --- --- --- --- 56.6 98.2
Papua 99.3 101.2 112.6 88.3 98.8 108.37 111.7 111.6 89.8 104.7
Indonesia 98.0 95.2 94.7 96.1 99.6 99.9 103.2 103.7 100.1 97.1
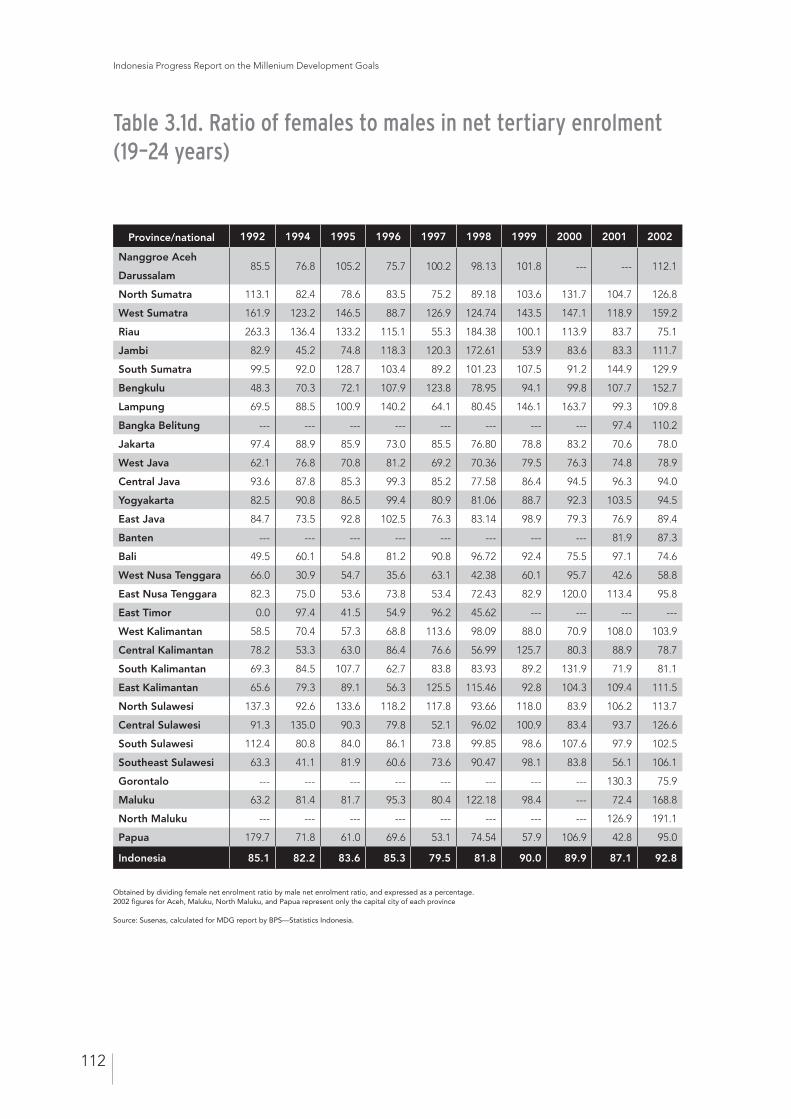
Indonesia Progress Report on the Millenium Development Goals
112
Table 3.1d. Ratio of females to males in net tertiary enrolment (19–24 years)
Obtained by dividing female net enrolment ratio by male net enrolment ratio, and expressed as a percentage. 2002 figures for Aceh, Maluku, North Maluku, and Papua represent only the capital city of each province Source: Susenas, calculated for MDG report by BPS—Statistics Indonesia.
Province/national 1992 1994 1995 1996 1997 1998 1999 2000 2001 2002
Nanggroe Aceh
Darussalam85.5 76.8 105.2 75.7 100.2 98.13 101.8 --- --- 112.1
North Sumatra 113.1 82.4 78.6 83.5 75.2 89.18 103.6 131.7 104.7 126.8
West Sumatra 161.9 123.2 146.5 88.7 126.9 124.74 143.5 147.1 118.9 159.2
Riau 263.3 136.4 133.2 115.1 55.3 184.38 100.1 113.9 83.7 75.1
Jambi 82.9 45.2 74.8 118.3 120.3 172.61 53.9 83.6 83.3 111.7
South Sumatra 99.5 92.0 128.7 103.4 89.2 101.23 107.5 91.2 144.9 129.9
Bengkulu 48.3 70.3 72.1 107.9 123.8 78.95 94.1 99.8 107.7 152.7
Lampung 69.5 88.5 100.9 140.2 64.1 80.45 146.1 163.7 99.3 109.8
Bangka Belitung --- --- --- --- --- --- --- --- 97.4 110.2
Jakarta 97.4 88.9 85.9 73.0 85.5 76.80 78.8 83.2 70.6 78.0
West Java 62.1 76.8 70.8 81.2 69.2 70.36 79.5 76.3 74.8 78.9
Central Java 93.6 87.8 85.3 99.3 85.2 77.58 86.4 94.5 96.3 94.0
Yogyakarta 82.5 90.8 86.5 99.4 80.9 81.06 88.7 92.3 103.5 94.5
East Java 84.7 73.5 92.8 102.5 76.3 83.14 98.9 79.3 76.9 89.4
Banten --- --- --- --- --- --- --- --- 81.9 87.3
Bali 49.5 60.1 54.8 81.2 90.8 96.72 92.4 75.5 97.1 74.6
West Nusa Tenggara 66.0 30.9 54.7 35.6 63.1 42.38 60.1 95.7 42.6 58.8
East Nusa Tenggara 82.3 75.0 53.6 73.8 53.4 72.43 82.9 120.0 113.4 95.8
East Timor 0.0 97.4 41.5 54.9 96.2 45.62 --- --- --- ---
West Kalimantan 58.5 70.4 57.3 68.8 113.6 98.09 88.0 70.9 108.0 103.9
Central Kalimantan 78.2 53.3 63.0 86.4 76.6 56.99 125.7 80.3 88.9 78.7
South Kalimantan 69.3 84.5 107.7 62.7 83.8 83.93 89.2 131.9 71.9 81.1
East Kalimantan 65.6 79.3 89.1 56.3 125.5 115.46 92.8 104.3 109.4 111.5
North Sulawesi 137.3 92.6 133.6 118.2 117.8 93.66 118.0 83.9 106.2 113.7
Central Sulawesi 91.3 135.0 90.3 79.8 52.1 96.02 100.9 83.4 93.7 126.6
South Sulawesi 112.4 80.8 84.0 86.1 73.8 99.85 98.6 107.6 97.9 102.5
Southeast Sulawesi 63.3 41.1 81.9 60.6 73.6 90.47 98.1 83.8 56.1 106.1
Gorontalo --- --- --- --- --- --- --- --- 130.3 75.9
Maluku 63.2 81.4 81.7 95.3 80.4 122.18 98.4 --- 72.4 168.8
North Maluku --- --- --- --- --- --- --- --- 126.9 191.1
Papua 179.7 71.8 61.0 69.6 53.1 74.54 57.9 106.9 42.8 95.0
Indonesia 85.1 82.2 83.6 85.3 79.5 81.8 90.0 89.9 87.1 92.8
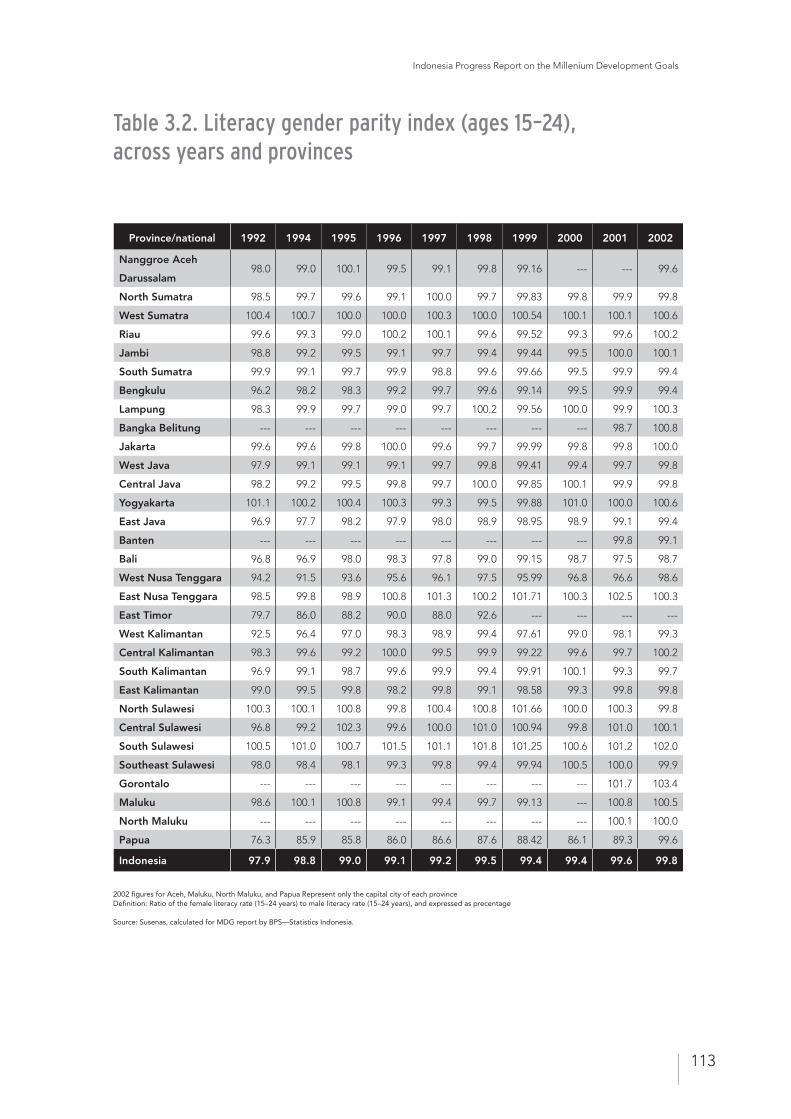
Indonesia Progress Report on the Millenium Development Goals
113
Province/national 1992 1994 1995 1996 1997 1998 1999 2000 2001 2002
Nanggroe Aceh
Darussalam98.0 99.0 100.1 99.5 99.1 99.8 99.16 --- --- 99.6
North Sumatra 98.5 99.7 99.6 99.1 100.0 99.7 99.83 99.8 99.9 99.8
West Sumatra 100.4 100.7 100.0 100.0 100.3 100.0 100.54 100.1 100.1 100.6
Riau 99.6 99.3 99.0 100.2 100.1 99.6 99.52 99.3 99.6 100.2
Jambi 98.8 99.2 99.5 99.1 99.7 99.4 99.44 99.5 100.0 100.1
South Sumatra 99.9 99.1 99.7 99.9 98.8 99.6 99.66 99.5 99.9 99.4
Bengkulu 96.2 98.2 98.3 99.2 99.7 99.6 99.14 99.5 99.9 99.4
Lampung 98.3 99.9 99.7 99.0 99.7 100.2 99.56 100.0 99.9 100.3
Bangka Belitung --- --- --- --- --- --- --- --- 98.7 100.8
Jakarta 99.6 99.6 99.8 100.0 99.6 99.7 99.99 99.8 99.8 100.0
West Java 97.9 99.1 99.1 99.1 99.7 99.8 99.41 99.4 99.7 99.8
Central Java 98.2 99.2 99.5 99.8 99.7 100.0 99.85 100.1 99.9 99.8
Yogyakarta 101.1 100.2 100.4 100.3 99.3 99.5 99.88 101.0 100.0 100.6
East Java 96.9 97.7 98.2 97.9 98.0 98.9 98.95 98.9 99.1 99.4
Banten --- --- --- --- --- --- --- --- 99.8 99.1
Bali 96.8 96.9 98.0 98.3 97.8 99.0 99.15 98.7 97.5 98.7
West Nusa Tenggara 94.2 91.5 93.6 95.6 96.1 97.5 95.99 96.8 96.6 98.6
East Nusa Tenggara 98.5 99.8 98.9 100.8 101.3 100.2 101.71 100.3 102.5 100.3
East Timor 79.7 86.0 88.2 90.0 88.0 92.6 --- --- --- ---
West Kalimantan 92.5 96.4 97.0 98.3 98.9 99.4 97.61 99.0 98.1 99.3
Central Kalimantan 98.3 99.6 99.2 100.0 99.5 99.9 99.22 99.6 99.7 100.2
South Kalimantan 96.9 99.1 98.7 99.6 99.9 99.4 99.91 100.1 99.3 99.7
East Kalimantan 99.0 99.5 99.8 98.2 99.8 99.1 98.58 99.3 99.8 99.8
North Sulawesi 100.3 100.1 100.8 99.8 100.4 100.8 101.66 100.0 100.3 99.8
Central Sulawesi 96.8 99.2 102.3 99.6 100.0 101.0 100.94 99.8 101.0 100.1
South Sulawesi 100.5 101.0 100.7 101.5 101.1 101.8 101.25 100.6 101.2 102.0
Southeast Sulawesi 98.0 98.4 98.1 99.3 99.8 99.4 99.94 100.5 100.0 99.9
Gorontalo --- --- --- --- --- --- --- --- 101.7 103.4
Maluku 98.6 100.1 100.8 99.1 99.4 99.7 99.13 --- 100.8 100.5
North Maluku --- --- --- --- --- --- --- --- 100.1 100.0
Papua 76.3 85.9 85.8 86.0 86.6 87.6 88.42 86.1 89.3 99.6
Indonesia 97.9 98.8 99.0 99.1 99.2 99.5 99.4 99.4 99.6 99.8
Table 3.2. Literacy gender parity index (ages 15–24), across years and provinces
2002 figures for Aceh, Maluku, North Maluku, and Papua Represent only the capital city of each provinceDefinition: Ratio of the female literacy rate (15–24 years) to male literacy rate (15–24 years), and expressed as precentage
Source: Susenas, calculated for MDG report by BPS—Statistics Indonesia.
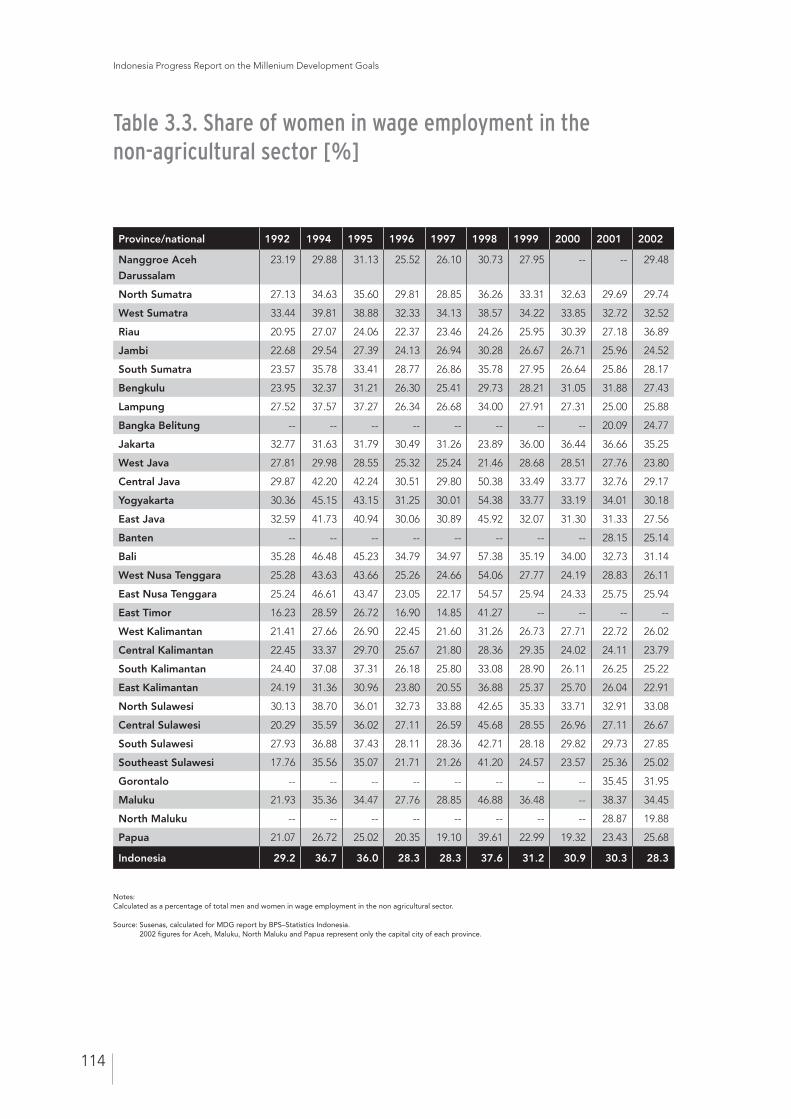
Indonesia Progress Report on the Millenium Development Goals
114
Table 3.3. Share of women in wage employment in the non-agricultural sector [%]
Province/national 1992 1994 1995 1996 1997 1998 1999 2000 2001 2002
Nanggroe Aceh
Darussalam
23.19 29.88 31.13 25.52 26.10 30.73 27.95 -- -- 29.48
North Sumatra 27.13 34.63 35.60 29.81 28.85 36.26 33.31 32.63 29.69 29.74
West Sumatra 33.44 39.81 38.88 32.33 34.13 38.57 34.22 33.85 32.72 32.52
Riau 20.95 27.07 24.06 22.37 23.46 24.26 25.95 30.39 27.18 36.89
Jambi 22.68 29.54 27.39 24.13 26.94 30.28 26.67 26.71 25.96 24.52
South Sumatra 23.57 35.78 33.41 28.77 26.86 35.78 27.95 26.64 25.86 28.17
Bengkulu 23.95 32.37 31.21 26.30 25.41 29.73 28.21 31.05 31.88 27.43
Lampung 27.52 37.57 37.27 26.34 26.68 34.00 27.91 27.31 25.00 25.88
Bangka Belitung -- -- -- -- -- -- -- -- 20.09 24.77
Jakarta 32.77 31.63 31.79 30.49 31.26 23.89 36.00 36.44 36.66 35.25
West Java 27.81 29.98 28.55 25.32 25.24 21.46 28.68 28.51 27.76 23.80
Central Java 29.87 42.20 42.24 30.51 29.80 50.38 33.49 33.77 32.76 29.17
Yogyakarta 30.36 45.15 43.15 31.25 30.01 54.38 33.77 33.19 34.01 30.18
East Java 32.59 41.73 40.94 30.06 30.89 45.92 32.07 31.30 31.33 27.56
Banten -- -- -- -- -- -- -- -- 28.15 25.14
Bali 35.28 46.48 45.23 34.79 34.97 57.38 35.19 34.00 32.73 31.14
West Nusa Tenggara 25.28 43.63 43.66 25.26 24.66 54.06 27.77 24.19 28.83 26.11
East Nusa Tenggara 25.24 46.61 43.47 23.05 22.17 54.57 25.94 24.33 25.75 25.94
East Timor 16.23 28.59 26.72 16.90 14.85 41.27 -- -- -- --
West Kalimantan 21.41 27.66 26.90 22.45 21.60 31.26 26.73 27.71 22.72 26.02
Central Kalimantan 22.45 33.37 29.70 25.67 21.80 28.36 29.35 24.02 24.11 23.79
South Kalimantan 24.40 37.08 37.31 26.18 25.80 33.08 28.90 26.11 26.25 25.22
East Kalimantan 24.19 31.36 30.96 23.80 20.55 36.88 25.37 25.70 26.04 22.91
North Sulawesi 30.13 38.70 36.01 32.73 33.88 42.65 35.33 33.71 32.91 33.08
Central Sulawesi 20.29 35.59 36.02 27.11 26.59 45.68 28.55 26.96 27.11 26.67
South Sulawesi 27.93 36.88 37.43 28.11 28.36 42.71 28.18 29.82 29.73 27.85
Southeast Sulawesi 17.76 35.56 35.07 21.71 21.26 41.20 24.57 23.57 25.36 25.02
Gorontalo -- -- -- -- -- -- -- -- 35.45 31.95
Maluku 21.93 35.36 34.47 27.76 28.85 46.88 36.48 -- 38.37 34.45
North Maluku -- -- -- -- -- -- -- -- 28.87 19.88
Papua 21.07 26.72 25.02 20.35 19.10 39.61 22.99 19.32 23.43 25.68
Indonesia 29.2 36.7 36.0 28.3 28.3 37.6 31.2 30.9 30.3 28.3
Notes: Calculated as a percentage of total men and women in wage employment in the non agricultural sector.
Source: Susenas, calculated for MDG report by BPS–Statistics Indonesia. 2002 figures for Aceh, Maluku, North Maluku and Papua represent only the capital city of each province.
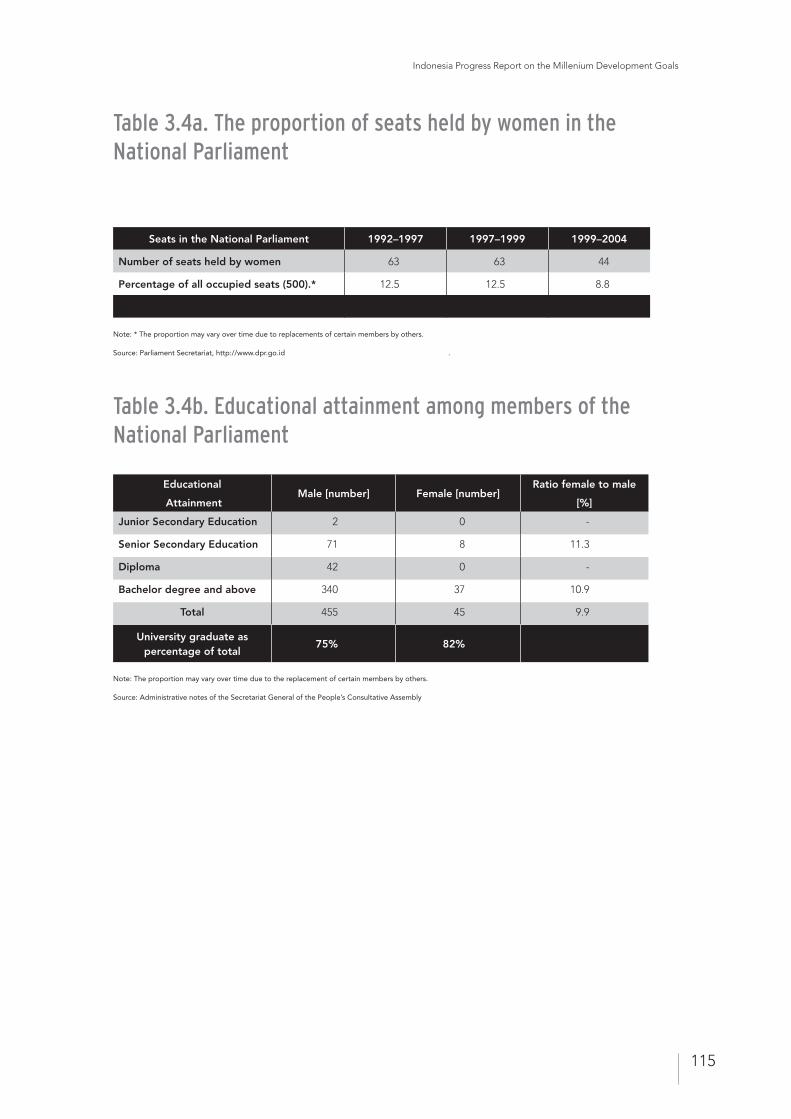
Indonesia Progress Report on the Millenium Development Goals
115
Table 3.4a. The proportion of seats held by women in the National Parliament
Note: The proportion may vary over time due to the replacement of certain members by others.
Source: Administrative notes of the Secretariat General of the People’s Consultative Assembly
Table 3.4b. Educational attainment among members of the National Parliament
Note: * The proportion may vary over time due to replacements of certain members by others.
Source: Parliament Secretariat, http://www.dpr.go.id .
Educational
AttainmentMale [number] Female [number]
Ratio female to male
[%]
Junior Secondary Education 2 0 -
Senior Secondary Education 71 8 11.3
Diploma 42 0 -
Bachelor degree and above 340 37 10.9
Total 455 45 9.9
University graduate as percentage of total
75% 82%
Seats in the National Parliament 1992–1997 1997–1999 1999–2004
Number of seats held by women 63 63 44
Percentage of all occupied seats (500).* 12.5 12.5 8.8
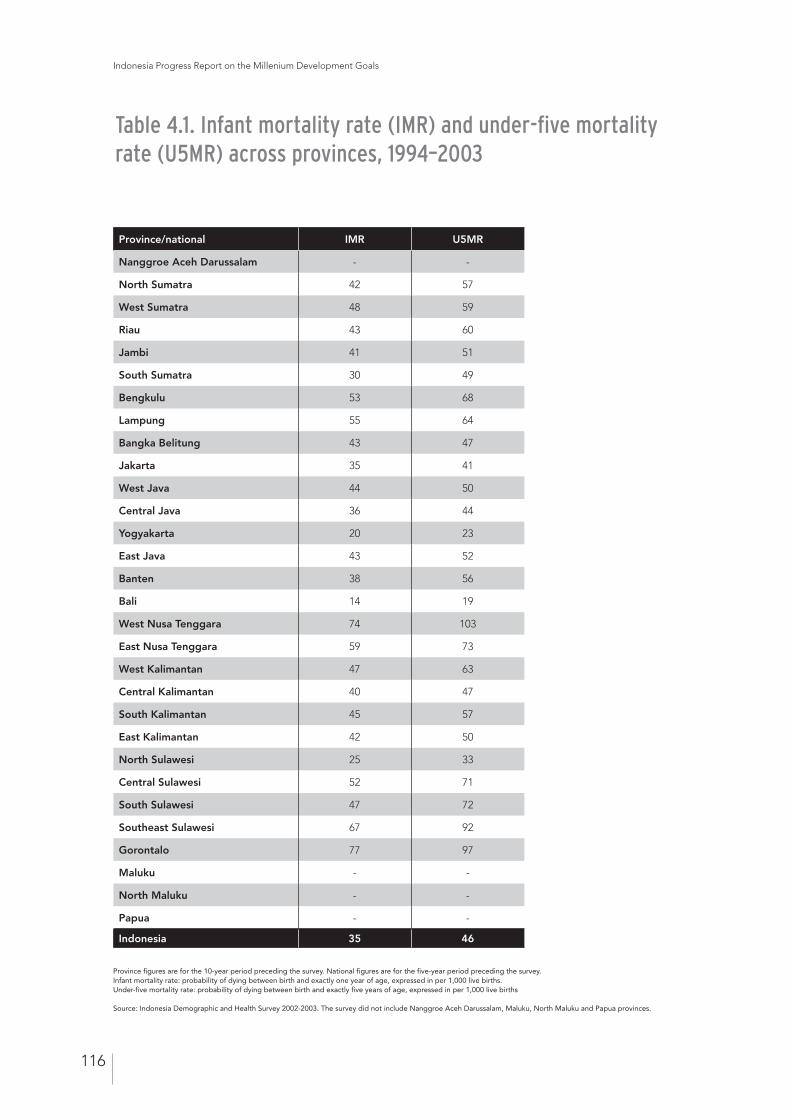
Indonesia Progress Report on the Millenium Development Goals
116
Table 4.1. Infant mortality rate (IMR) and under-five mortality rate (U5MR) across provinces, 1994–2003
Province figures are for the 10-year period preceding the survey. National figures are for the five-year period preceding the survey.Infant mortality rate: probability of dying between birth and exactly one year of age, expressed in per 1,000 live births. Under-five mortality rate: probability of dying between birth and exactly five years of age, expressed in per 1,000 live births
Source: Indonesia Demographic and Health Survey 2002-2003. The survey did not include Nanggroe Aceh Darussalam, Maluku, North Maluku and Papua provinces.
Province/national IMR U5MR
Nanggroe Aceh Darussalam - -
North Sumatra 42 57
West Sumatra 48 59
Riau 43 60
Jambi 41 51
South Sumatra 30 49
Bengkulu 53 68
Lampung 55 64
Bangka Belitung 43 47
Jakarta 35 41
West Java 44 50
Central Java 36 44
Yogyakarta 20 23
East Java 43 52
Banten 38 56
Bali 14 19
West Nusa Tenggara 74 103
East Nusa Tenggara 59 73
West Kalimantan 47 63
Central Kalimantan 40 47
South Kalimantan 45 57
East Kalimantan 42 50
North Sulawesi 25 33
Central Sulawesi 52 71
South Sulawesi 47 72
Southeast Sulawesi 67 92
Gorontalo 77 97
Maluku - -
North Maluku - -
Papua - -
Indonesia 35 46
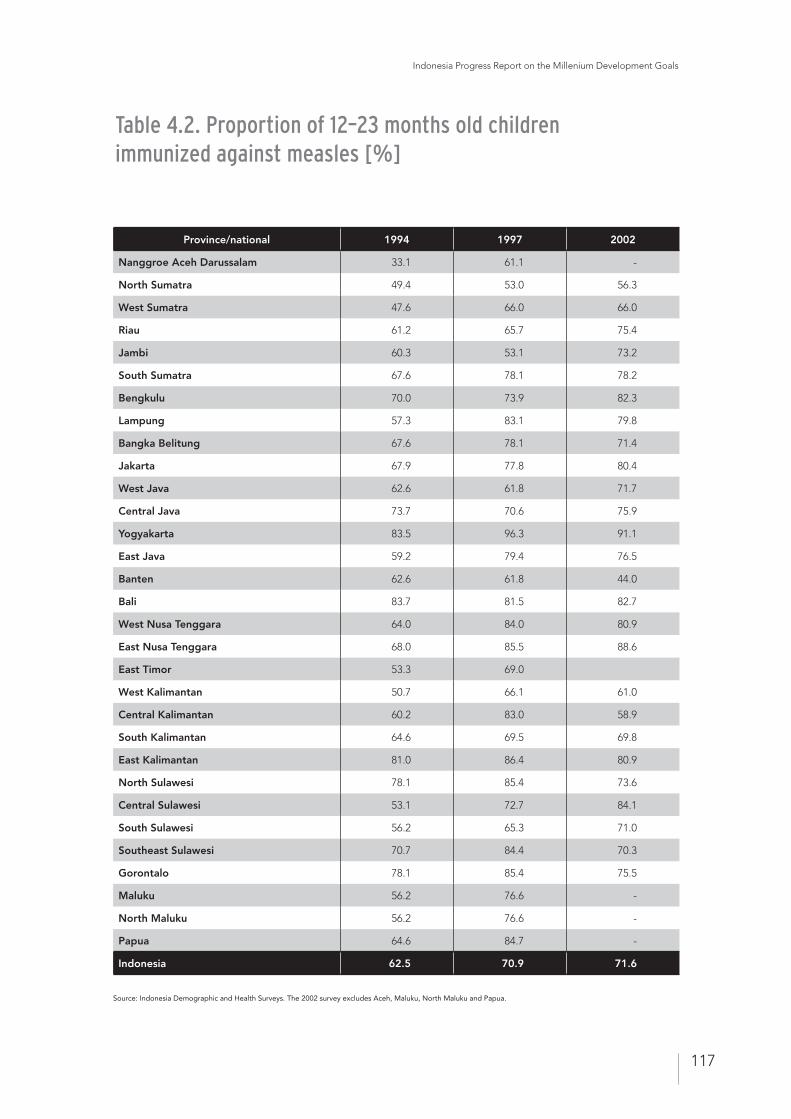
Indonesia Progress Report on the Millenium Development Goals
117
Table 4.2. Proportion of 12–23 months old children immunized against measles [%]
Province/national 1994 1997 2002
Nanggroe Aceh Darussalam 33.1 61.1 -
North Sumatra 49.4 53.0 56.3
West Sumatra 47.6 66.0 66.0
Riau 61.2 65.7 75.4
Jambi 60.3 53.1 73.2
South Sumatra 67.6 78.1 78.2
Bengkulu 70.0 73.9 82.3
Lampung 57.3 83.1 79.8
Bangka Belitung 67.6 78.1 71.4
Jakarta 67.9 77.8 80.4
West Java 62.6 61.8 71.7
Central Java 73.7 70.6 75.9
Yogyakarta 83.5 96.3 91.1
East Java 59.2 79.4 76.5
Banten 62.6 61.8 44.0
Bali 83.7 81.5 82.7
West Nusa Tenggara 64.0 84.0 80.9
East Nusa Tenggara 68.0 85.5 88.6
East Timor 53.3 69.0
West Kalimantan 50.7 66.1 61.0
Central Kalimantan 60.2 83.0 58.9
South Kalimantan 64.6 69.5 69.8
East Kalimantan 81.0 86.4 80.9
North Sulawesi 78.1 85.4 73.6
Central Sulawesi 53.1 72.7 84.1
South Sulawesi 56.2 65.3 71.0
Southeast Sulawesi 70.7 84.4 70.3
Gorontalo 78.1 85.4 75.5
Maluku 56.2 76.6 -
North Maluku 56.2 76.6 -
Papua 64.6 84.7 -
Indonesia 62.5 70.9 71.6
Source: Indonesia Demographic and Health Surveys. The 2002 survey excludes Aceh, Maluku, North Maluku and Papua.
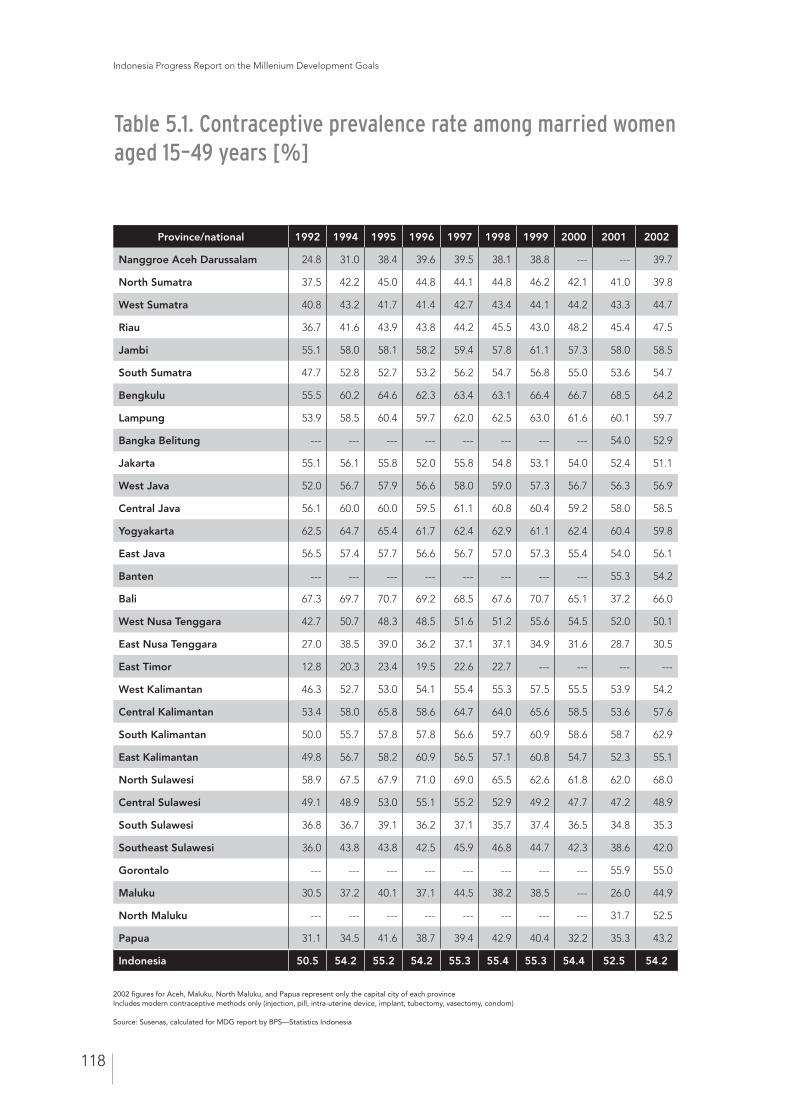
Indonesia Progress Report on the Millenium Development Goals
118
Table 5.1. Contraceptive prevalence rate among married women aged 15–49 years [%]
Province/national 1992 1994 1995 1996 1997 1998 1999 2000 2001 2002
Nanggroe Aceh Darussalam 24.8 31.0 38.4 39.6 39.5 38.1 38.8 --- --- 39.7
North Sumatra 37.5 42.2 45.0 44.8 44.1 44.8 46.2 42.1 41.0 39.8
West Sumatra 40.8 43.2 41.7 41.4 42.7 43.4 44.1 44.2 43.3 44.7
Riau 36.7 41.6 43.9 43.8 44.2 45.5 43.0 48.2 45.4 47.5
Jambi 55.1 58.0 58.1 58.2 59.4 57.8 61.1 57.3 58.0 58.5
South Sumatra 47.7 52.8 52.7 53.2 56.2 54.7 56.8 55.0 53.6 54.7
Bengkulu 55.5 60.2 64.6 62.3 63.4 63.1 66.4 66.7 68.5 64.2
Lampung 53.9 58.5 60.4 59.7 62.0 62.5 63.0 61.6 60.1 59.7
Bangka Belitung --- --- --- --- --- --- --- --- 54.0 52.9
Jakarta 55.1 56.1 55.8 52.0 55.8 54.8 53.1 54.0 52.4 51.1
West Java 52.0 56.7 57.9 56.6 58.0 59.0 57.3 56.7 56.3 56.9
Central Java 56.1 60.0 60.0 59.5 61.1 60.8 60.4 59.2 58.0 58.5
Yogyakarta 62.5 64.7 65.4 61.7 62.4 62.9 61.1 62.4 60.4 59.8
East Java 56.5 57.4 57.7 56.6 56.7 57.0 57.3 55.4 54.0 56.1
Banten --- --- --- --- --- --- --- --- 55.3 54.2
Bali 67.3 69.7 70.7 69.2 68.5 67.6 70.7 65.1 37.2 66.0
West Nusa Tenggara 42.7 50.7 48.3 48.5 51.6 51.2 55.6 54.5 52.0 50.1
East Nusa Tenggara 27.0 38.5 39.0 36.2 37.1 37.1 34.9 31.6 28.7 30.5
East Timor 12.8 20.3 23.4 19.5 22.6 22.7 --- --- --- ---
West Kalimantan 46.3 52.7 53.0 54.1 55.4 55.3 57.5 55.5 53.9 54.2
Central Kalimantan 53.4 58.0 65.8 58.6 64.7 64.0 65.6 58.5 53.6 57.6
South Kalimantan 50.0 55.7 57.8 57.8 56.6 59.7 60.9 58.6 58.7 62.9
East Kalimantan 49.8 56.7 58.2 60.9 56.5 57.1 60.8 54.7 52.3 55.1
North Sulawesi 58.9 67.5 67.9 71.0 69.0 65.5 62.6 61.8 62.0 68.0
Central Sulawesi 49.1 48.9 53.0 55.1 55.2 52.9 49.2 47.7 47.2 48.9
South Sulawesi 36.8 36.7 39.1 36.2 37.1 35.7 37.4 36.5 34.8 35.3
Southeast Sulawesi 36.0 43.8 43.8 42.5 45.9 46.8 44.7 42.3 38.6 42.0
Gorontalo --- --- --- --- --- --- --- --- 55.9 55.0
Maluku 30.5 37.2 40.1 37.1 44.5 38.2 38.5 --- 26.0 44.9
North Maluku --- --- --- --- --- --- --- --- 31.7 52.5
Papua 31.1 34.5 41.6 38.7 39.4 42.9 40.4 32.2 35.3 43.2
Indonesia 50.5 54.2 55.2 54.2 55.3 55.4 55.3 54.4 52.5 54.2
2002 figures for Aceh, Maluku, North Maluku, and Papua represent only the capital city of each provinceIncludes modern contraceptive methods only (injection, pill, intra-uterine device, implant, tubectomy, vasectomy, condom)
Source: Susenas, calculated for MDG report by BPS—Statistics Indonesia
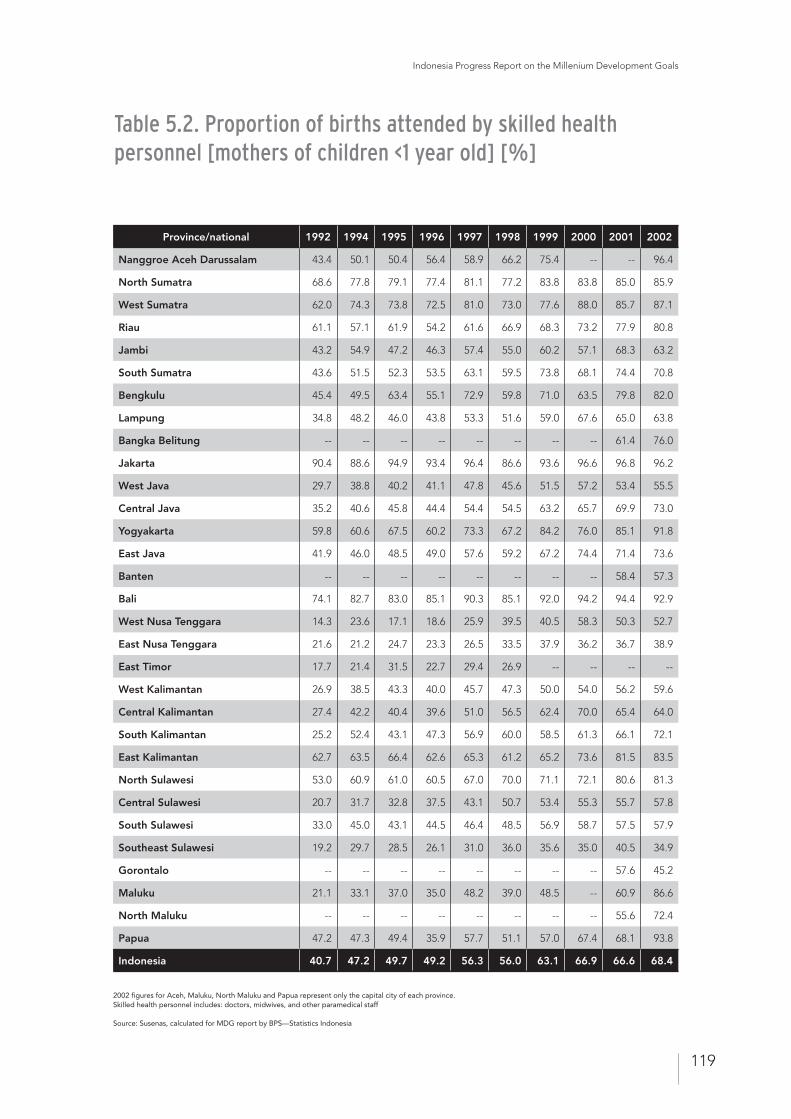
Indonesia Progress Report on the Millenium Development Goals
119
Table 5.2. Proportion of births attended by skilled health personnel [mothers of children <1 year old] [%]
Province/national 1992 1994 1995 1996 1997 1998 1999 2000 2001 2002
Nanggroe Aceh Darussalam 43.4 50.1 50.4 56.4 58.9 66.2 75.4 -- -- 96.4
North Sumatra 68.6 77.8 79.1 77.4 81.1 77.2 83.8 83.8 85.0 85.9
West Sumatra 62.0 74.3 73.8 72.5 81.0 73.0 77.6 88.0 85.7 87.1
Riau 61.1 57.1 61.9 54.2 61.6 66.9 68.3 73.2 77.9 80.8
Jambi 43.2 54.9 47.2 46.3 57.4 55.0 60.2 57.1 68.3 63.2
South Sumatra 43.6 51.5 52.3 53.5 63.1 59.5 73.8 68.1 74.4 70.8
Bengkulu 45.4 49.5 63.4 55.1 72.9 59.8 71.0 63.5 79.8 82.0
Lampung 34.8 48.2 46.0 43.8 53.3 51.6 59.0 67.6 65.0 63.8
Bangka Belitung -- -- -- -- -- -- -- -- 61.4 76.0
Jakarta 90.4 88.6 94.9 93.4 96.4 86.6 93.6 96.6 96.8 96.2
West Java 29.7 38.8 40.2 41.1 47.8 45.6 51.5 57.2 53.4 55.5
Central Java 35.2 40.6 45.8 44.4 54.4 54.5 63.2 65.7 69.9 73.0
Yogyakarta 59.8 60.6 67.5 60.2 73.3 67.2 84.2 76.0 85.1 91.8
East Java 41.9 46.0 48.5 49.0 57.6 59.2 67.2 74.4 71.4 73.6
Banten -- -- -- -- -- -- -- -- 58.4 57.3
Bali 74.1 82.7 83.0 85.1 90.3 85.1 92.0 94.2 94.4 92.9
West Nusa Tenggara 14.3 23.6 17.1 18.6 25.9 39.5 40.5 58.3 50.3 52.7
East Nusa Tenggara 21.6 21.2 24.7 23.3 26.5 33.5 37.9 36.2 36.7 38.9
East Timor 17.7 21.4 31.5 22.7 29.4 26.9 -- -- -- --
West Kalimantan 26.9 38.5 43.3 40.0 45.7 47.3 50.0 54.0 56.2 59.6
Central Kalimantan 27.4 42.2 40.4 39.6 51.0 56.5 62.4 70.0 65.4 64.0
South Kalimantan 25.2 52.4 43.1 47.3 56.9 60.0 58.5 61.3 66.1 72.1
East Kalimantan 62.7 63.5 66.4 62.6 65.3 61.2 65.2 73.6 81.5 83.5
North Sulawesi 53.0 60.9 61.0 60.5 67.0 70.0 71.1 72.1 80.6 81.3
Central Sulawesi 20.7 31.7 32.8 37.5 43.1 50.7 53.4 55.3 55.7 57.8
South Sulawesi 33.0 45.0 43.1 44.5 46.4 48.5 56.9 58.7 57.5 57.9
Southeast Sulawesi 19.2 29.7 28.5 26.1 31.0 36.0 35.6 35.0 40.5 34.9
Gorontalo -- -- -- -- -- -- -- -- 57.6 45.2
Maluku 21.1 33.1 37.0 35.0 48.2 39.0 48.5 -- 60.9 86.6
North Maluku -- -- -- -- -- -- -- -- 55.6 72.4
Papua 47.2 47.3 49.4 35.9 57.7 51.1 57.0 67.4 68.1 93.8
Indonesia 40.7 47.2 49.7 49.2 56.3 56.0 63.1 66.9 66.6 68.4
2002 figures for Aceh, Maluku, North Maluku and Papua represent only the capital city of each province.Skilled health personnel includes: doctors, midwives, and other paramedical staff
Source: Susenas, calculated for MDG report by BPS—Statistics Indonesia
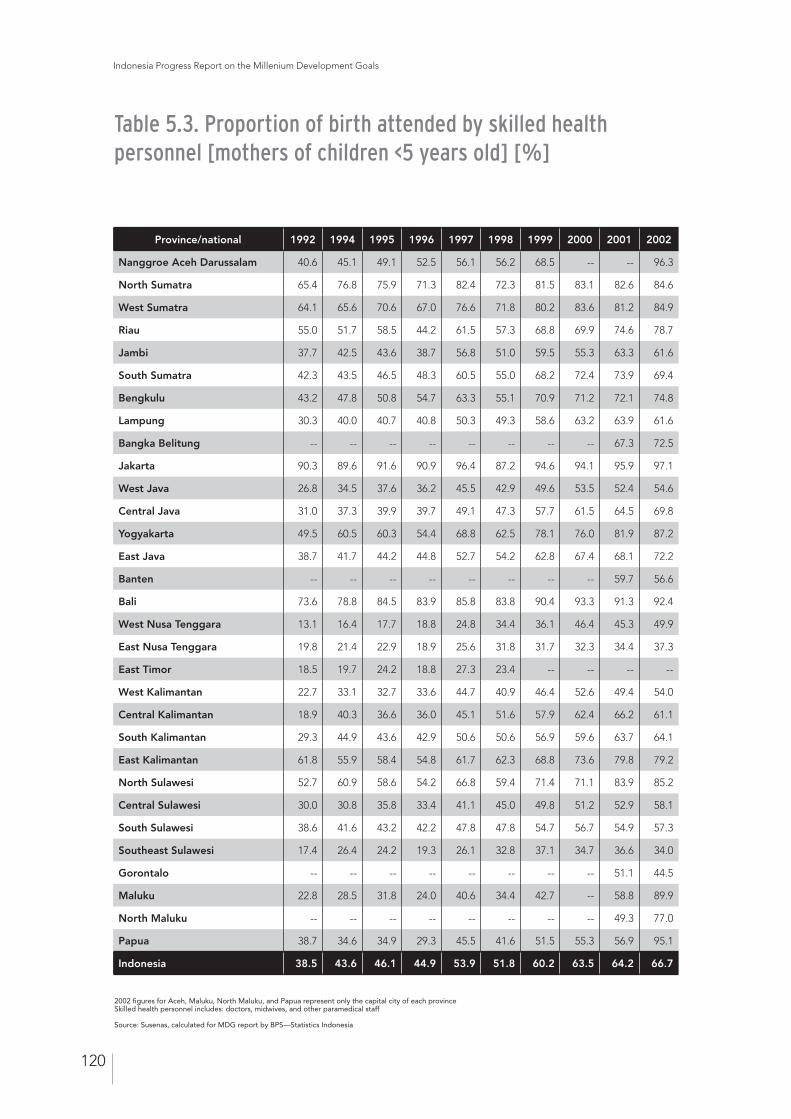
Indonesia Progress Report on the Millenium Development Goals
120
Province/national 1992 1994 1995 1996 1997 1998 1999 2000 2001 2002
Nanggroe Aceh Darussalam 40.6 45.1 49.1 52.5 56.1 56.2 68.5 -- -- 96.3
North Sumatra 65.4 76.8 75.9 71.3 82.4 72.3 81.5 83.1 82.6 84.6
West Sumatra 64.1 65.6 70.6 67.0 76.6 71.8 80.2 83.6 81.2 84.9
Riau 55.0 51.7 58.5 44.2 61.5 57.3 68.8 69.9 74.6 78.7
Jambi 37.7 42.5 43.6 38.7 56.8 51.0 59.5 55.3 63.3 61.6
South Sumatra 42.3 43.5 46.5 48.3 60.5 55.0 68.2 72.4 73.9 69.4
Bengkulu 43.2 47.8 50.8 54.7 63.3 55.1 70.9 71.2 72.1 74.8
Lampung 30.3 40.0 40.7 40.8 50.3 49.3 58.6 63.2 63.9 61.6
Bangka Belitung -- -- -- -- -- -- -- -- 67.3 72.5
Jakarta 90.3 89.6 91.6 90.9 96.4 87.2 94.6 94.1 95.9 97.1
West Java 26.8 34.5 37.6 36.2 45.5 42.9 49.6 53.5 52.4 54.6
Central Java 31.0 37.3 39.9 39.7 49.1 47.3 57.7 61.5 64.5 69.8
Yogyakarta 49.5 60.5 60.3 54.4 68.8 62.5 78.1 76.0 81.9 87.2
East Java 38.7 41.7 44.2 44.8 52.7 54.2 62.8 67.4 68.1 72.2
Banten -- -- -- -- -- -- -- -- 59.7 56.6
Bali 73.6 78.8 84.5 83.9 85.8 83.8 90.4 93.3 91.3 92.4
West Nusa Tenggara 13.1 16.4 17.7 18.8 24.8 34.4 36.1 46.4 45.3 49.9
East Nusa Tenggara 19.8 21.4 22.9 18.9 25.6 31.8 31.7 32.3 34.4 37.3
East Timor 18.5 19.7 24.2 18.8 27.3 23.4 -- -- -- --
West Kalimantan 22.7 33.1 32.7 33.6 44.7 40.9 46.4 52.6 49.4 54.0
Central Kalimantan 18.9 40.3 36.6 36.0 45.1 51.6 57.9 62.4 66.2 61.1
South Kalimantan 29.3 44.9 43.6 42.9 50.6 50.6 56.9 59.6 63.7 64.1
East Kalimantan 61.8 55.9 58.4 54.8 61.7 62.3 68.8 73.6 79.8 79.2
North Sulawesi 52.7 60.9 58.6 54.2 66.8 59.4 71.4 71.1 83.9 85.2
Central Sulawesi 30.0 30.8 35.8 33.4 41.1 45.0 49.8 51.2 52.9 58.1
South Sulawesi 38.6 41.6 43.2 42.2 47.8 47.8 54.7 56.7 54.9 57.3
Southeast Sulawesi 17.4 26.4 24.2 19.3 26.1 32.8 37.1 34.7 36.6 34.0
Gorontalo -- -- -- -- -- -- -- -- 51.1 44.5
Maluku 22.8 28.5 31.8 24.0 40.6 34.4 42.7 -- 58.8 89.9
North Maluku -- -- -- -- -- -- -- -- 49.3 77.0
Papua 38.7 34.6 34.9 29.3 45.5 41.6 51.5 55.3 56.9 95.1
Indonesia 38.5 43.6 46.1 44.9 53.9 51.8 60.2 63.5 64.2 66.7
Table 5.3. Proportion of birth attended by skilled health personnel [mothers of children <5 years old] [%]
2002 figures for Aceh, Maluku, North Maluku, and Papua represent only the capital city of each provinceSkilled health personnel includes: doctors, midwives, and other paramedical staff
Source: Susenas, calculated for MDG report by BPS—Statistics Indonesia
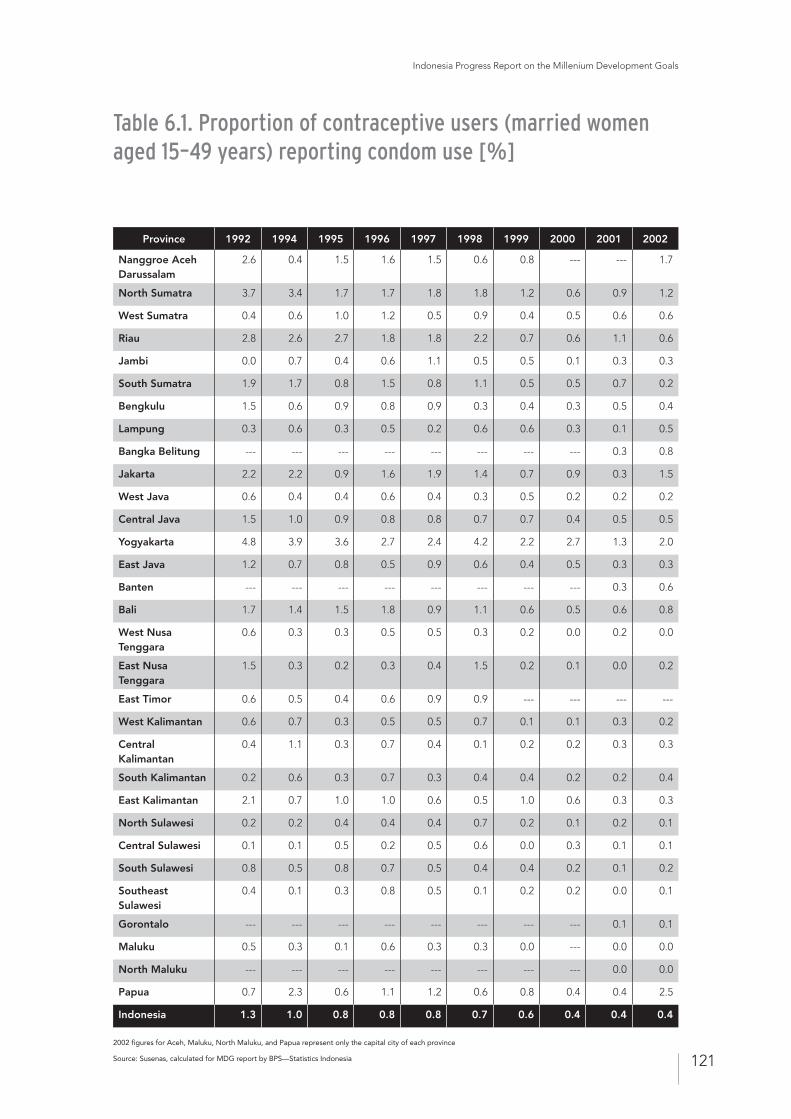
Indonesia Progress Report on the Millenium Development Goals
121
Province 1992 1994 1995 1996 1997 1998 1999 2000 2001 2002
Nanggroe Aceh Darussalam
2.6 0.4 1.5 1.6 1.5 0.6 0.8 --- --- 1.7
North Sumatra 3.7 3.4 1.7 1.7 1.8 1.8 1.2 0.6 0.9 1.2
West Sumatra 0.4 0.6 1.0 1.2 0.5 0.9 0.4 0.5 0.6 0.6
Riau 2.8 2.6 2.7 1.8 1.8 2.2 0.7 0.6 1.1 0.6
Jambi 0.0 0.7 0.4 0.6 1.1 0.5 0.5 0.1 0.3 0.3
South Sumatra 1.9 1.7 0.8 1.5 0.8 1.1 0.5 0.5 0.7 0.2
Bengkulu 1.5 0.6 0.9 0.8 0.9 0.3 0.4 0.3 0.5 0.4
Lampung 0.3 0.6 0.3 0.5 0.2 0.6 0.6 0.3 0.1 0.5
Bangka Belitung --- --- --- --- --- --- --- --- 0.3 0.8
Jakarta 2.2 2.2 0.9 1.6 1.9 1.4 0.7 0.9 0.3 1.5
West Java 0.6 0.4 0.4 0.6 0.4 0.3 0.5 0.2 0.2 0.2
Central Java 1.5 1.0 0.9 0.8 0.8 0.7 0.7 0.4 0.5 0.5
Yogyakarta 4.8 3.9 3.6 2.7 2.4 4.2 2.2 2.7 1.3 2.0
East Java 1.2 0.7 0.8 0.5 0.9 0.6 0.4 0.5 0.3 0.3
Banten --- --- --- --- --- --- --- --- 0.3 0.6
Bali 1.7 1.4 1.5 1.8 0.9 1.1 0.6 0.5 0.6 0.8
West Nusa Tenggara
0.6 0.3 0.3 0.5 0.5 0.3 0.2 0.0 0.2 0.0
East Nusa Tenggara
1.5 0.3 0.2 0.3 0.4 1.5 0.2 0.1 0.0 0.2
East Timor 0.6 0.5 0.4 0.6 0.9 0.9 --- --- --- ---
West Kalimantan 0.6 0.7 0.3 0.5 0.5 0.7 0.1 0.1 0.3 0.2
Central Kalimantan
0.4 1.1 0.3 0.7 0.4 0.1 0.2 0.2 0.3 0.3
South Kalimantan 0.2 0.6 0.3 0.7 0.3 0.4 0.4 0.2 0.2 0.4
East Kalimantan 2.1 0.7 1.0 1.0 0.6 0.5 1.0 0.6 0.3 0.3
North Sulawesi 0.2 0.2 0.4 0.4 0.4 0.7 0.2 0.1 0.2 0.1
Central Sulawesi 0.1 0.1 0.5 0.2 0.5 0.6 0.0 0.3 0.1 0.1
South Sulawesi 0.8 0.5 0.8 0.7 0.5 0.4 0.4 0.2 0.1 0.2
Southeast Sulawesi
0.4 0.1 0.3 0.8 0.5 0.1 0.2 0.2 0.0 0.1
Gorontalo --- --- --- --- --- --- --- --- 0.1 0.1
Maluku 0.5 0.3 0.1 0.6 0.3 0.3 0.0 --- 0.0 0.0
North Maluku --- --- --- --- --- --- --- --- 0.0 0.0
Papua 0.7 2.3 0.6 1.1 1.2 0.6 0.8 0.4 0.4 2.5
Indonesia 1.3 1.0 0.8 0.8 0.8 0.7 0.6 0.4 0.4 0.4
Table 6.1. Proportion of contraceptive users (married women aged 15–49 years) reporting condom use [%]
2002 figures for Aceh, Maluku, North Maluku, and Papua represent only the capital city of each province
Source: Susenas, calculated for MDG report by BPS—Statistics Indonesia
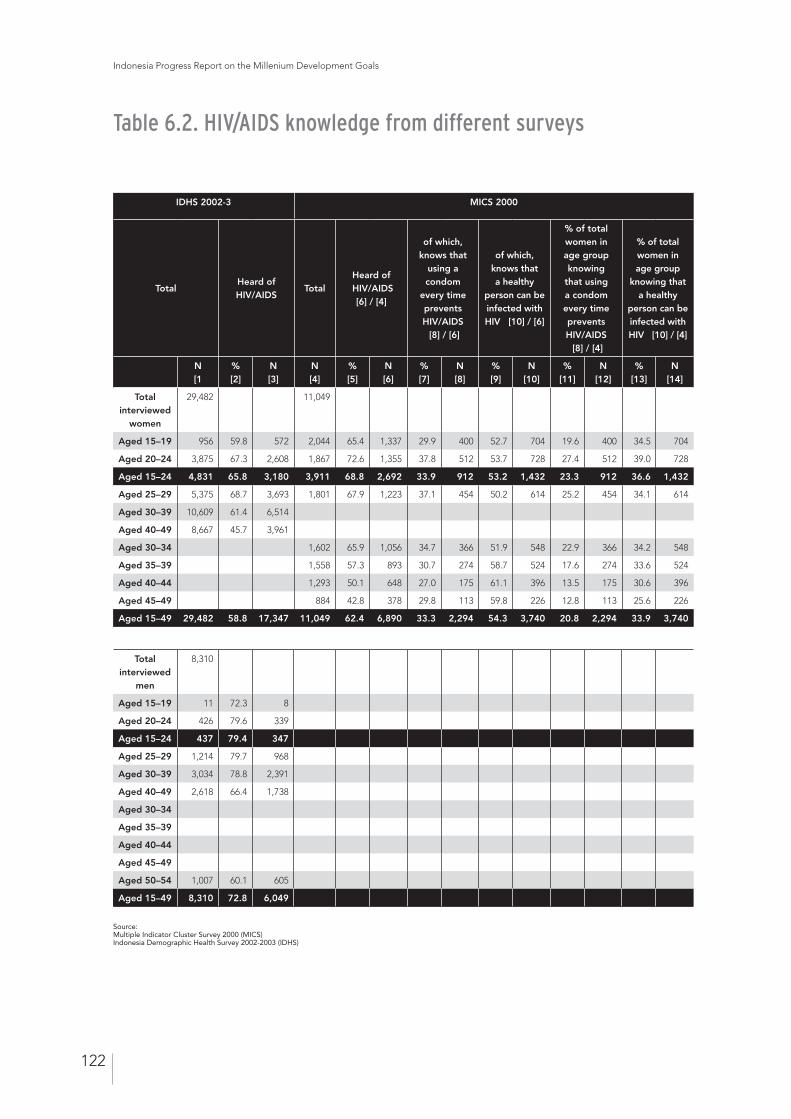
Indonesia Progress Report on the Millenium Development Goals
122
IDHS 2002-3 MICS 2000
TotalHeard of HIV/AIDS
TotalHeard of
HIV/AIDS[6] / [4]
of which, knows that
using a condom
every time prevents HIV/AIDS [8] / [6]
of which, knows that a healthy
person can be infected with HIV [10] / [6]
% of total women in age group knowing
that using a condom every time prevents HIV/AIDS [8] / [4]
% of total women in age group
knowing that a healthy
person can be infected with HIV [10] / [4]
N[1
%[2]
N[3]
N[4]
%[5]
N[6]
%[7]
N[8]
%[9]
N[10]
%[11]
N[12]
%[13]
N[14]
Total interviewed
women
29,482 11,049
Aged 15–19 956 59.8 572 2,044 65.4 1,337 29.9 400 52.7 704 19.6 400 34.5 704
Aged 20–24 3,875 67.3 2,608 1,867 72.6 1,355 37.8 512 53.7 728 27.4 512 39.0 728
Aged 15–24 4,831 65.8 3,180 3,911 68.8 2,692 33.9 912 53.2 1,432 23.3 912 36.6 1,432
Aged 25–29 5,375 68.7 3,693 1,801 67.9 1,223 37.1 454 50.2 614 25.2 454 34.1 614
Aged 30–39 10,609 61.4 6,514
Aged 40–49 8,667 45.7 3,961
Aged 30–34 1,602 65.9 1,056 34.7 366 51.9 548 22.9 366 34.2 548
Aged 35–39 1,558 57.3 893 30.7 274 58.7 524 17.6 274 33.6 524
Aged 40–44 1,293 50.1 648 27.0 175 61.1 396 13.5 175 30.6 396
Aged 45–49 884 42.8 378 29.8 113 59.8 226 12.8 113 25.6 226
Aged 15–49 29,482 58.8 17,347 11,049 62.4 6,890 33.3 2,294 54.3 3,740 20.8 2,294 33.9 3,740
Table 6.2. HIV/AIDS knowledge from different surveys
Source: Multiple Indicator Cluster Survey 2000 (MICS)Indonesia Demographic Health Survey 2002-2003 (IDHS)
Total interviewed
men
8,310
Aged 15–19 11 72.3 8
Aged 20–24 426 79.6 339
Aged 15–24 437 79.4 347
Aged 25–29 1,214 79.7 968
Aged 30–39 3,034 78.8 2,391
Aged 40–49 2,618 66.4 1,738
Aged 30–34
Aged 35–39
Aged 40–44
Aged 45–49
Aged 50–54 1,007 60.1 605
Aged 15–49 8,310 72.8 6,049
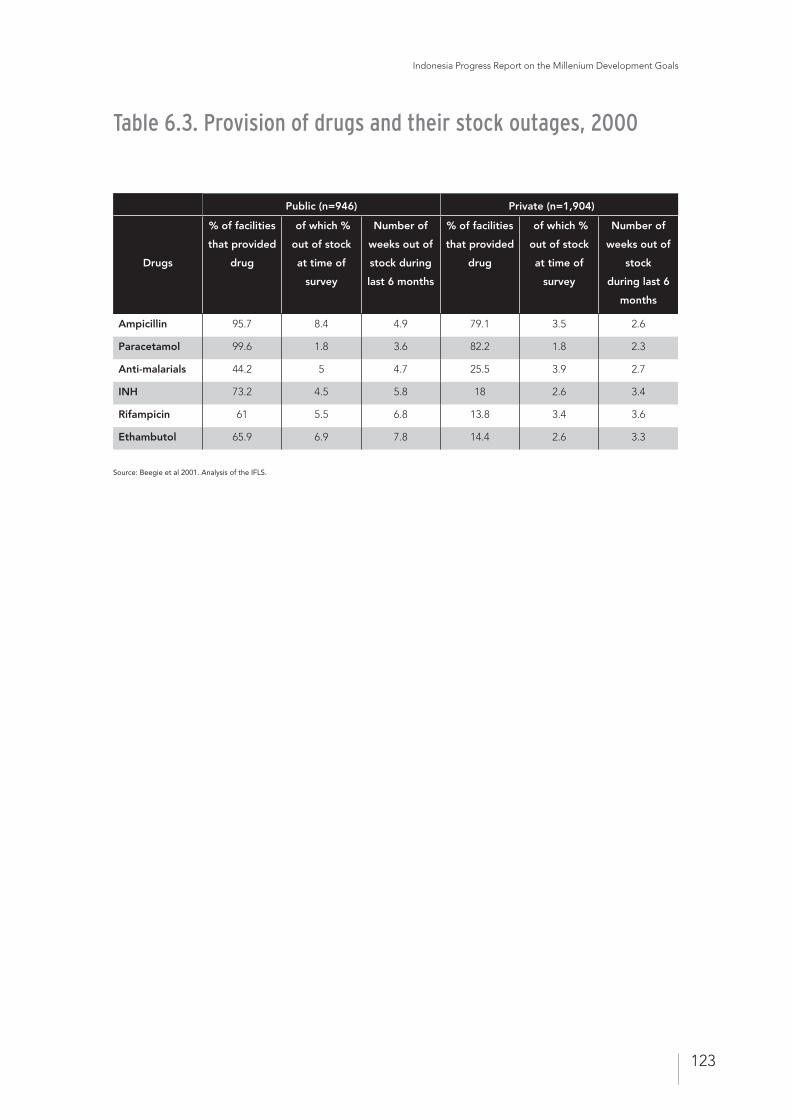
Indonesia Progress Report on the Millenium Development Goals
123
Public (n=946) Private (n=1,904)
Drugs
% of facilities
that provided
drug
of which %
out of stock
at time of
survey
Number of
weeks out of
stock during
last 6 months
% of facilities
that provided
drug
of which %
out of stock
at time of
survey
Number of
weeks out of
stock
during last 6
months
Ampicillin 95.7 8.4 4.9 79.1 3.5 2.6
Paracetamol 99.6 1.8 3.6 82.2 1.8 2.3
Anti-malarials 44.2 5 4.7 25.5 3.9 2.7
INH 73.2 4.5 5.8 18 2.6 3.4
Rifampicin 61 5.5 6.8 13.8 3.4 3.6
Ethambutol 65.9 6.9 7.8 14.4 2.6 3.3
Table 6.3. Provision of drugs and their stock outages, 2000
Source: Beegie et al 2001. Analysis of the IFLS.
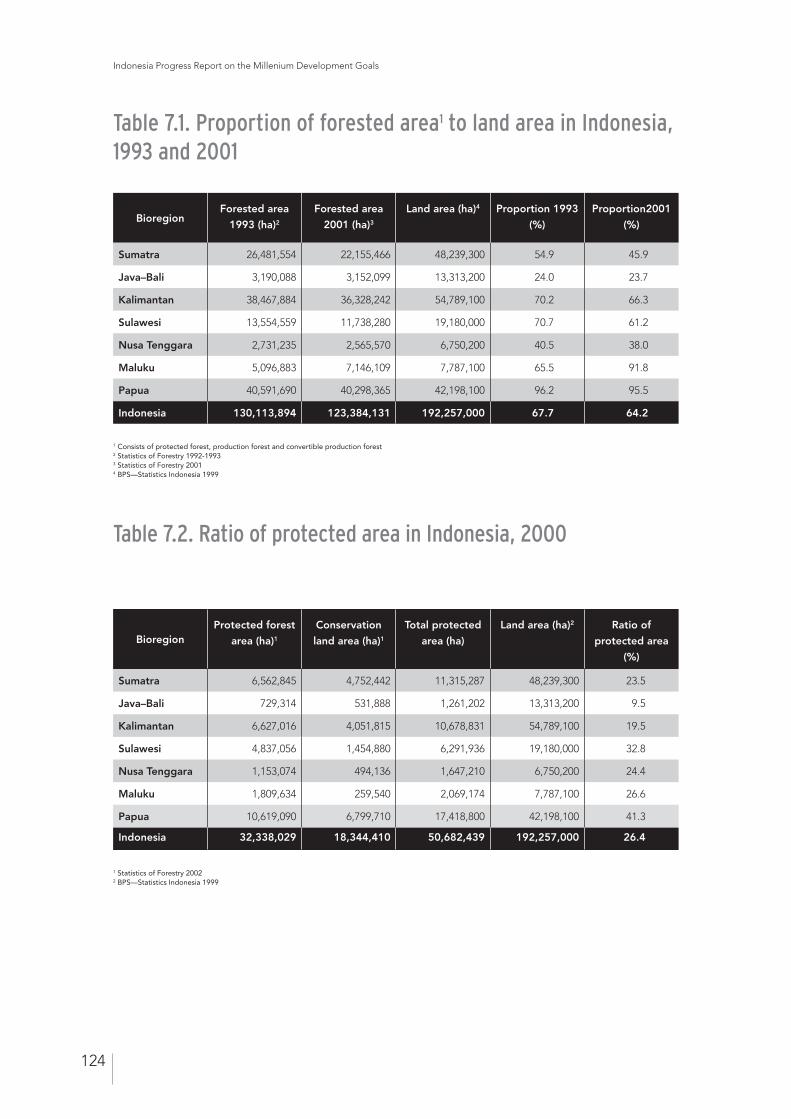
Indonesia Progress Report on the Millenium Development Goals
124
Table 7.2. Ratio of protected area in Indonesia, 2000
BioregionProtected forest
area (ha)1
Conservation
land area (ha)1
Total protected
area (ha)
Land area (ha)2 Ratio of
protected area
(%)
Sumatra 6,562,845 4,752,442 11,315,287 48,239,300 23.5
Java–Bali 729,314 531,888 1,261,202 13,313,200 9.5
Kalimantan 6,627,016 4,051,815 10,678,831 54,789,100 19.5
Sulawesi 4,837,056 1,454,880 6,291,936 19,180,000 32.8
Nusa Tenggara 1,153,074 494,136 1,647,210 6,750,200 24.4
Maluku 1,809,634 259,540 2,069,174 7,787,100 26.6
Papua 10,619,090 6,799,710 17,418,800 42,198,100 41.3
Indonesia 32,338,029 18,344,410 50,682,439 192,257,000 26.4
1 Statistics of Forestry 2002 2 BPS—Statistics Indonesia 1999
BioregionForested area
1993 (ha)2
Forested area
2001 (ha)3
Land area (ha)4 Proportion 1993
(%)
Proportion2001
(%)
Sumatra 26,481,554 22,155,466 48,239,300 54.9 45.9
Java–Bali 3,190,088 3,152,099 13,313,200 24.0 23.7
Kalimantan 38,467,884 36,328,242 54,789,100 70.2 66.3
Sulawesi 13,554,559 11,738,280 19,180,000 70.7 61.2
Nusa Tenggara 2,731,235 2,565,570 6,750,200 40.5 38.0
Maluku 5,096,883 7,146,109 7,787,100 65.5 91.8
Papua 40,591,690 40,298,365 42,198,100 96.2 95.5
Indonesia 130,113,894 123,384,131 192,257,000 67.7 64.2
Table 7.1. Proportion of forested area1 to land area in Indonesia, 1993 and 2001
1 Consists of protected forest, production forest and convertible production forest 2 Statistics of Forestry 1992-1993 3 Statistics of Forestry 2001 4 BPS—Statistics Indonesia 1999
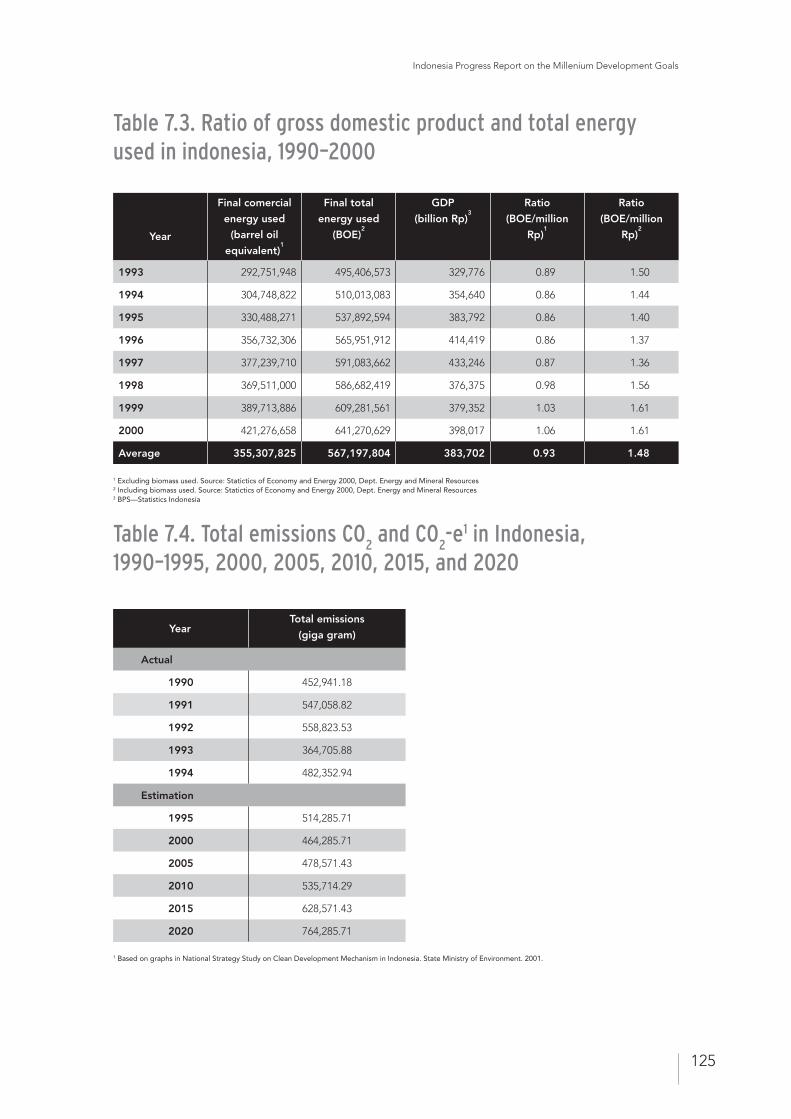
Indonesia Progress Report on the Millenium Development Goals
125
Table 7.3. Ratio of gross domestic product and total energy used in indonesia, 1990–2000
1 Excluding biomass used. Source: Statictics of Economy and Energy 2000, Dept. Energy and Mineral Resources 2 Including biomass used. Source: Statictics of Economy and Energy 2000, Dept. Energy and Mineral Resources 3 BPS—Statistics Indonesia
Year
Final comercial
energy used
(barrel oil
equivalent)1
Final total
energy used
(BOE)2
GDP
(billion Rp)3
Ratio
(BOE/million
Rp)1
Ratio
(BOE/million
Rp)2
1993 292,751,948 495,406,573 329,776 0.89 1.50
1994 304,748,822 510,013,083 354,640 0.86 1.44
1995 330,488,271 537,892,594 383,792 0.86 1.40
1996 356,732,306 565,951,912 414,419 0.86 1.37
1997 377,239,710 591,083,662 433,246 0.87 1.36
1998 369,511,000 586,682,419 376,375 0.98 1.56
1999 389,713,886 609,281,561 379,352 1.03 1.61
2000 421,276,658 641,270,629 398,017 1.06 1.61
Average 355,307,825 567,197,804 383,702 0.93 1.48
Table 7.4. Total emissions CO2 and CO
2-e1 in Indonesia,
1990–1995, 2000, 2005, 2010, 2015, and 2020
YearTotal emissions
(giga gram)
Actual
1990 452,941.18
1991 547,058.82
1992 558,823.53
1993 364,705.88
1994 482,352.94
Estimation
1995 514,285.71
2000 464,285.71
2005 478,571.43
2010 535,714.29
2015 628,571.43
2020 764,285.71
1 Based on graphs in National Strategy Study on Clean Development Mechanism in Indonesia. State Ministry of Environment. 2001.
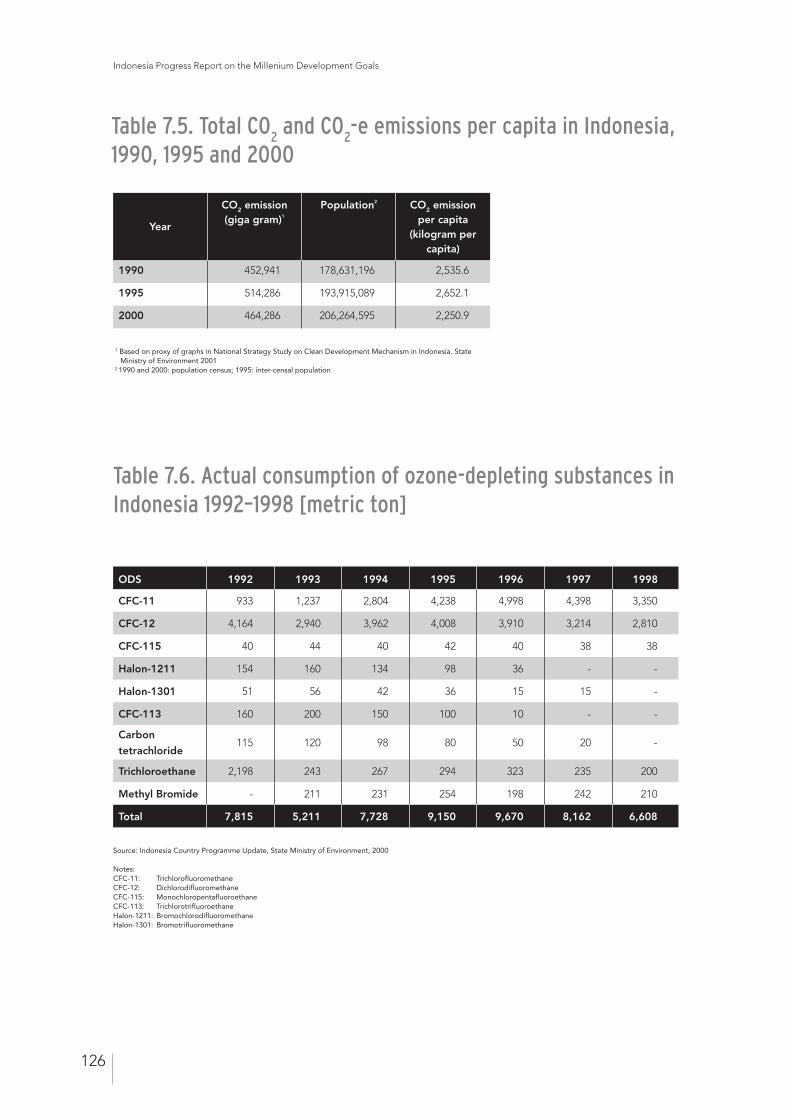
Indonesia Progress Report on the Millenium Development Goals
126
Table 7.5. Total CO2 and CO
2-e emissions per capita in Indonesia,
1990, 1995 and 2000
1 Based on proxy of graphs in National Strategy Study on Clean Development Mechanism in Indonesia. State Ministry of Environment 2001
2 1990 and 2000: population census; 1995: inter-censal population
Year
CO2 emission (giga gram)1
Population2 CO2 emission per capita
(kilogram per capita)
1990 452,941 178,631,196 2,535.6
1995 514,286 193,915,089 2,652.1
2000 464,286 206,264,595 2,250.9
Table 7.6. Actual consumption of ozone-depleting substances in Indonesia 1992–1998 [metric ton]
ODS 1992 1993 1994 1995 1996 1997 1998
CFC-11 933 1,237 2,804 4,238 4,998 4,398 3,350
CFC-12 4,164 2,940 3,962 4,008 3,910 3,214 2,810
CFC-115 40 44 40 42 40 38 38
Halon-1211 154 160 134 98 36 - -
Halon-1301 51 56 42 36 15 15 -
CFC-113 160 200 150 100 10 - -
Carbon
tetrachloride 115 120 98 80 50 20 -
Trichloroethane 2,198 243 267 294 323 235 200
Methyl Bromide - 211 231 254 198 242 210
Total 7,815 5,211 7,728 9,150 9,670 8,162 6,608
Source: Indonesia Country Programme Update, State Ministry of Environment, 2000 Notes: CFC-11: TrichlorofluoromethaneCFC-12: DichlorodifluoromethaneCFC-115: MonochloropentafluoroethaneCFC-113: TrichlorotrifluoroethaneHalon-1211: BromochlorodifluoromethaneHalon-1301: Bromotrifluoromethane
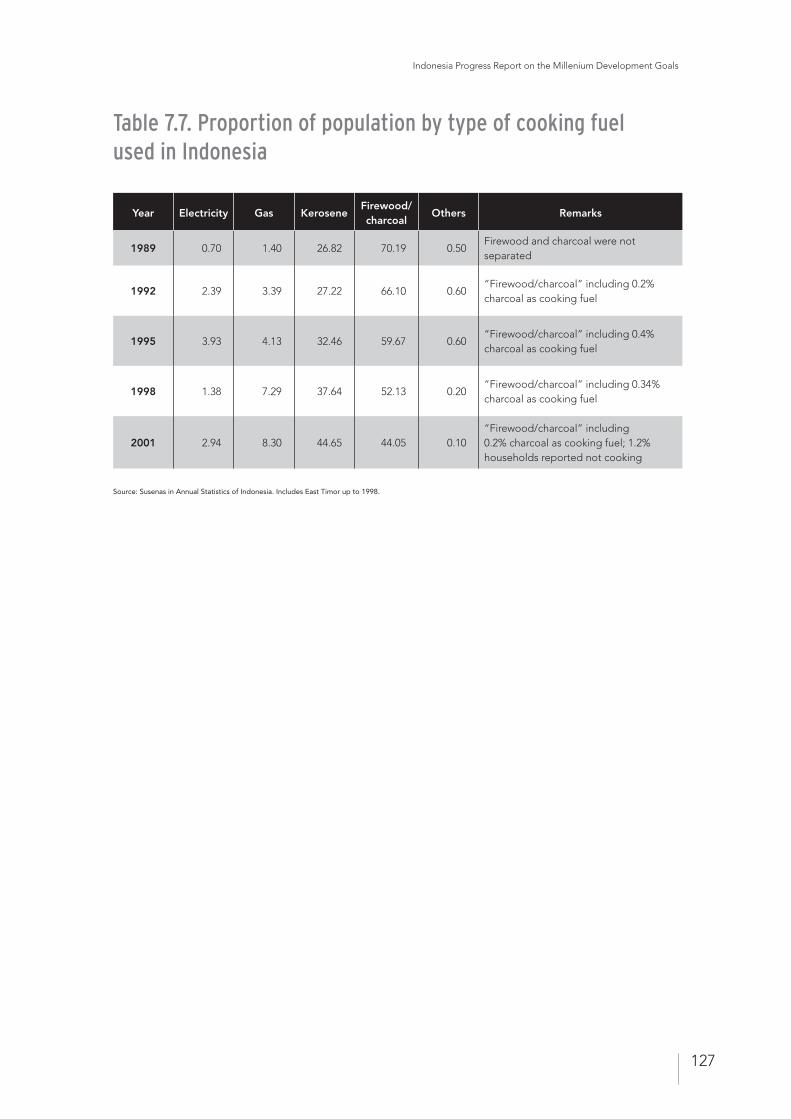
Indonesia Progress Report on the Millenium Development Goals
127
Table 7.7. Proportion of population by type of cooking fuel used in Indonesia
Year Electricity Gas KeroseneFirewood/charcoal
Others Remarks
1989 0.70 1.40 26.82 70.19 0.50Firewood and charcoal were not separated
1992 2.39 3.39 27.22 66.10 0.60“Firewood/charcoal” including 0.2% charcoal as cooking fuel
1995 3.93 4.13 32.46 59.67 0.60“Firewood/charcoal” including 0.4% charcoal as cooking fuel
1998 1.38 7.29 37.64 52.13 0.20“Firewood/charcoal” including 0.34% charcoal as cooking fuel
2001 2.94 8.30 44.65 44.05 0.10“Firewood/charcoal” including 0.2% charcoal as cooking fuel; 1.2% households reported not cooking
Source: Susenas in Annual Statistics of Indonesia. Includes East Timor up to 1998.
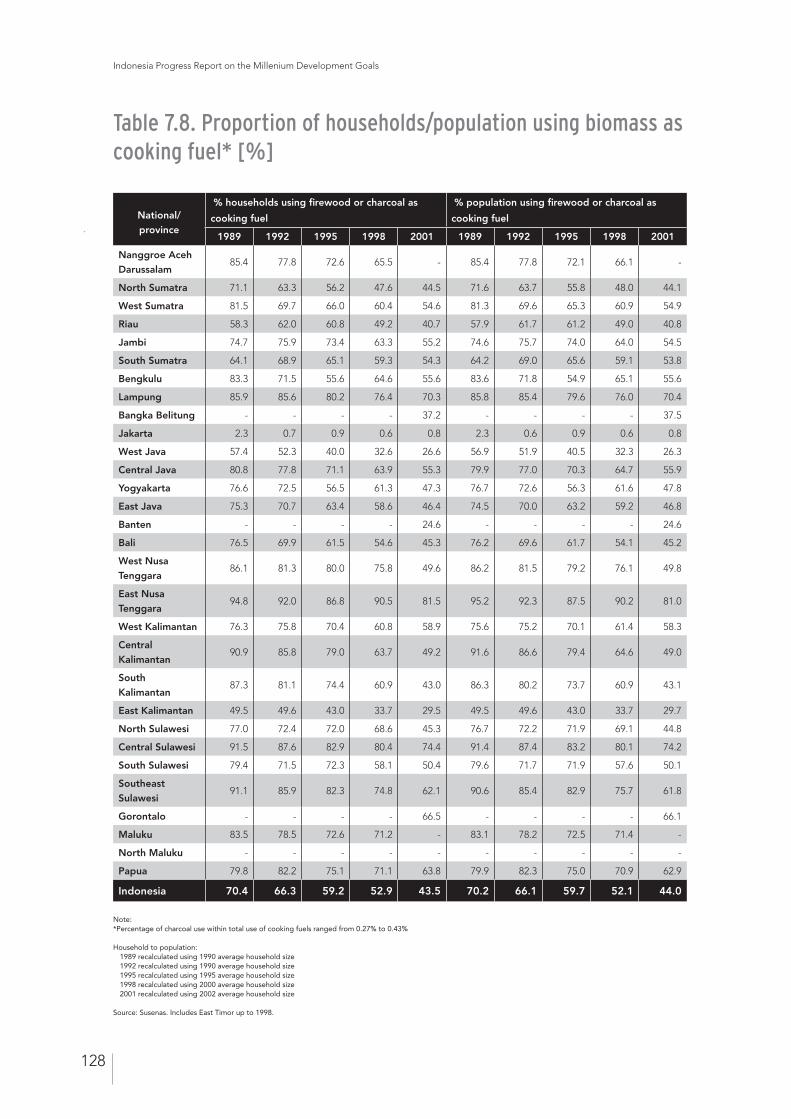
Indonesia Progress Report on the Millenium Development Goals
128
Table 7.8. Proportion of households/population using biomass as cooking fuel* [%]
Note:*Percentage of charcoal use within total use of cooking fuels ranged from 0.27% to 0.43%
Household to population: 1989 recalculated using 1990 average household size 1992 recalculated using 1990 average household size 1995 recalculated using 1995 average household size 1998 recalculated using 2000 average household size 2001 recalculated using 2002 average household size
Source: Susenas. Includes East Timor up to 1998.
National/ province
% households using firewood or charcoal as
cooking fuel
% population using firewood or charcoal as
cooking fuel
1989 1992 1995 1998 2001 1989 1992 1995 1998 2001
Nanggroe Aceh Darussalam
85.4 77.8 72.6 65.5 - 85.4 77.8 72.1 66.1 -
North Sumatra 71.1 63.3 56.2 47.6 44.5 71.6 63.7 55.8 48.0 44.1
West Sumatra 81.5 69.7 66.0 60.4 54.6 81.3 69.6 65.3 60.9 54.9
Riau 58.3 62.0 60.8 49.2 40.7 57.9 61.7 61.2 49.0 40.8
Jambi 74.7 75.9 73.4 63.3 55.2 74.6 75.7 74.0 64.0 54.5
South Sumatra 64.1 68.9 65.1 59.3 54.3 64.2 69.0 65.6 59.1 53.8
Bengkulu 83.3 71.5 55.6 64.6 55.6 83.6 71.8 54.9 65.1 55.6
Lampung 85.9 85.6 80.2 76.4 70.3 85.8 85.4 79.6 76.0 70.4
Bangka Belitung - - - - 37.2 - - - - 37.5
Jakarta 2.3 0.7 0.9 0.6 0.8 2.3 0.6 0.9 0.6 0.8
West Java 57.4 52.3 40.0 32.6 26.6 56.9 51.9 40.5 32.3 26.3
Central Java 80.8 77.8 71.1 63.9 55.3 79.9 77.0 70.3 64.7 55.9
Yogyakarta 76.6 72.5 56.5 61.3 47.3 76.7 72.6 56.3 61.6 47.8
East Java 75.3 70.7 63.4 58.6 46.4 74.5 70.0 63.2 59.2 46.8
Banten - - - - 24.6 - - - - 24.6
Bali 76.5 69.9 61.5 54.6 45.3 76.2 69.6 61.7 54.1 45.2
West Nusa Tenggara
86.1 81.3 80.0 75.8 49.6 86.2 81.5 79.2 76.1 49.8
East Nusa Tenggara
94.8 92.0 86.8 90.5 81.5 95.2 92.3 87.5 90.2 81.0
West Kalimantan 76.3 75.8 70.4 60.8 58.9 75.6 75.2 70.1 61.4 58.3
Central Kalimantan
90.9 85.8 79.0 63.7 49.2 91.6 86.6 79.4 64.6 49.0
South Kalimantan
87.3 81.1 74.4 60.9 43.0 86.3 80.2 73.7 60.9 43.1
East Kalimantan 49.5 49.6 43.0 33.7 29.5 49.5 49.6 43.0 33.7 29.7
North Sulawesi 77.0 72.4 72.0 68.6 45.3 76.7 72.2 71.9 69.1 44.8
Central Sulawesi 91.5 87.6 82.9 80.4 74.4 91.4 87.4 83.2 80.1 74.2
South Sulawesi 79.4 71.5 72.3 58.1 50.4 79.6 71.7 71.9 57.6 50.1
Southeast Sulawesi
91.1 85.9 82.3 74.8 62.1 90.6 85.4 82.9 75.7 61.8
Gorontalo - - - - 66.5 - - - - 66.1
Maluku 83.5 78.5 72.6 71.2 - 83.1 78.2 72.5 71.4 -
North Maluku - - - - - - - - - -
Papua 79.8 82.2 75.1 71.1 63.8 79.9 82.3 75.0 70.9 62.9
Indonesia 70.4 66.3 59.2 52.9 43.5 70.2 66.1 59.7 52.1 44.0
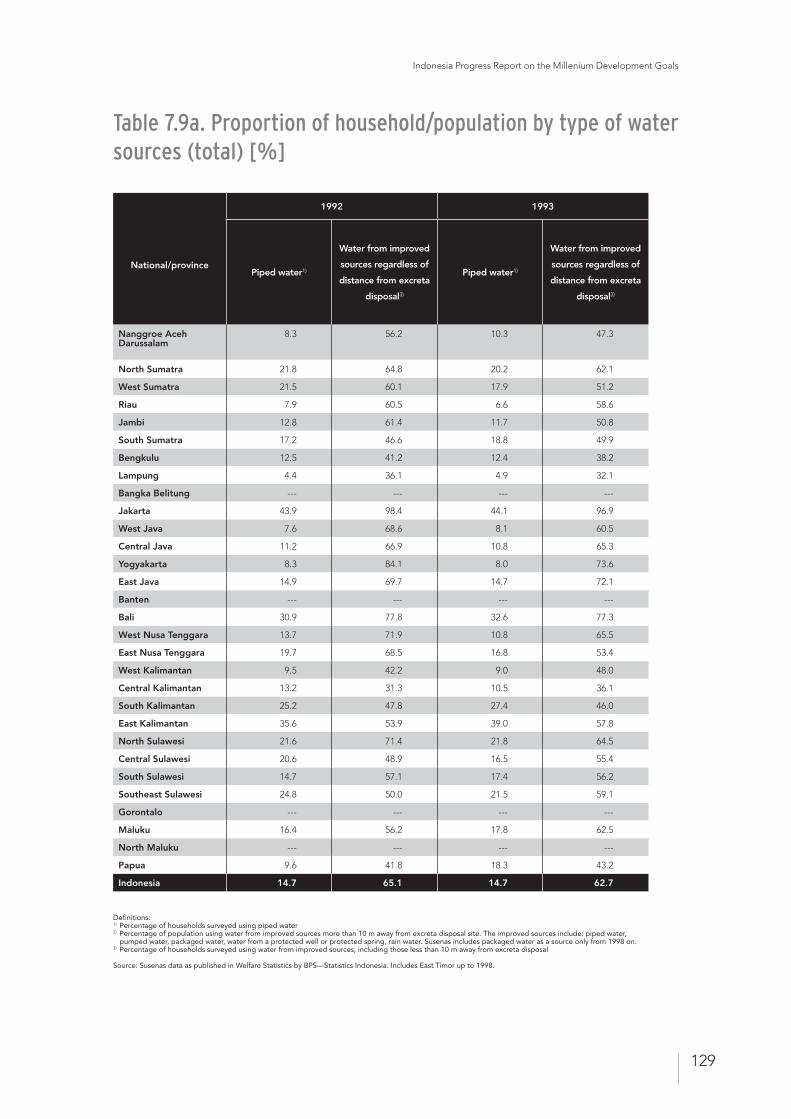
Indonesia Progress Report on the Millenium Development Goals
129
National/province
1992 1993
Piped water1)
Water from improved
sources regardless of
distance from excreta
disposal3)
Piped water1)
Water from improved
sources regardless of
distance from excreta
disposal3)
Nanggroe Aceh Darussalam
8.3 56.2 10.3 47.3
North Sumatra 21.8 64.8 20.2 62.1
West Sumatra 21.5 60.1 17.9 51.2
Riau 7.9 60.5 6.6 58.6
Jambi 12.8 61.4 11.7 50.8
South Sumatra 17.2 46.6 18.8 49.9
Bengkulu 12.5 41.2 12.4 38.2
Lampung 4.4 36.1 4.9 32.1
Bangka Belitung --- --- --- ---
Jakarta 43.9 98.4 44.1 96.9
West Java 7.6 68.6 8.1 60.5
Central Java 11.2 66.9 10.8 65.3
Yogyakarta 8.3 84.1 8.0 73.6
East Java 14.9 69.7 14.7 72.1
Banten --- --- --- ---
Bali 30.9 77.8 32.6 77.3
West Nusa Tenggara 13.7 71.9 10.8 65.5
East Nusa Tenggara 19.7 68.5 16.8 53.4
West Kalimantan 9.5 42.2 9.0 48.0
Central Kalimantan 13.2 31.3 10.5 36.1
South Kalimantan 25.2 47.8 27.4 46.0
East Kalimantan 35.6 53.9 39.0 57.8
North Sulawesi 21.6 71.4 21.8 64.5
Central Sulawesi 20.6 48.9 16.5 55.4
South Sulawesi 14.7 57.1 17.4 56.2
Southeast Sulawesi 24.8 50.0 21.5 59.1
Gorontalo --- --- --- ---
Maluku 16.4 56.2 17.8 62.5
North Maluku --- --- --- ---
Papua 9.6 41.8 18.3 43.2
Indonesia 14.7 65.1 14.7 62.7
Table 7.9a. Proportion of household/population by type of water sources (total) [%]
Definitions: 1) Percentage of households surveyed using piped water 2) Percentage of population using water from improved sources more than 10 m away from excreta disposal site. The improved sources include: piped water,
pumped water, packaged water, water from a protected well or protected spring, rain water. Susenas includes packaged water as a source only from 1998 on.3) Percentage of households surveyed using water from improved sources, including those less than 10 m away from excreta disposal
Source: Susenas data as published in Welfare Statistics by BPS—Statistics Indonesia. Includes East Timor up to 1998.
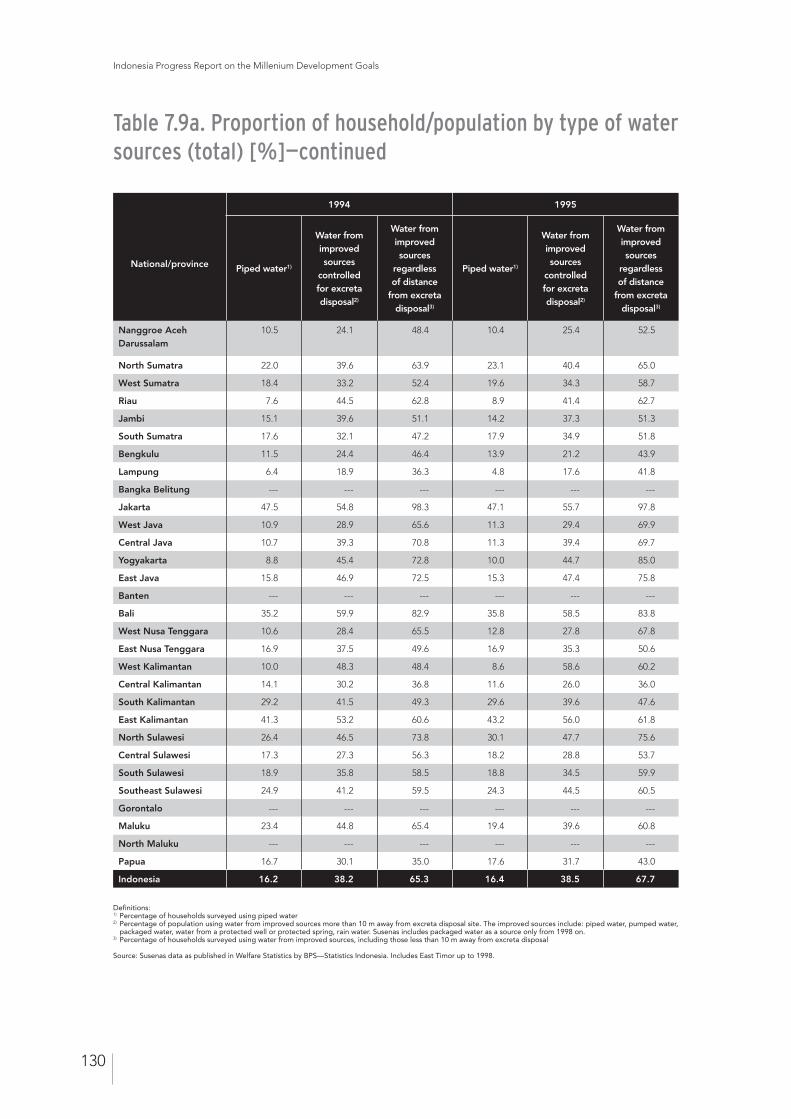
Indonesia Progress Report on the Millenium Development Goals
130
Table 7.9a. Proportion of household/population by type of water sources (total) [%]—continued
National/province
1994 1995
Piped water1)
Water from improved sources
controlled for excreta disposal2)
Water from improved sources
regardless of distance
from excreta disposal3)
Piped water1)
Water from improved sources
controlled for excreta disposal2)
Water from improved sources
regardless of distance
from excreta disposal3)
Nanggroe Aceh Darussalam
10.5 24.1 48.4 10.4 25.4 52.5
North Sumatra 22.0 39.6 63.9 23.1 40.4 65.0
West Sumatra 18.4 33.2 52.4 19.6 34.3 58.7
Riau 7.6 44.5 62.8 8.9 41.4 62.7
Jambi 15.1 39.6 51.1 14.2 37.3 51.3
South Sumatra 17.6 32.1 47.2 17.9 34.9 51.8
Bengkulu 11.5 24.4 46.4 13.9 21.2 43.9
Lampung 6.4 18.9 36.3 4.8 17.6 41.8
Bangka Belitung --- --- --- --- --- ---
Jakarta 47.5 54.8 98.3 47.1 55.7 97.8
West Java 10.9 28.9 65.6 11.3 29.4 69.9
Central Java 10.7 39.3 70.8 11.3 39.4 69.7
Yogyakarta 8.8 45.4 72.8 10.0 44.7 85.0
East Java 15.8 46.9 72.5 15.3 47.4 75.8
Banten --- --- --- --- --- ---
Bali 35.2 59.9 82.9 35.8 58.5 83.8
West Nusa Tenggara 10.6 28.4 65.5 12.8 27.8 67.8
East Nusa Tenggara 16.9 37.5 49.6 16.9 35.3 50.6
West Kalimantan 10.0 48.3 48.4 8.6 58.6 60.2
Central Kalimantan 14.1 30.2 36.8 11.6 26.0 36.0
South Kalimantan 29.2 41.5 49.3 29.6 39.6 47.6
East Kalimantan 41.3 53.2 60.6 43.2 56.0 61.8
North Sulawesi 26.4 46.5 73.8 30.1 47.7 75.6
Central Sulawesi 17.3 27.3 56.3 18.2 28.8 53.7
South Sulawesi 18.9 35.8 58.5 18.8 34.5 59.9
Southeast Sulawesi 24.9 41.2 59.5 24.3 44.5 60.5
Gorontalo --- --- --- --- --- ---
Maluku 23.4 44.8 65.4 19.4 39.6 60.8
North Maluku --- --- --- --- --- ---
Papua 16.7 30.1 35.0 17.6 31.7 43.0
Indonesia 16.2 38.2 65.3 16.4 38.5 67.7
Definitions: 1) Percentage of households surveyed using piped water 2) Percentage of population using water from improved sources more than 10 m away from excreta disposal site. The improved sources include: piped water, pumped water,
packaged water, water from a protected well or protected spring, rain water. Susenas includes packaged water as a source only from 1998 on.3) Percentage of households surveyed using water from improved sources, including those less than 10 m away from excreta disposal
Source: Susenas data as published in Welfare Statistics by BPS—Statistics Indonesia. Includes East Timor up to 1998.
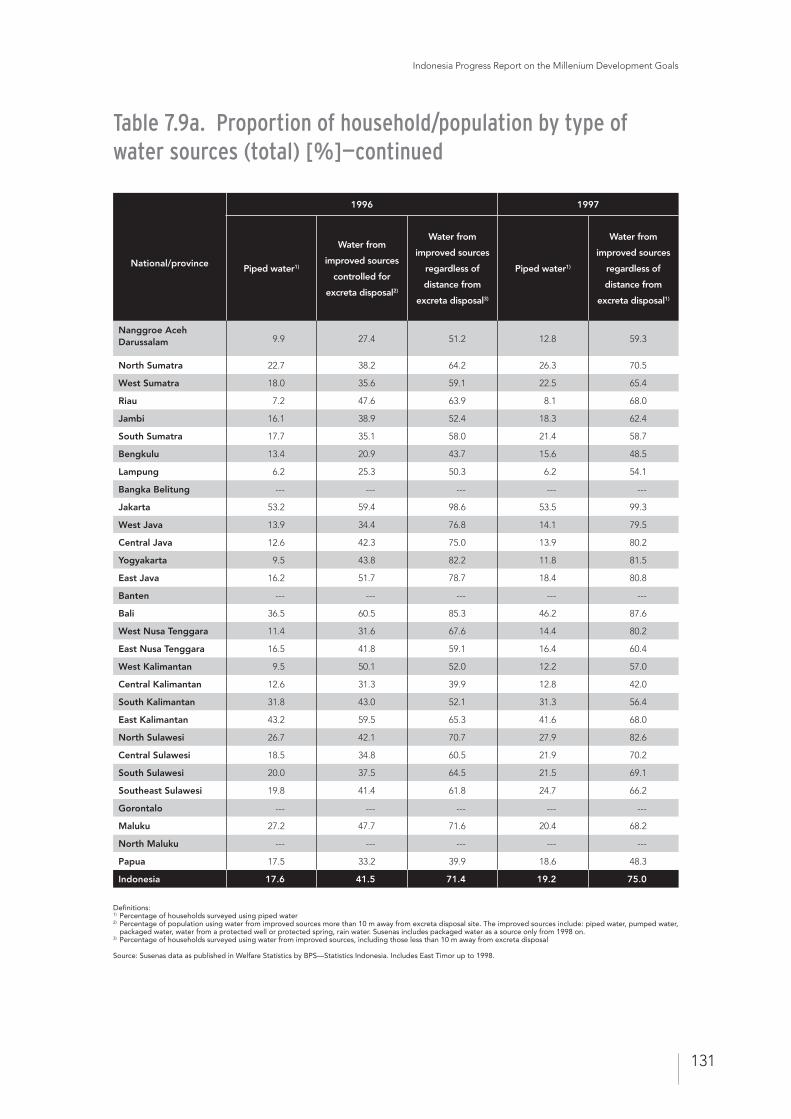
Indonesia Progress Report on the Millenium Development Goals
131
National/province
1996 1997
Piped water1)
Water from
improved sources
controlled for
excreta disposal2)
Water from
improved sources
regardless of
distance from
excreta disposal3)
Piped water1)
Water from
improved sources
regardless of
distance from
excreta disposal1)
Nanggroe Aceh Darussalam 9.9 27.4 51.2 12.8 59.3
North Sumatra 22.7 38.2 64.2 26.3 70.5
West Sumatra 18.0 35.6 59.1 22.5 65.4
Riau 7.2 47.6 63.9 8.1 68.0
Jambi 16.1 38.9 52.4 18.3 62.4
South Sumatra 17.7 35.1 58.0 21.4 58.7
Bengkulu 13.4 20.9 43.7 15.6 48.5
Lampung 6.2 25.3 50.3 6.2 54.1
Bangka Belitung --- --- --- --- ---
Jakarta 53.2 59.4 98.6 53.5 99.3
West Java 13.9 34.4 76.8 14.1 79.5
Central Java 12.6 42.3 75.0 13.9 80.2
Yogyakarta 9.5 43.8 82.2 11.8 81.5
East Java 16.2 51.7 78.7 18.4 80.8
Banten --- --- --- --- ---
Bali 36.5 60.5 85.3 46.2 87.6
West Nusa Tenggara 11.4 31.6 67.6 14.4 80.2
East Nusa Tenggara 16.5 41.8 59.1 16.4 60.4
West Kalimantan 9.5 50.1 52.0 12.2 57.0
Central Kalimantan 12.6 31.3 39.9 12.8 42.0
South Kalimantan 31.8 43.0 52.1 31.3 56.4
East Kalimantan 43.2 59.5 65.3 41.6 68.0
North Sulawesi 26.7 42.1 70.7 27.9 82.6
Central Sulawesi 18.5 34.8 60.5 21.9 70.2
South Sulawesi 20.0 37.5 64.5 21.5 69.1
Southeast Sulawesi 19.8 41.4 61.8 24.7 66.2
Gorontalo --- --- --- --- ---
Maluku 27.2 47.7 71.6 20.4 68.2
North Maluku --- --- --- --- ---
Papua 17.5 33.2 39.9 18.6 48.3
Indonesia 17.6 41.5 71.4 19.2 75.0
Table 7.9a. Proportion of household/population by type of water sources (total) [%]—continued
Definitions: 1) Percentage of households surveyed using piped water 2) Percentage of population using water from improved sources more than 10 m away from excreta disposal site. The improved sources include: piped water, pumped water,
packaged water, water from a protected well or protected spring, rain water. Susenas includes packaged water as a source only from 1998 on.3) Percentage of households surveyed using water from improved sources, including those less than 10 m away from excreta disposal
Source: Susenas data as published in Welfare Statistics by BPS—Statistics Indonesia. Includes East Timor up to 1998.
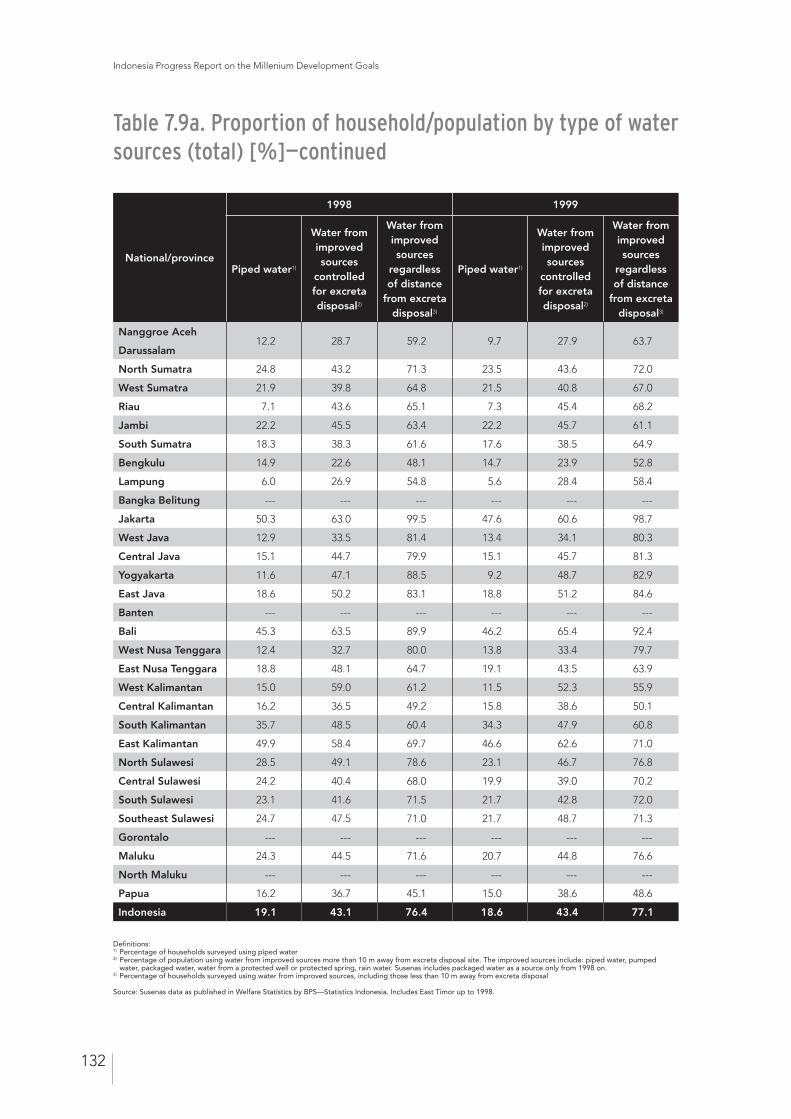
Indonesia Progress Report on the Millenium Development Goals
National/province
1998 1999
Piped water1)
Water from improved sources
controlled for excreta disposal2)
Water from improved sources
regardless of distance
from excreta disposal3)
Piped water1)
Water from improved sources
controlled for excreta disposal2)
Water from improved sources
regardless of distance
from excreta disposal3)
Nanggroe Aceh
Darussalam12.2 28.7 59.2 9.7 27.9 63.7
North Sumatra 24.8 43.2 71.3 23.5 43.6 72.0
West Sumatra 21.9 39.8 64.8 21.5 40.8 67.0
Riau 7.1 43.6 65.1 7.3 45.4 68.2
Jambi 22.2 45.5 63.4 22.2 45.7 61.1
South Sumatra 18.3 38.3 61.6 17.6 38.5 64.9
Bengkulu 14.9 22.6 48.1 14.7 23.9 52.8
Lampung 6.0 26.9 54.8 5.6 28.4 58.4
Bangka Belitung --- --- --- --- --- ---
Jakarta 50.3 63.0 99.5 47.6 60.6 98.7
West Java 12.9 33.5 81.4 13.4 34.1 80.3
Central Java 15.1 44.7 79.9 15.1 45.7 81.3
Yogyakarta 11.6 47.1 88.5 9.2 48.7 82.9
East Java 18.6 50.2 83.1 18.8 51.2 84.6
Banten --- --- --- --- --- ---
Bali 45.3 63.5 89.9 46.2 65.4 92.4
West Nusa Tenggara 12.4 32.7 80.0 13.8 33.4 79.7
East Nusa Tenggara 18.8 48.1 64.7 19.1 43.5 63.9
West Kalimantan 15.0 59.0 61.2 11.5 52.3 55.9
Central Kalimantan 16.2 36.5 49.2 15.8 38.6 50.1
South Kalimantan 35.7 48.5 60.4 34.3 47.9 60.8
East Kalimantan 49.9 58.4 69.7 46.6 62.6 71.0
North Sulawesi 28.5 49.1 78.6 23.1 46.7 76.8
Central Sulawesi 24.2 40.4 68.0 19.9 39.0 70.2
South Sulawesi 23.1 41.6 71.5 21.7 42.8 72.0
Southeast Sulawesi 24.7 47.5 71.0 21.7 48.7 71.3
Gorontalo --- --- --- --- --- ---
Maluku 24.3 44.5 71.6 20.7 44.8 76.6
North Maluku --- --- --- --- --- ---
Papua 16.2 36.7 45.1 15.0 38.6 48.6
Indonesia 19.1 43.1 76.4 18.6 43.4 77.1
Table 7.9a. Proportion of household/population by type of water sources (total) [%]—continued
Definitions: 1) Percentage of households surveyed using piped water 2) Percentage of population using water from improved sources more than 10 m away from excreta disposal site. The improved sources include: piped water, pumped water, packaged water, water from a protected well or protected spring, rain water. Susenas includes packaged water as a source only from 1998 on.3) Percentage of households surveyed using water from improved sources, including those less than 10 m away from excreta disposal
Source: Susenas data as published in Welfare Statistics by BPS—Statistics Indonesia. Includes East Timor up to 1998.
132
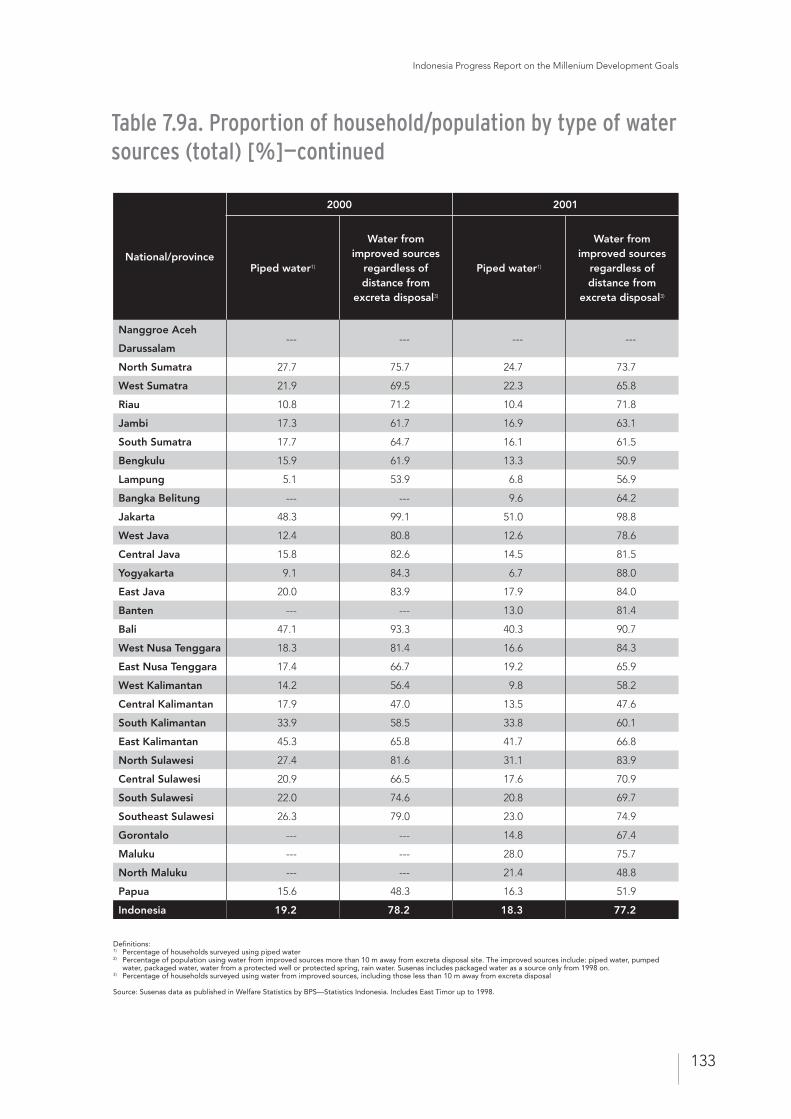
Indonesia Progress Report on the Millenium Development Goals
133
National/province
2000 2001
Piped water1)
Water from improved sources
regardless of distance from
excreta disposal3)
Piped water1)
Water from improved sources
regardless of distance from
excreta disposal3)
Nanggroe Aceh
Darussalam--- --- --- ---
North Sumatra 27.7 75.7 24.7 73.7
West Sumatra 21.9 69.5 22.3 65.8
Riau 10.8 71.2 10.4 71.8
Jambi 17.3 61.7 16.9 63.1
South Sumatra 17.7 64.7 16.1 61.5
Bengkulu 15.9 61.9 13.3 50.9
Lampung 5.1 53.9 6.8 56.9
Bangka Belitung --- --- 9.6 64.2
Jakarta 48.3 99.1 51.0 98.8
West Java 12.4 80.8 12.6 78.6
Central Java 15.8 82.6 14.5 81.5
Yogyakarta 9.1 84.3 6.7 88.0
East Java 20.0 83.9 17.9 84.0
Banten --- --- 13.0 81.4
Bali 47.1 93.3 40.3 90.7
West Nusa Tenggara 18.3 81.4 16.6 84.3
East Nusa Tenggara 17.4 66.7 19.2 65.9
West Kalimantan 14.2 56.4 9.8 58.2
Central Kalimantan 17.9 47.0 13.5 47.6
South Kalimantan 33.9 58.5 33.8 60.1
East Kalimantan 45.3 65.8 41.7 66.8
North Sulawesi 27.4 81.6 31.1 83.9
Central Sulawesi 20.9 66.5 17.6 70.9
South Sulawesi 22.0 74.6 20.8 69.7
Southeast Sulawesi 26.3 79.0 23.0 74.9
Gorontalo --- --- 14.8 67.4
Maluku --- --- 28.0 75.7
North Maluku --- --- 21.4 48.8
Papua 15.6 48.3 16.3 51.9
Indonesia 19.2 78.2 18.3 77.2
Table 7.9a. Proportion of household/population by type of water sources (total) [%]—continued
Definitions: 1) Percentage of households surveyed using piped water 2) Percentage of population using water from improved sources more than 10 m away from excreta disposal site. The improved sources include: piped water, pumped water, packaged water, water from a protected well or protected spring, rain water. Susenas includes packaged water as a source only from 1998 on.3) Percentage of households surveyed using water from improved sources, including those less than 10 m away from excreta disposal
Source: Susenas data as published in Welfare Statistics by BPS—Statistics Indonesia. Includes East Timor up to 1998.
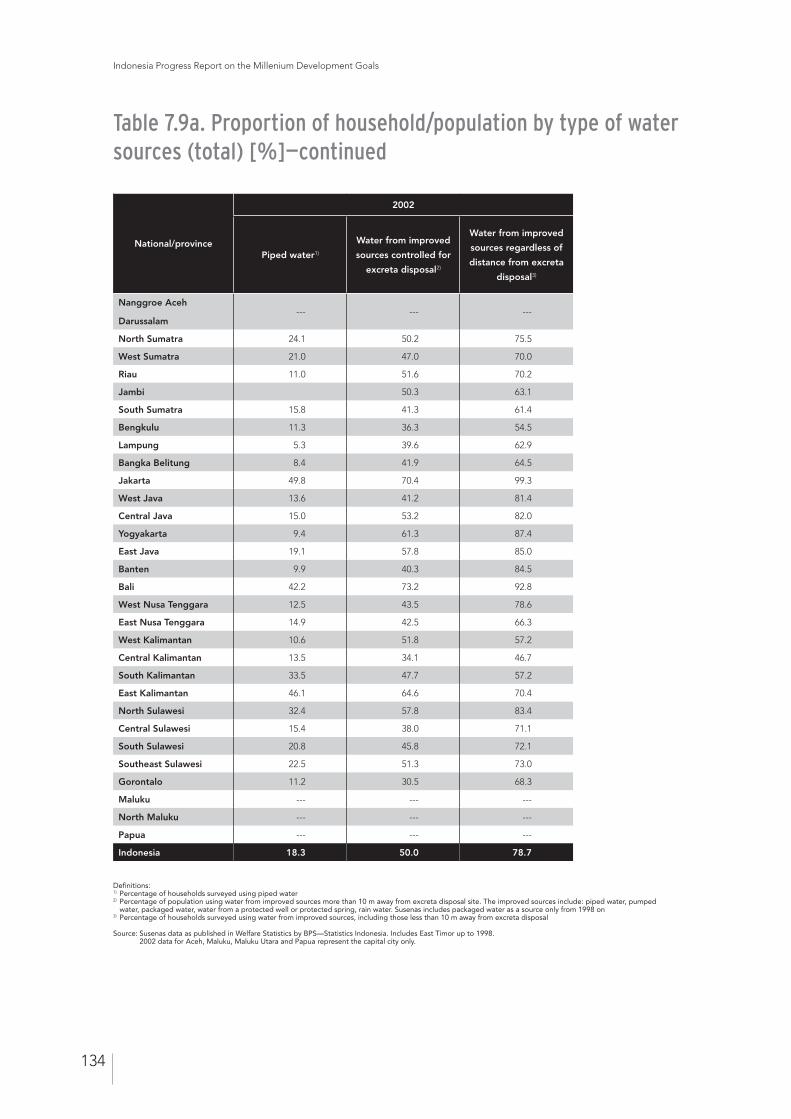
Indonesia Progress Report on the Millenium Development Goals
134
Table 7.9a. Proportion of household/population by type of water sources (total) [%]—continued
National/province
2002
Piped water1)
Water from improved
sources controlled for
excreta disposal2)
Water from improved
sources regardless of
distance from excreta
disposal3)
Nanggroe Aceh
Darussalam--- --- ---
North Sumatra 24.1 50.2 75.5
West Sumatra 21.0 47.0 70.0
Riau 11.0 51.6 70.2
Jambi 50.3 63.1
South Sumatra 15.8 41.3 61.4
Bengkulu 11.3 36.3 54.5
Lampung 5.3 39.6 62.9
Bangka Belitung 8.4 41.9 64.5
Jakarta 49.8 70.4 99.3
West Java 13.6 41.2 81.4
Central Java 15.0 53.2 82.0
Yogyakarta 9.4 61.3 87.4
East Java 19.1 57.8 85.0
Banten 9.9 40.3 84.5
Bali 42.2 73.2 92.8
West Nusa Tenggara 12.5 43.5 78.6
East Nusa Tenggara 14.9 42.5 66.3
West Kalimantan 10.6 51.8 57.2
Central Kalimantan 13.5 34.1 46.7
South Kalimantan 33.5 47.7 57.2
East Kalimantan 46.1 64.6 70.4
North Sulawesi 32.4 57.8 83.4
Central Sulawesi 15.4 38.0 71.1
South Sulawesi 20.8 45.8 72.1
Southeast Sulawesi 22.5 51.3 73.0
Gorontalo 11.2 30.5 68.3
Maluku --- --- ---
North Maluku --- --- ---
Papua --- --- ---
Indonesia 18.3 50.0 78.7
Definitions: 1) Percentage of households surveyed using piped water 2) Percentage of population using water from improved sources more than 10 m away from excreta disposal site. The improved sources include: piped water, pumped water, packaged water, water from a protected well or protected spring, rain water. Susenas includes packaged water as a source only from 1998 on 3) Percentage of households surveyed using water from improved sources, including those less than 10 m away from excreta disposal
Source: Susenas data as published in Welfare Statistics by BPS—Statistics Indonesia. Includes East Timor up to 1998. 2002 data for Aceh, Maluku, Maluku Utara and Papua represent the capital city only.
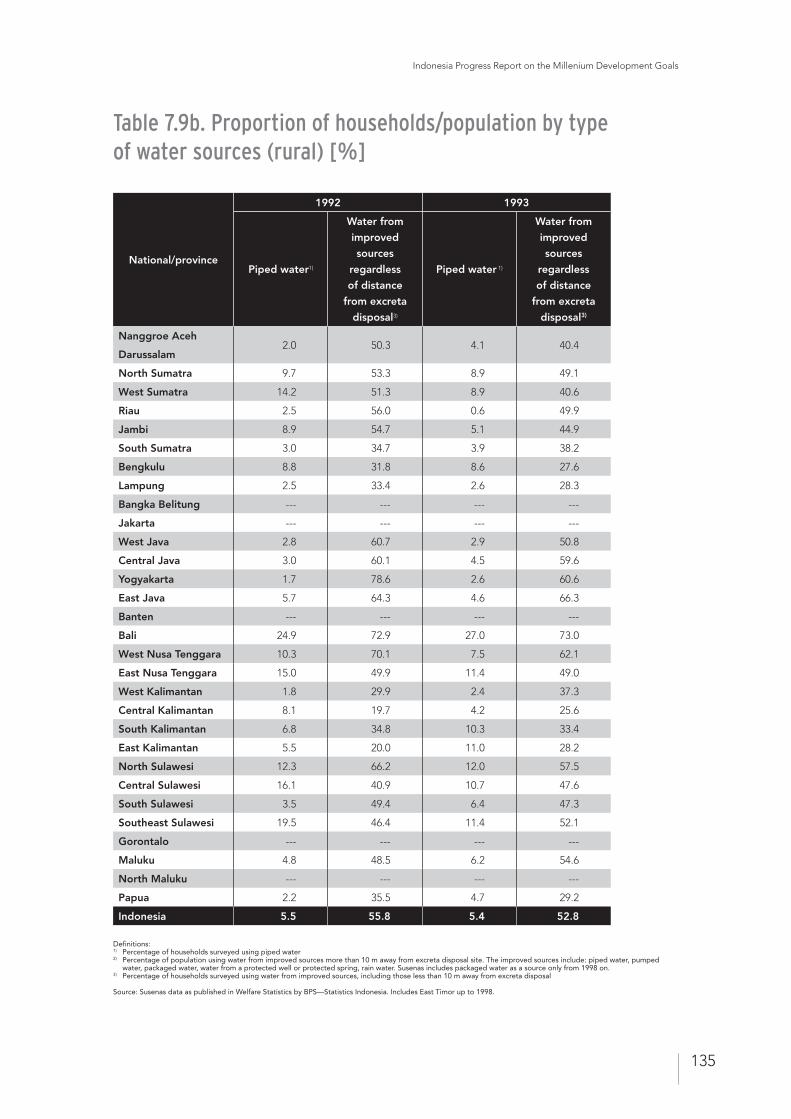
Indonesia Progress Report on the Millenium Development Goals
135
National/province
1992 1993
Piped water1)
Water from
improved
sources
regardless
of distance
from excreta
disposal3)
Piped water 1)
Water from
improved
sources
regardless
of distance
from excreta
disposal3)
Nanggroe Aceh
Darussalam2.0 50.3 4.1 40.4
North Sumatra 9.7 53.3 8.9 49.1
West Sumatra 14.2 51.3 8.9 40.6
Riau 2.5 56.0 0.6 49.9
Jambi 8.9 54.7 5.1 44.9
South Sumatra 3.0 34.7 3.9 38.2
Bengkulu 8.8 31.8 8.6 27.6
Lampung 2.5 33.4 2.6 28.3
Bangka Belitung --- --- --- ---
Jakarta --- --- --- ---
West Java 2.8 60.7 2.9 50.8
Central Java 3.0 60.1 4.5 59.6
Yogyakarta 1.7 78.6 2.6 60.6
East Java 5.7 64.3 4.6 66.3
Banten --- --- --- ---
Bali 24.9 72.9 27.0 73.0
West Nusa Tenggara 10.3 70.1 7.5 62.1
East Nusa Tenggara 15.0 49.9 11.4 49.0
West Kalimantan 1.8 29.9 2.4 37.3
Central Kalimantan 8.1 19.7 4.2 25.6
South Kalimantan 6.8 34.8 10.3 33.4
East Kalimantan 5.5 20.0 11.0 28.2
North Sulawesi 12.3 66.2 12.0 57.5
Central Sulawesi 16.1 40.9 10.7 47.6
South Sulawesi 3.5 49.4 6.4 47.3
Southeast Sulawesi 19.5 46.4 11.4 52.1
Gorontalo --- --- --- ---
Maluku 4.8 48.5 6.2 54.6
North Maluku --- --- --- ---
Papua 2.2 35.5 4.7 29.2
Indonesia 5.5 55.8 5.4 52.8
Table 7.9b. Proportion of households/population by type of water sources (rural) [%]
Definitions: 1) Percentage of households surveyed using piped water 2) Percentage of population using water from improved sources more than 10 m away from excreta disposal site. The improved sources include: piped water, pumped water, packaged water, water from a protected well or protected spring, rain water. Susenas includes packaged water as a source only from 1998 on.3) Percentage of households surveyed using water from improved sources, including those less than 10 m away from excreta disposal
Source: Susenas data as published in Welfare Statistics by BPS—Statistics Indonesia. Includes East Timor up to 1998.
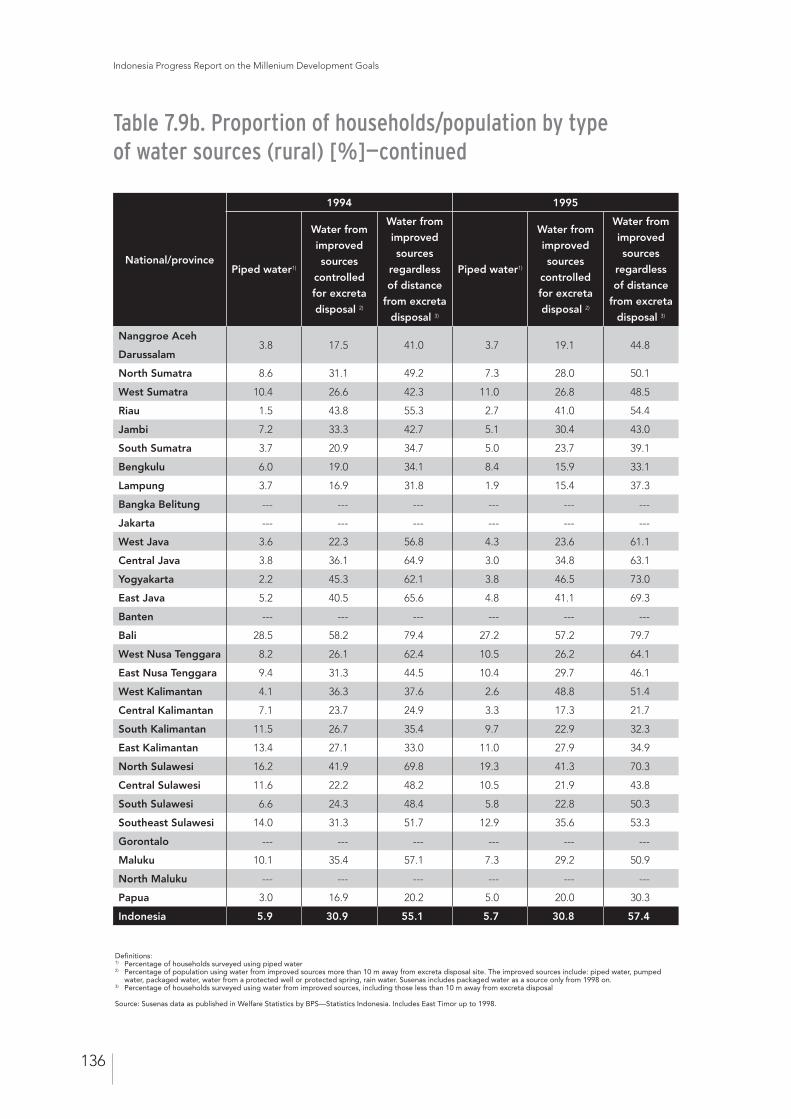
Indonesia Progress Report on the Millenium Development Goals
136
National/province
1994 1995
Piped water1)
Water from
improved
sources
controlled
for excreta
disposal 2)
Water from
improved
sources
regardless
of distance
from excreta
disposal 3)
Piped water1)
Water from
improved
sources
controlled
for excreta
disposal 2)
Water from
improved
sources
regardless
of distance
from excreta
disposal 3)
Nanggroe Aceh
Darussalam3.8 17.5 41.0 3.7 19.1 44.8
North Sumatra 8.6 31.1 49.2 7.3 28.0 50.1
West Sumatra 10.4 26.6 42.3 11.0 26.8 48.5
Riau 1.5 43.8 55.3 2.7 41.0 54.4
Jambi 7.2 33.3 42.7 5.1 30.4 43.0
South Sumatra 3.7 20.9 34.7 5.0 23.7 39.1
Bengkulu 6.0 19.0 34.1 8.4 15.9 33.1
Lampung 3.7 16.9 31.8 1.9 15.4 37.3
Bangka Belitung --- --- --- --- --- ---
Jakarta --- --- --- --- --- ---
West Java 3.6 22.3 56.8 4.3 23.6 61.1
Central Java 3.8 36.1 64.9 3.0 34.8 63.1
Yogyakarta 2.2 45.3 62.1 3.8 46.5 73.0
East Java 5.2 40.5 65.6 4.8 41.1 69.3
Banten --- --- --- --- --- ---
Bali 28.5 58.2 79.4 27.2 57.2 79.7
West Nusa Tenggara 8.2 26.1 62.4 10.5 26.2 64.1
East Nusa Tenggara 9.4 31.3 44.5 10.4 29.7 46.1
West Kalimantan 4.1 36.3 37.6 2.6 48.8 51.4
Central Kalimantan 7.1 23.7 24.9 3.3 17.3 21.7
South Kalimantan 11.5 26.7 35.4 9.7 22.9 32.3
East Kalimantan 13.4 27.1 33.0 11.0 27.9 34.9
North Sulawesi 16.2 41.9 69.8 19.3 41.3 70.3
Central Sulawesi 11.6 22.2 48.2 10.5 21.9 43.8
South Sulawesi 6.6 24.3 48.4 5.8 22.8 50.3
Southeast Sulawesi 14.0 31.3 51.7 12.9 35.6 53.3
Gorontalo --- --- --- --- --- ---
Maluku 10.1 35.4 57.1 7.3 29.2 50.9
North Maluku --- --- --- --- --- ---
Papua 3.0 16.9 20.2 5.0 20.0 30.3
Indonesia 5.9 30.9 55.1 5.7 30.8 57.4
Table 7.9b. Proportion of households/population by type of water sources (rural) [%]—continued
Definitions: 1) Percentage of households surveyed using piped water 2) Percentage of population using water from improved sources more than 10 m away from excreta disposal site. The improved sources include: piped water, pumped water, packaged water, water from a protected well or protected spring, rain water. Susenas includes packaged water as a source only from 1998 on.3) Percentage of households surveyed using water from improved sources, including those less than 10 m away from excreta disposal
Source: Susenas data as published in Welfare Statistics by BPS—Statistics Indonesia. Includes East Timor up to 1998.
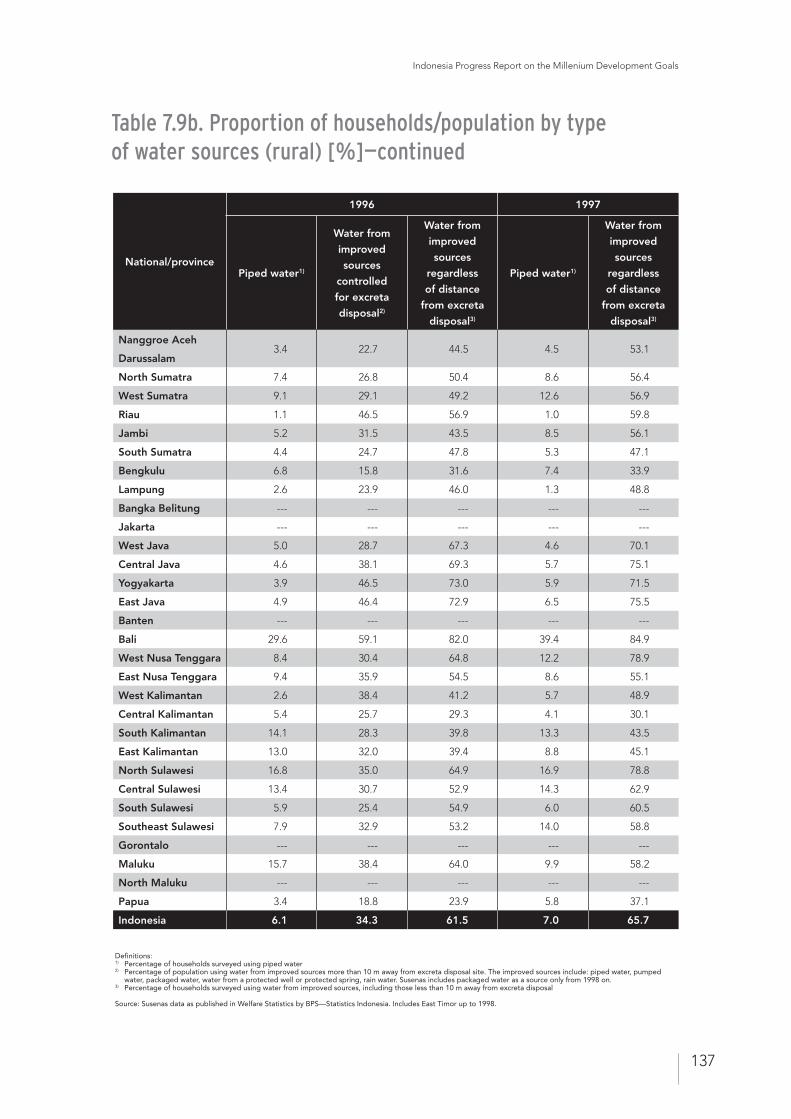
Indonesia Progress Report on the Millenium Development Goals
137
National/province
1996 1997
Piped water1)
Water from
improved
sources
controlled
for excreta
disposal2)
Water from
improved
sources
regardless
of distance
from excreta
disposal3)
Piped water1)
Water from
improved
sources
regardless
of distance
from excreta
disposal3)
Nanggroe Aceh
Darussalam3.4 22.7 44.5 4.5 53.1
North Sumatra 7.4 26.8 50.4 8.6 56.4
West Sumatra 9.1 29.1 49.2 12.6 56.9
Riau 1.1 46.5 56.9 1.0 59.8
Jambi 5.2 31.5 43.5 8.5 56.1
South Sumatra 4.4 24.7 47.8 5.3 47.1
Bengkulu 6.8 15.8 31.6 7.4 33.9
Lampung 2.6 23.9 46.0 1.3 48.8
Bangka Belitung --- --- --- --- ---
Jakarta --- --- --- --- ---
West Java 5.0 28.7 67.3 4.6 70.1
Central Java 4.6 38.1 69.3 5.7 75.1
Yogyakarta 3.9 46.5 73.0 5.9 71.5
East Java 4.9 46.4 72.9 6.5 75.5
Banten --- --- --- --- ---
Bali 29.6 59.1 82.0 39.4 84.9
West Nusa Tenggara 8.4 30.4 64.8 12.2 78.9
East Nusa Tenggara 9.4 35.9 54.5 8.6 55.1
West Kalimantan 2.6 38.4 41.2 5.7 48.9
Central Kalimantan 5.4 25.7 29.3 4.1 30.1
South Kalimantan 14.1 28.3 39.8 13.3 43.5
East Kalimantan 13.0 32.0 39.4 8.8 45.1
North Sulawesi 16.8 35.0 64.9 16.9 78.8
Central Sulawesi 13.4 30.7 52.9 14.3 62.9
South Sulawesi 5.9 25.4 54.9 6.0 60.5
Southeast Sulawesi 7.9 32.9 53.2 14.0 58.8
Gorontalo --- --- --- --- ---
Maluku 15.7 38.4 64.0 9.9 58.2
North Maluku --- --- --- --- ---
Papua 3.4 18.8 23.9 5.8 37.1
Indonesia 6.1 34.3 61.5 7.0 65.7
Table 7.9b. Proportion of households/population by type of water sources (rural) [%]—continued
Definitions: 1) Percentage of households surveyed using piped water 2) Percentage of population using water from improved sources more than 10 m away from excreta disposal site. The improved sources include: piped water, pumped water, packaged water, water from a protected well or protected spring, rain water. Susenas includes packaged water as a source only from 1998 on.3) Percentage of households surveyed using water from improved sources, including those less than 10 m away from excreta disposal
Source: Susenas data as published in Welfare Statistics by BPS—Statistics Indonesia. Includes East Timor up to 1998.
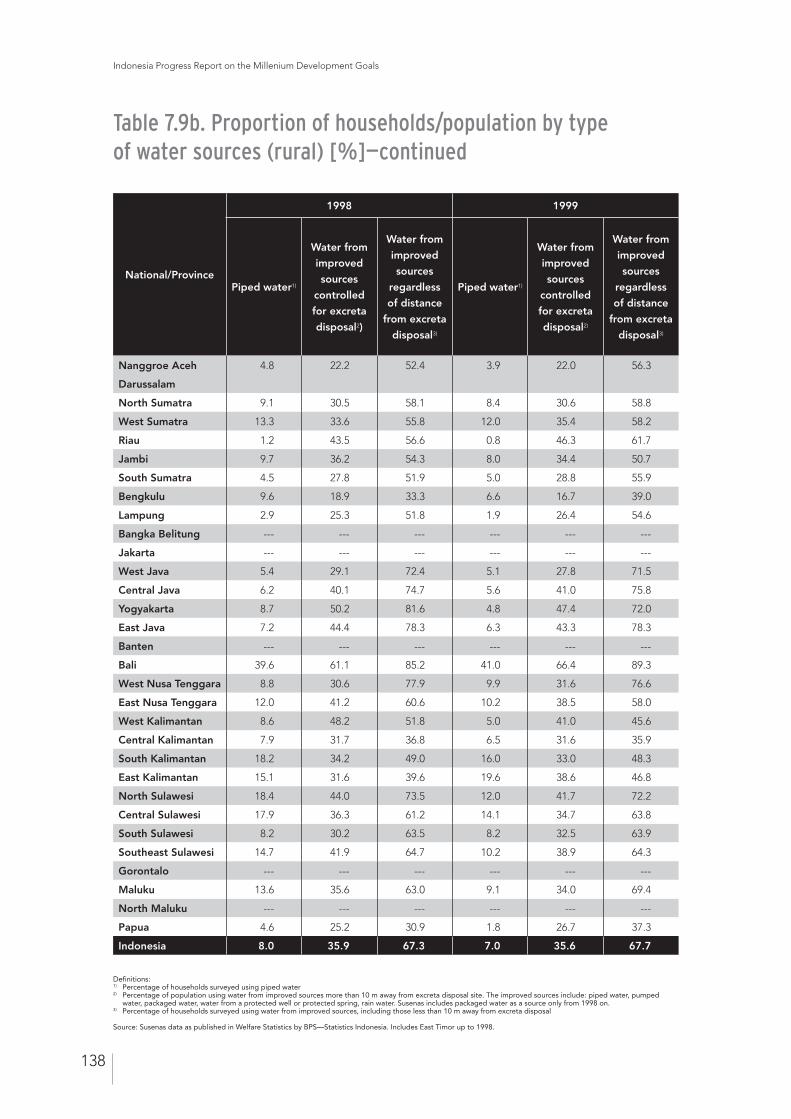
Indonesia Progress Report on the Millenium Development Goals
138
National/Province
1998 1999
Piped water1)
Water from
improved
sources
controlled
for excreta
disposal2)
Water from
improved
sources
regardless
of distance
from excreta
disposal3)
Piped water1)
Water from
improved
sources
controlled
for excreta
disposal2)
Water from
improved
sources
regardless
of distance
from excreta
disposal3)
Nanggroe Aceh
Darussalam
4.8 22.2 52.4 3.9 22.0 56.3
North Sumatra 9.1 30.5 58.1 8.4 30.6 58.8
West Sumatra 13.3 33.6 55.8 12.0 35.4 58.2
Riau 1.2 43.5 56.6 0.8 46.3 61.7
Jambi 9.7 36.2 54.3 8.0 34.4 50.7
South Sumatra 4.5 27.8 51.9 5.0 28.8 55.9
Bengkulu 9.6 18.9 33.3 6.6 16.7 39.0
Lampung 2.9 25.3 51.8 1.9 26.4 54.6
Bangka Belitung --- --- --- --- --- ---
Jakarta --- --- --- --- --- ---
West Java 5.4 29.1 72.4 5.1 27.8 71.5
Central Java 6.2 40.1 74.7 5.6 41.0 75.8
Yogyakarta 8.7 50.2 81.6 4.8 47.4 72.0
East Java 7.2 44.4 78.3 6.3 43.3 78.3
Banten --- --- --- --- --- ---
Bali 39.6 61.1 85.2 41.0 66.4 89.3
West Nusa Tenggara 8.8 30.6 77.9 9.9 31.6 76.6
East Nusa Tenggara 12.0 41.2 60.6 10.2 38.5 58.0
West Kalimantan 8.6 48.2 51.8 5.0 41.0 45.6
Central Kalimantan 7.9 31.7 36.8 6.5 31.6 35.9
South Kalimantan 18.2 34.2 49.0 16.0 33.0 48.3
East Kalimantan 15.1 31.6 39.6 19.6 38.6 46.8
North Sulawesi 18.4 44.0 73.5 12.0 41.7 72.2
Central Sulawesi 17.9 36.3 61.2 14.1 34.7 63.8
South Sulawesi 8.2 30.2 63.5 8.2 32.5 63.9
Southeast Sulawesi 14.7 41.9 64.7 10.2 38.9 64.3
Gorontalo --- --- --- --- --- ---
Maluku 13.6 35.6 63.0 9.1 34.0 69.4
North Maluku --- --- --- --- --- ---
Papua 4.6 25.2 30.9 1.8 26.7 37.3
Indonesia 8.0 35.9 67.3 7.0 35.6 67.7
Table 7.9b. Proportion of households/population by type of water sources (rural) [%]—continued
Definitions: 1) Percentage of households surveyed using piped water 2) Percentage of population using water from improved sources more than 10 m away from excreta disposal site. The improved sources include: piped water, pumped water, packaged water, water from a protected well or protected spring, rain water. Susenas includes packaged water as a source only from 1998 on.3) Percentage of households surveyed using water from improved sources, including those less than 10 m away from excreta disposal
Source: Susenas data as published in Welfare Statistics by BPS—Statistics Indonesia. Includes East Timor up to 1998.
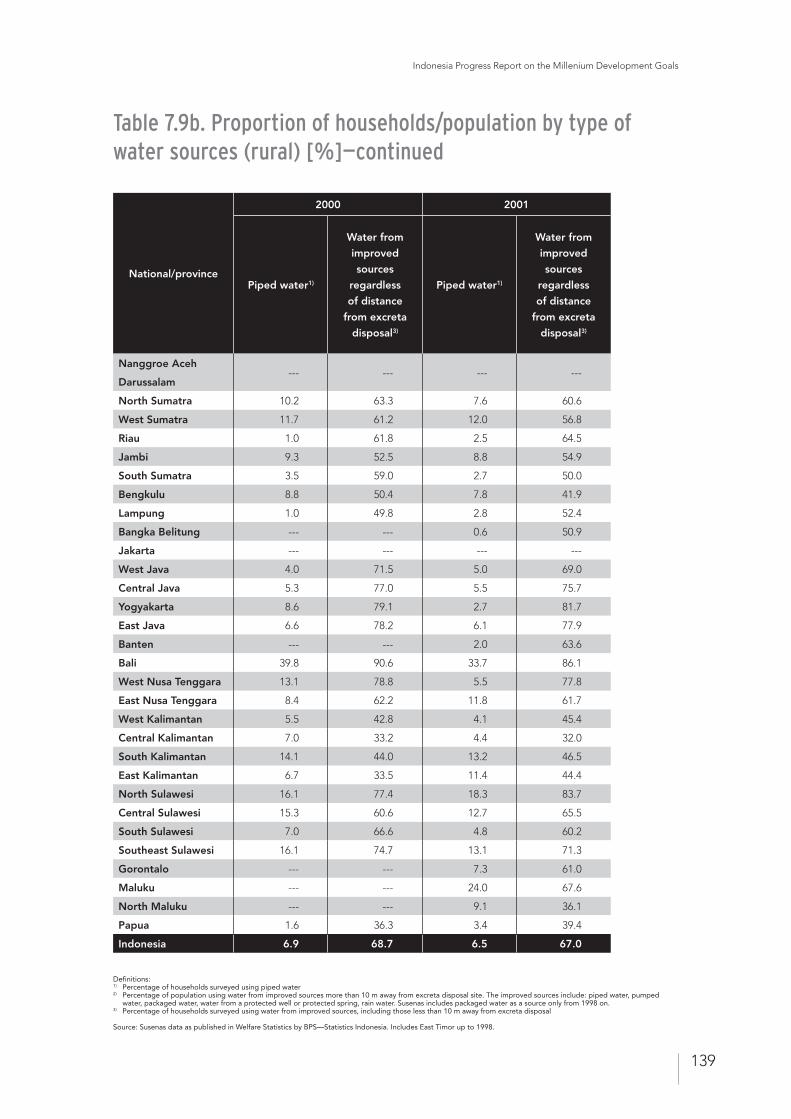
Indonesia Progress Report on the Millenium Development Goals
139
National/province
2000 2001
Piped water1)
Water from
improved
sources
regardless
of distance
from excreta
disposal3)
Piped water1)
Water from
improved
sources
regardless
of distance
from excreta
disposal3)
Nanggroe Aceh
Darussalam--- --- --- ---
North Sumatra 10.2 63.3 7.6 60.6
West Sumatra 11.7 61.2 12.0 56.8
Riau 1.0 61.8 2.5 64.5
Jambi 9.3 52.5 8.8 54.9
South Sumatra 3.5 59.0 2.7 50.0
Bengkulu 8.8 50.4 7.8 41.9
Lampung 1.0 49.8 2.8 52.4
Bangka Belitung --- --- 0.6 50.9
Jakarta --- --- --- ---
West Java 4.0 71.5 5.0 69.0
Central Java 5.3 77.0 5.5 75.7
Yogyakarta 8.6 79.1 2.7 81.7
East Java 6.6 78.2 6.1 77.9
Banten --- --- 2.0 63.6
Bali 39.8 90.6 33.7 86.1
West Nusa Tenggara 13.1 78.8 5.5 77.8
East Nusa Tenggara 8.4 62.2 11.8 61.7
West Kalimantan 5.5 42.8 4.1 45.4
Central Kalimantan 7.0 33.2 4.4 32.0
South Kalimantan 14.1 44.0 13.2 46.5
East Kalimantan 6.7 33.5 11.4 44.4
North Sulawesi 16.1 77.4 18.3 83.7
Central Sulawesi 15.3 60.6 12.7 65.5
South Sulawesi 7.0 66.6 4.8 60.2
Southeast Sulawesi 16.1 74.7 13.1 71.3
Gorontalo --- --- 7.3 61.0
Maluku --- --- 24.0 67.6
North Maluku --- --- 9.1 36.1
Papua 1.6 36.3 3.4 39.4
Indonesia 6.9 68.7 6.5 67.0
Table 7.9b. Proportion of households/population by type of water sources (rural) [%]—continued
Definitions: 1) Percentage of households surveyed using piped water 2) Percentage of population using water from improved sources more than 10 m away from excreta disposal site. The improved sources include: piped water, pumped water, packaged water, water from a protected well or protected spring, rain water. Susenas includes packaged water as a source only from 1998 on.3) Percentage of households surveyed using water from improved sources, including those less than 10 m away from excreta disposal
Source: Susenas data as published in Welfare Statistics by BPS—Statistics Indonesia. Includes East Timor up to 1998.
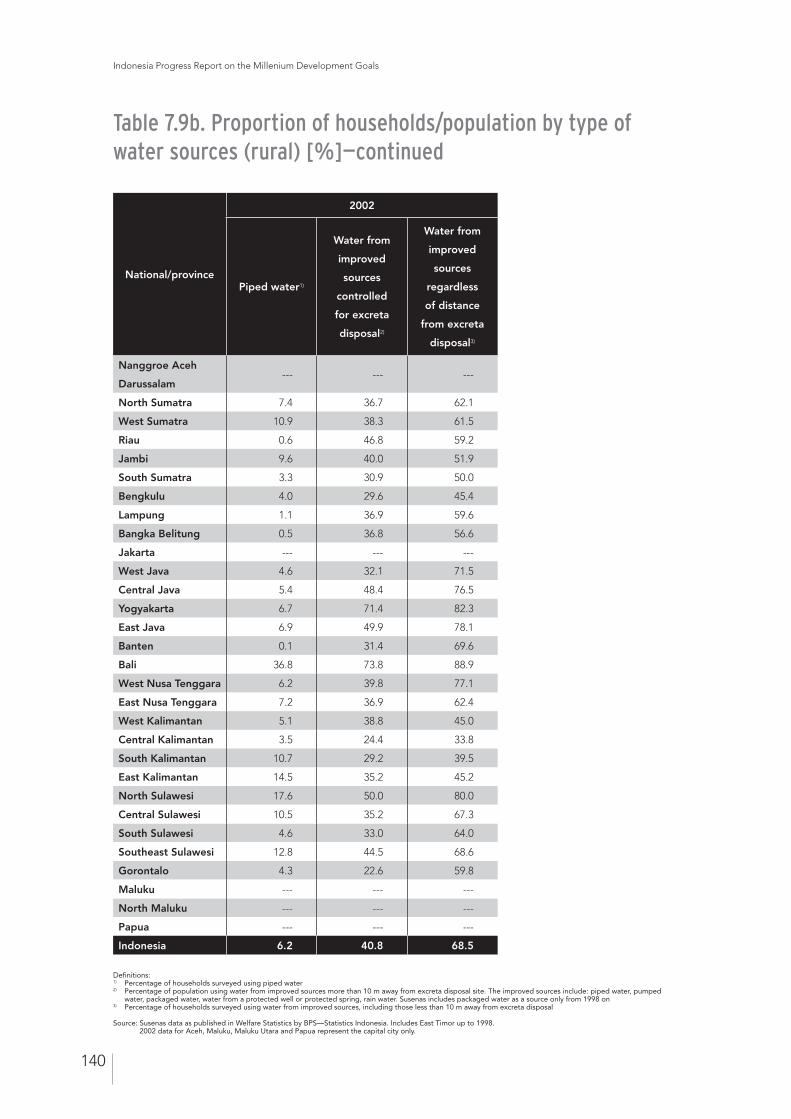
Indonesia Progress Report on the Millenium Development Goals
140
National/province
2002
Piped water1)
Water from
improved
sources
controlled
for excreta
disposal2)
Water from
improved
sources
regardless
of distance
from excreta
disposal3)
Nanggroe Aceh
Darussalam--- --- ---
North Sumatra 7.4 36.7 62.1
West Sumatra 10.9 38.3 61.5
Riau 0.6 46.8 59.2
Jambi 9.6 40.0 51.9
South Sumatra 3.3 30.9 50.0
Bengkulu 4.0 29.6 45.4
Lampung 1.1 36.9 59.6
Bangka Belitung 0.5 36.8 56.6
Jakarta --- --- ---
West Java 4.6 32.1 71.5
Central Java 5.4 48.4 76.5
Yogyakarta 6.7 71.4 82.3
East Java 6.9 49.9 78.1
Banten 0.1 31.4 69.6
Bali 36.8 73.8 88.9
West Nusa Tenggara 6.2 39.8 77.1
East Nusa Tenggara 7.2 36.9 62.4
West Kalimantan 5.1 38.8 45.0
Central Kalimantan 3.5 24.4 33.8
South Kalimantan 10.7 29.2 39.5
East Kalimantan 14.5 35.2 45.2
North Sulawesi 17.6 50.0 80.0
Central Sulawesi 10.5 35.2 67.3
South Sulawesi 4.6 33.0 64.0
Southeast Sulawesi 12.8 44.5 68.6
Gorontalo 4.3 22.6 59.8
Maluku --- --- ---
North Maluku --- --- ---
Papua --- --- ---
Indonesia 6.2 40.8 68.5
Table 7.9b. Proportion of households/population by type of water sources (rural) [%]—continued
Definitions: 1) Percentage of households surveyed using piped water 2) Percentage of population using water from improved sources more than 10 m away from excreta disposal site. The improved sources include: piped water, pumped water, packaged water, water from a protected well or protected spring, rain water. Susenas includes packaged water as a source only from 1998 on 3) Percentage of households surveyed using water from improved sources, including those less than 10 m away from excreta disposal
Source: Susenas data as published in Welfare Statistics by BPS—Statistics Indonesia. Includes East Timor up to 1998. 2002 data for Aceh, Maluku, Maluku Utara and Papua represent the capital city only.
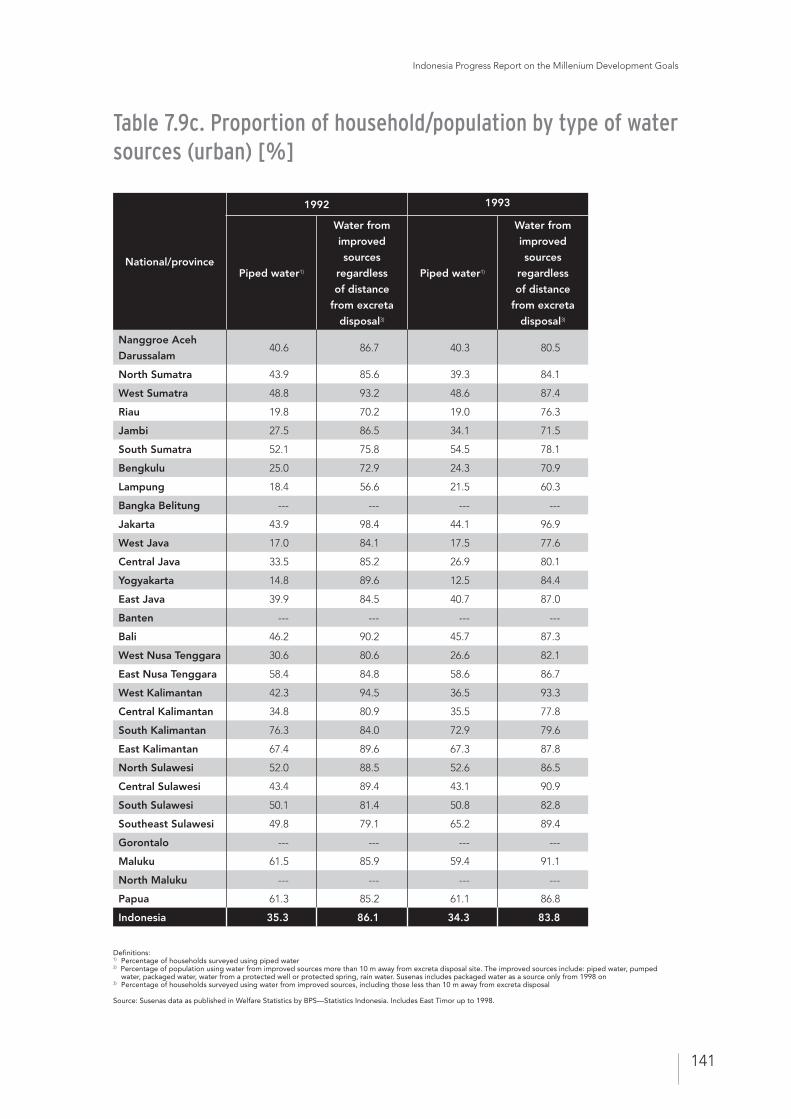
Indonesia Progress Report on the Millenium Development Goals
141
National/province
1992 1993
Piped water1)
Water from
improved
sources
regardless
of distance
from excreta
disposal3)
Piped water1)
Water from
improved
sources
regardless
of distance
from excreta
disposal3)
Nanggroe Aceh
Darussalam40.6 86.7 40.3 80.5
North Sumatra 43.9 85.6 39.3 84.1
West Sumatra 48.8 93.2 48.6 87.4
Riau 19.8 70.2 19.0 76.3
Jambi 27.5 86.5 34.1 71.5
South Sumatra 52.1 75.8 54.5 78.1
Bengkulu 25.0 72.9 24.3 70.9
Lampung 18.4 56.6 21.5 60.3
Bangka Belitung --- --- --- ---
Jakarta 43.9 98.4 44.1 96.9
West Java 17.0 84.1 17.5 77.6
Central Java 33.5 85.2 26.9 80.1
Yogyakarta 14.8 89.6 12.5 84.4
East Java 39.9 84.5 40.7 87.0
Banten --- --- --- ---
Bali 46.2 90.2 45.7 87.3
West Nusa Tenggara 30.6 80.6 26.6 82.1
East Nusa Tenggara 58.4 84.8 58.6 86.7
West Kalimantan 42.3 94.5 36.5 93.3
Central Kalimantan 34.8 80.9 35.5 77.8
South Kalimantan 76.3 84.0 72.9 79.6
East Kalimantan 67.4 89.6 67.3 87.8
North Sulawesi 52.0 88.5 52.6 86.5
Central Sulawesi 43.4 89.4 43.1 90.9
South Sulawesi 50.1 81.4 50.8 82.8
Southeast Sulawesi 49.8 79.1 65.2 89.4
Gorontalo --- --- --- ---
Maluku 61.5 85.9 59.4 91.1
North Maluku --- --- --- ---
Papua 61.3 85.2 61.1 86.8
Indonesia 35.3 86.1 34.3 83.8
Table 7.9c. Proportion of household/population by type of water sources (urban) [%]
Definitions: 1) Percentage of households surveyed using piped water 2) Percentage of population using water from improved sources more than 10 m away from excreta disposal site. The improved sources include: piped water, pumped water, packaged water, water from a protected well or protected spring, rain water. Susenas includes packaged water as a source only from 1998 on 3) Percentage of households surveyed using water from improved sources, including those less than 10 m away from excreta disposal
Source: Susenas data as published in Welfare Statistics by BPS—Statistics Indonesia. Includes East Timor up to 1998.
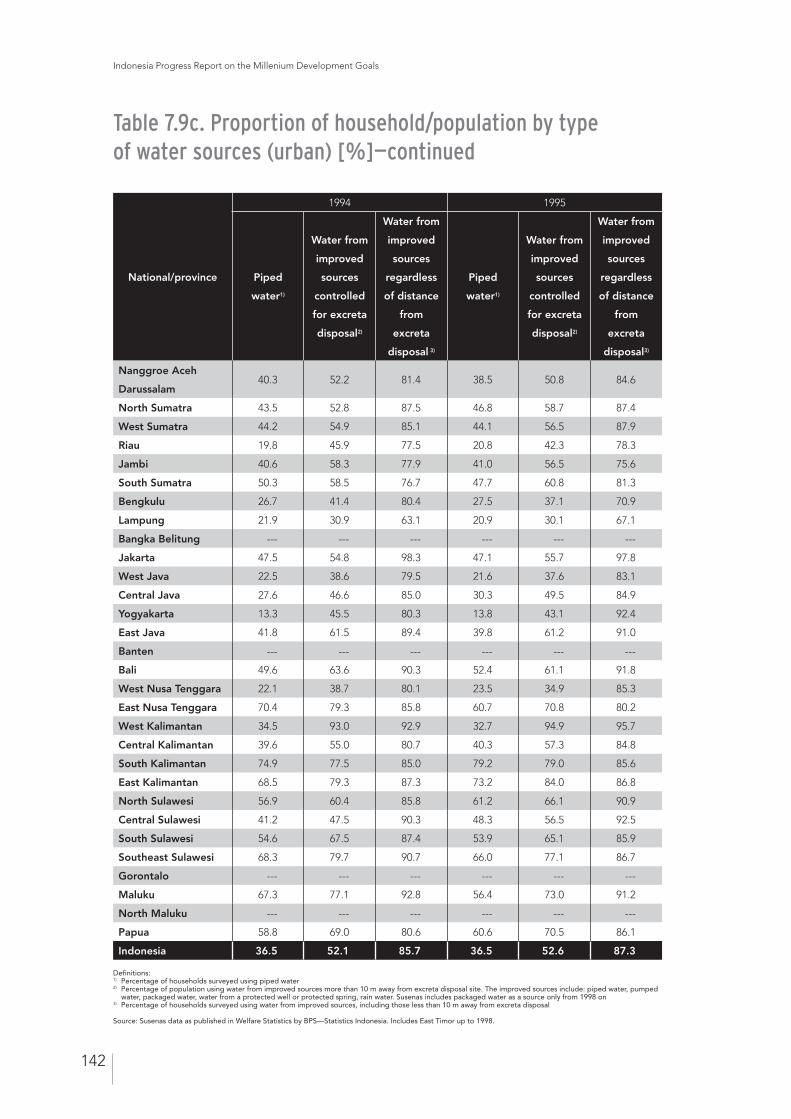
Indonesia Progress Report on the Millenium Development Goals
142
Table 7.9c. Proportion of household/population by type of water sources (urban) [%]—continued
National/province
1994 1995
Piped
water1)
Water from
improved
sources
controlled
for excreta
disposal2)
Water from
improved
sources
regardless
of distance
from
excreta
disposal 3)
Piped
water1)
Water from
improved
sources
controlled
for excreta
disposal2)
Water from
improved
sources
regardless
of distance
from
excreta
disposal3)
Nanggroe Aceh
Darussalam40.3 52.2 81.4 38.5 50.8 84.6
North Sumatra 43.5 52.8 87.5 46.8 58.7 87.4
West Sumatra 44.2 54.9 85.1 44.1 56.5 87.9
Riau 19.8 45.9 77.5 20.8 42.3 78.3
Jambi 40.6 58.3 77.9 41.0 56.5 75.6
South Sumatra 50.3 58.5 76.7 47.7 60.8 81.3
Bengkulu 26.7 41.4 80.4 27.5 37.1 70.9
Lampung 21.9 30.9 63.1 20.9 30.1 67.1
Bangka Belitung --- --- --- --- --- ---
Jakarta 47.5 54.8 98.3 47.1 55.7 97.8
West Java 22.5 38.6 79.5 21.6 37.6 83.1
Central Java 27.6 46.6 85.0 30.3 49.5 84.9
Yogyakarta 13.3 45.5 80.3 13.8 43.1 92.4
East Java 41.8 61.5 89.4 39.8 61.2 91.0
Banten --- --- --- --- --- ---
Bali 49.6 63.6 90.3 52.4 61.1 91.8
West Nusa Tenggara 22.1 38.7 80.1 23.5 34.9 85.3
East Nusa Tenggara 70.4 79.3 85.8 60.7 70.8 80.2
West Kalimantan 34.5 93.0 92.9 32.7 94.9 95.7
Central Kalimantan 39.6 55.0 80.7 40.3 57.3 84.8
South Kalimantan 74.9 77.5 85.0 79.2 79.0 85.6
East Kalimantan 68.5 79.3 87.3 73.2 84.0 86.8
North Sulawesi 56.9 60.4 85.8 61.2 66.1 90.9
Central Sulawesi 41.2 47.5 90.3 48.3 56.5 92.5
South Sulawesi 54.6 67.5 87.4 53.9 65.1 85.9
Southeast Sulawesi 68.3 79.7 90.7 66.0 77.1 86.7
Gorontalo --- --- --- --- --- ---
Maluku 67.3 77.1 92.8 56.4 73.0 91.2
North Maluku --- --- --- --- --- ---
Papua 58.8 69.0 80.6 60.6 70.5 86.1
Indonesia 36.5 52.1 85.7 36.5 52.6 87.3
Definitions: 1) Percentage of households surveyed using piped water 2) Percentage of population using water from improved sources more than 10 m away from excreta disposal site. The improved sources include: piped water, pumped water, packaged water, water from a protected well or protected spring, rain water. Susenas includes packaged water as a source only from 1998 on 3) Percentage of households surveyed using water from improved sources, including those less than 10 m away from excreta disposal
Source: Susenas data as published in Welfare Statistics by BPS—Statistics Indonesia. Includes East Timor up to 1998.
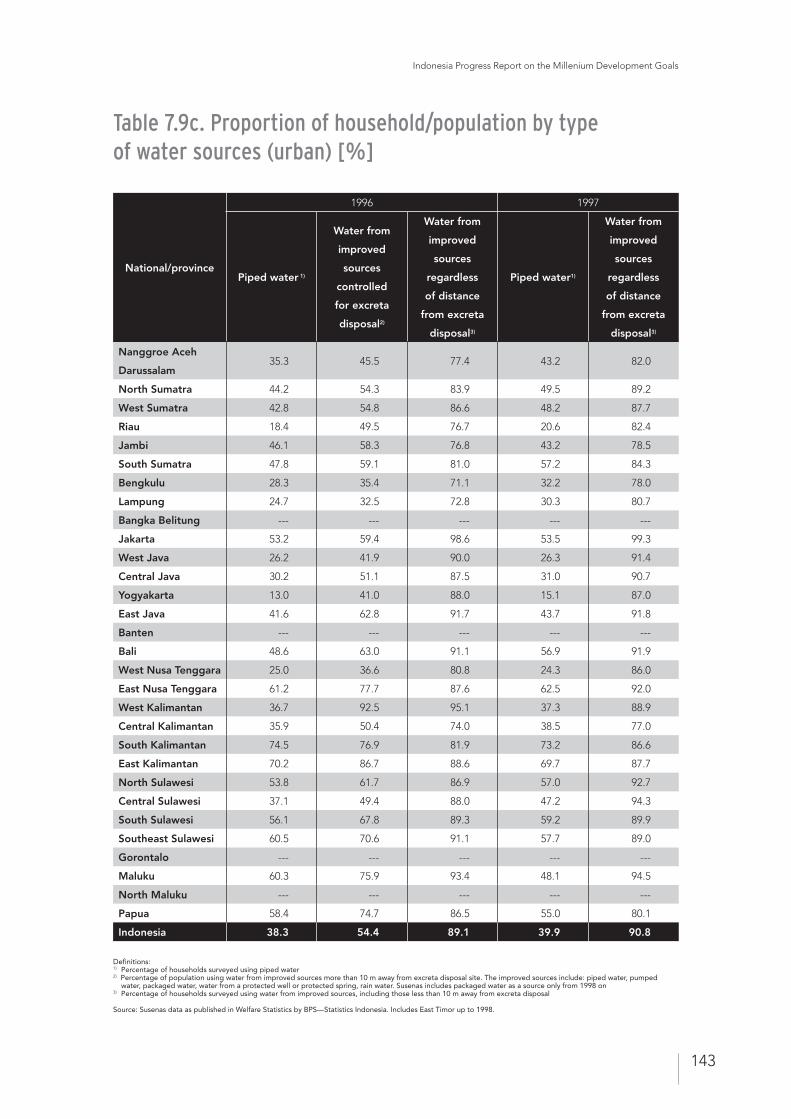
Indonesia Progress Report on the Millenium Development Goals
143
National/province
1996 1997
Piped water 1)
Water from
improved
sources
controlled
for excreta
disposal2)
Water from
improved
sources
regardless
of distance
from excreta
disposal3)
Piped water1)
Water from
improved
sources
regardless
of distance
from excreta
disposal3)
Nanggroe Aceh
Darussalam35.3 45.5 77.4 43.2 82.0
North Sumatra 44.2 54.3 83.9 49.5 89.2
West Sumatra 42.8 54.8 86.6 48.2 87.7
Riau 18.4 49.5 76.7 20.6 82.4
Jambi 46.1 58.3 76.8 43.2 78.5
South Sumatra 47.8 59.1 81.0 57.2 84.3
Bengkulu 28.3 35.4 71.1 32.2 78.0
Lampung 24.7 32.5 72.8 30.3 80.7
Bangka Belitung --- --- --- --- ---
Jakarta 53.2 59.4 98.6 53.5 99.3
West Java 26.2 41.9 90.0 26.3 91.4
Central Java 30.2 51.1 87.5 31.0 90.7
Yogyakarta 13.0 41.0 88.0 15.1 87.0
East Java 41.6 62.8 91.7 43.7 91.8
Banten --- --- --- --- ---
Bali 48.6 63.0 91.1 56.9 91.9
West Nusa Tenggara 25.0 36.6 80.8 24.3 86.0
East Nusa Tenggara 61.2 77.7 87.6 62.5 92.0
West Kalimantan 36.7 92.5 95.1 37.3 88.9
Central Kalimantan 35.9 50.4 74.0 38.5 77.0
South Kalimantan 74.5 76.9 81.9 73.2 86.6
East Kalimantan 70.2 86.7 88.6 69.7 87.7
North Sulawesi 53.8 61.7 86.9 57.0 92.7
Central Sulawesi 37.1 49.4 88.0 47.2 94.3
South Sulawesi 56.1 67.8 89.3 59.2 89.9
Southeast Sulawesi 60.5 70.6 91.1 57.7 89.0
Gorontalo --- --- --- --- ---
Maluku 60.3 75.9 93.4 48.1 94.5
North Maluku --- --- --- --- ---
Papua 58.4 74.7 86.5 55.0 80.1
Indonesia 38.3 54.4 89.1 39.9 90.8
Table 7.9c. Proportion of household/population by type of water sources (urban) [%]
Definitions: 1) Percentage of households surveyed using piped water 2) Percentage of population using water from improved sources more than 10 m away from excreta disposal site. The improved sources include: piped water, pumped water, packaged water, water from a protected well or protected spring, rain water. Susenas includes packaged water as a source only from 1998 on 3) Percentage of households surveyed using water from improved sources, including those less than 10 m away from excreta disposal
Source: Susenas data as published in Welfare Statistics by BPS—Statistics Indonesia. Includes East Timor up to 1998.
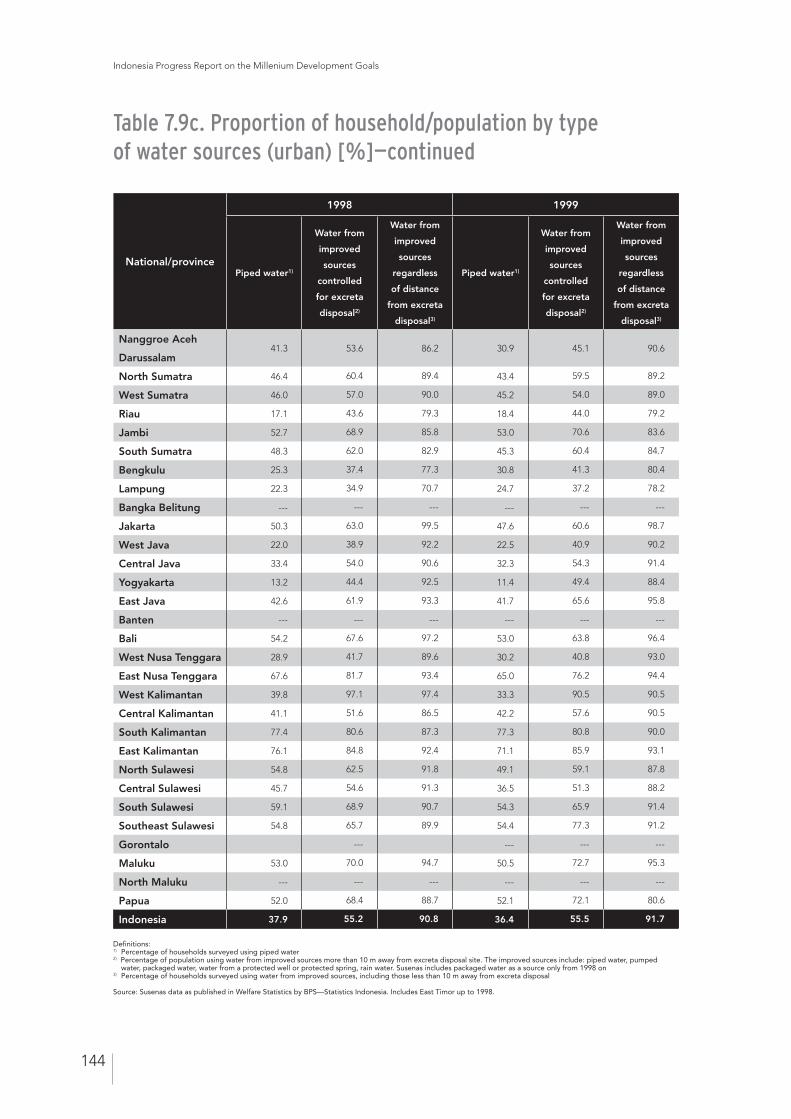
Indonesia Progress Report on the Millenium Development Goals
144
National/province
1998 1999
Piped water1)
Water from
improved
sources
controlled
for excreta
disposal2)
Water from
improved
sources
regardless
of distance
from excreta
disposal3)
Piped water1)
Water from
improved
sources
controlled
for excreta
disposal2)
Water from
improved
sources
regardless
of distance
from excreta
disposal3)
Nanggroe Aceh
Darussalam41.3 53.6 86.2 30.9 45.1 90.6
North Sumatra 46.4 60.4 89.4 43.4 59.5 89.2
West Sumatra 46.0 57.0 90.0 45.2 54.0 89.0
Riau 17.1 43.6 79.3 18.4 44.0 79.2
Jambi 52.7 68.9 85.8 53.0 70.6 83.6
South Sumatra 48.3 62.0 82.9 45.3 60.4 84.7
Bengkulu 25.3 37.4 77.3 30.8 41.3 80.4
Lampung 22.3 34.9 70.7 24.7 37.2 78.2
Bangka Belitung --- --- --- --- --- ---
Jakarta 50.3 63.0 99.5 47.6 60.6 98.7
West Java 22.0 38.9 92.2 22.5 40.9 90.2
Central Java 33.4 54.0 90.6 32.3 54.3 91.4
Yogyakarta 13.2 44.4 92.5 11.4 49.4 88.4
East Java 42.6 61.9 93.3 41.7 65.6 95.8
Banten --- --- --- --- --- ---
Bali 54.2 67.6 97.2 53.0 63.8 96.4
West Nusa Tenggara 28.9 41.7 89.6 30.2 40.8 93.0
East Nusa Tenggara 67.6 81.7 93.4 65.0 76.2 94.4
West Kalimantan 39.8 97.1 97.4 33.3 90.5 90.5
Central Kalimantan 41.1 51.6 86.5 42.2 57.6 90.5
South Kalimantan 77.4 80.6 87.3 77.3 80.8 90.0
East Kalimantan 76.1 84.8 92.4 71.1 85.9 93.1
North Sulawesi 54.8 62.5 91.8 49.1 59.1 87.8
Central Sulawesi 45.7 54.6 91.3 36.5 51.3 88.2
South Sulawesi 59.1 68.9 90.7 54.3 65.9 91.4
Southeast Sulawesi 54.8 65.7 89.9 54.4 77.3 91.2
Gorontalo --- --- --- ---
Maluku 53.0 70.0 94.7 50.5 72.7 95.3
North Maluku --- --- --- --- --- ---
Papua 52.0 68.4 88.7 52.1 72.1 80.6
Indonesia 37.9 55.2 90.8 36.4 55.5 91.7
Table 7.9c. Proportion of household/population by type of water sources (urban) [%]—continued
Definitions: 1) Percentage of households surveyed using piped water 2) Percentage of population using water from improved sources more than 10 m away from excreta disposal site. The improved sources include: piped water, pumped water, packaged water, water from a protected well or protected spring, rain water. Susenas includes packaged water as a source only from 1998 on 3) Percentage of households surveyed using water from improved sources, including those less than 10 m away from excreta disposal
Source: Susenas data as published in Welfare Statistics by BPS—Statistics Indonesia. Includes East Timor up to 1998.
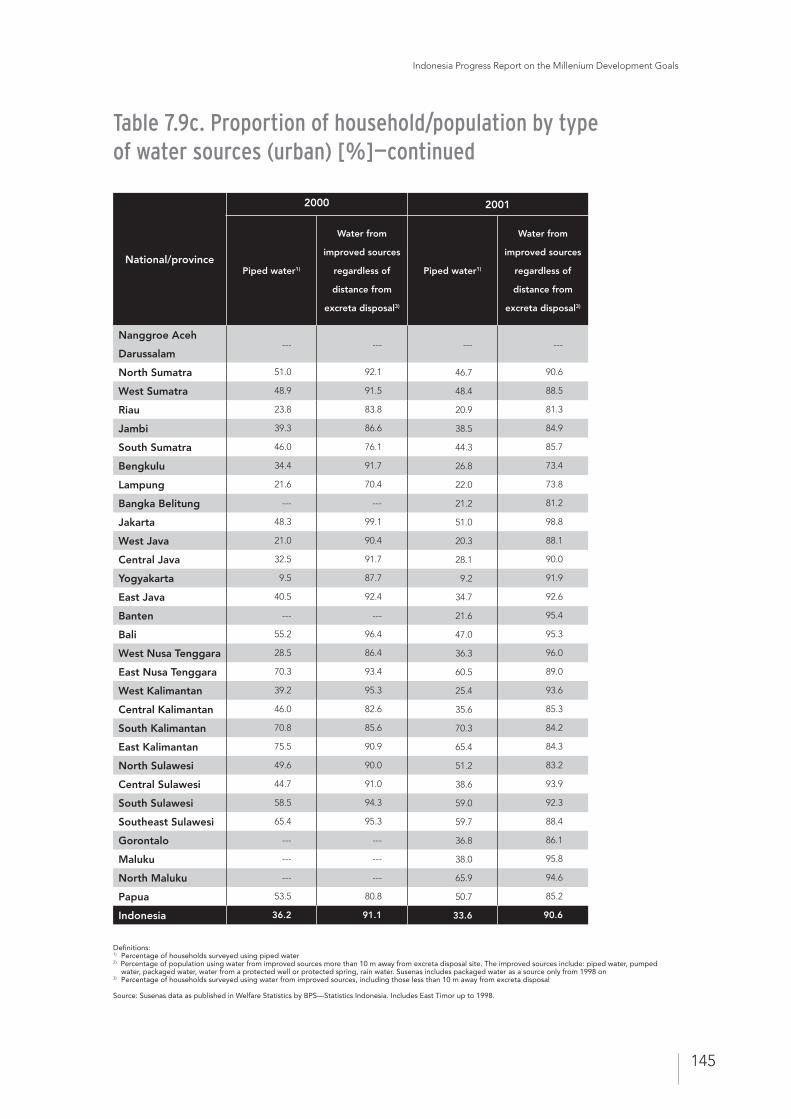
Indonesia Progress Report on the Millenium Development Goals
145
National/province
2000 2001
Piped water1)
Water from
improved sources
regardless of
distance from
excreta disposal3)
Piped water1)
Water from
improved sources
regardless of
distance from
excreta disposal3)
Nanggroe Aceh
Darussalam--- --- --- ---
North Sumatra 51.0 92.1 46.7 90.6
West Sumatra 48.9 91.5 48.4 88.5
Riau 23.8 83.8 20.9 81.3
Jambi 39.3 86.6 38.5 84.9
South Sumatra 46.0 76.1 44.3 85.7
Bengkulu 34.4 91.7 26.8 73.4
Lampung 21.6 70.4 22.0 73.8
Bangka Belitung --- --- 21.2 81.2
Jakarta 48.3 99.1 51.0 98.8
West Java 21.0 90.4 20.3 88.1
Central Java 32.5 91.7 28.1 90.0
Yogyakarta 9.5 87.7 9.2 91.9
East Java 40.5 92.4 34.7 92.6
Banten --- --- 21.6 95.4
Bali 55.2 96.4 47.0 95.3
West Nusa Tenggara 28.5 86.4 36.3 96.0
East Nusa Tenggara 70.3 93.4 60.5 89.0
West Kalimantan 39.2 95.3 25.4 93.6
Central Kalimantan 46.0 82.6 35.6 85.3
South Kalimantan 70.8 85.6 70.3 84.2
East Kalimantan 75.5 90.9 65.4 84.3
North Sulawesi 49.6 90.0 51.2 83.2
Central Sulawesi 44.7 91.0 38.6 93.9
South Sulawesi 58.5 94.3 59.0 92.3
Southeast Sulawesi 65.4 95.3 59.7 88.4
Gorontalo --- --- 36.8 86.1
Maluku --- --- 38.0 95.8
North Maluku --- --- 65.9 94.6
Papua 53.5 80.8 50.7 85.2
Indonesia 36.2 91.1 33.6 90.6
Table 7.9c. Proportion of household/population by type of water sources (urban) [%]—continued
Definitions: 1) Percentage of households surveyed using piped water 2) Percentage of population using water from improved sources more than 10 m away from excreta disposal site. The improved sources include: piped water, pumped water, packaged water, water from a protected well or protected spring, rain water. Susenas includes packaged water as a source only from 1998 on 3) Percentage of households surveyed using water from improved sources, including those less than 10 m away from excreta disposal
Source: Susenas data as published in Welfare Statistics by BPS—Statistics Indonesia. Includes East Timor up to 1998.
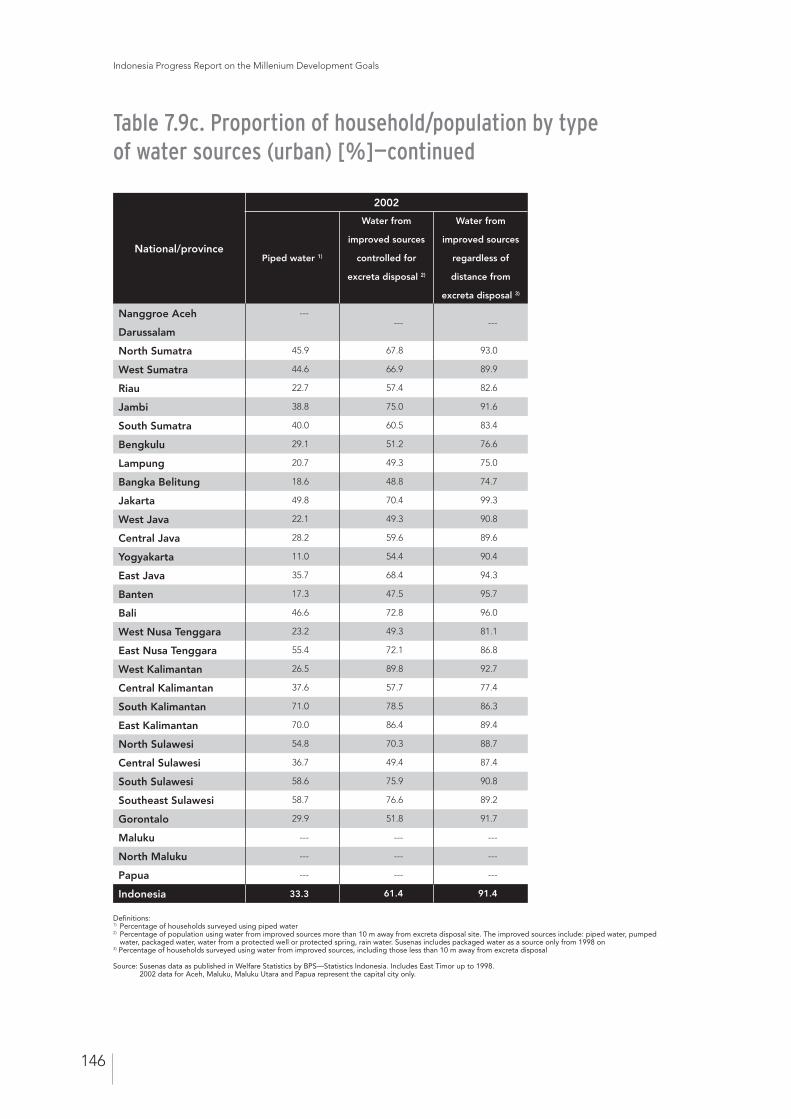
Indonesia Progress Report on the Millenium Development Goals
146
National/province
2002
Piped water 1)
Water from
improved sources
controlled for
excreta disposal 2)
Water from
improved sources
regardless of
distance from
excreta disposal 3)
Nanggroe Aceh
Darussalam
------ ---
North Sumatra 45.9 67.8 93.0
West Sumatra 44.6 66.9 89.9
Riau 22.7 57.4 82.6
Jambi 38.8 75.0 91.6
South Sumatra 40.0 60.5 83.4
Bengkulu 29.1 51.2 76.6
Lampung 20.7 49.3 75.0
Bangka Belitung 18.6 48.8 74.7
Jakarta 49.8 70.4 99.3
West Java 22.1 49.3 90.8
Central Java 28.2 59.6 89.6
Yogyakarta 11.0 54.4 90.4
East Java 35.7 68.4 94.3
Banten 17.3 47.5 95.7
Bali 46.6 72.8 96.0
West Nusa Tenggara 23.2 49.3 81.1
East Nusa Tenggara 55.4 72.1 86.8
West Kalimantan 26.5 89.8 92.7
Central Kalimantan 37.6 57.7 77.4
South Kalimantan 71.0 78.5 86.3
East Kalimantan 70.0 86.4 89.4
North Sulawesi 54.8 70.3 88.7
Central Sulawesi 36.7 49.4 87.4
South Sulawesi 58.6 75.9 90.8
Southeast Sulawesi 58.7 76.6 89.2
Gorontalo 29.9 51.8 91.7
Maluku --- --- ---
North Maluku --- --- ---
Papua --- --- ---
Indonesia 33.3 61.4 91.4
Table 7.9c. Proportion of household/population by type of water sources (urban) [%]—continued
Definitions: 1) Percentage of households surveyed using piped water 2) Percentage of population using water from improved sources more than 10 m away from excreta disposal site. The improved sources include: piped water, pumped water, packaged water, water from a protected well or protected spring, rain water. Susenas includes packaged water as a source only from 1998 on 3) Percentage of households surveyed using water from improved sources, including those less than 10 m away from excreta disposal
Source: Susenas data as published in Welfare Statistics by BPS—Statistics Indonesia. Includes East Timor up to 1998. 2002 data for Aceh, Maluku, Maluku Utara and Papua represent the capital city only.

Indonesia Progress Report on the Millenium Development Goals
147
No National/ provinceUrban
population
Number of
cities
Production Service coverage
lt/secondLeakage
(%)Population
Proportion
(%)
A Sumatra 17,884,336 129 26,907 33 9,686,679 54.2
1 Nanggroe Aceh
Darussalam
1,636,288 18 592 43 1,099,033 67.2
2 North Sumatra 6,940,581 33 8,038 29 3,259,964 47.0
3 West Sumatra 1,810,884 13 2,426 32 1,014,966 56.0
4 Riau 1,432,729 16 2,733 40 890,685 62.2
5 Jambi 1,214,291 11 1,835 29 90,858 74.8
6 South Sumatra 2,380,358 14 3,429 31 1,130,269 47.5
7 Bengkulu 394,367 6 1,179 22 29,162 73.9
8 Lampung 2,074,838 18 1,347 30 1,091,562 52.6
B Java-Bali 75,049,732 141 68,003 40 37,722,303 50.3
1 Jakarta 12,506,352 1 22,492 55 8,113,113 64.9
2 West Java 32,902,780 47 17,602 29 8,984,381 27.3
3 Central Java 12,221,214 33 7,548 33 7,452,623 61.0
4 Yogyakarta 856,319 6 954 38 699,033 81.6
5 East Java 14,597,730 45 15,961 38 10,810,145 74.1
6 Bali 1,965,337 9 3,446 23 1,663,008 84.6
C Kalimantan 5,259,688 37 8,435 29 3,228,400 61.4
1 West Kalimantan 1,016,552 12 2,428 31 645,841 63.5
2 Central Kalimantan 1,012,156 8 1,182 35 372,362 36.8
3 East Kalimantan 1,883,453 6 2,746 27 1,219,077 64.7
4 South Kalimantan 1,347,527 11 2,079 27 99,112 73.6
D Sulawesi 6,103,336 63 12,925 27 3,802,374 62.3
1 North Sulawesi 1,548,496 10 3,064 28 988,114 63.8
2 Central Sulawesi 635,055 15 492 39 292,614 46.1
3 South Sulawesi 3,544,560 30 8,656 25 2,264,031 63.9
4 Southeast Sulawesi 375,225 8 713 39 257,615 68.7
E Others 5,115,469 29 3,059 32 2,138,371 41.8
1 West Nusa Tenggara 2,721,435 6 949 28 662,529 24.3
2 East Nusa Tenggara 1,074,866 6 832 29 748,545 69.6
3 Maluku 506,772 7 401 28 267,382 52.8
4 North Maluku 176,298 3 67 26 113,943 64.6
5 Papua 636,098 7 810 43 345,972 54.4
I Western Indonesia 92,934,068 270 9,491 38 47,408,982 51.0
II Eastern Indonesia 16,478,493 129 24,419 28 9,169,145 55.6
Indonesia 109,412,561 399 119,329 36 56,578,127 51.7
Table 7.10. Coverage by regional drinking water companies (PDAM), 2000
Source: Data and General Information, Urban and Rural Development. Ministry of Resettlement and Regional Infrastructure 2001.
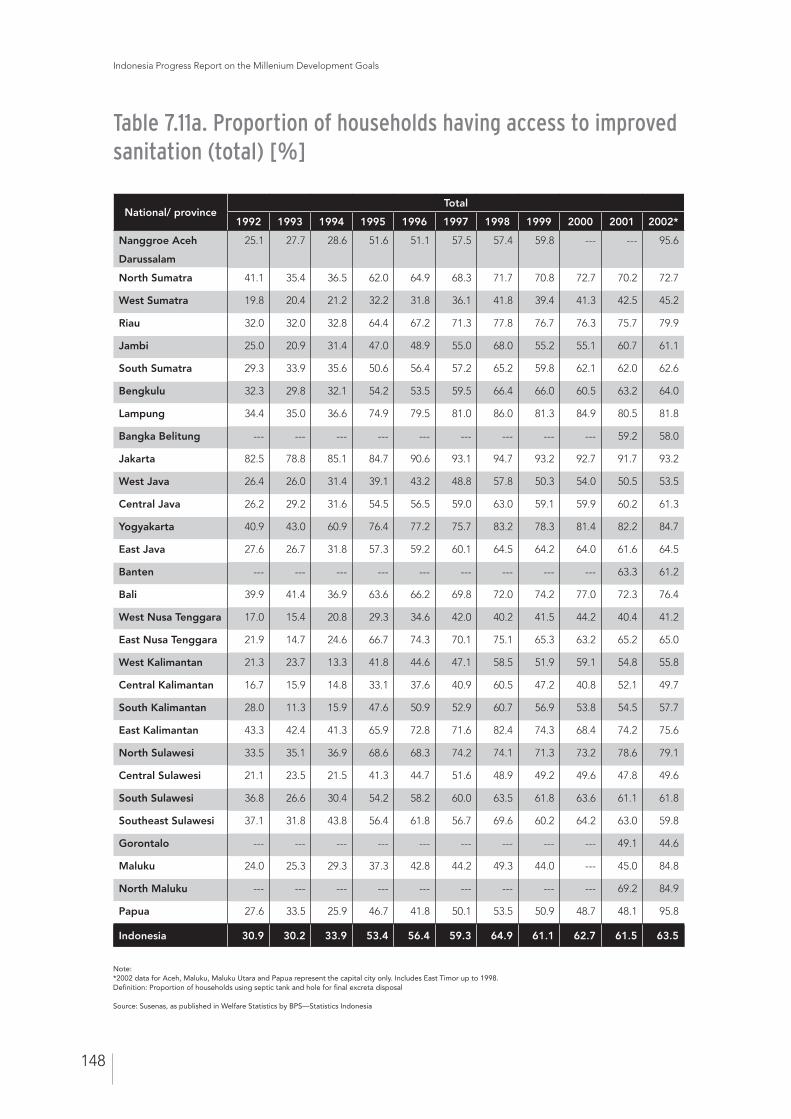
Indonesia Progress Report on the Millenium Development Goals
148
National/ provinceTotal
1992 1993 1994 1995 1996 1997 1998 1999 2000 2001 2002*
Nanggroe Aceh
Darussalam
25.1 27.7 28.6 51.6 51.1 57.5 57.4 59.8 --- --- 95.6
North Sumatra 41.1 35.4 36.5 62.0 64.9 68.3 71.7 70.8 72.7 70.2 72.7
West Sumatra 19.8 20.4 21.2 32.2 31.8 36.1 41.8 39.4 41.3 42.5 45.2
Riau 32.0 32.0 32.8 64.4 67.2 71.3 77.8 76.7 76.3 75.7 79.9
Jambi 25.0 20.9 31.4 47.0 48.9 55.0 68.0 55.2 55.1 60.7 61.1
South Sumatra 29.3 33.9 35.6 50.6 56.4 57.2 65.2 59.8 62.1 62.0 62.6
Bengkulu 32.3 29.8 32.1 54.2 53.5 59.5 66.4 66.0 60.5 63.2 64.0
Lampung 34.4 35.0 36.6 74.9 79.5 81.0 86.0 81.3 84.9 80.5 81.8
Bangka Belitung --- --- --- --- --- --- --- --- --- 59.2 58.0
Jakarta 82.5 78.8 85.1 84.7 90.6 93.1 94.7 93.2 92.7 91.7 93.2
West Java 26.4 26.0 31.4 39.1 43.2 48.8 57.8 50.3 54.0 50.5 53.5
Central Java 26.2 29.2 31.6 54.5 56.5 59.0 63.0 59.1 59.9 60.2 61.3
Yogyakarta 40.9 43.0 60.9 76.4 77.2 75.7 83.2 78.3 81.4 82.2 84.7
East Java 27.6 26.7 31.8 57.3 59.2 60.1 64.5 64.2 64.0 61.6 64.5
Banten --- --- --- --- --- --- --- --- --- 63.3 61.2
Bali 39.9 41.4 36.9 63.6 66.2 69.8 72.0 74.2 77.0 72.3 76.4
West Nusa Tenggara 17.0 15.4 20.8 29.3 34.6 42.0 40.2 41.5 44.2 40.4 41.2
East Nusa Tenggara 21.9 14.7 24.6 66.7 74.3 70.1 75.1 65.3 63.2 65.2 65.0
West Kalimantan 21.3 23.7 13.3 41.8 44.6 47.1 58.5 51.9 59.1 54.8 55.8
Central Kalimantan 16.7 15.9 14.8 33.1 37.6 40.9 60.5 47.2 40.8 52.1 49.7
South Kalimantan 28.0 11.3 15.9 47.6 50.9 52.9 60.7 56.9 53.8 54.5 57.7
East Kalimantan 43.3 42.4 41.3 65.9 72.8 71.6 82.4 74.3 68.4 74.2 75.6
North Sulawesi 33.5 35.1 36.9 68.6 68.3 74.2 74.1 71.3 73.2 78.6 79.1
Central Sulawesi 21.1 23.5 21.5 41.3 44.7 51.6 48.9 49.2 49.6 47.8 49.6
South Sulawesi 36.8 26.6 30.4 54.2 58.2 60.0 63.5 61.8 63.6 61.1 61.8
Southeast Sulawesi 37.1 31.8 43.8 56.4 61.8 56.7 69.6 60.2 64.2 63.0 59.8
Gorontalo --- --- --- --- --- --- --- --- --- 49.1 44.6
Maluku 24.0 25.3 29.3 37.3 42.8 44.2 49.3 44.0 --- 45.0 84.8
North Maluku --- --- --- --- --- --- --- --- --- 69.2 84.9
Papua 27.6 33.5 25.9 46.7 41.8 50.1 53.5 50.9 48.7 48.1 95.8
Indonesia 30.9 30.2 33.9 53.4 56.4 59.3 64.9 61.1 62.7 61.5 63.5
Table 7.11a. Proportion of households having access to improved sanitation (total) [%]
Note:*2002 data for Aceh, Maluku, Maluku Utara and Papua represent the capital city only. Includes East Timor up to 1998. Definition: Proportion of households using septic tank and hole for final excreta disposal
Source: Susenas, as published in Welfare Statistics by BPS—Statistics Indonesia
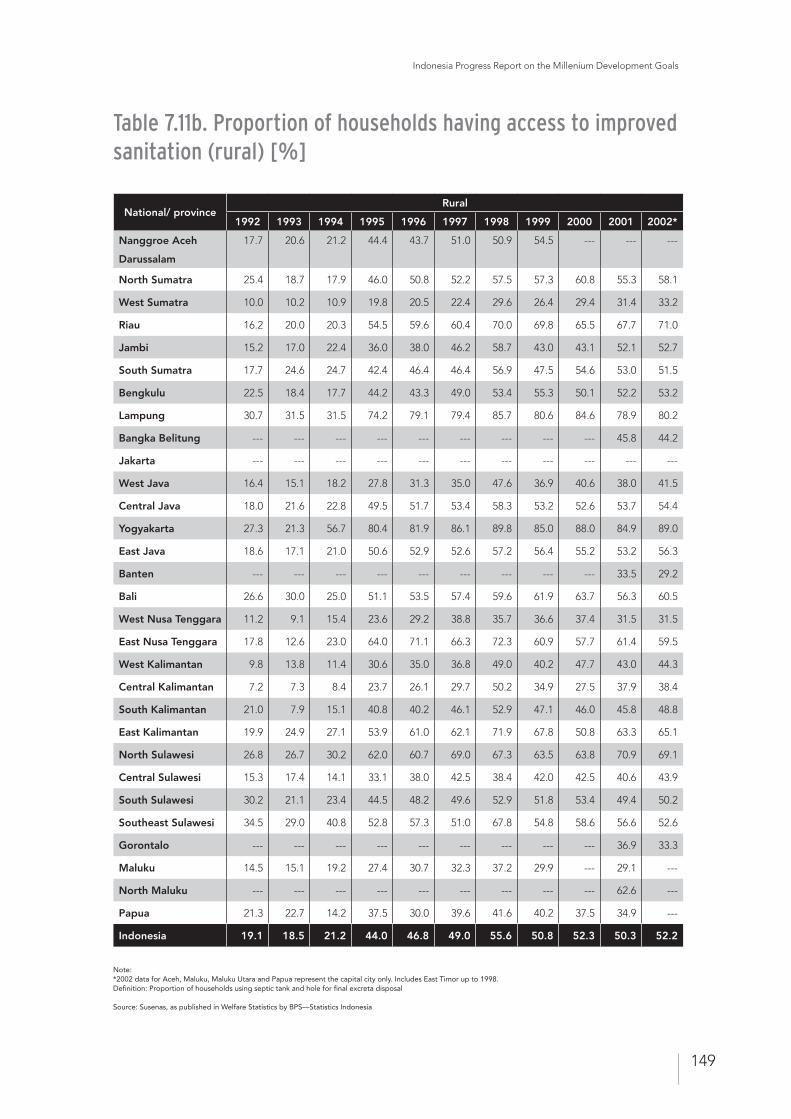
Indonesia Progress Report on the Millenium Development Goals
149
Table 7.11b. Proportion of households having access to improved sanitation (rural) [%]
National/ provinceRural
1992 1993 1994 1995 1996 1997 1998 1999 2000 2001 2002*
Nanggroe Aceh
Darussalam
17.7 20.6 21.2 44.4 43.7 51.0 50.9 54.5 --- --- ---
North Sumatra 25.4 18.7 17.9 46.0 50.8 52.2 57.5 57.3 60.8 55.3 58.1
West Sumatra 10.0 10.2 10.9 19.8 20.5 22.4 29.6 26.4 29.4 31.4 33.2
Riau 16.2 20.0 20.3 54.5 59.6 60.4 70.0 69.8 65.5 67.7 71.0
Jambi 15.2 17.0 22.4 36.0 38.0 46.2 58.7 43.0 43.1 52.1 52.7
South Sumatra 17.7 24.6 24.7 42.4 46.4 46.4 56.9 47.5 54.6 53.0 51.5
Bengkulu 22.5 18.4 17.7 44.2 43.3 49.0 53.4 55.3 50.1 52.2 53.2
Lampung 30.7 31.5 31.5 74.2 79.1 79.4 85.7 80.6 84.6 78.9 80.2
Bangka Belitung --- --- --- --- --- --- --- --- --- 45.8 44.2
Jakarta --- --- --- --- --- --- --- --- --- --- ---
West Java 16.4 15.1 18.2 27.8 31.3 35.0 47.6 36.9 40.6 38.0 41.5
Central Java 18.0 21.6 22.8 49.5 51.7 53.4 58.3 53.2 52.6 53.7 54.4
Yogyakarta 27.3 21.3 56.7 80.4 81.9 86.1 89.8 85.0 88.0 84.9 89.0
East Java 18.6 17.1 21.0 50.6 52.9 52.6 57.2 56.4 55.2 53.2 56.3
Banten --- --- --- --- --- --- --- --- --- 33.5 29.2
Bali 26.6 30.0 25.0 51.1 53.5 57.4 59.6 61.9 63.7 56.3 60.5
West Nusa Tenggara 11.2 9.1 15.4 23.6 29.2 38.8 35.7 36.6 37.4 31.5 31.5
East Nusa Tenggara 17.8 12.6 23.0 64.0 71.1 66.3 72.3 60.9 57.7 61.4 59.5
West Kalimantan 9.8 13.8 11.4 30.6 35.0 36.8 49.0 40.2 47.7 43.0 44.3
Central Kalimantan 7.2 7.3 8.4 23.7 26.1 29.7 50.2 34.9 27.5 37.9 38.4
South Kalimantan 21.0 7.9 15.1 40.8 40.2 46.1 52.9 47.1 46.0 45.8 48.8
East Kalimantan 19.9 24.9 27.1 53.9 61.0 62.1 71.9 67.8 50.8 63.3 65.1
North Sulawesi 26.8 26.7 30.2 62.0 60.7 69.0 67.3 63.5 63.8 70.9 69.1
Central Sulawesi 15.3 17.4 14.1 33.1 38.0 42.5 38.4 42.0 42.5 40.6 43.9
South Sulawesi 30.2 21.1 23.4 44.5 48.2 49.6 52.9 51.8 53.4 49.4 50.2
Southeast Sulawesi 34.5 29.0 40.8 52.8 57.3 51.0 67.8 54.8 58.6 56.6 52.6
Gorontalo --- --- --- --- --- --- --- --- --- 36.9 33.3
Maluku 14.5 15.1 19.2 27.4 30.7 32.3 37.2 29.9 --- 29.1 ---
North Maluku --- --- --- --- --- --- --- --- --- 62.6 ---
Papua 21.3 22.7 14.2 37.5 30.0 39.6 41.6 40.2 37.5 34.9 ---
Indonesia 19.1 18.5 21.2 44.0 46.8 49.0 55.6 50.8 52.3 50.3 52.2
Note:*2002 data for Aceh, Maluku, Maluku Utara and Papua represent the capital city only. Includes East Timor up to 1998. Definition: Proportion of households using septic tank and hole for final excreta disposal
Source: Susenas, as published in Welfare Statistics by BPS—Statistics Indonesia
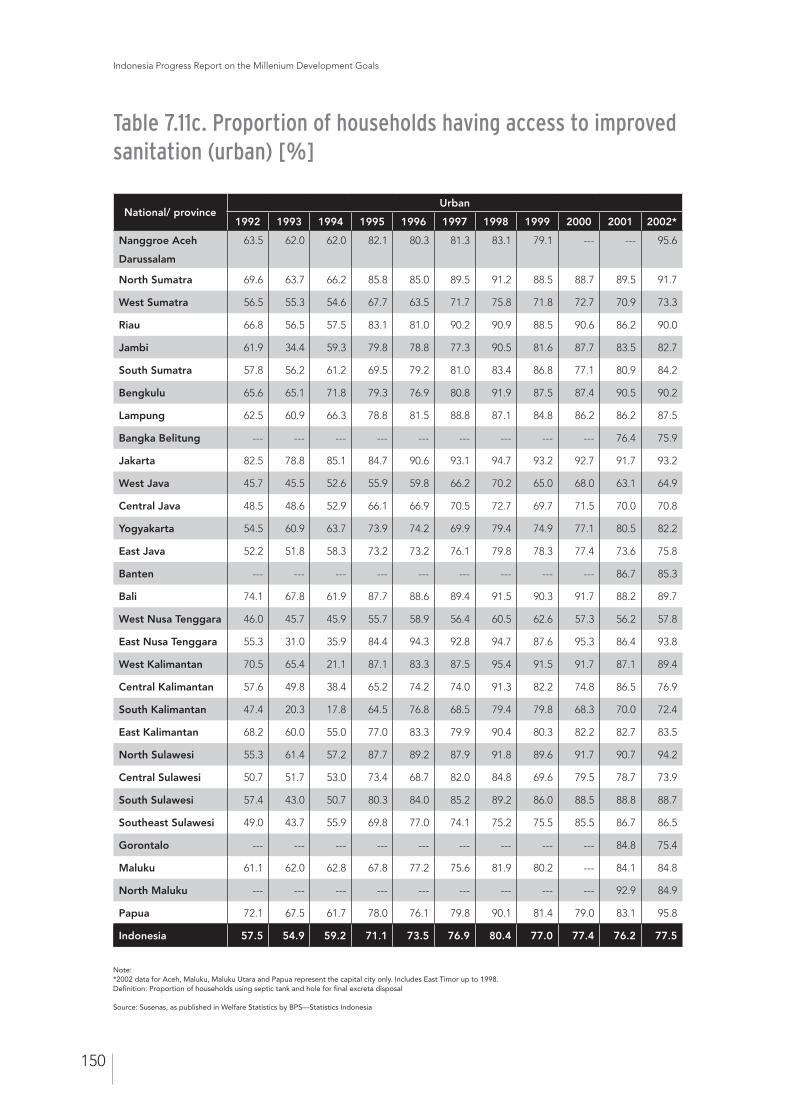
Indonesia Progress Report on the Millenium Development Goals
150
National/ provinceUrban
1992 1993 1994 1995 1996 1997 1998 1999 2000 2001 2002*
Nanggroe Aceh
Darussalam
63.5 62.0 62.0 82.1 80.3 81.3 83.1 79.1 --- --- 95.6
North Sumatra 69.6 63.7 66.2 85.8 85.0 89.5 91.2 88.5 88.7 89.5 91.7
West Sumatra 56.5 55.3 54.6 67.7 63.5 71.7 75.8 71.8 72.7 70.9 73.3
Riau 66.8 56.5 57.5 83.1 81.0 90.2 90.9 88.5 90.6 86.2 90.0
Jambi 61.9 34.4 59.3 79.8 78.8 77.3 90.5 81.6 87.7 83.5 82.7
South Sumatra 57.8 56.2 61.2 69.5 79.2 81.0 83.4 86.8 77.1 80.9 84.2
Bengkulu 65.6 65.1 71.8 79.3 76.9 80.8 91.9 87.5 87.4 90.5 90.2
Lampung 62.5 60.9 66.3 78.8 81.5 88.8 87.1 84.8 86.2 86.2 87.5
Bangka Belitung --- --- --- --- --- --- --- --- --- 76.4 75.9
Jakarta 82.5 78.8 85.1 84.7 90.6 93.1 94.7 93.2 92.7 91.7 93.2
West Java 45.7 45.5 52.6 55.9 59.8 66.2 70.2 65.0 68.0 63.1 64.9
Central Java 48.5 48.6 52.9 66.1 66.9 70.5 72.7 69.7 71.5 70.0 70.8
Yogyakarta 54.5 60.9 63.7 73.9 74.2 69.9 79.4 74.9 77.1 80.5 82.2
East Java 52.2 51.8 58.3 73.2 73.2 76.1 79.8 78.3 77.4 73.6 75.8
Banten --- --- --- --- --- --- --- --- --- 86.7 85.3
Bali 74.1 67.8 61.9 87.7 88.6 89.4 91.5 90.3 91.7 88.2 89.7
West Nusa Tenggara 46.0 45.7 45.9 55.7 58.9 56.4 60.5 62.6 57.3 56.2 57.8
East Nusa Tenggara 55.3 31.0 35.9 84.4 94.3 92.8 94.7 87.6 95.3 86.4 93.8
West Kalimantan 70.5 65.4 21.1 87.1 83.3 87.5 95.4 91.5 91.7 87.1 89.4
Central Kalimantan 57.6 49.8 38.4 65.2 74.2 74.0 91.3 82.2 74.8 86.5 76.9
South Kalimantan 47.4 20.3 17.8 64.5 76.8 68.5 79.4 79.8 68.3 70.0 72.4
East Kalimantan 68.2 60.0 55.0 77.0 83.3 79.9 90.4 80.3 82.2 82.7 83.5
North Sulawesi 55.3 61.4 57.2 87.7 89.2 87.9 91.8 89.6 91.7 90.7 94.2
Central Sulawesi 50.7 51.7 53.0 73.4 68.7 82.0 84.8 69.6 79.5 78.7 73.9
South Sulawesi 57.4 43.0 50.7 80.3 84.0 85.2 89.2 86.0 88.5 88.8 88.7
Southeast Sulawesi 49.0 43.7 55.9 69.8 77.0 74.1 75.2 75.5 85.5 86.7 86.5
Gorontalo --- --- --- --- --- --- --- --- --- 84.8 75.4
Maluku 61.1 62.0 62.8 67.8 77.2 75.6 81.9 80.2 --- 84.1 84.8
North Maluku --- --- --- --- --- --- --- --- --- 92.9 84.9
Papua 72.1 67.5 61.7 78.0 76.1 79.8 90.1 81.4 79.0 83.1 95.8
Indonesia 57.5 54.9 59.2 71.1 73.5 76.9 80.4 77.0 77.4 76.2 77.5
Table 7.11c. Proportion of households having access to improved sanitation (urban) [%]
Note:*2002 data for Aceh, Maluku, Maluku Utara and Papua represent the capital city only. Includes East Timor up to 1998. Definition: Proportion of households using septic tank and hole for final excreta disposal
Source: Susenas, as published in Welfare Statistics by BPS—Statistics Indonesia
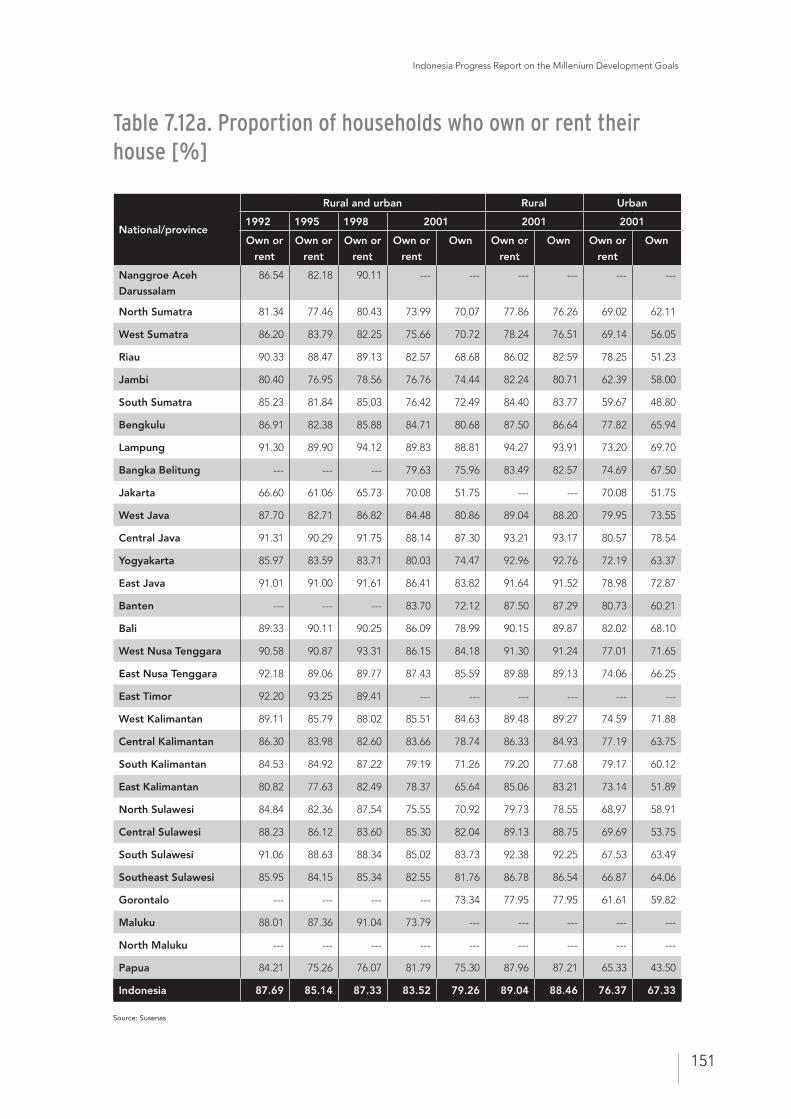
Indonesia Progress Report on the Millenium Development Goals
151
National/province
Rural and urban Rural Urban
1992 1995 1998 2001 2001 2001
Own or
rent
Own or
rent
Own or
rent
Own or
rent
Own Own or
rent
Own Own or
rent
Own
Nanggroe Aceh
Darussalam
86.54 82.18 90.11 --- --- --- --- --- ---
North Sumatra 81.34 77.46 80.43 73.99 70.07 77.86 76.26 69.02 62.11
West Sumatra 86.20 83.79 82.25 75.66 70.72 78.24 76.51 69.14 56.05
Riau 90.33 88.47 89.13 82.57 68.68 86.02 82.59 78.25 51.23
Jambi 80.40 76.95 78.56 76.76 74.44 82.24 80.71 62.39 58.00
South Sumatra 85.23 81.84 85.03 76.42 72.49 84.40 83.77 59.67 48.80
Bengkulu 86.91 82.38 85.88 84.71 80.68 87.50 86.64 77.82 65.94
Lampung 91.30 89.90 94.12 89.83 88.81 94.27 93.91 73.20 69.70
Bangka Belitung --- --- --- 79.63 75.96 83.49 82.57 74.69 67.50
Jakarta 66.60 61.06 65.73 70.08 51.75 --- --- 70.08 51.75
West Java 87.70 82.71 86.82 84.48 80.86 89.04 88.20 79.95 73.55
Central Java 91.31 90.29 91.75 88.14 87.30 93.21 93.17 80.57 78.54
Yogyakarta 85.97 83.59 83.71 80.03 74.47 92.96 92.76 72.19 63.37
East Java 91.01 91.00 91.61 86.41 83.82 91.64 91.52 78.98 72.87
Banten --- --- --- 83.70 72.12 87.50 87.29 80.73 60.21
Bali 89.33 90.11 90.25 86.09 78.99 90.15 89.87 82.02 68.10
West Nusa Tenggara 90.58 90.87 93.31 86.15 84.18 91.30 91.24 77.01 71.65
East Nusa Tenggara 92.18 89.06 89.77 87.43 85.59 89.88 89.13 74.06 66.25
East Timor 92.20 93.25 89.41 --- --- --- --- --- ---
West Kalimantan 89.11 85.79 88.02 85.51 84.63 89.48 89.27 74.59 71.88
Central Kalimantan 86.30 83.98 82.60 83.66 78.74 86.33 84.93 77.19 63.75
South Kalimantan 84.53 84.92 87.22 79.19 71.26 79.20 77.68 79.17 60.12
East Kalimantan 80.82 77.63 82.49 78.37 65.64 85.06 83.21 73.14 51.89
North Sulawesi 84.84 82.36 87.54 75.55 70.92 79.73 78.55 68.97 58.91
Central Sulawesi 88.23 86.12 83.60 85.30 82.04 89.13 88.75 69.69 53.75
South Sulawesi 91.06 88.63 88.34 85.02 83.73 92.38 92.25 67.53 63.49
Southeast Sulawesi 85.95 84.15 85.34 82.55 81.76 86.78 86.54 66.87 64.06
Gorontalo --- --- --- --- 73.34 77.95 77.95 61.61 59.82
Maluku 88.01 87.36 91.04 73.79 --- --- --- --- ---
North Maluku --- --- --- --- --- --- --- --- ---
Papua 84.21 75.26 76.07 81.79 75.30 87.96 87.21 65.33 43.50
Indonesia 87.69 85.14 87.33 83.52 79.26 89.04 88.46 76.37 67.33
Source: Susenas
Table 7.12a. Proportion of households who own or rent their house [%]
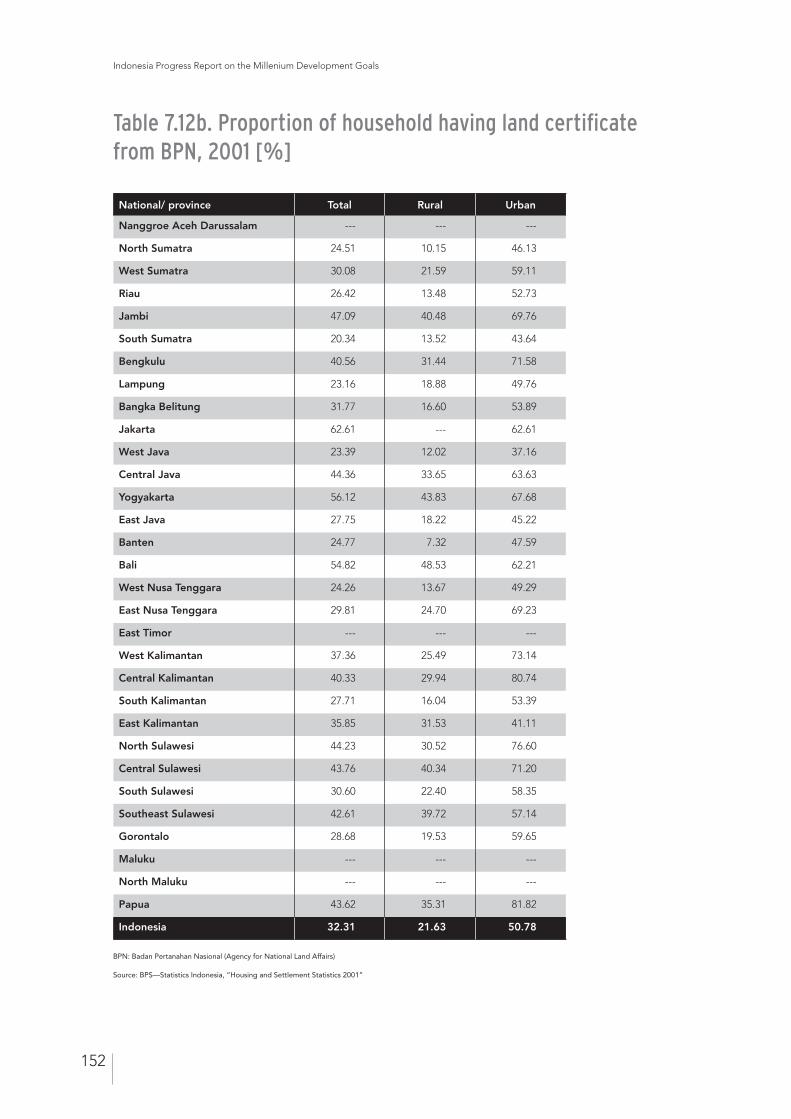
Indonesia Progress Report on the Millenium Development Goals
152
National/ province Total Rural Urban
Nanggroe Aceh Darussalam --- --- ---
North Sumatra 24.51 10.15 46.13
West Sumatra 30.08 21.59 59.11
Riau 26.42 13.48 52.73
Jambi 47.09 40.48 69.76
South Sumatra 20.34 13.52 43.64
Bengkulu 40.56 31.44 71.58
Lampung 23.16 18.88 49.76
Bangka Belitung 31.77 16.60 53.89
Jakarta 62.61 --- 62.61
West Java 23.39 12.02 37.16
Central Java 44.36 33.65 63.63
Yogyakarta 56.12 43.83 67.68
East Java 27.75 18.22 45.22
Banten 24.77 7.32 47.59
Bali 54.82 48.53 62.21
West Nusa Tenggara 24.26 13.67 49.29
East Nusa Tenggara 29.81 24.70 69.23
East Timor --- --- ---
West Kalimantan 37.36 25.49 73.14
Central Kalimantan 40.33 29.94 80.74
South Kalimantan 27.71 16.04 53.39
East Kalimantan 35.85 31.53 41.11
North Sulawesi 44.23 30.52 76.60
Central Sulawesi 43.76 40.34 71.20
South Sulawesi 30.60 22.40 58.35
Southeast Sulawesi 42.61 39.72 57.14
Gorontalo 28.68 19.53 59.65
Maluku --- --- ---
North Maluku --- --- ---
Papua 43.62 35.31 81.82
Indonesia 32.31 21.63 50.78
Table 7.12b. Proportion of household having land certificate from BPN, 2001 [%]
BPN: Badan Pertanahan Nasional (Agency for National Land Affairs)
Source: BPS—Statistics Indonesia, “Housing and Settlement Statistics 2001”
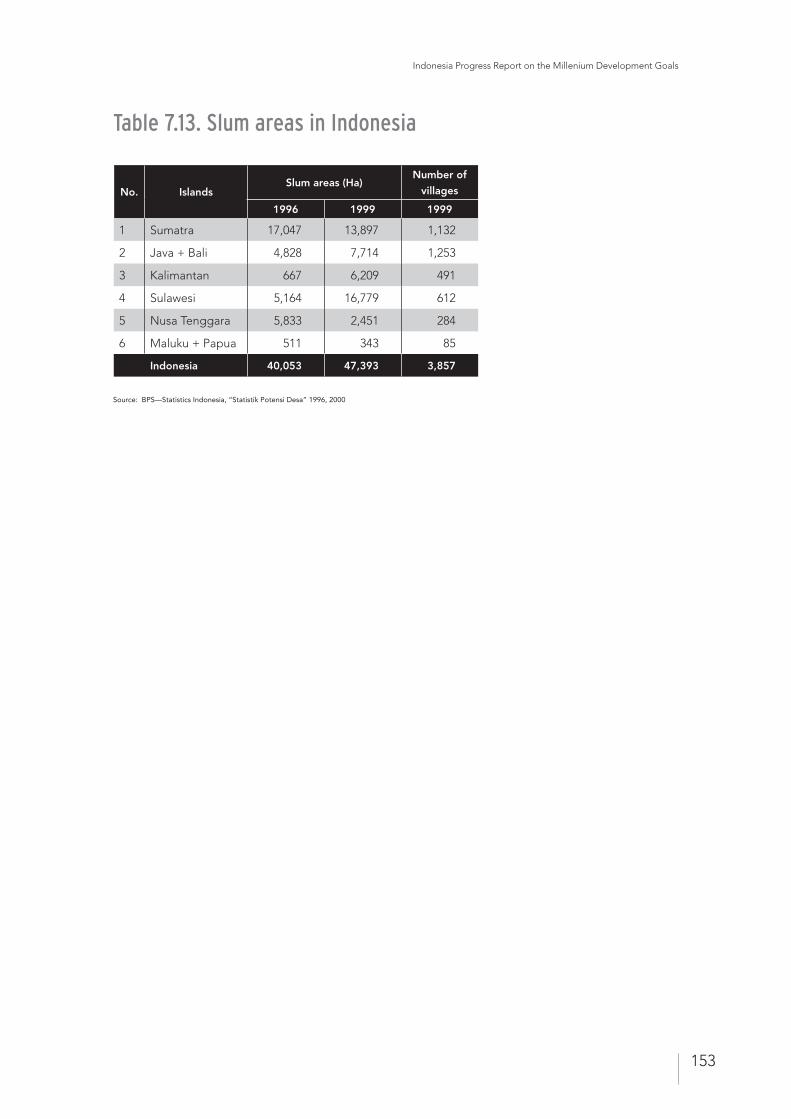
Indonesia Progress Report on the Millenium Development Goals
153
No. IslandsSlum areas (Ha)
Number of
villages
1996 1999 1999
1 Sumatra 17,047 13,897 1,132
2 Java + Bali 4,828 7,714 1,253
3 Kalimantan 667 6,209 491
4 Sulawesi 5,164 16,779 612
5 Nusa Tenggara 5,833 2,451 284
6 Maluku + Papua 511 343 85
Indonesia 40,053 47,393 3,857
Table 7.13. Slum areas in Indonesia
Source: BPS—Statistics Indonesia, “Statistik Potensi Desa” 1996, 2000
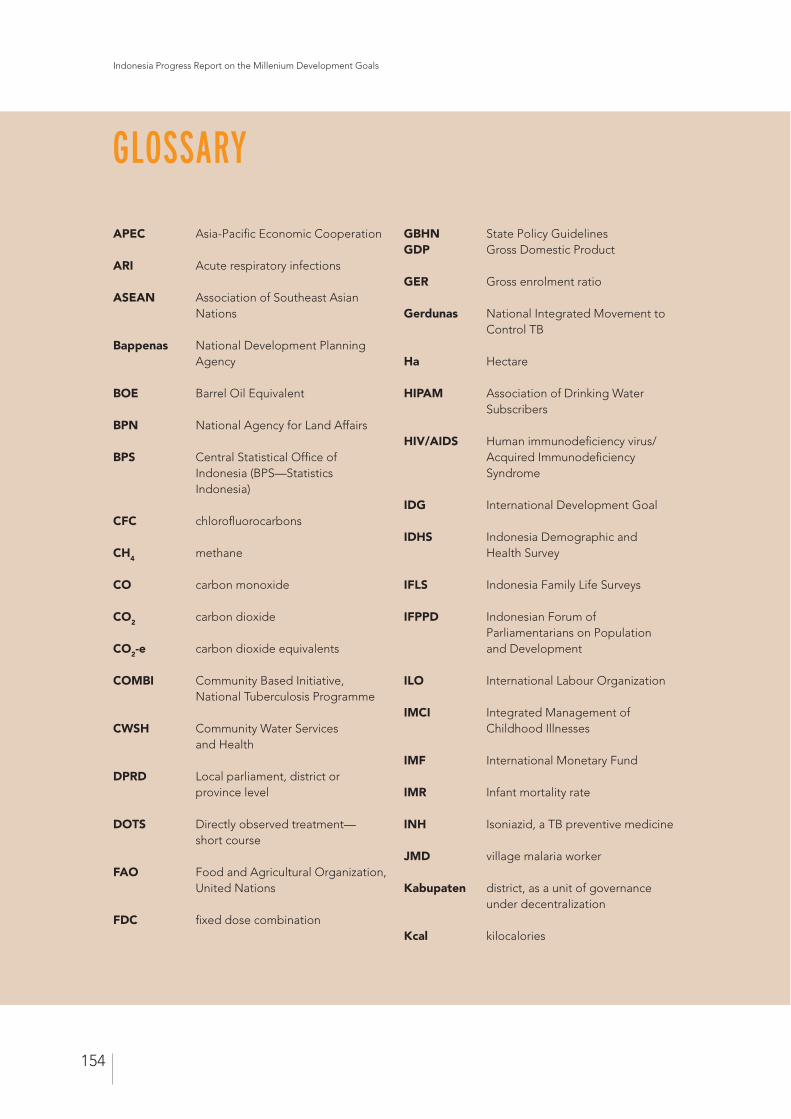
Indonesia Progress Report on the Millenium Development Goals
154
GLOSSARY
APEC Asia-Pacific Economic Cooperation
ARI Acute respiratory infections
ASEAN Association of Southeast Asian Nations
Bappenas National Development Planning Agency
BOE Barrel Oil Equivalent
BPN National Agency for Land Affairs
BPS Central Statistical Office of Indonesia (BPS—Statistics Indonesia)
CFC chlorofluorocarbons
CH4 methane
CO carbon monoxide
CO2 carbon dioxide
CO2-e carbon dioxide equivalents
COMBI Community Based Initiative, National Tuberculosis Programme
CWSH Community Water Services and Health
DPRD Local parliament, district or province level
DOTS Directly observed treatment— short course
FAO Food and Agricultural Organization, United Nations
FDC fixed dose combination
GBHN State Policy GuidelinesGDP Gross Domestic Product
GER Gross enrolment ratio
Gerdunas National Integrated Movement to Control TB
Ha Hectare
HIPAM Association of Drinking Water Subscribers
HIV/AIDS Human immunodeficiency virus/Acquired Immunodeficiency Syndrome
IDG International Development Goal
IDHS Indonesia Demographic and Health Survey
IFLS Indonesia Family Life Surveys
IFPPD Indonesian Forum of Parliamentarians on Population and Development
ILO International Labour Organization
IMCI Integrated Management of Childhood Illnesses
IMF International Monetary Fund
IMR Infant mortality rate
INH Isoniazid, a TB preventive medicine
JMD village malaria worker
Kabupaten district, as a unit of governance under decentralization
Kcal kilocalories
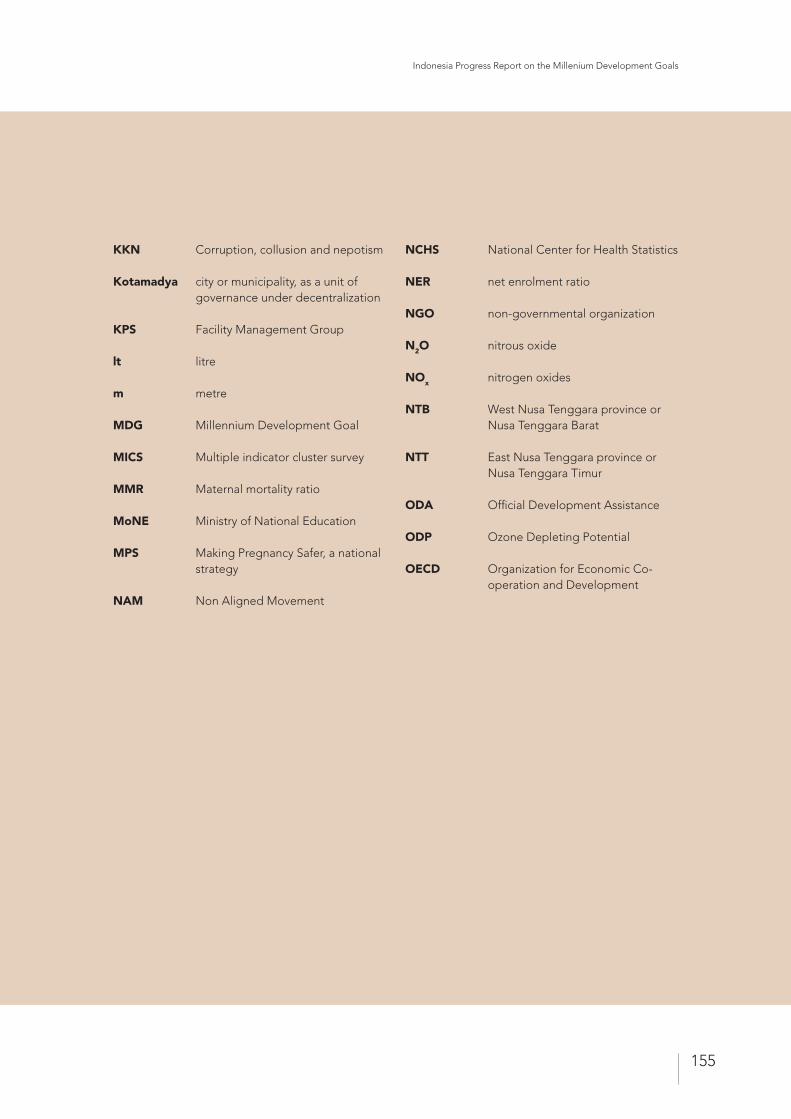
Indonesia Progress Report on the Millenium Development Goals
155
KKN Corruption, collusion and nepotism
Kotamadya city or municipality, as a unit of governance under decentralization
KPS Facility Management Group
lt litre
m metre
MDG Millennium Development Goal
MICS Multiple indicator cluster survey
MMR Maternal mortality ratio
MoNE Ministry of National Education
MPS Making Pregnancy Safer, a national strategy
NAM Non Aligned Movement
NCHS National Center for Health Statistics
NER net enrolment ratio
NGO non-governmental organization
N2O nitrous oxide
NOx nitrogen oxides
NTB West Nusa Tenggara province or Nusa Tenggara Barat
NTT East Nusa Tenggara province or Nusa Tenggara Timur
ODA Official Development Assistance
ODP Ozone Depleting Potential
OECD Organization for Economic Co-operation and Development