Indonesia Media
52
ed: CK / sa:MA, PY, CS Seizing the opportunity Current share price has yet to price in potential upside from higher advertising expenditure (adex) growth We forecast 10% adex growth in FY18F from potential consumption pick-up in pre-election year, and two major sporting events (World Cup and Asian Games) Initiate Indonesia Media Sector with OVERWEIGHT We prefer SCMA as a potential beneficiary of adex recovery, while MNCN is our second pick for its cheap valuation Laggard sector with potential upside. The Indonesian media sector has notably underperformed the JCI in FY17 on the back of muted advertising spending (ad spend) by FMCG companies due to political uncertainties and stagnant private consumption. We think that the current share price level has not priced in the potential higher adex growth in FY18F due to (i) potential pick-up in household consumption in a pre-election year which would help boost advertising spending (ad spend), and (ii) two major sporting events that would boost adex growth. Currently, both SCMA and MNCN are trading at - 1SD/-2SD of their historical 8-year average), which provides a good entry point in the event of a pick-up in adex growth. Election year is coming. Two major election events will take place in June 2018 and April 2019, i.e. the regional PILKADA and Presidential elections respectively. We think that both events will help boost private household consumption. In the past, household expenditure has increased by 300-400bps in the year prior to Indonesian elections. This is because the government needs to deliver economic growth to increase the electability of the incumbent or ruling party. The pre-election consumption boost will also bode well for consumer stocks; which will directly translate into a better performance for media companies from higher advertising spending by FMCG companies. SCMA is our top pick in the sector. Even though we have BUY calls on SCMA and MNCN, we prefer the former to the latter. Under our base-case scenario of higher adex growth for this year at 10%, we believe that SCMA is better positioned to monetise higher adex growth due to its improvement in audience share (in prime time (PT) and all time (AT)). Furthermore, SCMA will also broadcast the Asian Games which would enable it to have a high audience share number and additional revenue streams from sponsorships. JCI : 5,821.81 Analyst David Arie Hartono +62 2130034936 [email protected] Surya Citra Media : Surya Citra Media (SCMA) focusses on national free to air (FTA) TV broadcasting. Through its station SCTV and Indosiar. SCMA controls c. 31.0% of Indonesia's FTA TV audience shares (all time) as of April 2018 and ranked first on the metric. Media Nusantara Citra : Media Nusantara Citra (MNCN) is one of South East Asia's largest and most integrated media companies, controlled by media mogul, Hary Tanoesoedibjo, with a focus on national free to air (FTA) television broadcasting. MNCN controlled 32.8% of all time MNCN and SCMA share price movement Source: Bloomberg Finance L.P. 0 1,000 2,000 3,000 4,000 5,000 2/1/2013 5/1/2013 8/1/2013 11/1/2013 2/1/2014 5/1/2014 8/1/2014 11/1/2014 2/1/2015 5/1/2015 8/1/2015 11/1/2015 2/1/2016 5/1/2016 8/1/2016 11/1/2016 2/1/2017 5/1/2017 8/1/2017 11/1/2017 2/1/2018 5/1/2018 MNCN SCMA 25 Jun 2018 Indonesia Industry Focus Indonesia Media Refer to important disclosures at the end of this report STOCKS 12-mth Price Mkt Cap Target Price Performance (%) Rp US$m Rp 3 mth 12 mth Rating Surya Citra Media 2,100 2,181 2,600 (22.5) (19.2) BUY Media Nusantara 975 954 1,300 (28.6) (48.6) BUY Source: DBSVI, Bloomberg Finance L.P. Closing price as of 22 Jun 2018
-
Upload
khangminh22 -
Category
Documents
-
view
0 -
download
0
Transcript of Indonesia Media

ed: CK / sa:MA, PY, CS
Seizing the opportunity
Current share price has yet to price in potential upside from higher advertising expenditure (adex) growth
We forecast 10% adex growth in FY18F from potential consumption pick-up in pre-election year, and two major sporting events (World Cup and Asian Games)
Initiate Indonesia Media Sector with OVERWEIGHT
We prefer SCMA as a potential beneficiary of adex recovery, while MNCN is our second pick for its cheap valuation
Laggard sector with potential upside. The Indonesian media sector has notably underperformed the JCI in FY17 on the back of muted advertising spending (ad spend) by FMCG companies due to political uncertainties and stagnant private consumption. We think that the current share price level has not priced in the potential higher adex growth in FY18F due to (i) potential pick-up in household consumption in a pre-election year which would help boost advertising spending (ad spend), and (ii) two major sporting events that would boost adex growth. Currently, both SCMA and MNCN are trading at -1SD/-2SD of their historical 8-year average), which provides a good entry point in the event of a pick-up in adex growth. Election year is coming. Two major election events will take place in June 2018 and April 2019, i.e. the regional PILKADA and Presidential elections respectively. We think that both events will help boost private household consumption. In the past, household expenditure has increased by 300-400bps in the year prior to Indonesian elections. This is because the government needs to deliver economic growth to increase the electability of the incumbent or ruling party. The pre-election consumption boost will also bode well for consumer stocks; which will directly translate into a better performance for media companies from higher advertising spending by FMCG companies. SCMA is our top pick in the sector. Even though we have BUY calls on SCMA and MNCN, we prefer the former to the latter. Under our base-case scenario of higher adex growth for this year at 10%, we believe that SCMA is better positioned to monetise higher adex growth due to its improvement in audience share (in prime time (PT) and all time (AT)). Furthermore, SCMA will also broadcast the Asian Games which would enable it to have a high audience share number and additional revenue streams from sponsorships.
JCI : 5,821.81
Analyst David Arie Hartono +62 2130034936 [email protected]
Surya Citra Media : Surya Citra Media (SCMA) focusses on national free to air (FTA) TV broadcasting. Through its station SCTV and Indosiar. SCMA controls c. 31.0% of Indonesia's FTA TV audience shares (all time) as of April 2018 and ranked first on the metric.
Media Nusantara Citra : Media Nusantara Citra (MNCN) is one of South East Asia's largest and most integrated media companies, controlled by media mogul, Hary Tanoesoedibjo, with a focus on national free to air (FTA) television broadcasting. MNCN controlled 32.8% of all time
MNCN and SCMA share price movement
Source: Bloomberg Finance L.P.
0
1,000
2,000
3,000
4,000
5,000
2/1
/20
13
5/1
/20
13
8/1
/20
13
11
/1/2
01
3
2/1
/20
14
5/1
/20
14
8/1
/20
14
11
/1/2
01
4
2/1
/20
15
5/1
/20
15
8/1
/20
15
11
/1/2
01
5
2/1
/20
16
5/1
/20
16
8/1
/20
16
11
/1/2
01
6
2/1
/20
17
5/1
/20
17
8/1
/20
17
11
/1/2
01
7
2/1
/20
18
5/1
/20
18
MNCN SCMA
25 Jun 2018
Indonesia Industry Focus
Indonesia Media
Refer to important disclosures at the end of this report
STOCKS
12-mth
Price Mkt Cap Target Price Performance (%)
Rp US$m Rp 3 mth 12 mth Rating
Surya Citra Media 2,100 2,181 2,600 (22.5) (19.2) BUY Media Nusantara 975 954 1,300 (28.6) (48.6) BUY
Source: DBSVI, Bloomberg Finance L.P. Closing price as of 22 Jun 2018
Industry Focus
Indonesia Media
Page 2
Table of Contents
Investment Thesis 3
Advertising revenue is positively correlated with economic conditions 5
Growth is driven by FMCG advertising budget, and audience share which 6
Special events to support adex growth in FY18F 11
Company Guide – Initiation 13
Surya Citra Media 14
Media Nusantara Citra 31

Industry Focus
Indonesia Media
Page 3
Investment Thesis
We initiate the media sector with an Overweight call, and we prefer Surya Citra Media (SCMA) to Media Nusantara Citra (MNCN). Our Overweight call on the sector is premised on the following:
- We expect a recovery in advertising expenditure (adex) growth in FY18F. We estimate a 10% adex growth in FY18F which is based on (i) rate card improvement, (ii) potential higher advertising spending by FMCG companies and also technology companies, and (iii) two major sports events this year which could boost adex this year
- The sector has been underperformed the JCI in FY17 due to weak adex growth. But we think that the current share prices of SCMA and MNCN have only priced in adex growth of 4-5% and the market has yet to really price in the potential recovery of adex growth
- The media sector’s PE is now at a huge discount to consumer names – higher than the historical average discount
- Undemanding valuations – As SCMA/MNCN are trading at -1SD/-2SD of their 8-year means at the moment, we believe that their valuations are attractive
Laggard sector, with potential recovery in FY18F. Total adex growth in Indonesia decelerated to 8% y-o-y (bringing adex value to Rp145.5tr) in FY17 vs. 14% y-o-y in the previous year. The softer adex growth was due to: (i) stagnant private consumption which resulted in a decrease in the sales volume of FMCG companies and thus prompting FMCG companies cut their adex budget in 2017, and (ii) political instability in 2H17. Total advertising spending on TV and print (Rptr)
Source: Nielsen Note: Commercial product ad spending on TV and print based on gross rate card (does not include discount, promo, and bonus)
As the media sector is at a discount to consumer names, expect the discount to narrow on the back of potential adex recovery. The underperformance was due to company-specific problems. SCMA’s underperformance can be attributed to (i) weak topline performance due to soft audience share numbers in FY17, (ii) higher cost of programming from the acquisition of a production house, Sinemart in early FY17 – which resulted in a weaker EBITDA margin, and (iii) weak net income in FY17. Meanwhile, MNCN’s underperformance was due to (i) the fact that higher audience share number did not translate into a very strong topline growth in FY17, and (ii) some overhangs arising from debt refinancing at the parent level. Thus, currently the media stock is trading at a 37% discount to consumer PE multiple (the historical 3-year mean discount is at 28%). Media vs consumer PE ratio (x)
Source: Bloomberg Finance L.P.
Note: Media companies average only include MNCN and SCMA Consumer companies are UNVR, INDF, ICBP, MYOR, KLBF, HMSP, GGRM
101.7 109.8
118.0
134.8 145.5
8.0%7.5%
14.2%
7.9%
0%
2%
4%
6%
8%
10%
12%
14%
16%
-
20.0
40.0
60.0
80.0
100.0
120.0
140.0
160.0
2013 2014 2015 2016 2017
Advertising spending (Rptn) y-o-y growth (%)
0.0
5.0
10.0
15.0
20.0
25.0
30.0
35.0
40.0
2/1/20
13
7/1/20
13
12/1/201
3
5/1/20
14
10/1/201
4
3/1/20
15
8/1/20
15
1/1/20
16
6/1/20
16
11/1/201
6
4/1/20
17
9/1/20
17
2/1/20
18
Media PE Consumer PE

Industry Focus
Indonesia Media
Page 4
Relative PE between media and consumer is currently trading at -1SD. Revenue for most Indonesian media companies is highly correlated to spending on advertising and promotion by FMCG (more than 70%). We believe that the investors could view media stocks as a cheaper play on an improving domestic consumption story than consumer names. Relative PE between media and consumer sectors are currently trading at -1SD below the historical 3-year mean of 0.72x. With our positive view on TV adex growth, we believe that current valuations offer an attractive entry point into the media sector. Media PE relative to consumer PE
Source: Bloomberg Finance L.P.
Undemanding valuations, especially if adex rebounds. Trading at -1SD and -2SD or below relative to the historical level, we believe that SCMA and MNCN’s valuations are attractive, especially if advertising spending recovers. We think at the current share price levels for SCMA and MNCN, the market is pricing at 4-5% TV adex growth in FY18F (vs. our estimate of 10%). We believe that both stocks offer an attractive risk-reward profile at current valuations. Thus, we initiate the media sector with an Overweight call, and BUY calls on SCMA and MNCN. Even though we have BUY calls on SCMA and MNCN, we prefer the former to the latter. Under our base-case scenario of higher adex growth for this year at 10%, we believe that SCMA is better positioned to monetise higher adex growth due to its improvement in audience share (in prime time (PT) and all time (AT)). Furthermore, SCMA will also broadcast the Asian Games which would enable it to have a high audience share number and additional revenue streams from sponsorships. Meanwhile, we think that MNCN will see a slower multiple expansion, as it is facing weaker audience share in YTD 2018.
Peers comparison
Source: Bloomberg Finance L.P., and DBSVI
0.40
0.50
0.60
0.70
0.80
0.90
1.00
PE Average +1SDEV -1SDEV +2SDEV -2SDEV
FY2017 FY2018 FY2019 FY2017 FY2018 FY2019 FY2017 FY2018 FY2019 FY2017 FY2018 FY2019 FY2017 FY2018 FY2019
Indonesia Media
Surya Citra Media SCMA IJ EQUITY 24.4x 21.9x 19.8x 16.6x 14.8x 13.1x 91.1 101.5 112.2 266.81 317.62 372.48 8.3x 7.0x 6.0x
Media Nusantara Citra MNCN IJ EQUITY 10.5x 9.4x 7.9x 6.1x 5.6x 4.8x 101.8 113.5 135.2 632.15 703.57 793.34 1.7x 1.5x 1.3x
Regional Media
BEC World PCL BEC TB Equity nm nm 77.0x nm 15.1x 7.4x (0.6) (0.0) 0.0 0.69 0.67 0.67 0.7x 0.8x 0.8x
Astro Malaysia ASTRO MK EQUITY 13.9x 11.3x 13.4x 7.0x 7.8x 6.7x 0.1 0.1 0.1 0.12 0.13 0.15 13.9x 13.3x 11.5x
Media Prima MPR MK Equity nm nm 77.0x nm 15.1x 7.4x (0.6) (0.0) 0.0 0.69 0.67 0.67 0.7x 0.8x 0.8x
Sun TV SUNTV IN Equity nm nm 77.0x nm 15.1x 7.4x (0.6) (0.0) 0.0 0.69 0.67 0.67 0.7x 0.8x 0.8x
TV18 TV18 IN Equity nm nm 77.0x nm 15.1x 7.4x (0.6) (0.0) 0.0 0.69 0.67 0.67 0.7x 0.8x 0.8x
Indonesia Consumer
Unilever Indonesia UNVR IJ EQUITY 48.2x 43.1x 39.2x 33.8x 30.1x 27.4x 918.0 1,027.0 1,129.9 678.03 787.02 889.95 65.3x 56.3x 49.8x
Indofood Sukses Makmur INDF IJ EQUITY 14.1x 13.5x 12.7x 7.4x 7.1x 6.9x 474.7 497.4 528.4 3,550.95 3,810.93 4,075.13 1.9x 1.8x 1.6x
Indofood CBP Sukses Makmur ICBP IJ Equity 26.4x 22.7x 20.6x 15.6x 13.8x 12.4x 325.6 378.1 418.2 1,677.57 1,892.89 2,122.05 5.1x 4.5x 4.1x
Mayora Indah MYOR IJ EQUITY 50.2x 42.5x 37.0x 25.2x 22.1x 19.6x 59.2 69.8 80.3 311.95 360.83 417.06 9.8x 8.5x 7.3x
Kalbe Farma KLBF IJ EQUITY 25.5x 23.1x 20.9x 16.2x 14.7x 13.1x 51.6 56.8 63.0 287.90 319.14 353.81 4.6x 4.1x 3.7x
Indonesia Retail
Ace Hardware Indonesia ACES IJ EQUITY 33.0x 32.8x 32.5x 21.6x 21.0x 20.6x 39.1 39.3 39.7 211.84 239.01 266.47 6.1x 5.4x 4.8x
Matahari Department Store LPPF IJ EQUITY 13.5x 12.4x 11.5x 9.1x 8.0x 7.1x 653.6 710.9 768.7 797.82 1,051.26 1,322.28 11.1x 8.4x 6.7x
Matahari Putra Prima MPPA IJ EQUITY nm 103.0x 43.3x nm 4.5x 3.5x (231.2) 2.6 6.3 218.32 272.08 278.36 1.2x 1.0x 1.0x
Ramayana Lestari RALS IJ EQUITY 24.4x 21.9x 19.8x 16.6x 14.8x 13.1x 91.1 101.5 112.2 266.81 317.62 372.48 8.3x 7.0x 6.0x
Price/ BVPS (X)P/E (X) EV/ EBITDA (X) EPS (Fully Diluted) BVPS
Industry Focus
Indonesia Media
Page 5
Advertising revenue is positively correlated with economic
conditions
The revenue of Indonesian media companies is generally correlated with:
- spending on advertising and promotion (A&P) by FMCG companies, as this contributes more than 70% of media companies’ revenue.
- economic conditions, albeit indirectly; softer economy conditions (soft GDP growth) would lead to FMCG companies cutting down their advertising on TV.
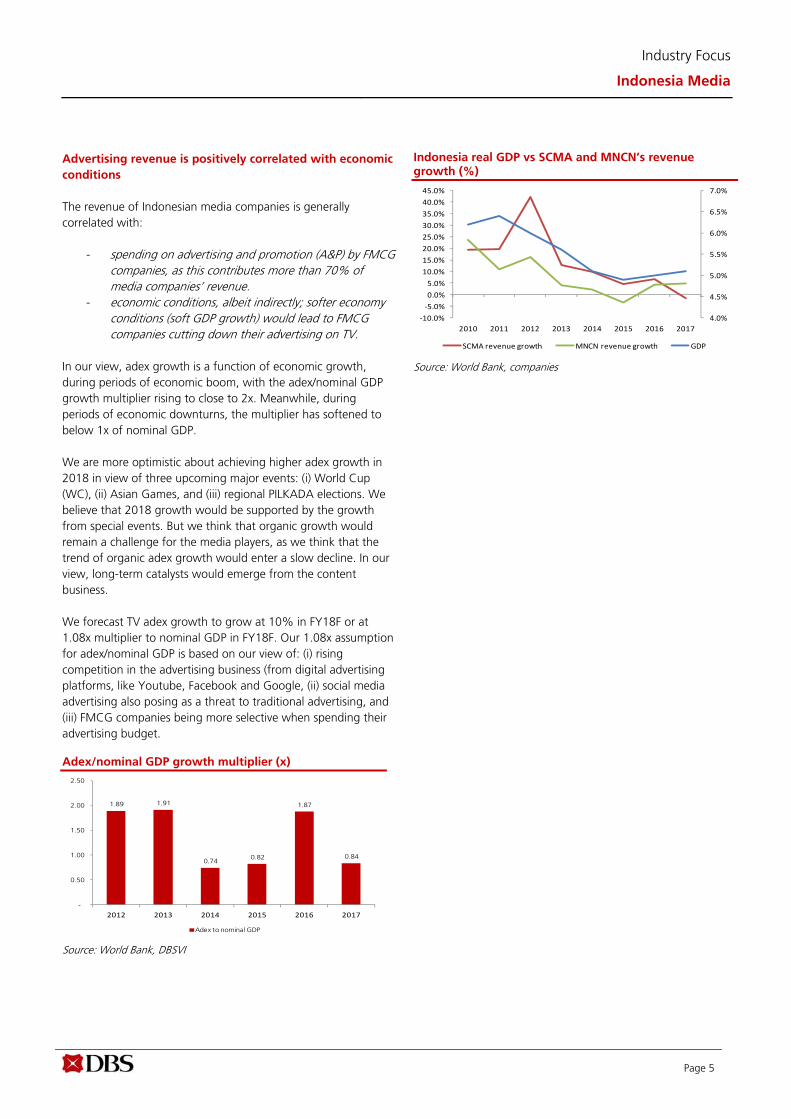
In our view, adex growth is a function of economic growth, during periods of economic boom, with the adex/nominal GDP growth multiplier rising to close to 2x. Meanwhile, during periods of economic downturns, the multiplier has softened to below 1x of nominal GDP. We are more optimistic about achieving higher adex growth in 2018 in view of three upcoming major events: (i) World Cup (WC), (ii) Asian Games, and (iii) regional PILKADA elections. We believe that 2018 growth would be supported by the growth from special events. But we think that organic growth would remain a challenge for the media players, as we think that the trend of organic adex growth would enter a slow decline. In our view, long-term catalysts would emerge from the content business. We forecast TV adex growth to grow at 10% in FY18F or at 1.08x multiplier to nominal GDP in FY18F. Our 1.08x assumption for adex/nominal GDP is based on our view of: (i) rising competition in the advertising business (from digital advertising platforms, like Youtube, Facebook and Google, (ii) social media advertising also posing as a threat to traditional advertising, and (iii) FMCG companies being more selective when spending their advertising budget. Adex/nominal GDP growth multiplier (x)
Source: World Bank, DBSVI
Indonesia real GDP vs SCMA and MNCN’s revenue growth (%)
Source: World Bank, companies
1.89 1.91
0.74 0.82
1.87
0.84
-
0.50
1.00
1.50
2.00
2.50
2012 2013 2014 2015 2016 2017
Adex to nominal GDP
4.0%
4.5%
5.0%
5.5%
6.0%
6.5%
7.0%
‐10.0%
‐5.0%
0.0%
5.0%
10.0%
15.0%
20.0%
25.0%
30.0%
35.0%
40.0%
45.0%
2010 2011 2012 2013 2014 2015 2016 2017
SCMA revenue growth MNCN revenue growth GDP
Industry Focus
Indonesia Media
Page 6
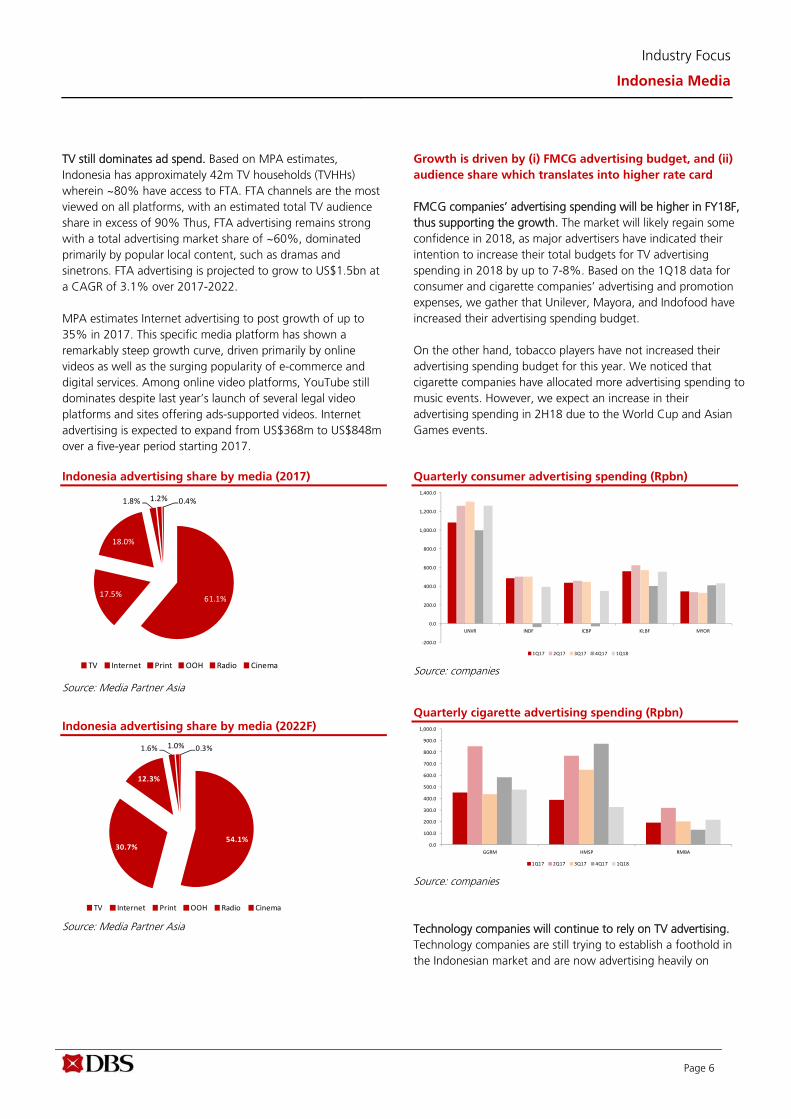
TV still dominates ad spend. Based on MPA estimates, Indonesia has approximately 42m TV households (TVHHs) wherein ~80% have access to FTA. FTA channels are the most viewed on all platforms, with an estimated total TV audience share in excess of 90% Thus, FTA advertising remains strong with a total advertising market share of ~60%, dominated primarily by popular local content, such as dramas and sinetrons. FTA advertising is projected to grow to US$1.5bn at a CAGR of 3.1% over 2017-2022. MPA estimates Internet advertising to post growth of up to 35% in 2017. This specific media platform has shown a remarkably steep growth curve, driven primarily by online videos as well as the surging popularity of e-commerce and digital services. Among online video platforms, YouTube still dominates despite last year’s launch of several legal video platforms and sites offering ads-supported videos. Internet advertising is expected to expand from US$368m to US$848m over a five-year period starting 2017. Indonesia advertising share by media (2017)
Source: Media Partner Asia Indonesia advertising share by media (2022F)
Source: Media Partner Asia
Growth is driven by (i) FMCG advertising budget, and (ii)
audience share which translates into higher rate card
FMCG companies’ advertising spending will be higher in FY18F, thus supporting the growth. The market will likely regain some confidence in 2018, as major advertisers have indicated their intention to increase their total budgets for TV advertising spending in 2018 by up to 7-8%. Based on the 1Q18 data for consumer and cigarette companies’ advertising and promotion expenses, we gather that Unilever, Mayora, and Indofood have increased their advertising spending budget. On the other hand, tobacco players have not increased their advertising spending budget for this year. We noticed that cigarette companies have allocated more advertising spending to music events. However, we expect an increase in their advertising spending in 2H18 due to the World Cup and Asian Games events. Quarterly consumer advertising spending (Rpbn)
Source: companies Quarterly cigarette advertising spending (Rpbn)
Source: companies Technology companies will continue to rely on TV advertising. Technology companies are still trying to establish a foothold in the Indonesian market and are now advertising heavily on
61.1%17.5%
18.0%
1.8% 1.2% 0.4%
TV Internet Print OOH Radio Cinema
54.1%30.7%
12.3%
1.6% 1.0% 0.3%
TV Internet Print OOH Radio Cinema
‐200.0
0.0
200.0
400.0
600.0
800.0
1,000.0
1,200.0
1,400.0
UNVR INDF ICBP KLBF MYOR
1Q17 2Q17 3Q17 4Q17 1Q18
0.0
100.0
200.0
300.0
400.0
500.0
600.0
700.0
800.0
900.0
1,000.0
GGRM HMSP RMBA
1Q17 2Q17 3Q17 4Q17 1Q18

Industry Focus
Indonesia Media
Page 7
traditional media, like TV. Based on the data from Nielsen, technology companies consistently rank among the top 10 advertisers on the main TV channels. Top 10 product adex (Rpbn)
Source: Nielsen Audience share is key for rate card improvement. For FMCG companies that would like to advertise their products on TV stations, they would like to see high and stable audience share numbers. A higher audience share number means that the probability of their products become well-known would be higher. The audience share is calculated by dividing the average number of audience by total TV audience share. The average rate card in the Indonesian media industry stands at US$5,000/30seconds and it could go higher, subject to the audience share number. MNCN regained its pole position in May 2018 audience share number. Based on Nielsen data for May audience share numbers, MNCN has successfully won back its first position in all time (AT) audience share by 32.8% (+2.1ppts m-o-m), and prime time (PT) audience share by 33.9% (+1.7ppts m-o-m). We think the increase of audience share in May 2018 was due to its strong Ramadhan programme line-up. RCTI has secured a leading audience share (23.7%) in Suhoor prime time between 2am and 6am. In the Ramadhan festive period, there were other prime time slots being allocated in the morning; while under normal circumstances, these will be considered as non-prime time slots. VIVA group occupies the third position with 19.7% share (+0.2ppt m-o-m) of prime time (PT) and 21.3% share (+0.9ppt m-o-m) of all time (AT) as of May 2018.
Prime time (PT) audience share as of May 2018 per TV station
Source: Nielsen
Prime time (PT) audience share as of May 2018 per group
Source: NIelsen
All time (AT) audience share as of May 2018 per TV station
Source: NIelsen
RCT I SCTV IV M T RA NS MNCTV T RA NS7 GTV A NTV TV ONE METRO TV RM
Jan-17 26.9 11.4 12.5 6.9 10.1 6.0 4.6 14.7 3.5 2.0 1.1Feb-17 24.9 16.0 13.7 5.2 7.9 5.9 5.2 14.2 3.4 2.1 1.1Mar-17 23.8 22.9 11.2 5.6 7.6 5.6 5.3 12.1 2.8 1.8 1.1Apr-17 21.7 21.4 12.6 4.6 8.7 6.1 7.3 9.5 4.9 1.9 1.0May-17 23.0 17.9 12.4 4.4 9.2 6.8 6.8 9.6 6.5 2.1 0.9Jun-17 24.0 15.9 9.9 4.1 9.4 5.7 7.7 14.4 5.9 1.8 0.9Jul-17 20.9 14.5 13.4 4.7 10.7 5.3 5.4 16.9 5.7 1.5 0.7Aug-17 21.6 14.5 12.2 3.9 10.4 6.5 5.8 16.0 6.0 1.7 1.2Sep-17 20.6 12.7 12.7 4.0 12.7 6.8 5.2 16.0 6.5 1.6 0.9Oct-17 19.2 13.2 12.3 4.6 11.4 6.5 5.6 18.6 6.1 1.4 0.9Nov-17 18.6 16.1 14.0 4.8 9.2 7.3 4.8 17.0 5.4 1.4 1.0Dec-17 16.8 18.8 17.6 5.2 9.3 6.3 5.2 15.0 3.4 1.3 0.9Jan-18 15.3 20.4 15.6 4.4 11.3 5.3 6.5 16.3 2.6 1.2 0.8Feb-18 14.5 20.5 15.0 4.6 11.2 5.5 7.4 16.3 2.8 1.2 0.7Mar-18 15.6 20.2 14.1 4.7 10.3 5.9 7.3 17.2 2.5 1.1 0.7Apr-18 15.2 21.0 14.2 5.6 9.8 5.4 7.2 16.9 2.6 1.1 0.7May-18 16.4 17.9 15.1 4.6 10.8 6.1 6.7 16.8 2.9 1.4 1.1
MNCN SCMA TRA NS V IV A
Jan-17 41.6 23.9 12.9 18.2
Feb-17 38.0 29.7 11.1 17.6Mar-17 36.7 34.1 11.2 14.9
Apr-17 37.7 34.0 10.7 14.4May-17 39.0 30.3 11.2 16.1
Jun-17 41.1 25.8 9.8 20.3Jul-17 37.0 27.9 10.0 22.6
Aug-17 37.8 26.7 10.4 22.0Sep-17 38.5 25.4 10.8 22.5
Oct-17 36.2 25.5 11.1 24.7Nov-17 32.6 30.1 12.1 22.4
Dec-17 31.3 36.4 11.5 18.4Jan-18 33.1 36.0 9.7 18.9
Feb-18 33.1 35.5 10.1 19.1Mar-18 33.2 34.3 10.6 19.7
Apr-18 32.2 35.2 11.0 19.5May-18 33.9 33.0 10.7 19.7
R C TI SC TV IV M TR A N S M N C T V T R A N S7 GTV A N TV T V ON E M ET R O TV R I1 LocalT V
Jan-17 19.3 12.6 11.4 6.9 11.2 7.1 5.0 19.4 3.7 2.0 1.2 0.2Feb-17 17.8 14.6 12.7 6.3 9.6 7.1 5.2 19.4 3.7 2.2 1.2 0.2Mar-17 17.2 18.1 11.0 6.7 10.3 7.6 5.7 16.9 3.3 1.8 1.2 0.2Apr-17 16.4 17.4 12.4 6.6 10.6 8.0 6.5 14.5 4.3 2.0 1.0 0.3May-17 17.7 16.0 12.1 6.2 11.1 8.4 6.7 13.4 4.9 2.1 1.1 0.3Jun-17 18.9 14.5 11.0 5.6 10.9 7.5 7.1 17.5 4.0 1.7 1.0 0.3Jul-17 16.2 13.3 13.6 6.5 12.0 7.6 5.5 17.9 4.5 1.6 0.9 0.1Aug-17 16.6 13.2 13.5 5.9 11.4 7.9 5.6 17.6 5.2 1.8 1.2 0.1Sep-17 15.7 12.6 15.0 6.2 12.4 8.2 5.3 16.3 5.5 1.7 1.1 0.0Oct-17 15.3 13.1 14.9 6.8 11.4 7.9 5.4 17.2 5.2 1.5 1.0 0.3Nov-17 15.3 13.9 15.2 7.0 10.4 8.5 5.2 16.7 4.9 1.6 1.0 0.9Dec-17 14.5 15.5 16.3 7.1 10.3 7.3 6.7 16.2 3.6 1.4 0.9 0.2Jan-18 13.1 17.2 15.6 6.6 11.5 6.6 7.3 16.8 2.9 1.3 0.9 0.2Feb-18 12.1 17.5 15.2 6.7 11.6 6.6 8.1 16.7 3.1 1.3 0.8 0.3Mar-18 12.7 17.8 14.6 6.5 10.7 6.7 7.7 18.5 2.7 1.1 0.8 0.2Apr-18 13.0 18.7 14.7 7.0 10.0 6.4 7.7 17.5 2.9 1.2 0.8 0.1May-18 15.1 16.5 14.5 6.1 10.3 6.2 7.4 18.1 3.2 1.4 1.1 0.1
Top 10 product TV and print Adex 2017 Adex 2016Meikarta 1,539.5 -Trave loka.com 1,136.7 65%Indomie 981.5 25%Vivo s martphone 823.5 577%Clear shampoo 795.5 40%SGM exksplor 769.9 38%Kementrian Kesehatan 702.2 23%Sams ung s martphone 640.0 28%Dove 610.3 788%Cap bango 589.7 36%

Industry Focus
Indonesia Media
Page 8
All time (AT) audience share as of May 2018 per group
Source: NIelsen
Correlation between audience share and advertising revenue of each TV player. Based on our analysis, we gather that there is some correlation between media advertising revenue growth and last year’s audience share number. This indicates that, if the audience share of one TV media company fell – it would have an impact on next year’s revenue growth. We believe that the advertisers will ask for adjustments in the rate card, depending on the audience share.
SCMA: Correlation between last year’s audience share and revenue growth
Source: Nielsen, companies
MNCN: Correlation between last year’s audience share and revenue growth
Source: Nielsen, companies
MNCN SCMA TRA NS V IV AJan-17 35.5 24.0 14.0 23.1Feb-17 32.6 27.3 13.4 23.1Mar-17 33.2 29.1 14.3 20.2Apr-17 33.5 29.8 14.6 18.8May-17 35.5 28.1 14.6 18.3Jun-17 36.9 25.5 13.1 21.5Jul-17 33.7 26.9 14.1 22.4Aug-17 33.6 26.7 13.8 22.8Sep-17 33.4 27.6 14.4 21.8Oct-17 32.1 28.0 14.7 22.4Nov-17 30.9 29.1 15.5 21.6Dec-17 31.5 31.8 14.4 19.8Jan-18 31.9 32.8 13.2 19.7Feb-18 31.8 32.7 13.3 19.8Mar-18 31.1 32.4 13.2 21.2Apr-18 30.7 33.4 13.4 20.4May-18 32.8 31.0 12.3 21.3
‐4.0%
‐2.0%
0.0%
2.0%
4.0%
6.0%
8.0%
10.0%
12.0%
14.0%
0.0
5.0
10.0
15.0
20.0
25.0
30.0
35.0
2013 2014 2015 2016 2017
SCMA PT audience share SCMA revenue growth
‐4.0%
‐3.0%
‐2.0%
‐1.0%
0.0%
1.0%
2.0%
3.0%
4.0%
5.0%
6.0%
0.0
5.0
10.0
15.0
20.0
25.0
30.0
35.0
40.0
45.0
50.0
2013 2014 2015 2016 2017
MNCN PT audience share MNCN revenue growth

Industry Focus
Indonesia Media
Page 9
Who are the players in Indonesia’s media industry? There are some groups that owned a number of national free to air TV stations in Indonesia:
- MNC Group, which is owned by Hary Tanoesoedibjo, has three national TV stations (RCTI, MNCTV, and GTV) and regional TV stations under i-News TV
- Emtek Group, which is owned by Eddy Sariaatmadja, has two national TV stations (SCTV and Indosiar)
- VIVA Group, which is owned by Bakrie group, has two national TV stations (ANTV and TV One)
- Trans Group, which is owned by Chairul Tanjung, has two national TV stations (Trans TV and Trans 7)
- Media Group, which is owned by Surya Paloh, has one TV station (Metro TV)
- Government of Indonesia also owns one national TV station (TVRI)
Indonesia’s TV stations
Source: company
Owner Group TV stat ion
Wishnutama and A gus Lasmono
Indika Group
Gov ernment of Indonesia
Gov ernment of Indonesia
Rajawali Corpora Rajawali Corpora
Chairul Tanjung T rans Group
Sury a Paloh Media Group
Kompas Gramedia Kompas Gramedia
Hary Tanoesoedibjo MNC Group
Eddy Sariaatmadja Emtek Group
Bak rie Group Bak rie Group
Industry Focus
Indonesia Media
Page 10
Content essential to drive audience share. In general, Indonesians prefer to watch local content, which tend to feature live recording, soap operas (sinetron), and variety shows. The preference for local content is due to language barriers, and the lack of education in some parts of Indonesia.
Surya Citra Media (SCMA), Media Nusantara Citra (MNCN), and Visi Media Asia (VIVA) are fighting for the top spot in prime time audience share. Last year, MNCN was able to grab the pole position for prime time audience share with 37.3% market share on the back of its hugely popular local drama called “Dunia Terbalik”. Meanwhile, SCMA was able to improve its PT audience share number to 29.2% (+4.1ppts m-o-m) thanks to its Sinemart production unit, which produced dramas like “Anak Langit”, and the famous music show called “D’Academy” that aired on Indosiar TV station.
Indonesia TV programmes
Source: Nielsen,companies
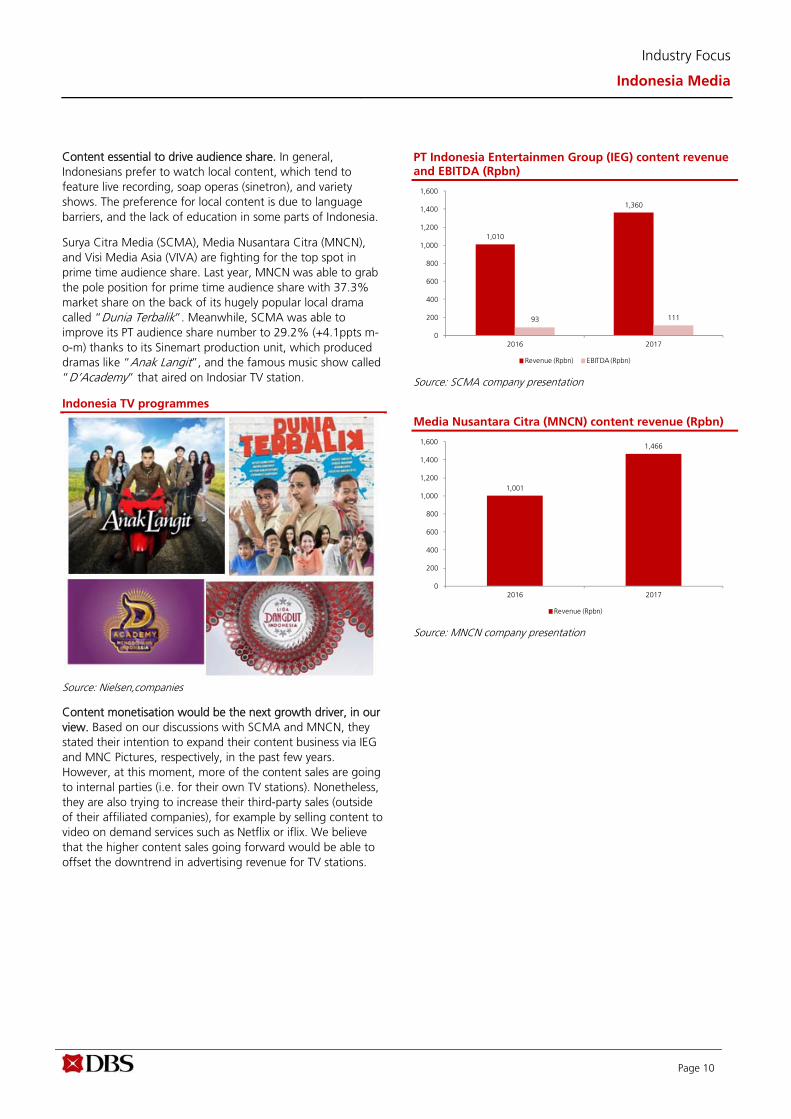
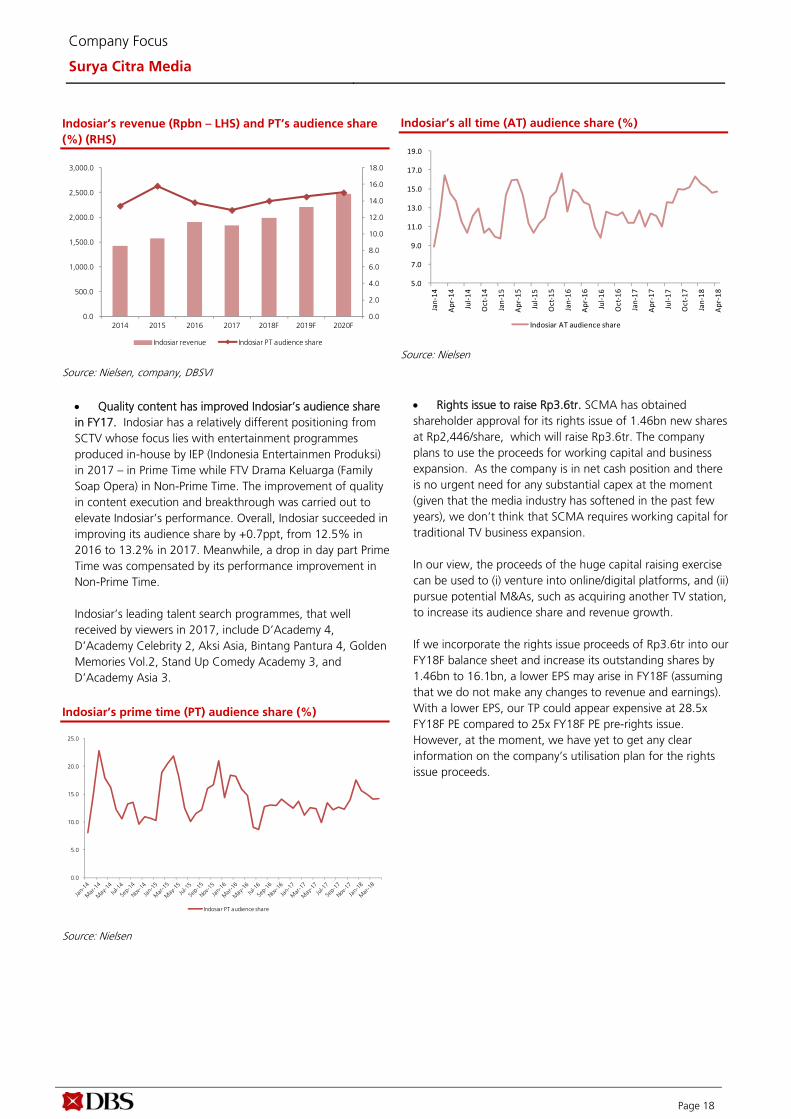
Content monetisation would be the next growth driver, in our view. Based on our discussions with SCMA and MNCN, they stated their intention to expand their content business via IEG and MNC Pictures, respectively, in the past few years. However, at this moment, more of the content sales are going to internal parties (i.e. for their own TV stations). Nonetheless, they are also trying to increase their third-party sales (outside of their affiliated companies), for example by selling content to video on demand services such as Netflix or iflix. We believe that the higher content sales going forward would be able to offset the downtrend in advertising revenue for TV stations.
PT Indonesia Entertainmen Group (IEG) content revenue and EBITDA (Rpbn)
Source: SCMA company presentation
Media Nusantara Citra (MNCN) content revenue (Rpbn)
Source: MNCN company presentation
1,010
1,360
93 111
0
200
400
600
800
1,000
1,200
1,400
1,600
2016 2017
Revenue (Rpbn) EBITDA (Rpbn)
1,001
1,466
0
200
400
600
800
1,000
1,200
1,400
1,600
2016 2017
Revenue (Rpbn)

Industry Focus
Indonesia Media
Page 11
Special events to support adex growth in FY18F Special events to support adex growth in FY18F. In 2018, there are a few major events that we believe could help boost the adex growth of media players. The events are: (i) World Cup (WC), and (ii) Asian Games. For WC, based on the past experience, cigarette, telecommunication, and health drink players will spend a substantial part of their advertising budgets on TV by sponsoring WC-related programmes. Top product category for TV advertisements during WC 2010
Source: Nielsen Top products that were advertised during WC 2010
Source: Nielsen About 3,000 spots were aired during WC. During WC events, audience share will typically surge and this will lead to media players increasing their rate card. Besides a higher rate card, we believe the TV programmes that are aired prior to WC games would benefit as well. If we assume that there are 3,000 available spots for WC events and a rate card of Rp70m/30seconds, we believe that WC could generate advertising revenue of at least Rp200bn over one month. With the World Cup being broadcasted by Trans Group, will this have an impact on SCMA and MNCN? Trans Group (privately owned) and the 4th largest TV group in Indonesia has secured the broadcast rights for WC 2018, which will start on 14 June 2018 and end on 15 July 2018. WC 2018 will be hosted in Russia (whose time zone is four hours ahead of Indonesia’s) and the matches will be broadcast at 7pm to 1am in Indonesia. We
believe it would directly compete with the prime time shows offered by SCMA and MNCN, and also VIVA. If we look back at the previous WC in 2014 that was broadcasted by the VIVA group, the event helped it gain at least 8% of audience share during that time (from a rough average share of 6% in the first five months of 2014 to 13%-15% during WC 2014). We think that the audience share of MNCN, SCMA, and VIVA will decline in June and July 2018, and Trans Group will benefit from improving audience share numbers. Will Trans Group be able to monetise the WC momentum to create some pressure on the Big 3? In our view, the strategy to broadcast WC 2018 would enable it to significantly improve its audience share numbers. But most importantly, there are also opportunities for TV programmes preceding WC 2018 matches to shine and grab the attention of a huge audience. If we look back at VIVA group via ANTV, prior to the screening of WC 2014 matches, its audience share in prime time (PT) slots was actually quite low. Post WC 2014, ANTV managed to successfully monetise its association with the event by clinching higher viewership for its drama series as well as improving its long-term audience share. ANTV’s audience share pre- and post-WC 2014
Source: Nielsen Regional PILKADA election in 2H18 and Presidential election next year will improve private consumption – leading to higher advertising spending by FMCG companies. We believe that two major election events will happen in June 2018 and April 2019. We are of the opinion that such events will help boost private household consumption. In the past, household expenditure has increased by 300-400bps in the year prior to Indonesian elections. This is because the government needs to deliver economic growth to increase the electability of the incumbent or ruling party. The pre-election consumption boost will also bode well for consumer stocks; which will directly translate into a better performance for media companies from higher advertising spending by FMCG companies.
0.0
2.0
4.0
6.0
8.0
10.0
12.0
14.0
16.0
18.0
20.0
World Cup 2014 boostANTV audience share
Pre World Cup 2014,the audience share was quite low
Post World Cup 2014, ANTV has been able to improve the audience share. Since the other programs also been sh ining and able to post a good audience share number up to now

Industry Focus
Indonesia Media
Page 12
Household expenditure growth (%)
Source: World Bank
3.2%
5.0%5.3%
4.9% 4.7%5.1%
5.5% 5.4%5.1% 5.0% 5.0% 4.9%
0.0%
1.0%
2.0%
3.0%
4.0%
5.0%
6.0%
2006 2007 2008 2009 2010 2011 2012 2013 2014 2015 2016 2017
Household consumption

Industry Focus
Indonesia Media
Page 13
Company Initiations

ed: CK / MA, PY, CS
BUY (Initiating Coverage) Last Traded Price ( 22 Jun 2018): Rp2,100 (JCI : 5,821.81) Price Target 12-mth: Rp2,600 (24% upside) Potential Catalyst: Asian Games could further spur revenue growth this year, Ramadhan, and acceleration of Media adex to benefit SCMA Analyst David Arie Hartono +62 2130034936 [email protected]
Price Relative
Forecasts and Valuation FY Dec (Rpbn) 2016A 2017A 2018F 2019F Revenue 4,524 4,454 4,854 5,222 EBITDA 2,140 1,970 2,184 2,411 Pre-tax Profit 2,024 1,782 1,999 2,210 Net Profit 1,501 1,331 1,484 1,641 Net Pft (Pre Ex.) 1,501 1,331 1,484 1,641 EPS (Rp) 103 91.1 101 112 EPS Pre Ex. (Rp) 103 91.1 101 112 EPS Gth (%) (1) (11) 11 11 EPS Gth Pre Ex (%) (1) (11) 11 11 Diluted EPS (Rp) 103 91.1 101 112 Net DPS (Rp) 0.0 0.0 0.0 0.0 BV Per Share (Rp) 234 267 318 372 PE (X) 20.5 23.1 20.7 18.7 PE Pre Ex. (X) 20.5 23.1 20.7 18.7 P/Cash Flow (X) 22.2 24.6 20.2 18.1 EV/EBITDA (X) 14.3 15.7 13.9 12.4 Net Div Yield (%) 0.0 0.0 0.0 0.0 P/Book Value (X) 9.0 7.9 6.6 5.6 Net Debt/Equity (X) CASH CASH CASH CASH ROAE (%) 45.7 36.3 34.7 32.5 Consensus EPS (Rp): N/A N/A N/A Other Broker Recs: B: 13 S: 0 H: 3 ICB Industry : Consumer Services ICB Sector: Media Principal Business: Surya Citra Media (SCMA) focusses on national free to air (FTA) TV broadcasting. Through its station SCTV and Indosiar. SCMA controls c. 31.0% of Indonesia's FTA TV audience shares (all time) as of April 2018 and ranked first on the metric.
Source of all data on this page: Company, DBSVI, Bloomberg Finance L.P.
At A Glance Issued Capital (m shrs) 14,622
Mkt. Cap (Rpbn/US$m) 30,705 / 2,181
Major Shareholders (%)
PT Elang Mahkota Teknologi 60.83%
Free Float (%) 39.1%
3m Avg. Daily Val (US$m) 1.9
DBS Group Research . Equity 25 Jun 2018
Indonesia Company Focus
Surya Citra Media Bloomberg: SCMA IJ | Reuters: SCMA.IJ Refer to important disclosures at the end of this report
More exciting outlook Revenue growth driven by higher rate card due to audience
share improvement and Asian Games
The acquisition of another TV station would make SCMA the biggest TV station, thus boosting its revenue growth
Higher content sold to third parties would be the next growth catalyst
Initiate SCMA with BUY call and TP of Rp2,600/share
Promising outlook. We estimate SCMA to post 9% y-o-y growth in FY18F (vs. -1.6% y-o-y in FY17), due to (i) better ad spend outlook in FY18F, (ii) recovery in audience share, which translates into a higher rate card, and (iii) additional revenue streams from Asian Games events in August 2018. We assume earnings CAGR of 10.8% over FY17-20F on the back of higher gross margin of 59.8% in FY18F (vs. 58.6% in FY17).
Are M&As on the table? SCMA has received the approval for its rights issue of 1.46bn new shares at Rp2,446/share that will raise Rp3.6tr. The company plans to use the proceeds (currently unused) for working capital and business expansion. In our view, the proceeds could be used to expand its business by either (i) acquiring another TV station, or (ii) venturing into online/digital media platforms. The acquisition of another TV station would be positive for SCMA, thus making it the biggest TV player in Indonesia and boosting its revenue growth.
Where we differ. We are more conservative than consensus as we assume lower media industry adex of 10% in FY18F and as a result, our revenue growth is 5% below consensus. Furthermore, we assume a higher cost of programming, which will lead to a lower GPM. Thus, our FY18 earnings forecast is 14% below consensus. At the end of the day, we have a lower TP vs consensus. Valuation:
Our DCF-based TP of Rp2,600/share for SCMA assumes a WACC of 9% and terminal growth of 3%. Our TP implies 25.6x FY18F PE. Currently, the stock is trading at 17.9x FY18F PE, which is -1SD of its 8-year mean.
Key Risks to Our View:
Slower ad spend by FMCG companies, decline in audience share, competition from digital advertising, and digitalisation of transmission.
42
62
82
102
122
142
162
182
202
222
1,755.0
2,255.0
2,755.0
3,255.0
3,755.0
4,255.0
Jun-14 Jun-15 Jun-16 Jun-17 Jun-18
Relative IndexRp
Surya Citra Media (LHS) Relative JCI (RHS)

Page 15
Company Focus
Surya Citra Media
Table of Contents
SWOT analysis 16
Investment summary 17
Company background 19
Key management team 19
Competitive strengths 20
Growth strategies 20
Key risks 21
Critical data points to watch 22
Key assumption 25
Income statement 26
Quarterly/interim income statement 27
Balance sheet 28
Cash flow statement 29
Valuation 30

Page 16
Company Focus
Surya Citra Media
SWOT Analysis
Strengths Weakness
SCMA has solid prime time and non-prime time audience share numbers Strong production house Healthy balance sheet and minimum USD exposure Higher FCF vis-à-vis peers Has the highest net margin in the industry of 29.9% and ROE of 36.3% as of 2017
Highly dependent on FMCG companies (70% of revenue), since they contribute the bulk of the company’s revenue
Opportunities Threats
Potential higher revenue growth in FY18F from the Asian Games event, whose broadcasting licence is owned by SCTV Potential acquisition of another TV station. Such move would make SCMA the largest TV company in terms of audience share in Indonesia
Softer advertising spending (ad spend) by FMCG companies would impact its revenue growth Fierce competition in audience share will also pose a threat to the company Competition from digital advertising Switch to digital from analog
Source: DBSVI

Page 17
Company Focus
Surya Citra Media
Investment Summary Initiate coverage of SCMA with BUY call and TP of Rp2,600/share. Our optimism is based on the following:
- Improvement in SCTV audience share in YTD 2018, which enables the company to increase its rate card in FY18F
- Asian Games would give another boost to the company’s revenue stream in FY18F
- Indosiar’s audience share remains stable and at a high level, which we believe it would enable a higher sponsorship payment
- We estimate a stabilisation of SCMA’s margin in FY18F to 59.8%. In FY17, gross margin fell significantly to 58.6% due to higher cost of programming after acquiring SinemArt
- Healthy balance sheet with minimum USD exposure, and the company offers a good ROE of 34.7% in FY18F – which is the highest among the media industry
- SCMA is currently trading at 17.9x PE FY18F, -1SD of its historical 8-year mean of 21.2x. We believe that the current share price has priced in the bad news, coupled with the failure to reflect any potential upside
SCTV’s improvement in audience share to drive revenue growth in FY18F. In the past three years, SCTV has been under pressure to deliver a strong and stable audience share number, which resulted in soft revenue growth. However, we foresee that SCTV’s audience share has shown a recovery since end of 2017, and it has continued to improve up till April 2018. We believe the improvement in audience share would boost its rate card in FY18F. Furthermore, we also see additional revenue streams for SCTV from Asian Games, as SCTV owns the broadcasting licence for Asian Games. We estimate an additional revenue of at least Rp200bn (assuming 3,000 time slots available for Asian Games and a rate card between of Rp65m and Rp70m per 30seconds).
SCTV prime time (PT) audience share (%) (RHS) and SCTV
revenue (Rpbn) (LHS)
Source: Nielsen, company
Forecast SCTV revenue CAGR of 5% over FY17-20F. We assume that SCTV’s prime time audience share to remain in the range of 18.5-19.5% over FY18F-20F and assume 5% rate card improvement p.a. As a result, we assume revenue to grow at a CAGR of 5% over FY17-20F. This has already pencilled in softer advertising expenditure (adex) going forward due to more competition from digital advertising.
SCTV revenue (Rpbn – LHS) and PT audience share (% -
RHS)
Source: Nielsen, company, DBSVI Indosiar to continue delivering good growth. Indosiar has successfully transformed its programming since 2012, with the TV station now delivering good audience share numbers – thanks to its music shows like D’Academy. Indosiar’s revenue grew at a CAGR of 9% in FY14-17 due to the improvement in audience share number. We forecast 10% revenue CAGR over FY17-20F for Indosiar TV station on the back of potentially stable audience share numbers. Several new programmes have emerged to maintain its audience share number in FY18F, e.g. LIDA (Liga Dangdut Indonesia). The show has received more sponsorship revenue from FMCG companies but it entails higher programming costs.
Indosiar’s revenue (Rpbn – LHS) and PT’s audience share
(%) (RHS)
Source: Nielsen, company
0.0
2.0
4.0
6.0
8.0
10.0
12.0
14.0
16.0
18.0
20.0
2,540.0
2,560.0
2,580.0
2,600.0
2,620.0
2,640.0
2,660.0
2,680.0
2,700.0
2,720.0
2,740.0
2014 2015 2016 2017
SCTV revenue SCTV PT audience share
0.0
5.0
10.0
15.0
20.0
25.0
2,400.0
2,500.0
2,600.0
2,700.0
2,800.0
2,900.0
3,000.0
3,100.0
2014 2015 2016 2017 2018F 2019F 2020F
SCTV revenue SCTV PT audience share
0.0
2.0
4.0
6.0
8.0
10.0
12.0
14.0
16.0
18.0
0.0
200.0
400.0
600.0
800.0
1,000.0
1,200.0
1,400.0
1,600.0
1,800.0
2,000.0
2014 2015 2016 2017
Indosiar revenue Indosiar PT audience share
Page 18
Company Focus
Surya Citra Media
Indosiar’s revenue (Rpbn – LHS) and PT’s audience share
(%) (RHS)
Source: Nielsen, company, DBSVI Quality content has improved Indosiar’s audience share in FY17. Indosiar has a relatively different positioning from SCTV whose focus lies with entertainment programmes produced in-house by IEP (Indonesia Entertainmen Produksi) in 2017 – in Prime Time while FTV Drama Keluarga (Family Soap Opera) in Non-Prime Time. The improvement of quality in content execution and breakthrough was carried out to elevate Indosiar’s performance. Overall, Indosiar succeeded in improving its audience share by +0.7ppt, from 12.5% in 2016 to 13.2% in 2017. Meanwhile, a drop in day part Prime Time was compensated by its performance improvement in Non-Prime Time. Indosiar’s leading talent search programmes, that well received by viewers in 2017, include D’Academy 4, D’Academy Celebrity 2, Aksi Asia, Bintang Pantura 4, Golden Memories Vol.2, Stand Up Comedy Academy 3, and D’Academy Asia 3.
Indosiar’s prime time (PT) audience share (%)
Source: Nielsen
Indosiar’s all time (AT) audience share (%)
Source: Nielsen
Rights issue to raise Rp3.6tr. SCMA has obtained shareholder approval for its rights issue of 1.46bn new shares at Rp2,446/share, which will raise Rp3.6tr. The company plans to use the proceeds for working capital and business expansion. As the company is in net cash position and there is no urgent need for any substantial capex at the moment (given that the media industry has softened in the past few years), we don’t think that SCMA requires working capital for traditional TV business expansion.
In our view, the proceeds of the huge capital raising exercise can be used to (i) venture into online/digital platforms, and (ii) pursue potential M&As, such as acquiring another TV station, to increase its audience share and revenue growth. If we incorporate the rights issue proceeds of Rp3.6tr into our FY18F balance sheet and increase its outstanding shares by 1.46bn to 16.1bn, a lower EPS may arise in FY18F (assuming that we do not make any changes to revenue and earnings). With a lower EPS, our TP could appear expensive at 28.5x FY18F PE compared to 25x FY18F PE pre-rights issue. However, at the moment, we have yet to get any clear information on the company’s utilisation plan for the rights issue proceeds.
0.0
2.0
4.0
6.0
8.0
10.0
12.0
14.0
16.0
18.0
0.0
500.0
1,000.0
1,500.0
2,000.0
2,500.0
3,000.0
2014 2015 2016 2017 2018F 2019F 2020F
Indosiar revenue Indosiar PT audience share
0.0
5.0
10.0
15.0
20.0
25.0
Indosiar PT audience share
5.0
7.0
9.0
11.0
13.0
15.0
17.0
19.0
Jan‐14
Apr‐14
Jul‐14
Oct‐14
Jan‐15
Apr‐15
Jul‐15
Oct‐15
Jan‐16
Apr‐16
Jul‐16
Oct‐16
Jan‐17
Apr‐17
Jul‐17
Oct‐17
Jan‐18
Apr‐18
Indosiar AT audience share
Page 19
Company Focus
Surya Citra Media
Company Background
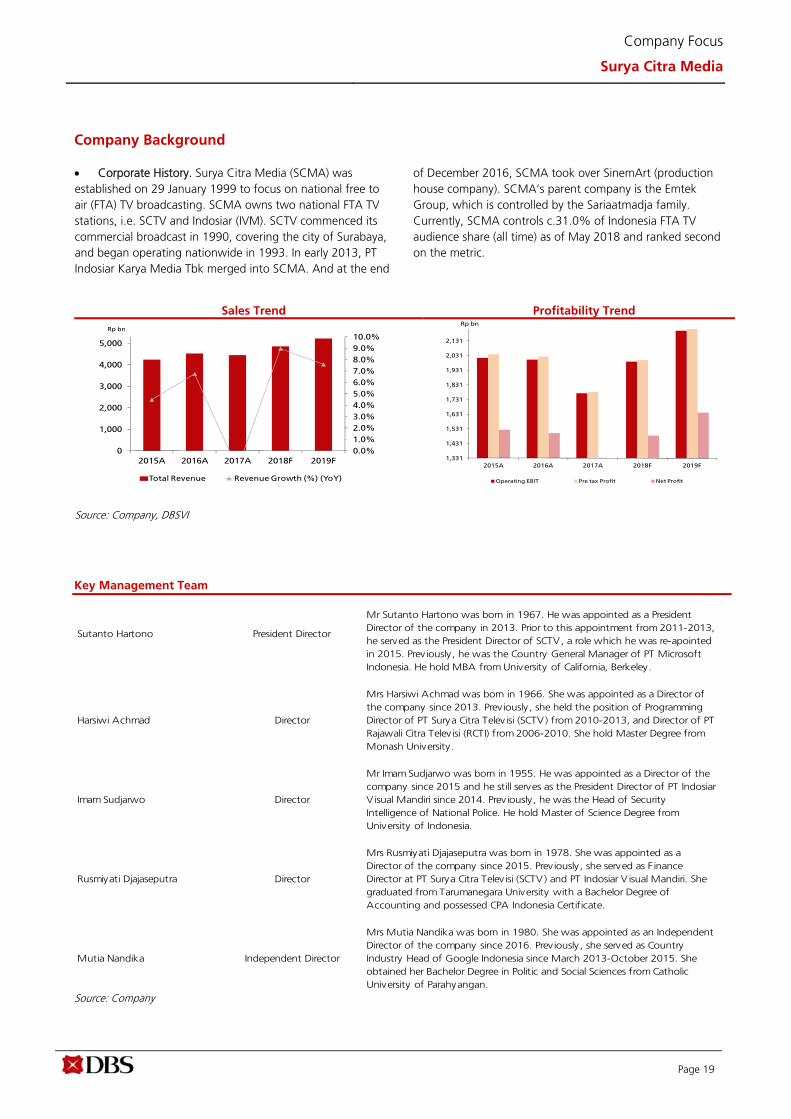
Corporate History. Surya Citra Media (SCMA) was established on 29 January 1999 to focus on national free to air (FTA) TV broadcasting. SCMA owns two national FTA TV stations, i.e. SCTV and Indosiar (IVM). SCTV commenced its commercial broadcast in 1990, covering the city of Surabaya, and began operating nationwide in 1993. In early 2013, PT Indosiar Karya Media Tbk merged into SCMA. And at the end
of December 2016, SCMA took over SinemArt (production house company). SCMA’s parent company is the Emtek Group, which is controlled by the Sariaatmadja family. Currently, SCMA controls c.31.0% of Indonesia FTA TV audience share (all time) as of May 2018 and ranked second on the metric.
Sales Trend Profitability Trend
Source: Company, DBSVI
Key Management Team
Source: Company
0.0%
1.0%
2.0%
3.0%
4.0%
5.0%
6.0%
7.0%
8.0%
9.0%
10.0%
0
1,000
2,000
3,000
4,000
5,000
2015A 2016A 2017A 2018F 2019F
Rp bn
Total Revenue Revenue Growth (%) (YoY)
1,331
1,431
1,531
1,631
1,731
1,831
1,931
2,031
2,131
2015A 2016A 2017A 2018F 2019F
Rp bn
Operating EBIT Pre tax Profit Net Profit
Sutanto Hartono President Director
Mr Sutanto Hartono was born in 1967. He was appointed as a President Director of the company in 2013. Prior to this appointment from 2011-2013, he served as the President Director of SCTV, a role which he was re-apointed in 2015. Previously, he was the Country General Manager of PT Microsoft Indonesia. He hold MBA from University of California, Berkeley.
Harsiwi Achmad Director
Mrs Harsiwi Achmad was born in 1966. She was appointed as a Director of the company since 2013. Previously, she held the position of Programming Director of PT Surya Citra Telev isi (SCTV) from 2010-2013, and Director of PT Rajawali Citra Telev isi (RCTI) from 2006-2010. She hold Master Degree from Monash University .
Imam Sudjarwo Director
Mr Imam Sudjarwo was born in 1955. He was appointed as a Director of the company since 2015 and he still serves as the President Director of PT Indosiar V isual Mandiri since 2014. Previously, he was the Head of Security Intelligence of National Police. He hold Master of Science Degree from University of Indonesia.
Rusmiyati Djajaseputra Director
Mrs Rusmiyati Djajaseputra was born in 1978. She was appointed as a Director of the company since 2015. Previously, she served as F inance Director at PT Surya Citra Telev isi (SCTV) and PT Indosiar V isual Mandiri. She graduated from Tarumanegara University with a Bachelor Degree of Accounting and possessed CPA Indonesia Certificate.
Mutia Nandika Independent Director
Mrs Mutia Nandika was born in 1980. She was appointed as an Independent Director of the company since 2016. Previously, she served as Country Industry Head of Google Indonesia since March 2013-October 2015. She obtained her Bachelor Degree in Politic and Social Sciences from Catholic University of Parahyangan.

Page 20
Company Focus
Surya Citra Media
Competitive Strengths One of the leaders in prime time (PT) and all time (AT) audience share. As of May 2018, SCMA controls market shares of 33.0% and 31.0% of PT and AT, respectively. In YTD 2018, SCMA has showed a significant improvement in terms of audience share for both TV stations, SCTV and Indosiar; through their new programs in both TV stations. Currently, SCMA is the second largest market share behind MNCN.
All time (AT) audience share per group (%)
Source: Nielsen Prime time (PT) audience share per group (%)
Source: Nielsen
Growth Strategies SCTV’s audience share has improved. In 2017, SCTV prime time (PT) and all time (AT) audience share have improved significantly. SCTV AT and PT increased by 1.8ppts and 5.0ppts, respectively in 2017. The improvement of audience share was due to its soap opera (Sinetron) programmes that were produced by PT SinemArt Indonesia (which was acquired in FY17). Several programmes like “Siapa Takut Jatuh Cinta”, “Anak Langit”, “Berkah Cinta”, “Anak Sekolahan”, and “Boy” helped to improve SCTV’s PT audience share number in 2017.
SCTV’s PT audience share showed an improvement YTD
(%)
Source: Nielsen SCTV’s AT audience share showed an improvement YTD
(%)
Source: Nielsen
MNCN SCMA TRANS VIVAJan-17 35.5 24.0 14.0 23.1Feb-17 32.6 27.3 13.4 23.1Mar-17 33.2 29.1 14.3 20.2Apr-17 33.5 29.8 14.6 18.8May-17 35.5 28.1 14.6 18.3Jun-17 36.9 25.5 13.1 21.5Jul-17 33.7 26.9 14.1 22.4Aug-17 33.6 26.7 13.8 22.8Sep-17 33.4 27.6 14.4 21.8Oct-17 32.1 28.0 14.7 22.4Nov-17 30.9 29.1 15.5 21.6Dec-17 31.5 31.8 14.4 19.8Jan-18 31.9 32.8 13.2 19.7Feb-18 31.8 32.7 13.3 19.8Mar-18 31.1 32.4 13.2 21.2Apr-18 30.7 33.4 13.4 20.4May-18 32.8 31.0 12.3 21.3
MNCN SCMA TRANS VIVAJan-17 41.6 23.9 12.9 18.2Feb-17 38.0 29.7 11.1 17.6Mar-17 36.7 34.1 11.2 14.9Apr-17 37.7 34.0 10.7 14.4May-17 39.0 30.3 11.2 16.1Jun-17 41.1 25.8 9.8 20.3Jul-17 37.0 27.9 10.0 22.6Aug-17 37.8 26.7 10.4 22.0Sep-17 38.5 25.4 10.8 22.5Oct-17 36.2 25.5 11.1 24.7Nov-17 32.6 30.1 12.1 22.4Dec-17 31.3 36.4 11.5 18.4Jan-18 33.1 36.0 9.7 18.9Feb-18 33.1 35.5 10.1 19.1Mar-18 33.2 34.3 10.6 19.7Apr-18 32.2 35.2 11.0 19.5May-18 33.9 33.0 10.7 19.7
0.0
5.0
10.0
15.0
20.0
25.0
Jan-
14
Mar
-14
May
-14
Jul-1
4
Sep-
14
Nov
-14
Jan-
15
Mar
-15
May
-15
Jul-1
5
Sep-
15
Nov
-15
Jan-
16
Mar
-16
May
-16
Jul-1
6
Sep-
16
Nov
-16
Jan-
17
Mar
-17
May
-17
Jul-1
7
Sep-
17
Nov
-17
Jan-
18
Mar
-18
SCTV PT audience share
10.0
11.0
12.0
13.0
14.0
15.0
16.0
17.0
18.0
19.0
20.0
Jan‐14
Apr‐14
Jul‐14
Oct‐14
Jan‐15
Apr‐15
Jul‐15
Oct‐15
Jan‐16
Apr‐16
Jul‐16
Oct‐16
Jan‐17
Apr‐17
Jul‐17
Oct‐17
Jan‐18
Apr‐18
SCTV all time audience share

Page 21
Company Focus
Surya Citra Media
SCTV vs RCTI’s prime time audience share (%)
Source: Nielsen Asian Games will provide additional revenue for SCMA. The Asian Games, which will be held in Jakarta and Palembang, is expected to be a momentous national event that will grab the attention of Indonesians. All eyes will be on the second largest sporting event in the world, and the excitement is further underpinned by the fact it is the first time that Indonesia has hosted the Asian Games since 1962. The appointment of SCTV as the official media to cover the 2018 Asian Games in Jakarta and Palembang will certainly improve SCMA’s potential to boost its audience share.
Content is the next growth driver. Online video streaming platforms have been expanding into emerging markets like Indonesia with localised content. Falling smartphone prices and improved 4G coverage have also contributed to smartphone penetration rising to 43% and the proliferation of subscription video on demand (SVoD) services. Netflix, iflix and Hooq are a few examples of SVoD players in Indonesia. Most of the SVoD players provide localised content which they bought from SCMA or MNCN – thus providing a new revenue stream to offset the potential decline of advertising revenue in the future.
SCMA’s production house team and flow of content sales
Source: company
Key Risks
Soft advertising spending (ad spend) growth. Ad spend growth is positively correlated to the GDP of Indonesia. In our base case, we assume 1.08x multiplier between ad spend and nominal GDP. Our multiplier is based on the assumption of a household consumption recovery due to 2018 being an election year. However, if the household consumption recovery trails our expectation, then the risks of lower ad spend growth and lower revenue growth for TV players could emerge in FY18F.
Sensitivity analysis on advertising spending
Source: World Bank, Nielsen, companies, DBSVI Weaker audience share. Ad spend growth is one of the key drivers for the media industry’s growth. The other factor is audience share, which would impact the rate card of media players. Normally, advertisers prefer to advertise their products on TV stations that have a strong and stable audience share. If SCMAs fail to maintain its strong audience share, its rate card could head south and this could result in lower revenue growth in FY18F.
Rights issue to raise Rp3.6tr. SCMA has obtained shareholder approval for its rights issue of 1.46bn new shares at Rp2,446/share, which will raise Rp3.6tr. The company plans to use the proceeds for working capital and business expansion. We think that investors will wait for more clarity on the utilisation plan of its capital raising exercise ( which entails a potential dilution). The right investments could boost investor confidence. Massive growth of online media. The massive growth of online media remains a challenge for the media industry’s ad spend growth going forward.
Digitalisation regulation. Furthermore, the plan to introduce new broadcasting laws in relation to the migration of analogue to digital transmission, also poses another challenge for the media industry.
0.0
5.0
10.0
15.0
20.0
25.0
30.0
35.0
Jan-
14
Mar
-14
May
-14
Jul-1
4
Sep-
14
Nov-
14
Jan-
15
Mar
-15
May
-15
Jul-1
5
Sep-
15
Nov-
15
Jan-
16
Mar
-16
May
-16
Jul-1
6
Sep-
16
Nov-
16
Jan-
17
Mar
-17
May
-17
Jul-1
7
Sep-
17
Nov-
17
Jan-
18
Mar
-18
SCTV PT audience share RCTI PT audience share
VIP - Online Video Content production house
Content Distribution
TV shows (drama, FTV, variety show)Online (Iflix, Netflix, Vidio, Smartphones)Cinema (Indonesia Box Office)
2015 2016 2017 2018F BEA R BA SE BULL
SCMA 4.5% 6.8% -1.6% 9.0% 6.0% 9.0% 12.0%
MNCN -3.3% 4.4% 4.8% 6.0% 4.0% 6.0% 8.0%
Ads spend average growth 7.5% 14.2% 7.9% 10.0% 7.2% 10.0% 12.0%
Indonesia nominal GDP 9.1% 7.6% 9.5% 9.3% 9.0% 9.3% 10.0%
x GDP 0.82 1.87 0.84 1.08 0.80 1.08 1.20

Page 22
Company Focus
Surya Citra Media
CRITICAL DATA POINTS TO WATCH
Critical Factors Advertising revenue is positively correlated with GDP In our view, adex growth is a function of economic growth, during periods of economic boom, with the adex/nominal GDP growth multiplier rising to close to 2x. Meanwhile, during periods of economic downturns, the multiplier has softened to below 1x of nominal GDP. Media players are a proxy to consumer demand and trading at a discount Media player’s revenues are highly correlated to spending by FMCG companies on advertising and promotions. Currently, the media sector is trading at 16.2x FY18F PE vs. 32.7x FY18F PE for the consumer sector – we note that the media sector has been trading at a huge discount to consumer names. With the potential recovery of industry adex in FY18F, we believe that the media sector’s PE discount to consumer names will narrow going forward. Correlation between audience share and advertising revenue of each TV player
Based on our analysis, we gather that there is some correlation between media advertising revenue growth and last year’s audience share number. This indicates that, if the audience share of one TV media company fell – it would have an impact on next year’s revenue growth. We believe that the advertisers will ask for adjustments in the rate card, depending on the audience share.
SCTV Revenue (Rpbn)
Indosiar Revenue (Rpbn)
Others (content revenue -Rpbn)
Source: company, DBSVI
27052611 2600
27302860
0.0
412.7
825.4
1238.1
1650.8
2063.5
2476.2
2888.9
2015A 2016A 2017A 2018F 2019F
1485
18811731
1988
2213
0.0
451.4
902.9
1354.3
1805.8
2257.2
2015A 2016A 2017A 2018F 2019F
48.8
32.2
123
135
149
0.00
30.31
60.62
90.94
121.25
151.56
2015A 2016A 2017A 2018F 2019F
Page 23
Company Focus
Surya Citra Media
4.0%
4.5%
5.0%
5.5%
6.0%
6.5%
7.0%
‐10.0%
0.0%
10.0%
20.0%
30.0%
40.0%
50.0%
2010 2011 2012 2013 2014 2015 2016 2017
SCMA revenue growth MNCN revenue growth GDP
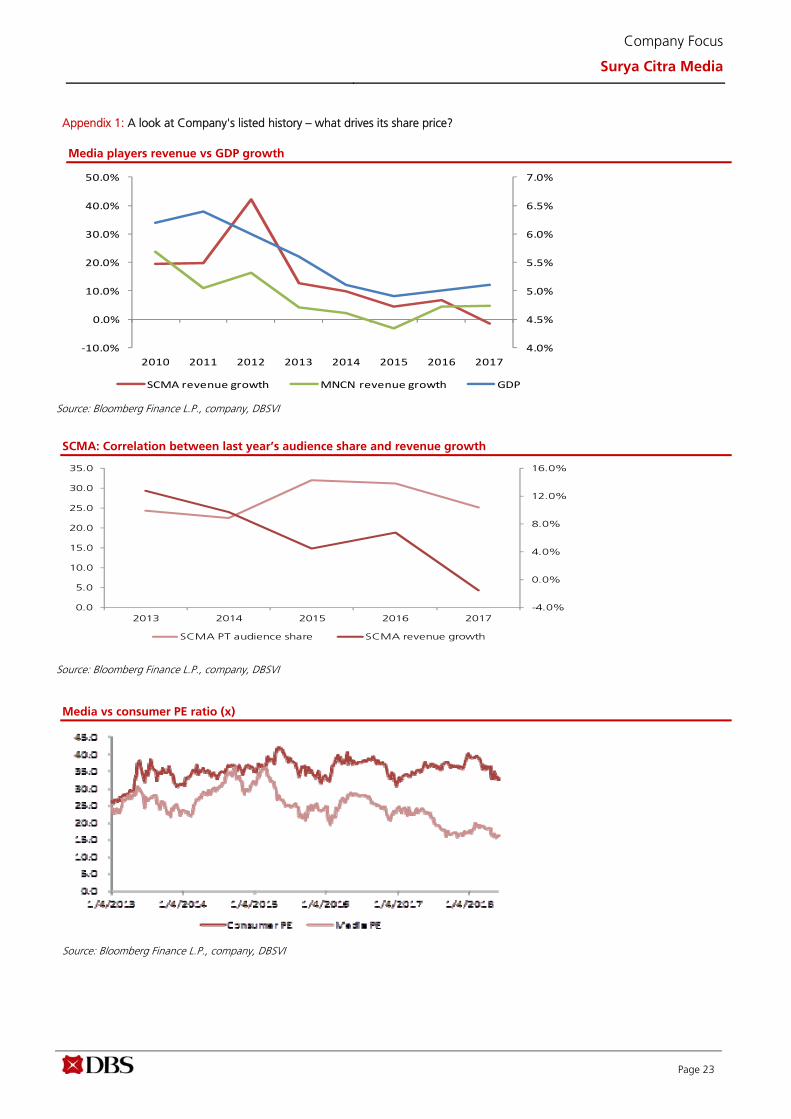
Appendix 1: A look at Company's listed history – what drives its share price? Media players revenue vs GDP growth
Source: Bloomberg Finance L.P., company, DBSVI
SCMA: Correlation between last year’s audience share and revenue growth
Source: Bloomberg Finance L.P., company, DBSVI
Media vs consumer PE ratio (x)
Source: Bloomberg Finance L.P., company, DBSVI
-4.0%
0.0%
4.0%
8.0%
12.0%
16.0%
0.0
5.0
10.0
15.0
20.0
25.0
30.0
35.0
2013 2014 2015 2016 2017
SCMA PT audience share SCMA revenue growth

Page 24
Company Focus
Surya Citra Media
Balance Sheet:
Solid balance sheet. Surya Citra Media (SCMA) has a solid balance sheet. The company does not have any bank borrowings and has always been in a net cash position. As of end-December 2017, the company’s cash position stood at Rp233.5bn. ROA fell in 2017 due to acquisition of SinemArt. In the past three years, SCMA’s ROA stabilised at 32-33% between FY14 and FY16. However, in FY17, SCMA’s ROA fell to 26.1% due to higher intangible assets in the wake of the acquisition of SinemArt in 2017 that involved Rp716bn. Softer earnings lead to lower ROE. Due to the softer industry growth, SCMA faced a number of challenges in the past few years arising from (i) weak audience share number, and (ii) higher cost of programming incurred to quickly boost the audience share number. This has resulted in a lacklustre earnings performance in the past few years, with ROE falling to 36.3% in FY17 from 45.7% in FY16. Share Price Drivers:
Higher ad spend by FMCG companies. The market will likely regain some confidence in 2018, as major advertisers have indicated their plans to increase their total budgets on TV ad spend in 2018 by up to 7-8%. This is also supported by MPA’s latest data that the FTA advertising market will grow by 6.7% in 2018. Improvement in audience share. A high and stable audience share is essential for media players, as this would enable them to charge advertisers a higher rate card. Key Risks:
Weakening adex growth. Our 10% adex growth is based on our assumption of higher ad spend by FMCG companies. If adex growth is only at 7%, then our revenue growth and PE multiple will be lower. Weaker audience share number. If its audience share fall and SCMA concedes market share to its competitors, this will translate into potentially lower rate card charges and weak revenue growth in FY18F. Rights issue could become an overhang. SCMA has obtained shareholder approval at its EGM to raise new capital of Rp3.6tr (at Rp2,446/share). Based on the Indonesia’s securities regulations, the approval would be valid for two years, i.e. until 2020. In our view, this could present an overhang risk for SCMA’s share price, as investors could be concerned about the potential dilution effect. Company Background
Surya Citra Media (SCMA) focusses on national free to air (FTA) TV broadcasting. Through its station SCTV and Indosiar. SCMA controls c. 31.0% of Indonesia's FTA TV audience shares (all time) as of April 2018 and ranked first on the metric.
Leverage & Asset Turnover (x)
Capital Expenditure
ROE (%)
Forward PE Band (x)
PB Band (x)
Source: Company, DBSVI
0.7
0.8
0.8
0.9
0.9
1.0
1.0
0.00
0.01
0.01
0.02
0.02
0.03
0.03
0.04
0.04
0.05
0.05
2015A 2016A 2017A 2018F 2019F
Gross Debt to Equity (LHS) Asset Turnover (RHS)
0.0
50.0
100.0
150.0
200.0
250.0
300.0
350.0
2015A 2016A 2017A 2018F 2019F
Capital Expenditure (-)
Rpm
0.0%
5.0%
10.0%
15.0%
20.0%
25.0%
30.0%
35.0%
40.0%
45.0%
2015A 2016A 2017A 2018F 2019F
Avg: 29.2x
+1sd: 33.6x
+2sd: 38x
‐1sd: 24.9x
‐2sd: 20.5x
17.5
22.5
27.5
32.5
37.5
42.5
Jun-14 Jun-15 Jun-16 Jun-17
(x)
Avg: 11.93x
+1sd: 14.23x
+2sd: 16.53x
‐1sd: 9.63x
‐2sd: 7.33x6.4
8.4
10.4
12.4
14.4
16.4
18.4
Dec-14 Dec-15 Dec-16 Dec-17
(x)
Rpbn

Page 25
Company Focus
Surya Citra Media
Key Assumptions
FY Dec 2014A 2015A 2016A 2017A 2018F 2019F SCTV Revenue 2,717 2,705 2,611 2,600 2,730 2,860
Indosiar Revenue 1,319 1,485 1,881 1,731 1,988 2,213
Others (content revenue) 19.6 48.8 32.3 123 135 149
Segmental Breakdown
FY Dec 2014A 2015A 2016A 2017A 2018F 2019F Revenues (Rpbn)
Advertising Revenue 4,036 4,189 4,492 4,331 4,718 5,073
Others 19.6 48.8 32.3 123 135 149
Total 4,056 4,238 4,524 4,454 4,854 5,222
Source: company, DBSVI

Page 26
Company Focus
Surya Citra Media
Income Statement (Rpbn)
FY Dec 2014A 2015A 2016A 2017A 2018F 2019F Revenue 4,056 4,238 4,524 4,454 4,854 5,222
Cost of Goods Sold (1,475) (1,522) (1,782) (1,842) (1,950) (2,038)
Gross Profit 2,580 2,715 2,742 2,612 2,904 3,184
Other Opng (Exp)/Inc (664) (701) (738) (840) (915) (985)
Operating Profit 1,917 2,015 2,003 1,772 1,989 2,200
Other Non Opg (Exp)/Inc 0.0 0.0 0.0 0.0 0.0 0.0
Associates & JV Inc 0.0 (0.2) 1.85 11.0 0.0 0.0
Net Interest (Exp)/Inc 0.22 24.1 18.4 (1.1) 10.3 10.6
Exceptional Gain/(Loss) 0.0 0.0 0.0 0.0 0.0 0.0
Pre-tax Profit 1,917 2,038 2,024 1,782 1,999 2,210
Tax (469) (517) (512) (464) (500) (553)
Minority Interest 5.37 1.94 (10.2) 13.7 (15.4) (17.0)
Preference Dividend 0.0 0.0 0.0 0.0 0.0 0.0
Net Profit 1,454 1,524 1,501 1,331 1,484 1,641
Net Profit before Except. 1,454 1,524 1,501 1,331 1,484 1,641
EBITDA 2,026 2,142 2,140 1,970 2,184 2,411
Growth
Revenue Gth (%) 9.8 4.5 6.8 (1.6) 9.0 7.6
EBITDA Gth (%) 8.8 5.7 (0.1) (8.0) 10.9 10.4
Opg Profit Gth (%) 9.0 5.1 (0.6) (11.5) 12.2 10.6
Net Profit Gth (Pre-ex) (%) 13.6 4.8 (1.5) (11.3) 11.4 10.6
Margins & Ratio
Gross Margins (%) 63.6 64.1 60.6 58.6 59.8 61.0
Opg Profit Margin (%) 47.3 47.5 44.3 39.8 41.0 42.1
Net Profit Margin (%) 35.8 35.9 33.2 29.9 30.6 31.4
ROAE (%) N/A 46.2 45.7 36.3 34.7 32.5
ROA (%) N/A 32.8 32.0 26.1 25.7 25.0
ROCE (%) N/A 39.5 39.7 30.9 29.7 28.4
Div Payout Ratio (%) 51.3 120.0 80.9 63.7 50.7 51.1
Net Interest Cover (x) NM NM NM 1,652.8 NM NM Source: company, DBSVI
Margins Trend
28.0%
33.0%
38.0%
43.0%
48.0%
2015A 2016A 2017A 2018F 2019F
Operating Margin % Net Income Margin %
Page 27
Company Focus
Surya Citra Media
Quarterly / Interim Income Statement (Rpbn)
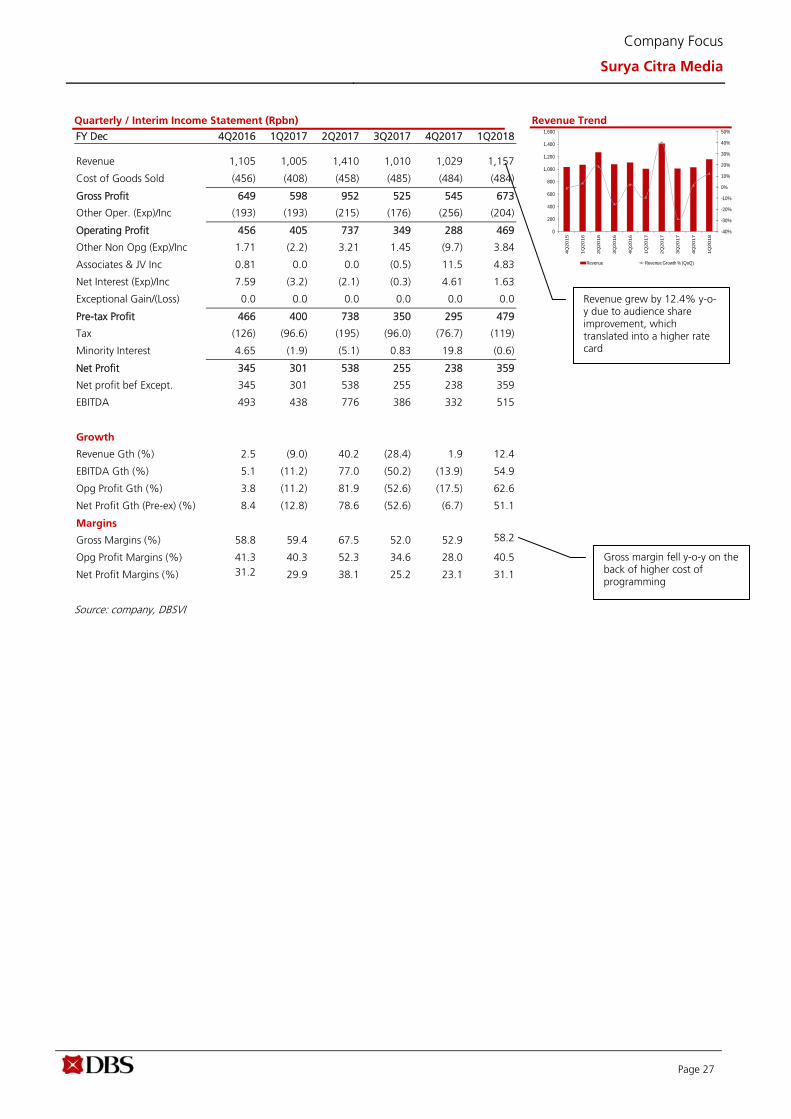
FY Dec 4Q2016 1Q2017 2Q2017 3Q2017 4Q2017 1Q2018 Revenue 1,105 1,005 1,410 1,010 1,029 1,157
Cost of Goods Sold (456) (408) (458) (485) (484) (484)
Gross Profit 649 598 952 525 545 673
Other Oper. (Exp)/Inc (193) (193) (215) (176) (256) (204)
Operating Profit 456 405 737 349 288 469
Other Non Opg (Exp)/Inc 1.71 (2.2) 3.21 1.45 (9.7) 3.84
Associates & JV Inc 0.81 0.0 0.0 (0.5) 11.5 4.83
Net Interest (Exp)/Inc 7.59 (3.2) (2.1) (0.3) 4.61 1.63
Exceptional Gain/(Loss) 0.0 0.0 0.0 0.0 0.0 0.0
Pre-tax Profit 466 400 738 350 295 479
Tax (126) (96.6) (195) (96.0) (76.7) (119)
Minority Interest 4.65 (1.9) (5.1) 0.83 19.8 (0.6)
Net Profit 345 301 538 255 238 359
Net profit bef Except. 345 301 538 255 238 359
EBITDA 493 438 776 386 332 515
Growth
Revenue Gth (%) 2.5 (9.0) 40.2 (28.4) 1.9 12.4
EBITDA Gth (%) 5.1 (11.2) 77.0 (50.2) (13.9) 54.9
Opg Profit Gth (%) 3.8 (11.2) 81.9 (52.6) (17.5) 62.6
Net Profit Gth (Pre-ex) (%) 8.4 (12.8) 78.6 (52.6) (6.7) 51.1
Margins
Gross Margins (%) 58.8 59.4 67.5 52.0 52.9 58.2
Opg Profit Margins (%) 41.3 40.3 52.3 34.6 28.0 40.5
Net Profit Margins (%) 31.2 29.9 38.1 25.2 23.1 31.1
Revenue Trend
Source: company, DBSVI
-40%
-30%
-20%
-10%
0%
10%
20%
30%
40%
50%
0
200
400
600
800
1,000
1,200
1,400
1,600
4Q
20
15
1Q
20
16
2Q
20
16
3Q
20
16
4Q
20
16
1Q
20
17
2Q
20
17
3Q
20
17
4Q
20
17
1Q
20
18
Revenue Revenue Growth % (QoQ)
Gross margin fell y-o-y on the back of higher cost of programming
Revenue grew by 12.4% y-o-y due to audience share improvement, which translated into a higher rate card

Page 28
Company Focus
Surya Citra Media
Balance Sheet (Rpbn)
FY Dec 2014A 2015A 2016A 2017A 2018F 2019F Net Fixed Assets 762 962 967 1,029 1,013 982
Invts in Associates & JVs 24.1 24.3 26.2 37.3 37.3 37.3
Other LT Assets 745 736 875 1,611 1,643 1,672
Cash & ST Invts 1,246 686 455 234 765 1,448
Inventory 462 533 689 766 770 805
Debtors 1,291 1,412 1,534 1,556 1,684 1,811
Other Current Assets 198 213 275 153 233 251
Total Assets 4,728 4,566 4,821 5,386 6,145 7,006
ST Debt
0.0 0.0 0.0 0.0 0.0 0.0
Creditor 335 260 385 437 435 455
Other Current Liab 484 601 605 306 304 322
LT Debt 0.0 0.0 0.0 0.0 0.0 0.0
Other LT Liabilities 431 292 125 237 241 245
Shareholder’s Equity 3,446 3,146 3,427 3,901 4,644 5,446
Minority Interests 32.4 267 279 504 520 537
Total Cap. & Liab. 4,728 4,566 4,821 5,386 6,145 7,006
Non-Cash Wkg. Capital 1,133 1,297 1,507 1,732 1,947 2,089
Net Cash/(Debt) 1,246 686 455 234 765 1,448
Debtors Turn (avg days) N/A 116.4 118.8 126.6 121.8 122.1
Creditors Turn (avg days) N/A 77.8 71.5 90.7 90.8 89.0
Inventory Turn (avg days) N/A 130.2 135.4 160.5 159.8 157.4
Asset Turnover (x) NM 0.9 1.0 0.9 0.8 0.8
Current Ratio (x) 3.9 3.3 3.0 3.6 4.7 5.6
Quick Ratio (x) 3.1 2.4 2.0 2.4 3.3 4.2
Net Debt/Equity (X) CASH CASH CASH CASH CASH CASH
Net Debt/Equity ex MI (X) CASH CASH CASH CASH CASH CASH
Capex to Debt (%) N/A N/A N/A N/A N/A N/A Source: company, DBSVI
Asset Breakdown
Net Fixed Assets -28.4%
Assocs'/JVs -1.0%
Bank, Cash and Liquid
Assets -6.4%
Inventory -21.1%
Debtors -43.0%
Other LT assets due to higher intangible assets from acquisition of SinemArt at Rp716bn

Page 29
Company Focus
Surya Citra Media
Cash Flow Statement (Rpbn)
FY Dec 2014A 2015A 2016A 2017A 2018F 2019F Pre-Tax Profit 1,917 2,038 2,024 1,782 1,999 2,210
Dep. & Amort. 109 127 135 187 195 212
Tax Paid (469) (517) (512) (464) (500) (553)
Assoc. & JV Inc/(loss) 0.0 0.0 0.0 0.0 0.0 0.0
Chg in Wkg.Cap. (384) (453) (434) (110) (120) (143)
Other Operating CF 4.89 311 172 (144) (50.8) (28.6)
Net Operating CF 1,179 1,507 1,385 1,251 1,524 1,698
Capital Exp.(net) (152) (322) (144) (253) (179) (180)
Other Invts.(net) 0.0 0.0 0.0 0.0 0.0 0.0
Invts in Assoc. & JV (24.1) (0.3) (1.9) (11.0) 0.0 0.0
Div from Assoc & JV 0.0 0.0 0.0 0.0 0.0 0.0
Other Investing CF (10.4) 210 (105) (263) 0.0 0.0
Net Investing CF (187) (112) (250) (526) (179) (180)
Div Paid (746) (1,828) (1,214) (848) (752) (838)
Chg in Gross Debt 37.1 84.5 35.5 (165) (65.0) 0.0
Capital Issues 0.0 (3.6) 0.33 0.0 0.0 0.0
Other Financing CF (80.5) (211) (188) 13.2 4.02 4.12
Net Financing CF (789) (1,958) (1,365) (1,000) (813) (834)
Currency Adjustments 0.0 0.0 0.0 0.0 0.0 0.0
Chg in Cash 203 (563) (231) (276) 531 683
Opg CFPS (Rp) 107 134 124 93.1 112 126
Free CFPS (Rp) 70.2 81.0 84.9 68.2 92.0 104 Source: Company, DBSVI
Capital Expenditure
0.0
50.0
100.0
150.0
200.0
250.0
300.0
350.0
2015A 2016A 2017A 2018F 2019F
Capital Expenditure (-)
Rpm

Page 30
Company Focus
Surya Citra Media
Valuation Initiate coverage: BUY, TP Rp2,600. Our DCF-based TP of Rp2,600/share for SCMA assumes a WACC of 9% and terminal growth of 3%, with cash flow discounted back from FY25F to the present. To arrive at our WACC of 9%, we assume a risk-free rate of 8%, market risk premium of
5%, and equity beta of 0.8. Our TP implies 25.6x FY18F PE which is above its historical 8-year mean. Currently, the stock is trading at 17.9x FY18F PE (-1SD of its historical 8-year mean of 21.2x).
SCMA’s forward PE band
Source: Bloomberg Finance LP Data as of 20 June 2018
‐
5.0
10.0
15.0
20.0
25.0
30.0
35.0
40.0
45.0
Jan‐10 Jan‐11 Jan‐12 Jan‐13 Jan‐14 Jan‐15 Jan‐16 Jan‐17 Jan‐18
P/E
MEAN
+1 STDEV
+2 STDEV
‐1 STDEV
‐2 STDEV

ed: KK / MA, PY, CS
BUY (Initiating Coverage) Last Traded Price ( 22 Jun 2018): Rp975 (JCI : 5,821.81) Price Target 12-mth: Rp1,300 (33% upside) Potential Catalyst: Acceleration of media advertising ependiture (adex), and Ramadhan season Analyst David Arie Hartono +62 2130034936 [email protected]
Price Relative
Forecasts and Valuation FY Dec (Rpbn) 2016A 2017A 2018F 2019F Revenue 6,730 7,053 7,474 7,945 EBITDA 2,582 3,113 3,293 3,612 Pre-tax Profit 2,153 2,416 2,482 2,746 Net Profit 1,369 1,453 1,620 1,930 Net Pft (Pre Ex.) 1,369 1,453 1,620 1,930 EPS (Rp) 95.9 102 113 135 EPS Pre Ex. (Rp) 95.9 102 113 135 EPS Gth (%) 15 6 11 19 EPS Gth Pre Ex (%) 15 6 11 19 Diluted EPS (Rp) 95.9 102 113 135 Net DPS (Rp) 0.0 0.0 0.0 0.0 BV Per Share (Rp) 618 632 704 793 PE (X) 10.2 9.6 8.6 7.2 PE Pre Ex. (X) 10.2 9.6 8.6 7.2 P/Cash Flow (X) 7.1 6.3 7.1 5.9 EV/EBITDA (X) 5.6 5.7 5.2 4.5 Net Div Yield (%) 0.0 0.0 0.0 0.0 P/Book Value (X) 1.6 1.5 1.4 1.2 Net Debt/Equity (X) CASH 0.3 0.2 0.1 ROAE (%) 15.4 16.3 17.0 18.1 Consensus EPS (Rp): N/A N/A N/A Other Broker Recs: B: S: H: ICB Industry : Consumer Services ICB Sector: Media Principal Business: Media Nusantara Citra (MNCN) is one of South East Asia's largest and most integrated media companies, controlled by media mogul, Hary Tanoesoedibjo, with a focus on national free to air (FTA) television broadcasting. MNCN controlled 32.8% of all time audience share. Source of all data on this page: company, DBSVI, Bloomberg Finance L.P.
At A Glance Issued Capital (m shrs)
Mkt. Cap (Rpbn/US$m) 17,488 / 954
Major Shareholders (%)
Global Mediacom Tbk 59.16%
Free Float (%) 40.8%
3m Avg. Daily Val (US$m) 1.6
DBS Group Research . Equity 25 Jun 2018
Indonesia Company Focus
Media Nusantara Citra Bloomberg: MNCN IJ | Reuters: MNCN.IJ Refer to important disclosures at the end of this report
Too cheap to ignore Revenue growth driven by higher rate cards of MNCTV and
GTV Estimate 12.3% earnings CAGR between FY17-20F with
better gross margin Higher content sold to third parties would be the next
growth driver Initiate MNCN with a BUY call and TP of Rp1,300/share
Attractive entry point. Currently, the stock is trading at 8.8x FY18F PE or trading at -2SD (below its historical 8 years mean of 17.4x). We believe that the market has over punished the stock due to weak advertising expenditure (adex) growth environment in the past few years. However, we believe that the stock has not priced in the potential upsides from; (i) improvement in Media Nusantara Citra TV (MNCTV) and GTV (formerly Global TV) audience shares could be the growth drivers in FY18F; (ii) potential higher revenue contribution from its content business and; (iii) potential higher gross margin in FY18F of 62% vs SCMA of 59.8% in FY18F. Assume 12.3% earnings CAGR for FY17-20F. Even though MNCN did not have the rights to broadcast special events in FY18, we believe that MNCN would benefit from a potential acceleration of adex growth in 2H18 and the Lebaran season in 2Q18. We assume a revenue growth of 6%/6.3% in FY18F/19F respectively from higher rate card in MNCTV and GTV. Meanwhile, we assume a stable and high gross margin at 62% in FY18F due to more local content. Thus, we estimate an earnings growth of 23.9%/7.2% in FY18F/19F respectively.
Where we differ. Our revenue and earnings are in line with street estimates for this year. We differ from the streets is on gross margin; we assume a gross margin of 62% vs streets of 61.2%.
Valuation:
Our DCF-based TP of Rp1,300/share for MNCN assumes a WACC of 12.2% and terminal growth of 3%. Our TP implies 11.5x FY18F PE. Currently, the stock is trading at 8.8x FY18F PE, which is -2SD of its 8-year mean.
Key Risks to Our View:
Slower ad spend from FMCG companies; decline in audience shares; competition from digital advertising; and digitalisation.
27
47
67
87
107
127
147
167
187
207
877.5
1,377.5
1,877.5
2,377.5
2,877.5
3,377.5
Jun-14 Jun-15 Jun-16 Jun-17 Jun-18
Relative IndexRp
Media Nusantara Citra (LHS) Relative JCI (RHS)

Page 32
Company Focus
Media Nusantara Citra
Table of Contents
SWOT analysis 33
Investment summary 34
Company background 37
Key management team 38
Competitive strengths 39
Growth strategies 39
Key risks 39
Critical data points to watch 40
Key assumption 42
Income statement 43
Quarterly/interim income statement 44
Balance sheet 45
Cash flow statement 46
Valuation 47

Page 33
Company Focus
Media Nusantara Citra
SWOT Analysis
Strengths Weakness One of the leaders in prime time (PT) and all time (AT) audience share RCTI has a good audience share Strong in-house production team
Highly dependent on FMCG companies (70% of revenue) that contribute the bulk of the company’s revenue USD/IDR depreciation would pressure the company’s net profit
Opportunities Threats Potential higher revenue growth from a potential acceleration of media advertising expenditure (adex) in FY18F Higher content sales to third parties which would enable the company to book higher revenue growth
Softer advertising spending (ad spend) by FMCG companies would impact its revenue growth Fierce competition in audience share would also pose a threat to the company Competition from digital advertising Switch from analog to digital
Source: DBSVI

Page 34
Company Focus
Media Nusantara Citra
Investment Summary Initiate coverage of MNCN with a BUY call and TP of Rp1,300/share, based on the following reasons:
- Estimate more contribution from MNCTV and GTV in FY18F from an improvement in audience share
- We estimate a higher gross margin of 62% in FY18F compare to SCMA of 59.8% in FY18F which would drive the earnings of MNCN in FY18F
- Higher earnings growth of 12.3% CAGR between FY17-20F vs peers
- MNCN is currently trading at 8.8x PE FY18F, -2SD below its historical mean of 17.4x. We believe that the current share price has priced in the bad news, and we believe that the share price has not priced in the potential upside
Flattish revenue growth from RCTI. One of its national TV stations RCTI saw its prime time (PT) audience share slip to 16.4% as of May 2018 (-6.6ppts y-o-y) on the back of stronger competition in the drama series category from SCTV and ANTV. As a result, we assume that RCTI revenue weighting to MNCN total advertising revenue to decline to 52%/50% in FY18F/FY19F, respectively from 55% in FY17.
MNCN advertising revenue weighting per TV stations
Source: company and DBSVI
RCTI prime time (PT) faces more competition (%)
Source: Nielsen More stable MNCTV audience share. In 2018, MNCTV will continue to focus on the middle class segment, with programs ranging from game shows, animation, family drama, and local music variety shows. YTD 2018, MNCTV prime time (PT) audience share has stabilised to 10.7% as of May 2018 vs 9.7% in FY17. As a result, we assume higher revenue contribution from MNCTV stations to 27%/28% in FY18F/FY19F respectively, or we assume a 9.2% revenue growth CAGR between FY17-19F on the back of higher rate card from an improvement in audience share.
MNCTV revenue growth assumptions (Rpbn)
Source: company, and DBSVI
55.0%
25.0%
15.0%
5.0%
52.0%
27.0%
16.0%
5.0%
50.0%
28.0%
17.0%
5.0%
0%
10%
20%
30%
40%
50%
60%
RCTI MNCTV Global TV I News TV
2017 2018F 2019F
0.0
5.0
10.0
15.0
20.0
25.0
30.0
35.0
Jan‐14
Apr‐14
Jul‐14
Oct‐14
Jan‐15
Apr‐15
Jul‐15
Oct‐15
Jan‐16
Apr‐16
Jul‐16
Oct‐16
Jan‐17
Apr‐17
Jul‐17
Oct‐17
Jan‐18
Apr‐18
RCTI SCTV ANTV
1,659.8
1,849.9
1,980.9
1,400.0
1,500.0
1,600.0
1,700.0
1,800.0
1,900.0
2,000.0
2,100.0
2017 2018F 2019F
9.2% revenue growth CAGR between FY17-19F

Page 35
Company Focus
Media Nusantara Citra
MNCTV prime time (PT) audience share (%)
Source: Nielsen Global TV (GTV) transformation in progress. Formerly known as Global TV, it rebranded its station to GTV in December 2017. It has also repositioned as a national free-to-air (FTA) network targeting a modern and young family demographic. In mid-2017, GTV reduced its foreign content and targeted young and modern family demographics. GTV is focusing on more local content such as talent search programs, talk shows and reality shows, all of which were produced by its in-house production team. In 2017, GTV’s average all-time audience share was 5.8%. As of 5M18, the prime time (PT) audience share has improved to 7% vs 5.8% in 5M17. We believe the improvement of audience share would enable the company to charge a higher rate card. We assume a 9.9% revenue growth CAGR between FY17-19F. Global TV (GTV) revenue growth assumptions (Rpbn)
Source: company, DBSVI
Global TV (GTV) prime time (PT) audience share (%)
Source: Nielsen Boost from higher in-house production. MNCN managed to increase local content production throughout its stations to an impressive 90% rate, due largely to the company’s in-house production unit, MNC Pictures. Currently, MNCN has a staggering content library of more than 300,000 hours and this is continuously increasing. MNCN is monetising its existing library by creating 20 local Pay-TV channels and digital platform licensing. Gross margin has improved significantly. In the past, MNCN has been trading at a discount compare to SCMA. One of the reasons was its lower gross margin vs its peers. However, in FY17, MNCN improved its gross margin significantly to 62.1% vs 57.3% in FY16 (higher than its peers’ 58.6% in FY17), thanks to in-house content that reduced cost of programming. We believe that gross margin will continue to improve going forward; we assume a gross margin of 62% in FY18F. MNCN vs SCMA gross margin (%)
Source: company, DBSVI
0.0
2.0
4.0
6.0
8.0
10.0
12.0
14.0
16.0
Jan‐14
Apr‐14
Jul‐14
Oct‐14
Jan‐15
Apr‐15
Jul‐15
Oct‐15
Jan‐16
Apr‐16
Jul‐16
Oct‐16
Jan‐17
Apr‐17
Jul‐17
Oct‐17
Jan‐18
Apr‐18
995.9 1,096.2
1,202.7
-
200.0
400.0
600.0
800.0
1,000.0
1,200.0
1,400.0
1,600.0
1,800.0
2017 2018F 2019F
9.9% revenue growth CAGR between FY17-19F
0.0
1.0
2.0
3.0
4.0
5.0
6.0
7.0
8.0
9.0
10.0
Jan‐14
Apr‐14
Jul‐1
4
Oct‐14
Jan‐15
Apr‐15
Jul‐1
5
Oct‐15
Jan‐16
Apr‐16
Jul‐1
6
Oct‐16
Jan‐17
Apr‐17
Jul‐1
7
Oct‐17
Jan‐18
Apr‐18
0.0%
10.0%
20.0%
30.0%
40.0%
50.0%
60.0%
70.0%
80.0%
2012 2013 2014 2015 2016 2017
MNCN gross margin (%) SCMA gross margin (%)
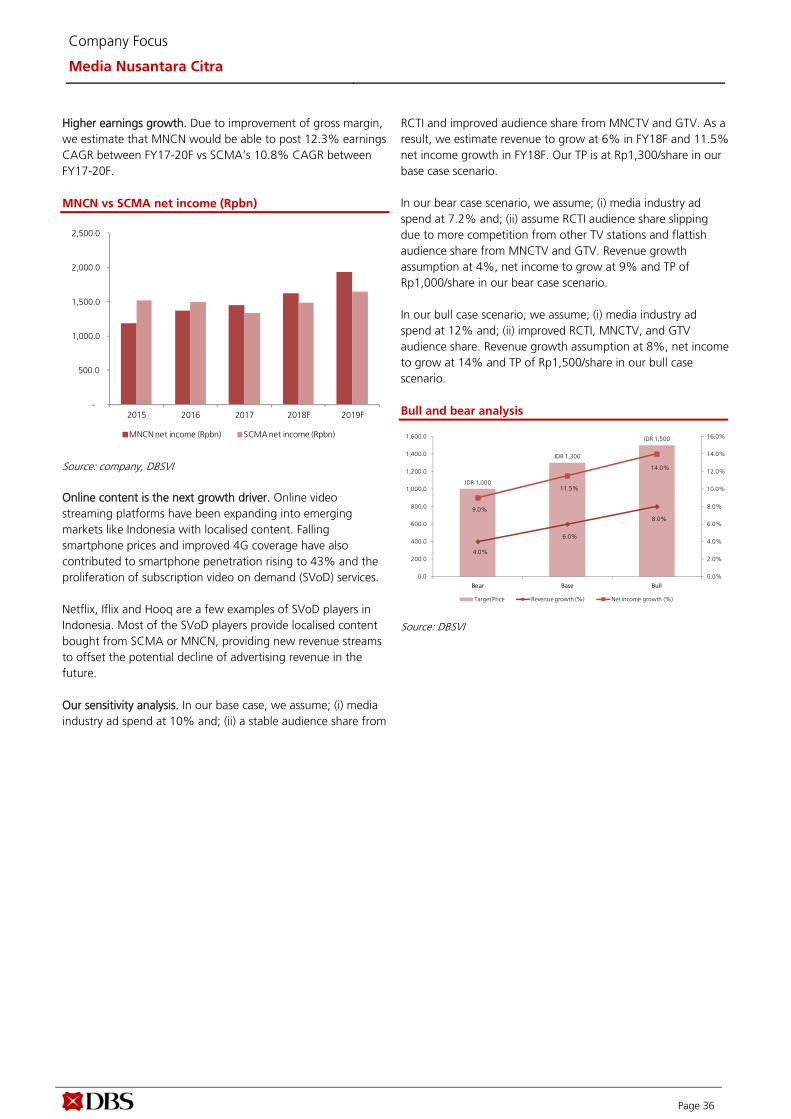
Page 36
Company Focus
Media Nusantara Citra
Higher earnings growth. Due to improvement of gross margin, we estimate that MNCN would be able to post 12.3% earnings CAGR between FY17-20F vs SCMA’s 10.8% CAGR between FY17-20F. MNCN vs SCMA net income (Rpbn)
Source: company, DBSVI Online content is the next growth driver. Online video streaming platforms have been expanding into emerging markets like Indonesia with localised content. Falling smartphone prices and improved 4G coverage have also contributed to smartphone penetration rising to 43% and the proliferation of subscription video on demand (SVoD) services.
Netflix, Iflix and Hooq are a few examples of SVoD players in Indonesia. Most of the SVoD players provide localised content bought from SCMA or MNCN, providing new revenue streams to offset the potential decline of advertising revenue in the future. Our sensitivity analysis. In our base case, we assume; (i) media industry ad spend at 10% and; (ii) a stable audience share from
RCTI and improved audience share from MNCTV and GTV. As a result, we estimate revenue to grow at 6% in FY18F and 11.5% net income growth in FY18F. Our TP is at Rp1,300/share in our base case scenario. In our bear case scenario, we assume; (i) media industry ad spend at 7.2% and; (ii) assume RCTI audience share slipping due to more competition from other TV stations and flattish audience share from MNCTV and GTV. Revenue growth assumption at 4%, net income to grow at 9% and TP of Rp1,000/share in our bear case scenario. In our bull case scenario, we assume; (i) media industry ad spend at 12% and; (ii) improved RCTI, MNCTV, and GTV audience share. Revenue growth assumption at 8%, net income to grow at 14% and TP of Rp1,500/share in our bull case scenario. Bull and bear analysis
Source: DBSVI
-
500.0
1,000.0
1,500.0
2,000.0
2,500.0
2015 2016 2017 2018F 2019F
MNCN net income (Rpbn) SCMA net income (Rpbn)
IDR 1,000
IDR 1,300
IDR 1,500
4.0%
6.0%
8.0%
9.0%
11.5%
14.0%
0.0%
2.0%
4.0%
6.0%
8.0%
10.0%
12.0%
14.0%
16.0%
0.0
200.0
400.0
600.0
800.0
1,000.0
1,200.0
1,400.0
1,600.0
Bear Base Bull
Target Price Revenue growth (%) Net Income growth (%)

Page 37
Company Focus
Media Nusantara Citra
Company Background Corporate History. Media Nusantara Citra (MNCN) is one of Southeast Asia’s largest and most integrated media companies, controlled by media mogul Hary Tanoesoedibjo. It focuses on National Free to Air (FTA) broadcasting. MNCN controlled 32.8% of all time (AT) audience share as of May
2018 through its 3 TV channels - RCTI, MNCTV, and Global TV (GTV). MNCN also has a solid presence in content and production house businesses through its PT MNC Studios International (MSIN).
Sales Trend Profitability Trend
Source: company, DBSVI
0.0%
1.0%
2.0%
3.0%
4.0%
5.0%
6.0%
7.0%
8.0%
9.0%
10.0%
0
1,000
2,000
3,000
4,000
5,000
6,000
7,000
8,000
2015A 2016A 2017A 2018F 2019F
Rp bn
Total Revenue Revenue Growth (%) (YoY)
1,185
1,385
1,585
1,785
1,985
2,185
2,385
2,585
2,785
2,985
2015A 2016A 2017A 2018F 2019F
Rp bn
Operating EBIT Pre tax Profit Net Profit

Page 38
Company Focus
Media Nusantara Citra
Key Management Team
David Fernando Audy President Director Mr David Fernando Audy was born in 1979. He was appointed as a President Director of the company in September 2016. Prior to this appointment, he served numerous executive positions namely President Director of PT MNC Pictures (2017), President Director of PT Linktone Indonesia (2011-2015), and VP of PT Media Nusantara Citra (2009-2012). He obtained a Master of Commerce degree in Accounting from University of New South Wales, Australia.
Kanti Mirdiati Imansyah Director Mrs Kanti Mirdiati Imansyah was born in 1966. She was appointed as a Director of the company in 2013. Previously, she was Vice President of RCTI since 2012. She completed her Bachelor of Science Degree at La Jolla Academy of Advertising Arts, San Diego, USA.
Faisal Dharma Setiawan Director Mr Faisal Dharma Setiawan was born in 1966. He was appointed as a Director of the company in October 2014. Prior to this appointment, he served as Vice Chief Finance Officer for Strategy and Finance at PT Bank CIMB Niaga. He obtained a Master of Management degree in Accounting from Prasetya Mulya University.
Ella Kartika Director Mrs Ella Kartika was born in 1969. She was appointed as a Director of the company in October 2014. She joined the company in 2008 and has held senior roles in television programming and production, as well as sales and marketing within the company's subsidiaries. She received her Master of Management degree in Banking and Finance from University of Indonesia.
Arya Mahendra Sinulingga Director Mr Arya Mahendra Sinulingga was born in 1971. He was appointed as a Director of the company in July 2015. He was a member of the Indonesian Broadcasting Commission for North Sumatera and joined the company in 2008, taking on various executive positions. He graduated from Bandung Institute of Technology with a Bachelor degree of Civil Engineering.
Angela Herliani Tanoesoedibjo
Director Mrs Angela Herliani Tanoesoedibjo was born in 1987. She was appointed as a Director of the company in September 2016. She previously occupied several executive positions, namely Director at PT MNI Entertainment (2011-2017), Deputy Director of MNC Channels (2013-2014), and Corporate Finance and Business Development Associate of PT Media Nusantara Citra (2010-2013). She completed her Master of Commerce degree in Finance from The University of New South Wales, Australia.
Gwenarty Setiadi Independent Director Mrs Gwenarty Setiadi was born in 1962. She was appointed as an Independent Director of the company in September 2016. Previously, she served multiple roles at Citibank between1998-2008 as Head of Recruitment and Training. She graduated from University of Satya Wacana with a Bachelor Degree of Agriculture.
Source: company

Page 39
Company Focus
Media Nusantara Citra
Competitive Strengths Prime time (PT) and all time (AT) audience shares. As of May 2018, MNCN controls market shares of 33.9% and 32.8% of PT and AT respectively. MNCN has the biggest market share in AT and PT through their three TV stations - RCTI, MNCTV and GTV.
All time (AT) audience share per group
Source: Nielsen
Prime time (PT) audience share per group
Source: Nielsen
Growth Strategies Boosting audience share. The improvement of MNCTV and GTV’s audience shares would remain a key growth area for MNCN in the next few years. The improvement in audience share would translate into a higher rate card.
Online content providers. Netflix, Iflix and Hooq are a few examples of SVoD players in Indonesia. Most of the SVoD players provide localised content bought from SCMA or MNCN, providing new revenue streams to offset the potential decline of advertising revenue in the future.
Key Risks
Soft ad spend growth. Ad spend growth is positively correlated to the GDP of Indonesia. In our base case, we assume 1.08x multiplier between ad spend/nominal GDP. Our multiplier is based on the assumption of the recovery of household consumption due to the election year. However, if household consumption does not recover as expected, there would be a risk of lower ad spend growth and TV players’ revenue growth in FY18F.
Sensitivity analysis on advertising spending (ad spend)
Source: World Bank, Nielsen, Companies, and DBSVI Weaker audience share. Ad spend growth is one of the key factors for the media industry’s growth. The other factor is audience share, as it impacts the rate card of media players. Normally, advertisers prefer to advertise their products on TV stations with strong and stable audience share. If SCMA fails to maintain its strong audience share, there is a possibility of a lower rate card and resulting in a lower revenue growth in FY18F.
Massive growth of online media. The massive growth of online media continues to become a challenge to traditional media industry’s ad spend growth going forward.
Digitalisation laws. Plans for new broadcasting laws related to analog-to-digital migration may also pose challenges for the media industry.
MNCN SCMA TRANS VIVAJan-17 35.5 24.0 14.0 23.1Feb-17 32.6 27.3 13.4 23.1Mar-17 33.2 29.1 14.3 20.2Apr-17 33.5 29.8 14.6 18.8May-17 35.5 28.1 14.6 18.3Jun-17 36.9 25.5 13.1 21.5Jul-17 33.7 26.9 14.1 22.4Aug-17 33.6 26.7 13.8 22.8Sep-17 33.4 27.6 14.4 21.8Oct-17 32.1 28.0 14.7 22.4Nov-17 30.9 29.1 15.5 21.6Dec-17 31.5 31.8 14.4 19.8Jan-18 31.9 32.8 13.2 19.7Feb-18 31.8 32.7 13.3 19.8Mar-18 31.1 32.4 13.2 21.2Apr-18 30.7 33.4 13.4 20.4May-18 32.8 31.0 12.3 21.3
MNCN SCMA TRANS VIVAJan-17 41.6 23.9 12.9 18.2Feb-17 38.0 29.7 11.1 17.6Mar-17 36.7 34.1 11.2 14.9Apr-17 37.7 34.0 10.7 14.4May-17 39.0 30.3 11.2 16.1Jun-17 41.1 25.8 9.8 20.3Jul-17 37.0 27.9 10.0 22.6Aug-17 37.8 26.7 10.4 22.0Sep-17 38.5 25.4 10.8 22.5Oct-17 36.2 25.5 11.1 24.7Nov-17 32.6 30.1 12.1 22.4Dec-17 31.3 36.4 11.5 18.4Jan-18 33.1 36.0 9.7 18.9Feb-18 33.1 35.5 10.1 19.1Mar-18 33.2 34.3 10.6 19.7Apr-18 32.2 35.2 11.0 19.5May-18 33.9 33.0 10.7 19.7
2015 2016 2017 2018F BEA R BA SE BULL
SCMA 4.5% 6.8% -1.6% 9.0% 6.0% 9.0% 12.0%
MNCN -3.3% 4.4% 4.8% 6.0% 4.0% 6.0% 8.0%
Ads spend average growth 7.5% 14.2% 7.9% 10.0% 7.2% 10.0% 12.0%
Indonesia nominal GDP 9.1% 7.6% 9.5% 9.3% 9.0% 9.3% 10.0%
x GDP 0.82 1.87 0.84 1.08 0.80 1.08 1.20
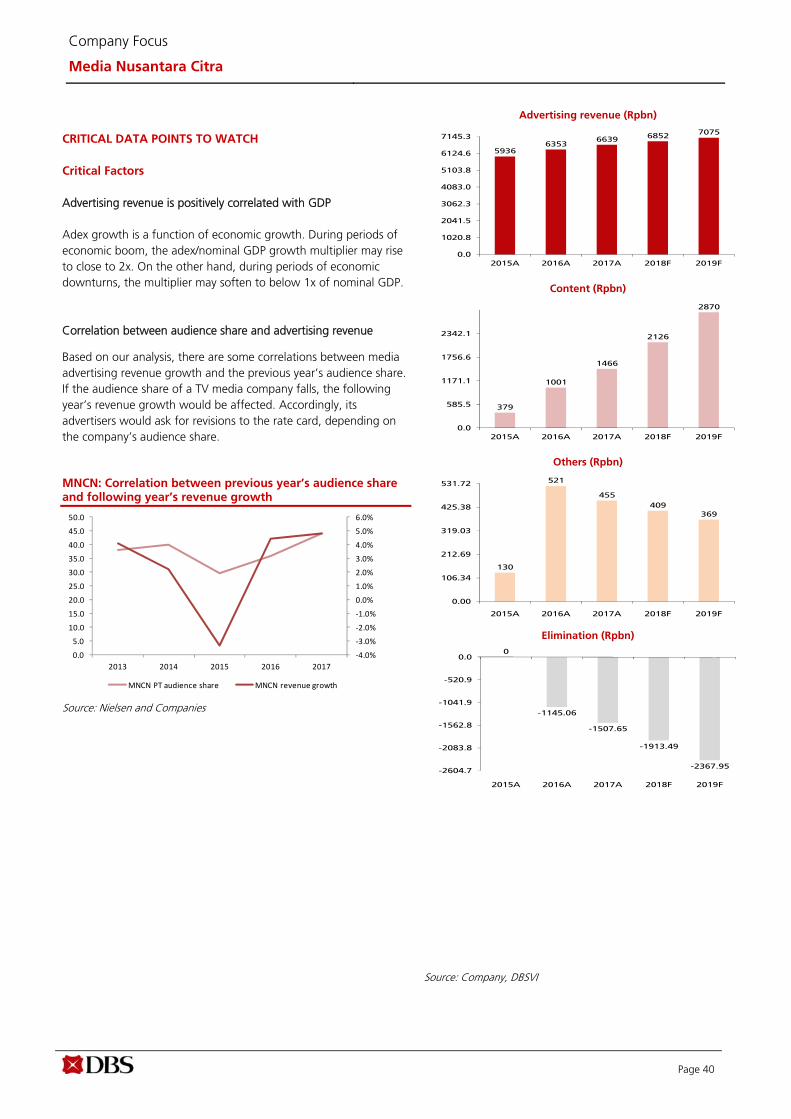
Page 40
Company Focus
Media Nusantara Citra
CRITICAL DATA POINTS TO WATCH
Critical Factors
Advertising revenue is positively correlated with GDP Adex growth is a function of economic growth. During periods of economic boom, the adex/nominal GDP growth multiplier may rise to close to 2x. On the other hand, during periods of economic downturns, the multiplier may soften to below 1x of nominal GDP. Correlation between audience share and advertising revenue
Based on our analysis, there are some correlations between media advertising revenue growth and the previous year’s audience share. If the audience share of a TV media company falls, the following year’s revenue growth would be affected. Accordingly, its advertisers would ask for revisions to the rate card, depending on the company’s audience share. MNCN: Correlation between previous year’s audience share and following year’s revenue growth
Source: Nielsen and Companies
‐4.0%
‐3.0%
‐2.0%
‐1.0%
0.0%
1.0%
2.0%
3.0%
4.0%
5.0%
6.0%
0.0
5.0
10.0
15.0
20.0
25.0
30.0
35.0
40.0
45.0
50.0
2013 2014 2015 2016 2017
MNCN PT audience share MNCN revenue growth
Advertising revenue (Rpbn)
Content (Rpbn)
Others (Rpbn)
Elimination (Rpbn)
Source: Company, DBSVI
59366353
66396852
7075
0.0
1020.8
2041.5
3062.3
4083.0
5103.8
6124.6
7145.3
2015A 2016A 2017A 2018F 2019F
379
1001
1466
2126
2870
0.0
585.5
1171.1
1756.6
2342.1
2015A 2016A 2017A 2018F 2019F
130
521
455
409
369
0.00
106.34
212.69
319.03
425.38
531.72
2015A 2016A 2017A 2018F 2019F
0
-1145.06
-1507.65
-1913.49
-2367.95-2604.7
-2083.8
-1562.8
-1041.9
-520.9
0.0
2015A 2016A 2017A 2018F 2019F
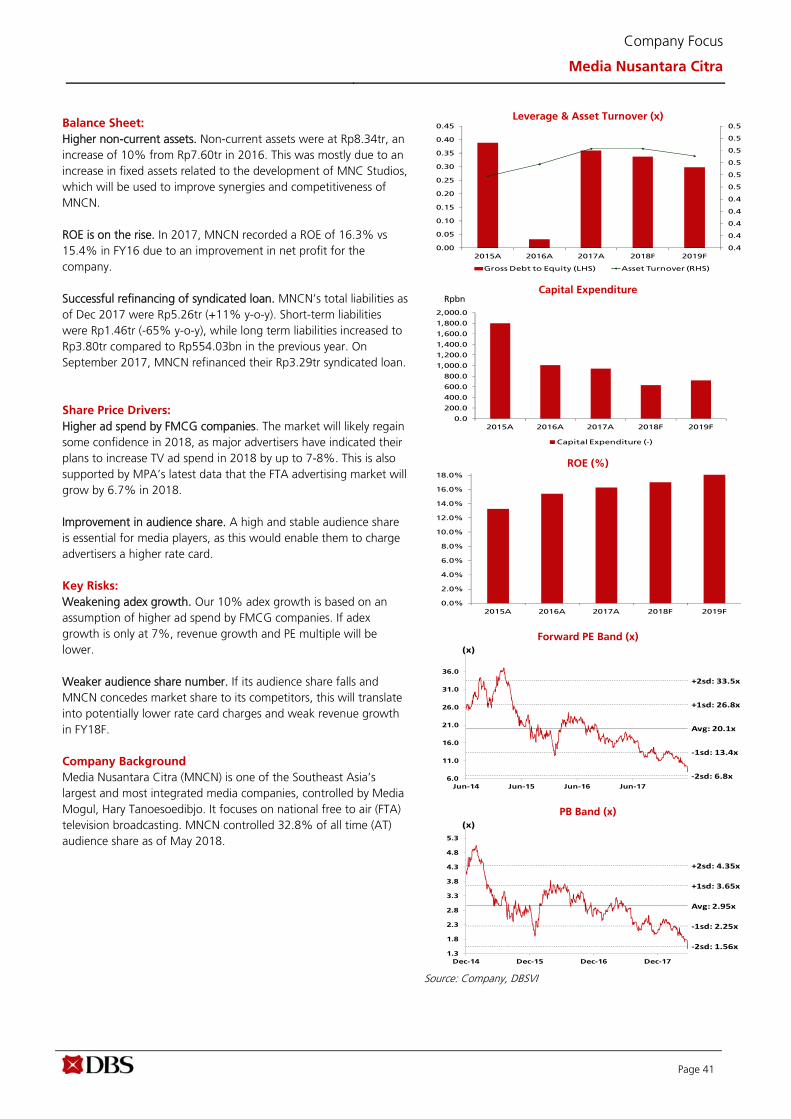
Page 41
Company Focus
Media Nusantara Citra
Balance Sheet:
Higher non-current assets. Non-current assets were at Rp8.34tr, an increase of 10% from Rp7.60tr in 2016. This was mostly due to an increase in fixed assets related to the development of MNC Studios, which will be used to improve synergies and competitiveness of MNCN. ROE is on the rise. In 2017, MNCN recorded a ROE of 16.3% vs 15.4% in FY16 due to an improvement in net profit for the company. Successful refinancing of syndicated loan. MNCN’s total liabilities as of Dec 2017 were Rp5.26tr (+11% y-o-y). Short-term liabilities were Rp1.46tr (-65% y-o-y), while long term liabilities increased to Rp3.80tr compared to Rp554.03bn in the previous year. On September 2017, MNCN refinanced their Rp3.29tr syndicated loan. Share Price Drivers:
Higher ad spend by FMCG companies. The market will likely regain some confidence in 2018, as major advertisers have indicated their plans to increase TV ad spend in 2018 by up to 7-8%. This is also supported by MPA’s latest data that the FTA advertising market will grow by 6.7% in 2018. Improvement in audience share. A high and stable audience share is essential for media players, as this would enable them to charge advertisers a higher rate card. Key Risks:
Weakening adex growth. Our 10% adex growth is based on an assumption of higher ad spend by FMCG companies. If adex growth is only at 7%, revenue growth and PE multiple will be lower. Weaker audience share number. If its audience share falls and MNCN concedes market share to its competitors, this will translate into potentially lower rate card charges and weak revenue growth in FY18F. Company Background
Media Nusantara Citra (MNCN) is one of the Southeast Asia’s largest and most integrated media companies, controlled by Media Mogul, Hary Tanoesoedibjo. It focuses on national free to air (FTA) television broadcasting. MNCN controlled 32.8% of all time (AT) audience share as of May 2018.
Leverage & Asset Turnover (x)
Capital Expenditure
ROE (%)
Forward PE Band (x)
PB Band (x)
Source: Company, DBSVI
0.4
0.4
0.4
0.4
0.4
0.5
0.5
0.5
0.5
0.5
0.5
0.00
0.05
0.10
0.15
0.20
0.25
0.30
0.35
0.40
0.45
2015A 2016A 2017A 2018F 2019F
Gross Debt to Equity (LHS) Asset Turnover (RHS)
0.0
200.0
400.0
600.0
800.0
1,000.0
1,200.0
1,400.0
1,600.0
1,800.0
2,000.0
2015A 2016A 2017A 2018F 2019F
Capital Expenditure (-)
Rpm
0.0%
2.0%
4.0%
6.0%
8.0%
10.0%
12.0%
14.0%
16.0%
18.0%
2015A 2016A 2017A 2018F 2019F
Avg: 20.1x
+1sd: 26.8x
+2sd: 33.5x
‐1sd: 13.4x
‐2sd: 6.8x6.0
11.0
16.0
21.0
26.0
31.0
36.0
Jun-14 Jun-15 Jun-16 Jun-17
(x)
Avg: 2.95x
+1sd: 3.65x
+2sd: 4.35x
‐1sd: 2.25x
‐2sd: 1.56x1.3
1.8
2.3
2.8
3.3
3.8
4.3
4.8
5.3
Dec-14 Dec-15 Dec-16 Dec-17
(x)
Rpbn

Page 42
Company Focus
Media Nusantara Citra
Key Assumptions
FY Dec 2014A 2015A 2016A 2017A 2018F 2019F Advertising revenue 6,580 5,936 6,353 6,639 6,852 7,075
Content 0.0 379 1,001 1,466 2,126 2,870
Others 85.5 130 521 455 409 369
Elimination 0.0 0.0 (1,145) (1,508) (1,913) (2,368)
Segmental Breakdown
FY Dec 2014A 2015A 2016A 2017A 2018F 2019F Revenues (Rpbn)
Advertising revenue 6,580 5,936 6,353 6,639 6,852 7,075
Content revenue 0.0 379 1,001 1,466 2,126 2,870
Others 85.5 130 521 455 409 369
Elimination 0.0 0.0 (1,145) (1,508) (1,913) (2,368)
Total 6,666 6,445 6,730 7,053 7,474 7,945
Source: Company, DBSVI
Elimination is due to sales of content to the internal companies

Page 43
Company Focus
Media Nusantara Citra
Income Statement (Rpbn)
FY Dec 2014A 2015A 2016A 2017A 2018F 2019F Revenue 6,666 6,445 6,730 7,053 7,474 7,945
Cost of Goods Sold (2,813) (2,861) (2,875) (2,670) (2,842) (3,015)
Gross Profit 3,853 3,584 3,856 4,382 4,631 4,930
Other Opng (Exp)/Inc (1,251) (1,390) (1,524) (1,716) (1,819) (1,934)
Operating Profit 2,602 2,194 2,332 2,666 2,813 2,996
Other Non Opg (Exp)/Inc (81.9) (372) 4.05 (0.3) (80.0) 0.0
Associates & JV Inc (6.2) (7.9) (25.2) (10.3) (10.3) (10.3)
Net Interest (Exp)/Inc 28.2 (133) (158) (240) (240) (240)
Exceptional Gain/(Loss) 0.0 0.0 0.0 0.0 0.0 0.0
Pre-tax Profit 2,542 1,681 2,153 2,416 2,482 2,746
Tax (660) (404) (670) (848) (745) (687)
Minority Interest (121) (91.3) (114) (114) (117) (130)
Preference Dividend 0.0 0.0 0.0 0.0 0.0 0.0
Net Profit 1,761 1,186 1,369 1,453 1,620 1,930
Net Profit before Except. 1,761 1,186 1,369 1,453 1,620 1,930
EBITDA 2,690 2,118 2,582 3,113 3,293 3,612
Growth
Revenue Gth (%) 80.4 (3.3) 4.4 4.8 6.0 6.3
EBITDA Gth (%) 44.5 (21.3) 21.9 20.6 5.8 9.7
Opg Profit Gth (%) 47.9 (15.7) 6.3 14.3 5.5 6.5
Net Profit Gth (Pre-ex) (%) 37.6 (32.7) 15.4 6.2 11.5 19.1
Margins & Ratio
Gross Margins (%) 57.8 55.6 57.3 62.1 62.0 62.0
Opg Profit Margin (%) 39.0 34.0 34.6 37.8 37.6 37.7
Net Profit Margin (%) 26.4 18.4 20.3 20.6 21.7 24.3
ROAE (%) N/A 13.3 15.4 16.3 17.0 18.1
ROA (%) N/A 8.4 9.5 9.9 10.4 11.5
ROCE (%) N/A 12.7 13.6 14.5 13.7 14.3
Div Payout Ratio (%) 42.4 154.1 88.7 58.4 46.4 43.4
Net Interest Cover (x) NM 16.5 14.8 11.1 11.7 12.5 Source: Company, DBSVI
Margins Trend
17.0%
22.0%
27.0%
32.0%
37.0%
2015A 2016A 2017A 2018F 2019F
Operating Margin % Net Income Margin %
Improvement in GPM was due to higher content from internal productions.
One-off non-cash expenses such as higher depreciation, tax credit write off due to tax amnesty, and forex gain and losses.
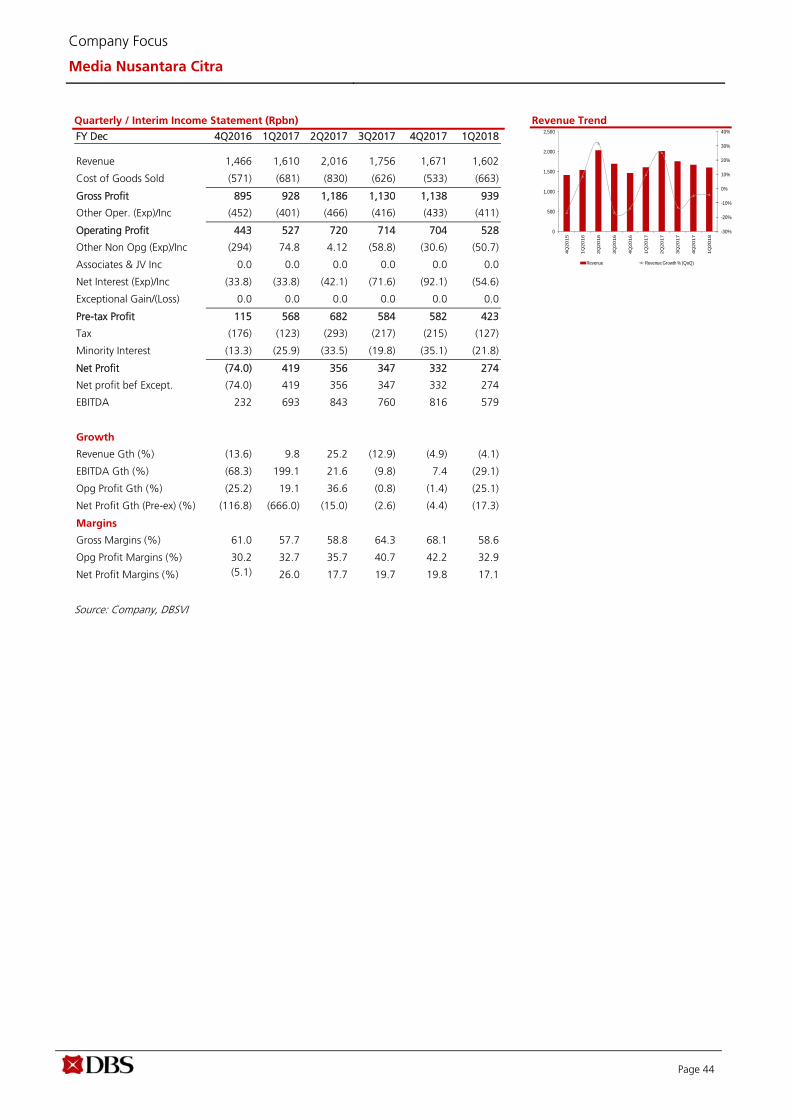
Page 44
Company Focus
Media Nusantara Citra
Quarterly / Interim Income Statement (Rpbn)
FY Dec 4Q2016 1Q2017 2Q2017 3Q2017 4Q2017 1Q2018 Revenue 1,466 1,610 2,016 1,756 1,671 1,602
Cost of Goods Sold (571) (681) (830) (626) (533) (663)
Gross Profit 895 928 1,186 1,130 1,138 939
Other Oper. (Exp)/Inc (452) (401) (466) (416) (433) (411)
Operating Profit 443 527 720 714 704 528
Other Non Opg (Exp)/Inc (294) 74.8 4.12 (58.8) (30.6) (50.7)
Associates & JV Inc 0.0 0.0 0.0 0.0 0.0 0.0
Net Interest (Exp)/Inc (33.8) (33.8) (42.1) (71.6) (92.1) (54.6)
Exceptional Gain/(Loss) 0.0 0.0 0.0 0.0 0.0 0.0
Pre-tax Profit 115 568 682 584 582 423
Tax (176) (123) (293) (217) (215) (127)
Minority Interest (13.3) (25.9) (33.5) (19.8) (35.1) (21.8)
Net Profit (74.0) 419 356 347 332 274
Net profit bef Except. (74.0) 419 356 347 332 274
EBITDA 232 693 843 760 816 579
Growth
Revenue Gth (%) (13.6) 9.8 25.2 (12.9) (4.9) (4.1)
EBITDA Gth (%) (68.3) 199.1 21.6 (9.8) 7.4 (29.1)
Opg Profit Gth (%) (25.2) 19.1 36.6 (0.8) (1.4) (25.1)
Net Profit Gth (Pre-ex) (%) (116.8) (666.0) (15.0) (2.6) (4.4) (17.3)
Margins
Gross Margins (%) 61.0 57.7 58.8 64.3 68.1 58.6
Opg Profit Margins (%) 30.2 32.7 35.7 40.7 42.2 32.9
Net Profit Margins (%) (5.1) 26.0 17.7 19.7 19.8 17.1
Revenue Trend
Source: Company, DBSVI
-30%
-20%
-10%
0%
10%
20%
30%
40%
0
500
1,000
1,500
2,000
2,500
4Q
20
15
1Q
20
16
2Q
20
16
3Q
20
16
4Q
20
16
1Q
20
17
2Q
20
17
3Q
20
17
4Q
20
17
1Q
20
18
Revenue Revenue Growth % (QoQ)

Page 45
Company Focus
Media Nusantara Citra
Balance Sheet (Rpbn)
FY Dec 2014A 2015A 2016A 2017A 2018F 2019F Net Fixed Assets 2,659 4,146 4,824 5,307 5,370 5,466
Invts in Associates & JVs 92.3 85.7 60.3 10.1 10.1 10.1
Other LT Assets 2,187 2,516 2,717 3,022 2,972 2,981
Cash & ST Invts 1,132 398 499 469 1,526 2,504
Inventory 1,635 1,593 1,950 2,359 2,293 2,433
Debtors 3,215 3,395 3,054 3,026 3,221 3,425
Other Current Assets 2,688 2,340 1,135 864 593 620
Total Assets 13,609 14,475 14,240 15,057 15,986 17,438
ST Debt
25.8 65.6 55.7 143 143 143
Creditor 475 603 435 740 625 663
Other Current Liab 392 371 3,709 576 329 332
LT Debt 3,135 3,649 252 3,387 3,541 3,541
Other LT Liabilities 188 219 302 410 410 410
Shareholder’s Equity 8,907 8,966 8,818 9,025 10,044 11,326
Minority Interests 486 601 669 776 894 1,024
Total Cap. & Liab. 13,609 14,475 14,240 15,057 15,986 17,438
Non-Cash Wkg. Capital 6,672 6,354 1,996 4,934 5,154 5,483
Net Cash/(Debt) (2,029) (3,316) 192 (3,061) (2,158) (1,180)
Debtors Turn (avg days) N/A 187.2 174.9 157.3 152.6 152.7
Creditors Turn (avg days) N/A 77.0 72.8 96.9 109.7 98.4
Inventory Turn (avg days) N/A 230.4 248.4 355.4 373.8 361.0
Asset Turnover (x) NM 0.5 0.5 0.5 0.5 0.5
Current Ratio (x) 9.7 7.4 1.6 4.6 7.0 7.9
Quick Ratio (x) 4.9 3.6 0.8 2.4 4.3 5.2
Net Debt/Equity (X) 0.2 0.3 CASH 0.3 0.2 0.1
Net Debt/Equity ex MI (X) 0.2 0.4 CASH 0.3 0.2 0.1
Capex to Debt (%) 41.0 48.5 328.5 26.7 17.2 19.6 Source: Company, DBSVI
Asset Breakdown
Net Fixed Assets -47.5%
Assocs'/JVs -0.1%
Bank, Cash and Liquid
Assets -4.2%
Inventory -21.1%
Debtors -27.1%

Page 46
Company Focus
Media Nusantara Citra
Cash Flow Statement (Rpbn)
FY Dec 2014A 2015A 2016A 2017A 2018F 2019F Pre-Tax Profit 2,542 1,681 2,153 2,416 2,482 2,746
Dep. & Amort. 176 304 271 458 571 626
Tax Paid (660) (404) (670) (848) (745) (687)
Assoc. & JV Inc/(loss) 0.0 0.0 0.0 0.0 0.0 0.0
Chg in Wkg.Cap. (779) (182) (204) (10.7) (315) (302)
Other Operating CF (181) (150) 416 183 (21.8) (26.8)
Net Operating CF 1,098 1,249 1,966 2,198 1,972 2,357
Capital Exp.(net) (1,296) (1,800) (1,011) (943) (634) (722)
Other Invts.(net) 0.0 0.0 0.0 0.0 0.0 0.0
Invts in Assoc. & JV 5.99 6.58 25.5 50.2 0.0 0.0
Div from Assoc & JV 0.0 0.0 0.0 0.0 0.0 0.0
Other Investing CF (1,446) 730 789 166 320 (9.1)
Net Investing CF (2,736) (1,064) (196) (727) (314) (731)
Div Paid (497) (888) (587) (587) (578) (648)
Chg in Gross Debt 2,667 575 (49.6) (9.0) (23.3) 0.0
Capital Issues 288 (230) (1,013) (666) 0.0 0.0
Other Financing CF (264) (377) (18.9) (239) 0.0 0.0
Net Financing CF 2,195 (919) (1,669) (1,501) (601) (648)
Currency Adjustments 0.0 0.0 0.0 0.0 0.0 0.0
Chg in Cash 557 (734) 101 (30.2) 1,057 978
Opg CFPS (Rp) 131 100 152 155 160 186
Free CFPS (Rp) (13.8) (38.6) 66.9 87.9 93.8 115 Source: Company, DBSVI
Capital Expenditure
0.0
200.0
400.0
600.0
800.0
1,000.0
1,200.0
1,400.0
1,600.0
1,800.0
2,000.0
2015A 2016A 2017A 2018F 2019F
Capital Expenditure (-)
RpmRpbn

Page 47
Company Focus
Media Nusantara Citra
Valuation Initiate coverage: BUY, TP Rp1,300. Our DCF-based TP of Rp1,300/share for MNCN assumes a WACC of 12.2% and terminal growth of 3%, with cash flow discounted back to FY25F. To arrive at our WACC of 12.2%, we assume a risk-free rate of 8%, market risk premium of 5%, and equity beta of 0.95. Our TP implies 11.5x FY18F PE which is
below its historical 8-year mean. Currently, the stock is trading at 8.8x FY18F PE (-2SD of its historical 8-year mean of 17.4x).
MNCN forward PE band
Source: Bloomberg Finance L.P. Data as of 21 June 2018
0
5
10
15
20
25
30
35
40
Jan‐10 Jan‐11 Jan‐12 Jan‐13 Jan‐14 Jan‐15 Jan‐16 Jan‐17 Jan‐18
P/E
MEAN
+1 STDEV
+2 STDEV
‐1 STDEV
‐2 STDEV

Industry Focus
Indonesia Media
Page 48
DBSVI recommendations are based an Absolute Total Return* Rating system, defined as follows:
STRONG BUY (>20% total return over the next 3 months, with identifiable share price catalysts within this time frame)
BUY (>15% total return over the next 12 months for small caps, >10% for large caps)
HOLD (-10% to +15% total return over the next 12 months for small caps, -10% to +10% for large caps)
FULLY VALUED (negative total return i.e. > -10% over the next 12 months)
SELL (negative total return of > -20% over the next 3 months, with identifiable catalysts within this time frame)
Share price appreciation + dividends
Completed Date: 25 Jun 2018 15:18:33 (WIB) Dissemination Date: 25 Jun 2018 15:43:04 (WIB)
Sources for all charts and tables are DBSVI unless otherwise specified.
GENERAL DISCLOSURE/DISCLAIMER
This report is prepared by PT DBS Vickers Sekuritas Indonesia (''DBSVI''). This report is solely intended for the clients of DBS Bank Ltd, its respective
connected and associated corporations and affiliates only and no part of this document may be (i) copied, photocopied or duplicated in any form
or by any means or (ii) redistributed without the prior written consent of PT DBS Vickers Sekuritas Indonesia (''DBSVI'').
The research set out in this report is based on information obtained from sources believed to be reliable, but we (which collectively refers to DBS
Bank Ltd, its respective connected and associated corporations, affiliates and their respective directors, officers, employees and agents (collectively,
the “DBS Group”) have not conducted due diligence on any of the companies, verified any information or sources or taken into account any other
factors which we may consider to be relevant or appropriate in preparing the research. Accordingly, we do not make any representation or
warranty as to the accuracy, completeness or correctness of the research set out in this report. Opinions expressed are subject to change without
notice. This research is prepared for general circulation. Any recommendation contained in this document does not have regard to the specific
investment objectives, financial situation and the particular needs of any specific addressee. This document is for the information of addressees
only and is not to be taken in substitution for the exercise of judgement by addressees, who should obtain separate independent legal or financial
advice. The DBS Group accepts no liability whatsoever for any direct, indirect and/or consequential loss (including any claims for loss of profit)
arising from any use of and/or reliance upon this document and/or further communication given in relation to this document. This document is not
to be construed as an offer or a solicitation of an offer to buy or sell any securities. The DBS Group, along with its affiliates and/or persons
associated with any of them may from time to time have interests in the securities mentioned in this document. The DBS Group, may have
positions in, and may effect transactions in securities mentioned herein and may also perform or seek to perform broking, investment banking and
other banking services for these companies.
Any valuations, opinions, estimates, forecasts, ratings or risk assessments herein constitutes a judgment as of the date of this report, and there can
be no assurance that future results or events will be consistent with any such valuations, opinions, estimates, forecasts, ratings or risk assessments.
The information in this document is subject to change without notice, its accuracy is not guaranteed, it may be incomplete or condensed, it may
not contain all material information concerning the company (or companies) referred to in this report and the DBS Group is under no obligation to
update the information in this report.
This publication has not been reviewed or authorized by any regulatory authority in Singapore, Hong Kong or elsewhere. There is no planned
schedule or frequency for updating research publication relating to any issuer.
The valuations, opinions, estimates, forecasts, ratings or risk assessments described in this report were based upon a number of estimates and
assumptions and are inherently subject to significant uncertainties and contingencies. It can be expected that one or more of the estimates on
which the valuations, opinions, estimates, forecasts, ratings or risk assessments were based will not materialize or will vary significantly from actual
results. Therefore, the inclusion of the valuations, opinions, estimates, forecasts, ratings or risk assessments described herein IS NOT TO BE RELIED
UPON as a representation and/or warranty by the DBS Group (and/or any persons associated with the aforesaid entities), that:
(a) such valuations, opinions, estimates, forecasts, ratings or risk assessments or their underlying assumptions will be achieved, and
(b) there is any assurance that future results or events will be consistent with any such valuations, opinions, estimates, forecasts, ratings or risk
assessments stated therein.
Please contact the primary analyst for valuation methodologies and assumptions associated with the covered companies or price targets.
Any assumptions made in this report that refers to commodities, are for the purposes of making forecasts for the company (or companies)
mentioned herein. They are not to be construed as recommendations to trade in the physical commodity or in the futures contract relating to the
commodity referred to in this report.

Industry Focus
Indonesia Media
Page 49
DBSVUSA, a US-registered broker-dealer, does not have its own investment banking or research department, has not participated in any public
offering of securities as a manager or co-manager or in any other investment banking transaction in the past twelve months and does not engage
in market-making.
ANALYST CERTIFICATION
The research analyst(s) primarily responsible for the content of this research report, in part or in whole, certifies that the views about the
companies and their securities expressed in this report accurately reflect his/her personal views. The analyst(s) also certifies that no part of his/her
compensation was, is, or will be, directly or indirectly, related to specific recommendations or views expressed in the report. The research analyst (s)
primarily responsible for the content of this research report, in part or in whole, certifies that he or his associate1 does not serve as an officer of the
issuer or the new listing applicant (which includes in the case of a real estate investment trust, an officer of the management company of the real
estate investment trust; and in the case of any other entity, an officer or its equivalent counterparty of the entity who is responsible for the
management of the issuer or the new listing applicant) and the research analyst(s) primarily responsible for the content of this research report or
his associate does not have financial interests2 in relation to an issuer or a new listing applicant that the analyst reviews. DBS Group has
procedures in place to eliminate, avoid and manage any potential conflicts of interests that may arise in connection with the production of
research reports. The research analyst(s) responsible for this report operates as part of a separate and independent team to the investment
banking function of the DBS Group and procedures are in place to ensure that confidential information held by either the research or investment
banking function is handled appropriately. There is no direct link of DBS Group's compensation to any specific investment banking function of the
DBS Group.
COMPANY-SPECIFIC / REGULATORY DISCLOSURES
1. DBS Bank Ltd, DBS HK, DBS Vickers Securities (Singapore) Pte Ltd (''DBSVS''), DBSV HK or their subsidiaries and/or other affiliates have a
proprietary position in Matahari Department Store recommended in this report as of 31 May 2018.
2. Neither DBS Bank Ltd, DBS HK nor DBSV HK market makes in equity securities of the issuer(s) or company(ies) mentioned in this Research
Report.
Compensation for investment banking services:
3. DBS Bank Ltd., DBSVS, their subsidiaries and/or other affiliates of DBSVUSA have received compensation, within the past 12 months for
investment banking services from Indofood Sukses Makmur as of 31 May 2018.
4. DBSVUSA does not have its own investment banking or research department, nor has it participated in any public offering of securities as a
manager or co-manager or in any other investment banking transaction in the past twelve months. Any US persons wishing to obtain further
information, including any clarification on disclosures in this disclaimer, or to effect a transaction in any security discussed in this document
should contact DBSVUSA exclusively.
Disclosure of previous investment recommendation produced:
5. DBS Bank Ltd, DBS Vickers Securities (Singapore) Pte Ltd (''DBSVS''), their subsidiaries and/or other affiliates may have published other
investment recommendations in respect of the same securities / instruments recommended in this research report during the preceding 12
months. Please contact the primary analyst listed in the first page of this report to view previous investment recommendations published by
DBS Bank Ltd, DBS Vickers Securities (Singapore) Pte Ltd (''DBSVS''), their subsidiaries and/or other affiliates in the preceding 12 months.
1 An associate is defined as (i) the spouse, or any minor child (natural or adopted) or minor step-child, of the analyst; (ii) the trustee of a trust of which the analyst, his
spouse, minor child (natural or adopted) or minor step-child, is a beneficiary or discretionary object; or (iii) another person accustomed or obliged to act in accordance with the directions or instructions of the analyst.
2 Financial interest is defined as interests that are commonly known financial interest, such as investment in the securities in respect of an issuer or a new listing applicant, or financial accommodation arrangement between the issuer or the new listing applicant and the firm or analysis. This term does not include commercial lending conducted at arm's length, or investments in any collective investment scheme other than an issuer or new listing applicant notwithstanding the fact that the scheme has investments in securities in respect of an issuer or a new listing applicant.

Industry Focus
Indonesia Media
Page 50
RESTRICTIONS ON DISTRIBUTION
General This report is not directed to, or intended for distribution to or use by, any person or entity who is a citizen or resident of or located in any locality, state, country or other jurisdiction where such distribution, publication, availability or use would be contrary to law or regulation.
Australia This report is being distributed in Australia by DBS Bank Ltd. (“DBS”) or DBS Vickers Securities (Singapore) Pte Ltd (“DBSVS”). DBS holds Australian Financial Services Licence no. 475946. DBSVS is exempted from the requirement to hold an Australian Financial Services Licence under the Corporation Act 2001 (“CA”) in respect of financial services provided to the recipients. DBSVS is regulated by the Monetary Authority of Singapore under the laws of Singapore, which differ from Australian laws. Distribution of this report is intended only for “wholesale investors” within the meaning of the CA.
Hong Kong This report has been prepared by an entity(ies) which is not licensed by the Hong Kong Securities and Futures Commission to carry on the regulated activity of advising on securities pursuant to the Securities and Futures Ordinance (Chapter 571 of the Laws of Hong Kong). This report is being distributed in Hong Kong and is attributable to DBS Vickers Hong Kong Limited, a licensed corporation licensed by the Hong Kong Securities and Futures Commission to carry on the regulated activity of advising on securities pursuant to the Securities and Futures Ordinance (Chapter 571 of the Laws of Hong Kong).
For any query regarding the materials herein, please contact Paul Yong (CE. No. ASE988) at [email protected].
Indonesia This report is being distributed in Indonesia by PT DBS Vickers Sekuritas Indonesia.
Malaysia This report is distributed in Malaysia by AllianceDBS Research Sdn Bhd ("ADBSR"). Recipients of this report, received from ADBSR are to contact the undersigned at 603-2604 3333 in respect of any matters arising from or in connection with this report. In addition to the General Disclosure/Disclaimer found at the preceding page, recipients of this report are advised that ADBSR (the preparer of this report), its holding company Alliance Investment Bank Berhad, their respective connected and associated corporations, affiliates, their directors, officers, employees, agents and parties related or associated with any of them may have positions in, and may effect transactions in the securities mentioned herein and may also perform or seek to perform broking, investment banking/corporate advisory and other services for the subject companies. They may also have received compensation and/or seek to obtain compensation for broking, investment banking/corporate advisory and other services from the subject companies.
Wong Ming Tek, Executive Director, ADBSR
Singapore This report is distributed in Singapore by DBS Bank Ltd (Company Regn. No. 196800306E) or DBSVS (Company Regn No.
198600294G), both of which are Exempt Financial Advisers as defined in the Financial Advisers Act and regulated by the Monetary Authority of Singapore. DBS Bank Ltd and/or DBSVS, may distribute reports produced by its respective foreign entities, affiliates or other foreign research houses pursuant to an arrangement under Regulation 32C of the Financial Advisers Regulations. Where the report is distributed in Singapore to a person who is not an Accredited Investor, Expert Investor or an Institutional Investor, DBS Bank Ltd accepts legal responsibility for the contents of the report to such persons only to the extent required by law. Singapore recipients should contact DBS Bank Ltd at 6327 2288 for matters arising from, or in connection with the report.
Thailand This report is being distributed in Thailand by DBS Vickers Securities (Thailand) Co Ltd.

Industry Focus
Indonesia Media
Page 51
United Kingdom
This report is produced by PT DBS Vickers Sekuritas Indonesia which is regulated by the Otoritas Jasa Keuangan (OJK). This report is disseminated in the United Kingdom by DBS Vickers Securities (UK) Ltd, ("DBSVUK"). DBSVUK is authorised and regulated by the Financial Conduct Authority in the United Kingdom. In respect of the United Kingdom, this report is solely intended for the clients of DBSVUK, its respective connected and associated corporations and affiliates only and no part of this document may be (i) copied, photocopied or duplicated in any form or by any means or (ii) redistributed without the prior written consent of DBSVUK. This communication is directed at persons having professional experience in matters relating to investments. Any investment activity following from this communication will only be engaged in with such persons. Persons who do not have professional experience in matters relating to investments should not rely on this communication.
Dubai International Financial Centre
This research report is being distributed by DBS Bank Ltd., (DIFC Branch) having its office at PO Box 506538, 3rd Floor, Building 3, East Wing, Gate Precinct, Dubai International Financial Centre (DIFC), Dubai, United Arab Emirates. DBS Bank Ltd., (DIFC Branch) is regulated by The Dubai Financial Services Authority. This research report is intended only for professional clients (as defined in the DFSA rulebook) and no other person may act upon it.
United Arab Emirates
This report is provided by DBS Bank Ltd (Company Regn. No. 196800306E) which is an Exempt Financial Adviser as defined in the Financial Advisers Act and regulated by the Monetary Authority of Singapore. This report is for information purposes only and should not be relied upon or acted on by the recipient or considered as a solicitation or inducement to buy or sell any financial product. It does not constitute a personal recommendation or take into account the particular investment objectives, financial situation, or needs of individual clients. You should contact your relationship manager or investment adviser if you need advice on the merits of buying, selling or holding a particular investment. You should note that the information in this report may be out of date and it is not represented or warranted to be accurate, timely or complete. This report or any portion thereof may not be reprinted, sold or redistributed without our written consent.
United States This report was prepared by PT DBS Vickers Sekuritas Indonesia (''DBSVI''). DBSVUSA did not participate in its preparation. The research analyst(s) named on this report are not registered as research analysts with FINRA and are not associated persons of DBSVUSA. The research analyst(s) are not subject to FINRA Rule 2241 restrictions on analyst compensation, communications with a subject company, public appearances and trading securities held by a research analyst. This report is being distributed in the United States by DBSVUSA, which accepts responsibility for its contents. This report may only be distributed to Major U.S. Institutional Investors (as defined in SEC Rule 15a-6) and to such other institutional investors and qualified persons as DBSVUSA may authorize. Any U.S. person receiving this report who wishes to effect transactions in any securities referred to herein should contact DBSVUSA directly and not its affiliate.
Other jurisdictions
In any other jurisdictions, except if otherwise restricted by laws or regulations, this report is intended only for qualified, professional, institutional or sophisticated investors as defined in the laws and regulations of such jurisdictions.

Industry Focus
Indonesia Media
Page 52
DBS Regional Research Offices HONG KONG DBS Vickers (Hong Kong) Ltd Contact: Paul Yong 18th Floor Man Yee Building 68 Des Voeux Road Central Central, Hong Kong Tel: 65 6878 8888 Fax: 65 65353 418 e-mail: [email protected] Participant of the Stock Exchange of Hong Kong
MALAYSIA AllianceDBS Research Sdn Bhd Contact: Wong Ming Tek (128540 U) 19th Floor, Menara Multi-Purpose, Capital Square, 8 Jalan Munshi Abdullah 50100 Kuala Lumpur, Malaysia. Tel.: 603 2604 3333 Fax: 603 2604 3921 e-mail: [email protected]
SINGAPORE DBS Bank Ltd Contact: Janice Chua 12 Marina Boulevard, Marina Bay Financial Centre Tower 3 Singapore 018982 Tel: 65 6878 8888 Fax: 65 65353 418 e-mail: [email protected] Company Regn. No. 196800306E
INDONESIA PT DBS Vickers Sekuritas (Indonesia) Contact: Maynard Priajaya Arif DBS Bank Tower Ciputra World 1, 32/F Jl. Prof. Dr. Satrio Kav. 3-5 Jakarta 12940, Indonesia Tel: 62 21 3003 4900 Fax: 6221 3003 4943 e-mail: [email protected]
THAILAND DBS Vickers Securities (Thailand) Co Ltd Contact: Chanpen Sirithanarattanakul 989 Siam Piwat Tower Building, 9th, 14th-15th Floor Rama 1 Road, Pathumwan, Bangkok Thailand 10330 Tel. 66 2 857 7831 Fax: 66 2 658 1269 e-mail: [email protected] Company Regn. No 0105539127012 Securities and Exchange Commission, Thailand