International E – Publication
101
International E – Publication www.isca.me ,www.isca.co.in
-
Upload
khangminh22 -
Category
Documents
-
view
0 -
download
0
Transcript of International E – Publication

International E – Publication
www.isca.me ,www.isca.co.in
PROCEEDINGS OF THE NATIONAL SEMINAR ON
IMPACT OF SCIENTIFIC ADVANCES ON SOCIETY,
ISAS-2015
St. Pious X Degree & PG College for Women, Nacharam,
Hyderabad-500076, INDIA
Editor-in-Chief: Dr. Mala Das Sharma
2015
International E - Publication
www.isca.me ,www.isca.co.in
International E - Publication 427, Palhar Nagar, RAPTC, VIP-Road, Indore-452005 (MP) INDIA
Phone: +91-731-2616100, Mobile: +91-80570-83382
E-mail: [email protected], Website:www.isca.me , www.isca.co.in
© Copyright Reserved
2015
All rights reserved. No part of this publication may be reproduced, stored, in a
retrieval system or transmitted, in any form or by any means, electronic,
mechanical, photocopying, reordering or otherwise, without the prior permission
of the publisher.
ISBN: 978-93-84648-95-4
Foreword
During the last two decades the world has seen tremendous advancement in the research areas
of science, in general, with special emphasis on certain areas that include space, communication,
medical, pharmaceutical, biological and material sciences. We, the Indians, are also involved in this
mission in a big way. As an educational institute of repute within the twin cities of Hyderabad and
Secunderabad, it has always been our endeavour to educate ourselves and our students with the
recent advancements in the field of science and technology. A look back into our earlier organized
seminar/workshop since 2005 onwards clearly brings out as to how the college is striving to make
an effort towards familiarizing the students about the thrust areas of research in different fields. The
present national seminar on “Impact of Scientific Advances on Society” is also organized with the
same broad objective. Further, such platform provides us (both teachers and students) an excellent
opportunity to interact, exchange ideas and information, and possibly work together on the topic of
mutual interest.
This time we are delighted to release the proceedings of the seminar with an ISBN generated
by the International E-Publication (Registered publisher under MHRD, Government of India). The
proceeding volume comprise of four abstracts of the invited talk and twenty-seven full length
papers contributed by the faculty and research scholars of different institutes. We received blessings
in the form of messages from several renowned personalities.
We offer our sincere thanks to Dr. Ch. Mohan Rao, Director, CCMB, Hyderabad for
accepting invitation to inaugurate this national seminar as the Chief Guest and agreeing to deliver
the keynote address. We express our gratitude to Prof. D. S. Ramesh, Director, IIG, Mumbai for
making our dream into reality by sponsoring this national seminar. We are also thankful to all the
invited speakers and other researchers, who have contributed their research findings for the
proceeding volume. We have provided the e-mail Ids of the authors to facilitate communication
between readers and authors.
We sincerely hope that the seminar would inspire many young student participants for
preferring a career in research and excel in their respective areas to fulfil the very purpose of
organizing this seminar.
Mala Das Sharma, R. Komala and C. Vanisree
Editorial Team

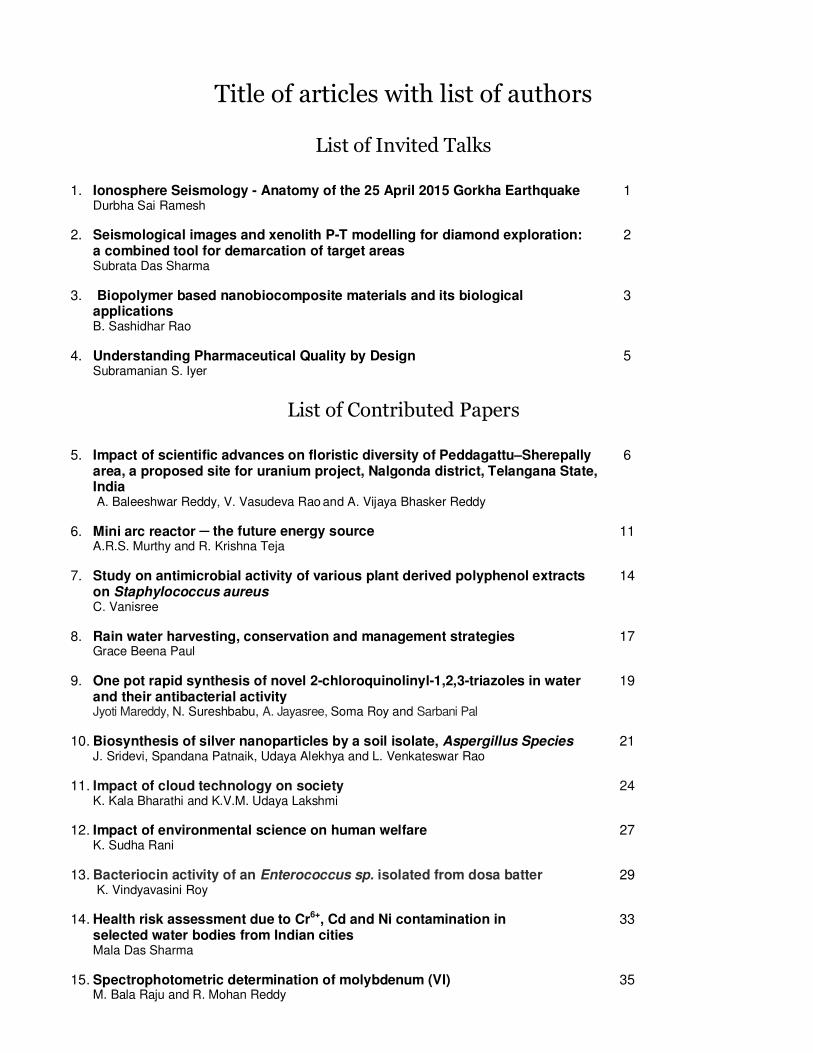
Title of articles with list of authors
List of Invited Talks
1. Ionosphere Seismology - Anatomy of the 25 April 2015 Gorkha Earthquake 1 Durbha Sai Ramesh
2. Seismological images and xenolith P-T modelling for diamond exploration: 2 a combined tool for demarcation of target areas Subrata Das Sharma
3. Biopolymer based nanobiocomposite materials and its biological 3 applications B. Sashidhar Rao
4. Understanding Pharmaceutical Quality by Design 5 Subramanian S. Iyer
List of Contributed Papers
5. Impact of scientific advances on floristic diversity of Peddagattu–Sherepally 6
area, a proposed site for uranium project, Nalgonda district, Telangana State, India A. Baleeshwar Reddy, V. Vasudeva Rao
and A. Vijaya Bhasker Reddy
6. Mini arc reactor ─ the future energy source 11 A.R.S. Murthy and R. Krishna Teja
7. Study on antimicrobial activity of various plant derived polyphenol extracts 14 on Staphylococcus aureus C. Vanisree
8. Rain water harvesting, conservation and management strategies 17 Grace Beena Paul
9. One pot rapid synthesis of novel 2-chloroquinolinyl-1,2,3-triazoles in water 19 and their antibacterial activity Jyoti Mareddy, N. Sureshbabu, A. Jayasree, Soma Roy and Sarbani Pal
10. Biosynthesis of silver nanoparticles by a soil isolate, Aspergillus Species 21 J. Sridevi, Spandana Patnaik, Udaya Alekhya and L. Venkateswar Rao
11. Impact of cloud technology on society 24 K. Kala Bharathi and K.V.M. Udaya Lakshmi
12. Impact of environmental science on human welfare 27 K. Sudha Rani
13. Bacteriocin activity of an Enterococcus sp. isolated from dosa batter 29 K. Vindyavasini Roy
14. Health risk assessment due to Cr6+, Cd and Ni contamination in 33 selected water bodies from Indian cities Mala Das Sharma
15. Spectrophotometric determination of molybdenum (VI) 35 M. Bala Raju and R. Mohan Reddy
16. Kinetics and mechanism of protection of uridine-3´-monophosphate 40 from sulphate radical anion by caffeic acid under anoxic conditions
Midudhula Sudha Swarga and Adinarayana Mundra
17. Synthesis and comparative studies of Sr2CeO4:Eu phosphor 45 Paleena Thulimilli, M. Sangeetha, N.V. Poornachandra Rao and K.V.R. Murthy
18. Isolation and identification of microbial community in coal mine dust 49 of SCCL, Godavarikhani P. Jyothi Chaitanya, Dhatri Madduru, J.Sri Devi and N. Lakshmi Bhavani
19. Assessment of various phytochemicals and antimicrobial activity of 52 fenugreek (trigonella foenum-graecum): a common Indian spice P. Jyothi Chaitanya, B. Vijaya Lakshmi and N. Lakshmi Bhavani
20. Impact of scientific advancement on the health of the modern society 56 P. U. V. N. Manendra Rao
21. Environmentally benign click assisted synthesis and antiproliferative 58 activity study of triazole-oxadiazole conjugates P. Neeraja, S, Srinivas, K. Mukkanti, P. K. Dubey and S. Pal
22. Early detection of electrical problems through infrared thermography 61 Pooja Das Sharma
23. Drug resistance and plasmid profiling of Pseudomonas isolated from 64 Hyderabad regions Pritha Ghosh
24. Growth of mobile applications and its impact 68 P. Soumya Sree Laxmi and K. Sandhya Sree
25. Point spread function of asymmetrically apodized slit aperture 71 R. Komala and P. Sangeetha Lakshmi
26. Determination of sodium metal ions in various junk foods by 73 flame photometry Rani Padmini
27. Delusional disorder: an altered perception 75 Sikta Bandopadhyay
28. Utility of viral load in antiretroviral therapy 78 Sri Laxmi Kandula
29. Positive impact of PSB biofertilisers in agriculture 80 S. Sreedevi
30. Leveraging mobile cloud computing through unwanted desktop-pc 83 resources Sujanavan Tiruvayipati
and Ravi Thubati
31. Antibacterial effect of Coleus amboinicus leaf extract 86 Vasavi Dathar, Revathi Desai and Pavan Kumar Pindi
Proceedings of the National Seminar on "Impact of Scientific Advances on Society", August 18-19, 2015, p.1-1
St. Pious X Degree & PG College for Women, Hyderabad-500076.
Sponsored by the Indian Institute of Geomagnetism, Navi Mumbai-410218 (DST, Govt. of India)
Ionosphere Seismology - Anatomy of the 25 April 2015 Gorkha Earthquake
Durbha Sai Ramesh*
Indian Institute of Geomagnetism Navi Mumbai-410218, India *[email protected]
Earth and its near space environment consisting of the atmosphere and Ionosphere are coupled
systems and therefore processes that operate in either domain largely influence the other. This can be
both an opportunity and an obstacle based on the experiment designed to understand this coupling. The
ionosphere is perhaps one of the most dynamic elements of such a vibrant system. The Ionosphere is
affected by a variety of disturbances - e.g. severe magnetic storms, weather, volcanic eruptions, earth-
quakes etc. Therefore the forcing on the ionosphere can be of varied origin - from above (solar) and
below (lithosphere). For example, disturbances that nucleate from below, follow the mechanical or
chemical pathways to propagate into the ionosphere to interact with the ionised gas and alter the elec-
tron density there. Exponential decrease of atmospheric density with altitude results in anomalous am-
plification of these upward propagating waves (disturbances) by a factor 105 - 10
6 following the re-
quirement of energy conservation. Thus even mm - cm scale disturbances in the neutral atmosphere
and ground level become observable at ionospheric altitudes. This characteristic property is exploited
to monitor earthquakes from Space using tools such as Global Positioning System (GPS) and Synthetic
Aperture Radar Interferometry (InSAR).
Earthquake related vertical and horizontal surface displacements induce infrasonic pressure
waves in the vicinity of neutral atmosphere and travel as acoustic gravity waves to perturb total elec-
tron content (TEC) in the ionosphere. Similarly, horizontally propagating surface waves (e.g. Rayleigh
wave) also effect the TEC. The ionospheric disturbances triggered by earthquakes are called coseismic
ionospheric disturbances (CIDs). Deploying dense networks of GPS, variations in TEC induced by
CIDs are recorded. The TEC can therefore act as proxies to ionospheric disturbances excited by earth-
quakes. From these observations several characteristics of the earthquakes can be distilled in a refined
manner compared to ground based instrumentation such as the seismometers. This in essence is the
emerging field of “Ionosphere Seismology”. Further, Space based observation tools add a new dimen-
sion to earthquake precursory research that is hitherto unexplored by seismologists to realise its poten-
tial. In this context, some fresh insights related to the recent Gorkha (Nepal) earthquake are presented
here.
However, the challenge is to unambiguously recognise and associate variations in measured TEC
values to earthquakes occurrence rather than other competing candidate forcings from above and be-
low.
dsramesh
Typewritten Text
dsramesh
Typewritten Text
1
dsramesh
Typewritten Text
Proceedings of the National Seminar on "Impact of Scientific Advances on Society", August 18-19, 2015, p.2-2
St. Pious X Degree & PG College for Women, Hyderabad-500076.
Sponsored by the Indian Institute of Geomagnetism, Navi Mumbai-410218 (DST, Govt. of India)
Seismological images and xenolith P-T modelling for diamond exploration: a combined tool for demarcation of target areas
Subrata Das Sharma*
National Geophysical Research Institute
(Council of Scientific & Industrial Research)
Uppal Road, Hyderabad-500007, India *[email protected]
Geophysical signatures per se are of extreme value. However, their interpretation needs to be sup-
ported by relevant geological, geochemical and geochronological results in order to reduce the ambiguity
associated with the evolution of a region. Understanding the tectonic make up of an area through study of
surface geological features together with depth information on the nature of the underlying lithosphere
forms the key to diamond exploration strategy. Although diamonds have been reported from the Indian
craton for many centuries, search for their carrier rocks dates back only to the beginning of 20th century.
This study focuses on a wide area in southeast India, parts of which are bestowed with both diamondifer-
ous and non-diamondiferous source rocks like the kimberlites and lamproites.
Using special processing techniques for analyzing earthquake data, called the Ps (SV and SH) and Sp
receiver function techniques, we recover depth images of the lithospheric mantle beneath southeast India
encompassing a wide region. These images reveal presence of two significant velocity anomalies of con-
trasting nature at different depths beneath the study region. High velocity features are observed between
160 and 220 km depth (popularly known amongst the geophysicists as the Lehmann discontinuity or L-
boundary) while a complex low velocity contrast layer (LVZ) is delineated at ~ 80-100 km depth. Analy-
ses of results from several other studies that include regional geology, geophysics, geochemistry, and geo-
chronology allow us to infer that the positive velocity contrasts at L-boundary represent preserved oceanic
remnants of a ~1.6 Ga old paleosubduction event in southeast India. Computations of pressure-
temperature data on suitable rocks (called mantle xenoliths) in conjunction with multiple evidences pre-
sented in this study argue that the craton beneath southeast India is underlain by a thick lithospheric
root/keel in excess of 200 km. This suggests an environment conducive for diamond stability. Our trans-
verse component receiver functions (SH) bear remarkable similarity in shallow mantle stratification with
that of the kimberlite bearing Slave craton in Canada, which has confirmed presence of diamonds accom-
panied by a thick lithospheric keel.
The results obtained from this study together with several other lines of evidences collectively reaf-
firm that the shield areas/cratons beneath southeast India have deep keels associated with low geothermal
gradient which are indeed the potential regions where the diamond crystals remain stable. Such a P-T en-
vironment is referred in the literature as the diamond 'storage area'. Wide regions covering the Godavari
graben and adjoining areas, besides a few others, are identified as potential zones for diamond exploration
endeavours. Initiation of concerted efforts in these regions might prove extremely rewarding. Search for
new indicator minerals that are stable within the stability field of diamond and dominantly defined by
subduction related process that possibly operated over an area in excess of 2 × 10⁵ km
2 holds the key to
realize the unrealized potential of the study region in terms of diamond exploration.
dsramesh
Typewritten Text
2
Proceedings of the National Seminar on "Impact of Scientific Advances on Society", August 18-19, 2015, p.3-4
St. Pious X Degree & PG College for Women, Hyderabad-500076.
Sponsored by the Indian Institute of Geomagnetism, Navi Mumbai-410218 (DST, Govt. of India)
Biopolymer based nanobiocomposite materials and its biological applications
B. Sashidhar Rao*
Department of Biochemistry, UCS Osmania University, Hyderabad-500007, India *[email protected]
Nanotechnology is a branch of science and technology that deals with materials having dimension
less than 100 nm. The term nano originated from the Greek word ‘ nanos’ which means ‘dwarf’. The de-
finition of a nanoparticle is an aggregate of atoms bonded together with a radius between 1 and 100 nm.
Hence, nanoscience deals with very small (one billionth of a meter) objects that have a wide range of ap-
plications in various fields such as electronics, optical communications, agricultural, food and biological
systems, especially as biosensors, antimicrobials, catalysts, drug delivery and other biomedical areas.
Their physical properties, huge surface area and small size offer numerous functionalities. It is pertinent to
note that Richard P. Feynman (Nobel Laureate in Physics, 1965) is often credited for introducing the con-
cept of nanotechnology about five decades ago.
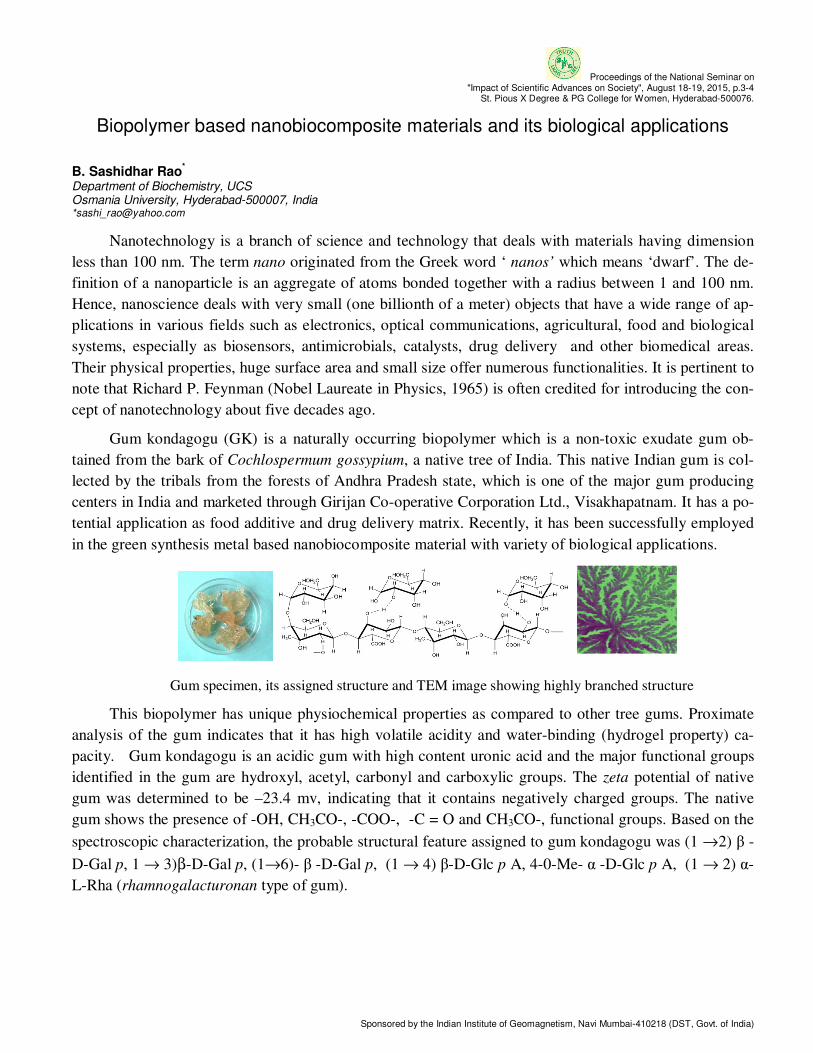
Gum kondagogu (GK) is a naturally occurring biopolymer which is a non-toxic exudate gum ob-
tained from the bark of Cochlospermum gossypium, a native tree of India. This native Indian gum is col-
lected by the tribals from the forests of Andhra Pradesh state, which is one of the major gum producing
centers in India and marketed through Girijan Co-operative Corporation Ltd., Visakhapatnam. It has a po-
tential application as food additive and drug delivery matrix. Recently, it has been successfully employed
in the green synthesis metal based nanobiocomposite material with variety of biological applications.
Gum specimen, its assigned structure and TEM image showing highly branched structure
This biopolymer has unique physiochemical properties as compared to other tree gums. Proximate
analysis of the gum indicates that it has high volatile acidity and water-binding (hydrogel property) ca-
pacity. Gum kondagogu is an acidic gum with high content uronic acid and the major functional groups
identified in the gum are hydroxyl, acetyl, carbonyl and carboxylic groups. The zeta potential of native
gum was determined to be –23.4 mv, indicating that it contains negatively charged groups. The native
gum shows the presence of -OH, CH3CO-, -COO-, -C = O and CH3CO-, functional groups. Based on the
spectroscopic characterization, the probable structural feature assigned to gum kondagogu was (1 →2) β -
D-Gal p, 1 → 3)β-D-Gal p, (1→6)- β -D-Gal p, (1 → 4) β-D-Glc p A, 4-0-Me- α -D-Glc p A, (1 → 2) α-
L-Rha (rhamnogalacturonan type of gum).
dsramesh
Typewritten Text
3
Proceedings of the National Seminar on "Impact of Scientific Advances on Society", August 18-19, 2015, p.3-4
St. Pious X Degree & PG College for Women, Hyderabad-500076.
Sponsored by the Indian Institute of Geomagnetism, Navi Mumbai-410218 (DST, Govt. of India)
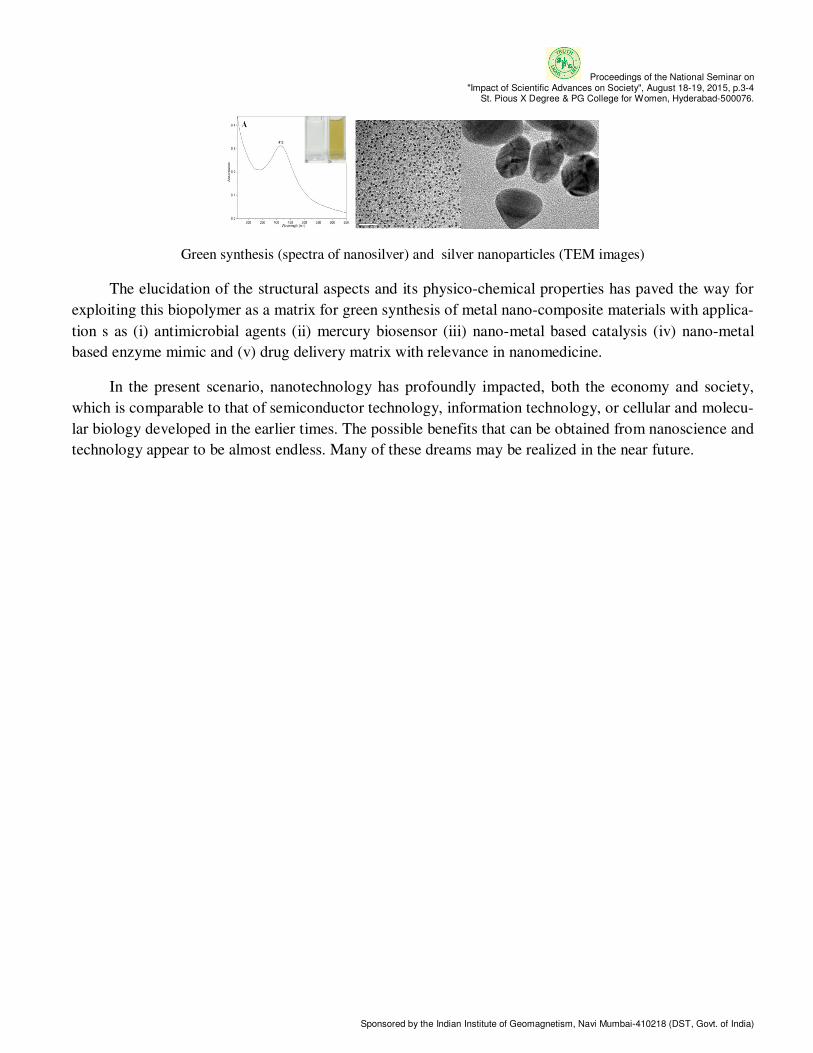
Green synthesis (spectra of nanosilver) and silver nanoparticles (TEM images)
The elucidation of the structural aspects and its physico-chemical properties has paved the way for
exploiting this biopolymer as a matrix for green synthesis of metal nano-composite materials with applica-
tion s as (i) antimicrobial agents (ii) mercury biosensor (iii) nano-metal based catalysis (iv) nano-metal
based enzyme mimic and (v) drug delivery matrix with relevance in nanomedicine.
In the present scenario, nanotechnology has profoundly impacted, both the economy and society,
which is comparable to that of semiconductor technology, information technology, or cellular and molecu-
lar biology developed in the earlier times. The possible benefits that can be obtained from nanoscience and
technology appear to be almost endless. Many of these dreams may be realized in the near future.
dsramesh
Typewritten Text
4
Proceedings of the National Seminar on "Impact of Scientific Advances on Society", August 18-19, 2015, p.5-5
St. Pious X Degree & PG College for Women, Hyderabad-500076.
Sponsored by the Indian Institute of Geomagnetism, Navi Mumbai-410218 (DST, Govt. of India)
Understanding Pharmaceutical Quality by Design
Subramanian S. Iyer*
Mylan Laboratories Ltd. Hyderabad, India *[email protected]
“Quality by design (QbD),” although a new concept to the pharmaceutical industry, has been in
existence for quite a few years, extensively applied in the automotive, the semiconductor, and the pe-
trochemical industry. QbD fundamentally means building Quality in. The implementation of QbD
principles provides a cost-efficient approach to delivering high quality medicines for patients. It is a
risk management and science-based approach promoted by the United States Food and Drug Adminis-
tration to enhance pharmaceutical development throughout a product’s life cycle. The endeavor of the
presenter is to give an overview of the QbD elements and its likely benefits to Indian pharmaceutical
industry.
dsramesh
Typewritten Text
5
dsramesh
Typewritten Text
Proceedings of the National Seminar on "Impact of Scientific Advances on Society", August 18-19, 2015, p.6-10
St. Pious X Degree & PG College for Women, Hyderabad-500076.
Sponsored by the Indian Institute of Geomagnetism, Navi Mumbai-410218 (DST, Govt. of India)
Impact of scientific advances on floristic diversity of Peddagattu–Sherepally area, a proposed site for uranium project, Nalgonda district, Telangana State, India
A. Baleeshwar Reddy1, V. Vasudeva Rao
2 and A.
Vijaya Bhasker Reddy1,*
1Department of Botany, Osmania University, Hyderabad-500
007, Telangana State, India 2AINP on Vertebrate Pest Management, Prof. Jayashankar
Telangana State Agricultural University, Rajendranagar, Hyderabad- 500030, Telangana State, India *[email protected]
ABSTRACT
The study was carried out in order to explore the existing
floristic composition in Pedagattu- Sherepally area, Nal-
gonda district, Telangana state, which is a proposed site for
uranium project. The study area harbours 464 species under 324 genera and 86 families. Of the total 464 species,
dicotyledons are represented by 373 species belonging to
258 genera under 70 families and 89 monocotyledon species belonging to 64 genera and 14 families. Habit-wise
analysis showed that herbs are the most predominated
species followed by shrubs, trees, aquatic forms and
climbers. The family Poaceae is the dominated family followed by Fabaceae, Asteraceae, Caesalpiniaceae,
Euphorbiaceae and Acanthaceae. The present study col-
lected a total 21 endemic species belonging to 19 genera and 12 families and total of 83 medicinal plant species
belonging to 43 families and 73 genera were recorded. The
flora of the study area would be affected and altered in case the proposed site for uranium project comes to exist.
Keywords: Species richness, generic coefficient, uranium projects
1. INTRODUCTION
Power generation is an essential pre-requisite for es-
tablishment of a strong industrial base and infrastructural
development. In this regard, availability of nuclear fuel,
in the wake of over stress on other power resources, for continuous production of nuclear energy is a crucial and
essential factor. Uranium Corporation of India Limited
(UCIL) is undertaking mining and processing of Ura-nium ore on large scale and it is expanding its operation
in Nalgonda District of Telangana state, which is en-
dowed with huge uranium deposits. Jaduguda in Singhbhum Thrust Belt (in the state of Jharkhand) is the
first uranium deposit to be discovered in the country in
1951 [1]. This discovery of uranium at Jaduguda in this
belt paved the way for intensive exploration work and soon a few more deposits were brought to light in this
area [1]. Some of these deposits like Bhatin, Narwapahar
and Turamdih are well known uranium mines of the
country. Apart from discoveries in the Singhbhum
Thrust Belt, several uranium occurrences have also been
found in Cuddapah basin of Andhra Pradesh and Telan-gana. These include Lambapur-Peddagattu, Chitrial,
Kuppunuru, Tumallapalle, Rachakuntapalle which have
significantly contributed towards the uranium reserve base of India.
Uranium processing plant has been planned in Shere-
pally area, Nalgonda district to treat the ore of Lamba-pur-Peddagattu mines. The plant site is about 54 km
away from Lambapur area as there are some environ-
mentally sensitive places around the mine site. The
design philosophy of this plant is similar to the processing practices proposed at Turamidh plant. Latest
equipment and degree of instrumentation similar to the
ones proposed at Turamdih, will also be adopted in Sherepally plant [1]. However, the sizing of these
equipment and provisions of flexibility to allow alternate
Processing technology to accommodate unexpected ore characteristics will be the vital aspects for Sherepally
plant [1].
Floristic study is need for sustainable development
activities for any area. In floristic diversity, the concept of species richness is one of the oldest and most funda-
mental concepts [2] that was first coined by McIntosh
[3]. Species richness can refer to the number of species present in a given area or in a given sample, without
considering the number of individuals examined in each
species [4]. Species richness can be numerical [5] or be
related to species density in an area [6]. Species richness is the simplest way to describe community and regional
diversity [7], and this variable i.e. number of species,
forms the basis of many ecological models of communi-ty structure [8-10].
Biodiversty measures (species diversity and species
richness ) have been widely used as indicators of ecosys-tem status, and play a critical role in studies dealing with
the assessment of human impact on ecological systems
[11]. However, since the biodiversity of any ecosystem
is far too complex to be comprehensively quantified, suitable indicators [12] or surrogates [13] of biodiversity
are needed. Conceptually, species richness appears as the
most intuitive and straightforward parameter to measure biodiversity [14]. Nonetheless, for several reasons, to
determine the true species richness of a community is not
an easy task [15]. Hence, in the present study different non-parametric species richness estimators are used to
dsramesh
Typewritten Text
6
Proceedings of the National Seminar on "Impact of Scientific Advances on Society", August 18-19, 2015, p.6-10
St. Pious X Degree & PG College for Women, Hyderabad-500076.
Sponsored by the Indian Institute of Geomagnetism, Navi Mumbai-410218 (DST, Govt. of India)
estimate the true number of species found in Peddagattu- Sherepally area, a proposed site for uranium projects.
2. MATERIALS AND METHOD
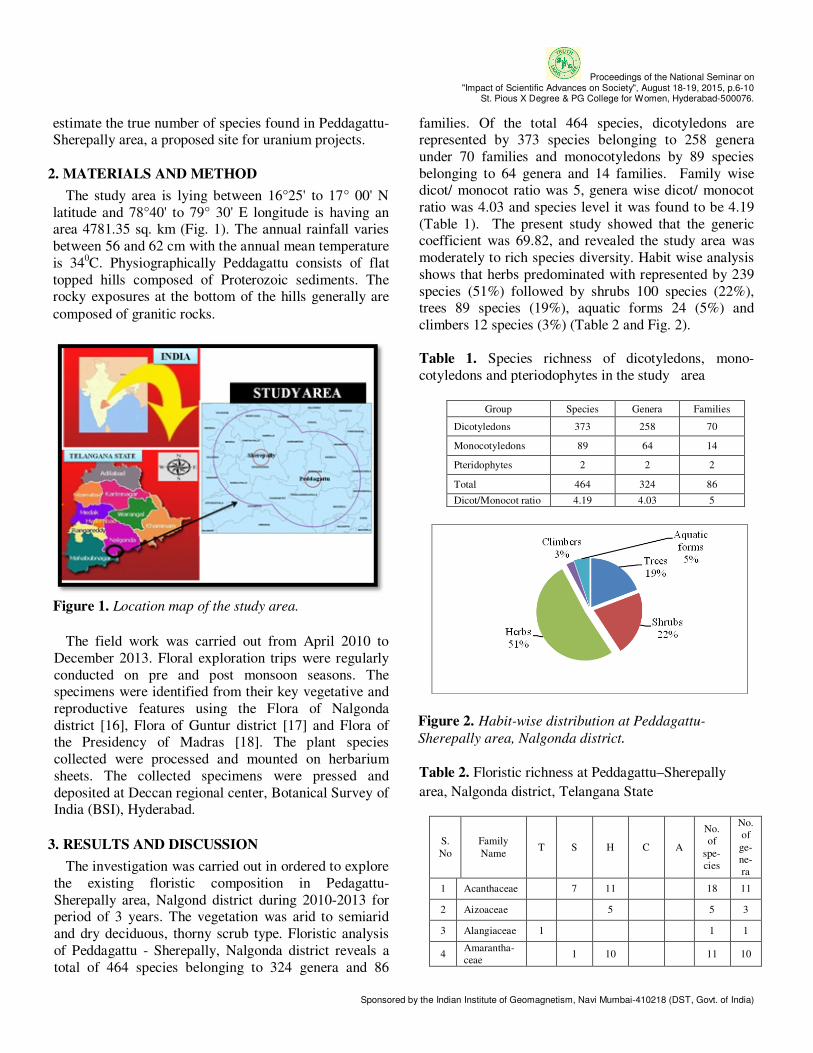
The study area is lying between 16°25' to 17° 00' N
latitude and 78°40' to 79° 30' E longitude is having an area 4781.35 sq. km (Fig. 1). The annual rainfall varies
between 56 and 62 cm with the annual mean temperature
is 340C. Physiographically Peddagattu consists of flat
topped hills composed of Proterozoic sediments. The rocky exposures at the bottom of the hills generally are
composed of granitic rocks.
Figure 1. Location map of the study area.
The field work was carried out from April 2010 to
December 2013. Floral exploration trips were regularly
conducted on pre and post monsoon seasons. The specimens were identified from their key vegetative and
reproductive features using the Flora of Nalgonda
district [16], Flora of Guntur district [17] and Flora of the Presidency of Madras [18]. The plant species
collected were processed and mounted on herbarium
sheets. The collected specimens were pressed and
deposited at Deccan regional center, Botanical Survey of India (BSI), Hyderabad.
3. RESULTS AND DISCUSSION
The investigation was carried out in ordered to explore
the existing floristic composition in Pedagattu-
Sherepally area, Nalgond district during 2010-2013 for period of 3 years. The vegetation was arid to semiarid
and dry deciduous, thorny scrub type. Floristic analysis
of Peddagattu - Sherepally, Nalgonda district reveals a
total of 464 species belonging to 324 genera and 86
families. Of the total 464 species, dicotyledons are represented by 373 species belonging to 258 genera
under 70 families and monocotyledons by 89 species
belonging to 64 genera and 14 families. Family wise dicot/ monocot ratio was 5, genera wise dicot/ monocot
ratio was 4.03 and species level it was found to be 4.19
(Table 1). The present study showed that the generic coefficient was 69.82, and revealed the study area was
moderately to rich species diversity. Habit wise analysis
shows that herbs predominated with represented by 239
species (51%) followed by shrubs 100 species (22%), trees 89 species (19%), aquatic forms 24 (5%) and
climbers 12 species (3%) (Table 2 and Fig. 2).
Table 1. Species richness of dicotyledons, mono-
cotyledons and pteriodophytes in the study area
Group Species Genera Families
Dicotyledons 373 258 70
Monocotyledons 89 64 14
Pteridophytes 2 2 2
Total 464 324 86
Dicot/Monocot ratio 4.19 4.03 5
Figure 2. Habit-wise distribution at Peddagattu-
Sherepally area, Nalgonda district.
Table 2. Floristic richness at Peddagattu–Sherepally
area, Nalgonda district, Telangana State
S.
No
Family
Name T S H C A
No.
of
spe-
cies
No.
of
ge-
ne-
ra
1 Acanthaceae
7 11
18 11
2 Aizoaceae
5
5 3
3 Alangiaceae 1
1 1
4 Amarantha-
ceae 1 10
11 10
dsramesh
Typewritten Text
7

Proceedings of the National Seminar on "Impact of Scientific Advances on Society", August 18-19, 2015, p.6-10
St. Pious X Degree & PG College for Women, Hyderabad-500076.
Sponsored by the Indian Institute of Geomagnetism, Navi Mumbai-410218 (DST, Govt. of India)
5 Amaryllida-
ceae 1 1
2 2
6 Anacardia-
ceae 2
2 2
7 Annonaceae 3
3 2
8 Apocyna-
ceae 4 4 2 1
11 9
9 Aponogeto-
naceae 1
1 1
10 Araceae
1 1 1
11 Arecaceae 3
3 3
12 Aristolo-
chiaceae 1
1 1
13 Asclepiada-
ceae 8 2 1
11 10
14 Asteraceae
1 20
21 20
15 Bignonia-
ceae 4
4 4
16 Boragina-
ceae 3
5
8 4
17 Cactaceae
3
3 2
18 Caesalpinia-
ceae 11 7 3
21 11
19 Cannaceae
1
1 1
20 Capparaceae 1 3 7
11 4
21 Caricaceae 1
1 1
22 Caryophyl-
laceae 1
1 1
23 Casuarina-
ceae 1
1 1
24 Celastraceae
1
1 1
25 Combreta-
ceae 2
2 1
26 Commelina-
ceae 3
3 2
27 Convolvula-
ceae 2 10 1 1 14 5
28 Cucurbita-
ceae 1 7
8 8
29 Cyperaceae
13 13 6
30 Ebenaceae 2
2 1
31 Euphorbia-
ceae 9 10
19 9
32 Fabaceae 4 11 15 2
32 20
33 Gentiana-
ceae 1
1 1
34 Hernandia-
ceae 1
1 1
35 Hydrochari-
taceae 1 1 1
36 Hydrolea-
ceae 1
1 1
37 Lamiaceae
1 8
9 6
38 Lauraceae
1
1 1
39 Lecythida-
ceae 1
1 1
40 Liliaceae
1 4 1
6 6
41 Loganiaceae 1
1 1
42 Lorantha-
ceae 1
1 1
43 Lythraceae 2
2
4 4
44 Malvaceae 2 7 6
15 9
45 Marsilea-
ceae 1 1 1
46 Meliaceae 1
1 1
47 Menisper-
maceae 2
2
4 4
48 Mimosaceae 10 3 1
1 15 8
49 Moraceae 4 1
5 2
50 Moringaceae 1
1 1
51 Musaceae
1
1 1
52 Myrtaceae 3
3 3
53 Nyctagina-
ceae 2 2
4 3
54 Nymphaea-
ceae 3 3 2
55 Oleaceae
2
2 2
56 Onagraceae
1
1 2 1
57 Pandanaceae
1
1 1
58 Papavera-
ceae 1
1 1
59 Passiflora-
ceae 1
1 1
60 Pedaliaceae
1 2
3 3
61 Plumbagina-
ceae 1
1 1
62 Poaceae
1 53
54 37
63 Polygala-
ceae 5
5 1
64 Polygona-
ceae 4
4 3
65 Pontederia-
ceae 1 1 1
66 Portulaca-
ceae 2
2 1
67 Pteridaceae
1
1 1
68 Punicaceae 1
1 1
69 Rhamnaceae 1 1
2 1
70 Rubiaceae 2 1 4
7 6
71 Rutaceae 3 2
5 5
72 Salvadora-
ceae 1 1
2 2
73 Santalaceae 1
1 1
74 Sapindaceae 1 1 2
4 3
75 Sapotaceae 2
2 1
76 Scrophula-
riaceae 7
7 5
77 Simaruba-
ceae 2
2 2
dsramesh
Typewritten Text
8
dsramesh
Typewritten Text
Proceedings of the National Seminar on "Impact of Scientific Advances on Society", August 18-19, 2015, p.6-10
St. Pious X Degree & PG College for Women, Hyderabad-500076.
Sponsored by the Indian Institute of Geomagnetism, Navi Mumbai-410218 (DST, Govt. of India)
78 Solanaceae
2 6
8 4
79 Sterculia-
ceae 3 1 3
7 6
80 Tiliaceae
4 3
7 3
81 Typhaceae
1 1 1
82 Ulmaceae 1
1 1
83 Verbenaceae 3 4 2
9 8
84 Violaceae
1
1 1
85 Vitaceae
2
2 1
86 Zygophylla-
ceae 1
1 1
Total 89 100 239 12 24 464 324
D- Dicots; M- Monocots; Pt – Pteridophytes; T- Trees; S- Shrubs; H-
Herbs; C- Climbers; A- Aquatic forms
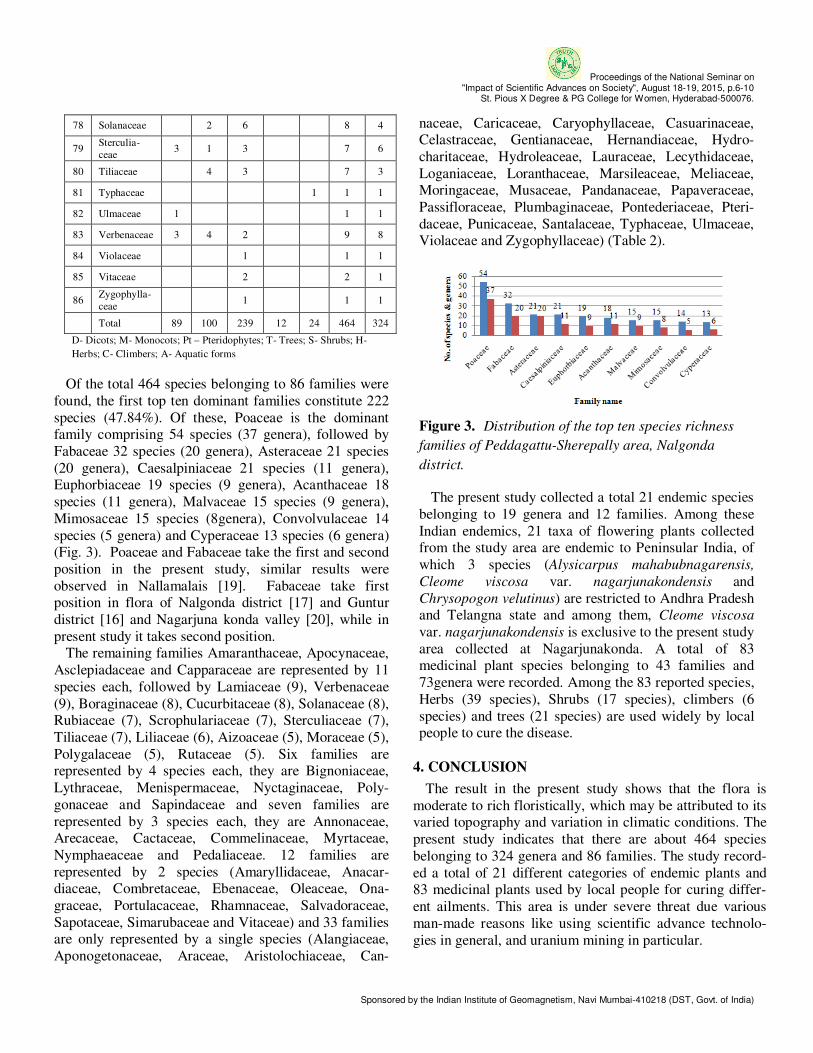
Of the total 464 species belonging to 86 families were
found, the first top ten dominant families constitute 222
species (47.84%). Of these, Poaceae is the dominant family comprising 54 species (37 genera), followed by
Fabaceae 32 species (20 genera), Asteraceae 21 species
(20 genera), Caesalpiniaceae 21 species (11 genera), Euphorbiaceae 19 species (9 genera), Acanthaceae 18
species (11 genera), Malvaceae 15 species (9 genera),
Mimosaceae 15 species (8genera), Convolvulaceae 14
species (5 genera) and Cyperaceae 13 species (6 genera) (Fig. 3). Poaceae and Fabaceae take the first and second
position in the present study, similar results were
observed in Nallamalais [19]. Fabaceae take first position in flora of Nalgonda district [17] and Guntur
district [16] and Nagarjuna konda valley [20], while in
present study it takes second position. The remaining families Amaranthaceae, Apocynaceae,
Asclepiadaceae and Capparaceae are represented by 11
species each, followed by Lamiaceae (9), Verbenaceae
(9), Boraginaceae (8), Cucurbitaceae (8), Solanaceae (8), Rubiaceae (7), Scrophulariaceae (7), Sterculiaceae (7),
Tiliaceae (7), Liliaceae (6), Aizoaceae (5), Moraceae (5),
Polygalaceae (5), Rutaceae (5). Six families are represented by 4 species each, they are Bignoniaceae,
Lythraceae, Menispermaceae, Nyctaginaceae, Poly-
gonaceae and Sapindaceae and seven families are
represented by 3 species each, they are Annonaceae, Arecaceae, Cactaceae, Commelinaceae, Myrtaceae,
Nymphaeaceae and Pedaliaceae. 12 families are
represented by 2 species (Amaryllidaceae, Anacar-diaceae, Combretaceae, Ebenaceae, Oleaceae, Ona-
graceae, Portulacaceae, Rhamnaceae, Salvadoraceae,
Sapotaceae, Simarubaceae and Vitaceae) and 33 families are only represented by a single species (Alangiaceae,
Aponogetonaceae, Araceae, Aristolochiaceae, Can-
naceae, Caricaceae, Caryophyllaceae, Casuarinaceae, Celastraceae, Gentianaceae, Hernandiaceae, Hydro-
charitaceae, Hydroleaceae, Lauraceae, Lecythidaceae,
Loganiaceae, Loranthaceae, Marsileaceae, Meliaceae, Moringaceae, Musaceae, Pandanaceae, Papaveraceae,
Passifloraceae, Plumbaginaceae, Pontederiaceae, Pteri-
daceae, Punicaceae, Santalaceae, Typhaceae, Ulmaceae, Violaceae and Zygophyllaceae) (Table 2).
Figure 3. Distribution of the top ten species richness
families of Peddagattu-Sherepally area, Nalgonda
district.
The present study collected a total 21 endemic species
belonging to 19 genera and 12 families. Among these
Indian endemics, 21 taxa of flowering plants collected from the study area are endemic to Peninsular India, of
which 3 species (Alysicarpus mahabubnagarensis,
Cleome viscosa var. nagarjunakondensis and
Chrysopogon velutinus) are restricted to Andhra Pradesh and Telangna state and among them, Cleome viscosa
var. nagarjunakondensis is exclusive to the present study
area collected at Nagarjunakonda. A total of 83 medicinal plant species belonging to 43 families and
73genera were recorded. Among the 83 reported species,
Herbs (39 species), Shrubs (17 species), climbers (6
species) and trees (21 species) are used widely by local people to cure the disease.
4. CONCLUSION
The result in the present study shows that the flora is
moderate to rich floristically, which may be attributed to its varied topography and variation in climatic conditions. The
present study indicates that there are about 464 species
belonging to 324 genera and 86 families. The study record-
ed a total of 21 different categories of endemic plants and 83 medicinal plants used by local people for curing differ-
ent ailments. This area is under severe threat due various
man-made reasons like using scientific advance technolo-
gies in general, and uranium mining in particular.
dsramesh
Typewritten Text
9
Proceedings of the National Seminar on "Impact of Scientific Advances on Society", August 18-19, 2015, p.6-10
St. Pious X Degree & PG College for Women, Hyderabad-500076.
Sponsored by the Indian Institute of Geomagnetism, Navi Mumbai-410218 (DST, Govt. of India)
REFERENCES CITED
1. Gupta, R. and Sarangi, A.K., IAEA symposium on Uranium
production and raw materials for the nuclear fuel cycle-
supply and demand, economics, the environment and
energy security, 2005, Vienna. 2. Peet, R.K. Annual Review of Ecology and Systematics,
1974, v. 5, p. 285-307.
3. McIntosh, R.P., Ecology, 1967, v. 48, p. 392–402.
4. Hamilton, A.J., Journal of Environmental Management,
2005, v. 75, p. 89–92.
5. Hurlbert, S.H., Ecology, 1971, v. 52, p.577–586. 6. Simpson, G.G., Systematic Zoology, 1964), v. 13, p. 57-73.
7. Magurran, A.E., Ecological diversity and its measurement,
1988, Chapman and Hall, London.
8. Mac Arthur, R.H. and Wilson, E.O., The theory of island
biogeography, 1967, Princeton University Press, Princeton.
9. Connell, J. H., Science, 1978, v. 199, p. 1302-1303.
10. Stevens, G.C., American Naturalist, 1989, v. 133, p. 240-
256.
11. Leitner, W. and Turner, W.R., Ecyclopedia of biodiversity,
edited by Levin S.A., 2001, p. 123-144, Academic Press,
Princeton. 12. Duelli, P. and Obrist, M.K., Agriculture Ecosystem and
Environment, 2003, v. 98, p. 87-98.
13. Sarkar, S., The Monist, 2002, v. 85, p. 131-155.
14. Gotelli, N. and Colwell, R.K., Ecology Letters, 2001, v. 4, p.379–391.
15. Magurran, A.E., Measuring biological diversity, 2004,
Blackwell Science Ltd.
16. Rao, P.N., Raghava Swamy., Pullaiah. T., Flora of
Nalgonda District, Andhra Pradesh, 2001, Shipra
Publication, Delhi.
17. Pullaiah, T., Ramakrishnaiah, V., Sadhya Rani, S. and Rao,
P.N., Flora of Guntur District, Andhra Pradesh, India,
2000, Regency Publications.
18. Gamble, J.S. and Fischer, C.E.C., Flora of the Presidency
of Madras (1915-1935). 19. Sudhakar Reddy. C, Thulsi Rao, Siva Rama Krishna, I. and
Javed S.M.M., Journal of Plant Science, 2008, v. 3(1), p.
85-91.
20. Thothathri, K., Ind. For., 1964, v, 90, p. 539-546.
ACKNOWLEDGEMENTS
The authors are grateful to Board of Research on Nuclear
Science (BRNS), BARC, Government of India, for funding
the project. We also extended our thanks to Osmania Universi-
ty and Prof. Jayashanker Telangana State Agricultural Univer-sity for granting permission to conduct studies at Peddagattu
and Shereplly area, Nalgonda district of Telangana State.
dsramesh
Typewritten Text
10
dsramesh
Typewritten Text

Proceedings of the National Seminar on "Impact of Scientific Advances on Society", August 18-19, 2015, p.11-13
St. Pious X Degree & PG College for Women, Hyderabad-500076.
Sponsored by the Indian Institute of Geomagnetism, Navi Mumbai-410218 (DST, Govt. of India)
Mini arc reactor ─ the future energy source
A.R.S. Murthy* and R. Krishna Teja
#
Krishnamurthy IIT Academy student, Hyderabad, Telangana, India *[email protected]
ABSTRACT
Globally there is a growing demand for electricity that is
cheap and reliable. At the same time, recent concerns over global warming have resulted in many governments
pledging their nations to reduce the amount of Carbon Di
Oxide they generate. Nuclear forces are the strongest force
in the nature. The problem is that nuclear energy is the proverbial political hot potato - even in early days when the
new energy source exploded onto the world scene. The
tremendous amount of energy locked in the atom held the promise of a future like something out of a technological
Arabian Nights. It would be a world where electricity will
be cheap to meter, deserts would bloom, ships would circle the Earth on a lump of fuel the size of a baseball, planes
would fly for months without landing, the sick would be
healed and even cars would be atom powered. But though
nuclear power did bring about incredible changes in our world, in its primary role, generating electricity for homes
and industry, it ended up as less of a miracle and more of a
very complicated way of boiling water. Mini nuclear reactor or an arc reactor is a miniature model of the nuclear reactor
working on the same principles of a normal nuclear reactor.
The only difference is that is the size. The mini arc reactor
is basically in the size of a meter in diameter and would be as small as possible until invented promising to bring about
many benefits to society.
Keywords: Mini arc reactor, nuclear force, source of energy
1. INTRODUCTION
A nuclear reactor, formerly known as atomic pile, is a
device used to initiate and control a sustained nuclear chain reaction. Nuclear reactors are used at nuclear
power plants for electricity generation and in propulsion
of ships. Heat from nuclear fission is passed to a working fluid (water or gas), which runs through turbines. These
either drive a ship's propellers or turn electrical genera-
tors. Nuclear generated steam in principle can be used
for industrial process heat or for district heating. Some reactors are used to produce isotopes for medical and
industrial use, or for production of weapons-grade
plutonium. Some are run only for research. Today there are about 450 nuclear power reactors that are used to
generate electricity in about 30 countries around the
world. When a large fissile atomic nucleus such as uranium-
235 or plutonium-239 absorbs a neutron, it may undergo
nuclear fission. The heavy nucleus splits into two or
more lighter nuclei, (the fission products), releasing kinetic energy, gamma radiation, and free neutrons. A
portion of these neutrons may later be absorbed by other
fissile atoms and trigger further fission events, which release more neutrons, and so on. This is known as a
nuclear chain reaction. To control such a nuclear chain
reaction, neutron poisons and neutron moderators can change the portion of neutrons that will go on to cause
more fission Nuclear reactors generally have automatic
and manual systems to shut the fission reaction down if
monitoring detects unsafe conditions. Commonly-used moderators include regular (light) water (in 74.8% of the
world's reactors), solid graphite (20% of reactors) and
heavy water (5% of reactors). Some experimental types of reactor have used beryllium, and hydrocarbons have
been suggested as another possibility.
1.1 Heat generation
The reactor core generates heat in a number of ways:
• The kinetic energy of fission products is con-
verted to thermal energy when these nuclei col-lide with nearby atoms.
• The reactor absorbs some of the gamma rays
produced during fission and converts their energy into heat.
• Heat is produced by the radioactive decay of
fission products and materials that have been ac-
tivated by neutron absorption. This decay heat-source will remain for some time even after the
reactor is shut down.
A kilogram of uranium-235 (U-235) converted via nuclear processes releases approximately three
million times more energy than a kilogram of coal
burned conventionally (7.2 × 10¹³
joules per kilogram of uranium-235 versus 2.4 × 10
7 joules per kilogram
of coal).
1.2 Electrical power generation
The energy released in the fission process generates
heat, some of which can be converted into usable energy.
A common method of harnessing this thermal energy is to use it to boil water to produce pressurized steam
dsramesh
Typewritten Text
11

Proceedings of the National Seminar on "Impact of Scientific Advances on Society", August 18-19, 2015, p.11-13
St. Pious X Degree & PG College for Women, Hyderabad-500076.
Sponsored by the Indian Institute of Geomagnetism, Navi Mumbai-410218 (DST, Govt. of India)
which will then drive a steam turbine that turns an alternator and generates electricity.
2. PRINCIPLE OF MINI ARC REACTOR
An improved plasma arc reactor is provided with vari-
ably positionable electrodes, including a cylindrical
anode electrode having an inner, frustoconical cavity providing a reaction chamber and a spherical cathode
ball electrode mounted therein. Between these electrodes
an arc discharge is induced and sustained to heat and
ionize an inert gas to produce an arc plasma for refining raw material introduced into the reaction chamber. A
magnetic induction coil is mounted around the outer
diameter of the anode electrode to thereby establish a magnetic field to rotate the arc discharge and plasma
within the reaction chamber.
The mini reactor would run on palladium (Pd103
) or (Pd
105) as palladium has been regarded as a cold fusion
reaction as it doesn’t require any special plasma rods or
containment triodes and would produce electrons by
decaying. However only the blue prints have been made until present date. Scientists all around the world are
trying to create one of its kinds.
3. COLD FUSION TECHNOLOGY
The cold fusion dream lives on: NASA is developing
cheap, clean, low-energy nuclear reaction (LENR) technology that could eventually see cars, planes, and
homes powered by small, safe nuclear reactors. LENR is
absolutely nothing like either fission or fusion. Where
fission and fusion are underpinned by strong nuclear force, LENR harnesses power from weak nuclear force
— but capturing this energy is difficult. So far, NASA’s
best effort involves a nickel lattice and hydrogen ions. The hydrogen ions are sucked into the nickel lattice, and
then the lattice is oscillated at a very high frequency
(between 5 and 30 terahertz). This oscillation excites the nickel’s electrons, which are forced into the hydrogen
ions (protons), forming slow-moving neutrons. The nickel immediately absorbs these neutrons, making it
unstable. To regain its stability, the nickel strips a
neutron of its electron so that it becomes a proton — a reaction that turns the nickel into copper and creates a lot
of energy in the process.
4. BENEFITS TO THE SOCIETY
• The mini arc reactor could easily power a whole
block of houses for a period up to a year
• According to NASA, 1% of the world’s nickel
production could meet the world’s energy needs,
at a quarter of the cost of coal.
• The most logical first application of mini arc
reactor is the home reactor, which would produce
heat and electricity for the home while charging
the family electric car. Another area is in transportation, with the light, portable reactors
powering supersonic aircraft and flying cars
without the danger or radiation. It could even be used to power a space plane capable of reaching
orbit without stages or external fuel tanks.
• The main objective of mini arc reactor is to
minimise the size and not occupying acres of land.
• The reactor produces comparably much more
power than a simple generator and is more efficient.
• Less radioactive waste is a one more benefit of the
reactor. Less radioactive waste is equal to less
pollution and harmful gases.
5. CHALLENGES
• The electrons in the metal lattice are made to
oscillate so that the energy applied to the electrons is concentrated into only a few of them. When
they become energetic enough, the electrons are
forced into the hydrogen protons to form slow
neutrons. These are immediately drawn into the nickel atoms, making them unstable. This sets off
a reaction in which one of the neutrons in the
nickel atom splits into a proton, an electron and an antineutrino. This changes the nickel into copper,
and releases energy without dangerous ionizing
radiation.
• If it could be made to work, the practical
applications would be as revolutionary as what
fission has achieved and fusion has promised.
Theoretically, the process could yield several
million times more energy than chemical reactions. According to Dennis Bushnell, Chief
dsramesh
Typewritten Text
12

Proceedings of the National Seminar on "Impact of Scientific Advances on Society", August 18-19, 2015, p.11-13
St. Pious X Degree & PG College for Women, Hyderabad-500076.
Sponsored by the Indian Institute of Geomagnetism, Navi Mumbai-410218 (DST, Govt. of India)
Scientist, NASA Langley Research Centre, one percent of the nickel mined per year could meet
the world’s energy needs for a quarter of the cost
of coal. In past years, several labs have blown up while studying LENR and windows have melted –
showing that if it really works, it can produce an
impressive amount of energy.
• There are a lot of people who are trying to just
build something without understanding anything.
It worked for Edison and the light bulb, but it took
him a long time and that was a simple system.
This is very complex. And if they make something that just barely works, and accidentally one in a
thousand works really, really well, it's going to
take down a house with their trial-and-error method.”
• Cooling is the biggest challenge of the reactor.
Cooling high temperatures within a small amount
of space quickly is a major challenge. If atoll the reactor is created it would be heated up to
hundreds of degrees and would lead to a
radioactive explosion. As long as the reactor’s
power coil is cooled down is would be redefining the power.
• One major problem is that the nuclear resources
are a very powerful source of energy. They can be
misused by using them as weapons.
6. SUGGESTIONS
Cooling a reactor: The approach to cooling is very simple: push water past the nuclear core and carry the
heat somewhere else. The chain reaction that actually
runs the reactor can be shut off in a matter of seconds. What's left over in the core, the radioactive material, will
continue to give off heat for a long time. Unless there is
a mechanism to remove that, the heat can build up and can eventually damage the radioactive fuel or the
reactor.
Minimising the radioactive waste: - Even through the
mini arc reactor produces very less amount of radioactive waste it may be harmful to the society.
Proper disposal of this waste must be ensured. Waste
disposal can be achieved by discovering or synthesizing new compounds or elements which can minimise
radiations at the same time producing power.
7. CONCLUSION
Micro Reactor Technology (MRT) has a very
promising future as it is sustainable, safe and green. It would be a technological dream to perceive mini arc
reactors as alternative sources of energy in providing
number of benefits to the society.
REFERENCES
1. www.gizmag.com/small-modular-nuclear-reactors/20860/
2. https://en.wikipedia.org/wiki/Micro_nuclear_reactor
3. www.world-nuclear.org/.../Nuclear...Reactors/Small-
Nuclear-Power-Reac..
4. www.gizmag.com/nasa-lenr-nuclear-reactor/26309/
dsramesh
Typewritten Text
13

Proceedings of the National Seminar on "Impact of Scientific Advances on Society", August 18-19, 2015, p.14-16
St. Pious X Degree & PG College for Women, Hyderabad-500076.
Sponsored by the Indian Institute of Geomagnetism, Navi Mumbai-410218 (DST, Govt. of India)
Study on antimicrobial activity of various plant derived polyphenol extracts on Staphylococcus aureus
C. Vanisree*
Department of Biochemistry, St. Pious X Degree & PG College for Women, Nacharam,, Hyderabad-500076, Telangana, India * [email protected]
ABSTRACT
The polyphenols from five different plant sources, green tea, black tea, onion, grapes and lemon peel were extracted using ethyl acetate extraction for green tea and black tea, acetone and water extraction for onions and grapes and ethanol for lemon peel. The total polyphenol content was estimated using the Folin-Ciocalteu method with gallic acid as the reference standard (100 ug/ml). The highest amount of polyphenols was found in green tea (camellia sinesis) with gallic acid equivalent of 37.6±5.65 mg/ml and mini-mum in onion (Allium cepa) extract 17.6±1.414 mg/ml. The antimicrobial effect of polyphenol extracts of the five plant sources was studied on the isolate of Staphylococcus aureus by well diffusion method with 5mg/ml and 2.5 mg/ml concentration of the extracts. The Staphylococcus aureus was susceptible to the polyphenol extracts of the five plant sources. Though the concentration of polyphenols taken was same for all the extracts, the antimicrobial effect varied. The maximum zone of inhibition was seen with green tea (24.6±0.42 mm) and minimum with onion extract (7±0 mm).The lemon peel extract showed higher antimi-crobial effect (15±0.28 mm) compared to grape extract (12.2±0.28 mm). The antimicrobial effect was comparable with that of tetracycline on Staphylococcus aureus with zone of inhibition of 30±0.14 mm and 22.5±0.28 mm with 5 mg/ml and 2.5 mg/ml concentration of the antibiotic respectively. The polyphenols from natural sources can be used as natural medicines instead of synthetic antibiotics.
Keywords: Polyphenol extract, antibacterial effect, disc diffusion
1. INTRODUCTION
Polyphenols (PPs) are reactive metabolites abundant in plant-derived foods, particularly fruits, seeds and leaves as secondary metabolites. Ranging from simple phenolic molecules to highly polymerized compounds with molecular weights of greater than 30,000 Da, the occur-rence of this complex group of substances in plant foods is extremely variable and exhibit high antioxidant capacity (free radical scavenging and metal chelating activities) [1]. Their possible beneficial implications in human health, such as in the treatment and prevention of cancer, cardiovascular disease, and opportunistic infec-
tions caused by microbes like Staphylococcus aureus pseudomonas aeruginosa, E. coli etc. Staphylococcus
aureus is a grampositive cocci often involved in respira-tory infections, sinusitis, food poisoning and skin infec-tions such as abscesses. The plant sources such as green tea (camellia sinesis), black tea, grapes, onion , lemon and apices are rich in antioxidants and are expected to show antimicrobial activity. Green tea polyphenols are catechins ,phytochemicals composed of several linked ring-like structures with chemical tags called phenol groups, and because there are many phenol groups, these catechins are called polyphenols [2, 3]. They protect cells and body chemicals against damage caused by free radicals, reactive atoms that contribute to tissue damage in the body. Grapes (Vitis vinifera), well known for their high levels of antioxidants and polyphenols, have also shown promise as novel antimicrobial agents [4-6]. Onion is one of the richest source of flavonoids and
organosulphur compounds. They possess high level of antioxidant activity attribued to flavonoids quercetin and
pigments such as anthocynins. Lemon is an important medicinal plant of the family Rutaceae. The peel of Citrus fruits is a rich source of flavonoid glycosides, coumarins, (- sitosterol, glycosides and volatile oils .
In the present study polyphenols were extracted from five different plant sources, green tea, black tea, lemon peel , onion and grapes and their antimicrobial effect was studied on gram positive bacteria Staphylococcus aureus by well diffusion method.
2. METHODOLOGY
2.1 Preparation of polyphenol extract
Polyphenols were extracted from five different plant sources: green tea, black tea, grapes, lemon peel and onion as they possess high antioxidants.
2.2 Extraction from grapes, lemon and onion
3 gm each of grapes, onion were homogenised using motor and pestle and extracted twice for 15 min with 10 ml acetone/water (80/20, v/v) containing HCl (0.1/10, v/v) to prevent oxidation of the polyphenols at room temperature and then stirred for 30 min on a magnetic agitator. After centrifugation (3000 rpm for 10 min), the supernatants from both extractions were combined and made up to a final volume of 25 ml with distilled H2O. The extracts were filtered through Whatmann No.1 filter paper. Only pulp was used for extraction from onion [4,
dsramesh
Typewritten Text
14
Proceedings of the National Seminar on "Impact of Scientific Advances on Society", August 18-19, 2015, p.14-16
St. Pious X Degree & PG College for Women, Hyderabad-500076.
Sponsored by the Indian Institute of Geomagnetism, Navi Mumbai-410218 (DST, Govt. of India)
7-9]. The polyphenols from lemon peel were extracted using ethanol extraction method [10].
2.3 Extraction from green tea and black tea
To the crudely crushed dried tea leaves (3 g) hot water (60˚C) was added in the ratio 1:20 (with periodical stirring to deactivate enzymes). The boiling mixture’s filtrate was collected (three times). Water bath at 60˚C is used to concentrate the tea solution. The filtrate was decaffeinated using methylene chloride. To the filtrate ethyl acetate was added in 1:6 ratio and the upper yellow part containing polyphenols was collected for the estimation [3].
2.4 Determination of total phenolic compounds
Total phenolic compounds from lyophilized samples were quantified using Folin-Ciocalteu’s method [11]. TPC of extracts was determined using the Folin-Ciocalteu method. Gallic acid of 100 µg/ml was used as standard. Samples (300 µl, in duplicate) were introduced into test tubes wrapped in aluminum foil followed by addition of 1.5 ml of FC reagent (10 times dilution) and 1.2 ml of sodium carbonate solution (7.5% w/v). The tubes were allowed to stand in the dark for 30 min before absorbance was measured at 765 nm. TPC was expressed as gallic acid equivalent (GAE) in µg/ml.
2.5 Preparation of the bacterial culture
Eleven bacterial isolates of Staphylococcus aureus was inoculated in Mueller Hinton broth (pH 7.4.) for 8 hours. The concentration of the suspensions was adjusted to 0.5 Mc Farland standard to reach an optical density of 0.08 – 0.10 at 625 nm by adding sterile distilled water. This gives a bacterial suspension containing 1.5 x 10⁸ CFU/ml. Isolates were seeded on Mueller Hinton agar plates by using sterilized cotton swabs.
2.6 Susceptibility tests
The susceptibility tests were performed by the Mueller Hinton agar well diffusion method [12]. The bacterial strains grown on nutrient agar at 37°C for 18 to 20 h were suspended in a saline solution (0.85%, w/v) to a turbidity of 0.5 Mac Farland standards (108 CFU/ml) [13]. The suspension was used to inoculate 90mm diameter Petri dishes with a sterile non-toxic cotton swab on a wooden applicator. Wells (6 mm diameter) were punched in the agar and filled with 50 µl of 5mg/ml extract and 2.5mg/ml extract. Plates were incubated in air at 37°C for 24 h. Antibacterial activity was evaluated by measuring inhibition zone diameters.
3. STATISTICAL ANALYSIS
The values of antimicrobial activity polyphenol extracts were expressed as mean ± standard deviation (n= 2) for each sample.
4. RESULTS AND DISCUSSION
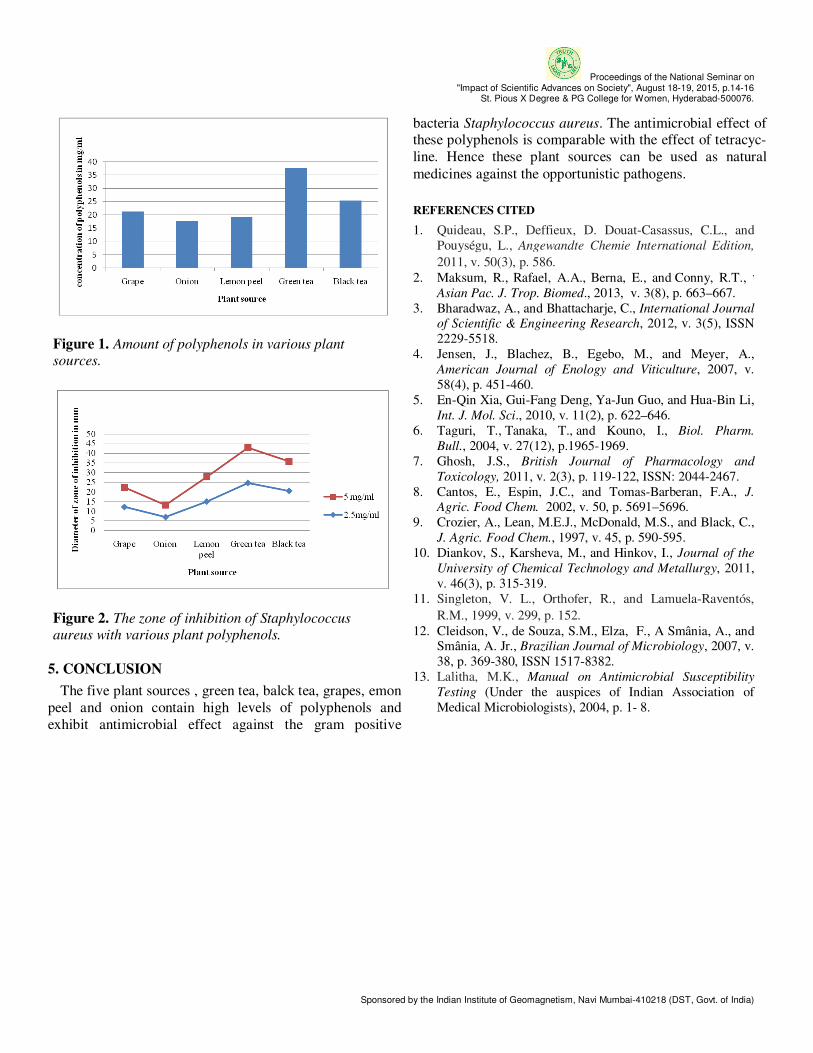
As shown in Table 1 and Fig. 1, the amount of polyphenols was found to be maximum in the leaf extracts of green tea with concentration of 37.6±5.65 mg/ml followed by black tea 25.3±3.53mg/ml ,grape 21.3±2.12 mg/ml, lemon peel 19.1±1.414 mg/ml and minimum in onion extract 17.6±1.414 mg/ml. The inhibition zone of Staphylococcus aureus with 5mg/ml concentration of polyphenol extract was found to be maximum for green tea 24.6±0.42 mm followed by black tea with 20.5±0.14mm , lemon peel 15±0.28 mm, grapes with 12.2±0.28 mm and minimum for the onion extract with 7±0 mm. As seen in Fig. 2 the pattern of the graph of inhibition zone diameter of the five polyphenol extracts is similar for 5mg/ml and 2.5 mg/ml cconcentration of polyphenols. Though the concentration of polyphenols was found to be more in grapes than lemon peel but the antimicrobial effect of lemon peel was more than the grape extract based on the values of inhibition zones.
Table 1. Comparison of concentration of polyphenols in various plant sources and Inhibition zones (in mm) for Staphylococcus aureus with polyphenol extract of various plant sources
S.No
Pla
nt
sou
rce
Sta
nd
ard
gal
lic
acid
10
0µ
g/m
l
Zo
ne
dia
met
ers
in
mil
lim
etre
s
Co
nce
ntr
atio
n o
f
po
lyp
hen
ols
mg
/ml
± s
tan
dar
d
evia
tio
n
Po
lyp
hen
ol
extr
act
5m
g/m
l
Po
lyp
hen
ol
extr
act
2.5
mg
/ml
1 Grape 21.3±2.12 12.2±0.28 10.15±0.07
2 Onion 17.6±1.414 7±0 6.25±0.07
3 Lemon peel 19.1±1.414 15±0.28 12.9±0.14
4 Green tea 37.6±5.65 24.6±0.42 18.3±0.21
5 Black tea 25.3±3.53 20.5±0.14 15.3±0.14
6 Tetracycline - 30±0.14 22.5±0.28
dsramesh
Typewritten Text
15
Proceedings of the National Seminar on "Impact of Scientific Advances on Society", August 18-19, 2015, p.14-16
St. Pious X Degree & PG College for Women, Hyderabad-500076.
Sponsored by the Indian Institute of Geomagnetism, Navi Mumbai-410218 (DST, Govt. of India)
Figure 1. Amount of polyphenols in various plant
sources.
Figure 2. The zone of inhibition of Staphylococcus
aureus with various plant polyphenols.
5. CONCLUSION
The five plant sources , green tea, balck tea, grapes, emon peel and onion contain high levels of polyphenols and exhibit antimicrobial effect against the gram positive
bacteria Staphylococcus aureus. The antimicrobial effect of these polyphenols is comparable with the effect of tetracyc-line. Hence these plant sources can be used as natural
medicines against the opportunistic pathogens.
REFERENCES CITED
1. Quideau, S.P., Deffieux, D. Douat-Casassus, C.L., and Pouységu, L., Angewandte Chemie International Edition,
2011, v. 50(3), p. 586. 2. Maksum, R., Rafael, A.A., Berna, E., and Conny, R.T., ,
Asian Pac. J. Trop. Biomed., 2013, v. 3(8), p. 663–667. 3. Bharadwaz, A., and Bhattacharje, C., International Journal
of Scientific & Engineering Research, 2012, v. 3(5), ISSN 2229-5518.
4. Jensen, J., Blachez, B., Egebo, M., and Meyer, A., American Journal of Enology and Viticulture, 2007, v. 58(4), p. 451-460.
5. En-Qin Xia, Gui-Fang Deng, Ya-Jun Guo, and Hua-Bin Li, Int. J. Mol. Sci., 2010, v. 11(2), p. 622–646.
6. Taguri, T., Tanaka, T., and Kouno, I., Biol. Pharm.
Bull., 2004, v. 27(12), p.1965-1969. 7. Ghosh, J.S., British Journal of Pharmacology and
Toxicology, 2011, v. 2(3), p. 119-122, ISSN: 2044-2467. 8. Cantos, E., Espin, J.C., and Tomas-Barberan, F.A., J.
Agric. Food Chem. 2002, v. 50, p. 5691–5696. 9. Crozier, A., Lean, M.E.J., McDonald, M.S., and Black, C.,
J. Agric. Food Chem., 1997, v. 45, p. 590-595. 10. Diankov, S., Karsheva, M., and Hinkov, I., Journal of the
University of Chemical Technology and Metallurgy, 2011, v. 46(3), p. 315-319.
11. Singleton, V. L., Orthofer, R., and Lamuela-Raventós,
R.M., 1999, v. 299, p. 152. 12. Cleidson, V., de Souza, S.M., Elza, F., A Smânia, A., and
Smânia, A. Jr., Brazilian Journal of Microbiology, 2007, v. 38, p. 369-380, ISSN 1517-8382.
13. Lalitha, M.K., Manual on Antimicrobial Susceptibility
Testing (Under the auspices of Indian Association of Medical Microbiologists), 2004, p. 1- 8.
dsramesh
Typewritten Text
16
dsramesh
Typewritten Text
Proceedings of the National Seminar on "Impact of Scientific Advances on Society", August 18-19, 2015, p.17-18
St. Pious X Degree & PG College for Women, Hyderabad-500076.
Sponsored by the Indian Institute of Geomagnetism, Navi Mumbai-410218 (DST, Govt. of India)
Rain water harvesting, conservation and management strategies
Grace Beena Paul*
Department of Zoology, St. Pious X Degree & PG College for Women, Nacharam, Hyderabad-500076,Telangana, India *[email protected]
ABSTRACT
As the water crisis continues to become severe, there is a
dire need of reform in water management system and revival of traditional systems. Scientific and technological
studies needs to be carried out to assess present status so as
to suggest suitable mitigative measures for the revival to
traditional system/wisdom. Revival process should necessarily be backed by people's initiative and active
public participation. Water is considered an everlasting free
source that can be acquired naturally. Demand for processed supply water is growing higher due to an
increasing population. Sustainable use of water could
maintain a balance between its demand and supply. Rainwater harvesting (RWH) is the most traditional and
sustainable method, which could easily be used for potable
and non potable purposes both in residential and
commercial buildings. Rainwater harvesting (RWH) could be the most sustainable solution to be included in the urban
water management system. It could mitigate the water crisis
problem, reduce the burden on traditional water sources, alleviate nonpoint source pollutant loads, control water
logging problems, prevent flooding, help in controlling
climate change impacts, contribute to the storm water management, and so forth .Water scarcity and the limited
capacity of conventional sources in urban areas promote
RWH as an easily accessible source.
Rainwater harvesting system plays an important role in
developing sustainable urban future. Availability of water
of serviceable quality from conservative sources is becoming limited day by day due to huge demand.
Rainwater provides sufficient quantity of water with small
cost. Hence, the system can promote significant water saving in residential buildings Most of the researches on
rainwater harvesting systems (RWHS) revealed that water
conservation achieved through RWHS is quite significant
especially in places where water is not easily available to consumers.
1. INTRODUCTION
Water is essential for all life and used in many
different ways, It is also a part of the larger ecosystem in
which the reproduction of the bio diversity depends. Fresh water scarcity is not limited to the arid climate
regions, but in areas with good supply the access of safe
water is becoming critical problem. Water harvesting
like many techniques in use today is not new. It is
practiced as early as 4500 B.C by the people of Ur and also latest by the Nabateans and other people of the
Middle East. While the early water harvesting techniques
used natural materials, 20th century technology has made
it possible to bring awareness about conservation of rain water harvesting .The term water harvesting was used
first by Geddes of the University of Sydney.
1.1 Water conservation
This encompasses the policies, strategies and activities
to manage fresh water as a sustainable resource. Popula-
tion, household size and growth and affluence all affect how much water is used. Factors such as climate
change will increase pressures on natural water resources
especially in manufacturing and agricultural irrigation.
World population tripled in the 1900s, resulting in six times the usage of water resources, reports World Water
Council. With the council estimating a population
increase of another 40 to 50 percent through 2050, water stress may increase. As the water crisis continues to
become severe, there is a dire need of reform in water
management system and revival of traditional systems. Scientific and technological studies need to be carried
out to assess present status so as to suggest suitable
mitigative measures for the revival to traditional
system/wisdom. Revival process Living creatures of the universe are made of five basic elements, viz., Earth,
Water, Fire, Air and Sky, Obviously, water is one of the
most important elements and no creature can survive without it. Despite having a great regard for water, we
seem to have failed to address this sector seriously.
Human being could not save and conserve water and it sources, probably because of its availability in
abundance. But this irresponsible attitude resulted in
deterioration of water bodies with respect to quantity and
quality both. Now, situation has arrived when even a single drop of water matters. However, “better late than
never", we have not realized the seriousness of this issue
and initiated efforts to overcome those problems.
1.2 Significance of harvesting rain water
There are many reasons but following are some of the
important ones.
� To arrest ground water decline and augment ground water table
� To beneficiate water quality in aquifers
dsramesh
Typewritten Text
17

Proceedings of the National Seminar on "Impact of Scientific Advances on Society", August 18-19, 2015, p.17-18
St. Pious X Degree & PG College for Women, Hyderabad-500076.
Sponsored by the Indian Institute of Geomagnetism, Navi Mumbai-410218 (DST, Govt. of India)
� To conserve surface water runoff during monsoon
� To reduce soil erosion
� To inculcate a culture of water conservation
1.3 How to harvest rain water
Broadly there are two ways of harvesting rainwater:
(i) Surface runoff harvesting
In urban area rainwater flows away as surface runoff. This runoff could be caught and used for recharging
aquifers by adopting appropriate methods.
(ii) Roof top rainwater harvesting
It is a system of catching rainwater where it falls. In rooftop harvesting, the roof becomes the catchments, and
the rainwater is collected from the roof of the
house/building. It can either be stored in a tank or diverted to artificial recharge system. This method is less
expensive and very effective and if implemented
properly helps in augmenting the ground water level of
the area.
2. METHODS OF ROOF TOP RAINWATER HAR-
VESTING
2.1 Storage of direct use
In this method rain water collected from the roof of the building is diverted to a storage tank. The storage tank
has to be designed according to the water requirements,
rainfall and catchment availability. Each drainpipe
should have mesh filter at mouth and first flush device followed by filtration system before connecting to the
storage tank. It is advisable that each tank should have
excess water over flow system. Excess water could be diverted to recharge system.
Water from storage tank can be used for secondary
purposes such as washing and gardening etc. This is the most cost effective way of rainwater harvesting. The
main advantage of collecting and using the rainwater
during rainy season is not only to save water from
conventional sources, but also to save energy incurred on transportation and distribution of water at the
doorstep. This alsoconserve groundwater, if it is being
extracted to meet the demand when rains are on.
2.2 Recharging groundwater aquifers
Ground water aquifers can be recharged by various kinds of structures to ensure percolation of rainwater in
the ground instead of draining away from the surface. Commonly used recharging methods are:
a) Recharging of bore wells
b) Recharging of dug wells. c) Recharge pits
d) Recharge Trenches
e) Soak ways or Recharge Shafts f) Percolation Tanks
2.3 Recharging of bore wells
Rainwater collected from rooftop of the building is diverted through drainpipes to settlement or filtration
tank. After settlement filtered water is diverted to bore
wells to recharge deep aquifers. Abandoned bore wells can also be used for recharge.
The department of Zoology with the help of Statistics
department conducted a survey through questionnaire method (Fig. 1) to bring about the awareness to harvest
rain water.
0 10 20 30 40 50 60 70 80
yesno
small tank(1000L)tanks(1000-10000L)
large tanks(>10000L)don’t know
save moneygood for environment
for gardenalready existedwashing the car
flushing toiletwashing clothes
otherlandlords wont allow to install
no suitable downpipesdon’t know how to install
too expensivedon’t believe that it will save money
don’t believe that products are not reliable enoughwater quality isn't good
SURVEY ON RAIN WATER HARVESTING PIT
Rain water harvest pit in locality Type of harvesting pit
Reason for having Harvesting pit Usage of rain water
Reasons for not having rain water pit if given a chance would you like to install a pit
purchase of water in summer
Figure 1. Statistical analysis of the data–questionnaire
method.
3. CONCLUSION
St. Pious campus is charged with rain water harvesting
pits, establishing the common flora and fauna, is instru-mental in sending out conservational awareness as well as
encouraging and appreciation of the biodiversity within the
campus community. The Campus continues to support a rich diversity of plants and animals since the development
of rain water harvesting pits.
REFERENCES
1. Haigh, M.J., Asian Journal of Water, Environment and
Pollution, 2004, v. 1(1), p. 17–28.
2. Behzadian, K., and Kapelan, Z., Science of the Total
Environment, 2015, v. 527-528, p. 220–231.
dsramesh
Typewritten Text
18
dsramesh
Typewritten Text

Proceedings of the National Seminar on "Impact of Scientific Advances on Society", August 18-19, 2015, p.19-20
St. Pious X Degree & PG College for Women, Hyderabad-500076.
Sponsored by the Indian Institute of Geomagnetism, Navi Mumbai-410218 (DST, Govt. of India)
One pot rapid synthesis of novel 2-chloroquinolinyl-1,2,3-triazoles in water and their antibacterial activity
Jyoti Mareddy1,2
, N. Sureshbabu2, A. Jayasree
2, Soma
Roy3 and Sarbani Pal
1,*
1Department of Chemistry, MNR Degree & PG College, Kukatpally,
Hyderabad-500085, India. 2Centre for Chemical Sciences and Technology, Institute of
Science & Technology, Jawaharlal Nehru Technological University Hyderabad, Kukatpally, Hyderabad-500085, India.
3Department of Biotechnology, Chaitanya Bharathi Institute of
Technology, Gandipet, Hyderabad 500075, India. *[email protected]
ABSTRACT
A series of 2-chloroquinolinyltriazoles possessing various substitutent on the triazolyl ring were designed as potential
antibacterial agents. Synthesis of these compounds was
carried out via a multi-step sequence consisting of copper-
catalyzed azide-alkyne cycloaddition (CuAAC) of 3-(azidomethyl)-quinoline derivative with terminal alkynes as
a key step using water as solvent. A number of compounds
were synthesized by using this method some of which showed promising antibacterial activities when tested in
vitro.
Keywords: 2-chloroquinoline, 1,2,3-triazole, cycloaddition, antibacterial
activities
1. INTRODUCTION
The problem of increased prevalence of diseases
worldwide caused by microorganisms has underlined the
need for the identification and development of newer and potent antimicrobial agents. Thus, design, synthesis and
pharmacological evaluation of new chemical entities are
highly desirable to fight against bacterial pathogens. The
design of drugs based on molecular hybridization
approach involves linking of two pharmacophores
possessing individual inherent activity into a single agent
thus incorporating the dual activity or enhanced activity into a single hybrid molecule [1]. For example, a drug
candidate Tazobactam showed enhanced antibacterial
activity due to the synergistic effect of both 1,2,3-
triazole and beta lactam nucleus [2]. Appropriately functionalized 1,2,3-triazole ring system
has become one of the common fragments in the discov-
ery of new chemical entities. The quinoline nucleus on the other hand has been found to be integral part of many
synthetic and natural products with a wide range of
pharmacological properties including antibacterial [3, 4]
and antifungal [5] activities. Prompted by these observa-
tions we extended our search hoping to go one step
ahead in the field of novel antimicrobial agents we
undertook the design and the synthesis of a new class of
quinoline coupled [1,2,3]-triazoles via the strategy based
on linking the 1,2,3-triazole through the C-3 position of the quinoline ring was not explored earlier (Scheme 1).
We anticipated that compounds synthesized would
furnish promising antimicrobial properties.
N Cl
NN
N
N Cl
NN
N
Various substituents
Scheme 1.Design of hybrid molecules.
2. PRESENT WORK
2.1 Chemistry
The synthesis of our target compounds 1 was carried out by adopting multi-step sequence as outlined in
Scheme 1. The copper-catalyzed azide-alkyne cycloaddi-
tion (CuAAC) [6, 7] the best paradigm of click chemi-
stry was used as a key step in this sequence. This in-volves the construction of triazole ring via Cu(I)-
catalyzed 1,3-cycloaddition of an azide to a terminal
alkyne in the presence of a mixture of CuSO4 and sodium ascorbate as a precatalyst system which gene-
rates the Cu(I) species in situ in the reaction mixture.
The stating material, the corresponding dichloro deriva-
tive (1 mmol) was treated with KI (1.1 mmol) to afford the iodo derivative which on reaction with sodium azide
(1.1 mmol) provided the corresponding 3-(azidomethyl)-
2-chloroquinoline deri-vative. The azide (1 mmol) was then coupled with a variety of terminal alkynes (1 mmol)
in the presence of CuSO4 (0.25 mmol) and sodium
ascorbate (0.25 mmol) smoothly under mild conditions in water to afford the desired compound 1 in one pot
(Scheme 2). The progress of the reaction was checked by
TLC and after completion of the reaction the reaction
mixture was quenched in crushed ice and filtered to get the solid. The isolated solid was pure enough to preceed
further.
N Cl
I
N Cl
N3N
NN
N ClR
N Cl
Cl
1
12 3
Scheme 2. Reagents and conditions: (1) KI, water, 3h,
room temp, 91%; (2) NaN3, water, 6h, room temp, 90%;
(3) R-C≡CH, CuSO4, Na-ascorbate, H2O, 10 min-2h,
room temp.
dsramesh
Typewritten Text
19
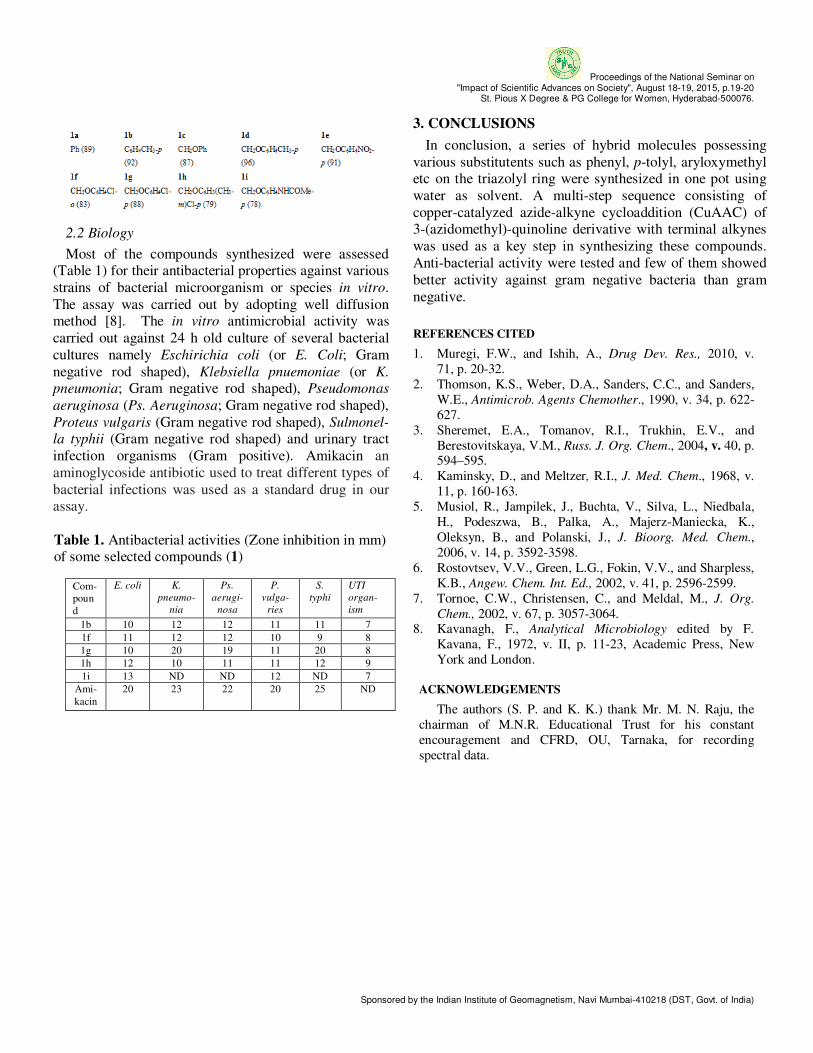
Proceedings of the National Seminar on "Impact of Scientific Advances on Society", August 18-19, 2015, p.19-20
St. Pious X Degree & PG College for Women, Hyderabad-500076.
Sponsored by the Indian Institute of Geomagnetism, Navi Mumbai-410218 (DST, Govt. of India)
2.2 Biology
Most of the compounds synthesized were assessed (Table 1) for their antibacterial properties against various
strains of bacterial microorganism or species in vitro.
The assay was carried out by adopting well diffusion method [8].
The in vitro antimicrobial activity was
carried out against 24 h old culture of several bacterial
cultures namely Eschirichia coli (or E. Coli; Gram
negative rod shaped), Klebsiella pnuemoniae (or K.
pneumonia; Gram negative rod shaped), Pseudomonas
aeruginosa (Ps. Aeruginosa; Gram negative rod shaped),
Proteus vulgaris (Gram negative rod shaped), Sulmonel-
la typhii (Gram negative rod shaped) and urinary tract
infection organisms (Gram positive). Amikacin an
aminoglycoside antibiotic used to treat different types of
bacterial infections was used as a standard drug in our assay.
Table 1. Antibacterial activities (Zone inhibition in mm) of some selected compounds (1)
Com-
poun
d
E. coli K.
pneumo-
nia
Ps.
aerugi-
nosa
P.
vulga-
ries
S.
typhi
UTI
organ-
ism
1b 10 12 12 11 11 7
1f 11 12 12 10 9 8
1g 10 20 19 11 20 8
1h 12 10 11 11 12 9
1i 13 ND ND 12 ND 7
Ami-
kacin
20 23 22 20 25 ND
3. CONCLUSIONS
In conclusion, a series of hybrid molecules possessing
various substitutents such as phenyl, p-tolyl, aryloxymethyl etc on the triazolyl ring were synthesized in one pot using
water as solvent. A multi-step sequence consisting of
copper-catalyzed azide-alkyne cycloaddition (CuAAC) of 3-(azidomethyl)-quinoline derivative with terminal alkynes
was used as a key step in synthesizing these compounds.
Anti-bacterial activity were tested and few of them showed
better activity against gram negative bacteria than gram
negative.
REFERENCES CITED
1. Muregi, F.W., and Ishih, A., Drug Dev. Res., 2010, v.
71, p. 20-32.
2. Thomson, K.S., Weber, D.A., Sanders, C.C., and Sanders,
W.E., Antimicrob. Agents Chemother., 1990, v. 34, p. 622-
627.
3. Sheremet, E.A., Tomanov, R.I., Trukhin, E.V., and
Berestovitskaya, V.M., Russ. J. Org. Chem., 2004, v. 40, p. 594–595.
4. Kaminsky, D., and Meltzer, R.I., J. Med. Chem., 1968, v.
11, p. 160-163.
5. Musiol, R., Jampilek, J., Buchta, V., Silva, L., Niedbala,
H., Podeszwa, B., Palka, A., Majerz-Maniecka, K.,
Oleksyn, B., and Polanski, J., J. Bioorg. Med. Chem.,
2006, v. 14, p. 3592-3598.
6. Rostovtsev, V.V., Green, L.G., Fokin, V.V., and Sharpless,
K.B., Angew. Chem. Int. Ed., 2002, v. 41, p. 2596-2599.
7. Tornoe, C.W., Christensen, C., and Meldal, M., J. Org.
Chem., 2002, v. 67, p. 3057-3064. 8. Kavanagh, F., Analytical Microbiology edited by F.
Kavana, F., 1972, v. II, p. 11-23, Academic Press, New
York and London.
ACKNOWLEDGEMENTS
The authors (S. P. and K. K.) thank Mr. M. N. Raju, the
chairman of M.N.R. Educational Trust for his constant
encouragement and CFRD, OU, Tarnaka, for recording
spectral data.
dsramesh
Typewritten Text
20
Proceedings of the National Seminar on "Impact of Scientific Advances on Society", August 18-19, 2015, p.21-23
St. Pious X Degree & PG College for Women, Hyderabad-500076.
Sponsored by the Indian Institute of Geomagnetism, Navi Mumbai-410218 (DST, Govt. of India)
Biosynthesis of silver nanoparticles by a soil isolate, Aspergillus Species
J. Sridevi1,*
, Spandana Patnaik1, Udaya Alekhya
1, and
L. Venkateswar Rao2
1Department of Microbiology, Government Degree College for
Women (Autonomous), Begumpet, Hyderabad. 500016, India. 2Department of Microbiology, University College of Science,
Osmania University, Hyderabad-500006, India. *[email protected]
ABSTRACT
In recent science Nanotechnology is a promising field for the researchers. Nanoparticle production by using biological
systems like plants, microbes, is fast picking in the present
scenario because of the immense applications of nanopar-ticles. There is an increasing interest in silver nanoparticles
on account of the antimicrobial properties that they display
and have been mentioned to be future generation antimicro-
bials. Other applications to mention a few include catalysis, biosensing, imaging, drug delivery, nanodevice fabrication
and in medicine. The present study is focused on an eco-
friendly, cost efficient, rapid and easy method for biosyn-thesis of silver nanoparticles (AgNPs) by using a fungus,
Aspergillus sps. isolated from soil. The fungal culture was
isolated in pure form and used for the biosynthesis of silver
nanoparticles. The culture filtrate of Aspergillus sps. was added with 0.1 mM silver nitrate solution which resulted in
the formation of silver nanoparticles after incubation. The
silver nanoparticles were analyzed by Visual analysis, UV-Vis absorption spectroscopy. The culture filtrate showed a
characteristic brown color after 24 hours of incubation at
RT in dark conditions. The silver nanoparticle solution showed maximum absorbance at 440 nm in UV-Vis
spectroscopy.
Keywords: Aspergillus sps., Silver nanoparticles, UV-Vis Spectroscopy
1. INTRODUCTION
Nanotechnology is an emerging and promising field in
the area of interdisciplinary Biosciences [1]. Nanotech-
nology mostly deals with the synthesis of different types of nanoparticles by various physical and chemical
processes. It is significant not only of the myriad of
applications but also it is synthesized economically, in a green way [2]. Currently, there is a growing need to
develop an eco-friendly process for nanoparticle synthe-
sis and hence the focus turned towards ‘green’ chemistry
and bioprocesses [3]. Nanotechnology applications are highly suitable for biological molecules, because of their
exclusive properties. The biological molecules undergo
highly controlled assembly for making them suitable for
the metal nanoparticle synthesis which was found to be
reliable and eco friendly. Biosynthesis of nanoparticles is gearing up for its huge potential applications [4-5].
Nano silver particles have been found tremendous
applications in the fields of high sensitivity biomolecular
detection, diagnostics, antimicrobials, therapeutics, catalysis and micro-electronics. However, there is still
need for economic commercially viable as well as
environmentally clean synthesis route to synthesize the silver nanoparticles. Silver is known for its inhibitory
effect on many bacterial strains and microorganisms
commonly present in medical and industrial processes.
In medicines, silver nanoparticles are included in topical applications and creams to prevent infection of burns and
open wounds. Medical devices and implants are also
impregnated with silver components. In textile industry, silver-embedded fabrics are now used in sporting equip-
ment. The need for environmental non-toxic synthetic
protocols for nanoparticles synthesis leads to the devel-oping interest in biological approaches which are free
from the use of toxic chemicals as byproducts. Thus,
there is an increasing demand for “Green nanotechnolo-
gy”. Many biological approaches for both extracellular and intracellular nanoparticles synthesis have been
reported till date using microorganisms including bacte-
ria, fungi. Biosynthesis of silvernanoparticles using fungi, including Fusarium acuminatum [6], Fusarium
oxysporum [7], Aspergillus niger [8], Aspergillus clava-
tus [9], Penicillium fellutanum [10], Fusarium solani
[11], Alternaria alternata [12] etc. have been success-
fully used for the synthesis of silver nanoparticles. The
present study demonstrated the extracellular synthesis of
stable silver nanoparticles using a soil isolate, Aspergil-
lus sps.
2. MATERIALS AND METHOD
2.1 Isolation and identification of Aspergillus sps.
Samples like soil, degrading wood, were collected
from the college premises and transported to the labora-tory and stored at 4°C. The samples were serially diluted
by 10-fold and inoculated onto Potato Dextrose Agar
medium plates for the isolation of fungi. After incubation at 28°C for 4 days, Morphologically different colonies
were picked and subcultured onto PDA slants to obtain
pure cultures. These slants were maintained at 4°C for subsequent identification. One of the fungal cultures was
selected for the biosynthesis of silver nanoparticles. The
dsramesh
Typewritten Text
21
Proceedings of the National Seminar on "Impact of Scientific Advances on Society", August 18-19, 2015, p.21-23
St. Pious X Degree & PG College for Women, Hyderabad-500076.
Sponsored by the Indian Institute of Geomagnetism, Navi Mumbai-410218 (DST, Govt. of India)
culture was identified by its microscopic and colony morphology.
2.2 Production of fungal biomass
The spores of the fungal culture identified to be
Aspergillus sps.,were used for the production of fungal
biomass. 100 mL of potato dextrose broth (Hi-Media) was inoculated with fungal spores at a rate of ~10
5
spores/mL in 100 mL Erlenmeyer flask. The flask was
kept in a shaker incubator at 120 rpm, 28° C, for 3 days
for the biomass to develop. After 3 days the fungal culture was filtered through Whatman No.1 filter paper
to separate out the culture filtrate and biomass.
2.3 Synthesis of silver nanoparticles (AgNPs) using
culture filtrate of Aspergillus sps.
The fungal biomass was washed thoroughly with
sterile distilled water to remove residual medium components. Approximately 25 g of the biomass was
aseptically transferred to a 250 mL flask having 100 mL
of distilled water and incubated for 3 days in a shaker incubator at 120 rpm, 28° C. After incubation, the
culture was filtered through Whatman No.1 filter paper
to obtain clear fungal filtrate. 20 mL of the fungal filtrate was added with 20 mL of 0.1mM AgNO3
solution in a
100 mL flask and incubated in dark in shaker incubator
at 120 rpm, 28° C. During incubation the silver
nanoparticles were produced by reduction of silver ions to metallic silver.
2.4 Characterization of biosynthesized silver nanopar-
ticles
(i) Visual Analysis
After incubation for 24 hours, change in the color of
the culture filtrate and AgNO3 mixture was observed. This mixture was further subjected to various analyses.
(ii) UV-Visible spectroscopic analysis
The UV-Visible spectra of the mixture was recorded from 320 to 500, as function of wavelength using UV-
Vis spectrophotometer. The surface Plasmon resonance
of silver nanoparticles was determined by getting the peak value of wavelength.
3. RESULTS AND DISCUSSION
3.1 Isolation and identification of Aspergillus sps.
The fungal culture which was isolated in the pure form
(Fig. 1) on PDA agar slant was identified to be
Aspergillus sps., based on colony morphology and microscopic observation.
Figure 1. Aspergillus sps on PDA slant.
3.2 Synthesis of silver nanoparticles (AgNPs) using
culture filtrate of Aspergillus sps.
Figure 2 shows Flask A of the fungal culture filtrate
and before immersion in 0.1 mM AgN O3 solution. The
pale yellow color of the fungal cells can clearly be observed . The fungal cells after immersion in 0.1 mM
AgNO3 solution for 24 hours is shown in Flask B.
Figure 2. Picture of flasks A and B containing Asper-
gillus sps. culture filtrate before and after exposure to
Ag+ ions 24 hours.
It can be observed that the previous pale yellow color of the reaction mixture is changed to the brownish color
after 24 hours of incubation in dark. The appearance of
brown color in solution containing the biomass is a clear
indication of the formation of silver nanoparticles in the reaction mixture. The color of the solution is due to the
excitation of surface plasmon vibrations in the silver
nanoparticles.
dsramesh
Typewritten Text
22

Proceedings of the National Seminar on "Impact of Scientific Advances on Society", August 18-19, 2015, p.21-23
St. Pious X Degree & PG College for Women, Hyderabad-500076.
Sponsored by the Indian Institute of Geomagnetism, Navi Mumbai-410218 (DST, Govt. of India)
3.3 UV-Visible spectroscopic analysis
The absorption spectra recorded at various wavelengths (λ) from the Aspergillus sps. reaction flask
after 24 hours are reported in Table 1 and Figure 3. The
strong surface plasmon resonance centered at 440 nm is
characteristic of colloidal silver and found similar to result of [13] in which an intense peak was found at 410
nm. An earlier report indicated that the absorption
spectrum of spherical silver nanoparticles is found maximum between 420 nm and 450 nm [14].
Table 1. Absorption spectra recorded at various wave-lengths
S. No. Wave length
(λ)
Absorbance
(24 hrs)
1 320 0.324
2 340 0.098
3 360 0.084
4 380 0.126
5 400 0.288
6 420 0.530
7 440 0.792
9 460 0.740
10 480 0.700
11 500 0.571
Figure 3. Absorption spectra of Aspergillus sps. as a
function of wave-length.
4. CONCLUSION
In the present study a soil fungal isolate Aspergillus sps.
had been used in the extracellular synthesis of silver nanoparticles. In the biosynthesis of metal nanoparticle by a
fungus, enzymes are produced which reduce a salt to its
metallic solid nanoparticles through the biocatalytic effect.
Aspergillus sps which has a potential to synthesize various extracellular industrial enzymes, also has the potential to
biocatalyze the reduction of silver salts to nano silver. The
visual analysis and UV spectroscopic studies showing change of color of culture filtrate from pale yellow to brown
and Surface Plasmon Resonance peak at 440 nm, respec-
tively, clearly indicates the synthesis of silver nanoparticles. Thus the present study has reported the biological process
for the synthesis of silver nanoparticles using a soil isolate
Aspergillus sps. The silver nanoparticles can be further
characterized and explored for their varied applications.
REFERENCES CITED
1. Natarajan, K., Selvaraj, S., and Ramachandra, M.V.,
Digest Journal of Nanomaterials and Biostructures, 2010,
v. 5, p. 135-140.
2. Gopinath, V., Mubarak Ali, D., Priyadarshini, S.,
Priyadharshini, N. M., Thajuddin, N., Velusamy, P. et al.,
Colloids and Surfaces, B: Biointerfaces, 2012, v. 96, p. 69-
74.
3. Mohanpuria, P., Rana, N.K., and Yadav, S.K., Journal of
Nanoparticle Research, 2008, v. 10, p. 507-517.
4. Narayanan, K., and Sakthivel, N., Materials Letters, 2008,
v. 62, p. 4588.
5. Philip, D., Physica E: Low-dimensional Systems and
Nanostructures, 2010, v. 42(5), p. 1417.
6. Ingle, A., Gade, A., Pierrat, S., Sonnichsen, C., and Rai,
M., Curr. Nanosci., 2008, v. 4, p. 141.
7. Ahmad, A., Mukherjee, P., Senapati, S., Mandal, D., Khan,
M.I., Kumar, R. and Sastry, M., Colloids and Surfaces B:
Biointerfaces, 2003, v. 28, p. 313-318.
8. Gade, A., Bonde, P., Ingle, A., Marcato, P., Duran, N., and Rai, M. J., Biobased. Mater. Biener, 2008, v. 2, p. 243.
9. Verma, V., Karwar, R., and Gange, A., Nanomedicine
(Lond), 2010, v. 5(1), p. 33.
10. Kathiresan, K., Manivannan, S., Nabeel, M.A., and
Dhivya, B., Colloid surface B, 2009, v. 71, p. 13.
11. Ingle, I., Gade, A., Bawaskar, M., and Rai, M., J.
Nanopart. Res., 2011, v. 11, p. 2079.
12. Gajbhiye, M., Kesharwani, J, Ingle, A., Gade, A., and Rai,
M., Nanomedicine: Nanotech. Bio. and Med., 2009, v. 5, p.
383.
13. Mukherjee, P., Roy, M., Mandal, B., Dey, G., Mukherjee,
P., Ghatak, J., Tyagi, A., and Kale, S., IOP publishing
Nanotechnology Journal, 2008, v. 19, 075103 (7p.).
14. Maliszewska, J., Szewczyk, K., and Haszak, K., Journal of
Physics : Conference Series, 2008, v. 146, 012025.
dsramesh
Typewritten Text
23
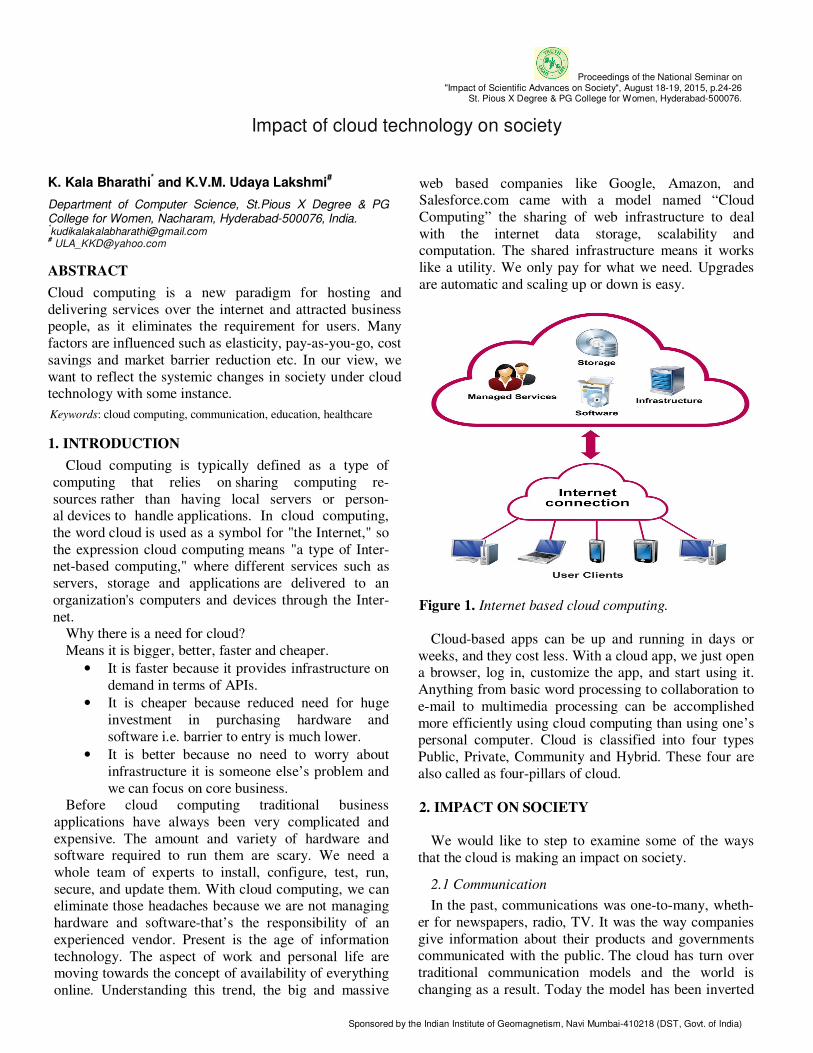
Proceedings of the National Seminar on "Impact of Scientific Advances on Society", August 18-19, 2015, p.24-26
St. Pious X Degree & PG College for Women, Hyderabad-500076.
Sponsored by the Indian Institute of Geomagnetism, Navi Mumbai-410218 (DST, Govt. of India)
Impact of cloud technology on society
K. Kala Bharathi* and K.V.M. Udaya Lakshmi
#
Department of Computer Science, St.Pious X Degree & PG College for Women, Nacharam, Hyderabad-500076, India. *[email protected]
ABSTRACT
Cloud computing is a new paradigm for hosting and
delivering services over the internet and attracted business people, as it eliminates the requirement for users. Many
factors are influenced such as elasticity, pay-as-you-go, cost
savings and market barrier reduction etc. In our view, we
want to reflect the systemic changes in society under cloud technology with some instance.
Keywords: cloud computing, communication, education, healthcare
1. INTRODUCTION
Cloud computing is typically defined as a type of
computing that relies on sharing computing re-
sources rather than having local servers or person-al devices to handle applications. In cloud computing,
the word cloud is used as a symbol for "the Internet," so
the expression cloud computing means "a type of Inter-net-based computing," where different services such as
servers, storage and applications are delivered to an
organization's computers and devices through the Inter-
net. Why there is a need for cloud?
Means it is bigger, better, faster and cheaper.
• It is faster because it provides infrastructure on
demand in terms of APIs.
• It is cheaper because reduced need for huge
investment in purchasing hardware and
software i.e. barrier to entry is much lower.
• It is better because no need to worry about
infrastructure it is someone else’s problem and
we can focus on core business. Before cloud computing traditional business
applications have always been very complicated and
expensive. The amount and variety of hardware and software required to run them are scary. We need a
whole team of experts to install, configure, test, run,
secure, and update them. With cloud computing, we can eliminate those headaches because we are not managing
hardware and software-that’s the responsibility of an
experienced vendor. Present is the age of information
technology. The aspect of work and personal life are moving towards the concept of availability of everything
online. Understanding this trend, the big and massive
web based companies like Google, Amazon, and Salesforce.com came with a model named “Cloud
Computing” the sharing of web infrastructure to deal
with the internet data storage, scalability and computation. The shared infrastructure means it works
like a utility. We only pay for what we need. Upgrades
are automatic and scaling up or down is easy.
Figure 1. Internet based cloud computing.
Cloud-based apps can be up and running in days or
weeks, and they cost less. With a cloud app, we just open a browser, log in, customize the app, and start using it.
Anything from basic word processing to collaboration to
e-mail to multimedia processing can be accomplished
more efficiently using cloud computing than using one’s personal computer. Cloud is classified into four types
Public, Private, Community and Hybrid. These four are
also called as four-pillars of cloud.
2. IMPACT ON SOCIETY We would like to step to examine some of the ways
that the cloud is making an impact on society.
2.1 Communication
In the past, communications was one-to-many, wheth-
er for newspapers, radio, TV. It was the way companies
give information about their products and governments communicated with the public. The cloud has turn over
traditional communication models and the world is
changing as a result. Today the model has been inverted
dsramesh
Typewritten Text
24
Proceedings of the National Seminar on "Impact of Scientific Advances on Society", August 18-19, 2015, p.24-26
St. Pious X Degree & PG College for Women, Hyderabad-500076.
Sponsored by the Indian Institute of Geomagnetism, Navi Mumbai-410218 (DST, Govt. of India)
now we have many-to-one communication like Twitter and Facebook, where the page owner can issue a mes-
sage, and hundreds, thousands or millions of people can
respond. The result is a new transparency as people communicate with politicians, pop stars and anyone on
the public stage in a very open way. It gave an example
of how the cloud is changing the way we interact, with very real consequences.
2.2 Closing the digital divide
You may have heard of the One Laptop per Child (OLPC) was setup to direct the creation of affordable
educational devices for use in the developing world. Its
primary goal is the production of low-cost and low-power laptop computer to reach children. It was a noble
idea, but unable to live up to expectations. It was a very
hardware-focused view of the world, built with non-
standard technology that was unfamiliar to people outside. A major inhibitor was the limited selection of
software available, as well as how to distribute it, how to
install it, how to maintain it, and what licensing was required. Building a land line infrastructure that’s
become out of date, countries are going directly to
mobile because it’s a much cheaper and easier way to provide coverage. The cloud provides a similar whole-
sale leap over the PC model on which OLPC was based.
Rather than a specific laptop design with many technical
constraints, now all you need is access to the web, and an endless variety of free software is at your fingertips. You
still need an access and display device, but these devices
(i.e., mobile phones) are everywhere, and they’re con-stantly getting smarter, faster, cheaper, and more versa-
tile.
2.3 Education
Another area where the cloud is making an impact is
education, where innovative teaching tools and reference
materials allow educators to stretch their precious budgets. Many institutions are adopting Cloud technolo-
gy for several reasons, including:
• Ability for the students to access data any-where, anytime, to enroll in online classes and
to participate in group activities.
• The class enrollments and assignment tracking,
thus reducing expenses significantly. • Ability for the institutional body to leverage the
storage cloud to store the daily 2.5 quintillion
bytes of data securely and without the need to cater to a complicated infrastructure.
• The benefit of process billing and charging for
education and non-education related activities.
Access is now instantly available and in many in-stances free thanks to the proliferation of websites
dispensing educational material and cloud knowledge-
sharing communities. A simple internet connection can go a long way.
2.4 Science and Engineering
The complexity of today’s scientific and engineering
problems is far beyond the capabilities of traditional
tools. Innovations are based on modeling and simulation that require massive amounts of computing power. The
cloud provides ready access to that power, on a highly
efficient pay-as-you-go basis. This flexibility can be crucial for product development, as well as the fortunes
of the company driving it. One example is the develop-
ment of advance drugs, where every day can represent
millions of Euros in sales and recovery of investment. If a pharmaceutical company needs to simulate how a
promising new medication interacts with 16 million
proteins, the analysis could run for weeks on their internal systems, tying up resources at enormous cost.
The public cloud provides an alternative, giving scien-
tists access to hundreds or thousands of servers, for a day, a week, or as long as they’re needed. Cloud compu-
ting is advancing scientific progress in another way.
Where previously only the largest companies could
afford their own massive computer clusters, immense processing performance is now within reach for any
small research team or individual with a brilliant design
they want to bring into everyone life.
2.5 Community
In early days of Computing, where everyone had a
“dumb terminal” connected to a mainframe for processing and storage. Then in the eighties, the PC
brought processors and storage to our fingertips, provid-
ing the focus of innovation that lasted decades. Now the pendulum has shifted again, with data, applications, and
computing power recentralized to make those resources
available to everyone. There’s a community aspect to the cloud that’s chang-
ing the way products are designed, projects are funded,
and work gets done. This is the concept of crowd sourc-
ing, enabling new forms of collaboration for people who share a common interest or passion, without geographic
constraints. The approach is based on competition, where
the customer describes what they’re looking for and designers compete to come up with the best concept. The
customer then hires the winner to create the final design.
Customers get access to a global community of afforda-
dsramesh
Typewritten Text
25
Proceedings of the National Seminar on "Impact of Scientific Advances on Society", August 18-19, 2015, p.24-26
St. Pious X Degree & PG College for Women, Hyderabad-500076.
Sponsored by the Indian Institute of Geomagnetism, Navi Mumbai-410218 (DST, Govt. of India)
ble design talent, while designers get work opportunities not previously available.
But unlike in the past, the cloud allows users–
individual, companies, and global communities–almost unlimited creativity in how they take advantage of
it. The result is an explosion of innovation with tre-
mendous social, scientific, and business benefits.
2.6 Health
There are many reasons why using cloud technology
in the healthcare industry is gaining speed. Some exam-ples include managing patient data and sharing it among
different parties such as medical professionals or patients
checking their own status and treatment follow-ups and reducing operational costs such as data storage and
accessing through devices such as mobile phones and
going beyond the traditional intranet implementing a
quick solution in a secure environment that is accommo-dating with the Health Insurance Portability and Accoun-
tability Act regulations.
While there may be challenges in integrating old or current tools with new technologies and the correspond-
ing level of services, the benefits will outweigh the inhibition to move to the cloud.
3. CONCLUSION
Cloud Computing “The New Age lifesaver” is a relatively
new concept that presents a good number of benefits for its users. We hope in future may increase their role in various
sectors as hardware optional, medical treatments simplifica-
tion, weather forecasting, education, online marketing and
digital media etc.
SUGGESTED REFERENCES
1. Gandhi, V.C., .Prajapati, J.A. and Darji, P.A., International
Journal of Emerging Trends & Technology in Computer
Science (IJETTCS), 2012, v. 1(3).
2. Singh, H., International Journal of Electronics and
Computer Science Engineering, 2012.
3. Das , S.K., Cloud Computing, 2015, Dominant publisher
and distributers.
4. http://www.thoughtsoncloud.com/2013/04/how-cloud-computing-is-impacting-everyday-life.
dsramesh
Typewritten Text
26
Proceedings of the National Seminar on "Impact of Scientific Advances on Society", August 18-19, 2015, p.27-28
St. Pious X Degree & PG College for Women, Hyderabad-500076.
Sponsored by the Indian Institute of Geomagnetism, Navi Mumbai-410218 (DST, Govt. of India)
Impact of environmental science on human welfare
K. Sudha Rani*
Department of Botany, Government Degree College for Women (Autonomous), Begumpet, Hyderabad. 500016, India. *[email protected]
ABSTRACT
This paper presents the importance of environmental
science on human development. Today environmental
science plays a crucial role in the development of each
individual. If not handled with care and wisdom, power
plants, mining, chemical and other industries, which are so
vital for the well being of modern man, are also potential of
causing irretrievable damage to our greatest assets like
forest, water, air and land. The threat to the human race due
to environmental degradation is very great so we have to
follow a middle path of “sustainable development” and
growth of “Green Technology”, that incorporates treatment
of air emission, waste water reduction i. e. waste man-
agement development of non conventional renewable
energy sources and recovery of resources recycle and reuse.
Keywords: Environment, natural resources, human welfare
1. INTRODUCTION
Impact of environmental science is very broad. There
has been huge growth of interest in environmental
science since 1960. The essence of environmental
science is its multidisciplinary nature [1]. It has evolved
from the integrated use of many disciplines and includes
most important topics of modern civilization [2]. Envi-
ronmental science is problem oriented i.e. it seeks new,
valid, generalizable knowledge about the natural world
and our impacts on it. It gives us ideas and information
to deal successfully with the environmental problems
[3].
2. NATURAL RESOURCES
Impact of recent scientific technology and their efforts
on the natural or renewable resources are in the follow-
ing broad areas of natural resources.
2.1 Mineral resources
The mineral resources can have several broad catego-
ries such as elements for metal production and technolo-
gy, building materials, minerals for metal production and
minerals for the chemical production and technology for
chemical industry.
Some of the suggested measures required to check the
wasteful and injudicious use of minerals are: (i) recy-
cling the minerals /metals, (ii) developing more efficient
technologies, (iii) designing smaller equipment, and (iv)
exploiting untapped deposits i. e. deep sea mining and
finding new resources for glass, ceramics, plastics,
synthetic fibres etc. and using them as substitutes for
exhaustible minerals.
2.2 Water resources
It is an important renewable resource. It is a biotic
community literally the source of life on earth. It is the
major constituent of the Hydrosphere.
The modern technology brings the advantage by
constructing hydraulic dam structures across river
valleys. The potential use could be for
irrigation,hydroelectricity, water transport to deficit
areas etc.
The efforts to improve the water resources by modern
technology are: (i) hydroelectricity generation, (ii)
ensuring a year- round water supply, (iii) transfer of
water using canals from areas of excess to areas of
deficit, (iv) flood control and soil protection, (v)
irrigation during dry periods, and (vi) multipurpose river
valley projects provide for inland water navigation can
also used to develop fish hatcheries and nurseries.
2.3Food resources
Food is the main resource for all living organisms.
Man obtains food from cultivated plants and
domesticated animals. The effects of agriculture on the
environment broadly contain global, local changes
through the entire the world.
Effect of artificial chemical fertilizers offer these
advantages for improving the plant products: (i)
fertilizers can be easier to store, handle and apply, (ii)
there is a lower risk of pathogenic contamination, (iii)
they allow intensive use of grazing land more rapidly
after treatment.
2.4 Energy resources
All living beings are operated by means of energy.
Energy is not only the pre requisite for all life forms, but
it is an important factor in the economic growth and
technical change. Solar and bioenergy are very important
in this field. So they are broadly used in (i) cooking,
heating and lighting etc., (ii) transporting people and
goods, (iii) production and convention of primary fuels.
dsramesh
Typewritten Text
27
Proceedings of the National Seminar on "Impact of Scientific Advances on Society", August 18-19, 2015, p.27-28
St. Pious X Degree & PG College for Women, Hyderabad-500076.
Sponsored by the Indian Institute of Geomagnetism, Navi Mumbai-410218 (DST, Govt. of India)
2.4.1 Solar energy
The important energy resource in the nature is sun.
The energy from the sun is solar energy .The modern
technology brings so many merits for utilization of solar
energy such as (i) solar cookers for cooking food and
solar heaters, (ii) the solar electric system fulfilling
requirement of electricity for decentralized applications,
(iii) easy installation and maintenance, and (iv) no
pollution and no charring.
2.4.2 Bio energy
It is considered as the living matter residues. It
includes all the new plant growth residues of plants,
waste herbage, agriculture and forest residues etc.
The static application of bio-energy as domestic
heating and power generation. The biogas is produced
from animal manure. Biogas is a cheap and convenient
cooking fuel. It is also used for lighting and running
small motors and providing power for cottage
industries.
3. CONCLUSION
Thus from the above discussion it is clear that the
impact of advantages of environmental science is enough
to support future generations i.e. every desirable change
in the physical, chemical and biological factors. There
were natural resources that restored quality though the
sustaining. The assimilative capacity of the
environmental science is tremendous but not infinity. It
also reveals the impact of humans upon the environment.
REFERENCES CITED
1. Pathak, A. K., Environmental Studies, 2006, Silver line
Publications.
2. Environmental Studies, 2010, Neel Kamal Publications.
3. Sharma, P.D., Ecology and Environment, 2010 (10threvised
edition), Rastogi Publications.
dsramesh
Typewritten Text
28
Proceedings of the National Seminar on "Impact of Scientific Advances on Society", August 18-19, 2015, p.29-32
St. Pious X Degree & PG College for Women, Hyderabad-500076.
Sponsored by the Indian Institute of Geomagnetism, Navi Mumbai-410218 (DST, Govt. of India)
Bacteriocin activity of an Enterococcus sp. isolated from dosa batter
K. Vindyavasini Roy*
Department of Microbiology, St. Pious X Degree & PG College for Women, Nacharam, Hyderabad-500076,Telangana, India
ABSTRACT
Bacteriocins are antibacterial proteins or peptides produced
by bacteria. Lactic acid bacteria(LAB) are capable of
producing a variety of bacteriocins with activity against food borne pathogens and hence are of interest as they have
potential role as food preservatives. Growing consumer
awareness about the deleterious effects of chemical preser-
vatives in food has led to their preference for natural or organic foods. In this scenario application of bacteriocins or
bacteriocin producing cultures in food preservation is
gaining importance. Use of either bacteriocin producing LAB strains, which are generally regarded as safe (GRAS),
or their bacteriocins in food production and packaging
could have a positive effect on food preservation and safety. Fifteen LAB were isolated from diary and fermented foods
and were evaluated for their antibacterial activity. An
isolate D1 from Dosa batter was found to exhibit good
antibacterial activity. This isolate was identified as Entero-
coccus sps.
Keywords: Bacteriocin, lactic acid bacteria, antimicrobial activity
1. INTRODUCTION
Bacteriocins are extracellularly released peptides or
proteins produced by bacteria, which exhibit antimi-
crobial action against other bacteria, especially closely related Species. They are not termed antibiotics as they
differ from therapeutic antibiotics in being proteinaceous
agents, which are rapidly digested by proteases in the human digestive tract. Bacteriocin production can be
considered as an advantage for food and feed producers
since, even in insufficient amounts; these peptides can
kill or inhibit pathogenic bacteria that compete for the same ecological niche or nutrient pool. This role is
supported by the fact that many bacteriocins have a
narrow host range, and are likely to be most effective against related bacteria with similar nutritive demand
[1]. Several types of bacteriocins from food-associated
lactic acid bacteria have been identified and characte-
rized, the important ones being Nisin, Bacteriocin, Diplococcin, Acidophilin, Bulgaricin, Helveticins,
Lactacins and Plantaricins [2]. Apart from food asso-
ciated lactic acid bacteria the nonfood lactic acid bacte-ria, such as enterococci and streptococci, have also been
scrutinized for bacteriocin production, and many publi-
cations have shown that they are producers of such
antimicrobial peptides [3-5]. Some enterococci are actually part of the main fermenting flora of dairy and
meat products and among the dominant lactic acid
bacteria in the intestinal flora of mammals and other
animals. Bacteriocins as biopreservatives have a great potential
and can replace chemical preservatives in food products
because they are non-toxic , easily degradable and stable in a wide range of pH and temperature [6].The
purpose of the current study was to isolate and charac-
terize bacteriocin producing lactic acid bacteria from dairy and fermented food products and evaluate their
antibacterial activity.
2. MATERIALS AND METHODS
2.1 Sample collection
The dairy products like milk, curd, yoghurt, but-
termilk were collected from the local markets in
Hyderabad. The fermented dosa and idli batters
were obtained from different households in sterile
containers. All the samples were stored in cold 40C
till processed.
2.2 Isolation and identification
Samples like milk, curd, buttermilk, dosa and idli bat-
ters were diluted tenfold and 0.1ml of 10-2
, 10-3
, 10-4
samples was plated on de Man Rogosa agar (MRS agar HI Media laboratories Pvt ltd). Samples like cabbage
and cucumber were chopped into small pieces and one
gram of the samples were mixed in sterile saline and
tenfold dilutions were prepared and plated on de Man Rogosa agar (MRS agar – HI Media laboratories Pvt ltd).
The plates were incubated at 37°C for 24 hours in an
anaerobic gas pak system (HI Media laboratories Pvt ltd). The isolates obtained were identified on the basis of
growth, cell morphology, gram staining, catalase activity
and carbohydrate fermentation tests.
2.3 Production of crude bacteriocin
The isolated Lactic acid bacilli strains were grown in
MRS broth (Hi Media Laboratory Pvt Ltd., India) (pH-6.0) using 5% inoculum of overnight culture and incu-
bated anaerobically at 37oC for 48 h. After incubation,
cells were removed from the growth medium by centri-fugation 10,000×g for 15 min, 4ºC.The cell-free superna-
dsramesh
Typewritten Text
dsramesh
Typewritten Text
dsramesh
Typewritten Text
29
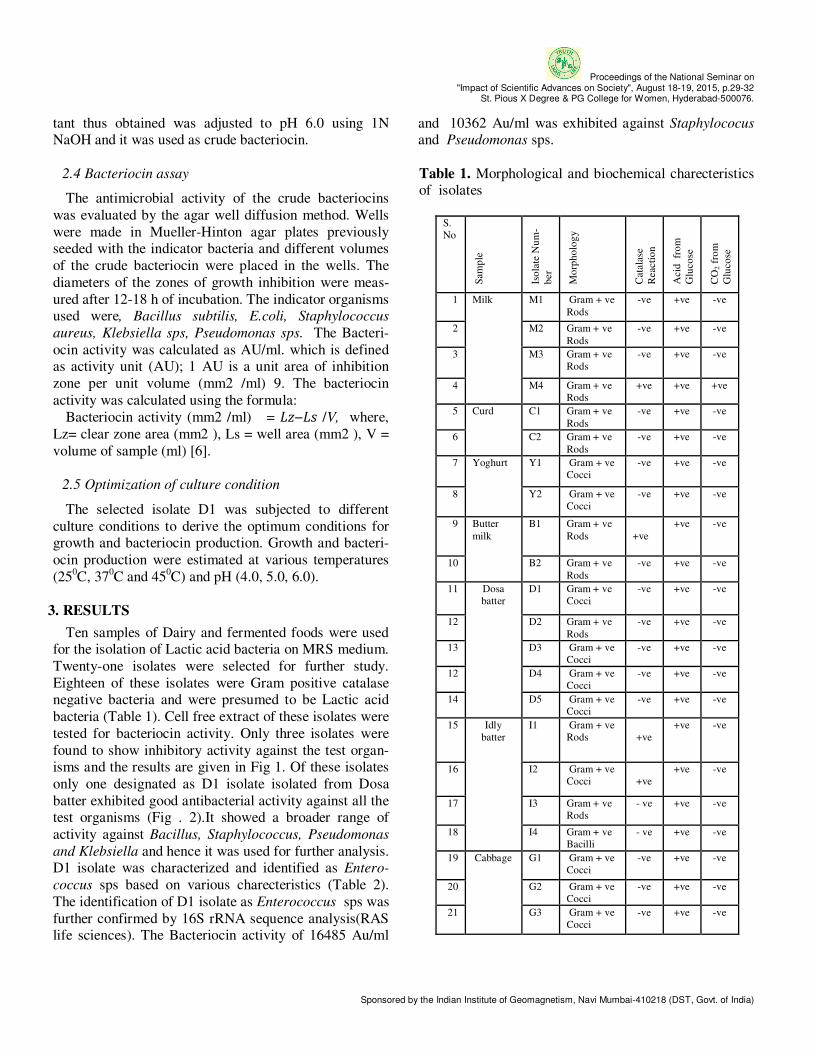
Proceedings of the National Seminar on "Impact of Scientific Advances on Society", August 18-19, 2015, p.29-32
St. Pious X Degree & PG College for Women, Hyderabad-500076.
Sponsored by the Indian Institute of Geomagnetism, Navi Mumbai-410218 (DST, Govt. of India)
tant thus obtained was adjusted to pH 6.0 using 1N NaOH and it was used as crude bacteriocin.
2.4 Bacteriocin assay
The antimicrobial activity of the crude bacteriocins
was evaluated by the agar well diffusion method. Wells
were made in Mueller-Hinton agar plates previously seeded with the indicator bacteria and different volumes
of the crude bacteriocin were placed in the wells. The
diameters of the zones of growth inhibition were meas-
ured after 12-18 h of incubation. The indicator organisms used were, Bacillus subtilis, E.coli, Staphylococcus
aureus, Klebsiella sps, Pseudomonas sps. The Bacteri-
ocin activity was calculated as AU/ml. which is defined as activity unit (AU); 1 AU is a unit area of inhibition
zone per unit volume (mm2 /ml) 9. The bacteriocin
activity was calculated using the formula:
Bacteriocin activity (mm2 /ml) = ��−�� /V, where,
Lz= clear zone area (mm2 ), Ls = well area (mm2 ), V =
volume of sample (ml) [6].
2.5 Optimization of culture condition
The selected isolate D1 was subjected to different
culture conditions to derive the optimum conditions for growth and bacteriocin production. Growth and bacteri-
ocin production were estimated at various temperatures
(250C, 37
0C and 45
0C) and pH (4.0, 5.0, 6.0).
3. RESULTS
Ten samples of Dairy and fermented foods were used for the isolation of Lactic acid bacteria on MRS medium.
Twenty-one isolates were selected for further study.
Eighteen of these isolates were Gram positive catalase negative bacteria and were presumed to be Lactic acid
bacteria (Table 1). Cell free extract of these isolates were
tested for bacteriocin activity. Only three isolates were
found to show inhibitory activity against the test organ-isms and the results are given in Fig 1. Of these isolates
only one designated as D1 isolate isolated from Dosa
batter exhibited good antibacterial activity against all the test organisms (Fig . 2).It showed a broader range of
activity against Bacillus, Staphylococcus, Pseudomonas
and Klebsiella and hence it was used for further analysis. D1 isolate was characterized and identified as Entero-
coccus sps based on various charecteristics (Table 2).
The identification of D1 isolate as Enterococcus sps was
further confirmed by 16S rRNA sequence analysis(RAS life sciences). The Bacteriocin activity of 16485 Au/ml
and 10362 Au/ml was exhibited against Staphylococus
and Pseudomonas sps.
Table 1. Morphological and biochemical charecteristics of isolates
S.
No
Sam
ple
Iso
late
Nu
m-
ber
Mo
rph
olo
gy
Cata
lase
Reacti
on
Acid
fr
om
Glu
co
se
CO
2 f
rom
Glu
co
se
1 Milk M1 Gram + ve
Rods
-ve +ve -ve
2 M2 Gram + ve
Rods
-ve +ve -ve
3 M3 Gram + ve
Rods
-ve +ve -ve
4 M4 Gram + ve
Rods
+ve +ve +ve
5 Curd C1 Gram + ve
Rods
-ve +ve -ve
6 C2 Gram + ve
Rods
-ve +ve -ve
7 Yoghurt Y1 Gram + ve
Cocci
-ve +ve -ve
8 Y2 Gram + ve
Cocci
-ve +ve -ve
9 Butter
milk
B1 Gram + ve
Rods
+ve
+ve -ve
10 B2 Gram + ve
Rods
-ve +ve -ve
11 Dosa
batter
D1 Gram + ve
Cocci
-ve +ve -ve
12 D2 Gram + ve
Rods
-ve +ve -ve
13 D3 Gram + ve
Cocci
-ve +ve -ve
12 D4 Gram + ve
Cocci
-ve +ve -ve
14 D5 Gram + ve
Cocci
-ve +ve -ve
15 Idly
batter
I1 Gram + ve
Rods
+ve
+ve -ve
16 I2 Gram + ve
Cocci
+ve
+ve -ve
17 I3 Gram + ve
Rods
- ve +ve -ve
18 I4 Gram + ve
Bacilli
- ve +ve -ve
19 Cabbage G1 Gram + ve
Cocci
-ve +ve -ve
20 G2 Gram + ve
Cocci
-ve +ve -ve
21 G3 Gram + ve
Cocci
-ve +ve -ve
dsramesh
Typewritten Text
30

Proceedings of the National Seminar on "Impact of Scientific Advances on Society", August 18-19, 2015, p.29-32
St. Pious X Degree & PG College for Women, Hyderabad-500076.
Sponsored by the Indian Institute of Geomagnetism, Navi Mumbai-410218 (DST, Govt. of India)
Figure 1. Antibacterial activity of lactic acid bacteria
isolates.
Table 2. Characteristics of D1 isolate
Gram Reaction +ve
Catalase -ve
Acid from glucose +ve
CO2 from glucose - ve
Growth at 450C +ve
Growth in presence of 6.5% NaCl +ve
Figure 2. Antibacterial activity of D1 isolate.
The growth pattern of the Enterococcus isolate was
studied by measuring the absorbance at 620nm. A lag
period of 10 hours was observed, maximum growth was
seen at 24 hours and then the growth plateaued (Fig. 3). The Enterococcus isolate showed maximum growth at
370C and pH 6 (Fig. 4).
Figure 3. Growth pattern of Enterococcus isolate.
Figure 4. Effect of Temperature and pH on growth of
D1 isolate.
4. DISCUSSION
Different authors have reported isolation of bacteriocin
producing enterococci from foods [7] and from animals [8]. Strong anti-listerial activity of bacteriocins produced
by enterococci has also been reported in several matrices
e.g. cheese, fermented meat products, canine feed,
horses and rabbits faeces [4, 9, 10]. This study also shows presence of bacteriocin
producing enterococci in fermented foods having good
antimicrobial activity against common bacteria. The isolate D1 exhibited good antibacterial activity against
Pseudomonas sps which are usually resistant to various
antimicrobial agents. However, this study is limited as the activity was not tested against food borne pathogens
like Salmonella, Listeria etc. The emergence of multiple
antibiotic-resistant enterococci among agents of
nosocomial disease and the presence of virulence factors among food isolates requires a careful safety evaluation
of isolates intended for potential biotechnical use.
Further evaluation of this enterococcal bacteriocin may
dsramesh
Typewritten Text
31
dsramesh
Typewritten Text
Proceedings of the National Seminar on "Impact of Scientific Advances on Society", August 18-19, 2015, p.29-32
St. Pious X Degree & PG College for Women, Hyderabad-500076.
Sponsored by the Indian Institute of Geomagnetism, Navi Mumbai-410218 (DST, Govt. of India)
provide information as to its potential application in food
preservation.
REFERENCES CITED
1. Deegan, L.H., Cotter, P.D., Hill, C., and Ross, P., Int.
Dairy J., 2006, v. 16, p. 1058-1071. 2. Nettles, C.G., and Barefoot, S.F., Journal of Food
Protection, 1993, v. 56, p. 338-356.
3. Henning, C., Gautam, D., and Muriana, P.,
Microorganisms, 2015, v. 3, p. 1-16.
4. Giraffa, G., Food Microbiology, 1995, v. 12, p. 291–299.
5. Franz, C.M., van Belkum, M.J., Holzapfel,W.H., Abriouel, H., and Gálvez, A., FEMS Microbiol. Rev., (2007, v.
31(3), p. 293-310.
6. Usmiati, S., and Marwati, T., Indonesian Journal of
Agriculture, 2009, v. 2(2), p. 82.
7. Tulini, F.L., Gomes, B.C., and de Martinis, E.C.P., Food
Science and Technology, 2011, v.31(1), p. 155-159.
8. Shin, M.S., Han, S.K., Ji, A.R., Kim, K.S., and Lee, W.K.,
J. Appl. Microbiol., 2008, v. 105(6), p. 2203-2212.
9. Ennahar, S., Aoude-Werner, D., Assobhei, O., and
Hasselmann, C., J. Appl. Microbiol., 1998, v. 85(3), p.521-
526.
10. Yenizey M. Alvarez-Cisneros, Francisco J. Fernández,
Carmen Wacher-Rodarte, Manuel B. Aguilar, Teresita del
Rosario Sáinz Espuñes, and Edith Ponce-Alquicira, J. Sci.
Food Agric., 2010, v. 90(14), p. 2475-2481.
dsramesh
Typewritten Text
32
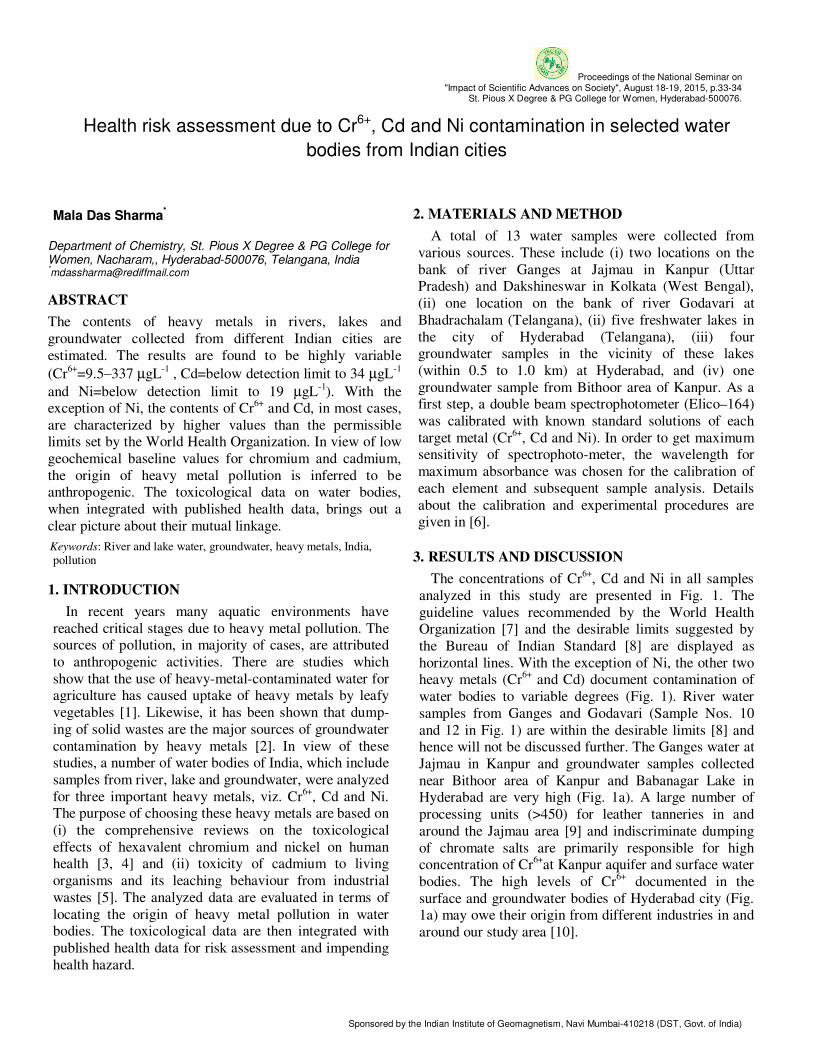
Proceedings of the National Seminar on "Impact of Scientific Advances on Society", August 18-19, 2015, p.33-34
St. Pious X Degree & PG College for Women, Hyderabad-500076.
Sponsored by the Indian Institute of Geomagnetism, Navi Mumbai-410218 (DST, Govt. of India)
Health risk assessment due to Cr6+, Cd and Ni contamination in selected water
bodies from Indian cities
Mala Das Sharma*
Department of Chemistry, St. Pious X Degree & PG College for Women, Nacharam,, Hyderabad-500076, Telangana, India *[email protected]
ABSTRACT
The contents of heavy metals in rivers, lakes and
groundwater collected from different Indian cities are
estimated. The results are found to be highly variable
(Cr6+
=9.5‒337 µgL-1
, Cd=below detection limit to 34 µgL-1
and Ni=below detection limit to 19 µgL-1
). With the exception of Ni, the contents of Cr
6+ and Cd, in most cases,
are characterized by higher values than the permissible limits set by the World Health Organization. In view of low
geochemical baseline values for chromium and cadmium,
the origin of heavy metal pollution is inferred to be anthropogenic. The toxicological data on water bodies,
when integrated with published health data, brings out a
clear picture about their mutual linkage.
Keywords: River and lake water, groundwater, heavy metals, India, pollution
1. INTRODUCTION
In recent years many aquatic environments have
reached critical stages due to heavy metal pollution. The sources of pollution, in majority of cases, are attributed
to anthropogenic activities. There are studies which
show that the use of heavy-metal-contaminated water for agriculture has caused uptake of heavy metals by leafy
vegetables [1]. Likewise, it has been shown that dump-
ing of solid wastes are the major sources of groundwater
contamination by heavy metals [2]. In view of these studies, a number of water bodies of India, which include
samples from river, lake and groundwater, were analyzed
for three important heavy metals, viz. Cr6+
, Cd and Ni. The purpose of choosing these heavy metals are based on
(i) the comprehensive reviews on the toxicological
effects of hexavalent chromium and nickel on human health [3, 4] and (ii) toxicity of cadmium to living
organisms and its leaching behaviour from industrial
wastes [5]. The analyzed data are evaluated in terms of
locating the origin of heavy metal pollution in water bodies. The toxicological data are then integrated with
published health data for risk assessment and impending
health hazard.
2. MATERIALS AND METHOD
A total of 13 water samples were collected from
various sources. These include (i) two locations on the
bank of river Ganges at Jajmau in Kanpur (Uttar Pradesh) and Dakshineswar in Kolkata (West Bengal),
(ii) one location on the bank of river Godavari at
Bhadrachalam (Telangana), (ii) five freshwater lakes in
the city of Hyderabad (Telangana), (iii) four groundwater samples in the vicinity of these lakes
(within 0.5 to 1.0 km) at Hyderabad, and (iv) one
groundwater sample from Bithoor area of Kanpur. As a first step, a double beam spectrophotometer (Elico–164)
was calibrated with known standard solutions of each
target metal (Cr6+
, Cd and Ni). In order to get maximum sensitivity of spectrophoto-meter, the wavelength for
maximum absorbance was chosen for the calibration of
each element and subsequent sample analysis. Details
about the calibration and experimental procedures are given in [6].
3. RESULTS AND DISCUSSION
The concentrations of Cr6+
, Cd and Ni in all samples
analyzed in this study are presented in Fig. 1. The
guideline values recommended by the World Health Organization [7] and the desirable limits suggested by
the Bureau of Indian Standard [8] are displayed as
horizontal lines. With the exception of Ni, the other two heavy metals (Cr
6+ and Cd) document contamination of
water bodies to variable degrees (Fig. 1). River water
samples from Ganges and Godavari (Sample Nos. 10
and 12 in Fig. 1) are within the desirable limits [8] and hence will not be discussed further. The Ganges water at
Jajmau in Kanpur and groundwater samples collected
near Bithoor area of Kanpur and Babanagar Lake in Hyderabad are very high (Fig. 1a). A large number of
processing units (>450) for leather tanneries in and
around the Jajmau area [9] and indiscriminate dumping
of chromate salts are primarily responsible for high concentration of Cr
6+at Kanpur aquifer and surface water
bodies. The high levels of Cr6+
documented in the
surface and groundwater bodies of Hyderabad city (Fig. 1a) may owe their origin from different industries in and
around our study area [10].
dsramesh
Typewritten Text
33
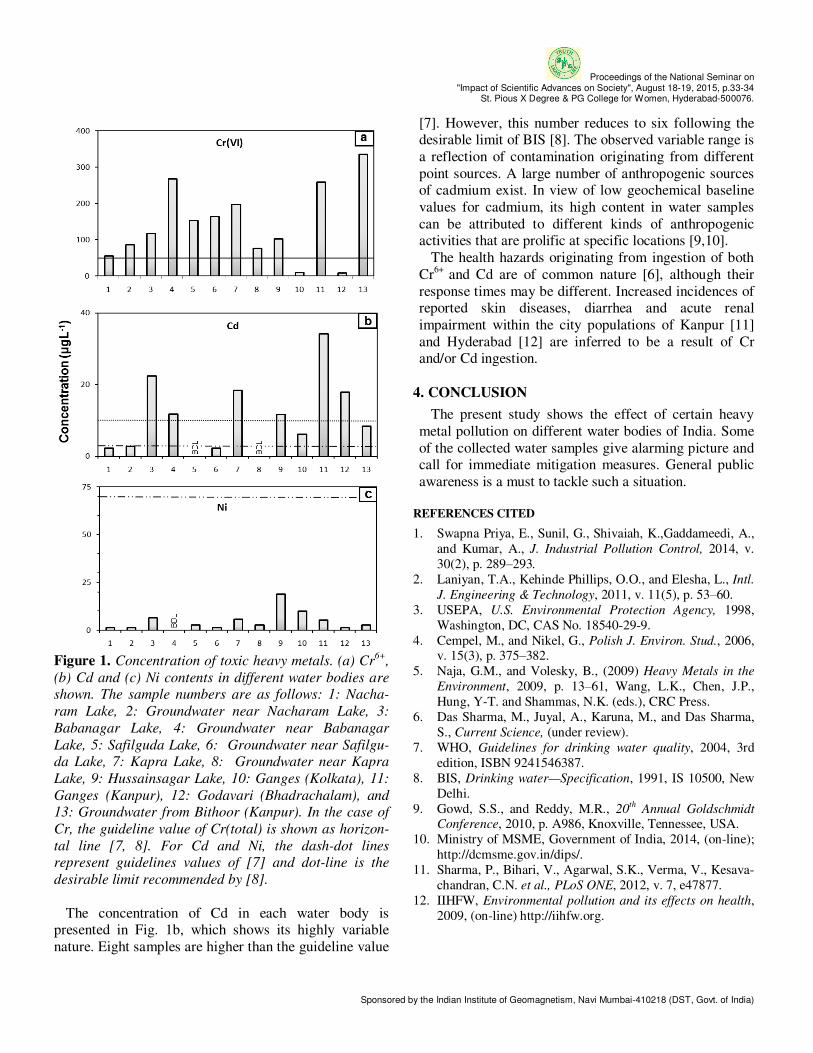
Proceedings of the National Seminar on "Impact of Scientific Advances on Society", August 18-19, 2015, p.33-34
St. Pious X Degree & PG College for Women, Hyderabad-500076.
Sponsored by the Indian Institute of Geomagnetism, Navi Mumbai-410218 (DST, Govt. of India)
Figure 1. Concentration of toxic heavy metals. (a) Cr
6+,
(b) Cd and (c) Ni contents in different water bodies are
shown. The sample numbers are as follows: 1: Nacha-
ram Lake, 2: Groundwater near Nacharam Lake, 3:
Babanagar Lake, 4: Groundwater near Babanagar
Lake, 5: Safilguda Lake, 6: Groundwater near Safilgu-
da Lake, 7: Kapra Lake, 8: Groundwater near Kapra
Lake, 9: Hussainsagar Lake, 10: Ganges (Kolkata), 11:
Ganges (Kanpur), 12: Godavari (Bhadrachalam), and
13: Groundwater from Bithoor (Kanpur). In the case of
Cr, the guideline value of Cr(total) is shown as horizon-
tal line [7, 8]. For Cd and Ni, the dash-dot lines
represent guidelines values of [7] and dot-line is the
desirable limit recommended by [8].
The concentration of Cd in each water body is presented in Fig. 1b, which shows its highly variable
nature. Eight samples are higher than the guideline value
[7]. However, this number reduces to six following the desirable limit of BIS [8]. The observed variable range is
a reflection of contamination originating from different
point sources. A large number of anthropogenic sources of cadmium exist. In view of low geochemical baseline
values for cadmium, its high content in water samples
can be attributed to different kinds of anthropogenic activities that are prolific at specific locations [9,10].
The health hazards originating from ingestion of both
Cr6+
and Cd are of common nature [6], although their
response times may be different. Increased incidences of reported skin diseases, diarrhea and acute renal
impairment within the city populations of Kanpur [11]
and Hyderabad [12] are inferred to be a result of Cr and/or Cd ingestion.
4. CONCLUSION
The present study shows the effect of certain heavy
metal pollution on different water bodies of India. Some
of the collected water samples give alarming picture and call for immediate mitigation measures. General public
awareness is a must to tackle such a situation.
REFERENCES CITED
1. Swapna Priya, E., Sunil, G., Shivaiah, K.,Gaddameedi, A.,
and Kumar, A., J. Industrial Pollution Control, 2014, v.
30(2), p. 289‒293.
2. Laniyan, T.A., Kehinde Phillips, O.O., and Elesha, L., Intl.
J. Engineering & Technology, 2011, v. 11(5), p. 53‒60.
3. USEPA, U.S. Environmental Protection Agency, 1998,
Washington, DC, CAS No. 18540-29-9.
4. Cempel, M., and Nikel, G., Polish J. Environ. Stud., 2006, v. 15(3), p. 375‒382.
5. Naja, G.M., and Volesky, B., (2009) Heavy Metals in the
Environment, 2009, p. 13‒61, Wang, L.K., Chen, J.P.,
Hung, Y-T. and Shammas, N.K. (eds.), CRC Press.
6. Das Sharma, M., Juyal, A., Karuna, M., and Das Sharma,
S., Current Science, (under review).
7. WHO, Guidelines for drinking water quality, 2004, 3rd
edition, ISBN 9241546387.
8. BIS, Drinking water—Specification, 1991, IS 10500, New
Delhi.
9. Gowd, S.S., and Reddy, M.R., 20th
Annual Goldschmidt
Conference, 2010, p. A986, Knoxville, Tennessee, USA.
10. Ministry of MSME, Government of India, 2014, (on-line);
http://dcmsme.gov.in/dips/.
11. Sharma, P., Bihari, V., Agarwal, S.K., Verma, V., Kesava-
chandran, C.N. et al., PLoS ONE, 2012, v. 7, e47877.
12. IIHFW, Environmental pollution and its effects on health,
2009, (on-line) http://iihfw.org.
dsramesh
Typewritten Text
34
Proceedings of the National Seminar on "Impact of Scientific Advances on Society", August 18-19, 2015, p.35-39
St. Pious X Degree & PG College for Women, Hyderabad-500076.
Sponsored by the Indian Institute of Geomagnetism, Navi Mumbai-410218 (DST, Govt. of India)
Spectrophotometric determination of molybdenum (VI)
M. Bala Raju* and R. Mohan Reddy
Department of Chemistry, PSC & KVSC Govt. College,
Nandyal- 518502, Kurnool District, Andhra Pradesh, India *[email protected]
ABSTRACT
Molybdenum (VI) forms yellow colored water soluble
complex with 2,4-Dihydroxybenzaldehyde-p-
hydroxybenzoylhydrazone(2,4-DHBPHBH) in the pH
range of 1.0 to 7.0. The complex has an absorption
maximum at 415 nm. The reagent has negligible
absorbance at 415 nm. Hence, analytical studies are
made at 415 nm. Absorbance is maximum and con-
stant in the pH range of 2.0 to 3.5. Hence, pH 3.0 is
selected for further studies. The linear plot between the
absorbance and the amount of Mo(VI) indicates that
Beer’s law is obeyed in the range of 0.479–11.993
µg/ml of Mo(VI). The molar absorptivity and San-
dell’s selectivity are 0.864 ± 0.002 x 10⁴ l mol
– 1 cm
–
1and 0.0090 µg/cm
2 respectively. The standard devia-
tion of the method for ten determinations of 4.797
µg/ml of Mo(VI) is 0.008. The correlation coefficient
(γ) of the calibration equation of the experimental data
is 0.9999. The effective range of concentration for
accurate determination of Mo(VI) as ascertained from
Ringbom plot is 0.500 to 10.990 µg/ml.
Keywords: Molybdenum(VI), 2,4-DHBPHBH, Sandell’s selectivity Ringbom plot
1. INTRODUCTION
Molybdenum is an important transition metal in agri-
culture and metallurgy. Its chemistry is very complex in
nature. The compounds containing molybdenum in 0,+2,
+3, +5 and +6 oxidation states are known to exist. About 85 percent molybdenum that is being produced is used in
manufacture of iron based alloys. Molybdenum is added
to the cast iron to increase its strength which is widely used in the manufacture of automobile engines. Because
of the properties such as strength, stiffness, electrical and
thermal conductivity and corrosion resistance, the alloys of molybdenum find numerous industrial applications.
Molybdenum when added in the form of fertilizer,
large increase in the crops yields, particularly legumin-
ous, have been observed. It is added in trace amounts in vitamin supplements and specialized medicines. Recent
studies have shown that molybdenum is an important
element in promoting healthy teeth. Molybdenum is
being used as catalyst in many petroleum and chemical
processes. It is used as activator or promoter of other catalysts.
The number of chromogenic reagents available for
molybdenum is relatively small. Of these the thiocya-
nate-tin (II) chloride method is the oldest and most widely used. However, even this method suffers from a
number of limiting factors [1, 2] such as variations of
absorbance with thiocyanate, tin (II) chloride and hydro-gen ion concentrations, interference from various metal
ions and problems of stability and reproducibility of
measurements. Among the reagents employed dithiol [3-5]
is popular because of its selectivity, sensitivity.
However, the reaction between molybdenum and dithiol
is more rapid at higher temperatures (750C) and heating
is not possible in the presence of tungsten, which reacts with dithiol. Most of the methods are extraction methods
[6,7]. Only a few methods are reported using benzoyl
hydrazone derivatives. Podcahinova [8]
reported a paper in 1974 for spectro-
photometric determination of molybdenum(VI) with 2-
hydroxy-1-napthaldehyde isonicotinoylhydrazone which
suffers from interference of Fe(III). Rao et al. [9]
determined Mo(VI) with resacetophenone-
isonicotinolyhydrazone spectrophotometrically, kavlentis
in1986 presented a paper describing the spectrophotome-tric determination of molybdenum [10]
with salicylalde-
hyde isonicotinoylhydrazone. Murthy et al. [11] in 1988
determined molybdenum spectrophotomertically with salicylaldioxime isonicotinoylhydrazone.
In view of greater importance of molybdenum(VI) in
agriculture, industry and biological activity, the author
has undertaken a detailed study of the colour reaction between Mo(VI) and 2,4-DHBPHBP to develop a new
sensitive spectrophotometric method for the determina-
tion of Mo(VI) and the results are presented .
2. PRESENT INVESTIGATION
2,4-DHBPHBH forms yellow colored water soluble
complex with molybdenum(VI) in the pH range of 1.0 to
7.0. The yellow solution is, therefore, investigated
spectrophometrically for the possible determination of micro amounts of molybdenum(VI).
2.1 Absorption spectra of the reagent and the experi-
mental solution
The absorption spectra of the reagent solution against
corresponding buffer blank and the experimental solu-
tion containing solutions of the reagent the buffer (pH
dsramesh
Typewritten Text
35

Proceedings of the National Seminar on "Impact of Scientific Advances on Society", August 18-19, 2015, p.35-39
St. Pious X Degree & PG College for Women, Hyderabad-500076.
Sponsored by the Indian Institute of Geomagnetism, Navi Mumbai-410218 (DST, Govt. of India)
3.0) against the reagent blank are recorded in the wave-length range 365 nm to 600 nm. The typical spectra are
presented in Fig. 1.
4 0 0 4 5 0 5 0 0 5 5 0 6 0 0
0 . 0
0 . 2
0 . 4
0 . 6
0 . 8
1 . 0
b
a
Ab
so
rba
nc
e
W a v e l e n g t h ( n m )
Figure 1. Absorption spectra of (a) 2,4 – DHBPHBH Vs
buffer blank, (b) [Mo (VI)] - 2,4 – DHBPHBH Vs
reagent blank.[Mo (VI)] = 5 x 10⁻⁵
M ; [2,4 DHBPHBH]
= 1.0 x 10⁻³
M, pH = 3.0.
The spectra presented in Fig.1 shows that the complex
has an absorption maximum at 415 nm. The reagent has
negligible absorbance at 415 nm. Hence, analytical
studies are made at 415 nm.
2.2 Effect of pH on the absorbance of experimental
solution
The optimum pH required for the maximum colour development is established from the results obtained in
the experiment carried out. The plot drawn between
absorbance and pH (Fig. 2) indicates that the absorbance is maximum and constant in the pH range of 2.0 to 3.5.
Hence, pH 3.0 is selected for further studies.
2.3 Effect of 2,4- DHBPHBH concentration on the
absorbance of the experimental solution
The optimum concentration of 2,4-DHBPHBH
required for achieving maximum absorbance is arrived at
by following the procedure in 3.d and the results are presented in Table 1.
1 2 3 4 5 6 7
0 .0
0 .1
0 .2
0 .3
0 .4
0 .5
Absorb
an
ce
pH
Figure 2. Effect of pH on absorbance of [Mo (VI)] - 2,4
– DHBPHBH system.[Mo (VI)] = 5 x 10⁻⁵
M; [2,4 –
DHBPHBH]=1.0 x 10⁻³
M, λ = 420 nm.
Table 1. Effect of 2,4-DHBPHBH concentration on the absorbance of experimental solutions, [Mo(VI)] = 5.0 x
10-5M ; pH = 3.0 ; λ = 415 nm
[2,4-DHBPHBH] : [MO(VI)] Absorbance
1: 2 0.179
1:5 0.258
1:10 0.429
1:20 0.432
1:60 0.433
1:80 0.429
The results in Table 1 indicates that a 10 molar excess
of the reagent is necessary for achieving maximum absorbance. Hence, the same ratio is maintained
throughout the studies.
2.4 Order of addition of constituent solutions on the
absorbance of the experimental solution
The order of addition of the constituent solutions
(buffer solution, Mo(VI) and the reagent solution) has no
effect on the absorbance of the experimental solutions. Hence, it is not necessary to adhere to a particular order
of addition of various constituents of the experimental
solution.
2.5 Effect of time on colour development and stability
of the colour
To study the effect of time on the absorbance, it shows that the colour development is instantaneous and
remains constant for 20 hours.
dsramesh
Typewritten Text
36
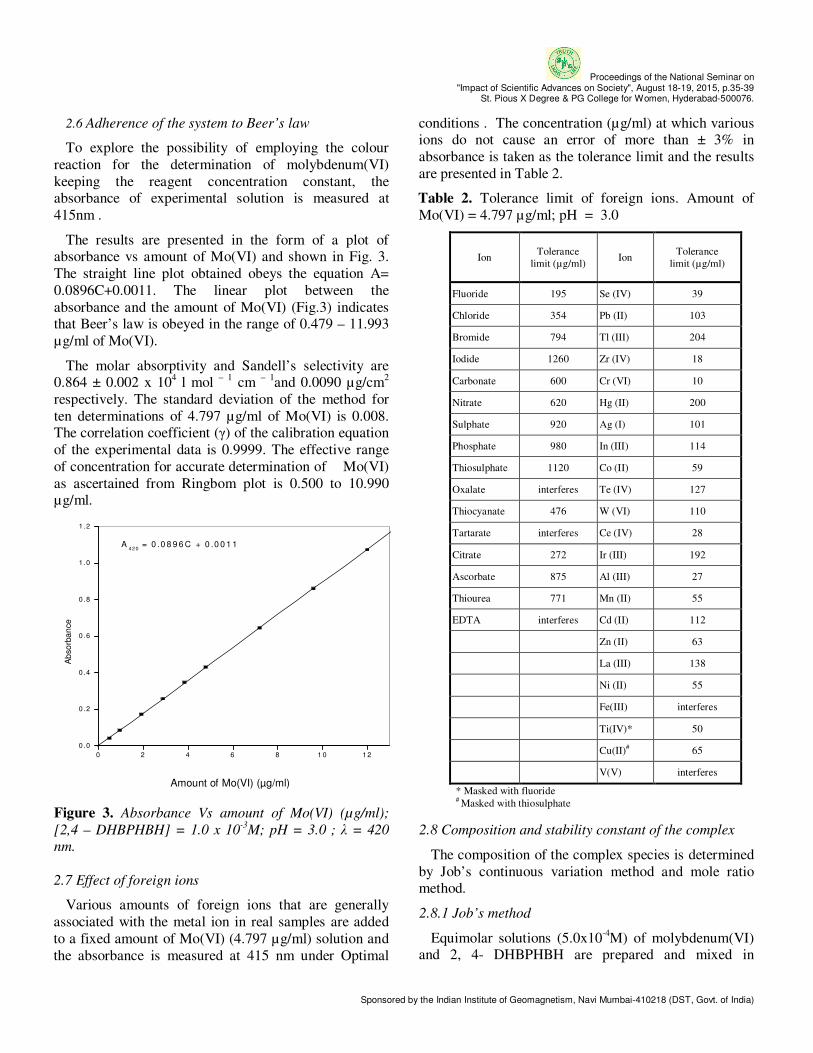
Proceedings of the National Seminar on "Impact of Scientific Advances on Society", August 18-19, 2015, p.35-39
St. Pious X Degree & PG College for Women, Hyderabad-500076.
Sponsored by the Indian Institute of Geomagnetism, Navi Mumbai-410218 (DST, Govt. of India)
2.6 Adherence of the system to Beer’s law
To explore the possibility of employing the colour
reaction for the determination of molybdenum(VI)
keeping the reagent concentration constant, the absorbance of experimental solution is measured at
415nm .
The results are presented in the form of a plot of absorbance vs amount of Mo(VI) and shown in Fig. 3.
The straight line plot obtained obeys the equation A=
0.0896C+0.0011. The linear plot between the
absorbance and the amount of Mo(VI) (Fig.3) indicates that Beer’s law is obeyed in the range of 0.479 – 11.993
µg/ml of Mo(VI).
The molar absorptivity and Sandell’s selectivity are 0.864 ± 0.002 x 10
4 l mol
– 1 cm
– 1and 0.0090 µg/cm
2
respectively. The standard deviation of the method for
ten determinations of 4.797 µg/ml of Mo(VI) is 0.008. The correlation coefficient (γ) of the calibration equation
of the experimental data is 0.9999. The effective range
of concentration for accurate determination of Mo(VI)
as ascertained from Ringbom plot is 0.500 to 10.990 µg/ml.
0 2 4 6 8 1 0 1 2
0 .0
0 .2
0 .4
0 .6
0 .8
1 .0
1 .2
A4 2 0
= 0 .0 8 9 6 C + 0 .0 0 1 1
Ab
so
rba
nce
Amount of Mo(VI) (µg/ml)
Figure 3. Absorbance Vs amount of Mo(VI) (µg/ml);
[2,4 – DHBPHBH] = 1.0 x 10⁻³
M; pH = 3.0 ; λ = 420
nm.
2.7 Effect of foreign ions
Various amounts of foreign ions that are generally
associated with the metal ion in real samples are added
to a fixed amount of Mo(VI) (4.797 µg/ml) solution and
the absorbance is measured at 415 nm under Optimal
conditions . The concentration (µg/ml) at which various ions do not cause an error of more than ± 3% in
absorbance is taken as the tolerance limit and the results
are presented in Table 2.
Table 2. Tolerance limit of foreign ions. Amount of
Mo(VI) = 4.797 µg/ml; pH = 3.0
Ion Tolerance
limit (µg/ml) Ion
Tolerance
limit (µg/ml)
Fluoride 195 Se (IV) 39
Chloride 354 Pb (II) 103
Bromide 794 Tl (III) 204
Iodide 1260 Zr (IV) 18
Carbonate 600 Cr (VI) 10
Nitrate 620 Hg (II) 200
Sulphate 920 Ag (I) 101
Phosphate 980 In (III) 114
Thiosulphate 1120 Co (II) 59
Oxalate interferes Te (IV) 127
Thiocyanate 476 W (VI) 110
Tartarate interferes Ce (IV) 28
Citrate 272 Ir (III) 192
Ascorbate 875 Al (III) 27
Thiourea 771 Mn (II) 55
EDTA interferes Cd (II) 112
Zn (II) 63
La (III) 138
Ni (II) 55
Fe(III) interferes
Ti(IV)* 50
Cu(II)# 65
V(V) interferes
* Masked with fluoride # Masked with thiosulphate
2.8 Composition and stability constant of the complex
The composition of the complex species is determined
by Job’s continuous variation method and mole ratio method.
2.8.1 Job’s method
Equimolar solutions (5.0x10⁻⁴M) of molybdenum(VI)
and 2, 4- DHBPHBH are prepared and mixed in
dsramesh
Typewritten Text
37
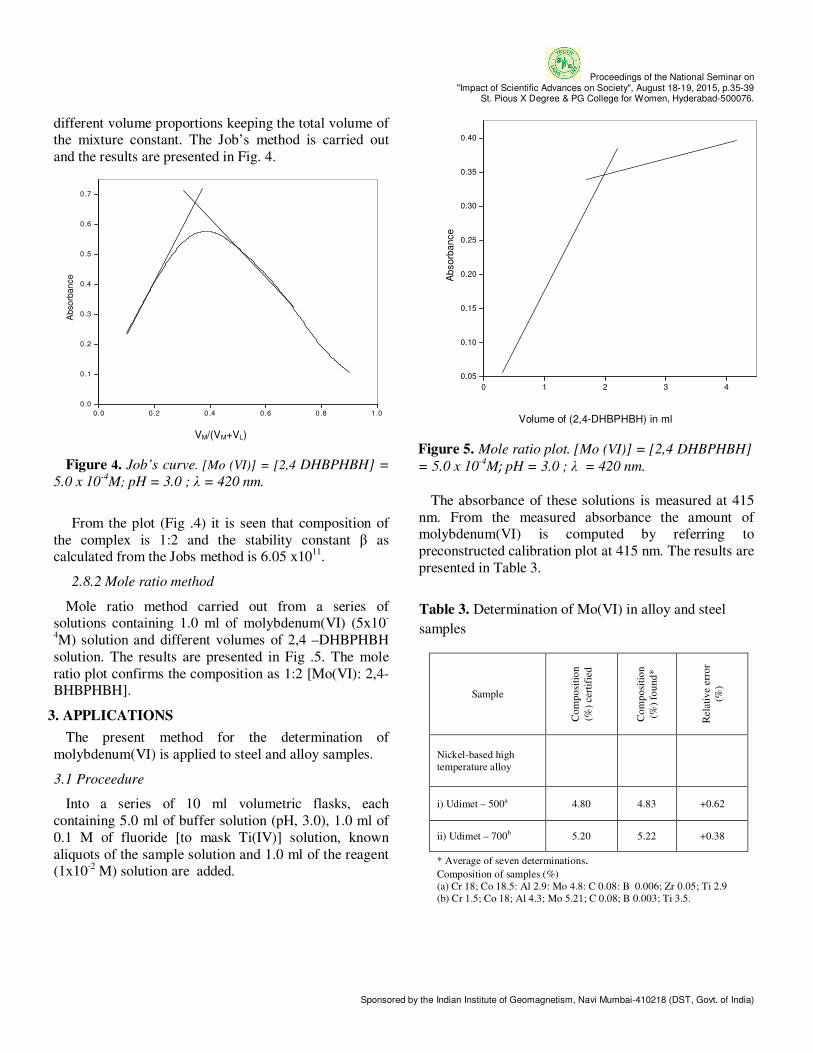
Proceedings of the National Seminar on "Impact of Scientific Advances on Society", August 18-19, 2015, p.35-39
St. Pious X Degree & PG College for Women, Hyderabad-500076.
Sponsored by the Indian Institute of Geomagnetism, Navi Mumbai-410218 (DST, Govt. of India)
different volume proportions keeping the total volume of the mixture constant. The Job’s method is carried out
and the results are presented in Fig. 4.
0.0 0 .2 0 .4 0.6 0 .8 1 .0
0 .0
0 .1
0 .2
0 .3
0 .4
0 .5
0 .6
0 .7
Ab
so
rba
nce
VM/(VM+VL)
Figure 4. Job’s curve. [Mo (VI)] = [2,4 DHBPHBH] =
5.0 x 10⁻⁴
M; pH = 3.0 ; λ = 420 nm.
From the plot (Fig .4) it is seen that composition of
the complex is 1:2 and the stability constant β as calculated from the Jobs method is 6.05 x10
11.
2.8.2 Mole ratio method
Mole ratio method carried out from a series of solutions containing 1.0 ml of molybdenum(VI) (5x10
-
4M) solution and different volumes of 2,4 –DHBPHBH
solution. The results are presented in Fig .5. The mole
ratio plot confirms the composition as 1:2 [Mo(VI): 2,4-BHBPHBH].
3. APPLICATIONS
The present method for the determination of
molybdenum(VI) is applied to steel and alloy samples.
3.1 Proceedure
Into a series of 10 ml volumetric flasks, each
containing 5.0 ml of buffer solution (pH, 3.0), 1.0 ml of
0.1 M of fluoride [to mask Ti(IV)] solution, known
aliquots of the sample solution and 1.0 ml of the reagent (1x10
-2 M) solution are added.
0 1 2 3 4
0.05
0.10
0.15
0.20
0.25
0.30
0.35
0.40
Absorb
ance
Volume of (2,4-DHBPHBH) in ml
Figure 5. Mole ratio plot. [Mo (VI)] = [2,4 DHBPHBH]
= 5.0 x 10⁻⁴
M; pH = 3.0 ; λ = 420 nm.
The absorbance of these solutions is measured at 415
nm. From the measured absorbance the amount of molybdenum(VI) is computed by referring to
preconstructed calibration plot at 415 nm. The results are
presented in Table 3.
Table 3. Determination of Mo(VI) in alloy and steel
samples
Sample
Co
mp
osi
tio
n
(%)
cert
ifie
d
Co
mp
osi
tio
n
(%)
fou
nd
*
Rela
tiv
e e
rro
r
(%)
Nickel-based high
temperature alloy
i) Udimet – 500a 4.80 4.83 +0.62
ii) Udimet – 700b 5.20 5.22 +0.38
* Average of seven determinations.
Composition of samples (%)
(a) Cr 18; Co 18.5: Al 2.9: Mo 4.8: C 0.08: B 0.006; Zr 0.05; Ti 2.9
(b) Cr 1.5; Co 18; Al 4.3; Mo 5.21; C 0.08; B 0.003; Ti 3.5.
dsramesh
Typewritten Text
38
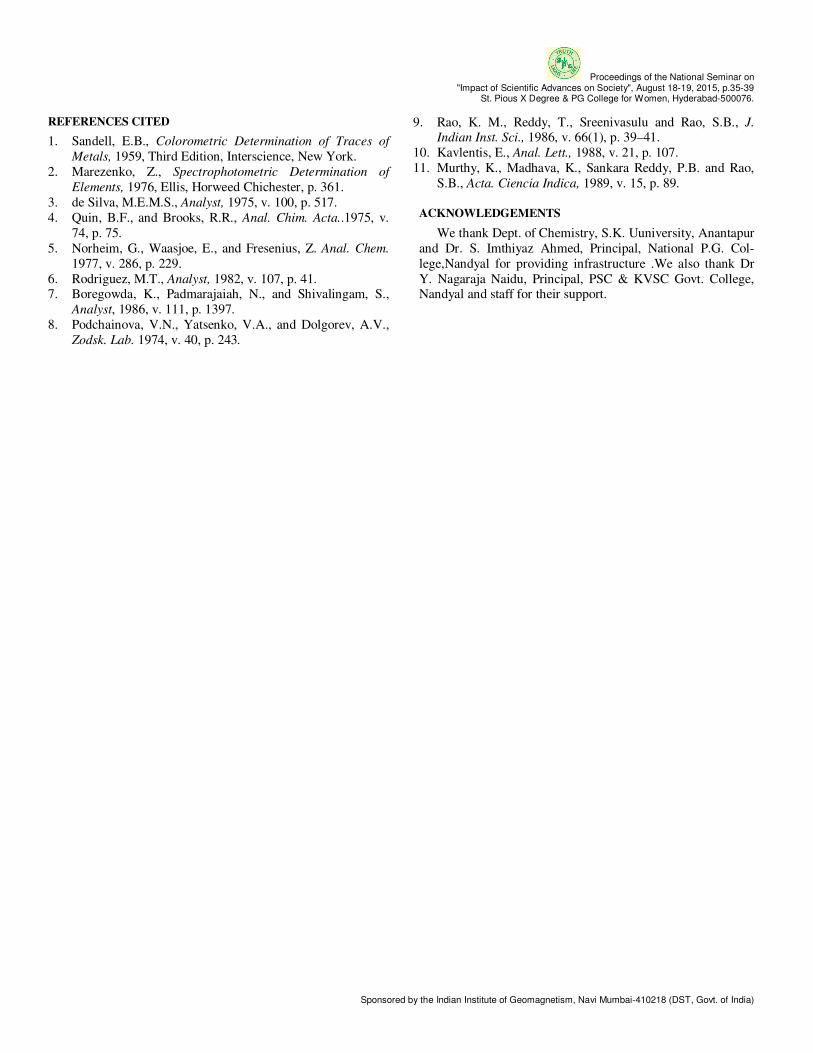
Proceedings of the National Seminar on "Impact of Scientific Advances on Society", August 18-19, 2015, p.35-39
St. Pious X Degree & PG College for Women, Hyderabad-500076.
Sponsored by the Indian Institute of Geomagnetism, Navi Mumbai-410218 (DST, Govt. of India)
REFERENCES CITED
1. Sandell, E.B., Colorometric Determination of Traces of
Metals, 1959, Third Edition, Interscience, New York.
2. Marezenko, Z., Spectrophotometric Determination of
Elements, 1976, Ellis, Horweed Chichester, p. 361.
3. de Silva, M.E.M.S., Analyst, 1975, v. 100, p. 517.
4. Quin, B.F., and Brooks, R.R., Anal. Chim. Acta..1975, v.
74, p. 75.
5. Norheim, G., Waasjoe, E., and Fresenius, Z. Anal. Chem.
1977, v. 286, p. 229.
6. Rodriguez, M.T., Analyst, 1982, v. 107, p. 41. 7. Boregowda, K., Padmarajaiah, N., and Shivalingam, S.,
Analyst, 1986, v. 111, p. 1397.
8. Podchainova, V.N., Yatsenko, V.A., and Dolgorev, A.V.,
Zodsk. Lab. 1974, v. 40, p. 243.
9. Rao, K. M., Reddy, T., Sreenivasulu and Rao, S.B., J.
Indian Inst. Sci., 1986, v. 66(1), p. 39–41.
10. Kavlentis, E., Anal. Lett., 1988, v. 21, p. 107.
11. Murthy, K., Madhava, K., Sankara Reddy, P.B. and Rao,
S.B., Acta. Ciencia Indica, 1989, v. 15, p. 89.
ACKNOWLEDGEMENTS
We thank Dept. of Chemistry, S.K. Uuniversity, Anantapur
and Dr. S. Imthiyaz Ahmed, Principal, National P.G. Col-
lege,Nandyal for providing infrastructure .We also thank Dr
Y. Nagaraja Naidu, Principal, PSC & KVSC Govt. College, Nandyal and staff for their support.
dsramesh
Typewritten Text
39
Proceedings of the National Seminar on "Impact of Scientific Advances on Society", August 18-19, 2015, p.40-44
St. Pious X Degree & PG College for Women, Hyderabad-500076.
Sponsored by the Indian Institute of Geomagnetism, Navi Mumbai-410218 (DST, Govt. of India)
Kinetics and mechanism of protection of uridine-3´-monophosphate from sul-phate radical anion by caffeic acid under anoxic conditions
Sudha Swarga Midudhula1,*
, and Adinarayana Mun-dra
2
1Department of Chemistry, St. Pious X Degree & PG College for
Women, Nacharam,, Hyderabad-500076, Telangana, India 2Post-Graduate College of Science, Saifabad, Osmania
University, Hyderabad-500004, Telangana, India. *[email protected]
ABSTRACT
The oxidation of uridine-3´-monophosphate by sulphate
radical anion (−•
4SO ) has been followed by measuring the
absorbance of uridine-3´-monophosphate at 262nm spectro-
photometrically. The rates and the quantum yields (φ) of oxidation of uridine-3´-monophosphate by sulphate radical
anion have been determined in the presence of different
concentrations of caffeic acid. Increase in [caffeic acid] is found to decrease the rate of oxidation of uridine-3´ -
monophosphate suggesting that caffeic acid acts as an
scavenger of −•
4SO and protects uridine-3´-monophosphate
from it. Sulphate radical anion competes for uridine-3´-
monophosphate as well as for caffeic acid. From the results
of experimentally determined quantum yields (φexptl) of oxidation of uridine-3´-monophosphate in presence of
different concentrations of caffeic acid and the quantum
yields calculated (φcal) p0
tlexpcal ×φ=φ , p is the probability
of −•
4SO reacting with uridine-3´-monophosphate in
presence of caffeic acid and φ0exptl is the quantum yield of
oxidation of uridine-3´-monophosphate in the absence of caffeic acid, assuming caffeic acid acting only as a scaven-
ger of −•
4SO radicals show that φcal values are lower than
φexptl values. This observation indicates that caffeic acid
might not be able to scavenge −•
4SO as expected, and
uridine-3´-monophosphate radicals may be competing for −•
4SO and thus reducing the scavenging capacity of caffeic
acid. These observations suggest that the uridine-3´-monophosphate radicals are totally reducing in nature,
unlike transient radicals produced in case of uracil, thymine,
thymidine, adenine and adenosine reaction with −•
4SO .
The oxidation of D- Ribose by sulphate radical anion
(−•
4SO ) has been followed by measuring the absorbance of
D- Ribose at 480nm spectrophotometrically using phenol
sulphuric acid method. The oxidation of D- Ribose by −•
4SO is one order of magnitude lower than the rate of
oxidation of uridine-3´-monophosphate. Independent estimation of the sugar moiety in uridine-3´-
monophosphate at different times also shows that sugar
moiety is not oxidized considerably. Further rate of oxida-
tion of uracil under similar condition is closer to uridine-3´-monophosphate. These results therefore indicate that the
base moiety might be the site of attack by the sulphate
radical anion in uridine-3 ́-monophosphate.
Keywords: Oxidation of caffeic acid, protection of uridine-3´- monophosphate by caffeic acid, Oxidation by sulphate radical anion
1. INTRODUCTION
The primary events leading to DNA damage occur
either from direct ionization of DNA itself or due to attack of radicals derived from the ionization of the
immediate environment [1, 2].These radicals are mainly
formed from water and the most damaging of them is the
hydroxyl radical [3]. The study of the direct ionization process within DNA is hampered by the high yields of
radicals formed on radiolysis of dilute aqueous solutions
of DNA. One of the approaches to study the properties of radical species produced by the direct ionization of
homopolynucleotides or DNA in aqueous solutions is by
utilizing a strong one-electron oxidant such as SO4.-. In
polynucleotides and DNA, strand breakage has been
reported to be induced within 100µs on reaction of SO4.-
[4, 5]. The reactions of photolytically generated SO4.-
with DNA model compounds [6, 7] have been reported to generate base radicals which subsequently abstract
hydrogen from the sugar moiety, thus transferring the
radical site, and sugar radicals so formed initiate strand breakage in polynucleotides or DNA. In order to under-
stand the mechanism of damage to DNAand poly nuc-
leotides by free radicals information about the nature and
behaviour of the DNA base radicals is desirable. The reactions of SO4
.- with pyrimidine bases and nucleosides
along with the protection and repair reactions by caffeic
acid are reported [8-11]. It has been observed that caffeic acid acts as an effective protecting agent against
damage by SO4.- [8-11]. It is in this back ground we have
carried out kinetic studies of photooxidation of uridine-3 -́monophosphate in the absence and presence of caffeic
acid to understand the site of attack of sulphate radical
anion on uridine-3´-monophosphate and to characterize
the nature of transient radicals produced. It is also of interest to evaluate the extent of protection offered by
caffeic acid.
dsramesh
Typewritten Text
40
Proceedings of the National Seminar on "Impact of Scientific Advances on Society", August 18-19, 2015, p.40-44
St. Pious X Degree & PG College for Women, Hyderabad-500076.
Sponsored by the Indian Institute of Geomagnetism, Navi Mumbai-410218 (DST, Govt. of India)
2. EXPERIMENTAL
Uridine-3´-monophosphate and peroxydisulphate
were purchased from E.Merck, while caffeic acid was from Sigma chemicals and used as received. The solu-
tions of caffeic acid, uridine-3´-monophosphate and
peroxydisulphate were always prepared afresh with double distilled water. Stock solutions of uridine-3´ -
monophosphate and caffeic acid were always freshly
prepared and were deaerated by bubbling nitrogen. The
solutions of potassium salt of peroxydisulphate was standardized using cerimetry using ferroin indicator.
Peroxydisulphate solution was added to a measured
excess of ferrous ammonium sulphate and back titrated with a standard ceric ammonium sulphate solution as
reported by Kapoor et al. [12]. At room temperature this
reaction is rapid enough for analytical purposes and equivalency of ferrous ion to peroxydisulphate is 2 to 1.
Required amounts of caffeic acid was then injected as
aqueous solution into the mixture of uridine-3´-
monophosphate and peroxydisulphate solutions present in a specially designed 1-cm path length quartz cuvette
which is suitable for both irradiations in the quantum
yield reactor as well as for absorbance measurements. The absorbance measurements were made at 262 nm,
which is the λmax of uridine-3´- monophosphate on a HITACHI UV-Visible spectrophotometer (model 3410).
Irradiations were performed at room temperature (25oC)
with medium-pressure mercury lamp using Quantum yield reactor model QYR-20. The irradiations were
interrupted at definite intervals of time and the absor-
bance were noted from which the rate of reaction and the quantum yields of oxidation are calculated. The light
intensity at 254 nm was measured by peroxydisulphate
chemical actinometry [13].
3. RESULTS AND DISCUSSION
N2 saturated aqueous solutions of the reaction mixture
containing uridine-3´-monophosphate (0.5x10⁻⁴
mol dm
-3), peroxydisulphate (4 x10
-4 moldm
-3) and with
varying concentrations of caffeic acid were irradiated
and the absorbance at 262 nm (λmax of uridine-3´ -monophosphate ) with time were noted. The absorbance
of uridine-3´-monophosphate in the reaction mixture at different intervals of irradiation time have been obtained
by subtracting the contribution of absorbance of caffeic
acid by carrying out a parallel experiment with caffeic acid alone at the same intervals of time measured under
similar experimental conditions of the oxidation of
uridine-3´ -monophosphate by sulphate radical anion in the presence of caffeic acid. From these the rates of
oxidation of uridine-3´-monophosphate were calculated from the plots of absorbance versus time using microcal
origin computer program on personal computer. The
initial rates of oxidation of uridine-3´-monophosphate by sulphate radical anion have been found to decrease
with increase in [caffeic acid].(Table.1). The quantum
yields of oxidation of uridine-3´ -monophosphate were calculated from the rates of oxidation of uridine-3´-
monophosphate by sulphate radical anion and the light
intensity absorbed by peroxydisulphate at 254 nm, the
wavelength at which peroxydisulphate is activated to sulphate radical anions. The quantum yields of oxidation
of uridine-3´-monophosphate (φexptl) at different [caffeic
acid] are presented in Table.1. The φexptl values were found to decrease with increasing concentration of
caffeic acid. The substances used in the present work
viz., caffeic acid and/or uridine-3´-monophosphate did not undergo any chemical change on shining the light in
the absence of peroxydisulphate. Caffeic acid has molar
absorption coefficient 7500 dm3mol
-1cm
-1 and uridine-
3 -́monophosphate has 8800 dm3mol
-1cm
-1 at 254 nm
wavelength at which peroxydisulphate is activated to −•
4SO radicals. Due to this more light is being absorbed
by caffeic acid and/or uridine-3 ́ -monophosphate and
the concentration of −•
4SO radicals produced from
activation of peroxydisulphate should decrease with
increase in concentration of caffeic acid and/or uridine-3 -́monophosphate. Contrary to this the quantum yields
of oxidation of caffeic acid and/or uridine-3´-
monophosphate were found to increase with increase in concentration of caffeic acid [10] and/or uridine-3´-
monophosphate (Table 2).
Table 1. Effect of [caffeic acid] on the quantum yields of photooxidation of Uridine -3´-monophosphate in
presence of peroxydisulphate (PDS) under anoxic
conditions.
Light intensity = 1.01 x 10¹⁵ quanta s-1
[PDS] = 4.00 x 10⁻⁴ mol dm-3, [Uridine -3´-monophosphate] = 5.00 x 10⁻⁵ mol dm-3,
pH∼7.5, Temp = 298 K
dsramesh
Typewritten Text
41
Proceedings of the National Seminar on "Impact of Scientific Advances on Society", August 18-19, 2015, p.40-44
St. Pious X Degree & PG College for Women, Hyderabad-500076.
Sponsored by the Indian Institute of Geomagnetism, Navi Mumbai-410218 (DST, Govt. of India)
Table 2. Rates of photooxidation of Uridine -3´-monophosphate in presence of peroxydisulphate (PDS)
at various [Uridine -3´-monophosphate] in aqueous
anoxic solution.
Light intensity = 1.01 x 10¹⁵ quanta s-1
[PDS] = 4.00 x 10⁻⁴mol dm-3 pH = 7.5, Temp = 298 K
These results suggest that the excited states of caffeic
acid and/or uridine-3´-monophosphate subsequently
transfer energy to peroxydisulphate to give −•
4SO
radicals by acting as sensitizers. Thus the efficiency of
production of −•
4SO radicals increase, which increases
the quantum yields of oxidation of caffeic acid and/or
uridine-3´-monophosphate.
Therefore in the present work we propose that caffeic acid as well as uridine-3´-monophosphate act as
sensitizers and transfers energy to peroxydisulphate to
create −•
4SO radicals. This type of sensitization effect
was proposed in similar systems earlier [14]. Since in
this system there is competition between uridine-3´-
monophosphate and caffeic acid for −•
4SO , the relative
amounts of −•
4SO reacting with uridine-3´-
monophosphate decreases with increasing [caffeic acid].
The rate constant of the reaction of the sulphate radical anion with caffeic acid was reported [15] to be 1.24x10
10
dm3mol
-1s
-1. The rate constant of the reaction of the
sulphate radical anion with uridine-3´-monophosphate has been calculated by the uridine-3´-monophosphate
competition method, which is very similar to the one
choosen by Akhalaq et al [16] to determine the rate constant for the reaction of OH radicals with polyhydric
alcohols in competition with KSCN. In the photolysis
experiment, oxygen free N2 –saturated solutions
containing uridine-3´-monophosphate and varying amounts of caffeic acid were irradiated for 4 minutes and
decrease of absorbance of uridine-3´-monophosphate
was measured. The decrease of absorbance of uridine-3´-monophosphate reflects the number of sulphate radical
anions that have reacted with uridine-3´ -
monophosphate. From the rate constant of reaction of
caffeic acid with −•
4SO (kcaffeic acid+ −•
4SO = 1.24x10
10
dm3mol
-1s
-1), The rate constant of
−•
4SO with uridine-3´-
monophosphate (kuridine-3´ -monophosphate +−•
4SO ) can be
calculated using equation (1).
Where [Absorbance of uridine-3´-monophosphate]0
and [Absorbance of uridine-3´-monophosphate]caffeic acid
indicate the decrease in the absorbance of uridine-3´-
monophosphate in the absence and presence of caffeic
acid respectively, in the same interval of time. Experiments of this kind can be carried out with great
accuracy. The rate constant for the reaction of sulphate
radical anion with uridine-3´-monophosphate has been calculated with five different concentrations of caffeic
acid and average value obtained is 4.1 x10⁹dm
3mol
-1s
-1.
The probability of −•
4SO radicals reacting with
uridine-3´-monophosphate {p (−•
4SO + uridine-3´-
monophosphate )} is calculated using the following
equation.
p(−•
4SO + uridine-3 ́-monophosphate ) =
)2(kacid] [caffeicate]kmonophosph- 3´ -[Uridine
kate]monophosph- 3´ -[Uridine
acid caffeicatemonophosph- 3´ -Uridine
atemonophosph '3-uridine−
+
−
kuridine-3´-monophosphate and kcaffeic acid are the rate
constants of −•
4SO with uridine-3´-monophosphate and
caffeic acid respectively. Using the value of φ0exptl (φ
0exptl
is the quantum yield of oxidation of uridine-3´-
monophosphate in the absence of caffeic acid) and p (p
is the probability of −•
4SO reacting with uridine-3´ -
monophosphate given by Equation (2). We calculated a
set of quantum yield values (φcal) using equation (3)
)3(
0
exp −×= ptlcal φφ
These φcal values represent the quantum yield values for photooxidation of uridine-3´-monophosphate in the presence of caffeic acid corresponding to the situation
where role of caffeic acid is restricted only to the sca-
venging of −•
4SO . If caffeic acid is acting as a scavenger
alone, φcal are expected to be equal to φexptl values. However it is clear from the data in Table.1 that the
calculated quantum yield values (φcal) are smaller than the experimentally measured quantum yield values
(φexptl). This observation indicates that caffeic acid might
dsramesh
Typewritten Text
42
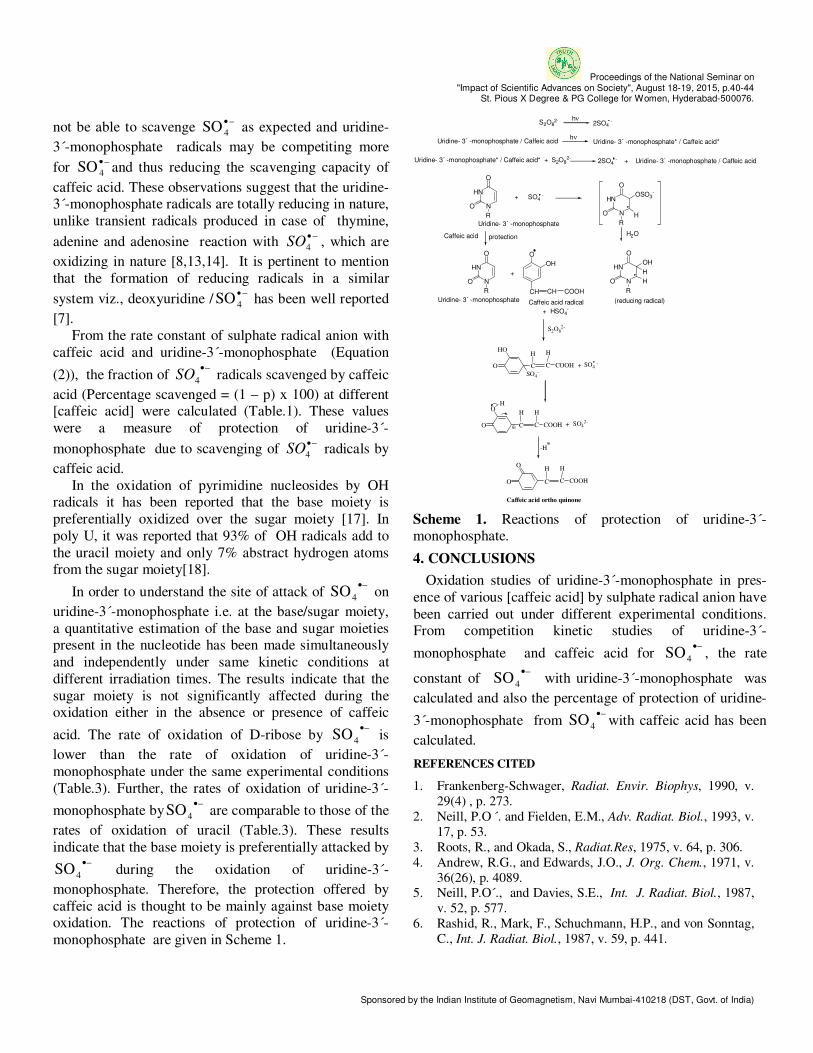
Proceedings of the National Seminar on "Impact of Scientific Advances on Society", August 18-19, 2015, p.40-44
St. Pious X Degree & PG College for Women, Hyderabad-500076.
Sponsored by the Indian Institute of Geomagnetism, Navi Mumbai-410218 (DST, Govt. of India)
not be able to scavenge −•
4SO as expected and uridine-
3 -́monophosphate radicals may be competiting more
for −•
4SO and thus reducing the scavenging capacity of
caffeic acid. These observations suggest that the uridine-3 -́monophosphate radicals are totally reducing in nature,
unlike transient radicals produced in case of thymine,
adenine and adenosine reaction with −•
4SO , which are
oxidizing in nature [8,13,14]. It is pertinent to mention
that the formation of reducing radicals in a similar
system viz., deoxyuridine /−•
4SO has been well reported
[7].
From the rate constant of sulphate radical anion with
caffeic acid and uridine-3´-monophosphate (Equation
(2)), the fraction of −•
4SO radicals scavenged by caffeic
acid (Percentage scavenged = (1 – p) x 100) at different [caffeic acid] were calculated (Table.1). These values
were a measure of protection of uridine-3´-
monophosphate due to scavenging of −•
4SO radicals by
caffeic acid.
In the oxidation of pyrimidine nucleosides by OH radicals it has been reported that the base moiety is
preferentially oxidized over the sugar moiety [17]. In
poly U, it was reported that 93% of OH radicals add to
the uracil moiety and only 7% abstract hydrogen atoms from the sugar moiety[18].
In order to understand the site of attack of −•
4SO on
uridine-3´-monophosphate i.e. at the base/sugar moiety,
a quantitative estimation of the base and sugar moieties present in the nucleotide has been made simultaneously
and independently under same kinetic conditions at
different irradiation times. The results indicate that the
sugar moiety is not significantly affected during the oxidation either in the absence or presence of caffeic
acid. The rate of oxidation of D-ribose by −•
4SO is
lower than the rate of oxidation of uridine-3´-
monophosphate under the same experimental conditions
(Table.3). Further, the rates of oxidation of uridine-3´-
monophosphate by−•
4SO are comparable to those of the
rates of oxidation of uracil (Table.3). These results
indicate that the base moiety is preferentially attacked by −•
4SO during the oxidation of uridine-3´-
monophosphate. Therefore, the protection offered by
caffeic acid is thought to be mainly against base moiety oxidation. The reactions of protection of uridine-3´-
monophosphate are given in Scheme 1.
2SO4 -
Uridine- 3´ -monophosphate / Caffeic acid Uridine- 3´ -monophosphate* / Caffeic acid*
hν
Uridine- 3´ -monophosphate* / Caffeic acid* + S2O82-
hν
2SO4 - + Uridine- 3´ -monophosphate / Caffeic acid
HN
NO
O
SO4 -+ HN
NO
O
OSO3-
H
protection
HN
NO
O
HN
NO
O
OH
H
Uridine- 3´ -monophosphate Caffeic acid radical
+ HSO4-
(reducing radical)
Caffeic acid
Uridine- 3´ -monophosphate
S2O82-
H2O
RR
R R
O
OH
CH CH COOH
H
HO
O C
SO4-
O
O C
H
+
O
O C
Caffeic acid ortho quinone
H
H
H
+ SO4 -
C COOH
H
C COOH
H
C COOH
H
S2O82-
SO42-
-H
+
Scheme 1. Reactions of protection of uridine-3´-monophosphate.
4. CONCLUSIONS
Oxidation studies of uridine-3´-monophosphate in pres-
ence of various [caffeic acid] by sulphate radical anion have
been carried out under different experimental conditions. From competition kinetic studies of uridine-3´-
monophosphate and caffeic acid for −•
4SO , the rate
constant of −•
4SO with uridine-3´-monophosphate was
calculated and also the percentage of protection of uridine-
3 -́monophosphate from −•
4SO with caffeic acid has been
calculated.
REFERENCES CITED
1. Frankenberg-Schwager, Radiat. Envir. Biophys, 1990, v.
29(4) , p. 273.
2. Neill, P.O ´. and Fielden, E.M., Adv. Radiat. Biol., 1993, v.
17, p. 53.
3. Roots, R., and Okada, S., Radiat.Res, 1975, v. 64, p. 306.
4. Andrew, R.G., and Edwards, J.O., J. Org. Chem., 1971, v.
36(26), p. 4089. 5. Neill, P.O´., and Davies, S.E., Int. J. Radiat. Biol., 1987,
v. 52, p. 577.
6. Rashid, R., Mark, F., Schuchmann, H.P., and von Sonntag,
C., Int. J. Radiat. Biol., 1987, v. 59, p. 441.
dsramesh
Typewritten Text
43
Proceedings of the National Seminar on "Impact of Scientific Advances on Society", August 18-19, 2015, p.40-44
St. Pious X Degree & PG College for Women, Hyderabad-500076.
Sponsored by the Indian Institute of Geomagnetism, Navi Mumbai-410218 (DST, Govt. of India)
7. Hildenbrand, K., Behrens, G., Schuite-Frohlinde, D., and Herak, J.N., J. Chem. Soc. Perkin Trans, 1989, v. 2, p. 283.
8. Sudha Swaraga, M., and Adinarayana, M., Proceedings of
Indian Academy of Sciences, 2003, v. 115(2), p. 123.
9. Sudha Swaraga, M., Charitha, L., and Adinarayana, M.,
Research Journal of Chemistry and Environment, 2002, v.
6(4), p. 29.
10. Sudha Swaraga, M., and Adinarayana, M., International
Journal of Chemical Sciences, 2014, v. 12(2) , p. 403.
11. Sudha Swaraga, M., and Adinarayana, M., Proceedings of
International Conference on New Dimensions in Chemistry
and Chemical Technologies- Application in Pharma Indus-
try – JNTU (H). ISBN 978-93-82829-90-4.
12. Kapoor, S., Sharma, P.D., and Gupta, Y.K., Talanta, 1975,
v. 22, p. 765.
13. Ravi Kumar, M., Thirupathi Rao, M., and Adinarayana, M., Indian. J. Chem., 1998, v. 37, p. 346 A.
14. Sudha Swaraga, M., and Adinarayana, M., Indian J.
Biochem. Biophysics, 2003, v. 40, p. 27.
15. Sudha Swaraga, M., Charitha, L., and Adinarayana, M.,
J.Chem. Sci.,2005, v. 117(4) , p. 345.
16. Akhalaq, M.S., Al-Baghdad, S., and von Sonntag, C.,
Carbohydrate Res., 1987, v. 164, p. 71.
17. Deeble, D.J., and von Sonntag, C., Int. J. Radiat. Biol.,
1986, v. 49, p. 915.
18. Dizdaroglu, M., Biochemistry, 1985, v. 24, p. 4476.
ACKNOWLEDGEMENTS
The authors thank Department of Chemistry, Osmania
University for providing facilities.
dsramesh
Typewritten Text
44
Proceedings of the National Seminar on "Impact of Scientific Advances on Society", August 18-19, 2015, p.45-48
St. Pious X Degree & PG College for Women, Hyderabad-500076.
Sponsored by the Indian Institute of Geomagnetism, Navi Mumbai-410218 (DST, Govt. of India)
Synthesis and comparative studies of Sr2CeO4:Eu phosphor
Paleena Thulimilli1,*
, M. Sangeetha1, N.V. Poorna-
chandra Rao2 and K.V.R. Murthy
3
1Department of Physics, St.Pious X Degree & PG College for
Women, Hyderabad-500076, India 2Department of Physics, Rajiv Gandhi University of Knowledge
Technologies (RGUKT), IIIT, Basara, Telangana State, India 3Display Materials Laboratory, Applied Physics Department,
Faculty of Technology and Engneering, M.S. University of Baroda,Vadodara-390001, India
ABSTRACT
Pure Sr2CeO4 and Sr2CeO4:Eu3+
(0.5, 1.0, 1.5, 2.0, 4.0
mol%) phosphors were synthesized by the sol-gel method
and conventional solid-state reaction method.The samples
fired at different temperatures 8000C , 1000
0C and 1200
0C
for 3h.X-ray diffraction (XRD), scanning electron micro-
scopy (SEM) and photoluminescence (PL) spectra were
used to characterize the pure Sr2CeO4 and Sr2CeO4:Eu
3+phosphors. The XRD study confirms the
structure of the system as orthorhombic and the calculated
crystallite size of Sr2CeO4:Eu3+
phosphoris 40nm.SEM images showed that the sol-gel synthesizes sample fired at
12000C are spheroidal in shape and even at high
temperature they appear less agglomerated. The spherical
morphology has a positive effect on the optical property. Sr-
2CeO4 exhibits photoluminescence due to the charge
transfer (CT) mechanism. The sample displays a broad
emission spectrum which peaks at 467nm which is attri-buted to the energy transfer between the molecular orbital
of the ligand and charge transfer state of the Ce4+
ion. Upon
excitation at 254nm wavelength, the emission spectrum of
Sr2CeO4:Eu3+
phosphor emits a broad band range from 570-600nm with maximum intensity peak at 595nm (Orange
red)(2.12eV).This phosphor is having excellent colour
tunability of red light with different concentration of europium.
Keywords: Photoluminescence, XRD, SEM, phosphor, rare-earth ions, solid state reaction technique, sol-gel method
1. INTRODUCTION
The development of phosphors for the three primary
colours attracts considerable interests in recent years due
to their potential technological applications such as high-
performance fluorescent lights and high-resolution display devices [1-3]. In the recent years, research on the
phosphors used for white LEDs has become a hot topic
and gained maturity. When excited, the oxide-based phosphors convert absorbed energy into electromagnetic
radiation in ultraviolet, visible, infrared regions, and the
luminescence of rare earth based phosphors also permits
the development of trichromatic luminescence lighting. In 1998, a blue phosphor compound, Sr2CeO4,
possessing one-dimensional chain of edge-sharing CeO6
octahedra, was identified by Danielson and his co-workers with combinatorial chemistry [4]. It exhibited a
blue–white emission band that peaks at 485 nm under
254 nm excitation. The luminescence was suggested to originate from a ligand-to-metal Ce
4+ charge transfer. In
addition, it has been established that Sr2CeO4 exhibits
photoluminescence under excitation with irradiation of
ultra violet rays [5, 6]. Sr2CeO4 phosphor has been widely studied because of its importance in the realiza-
tion of a new generation of optoelectronic and displaying
devices. Recently, some groups began using all kinds of methods to fabricate this promising material and research
its luminescent properties [7-10].
In this research article, we have studied on the synthe-sis, size, morphology and photoluminescence properties
of pure and Eu3+
ion doped Sr2CeO4 phosphors prepared
by solid state reaction method and sol-gel method in air
at 8000C, 1000
0C and 1200
0C. The prepared materials
were characterized by XRD, SEM and photolumines-
cence techniques. PL studies of Eu3+
doped Sr2CeO4
phosphor reveals that the emission colour varies from blue to red. This phosphor has a good potential for
technological applications.
2. EXPERIMENTAL METHODS
Pure and dysprosium ion doped Sr2CeO4 were synthe-
sized by the conventional solid state reaction method and sol-gel method. The dopant concentration in
Sr2CeO4:Eu3+
varied from 0.5-4.0 mol% range.Strontium
Nitrate(Sr(NO3)2) assay(99.995%) Sigma-Aldrich Chemie, Inc,Germany, Cerium Nitrate (Ce(NO3)3 assay
(99.5%), Europium Nitrate (Eu(NO3)3), Citric Acid,
Ethylene Glycol and Liquid ammonia (NH3) assay
(99.9%), National Chemicals, Nutan Gujarat Industrial Estate, Vadodara, India, were used as starting materials
to prepare pure and Eu3+
doped Sr2CeO4 phosphors. The
stoichiometric mixture of these staring materials were thoroughly homogenized in an agate mortar and pestle
for 1hr and then put into an alumina crucible. Different
samples were obtained after subsequent thermal treatment at 800
0C, 1000
0C and 1200
0Cfor 3 h in muffle
furnace in air with a heating rate of 5◦C/min. Finally the
samples were allowed to cool down to room temperature.
In sol-gel technique the starting materials were Sr(NO3)3, Ce(NO3)3.6H2O, Citric Acid, Ethylene Glycol
dsramesh
Typewritten Text
45

Proceedings of the National Seminar on "Impact of Scientific Advances on Society", August 18-19, 2015, p.45-48
St. Pious X Degree & PG College for Women, Hyderabad-500076.
Sponsored by the Indian Institute of Geomagnetism, Navi Mumbai-410218 (DST, Govt. of India)
and Liquid ammonia (NH3. The nitrates were first dissolved in around 20ml of double distilled water and
kept for stirring on a magnetic plate at room temperature
until it becomes transparent in color and all the salt have mixed. Gradually the temperature of the plate was
increased to 40-50°C. After a certain time of continuous
stirring, citric acid was added to the transparent solution. The pH of the resulting solution was maintained 6-7 by
adding droplets of ammonia. The temperature of the
solution was raised to 60-80°C. The solution at this stage
becomes milky in colour due to the precipitation taking place in the solution due to citric acid acting as a chilat-
ing agent. After few hours of stirring Ethylene glycol
was added to the solution and stirring was maintained. The solution now changes its colour and becomes
yellow, becoming more viscous and the formation of gel
takes place. The starting materials used are nitrates in aqueous media, which form stable gels through gelation
with citric acid, followed by cross-linking after polycon-
densation of ethylene glycol at increased temperature.
Phase identification of the powders was carried out by the X-ray powder diffraction using RIGAKU D’MAX III
Diffractometer having Cu Kα radiation (λ=1.54nm). The
scan range was kept from 50 to 80
0 at the scan speed of
0.050 per second.The microstructures of the samples
were studied using a scanning electron microscope
(SEM) (JSM-5610LV, JEOL). The scanning continues
time is 10s, and 2θ range is from 15 to 60o.The
photoluminescence (PL) emission and excitation spectra
were recorded with a spectrofluorophotometer (SHI-
MADZU, RF-5301 PC) equipped with a Xenon lamp as excitation source. All the spectra were recorded at room
temperature. Emission and excitation spectra were
recorded using a spectral slit width of 1.5 nm.
3. RESULTS AND DISCUSSION
3.1 XRD studies of Sr2CeO4: Eu3+
phosphor
The crystal structure of the obtained product was
identified by X-ray diffraction analysis (XRD). Fig.1 shows the typical X-ray diffraction (XRD) patterns of
Sr2CeO4:Eu3+
phosphor synthesized with sol-gel and
solid state reaction method. Fig.2 shows the XRD
patterns of Sr2CeO4:Eu3+
phosphor calcined at 8000C and
10000C.The XRD spectra consist of three strong peaks
and several weak peaks. The obtained powder XRD have
broadened reflexes, which indicates the nanocrystallinity of the products. The intensity of peaks reflected the high
degree of crystallinity of the nanoparticles. However, the
Figure 1. XRD pattern of Eu doped Sr2CeO4 phosphor
synthesized with sol-gel and solid state reaction
technique.
Figure 2. XRD pattern of Eu doped Sr2CeO4 phosphor
synthesized with sol-gel and solid state reaction
technique at 8000C and 1000
0C.
diffraction peaks are broad which indicating that the crystalline size is very small. The XRD study confirms
the structure of the system as orthorhombic. The average
crystallite size can be estimated from the peak
broadening using Scherer’s relation D= 0.9 λ / β cosθ, where λ is the wavelength of the X-ray (λ=1.54A
0), β is
the broadening of diffraction line measured at half of its
maximum intensity (FWHM:full width at half maximum), θ is the Bragg’s diffraction angle and D is
the particle diameter size. Using the strongest peak of
diffraction pattern of the Sr2CeO4:Eu3+
phosphor, the
average crystallite size was found to be 40nm.
3.2 Scanning Electron microscope of Sr2CeO4: Eu3+
phosphor
The scanning electronic micrograph of Eu doped
Sr2CeO4 phosphor is shown in Fig. 3. The sample
dsramesh
Typewritten Text
46
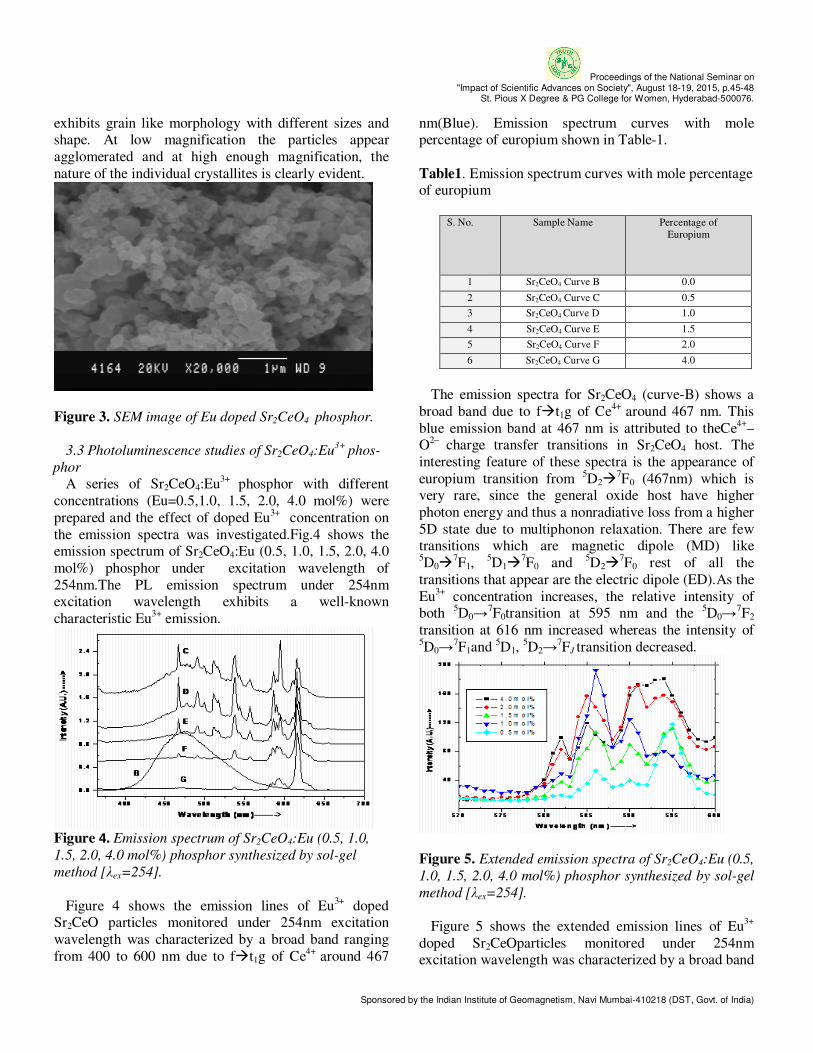
Proceedings of the National Seminar on "Impact of Scientific Advances on Society", August 18-19, 2015, p.45-48
St. Pious X Degree & PG College for Women, Hyderabad-500076.
Sponsored by the Indian Institute of Geomagnetism, Navi Mumbai-410218 (DST, Govt. of India)
exhibits grain like morphology with different sizes and shape. At low magnification the particles appear
agglomerated and at high enough magnification, the
nature of the individual crystallites is clearly evident.
Figure 3. SEM image of Eu doped Sr2CeO4 phosphor.
3.3 Photoluminescence studies of Sr2CeO4:Eu3+
phos-
phor
A series of Sr2CeO4:Eu3+
phosphor with different
concentrations (Eu=0.5,1.0, 1.5, 2.0, 4.0 mol%) were
prepared and the effect of doped Eu3+
concentration on
the emission spectra was investigated.Fig.4 shows the emission spectrum of Sr2CeO4:Eu (0.5, 1.0, 1.5, 2.0, 4.0
mol%) phosphor under excitation wavelength of
254nm.The PL emission spectrum under 254nm excitation wavelength exhibits a well-known
characteristic Eu3+
emission.
Figure 4. Emission spectrum of Sr2CeO4:Eu (0.5, 1.0,
1.5, 2.0, 4.0 mol%) phosphor synthesized by sol-gel
method [λex=254].
Figure 4 shows the emission lines of Eu3+
doped Sr2CeO particles monitored under 254nm excitation
wavelength was characterized by a broad band ranging
from 400 to 600 nm due to f�t1g of Ce4+
around 467
nm(Blue). Emission spectrum curves with mole percentage of europium shown in Table-1.
Table1. Emission spectrum curves with mole percentage of europium
S. No. Sample Name Percentage of
Europium
1 Sr2CeO4 Curve B 0.0
2 Sr2CeO4 Curve C 0.5
3 Sr2CeO4 Curve D 1.0
4 Sr2CeO4 Curve E 1.5
5 Sr2CeO4 Curve F 2.0
6 Sr2CeO4 Curve G 4.0
The emission spectra for Sr2CeO4 (curve-B) shows a
broad band due to f�t1g of Ce4+
around 467 nm. This
blue emission band at 467 nm is attributed to theCe4+
–O
2– charge transfer transitions in Sr2CeO4 host. The
interesting feature of these spectra is the appearance of
europium transition from 5D2�
7F0 (467nm) which is
very rare, since the general oxide host have higher
photon energy and thus a nonradiative loss from a higher
5D state due to multiphonon relaxation. There are few transitions which are magnetic dipole (MD) like 5D0�
7F1,
5D1�
7F0 and
5D2�
7F0 rest of all the
transitions that appear are the electric dipole (ED).As the
Eu3+
concentration increases, the relative intensity of both
5D0→
7F0transition at 595 nm and the
5D0→
7F2
transition at 616 nm increased whereas the intensity of 5D0→
7F1and
5D1,
5D2→
7FJ transition decreased.
Figure 5. Extended emission spectra of Sr2CeO4:Eu (0.5,
1.0, 1.5, 2.0, 4.0 mol%) phosphor synthesized by sol-gel
method [λex=254].
Figure 5 shows the extended emission lines of Eu3+
doped Sr2CeOparticles monitored under 254nm excitation wavelength was characterized by a broad band
dsramesh
Typewritten Text
47

Proceedings of the National Seminar on "Impact of Scientific Advances on Society", August 18-19, 2015, p.45-48
St. Pious X Degree & PG College for Women, Hyderabad-500076.
Sponsored by the Indian Institute of Geomagnetism, Navi Mumbai-410218 (DST, Govt. of India)
ranging from 400 to 600 nm. The emission spectra of Eu
3+ contain not only the characteristic transition lines
from the lowest excited 5D0level but also those from
higher energy levels (5D1 and
5D2). In Fig. 5, the
strongest emission peak located at 595 nm showing
prominent and orange red light is due to the 5D0→
7F1
magnetic dipole transition of Eu3+
[11,12]. Comparison between sol-gel and the solid state
reaction sample (0.5mole % of Eu) has been shown in
Fig. 6. There is a remarkable difference in the emission
spectra of the sol-gel and solid state reaction technique, the spectra is almost similar at all the wavelengths
except at the 580-630nm. The most important difference
is the generation of the high intensity 595nm(Orange red) peak and with small hump at 616nn (Red) for the
sol-gel sample which is not seen in the solid state
reaction sample. These are due to splitting of 5D0�
7F1
and 5D0�
7F2 transition levels which are not observed in
the solid state reaction specimen. This shows that the
crystal field splits the levels (7F1 and
7F2). , further; this
splitting may be correlated to the small crystal size of the sol-gel prepared sample, the smaller size facilitates the
crystal field to split further.
5 8 5 6 0 0 6 1 5 6 3 0
0 .0 0
0 .2 5
0 .5 0
0 .7 5
1 .0 0
5 8 6
5 9 1
6 0 1
6 1 6
5 8 8
5 9 76 0 6
Inte
nsit
y (A
.U.)
----
--->
W a v e le n g t h ( n m ) - - - - - - ->
S S R ( 0 .5 % )
S G ( 0 .5 % )
Figure 6. Emission spectrum of Sr2CeO4:Eu (0.5mol%)
phosphor synthesized by sol-gel method and solid state
reaction method [λex=254].
4. CONCLUSIONS
The main conclusions that can be drawn by studying the
effect of europium doping on the luminescence properties
of the Sr2CeO4 are as follows:
(i) Sr2CeO4 blue phosphor and europium doped Sr2CeO4 phosphor were synthesized by sol-gel method and solid
state reaction method.
(ii) Spectroscopic studies of pure and rare earth doped
Sr2CeO4 phosphors are investigated.
(iii) The XRD study confirms the structure of the system
as orthorhombic.
(iv) The photoluminescence spectra reveal that the inten-
sity of emission increases when thepreparatory techniques
is varied from solid state reaction to sol-gel.
(v) The emission spectra of Sr2CeO4 at the corresponding peak excitation value showed broad spectrum in the region
300-700 nm with a peak around 467 nm. Comparison with
solid state reaction revealed a marked difference in the
emission characteristics from 580nm-630nm for the 0.5mol% doped europium sample. This may be due to the
nanocrystal size (40nm) of the phosphor synthesized by sol-
gel method.
(vi) Greater splitting of the 5D0�
7F1,
5D0�
7F2 when
compared with solid state reaction and few additional lines
were seen at 597nm and 614nm for the sol-gel prepared
sample.
(vii) Excellent tunablity of phosphor observed when
doped with various concentrations of europium.
REFERENCES CITED
1. Shi, S., Li, J., and Zhou, J., Materials Science Forum,
2005, v. 475-479, p. 1181-1184.
2. Chen, W., Li, F., and Yu, J., Materials Letters, 2006, v. 60,
p. 57-62.
3. Khollam, Y.B., Deshpande, S.B., Khanna, P.K., Joy, P.A.,
and Potdar, H.S., Materials Letters, 2004, v. 58(20), p.
2521-2524.
4. Gomes, J., Pires, A.M., and Serra, O.A., Quim. Nova,
2004, v. 27, p. 5.
5. Hirai, T., and Kawamura, Y., Journal of Physical
Chemistry B, 2004, v. 108, p. 12763-12769. 6. Xing, D., Shi, J., and Gong, M., Materials Letters, 2005, v.
59, p. 948-952.
7. Kang, M., and Choi, S., Journal of Materials Science,
2002, v. 37, p. 2721-2729.
8. Hong, S.K., Jung, D.S., Lee, H.J., and Kang, Y.C., Korean
J. Chem. Engg., 2006, v. 23, p. 496-498.
9. Nag, A., and Kutty, T.R.N., Journal of Materials
Chemistry, 2003, v. 13, p. 370-376.
10. Sankar, R., and Subba Rao, G.V., Journal of
Electrochemical Society, 2000, v. 147, p. 2773-2779.
11. Zhang, C., Shi, J., Yang, X., Lu, L., and Wang X., J. Rare
Earths, 2010, v. 28(4), p. 513.
12. Seema, R. and Kalarikkal, N., Proceeding of ICNM, 2009,
6–8 April.
dsramesh
Typewritten Text
48
Proceedings of the National Seminar on "Impact of Scientific Advances on Society", August 18-19, 2015, p.49-51
St. Pious X Degree & PG College for Women, Hyderabad-500076.
Sponsored by the Indian Institute of Geomagnetism, Navi Mumbai-410218 (DST, Govt. of India)
Isolation and identification of microbial community in coal mine dust of SCCL, Godavarikhani
P. Jyothi Chaitanya1, *
, Dhatri Madduru2, J.Sri Devi
1
and N. Lakshmi Bhavani3
1Department of Microbiology, Government Degree College for
Women, Begumpet, Hyderabad-500016 Telangana, India. 2Department of Biotechnology, R.B.V.R.R. Degree College for
Women, Narayanguda, Hyderabad, Telangana, India. 3Plant Tissue Culture and Plant Molecular Genetics Lab.,
Department of Botany, University College of Science, Saifabad, Hyderabad-500004, Telangana, India. * [email protected]
ABSTRACT
Present investigation mainly focused on the isolation and identification of microorganisms present in the soil dust of
the SCCL (Singareni Collieries Company Limited) coal
mines of Godavarikhani, Karimnagar. Samples were
collected from 3 places i.e under excavation (U1) and one nearer to the excavation (U2) and one outside the excavation
(S1). The colour and texture of the soil was different in 3
places. Collected material was serially diluted and made into 10
-1 to 10
-10 dilution and inoculated on basal medium.
On the agar plate we found different kinds of bacteria on S1
than U1 and U2. On the basal medium small colonies were
seen. Based on the cultural characteristics, biochemical tests, staining colonies were identified as the methanogens
in both the samples of U1 and U2, where as organisms like
Klebsiella pneumoniae, Streptococci sp., staphylococci sp. Pseudomonas sp. and E.coli in the samples of S1. From this
study it may be concluded that the surface sample showed
more pathogenic microorganisms compared to the under-ground samples. Presence of more methanogenic than the
pathogenic microorganisms in the underground samples
may be due to mining activity. Further the 16s rRna
analysis is to be carried out to find out the specific species of methanogens.
Keywords: SCCL, excavation, methanogens, pathogenic microorganisms
1. INTRODUCTION
Methanogens are a group of bacteria belonging to the
domain Archaea and phylum Euryarcheota. They can be
classified into six orders namely Methanomicro-
biales,Mithanocellales, Methanosarcinales, Methano-
bacteriales, Methanococcales and Methanopyrales.
These are the organisms capable of producing methane.
Methane can be classified under trace gas due to its global warming potential. It also increases ozone and
water vapour in tropospheric and stratospheric regions
respectively which can increase radioactive force of the gas.
Methanogens have distinct cellular characteristics
when compared to Eubacteria such as peptidoglycan in
the cell wall of methanogens is replaced by pseudomure-in (Methanobrevibacter and Methanobacterium), hetero-
polysaccharide (Methanosarcina) and protein in Metha-
nomicrobium. All methanogens have coenzyme F420 and coenzyme M/2-mercaptoethanesulfonic acid which is
methylated to produce methane [1]. Methanogens
employ various pathways for generation of methane.
Common pathways include methanol and CO2 reduction, acetate cleavage, as well as from a variety of methylated
compounds. Based on the pathway used the genes will
differ for one species to other. For instance, methyl coenzyme M reductase (mcrA) is used in the reduction of
methyl group bound to co-enzyme M, which is the last
step in generation of methane [2]. Methanogens are strict anaerobes and are mostly found
in arid soil. Coal mines soils are the best source for
isolation of methanogens. Coal bearing sediments are
rich in organic matter and carbon which can be utilized by methanogenic subsurface microbial community.
Biogenic methane can be produced from coal material
under anoxic conditions. Biodegradation of coal is performed by bacteria by fermentation of polymers and
monomers to produce fatty acids, organic acids, alcohols
and/or hydrogen and carbon dioxide which can be utilized by methanogens to produce methane [3].
In our present study, we made an attempt to identify
the methanogenic and other microbial community profile
from different soil samples i,e under excavation (U1) and one nearer to the excavation (U2) and one outside the
excavation (S1).
2. MATERIALS AND METHODS
2.1 Soil samples and soil characterization
Soil dust samples were collected form SCCL (Singa-reni Collieries Company Limited) coal mines of Godava-
rikhani, Karimnagar in January 2015. Samples were
collected from 3 places i.e under excavation (U1) and one nearer to the excavation (U2) and one outside the
excavation (S1). The colour and texture of the soil was
different in 3 places.
dsramesh
Typewritten Text
49
Proceedings of the National Seminar on "Impact of Scientific Advances on Society", August 18-19, 2015, p.49-51
St. Pious X Degree & PG College for Women, Hyderabad-500076.
Sponsored by the Indian Institute of Geomagnetism, Navi Mumbai-410218 (DST, Govt. of India)
2.2 Isolation of microbes
Microbes from soil sample were isolated using serial dilution method. The samples were serially diluted from
10-1 to 10-10 dilutions.
2.3 Culturing and enrichment of microbes
Microbes were inoculated on Basal medium (Table 1).
Table 1. Basal agar medium
Constituent Amount
KH2PO4 0.14 g
CaCl2. 2H2O 0.14 g
KCl 0.34g
MgCl2. 6H2O 2.8 g
MgSO4. 7H2O 3.5g
NaCl 20.0g
Fe(NH4)2(SO2). 6H2O 0.002g
NH4Cl 0.25g
Na2SeO4.10H2O 0.0037g
NaHCO3 5.0g
Yeast Extract 2.0g
Na2S. 9 H2Ob 0.5 g
Trypticase 2.0g
Sodium acetate 1.25g
L-Cysteine hydrochloride. H2O 0.5g
Trace mineral solution 10 ml
Vitamin solution 10 ml
Leucine 0.5g
Isoleucine 1.0g
Calcium Pantothenate 50µg
NiCl2. 6H2O 0.5g
agar At final concentra-
tion of 1.5 %
(Wt./Vol)
Distilled H2O 1,000 ml
2.4 Biochemical tests
Biochemical tests were performed to further confirm
the presence of methanogens in the sample. The tests
performed were IMViC test, Triple sugar iron, Starch hydrolysis and Catalase test.
2.5 Staining
FA (Fluorescent antibody) staining was used to identi-
fy the colonies as methanogens in samples U1 and U2. The antibody directly interacts with the methanogenic
colonies. The fluorescence was measured at 420nm.
Whereas bacteria of colonies from sample S1 were stained using gram staining.
3. RESULTS
3.1 Cultural characteristics
After 10 days small colonies were found on agar plates
containing basal medium. They are slow growing
colonies. On microscopic observation long rods with 0.5mm diameter are observed form U1 and U2 samples.
Whereas Circular, raised colonies from S1 sample were
observed. This indicates that U1 and U2 samples may contain methanogens while, S1 sample contains
eubacteria such as E. coli.
3.2 Biochemical tests
The results obtained for various biochemical tests are
shown in Table 2.
Table 2. Results of biochemical tests
S.
No
Test
Meth
ano
gen
s
E.c
oli
Kle
bsi
ell
a
pn
eu
mon
iae,
Str
ep
toco
cci
sp.,
sta
ph
ylo
cocci
sp.
1 Indole +Ve +Ve -Ve -Ve -Ve
2 Methyl red +Ve +Ve -Ve +Ve +Ve
3 Citrate +Ve -Ve +Ve +Ve +Ve
4 Triple sugar ion +Ve +Ve
gas
-Ve -Ve -Ve
5 Starch hydrolysis -Ve +Ve -Ve -Ve +Ve
6 Catalase -Ve +Ve +Ve -Ve +Ve
7 Mannitol -Ve +Ve +Ve +Ve +Ve
8 Voges Proskauer -Ve -Ve +Ve +Ve +Ve
3.3 Staining
Microscopic observation of colonies from sample U1 and U2 revealed presence of methanogens as the antibo-
dies specifically interacted with colonies. Gram staining
of sample S1 revealed presence of E.coli.
4. DISCUSSION AND CONCLUSION
Methanogenic archaea are the group of microbes with ability to produce methane. They usually produce
methane through reduction of CO2 and H2 [4].
Methanogens are present in gut of rumen and soil under anoxia conditions. In soil, anaerobic methanogenesis
takes place in anoxic microsites by methanogens [5].
Coal mines are good source of methanogens. As coal is rich in carbon and organic matter it can be degraded
by microbes to produce methane. Coal mines can
contribute for about 7% of global methane content.
Beckmann et al 2011 studied methane production and isolated methanogens form abandoned coal mines from
Germany and concluded that coal mines are rich in
methanogens and can contribute to the production of substantial amount of methane [6].
dsramesh
Typewritten Text
50

Proceedings of the National Seminar on "Impact of Scientific Advances on Society", August 18-19, 2015, p.49-51
St. Pious X Degree & PG College for Women, Hyderabad-500076.
Sponsored by the Indian Institute of Geomagnetism, Navi Mumbai-410218 (DST, Govt. of India)
From our present study, based on cultural characteristics, biochemical tests and staining of
colonies we conclude that the surface sample showed
more pathogenic microorganisms compared to the underground samples. Presence of more methanogenic
than the pathogenic microorganisms in the underground
samples may be due to mining activity. Further the 16s rRna analysis has to be carried out to find out the
specific species of methanogens.
REFERENCES CITED
1. Hook, S.E., Wright, A.G., and McBride, B.W.,
Methanogens: Methane Producers of the Rumen and
Mitigation Strategies, 2010, p. 1-11.
2. Angel, R., Claus, P., and Conrad, R., ISME J., 2012, v. 6(4), p. 847-862.
3. Gründger, F., Jiménez, N., Thielemann, T., Straaten, N.,
Lüders, T., Richnow, H.-H., and Krüger, Frontiers in
Microbiology, 2015, v. 6, p. 200.
4. Thauer, R.K., Kaster, A-K., Seedorf, H., Buckel, W., and
Hedderich, R., Nature Reviews Microbiology, 2008, v. 6, p.
579-591.
5. Silva, S.N., Guzm, S.Y., Dendooven, L., and Lunaguido,
M., Pedosphere, 2014, v. 24(3), p. 291-307.
6. Beckmann, S., Lueders, T., Kru¨ger, M., von Netzer, F.,
Engelen, B., and Cypionka, H., Applied and Environ.
Microbiol., 2011, p. 3749–3756.
dsramesh
Typewritten Text
51

Proceedings of the National Seminar on "Impact of Scientific Advances on Society", August 18-19, 2015, p.52-55
St. Pious X Degree & PG College for Women, Hyderabad-500076.
Sponsored by the Indian Institute of Geomagnetism, Navi Mumbai-410218 (DST, Govt. of India)
Assessment of various phytochemicals and antimicrobial activity of fenugreek (trigonella foenum-graecum): a common Indian spice
P. Jyothi Chaitanya1,*
, B. Vijaya Lakshmi2 and N.
Lakshmi Bhavani3
1Department of Microbiology, Govt. Degree College for Women,
Begumpet (Osmania University), Hyderabad-500016, Telanga-na, India 2Department of Botany, Govt. Degree College for Women,
Begumpet (Osmania University), Hyderabad-500016, Telanga-na, India 3Plant Tissue Culture and Plant Molecular Genetics Lab.,
Department of Botany, University College of Science, Saifabad (Osmania University), Hyderabad-500004, Telangana, India *[email protected]
ABSTRACT
Fenugreek (Trigonella foenum-graecum L.), plant is widely distributed all over the world and belongs to the family Fabacecae. The yields can be significant increase in quantity and quality through the suitable management of cultivation, irrigation and harvesting. The plant contains active constituents such as alkaloids, flavonoids, steroids, Saponins etc. It is an old traditional medicinal plant and used as a one of the spice. It has been commonly used as a traditional medicine and food. Fenugreek is known to have hypoglycemic, hypocholesterolaemic and Anti inflammato-ry effects. Recent research has identified that fenugreek as an important medicinal plant which is very potential for curing diseases and also as a source for preparing raw materials of pharmaceutical industry, like in steroidal hormones. This present research work is aimed to investi-gate the phytochemicals from leaf extracts of Trigonella
foenum-graecum L. Seed powder of Fenugreek was dissolved in different solvents viz., ethanol, methanol, chloroform, acetone, water and petroleum ether and these extracts are subjected to screen for their phyto-chemicals. Results revealed the presence of saponins, steroids, phenols, flavonoids, terpenoids, alkaloids, cardiac glycosides, reducing sugars, tannins and protiens. In the present investigation, the methanol extracts and water extracts showed more number of phytochemicals than the chloroform, acetone and pet ether. Apart from these the petroleum ether extracts showed very less amount of phytochemical constituents. We hope that the present study will be helpful for the phytochemists and pharmacologists for the detection of novel compounds for the study.
Keywords: Seed extract, trigonella foenum-graecum L, secondary metabolites
1. INTRODUCTION
Trigonella foenum-graecum (Family Fabaeace) is called methika in Ayurveda and used as medicine for the treatment of wounds, abscesses, arthritis, bronchitis and digestive disorders etc. it is printed in since from older times this plant also eaten in winters as to improve immunity and protects heart, brain and other vital organs of body through its medicinal properties. In traditional Chinese Medicine it is also used for kidney problems and conditions affecting the male reproductive tract. The recent researches have proved it beneficial for Atheros-clerosis, Constipation, Diabetes, High cholesterol and Hypertriglyceridemia. According to Indian Herbal Pharmacopoeia [1] , the seeds of fenugreek contain alkaloids, flavonoids, saponins, amino acids, tannins and some steroidal glycosides, proteins etc. Ansari [2] described that the standardization of fenugreek seeds is done for the establishment of quality and identity profile of the drug for the purpose of safety monitoring and overall quality assurance of the industrially as well as commercially important drug .since there is a few literature regarding the standard protocol of the phyto-chemical analysis of fenugreek seeds. Therefore, in the present investigation an attempt has been made to standardize fenugreek seeds by using phytochemical analysis and to analyse their antimicrobial activity.
2. MATERIAL AND METHODS
The healthy and disease free seeds of Trigonella foe-
num-graecum L seed material was collected from the cantonment area of Sainikpuri, Hyderabad, Telangana, India and cultivated seeds of Trigonella foenum-graecum L was collected from the Sainikpuri in the month of August, 2014. Collected plant material was washed thoroughly in running tap water, shade dried in open air separately. Powder of the both the seeds is obtained by grinding them mechanically. About 100 gm of each dried powder of the plant were soaked separately in 100 ml of different solvents like methanol, ethanol, chloroform, pet ether and acetone in conical flasks and then subjected to agitation on a rotary magnetic shaker for about 72 hours. After three days the plant extracts were subjected to filtration, filtered with No 42 Whatman filter paper separately. Concentrated extracts was preserved in sterilized air tight labeled bottles and preserved in refrigerator at 4˚C until required for further use. The extract was filtered under reduced pressure using rotary flash evaporator and subjected for further preliminary
dsramesh
Typewritten Text
52
Proceedings of the National Seminar on "Impact of Scientific Advances on Society", August 18-19, 2015, p.52-55
St. Pious X Degree & PG College for Women, Hyderabad-500076.
Sponsored by the Indian Institute of Geomagnetism, Navi Mumbai-410218 (DST, Govt. of India)
phytochemical tests. Different tests conducted for the identification of phytochemicals is adopted by using the methods described by [3, 4].
2.1 Test for alkaloids
Alkaloids are confirmed by a cream colour precipitate was produced by adding to the 5ml of extract 5ml of 2N HCL is added and boiled then the mixture is filtered. To the filtrate a few drops of Mayer’s reagent is added.
2.2 Test for saponins
Saponins are tested by boiling 5ml of extract in 10ml of distilled water in a test tube and are shaken vigorously for about 30 seconds. The test tube is allowed to settle for half an hour. Formation of froth indicates the presence of saponins.
2.3 Test for tannins
Tannins are tested by adding a few drops of 1% lead acetate to 5 ml of plant extract. Appearance of yellow precipitate indicates the presence of tannins.
2.4 Test for phenols
Phenols are tested by adding 2ml of ferric chloride solution to 2ml of plant extract. Appearance of bluish green colour solution indicates the presence of phenols.
2.5 Test for steroids
To test the presence of steroids 1ml extract was dissolved in 10ml of chloroform and equal volume of concentrated sulphuric acid was added from the walls of the test tube. Appearance of red colour in the upper layer and yellow with green fluorescence indicates the presence of steroids.
2.6 Test for cardioglycosides
To 1ml of extract glacial acetic acid, few drops of ferric chloride and then finally concentrated sulphuric acid were added from the walls of the test tube. Appearance of the reddish brown at the junction of two layers and the bluish green colour in the upper layer indicates the presence of cardiac glycosides.
2.7 Test for anthraquionones
5ml extract was boiled with 10ml of sulphuric acid and filtered while hot. The filtrate was shaken with 5ml of chloroform the chloroform layer was pipetted out into another test tube then 1ml of dilute ammonia is added.
The resulting solution was observed for colour changes. The change in colour indicates the presence of anthraquinones.
2.8 Test for flavonoids
To one ml of the extract, a few drops of dilute sodium hydroxide are added. An intense yellow colour was produced in the plant extract, which became colorless on addition of few drops of dilute acid. This indicates the presence of flavonoids.
2.9 Test for carbohydrates
To the 1ml of extract add 5 to 10 drops of Fehling’s solution. Then the mixture was subjected to boiling for 15 minutes. Appearance of brick red precipitate indicates the presence of carbohydrates.
2.10 Test for terpenoids
1ml of the extract was dissolved in 1ml of chloroform; 1ml of acetic anhydride was added following the addition of 2ml of concentrated sulphuric acid. Formation of reddish colour indicates the presence of terpenoids.
2.11 Anti microbial activity
Nutrient agar medium is used for the antibacterial screening test. The nutrient agar medium plates were prepared by pouring 15ml of nutrient agar media into sterile Petri plates. Twenty four hours old cultures of the organisms to be tested were used. Inoculate the plates with test organism. Various concentrations of the wood extracts were transferred into the sterile filter paper disc and the plates were allowed to stand for one hour for pre-diffusion of extracts to occur in agar disc diffusion
method. The plates were then incubated at 37⁰C for 24 hours.
2.12 Test organisms
Microbial cultures obtained from the Department of Microbiology, University College of Science, Osmania University, Hyderabad, India. Among seven bacterial species investigated four gram negative bacteria (E.coli,
Salmonella typhi, Klebsiella pneumonia), gram positive bacteria (Sterpococci, Bacillus subtilis, Bacillus cereus) All the bacterial were maintained at 4 ̊ C Nutrient agar slants respectively.
dsramesh
Typewritten Text
53

Proceedings of the National Seminar on "Impact of Scientific Advances on Society", August 18-19, 2015, p.52-55
St. Pious X Degree & PG College for Women, Hyderabad-500076.
Sponsored by the Indian Institute of Geomagnetism, Navi Mumbai-410218 (DST, Govt. of India)
2.13 Preparation of concentrations
Methanol, ethanol and pet ether seed extracts of Trigonella foenum-graecum L were prepared as a different concentrations (100µg/ml, 250mµ/ml, and 500µg/ml) to get the final drug concentration 10µg/ml,25µmg/ml, 50µg/ml and 75µg/ml respectively, control (DMSO) and standard (streptomycin 10µg/ml for bacteria). Concentrations of extracts were prepared by disc diffusion method; discs with 9mm diameter were prepared using No1 Whatman filter paper and sterilized by autoclaving. Then, the discs had been impregnated with different concentrations of extracts.
3. RESULTS AND DISCUSSION
The phytochemical analysis of Trigonella foenum-
graecum L seed extracts were tested by different precise tests. Methanol, ethanol, petroleum ether, chloroform, acetone seed extracts of Trigonella foenum-graecum L analyzed for phytochemical compounds such as tannins, saponins, flavonoids, steroids, alkaloids, phenols, terpenoids. Phytochemical analyses (Table 1) explain that the presence of terpenoids, tannins, flavonoids, alkaloids in all the extracts. Whereas steroids and phenols are found to be present in acetone, pet ether and chloroform only those were not observed in ethanol and methanol. Saponins are found in acetone extracts only.
Table 1. Preliminary Phytochemical analysis of seed extracts of Trigonella foenum-graecum L.
S.
No.
Phytochemicals
Met
han
ol
Eth
ano
l
Ch
loro
form
Pet
eth
er
Ace
ton
e
Wat
er
1 Tannins + + + + + +
2 Phenols - - + + + +
3 Saponins + + _ _ + +
4 Alkaloids + + + + + +
5 Flavonoids + + + + + +
6 Anthraquinones - - - - - _
7 Terpenoids + + + + + +
8 Cardiac glycosides + + + + + _
9 Steroids - - + + + _
10 Carbohydrates + + + _ + +
11 Aminoacids + + _ _ + +
+ Indicates the presence the presence of phytochemicals - Indicates the absence the presence of phytochemicals
The bacterial microorganisms Psuedomonas aureus,
Streptococci, Salmonella typhi, Bacillus aureus,
Klebsiella pneumonia and Bacillus subtilis were employed for the test of antibacterial activity (Table 2). Among all the solvent extracts tested extracts of methanol and ethanol were found to more active towards the tested bacterial organisms. Table 3 explains the antifungal analysis revealed that the maximum activity of solvents against fungi in order of Fusarium, Mucor,
Rhizopus and Aspergillus niger. Among all the solvent extracts tested extracts of methanol and ethanol were found to more active towards the tested fungal organisms.
Table 2. Antibacterial activities of Trigonella foenum-
graecum L seed extracts
dsramesh
Typewritten Text
54
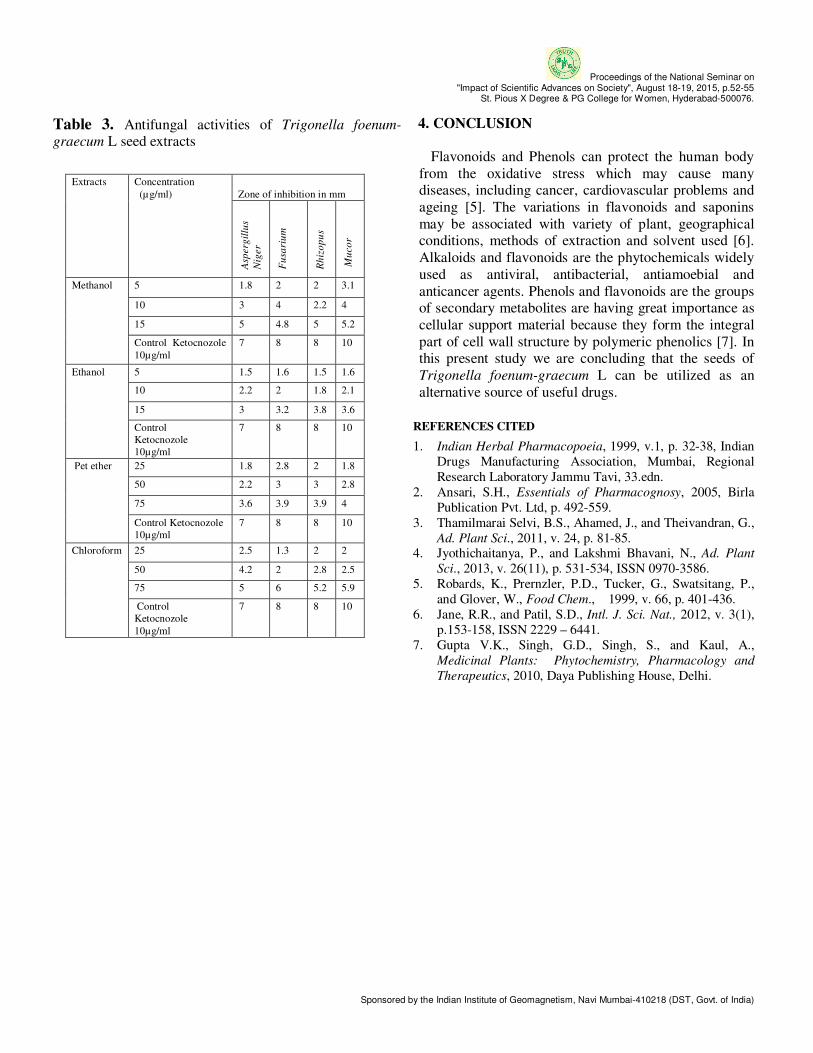
Proceedings of the National Seminar on "Impact of Scientific Advances on Society", August 18-19, 2015, p.52-55
St. Pious X Degree & PG College for Women, Hyderabad-500076.
Sponsored by the Indian Institute of Geomagnetism, Navi Mumbai-410218 (DST, Govt. of India)
Table 3. Antifungal activities of Trigonella foenum-
graecum L seed extracts
Extracts Concentration
(µg/ml)
Zone of inhibition in mm
Asp
erg
illu
s
Nig
er
Fu
sari
um
Rh
izo
pu
s
Mu
co
r
Methanol 5 1.8 2 2 3.1
10 3 4 2.2 4
15 5 4.8 5 5.2
Control Ketocnozole
10µg/ml
7 8 8 10
Ethanol 5 1.5 1.6 1.5 1.6
10 2.2 2 1.8 2.1
15 3 3.2 3.8 3.6
Control Ketocnozole 10µg/ml
7 8 8 10
Pet ether 25 1.8 2.8 2 1.8
50 2.2 3 3 2.8
75 3.6 3.9 3.9 4
Control Ketocnozole 10µg/ml
7 8 8 10
Chloroform 25 2.5 1.3 2 2
50 4.2 2 2.8 2.5
75 5 6 5.2 5.9
Control Ketocnozole
10µg/ml
7 8 8 10
4. CONCLUSION
Flavonoids and Phenols can protect the human body
from the oxidative stress which may cause many diseases, including cancer, cardiovascular problems and ageing [5]. The variations in flavonoids and saponins may be associated with variety of plant, geographical conditions, methods of extraction and solvent used [6]. Alkaloids and flavonoids are the phytochemicals widely used as antiviral, antibacterial, antiamoebial and anticancer agents. Phenols and flavonoids are the groups of secondary metabolites are having great importance as cellular support material because they form the integral part of cell wall structure by polymeric phenolics [7]. In this present study we are concluding that the seeds of Trigonella foenum-graecum L can be utilized as an alternative source of useful drugs.
REFERENCES CITED
1. Indian Herbal Pharmacopoeia, 1999, v.1, p. 32-38, Indian Drugs Manufacturing Association, Mumbai, Regional Research Laboratory Jammu Tavi, 33.edn.
2. Ansari, S.H., Essentials of Pharmacognosy, 2005, Birla Publication Pvt. Ltd, p. 492-559.
3. Thamilmarai Selvi, B.S., Ahamed, J., and Theivandran, G., Ad. Plant Sci., 2011, v. 24, p. 81-85.
4. Jyothichaitanya, P., and Lakshmi Bhavani, N., Ad. Plant
Sci., 2013, v. 26(11), p. 531-534, ISSN 0970-3586. 5. Robards, K., Prernzler, P.D., Tucker, G., Swatsitang, P.,
and Glover, W., Food Chem., 1999, v. 66, p. 401-436. 6. Jane, R.R., and Patil, S.D., Intl. J. Sci. Nat., 2012, v. 3(1),
p.153-158, ISSN 2229 – 6441. 7. Gupta V.K., Singh, G.D., Singh, S., and Kaul, A.,
Medicinal Plants: Phytochemistry, Pharmacology and
Therapeutics, 2010, Daya Publishing House, Delhi.
dsramesh
Typewritten Text
55
Proceedings of the National Seminar on "Impact of Scientific Advances on Society", August 18-19, 2015, p.56-57
St. Pious X Degree & PG College for Women, Hyderabad-500076.
Sponsored by the Indian Institute of Geomagnetism, Navi Mumbai-410218 (DST, Govt. of India)
Impact of scientific advancement on the health of the modern society
P. U. V. N. Manendra Rao*
Govt. P. G. College of Physical Education Domalguda, Hyderabad, India
ABSTRACT
Physical inactivity is a primary cause of most chronic
diseases. Sedentary life style, obesity cause insulin resis-
tance, which develops diabetes. The prevalence of this form is increasing in both developed and developing countries,
owing to the increasing prevalence of obesity and sedentary
lifestyles. Cardiovascular disease (CVD) is the leading cause of death worldwide and mostly in Asia. The root
causes of this modern epidemic are sedentary stressful
urban lifestyles and high-calorie diets rich in saturated fats, salt, and simple sugars. Fast food is the term given to food
that can be prepared and served very quickly. The most
important factors which hurt our health are sedentary
lifestyle, Fast foods and addiction to mobile phone and internet. Sedentary life style leads to obesity and other
degenerative diseases. The sophisticated life style because
of the scientific advancement causing many health hazards among the modern youth.
Keywords: Sedentary life style, cardio vascular diseases (CVDs), obesity and
diabetes
1. INTRODUCTION
Chronic diseases are major killers in the modern era. The scientific advancement provided the modern society
with many sophisticated commodities and gadgets.
Physical inactivity is a primary cause of most chronic
diseases. Sedentary life style, obesity cause insulin resistance which develops diabetes. Cardiovascular
disease (CVD) is the leading cause of death worldwide
and mostly in Asia. The root causes of this modern epidemic are sedentary stressful urban lifestyles and
high-calorie diets rich in saturated fats, salt, and simple
sugars. In most Asian and Middle Eastern countries, outside East Asia, prevalence of CVD and its risk factors
are high and still rising, while the rising mortality is
among the highest in the world. The most important
factors which hurt our health are sedentary lifestyle, fast foods, addiction to mobile phone and internet and
attracting to western life due to globalization.
2. FAST FOODS
Fast food is the term given to food that can be pre-pared and served very quickly. Fast food can also be
defined as any food that contributes little or no nutrient
value to the diet, instead provides excess calories and fat.
Fast food may include salted snack foods, gum, candy, sweet desserts, chips, hot pies, pasties, sandwiches,
burgers, croissants, kebabs, pizzas, chicken, soups, and
salads.It also includes drinks, for instance, milkshakes,
and carbonated beverages. Fast food increases your weight. The higher your BMI, the higher your risk of
obesity and chronic diseases, such as type 2 diabetes,
high blood pressure, cardiovascular disease, gallstones and cancer.
2.1 Disadvantages of fast food
When you feel like eating something and think of
food, the things come to mind first is the taste, odor or
color. Fast foods create a much higher risk of heart
disease because of the high level of saturated or trans fats found in much of the food. Those fats can clog the
arteries and, over time, contribute to high cholesterol
levels. Fast foods also cause obesity. Obesity is a major pediatric public health problem. Adolescents are a
priority population for intervention strategies. Obesity
threatens to become the 21st century’s leading health
problem. As more nations become industrialized and urbanized, the prevalence of obesity will inevitably rise.
Being obese can induce multiple metabolic abnormalities
that contribute to cardiovascular disease, diabetes mellitus, and other chronic disorders. Obesity is the
gateway for all degenerated diseases like diabetes. A
peptic ulcer which is also known as PUD or peptic ulcer disease is the most common ulcer of an area of the
gastrointestinal tract that is usually acidic and thus
extremely painful. Doctors believe that stress, spicy
foods, and alcohol cause most ulcers, constipation and indigestion. Habit of taking fast foods leads to "Away
from the Family Gathering", "Irregular Timing of
Eating", "Waste of Money", "Lack of Essential Nu-trients", "Spikes Your Blood Sugar", "Damages Your
Heart", "Obesity Risk". Anyway, fast foods are "Fast
Now", "Potentially Fatal Later".
3. CELL PHONE
Every day, we are swimming in a sea of electromag-
netic radiation (EMR) produced by electrical appliances, power lines, wiring in buildings, and a slew of other
technologies that are part of modern life. From the
dishwasher and microwave oven in the kitchen and the clock radio next to your bed, to the cellular phone you
hold to your ear—sometimes for hours each day—
dsramesh
Typewritten Text
56

Proceedings of the National Seminar on "Impact of Scientific Advances on Society", August 18-19, 2015, p.56-57
St. Pious X Degree & PG College for Women, Hyderabad-500076.
Sponsored by the Indian Institute of Geomagnetism, Navi Mumbai-410218 (DST, Govt. of India)
exposure to EMR is growing and becoming a serious health threat.
3.1 Smart phone
A smart phone could be defined as a mobile phone that has additional functions similar to personal digital
assistant devices. Smart phone use in health care work
settings presents both opportunities and challenges. The benefits could be severely undermined if abuse and
overuse are not kept in check. Some research conducted
on mobile phone bans in England, as mobile phones are
very popular there amongst teenagers. The cultures of societies are underestimated determinants of their
population health and well-being. This is as true of
modern western culture, including its defining qualities of materialism and individualism, as it is of other cul-
tures. Mobile phones (MPs) progressed from a tool of
the privileged few to a gadget for the masses. We live in a high-tech world of electronics, constantly strolling
through invisible fields of radio waves, television waves,
microwaves, radar, and Wi-Fi networks. In the 1980s in
the Nordic countries and in the 1990s in the United States, a new source of radio frequency waves came into
widespread use: The cell phone, which emits non ioniz-
ing radio waves through an antenna commonly held close to the head. By 2009, the cell phone had become an
integral part of everyday life, with more than 285 million
subscribers to cell phone service in the United States
(91% of the population) and more than 5 billion world-wide. With the World Health Organization (WHO) and
the US National Cancer Institute concluding that there is no conclusive or consistent evidence that no ionizing
radiation emitted by cell phones is associated with
cancer risk. Electromagnetic radio waves emitted from cell phones could damage DNA and lead to cancer; it
may therefore seem surprising that a monograph com-
mittee of the International Agency for Research on Cancer (IARC), an agency of the WHO, recently an-
nounced that cell phones may be “possibly carcinogenic
to humans”.
4. CONCLUSION
The progression of the science is essential for the sur-
vival of the human being and to avail sophisticated livelihood. But at the same time we should realize that
how the technology encroaching and keeping us away
from the nature. Without breaking human relations and welfare youth should utilize the modern gadgets.
REFERENCES
1. Peet, R.K. Annual Review of Ecology and Systematics,
1974, v. 5, p. 285-307.
2. Ramahi, T.M., Asia Pac. J. Public Health, 2010, v. 22(3),
p.83S-89S.
3. Trovato, G.M., Trovato EPMA Journal, 2012, v. 3, p. 8. 4. Gill, P.S., Kamath, A., and Gill, T.S., Risk Manag.
Healthc. Policy, 2012, v. 5 p. 105–114.
5. Acharya, J.P., Acharya, I., and Waghrey, D., IJMRHS,
2013, 2(3), p. 388-394.
dsramesh
Typewritten Text
57
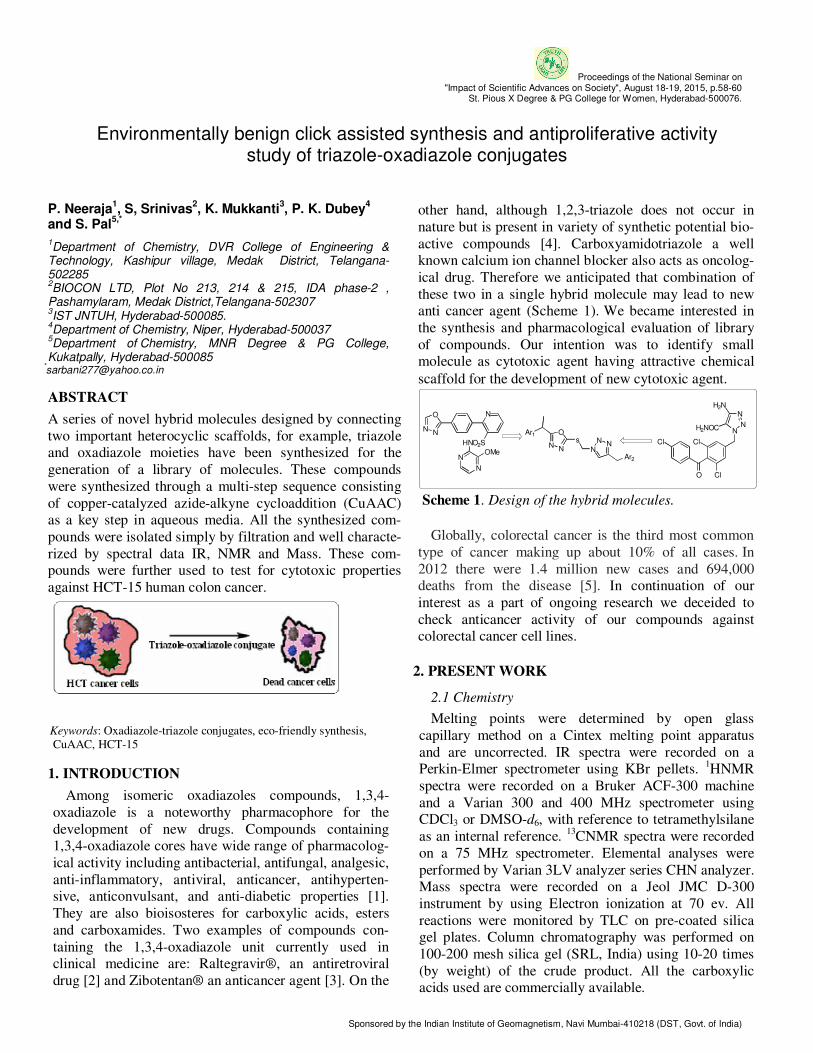
Proceedings of the National Seminar on "Impact of Scientific Advances on Society", August 18-19, 2015, p.58-60
St. Pious X Degree & PG College for Women, Hyderabad-500076.
Sponsored by the Indian Institute of Geomagnetism, Navi Mumbai-410218 (DST, Govt. of India)
Environmentally benign click assisted synthesis and antiproliferative activity study of triazole-oxadiazole conjugates
P. Neeraja1, S, Srinivas
2, K. Mukkanti
3, P. K. Dubey
4
and S. Pal5,*
1Department of Chemistry, DVR College of Engineering &
Technology, Kashipur village, Medak District, Telangana- 502285 2BIOCON LTD, Plot No 213, 214 & 215, IDA phase-2 ,
Pashamylaram, Medak District,Telangana-502307 3IST JNTUH, Hyderabad-500085.
4Department of Chemistry, Niper, Hyderabad-500037
5Department of Chemistry, MNR Degree & PG College,
Kukatpally, Hyderabad-500085 *[email protected]
ABSTRACT
A series of novel hybrid molecules designed by connecting
two important heterocyclic scaffolds, for example, triazole and oxadiazole moieties have been synthesized for the
generation of a library of molecules. These compounds
were synthesized through a multi-step sequence consisting
of copper-catalyzed azide-alkyne cycloaddition (CuAAC) as a key step in aqueous media. All the synthesized com-
pounds were isolated simply by filtration and well characte-
rized by spectral data IR, NMR and Mass. These com-pounds were further used to test for cytotoxic properties
against HCT-15 human colon cancer.
Keywords: Oxadiazole-triazole conjugates, eco-friendly synthesis,
CuAAC, HCT-15
1. INTRODUCTION
Among isomeric oxadiazoles compounds, 1,3,4-
oxadiazole is a noteworthy pharmacophore for the
development of new drugs. Compounds containing 1,3,4-oxadiazole cores have wide range of pharmacolog-
ical activity including antibacterial, antifungal, analgesic,
anti-inflammatory, antiviral, anticancer, antihyperten-sive, anticonvulsant, and anti-diabetic properties [1].
They are also bioisosteres for carboxylic acids, esters
and carboxamides. Two examples of compounds con-
taining the 1,3,4-oxadiazole unit currently used in clinical medicine are: Raltegravir®, an antiretroviral
drug [2] and Zibotentan® an anticancer agent [3]. On the
other hand, although 1,2,3-triazole does not occur in
nature but is present in variety of synthetic potential bio-
active compounds [4]. Carboxyamidotriazole a well known calcium ion channel blocker also acts as oncolog-
ical drug. Therefore we anticipated that combination of
these two in a single hybrid molecule may lead to new anti cancer agent (Scheme 1). We became interested in
the synthesis and pharmacological evaluation of library
of compounds. Our intention was to identify small molecule as cytotoxic agent having attractive chemical
scaffold for the development of new cytotoxic agent.
N N
O N
HNO2S
N
N
OMeN N
OAr1s
NNN
Ar2
Cl
O
Cl
Cl
NN
N
H2N
H2NOC
Scheme 1. Design of the hybrid molecules.
Globally, colorectal cancer is the third most common
type of cancer making up about 10% of all cases. In
2012 there were 1.4 million new cases and 694,000 deaths from the disease [5]. In continuation of our
interest as a part of ongoing research we deceided to
check anticancer activity of our compounds against colorectal cancer cell lines.
2. PRESENT WORK
2.1 Chemistry
Melting points were determined by open glass
capillary method on a Cintex melting point apparatus
and are uncorrected. IR spectra were recorded on a Perkin-Elmer spectrometer using KBr pellets.
1HNMR
spectra were recorded on a Bruker ACF-300 machine
and a Varian 300 and 400 MHz spectrometer using CDCl3 or DMSO-d6, with reference to tetramethylsilane
as an internal reference. 13
CNMR spectra were recorded
on a 75 MHz spectrometer. Elemental analyses were
performed by Varian 3LV analyzer series CHN analyzer. Mass spectra were recorded on a Jeol JMC D-300
instrument by using Electron ionization at 70 ev. All
reactions were monitored by TLC on pre-coated silica gel plates. Column chromatography was performed on
100-200 mesh silica gel (SRL, India) using 10-20 times
(by weight) of the crude product. All the carboxylic acids used are commercially available.
dsramesh
Typewritten Text
58
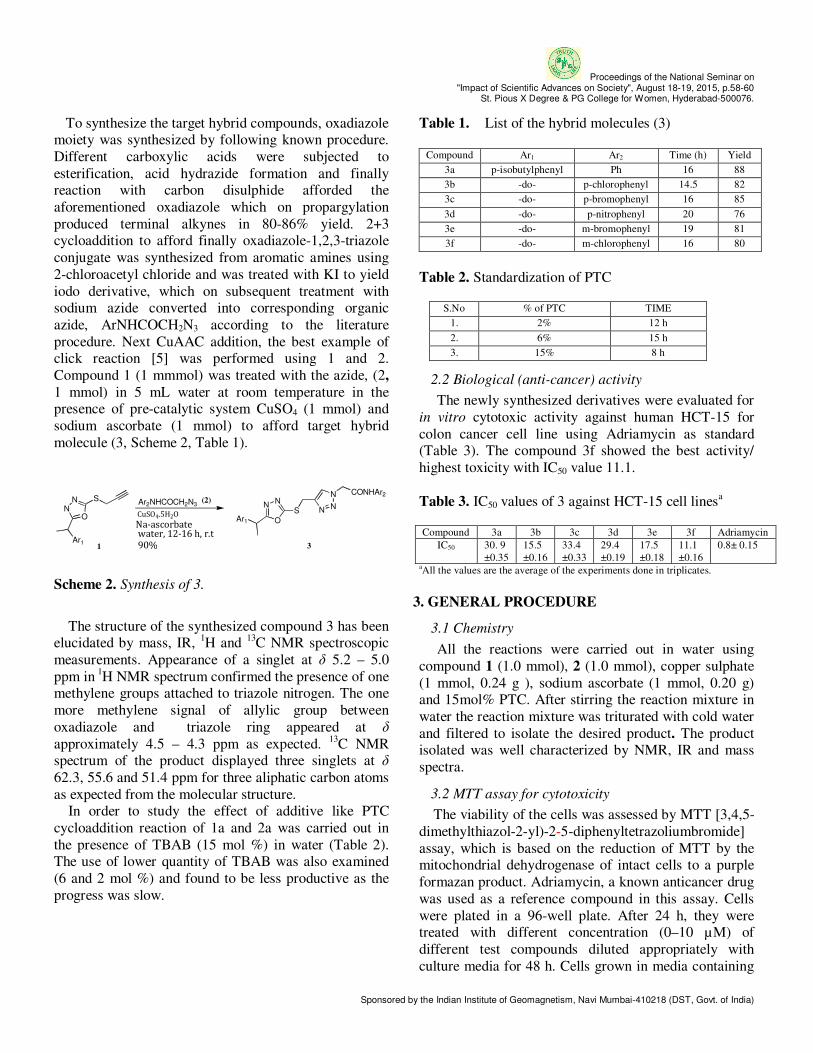
Proceedings of the National Seminar on "Impact of Scientific Advances on Society", August 18-19, 2015, p.58-60
St. Pious X Degree & PG College for Women, Hyderabad-500076.
Sponsored by the Indian Institute of Geomagnetism, Navi Mumbai-410218 (DST, Govt. of India)
To synthesize the target hybrid compounds, oxadiazole moiety was synthesized by following known procedure.
Different carboxylic acids were subjected to
esterification, acid hydrazide formation and finally reaction with carbon disulphide afforded the
aforementioned oxadiazole which on propargylation
produced terminal alkynes in 80-86% yield. 2+3 cycloaddition to afford finally oxadiazole-1,2,3-triazole
conjugate was synthesized from aromatic amines using
2-chloroacetyl chloride and was treated with KI to yield
iodo derivative, which on subsequent treatment with sodium azide converted into corresponding organic
azide, ArNHCOCH2N3 according to the literature
procedure. Next CuAAC addition, the best example of click reaction [5] was performed using 1 and 2.
Compound 1 (1 mmmol) was treated with the azide, (2,
1 mmol) in 5 mL water at room temperature in the presence of pre-catalytic system CuSO4 (1 mmol) and
sodium ascorbate (1 mmol) to afford target hybrid
molecule (3, Scheme 2, Table 1).
CuSO4.5H2O
Na-ascorbatewater, 12-16 h, r.t
90%
Ar1 O
NNS
Ar2NHCOCH2N3
Ar1
O
NN
S
N N
N CONHAr2
1
(2)
3
Scheme 2. Synthesis of 3.
The structure of the synthesized compound 3 has been elucidated by mass, IR,
1H and
13C NMR spectroscopic
measurements. Appearance of a singlet at δ 5.2 – 5.0
ppm in 1H NMR spectrum confirmed the presence of one
methylene groups attached to triazole nitrogen. The one
more methylene signal of allylic group between
oxadiazole and triazole ring appeared at δ
approximately 4.5 – 4.3 ppm as expected. 13
C NMR spectrum of the product displayed three singlets at δ
62.3, 55.6 and 51.4 ppm for three aliphatic carbon atoms
as expected from the molecular structure. In order to study the effect of additive like PTC
cycloaddition reaction of 1a and 2a was carried out in
the presence of TBAB (15 mol %) in water (Table 2). The use of lower quantity of TBAB was also examined
(6 and 2 mol %) and found to be less productive as the
progress was slow.
Table 1. List of the hybrid molecules (3)
Compound Ar1 Ar2 Time (h) Yield
3a p-isobutylphenyl Ph 16 88
3b -do- p-chlorophenyl 14.5 82
3c -do- p-bromophenyl 16 85
3d -do- p-nitrophenyl 20 76
3e -do- m-bromophenyl 19 81
3f -do- m-chlorophenyl 16 80
Table 2. Standardization of PTC
S.No % of PTC TIME
1. 2% 12 h
2. 6% 15 h
3. 15% 8 h
2.2 Biological (anti-cancer) activity
The newly synthesized derivatives were evaluated for
in vitro cytotoxic activity against human HCT-15 for
colon cancer cell line using Adriamycin as standard (Table 3). The compound 3f showed the best activity/
highest toxicity with IC50 value 11.1.
Table 3. IC50 values of 3 against HCT-15 cell linesa
Compound 3a 3b 3c 3d 3e 3f Adriamycin
IC50 30. 9
±0.35
15.5
±0.16
33.4
±0.33
29.4
±0.19
17.5
±0.18
11.1
±0.16
0.8± 0.15
aAll the values are the average of the experiments done in triplicates.
3. GENERAL PROCEDURE
3.1 Chemistry
All the reactions were carried out in water using
compound 1 (1.0 mmol), 2 (1.0 mmol), copper sulphate
(1 mmol, 0.24 g ), sodium ascorbate (1 mmol, 0.20 g) and 15mol% PTC. After stirring the reaction mixture in
water the reaction mixture was triturated with cold water
and filtered to isolate the desired product. The product isolated was well characterized by NMR, IR and mass
spectra.
3.2 MTT assay for cytotoxicity
The viability of the cells was assessed by MTT [3,4,5-
dimethylthiazol-2-yl)-2-5-diphenyltetrazoliumbromide]
assay, which is based on the reduction of MTT by the mitochondrial dehydrogenase of intact cells to a purple
formazan product. Adriamycin, a known anticancer drug
was used as a reference compound in this assay. Cells
were plated in a 96-well plate. After 24 h, they were treated with different concentration (0–10 µM) of
different test compounds diluted appropriately with
culture media for 48 h. Cells grown in media containing
dsramesh
Typewritten Text
59

Proceedings of the National Seminar on "Impact of Scientific Advances on Society", August 18-19, 2015, p.58-60
St. Pious X Degree & PG College for Women, Hyderabad-500076.
Sponsored by the Indian Institute of Geomagnetism, Navi Mumbai-410218 (DST, Govt. of India)
equivalent amount of DMSO served as positive control and cells in medium without any supplementation were
used as negative control. After the treatment, media
containing compound were carefully removed by aspiration. 100 µl of 0.4 mg/ mLMTT in PBS was added
to each well and incubated in the dark for 4 h. 100 µl of
DMSO was added to each well and kept in an incubator for 4 h for dissolution of the formed formazan crystals.
Amount of formazan was determined by measuring the
absorbance at 540 nm using an ELISA plate reader.
4. CONCLUSIONS
Triazole-oxadiazole derivatives were synthesized in aqueous medium in presence of 15 mol % PTC, identified
by 1H NMR,
13C NMR, IR and Mass spectral analysis. The
derivatives were screened for cytotoxic activities against
colon cancer cell lines.
REFERENCES CITED
1. de Olivera, C.S., Lira, B.F., Filho, J.M.B-, Lorenzo, J.G.F.
and de Athayde-Filho, P.F., Molecules, 2012, v. 17, p.
10192-10231.
2. Bostron, J. Honger, A., Llinias, A., Wellner, E. and
Plowright, A.T., J. Med. Chem., 2012, v. 55, p. 1817-1830.
3. Savarino, A., Expert Opni. Investig. Drugs, 2006, v. 15, p.
1507-1522.
4. Praveena, K.S.S. Murthy, N.Y.S. and Pal, S., J. Chem.
Pharm. Res., 2015, v. 7(5), p. 506-522.
5. World Cancer Report (World Health Organization), 2014,
Chapter 1.1. ISBN 9283204298.
6. Kolb, H.C., Finn, M.G. and Sharpless, K.B., Angew. Chem.
Intl. Ed., 2001, v. 40, p. 2004.
ACKNOWLEDGEMENTS
The authors P. Neeraja and S. Srinivas thank DVR College of
Engineering &Technology for encouragement & CFRD,
Osmania Uuniversity for spectra.
dsramesh
Typewritten Text
60
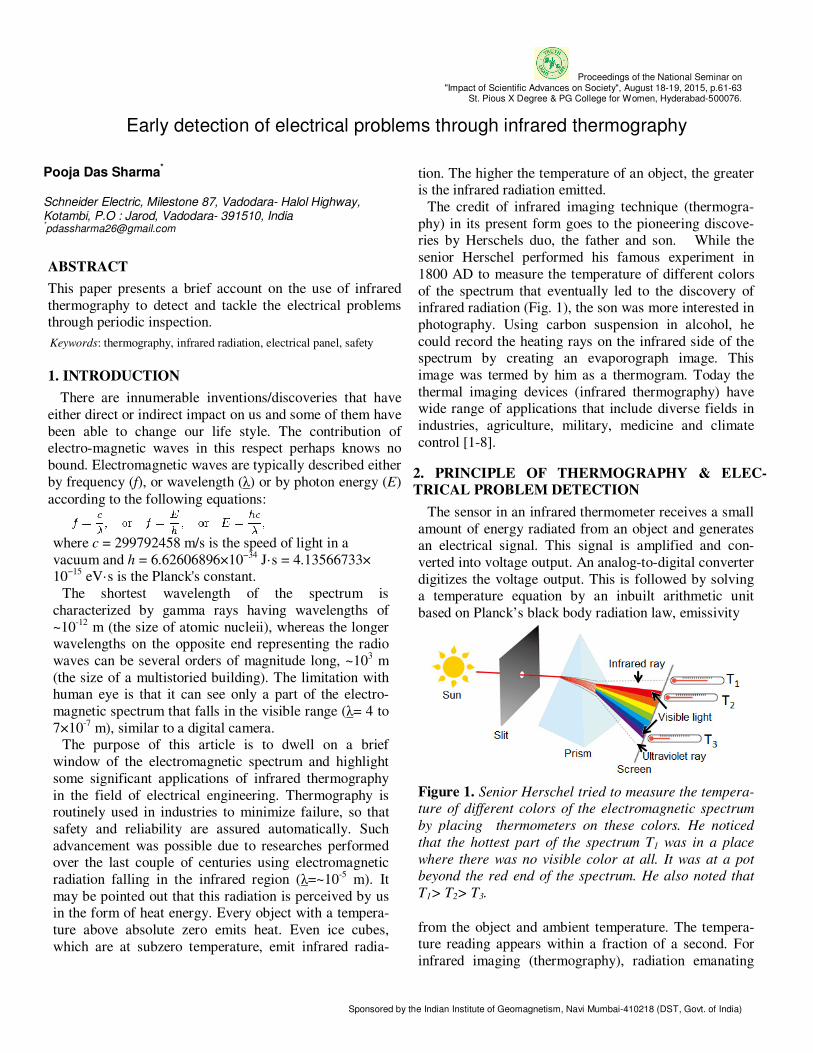
Proceedings of the National Seminar on "Impact of Scientific Advances on Society", August 18-19, 2015, p.61-63
St. Pious X Degree & PG College for Women, Hyderabad-500076.
Sponsored by the Indian Institute of Geomagnetism, Navi Mumbai-410218 (DST, Govt. of India)
Early detection of electrical problems through infrared thermography
Pooja Das Sharma*
Schneider Electric, Milestone 87, Vadodara- Halol Highway, Kotambi, P.O : Jarod, Vadodara- 391510, India *[email protected]
ABSTRACT
This paper presents a brief account on the use of infrared
thermography to detect and tackle the electrical problems through periodic inspection.
Keywords: thermography, infrared radiation, electrical panel, safety
1. INTRODUCTION
There are innumerable inventions/discoveries that have
either direct or indirect impact on us and some of them have
been able to change our life style. The contribution of electro-magnetic waves in this respect perhaps knows no
bound. Electromagnetic waves are typically described either
by frequency (f), or wavelength (λ) or by photon energy (E)
according to the following equations:
where c = 299792458 m/s is the speed of light in a
vacuum and h = 6.62606896×10⁻³⁴
J·s = 4.13566733× 10
−15 eV·s is the Planck's constant.
The shortest wavelength of the spectrum is
characterized by gamma rays having wavelengths of
~10-12
m (the size of atomic nucleii), whereas the longer wavelengths on the opposite end representing the radio
waves can be several orders of magnitude long, ~103 m
(the size of a multistoried building). The limitation with human eye is that it can see only a part of the electro-
magnetic spectrum that falls in the visible range (λ= 4 to
7×10⁻⁷
m), similar to a digital camera. The purpose of this article is to dwell on a brief
window of the electromagnetic spectrum and highlight
some significant applications of infrared thermography
in the field of electrical engineering. Thermography is routinely used in industries to minimize failure, so that
safety and reliability are assured automatically. Such
advancement was possible due to researches performed over the last couple of centuries using electromagnetic
radiation falling in the infrared region (λ=~10-5 m). It
may be pointed out that this radiation is perceived by us in the form of heat energy. Every object with a tempera-
ture above absolute zero emits heat. Even ice cubes,
which are at subzero temperature, emit infrared radia-
tion. The higher the temperature of an object, the greater is the infrared radiation emitted.
The credit of infrared imaging technique (thermogra-
phy) in its present form goes to the pioneering discove-ries by Herschels duo, the father and son. While the
senior Herschel performed his famous experiment in
1800 AD to measure the temperature of different colors
of the spectrum that eventually led to the discovery of infrared radiation (Fig. 1), the son was more interested in
photography. Using carbon suspension in alcohol, he
could record the heating rays on the infrared side of the spectrum by creating an evaporograph image. This
image was termed by him as a thermogram. Today the
thermal imaging devices (infrared thermography) have wide range of applications that include diverse fields in
industries, agriculture, military, medicine and climate
control [1-8].
2. PRINCIPLE OF THERMOGRAPHY & ELEC-
TRICAL PROBLEM DETECTION
The sensor in an infrared thermometer receives a small
amount of energy radiated from an object and generates an electrical signal. This signal is amplified and con-
verted into voltage output. An analog-to-digital converter
digitizes the voltage output. This is followed by solving a temperature equation by an inbuilt arithmetic unit
based on Planck’s black body radiation law, emissivity
Figure 1. Senior Herschel tried to measure the tempera-
ture of different colors of the electromagnetic spectrum
by placing thermometers on these colors. He noticed
that the hottest part of the spectrum T1 was in a place
where there was no visible color at all. It was at a pot
beyond the red end of the spectrum. He also noted that
T1> T2> T3.
from the object and ambient temperature. The tempera-ture reading appears within a fraction of a second. For
infrared imaging (thermography), radiation emanating
dsramesh
Typewritten Text
61
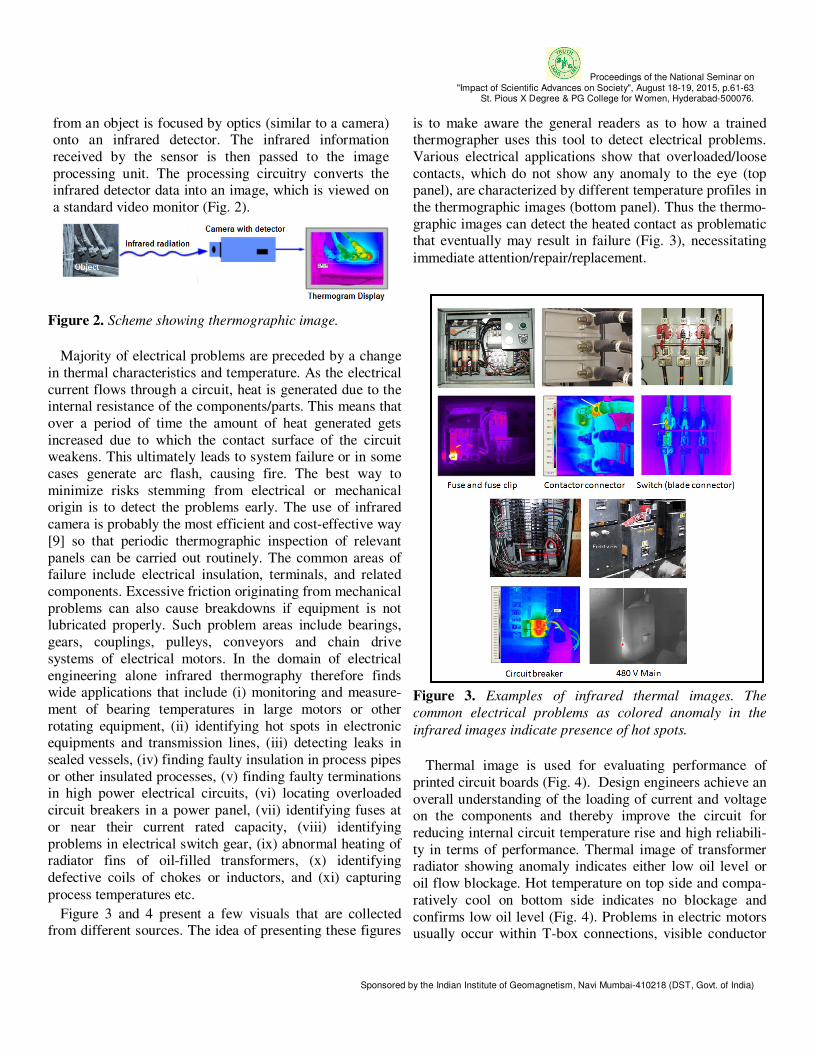
Proceedings of the National Seminar on "Impact of Scientific Advances on Society", August 18-19, 2015, p.61-63
St. Pious X Degree & PG College for Women, Hyderabad-500076.
Sponsored by the Indian Institute of Geomagnetism, Navi Mumbai-410218 (DST, Govt. of India)
from an object is focused by optics (similar to a camera) onto an infrared detector. The infrared information
received by the sensor is then passed to the image
processing unit. The processing circuitry converts the infrared detector data into an image, which is viewed on
a standard video monitor (Fig. 2).
Figure 2. Scheme showing thermographic image.
Majority of electrical problems are preceded by a change
in thermal characteristics and temperature. As the electrical
current flows through a circuit, heat is generated due to the internal resistance of the components/parts. This means that
over a period of time the amount of heat generated gets
increased due to which the contact surface of the circuit weakens. This ultimately leads to system failure or in some
cases generate arc flash, causing fire. The best way to
minimize risks stemming from electrical or mechanical origin is to detect the problems early. The use of infrared
camera is probably the most efficient and cost-effective way
[9] so that periodic thermographic inspection of relevant
panels can be carried out routinely. The common areas of failure include electrical insulation, terminals, and related
components. Excessive friction originating from mechanical
problems can also cause breakdowns if equipment is not lubricated properly. Such problem areas include bearings,
gears, couplings, pulleys, conveyors and chain drive
systems of electrical motors. In the domain of electrical
engineering alone infrared thermography therefore finds wide applications that include (i) monitoring and measure-
ment of bearing temperatures in large motors or other
rotating equipment, (ii) identifying hot spots in electronic equipments and transmission lines, (iii) detecting leaks in
sealed vessels, (iv) finding faulty insulation in process pipes
or other insulated processes, (v) finding faulty terminations in high power electrical circuits, (vi) locating overloaded
circuit breakers in a power panel, (vii) identifying fuses at
or near their current rated capacity, (viii) identifying
problems in electrical switch gear, (ix) abnormal heating of radiator fins of oil-filled transformers, (x) identifying
defective coils of chokes or inductors, and (xi) capturing
process temperatures etc.
Figure 3 and 4 present a few visuals that are collected from different sources. The idea of presenting these figures
is to make aware the general readers as to how a trained thermographer uses this tool to detect electrical problems.
Various electrical applications show that overloaded/loose
contacts, which do not show any anomaly to the eye (top panel), are characterized by different temperature profiles in
the thermographic images (bottom panel). Thus the thermo-
graphic images can detect the heated contact as problematic that eventually may result in failure (Fig. 3), necessitating
immediate attention/repair/replacement.
Figure 3. Examples of infrared thermal images. The
common electrical problems as colored anomaly in the
infrared images indicate presence of hot spots.
Thermal image is used for evaluating performance of
printed circuit boards (Fig. 4). Design engineers achieve an
overall understanding of the loading of current and voltage on the components and thereby improve the circuit for
reducing internal circuit temperature rise and high reliabili-
ty in terms of performance. Thermal image of transformer radiator showing anomaly indicates either low oil level or
oil flow blockage. Hot temperature on top side and compa-
ratively cool on bottom side indicates no blockage and
confirms low oil level (Fig. 4). Problems in electric motors usually occur within T-box connections, visible conductor
dsramesh
Typewritten Text
62

Proceedings of the National Seminar on "Impact of Scientific Advances on Society", August 18-19, 2015, p.61-63
St. Pious X Degree & PG College for Women, Hyderabad-500076.
Sponsored by the Indian Institute of Geomagnetism, Navi Mumbai-410218 (DST, Govt. of India)
connections, rotors or bearings. All of these problems
involve overheating. Wear in the motor is documented in
Figure 4. More examples of electrical appliances (top
panel) used in different industries with their infrared
thermal images (bottom panel).
infrared thermography (Fig. 4).
3. CONCLUSIONS
Infrared thermography is a highly reliable and cost-effective preventative maintenance solution. With adequate
training and education, the technique can be adopted for
minimizing failure. This would ensure profit, safety and
reliability in various operations.
REFERENCES CITED
1. Korendo, Z., and Florkowski, M., Power Engineering Journal,
2001, v. 15(1), p. 33-42.
2. Verma, A.K., Ray, A.K., Singh, S.P., Banerjee, D., and
Samuel, S., Indian Pulp and Paper Technical Association
(IPPTA), 2009, v. 21(2), p. 55-58.
3. Balaras, C.A., and Argiriou, A.A., Energy and Buildings, 2002,
v. 34(2), p. 171-183.
4. Manickavasagan, A., Jayas, D.S., White, N.D.G. and Paliwal, J., CSAE/SCGR Meeting, 2005, Paper No. 05-002, Winnipeg,
Manitoba (Canada).
5. Pašagić, V., Mužević, M. and Kelecc, D., BRODOGRADNJA,
2008, v. 59, p. 123-130.
6. Kerr, J., NZHTA Tech Brief Series, 2004, v. 3(3), (on-line)
http://nzhta.chmeds.ac.nz/thermography_ breastcancer.pdf
7. Gulyaev, Y.V., Markov, A.G., Koreneva, L.G. and Zakharov
P.V., IEEE Engineering in Medicine and Biology Magazine,
1995, v. 14(6), p.766–771.
8. Gottschalk, K., Infrared Thermography Recent Advances and
Future Trends, C. Meola (ed.), Bentham Science Publishers, 2014, pp. 103-132.
9. Stockton, G.R., The World of Infrared, 2012, (on-line)
http://www.stocktoninfrared.com/are-electrical-switchgear-
surveys-still/
dsramesh
Typewritten Text
63

Proceedings of the National Seminar on "Impact of Scientific Advances on Society", August 18-19, 2015, p.64-67
St. Pious X Degree & PG College for Women, Hyderabad-500076.
Sponsored by the Indian Institute of Geomagnetism, Navi Mumbai-410218 (DST, Govt. of India)
Drug resistance and plasmid profiling of Pseudomonas isolated from Hyderabad regions
Pritha Ghosh*
Department of Microbiology, St. Pious X Degree & PG College for Women, Nacharam,, Hyderabad-500076, Telangana, India
ABSTRACT
Pseudomonas is a genus of gamma proteobacteria belong-
ing to larger family of pseudomonads. It is a rod shape, gram negative, aerobic, non-sporing with polar flagella. The
strains of Pseudomonas now a days, recognized as an
emerging opportunistic pathogen of clinical relevance. Pseudomonas strain genome sequences have made the
genus an excellent focus for scientific research; the best
studied species includes P.aeruginosa, in its role as an opportunistic human pathogen. The samples used in this
project were isolated from different sources from various
regions of Hyderabad.
A total of 40 strains were implemented in this work to gain
an insight on antibiotic resistance of various Pseudomonas
isolates obtained and their plasmid profile. Its multi drug resistance action was done by placing antibiotics discs on
Muller Hinton agar. And the resistant isolates were further
checked for plasmid profile using Brinboim and Dolly method.
Hence this work is an effort to investigate the plasmid
presence, profiling and their involvement in resistance to different antibiotics
Keywords: Pseudomonas, multi drug resistance, plasmid profiling
1. INTRODUCTION
Pseudomonas is a genus of gamma proteobacteria,
belonging to the larger family of pseudomonads. Recent-
ly, 16S rRNA sequence analysis has redefined the taxonomy of many bacterial species [1]. Pseudomonad''
literally means 'false unit', being derived from the Greek
pseudo (‘false’) and monas (‘a single unit'). The term "monad" was used in the early history of microbiology to
denote single-celled organisms. Because of their wide-
spread occurrence were observed early in the history of
microbiology. Soon afterwards, pseudomonads were isolated from many natural niches, and a large number of
species names were originally assigned to the genus.
New methodology and the inclusion of approaches based on the studies of conservative macromolecules have
reclassified many strains [2]. Several different epidemio-
logical studies indicate antibiotic resistance is increasing in clinical isolates [3]. In the year 2000, the complete
genome sequence of a Pseudomonas species was deter-
mined; more recently, the sequence of other strains have
been determined, including P. aeruginosa strains PAO1 (2000), P. putida KT2440 (2002), P. fluorescens Pf-5
(2005), P. syringae pathovar tomato DC3000 (2003), P.
syringae pathovar syringae B728a (2005), P. syringae pathovar phaseolica 1448A (2005), P. fluorescens PfO-1
and P. entomophila L48 [3]. An article published in the
journal Science in 2008 showed Pseudomonas may be the most common nucleator of ice crystals in clouds,
thereby being of utmost importance to the formation of
snow and rain around the world [4, 5]. The members of
the genus demonstrate a great deal of metabolic diversi-ty, and are able to colonise a wide range of niches [6].
Their ease of culture in vitro and availability of an
increasing number of Pseudomonas strain genome sequences has made the genus an excellent focus for
scientific research; the best studied species include P.
aeruginosa in its role as an opportunistic human patho-gen, the plant pathogen P. syringae, the soil bacterium P.
putida, and the plant growth promoting P. fluorescens.
The primary cause of antibiotic resistance is genetic
mutation in bacteria. The prevalence of antibiotic resis-tant bacteria is a result of antibiotic use both within
medicine and veterinary medicine. The greater the
duration of exposure the greater the risk of the develop-ment of resistance irrespective of the severity of the need
for antibiotics. As resistance becomes more common
there becomes a greater need for alternative treatments.
However despite a push for new antibiotic therapies there has been a continued decline in the number of
newly approved drugs [7]. Antibiotic resistance therefore
poses a significant problem. If a bacterium carries several resistance genes, it is called multiresistant or,
informally, a superbug or super bacterium. Being Gram-
negative bacteria, most Pseudomonas spp. are naturally resistant to penicillin and the majority of related beta-
lactam antibiotics, but a number are sensitive to pipera-
cillin, imipenem, ticarcillin, tobramycin, or ciproflox-
acin [8]. Their resistance to most antibiotics is attributed to efflux pumps, which pump out some antibiotics before
the antibiotics are able to act. This low susceptibility is
attributable to a concerted action of multidrug efflux pumps with chromosomally-encoded antibiotic resis-
tance genes (e.g. mexAB-oprM, mexXY, etc., [9]) and the
low permeability of the bacterial cellular envelopes. Acquired resistance is either by mutation in chromoso-
dsramesh
Typewritten Text
64
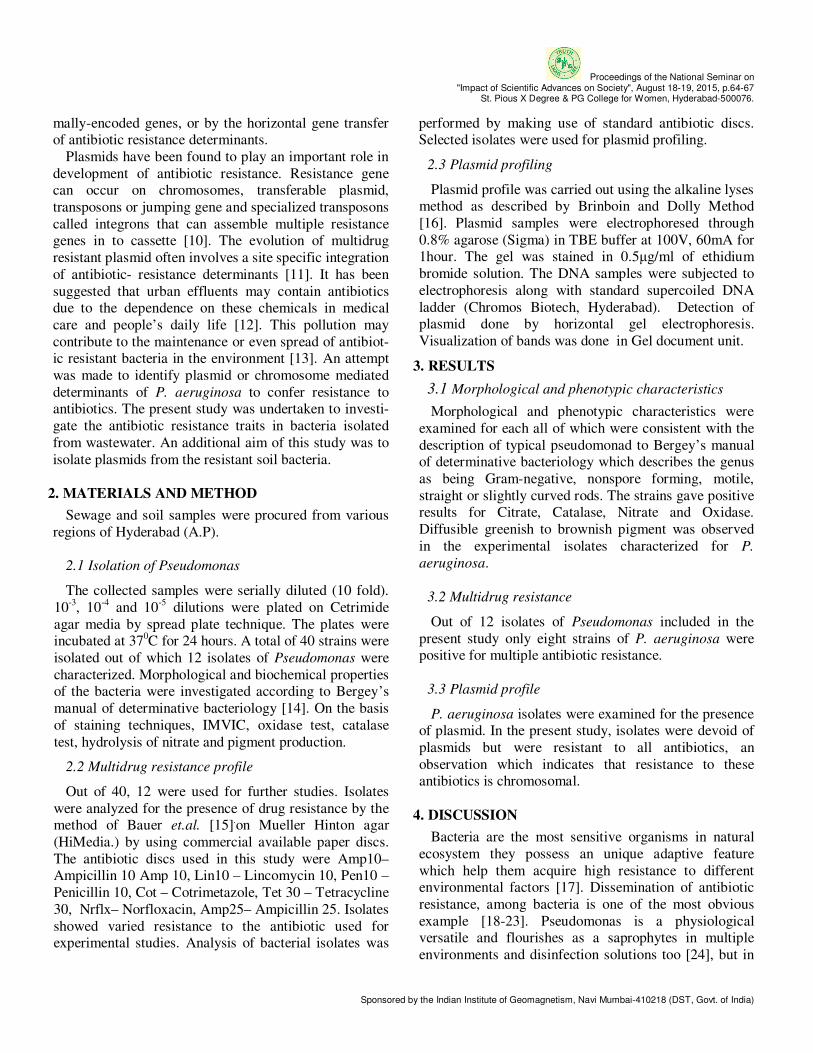
Proceedings of the National Seminar on "Impact of Scientific Advances on Society", August 18-19, 2015, p.64-67
St. Pious X Degree & PG College for Women, Hyderabad-500076.
Sponsored by the Indian Institute of Geomagnetism, Navi Mumbai-410218 (DST, Govt. of India)
mally-encoded genes, or by the horizontal gene transfer of antibiotic resistance determinants.
Plasmids have been found to play an important role in
development of antibiotic resistance. Resistance gene can occur on chromosomes, transferable plasmid,
transposons or jumping gene and specialized transposons
called integrons that can assemble multiple resistance genes in to cassette [10]. The evolution of multidrug
resistant plasmid often involves a site specific integration
of antibiotic- resistance determinants [11]. It has been
suggested that urban effluents may contain antibiotics due to the dependence on these chemicals in medical
care and people’s daily life [12]. This pollution may
contribute to the maintenance or even spread of antibiot-ic resistant bacteria in the environment [13]. An attempt
was made to identify plasmid or chromosome mediated
determinants of P. aeruginosa to confer resistance to antibiotics. The present study was undertaken to investi-
gate the antibiotic resistance traits in bacteria isolated
from wastewater. An additional aim of this study was to
isolate plasmids from the resistant soil bacteria.
2. MATERIALS AND METHOD
Sewage and soil samples were procured from various
regions of Hyderabad (A.P).
2.1 Isolation of Pseudomonas
The collected samples were serially diluted (10 fold).
10-3
, 10-4
and 10-5
dilutions were plated on Cetrimide
agar media by spread plate technique. The plates were incubated at 37
0C for 24 hours. A total of 40 strains were
isolated out of which 12 isolates of Pseudomonas were
characterized. Morphological and biochemical properties of the bacteria were investigated according to Bergey’s
manual of determinative bacteriology [14]. On the basis
of staining techniques, IMVIC, oxidase test, catalase
test, hydrolysis of nitrate and pigment production.
2.2 Multidrug resistance profile
Out of 40, 12 were used for further studies. Isolates
were analyzed for the presence of drug resistance by the method of Bauer et.al. [15]
.on Mueller Hinton agar
(HiMedia.) by using commercial available paper discs.
The antibiotic discs used in this study were Amp10– Ampicillin 10 Amp 10, Lin10 – Lincomycin 10, Pen10 –
Penicillin 10, Cot – Cotrimetazole, Tet 30 – Tetracycline
30, Nrflx– Norfloxacin, Amp25– Ampicillin 25. Isolates
showed varied resistance to the antibiotic used for experimental studies. Analysis of bacterial isolates was
performed by making use of standard antibiotic discs. Selected isolates were used for plasmid profiling.
2.3 Plasmid profiling
Plasmid profile was carried out using the alkaline lyses method as described by Brinboin and Dolly Method
[16].
Plasmid samples were electrophoresed through
0.8% agarose (Sigma) in TBE buffer at 100V, 60mA for 1hour. The gel was stained in 0.5µg/ml of ethidium
bromide solution. The DNA samples were subjected to
electrophoresis along with standard supercoiled DNA
ladder (Chromos Biotech, Hyderabad). Detection of plasmid done by horizontal gel electrophoresis.
Visualization of bands was done in Gel document unit.
3. RESULTS
3.1 Morphological and phenotypic characteristics
Morphological and phenotypic characteristics were
examined for each all of which were consistent with the
description of typical pseudomonad to Bergey’s manual of determinative bacteriology which describes the genus
as being Gram-negative, nonspore forming, motile,
straight or slightly curved rods. The strains gave positive results for Citrate, Catalase, Nitrate and Oxidase.
Diffusible greenish to brownish pigment was observed
in the experimental isolates characterized for P.
aeruginosa.
3.2 Multidrug resistance
Out of 12 isolates of Pseudomonas included in the
present study only eight strains of P. aeruginosa were positive for multiple antibiotic resistance.
3.3 Plasmid profile
P. aeruginosa isolates were examined for the presence of plasmid. In the present study, isolates were devoid of
plasmids but were resistant to all antibiotics, an
observation which indicates that resistance to these antibiotics is chromosomal.
4. DISCUSSION
Bacteria are the most sensitive organisms in natural
ecosystem they possess an unique adaptive feature
which help them acquire high resistance to different environmental factors [17]. Dissemination of antibiotic
resistance, among bacteria is one of the most obvious
example [18-23]. Pseudomonas is a physiological versatile and flourishes as a saprophytes in multiple
environments and disinfection solutions too [24], but in
dsramesh
Typewritten Text
65

Proceedings of the National Seminar on "Impact of Scientific Advances on Society", August 18-19, 2015, p.64-67
St. Pious X Degree & PG College for Women, Hyderabad-500076.
Sponsored by the Indian Institute of Geomagnetism, Navi Mumbai-410218 (DST, Govt. of India)
the last 2 decades the organisms have become increasingly recognized as the aetiological agents in
variety of serious infections [25]. Indiscriminate use of
anti microbial drugs also adds up to its resistance of different antibitotics. In additional to inate resistance,
acquired additional resistance due to plasmids is also a
problem which needs a broader insight to study various subjects related to pseudomonas To date in general
bacteriological studies with sanitary pollution &
bacterial number and only limited studies were aimed at
the problem of bacterial resistance to antibiotics .Moreover this problem is of a greater significance in the
ecology of those micro organisms and in the public
health risk [26-27]. The present study was designed to determine pseudomonas isolates obtained from various
environmental samples and to investigate plasmid
presence and their involvement in resistance to different antibiotics.
A total of 40 strains were taken for experimental
analysis out of which 12 isolates of Pseudomonas were
characterized based on gram morphology and biochemical tests. Present study also gives insight on
multi drug resistance. Our experimental data shows that
out of 12, 8 were found to be highly resistant to different antibiotics (Table 1).
Table 1. Experimental data
Sexual contact through the formation of bridge of pillus is common among gram negative bacilli and other
species. This may involve chromosomal or
extrachromosomal plasmid DNA transfer. Plasmids are extra chromosomal DNA, which carries resistant gene
through generation which confers bacterial resistance
[28]. In order to examine if there is plasmid involvement in
antibiotic resistance mentioned above, plasmid
extraction with alkaline lysis method was applied in our
study. From the results of plasmid extraction experiment ,it was found that ,the strains were devoid of plasmids
but were resistant to all most all antibiotics used there by
indicating that resistance to these antibiotics is chromosomal, an observation which co relates with the
previous literature data . Although the relationship
between plasmid-medi- ated antibiotic resistance and alterations in virulence is established, [29-32]. The
association of chromosomally- mediated resistance and
virulence has received less attention. Spontaneous
mutationsin chromosomal genes occur at a frequency of 10
6-10
8/cell division. In relation to antibiotic resistance,
such mutations usually involve genes encoding the target
site, or cell structures affecting access to the target site. The other factor for the absence of plasmids may be
attributed to fertility inhibition, a phenomena which is a
result of the activity of multi-sub unit repressor encoded
by two fin genes which acts on operator and prevents transcription of genes required for transfer. Most R-
plasmids posses active fin repressor which may accounts
for low transfer frequency.
5. CONCLUSION
From the above discussion it is shown that isolates exhi-
biting the drug resistance was not due to the plasmid
mediated. In the view of these studies, it is evident that the
bacterial strains were able to grow in the presence of antibiotics. This property of antibiotic resistance in these
bacteria may be important to get an insight to study hori-
zontal gene transfer mechanism and may be linked to the distribution of these resistances in nature. Resistance to
antibiotics is widespread among bacteria and relation with
transferable plasmids should be further studied. Environ-mental contamination with antibiotics in conjugation with
the presence of resistant bacteria and their resistance genes
affects the biodiversity of natural ecosystems. Presence of
antibiotics there by determine a reduction in the levels of microbial diversity by the suppression or reduction of
susceptible organisms, like bacteria and thus altering the
balance of natural microcosm.
dsramesh
Typewritten Text
66
Proceedings of the National Seminar on "Impact of Scientific Advances on Society", August 18-19, 2015, p.64-67
St. Pious X Degree & PG College for Women, Hyderabad-500076.
Sponsored by the Indian Institute of Geomagnetism, Navi Mumbai-410218 (DST, Govt. of India)
REFERENCES CITED
1. Anzai, Y., Kim, H., Park, J.Y., and Wakabayashi, H., Int.
J. Syst. Evol. Microbiol., 2000, v. 50, p.1563–1589.
2. Cornelis, P., (ed.), 2008, Caister Academic Press. ISBN
978-1-904455-19-6, ISBN 1904455190, http://www. hori
zonpress.com/pseudo. 3. Van Eldere, J., J. Antimicrob. Chemother., 2003, v. 51 (2),
p. 347–52.
4. From snowflake formation to growth of bacterial colonies.
5. The rain making bacteria.
6. Hassett, D., Cuppoletti, J., Trapnell, B., Lymar, S., Rowe,
J., Yoon, S., Hilliard, G., Parvatiyar, K., Kamani, M.,
Wozniak, D., Hwang, S., McDermott, T., and Ochsner, U.,
Adv Drug Deliv. Rev., 2002, v. 54 (11), p. 1425–1443.
7. The Journal of Antibiotics, 2010, v. 63, p. 423-430.
8. Robicsek, A., Jacoby, G.A., and Hooper, D.C., Lancet.
Infect. Dis., 2006, v. 6 (10), p. 629–640.
9. Hardie, et. al., 2009, Caister Academic Press. ISBN 978-
1-904455-42-4.
10. Shlaes, D.M.., Gerding, D.N,. John, J.F. Jr., Duncan, R.A.
and Craig, W.A., Infect. Contral Hosp Epidemiol., 1997, v.
18, p. 275-291.
11. Spencer, D.H., Kas, A., Smith, E.E., Smis, E.H. and Olson,
M.V. J. Bacteriol., 2003, v. 185, p. 1316-1325.
12. Levy, S.B., Sci. Am., 1998, v. 278, p. 46–54.
13. Gon˜i-Urriza, M., Capdepuy, M., Arpin, C., Raymond, N.,
Caumette, P., Quentin, C., Appl. Environ. Microbiol., 2000, v. 66, p.125–132.
14. Holt, G.H., Kreig, N.R., Sneath, P.H.A., Staley, J.T. and
Williams, S.T., Bergey’s Manual of Determinative
Bacteriology, 1997, 9th Edn., Williams and Wilkins, New
York.
15. Bauer, A.W., Kirby, W.M.M., Sherris, J.C., and Turck, M.
American Journal of Clinical Pathology, 1966), v. 45, p.
494–496.
16. Davis, L.G., Dibner, M.D. and Battey, J.F., 1986, Elsevier Science Publishing Co. Inc., New York .
17. Lobova ,T.I, Maksimova, E.Y. Popova, L.Y., and
Pechurkin, N.S., Aquat.Ecol., 2002, v. 36, p. 229-307.
18. Chandrasekharan, S., Venkatesh, B. and Laithakumari, D.,
Curr.Microbiol.,1998, v. 37, p. 347-351.
19. Gomes:- Lus, R., Int. Microbiol., 1998, v. 1, p. 279-284.
20. Ho, M.W., Traavik, T., Olsvik,.T,T., Appeser, B., Howard, C.V., Von Weizsacker, C. and McGavin, G.C., Microbial. Ecol.Health
Dis., 1998, v. 10, p. 33-59. 21. Van Elsass, J.D., McSpadder–Gardener, B.B., Wolters,
A.C., and Smit, E., Applied Environ. Microbiol., 1998, v.
64, p. 880-889.
22. Radu, S., Mutalib, S.S., Rusul, G., Haasan, Z., and Yeang,
L.K., Microbios., 2001, v. 407, p. 39-47.
23. Shoemaker, N.B., Vlamkis, H., Hayes and Sayers, A.A.,
Applied Environ. Microbiol., 2001, v. 67, p. 561-568.
24. Govan, T.R.W. Mackey and Mc Carty’s Practical Medical
Microbiology, (Colle, .J.G., Frasier, A.G., Marmion, B.P.,
and Simmon’s, A., Eds.), 1996, 14th Edition, pp. 414-416,
Churchill Livingstone, New York.
25. Neu, H.C., J. Antimicrobe Chemother (Suppl. B), 1983.
26. Papadakis, J.A , Mavridou, Richardson, S.C., Lampiri, M
and Marcelou, U., Water Res., 1997, v. 3, p. 799- 804.
27. Qureshi, A.A. and Qureshi, M.A., Multiple Water Air Soil
Pollut., 1992, v. 61, p. 47-56.
28. Naik, U.B., Jalil, J., Bhatnase, Naik, V.B., and Dhore, R.,
2010, v. 1(1), p. 37-44, Research India Publications, ISSN
0976-5867. 29. Laporta, M.Z., Silva, M.L.M., Scaletsky, I.C.A., and
Trabulsi, L.R., Infect. Immun., 1986, v. 51, p. 715-717.
30. Wachsmuth, I.K., Falkow, S., and Ryder, R.W., Infect.
Immun. 1976, v. 14, p. 403407.
31. Echeverria, P., Verhaert, L., Ulyangco, C.V. et al., Lancet.,
1978, v. 2, p. 589-592.
32. Lacey, R.W., Chopra, I., J. Med. Microbiol., 1975, v. 8, p.
137-147.
dsramesh
Typewritten Text
67
Proceedings of the National Seminar on "Impact of Scientific Advances on Society", August 18-19, 2015, p.68-70
St. Pious X Degree & PG College for Women, Hyderabad-500076.
Sponsored by the Indian Institute of Geomagnetism, Navi Mumbai-410218 (DST, Govt. of India)
Growth of mobile applications and its impact
P. Soumya Sree Laxmi* and K. Sandhya Sree
#
Department of Computer Science, St.Pious X Degree & PG College for Women, Nacharam, Hyderabad-500076, India *[email protected]
ABSTRACT
Mobile applications (or Mobile apps) use and development
is growing rapidly in modern society. People of different
age group are using mobile apps for different purpose. Smartphone developers are rising with never ending
innovative Mobile apps. This tremendous growth is show-
ing deep impact on the society. This paper provides an overview on the growth of mobile apps development and its
effect on the society.
Keywords: Smart phones, mobile apps, social impact
1. INTRODUCTION
Computers have made everything and anything reach-
able to mankind. Adding to these mobile applications are
running on a small hand held mobile device which is moveable, easy to use and accessible from anywhere and
any place. Earlier days mobiles were used as a medium
for sending and receiving calls. Mobile is how the world communicates today. Smart phones play an increasingly
important role in our daily lives from collecting infor-
mation to news, entertainment, payments, socializing and
shopping, people use mobile phones more and more and they don’t go to mobile sites instead download mobile
apps to perform these activities. Application software
developers also have to consider a lengthy array of screen sizes, hardware specifications and configurations
because of intense competition in mobile software and
changes within each of the platforms [1]. Mobile applications (or mobile apps) are compact
programs developed to work on a smart phone, tablets
and feature phones. Mobile apps fall broadly into three
categories: native, web based, and hybrid [2, 3]. Native applications run on a device’s operating system and are
required to be adapted for different devices. Web-based
apps require a web browser on a mobile device. Hybrid apps are ‘native-wrapped’ web apps.
• Native Apps : These apps are installed in the
device. They do not need any data transfer to the
server and works in the device without network as the data about the app is stored in the device itself.
For example, Notes and Reminder in iPhones.
• Hybrid Apps (Web): Apps are installed in the
device and always require internet connection to
run and function. For example, Social Networking
Apps (Facebook, Twitter), Instant Messengers (Whatsapp, Skype), E-Commerce (E-bay,
Flipkart)
• Hybrid Apps (Mixed): Apps are installed in the
device and may or may not require internet
connection to run and function. For example, games, screen apps, etc.
2. IMPACT OF MOBILE APPLICATIONS ON SO-
CIETY
Mobile apps became one of the common sources for many business partners and even individuals. The major
impacts of Mobile apps include business, education,
health and social life. Mobile technology has drastically
changed the cultural norms and behavior of individuals. The impacts are both at the positive side and also at the
negative side.
2.1 Business
The impact of Mobile apps has created new
dimensions on business. Different mobile operating
system vendors have their own mobile application technology hence having a different market for Mobile
Applications. The most common one are iPhone
application market, BlackBerry application market, Android market, Microsoft mobile Application market.
These online market places enable users to download
useful mobile applications on need basis. Though advertising is an old concept but the features of
Smartphone have made it more effective and no doubt it
is an additional positive impact of Mobile application for
business. Mobile application publisher, distributor and service provider are getting large revenue by providing
ads as a part of mobile application [4]. However as a
negative effect increase in mobile apps had a drastic effect on the PC market according to surveys.
2.2 Education
Any efforts in improving the quality of education have been always appreciated. Mobile apps have emerged as
a knowledge database. People no longer do require
carrying all those bundles of magazines and books, or 'stay tuned' to catch the latest headlines, but can easily
read them all on our devices. Growing internet
connectivity and speed has helped us to keep in touch with the most recent updates regarding almost every
sphere or field. No matter whether you're a businessman
seeking latest information on stocks and shares or
students willing to get the latest pieces of information there are apps to do the work for them. However as a
dsramesh
Typewritten Text
68
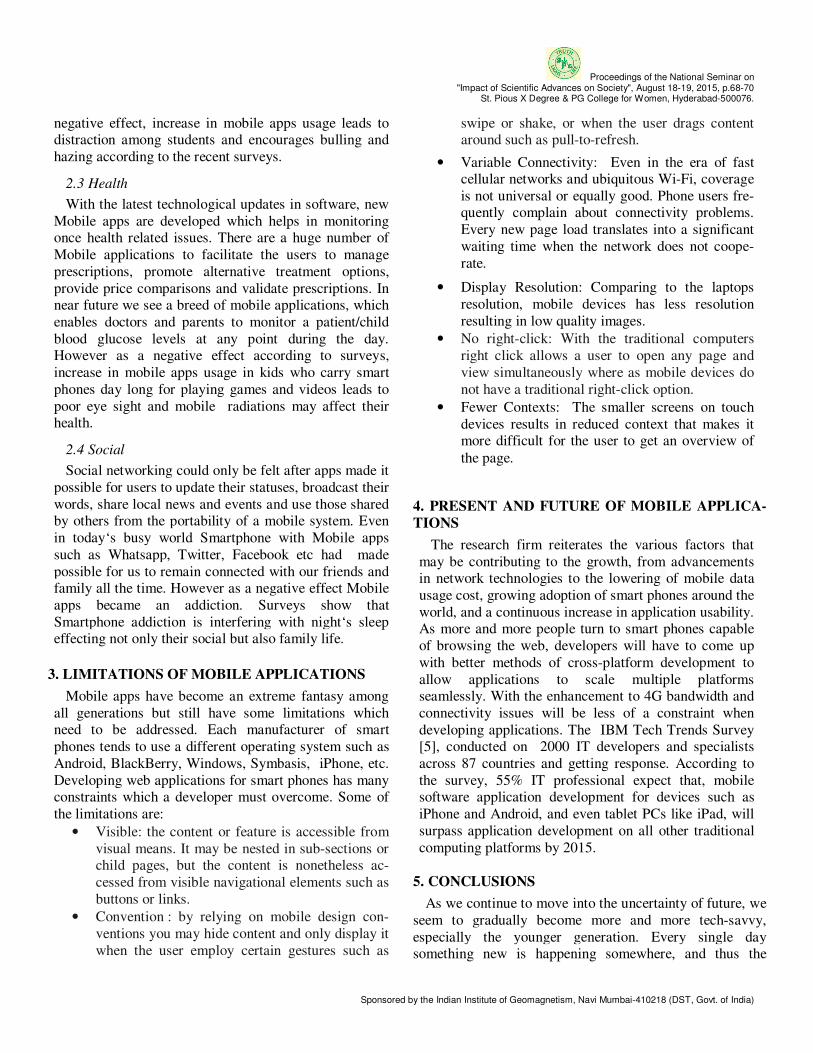
Proceedings of the National Seminar on "Impact of Scientific Advances on Society", August 18-19, 2015, p.68-70
St. Pious X Degree & PG College for Women, Hyderabad-500076.
Sponsored by the Indian Institute of Geomagnetism, Navi Mumbai-410218 (DST, Govt. of India)
negative effect, increase in mobile apps usage leads to distraction among students and encourages bulling and
hazing according to the recent surveys.
2.3 Health
With the latest technological updates in software, new
Mobile apps are developed which helps in monitoring once health related issues. There are a huge number of
Mobile applications to facilitate the users to manage
prescriptions, promote alternative treatment options,
provide price comparisons and validate prescriptions. In near future we see a breed of mobile applications, which
enables doctors and parents to monitor a patient/child
blood glucose levels at any point during the day. However as a negative effect according to surveys,
increase in mobile apps usage in kids who carry smart
phones day long for playing games and videos leads to
poor eye sight and mobile radiations may affect their health.
2.4 Social
Social networking could only be felt after apps made it
possible for users to update their statuses, broadcast their
words, share local news and events and use those shared by others from the portability of a mobile system. Even
in today‘s busy world Smartphone with Mobile apps
such as Whatsapp, Twitter, Facebook etc had made
possible for us to remain connected with our friends and family all the time. However as a negative effect Mobile
apps became an addiction. Surveys show that
Smartphone addiction is interfering with night‘s sleep effecting not only their social but also family life.
3. LIMITATIONS OF MOBILE APPLICATIONS
Mobile apps have become an extreme fantasy among
all generations but still have some limitations which need to be addressed. Each manufacturer of smart
phones tends to use a different operating system such as
Android, BlackBerry, Windows, Symbasis, iPhone, etc.
Developing web applications for smart phones has many constraints which a developer must overcome. Some of
the limitations are:
• Visible: the content or feature is accessible from
visual means. It may be nested in sub-sections or child pages, but the content is nonetheless ac-
cessed from visible navigational elements such as
buttons or links.
• Convention : by relying on mobile design con-
ventions you may hide content and only display it
when the user employ certain gestures such as
swipe or shake, or when the user drags content around such as pull-to-refresh.
• Variable Connectivity: Even in the era of fast cellular networks and ubiquitous Wi-Fi, coverage
is not universal or equally good. Phone users fre-quently complain about connectivity problems.
Every new page load translates into a significant
waiting time when the network does not coope-
rate.
• Display Resolution: Comparing to the laptops
resolution, mobile devices has less resolution
resulting in low quality images.
• No right-click: With the traditional computers
right click allows a user to open any page and
view simultaneously where as mobile devices do
not have a traditional right-click option.
• Fewer Contexts: The smaller screens on touch
devices results in reduced context that makes it more difficult for the user to get an overview of
the page.
4. PRESENT AND FUTURE OF MOBILE APPLICA-
TIONS
The research firm reiterates the various factors that
may be contributing to the growth, from advancements in network technologies to the lowering of mobile data
usage cost, growing adoption of smart phones around the
world, and a continuous increase in application usability. As more and more people turn to smart phones capable
of browsing the web, developers will have to come up
with better methods of cross-platform development to
allow applications to scale multiple platforms seamlessly. With the enhancement to 4G bandwidth and
connectivity issues will be less of a constraint when
developing applications. The IBM Tech Trends Survey [5], conducted on 2000 IT developers and specialists
across 87 countries and getting response. According to
the survey, 55% IT professional expect that, mobile software application development for devices such as
iPhone and Android, and even tablet PCs like iPad, will
surpass application development on all other traditional
computing platforms by 2015.
5. CONCLUSIONS
As we continue to move into the uncertainty of future, we
seem to gradually become more and more tech-savvy,
especially the younger generation. Every single day something new is happening somewhere, and thus the
dsramesh
Typewritten Text
69
Proceedings of the National Seminar on "Impact of Scientific Advances on Society", August 18-19, 2015, p.68-70
St. Pious X Degree & PG College for Women, Hyderabad-500076.
Sponsored by the Indian Institute of Geomagnetism, Navi Mumbai-410218 (DST, Govt. of India)
dynamic nature of technology continues to progress. There are several ways that we can control and minimize the
negative impacts of Mobile apps in society. In order to
understand the positive and negative impact of Mobile apps it is even more important to educate the users on how to use
them smartly. Proper guidance to the users and better
security access controls to the smartphones should be
provided to reap the fruits of the emerging technology.
SUGGESTED REFERENCES
1. Software Development Discussion Paper: An overview of
mobile development in the context of current technology.
2. Masi, E., G. Cantone, Mastrofini, M., Calavaro, G., and Subiaco, P., Proceedings of International Conference on
Mobile Computing, Applications, and Services., ser.
MobiCASE’4, 2012, p. 64–79.
3. http://www.computerworld.com.au/whitepaper/371126/
native-web-or-hybrid-mobile-app-development/download/
4. Mogg, T., 2012, http://www.digitaltrends.com/mobile/
smartphone-sales-exceed-those-of-pcs-for-firsttime-apple-
smashes-record/
5. IBM Survey, 2010, http://www.fiercemobilecontent.com/
press-releases/ibm-survey-itprofessionals-predict-mobile-
and-cloud-technologies-will-dominateenter
dsramesh
Typewritten Text
70
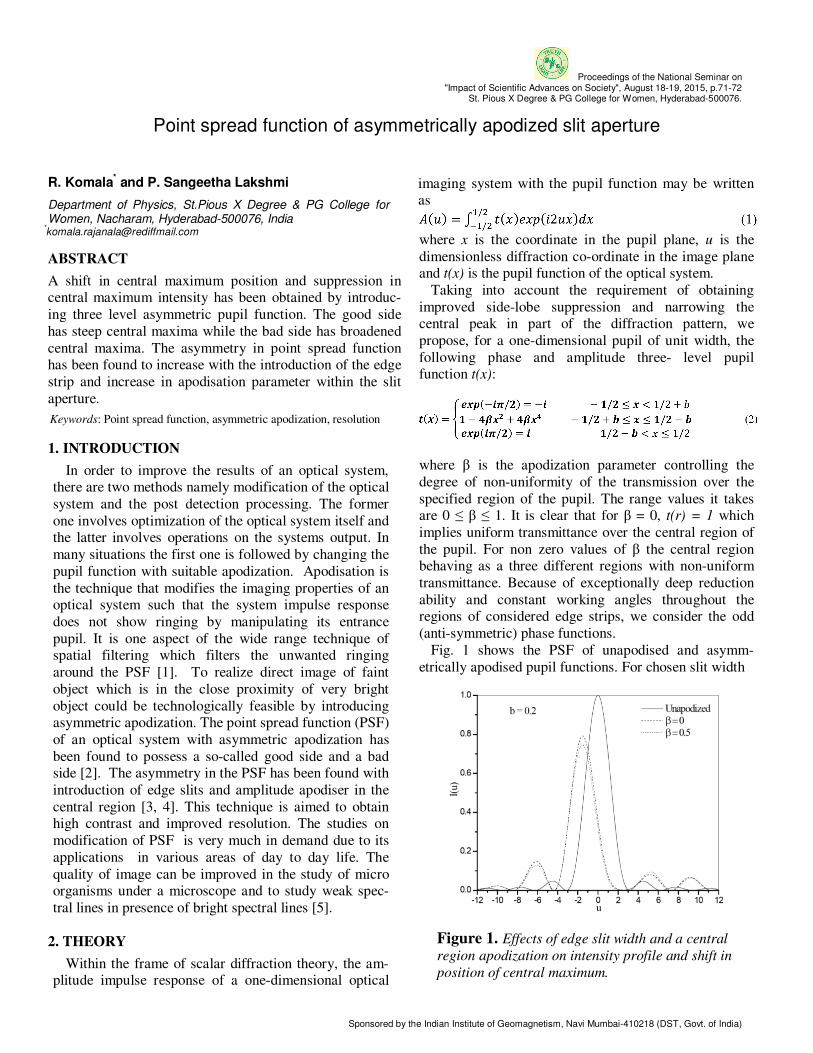
Proceedings of the National Seminar on "Impact of Scientific Advances on Society", August 18-19, 2015, p.71-72
St. Pious X Degree & PG College for Women, Hyderabad-500076.
Sponsored by the Indian Institute of Geomagnetism, Navi Mumbai-410218 (DST, Govt. of India)
Point spread function of asymmetrically apodized slit aperture
R. Komala* and P. Sangeetha Lakshmi
Department of Physics, St.Pious X Degree & PG College for Women, Nacharam, Hyderabad-500076, India
ABSTRACT
A shift in central maximum position and suppression in central maximum intensity has been obtained by introduc-
ing three level asymmetric pupil function. The good side
has steep central maxima while the bad side has broadened
central maxima. The asymmetry in point spread function has been found to increase with the introduction of the edge
strip and increase in apodisation parameter within the slit
aperture.
Keywords: Point spread function, asymmetric apodization, resolution
1. INTRODUCTION
In order to improve the results of an optical system, there are two methods namely modification of the optical
system and the post detection processing. The former
one involves optimization of the optical system itself and the latter involves operations on the systems output. In
many situations the first one is followed by changing the
pupil function with suitable apodization. Apodisation is
the technique that modifies the imaging properties of an optical system such that the system impulse response
does not show ringing by manipulating its entrance
pupil. It is one aspect of the wide range technique of spatial filtering which filters the unwanted ringing
around the PSF [1]. To realize direct image of faint
object which is in the close proximity of very bright
object could be technologically feasible by introducing asymmetric apodization. The point spread function (PSF)
of an optical system with asymmetric apodization has
been found to possess a so-called good side and a bad side [2]. The asymmetry in the PSF has been found with
introduction of edge slits and amplitude apodiser in the
central region [3, 4]. This technique is aimed to obtain high contrast and improved resolution. The studies on
modification of PSF is very much in demand due to its
applications in various areas of day to day life. The
quality of image can be improved in the study of micro organisms under a microscope and to study weak spec-
tral lines in presence of bright spectral lines [5].
2. THEORY
Within the frame of scalar diffraction theory, the am-plitude impulse response of a one-dimensional optical
imaging system with the pupil function may be written as
where x is the coordinate in the pupil plane, u is the
dimensionless diffraction co-ordinate in the image plane and t(x) is the pupil function of the optical system.
Taking into account the requirement of obtaining
improved side-lobe suppression and narrowing the central peak in part of the diffraction pattern, we
propose, for a one-dimensional pupil of unit width, the
following phase and amplitude three- level pupil function t(x):
where β is the apodization parameter controlling the
degree of non-uniformity of the transmission over the
specified region of the pupil. The range values it takes are 0 ≤ β ≤ 1. It is clear that for β = 0, t(r) = 1 which
implies uniform transmittance over the central region of
the pupil. For non zero values of β the central region behaving as a three different regions with non-uniform
transmittance. Because of exceptionally deep reduction
ability and constant working angles throughout the regions of considered edge strips, we consider the odd
(anti-symmetric) phase functions.
Fig. 1 shows the PSF of unapodised and asymm-
etrically apodised pupil functions. For chosen slit width
Figure 1. Effects of edge slit width and a central
region apodization on intensity profile and shift in
position of central maximum.
dsramesh
Typewritten Text
71
Proceedings of the National Seminar on "Impact of Scientific Advances on Society", August 18-19, 2015, p.71-72
St. Pious X Degree & PG College for Women, Hyderabad-500076.
Sponsored by the Indian Institute of Geomagnetism, Navi Mumbai-410218 (DST, Govt. of India)
b and for different values of apodization parameter β as a function of the normalized pupil co-ordinate from center
to end of the central region. The amplitude distribution
in the focal region may be written as
It means that the resultant complex amplitude
distribution in the focal region is the sum of the
diffraction fields �1(�) and �2(�) contributing by the
narrow edge slits with opposite transmittances -i and i
and the field �0(�) by the central region covered with an amplitude apodizer.
The intensity PSF I(u) which is the real measurable
quantity can be obtained by taking the squared modulus
of A(u). Thus,
3. RESULTS AND DISCUSSION
The results of investigations on the effects of asymmetric apodization on intensity distributions in the
image plane of an optical system have been obtained
from Eq. (4) as a function of diffraction coordinate u varying from -12 to +12 by employing a twelve-point
Gauss quadrature numerical method of integration.
Gaussian quadrature possesses most important desirable
properties such as positivity of the weights, rapid convergence, mathematical elegance, etc. It is extremely
efficient and accurate [6]. Hence, we have chosen this
method to evaluate integrals. An iterative method has been developed and applied to the position and intensity
of central maximum. The performance of the designed
pupil functions is described by the asymmetric point spread functions of a slit and depicted in Fig.1. In this
figure the unapodized or Airy PSF is represented by the
solid curve for easy comparison. The PSFs are graphically represented in Fig. 1 for b=0.2 when the
central region of the slit is apodized with β. It can be
seen from this figure that on the left half axis (bad side)
the central peak is broadened, shifted, while on the right half axis (good side) the central peak is narrower. It tells
us that the good side in which a steep central peak is
achieved at the cost of worsening its counterpart. However, the magnitude of these effects depends on b
value and the reduction in central peak intensity is
increasing with the degree of apodization. However, the shifting of central maximum provides high contrast only
in a narrow region on good side. This small dark zone is
particularly important in the case of resolution of two
line objects which are widely varying in their intensity and very close to each other. The results obtained in our
investigation are clearly demonstrating that the central
peak is narrowing on good side with the strip width for any given value of apodising parameter.
REFERENCES CITED
1. Mills, J.P., and Thompson, B.J., Coherent Optical Systems
SPIE Milestones series, 1996, 119, SPIE Optical Engineering Press, Ellingham.
2. Cheng, L., and Siu, C.G., Meas. Sci. Technol., 1991, v. 2,
p. 198.
3. Reddy, A.R.N, Komala, R., Goud, M.K., and Goud, S.L.,
AIP Conf. Proc., 2011, 1391, 341.
4. Komala, R., Reddy, A.R.N, Goud, M.K., and Goud, S.L.,
Acta Physica Polonica, A 2012, 2714. 5. Kowalczyk, M. Zapata-Rodriguez, C.J., and Martinez-
Corral, M., Appl. Opt., 1998, v, 37, p. 8206.
6. Mathews, J.H., and Fink, K.D., Numerical Methods Using
Matlab, 2004, Pearson Prentice Hall, New Jersey.
dsramesh
Typewritten Text
72
Proceedings of the National Seminar on "Impact of Scientific Advances on Society", August 18-19, 2015, p.73-74
St. Pious X Degree & PG College for Women, Hyderabad-500076.
Sponsored by the Indian Institute of Geomagnetism, Navi Mumbai-410218 (DST, Govt. of India)
Determination of sodium metal ions in various junk foods by flame photometry
Rani Padmini*
Department of Biochemistry, St. Pious X Degree & PG College for Women, Nacharam, Hyderabad-500076, Telangana, India
ABSTRACT
Sodium (from Latin Natrium) is an abundant element which
is soft silvery-white and highly reactive metal. Its atomic
number is 11. It exists in numerous minerals such as
feldspars, sodalite and rock salt. It is a member of alkali metals and its only stable isotope is
23Na. It was first
isolated 1807 by the electrolysis of sodium hydroxide.
Sodium is an essential element for all animals and some plants. In animals, sodium ions are used against potassium
ions to build up charges on cell membranes, allowing
transmission of nerve impulses when the charge is dissi-pated. It is therefore classified as dietary inorganic macro-
mineral. Sodium chloride is the principal source of sodium
in diet and is used as seasoning and preservation. Sodium
levels in various junk food is analyzed by flame photome-try. By using flame photometry (more accurately called
flame atomic emission spectroscopy) the species are
examined in the spectrometer in the form of atoms. The technique allows quantitative analysis of the analyte metal
in the sample solution, a total of 15 junk food samples were
analyzed by using flame photometry. Therefore various
junk food samples analyzed are categorized into three as food containing high level, medium level, and low levels of
sodium.
Keywords: Sodium, sodium ions, sodium chloride, flame photometry, junk food, hypertension, hypernatremia, cardiac problem
1. INTRODUCTION
Sodium is an essential element for human and animal
lives and for some plant species. Its melting and boiling points are 97.8
◦ and 883
◦C, respectively. Sodium shows
exothermic reactions with water. Sodium or its com-
pound when exposed into flame imparts yellow color.
Most important sodium compounds are common salt (NaCl ), baking soda (NaHCO3), caustic soda (NaOH),
Borax (Na2B4O7.10H2O) etc.
Sodium chloride is the principal source of sodium in diet, the daily recommended levels of sodium is 2.3
gm/day. A normal serum sodium level is 135-
145mEq/Liter (mEq/L). In human and animals, sodium ions are necessary for
regulation of blood and body fluids, transmission of
nerve impulses, certain metabolic functions, heartbeat
regulation, important ion in extracellular compartment. It
helps in maintaining optimum level of salt and water
balance in the body, thereby preventing the body from
attaining the condition called as hypernatremia. An excess of body water caused by drinking will result in
too low sodium level in blood causing hyponatremia.
Sodium is important in brain and nerve function to
maintain osmotic balance by Na+/K
+ ATPase pump. It
also plays a major role in generating muscle contractions
by creating electrical potential gradient. Cells rely on
sodium to cause signal transduction [1]. In C4 plants, it aids in metabolism, in regeneration of (PEP) Phosphoe-
nol pyruvate and chlorophyll synthesis. It acts as a
substitute for potassium for maintaining turgor pressure [2].
Some of the sodium containing compounds like so-
dium pyrophosphate, trisodium citrates, are used as
emulsifying agent, buffering agents. Sodium plays, several roles [3] in specific food types
(Table 1).
Table 1. Role of sodium
In ready to eat
cereals
To improve flavor and
texture
Baked goods like
bread, beverages
Fermentation , reduces the
stickiness of dough
Pickles, jams Improves shelf life and
helps to control growth of
molds
Meat Flavor and preservation,
help increase water binding
Milk , fruits,
vegetables
Source of nutrient
2. MATERIALS AND METHODS
A total of 15 junk foods are analyzed for the levels of
sodium by using flame photometry. The technique uses a flame that evaporates the solvent and also sublimates and
atomizes the metal and then excites a valence electron to
an upper energy state. Light is emitted at characteristic wavelength for each metal as the electron returns to the
ground state that makes qualitative determination possi-
ble. Flame photometer use optical filters to monitor for the selected emission wavelength produced by the
analyte species.
2.1 Preparation of standard solution
Stock: Weigh accurately 254mg of “Anal R” quality of NaCl into a 100ml volumetric flask through funnel. Add
dsramesh
Typewritten Text
73
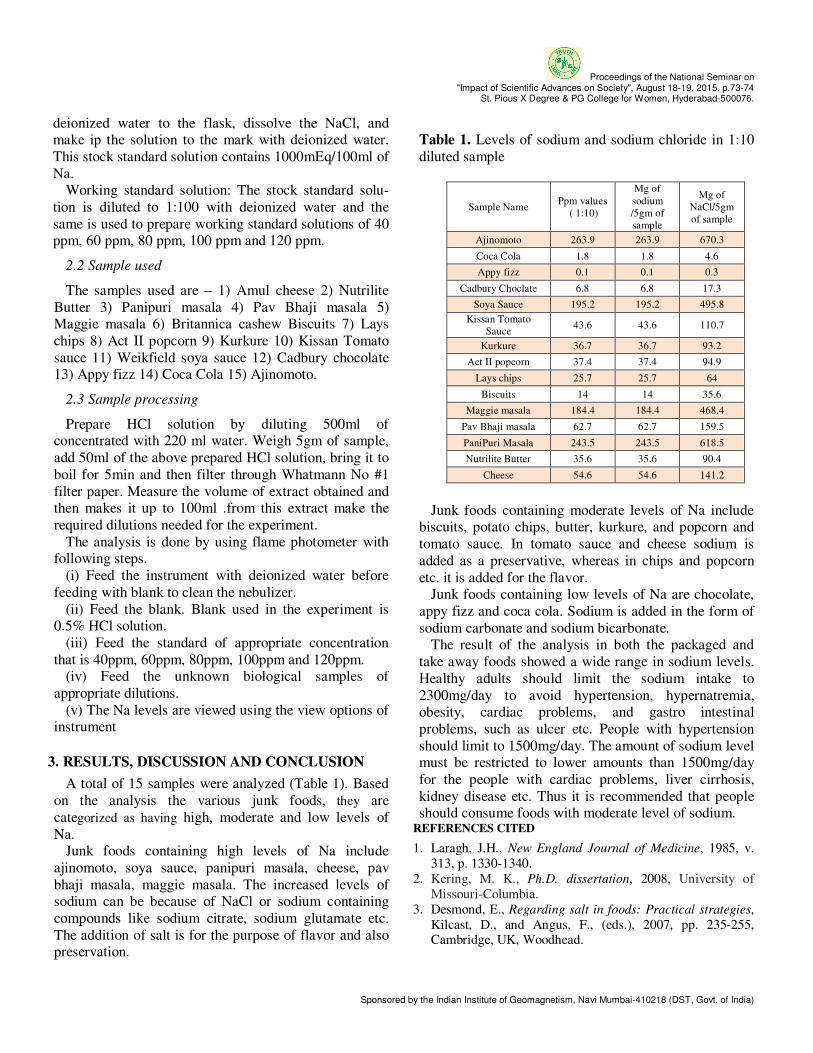
Proceedings of the National Seminar on "Impact of Scientific Advances on Society", August 18-19, 2015, p.73-74
St. Pious X Degree & PG College for Women, Hyderabad-500076.
Sponsored by the Indian Institute of Geomagnetism, Navi Mumbai-410218 (DST, Govt. of India)
deionized water to the flask, dissolve the NaCl, and make ip the solution to the mark with deionized water.
This stock standard solution contains 1000mEq/100ml of
Na. Working standard solution: The stock standard solu-
tion is diluted to 1:100 with deionized water and the
same is used to prepare working standard solutions of 40 ppm, 60 ppm, 80 ppm, 100 ppm and 120 ppm.
2.2 Sample used
The samples used are – 1) Amul cheese 2) Nutrilite
Butter 3) Panipuri masala 4) Pav Bhaji masala 5) Maggie masala 6) Britannica cashew Biscuits 7) Lays
chips 8) Act II popcorn 9) Kurkure 10) Kissan Tomato
sauce 11) Weikfield soya sauce 12) Cadbury chocolate 13) Appy fizz 14) Coca Cola 15) Ajinomoto.
2.3 Sample processing
Prepare HCl solution by diluting 500ml of concentrated with 220 ml water. Weigh 5gm of sample,
add 50ml of the above prepared HCl solution, bring it to
boil for 5min and then filter through Whatmann No #1
filter paper. Measure the volume of extract obtained and then makes it up to 100ml .from this extract make the
required dilutions needed for the experiment.
The analysis is done by using flame photometer with following steps.
(i) Feed the instrument with deionized water before
feeding with blank to clean the nebulizer.
(ii) Feed the blank. Blank used in the experiment is 0.5% HCl solution.
(iii) Feed the standard of appropriate concentration
that is 40ppm, 60ppm, 80ppm, 100ppm and 120ppm. (iv) Feed the unknown biological samples of
appropriate dilutions.
(v) The Na levels are viewed using the view options of instrument
3. RESULTS, DISCUSSION AND CONCLUSION
A total of 15 samples were analyzed (Table 1). Based
on the analysis the various junk foods, they are
categorized as having high, moderate and low levels of
Na. Junk foods containing high levels of Na include
ajinomoto, soya sauce, panipuri masala, cheese, pav
bhaji masala, maggie masala. The increased levels of sodium can be because of NaCl or sodium containing
compounds like sodium citrate, sodium glutamate etc.
The addition of salt is for the purpose of flavor and also preservation.
Table 1. Levels of sodium and sodium chloride in 1:10
diluted sample
Sample Name Ppm values
( 1:10)
Mg of
sodium
/5gm of
sample
Mg of
NaCl/5gm
of sample
Ajinomoto 263.9 263.9 670.3
Coca Cola 1.8 1.8 4.6
Appy fizz 0.1 0.1 0.3
Cadbury Choclate 6.8 6.8 17.3
Soya Sauce 195.2 195.2 495.8
Kissan Tomato
Sauce 43.6 43.6 110.7
Kurkure 36.7 36.7 93.2
Act II popcorn 37.4 37.4 94.9
Lays chips 25.7 25.7 64
Biscuits 14 14 35.6
Maggie masala 184.4 184.4 468.4
Pav Bhaji masala 62.7 62.7 159.5
PaniPuri Masala 243.5 243.5 618.5
Nutrilite Butter 35.6 35.6 90.4
Cheese 54.6 54.6 141.2
Junk foods containing moderate levels of Na include
biscuits, potato chips, butter, kurkure, and popcorn and
tomato sauce. In tomato sauce and cheese sodium is
added as a preservative, whereas in chips and popcorn
etc. it is added for the flavor. Junk foods containing low levels of Na are chocolate,
appy fizz and coca cola. Sodium is added in the form of
sodium carbonate and sodium bicarbonate. The result of the analysis in both the packaged and
take away foods showed a wide range in sodium levels.
Healthy adults should limit the sodium intake to
2300mg/day to avoid hypertension, hypernatremia, obesity, cardiac problems, and gastro intestinal
problems, such as ulcer etc. People with hypertension
should limit to 1500mg/day. The amount of sodium level must be restricted to lower amounts than 1500mg/day
for the people with cardiac problems, liver cirrhosis,
kidney disease etc. Thus it is recommended that people should consume foods with moderate level of sodium.
REFERENCES CITED
1. Laragh, J.H., New England Journal of Medicine, 1985, v.
313, p. 1330-1340.
2. Kering, M. K., Ph.D. dissertation, 2008, University of
Missouri-Columbia.
3. Desmond, E., Regarding salt in foods: Practical strategies,
Kilcast, D., and Angus, F., (eds.), 2007, pp. 235-255, Cambridge, UK, Woodhead.
dsramesh
Typewritten Text
74
Proceedings of the National Seminar on "Impact of Scientific Advances on Society", August 18-19, 2015, p.75-77
St. Pious X Degree & PG College for Women, Hyderabad-500076.
Sponsored by the Indian Institute of Geomagnetism, Navi Mumbai-410218 (DST, Govt. of India)
Delusional disorder: an altered perception
Sikta Bandopadhyay*
Department of Zoology, St. Pious X Degree & PG College for Women, Nacharam,, Hyderabad-500076, Telangana, India *[email protected]
ABSTRACT
Delusional disorder, the contemporary conceptualization of
paranoia, is an uncommon condition characterized by the presence of one or more nonbizarre delusions and the
relative absence of associated psychopathology. Delusion
has attracted enormous attention because it occurs in a large number of psychiatric as well as medical conditions. No
systematic research on paranoia took place for more than
half a century and modern investigations on delusional disorder were not done earlier. Hereditary factors and
association with inherited personality factors may play a
part, in the psychological maldevelopment. However, there
is an urgent need for the study of extended case series utilizing modern neurophysiological and neuropsychologi-
cal investigative methods. Here, in this article, the etiology
and clinical features are briefly discussed.
Keywords: Delusional disorder, etiology, dopamine, D2receptor, gene, pHVA
1. INTRODUCTION
Delusional disorder is a psychiatric disorder in which
the central feature is the presence of delusions in the absence of other symptomatology. Since the beginning
of psychiatry, delusional disorder has been at the center
of attention and continuing to engender controversy till today. Delusions have been regarded as the hallmark of
insanity in Western cultures, long before psychiatry
became a branch of medicine [1]. In contemporary classification system of mental disorders, such as Diag-
nostic and statistical manual, 4th edition (DSM-IV) and
International Classification of Diseases, 10th edition
(ICD-10), delusions are considered as cornerstone symptoms for the diagnosis of psychotic disorders.
Delusional formation is a fascinating and enigmatic
psychic process, which has been the object of numerous scientific debates and theoretical models, but of surpri-
singly few empirical studies [1, 2]. Delusions has been
defined as a false belief that is firmly maintained in spite of incontrovertible and obvious proof or evidence, in
spite of the fact that other members of the culture do not
share the belief. Systematic study of the phenomenology
of delusions, however, is a relatively recent enterprise and many fundamental questions remain unanswered.
2. HISTORICAL OVERVIEW OF DELUSIONAL
DISORDER
Historically, the concept of delusional disorder is de-rived from the classic Greek concept of paranoia. The
term paranoia, from which the modern adjective parano-
id is derived, has a long and chequered history. It has probably given rise to more controversy and confusion
of thought than any other term used in psychiatry. The
word paranoia was derived from the Greek Para (beside) nous (mind). It was used in ancient Greek literature to
mean “out of mind”, i.e., of unsound mind or insane.
Kahlbaum [3] used the name paranoia and first applied
the term to a chronic delusional disorder. Kraepelin [4] also recognized a condition that he called paranoia,
characterized by a persistent delusional system in the
absence of hallucinations and personality deterioration.
3. EPIDEMEOLOGY
Delusional disorder, an uncommon, probably hetero-
geneous group of illness, has a prevalence of 0.03 % and
incidence 1-3 new cases/1,00,000 population. Epidemio-
logical data suggests that delusional disorder is a sepa-rate condition or is an atypical form of schizophrenia and
mood disorders [5]. It is far less prevalent than schizoph-
renia and mood disorders. The age of onset is later than in schizophrenia although men tend to experience the
illness at earlier ages than women [6]. The observed sex
ratio is different from that of mood disorder, which
occurs disproportionately among women.
4. THE CONCEPT OF FORM AND CONTENT
Delusion, as “the basic characteristic of madness” [7],
has appropriately attracted an enormous amount of
theoretical interest but remarkably little is known with any certainty. Arthur [8] in his classic review concluded:
“delusion can still claim to be the most outstanding and
baffling behaviour symptom of mental illness” [7], has
appropriately attracted an enormous amount of theoreti-cal interest but remarkably little is known with any
certainty. The problem of delusion is one of the basic
problems of psychopathology and has impaired an impressive diversity of theoretical speculation. Accord-
ing to the Diagnostic and Statistical Manual of Mental
Disorders Text Revisions (DSM-IV-TR), published in 1994, it defines the core psychopathological features of
delusional disorder as persistent, nonbizarre delusions
not explained by other psychotic disorders. The delu-
dsramesh
Typewritten Text
75

Proceedings of the National Seminar on "Impact of Scientific Advances on Society", August 18-19, 2015, p.75-77
St. Pious X Degree & PG College for Women, Hyderabad-500076.
Sponsored by the Indian Institute of Geomagnetism, Navi Mumbai-410218 (DST, Govt. of India)
sions are unusual yet they refer to different aspects of life that might occur, such as being conspired against,
cheated on, physically ill, in love, jealous and so forth.
Delusions are categorized according to their content. The degree of hostility and suspiciousness may be such that
violent or aggressive behaviour results. Litigious beha-
viour is common among such patients. However, some patients, notably those with somatic delusions, may not
display hostility, anger, or even suspiciousness to any
considerable degree.
5. CLINICAL FEATURES AND CLASSIFICATION
OF THE DISEASE
Principal features include,
a) Non-bizzare delusions of at least 1 month’s dura-
tion. b) Criterion A for Schizophrenia has never been
met, although tactile and olfactory hallucinations
may be acceptable if they are related to the delu-
sional theme. c) Apart from the impact of the delusion(s) or its
consequences, functioning is not markedly im-
paired and behaviour is not obviously odd or bi-zarre.
d) Concurrent mood episodes, if present, are belief
relative to the duration of the delusional disord-er.
e) The disturbances are not the direct outcome of a
drug or medication or of a medical disorder.
Subtypes are Erotomanic, Grandiose, Jealous, Perse-
cutory, Somatic, Mixed and Unspecified or other.
Delusions are sufficiently idiosyncratic that sharp
distinctions and inclusive classifications have remained
elusive. Nash listed 44 varieties of delusions and admit-ted that the list is not yet complete. Vast differences can
be seen in the content of any single variety of delusions.
The current classificatory systems bypass the etiological
discussion by implementing pure symptomatological criteria closely to the Kraepelinian category of paranoia
[9]. A general scheme of descriptions of delusions has
been suggested by many are shown in Table 1.
6. FAMILIAL PATTERN OF DELUSIONAL DIS-
ORDER
Family studies that have begun to appear in the
literature indicate the possible specific family transmis-
sion of delusional disorder. It has been reported that
delusional disorder is more likely to be associated with a family history of such traits as suspiciousness, jealousy,
Table 1. Showing nine of the most common and
dramatically distinct types of delusion
-----------------------------------------------------------------
1. Delusion of Persecution Delusions of Reference
Delusions of Loss of Property
Delusions of Poison or infection
Delusions of Influence
Delusions of Innosence
2. Nihilistic Delusions 3. Delusions of ill health Hypochondriasis
Monosymptomatic hypochondriasis
Somatic Delusions
4. Delusions of Grandeur 5. Delusions of Poverty 6. Delusions of Love 7. Delusions of Jealousy 8. Delusions of Possession 9. Delusions of Reduplication
-------------------------------------------------------------------------------
secretiveness and the presence of paranoid behaviour or
delusions [10]. Some studies have found that delusional
disorder is more common among relatives of individuals with schizophrenia than others [10, 11].
7. ETIOLOGICAL MODELS OF DELUSIONAL DIS-
ORDER
The knowledge of etiology of delusional disorder is scanty and highly speculative, as little modern research
has been conducted. A general outline of the etiological
factors is described as below.
7.1 Genetic basis of delusional disorder
Human genetics research has generated enormous
amount of data about the genetic differences among individuals and groups. Investigation of these
differences has transformed our understanding of the
origins and nature of human diseases [12-14].
The discovery of Dopamine receptor genes associations with delusional disorder implies that at least
part of their genetic basis lies in the Dopaminergic
receptor system [15]. D2S allele was found to be
dsramesh
Typewritten Text
76
Proceedings of the National Seminar on "Impact of Scientific Advances on Society", August 18-19, 2015, p.75-77
St. Pious X Degree & PG College for Women, Hyderabad-500076.
Sponsored by the Indian Institute of Geomagnetism, Navi Mumbai-410218 (DST, Govt. of India)
strongly associated with the disease along with the TH1 allele with a moderately strong association. It may be
conceived that the polymorphism of the DR and/or TH
gene could be the part of the genetic basis underlying the hyperdopaminergic state and delusional etiology of the
disease [16], Serretti et. al. [17] demonstrated a
significant association between the Ser311Cys variant and delusional features in major psychoses in Italian
patients.
Few studies have also been implicated the possible
involvement of HLA association with delusional symptomatology in major psychosis The first HLA
association study was reported in delusional disorder
[18]. Since then several studies from our laboratory have implicated that involvement of gene polymorphisms of
HLA system in the etiopathology of delusional disorder.
Debnath et al. [19] demonstrated a significant association between the HLA-A*03 allele and delusional
disorder in Indian patients.
7.2 Organic brain factors
Gorman and Cummings [20] have proposed that
delusional illnesses of organic origin have underlying
features in common, particularly temporal lobe or limbic involvement and an excess of dopamine activity in
certain areas of the brain. It is very possible that organic
brain factors are much more common than we suspect in
delusional disorder, especially in younger males who have previously abused alcohol or drugs or have suffered
a head injury in the past, and in older patients (more
commonly female) who suffer from effects of an aging brain [21].
7.3 Biochemical evidence
High level of pHVA was found in the delusional
disorder patients when compared with the healthy controls suggesting the dopamine hypothesis of the
disease [16, 22].
8. CONCLUSION
Delusions are a key clinical manifestation of psychosis
and have particular significance for the diagnosis of delusional disorder. Although common in several psychia-
tric conditions, they also occur in a diverse range of other
disorders ( including brain injury, intoxication, somatic
illness). Delusional disorder is significant precisely because altered perception, often making them resistant to change.
Taking these genetic and biochemical approaches will
enhance our understanding of the psychotic symptoms manifested by the disease and may move us closer to the
consilience between the biology and phenomenology of
delusions.
REFERENCES CITED
1. Berrios, G.E., Brit. J..Psychiatry, 1991, v. 159 (suppl 14),
p. 6-13.
2. Butler, R.W., and Braff,, D.L., Schizophr. Bull.,1991, v.
17, p. 633-647.
3. Kahlbaum, K.L., Psychiatrische Wochenschrift, 1863, v.
14, p.125-128.
4. Kraepelin, E., 1989, Livingstone Publisher, Edinbburg.
5. Kendler, K.S., and Hays, P., Arch. Gen. Psychiatry, 1980,
v. 38, p. 547-551. 6. Hsiao, M.C., Liu, C.Y., Yang Y.Y., and Yeh, E.K., Psy.
Cin. Neurosci., 1999, v. 53(6), p. 673-.676.
7. Jasper, K., General Psychopathology, 1963, 7th ed.,
Manchester University Press, pp. 65-72.
8. Arthur, A.Z., Am. J. Psy., 1964, v. 121, p. 105-115.
9. Gabriel, E., Psychopathology, 1987, v. 20, p. 87-91.
10. Winokur, G., Psychopathology, 1986, v. 19(1-2), p. 30-34.
11. Watt, J.A.G., Am. J. Psy., 1985, v. 142, p. 1456-1458.
12. Cavalli- Sforza, L.L., and Bodmer, W.F., The Genetics of
Human Populations, 1971, pp. 559-561, Freeman & Co,
San Fransisco. 13. Bamshad, R.M., Mastan, N., Raviprasad, B.V., Reddy,
G.P., and Ricker C.E.,Genome Res. J., 2001, v. 11, p. 994-
1004.
14. Collins, A., Lonjou, C., and Morton, N.E, Genetics, 2003,
v. 165, p. 2213-2233.
15. Bandopadhyay, S., Singh, B., Bera, N.K., Das, S.K.,
Nayak, C.R., and Chaudhuri, T.K., NBU J. Anim. Sci.,
2008, v. 2(1):, p. 90-94.
16. Chaudhuri, T.K., and Banerjee, S., Dopaminergic System
in the Etiopathology of Delusional Disorder: Delusional
Disorder and Dopamine Receptor, 2012, LAMBERT
Academic Publishing (U.K.). 17. Serretti, A., Lilli, R., Lorenzani, C., Lattuada, E., and
Smeraldi, E., Am. J. Med. Genet,, 2000, v. 105, p. 283-290.
18. Chaudhri, T.K., and Das,S.K.,ASIETTA, 1997, Sydney.
19. Debnath, M., Das, S.K, Bera, N.K, Nayak, C.R., and
Chaudhuri, T.K., Ind. J. Psychiatry, 2000, v. 42(3), p. 275-
279.
20. Gorman, D.G., and Cummings, J.L., Seminars in
Neurology, 1990, v. 10, p. 229-238.
21. Munro, A. Can. J. Psychiatry, 1988, v. 33, p. 171-174.
22. Bandopadhyay, S., Singh, B., Bera, N.K., Das, S.K.,
Nayak, C.R., and Chaudhuri, T. K., Int. J. Chem. Sci., 2009, v. 7(3), p. 1583-1590.
dsramesh
Typewritten Text
77
Proceedings of the National Seminar on "Impact of Scientific Advances on Society", August 18-19, 2015, p.78-79
St. Pious X Degree & PG College for Women, Hyderabad-500076.
Sponsored by the Indian Institute of Geomagnetism, Navi Mumbai-410218 (DST, Govt. of India)
Utility of viral load in antiretroviral therapy
Sri Laxmi Kandula
Department of Biochemistry, St. Pious X degree & PG College for Women, Nacharam, Hyderabad-500076, Telangana, India *[email protected]
ABSTRACT
Globalization affects all facets of human life , including
health and well being. The HIV/AIDS epidemic has
highlighted the global nature of human health. Globaliza-tion has given rise to a trend towards finding common
solution to health challenges. Molecular techniques that
quantify and detect circulating HIV RNA have led to a new understanding of the pathogenesis of HIV disease and a
new surrogate marker for use in clinical management.
Keywords: Viral load, p24 antigen, CD-4 T-Cell
1. INTRODUCTION
Prior to the ability to quantify virion associated HIV-
RNA in the circulation, measurement of disease was by quantitative viral culture, by p24 antigen levels or
indirectly by CD4 T-cell enumeration. However , since
most patients have no detectable virus or p24 antigen in
the plasma during the period of latency following primary infection when their CD4 T-cell count was
essentially normal, the virus was thought to be “silent”
during this period. High levels of detectable virus by culture or p24 antigen were known to coincide with the
fall in CD4 T-cell count to levels below 200/mm3 and
the onset of AIDS-associated symptoms. This perspec-
tive changed when the p 24 antigen method was mod-ified to break apart the antibody- antigen complexes by
acid hydrolysis. This method, referred to as immune-
complex dissociated p24 antigen method(ICD-P24) demonstrated that viral p24 antigen was indeed present
at various levels during the period of clinical latency,
reflecting active viral replication. There are now three commercially available assays that quantify HIV-RNA
load in plasma and that detect some level of HIV-RNA
in essentially all infected individuals: bDNA( branched
DNA), RT-PCR( reverse transcription polymerase chain reaction) and NASBA (nucleic acid sequenced based
amplification). While CD4 T-cell count measurements
have great biologic variability, viral load measurements remain remarkably stable in clinically asymptomatic
patients as long as antiretroviral therapy is not changed.
2. VIRAL LOAD TEST
This test measures the amount of HIV in the blood. Generally it is used to monitor treatment progress or
detect early HIV infection. Results of this test are
reported as the number of HIV copies per milliliter of blood. The goal of HIV therapy is to suppress HIV
replication to the point where the amount of active HIV
is below the sensitivity of the HIV viral load test being
used.HIV RNA levels in the plasma usually correlate with the stage of disease, making them a good predictor
of disease progression. Viral load tests are also sensitive
tool for examining the effect of anti-HIV therapies. The combined use of CD4+ counts and viral load testing will
provide a more complete picture of a person’s risk of
disease progression and response to therapy. CD4+ cell counts indicate the status of an individual’s immune
system, where as viral load tests indicate the activity of
the virus.
3. PROCEDURE
HIV RNA in plasma can be quantitated by nucleic acid amplification technologies, such as the Polymerase
Chain Reaction (PCR). The COBAS AMPLICOR uses
PCR technology to achieve maximum sensitivity and
dynamic range for the quantitative detection of HIV-1 RNA in EDTA anti-coagulated plasma. It is an in-vitro
diagnostic nucleic acid amplification test for the
quantitation of HIV-1 RNA in human plasma. The test can be used to assess patient prognosis by measuring the
baseline HIV-1RNA level or to monitor the effects of
anti retroviral therapy by measuring changes in plasma HIV-1 RNA levels during the course of antiretroviral
treatment. The test is based on five major processes:
a) Specimen preparation to isolate HIV-1 RNA
b) Reverse transcription of the target RNA to generate complementary DNA (cDNA).
c) PCR amplification of target cDNA using HIV-1
specific complementary primers d) Hybridization of amplified products to
oligonucleotides detection probes specific to the target.
e) Detection of the probe bound amplified products by colorimetric determination.
4. ANTIRETROVIRAL THERAPY
Antiretroviral therapy (ART, Fig. 1) for treatment of
HIV-1 infection has significant prevention benefits,
reducing the risk of secondary HIV-1 transmission by over 90% [1, 2]. Mathematical models suggest that
providing ART to all HIV-1 infected persons and
achieving sustained viral suppression could substantially reduce population-level HIV-1 incidence [3, 4]. Earlier
treatment is now recommended in many settings as a
dsramesh
Typewritten Text
78

Proceedings of the National Seminar on "Impact of Scientific Advances on Society", August 18-19, 2015, p.78-79
St. Pious X Degree & PG College for Women, Hyderabad-500076.
Sponsored by the Indian Institute of Geomagnetism, Navi Mumbai-410218 (DST, Govt. of India)
Figure 1. Algorithm for ART.
result of mounting evidence for treatment and prevention benefits of ART initiation early in the course of HIV-1
infection [5, 6]. Plasma viral load is the primary
predictor of HIV-1 transmission and could be
incorporated into ART initiation guidelines to target individuals with an increased risk of transmission.
Guidelines for initiation of ART for HIV-1 infected
persons have generally been based on CD4 T cell count and symptoms of advanced HIV-1 disease. Current
WHO guidelines recommend ART initiation for WHO
clinical stage 3 and 4 infections and at CD4 counts ≤350 cells/µL regardless of stage.
5. CONCLUSION
Inclusion of viral load in ART initiation guidelines could
permit targeting ART resources to HIV-1 infected persons
who have a higher risk of transmitting HIV-1.
REFERENCES CITED
1. Cohen, M.S., Chen, Y.Q., McCauley, M., Gamble, T., and
Hosseinipour, M.C., N. Engl. J. Med. , 2011.
2. Donnell, D., Baeten, J.M., Kiarie, J., Thomas, K.K., and
Stevens, W., Lancet, 2010, v. 375, p. 2092–2098.
3. Granich, R.M., Gilks, C.F., Dye, C., De Cock, K.M., and
Williams, B.G., Lancet, 2009, v. 373, p. 48–57.
4. Dodd, P.J., Garnett, G.P., and Hallett, T.B., AIDS, 2010, v.
24, p.729–735.
5. Thompson, M.A., Aberg, J.A., Hoy, J.F., Telenti, A.,
Benson, C., et al., JAMA, v. 308, p. 387–402.
6. European AIDS Clinical Society Guidelines, 2011, Version 6.
dsramesh
Typewritten Text
79
Proceedings of the National Seminar on "Impact of Scientific Advances on Society", August 18-19, 2015, p.80-82
St. Pious X Degree & PG College for Women, Hyderabad-500076.
Sponsored by the Indian Institute of Geomagnetism, Navi Mumbai-410218 (DST, Govt. of India)
Positive impact of PSB biofertilisers in agriculture
S. Sreedevi*
Department of Microbiology, St. Pious X Degree & PG College for Women, Nacharam, Hyderabad-500076,Telangana, India
ABSTRACT
Converting soil insoluble phosphates (both organic and inorganic) to a form available for plants is a necessary goal to achieve sustainable agricultural production. Phosphate solubilizing Bacteria (PSB) are an important means in achieving this goal for improved plant growth and yield. PSB are a group of beneficial bacteria capable of hydrolyz-ing organic and inorganic phosphorus from insoluble compounds. Use of PSB as inoculants increases P uptake by plants and thus play a role in plant phosphorus nutrition by enhancing its availability to plants. The role of PSB as biofertilisers in agriculture is discussed in detail in the current review. This review is focused on various aspects of PSB, their occurrence, mechanism of action, role in phosphorus nutrition, and their efficacy in promoting plant growth.
Keywords: Sustainable agriculture, biofertilisers, PSB, phosphate solubilisation
The development of science and technology is the result of greatest creative abilities and activities of humankind. Science has originated, evolved and ad-vanced because of curiosity in human beings to explore, to know, and to understand the nature and the world around. There has been a continuous learning process in society leading to acquisition of tremendous knowledge from which applications have grown. Mostly, scientific advancements and accomplishments were related largely to felt needs, although, a few were motivated by a desire to know and understand nature. It was essential to ensure that the applications were based on ethical and moral values and principles, benefitting the human society as a whole. The impact of science on society was visible in every part of our living: in agriculture, medicine and health care, telecommunications, transportation, compu-terization and so on. One aspect of science, which has always been of great interest to individual scientists, and more recently to the scientific community as a whole, is MICROBES IN AGRICULTURE.
Today food production globally is adequate for the present population. However, in future, there will be even more people to feed. There is no more significant arable/ cultivable land available. There is often the felt need to develop the science and technology to improve
agriculture and thus increase the crop yield. Biotechnol-ogy holds the promise of higher yields and disease free crops. But genetic engineering arouses fears because one moves across species boundaries, causing much more difficult and uncertain risks, compared to physical engineering systems. Therefore, it is important to conti-nuously monitor the progress and ensure there is no place for complacency. The applications of scientific progress have to benefit humanity keeping in harmony with nature.
A considerable number of bacterial species are consi-dered to be beneficial to higher plants. Science and technological advancement has played a big role in changing the face of agriculture. It has provided enorm-ous capabilities to use existing microbes or to create new microbes and their microbial products to be applied in agriculture. They can be used as biofertilizers or control agents (biopesticides) for agriculture improvement [1]. Application of these microbes as inoculants enhances an abundant population of active and effective microorgan-isms in the rhizosphere region which in turn increases plant ability to uptake more nutrients. This resulted in increased production and abundant food supply as well as production of high quality products.
Biofertilizers are microbial inoculants of bacteria, algae, and fungi alone, or in combination, and they augment the availability of nutrients to the plants. These products enhance soil fertility by fixing atmospheric nitrogen and by mineralization of P & K. The global biofertilizers market, by type, is dominated by the nitrogen-fixing segment as nitrogen is the most essential nutrient for plants. The various microorganisms used as nitrogen-supplying biofertilizers are rhizobium, actinor-hizae, azotobactor, and azospirillum. They are used for leguminous as well as non-leguminous crops. These products are used to grow other crops as well, especially rice and sugarcane.
Phosphate-solubilizing bacteria (PSB) are another widely used type of biofertilisers. Phosphate solubilising microorganisms play an important role in supplementing phosphorus to the plants and thus enhance plant growth and crop yield. Phosphorus (P) is an important plant nutrient, essential for plant development and growth making up about 0.2 % of plant dry weight. Phosphorous is associated with many vital functions and is responsible for several physiological and biochemical plant activi-
ties such as Utilization of sugar and starch, Photosynthe-sis and transporting of genetic traits. It promotes early root formation, plant growth and it improves the quality
dsramesh
Typewritten Text
80
Proceedings of the National Seminar on "Impact of Scientific Advances on Society", August 18-19, 2015, p.80-82
St. Pious X Degree & PG College for Women, Hyderabad-500076.
Sponsored by the Indian Institute of Geomagnetism, Navi Mumbai-410218 (DST, Govt. of India)
of fruits, vegetables and grains and is vital to seed formation [2].
A majority of agricultural soils contain large reserves of phosphorus. Organic phosphorus compounds such as Inositol phosphate (soil phytate), phosphomonoesters, phosphodiesters including phospholipids and nucleic acids constitute a large proportion of the total phospho-rus in many soils. However, plants can only utilize P in soluble inorganic form. Also, a large portion of the soluble inorganic phosphate is accumulated as a conse-quence of regular applications of P fertilizers, but is rendered insoluble [3, 4]. Phosphate anions are extreme-ly reactive and may be precipitated with highly reactive Al3+ and Fe3+ in acidic, and with Ca2+ in calcareous or normal soils [5, 6]. In these forms, P is highly insoluble and unavailable to plants. Thus, a greater part of soil phosphorus, approximately 95–99% is present in the form of insoluble phosphates and hence cannot be utilized by the plants [7].
Soil Microorganisms are capable of transforming soil P to the forms available to plant. They enhance the P availability to plants by mineralizing organic P in soil and by solubilising precipitated phosphates [8-12]. This group of beneficial bacteria capable of hydrolyzing organic and inorganic phosphorus from insoluble com-pounds and converting to the soluble form are called as Phosphate solubilizing Bacteria (PSB). Some of the PSB are Bacillus brevis, Bacillus licheniformis, Pseudomonas
cepacia, Serratia marcescens, Xanthomonas spp., Flavobacterium spp. etc. [13, 14].
Diverse groups of organisms in soil employ variety of solubilization reactions to release soluble phosphorus from insoluble phosphates [15-17]. Thus the principal mechanism of mineral phosphate solubilization is the production of organic acids and acid phosphatases which play a major role in the mineralization of phosphorous in the soil [18-22]. Organic acids most frequently Gluconic acid and 2-ketogluconic acid synthesized by the microorganisms are associated with phosphate solubilizing ability [23-25]. Other organic acids such as glycolic, oxalic, malonic and succinic acid have also been identified among phosphate solubilizers. Chelating substances and inorganic acids such as sulphuric, nitric and carbonic acid are considered as other mechanisms for phosphate solubilization. However the effectiveness and their contribution to P release in soils seems to be less than organic acid production. PSB have been re-ported to have the ability to solubilize insoluble inorgan-ic phosphate compounds, such as tricalcium phosphate, dicalcium phosphate, hydroxyapatite and rock phosphate [26].
The PSB are ubiquitous with variation in forms and population in different soils. Population of PSB depends on different soil properties (physical and chemical properties, organic matter, and P content) and cultural activities [27].Larger populations of PSB are found in agricultural and rangeland soils [28]. High proportion of PSB is concentrated in the rhizosphere, and they are metabolically more active than from other sources [29].
Although a number of bacteria have been isolated with phosphate solubilising properties, there is still a need to search for and characterize new effective microbial inoculants. They can be isolated from various soil samples by dilution plating method on different media. Various media employed were GL (glucose and yeast extract), GELP (glucose, soilextract, yeast extract, peptone, CaCl2, MgSO4 and NaCl), Pikovskaya media (PVK), National Botanical Research Institute’s phos-phate growth medium (NBRIP), National Botanical Research Institute’s phosphate growth Bromophenol blue medium (NBRIP-BPB) [30, 31]. The media plates were incubated at 20˚C, 37˚C, and 45˚C. PSB colonies were isolated based on phosphate solubilization on media plates as indicated by the formation of a clear zone around them. Solubilization efficiency (SE %) was then calculated and the phosphorous solubilization potential of selected strains of phosphate solubilizing bacteria was tested in vitro by estimating available phosphorous in broth media [32]. These isolates can be tested for their plant growth-promoting activity by measuring the effect of the bacteria in vivo on the agronomical parameters like root and shoot elongation, fresh and dry weight of the developed plants. The potential isolates could be developed as inoculants and applied as biofertilisers, to improve phosphorus nutrition in plants and thus promote plant growth and productivi-ty.
REFERENCES CITED
1. Subba Rao, N.S., Biofertilisers in agriculture and forestry, 1995, Oxford and IBM Publ.Co., New Delhi.
2. Kadiri, D.D., Varada Raju Peetala, N.G.K., and Peela, S., International Journal of Advanced Biotechnology and
Research, 2004, v. 4(4), p. 518-526. 3. Rodríguez, H., and Fraga, R., Biotechnol. Adv., 2004, v.
17, p. 319-339. 4. Katiyar, V. and Goel, R., J. Microbiol. and Biotechnol.,
2004, v. 14 (4), p. 653-657. 5. Gyaneshwar, P., Kumar, G.N., Parekh, L.J., and Poole,
P.S., Plant Soil, 2002, v. 245, p. 83-93. 6. Hao, X., Cho, C.M., Racz, G.J. and Chang, C., Nutr. Cycl.
Agroecosys., 2002, v. 64, p. 213-224.
dsramesh
Typewritten Text
81

Proceedings of the National Seminar on "Impact of Scientific Advances on Society", August 18-19, 2015, p.80-82
St. Pious X Degree & PG College for Women, Hyderabad-500076.
Sponsored by the Indian Institute of Geomagnetism, Navi Mumbai-410218 (DST, Govt. of India)
7. Vassileva, M., Vassilev, N., and Azcon, R., World J.
Microbiol. Biotech., 1998, v. 14, p. 281–284. 8. Kang, S.C., Hat, C.G., Lee, T.G., and Maheshwari, D.K.,
Curr. Sci., 2002, v. 82, p. 439-442. 9. Das, K., Katiyar, V., and Goel, R., Microbio. Res., 2003, v.
158, p. 359-362. 10. Pradhan, N., and Sukla, L.B., African J. Biotechnol., 2005,
v. 5, p. 850-854. 11. Chen, Y.P., Rekha, P.D., Arunshen, A.B., Lai, W.A., and
Young, C.C., Appl. Soil Ecol., 2006, v. 34, p. 33-41. 12. Gupta, G.N., Khan, M.K., and Prakash, V., International
Journal of Recent Scientific Research, 2013, v. 4(4), p. 353 -356.
13. Satyanarayana, T., and Johri, B.N., Microbial Diversity:
Current Perspectives and Potential Applications, 2005, 377p., I. K. International Pvt. Ltd.
14. Hameeda, B., Harini, G., Rupela, O.P., and Reddy, G., Microbiol. Res., 2008, v. 163, p. 234-242.
15. Illmer, P., and Schinner, F., Soil Biol. Biochem., 1995, v. 24, p. 389-395.
16. Singh, S., and Kapoor, K.K., Mycorrhiza, 1998, v. 7, p. 249.
17. Khan, A.A., Jilani , G., Akhtar , M.S., Naqvi, S.M.S., and Rasheed, M., J. Agric. Biol. Sci., 2009, v. 1(1), p. 48-58.
18. Surange, S., Wollum, A.G., Kumar, N., and Nautiyal, C.S., Can. J. Microbiol., 1995, v. 43, p. 891- 894.
19. Dutton, V.M., and Evans, C.S., Can. J. Microbiol., 1996, v. 42, p. 881-895.
20. Nahas, E., World J. Microb. Biotechnol., 1996, v. 12, p. 18-23.
21. Hilda, R., and Fraga R., Biotech. Adv., 2000, v. 17, p. 319-359.
22. Shankar, T., Sivakumar, T., Asha, G., Sankaralingam, S., and Meenakshi Sundaram V., World Appl. Sci. J., 2013, v. 26(5), p. 610-617.
23. Bagyaraj, D.J., and Varma, A., Adv. Microbiol. Ecol., 1995, v. 14, p. 119-142.
24. Deubel, A., Gransee and Merbach, W., J. Plant Nutr. Soil
Sci., 2000, v. 163, p. 387-392. 25. Maliha, R., Samina, K., Nazma, A., Sadia, A., and Farooq,
L., Pak. J. Biol. Sci., 2004), v. 7, p. 187-196. 26. Vassilev, N., Franco, I., Vassileva, M., and Azcon, R.,
Bioresource Technol., 1996, v. 55, p. 237-241. 27. Kim, K.Y., Jordan, D., and McDonald, G.A., Biol. Fert.
Soils, 1998, v. 26, p. 79-87. 28. Yahya, A., and Azawi, S K.A., Plant Soil, 1998, v. 117, p.
135- 141. 29. Vazquez, P., Holguin, G., Puente, M., Cortes, A.E., and
Bashan, Y., Biol. Fert. Soils, 2000, v. 30, p. 460-468. 30. Nautiyal, C.S., FEMS Microbiol. Lett., 1999, v. 170(1), p.
265-270. 31. Pikovskaya, R.I., Microbiologia, 1948, v. 17, p. 319-339 32. Fiske, C.H., and Subbarow, Y., Journal of Biological
Chemistry, 1925, v. 66, p. 375-400.
dsramesh
Typewritten Text
82
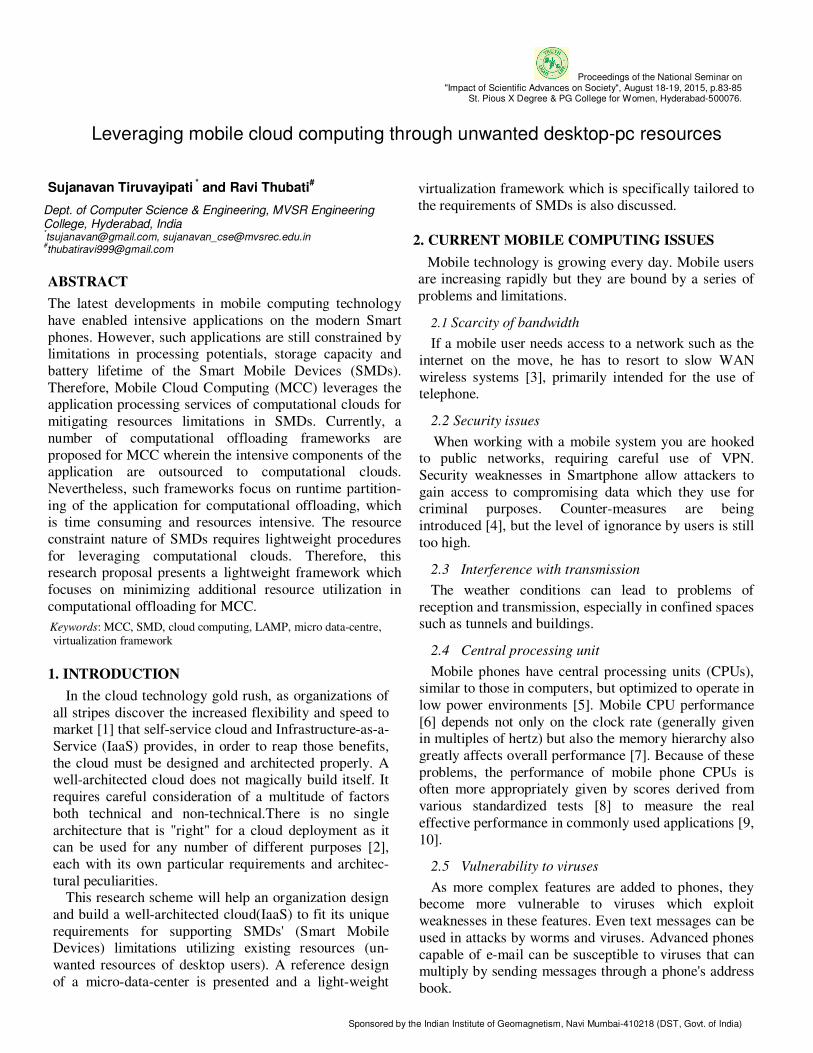
Proceedings of the National Seminar on "Impact of Scientific Advances on Society", August 18-19, 2015, p.83-85
St. Pious X Degree & PG College for Women, Hyderabad-500076.
Sponsored by the Indian Institute of Geomagnetism, Navi Mumbai-410218 (DST, Govt. of India)
Leveraging mobile cloud computing through unwanted desktop-pc resources
Sujanavan Tiruvayipati * and Ravi Thubati
#
Dept. of Computer Science & Engineering, MVSR Engineering College, Hyderabad, India *[email protected], [email protected]
ABSTRACT
The latest developments in mobile computing technology
have enabled intensive applications on the modern Smart
phones. However, such applications are still constrained by limitations in processing potentials, storage capacity and
battery lifetime of the Smart Mobile Devices (SMDs).
Therefore, Mobile Cloud Computing (MCC) leverages the application processing services of computational clouds for
mitigating resources limitations in SMDs. Currently, a
number of computational offloading frameworks are
proposed for MCC wherein the intensive components of the application are outsourced to computational clouds.
Nevertheless, such frameworks focus on runtime partition-
ing of the application for computational offloading, which is time consuming and resources intensive. The resource
constraint nature of SMDs requires lightweight procedures
for leveraging computational clouds. Therefore, this research proposal presents a lightweight framework which
focuses on minimizing additional resource utilization in
computational offloading for MCC.
Keywords: MCC, SMD, cloud computing, LAMP, micro data-centre, virtualization framework
1. INTRODUCTION
In the cloud technology gold rush, as organizations of
all stripes discover the increased flexibility and speed to market [1] that self-service cloud and Infrastructure-as-a-
Service (IaaS) provides, in order to reap those benefits,
the cloud must be designed and architected properly. A well-architected cloud does not magically build itself. It
requires careful consideration of a multitude of factors
both technical and non-technical.There is no single
architecture that is "right" for a cloud deployment as it can be used for any number of different purposes [2],
each with its own particular requirements and architec-
tural peculiarities. This research scheme will help an organization design
and build a well-architected cloud(IaaS) to fit its unique
requirements for supporting SMDs' (Smart Mobile Devices) limitations utilizing existing resources (un-
wanted resources of desktop users). A reference design
of a micro-data-center is presented and a light-weight
virtualization framework which is specifically tailored to
the requirements of SMDs is also discussed.
2. CURRENT MOBILE COMPUTING ISSUES
Mobile technology is growing every day. Mobile users are increasing rapidly but they are bound by a series of
problems and limitations.
2.1 Scarcity of bandwidth
If a mobile user needs access to a network such as the
internet on the move, he has to resort to slow WAN
wireless systems [3], primarily intended for the use of telephone.
2.2 Security issues
When working with a mobile system you are hooked to public networks, requiring careful use of VPN.
Security weaknesses in Smartphone allow attackers to
gain access to compromising data which they use for criminal purposes. Counter-measures are being
introduced [4], but the level of ignorance by users is still
too high.
2.3 Interference with transmission
The weather conditions can lead to problems of
reception and transmission, especially in confined spaces such as tunnels and buildings.
2.4 Central processing unit
Mobile phones have central processing units (CPUs), similar to those in computers, but optimized to operate in
low power environments [5]. Mobile CPU performance
[6] depends not only on the clock rate (generally given in multiples of hertz) but also the memory hierarchy also
greatly affects overall performance [7]. Because of these
problems, the performance of mobile phone CPUs is often more appropriately given by scores derived from
various standardized tests [8] to measure the real
effective performance in commonly used applications [9,
10].
2.5 Vulnerability to viruses
As more complex features are added to phones, they become more vulnerable to viruses which exploit
weaknesses in these features. Even text messages can be
used in attacks by worms and viruses. Advanced phones
capable of e-mail can be susceptible to viruses that can multiply by sending messages through a phone's address
book.
dsramesh
Typewritten Text
83
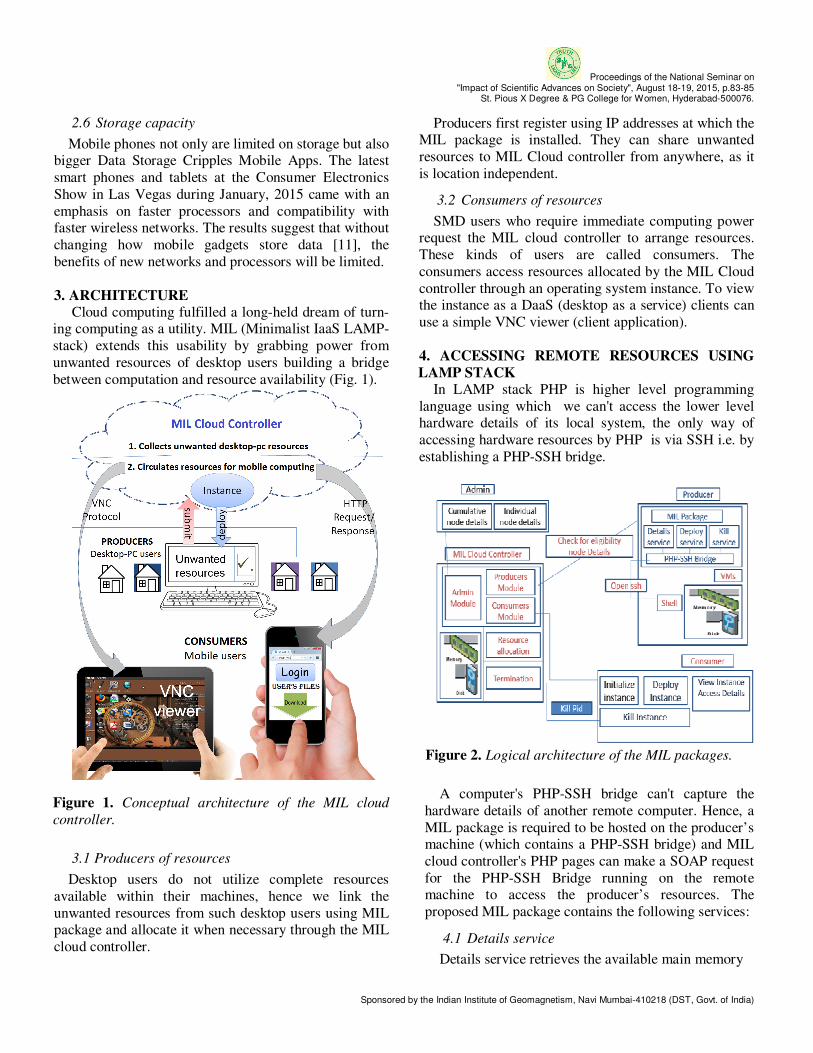
Proceedings of the National Seminar on "Impact of Scientific Advances on Society", August 18-19, 2015, p.83-85
St. Pious X Degree & PG College for Women, Hyderabad-500076.
Sponsored by the Indian Institute of Geomagnetism, Navi Mumbai-410218 (DST, Govt. of India)
2.6 Storage capacity
Mobile phones not only are limited on storage but also bigger Data Storage Cripples Mobile Apps. The latest
smart phones and tablets at the Consumer Electronics
Show in Las Vegas during January, 2015 came with an
emphasis on faster processors and compatibility with faster wireless networks. The results suggest that without
changing how mobile gadgets store data [11], the
benefits of new networks and processors will be limited.
3. ARCHITECTURE
Cloud computing fulfilled a long-held dream of turn-ing computing as a utility. MIL (Minimalist IaaS LAMP-
stack) extends this usability by grabbing power from
unwanted resources of desktop users building a bridge
between computation and resource availability (Fig. 1).
Figure 1. Conceptual architecture of the MIL cloud
controller.
3.1 Producers of resources
Desktop users do not utilize complete resources
available within their machines, hence we link the
unwanted resources from such desktop users using MIL package and allocate it when necessary through the MIL
cloud controller.
Producers first register using IP addresses at which the MIL package is installed. They can share unwanted
resources to MIL Cloud controller from anywhere, as it
is location independent.
3.2 Consumers of resources
SMD users who require immediate computing power request the MIL cloud controller to arrange resources.
These kinds of users are called consumers. The
consumers access resources allocated by the MIL Cloud
controller through an operating system instance. To view the instance as a DaaS (desktop as a service) clients can
use a simple VNC viewer (client application).
4. ACCESSING REMOTE RESOURCES USING
LAMP STACK
In LAMP stack PHP is higher level programming
language using which we can't access the lower level hardware details of its local system, the only way of
accessing hardware resources by PHP is via SSH i.e. by
establishing a PHP-SSH bridge.
Figure 2. Logical architecture of the MIL packages.
A computer's PHP-SSH bridge can't capture the
hardware details of another remote computer. Hence, a
MIL package is required to be hosted on the producer’s machine (which contains a PHP-SSH bridge) and MIL
cloud controller's PHP pages can make a SOAP request
for the PHP-SSH Bridge running on the remote machine to access the producer’s resources. The
proposed MIL package contains the following services:
4.1 Details service
Details service retrieves the available main memory
dsramesh
Typewritten Text
84
Proceedings of the National Seminar on "Impact of Scientific Advances on Society", August 18-19, 2015, p.83-85
St. Pious X Degree & PG College for Women, Hyderabad-500076.
Sponsored by the Indian Institute of Geomagnetism, Navi Mumbai-410218 (DST, Govt. of India)
and free hard disk space details form producers to MIL
Cloud controller (Fig. 3).
Figure 3. Scheme & code snippet of Details Service.
4.2 Deploy service
Once the deployment of instance is completed
consumer can view their Instance and Access Details
(Fig. 4). The accessing of consumers account is done two ways either using VNC Viewer or using Browser.
The viewing of consumer instance is done through
VNC Viewer using Ip address and port number otherwise it is done using browser URL.
“DISPLAY=:0”; Represents server default display.
“nohup Qemu >>/ null 2/dev/null &”; Returns Process
Id.
Figure 4. Scheme & code snippet of Deploy Service
4.3 Terminate service
Termination of an instance is done either by admin-
istrator or consumer by sending the “kill” command
along with the process ID to the instance and if it is
successful a return signal with ID “1” is received else
on failure signal with ID “0” is received (Fig. 5).
Figure 5. Scheme & code snippet of Terminate Service
5. CONCLUSION
MIL has the Cloud benefits for applications on an indi-
vidual basis. The application’s nature towards load varia-
tions and scalability requirements were not tested.
As a general formula it is an application considering the
load is always steady-state, cloud elasticity will not be as
efficient when compared with dedicated server hosting. However, if an application has non-peak load variation,
then it could dramatically reduce the running costs com-
pared to paying for a fully dedicated desktop all the time. In
this scenario MIL offers the flexibility of elastic scalability
as the application load grows overtime.
REFERENCES CITED
1. Yu Wu, Zhizhong Zhang, Wu C., Zongpeng Li and Lau F., IEEE Transactions, 2013 , v.15(4), p.821-832.
2. Hyun-suk Roh, Hyun-Woo Lee and Sang-Ho Lee, Advanced
Communication Technology (ICACT), 16th International
Conference, 2014, p.593-596.
3. Tao Ban, Shanqing Guo, Zonghua Zhang, Ando, R. and
Kadobayashi, Y., 7th
International Wireless
Communications and Mobile Computing Conference
(IWCMC), 2011, p.1801-1807.
4. Xiaolei Li, Guangdong Bai, Thian B, Zhenkai Liang and
Heng Yin, IEEE Eighth International Conference on
Software Security and Reliability-Companion (SERE-C),
2014, p.158-167. 5. Volkan Rodoplul and Teresa H. Meng, IEEE Journal on
selected areas in communications, 1999, v. 17(8), p. 1333-
1340.
6. Baskarane R., Archana P., Priyadharshini A. and Hemalatha
P., International Conference on Information
Communication and Embedded Systems (ICICES), 2014,
p.1-6.
7. Xing Liu, Chaowei Yuan, Zhen Yang, and Zhongwei Hu,
IEEE 78th
Vehicular Technology Conference (VTC Fall),
2013, p.1-5.
8. Gupta, P. and Kumar, P.R., IEEE Transactions on
Information Theory, 2000, v. 46(2).
9. Satyanarayanan, M., IEEE Personal Communications, 2001.
10. Axelrod, R. and Hamilton, W.D., Science, New Series,
1981, v. 211(4489), p. 1390-1396.
11. Hyojung Kang, Junseok Park and Hyokyung Bahn, IEEE
Transactions on Consumer Electronics, 2010, v.56(4),
p.2387-2392.
12. Jararweh, Y., Tawalbeh, L., Ababneh, F. And Dosari F.,
IEEE Ninth International Conference on Mobile Adhoc and
Sensor Networks (MSN), 2013, p.373-377.
dsramesh
Typewritten Text
85
Proceedings of the National Seminar on "Impact of Scientific Advances on Society", August 18-19, 2015, p.86-88
St. Pious X Degree & PG College for Women, Hyderabad-500076.
Sponsored by the Indian Institute of Geomagnetism, Navi Mumbai-410218 (DST, Govt. of India)
Antibacterial effect of Coleus amboinicus leaf extract
Vasavi Dathar*, Revathi Desai and Pavan Kumar Pindi
Department of Microbiology, Palamuru University, Mahabubna-gar-509001, Telangana State, India. *[email protected]
ABSTRACT
Medicinal plants are the prime source of drugs in both
developing and developed nations as drugs or herbal
extracts for various chemotherapeutic purposes. A metha-nolic extract from the leaves of the medicinal plant Coleus
amboinicus was prepared and tested for antibacterial
activity against 11 clinical isolates by disc diffusion method. The bacteria included the Gram positive Staphylo-
coccus aureus, Methicillin resistant Staphylococcus aureus
and Enterococci and Gram negative E.coli, Klebsiella
pneumoniae, Citrobacter divergens, Shigella flexneri,
Salmonella paratyphi A, Salmonella paratyphi B, Proteus
mirabilis and Pseudomonas aeruginosa. Chloramphenicol
and tetracycline were set up as control antibiotics. The extract showed activity against all the isolates with a
maximum zone of inhibition of diameter 9.33 ± 0.58 mm
and 7.33 ± 0.58 mm against E.coli at concentrations 2.5 mg/disc and 1.25 mg/disc respectively. A minimum zone of
inhibition of diameter 7.0 mm was shown against Salmonel-
la paratyphi B with a concentration of 2.5 mg/disc; but it was resistant at a concentration of 1.25 mg/disc. A mini-
mum inhibitory zone of 6.67± 0.58 mm at this concentra-
tion was shown against Staphylococcus aureus. Remaining
bacteria have shown intermediate results. The leaf extract was also active against Methicillin resistant staphylococcus
aureus. Pseudomonas aeruginosa which was resistant to
both the control antibiotics chloramphenicol and tetracyc-line and Proteus mirabilis resistant to tetracycline were
inhibited by the leaf extract. This indicates that Coleus
amboinicus can be efficiently used as a natural medicine for
the control of infections caused by these bacteria as well as other clinical isolates tested.
Keywords: Coleus amboinicus, leaf extract, clinical isolates, antibacterial effect, disc diffusion
1. INTRODUCTION
There are about 2000+ plant species known to possess
medicinal value in the traditional Asian system of
medicine [1]. Herbal medicines are used for successful management of various diseases like malaria, epilepsy,
infertility, convulsion, diarrhoea, dysentery, gonorrhoea,
flatulence, tonsillitis, bacterial and fungal infections,
mental illness and worm infections [2]. Coleus amboini-
cus or Plectranthus amboinicus is a medicinal and
ornamental plant belonging to the family Lamiaceae. It is
known as ‘Vamaku’ in Telugu [3]. The leaves are strongly flavored and make an excellent addition to
stuffing for meat and poultry. It is also used for making
snacks which are very tasty.The leaves are traditionally
used for the treatment of coughs, sore throats and nasal congestion and other problems such as infections,
rheumatism and flatulence, malarial fever, hepatopathy,
renal calculi, asthma, hiccoughs, bronchitis, helminthia-sis, colic, convulsions and epilepsy [4, 5]. The plant is
also used for its essential oils. It is considered nourishing
for lactating mothers which enhances breast milk pro-duction and also acts as a uterine cleansing agent [6].
Besides these medicinal uses, the leaf extract of this
plant is also used for the biosynthesis of gold nanopar-
ticles by a simple, non-toxic, efficient and green chemi-stry approach [7]. In the present work, the antibacterial
effect of leaf extract of this plant against eleven bacteria
isolated from clinical samples is studied.
2. MATERIALS AND METHOD
2.1 Preparation of leaf extract
Twenty to thirty healthy leaves of Coleus amboinicus
(Fig. 1) were taken, dried in the shade for 15 days and
powdered in a mechanical grinder. The powder was stored at 4°C. Samples were extracted using methanol as
a solvent as described by Crozier et al. [8]. Two grams of
dried leaf powder are weighed, placed into a 100 ml conical flask and treated with 40 ml of 80% (v/v)
aqueous methanol followed by an addition of 10 ml of 6
M HCl. The mixture was refluxed for 2 hours at 90 °C
and filtered using Whatman No. 1 filter paper, followed by evaporation of the filtrate using a vacuumed Rotary
Evaporator. The extract was further dried using sodium
sulphate, filtered and evaporated on the water bath. The crude extracts were re-dissolved in methanol for antimi-
crobial analysis.
Figure 1. Coleus amboinicus plant.
dsramesh
Typewritten Text
86
Proceedings of the National Seminar on "Impact of Scientific Advances on Society", August 18-19, 2015, p.86-88
St. Pious X Degree & PG College for Women, Hyderabad-500076.
Sponsored by the Indian Institute of Geomagnetism, Navi Mumbai-410218 (DST, Govt. of India)
2.2 Preparation of antimicrobial discs
Whatman No.1 filter paper was taken and cut into 6
mm discs. These discs were sterilized in a hot air oven at
a temperature of 1600C for 1 hour. Two different
concentrations of the leaf extract (2.5 mg/ disc and 1.25
mg/ disc) are added to each disc and the discs were used
for testing antimicrobial activity [9]. Chloramphenicol and tetracycline were set up as control antibiotics.
2.3 Preparation of the bacterial culture
Eleven bacterial isolates from clinical samples are
obtained from SVS Medical College, Mahabubnagar, which include Staphylococcus aureus, Methicillin
resistant Staphylococcus aureus, Enterococci,
Escherichia coli, Klebsiella species, Citrobacter
divergens, Shigella flexneri, Salmonella paratyphi A,
Salmonella paratyphi B, Proteus mirabilis and
Pseudomonas aeruginosa. Conventional bacteriological methods such as colony morphology, gram stain and
biochemical tests were used for identification of isolates
[10]. All the test organisms were inoculated in Mueller
Hinton broth (pH 7.4.) for 8 hours. The concentration of the suspensions was adjusted to 0.5 Mc Farland standard
[11] to reach an optical density of 0.08 – 0.10 at 625 nm
by adding sterile distilled water. This gives a bacterial suspension containing 1.5 x 10
8 CFU/ml [12]. Isolates
were seeded on Mueller Hinton agar plates by using
sterilized cotton swabs.The values of antimicrobial
activity of the leaf extract of Coleus amboinicus were expressed as mean ± standard deviation (n= 3) for each
sample.
3. RESULTS AND DISCUSSION
As shown in the Table-1, with disc diffusion method,
the inhibition zones with concentration of the leaf extract
2.5 mg/disc were found to be 7.0 mm for Salmonella
paratyphi B; 7.33 ± 0.58 mm for Shigella flexneri, 8.0
mm for Staphylococcus aureus, Klebsiella species,
Proteus mirabilis and Pseudomonas aeruginosa; 8.33 ±
0.58 mm for Enterococci and Methicillin resistant Staphylococcus aureus; 8.5 ± 0.5 mm for Citrobacter
divergens; 8.67 ± 0.58 mm for Salmonella paratyphi A
and 9.33 ± 0.58 mm for Escherichia coli. With a concentration of 1.25 mg/disc of leaf extract,
the inhibitory zones were found to be 6.67 ± 0.58 mm
for Staphylococcus aureus; 7.0 mm for Methicillin
resistant Staphylococcus aureus, Enterococci, Klebsiella
species, Citrobacter divergens, Salmonella paratyphi A,
Proteus mirabilis and Pseudomonas aeruginosa; 7.11 ±
0.29 mm for Shigella flexneri and 7.33 ± 0.58 mm for
Escherichia coli. Salmonella paratyphi B is resistant to the leaf extract at this concentration.
Table 1. Inhibition zones (in mm) for various bacteria with leaf extract of Coleus amboinicus
S.N
o
Organism
Zone diameters in millimetres
Leaf
ex-
tract
2.5mg
/disc
Leaf
ex-
tract
1.25m
g/disc
Chloram-
phenicol
Tetracyline
Gram
Positive
bacteria
1 Staphylo-
coccus
aureus
8.0 ±
0.0
6.67 ±
0.58
26 ± 0.0 30 ± 0.0
2 Methicil-
lin resis-
tant Sta-
phylococ-
cus au-
reus
8.33 ±
0.58
7.0 ±
0.0
34.33 ±
0.58
34.67 ±
0.58
3 Entero-
cocci
8.33 ±
0.58
7.0 ±
0.0
20.0 ± 0.0 24.0 ± 0.0
Gram
Negative
bacteria
1. Escheri-
chia coli
9.33 ±
0.58
7.33 ±
0.58
28.67 ±
1.53
19.33 ±
0.58
2. Klebsiella
species
8.0 ±
0.0
7.0 ±
0.0
27.67 ±
0.58
23.33 ±
0.58
3. Citrobac-
ter diver-
gens
8.5 ±
0.5
7.0 ±
1.0
20.0 ± 0.0 25.0 ± 0.0
4. Shigella
flexneri
7.33 ±
0.58
7.17 ±
0.29
34.0 ± 0.0 25.0 ± 0.0
5. Salmonel-
la paraty-
phi A
8.67 ±
0.58
7.0 ±
0.0
32.0 ± 0.0 24.0 ± 0.0
6. Salmonel-
la paraty-
phi B
7.0 ±
0.0
Resis-
tant
30.0 ± 0.0 22.67 ±
0.58
7. Proteus
mirabilis
8.0 ±
0.0
7.0 ±
0.0
20.0 ± 0.0 Resistant
8. Pseudo-
monas
aerugino-
sa
8.0 ±
0.0
7.0 ±
0.0
Resistant Resistant
The values are mean of triplicate measurements ± standard deviation.
Chloramphenicol and tetracycline were used as control
antibiotics which have shown inhibition zones of 20 mm to 34 ± 33 mm and 19.33 ± 0.58 to 34.67 ± 0.58
respectively for various bacteria tested. Similar
inhibitory effect against Gram positive and Gram
negative bacteria was shown by methanolic extracts of leaf, stem and root of Labisia pumila Benth. [13],
methanolic extracts of cranberry [14] and ethanol extract
of leaf and flower of Spathodea campanulata [15].
dsramesh
Typewritten Text
87
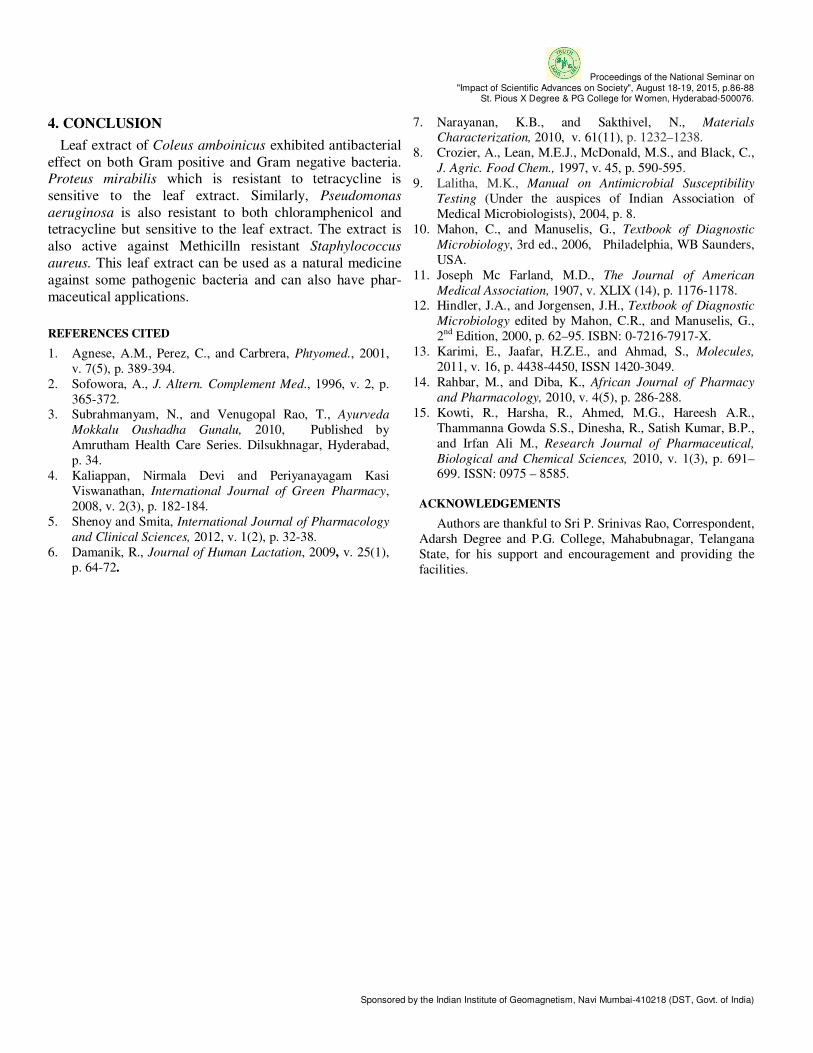
Proceedings of the National Seminar on "Impact of Scientific Advances on Society", August 18-19, 2015, p.86-88
St. Pious X Degree & PG College for Women, Hyderabad-500076.
Sponsored by the Indian Institute of Geomagnetism, Navi Mumbai-410218 (DST, Govt. of India)
4. CONCLUSION
Leaf extract of Coleus amboinicus exhibited antibacterial
effect on both Gram positive and Gram negative bacteria. Proteus mirabilis which is resistant to tetracycline is
sensitive to the leaf extract. Similarly, Pseudomonas
aeruginosa is also resistant to both chloramphenicol and tetracycline but sensitive to the leaf extract. The extract is
also active against Methicilln resistant Staphylococcus
aureus. This leaf extract can be used as a natural medicine
against some pathogenic bacteria and can also have phar-
maceutical applications.
REFERENCES CITED
1. Agnese, A.M., Perez, C., and Carbrera, Phtyomed., 2001,
v. 7(5), p. 389-394.
2. Sofowora, A., J. Altern. Complement Med., 1996, v. 2, p.
365-372. 3. Subrahmanyam, N., and Venugopal Rao, T., Ayurveda
Mokkalu Oushadha Gunalu, 2010, Published by
Amrutham Health Care Series. Dilsukhnagar, Hyderabad,
p. 34.
4. Kaliappan, Nirmala Devi and Periyanayagam Kasi
Viswanathan, International Journal of Green Pharmacy,
2008, v. 2(3), p. 182-184.
5. Shenoy and Smita, International Journal of Pharmacology
and Clinical Sciences, 2012, v. 1(2), p. 32-38.
6. Damanik, R., Journal of Human Lactation, 2009, v. 25(1),
p. 64-72.
7. Narayanan, K.B., and Sakthivel, N., Materials
Characterization, 2010, v. 61(11), p. 1232–1238.
8. Crozier, A., Lean, M.E.J., McDonald, M.S., and Black, C.,
J. Agric. Food Chem., 1997, v. 45, p. 590-595.
9. Lalitha, M.K., Manual on Antimicrobial Susceptibility
Testing (Under the auspices of Indian Association of
Medical Microbiologists), 2004, p. 8.
10. Mahon, C., and Manuselis, G., Textbook of Diagnostic
Microbiology, 3rd ed., 2006, Philadelphia, WB Saunders,
USA.
11. Joseph Mc Farland, M.D., The Journal of American
Medical Association, 1907, v. XLIX (14), p. 1176-1178. 12. Hindler, J.A., and Jorgensen, J.H., Textbook of Diagnostic
Microbiology edited by Mahon, C.R., and Manuselis, G.,
2nd Edition, 2000, p. 62–95. ISBN: 0-7216-7917-X.
13. Karimi, E., Jaafar, H.Z.E., and Ahmad, S., Molecules,
2011, v. 16, p. 4438-4450, ISSN 1420-3049.
14. Rahbar, M., and Diba, K., African Journal of Pharmacy
and Pharmacology, 2010, v. 4(5), p. 286-288.
15. Kowti, R., Harsha, R., Ahmed, M.G., Hareesh A.R.,
Thammanna Gowda S.S., Dinesha, R., Satish Kumar, B.P.,
and Irfan Ali M., Research Journal of Pharmaceutical,
Biological and Chemical Sciences, 2010, v. 1(3), p. 691–699. ISSN: 0975 – 8585.
ACKNOWLEDGEMENTS
Authors are thankful to Sri P. Srinivas Rao, Correspondent,
Adarsh Degree and P.G. College, Mahabubnagar, Telangana
State, for his support and encouragement and providing the
facilities.
dsramesh
Typewritten Text
88