Fracto-emissions as seismic precursors - Politecnico di Torino
12
Fracto-emissions as seismic precursors Alberto Carpinteri ⇑ , Oscar Borla Politecnico di Torino, Department of Structural, Geotechnical and Building Engineering, Corso Duca degli Abruzzi 24, 10129 Torino, Italy article info Article history: Received 6 December 2016 Received in revised form 6 March 2017 Accepted 7 March 2017 Available online 9 March 2017 Keywords: Fracture TeraHertz pressure waves Neutron emissions Acoustic emissions Electromagnetic emissions Earthquake precursors Multi-modal statistics abstract Three different forms of energy might be used as earthquake precursors for environmental protection against seismicity. At the tectonic scale, Acoustic Emission (AE) prevails, as well as Electro-Magnetic Emission (EME) at the intermediate scales, and Neutron Emission (NE) at the nano-scale. TeraHertz pressure waves are in fact produced at the last extremely small scale, and fracture experiments on natural rocks have recently demonstrated that these high-frequency waves are able to induce nuclear fission reactions with neutron and/or alpha particle emissions. Very important applications to earthquake precursors can be proposed. The authors present the results they are obtaining at a gypsum mine located in Northern Italy. In this mine, to avoid interference with human activities, the instrumental control units have been located at one hundred metres underground. The experimental results obtained from July 1st, 2013 to December 31, 2015 (five semesters) are analysed by means of a suitable multi-modal statistics. The experimental observations reveal a strong correlation between the three fracto-emission peaks (acoustic, electromag- netic, and neutron emissions) and the major earthquakes occurred in the surrounding areas. Ó 2017 Published by Elsevier Ltd. 1. Introduction Solids that break in a brittle way are subjected to a rapid emission of energy involving the generation of pressure waves that travel at a characteristic speed with an order of magnitude of 10 3 m/s. Considering the very important case of earth- quakes, it is possible to observe that, as fracture at the nanoscale (10 9 m) emits pressure waves at the frequency scale of TeraHertz (10 12 Hz), so fracture at the microscale (10 6 m) emits pressure waves at the frequency scale of GigaHertz (10 9 Hz), at the scale of millimetre emits pressure waves at the scale of MegaHertz (10 6 Hz), at the scale of metre emits pres- sure waves at the scale of kiloHertz (10 3 Hz), and eventually faults at the kilometre scale emit pressure waves at the scale of the simple Hertz, which is the typical and most likely frequency of seismic oscillations (Fig. 1) [1]. The animals with sensitive hearing in the ultrasonic field (frequency > 20 kHz) ‘‘feel” the earthquake up to one day in advance, when the active cracks are still below the metre scale. Ultrasounds are in fact a well-known seismic precursor [2,3]. With frequencies between Mega- and GigaHertz, and therefore cracks between the micron and the millimetre scale, pressure waves can generate electromagnetic waves of the same frequency, which turn out to be even a more advanced seis- mic precursor (up to a few days before) [4,5]. When pressure waves show frequencies between Giga- and TeraHertz, and then with cracks below the micron scale, we are witnessing a phenomenon partially unexpected: pressure waves resonate with the crystal lattices and, through a complex cascade of events (acceleration of electrons, bremsstrahlung gamma radi- http://dx.doi.org/10.1016/j.engfracmech.2017.03.007 0013-7944/Ó 2017 Published by Elsevier Ltd. ⇑ Corresponding author. E-mail address: [email protected] (A. Carpinteri). Engineering Fracture Mechanics 177 (2017) 239–250 Contents lists available at ScienceDirect Engineering Fracture Mechanics journal homepage: www.elsevier.com/locate/engfracmech
-
Upload
khangminh22 -
Category
Documents
-
view
0 -
download
0
Transcript of Fracto-emissions as seismic precursors - Politecnico di Torino
Engineering Fracture Mechanics 177 (2017) 239–250
Contents lists available at ScienceDirect
Engineering Fracture Mechanics
journal homepage: www.elsevier .com/locate /engfracmech
Fracto-emissions as seismic precursors
http://dx.doi.org/10.1016/j.engfracmech.2017.03.0070013-7944/� 2017 Published by Elsevier Ltd.
⇑ Corresponding author.E-mail address: [email protected] (A. Carpinteri).
Alberto Carpinteri ⇑, Oscar BorlaPolitecnico di Torino, Department of Structural, Geotechnical and Building Engineering, Corso Duca degli Abruzzi 24, 10129 Torino, Italy
a r t i c l e i n f o
Article history:Received 6 December 2016Received in revised form 6 March 2017Accepted 7 March 2017Available online 9 March 2017
Keywords:FractureTeraHertz pressure wavesNeutron emissionsAcoustic emissionsElectromagnetic emissionsEarthquake precursorsMulti-modal statistics
a b s t r a c t
Three different forms of energy might be used as earthquake precursors for environmentalprotection against seismicity. At the tectonic scale, Acoustic Emission (AE) prevails, as wellas Electro-Magnetic Emission (EME) at the intermediate scales, and Neutron Emission (NE)at the nano-scale. TeraHertz pressure waves are in fact produced at the last extremelysmall scale, and fracture experiments on natural rocks have recently demonstrated thatthese high-frequency waves are able to induce nuclear fission reactions with neutronand/or alpha particle emissions. Very important applications to earthquake precursorscan be proposed. The authors present the results they are obtaining at a gypsum minelocated in Northern Italy. In this mine, to avoid interference with human activities, theinstrumental control units have been located at one hundred metres underground. Theexperimental results obtained from July 1st, 2013 to December 31, 2015 (five semesters)are analysed by means of a suitable multi-modal statistics. The experimental observationsreveal a strong correlation between the three fracto-emission peaks (acoustic, electromag-netic, and neutron emissions) and the major earthquakes occurred in the surroundingareas.
� 2017 Published by Elsevier Ltd.
1. Introduction
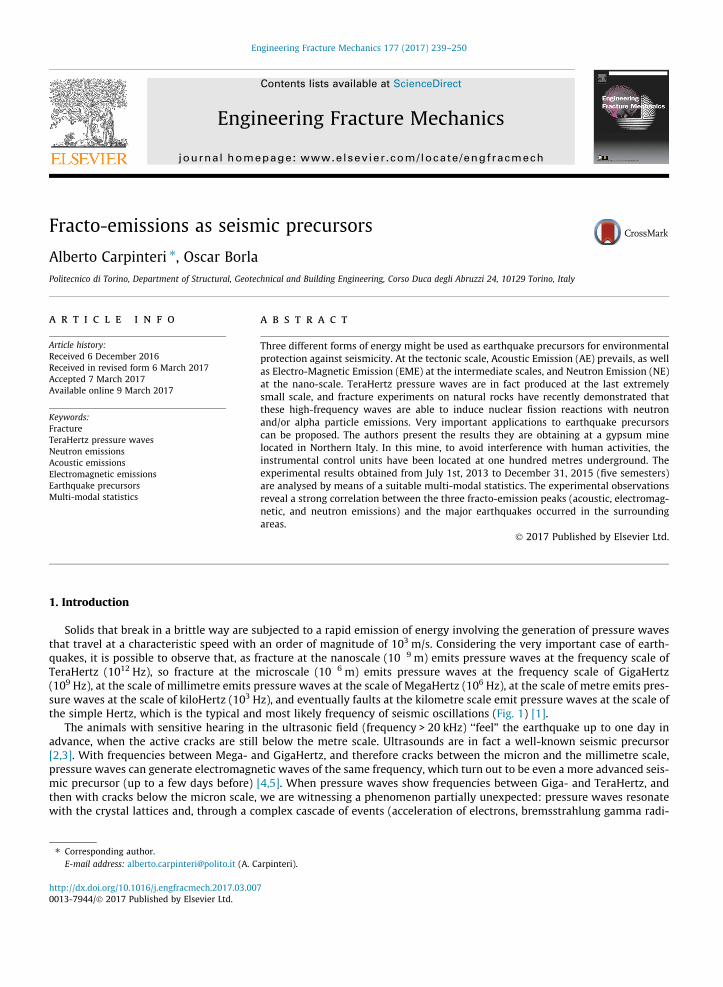
Solids that break in a brittle way are subjected to a rapid emission of energy involving the generation of pressure wavesthat travel at a characteristic speed with an order of magnitude of 103 m/s. Considering the very important case of earth-quakes, it is possible to observe that, as fracture at the nanoscale (10�9 m) emits pressure waves at the frequency scale ofTeraHertz (1012 Hz), so fracture at the microscale (10�6 m) emits pressure waves at the frequency scale of GigaHertz(109 Hz), at the scale of millimetre emits pressure waves at the scale of MegaHertz (106 Hz), at the scale of metre emits pres-sure waves at the scale of kiloHertz (103 Hz), and eventually faults at the kilometre scale emit pressure waves at the scale ofthe simple Hertz, which is the typical and most likely frequency of seismic oscillations (Fig. 1) [1].
The animals with sensitive hearing in the ultrasonic field (frequency > 20 kHz) ‘‘feel” the earthquake up to one day inadvance, when the active cracks are still below the metre scale. Ultrasounds are in fact a well-known seismic precursor[2,3]. With frequencies between Mega- and GigaHertz, and therefore cracks between the micron and the millimetre scale,pressure waves can generate electromagnetic waves of the same frequency, which turn out to be even a more advanced seis-mic precursor (up to a few days before) [4,5]. When pressure waves show frequencies between Giga- and TeraHertz, andthen with cracks below the micron scale, we are witnessing a phenomenon partially unexpected: pressure waves resonatewith the crystal lattices and, through a complex cascade of events (acceleration of electrons, bremsstrahlung gamma radi-
010 9
f (Hertz)
λλ (Metre)
1012 109 106 103 100
1031010 −6− 10 −3
HumansInsectsProteins Bacteria Earthquakes
wave velocity = λ × f ≈ 103 m s–1
Fig. 1. Correlation between wavelength (forming crack) scale and frequency scale by assuming a constant pressure wave velocity.
240 A. Carpinteri, O. Borla / Engineering Fracture Mechanics 177 (2017) 239–250
ation, photo-fission, etc.), may produce nuclear fission reactions [6–16]. It can be shown experimentally how such fissionreactions can emit neutrons [17–19] like in the well-known case of uranium-235 but without gamma radiation and radioac-tive wastes. Note that the Debye frequency, i.e., the fundamental frequency of free vibration of crystal lattices, is around theTeraHertz, and this is not a coincidence, since it is simply due to the fact that the inter-atomic distance is just around thenanometre, as indeed the minimum size of the lattice defects. As the chain reactions are sustained by thermal neutronsin a nuclear power plant, so the piezonuclear reactions are triggered by pressure waves that have a frequency close tothe resonance frequency of the crystal lattice and an energy close to that of thermal neutrons [8]. Neutrons therefore appearto be as the most advanced earthquake precursor (up to three weeks before) [20–27].
In the present work, after summarizing the results obtained during two different experimental investigations at ‘‘TestaGrigia” laboratory (Plateau Rosa, Cervinia, Italy) and at the seismic district of ‘‘Val Trebbia” (Bettola, Piacenza, Italy)[28,29], the authors describe the preliminary results acquired at a gypsum mine situated in Northern Italy (Murisengo,Alessandria) and related to the evaluation of acoustic, electromagnetic, and nuclear phenomena. The monitoring system,based on the simultaneous acquisition of the various physical quantities, controls the structural stability of the mine carryingout, at the same time, the environment monitoring for the seismic risk evaluation. The preliminary results obtained duringthe in-situ monitoring revealed a strong correlation between AE/EME/NE emissions and the major earthquakes occurring inthe surrounding areas.
2. Seismic precursors: acoustic, electromagnetic, neutron emissions
Seismic precursors are phenomena that take place well in advance than the occurrence of an earthquake. These param-eters are of various kind, such as ground deformation, changes in tilt and strain and in Earth tidal strain, changes in the geoa-coustic and geomagnetic field, in radon and carbon dioxide content, in environmental radioactivity and so on.
The monitoring and the correct interpretation of these phenomena provide the basis for the assessment of the three mainparameters of an earthquake: place and time of occurrence, as well as magnitude of the quake.
Moreover, the prediction strategy has to take into account an integral approach that includes the evaluation of severalphysical quantities and that discriminates true signals from the environmental background or noise.
In addition, it is very important to consider that, in the period before the earthquake occurrence, a very wide area ofcracking rocks is active and in a critical condition around the future earthquake focal zone under the influence of tectonicstresses. In particular, Dobrovolsky et al. [30] tried to calculate the dimension of this earthquake preparation area as a func-tion of the magnitude of the incoming earthquake considering an arbitrary heterogeneity and anisotropy of the Earth’s sur-face. Assuming that the zone of effective manifestation of the precursor deformations is a circle with the centre in theepicentre of the next earthquake, the radius R of this ‘strain zone’ may be up to hundreds kilometres for earthquakes witha magnitude M equal to 5 degrees in the Richter scale and can tend to the whole Earth surface for a M = 9 seismic event (forexample, Sumatra 2004, Chile 2010, Japan 2011). Comparison between theoretical and field results showed a satisfactoryagreement [30]. In addition, it was also observed that all the precursors tend to fall into this circle.
In the last decades a great number of laboratory tests and experimental observations evidenced that mechanical, electro-magnetic, and neutron emissions, together with radon levels, carbon dioxide emanations and temperature variations, are themost reliable natural phenomena that can be linked to earthquake preparation.
In particular, the experimental tests carried out since 2008 at the Politecnico di Torino have demonstrated how the mon-itoring of the different forms of energy (Acoustic Emission AE, Electro-Magnetic Emission EME, and Neutron Emission NE),emitted during the failure of natural and artificial brittle materials, enables an accurate interpretation of mechanical damageand fracture, not only at the scale of the laboratory, but also at the Earth’s crust scale [31–38].

A. Carpinteri, O. Borla / Engineering Fracture Mechanics 177 (2017) 239–250 241
Nowadays, the AE technique is well-known in the scientific community and applied for structural monitoring purposes[3,39–43]. In addition, the relation between AE and geological structure has been investigated for several years in order tostudy their implications as a precursor of earthquakes and volcanic eruptions [2,44–46]. For example, an AE paroxysm, i.e. alarge and almost abrupt increase in the AE signals, was observed at about 400 km of distance from the epicentral area beforethe occurrence of the Assisi earthquake [44,45].
Moreover, considering that earthquakes always affect structural stability, an interpretation in which AE and seismicevents are considered to be linked both in space and time seems to be possible. With this approach a correlation betweenbursts of AE activity in a masonry building and regional seismicity can be investigated [2,39,40,47].
In another recent work [48] a new method for evaluating seismic risk in regional areas based on the acoustic emission(AE) technique is proposed. In this research two important constructions of the Italian cultural heritage were considered:a chapel of the ‘‘Sacred Mountain of Varallo” and the ‘‘Asinelli Tower” in Bologna. The structures were monitored duringearthquake sequences in their relative areas and by using the Grassberger-Procaccia algorithm, a statistical method forspace-time correlation between AE and seismic events was developed. The study emphasized how under certain conditionsit was observed that AEs precede earthquakes. In particular a constant AE activity in the 24 h prior to an earthquake wasmonitored.
On the other hand, the EM signals are related to brittle materials in which the fracture propagation occurs suddenly and isaccompanied by abrupt stress drops in the stress–strain diagram. A number of laboratory studies revealed the existence ofEM signals during fracture experiments carried out on a wide range of materials [5,49–54]. It was also observed that the EMsignals detected during failure of materials are analogous to the anomalous radiation of geoelectromagnetic waves observedbefore major earthquakes [54], reinforcing the idea that the EM effect can be applied as a forecasting tool for seismic events.
In particular, several scientific reports emphasized that experimental evidences between anomalous electromagnetic sig-nals and earthquakes become more and more plausible [55–60]. As an example, the Kobe earthquake, occurred in Japan in1995, is considered as the ‘‘big impact” in terms of pre-seismic electromagnetic changes monitored by a lot of scientistsworking independently all around the World [58].
Moreover, kHz and MHz electromagnetic (EM) anomalies were also recorded before the L’Aquila (Italy) earthquakeoccurred on April 6, 2009 [61,62]. Clear anomalies were revealed between 2 and 8 days before the occurrence of the quake.
As regards the neutron emissions, the detections performed by Russian researchers [20–27] have led to consider also theEarth’s crust, in addition to cosmic rays, as a relevant source of neutron flux variations.
In particular, quoting from Volodichev, neutron emissions measured in seismic areas of the Pamir region (4200 m a.s.l.)exceeded the usual neutron background ‘‘up to two orders of magnitude in correspondence to seismic activity and ratherappreciable earthquakes, greater than or equal to the 4th degree in the Richter scale magnitude” [27]. In addition, consid-ering the altitude dependence of neutron radiation (Pfotzer profile [63]), values approximately ten times higher than naturalbackground at sea level are generally detected at 5000 m altitude. Therefore, the same earthquakes occurring at sea levelshould produce a neutron flux up to 1000 times higher than the natural background.
Anomalous neutron measurements were also carried out by Sigaeva et al. [23] before the Sumatra earthquake of Decem-ber 26, 2004. Variations in the neutron flux were observed in different points (Crimea and Kamchatka) some days before theearthquake. The variations’ peak reached hundreds of percentage.
3. In-situ monitoring of seismic risk: preliminary experimental investigations
An additional analysis carried out by the authors after those by the Russian research groups is presented. The studies startfrom recent data acquired at the ‘‘Testa Grigia” laboratory of Plateau Rosa, Cervinia (Italy), during an experimental campaignon the evaluation of neutron radiation from cosmic rays [28,29]. Even more recent data refer to a dedicated experimentaltrial carried out in Northern Italy, at the seismic district of ‘‘Val Trebbia”, Bettola, Piacenza [28,29].
3.1. Experimental campaign at ‘‘Testa Grigia” laboratory (Plateau Rosa, Italy)
Since 1997, dedicated experimental campaigns [64–66] have been performed at High Altitude Observatories (HMOs), inthe Northern as well as Southern Hemisphere, to obtain information on the variability of atmospheric neutron spectra withsolar activity.
In particular, in the period from July 30 to August 3, 2008, an experimental campaign was conducted at the ‘‘Testa Grigia”laboratory (Plateau Rosa, Italy). During the data acquisition, an evident increase by about 6 times in neutron radiation withrespect to the average natural background was monitored between July 31 and August 1st. This phenomenon was monitoredfor a period of about two hours. Then the values decreased to the usual background level (Fig. 2).
As usual, the assumptions made for the explanation of this event have firstly focused on possible effects of cosmic origin.However, from the analysis of data relating to solar and galactic events, apparently, no event of such great intensity wasfound. As a matter of fact, no significant sunspot activity was recorded during the data acquisition time window. As wellas, during the same period, no anomalies in the cosmic ray flux were detected [67].
On the other hand, considering the phenomenon of neutron emission before seismic events, a searching of earthquakesoccurred in the immediate vicinity of the laboratory and during the weeks following the experimental campaign was carried

0 10 20 30 40 50 60 70 80 900,0
0,2
0,4
0,6
0,8
1,0
1,2
1,4
Neu
tron
Am
bien
t Dos
e E
quiv
alen
t (μS
V/h
)
Time (hours)
Neutron Ambient Dose Equivalent
Fig. 2. Neutron ambient dose equivalent measured at ‘‘Testa Grigia” laboratory during the experimental campaign of July-August 2008.
242 A. Carpinteri, O. Borla / Engineering Fracture Mechanics 177 (2017) 239–250
out. A discrete seismic activity [68] occurred during the period July-August 2008 in a region a few hundred kilometres awayfrom the laboratory. In particular, starting from 8 days after the anomalous increase in neutron radiation, seismic events upto the 3rd degree in the Richter scale of magnitude were observed. This interpretation is consistent with the observations ofRussian groups and it provides further experimental evidence of the correlation between neutron emissions and seismicevents of appreciable intensity.
3.2. Experimental campaign at ‘‘Val Trebbia” (Piacenza, Italy) seismic district
From December 28, 2012, to January 6, 2013, a dedicated experimental campaign was conducted at Villanova Chiesa, Bet-tola, Piacenza, located in Northern Italy, at the ‘‘Val Trebbia” seismic district [28,29]. The seismic risk level of this geograph-ical area is changed after the disastrous earthquakes that have stricken the Emilia Romagna region in Spring 2012. At thismoment the area is considered a medium-high seismic zone.
During the experimental trial three evident peaks in neutron radiation field were monitored between December 30, 2012,and January 2, 2013. An increase by about 6 times in the neutron dose with respect to the average natural background wasobserved in two cases (Fig. 3). These phenomena were monitored for a period of at least three hours. Then the valuesdecreased to the usual background level.
30-dic-12 31-dic-12 02-gen-13 04-gen-13 06-gen-130
10
20
30
40
50
60
70
80
Neu
tron
Flue
nce
Rat
e (c
m−2
h−1)
Date
Neutron Fluence Rate in Bettola, Piacenza (Italy) Average Neutron Background (12,52±2,45) cm−2h−1
Fig. 3. Neutron ambient dose equivalent measured at Villanova Chiesa, Bettola, Piacenza during the period December 2012 – January 2013.
0
10
20
30
40
50
60
70
80
90
100FIRST SEMESTER - YEAR 2015
Aco
ustic
Em
issi
on R
ate
(AE/
day)
Days
Acoustic Emission Rate
(b)
0
1
2
3
4
5
6
7
8
NO
EM
E M
ON
ITO
RIN
G
FIRST SEMESTER - YEAR 2015
Elec
trom
agne
tic E
mis
sion
Rat
e (E
M/d
ay)
Days
EM Emission Rate
(c)
0
3
4
5
6
7
8FIRST SEMESTER - YEAR 2015
Neu
tron
Flu
x (X
103 c
m−2
day
− 1)
Days
NEUTRON FLUX(d)
0 15 30 45 60 75 90 105 120 135 150 165 180
0 15 30 45 60 75 90 105 120 135 150 165 180
0 15 30 45 60 75 90 105 120 135 150 165 180
0 15 30 45 60 75 90 105 120 135 150 165 180
0,01,5
2,0
2,5
3,0
3,5
4,0
4,5
5,0 FIRST SEMESTER - YEAR 2015
Days
Earthquakes
(a)
Epic
entr
eM
agni
tude
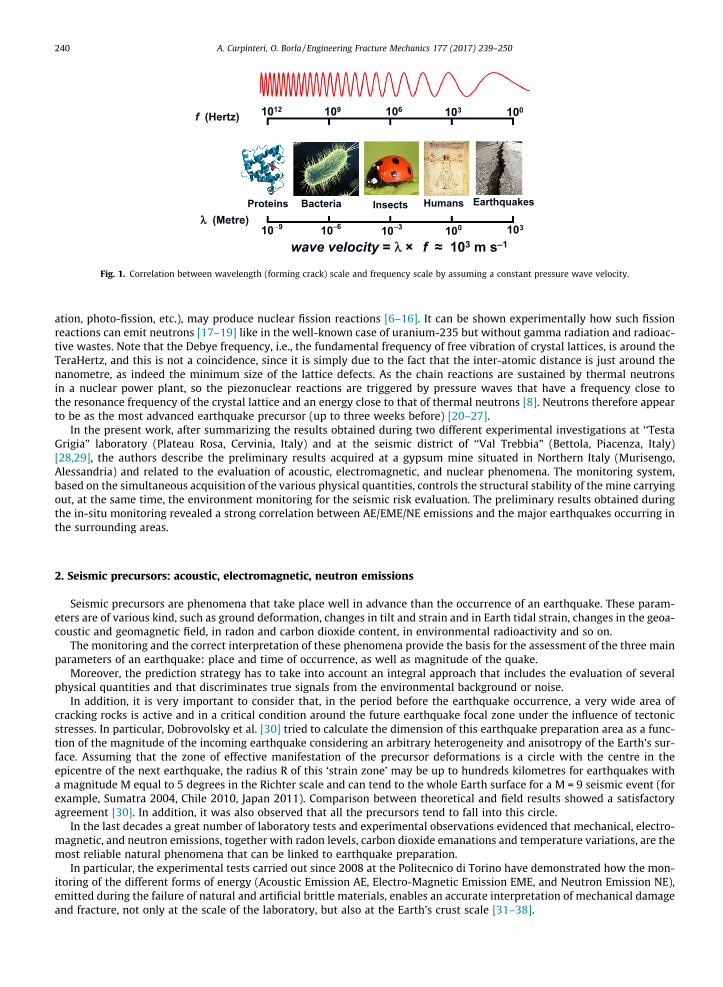
Fig. 4. Multi-modal Gaussian distribution during the first semester 2015 for earthquakes (a), acoustic emissions (b), electromagnetic emissions (c), andneutron emissions (d).
A. Carpinteri, O. Borla / Engineering Fracture Mechanics 177 (2017) 239–250 243
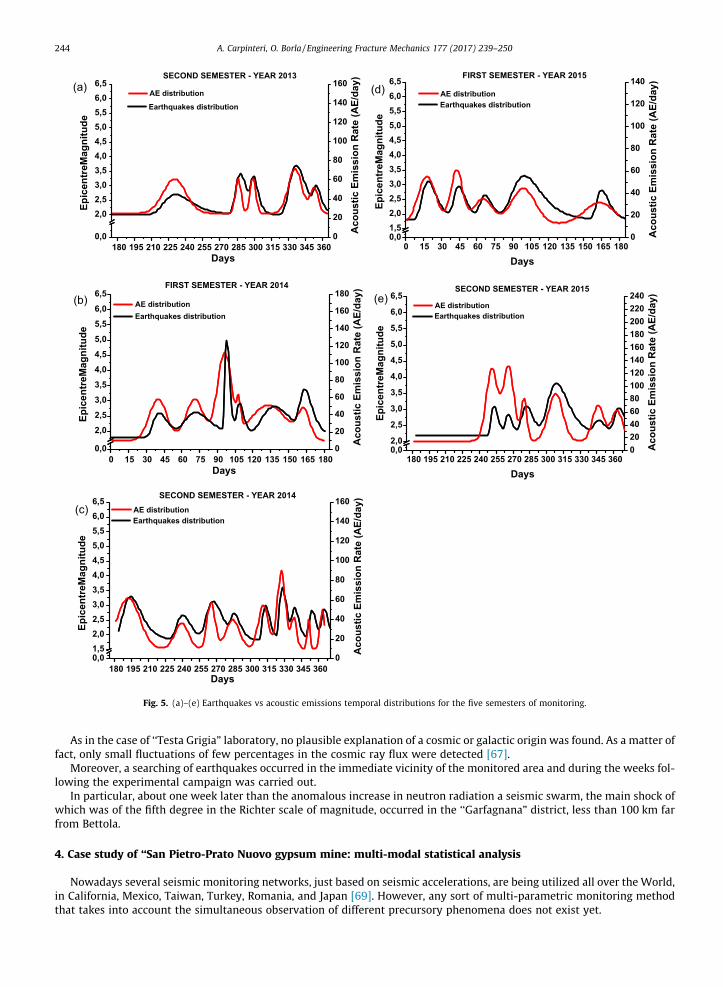
0,0
2,02,53,03,54,04,55,05,56,06,5
180 195 210 225 240 255 270 285 300 315 330 345 3600
20
40
60
80
100
120
140
160SECOND SEMESTER - YEAR 2013
Earthquakes distribution
Aco
ustic
Em
issi
on R
ate
(AE/
day)
Days
AE distributionEp
icen
treM
agni
tude
(a)
FIRST SEMESTER - YEAR 2014
0
20
40
60
80
100
120
140
160
180
0 15 30 45 60 75 90 105 120 135 150 165 1800,0
2,0
2,5
3,0
3,5
4,0
4,5
5,0
5,5
6,0
6,5
Aco
ustic
Em
issi
on R
ate
(AE/
day)
Days
AE distribution Earthquakes distribution
Epic
entr
eMag
nitu
de
(b)
0,01,52,02,53,03,54,04,55,05,56,06,5
180 195 210 225 240 255 270 285 300 315 330 345 3600
20
40
60
80
100
120
140
160
Days
Earthquakes distribution
SECOND SEMESTER - YEAR 2014
Aco
ustic
Em
issi
on R
ate
(AE/
day)
AE distribution
Epic
entr
eMag
nitu
de
(c)
0,01,52,02,53,03,54,04,55,05,56,06,5
0 15 30 45 60 75 90 105 120 135 150 165 1800
20
40
60
80
100
120
140FIRST SEMESTER - YEAR 2015
Days
Earthquakes distribution
Aco
ustic
Em
issi
on R
ate
(AE/
day)
AE distribution
Epic
entr
eMag
nitu
de
(d)
0,02,0
2,5
3,0
3,5
4,0
4,5
5,0
5,5
6,0
6,5
180 195 210 225 240 255 270 285 300 315 330 345 360020406080100120140160180200220240
Days
Earthquakes distribution
SECOND SEMESTER - YEAR 2015
Aco
ustic
Em
issi
on R
ate
(AE/
day)
AE distribution
Epic
entr
eMag
nitu
de
(e)
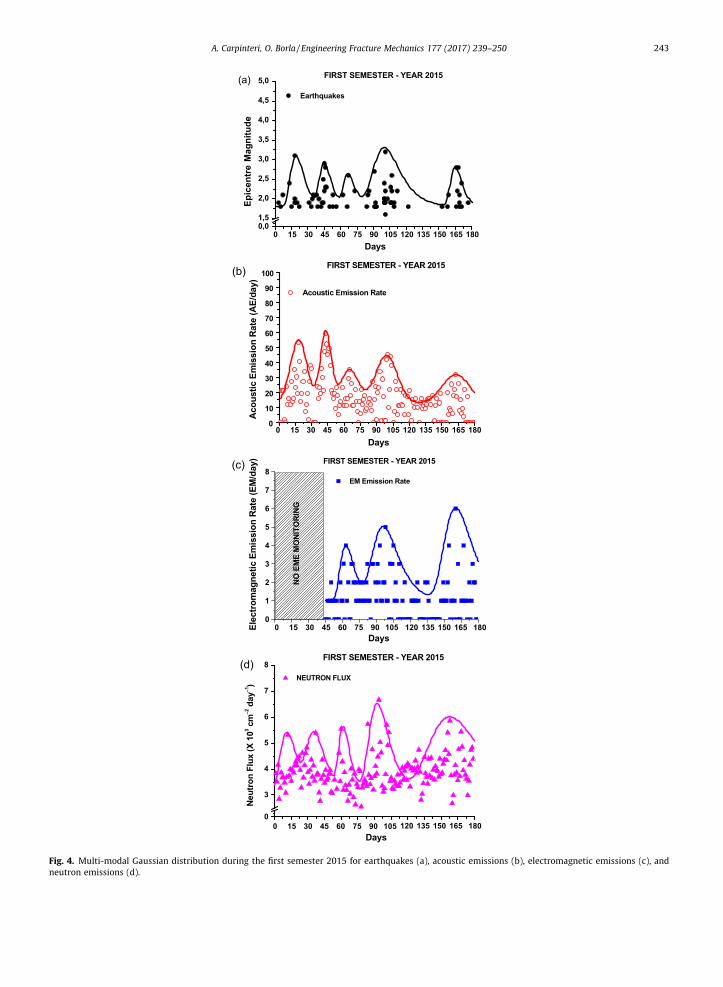
Fig. 5. (a)–(e) Earthquakes vs acoustic emissions temporal distributions for the five semesters of monitoring.
244 A. Carpinteri, O. Borla / Engineering Fracture Mechanics 177 (2017) 239–250
As in the case of ‘‘Testa Grigia” laboratory, no plausible explanation of a cosmic or galactic origin was found. As a matter offact, only small fluctuations of few percentages in the cosmic ray flux were detected [67].
Moreover, a searching of earthquakes occurred in the immediate vicinity of the monitored area and during the weeks fol-lowing the experimental campaign was carried out.
In particular, about one week later than the anomalous increase in neutron radiation a seismic swarm, the main shock ofwhich was of the fifth degree in the Richter scale of magnitude, occurred in the ‘‘Garfagnana” district, less than 100 km farfrom Bettola.
4. Case study of ‘‘San Pietro-Prato Nuovo gypsum mine: multi-modal statistical analysis
Nowadays several seismic monitoring networks, just based on seismic accelerations, are being utilized all over the World,in California, Mexico, Taiwan, Turkey, Romania, and Japan [69]. However, any sort of multi-parametric monitoring methodthat takes into account the simultaneous observation of different precursory phenomena does not exist yet.
0,01,5
2,0
2,5
3,0
3,5
4,0
4,5
5,0
5,5
6,0
6,5
0 15 30 45 60 75 90 105 120 135 150 165 1800
1
2
3
4
5
6
7
8
9
10
11
12
Days
Earthquakes distribution
NO
EM
E M
ON
ITO
RIN
G
FIRST SEMESTER - YEAR 2015
Elec
trom
agne
tic E
mis
sion
Rat
e (E
M/d
ay)
EM distribution
Epic
entr
eMag
nitu
de
(a)
0,0
2,0
2,5
3,0
3,5
4,0
4,5
5,0
5,5
6,0
6,5
180 195 210 225 240 255 270 285 300 315 330 345 3600
2
4
6
8
10
12
14
16
18
20SECOND SEMESTER - YEAR 2015
Days
Earthquakes distribution
Elec
trom
agne
tic E
mis
sion
Rat
e (E
M/d
ay)
EM distribution
Epic
entr
eMag
nitu
de
(b)
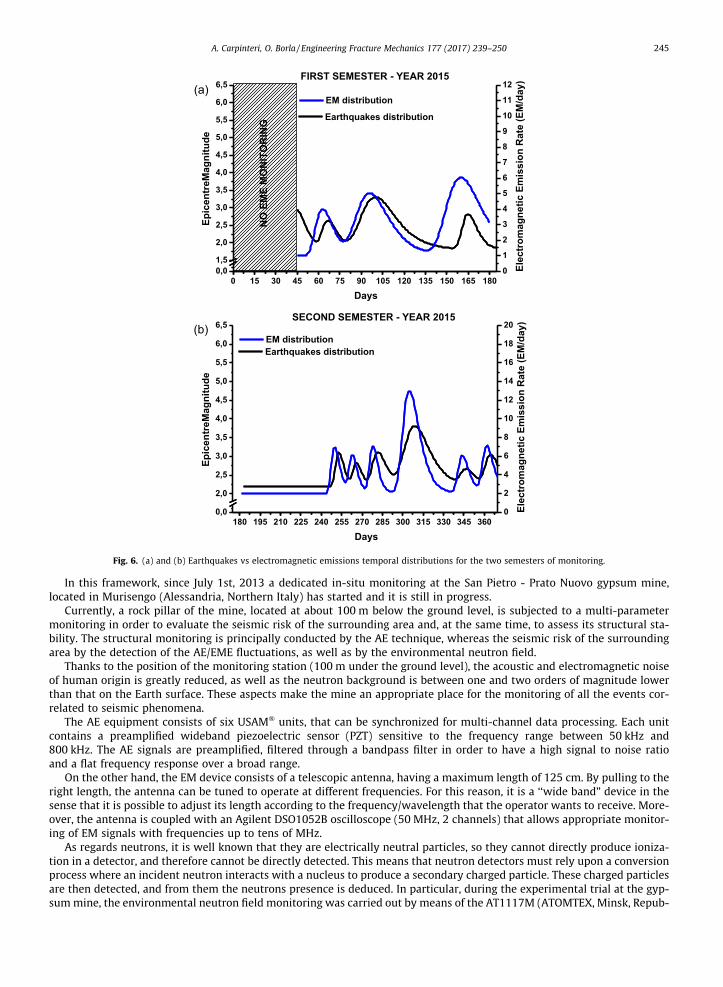
Fig. 6. (a) and (b) Earthquakes vs electromagnetic emissions temporal distributions for the two semesters of monitoring.
A. Carpinteri, O. Borla / Engineering Fracture Mechanics 177 (2017) 239–250 245
In this framework, since July 1st, 2013 a dedicated in-situ monitoring at the San Pietro - Prato Nuovo gypsum mine,located in Murisengo (Alessandria, Northern Italy) has started and it is still in progress.
Currently, a rock pillar of the mine, located at about 100 m below the ground level, is subjected to a multi-parametermonitoring in order to evaluate the seismic risk of the surrounding area and, at the same time, to assess its structural sta-bility. The structural monitoring is principally conducted by the AE technique, whereas the seismic risk of the surroundingarea by the detection of the AE/EME fluctuations, as well as by the environmental neutron field.
Thanks to the position of the monitoring station (100 m under the ground level), the acoustic and electromagnetic noiseof human origin is greatly reduced, as well as the neutron background is between one and two orders of magnitude lowerthan that on the Earth surface. These aspects make the mine an appropriate place for the monitoring of all the events cor-related to seismic phenomena.
The AE equipment consists of six USAM� units, that can be synchronized for multi-channel data processing. Each unitcontains a preamplified wideband piezoelectric sensor (PZT) sensitive to the frequency range between 50 kHz and800 kHz. The AE signals are preamplified, filtered through a bandpass filter in order to have a high signal to noise ratioand a flat frequency response over a broad range.
On the other hand, the EM device consists of a telescopic antenna, having a maximum length of 125 cm. By pulling to theright length, the antenna can be tuned to operate at different frequencies. For this reason, it is a ‘‘wide band” device in thesense that it is possible to adjust its length according to the frequency/wavelength that the operator wants to receive. More-over, the antenna is coupled with an Agilent DSO1052B oscilloscope (50 MHz, 2 channels) that allows appropriate monitor-ing of EM signals with frequencies up to tens of MHz.
As regards neutrons, it is well known that they are electrically neutral particles, so they cannot directly produce ioniza-tion in a detector, and therefore cannot be directly detected. This means that neutron detectors must rely upon a conversionprocess where an incident neutron interacts with a nucleus to produce a secondary charged particle. These charged particlesare then detected, and from them the neutrons presence is deduced. In particular, during the experimental trial at the gyp-summine, the environmental neutron field monitoring was carried out by means of the AT1117M (ATOMTEX, Minsk, Repub-

0,0
2,02,53,03,54,04,55,05,56,06,5
180 195 210 225 240 255 270 285 300 315 330 345 3600,0
456789101112131415
SECOND SEMESTER - YEAR 2013
Earthquakes distribution
Days
Neutron distributionEp
icen
tre
Mag
nitu
de (a)
0
1,52,02,53,03,54,04,55,05,56,06,5
0 15 30 45 60 75 90 105 120 135 150 165 1804
5
6
7
8
25303540
Earthquakes distribution
FIRST SEMESTER - YEAR 2014
Neu
tron
Flu
x (X
103 c
m-2 d
ay-1
)
Days
Neutron distribution
Epic
entr
eM
agni
tude
(b)
0,01,52,02,53,03,54,04,55,05,56,06,5
180 195 210 225 240 255 270 285 300 315 330 345 3600
3
4
5
6
7
8
9
10
11
12
Earthquakes distribution
SECOND SEMESTER - YEAR 2014
Neu
tron
Flu
x (X
103 c
m-2 d
ay-1)
Days
Neutron distribution
Epic
entr
eM
agni
tude
(c)
0,01,52,02,53,03,54,04,55,05,56,06,5
0 15 30 45 60 75 90 105 120 135 150 165 1800,03
4
5
6
7
8
9
10
Days
Earthquakes distribution
FIRST SEMESTER - YEAR 2015
Neu
tron
Flu
x (X
103 c
m-2
day
-1)
Neutron distribution
Epic
entr
eM
agni
tude
(d)
0,02,0
2,5
3,0
3,5
4,0
4,5
5,0
5,5
6,0
6,5
180 195 210 225 240 255 270 285 300 315 330 345 360345678
36
37
38
Days
Earthquakes distribution
SECOND SEMESTER - YEAR 2015
Neu
tron
Flu
x (X
103 c
m-2 d
ay-1)
Neutron distribution
Epic
entr
eM
agni
tude
(e)
Fig. 7. (a)–(e) Earthquakes vs neutron emissions temporal distributions for the five semesters of monitoring.
246 A. Carpinteri, O. Borla / Engineering Fracture Mechanics 177 (2017) 239–250
lic of Belarus) neutron device. This type of device provides a high sensitivity and wide measuring ranges (neutron energyrange 0.025 eV–14 MeV), with a fast response to radiation field change ideal for any environmental monitoring purpose.
From July 1st, 2013, the acquisition of acoustic and neutron environmental radioactivity parameters was performed,whereas only from February 15, 2015 the measuring platform has been also integrated with the acquisition of electromag-netic emissions by means of the telescopic antenna coupled with the Agilent oscilloscope.
The acquisition of the experimental data of acoustic emissions, electromagnetic emissions, neutron environmental fluxand seismic activity, was carried out on a monthly basis. Moreover, the period of monitoring has been divided for conve-nience into five distinct semesters.
The statistical analysis of the distribution of seismic events and of the three fracto-emissions was performed by means ofa multi-modal (multi-peak) approach. The software used for the statistical analysis was Microcal Origin. Given a specific dis-crete distribution of points and applying suitable computational routines, the software determines the relative maxima ofthe distribution and evaluates the best Gaussian fitting by symmetrical or non-symmetrical bell-shaped curves.
Regarding the seismic activity, during the 921 days (five semesters) of the preliminary investigation, 242 earthquakes ofmagnitude greater than 1.8 degrees in the Richter scale, within a geographical area of 100 km radius, were observed [70].
0,0
2,0
2,5
3,0
3,5
4,0
80 85 90 95 100 105 110 115 120 125 13005101520253035404550556065
April 11, 2015 - Earthquake M=3.2
Days
Earthquakes distribution
Aco
ustic
Em
issi
on R
ate
(AE/
day) AE distribution
Epic
entr
eM
agni
tude
(a)
0
1
2
3
4
5
6
7
80 85 90 95 100 105 110 115 120 125 1300,01,5
2,0
2,5
3,0
3,5
4,0
E
lect
rom
agne
tic E
mis
sion
Rat
e (E
M/d
ay)
EME distribution
April 11, 2015 - Earthquake M=3.2
Days
Earthquakes distribution
Epic
entr
eM
agni
tude
(b)
0,01,5
2,0
2,5
3,0
3,5
4,0
80 85 90 95 100 105 110 115 120 125 1300
3
4
5
6
7
8April 11, 2015 - Earthquake M=3.2
Days
Earthquakes distribution
Neu
tron
Flu
x (X
10
3 cm
-2 d
ay-1) NE distribution
Epic
entr
eM
agni
tude
(c)
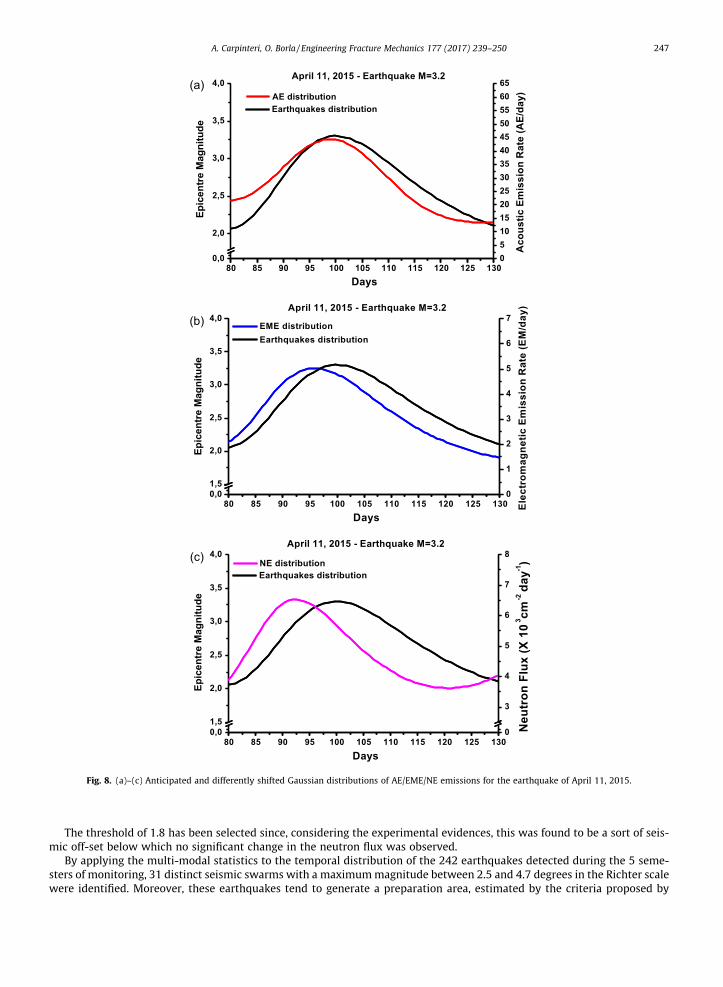
Fig. 8. (a)–(c) Anticipated and differently shifted Gaussian distributions of AE/EME/NE emissions for the earthquake of April 11, 2015.
A. Carpinteri, O. Borla / Engineering Fracture Mechanics 177 (2017) 239–250 247
The threshold of 1.8 has been selected since, considering the experimental evidences, this was found to be a sort of seis-mic off-set below which no significant change in the neutron flux was observed.
By applying the multi-modal statistics to the temporal distribution of the 242 earthquakes detected during the 5 seme-sters of monitoring, 31 distinct seismic swarms with a maximummagnitude between 2.5 and 4.7 degrees in the Richter scalewere identified. Moreover, these earthquakes tend to generate a preparation area, estimated by the criteria proposed by
248 A. Carpinteri, O. Borla / Engineering Fracture Mechanics 177 (2017) 239–250
Dobrovolsky et al. [30], characterised by a radius between several tens and some hundreds kilometres and therefore withinthe monitoring area in the surroundings of Murisengo.
Similar multi-modal evaluations were also performed for acoustic, electromagnetic, and neutron emissions.In the case of AE emissions, it was considered the discrete distribution of the total daily number of observed acoustic
events so that 31 AE Gaussian distributions over the 921 days of monitoring were clearly identified, exactly one for each cor-related swarm.
For what concerns the electromagnetic emissions, the same multi-modal statistical analysis was performed consideringthe total daily number of anomalous electromagnetic events. In this case, the data processing is limited only to the twosemesters of year 2015. Being the time period of the electromagnetic monitoring of just 320 days, only 9 EM Gaussian dis-tribution peaks were obtained.
Eventually, also for neutron radiation the multi-peak analysis was performed. As for the previous fracto-emissions, thetotal daily neutron flux was considered and 31 NE Gaussian distribution peaks over the 5 semesters of monitoring wereobtained.
As an example, the statistical distributions of seismic swarms and related fracto-emissions for the first half of the year2015 are shown in Fig. 4(a)–(d).
Besides the multimodal statistical analysis of earthquakes distribution and of the three fracto-emissions, a further tem-poral correlation between the semester distributions of seismic activity and each related fracto-emission was carried out.The comparison between the temporal distribution of seismic swarms and that of each fracto-emission is given in the fol-lowing for the five semesters of monitoring (Figs. 5(a)–(e), 6(a) and (b), 7(a)–(e)).
From the comparison between the different diagrams, it is evident the strong correlation between acoustic, electromag-netic, neutron signals and the seismic swarms occurring in the surrounding areas. The three fracto-emissions tend to antic-ipate the next seismic event with an evident and chronologically ordered shifting.
As a matter of fact, this behaviour was observed in an extremely systematic way for all the 31 detected seismic swarms. Inparticular, it was noted how AE regularly anticipate the earthquakes by about one day, EME by 3–4 days, whereas NE byabout one week. Therefore, they should be considered as precursors of the next major earthquake rather than aftershocksof the previous one, on the basis of the statistical signal processing and of the different temporal distances.
As a further example, in Fig. 8(a)–(c) it is reported the comparison between one of the 31 seismic swarms and the cor-related fracto-emission distributions. The seismic event refers to the swarm of April 2015 whose main event of 3.2 degrees inthe Richter scale occurred on April 11, 2015. From the comparison it can be seen that AE/EME/NE anticipate very clearly theseismic activity.
5. Conclusions
The experimental results obtained at the San Pietro - Prato Nuovo gypsummine emphasize the close correlation betweenacoustic, electromagnetic, and neutron emissions and seismic activity. In particular, it was observed that the three differentfracto-emissions regularly anticipate the seismic event by approximately one day, 3–4 days, and one week, respectively.
This preliminary experimental investigation can be considered as a starting point for the design and installation of addi-tional monitoring stations in other geographical areas where the seismic activity is significantly greater than that of Muri-sengo, such as in Sicily (Italy), Greece, California, and Japan.
Then, applying the methodology and the experimental approach used in the gypsum mine, it will be possible to realizesuitable monitoring platforms to prevent well in advance the effects of seismic events and to identify the epicentre of theearthquakes. An undoubtable impact onto seismology can be produced.
Moreover, the installation of the experimental devices for the acquisition of the energy parameters in geographicalregions characterised by a higher seismicity could be performed at the ground level and not necessarily underground asin the case of the Murisengo quarry. More intense fracto-emissions, well distinguishable from the background environmen-tal level, are supposed in those cases.
In this way, it will be possible to define more accurately the seismic off-set (currently assumed equal to 1.8 degrees in theRichter scale) and to better evaluate the time correlation between each fracto-emission, and the incoming earthquake. Alonger temporal shifting of each fracto-emission peak with respect to the seismic event is in fact expected.
References
[1] Ashcroft NW, Mermin DN. Solid state physics. Delhi: Cengage Learning; 2013.[2] Carpinteri A, Lacidogna G, Niccolini G. Acoustic emission monitoring of medieval towers considered as sensitive earthquake receptors. Nat Hazard
Earth Syst Sci 2007;7:251–61.[3] Lockner DA et al. Quasi-static fault growth and shear fracture energy in granite. Nature 1991;350:39–42.[4] Carpinteri A et al. Mechanical and electromagnetic emissions related to stress-induced cracks. Exp Tech 2012;36:53–64.[5] Rabinovitch A, Frid V, Bahat D. Surface oscillations. A possible source of fracture induced electromagnetic oscillations. Tectonophysics 2007;431:15–21.[6] Batzel RE, Seaborg GT. Fission of medium weight elements. Phys Rev 1951;82:607–15.[7] Bridgman PW. The breakdown of atoms at high pressures. Phys Rev 1927;29:188–91.[8] Carpinteri A. TeraHertz phonons and piezonuclear reactions from nano-scale mechanical instabilities. In: Carpinteri A, Lacidogna G, Manuello A,
editors. Acoustic, electromagnetic, neutron emissions from fracture and earthquakes. Switzerland: Springer International Publishing; 2016. p. 1–10.[9] Cook ND. Models of the atomic nucleus. 2nd ed. Dordrecht: Springer; 2010.
A. Carpinteri, O. Borla / Engineering Fracture Mechanics 177 (2017) 239–250 249
[10] Cook ND, Manuello A, Veneziano D, Carpinteri A. Piezonuclear fission reactions simulated by the lattice model of the atomic nucleous. In: Carpinteri A,Lacidogna G, Manuello A, editors. Acoustic, electromagnetic, neutron emissions from fracture and earthquakes. Switzerland: Springer InternationalPublishing; 2016. p. 219–35.
[11] Fulmer CB et al. Evidence for photofission of iron. Phys Rev Lett 1967;19:522–3.[12] Hagelstein PL, Letts D, Cravens D. Terahertz difference frequency response of PdD in two-laser experiments. J Cond Mat Nucl Sci 2010;3:59.[13] Hagelstein PL, Chaudhary IU. Anomalies in fracture experiments and energy exchange between vibrations and nuclei. Meccanica 2015;50:1189–203.[14] Lucia U, Carpinteri A. GeV plasmons and spalling neutrons from crushing of iron-rich natural rocks. Chem Phys Lett 2015;640:112–4.[15] Widom A, Swain J, Srivastava YN. Neutron production from the fracture of piezoelectric rocks. J Phys G: Nucl Part Phys 2013;40(15006):1–8.[16] Widom A, Swain J, Srivastava YN. Photo-disintegration of the iron nucleus in fractured magnetite rocks with magnetostriction. Meccanica
2015;50:1205–16.[17] Derjaguin BV et al. Titanium fracture yields neutrons? Nature 1989;34:492.[18] Diebner K. Fusionsprozesse mit hilfe konvergenter stosswellen – einige aeltere und neuere versuche und ueberlegungen. Kerntechnik 1962;3:89–93.[19] Fujii MF et al. Neutron emission from fracture of piezoelectric materials in deuterium atmosphere. Jpn J Appl Phys 2002;41(Pt. 1):2115–9.[20] Antonova VP, Volodichev NN, Kryukov SV, Chubenko AP, Shchepetov AL. Results of detecting thermal neutrons at Tien Shan high altitude station.
Geomagnetism Aeronomy 2009;49(6):761–7.[21] Kuzhevskij M et al. Neutron flux variations near the Earth’s crust. A possible tectonic activity detection. Nat Hazard Earth Syst Sci 2003;3:637–45.[22] Kuzhevskij M, Nechaev OYu, Sigaeva EA. Distribution of neutrons near the Earth’s surface. Nat Hazard Earth Syst Sci 2003;3:255–62.[23] Sigaeva EA et al. Thermal neutrons’ observations before the Sumatra earthquake. Geophys Res Abstr 2006;8:00435.[24] Sobolev GA, Shestopalov IP, Kharin EP. Implications of solar flares for the seismic activity of the Earth, Izvestiya. Phys Solid Earth 1998;34:603–7.[25] Volodichev NN, Kuzhevskij BM, Nechaev OYu, Panasyuk MI, Shavrin PI. Phenomenon of neutron intensity bursts during new and full moons. Cosmic
Res 1997;31(2):135–43.[26] Volodichev NN, et al. Lunar periodicity of the neutron radiation burst and seismic activity on the Earth. In: Proc. of the 26th international cosmic ray
conference, Salt Lake City, 17–25 August, 1999.[27] Volodichev NN, Kuzhevskij BM, Nechaev OYu, Panasyuk MI, Podorolsky AN, Shavrin PI. Sun-moon-earth connections: the neutron intensity splashes
and seismic activity. Astron Vestnik 2000;34:188–90.[28] Borla O, Lacidogna G, Zanini A, Carpinteri A. The phenomenon of neutron emission from earthquakes. In: Fracture mechanics for durability, reliability
and safety (proceedings of the 19th European conference on fracture, Kazan, Russia, 2012), CD-ROM, Paper N. 620; 2012.[29] Borla O, Lacidogna G, Carpinteri A. Piezonuclear neutron emissions from earthquakes and volcanic eruptions. In: Carpinteri A, Lacidogna G, Manuello A,
editors. Acoustic, electromagnetic, neutron emissions from fracture and earthquakes. Switzerland: Springer International Publishing; 2016. p. 135–51.[30] Dobrovolsky IP, Zubkov SI, Miachkin VI. Estimation of the size of earthquake preparation zones. Pure Appl Geophys 1979;117(5):1025–44.[31] Carpinteri A, Cardone F, Lacidogna G. Piezonuclear neutrons from brittle fracture: early results of mechanical compression tests. Strain 2009;45:332–9.[32] Carpinteri A, Borla O, Lacidogna G, Manuello A. Neutron emissions in brittle rocks during compression tests: monotonic vs. cyclic loading. Phys
Mesomech 2010;13:264–74.[33] Carpinteri A, Cardone F, Lacidogna G. Energy emissions from failure phenomena: mechanical, electromagnetic, nuclear. Expe Mech 2010;50:1235–43.[34] Carpinteri A, Lacidogna G, Manuello A, Borla O. Energy emissions from brittle fracture: neutron measurements and geological evidences of
piezonuclear reactions. Strength, Fracture Complexity 2011;7:13–31.[35] Carpinteri A, Chiodoni A, Manuello A, Sandrone R. Compositional and microchemical evidence of piezonuclear fission reactions in rock specimens
subjected to compression tests. Strain 2011;47:267–81.[36] Carpinteri A, Lacidogna G, Manuello A, Borla O. Piezonuclear fission reactions in rocks: evidences from microchemical analysis, neutron emission, and
geological transformation. Rock Mech Rock Eng 2012;45:445–59.[37] Carpinteri A, Lacidogna G, Borla O, Manuello A, Niccolini G. Electromagnetic and neutron emissions from brittle rocks failure: experimental evidence
and geological implications. Sadhana 2012;37:59–78.[38] Carpinteri A, Lacidogna G, Manuello A, Borla O. Piezonuclear fission reactions from earthquakes and brittle rocks failure: evidence of neutron emission
and nonradioactive product elements. Exp Mech 2013;53:345–65.[39] Carpinteri A, Lacidogna G. Damage monitoring of an historical masonry building by the acoustic emission technique. Mater Struct 2006;39:161–7.[40] Carpinteri A, Lacidogna G. Structural monitoring and integrity assessment of medieval towers. ASCE J Struct Eng 2006;132:1681–90.[41] Mogi K. Study of elastic shocks caused by the fracture of heterogeneous materials and its relation to earthquake phenomena. Bull Earthquake Res Inst
1962;40:125–73.[42] Ohtsu M. The history and development of acoustic emission in concrete engineering. Mag Concr Res 1996;48:321–30.[43] Shcherbakov R, Turcotte DL. Damage and self-similarity in fracture. Theor Appl Fracture Mech 2003;39:245–58.[44] Gregori GP, Paparo G. Acoustic emission (AE). A diagnostic tool for environmental sciences and for non destructive tests (with a potential application to
gravitational antennas). In: Schroeder W, editor. Meteorological and geophysical fluid dynamics. Bremen: Science Edition; 2004. p. 166–204.[45] Gregori GP, Paparo G, Poscolieri M, Zanini A. Acoustic emission and released seismic energy. Nat Hazards Earth Syst Sci 2005;5:777–82.[46] Gregori G, Poscolieri M, Paparo G, De Simone S, Rafanelli C, Ventrice G. Storms of crustal stress and AE earthquake precursors. Nat Hazard Earth Syst Sci
2010;10:319–37.[47] Carpinteri A, Lacidogna G. Damage diagnosis in concrete and masonry structures by acoustic emission technique. J Facta Universitatis, Series: Mech
Autom Control Robotics 2003;3(13):755–64.[48] Lacidogna G, Cutugno P, Niccolini G, Invernizzi S, Carpinteri A. Correlation between earthquakes and AE monitoring of historical buildings in seismic
areas. Appl Sci 2015;5:1683–98. doi: http://dx.doi.org/10.3390/app5041683.[49] Carpinteri A, Lacidogna G, Manuello A, Niccolini A, Schiavi A, Agosto A. Mechanical and electromagnetic emissions related to stress-induced cracks. Exp
Tech 2010;36(3):53–64.[50] Frid V, Rabinovitch A, Bahat D. Fracture induced electromagnetic radiation. J Phys D 2003;36:1620–8.[51] Lacidogna G, Carpinteri A, Manuello A, Durin G, Schiavi A, Niccolini G, et al. Acoustic and electromagnetic emissions as precursor phenomena in failure
processes. Strain 2010;47(2):144–52.[52] Miroshnichenko M, Kuksenko V. Study of electromagnetic pulses in initiation of cracks in solid dielectrics. Soviet Phys-Solid State 1980;22:895–6.[53] O’Keefe SG, Thiel DV. A mechanism for the production of electromagnetic radiation during fracture of brittle materials. Phys Earth Planet Int
1995;89:127–35.[54] Warwick JW, Stoker C, Meyer TR. Radio emission associated with rock fracture: possible application to the great Chilean earthquake of May 22, 1960. J
Geophys Res 1982;87:2851–9.[55] Biagi P. Seismic effects on LF radiowaves. In: Hayakawa M, editor. Atmospheric and ionospheric electromagnetic phenomena associated with
earthquakes. Tokyo: Terrapub; 1999. p. 535–42.[56] Hayakawa M, Fujinawa Y, editors. Electromagnetic Phenomena Related to Earthquake Prediction. Tokyo: Terrapub; 1994. 677pp.[57] Lighthill S, editor. A critical review of VAN. Earthquake prediction from seismic electric signals. Singapore: World Scientific Publishing Co.; 1996.
276pp.[58] Nagao T, Enomoto Y, Fujinawa Y, Hata M, Hayakawa M, Huang Q, et al. Electromagnetic anomalies associated with 1995 Kobe earthquake. J Geodyn
2002;33(4–5):349–59.[59] Telesca L, Cuomo V, Lapenna V. A new approach to investigate the correlation between geoelectrical time fluctuations and earthquakes in a seismic
area of southern Italy. Geophys Res Lett 2001;28:4375–8.
250 A. Carpinteri, O. Borla / Engineering Fracture Mechanics 177 (2017) 239–250
[60] Varotsos P, Lazaridou M, Eftaxias K, Antonopoulos G, Makris J, Kopanas J. Short-term earthquake prediction in Greece by seismic electric signals. In:Ligthhill Sir J, editor. A critical review of VAN: earthquake prediction from seismic electric signals. Singapore: World Scientific Publishing Co.; 1996. p.29–76.
[61] Eftaxias K, Athanasopoulou L, Balasis G, Kalimeri M, Nikolopoulos S, Contoyiannis Y, et al. Unfolding the procedure of characterizing recorded ultra lowfrequency, kHZ and MHz electromagnetic anomalies prior to the L’Aquila earthquake as pre-seismic ones - Part 1. Nat Hazard Earth Syst Sci2009;9:1953–71.
[62] Eftaxias K. Footprints of nonextensive Tsallis statistics, selfaffinity and universality in the preparation of the L’Aquila earthquake hidden in a pre-seismic EM emission. Physica A 2009;389:133–40.
[63] Pfotzer G, Regener E. Vertical intensity of cosmic rays by threefold coincidence in the stratosphere. Nature 1935;136:718–9.[64] Mishev A, Bouklijski A, Visca L, Borla O, Stamenov J, Zanini A. Recent cosmic ray studies with lead free neutron monitor at basic environmental
observatory moussala. Sun Geosphere 2008;3(1):26–8.[65] Zanini A, Storini M, Visca L, Durisi EAM, Fasolo F, Perosino M, et al. Neutron spectrometry at high mountain observatories. J Atmos Sol-Terr Phys
2005;67:755–62.[66] Zanini A, Storini M, Saavedra O. Cosmic rays at high mountain observatories. Adv Space Res 2009;44(10):1160–5.[67] Information on Jungfraujoch Neutron Monitor (18igy). Available at http://cr0.izmiran.rssi.ru/jun1/main.htm, last accessed March 2013.[68] Information on national geophysical data center/world data center (NGDC/WDC) Significant Earthquake Database, Boulder, CO, USA. Available: http://
www.ngdc.noaa.gov/nndc/struts/form?t=101650&s=1&d=1 [last accessed April 2012].[69] Allen R. Seconds before the big one, Seismology, ScientificAmerican.com; 2011. p. 54–9.[70] ISIDe Working Group (INGV, 2010). Italian seismological instrumental and parametric database: http://iside.rm.ingv.it.