POLITECNICO DI TORINO Repository ISTITUZIONALE - CORE
11
04 August 2020 POLITECNICO DI TORINO Repository ISTITUZIONALE Multi-site European framework for real-time co-simulation of power systems / Stevic, Marija; Estebsari, Abouzar; Vogel, Steffen; Pons, Enrico; Bompard, ETTORE FRANCESCO; Masera, Marcelo; Monti, Antonello. - In: IET GENERATION, TRANSMISSION & DISTRIBUTION. - ISSN 1751-8687. - STAMPA. - 11:17(2017), pp. 4126-4135. Original Multi-site European framework for real-time co-simulation of power systems Publisher: Published DOI:10.1049/iet-gtd.2016.1576 Terms of use: openAccess Publisher copyright (Article begins on next page) This article is made available under terms and conditions as specified in the corresponding bibliographic description in the repository Availability: This version is available at: 11583/2679359 since: 2018-05-21T18:01:41Z IET
-
Upload
khangminh22 -
Category
Documents
-
view
1 -
download
0
Transcript of POLITECNICO DI TORINO Repository ISTITUZIONALE - CORE

04 August 2020
POLITECNICO DI TORINORepository ISTITUZIONALE
Multi-site European framework for real-time co-simulation of power systems / Stevic, Marija; Estebsari, Abouzar; Vogel,Steffen; Pons, Enrico; Bompard, ETTORE FRANCESCO; Masera, Marcelo; Monti, Antonello. - In: IET GENERATION,TRANSMISSION & DISTRIBUTION. - ISSN 1751-8687. - STAMPA. - 11:17(2017), pp. 4126-4135.
Original
Multi-site European framework for real-time co-simulation of power systems
Publisher:
PublishedDOI:10.1049/iet-gtd.2016.1576
Terms of use:openAccess
Publisher copyright
(Article begins on next page)
This article is made available under terms and conditions as specified in the corresponding bibliographic description inthe repository
Availability:This version is available at: 11583/2679359 since: 2018-05-21T18:01:41Z
IET
IET Generation, Transmission & Distribution
Research Article
Multi-site European framework for real-timeco-simulation of power systems
ISSN 1751-8687Received on 30th September 2016Revised 24th March 2017Accepted on 10th April 2017doi: 10.1049/iet-gtd.2016.1576www.ietdl.org
Marija Stevic1 , Abouzar Estebsari2, Steffen Vogel1, Enrico Pons2, Ettore Bompard2, Marcelo Masera3,Antonello Monti11Institute for Automation of Complex Power Systems, RWTH Aachen University, Mathieustrasse 10, Aachen, Germany2Department of Energy, Politecnico di Torino, Corso Duca degli Abruzzi 24, Turin, Italy3Institute for Energy and Transport, European Commission Joint Research Centre, Westerduinweg 3, Petten, Netherlands
E-mail: [email protected]
Abstract: The framework for virtual integration of laboratories enables co-simulation and joint experiments that includehardware and software resources hosted at geographically distributed laboratories. The underlying concept of such frameworkis geographically distributed real-time (RT) co-simulation. To this end, digital RT simulators are interfaced over long distancesvia shared communication network such as the Internet. This study proposes an architecture for a modular frameworksupporting virtual integration of laboratories that enable flexible integration of digital RT simulators across Europe. In addition,the framework includes an interface that enables access for third parties via a web browser. A co-simulation interface algorithmadopted in this study is based on representation of interface quantities in form of dynamic phasors. Time delay between RTdigital simulators is compensated by means of phase shift that enables simulation fidelity for slow transients. The proposedarchitecture is realised for the integration of laboratories across Europe that are located at RWTH Aachen University inGermany, Politecnico di Torino in Italy and at European Commission Joint Research Centres in Petten, Netherland and in Ispra,Italy. The framework for virtual integration of laboratories presented in this study is applied for co-simulation of transmission anddistribution systems.
1 IntroductionThe changing paradigm of power systems imposes emergingchallenges for power system design, planning and operation [1].The paradigm shift of power systems has been reflected onmodelling and simulation methods used for power system analysisas well. Simulation frameworks are urged to continuously followgrowing demand for large-scale system simulation, simulation offast system dynamics and high-fidelity models. There is a tendencytoward performing joint simulation of systems that have beenstudied separately in the past. For instance, a joint simulationincluding detailed models of transmission and distribution systemsis performed nowadays to analyse interdependencies andunforeseen interactions between the two systems, particularly incase of scenarios with high level of penetration of distributedgeneration (DG) [2]. In addition, envisioned complexity of futurepower systems requires simulation frameworks that enableinterdisciplinary and multi-domain studies. Multi-physicssimulation approach is utilised for the holistic analysis of citydistrict energy systems that represent hybrid energy systems [3].Studies on architectures and concepts in smart grids require asimulation framework that enables joint analysis of power systemand information and communication technology system.
The requirements described above have motivated developmentof innovative solutions for simulation frameworks utilised forpower system analysis [4]. Various co-simulation and hybridsimulation frameworks have been proposed based on customsolutions or on integration of existing tools. Advanced technologiessuch as high-performance computing, and specialised hardwaresuch as field-programmable gate array are more often used forsimulation of power systems compared with traditional approachesin the past.
Digital real-time simulation (DRTS) and (power) hardware-in-the-loop (PHIL) testing have rapidly increasing roles in powersystem research. Thus, they are urged to follow requirements forlarge-scale and multi-domain studies ensuring high-fidelityframeworks. Dedicated DRTS setups and specialised test bencheshave been deployed at various laboratories to support and
accelerate the research on on-going transition of power systems.One innovative trend in DRTS and (P)HIL testing, which is studiedin this work, is virtual integration of laboratory setups across longgeographical distances. This concept relies on the geographicallydistributed RTS approach and aims at integrating geographicallydistributed laboratories to perform RT co-simulation and jointexperiments.
The rest of this paper is organised as follows. Section 2introduces the concept of virtual integration of laboratories acrosslong geographical distances. It includes an overview of the mainadvantages and challenges as well as related literature review. Anarchitecture of a framework for virtual integration of laboratories isproposed in Section 3. The architecture is developed for theintegration of laboratories across Europe, located at RWTH AachenUniversity in Germany, Politecnico di Torino (PoliTO) in Italy andat European Commission Joint Research Centres in Petten,Netherland and in Ispra, Italy. The co-simulation interfacealgorithm (IA) that is adopted in this work is described in Section4. An application of the framework for virtual integration oflaboratories for simulation of transmission and distribution systemsis included in Section 5 with obtained simulation results. Section 6concludes this paper highlighting the main contributions followedby an outlook on future research.
2 Geographically distributed RTS of powersystemsThe aim of DRTS and (P)HIL is to enable design and testing ofnew concepts or devices in an environment that is close to reality.Distributed computing with multiple units operating in parallel is acommon feature of DRTS in order to increase computingcapabilities and achieve scalability [5]. In case multiple units areused for simulation of a model, the model is decoupled intomultiple subsystems and conservation of energy at interfaces mustbe ensured as subsystems are naturally coupled in the originalsystem. This is considered a challenge even for locally distributed
IET Gener. Transm. Distrib.This is an open access article published by the IET under the Creative Commons Attribution-NonCommercial-NoDerivs License(http://creativecommons.org/licenses/by-nc-nd/3.0/)
1

DRTS and advanced synchronisation, data exchange and delaycompensation techniques are used.
Geographically distributed DRTS refers to the concept ofintegrating DRTS systems located at different geographicallocations for RT co-simulation. The challenge of ensuringconservation of energy between subsystems increases with longergeographical distances. Methods for delay compensation used forlocally distributed DRTS typically cannot be considered forapplications in geographically distributed DRTS. For instance, amethod for decoupling based on travelling wave property of atransmission line would require a line of a length of ∼3000 km fordelay compensation of 10 ms. In addition to the problem of largedelays, in an arbitrary case it is unrealistic to assume existence of adedicated communication medium that would provide hard RTcharacteristics. Thus, data exchange between subsystems ingeographically distributed DRTS is characterised by time-varyingdelay, packet loss, packet reordering and other non-deterministiccharacteristics of a shared communication network such as theInternet.
Capabilities and applications of DRTS and (P)HIL concepts canbe significantly enhanced in case of a geographically distributedframework for DRTS. Geographically distributed DRTSenvironment allows for sharing of computational resources,software and hardware assets and specific expertise available atdifferent laboratories. This is particularly beneficial for studyingmodern power systems that are more interconnected andinterdependent compared with traditional systems [6]. An extremefuture scenario in this context is a globally interconnected grid,known as global grid [7], which includes a long high-voltage (HV)direct current line between Europe and the USA. Interconnectedand interdependent systems must be designed and tested in anintegrated environment to fully assess their operation andunprecedented interactions. The paradigm shift of power systemstoward a sustainable, reliable and affordable system of the futurehas been recognised as a shared challenge that requires theinvolvement and alignment of academics, industries, utilities andother factors. Many initiatives address this requirement and aim atachieving a tight collaboration between different factors. In thisrespect, a geographically distributed DRTS environment provides ashared virtually coupled infrastructure that allows each group towork locally within its facilities but still collaborate and conductexperiments jointly, without potential confidentiality issues [8].The described flexibility is considered as an important advantageof geographically distributed DRTS, in addition to sharingresources for large-scale and multi-domain experiments that wouldbe difficult to achieve otherwise.
2.1 Summary of related work
One of the earliest realisations of a virtual environment for remotetesting of devices in power system field has been reported in [9].The implementation of the virtual environment was based on thevirtual test bed (VTB) and a LabVIEW virtual instrument.Experiments were pursued for remote model validation and designverification with physical devices located at the PolytechnicUniversity of Milan, Italy, and VTB-based virtual environmenthosted at the University of South Carolina, USA. VTB simulationplatform was further extended by a field programmable gate array-based module for coordination of simulation clocks of simulatorshosted at dispersed geographical locations [10]. The module wasbased on a common time signal derived from the global positioningsystem.
Further efforts toward geographically distributed simulationhave been focused on development of IAs for system decoupling[11]. Multiple University Research Initiative, supported by theDepartment of Defense, US, investigated the concept of virtualintegration of laboratories over long distances on a larger scalewith five universities involved. The work was mainly focused onall-electric ship studies. Within this context, the VTB environmentwas utilised for implementation and validation of IAs [12].
Geographically distributed simulation as an approach to multi-domain simulation was pursued for thermo-electric co-simulationof an all-electric ship [13]. Within this context, two different off-
the-shelf simulators, RT digital simulator (RTDS) and OPAL-RTwere interconnected over the distance of 3500 km.
A test bed that integrates a PHIL platform for testing of solarinverters with a large-scale distribution system simulationrepresents an example of a hybrid virtual interconnection ofhardware and software assets over the Internet [14]. GridLAB-D,an open-source distribution modelling platform, is hosted at thePacific Northwest National Laboratory, while PHIL setup islocated at the National Renewable Energy Laboratory, which ismore than 1600 km away. The two facilities exchange data over theInternet based on a custom JavaScript Object Notation (JSON)protocol with user datagram protocol (UDP) as a transport layer.
An importance of a holistic approach to design, analysis, testingand evaluation of smart grids has been described in [15]. Advancedresearch infrastructures, as well as their interconnections toestablish laboratory clusters, play a significant role in that respect.As the role of lab-based testing increases, standardised validationprocedures and benchmark criteria become more substantial toenable systematic and integrated studies of smart grids. However,flexibility and scalability of software-based simulation methods areadvantageous during the initial stages of the smart grid designprocess. To provide better integration and smooth transitionbetween different design stages, from basic design towarddeployment, a comprehensive smart grid co-simulation frameworkmosaik has been coupled with OPAL-RT DRTS [16]. Furthermore,mosaik enables integration of actual devices located at remotelaboratory. Therefore, framework allows for software and hardwareintegration that can be hosted at geographically dispersed locations.
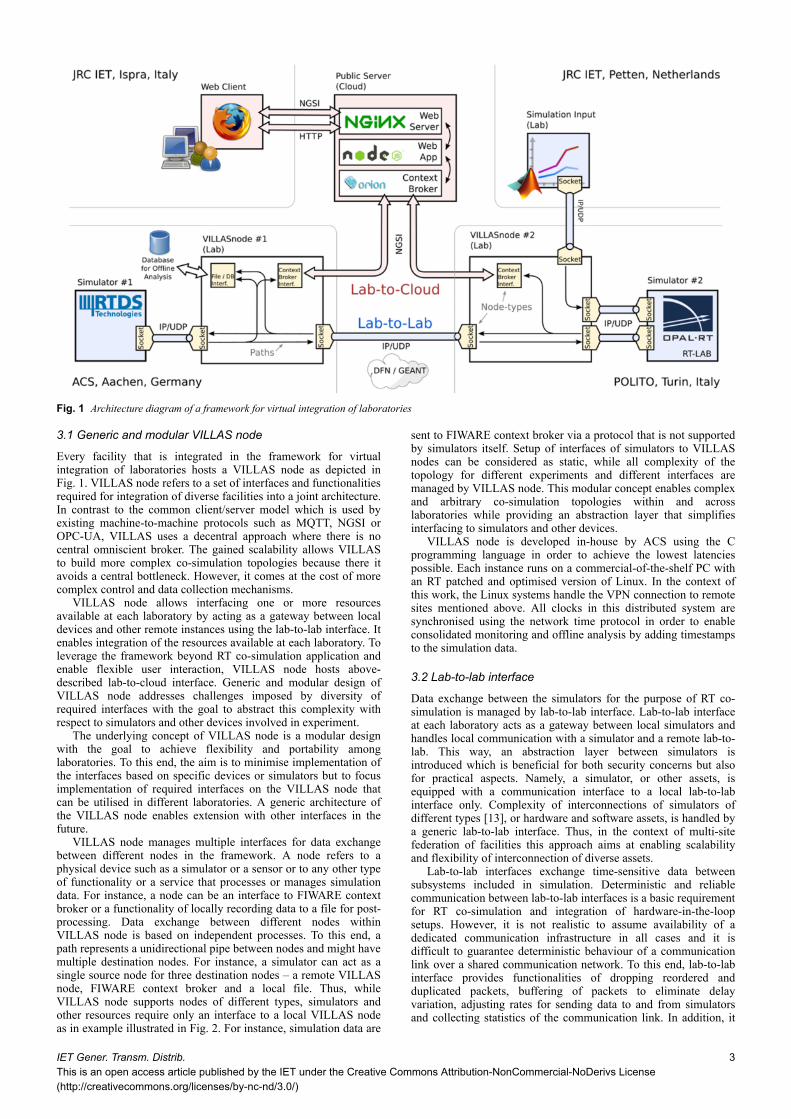
3 Architecture of a framework for virtualintegration of laboratoriesIn this work, we propose a framework for virtual integration oflaboratories across Europe that demonstrates feasibility of suchapproach. A conceptual architecture diagram of the framework forfederation of laboratories is illustrated in Fig. 1 and referred to asvirtually interconnected laboratories for large systems simulation/emulation (VILLAS). As it is depicted in Fig. 1, VILLASarchitecture enables integration of digital RT simulators, RTDS andOPAL-RT, located at dispersed geographical locations. RTDS ishosted at the facility of the Institute for Automation of ComplexPower Systems (ACSs), RWTH Aachen University, Germanywhile OPAL-RT is located at the laboratory of Energy Department(DENERG) at PoliTO, Italy. Furthermore, two facilities of theInstitute for Energy and Transport, Joint Research Centre (JRC-IET) of the European Commission, located at Petten, Netherlandsand Ispra, Italy, are integrated. As illustrated in Fig. 1, JRC-IETfacilities demonstrate interconnection of facilities beyondintegration of RTS resources. Namely, JRC-IET in Petten providesan online input to the simulation scenario. The JRC-IET facility inIspra provides a consolidated online monitoring of the simulationscenario based on data sets from all facilities being involved in thearchitecture. The laboratories are interconnected via DFN andGÉANT networks which, as part of the public Internet, are nationaland pan-European data networks that interconnect nationalresearch and education institutions. On top of these networks, avirtual private network (VPN) between facilities that are directlyinvolved in the simulation scenario is established while a publicserver acts as a gateway to provide monitoring access from theInternet.
The following sections describe required interfaces for theframework that are laboratory-to-laboratory (lab-to-lab) andlaboratory-to-cloud (lab-to-cloud) interfaces. A generic andmodular design of the main component of the framework thatmanages lab-to-lab and lab-to-cloud interfaces at each laboratory,referred to as VILLAS node in Fig. 1, is described below in moredetails. In addition, results of loopback communication tests fordata exchange between lab-to-lab interfaces are analysed toempirically characterise the performance of the communicationlink used for RT co-simulation.
2 IET Gener. Transm. Distrib.This is an open access article published by the IET under the Creative Commons Attribution-NonCommercial-NoDerivs License
(http://creativecommons.org/licenses/by-nc-nd/3.0/)
3.1 Generic and modular VILLAS node
Every facility that is integrated in the framework for virtualintegration of laboratories hosts a VILLAS node as depicted inFig. 1. VILLAS node refers to a set of interfaces and functionalitiesrequired for integration of diverse facilities into a joint architecture.In contrast to the common client/server model which is used byexisting machine-to-machine protocols such as MQTT, NGSI orOPC-UA, VILLAS uses a decentral approach where there is nocentral omniscient broker. The gained scalability allows VILLASto build more complex co-simulation topologies because there itavoids a central bottleneck. However, it comes at the cost of morecomplex control and data collection mechanisms.
VILLAS node allows interfacing one or more resourcesavailable at each laboratory by acting as a gateway between localdevices and other remote instances using the lab-to-lab interface. Itenables integration of the resources available at each laboratory. Toleverage the framework beyond RT co-simulation application andenable flexible user interaction, VILLAS node hosts above-described lab-to-cloud interface. Generic and modular design ofVILLAS node addresses challenges imposed by diversity ofrequired interfaces with the goal to abstract this complexity withrespect to simulators and other devices involved in experiment.
The underlying concept of VILLAS node is a modular designwith the goal to achieve flexibility and portability amonglaboratories. To this end, the aim is to minimise implementation ofthe interfaces based on specific devices or simulators but to focusimplementation of required interfaces on the VILLAS node thatcan be utilised in different laboratories. A generic architecture ofthe VILLAS node enables extension with other interfaces in thefuture.
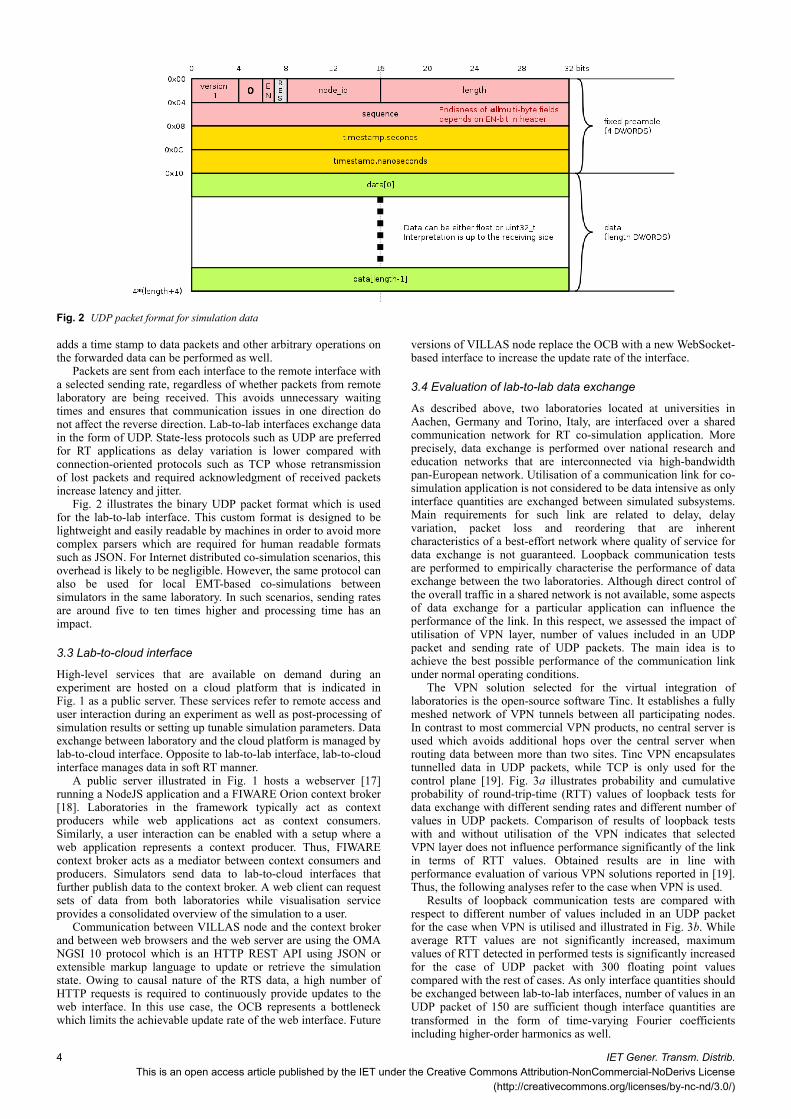
VILLAS node manages multiple interfaces for data exchangebetween different nodes in the framework. A node refers to aphysical device such as a simulator or a sensor or to any other typeof functionality or a service that processes or manages simulationdata. For instance, a node can be an interface to FIWARE contextbroker or a functionality of locally recording data to a file for post-processing. Data exchange between different nodes withinVILLAS node is based on independent processes. To this end, apath represents a unidirectional pipe between nodes and might havemultiple destination nodes. For instance, a simulator can act as asingle source node for three destination nodes – a remote VILLASnode, FIWARE context broker and a local file. Thus, whileVILLAS node supports nodes of different types, simulators andother resources require only an interface to a local VILLAS nodeas in example illustrated in Fig. 2. For instance, simulation data are
sent to FIWARE context broker via a protocol that is not supportedby simulators itself. Setup of interfaces of simulators to VILLASnodes can be considered as static, while all complexity of thetopology for different experiments and different interfaces aremanaged by VILLAS node. This modular concept enables complexand arbitrary co-simulation topologies within and acrosslaboratories while providing an abstraction layer that simplifiesinterfacing to simulators and other devices.
VILLAS node is developed in-house by ACS using the Cprogramming language in order to achieve the lowest latenciespossible. Each instance runs on a commercial-of-the-shelf PC withan RT patched and optimised version of Linux. In the context ofthis work, the Linux systems handle the VPN connection to remotesites mentioned above. All clocks in this distributed system aresynchronised using the network time protocol in order to enableconsolidated monitoring and offline analysis by adding timestampsto the simulation data.
3.2 Lab-to-lab interface
Data exchange between the simulators for the purpose of RT co-simulation is managed by lab-to-lab interface. Lab-to-lab interfaceat each laboratory acts as a gateway between local simulators andhandles local communication with a simulator and a remote lab-to-lab. This way, an abstraction layer between simulators isintroduced which is beneficial for both security concerns but alsofor practical aspects. Namely, a simulator, or other assets, isequipped with a communication interface to a local lab-to-labinterface only. Complexity of interconnections of simulators ofdifferent types [13], or hardware and software assets, is handled bya generic lab-to-lab interface. Thus, in the context of multi-sitefederation of facilities this approach aims at enabling scalabilityand flexibility of interconnection of diverse assets.
Lab-to-lab interfaces exchange time-sensitive data betweensubsystems included in simulation. Deterministic and reliablecommunication between lab-to-lab interfaces is a basic requirementfor RT co-simulation and integration of hardware-in-the-loopsetups. However, it is not realistic to assume availability of adedicated communication infrastructure in all cases and it isdifficult to guarantee deterministic behaviour of a communicationlink over a shared communication network. To this end, lab-to-labinterface provides functionalities of dropping reordered andduplicated packets, buffering of packets to eliminate delayvariation, adjusting rates for sending data to and from simulatorsand collecting statistics of the communication link. In addition, it
Fig. 1 Architecture diagram of a framework for virtual integration of laboratories
IET Gener. Transm. Distrib.This is an open access article published by the IET under the Creative Commons Attribution-NonCommercial-NoDerivs License(http://creativecommons.org/licenses/by-nc-nd/3.0/)
3
adds a time stamp to data packets and other arbitrary operations onthe forwarded data can be performed as well.
Packets are sent from each interface to the remote interface witha selected sending rate, regardless of whether packets from remotelaboratory are being received. This avoids unnecessary waitingtimes and ensures that communication issues in one direction donot affect the reverse direction. Lab-to-lab interfaces exchange datain the form of UDP. State-less protocols such as UDP are preferredfor RT applications as delay variation is lower compared withconnection-oriented protocols such as TCP whose retransmissionof lost packets and required acknowledgment of received packetsincrease latency and jitter.
Fig. 2 illustrates the binary UDP packet format which is usedfor the lab-to-lab interface. This custom format is designed to belightweight and easily readable by machines in order to avoid morecomplex parsers which are required for human readable formatssuch as JSON. For Internet distributed co-simulation scenarios, thisoverhead is likely to be negligible. However, the same protocol canalso be used for local EMT-based co-simulations betweensimulators in the same laboratory. In such scenarios, sending ratesare around five to ten times higher and processing time has animpact.
3.3 Lab-to-cloud interface
High-level services that are available on demand during anexperiment are hosted on a cloud platform that is indicated inFig. 1 as a public server. These services refer to remote access anduser interaction during an experiment as well as post-processing ofsimulation results or setting up tunable simulation parameters. Dataexchange between laboratory and the cloud platform is managed bylab-to-cloud interface. Opposite to lab-to-lab interface, lab-to-cloudinterface manages data in soft RT manner.
A public server illustrated in Fig. 1 hosts a webserver [17]running a NodeJS application and a FIWARE Orion context broker[18]. Laboratories in the framework typically act as contextproducers while web applications act as context consumers.Similarly, a user interaction can be enabled with a setup where aweb application represents a context producer. Thus, FIWAREcontext broker acts as a mediator between context consumers andproducers. Simulators send data to lab-to-cloud interfaces thatfurther publish data to the context broker. A web client can requestsets of data from both laboratories while visualisation serviceprovides a consolidated overview of the simulation to a user.
Communication between VILLAS node and the context brokerand between web browsers and the web server are using the OMANGSI 10 protocol which is an HTTP REST API using JSON orextensible markup language to update or retrieve the simulationstate. Owing to causal nature of the RTS data, a high number ofHTTP requests is required to continuously provide updates to theweb interface. In this use case, the OCB represents a bottleneckwhich limits the achievable update rate of the web interface. Future
versions of VILLAS node replace the OCB with a new WebSocket-based interface to increase the update rate of the interface.
3.4 Evaluation of lab-to-lab data exchange
As described above, two laboratories located at universities inAachen, Germany and Torino, Italy, are interfaced over a sharedcommunication network for RT co-simulation application. Moreprecisely, data exchange is performed over national research andeducation networks that are interconnected via high-bandwidthpan-European network. Utilisation of a communication link for co-simulation application is not considered to be data intensive as onlyinterface quantities are exchanged between simulated subsystems.Main requirements for such link are related to delay, delayvariation, packet loss and reordering that are inherentcharacteristics of a best-effort network where quality of service fordata exchange is not guaranteed. Loopback communication testsare performed to empirically characterise the performance of dataexchange between the two laboratories. Although direct control ofthe overall traffic in a shared network is not available, some aspectsof data exchange for a particular application can influence theperformance of the link. In this respect, we assessed the impact ofutilisation of VPN layer, number of values included in an UDPpacket and sending rate of UDP packets. The main idea is toachieve the best possible performance of the communication linkunder normal operating conditions.
The VPN solution selected for the virtual integration oflaboratories is the open-source software Tinc. It establishes a fullymeshed network of VPN tunnels between all participating nodes.In contrast to most commercial VPN products, no central server isused which avoids additional hops over the central server whenrouting data between more than two sites. Tinc VPN encapsulatestunnelled data in UDP packets, while TCP is only used for thecontrol plane [19]. Fig. 3a illustrates probability and cumulativeprobability of round-trip-time (RTT) values of loopback tests fordata exchange with different sending rates and different number ofvalues in UDP packets. Comparison of results of loopback testswith and without utilisation of the VPN indicates that selectedVPN layer does not influence performance significantly of the linkin terms of RTT values. Obtained results are in line withperformance evaluation of various VPN solutions reported in [19].Thus, the following analyses refer to the case when VPN is used.
Results of loopback communication tests are compared withrespect to different number of values included in an UDP packetfor the case when VPN is utilised and illustrated in Fig. 3b. Whileaverage RTT values are not significantly increased, maximumvalues of RTT detected in performed tests is significantly increasedfor the case of UDP packet with 300 floating point valuescompared with the rest of cases. As only interface quantities shouldbe exchanged between lab-to-lab interfaces, number of values in anUDP packet of 150 are sufficient though interface quantities aretransformed in the form of time-varying Fourier coefficientsincluding higher-order harmonics as well.
Fig. 2 UDP packet format for simulation data
4 IET Gener. Transm. Distrib.This is an open access article published by the IET under the Creative Commons Attribution-NonCommercial-NoDerivs License
(http://creativecommons.org/licenses/by-nc-nd/3.0/)

Different sending rates of UDP packets between twolaboratories are assessed based on results of packet loss ofloopback tests with different number of values included in UDPpackets. Negligible packet loss is detected for sending rate lowerthan 2000 p/s. Typical simulation time step of 50 μs is used inelectromagnetic transient simulation performed by simulatorsutilised in this work. However, sending rate of 2000 p/s issufficient as estimation of time-varying Fourier coefficients ofinterface quantities includes time averaging and sending an updateevery time step might be redundant.
Empirical characterisation of the communication link betweentwo laboratories indicate that, under normal conditions, selectedVPN solution can be used for sending UDP packets with 150floating point values with sending rate of 2000 p/s. Describedsettings do not significantly jeopardise performance of theavailable communication link. The following section introducesco-simulation IA and shows that these settings are sufficient for theapplication studied in this paper.
4 Co-simulation IA for geographically distributedRTS
The co-simulation IA adopted here is based on one of the mostcommonly employed IA for PHIL interfaces, which is the idealtransformer model (ITM) [20]. ITM IA is based on controlledcurrent and voltage sources that impose in the local subsystem thebehaviour of the remote subsystem. Therefore, ITM IA requirescurrent and voltage interface quantities to be exchanged betweenthe simulators. Simulators perform electromagnetic transientsimulation where voltage and current quantities are represented inthe form of time-domain (TD) waveforms. However, TDwaveforms are significantly deteriorated when exchanged betweensimulators over non-deterministic communication networkcharacterised by large delays with respect to simulation time step.To this end, voltage and current interface quantities are transformedin the form of time-varying Fourier coefficients, known as dynamicphasors (DPs) [21], before being sent to the remote simulator. Twodifferent domains are utilised in the co-simulation setup – TDwithin simulators, and DP domain for co-simulation IA and dataexchange. A hybrid approach to the design of co-simulation IA isillustrated in Fig. 4.
The concept of DPs extends the conventional phasorrepresentation of system quantities to include non-stationarysystem conditions. This concept assumes that a TD waveform x t
Fig. 3 RTT results of loopback communication tests between two laboratories for data exchange of UPD packets(a) Sending rates: 100, 200, 300, 400, 500, 1000, 1500, 2000, 2500 and 3000 p/s with different number of values: 20, 40, 60, 80, 100, 150, 200, 250 and 300, (b) Sending rates: 100,200, 300, 400, 500, 1000, 1500, 2000, 2500 and 3000 p/s
Fig. 4 Co-simulation IA
IET Gener. Transm. Distrib.This is an open access article published by the IET under the Creative Commons Attribution-NonCommercial-NoDerivs License(http://creativecommons.org/licenses/by-nc-nd/3.0/)
5

can be represented on the interval t ϵ(τ − T , τ] based on thecomplex Fourier coefficients Xk(τ)
x t = ∑k = − ∞
∞Xk(τ)ejkωt (1)
where ω = 2π /T , T represents fundamental system period. We referto time-varying Fourier coefficients Xk(τ) as DPs. The mainapplication of the DPs is in the context of synchronised phasormeasurements that are applied in power system monitoring,protection and control [22]. Furthermore, methods for modellingand simulation of power systems based on the DP approach havebeen applied [21]. Advances in DP-based simulation havemotivated research in the context of hybrid simulation where asubsystem is simulated by means of TD electromagnetic transientsimulation while another subsystem is simulated based on DPrepresentation [23].
This work utilises DPs for co-simulation IA, while bothsubsystems perform electromagnetic transient simulation based onTD waveforms. As illustrated in Fig. 4. DP is estimated based onthe TD waveform of interface quantity and then sent to the remotedigital RT simulator. Estimation of DPs is based here on thefollowing discrete-time calculation that is at time instant t = nTsgiven by:
Xk n = 1N ∑
m = n − N − 1
nx(m)e− jk(2π /N)m (2)
where fundamental period of the system is given by T = NTs. Notethat the estimation of the DP includes absolute time t = nTs thatenables synchronised DPs obtained from remote simulatorsassuming that time clocks of the two simulators are synchronisedto the global time.
The advantage of co-simulation IA based on DPs is theirrepresentation that naturally allows for compensation of time delayby means of phase shift. This approach was studied for time-delaycompensation in PHIL [24]. Phase-shift-based compensation ofsignificantly larger time delay that typically exists ingeographically distributed RTS was evaluated in [25]. Aninteresting result of this paper was comparison of stability regionswith respect to time delay of co-simulation IA based on TDwaveforms and DPs. It was demonstrated that co-simulation IAwith DPs provides larger stability region in some cases.
Furthermore, the study demonstrated improved simulation fidelityfor co-simulation interface based on DPs.
In this work, estimated DPs are sent to the remote simulator,which receives data with time delay Δt that is compensated bymeans of the phase shift. The phase shift requires the knowledge oftime delay of a data packet which can be determined only after thepacket has been received. All packets that are exchanged betweensimulators are time stamped which provides possibility to calculatethe time delay at the receiving end of the data exchange channel.
Signal reconstruction that includes delay compensation basedon the phase shift is defined based on the following:
xp n + dn = ∑k ∈ K
Xk n e+ jk(2π /N)ne+ jk(2π /N)dn
phase shift(3)
where K = [ − (N /2), (N /2) − 1] if N is even andK = [ − (N − 1/2), (N − 1/2)] if N is odd with respect to Ndefined in (2). Time delay of received DPs with respect to the timeinstant t = nTs when the values of DPs were sent is dn. Thisparameter is time varying and it is not deterministic but the methodto reconstruct a sample of the TD waveform remains deterministic.This is advantageous for compensation of time-varying delays butalso of packet losses. In case a packet loss has encountered, theprevious values of DPs will be used with time delay for phase shiftincreased by Ts. Timing diagram of the described co-simulation IAis illustrated in Fig. 5.
DPs are known to provide an adequate representation of thesignal based on a few coefficients which is one of the mainmotivations for their application for simulation of power systems.The co-simulation IA is implemented in this work withinsimulators and it includes a subset of DPs K = {0, 1, 2, 3}. Asimple empirical case study is based on a reference signal that hasbeen transferred through the co-simulation IA withoutcharacteristics of a communication channel. Therefore, the error iscaused only due to DP estimation and signal reconstruction. Theerror of a reconstructed TD waveform with respect to the referencesignal in cases of slow and fast transients of the reference signalwas analysed. In particular, we studied steady state, amplitudemodulation and signal with ramping up amplitude. DPrepresentation provides an adequate accuracy in case of slowtransients of TD waveform.
Fig. 6 illustrates steady-state condition of the reference signalfollowed by a slow ramp transient of a magnitude. As expected, ifall components of DPs are included in the co-simulation IA the
Fig. 5 Timing diagram of the co-simulation framework (TD – time domain, DP – dynamic phasor domain)
6 IET Gener. Transm. Distrib.This is an open access article published by the IET under the Creative Commons Attribution-NonCommercial-NoDerivs License
(http://creativecommons.org/licenses/by-nc-nd/3.0/)

reconstructed signal perfectly matches with the reference signaland error is equal to zero. If limited number of components isincluded, the error can be observed. The error can be neglected incase of slow transients. Fig. 7 illustrates error caused by amplitudemodulation transient in the reference signal. In this case, it isimportant to emphasise that the frequency of the reference signal isdifferent from fundamental frequency. The role of number ofcomponents of DPs to reconstruct the reference signal is importantin the context of matching frequency of reconstructed signal to thereference signal. As it can be seen in the enlarged section of thisfigure, larger number of DP components reduces the shift of thereconstructed signal.
The application of the described co-simulation IA in the contextof communication delay is illustrated in Fig. 8. The referencesignal has been transferred through communication medium withconstant and time-varying delay. The waveform that has beentransferred based on the proposed IA with DPs is not affected bytime shift in the remote subsystem. Otherwise, in case when DPsbased interface is not applied, TD waveform is shifted in time withrespect to the reference signal due to time delay. Furthermore,significant improvement can be observed in case of time-varyingdelay. Time-varying delay does not significantly deteriorate thereceived signal when DPs based IA is applied. If DP-basedinterface is not applied, delay variations introduce dynamics thatdoes not exist in the reference signal.
5 Experiment of a framework for virtuallyinterconnected laboratories
In this section, we present an example of a simulation case usingthe demo architecture. The simulation goal is to assess howdifferent prosumers behaviour in the distribution system wouldaffect the electricity grid performance at both transmission anddistribution levels [26].
Prosumers behaviour depends on many parameters from socialfactors to weather conditions but can eventually be translated tosome consumption/production time-variant profiles from the gridpoint of view, and can consequently affect the grid operationalbehaviour.
5.1 Simulation scenario
The main objective of the designed scenario is to show how such adistributed simulation platform satisfies the emerging needs oflarge-scale multi-level power system simulations throughintegrating different geographically distant modules/models. Thisscenario relies on a distribution system where high amounts of DGare injected into the grid. The DGs in our case study arephotovoltaic (PV) generators in an urban medium-voltage (MV)network. During a sunny summer day, when a considerable portionof the distribution grid consumption is being supplied by local PVgeneration, a drop of generation due to sudden weather change(from sunny to cloudy) coincides with a rapid increase ofconsumption in the daily load profile, when a large number ofelectric vehicles (EVs) are plugged in for charging. Consequentvoltage drop in the distribution system and frequency perturbationsin the transmission system can be monitored while keeping all
Fig. 6 Comparison of reference signal and signal transferred through co-simulation IA with different numbers of DP components
Fig. 7 Comparison of reference signal and signal transferred through co-simulation IA with different numbers of DP components
IET Gener. Transm. Distrib.This is an open access article published by the IET under the Creative Commons Attribution-NonCommercial-NoDerivs License(http://creativecommons.org/licenses/by-nc-nd/3.0/)
7

modules including prosumer behaviour, transmission anddistribution models geographically distributed.
5.2 Case study – transmission and distribution systems
We used a realistic case based on a portion of distribution systemof Turin (1M-inhabitant city in northern Italy) and its upstreamtransmission system, which is a portion of Piedmont Region powersystem.
The transmission grid consists of 86 buses, 110 lines, 20generators and 54 equivalent loads for the MV substations. ThisHV grid is interconnected with the MV network through anHV/MV substation, where the data exchange takes place betweenthe two RT simulators.
The transmission system is modelled and simulated at ACSlaboratory on a RTDS. Table 1 provides a summary of thetransmission system. Four racks of RTDS are utilised to executethe modelled system with 50 µs time step.
The portion of the MV network consists of a primary substationwith three 220/22 kV transformers. A summary of the networkspecifications is provided in Table 2. This grid is modelled andsimulated on the RT simulator at Department of Energy of PoliTO(Italy). The simulator is an OPAL machine with 12 cores operatingat 3.46 GHz. Four cores are used to execute the modelleddistribution system with 50 µs time step for an electromagnetictransient analysis.
The behaviour of the prosumers in the distribution grid isgenerated as load and production profiles in the third laboratory(located in JRC – Petten, Netherlands), which periodically controlsloads and PV models in the distribution system (Fig. 9).
A monitoring system in the fourth laboratory in JRC-Isprasupervises and monitors the data exchange and simulationperformance through a developed cloud system.
5.3 RT co-simulation of transmission and distributionsystems
The described setup demonstrates two substantial benefits of thegeographically distributed virtual environment. First, the issue oflarge-scale simulation is addressed by leveraging resources frommultiple facilities. This refers not only to sharing of computationalresources but also to benefits of a joint effort for implementationand validation of detailed models for simulation of transmissionand distribution systems.
Fig. 8 Comparison of co-simulation interface based on a TD waveform (interface without DP) and co-simulation IA based on DPs (interface with DP)
Table 1 Transmission network summarynumber of 380 kV buses 26number of 220 kV buses 60number of generators 20number of lines 110number of loads 54maximum total active capacity, MW 8458maximum total reactive capacity, Mvar 4338
Table 2 Distribution network summaryHV/MV transformers 3 (220/22 kV, 2 × 63 MVA + 1 × 55
MVA)number of MV feeders 5number of MV buses 49number of lines 49total length of lines, km 38.54number of MV/LV transformers 40number of LV customers 742 mono phase and 8293 three
phasetotal contractual load, MW 37.056number of equivalent LV models 40number of MV customers 6
Fig. 9 Indication of scenario window in 24 h total load/generation profiles
8 IET Gener. Transm. Distrib.This is an open access article published by the IET under the Creative Commons Attribution-NonCommercial-NoDerivs License
(http://creativecommons.org/licenses/by-nc-nd/3.0/)
Second, the data exchange between TS and DS is performed bytransferring currents and voltages at the transformer: interfacequantities at the decoupling point. Exchanging only interfacequantities is particularly beneficial for a realistic situation in whichconfidentiality aspects of sharing data and models among operatorsmight represent an obstacle for performing integrated studies.Thus, a significant value of the proposed concept of virtualintegration of laboratories is flexibility for collaboration in thecontext of system level and wide area studies, required to evaluateinteroperability and identify possible unacceptable interactions.
In particular, this is beneficial for studies on how differentlevels of DG, EV penetration and consumer behaviour patterns inthe distribution system would affect the system operation at bothtransmission and distribution levels. To this aim, we assessedtransmission and distribution system operation under extremeconsumer/prosumer behaviour at the distribution level.
In our example, we mainly focus on the balancing challengesfrom PV generators as one of commonly used non-programmablerenewable energies in Italy. There are four PV generators in theportion of MV grid we studied. On the basis of the designedscenario, sudden drop of generation due to cloud cover coincideswith the time consumption is increasing from more appliancesutilisation and EVs plugging. The coincident results in a rapidincrease of local total consumption (Fig. 9), while in normaloperation, consumption changes have slow transients.
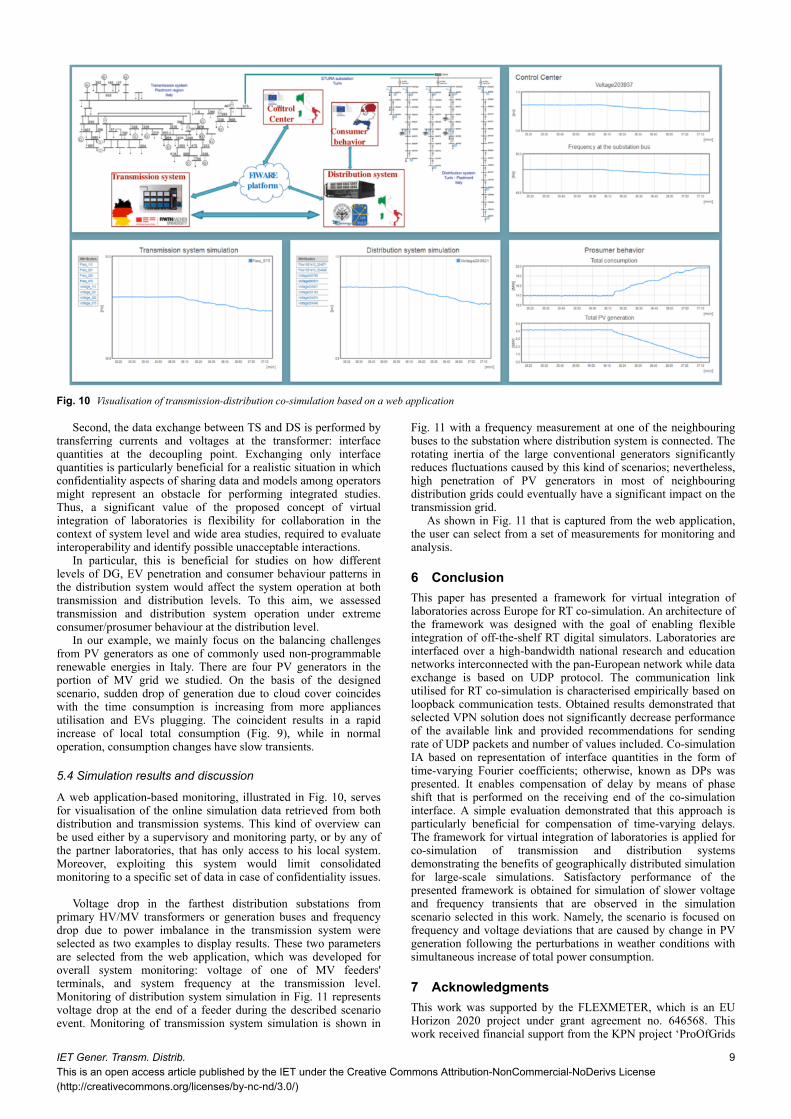
5.4 Simulation results and discussion
A web application-based monitoring, illustrated in Fig. 10, servesfor visualisation of the online simulation data retrieved from bothdistribution and transmission systems. This kind of overview canbe used either by a supervisory and monitoring party, or by any ofthe partner laboratories, that has only access to his local system.Moreover, exploiting this system would limit consolidatedmonitoring to a specific set of data in case of confidentiality issues.
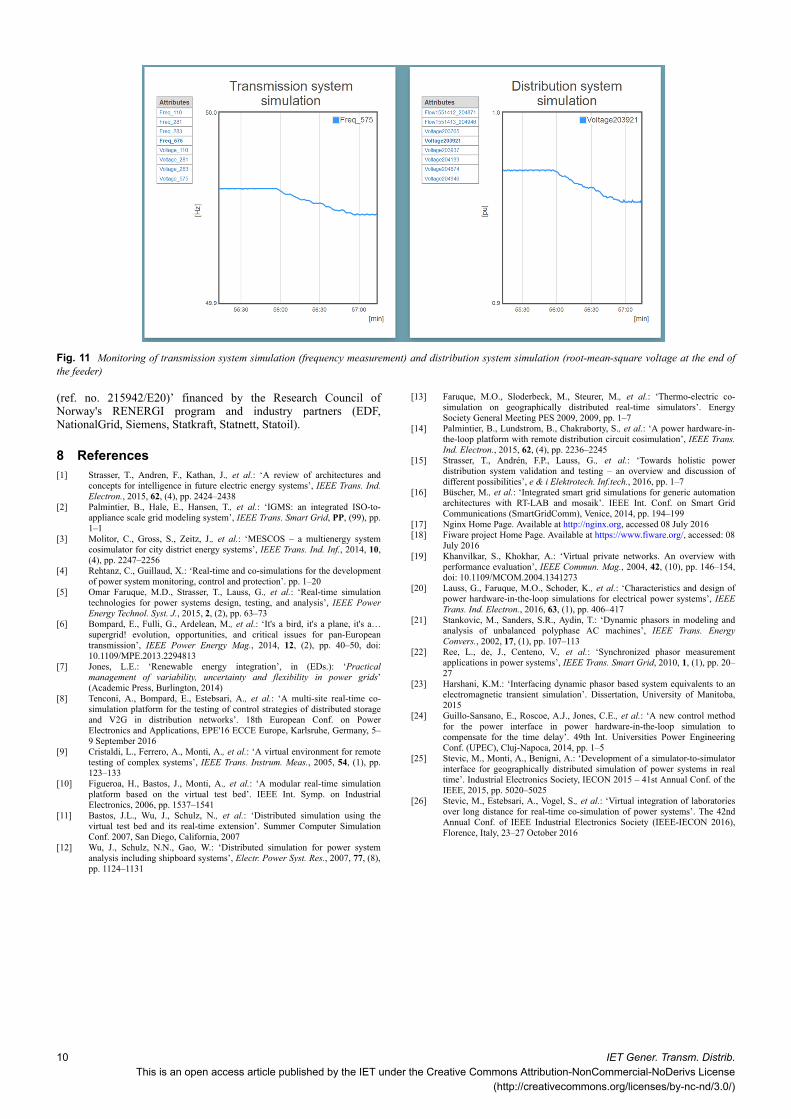
Voltage drop in the farthest distribution substations fromprimary HV/MV transformers or generation buses and frequencydrop due to power imbalance in the transmission system wereselected as two examples to display results. These two parametersare selected from the web application, which was developed foroverall system monitoring: voltage of one of MV feeders'terminals, and system frequency at the transmission level.Monitoring of distribution system simulation in Fig. 11 representsvoltage drop at the end of a feeder during the described scenarioevent. Monitoring of transmission system simulation is shown in
Fig. 11 with a frequency measurement at one of the neighbouringbuses to the substation where distribution system is connected. Therotating inertia of the large conventional generators significantlyreduces fluctuations caused by this kind of scenarios; nevertheless,high penetration of PV generators in most of neighbouringdistribution grids could eventually have a significant impact on thetransmission grid.
As shown in Fig. 11 that is captured from the web application,the user can select from a set of measurements for monitoring andanalysis.
6 ConclusionThis paper has presented a framework for virtual integration oflaboratories across Europe for RT co-simulation. An architecture ofthe framework was designed with the goal of enabling flexibleintegration of off-the-shelf RT digital simulators. Laboratories areinterfaced over a high-bandwidth national research and educationnetworks interconnected with the pan-European network while dataexchange is based on UDP protocol. The communication linkutilised for RT co-simulation is characterised empirically based onloopback communication tests. Obtained results demonstrated thatselected VPN solution does not significantly decrease performanceof the available link and provided recommendations for sendingrate of UDP packets and number of values included. Co-simulationIA based on representation of interface quantities in the form oftime-varying Fourier coefficients; otherwise, known as DPs waspresented. It enables compensation of delay by means of phaseshift that is performed on the receiving end of the co-simulationinterface. A simple evaluation demonstrated that this approach isparticularly beneficial for compensation of time-varying delays.The framework for virtual integration of laboratories is applied forco-simulation of transmission and distribution systemsdemonstrating the benefits of geographically distributed simulationfor large-scale simulations. Satisfactory performance of thepresented framework is obtained for simulation of slower voltageand frequency transients that are observed in the simulationscenario selected in this work. Namely, the scenario is focused onfrequency and voltage deviations that are caused by change in PVgeneration following the perturbations in weather conditions withsimultaneous increase of total power consumption.
7 AcknowledgmentsThis work was supported by the FLEXMETER, which is an EUHorizon 2020 project under grant agreement no. 646568. Thiswork received financial support from the KPN project ‘ProOfGrids
Fig. 10 Visualisation of transmission-distribution co-simulation based on a web application
IET Gener. Transm. Distrib.This is an open access article published by the IET under the Creative Commons Attribution-NonCommercial-NoDerivs License(http://creativecommons.org/licenses/by-nc-nd/3.0/)
9
(ref. no. 215942/E20)’ financed by the Research Council ofNorway's RENERGI program and industry partners (EDF,NationalGrid, Siemens, Statkraft, Statnett, Statoil).
8 References[1] Strasser, T., Andren, F., Kathan, J., et al.: ‘A review of architectures and
concepts for intelligence in future electric energy systems’, IEEE Trans. Ind.Electron., 2015, 62, (4), pp. 2424–2438
[2] Palmintier, B., Hale, E., Hansen, T., et al.: ‘IGMS: an integrated ISO-to-appliance scale grid modeling system’, IEEE Trans. Smart Grid, PP, (99), pp.1–1
[3] Molitor, C., Gross, S., Zeitz, J., et al.: ‘MESCOS – a multienergy systemcosimulator for city district energy systems’, IEEE Trans. Ind. Inf., 2014, 10,(4), pp. 2247–2256
[4] Rehtanz, C., Guillaud, X.: ‘Real-time and co-simulations for the developmentof power system monitoring, control and protection’. pp. 1–20
[5] Omar Faruque, M.D., Strasser, T., Lauss, G., et al.: ‘Real-time simulationtechnologies for power systems design, testing, and analysis’, IEEE PowerEnergy Technol. Syst. J., 2015, 2, (2), pp. 63–73
[6] Bompard, E., Fulli, G., Ardelean, M., et al.: ‘It's a bird, it's a plane, it's a…supergrid! evolution, opportunities, and critical issues for pan-Europeantransmission’, IEEE Power Energy Mag., 2014, 12, (2), pp. 40–50, doi:10.1109/MPE.2013.2294813
[7] Jones, L.E.: ‘Renewable energy integration’, in (EDs.): ‘Practicalmanagement of variability, uncertainty and flexibility in power grids’(Academic Press, Burlington, 2014)
[8] Tenconi, A., Bompard, E., Estebsari, A., et al.: ‘A multi-site real-time co-simulation platform for the testing of control strategies of distributed storageand V2G in distribution networks’. 18th European Conf. on PowerElectronics and Applications, EPE'16 ECCE Europe, Karlsruhe, Germany, 5–9 September 2016
[9] Cristaldi, L., Ferrero, A., Monti, A., et al.: ‘A virtual environment for remotetesting of complex systems’, IEEE Trans. Instrum. Meas., 2005, 54, (1), pp.123–133
[10] Figueroa, H., Bastos, J., Monti, A., et al.: ‘A modular real-time simulationplatform based on the virtual test bed’. IEEE Int. Symp. on IndustrialElectronics, 2006, pp. 1537–1541
[11] Bastos, J.L., Wu, J., Schulz, N., et al.: ‘Distributed simulation using thevirtual test bed and its real-time extension’. Summer Computer SimulationConf. 2007, San Diego, California, 2007
[12] Wu, J., Schulz, N.N., Gao, W.: ‘Distributed simulation for power systemanalysis including shipboard systems’, Electr. Power Syst. Res., 2007, 77, (8),pp. 1124–1131
[13] Faruque, M.O., Sloderbeck, M., Steurer, M., et al.: ‘Thermo-electric co-simulation on geographically distributed real-time simulators’. EnergySociety General Meeting PES 2009, 2009, pp. 1–7
[14] Palmintier, B., Lundstrom, B., Chakraborty, S., et al.: ‘A power hardware-in-the-loop platform with remote distribution circuit cosimulation’, IEEE Trans.Ind. Electron., 2015, 62, (4), pp. 2236–2245
[15] Strasser, T., Andrén, F.P., Lauss, G., et al.: ‘Towards holistic powerdistribution system validation and testing – an overview and discussion ofdifferent possibilities’, e & i Elektrotech. Inf.tech., 2016, pp. 1–7
[16] Büscher, M., et al.: ‘Integrated smart grid simulations for generic automationarchitectures with RT-LAB and mosaik’. IEEE Int. Conf. on Smart GridCommunications (SmartGridComm), Venice, 2014, pp. 194–199
[17] Nginx Home Page. Available at http://nginx.org, accessed 08 July 2016[18] Fiware project Home Page. Available at https://www.fiware.org/, accessed: 08
July 2016[19] Khanvilkar, S., Khokhar, A.: ‘Virtual private networks. An overview with
performance evaluation’, IEEE Commun. Mag., 2004, 42, (10), pp. 146–154,doi: 10.1109/MCOM.2004.1341273
[20] Lauss, G., Faruque, M.O., Schoder, K., et al.: ‘Characteristics and design ofpower hardware-in-the-loop simulations for electrical power systems’, IEEETrans. Ind. Electron., 2016, 63, (1), pp. 406–417
[21] Stankovic, M., Sanders, S.R., Aydin, T.: ‘Dynamic phasors in modeling andanalysis of unbalanced polyphase AC machines’, IEEE Trans. EnergyConvers., 2002, 17, (1), pp. 107–113
[22] Ree, L., de, J., Centeno, V., et al.: ‘Synchronized phasor measurementapplications in power systems’, IEEE Trans. Smart Grid, 2010, 1, (1), pp. 20–27
[23] Harshani, K.M.: ‘Interfacing dynamic phasor based system equivalents to anelectromagnetic transient simulation’. Dissertation, University of Manitoba,2015
[24] Guillo-Sansano, E., Roscoe, A.J., Jones, C.E., et al.: ‘A new control methodfor the power interface in power hardware-in-the-loop simulation tocompensate for the time delay’. 49th Int. Universities Power EngineeringConf. (UPEC), Cluj-Napoca, 2014, pp. 1–5
[25] Stevic, M., Monti, A., Benigni, A.: ‘Development of a simulator-to-simulatorinterface for geographically distributed simulation of power systems in realtime’. Industrial Electronics Society, IECON 2015 – 41st Annual Conf. of theIEEE, 2015, pp. 5020–5025
[26] Stevic, M., Estebsari, A., Vogel, S., et al.: ‘Virtual integration of laboratoriesover long distance for real-time co-simulation of power systems’. The 42ndAnnual Conf. of IEEE Industrial Electronics Society (IEEE-IECON 2016),Florence, Italy, 23–27 October 2016
Fig. 11 Monitoring of transmission system simulation (frequency measurement) and distribution system simulation (root-mean-square voltage at the end ofthe feeder)
10 IET Gener. Transm. Distrib.This is an open access article published by the IET under the Creative Commons Attribution-NonCommercial-NoDerivs License
(http://creativecommons.org/licenses/by-nc-nd/3.0/)