12_Pd_Al2O_OA.pdf - IRIS Uni Torino
41
21 March 2022 AperTO - Archivio Istituzionale Open Access dell'Università di Torino Original Citation: Effect of reduction in liquid phase on the properties and the catalytic activity of Pd/Al2O3 catalysts Published version: DOI:10.1016/j.jcat.2011.11.018 Terms of use: Open Access (Article begins on next page) Anyone can freely access the full text of works made available as "Open Access". Works made available under a Creative Commons license can be used according to the terms and conditions of said license. Use of all other works requires consent of the right holder (author or publisher) if not exempted from copyright protection by the applicable law. Availability: This is the author's manuscript This version is available http://hdl.handle.net/2318/95972 since 2016-10-08T15:33:40Z
-
Upload
khangminh22 -
Category
Documents
-
view
1 -
download
0
Transcript of 12_Pd_Al2O_OA.pdf - IRIS Uni Torino

21 March 2022
AperTO - Archivio Istituzionale Open Access dell'Università di Torino
Original Citation:
Effect of reduction in liquid phase on the properties and the catalytic activity of Pd/Al2O3 catalysts
Published version:
DOI:10.1016/j.jcat.2011.11.018
Terms of use:
Open Access
(Article begins on next page)
Anyone can freely access the full text of works made available as "Open Access". Works made available under aCreative Commons license can be used according to the terms and conditions of said license. Use of all other worksrequires consent of the right holder (author or publisher) if not exempted from copyright protection by the applicable law.
Availability:
This is the author's manuscript
This version is available http://hdl.handle.net/2318/95972 since 2016-10-08T15:33:40Z

1
This Accepted Author Manuscript (AAM) is copyrighted and published by Elsevier. It is posted here by
agreement between Elsevier and the University of Turin. Changes resulting from the publishing process
- such as editing, corrections, structural formatting, and other quality control mechanisms - may not be
reflected in this version of the text. The definitive version of the text was subsequently published in
[Journal of Catalysis, 287 (2012) 44–54, doi:10.1016/j.jcat.2011.11.018].
You may download, copy and otherwise use the AAM for non-commercial purposes provided that your
license is limited by the following restrictions:
(1) You may use this AAM for non-commercial purposes only under the terms of the CC-BY-NC-ND
license.
(2) The integrity of the work and identification of the author, copyright owner, and publisher must be
preserved in any copy.
(3) You must attribute this AAM in the following format: Creative Commons BY-NC-ND license
(http://creativecommons.org/licenses/by-nc-nd/4.0/deed.en),
[http://www.sciencedirect.com/science/article/pii/S0021951711003873]

2
Effect of reduction in liquid phase on the properties and
the catalytic activity of Pd/Al2O3 catalysts.
Elena Groppoa,∗
, Giovanni Agostinia, Andrea Piovano
a,†, Naresh B. Muddada
a,‡, Giuseppe
Leofantib, Riccardo Pellegrini
c, Giuseppe Portale
d, Alessandro Longo
e, Carlo Lamberti
a
aDepartment of Inorganic, Physical and Materials Chemistry, INSTM Reference Center and NIS
Centre of Excellence, Università di Torino, Via P. Giuria 7, I-10125 Torino, Italy
bConsultant, Via Firenze 43, 20010 Canegrate (Milano) Italy
cChimet SpA - Catalyst Division, Via di Pescaiola 74, I-52041 Viciomaggio (Arezzo), Italy
dNetherlands Organization for Scientific Research at ESRF, BP 220, F-38043 Grenoble Cedex 9,
France
eIstituto per lo Studio dei Materiali Nanostrutturati del CNR, Via Ugo La Malfa 153, I-90146,
Palermo, Italy
† Present address: Institut Laue Langevin, 6 Rue Jules Horowitz BP 156, F-38042 Grenoble
Cedex 9, France
‡Present address: inGAP centre of Research-based Innovation, Department of Chemistry,
University of Oslo, Sem Saerlandsvei 26, N-0315 Oslo, Norway
Abstract
The change of structural and surface properties of Pd/Al2O3 catalysts as effect of reduction in liquid
phase during preparation, are investigated by a multi-technical approach. It has been found that,
although the treatment leaves an external shell of oxidized Pd because of the exposure to air of final
wet catalyst, it affects both the catalyst reducibility and the properties of the supported Pd
nanoparticles, in terms of dispersion, particle size, morphology, interaction with the support,
structural order and surface properties. Consequently, unreduced and pre-reduced catalysts show
different performances in the debenzylation of 4-benzyloxyphenol reaction.
∗ Corresponding author: Tel. +39 011 6708373; fax: +39 011 6707855; e-mail: [email protected]

3
1. Introduction
Pd-supported catalysts are widely used in hydrogenation reactions for the synthesis of fine
chemicals (e.g., active pharmaceutical ingredients) [1] and bulk chemicals (e.g., terephthalic acid)
[2]. Although Pd catalysts find application for reactions in gas phase [3], more often they are used
for reactions in liquid phase [4-7], and thus more conveniently supplied in the wet form, i.e. with
pores filled by water. Pd catalysts are usually prepared by supporting a Pd precursor on high surface
area carriers, among which metal-oxides, such as Al2O3 and carbons are the most used. We have
recently demonstrated that, whichever is the support, following the deposition-precipitation method
Pd is supported in the form of a Pd oxide or hydroxide [8]. Depending on the specific catalytic
process in which they are used, Pd catalysts can be supplied directly in this oxidized state or can be
further reduced by the catalyst manufacturer itself through different reducing agents (among which
sodium formate, sodium borohydride and hydrogen are the most common ones).
Although the active Pd phase in reductive conditions typical of hydrogenation reaction is metal
Pd, the oxidation state of the starting catalyst (i.e. unreduced or pre-reduced) influences its catalytic
performances in such a way that sometimes it is more convenient to use an unreduced catalyst [9-
11], and some others a reduced catalyst shows better performances [12, 13]. This suggests that the
physical-chemical properties of the supported Pd particles depend on the reduction state and on the
reduction method. However, a clear relationship among the reduction state of the catalyst as loaded
into the reactor, its physical-chemical properties and the catalytic performances, was never
demonstrated so far.
We will show that the catalytic performances of alumina-supported Pd-based catalysts in the
debenzylation of 4-benzyloxyphenol (chosen as test reaction) are influenced by a pre-reduction in
liquid phase, in terms of induction time, activity and turnover frequency. In an attempt to
understand the origin of these changes, we performed a systematic investigation of the structural
and surface properties of Pd/Al2O3 catalysts as a function of the reduction state (unreduced or pre-
reduced with different reducing agents). The oxidation state of the supported Pd phase was

4
evaluated by means of TPR, whereas the surface oxidation state was determined by FT-IR
spectroscopy of CO adsorbed at 100 K. CO chemisorption, TEM and SAXS were successively
adopted to determine the dispersion and the morphology of the Pd particle. At last, Pd hydride
decomposition in TPR experiments and FT-IR of CO adsorbed at room temperature were used to
investigate the order/disorder characteristics of bulk and surface Pd particles, as well as the nature
of the exposed surface sites. This multi-technical approach, already applied by us to investigate
various Pd supported catalysts [8, 14-17], is fundamental to understand the role of pre-reduction in
determining the reducibility of supported Pd-oxide or hydroxide and the properties of the final Pd
nanoparticles.
2. Experimental
2.1. Catalysts preparation and nomenclature
Supported Pd samples were prepared in the Chimet Laboratories on γ-Al2O3 (surface area = 121
m2 g
-1; pore volume = 0.43 cm
3 g
-1) following the deposition-precipitation method, with Na2PdCl4
as palladium precursor and Na2CO3 as basic agent [8]. Three Pd loadings were investigated: 5.0 wt
%, which is relevant for industrial applications, 2.0 and 3.5 wt% for comparison. All catalysts were
carefully washed until complete Cl- removal was achieved and were kept in their wet state (ca. 50%
of water) until measurement. The same procedure was followed to prepare supported Pd samples on
a wood-based activated carbon, (surface area = 980 m2 g
-1; pore volume = 0.62 cm
3 g
-1), which
were used for the evaluation of mass transfer phenomena in the catalytic tests. For the 5.0 wt%
catalyst, after the deposition of palladium as hydroxide, reduction was carried out in liquid phase by
means of three different reducing agents, i.e. HCOONa, NaBH4, or hydrogen at 338 K. For
reduction with hydrogen, the treatment was performed inside a stainless steel autoclave, under 10
bar of pressure. As for unreduced catalysts, the reduced catalysts were successively water-washed
until residual Cl- were completely removed and stored in their wet state.

5
Hereafter, the nomenclature PdAl and PdCw is used to indicate the unreduced catalysts prepared
on alumina (Al) and wood carbon (Cw), respectively. The Pd loading is indicated before the PdAl
label; thus 5PdAl refers to the 5.0 wt% loading. When a reduction in the liquid phase is performed,
a label indicating the reducing agent is added. Thus, 5PdAl(F), 5PdAl(B) and 5PdAl(H) refer to
alumina-supported palladium catalysts (5.0 wt% loading) reduced with formate, borohydride and
hydrogen, respectively; whereas PdCw(F) refers to carbon-supported palladium catalyst reduced
with formate. All the Pd supported samples were stored in their wet state. TPR data (vide infra
Table 1) provided evidence that the drying atmosphere greatly affects the reduction temperature of
the catalysts: a sample dried in inert atmosphere starts to be reduced at lower temperature than the
same sample dried in air. The reason is attributed to the auto-reduction of a very small fraction of
defective sites, as demonstrated also by FT-IR spectroscopy of CO adsorbed at 100 K (vide infra)
and as already suggested in the literature [18-20]. This observation is relevant in order to avoid
misleading comparisons with similar data in literature. However, it was found that all the properties
of Pd-supported particles before and after reduction (such as the Pd2+
/Pdtot ratio and the Pd
dispersion) are not affected by the drying procedure. Therefore, the drying step was always
conducted in air (unless specified).
To take into account the possible modification of the γ-Al2O3 pore size distribution upon Pd
precipitation, a fraction of the γ-Al2O3 support was subjected to the deposition-precipitation process
without adding the Pd precursor. This sample was used to simulate the contribution of the support
in the SAXS experiments. Finally, unsupported PdO and Pd samples were prepared as a reference
for TPR experiments following a procedure similar to that adopted for the catalysts preparation, but
omitting the support. The final unsupported samples were dried overnight in air at 393K .
2.2. Catalysts activity in debenzylation reaction.
The catalytic performance of the Pd/Al2O3 samples was tested in the debenzylation of 4-
benzyloxyphenol to hydroquinone and toluene. The reaction was carried out in a 300 cm3 glass

6
reactor equipped with a double mantle for water circulation, and a gas injection stirrer (Premex, br1
series). Water at the required temperature was circulated inside the reactor mantle by means of a
thermostatic bath. In a typical experiment, the reactor was charged with 500 mg of dry catalyst, and
then a solution of 10 g of 4-benzyloxyphenol in 140 ml of ethanol was poured into the reactor. The
reactor was purged first with nitrogen and then with hydrogen. Hydrogenation was performed at
atmospheric pressure, at a temperature of 308 K, and with a stirring speed of 2000 rpm.
By plotting the hydrogen consumption versus time a straight line is obtained, demonstrating that
the reaction has a zero-order with respect to the substrate. The slope of this line corresponds to the
activity (hereafter r), expressed in cm3 STP min
-1 and the intercept with the abscissa has been taken
as the measure of the induction time. The mean activity of surface Pd atoms can be defined in terms
of turnover frequency (TOF), which is the number of H2 molecules consumed per second per
number of surface atoms determined by an independent technique [21], in this work by CO
chemisorption.
Figure 1.
To prove that the reaction proceeds without mass transfer constraints in the conditions adopted
herein, several tests with different catalyst amounts (i.e., 300, 500 and 700 mg), different catalyst
particle size (i.e., 5 and 23 µm) and at different temperatures (i.e., 293, 308, and 323 K), were
performed [22-24]. The effect of particle size on catalytic activity was evaluated on PdCw(F),
having a particle size of 23 µm (measured by LALLS technique with Malvern Mastesizer 2000
instrument). The catalyst particle size was decreased to 5 µm by grinding. CO chemisorption data
demonstrated that the grinding procedure does not affect the palladium dispersion. By using a
simplified approach [22], the reciprocal plot 1/r versus 1/m (Figure 1a) allowed us to calculate the
mass transfer coefficient for the transfer of the gas to liquid phase (km) and the pseudo-kinetic
constant, which includes the mass transport to the solid-liquid interface, as well as internally to the
porous solid (kr). The ratio km/kr resulted in a value higher than 103, providing evidence that the

7
transfer of the gas (i.e., H2) is much quicker than the reaction rate; and this happens at almost the
same extent regardless of the catalyst particle size (5 or 23 µm).
The Arrhenius plot shown in Figure 1b further confirms the above mentioned results, giving an
activation energy value equal to 52.3 kJ/mol (12.5 kcal/mol). According to Roberts [24], when a
reaction is controlled by either gas/liquid or liquid/solid mass transport, the observed activation
energy should be less than 5 kcal/mol; whereas activation energy values greater than 10 kcal/mol
(as in our case), are an indication that the reaction proceeds without mass transfer constraints, either
with or without pore diffusion. Moreover, the fact that the reciprocal plot of Figure 1a is the same
for both catalysts having a different particle size (i.e., 5 and 23 µm) provides evidence that the
reaction rate depends only on the chemical reaction taking place on active Pd sites, without the
influence of internal pore diffusion [23].
2.3. Catalysts characterization
2.3.1 Temperature Programmed Reduction (TPR) and CO Chemisorption
A Micromeritics Autochem 2910 instrument was used for both, TPR and CO chemisorption
measurements. For the TPR measurements, the instrument was equipped with a CryoCooler device
allowing to perform the measurements starting from 153 K. The water formed during the reduction
process was trapped inside a molecular sieve getter located between the sample holder and the
detector. A typical procedure was as follows: 100 mg of sample (either wet or dry) are introduced in
the sample holder, and heated in situ by a nitrogen flow at 393 K for two hours [8, 15]. Then the
sample is cooled down to 153 K under Ar flow (50 cm3 min
-1). Successively, the flow is switched to
5% H2 in Ar (50 cm3 min
-1) and maintained throughout the analysis. Once a baseline is established,
the temperature ramp is started at a rate of 5 K min-1
up to 623 K. Tmax and Tmin indicate the
temperatures of the maximum rate of H2 consumption or release, respectively. Tstart is the
temperature of the beginning of H2 consumption, defined as the temperature where the first
derivative of the TCD signal vs. temperature exceeds the arbitrary value of 5 10-4
. Note that all the

8
TPR curves shown hereafter present a minimum around 230 K, which is an instrumental artifact due
to a small change in the heating rate.
CO chemisorption measurements were performed at 323 K by a dynamic pulse method on
samples pre-reduced in H2 at 393 K [25]. In a typical experiment, the catalyst (200 mg) was reduced
in situ at 393 K according to the following procedure: (i) the catalyst is loaded inside the U-tube,
(ii) it is heated in He up to 393 K (ramp rate of 10 K min-1
), (iii) H2 is fed for 30 min, and (iv) the
sample is cooled down to 323 K in He (ramp rate of 10 K min-1
). A CO/Pd average stoichiometry =
1 was assumed to calculate the Pd dispersion. This assumption was verified by measurements
performed simultaneously in a static volumetric apparatus on three samples reduced at two different
temperatures (393 and 673 K) using both, H2 and O2 as probe molecules; these measurements gave
a O/Pd average stoichiometry close to 1 [14, 26]. Comparing the results obtained according to the
two methods, a CO/O ratio in the 0.94-1.13 range was obtained, which is a strong support for a
CO/Pd average stoichiometry = 1.
2.3.2 Transmission Electron Microscopy (TEM)
Transmission electron micrographs were obtained using a JEOL 3010-UHR instrument operating at
300 kV, equipped with a 2k x 2k pixels Gatan US1000 CCD camera. Samples were deposited on a
copper grid covered with a lacey carbon film.
2.3.3 Small Angle X-Ray Scattering (SAXS)
SAXS measurements were performed at the synchrotron DUBBLE beamline BM26B [27] at the
European Synchrotron Radiation Facilities (ESRF, Grenoble, F). Experiments were carried out
using a monochromatic 12 keV X-ray beam. The H-hutch of BM26B is equipped to perform
SAXS/WAXS experiments and was designed with a maximum of flexibility that allows one to
study several problems, particularly in the field of nanoscience [27]. In our experiments, the small-
angle scattering images were recorded by placing a two-dimensional PilatusPilatus 1M detector (by
Dectris) at 6 m. Thus, a large scattering vector range was covered, 0.1< q < 3.5 nm-1
(being q [nm-1
]
= 10x1.014E [19]sinθ the scattering vector, where θ is the scattering angle and E is the energy of

9
the X-ray beam) and the maximum d-spacing resolution was 62.8 nm. Silver Behenate were used as
standard to determine the centre of the beam and the scattering vector scale. Then the isotropic
SAXS intensity profiles were obtained by integration of the two-dimensional images radially
averaged around the centre of the primary beam by using FIT2D software [28-30]. The analysis
details will be described in a forthcoming paper.
2.3.4 FT-IR spectroscopy of adsorbed CO
The FT-IR spectra of CO adsorbed on the catalysts were recorded at a resolution of 2 cm-1
on a
Bruker Vertex 70 instrument, in transmission mode. In situ experiments were carried out in a home
made quartz cell equipped with KBr windows allowing to perform sample activation and successive
measurements in the 100 – 823 K temperature range, at pressures from 10-4
to 760 Torr. The
catalysts were pressed into self-supporting pellets and activated in the same cells used for the
measurement. Both activation and measurements were performed using grease-free cells and
vacuum lines.
A first set of experiments was aimed to determine the surface oxidation state of the Pd phase
on the fresh samples. For this reason, the samples were heated at 393 K in air, followed by a rapid
outgassing to remove the air from the cell; the outgassing time was kept as short as possible, in
order to avoid any possible Pd2+
auto-reduction. In order to minimize changes on the catalyst
surface, due to reaction of the CO probe with the supported Pd hydroxide phase, FT-IR experiments
were performed by dosing CO (equilibrium pressure PCO = 5 Torr) on samples pre-cooled down to
100 K. For comparison, the same experiment was performed also on samples heated at 393 K in
vacuum, and on 5PdAl reduced in H2 gas at 393 K. A second set of experiments was aimed to
characterize the surface sites on the reduced Pd particles by FT-IR of CO adsorbed at room
temperature, following the approach already discussed in our previous works [14, 15, 17, 31]. In
that case, the Pd phase was pre-reduced in H2 gas at 373 K. The reduction process consisted in two
subsequent H2 dosages (equilibrium pressure PH2 = 120 Torr, contact time = 10 minutes), followed
by outgassing at 373 K; then the samples were cooled down to room temperature in a dynamic
10
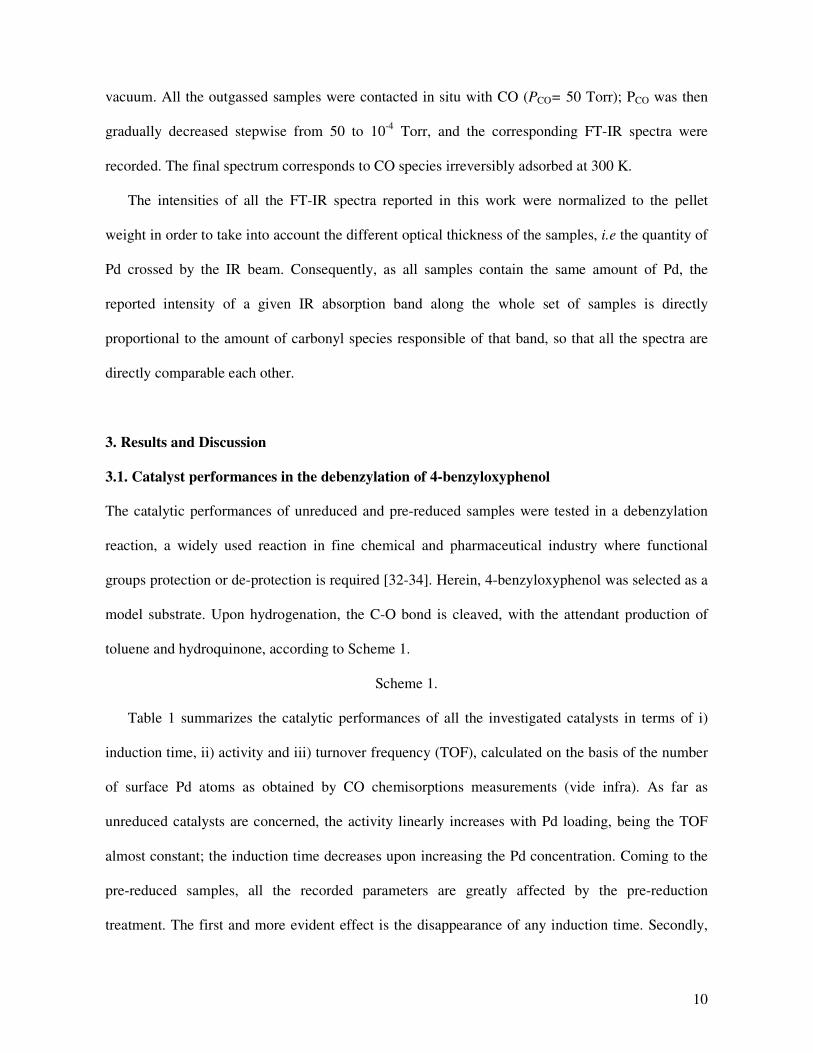
vacuum. All the outgassed samples were contacted in situ with CO (PCO= 50 Torr); PCO was then
gradually decreased stepwise from 50 to 10-4
Torr, and the corresponding FT-IR spectra were
recorded. The final spectrum corresponds to CO species irreversibly adsorbed at 300 K.
The intensities of all the FT-IR spectra reported in this work were normalized to the pellet
weight in order to take into account the different optical thickness of the samples, i.e the quantity of
Pd crossed by the IR beam. Consequently, as all samples contain the same amount of Pd, the
reported intensity of a given IR absorption band along the whole set of samples is directly
proportional to the amount of carbonyl species responsible of that band, so that all the spectra are
directly comparable each other.
3. Results and Discussion
3.1. Catalyst performances in the debenzylation of 4-benzyloxyphenol
The catalytic performances of unreduced and pre-reduced samples were tested in a debenzylation
reaction, a widely used reaction in fine chemical and pharmaceutical industry where functional
groups protection or de-protection is required [32-34]. Herein, 4-benzyloxyphenol was selected as a
model substrate. Upon hydrogenation, the C-O bond is cleaved, with the attendant production of
toluene and hydroquinone, according to Scheme 1.
Scheme 1.
Table 1 summarizes the catalytic performances of all the investigated catalysts in terms of i)
induction time, ii) activity and iii) turnover frequency (TOF), calculated on the basis of the number
of surface Pd atoms as obtained by CO chemisorptions measurements (vide infra). As far as
unreduced catalysts are concerned, the activity linearly increases with Pd loading, being the TOF
almost constant; the induction time decreases upon increasing the Pd concentration. Coming to the
pre-reduced samples, all the recorded parameters are greatly affected by the pre-reduction
treatment. The first and more evident effect is the disappearance of any induction time. Secondly,

11
pre-reduced 5PdAl catalysts show a greater activity than the unreduced one and, consequently, a
greater TOF.
Table 1.
The data summarized in Table 1 unequivocally indicate that the pre-reduction procedure affects
the catalyst performance. However, its effects on the oxidation degree and reducibility of supported
Pd phase, as well as the morphology, the structural order and the surface properties of final Pd
nanoparticles was never investigated in detail. This would be of a great interest in view of a rational
choice of the best preparation procedure. The following sections will deal with the investigation of
each one of the above mentioned catalyst properties. In most cases, the measurements were
performed on 5PdAl and 5PdAl(F), the latter chosen as a representative for the pre-reduced
catalysts.
3.2. Oxidation state of the supported Pd phase
3.2.1 Oxidation degree: TPR results
The oxidation state of the supported Pd phase in both the unreduced and pre-reduced catalyst was
evaluated at first by means of TPR, which is one of the most common technique used to investigate
the reducibility of supported metal species [35-37]. However, the experiments on palladium are
complicated by the fact that reduction of Pd2+
precursors to Pd0 starts below room temperature, thus
requiring the use of an apparatus capable to operate also at a low temperature (in this work from
153 K). This is the reason why very few works in literature show TPR data on reduction of
supported Pd2+
compounds [8, 15, 38-40].
Figure 2.
The TPR profiles of 5PdAl and 5PdAl(F) are shown in Figure 2. The two curves are
characterized by a reduction peak starting at temperature lower than 275 K due to the Pd2+
→ Pd0
reduction, followed by a smaller negative peak centred around 330 K due to the decomposition of
the Pd hydride formed at lower temperature. The integrated area below the positive peak (after

12
correction for both bulk and surface hydride formation) gives the overall hydrogen consumption in
the reduction process and allows to calculate the Pd2+
fraction present in each sample. The so
obtained data are summarized in the last column of Table 2, and indicate that:
1) in 5PdAl (sample 2 in Table 2) all the supported Pd is in the Pd2+
form within the accuracy of
the technique (the Pd2+
/Pdtot ratio is determined with an incertitude of ±0.03); therefore no
reduction to Pd0 occurs during the impregnation step.
2) in 5PdAl(F) (sample 5 in Table 2) more than half of the Pd phase is still oxidized. The TPR
results are confirmed by XANES and EXAFS data (not shown). This observation is quite
unexpected since the catalyst was reduced in Na-formate. It is worth underlining that the
fraction of Pd2+
(0.57-0.58) is much larger than that expected for a surface passivation, i.e.
formation of a surface monolayer of oxygen [26]; in such a case the Pd2+
fraction value would
be of 0.24, as calculated on account of the dispersion values obtained from CO chemisorption
data (vide infra). The same extent of sub-surface oxidation is observed also when PdAl(F) is
dried in inert atmosphere (sample 5’ in Table 2), demonstrating that Pd is partially oxidized
already in the wet sample and that drying in air did not alter the Pd2+
fraction.
3) Although it is still highly oxidized, 5PdAl(F) starts to be reduced at lower temperature than
PdAl.
Table 2.
In principle, the presence of about 50% of oxidized Pd in the 5PdAl(F) sample (see Table 2)
can be explained by two main hypothesis: (i) incomplete reduction of the supported Pd-hydroxide
by Na formate; (ii) re-oxidation of fully reduced Pd0, due to later exposure of the wet catalyst to air.
The Pd surface would be oxidized in any case, since it is well known that O2 chemisorbs
dissociatively on metal Pd [41-43]. However, in the case (i) both, the core and the surface of the Pd
particles should be oxidized, whereas in the case (ii) the oxidation process should involve only the
surface and the sub-surface layers. In order to get more insight into the nature of the partially
oxidized Pd particles in the PdAl(F) sample, a sequence of TPR measurements was performed on a

13
PdAl sample subjected to ad hoc conceived thermal treatments. The TPR curves are shown in
Figure 4, whereas the corresponding Tstart and Tmax values, as well as the Pd2+
fraction, are
summarized in Table 2.
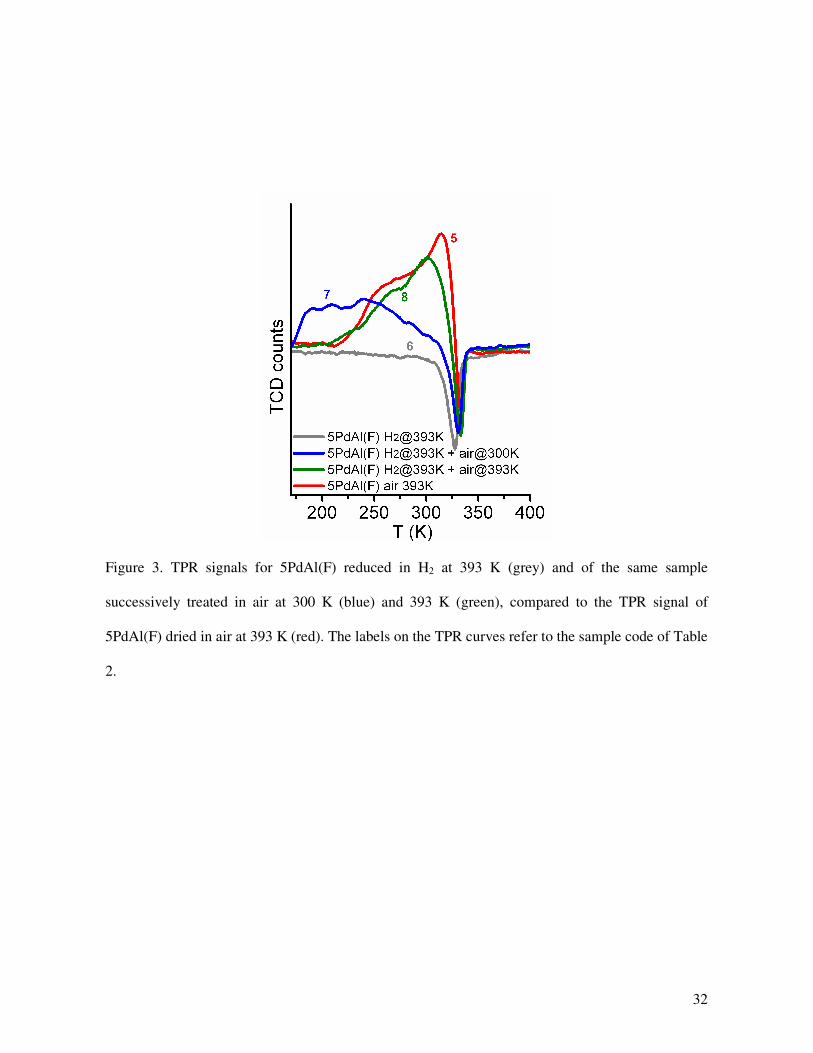
Figure 3
The TPR profile of 5PdAl(F) reduced in H2 gas (sample 6 in Figure 3 and Table 2) showed no
consumption of H2 but only the hydride decomposition peak at 328 K, demonstrating that thermal
treatment in H2 gas causes a complete Pd2+
→ Pd0 reduction (in agreement with XAS results, not
shown). When the sample is exposed to air at room temperature (sample 7 in Figure 3 and Table 2)
Pd0 is partially re-oxidized, as testified by the appearance of the Pd
2+ → Pd
0 reduction peak.
However, the re-oxidized Pd is only a fraction of the total Pd (about 25 %) and likely corresponds
to a surface monolayer only (dispersion = 24 %, vide infra). A larger fraction of Pd0 (52 %) is re-
oxidized when the 5PdAl(F) sample reduced in H2 gas is treated in air at 393 K (sample 8 in Figure
4 and Table 1). In addition, the thinner the re-oxidized Pd2+
layer, the easier its reduction (i.e. lower
Tstart and Tmax), probably as a result of surface defectivity. The shape as well as Tstart, Tmax and the
integrated area of the TPR reduction peak of sample 5PdAl(F) dried in air (sample 5 in Figure 3 and
Table 2) are close to that of sample 5PdAl(F) reduced in H2 gas and treated in air at 393 K (sample
8 in Figure 3 and Table 2). Because the latter is covered by an external PdO layer formed during re-
oxidation of the fully reduced Pd, the result supports the hypothesis (ii) formulated above: Na-
formate fully reduces the supported Pd-hydroxide phase; then the resulting Pd0 is partially re-
oxidized by air on both, surface and sub-surface.
3.2.2 Surface oxidation state: FT-IR of CO adsorbed at 100 K.
In order to definitely demonstrate that the Pd phase in 5PdAl(F) has a metal core-oxide layer
structure, we have performed a FT-IR experiment of CO adsorbed at 100 K. The low temperature is
necessary to avoid reaction of CO with the supported Pd2+
phase [20, 44-46]. Figure 4 shows the
FT-IR spectra of CO adsorbed at low temperature on the 5PdAl and 5PdAl(F) samples dried in air
at 393 K (samples 2 and 5, respectively). Both spectra are dominated by an IR absorption band at

14
around 2148 cm-1
, which is due to CO physisorbed on the support [47]; whereas no IR absorption
bands at frequencies lower than 2100 cm-1
are observed for both samples, demonstrating that no
accessible metal Pd is present in those cases. Apparently, no IR absorption bands ascribable to
carbonyl species formed on Pd2+
species are observed. However, linear carbonyls on Pd2+
sites have
been reported to give absorption in the 2160 – 2140 cm-1
range [20, 44-46, 48-51], that is precisely
the frequency range dominated by the IR absorption band due to physisorbed CO.
The same experiment was repeated for 5PdAl and 5PdAl(F) dried in vacuum, with the aim to
exclude that the absence of accessible Pd0 sites on 5PdAl(F) was induced by the drying procedure in
air. The corresponding FT-IR spectra (samples 2’ and 5’, respectively) show, in addition to the IR
absorption band due to physisorbed CO, very weak IR absorption bands around 2100 and 1950 cm-1
characteristic of carbonyls formed on Pd0 [14, 17, 20, 31, 52-61]. However, these bands are much
less intense than those obtained by dosing CO on 5PdAl sample reduced in H2 at 393 K (sample 3,
grey spectrum in Figure 4), and are assigned to CO adsorbed on the small fraction of defective sites
which have been auto-reduced during the sample activation (see Experimental). The FT-IR spectra
shown in Figure 4 validate the hypothesis formulated above on the basis of TPR results: the surface
oxidation state of the supported Pd phase is +2 for both, 5PdAl and 5PdAl(F) samples.
Figure 4.
3.3. Reducibility of oxidized samples
In the previous paragraphs we have demonstrated that the surface of Pd particles is fully oxidized in
both unreduced and pre-reduced catalysts. Thus, the oxidation state of Pd surface sites can not be
accounted for the different catalytic performances induced by pre-reduction. An alternative
explanation comes from the observation that 5PdAl(F) is reduced at temperature lower than 5PdAl,
as already shown in Figure 2 and summarized in Table 2. This result suggests that the two oxidized
phase in 5PdAl and 5PdAl(F) have different properties.

15
The easier reducibility of 5PdAl(F) can be explained by analyzing the results of TPR
experiments summarized in Figure 5, where the starting reduction temperature Tstart, which is the
most significant parameter indicating the easiness of catalyst reduction, is reported vs the Pd2+
fraction in the samples. The data shown in Figure 5 are a selection of those reported in Table 2 and
include samples at different degrees of oxidation: (i) the two fully oxidized samples 5PdAl (sample
2), and bulk PdO (sample 0), (ii) the partially oxidized sample 5PdAl(F) (sample 5), and (iii) the
partially oxidized samples obtained from 5PdAl, 5PdAl(F) and PdO reduced at 393 K in H2 and re-
oxidized in air at RT and 393 K. All the data lie on a straight line, meaning that more oxidized are
the Pd particles, less easy is their reduction. It is well known that re-oxidation of metal Pd causes an
increase of surface irregularity, up to a surface fragmentation [62-64]. This is a consequence of both
the larger volume of PdO with respect to that of metal Pd and its lower surface tension. However,
by increasing the oxidation degree the oxidized layer becomes progressively more regular
approaching the order of true oxide, such as in samples 5PdAl and bulk PdO. The easier reducibility
of 5PdAl(F) with respect to 5PdAl would be the consequence of a greater disorder of the few
external PdO layers, when compared to the bulk-like PdO phase in 5PdAl.
Figure 5.
3.4. Properties of reduced Pd
The data shown in the previous sections definitely demonstrate that, in spite of a large amount of
oxidized Pd phase still present, the pre-reduced 5PdAl(F) catalyst is reduced more easily than the
unreduced one. However, once the catalysts are in the reducing reaction environment, it could be
that the starting differences vanish. Therefore, it is important to know if the different reducibility
observed on the fresh catalysts corresponds to different properties, such as particle size,
morphology and defectivity, of the Pd nanoparticles in the reducing environment (i.e. during the
catalytic act), thus explaining the different observed catalytic performances (see Table 1). A direct
investigation on both 5PdAl and 5PdAl(F) samples after reduction in reaction conditions would be

16
complicated by several factors, including the possible presence of compounds from reaction
medium; therefore, the samples have been treated in H2 gas at 393 K in order to completely reduce
the Pd phase.
3.4.1. Pd dispersion and interaction of Pd particles with the support (CO chemisorption, TEM and
SAXS)
CO chemisorption was already demonstrated to be an efficient technique for investigating the
dispersion of Pd nanoparticles (i.e., the ratio between surface and total metal atoms), when
poisoning phenomena of the exposed metal surface are negligible [8, 14]. From the dispersion
values summarized in Table 3, it is evident that Pd dispersion (Dchemi) slightly decreases with
increasing Pd concentration, as already reported in literature. Moreover, the pre-reduced catalysts
show a lower dispersion than the unreduced one, independently of the reducing agent.
Table 3.
A first hypothesis to explain the loss of Pd dispersion after pre-reduction in liquid phase is the
occurrence of a relevant sintering of the Pd particles; in this case TEM investigation should reveal
an increase in the average particle diameter going from unreduced to pre-reduced catalysts. For this
reason, a series of TEM images were collected on both 5PdAl and 5PdAl(F); three representative
images are shown in Figure 6a-c. In all cases, Pd particles having a fcc structure (as evidenced by
electron diffraction, see insets in Figure 6a-c) are homogeneously distributed on the support in an
isolated form, whereas no aggregates are observed (Figure not shown). A careful analysis of several
TEM images revealed that the average Pd particle size increases moderately after the reduction
process, but it can not account for the whole loss of Pd dispersion as found by CO chemisorption.
Unfortunately, it is not possible to quantitatively estimate the change in particle size as already done
in previous cases [14, 15], mainly because the cubo-octahedral morphology of Pd particles exhibits
(111) and (100) faces in different ratio (see arrows and labels in Figure 8), that makes difficult the
identification of the particle diameter. As an example, Figure 6b shows a Pd particle terminating
mainly with (111) faces, whereas in the Pd particle shown in Figure 6a and c the extension of (100)
17
faces is larger. In all the cases, the particle diameter would result in a different value according to
the direction in which it is evaluated. As TEM provides only the projection of the particle on the
plane perpendicular to the electron beam axis, and not a tri-dimensional reconstruction of the
particles, a reliable particle size distribution can not be obtained in the present conditions, contrarily
to what done in the past on samples characterized by particles with symmetrical shape [14, 15].
Figure 6.
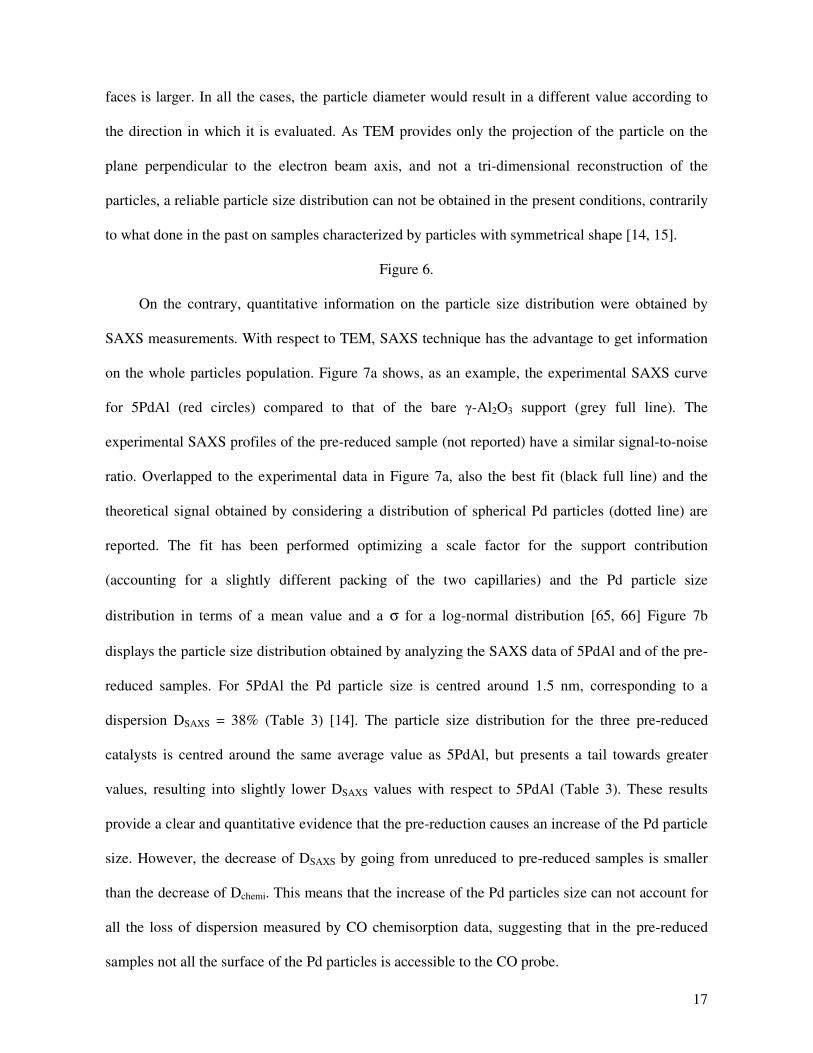
On the contrary, quantitative information on the particle size distribution were obtained by
SAXS measurements. With respect to TEM, SAXS technique has the advantage to get information
on the whole particles population. Figure 7a shows, as an example, the experimental SAXS curve
for 5PdAl (red circles) compared to that of the bare γ-Al2O3 support (grey full line). The
experimental SAXS profiles of the pre-reduced sample (not reported) have a similar signal-to-noise
ratio. Overlapped to the experimental data in Figure 7a, also the best fit (black full line) and the
theoretical signal obtained by considering a distribution of spherical Pd particles (dotted line) are
reported. The fit has been performed optimizing a scale factor for the support contribution
(accounting for a slightly different packing of the two capillaries) and the Pd particle size
distribution in terms of a mean value and a σ for a log-normal distribution [65, 66] Figure 7b
displays the particle size distribution obtained by analyzing the SAXS data of 5PdAl and of the pre-
reduced samples. For 5PdAl the Pd particle size is centred around 1.5 nm, corresponding to a
dispersion DSAXS = 38% (Table 3) [14]. The particle size distribution for the three pre-reduced
catalysts is centred around the same average value as 5PdAl, but presents a tail towards greater
values, resulting into slightly lower DSAXS values with respect to 5PdAl (Table 3). These results
provide a clear and quantitative evidence that the pre-reduction causes an increase of the Pd particle
size. However, the decrease of DSAXS by going from unreduced to pre-reduced samples is smaller
than the decrease of Dchemi. This means that the increase of the Pd particles size can not account for
all the loss of dispersion measured by CO chemisorption data, suggesting that in the pre-reduced
samples not all the surface of the Pd particles is accessible to the CO probe.

18
Figure 7.
As a matter of fact, in addition to the moderate increase of Pd particle size by going from 5PdAl
to 5PdAl(F), TEM images revealed the occurrence of an embedding of the Pd particles into the
Al2O3 support, a phenomenon that undoubtedly contributes to the loss of Pd dispersion after
reduction in the liquid phase. In fact, although already a fraction of Pd particles were partially
buried into Al2O3 in 5PdAl sample, an important fraction was protruding out of the surface (an
example is shown in Figure 6c). In contrast, nearly all the Pd particles are partially embedded into
the support in 5PdAl(F) sample (Figure 6b). A strong metal-support interaction is typically
observed in the presence of highly reducible supports (such as TiO2 and CeO2) and in those cases
H2 reduction at high temperature (≥ 773 K) brings about a relevant decrease in the chemisorption
ability of the metal. Although the final effect is similar, the phenomenon discussed herein has a
different origin and reflects a high mobility of the Al2O3 support, even in absence of H2 at high
temperature. Recently, we have shown that relevant changes in the morphology of some supports
(e.g. γ-Al2O3 and SiO2-Al2O3) can occur during catalyst preparation [16]. In particular, an increase
in surface area and decrease in the pore volume was observed on γ-Al2O3 after the Pd precipitation.
These morphological changes were attributed to the mobility of Al2O3, induced by the basic
medium used during Pd deposition-precipitation. The presence of a fraction of Pd particles
embedded in the support already in 5PdAl (see Figure 6a) is in agreement with the results discussed
above. The phenomenon becomes much more evident in 5PdAl(F) because the catalyst remains for
longer time in an alkaline solution (Na-formate used for reduction), thus favouring a further
mobility of the Al2O3 support. Summarizing, reduction in the liquid phase brings about a decrease
in Pd dispersion that is partially explained by a sintering of Pd particles (quantitatively determined
by SAXS measurements) and partially by their embedding into Al2O3 (which is observed by TEM
and explains the discrepancy between Dchemi and DSAXS for the pre-reduced catalysts), due the high
mobility of the support in the alkaline environment characterizing the catalyst preparation.

19
3.4.2. Pd disorder (TPR and FT-IR of adsorbed CO)
Additional information on the properties of the supported Pd particles can be obtained by TPR
data in the region of the negative peak due to hydride decomposition. A magnification of TPR
curves of 5PdAl and pre-reduced samples in the Pd hydride decomposition region is shown in
Figure 8. All the samples were subjected to the same treatment performed during CO chemisorption
measurements, i.e. drying in air at 393 K followed by reduction in H2 at the same temperature. The
curves of unreduced and pre-reduced samples differ both in integrated area of the negative peak and
in peak position. The integrated area allows the calculation of the H/Pd ratio in Pd hydride, as
summarized in Table 3. The temperature of hydride decomposition appears to be strictly correlated
to H/Pd ratio suggesting that both of them are dependent on the same property. As already pointed
out, the reduction in liquid medium confers to Pd particles specific characteristics, independently on
reductant.
It is well known that the H/Pd value decreases upon increasing the Pd dispersion; the same
trend is shown by the temperature of the hydride decomposition [39, 67-74]. However, both
quantities depend also on the internal disorder of the Pd particles, due to both framework defects,
impurities or decorations: the lower the H/Pd ratio, the more disordered the Pd particles [68-70, 72,
74-76]. The two factors affecting the H/Pd ratio and the decomposition temperature of the hydride
are often correlated each other because the smallest particles tend to be more disordered than the
bigger ones [75]. Thus, it is difficult to decide the importance of the relative contribution of the two
characteristics, i.e. particle size and internal disorder, to H/Pd ratio and decomposition temperature.
According to TEM and SAXS evaluations, that point out only a modest difference of Pd particle
size between 5PdAl and 5PdAl(F), we must conclude that the Pd particles of the unreduced catalyst
are more disordered than those of pre-reduced ones, probably because of the milder conditions and
slower rate of the reduction in liquid medium with respect to those of reduction with H2 in gas
phase.
Figure 8.

20
FT-IR spectroscopy of adsorbed CO has been used to obtain information on the surface
regularity of the final Pd particles; these data provide information complementary to those obtained
by TPR, which gave indication on the Pd disorder in the bulk. Indeed, FT-IR spectroscopy of
adsorbed CO is a well established technique to obtain information on the exposed faces of
supported metal nanoparticles and on their defectivity [14, 17, 20, 31, 52-61]. The FT-IR spectra of
CO adsorbed at room temperature on unreduced and pre-reduced samples subjected to the same
treatment performed during CO chemisorption measurements (i.e. dried in air at 393 K and
successively reduced in H2 at the same temperature), are shown in Figure 9 as a function of CO
pressure. In our experimental conditions, θmax (blue curve) corresponds to T = 300 K and PCO = 50
Torr, whereas θmin (red curve) is obtained by evacuation at 300 K down to 10-4
Torr. In all cases, the
IR spectrum at the maximum CO coverage (blue) shows three main IR absorption bands at around
2090, 1940 and 1985 cm-1
, which are characteristic of linear and bridged carbonyls on (111) faces,
and of bridged carbonyls on (100) faces, respectively [17, 20, 55, 58, 77-91]. Therefore, FT-IR
spectra are in good agreement with the morphology determined by TEM images (Figure 6), which
showed Pd particles terminating with (111) and (100) faces in different proportion. All of the above
mentioned IR absorption bands evolve upon decreasing CO pressure, as a consequence of the
decreasing CO population, as it is well known in literature [17, 20, 55, 58, 77-91]. In particular,
linear carbonyls are the most reversible adsorbed species and the corresponding IR absorption band
downward shifts of about 15 cm-1
, because of the removal of coupling between adjacent CO
oscillators. At lower CO coverage, an additional IR absorption band around 2050 cm-1
emerges,
which is assigned to linear carbonyls on defective sites; these species are irreversible upon
outgassing at room temperature.
Two main differences are observed between the FT-IR spectra of CO adsorbed on 5PdAl
and those of CO adsorbed on the pre-reduced samples. Although the types of surface Pd carbonyls
are the same (same frequency position of all the IR absorption bands), their relative amount is
different (different relative intensity of the three IR absorption bands). In particular, by comparing

21
the IR spectra at the highest CO coverage, the following differences can be noticed: (i) the IR
absorption bands characteristic of linear and bridged carbonyls have an almost equal intensity in
5PdAl, whereas for the three pre-reduced samples the IR absorption band due to linear carbonyls
has a lower intensity; (ii) the IR absorption band at 1985 cm-1
, assigned to bridged carbonyls on
(100) faces, is scarcely visible in 5PdAl, suggesting that (100) faces are less extended than (111)
faces. The same IR absorption band is more prominent in the IR spectra of CO adsorbed on the
three pre-reduced samples. A correlation between the Pd particle size and the relative proportion of
linear and bridged carbonyls in the IR spectra of adsorbed CO has been already established [92, 93].
On small and amorphous (i.e. highly defective) metal particles CO is adsorbed prevalently in the
linear (terminal) mode, whereas an increase in the particle size (and thus in the order) results in the
formation of a greater number of bridged carbonyls [17, 55, 60, 92-95]. On these bases, the overall
sequence of FT-IR spectra shown in Figure 9 points out that Pd particles on 5PdAl display a more
defective surface than those on the pre-reduced catalysts. Therefore, pre-reduction in liquid phase
would be responsible of formation of bigger Pd particles more ordered, both internally (as obtained
by TPR) and on the surface (as shown by FT-IR spectroscopy of adsorbed CO).
Figure 9.
4. Conclusions
The present work investigates the relationship between the reduction state of Pd-based alumina-
supported catalysts as loaded into the reactor, and their properties and catalytic performances in the
debenzylation of 4-benzyloxyphenol. It was found that, after pre-reduction in the liquid phase,
about 50% of the Pd in the catalyst is still oxidized. The reason is attributed to a partial re-
oxidization of the Pd0 particles formed during the reduction step, because of the contact of wet
catalyst with the air. The re-oxidation involves both, surface and sub-surface. However, the external
Pd2+
phase is easier to be reduced than bulk PdO; therefore the pre-reduced catalyst starts faster in
reaction conditions, as testified by the absence of an induction time in the adopted experimental

22
conditions. The easier reducibility of the pre-reduced catalyst has been explained as due to the
greater structural disorder of a few external PdO layers when compared to a bulk PdO.
Besides affecting the catalyst reducibility, the pre-reduction in liquid phase influences also the
properties of the final Pd nanoparticles in many aspects and, consequently, the catalyst
performances. In particular, the Pd dispersion decreases (CO chemisorption data, Table 3) mainly as
a consequence of: (i) a greater interaction of the Pd particles with the support (embedding), as
observed by TEM (Figure 6), and (ii) a particle sintering (as suggested qualitatively by TEM and
demonstrated quantitatively by SAXS). Moreover, the pre-reduction in liquid phase brings to an
increase of the order (both internal and superficial) of the Pd particles (TPR and FT-IR data, Figure
8 and Figure 9). As a consequence, the final Pd particles display (qualitatively) the same types of
active sites in the two catalysts, although in different proportion. In particular, Pd particles in pre-
reduced catalysts are bigger than those in unreduced one and more ordered both internally and on
the surface; as a consequence, the latter have a larger fraction of sites located on extended faces,
than on edges or corners. A greater structural order of supported Pd particles would favour the
debenzylation of 4-benzyloxyphenol as well as other surface sensitive reactions.
Acknowledgments
Luca Diano is kindly acknowledged for performing some of the FT-IR experiments. We are
indebted with the whole staff of DUBBLE BM26 beamline at the ESRF (particularly to Daniel
Hermida Merino, S. Nikitenko and W. Brass) where both Pd K-edge EXAFS (BM26A) and SAXS
(BM26B) measurements were performed. We are particularly grateful to Andrea Governini (Chimet
SpA) for the catalytic activity measurements and to Massimo Graziani (Chimet SpA) for the
chemisorption measurements.The authors wish to thank Adriano Zecchina and Francesco Giannici
for the stimulating discussion.

23
References
[1] H.-U. Blaser, A. Indolese, A. Schnyder, H. Steiner and M. Studer, J. Mol. Catal. A: Chem., 173
(2001) 3.
[2] N. Pernicone, M. Cerboni, G. Prelazzi, F. Pinna and G. Fagherazzi, Catal. Today, 44 (1998) 129.
[3] D. Duca, F. Arena, A. Parmaliana and G. Deganello, Appl. Catal., A, 172 (1998) 207.
[4] F. Figueras and B. Coq, J. Mol. Catal. A: Chem., 173 (2001) 223.
[5] E. Santacesaria, P. Wilkinson, P. Babini and S. Carra, Ind. Eng. Chem. Res., 27 (1988) 780.
[6] G. Neri, M.G. Musolino, C. Milone, D. Pietropaolo and S. Galvagno, Appl. Catal. A-Gen., 208
(2001) 307.
[7] M. Studer and H.U. Blaser, J. Mol. Catal. A-Chem., 112 (1996) 437.
[8] G. Agostini, E. Groppo, A. Piovano, R. Pellegrini, G. Leofanti and C. Lamberti, Langmuir, 26
(2010) 11204.
[9] K.G. Griffin, S. Hawker and M.A. Batti, The Removal of Protecting Groups by Catalytic
Hydrogenation, In Catalysis of organic Reactions, R.E. Malz Ed., Marcel Dekker, Inc., 1996,
[10] W.M. Pearlman, Tetrahedron Lett., 8 (1967) 1663.
[11] A.M.R. Galletti, F. Bonaccorsi, F. Calvani and C. Di Bugno, Catal. Commun., 7 (2006) 896.
[12] H.-U. Blaser, U. Siegrist and H. Steiner, Aromatic Nitro Compounds In Fine Chemicals
through Heterogeneous Catalysis, R.A. Sheldon and H. van Bekkum Ed., Wiley-VCH, Weinheim,
2001,
[13] E. Auer, A. Freund, J. Pietsch and T. Tacke, Appl. Catal. A-Gen., 173 (1998) 259.
[14] G. Agostini, R. Pellegrini, G. Leofanti, L. Bertinetti, S. Bertarione, E. Groppo, A. Zecchina and
C. Lamberti, J. Phys. Chem. C, 113 (2009) 10485.
[15] R. Pellegrini, G. Leofanti, G. Agostini, L. Bertinetti, S. Bertarione, E. Groppo, A. Zecchina and
C. Lamberti, J. Catal., 267 (2009) 40.
[16] R. Pellegrini, G. Leofanti, G. Agostini, M. Rivallain, E. Groppo and C. Lamberti, Langmuir,
25 (2009) 6476.

24
[17] E. Groppo, W. Liu, O. Zavorotynska, G. Agostini, G. Spoto, S. Bordiga, C. Lamberti and A.
Zecchina, Chem. Mater., 22 (2010) 2297.
[18] P. Kasai and R. Bishop, J. Phys. Chem., 81 (1977) 152.
[19] J. Michalik, M. Narayama and L. Kevan, J. Phys. Chem., 89 (1985) 4553.
[20] D. Tessier, A. Rakai and F. Bozonverduraz, J. Chem. Soc.-Faraday Trans., 88 (1992) 741.
[21] M. Boudart, Chem. Rev., 95 (1995) 661.
[22] W.R. Alcorn and T.J. Sullivan, Evaluation of Hydrogenation Catalysts in Batch Reactors, In
Catalysis of Organic Reactions, J.R. Kosak Ed., Marcel Dekker, Inc., 1984,
[23] H.S. Fogler In Elements of Chemical Reaction Engineering, Ed., Prentice-Hall Inc., 1992.
[24] G.W. Roberts, The Influence of Mass and Heat Transfer on the Performance of the
Heterogeneous Catalysts in Gas/Liquid/Solid Systems, In Catalysis in Organic Synthesis, P.N.
Rylander and H. Greenfield Ed., Academic Press, 1976,
[25] J.R. Anderson and K.C. Pratt, Surface area measurement, In Introduction to Characterization
and Testing of Catalysts, Ed., Academic Press, 1986,
[26] G. Prelazzi, M. Cerboni and G. Leofanti, J. Catal., 181 (1999) 73.
[27] W. Bras, I.P. Dolbnya, D. Detollenaere, R. van Tol, M. Malfois, G.N. Greaves, A.J. Ryan and
E. Heeley, J. Appl. Crystall., 36 (2003) 791.
[28] A.P. Hammersley, 1998.
[29] A. Longo, P. Calandra, M.P. Casaletto, C. Giordano, A.M. Venezia and V. Turco Liveri,
Mater. Chem. Phys. , 96 (2006) 66–72.
[30] E. Cattaruzza, F. D'Acapito, F. Gonella, A. Longo, A. Martorana, G. Mattei, C. Maurizio and
D. Thiaudière, Appl. Cryst., 33 (2000) 740.
[31] E. Groppo, S. Bertarione, F. Rotunno, G. Agostini, D. Scarano, R. Pellegrini, G. Leofanti, A.
Zecchina and C. Lamberti, J. Phys. Chem. C, 111 (2007) 7021.
[32] M. Freifelder In Practical Catalytic Hydrogenation Techniques and Applications, Ed., John
Wiley & Sons, Inc., 1971.

25
[33] S. Nishimura In Handbook of Heterogeneous Catalytic Hydrogenation for Organic Synthesis,
Ed., John Wiley & Sons, Inc., 2001.
[34] L.S. Seif, K.M. Partyka and J.E. Hengeveld, Selective Hydrogenolysis of Benzyl and
Carbobenzyloxy Protecting Groups for Hydroxyl and Amino Functions, In Catalysis of Organic
Reactions, D.W. Blackburn Ed., Marcel Dekker, Inc., New York, 1990,
[35] H. Knözinger, Temperature-Programmed Reduction and Oxidation, In Handbook of
Heterogeneous Catalysis, Ed., 2008,
[36] N.W. Hurst, S.J. Gentry, A. Jones and B.D. McNicol, Catal. Rev., 24 (1982) 233.
[37] J.W. Niemantsverdriet, Temperature-Programmed Techniques, In Spectroscopy in Catalysis:
An Introduction, Ed., Wiley-VCH, 2007,
[38] B.C. Campo, M.A. Volpe and C.E. Gigola, Ind. Eng. Chem. Res., 48 (2009) 10234.
[39] C. Amorim and M.A. Keane, J. Colloid Interface Sci., 322 (2008) 196.
[40] C.W. Chou, S.J. Chu, H.J. Chiang, C.Y. Huang, C.J. Lee, S.R. Sheen, T.P. Perng and C.T.
Yeh, J. Phys. Chem. B, 105 (2001) 9113.
[41] H. Conrad, G. Ertl, J. Kiippers and E.E. Latta, Surf. Sci., 65 (1977) 245.
[42] T.W. Orent and S.D. Bader, Surf. Sci., 115 (1982) 323.
[43] M. Peuckert, J. Phys. Chem., 89 (1985) 2481.
[44] G. Perez-Osorio, F. Castillon, A. Simakov, H. Tiznado, F. Zaera and S. Fuentes, Appl. Catal.
B-Environ., 69 (2007) 219.
[45] H.Q. Zhu, Z.F. Qin, W.J. Shan, W.J. Shen and J.G. Wang, J. Catal., 233 (2005) 41.
[46] H. Tiznado, S. Fuentes and F. Zaera, Langmuir, 20 (2004) 10490.
[47] C. Morterra and G. Magnacca, Catal. Today, 27 (1996) 497.
[48] A. Palazov, C.C. Chang and R.J. Kokes, J. Catal., 36 (1975) 338.
[49] W. Juszczyk, Z. Karpinski, I. Ratajczykowa, Z. Stanasiuk, J. Zielinki, L.L. Sheu and W.M.H.
Sachtler, J. Catal., 120 (1989) 68.
[50] K. Moller and T. Bein, J. Phys. Chem., 94 (1990) 845.

26
[51] Z.C. Zhang, H.Y. Chen and W.M.H. Sachtler, J. Chem. Soc.-Faraday Trans., 87 (1991) 1413.
[52] R. Craciun, W. Daniell and H. Knozinger, Appl. Catal. A-Gen., 230 (2002) 153.
[53] A.N. Pestryakov, V.V. Lunin, S. Fuentes, N. Bogdanchikova and A. Barrera, Chem. Phys.
Lett., 367 (2003) 102.
[54] M. Skotak, Z. Karpinski, W. Juszczyk, J. Pielaszek, L. Kepinski, D.V. Kazachkin, V.I.
Kovalchuk and J.L. d'Itri, J. Catal., 227 (2004) 11.
[55] S. Bertarione, D. Scarano, A. Zecchina, V. Johanek, J. Hoffmann, S. Schauermann, M.M.
Frank, J. Libuda, G. Rupprechter and H.J. Freund, J. Phys. Chem. B, 108 (2004) 3603.
[56] A.M.J. van der Eerden, T. Visser, A. Nijhuis, Y. Ikeda, M. Lepage, D.C. Koningsberger and
B.M. Weckhuysen, J. Am. Chem. Soc., 127 (2005) 3272.
[57] T. Lear, R. Marshall, E.K. Gibson, T. Schutt, T.M. Klapotke, G. Rupprechter, H.J. Freund,
J.M. Winfield and D. Lennon, Phys. Chem. Chem. Phys., 7 (2005) 565.
[58] T. Lear, R. Marshall, J.A. Lopez-Sanchez, S.D. Jackson, T.M. Klapotke, M. Baumer, G.
Rupprechter, H.J. Freund and D. Lennon, J. Chem. Phys., 123 (2005) Art. No. 174706.
[59] T. Lear, R. Marshall, J.A. Lopez-Sanchez, S.D. Jackson, T.M. Klapotke, M. Baumer, G.
Rupprechter, H.J. Freund and D. Lennon, J. Chem. Phys., 124 (2006) Art. No. 069901.
[60] S. Bertarione, C. Prestipino, E. Groppo, D. Scarano, G. Spoto, A. Zecchina, R. Pellegrini, G.
Leofanti and C. Lamberti, Phys. Chem. Chem. Phys., 8 (2006) 3676.
[61] L. Bollmann, J.L. Ratts, A.M. Joshi, W.D. Williams, J. Pazmino, Y.V. Joshi, J.T. Miller, A.J.
Kropf, W.N. Delgass and F.H. Ribeiro, J. Catal., 257 (2008) 43.
[62] J.J. Chen and E. Ruckenstein, J. Phys. Chem., 85 (1981) 1606.
[63] E.H. Voogt, A.J.M. Mens, O.L.J. Gijzeman and J.W. Geus, Surf. Sci., 350 (1996) 21.
[64] R.J. Farrauto, J.K. Lampert, M.C. Hobson and E.M. Waterman, Appl. Catal. B, 6 (1995) 263.
[65] J.S. Pedersen, J. Appl. Crystallogr., 27 (1994) 595.
[66] J.S. Pedersen, Phys. Rev. B, 47 (1993) 657.
[67] P.C. Aben, J. Catal., 10 (1968) 224.

27
[68] T.B. Flanagan, R. Balasubramaniam and R. Kirchheim, Platinum Metals Rev., 45 (2001) 114.
[69] N.K. Nag, J. Phys. Chem. B, 105 (2001) 5945.
[70] M. Bonarowska, J. Pielaszek, W. Juszczyk and Z. Karpinski, J. Catal., 195 (2000) 304.
[71] E.W. Shin, S.I. Cho, J.H. Kang, W.J. Kim, J.D. Park and S.H. Moon, Korean J. Chem. Eng., 17
(2000) 468.
[72] N. Krishnankutty, J. Li and M.A. Vannice, Appl. Catal. A-Gen., 173 (1998) 137.
[73] F. Pinna, M. Signoretto, G. Strukul, S. Polizzi and N. Pernicone, React. Kinet. Catal. Lett., 60
(1997) 9.
[74] A.L. Bonivardi and M.A. Baltanas, J. Catal., 138 (1992) 500.
[75] F.A. Lewis, Platinum Metals Rev., 4 (1960) 132.
[76] G. Fagherazzi, A. Benedetti, S. Polizzi, A. Mario, F. Pinna, M. Signoretto and N. Pernicone,
Catal. Lett., 32 (1995) 293.
[77] X.P. Xu and D.W. Goodman, J. Phys. Chem., 97 (1993) 7711.
[78] X.P. Xu, P.J. Chen and D.W. Goodman, J. Phys. Chem., 98 (1994) 9242.
[79] V.E. Henrich and P.A. Cox In The Surface Science of Metal Oxides, Ed., Cambridge
University Press, Cambridge, 1994.
[80] M.A. Barteau, Chem. Rev., 96 (1996) 1413.
[81] M.A. Barteau and J.M. Vohs, Oxide model systems, In Handbook of Heterogeneous Catalysis,
G. Ertl, H. Knözinger and J. Weitkamp Ed., Wiley-VCH, Weinheim, 1997, 2.
[82] C. Xu and D.W. Goodman, Ultrathin oxide films: model catalyst supports, In Handbook of
Heterogeneous Catalysis, G. Ertl, H. Knözinger and J. Weitkamp Ed., Wiley-VCH, Weinheim,
1997, 2.
[83] H.J. Freund, Angew. Chem.-Int. Edit. Engl., 36 (1997) 452.
[84] K. Wolter, O. Seiferth, J. Libuda, H. Kuhlenbeck, M. Baumer and H.J. Freund, Chem. Phys.
Lett., 277 (1997) 513.

28
[85] K. Wolter, O. Seiferth, J. Libuda, H. Kuhlenbeck, M. Baumer and H.J. Freund, Surf. Sci., 404
(1998) 428.
[86] K. Wolter, O. Seiferth, H. Kuhlenbeck, M. Bäumer and H.J. Freund, Surf. Sci., 399 (1998)
190.
[87] C.R. Henry, Surf. Sci. Rep., 31 (1998) 235.
[88] S. Surnev, M. Sock, M.G. Ramsey, F.P. Netzer, M. Wiklund, M. Borg and J.N. Andersen,
Surf. Sci., 470 (2000) 171.
[89] H.J. Freund, M. Baumer and H. Kuhlenbeck, Adv. Catal., 45 (2000) 333.
[90] N. Sheppard and C. De La Cruz, Catal. Today, 70 (2001) 3.
[91] E. Ozensoy and D.W. Goodman, Phys. Chem. Chem. Phys., 6 (2004) 3765.
[92] J.S. Bradley, E.W. Hill, S. Behal, C. Klein, B. Chaudret and A. Duteil, Chem. Mat., 4 (1992)
1234.
[93] J.S. Bradley, J.M. Millar, E.W. Hill and S. Behal, J. Catal., 129 (1991) 530.
[94] L.L. Sheu, Z. Karpinski and W.-M.H. Sachtler, J. Phys. Chem., 93 (1989) 4890.
[95] L.-L. Sheu, H. Knozinger and S.W.M. H., J. Am. Chem. Soc., 111 (1989) 8 125.

29
Figures and Captions
H2
cat
H2
cat
Scheme 1. Debenzylation of 4-benzyloxyphenol to form hydroquinone and toluene.

30
Figure 1. Mass transfer evaluation in the debenzylation of 4-benzyloxyphenol. Part (a): reciprocal
plot of activity (r) versus the catalyst amount (m). Reaction conditions: PdCw(F) catalyst,
atmospheric pressure, 308 K, 2000 rpm stirring speed, catalyst loading: 300, 500 and 700 mg. Part
(b): Arrhenius plot. PdCw(F) catalyst, atmospheric pressure, catalyst loading 500 mg, 2000 rpm
stirring speed, temperature: 293, 308, and 323 K.

31
Figure 2. TPR curves of 5PdAl (black) and 5PdAl(F) (red) samples either dried in air at 393 K. The
labels on the TPR curves refer to the sample code of Table 2. The curves are vertically shifted for
clarity.
32
Figure 3. TPR signals for 5PdAl(F) reduced in H2 at 393 K (grey) and of the same sample
successively treated in air at 300 K (blue) and 393 K (green), compared to the TPR signal of
5PdAl(F) dried in air at 393 K (red). The labels on the TPR curves refer to the sample code of Table
2.

33
Figure 4. FT-IR spectra of CO adsorbed at 100 K on 5PdAl and 5PdAl(F) samples dried either in air
(black and green spectra) or in vacuum (blue and red spectra) at 393 K, compared to the spectrum
obtained in the same conditions on 5PdAl reduced in H2 at 393 K (grey). The numeric labels refer
to the sample code of Table 2.

34
Figure 5. Starting reduction temperature (Tstart) as a function of the Pd2+
fraction in the catalysts as
determined by TPR experiments. The labels on the scattered points refer to the sample code of
Table 2.

35
Figure 6. Selected TEM micrographs of a few Pd particles on both 5PdAl (parts a and c) and
5PdAl(F) (part b) samples (top part) and schematic representation of the exposed faces (bottom
part). The insets show the electron diffraction of each particle, demonstrating the fcc structure.

36
Figure 7. Part a): Experimental SAXS curve of 5PdAl (dots), compared to the signal of the bare Al
support (grey). Also the theoretical signal obtained by considering spherical Pd particles (dotted
line) and the best fit (black line) are reported. Part b): particle size distribution for the unreduced
and pre-reduced samples obtained by analyzing the SAXS data.

37
Figure 8. TPR signals of PdO bulk, unreduced and pre-reduced catalysts dried in air at 393 K and
then reduced in H2 at 393 K, in the region of the negative peak due to hydride decomposition.

38
Figure 9. FT-IR spectra of CO adsorbed at room temperature on unreduced and pre-reduced
samples, reduced in H2 at the 393 K. The sequences of FT-IR spectra show the effect of decreasing
PCO, from 50 Torr (blue spectrum) to 10-4
Torr (red).

39
Tables and Captions
Table 1. Catalyst activity (in cm3min
-1) and turnover frequency (TOF, s
-1, defined as the number of
H2 molecules consumed per second per number of surface atoms determined by CO chemisorption
as an independent technique) of unreduced PdAl catalysts as a function of the Pd loading and of
pre-reduced 5PdAl catalysts.
Sample Induction
time (min)
Activity
(cm3min
-1)
TOF
(s-1
)
2PdAl 27 5.0 0.098
3.5PdAl 20 6.2 0.071
5PdAl 11 11.3 0.093
5PdAl(F) 0 12.9 0.156
5PdAl(B) 0 13.7 0.176
5PdAl(H) 0 14.4 0.170
Table 2. Summary of the TPR data obtained for 5PdAl and 5PdAl(F) samples subjected to different
thermal treatments. Also the data obtained for a bulk, unsupported, PdO sample are reported for
comparison (samples 0 and 1). Tstart and Tmax refer, respectively, to the starting and maximum
temperature values of the hydrogen consumption peak due to the Pd2+
→ Pd0 reduction; Pd
2+/Pdtot is
the fraction of Pd2+
present in the catalyst (see Experimental).
Code Sample Treatment Tstart (K) Tmax (K) Pd2+
/Pdtot
0 PdO air 393 K 260 298 1.00
1 PdO H2 393 K + air 393 K 173 198 0.16
2 5PdAl air 393 K 265 308 0.97
2’ 5PdAl N2 393 K 247 271 1.02
3 5PdAl H2 393 K - - 0.00
4 5PdAl H2 393 K + air 300 K 175 256 0.35
5 5PdAl(F) air 393 K 213 315 0.57
5’ 5PdAl(F) N2 393 K 163 223 0.58
6 5PdAl(F) H2 393 K - - 0.00
7 5PdAl(F) H2 393 K + air 300 K 172 n.d. 0.25
8 5PdAl(F) H2 393 K + air 393 K 201 301 0.52

40
Table 3. Pd dispersion as obtained by CO chemisorption data (DChemi) and, when available, by
SAXS data (DSAXS), minimum of the negative peak due to the decomposition of the formed Pd
hydride (Tmin) and corresponding H/Pd in Pd hydride, as obtained by TPR on the whole set of
samples investigated in this work.
Sample Dchemi (%) DSAXS (%) Tmin (K) H/Pd in Pd
hydride
PdO 0.2 - 339 0.50
2PdAl 38 n.a. 321 0.17
3.5PdAl 37 n.a. 320 0.17
5PdAl 36 38 322 0.19
5PdAl(F) 24 31 328 0.27
5PdAl(B) 23 31 329 0.29
5PdAl(H) 25 32 327 0.28