The 'Home International' Comparisons in Vocational Qualifications
22
This article was downloaded by: [University of Stirling Library] On: 21 June 2012, At: 01:45 Publisher: Routledge Informa Ltd Registered in England and Wales Registered Number: 1072954 Registered office: Mortimer House, 37-41 Mortimer Street, London W1T 3JH, UK Comparative Education Publication details, including instructions for authors and subscription information: http://www.tandfonline.com/loi/cced20 The 'Home International' Comparisons in Vocational Qualifications Roy Canning & Martin Cloonan Available online: 28 Jun 2010 To cite this article: Roy Canning & Martin Cloonan (2002): The 'Home International' Comparisons in Vocational Qualifications, Comparative Education, 38:2, 189-209 To link to this article: http://dx.doi.org/10.1080/03050060220140575 PLEASE SCROLL DOWN FOR ARTICLE Full terms and conditions of use: http://www.tandfonline.com/page/terms-and- conditions This article may be used for research, teaching, and private study purposes. Any substantial or systematic reproduction, redistribution, reselling, loan, sub- licensing, systematic supply, or distribution in any form to anyone is expressly forbidden. The publisher does not give any warranty express or implied or make any representation that the contents will be complete or accurate or up to date. The accuracy of any instructions, formulae, and drug doses should be independently verified with primary sources. The publisher shall not be liable for any loss, actions, claims, proceedings, demand, or costs or damages whatsoever or howsoever caused arising directly or indirectly in connection with or arising out of the use of this material.
Transcript of The 'Home International' Comparisons in Vocational Qualifications

This article was downloaded by: [University of Stirling Library]On: 21 June 2012, At: 01:45Publisher: RoutledgeInforma Ltd Registered in England and Wales Registered Number: 1072954Registered office: Mortimer House, 37-41 Mortimer Street, London W1T 3JH, UK
Comparative EducationPublication details, including instructions for authors andsubscription information:http://www.tandfonline.com/loi/cced20
The 'Home International'Comparisons in VocationalQualificationsRoy Canning & Martin Cloonan
Available online: 28 Jun 2010
To cite this article: Roy Canning & Martin Cloonan (2002): The 'Home International'Comparisons in Vocational Qualifications, Comparative Education, 38:2, 189-209
To link to this article: http://dx.doi.org/10.1080/03050060220140575
PLEASE SCROLL DOWN FOR ARTICLE
Full terms and conditions of use: http://www.tandfonline.com/page/terms-and-conditions
This article may be used for research, teaching, and private study purposes.Any substantial or systematic reproduction, redistribution, reselling, loan, sub-licensing, systematic supply, or distribution in any form to anyone is expresslyforbidden.
The publisher does not give any warranty express or implied or make anyrepresentation that the contents will be complete or accurate or up to date. Theaccuracy of any instructions, formulae, and drug doses should be independentlyverified with primary sources. The publisher shall not be liable for any loss,actions, claims, proceedings, demand, or costs or damages whatsoever orhowsoever caused arising directly or indirectly in connection with or arising out ofthe use of this material.

Comparative Education Volume 38 No. 2 2002 pp. 189–209
The ‘Home International’Comparisons in VocationalQuali� cationsROY CANNING & MARTIN CLOONAN
ABSTRACT The paper provides a comparative analysis of the take-up and usage of NationalVocational Quali� cations within two constituent countries in the UK (Scotland and England). Themethodology of the study is based upon the use of the quarterly Labour Force Survey for spring 1998and extensive case study material. The research suggests that Scotland under-performs in the take-upof national vocational quali� cations in comparison with England. However, the paper argues thatthis is not a cause for concern and that it should be seen as a positive outcome indicating a higherlevel of educational achievement and a better mix between job opportunities and labour market skills.The research evidence also suggests that social class, gender and spatiality largely determineparticipation levels in work-based, post-16 education and training. Finally, it is argued thatintra-national comparisons between nation states in the UK can be misleading in arriving atmeaningful policy measures in vocational education. A regional analysis both within a constituentcountry of the UK and across such constituent countries may be more helpful in arriving at a broadersocio-economic solution to what are perceived as local problems.
Introduction
Recent research from Raffe et al. (1999) has suggested that a ‘Home Internationals’ approachto educational research involving comparative studies between different parts of the UnitedKingdom would be a fruitful one in terms of making a contribution to theory, notingdifferences, providing knowledge for practical purposes and in� uencing policy. It alsosuggested that the potential for such an analysis was growing.
To a great extent such sentiments chime well within the current political climate in theUK. With devolution [1] in Scotland, Wales and Northern Ireland and further divergence,the scope for more research based upon such intranational comparisons seems to be obvious.However, it is necessary to urge caution in pursuit of such contrasts. This observation followscomparative research undertaken in the UK by the authors on the take-up of NationalVocational Quali� cations (NVQs) in England with that of Scottish Vocational Quali� cations(SVQs) in Scotland. Both sets of quali� cations were developed in the mid-1980’s to providea work-based vocational route to achieving credentials. The evidence gathered from thisresearch forms the basis for the critique of intranational comparison offered in this paper.
The research falls into four parts. The � rst section describes the methodology. A criticalreview of the literature is given and the limitations of intranational comparative educationstudies are discussed. The national data-sets used in the research are then described and an
Correspondence to: Dr Roy Canning, Institute of Education, Pathfoot Building, University of Stirling,Scotland FK9 4LA, UK. Email: [email protected]
ISSN 0305-0068 print; ISSN 1360-0486 online/02/020189-21 Ó 2002 Taylor & Francis LtdDOI: 10.1080/03050060220140575
Dow
nloa
ded
by [
Uni
vers
ity o
f St
irlin
g L
ibra
ry]
at 0
1:45
21
June
201
2
190 R. Canning & M. Cloonan
outline is provided of the illustrative case studies which are also included. In the secondsection, an intranational comparison is made of the data on vocational quali� cations inEngland and Scotland. Particular attention is paid to the factors that determine the take-upof vocational quali� cations in both countries. The third section deals with regional differ-ences in participation in work-based vocational education within Scotland. Despite a growingliterature on the importance of globalisation and individualisation, the evidence from theresearch suggests that spatiality and social class structures continue strongly to in� uenceeducational outcomes. The � nal section explores the debate surrounding the importance ofintranational comparative studies and argues the case for the formulation of policy invocational education on a more re� ned regional analysis within nations rather than betweenthe politically de� ned constituent countries of the UK.
Comparative intranational research in education has the advantage of providing theoreti-cal insights into the architecture of national education systems and, thus, potentially facili-tates a more re� ned international analysis of complementary clusters of education structures.For instance, the discussion on competence-based education is of international importance.In Europe, outcome-based competence structures are coming to dominate policy making, yetlittle research evidence is used to support their use within vocational education. The recentliterature on competence frameworks emerging from Australia is highly critical of standard-based outcome approaches to vocational education, whilst in South Africa interest is beingshown in quali� cations that are based upon such models. This paper therefore makes a timelycontribution to the ‘competence’ literature set within an intranational comparative frame-work.
Literature
It has become something of a cliche to note that Scotland has an education system that isunique within the UK. Bearing these differences in mind, it would be somewhat surprisingif the take-up and outcomes of Scotland’s vocational education simply mirrored those of therest of the UK. Unsurprisingly, they do not.
In fact, meaningful comparisons between the four home countries are notoriously hardto make and there are a number of particular aspects of Scotland’s situation that mark it outfrom that of the rest of the UK. Examples of this include the recently implemented ‘HigherStill’ programme. Of particular importance to the current research is that:
Compared to England more young people are retained in the school system beyondschool leaving age. (Bamford & Schuller, 1999, p. 26)
Moreover, Scotland has fewer young people leaving school without a quali� cation than otherUK countries—3.6%. This compares to 7.8% in England, and an overall UK � gure of 7.4%(Bamford & Schuller, 1999, p. 11).
Overall, Scotland has a lead over the other UK countries in terms of academicachievement. Thus the Labour Force Survey has also shown that ‘proportionately morepeople in Scotland have an academic quali� cation’ (Bamford & Schuller, 1999, p. 38) andthat 49% of the employed workforce in Scotland was quali� ed to at least level III orequivalent—more than the UK average of 43%. This is signi� cant for the current research asRobinson (1996) found that people with higher education attainment are less likely to takevocational quali� cations.
Scotland not only has the best academic record of any UK country, there is also evidencethat it is more culturally attuned to education than other UK countries. Thus a MORI poll(based on a small sample) found that young Scots value quali� cations more highly than
Dow
nloa
ded
by [
Uni
vers
ity o
f St
irlin
g L
ibra
ry]
at 0
1:45
21
June
201
2

‘Home International’ Comparisons in SVQs/NVQs 191
young people in other regions of the UK and rated training more highly than other regionsof the UK (Bamford & Schuller, 1999). While there is no room for complacency here, neitherare there grounds for despair.
Whilst the Scottish economy in recent years has followed a broadly comparable pathwith that of the rest of the UK, in that it has moved from a manufacturing-based economytowards one dominated by the service sectors (Scottish Of� ce, 1998a), there are also anumber of economic factors peculiar to Scotland which are likely to impact upon thecomparative uptake of SVQs. First, Scotland has traditionally had a higher claimant rate thanthe rest of the UK and this continued in recent years, albeit with one or two aberrations(Blake & Bowman, 1998). Scottish unemployment rates have also historically been higherthan those of the UK as a whole (Scottish Of� ce, 1998b). A great deal of the literature hasnoted that those who are unemployed or otherwise economically inactive are the least likelyto undertake any training or educational courses (DfEE, 1998a).
There are also important regional differences within Scotland’s economy which feed intoits educational performance. Thus while Scotland has improved its quali� cations perform-ance compared to England over a period of twenty-� ve years, there were marked regionaldifferences with, for example, parts of Glasgow considerably under-performing (Bamford &Schuller, 1999). This mirrors a similar pattern across the UK where improved levels ofachievement have also been characterised by major regional variations. Regional variations inNVQ take-up were examined in a 1998 report published by the University of Westminster,which examined the impact of NVQs in London in comparison to the rest of the UK. Thereport claimed that:
There is a North/South divide in connection with participation in governmentsupported training (GST) and in full-time education. Higher participation rates ingovernment training schemes are found in the North, whereas higher full-timeeducation rates are found in the South. (University of Westminster, 1998, p. 5)
The existence of a north-south divide in quali� cations in England was also noted by Schagenet al (1997) and by a 1998 Department for Education and Employment survey which foundthat the region with the most people holding NVQs/SVQs was the economically deprivedNorth West of England (DfEE, 1998b).
The Westminster University report also noted peculiar characteristics of NVQ take-up inLondon, such as the fact that London’s NVQ candidates were likely to be more highlyquali� ed than candidates elsewhere (University of Westminster, 1998). London was alsocharacterised as having a higher take-up of NVQs in the public sector than in the privatesector, which Robinson (1996) claims is not the case across the UK.
The fact that patterns of participation in vocational education in London differ fromthose of the rest of the UK has important implications for SVQ take-up rates. In both casesthe presence of a relatively highly educated workforce militates against high take-up of VQs.Take-up of N/SVQs cannot simply be linked to population size. There is no inherent reasonwhy Scotland’s take-up rate should match its population size. A number of key variables,including the education system, competition from other quali� cations, economic conditionsand occupational strata, also come into play. Given the concentration of NVQs and SVQsinto a number of occupations, mainly in low-level service jobs (Canning, 1998), it isunsurprising that a relatively educated workforce, of the type seen in London and Scotlandhas less use for them than other, less academically-quali� ed, regions. We thus see little meritin simply comparing England and Scotland across-the-board. It makes rather more sense forthe purpose of this research to treat Scotland as a region within the UK.
Dow
nloa
ded
by [
Uni
vers
ity o
f St
irlin
g L
ibra
ry]
at 0
1:45
21
June
201
2

192 R. Canning & M. Cloonan
Regional Comparisons
In England the former Training and Enterprise Councils (TECS) and Government RegionalOf� ces have often criticised a blanket regional approach to training and the compilation ofacross-the-board training targets. For example, one Of� ce noted that it has � ve differenttypes of labour markets within its borders, making simplistic target-setting of limited value.Another had twenty-� ve of the most economically deprived areas in the country within itsdomain, along with some of the country’s richest areas. There can thus be wide variations inparticipation in vocational education within Government regions (Schagen et al., 1997).
Some of the regional differences within Scotland have been illustrated by the ScottishOf� ce (1998b, pp. 9, 28–31) and others. For example, claimant rates have been highest inthe central belt and the Highlands of Scotland (Blake & Bowman, 1998, p. 184). In contrastonly those workers in Surrey, Berkshire, Swindon and London counties and towns in theSouth of England enjoy a higher gross weekly wage than those in Aberdeen. East Lothian andMidlothian regions and towns in Scotland have been of� cially cited as the poorest parts of theUK, while Edinburgh is cited as Britain’s second-richest city after Swindon (Browne, 1998).
With regard to meeting training targets:
The strategies used may need to be very different in an area of old industries, witha population reluctant to move to � nd training, from those appropriate to anarea… with a highly mobile population, prepared to travel… local traditions andaspirations are likely to in� uence the role played by the three main quali� cationroutes, with vocational—and more especially work-based, routes having a widerappeal in some regions than in others. (Schagen et al., 1997, p. 50).
We agree with these sentiments and note further that there is a need to differentiate withinregions as well. There have also been major differences between regions in the achievementof training targets (Bamford & Schuller, 1999, p. 18). We have emphasised here theparticular characteristics that mark Scotland out as a region from the rest of the UK. One ofthese is the state of competition with vocational quali� cations within Scotland.
The main ‘competition’ for SVQs in terms of externally-accredited vocationalquali� cations comes via the Scottish National Certi� cates (including National Certi� catemodules, Higher National Certi� cates and Higher National Diplomas), on the one hand andEnglish NVQs and traditional UK vocational quali� cations on the other. One of the maindifferences between Scotland and England in terms of vocational quali� cations is theexistence of National Certi� cate modules in Scotland which were � rst introduced in 1983.The very existence of National Certi� cate modules within Scotland again militates againstsimplistic cross-border comparisons:
The National Certi� cate complicates any comparisons because it is a Scottishquali� cation which may have depressed take-up of other vocational quali� cations,and especially of SVQs … once again, direct comparisons are hard to make.(Bamford & Schuller, 1999, p. 36).
The potential for National Certi� cates to act as a form of competition for SVQs waspreviously noted by Scottish Council for Vocational Educational Quali� cations (SCOTVEC)in 1995 when it speculated that one reason for the comparatively low level of take-up forSVQs at intermediate skills and professional levels was that ‘Higher National Certi� cates andHigher National Diplomas are being used instead of SVQs’ (SCOTVEC, 1995, p. 6). Overallusage of higher national certi� cates was then estimated to be costing about 9000 SVQs.
Existing vocational quali� cations, such as those provided by City and Guilds [2], also
Dow
nloa
ded
by [
Uni
vers
ity o
f St
irlin
g L
ibra
ry]
at 0
1:45
21
June
201
2

‘Home International’ Comparisons in SVQs/NVQs 193
provide a form of competition to SVQs in areas where they overlap. Thus it has been reportedthat:
The Local Enterprise Councils (LECs) have found that most private trainingproviders use NVQs as a result of historical links with City & Guilds. (SCOTVEC,1995, p. 2)
The existence of competition for both NVQs and SVQs from other vocational quali� cationshas also been noted by previous research. Callender (1996) noted that the Labour ForceSurvey in Spring 1994 found that while 2% of the working population were deemed to bestudying towards N/SVQs, 12% were working towards other vocational quali� cations. Uptakeof other vocational quali� cations was on an upward trend before the introduction of NVQs(Robinson, 1996).
In summary, the literature review identi� es the importance of regional variations in thetake-up of vocational quali� cations and the inter-relatedness of the new quali� cations withacademic awards and traditional vocational quali� cations. There is also evidence to suggestthat the location of corporate ‘head of� ces’ in the UK may be a signi� cant factor in thetake-up of N/SVQs.
With the advent of devolved political structures within the UK it would be reasonable toassume that vocational education policy will diverge between its semi-autonomous constitu-ent states. As Raffe (1998a) suggests ‘the potential for divergence will at least be partiallyrealised’ and it can be expected that ‘education will develop its own momentum for change’(p. 24). The perception of England as the dominant entity (Bell & Grant, 1977) representingthe British Islands is likely to diminish at least within Europe if not internationally.
Methodology
In October 1998 the Institute of Education at the University of Stirling in Scotland wascommissioned by the Scottish Quali� cations Authority (SQA) to examine the comparativetake-up of Scottish Vocational Quali� cations (SVQs) in Scotland and National VocationalQuali� cations (NVQs) in England. The aims of the research were to:
· Identify the take-up of NVQs and SVQs in the UK.· Compare the � gures in order to establish any signi� cant differences in usage.· Establish the signi� cant factors that determine take-up rates.· Indicate aspects of take-up in Scotland that could be improved and areas for further
research.
The methodology used in the research consisted of three parts: a literature review, a searchof relevant national statistical databases and a set of illustrative case studies. The literaturereview built upon Canning’s previous work. It began in November 1998 and was updated asnew literature emerged.
Analysis of the relevant statistics for SVQs began in December 1998 following the arrivalof the Labour Force Survey (LFS) for Spring 1998. We also examined the NationalInformation System for Vocational Quali� cations (NISVQ). The NISVQ is managed by theDepartment for Education and Employment (DfEE) [3] in England and contains infor-mation voluntarily supplied by the four main Awarding Bodies for vocational quali� cations.It therefore represents a � ow of quali� cations achieved. The NISVQ database covers only asample of all full vocational quali� cations. It is estimated to cover 55% of all N/SVQs and75% of other full vocational quali� cations. The NISVQ contains a range of backgroundinformation on the characteristics of those individuals who obtain the awards, particularlygender and age. The disadvantage of the NISVQ database is that it only covers the largest
Dow
nloa
ded
by [
Uni
vers
ity o
f St
irlin
g L
ibra
ry]
at 0
1:45
21
June
201
2

194 R. Canning & M. Cloonan
Awarding Bodies and is, therefore, likely to under-estimate the number of intermediate andhigher level vocational quali� cations as these are more likely to be awarded by the other 120smaller Awarding Bodies. A second weakness in the NISVQ database is that it relies heavilyon the accuracy of the reporting procedures adopted by the Awarding Bodies.
The LFS has been conducted each quarter since 1992 with a representative sample of60,000 households containing some 115,000 people aged 16 and over drawn from across theUK. It represents the stock of quali� cations held in the labour market. Since 1993 the LFShas asked speci� c questions relating to the take-up of N/SVQs. The advantage of the LFS isthat it focuses on the individuals who actually report holding N/SVQs. The disadvantage ofthe LFS is that the sample size for Scotland is small and often does not allow for acomprehensive statistical analysis to be undertaken. A second disadvantage of the LFS is thatit relies on the accuracy of the individual responses of those interviewed. Although the LFShas become more sophisticated over the years any analysis of the language of quali� cationsdoes present problems:
Talk about quali� cations tends to be vague rather than precise … … quali� cationtitles are linguistically complex. (Campanelli & Channell, 1996, p vi)
It can, therefore, be dif� cult for those holding quali� cations to know exactly what they haveachieved given the number and complexity of awards on offer. This is particularly the casefor vocational quali� cations.
The national data sets were selected as a source of information for the statistical analysisof the present study because they offered a national perspective on the take-up and usageof S/NVQs and were compiled independently of the Accrediting and Awarding Bodiesinvolved in the delivery of the quali� cations (SQA and the Quali� cations and CurriculumAuthority [QCA] hold data on the number of S/NVQ certi� cates issued to candidates. Thisoften includes multiple awards held by the same candidate). By using the NISVQ and LFSdatabases a more comprehensive analysis of the full range of N/SVQs provision and relatedtraditional vocational quali� cations was possible.
A number of case studies have been used to illustrate and further explore the issuesarising from the literature review and data-sets. Three of the four interviews were conductedface-to-face during February and March 1999. These interviews form the basis of the casestudies for the private training provider, the college and the Awarding Body. The � nal casestudy was developed following extended telephone interviews with two large retailers. Thecase studies are designed to be ‘illustrative rather than representative’ of the sectors involved.We do, however, believe that they are representative in the sense that they serve to highlightthe major issues concerning SVQ take-up within Scotland. During the face-to-face inter-views, respondents were encouraged to re� ect upon their own experience; on the nature oflikely competition for SVQs; and to speculate about the future. They were also assured ofcon� dentiality.
It is important to acknowledge the limitations of intranational comparative researchstudies in education. As Raffe (1998a) has indicated:
In a wider international context the systems’ similarities are more substantial thanthe differences among them. (p. 9)
In comparison with a broader international perspective on the development of educationsystems, the intranational differences may be much less signi� cant. However, this limitationneeds to be counterbalanced against what Bell & Grant (1977) claim are the dangers of notpaying much attention to the educational and cultural pluralism of our own islands. Often thedifferences and similarities within sub-systems of education in interdependent states helpsinform the wider theoretical debates in comparative education.
Dow
nloa
ded
by [
Uni
vers
ity o
f St
irlin
g L
ibra
ry]
at 0
1:45
21
June
201
2

‘Home International’ Comparisons in SVQs/NVQs 195
TABLE I. S/NVQs held in the UK
Scotland United Kingdom
Level S/NVQs Other VQs N/SVQs Other VQs
Level 1 3,432 6,773 55,356 225,022Level 2 11,436 2,972 168,368 72,202Level 3 2,784 2,405 52,668 72,786Level 4 & 5 210 18,362 4,102 52,145Totals 17,862 30,512 280,404 422,155
Source: NISVQ 1996/97.
Secondary Data Analysis
The � rst section of the data analysis deals with the national data-sets on vocationalquali� cations and the Labour Force Survey. This is followed by the use of case studies toillustrate key � ndings from the quantitative data.
Our � rst � nding from the secondary data analysis is that the take-up of SVQs withinScotland is lower in percentage terms than that of NVQs in England. Thus in absolute termsthe take-up of SVQs may be seen as disappointing in Scotland. However, the interestingquestions are how does Scotland compare with England and should it be a cause of concernthat SVQs are taken up in smaller numbers in Scotland than NVQs in England?
Those holding N/SVQs
Table I gives the most recent data from NISVQ (1996/97). It shows that Scotland accountsfor 6.4% of the UK take-up of N/SVQs. This is 2.4 percentage points below its share of theUK working population (8.8%) and amounts to 30% less N/SVQ take-up in Scotlandcompared with the rest of the UK. According to NISVQ, Scotland also underperforms inother vocational quali� cations at 7.2% of UK awards. However, it seems that in Scotlandother vocational quali� cations are less popular at levels 1 and 2 than in the UK. It should benoted that the data presented in Table I excludes � gures on GNVQs and GSVQs.
Information on numbers holding S/NVQs is also available through the LFS. Thisprovides the most important data source in this area as it is used to measure progress towardsthe National Education and Training Targets (NACETT) for England and the AdvisoryScottish Council for Education and Training Targets (ASCETT) for Scotland. Table IIshows data on the number of people holding N/SVQs in Scotland and the United Kingdom.Using this data source, Scotland accounts for 6.1% of all S/NVQs held in the UK. This is 2.7percentage points below its UK share of the working population.
The Labour Force Survey also collects data on those who have and are studying towardsa S/NVQ (Table III).
Clearly the growth in the number of people holding full S/NVQs has been signi� cant.
TABLE II. People holding N/SVQs
Location Number (thousands)
United Kingdom 1,970Scotland 120
Source: LFS Autumn 1997
Dow
nloa
ded
by [
Uni
vers
ity o
f St
irlin
g L
ibra
ry]
at 0
1:45
21
June
201
2
196 R. Canning & M. Cloonan
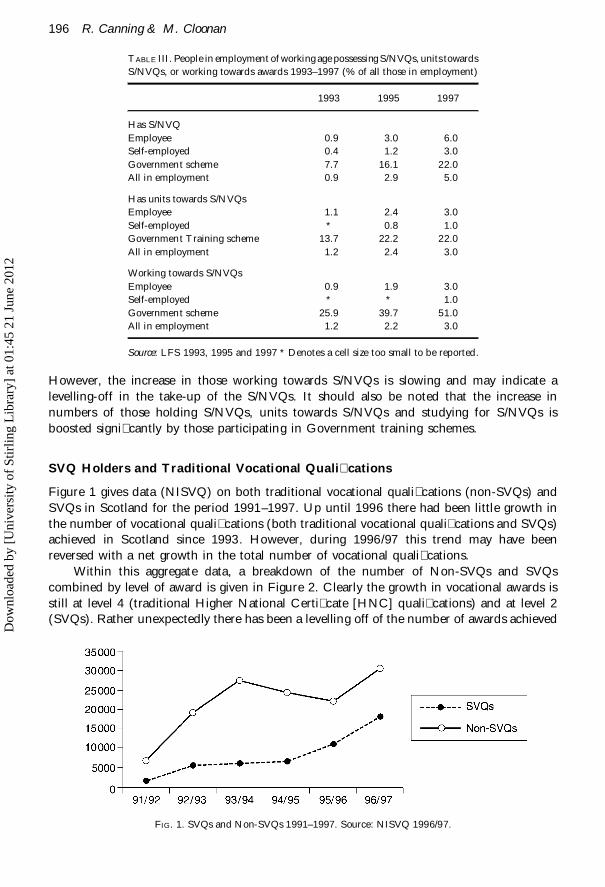
TABLE III. People in employment of working age possessing S/NVQs, units towardsS/NVQs, or working towards awards 1993–1997 (% of all those in employment)
1993 1995 1997
Has S/NVQEmployee 0.9 3.0 6.0Self-employed 0.4 1.2 3.0Government scheme 7.7 16.1 22.0All in employment 0.9 2.9 5.0
Has units towards S/NVQsEmployee 1.1 2.4 3.0Self-employed * 0.8 1.0Government Training scheme 13.7 22.2 22.0All in employment 1.2 2.4 3.0
Working towards S/NVQsEmployee 0.9 1.9 3.0Self-employed * * 1.0Government scheme 25.9 39.7 51.0All in employment 1.2 2.2 3.0
Source: LFS 1993, 1995 and 1997 * Denotes a cell size too small to be reported.
However, the increase in those working towards S/NVQs is slowing and may indicate alevelling-off in the take-up of the S/NVQs. It should also be noted that the increase innumbers of those holding S/NVQs, units towards S/NVQs and studying for S/NVQs isboosted signi� cantly by those participating in Government training schemes.
SVQ Holders and Traditional Vocational Quali� cations
Figure 1 gives data (NISVQ) on both traditional vocational quali� cations (non-SVQs) andSVQs in Scotland for the period 1991–1997. Up until 1996 there had been little growth inthe number of vocational quali� cations (both traditional vocational quali� cations and SVQs)achieved in Scotland since 1993. However, during 1996/97 this trend may have beenreversed with a net growth in the total number of vocational quali� cations.
Within this aggregate data, a breakdown of the number of Non-SVQs and SVQscombined by level of award is given in Figure 2. Clearly the growth in vocational awards isstill at level 4 (traditional Higher National Certi� cate [HNC] quali� cations) and at level 2(SVQs). Rather unexpectedly there has been a levelling off of the number of awards achieved
FIG. 1. SVQs and Non-SVQs 1991–1997. Source: NISVQ 1996/97.
Dow
nloa
ded
by [
Uni
vers
ity o
f St
irlin
g L
ibra
ry]
at 0
1:45
21
June
201
2

‘Home International’ Comparisons in SVQs/NVQs 197
FIG. 2. SVQs and Non-SVQs by level of award 1991–1997. Source: NISVQ 1992–1996.
at level 3. This data is again consistent with the latest national report on skills attainment inScotland (ASCETT, 1998), which also indicates a lack of growth at intermediate skill level.
Take-up of SVQs by Level, Framework, Occupation and Industrial Distribution
In the UK, 80% of N/SVQs are at level 1 and 2, 19% at level 3 and 1% at level 4 and 5(NISVQ, 1996/97). The two main framework [4] areas for NVQs are the Provision ofBusiness Services at 33% and Providing Goods and Services at 31%. In Scotland, SVQcandidates are more likely to hold level 3 awards (intermediate skills) and are less likely to beemployed in the business service sectors compared to the equivalent candidates holdingNVQs in England.
The occupational groups holding S/NVQs in the UK compared to those holding SVQsin Scotland are shown in Figure 3. In Scotland SVQ candidates are more likely to be in theCraft and related occupations and less likely to be in the Managerial, Professional andAssociate Professional groups.
Data from the 1997 LFS indicates that the take-up of N/SVQs is highly concentratedwithin industrial sectors. In the UK, 32% of holders of N/SVQs work in public admini-stration, education and health. This sector is characterised by larger employers andabove-average proportions of employees receiving job-related training. The second largestnumber of holders of N/SVQs are to be found in distribution, hotels and catering, a sectorwith higher proportions of women employed. This pattern of industrial sector involvement inS/NVQs is supported by data from the Skill Needs in Britain 1998 survey (IFF Research,1999). On average a higher proportion of employees in Scotland work in industrial sectorsthat have a higher concentration of S/NVQ holders.
Characteristics of People Holding S/NVQs
Age
The age distribution of the holders of SVQs and NVQs is given in Table IV. In general terms,the take-up of S/NVQs is highly skewed towards the younger age groups. This is even morethe case in Scotland where 39% of the awards are taken by 16–19 year olds. This may re� ectthe higher number of young people participating in Government training schemes inScotland during the 1980s compared with elsewhere in the UK (Raffe, 1998b). However, thispattern of participation in Government Supported Training has been reversed in the 1990s
Dow
nloa
ded
by [
Uni
vers
ity o
f St
irlin
g L
ibra
ry]
at 0
1:45
21
June
201
2

198 R. Canning & M. Cloonan
FIG. 3. Occupations holding S/NVQs in Scotland and the UK.
with Scotland having fewer young people involved in state-funded training schemes than theUK average in 1995/96 (Regional Trends, 1998).
Gender
Using data from the Labour Force Survey, Felstead et al. (1995), Robinson (1996) and Alpin& Shackleton (1998) have all reported a signi� cantly higher proportion of women than menin employment holding N/SVQs. An analysis of the LFS Spring 1998 data con� rms thisearlier research with a signi� cant relationship between gender and holding [5] and workingtowards [6] an S/NVQ. This is not to say that there is little scope in Scotland for increasingthe take-up of SVQs by women. Table V shows that in absolute numbers women are stillunder-represented in Scotland in the take-up of SVQs compared with the rest of the UK.This may not be surprising given the younger age distribution and the higher take-up of craftlevel S/NVQs within Scotland. Overall the gender pattern associated with holding an S/NVQis determined by the occupational distribution of S/NVQs amongst the workforce. In the UK
TABLE IV. Age distribution of S/NVQ holders inScotland and the UK.
Age (years) Scotland UK
16–19 39% 34%20–24 18% 21%25–40 26% 28%41–59/64 17% 17%
Source: NISVQ 1996/97.
TABLE V. Gender distribution of S/NVQs holders inScotland and the UK.
Gender Scotland UK
Female 48% 57%Male 52% 43%
Source: NISVQ 1996/97.
Dow
nloa
ded
by [
Uni
vers
ity o
f St
irlin
g L
ibra
ry]
at 0
1:45
21
June
201
2

‘Home International’ Comparisons in SVQs/NVQs 199
TABLE VI. Economically active of working age: by highest quali� cation,Summer 1997 (%).
Scotland Great Britain
Higher education 25.9 23.6GCE A level equivalent 19.5 14.7Trade apprenticeship 13.1 10.2GCSE grades A–C equivalent 16.5 22.9Quali� cations level 1 5.3 6.4Other 7.1 8.4None 12.6 13.9
Total ( 5 100per cent) (thousands) 2,441 27,341
Source: Labour Force Survey (Summer, 1997).
53% of women work in three occupations (clerical and secretarial, personal and protectiveservices and sales). Women are also over- represented in the public administration, educationand health and distribution, hotels and catering sectors, where S/NVQs are more dominant.
Full-time/part-time employment
An area not often discussed in the literature on vocational quali� cations is the take-up of theawards by contractual hours worked. In particular are S/NVQs more attractive to those infull-time or part-time employment? The LFS survey allows us to analyse the take-up ofS/NVQs by employment status. The data suggests that there is a signi� cant link betweenhours worked and those holding S/NVQs [7] and those working towards S/NVQs [8]. Thosein full-time employment are more likely to hold and be working towards S/NVQs. InScotland this may help to explain the lower take-up of SVQs by women given that 81% ofpart-time workers are women.
Educational background
In an earlier study into the take-up of S/NVQs Shackleton & Walsh (1997) found that ‘thelonger an individual remains in full-time continuous education the less likely he/she is to havean NVQ’ (p. 49). This conclusion is supported by Robinson (1996) who claims that ‘peoplewith higher educational attainment are less likely to be working towards N/SVQs’ (p. 16) andby Alpin & Shackleton (1998) who associate the holding of N/SVQs with those with a‘modest educational background’ (p. 4).
Table VI shows that Scotland has a higher percentage of those of working age withhigher level quali� cations compared with Great Britain. This is con� rmed by a recentresearch report by Bamford & Schuller (1999) that claims that ‘Scotland retains its lead inthe proportions of young people moving into higher education’ (p. 48). It should also benoted that ‘more Scottish higher education provision takes place in colleges of furthereducation’ (p. 48) than in England. The great majority of these students are studying forHNCs and HNDs, either on a full-time or a part-time basis (Table VII).
It is important to acknowledge that Scotland has one of the highest participation levelsfor young people in higher education in Great Britain. Given the strong link betweeneducational background and the take-up of S/NVQs it is reasonable to assume that inScotland there will be less overall demand for S/NVQs compared with the rest of the UK.
Dow
nloa
ded
by [
Uni
vers
ity o
f St
irlin
g L
ibra
ry]
at 0
1:45
21
June
201
2

200 R. Canning & M. Cloonan
TABLE VII. Students registered on HNC and HND by mode of attendance 1996–97.
Short EveningTotal Full-time full-time Block release Day release Part-time classes Private study
HNC/HND 45,122 25,818 88 255 7424 2122 7622 1790
Source: Scottish Of� ce (1998c).
Social class
The variable of social class is signi� cantly related to both the holding of N/SVQs [9] and tostudying for N/SVQs [10]. In other words you are more likely to hold or be studying forN/SVQs if you are in a skilled occupation (manual) or a partly skilled occupation rather thanin a professional or intermediate occupation, or a skilled occupation (non-manual). There isno evidence that Scotland has a signi� cantly different social class structure from England.
Geographical location
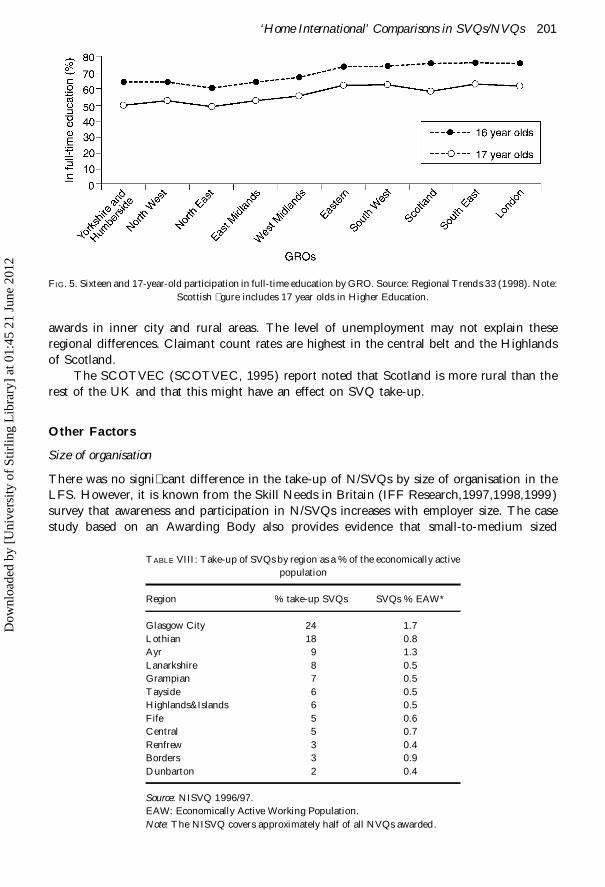
Based on an analysis of Government Regional Of� ces (GROs) in the LFS the variablegeography is signi� cantly associated with having N/SVQs [11].
Figure 4 shows the take–up of N/SVQs by GRO. It should be noted that the NISVQdatabase covers approximately half of all NVQs awarded. The � gures, therefore, only providethe proportions of S/NVQs awarded by GRO and not the absolute numbers. Nevertheless,a clear North/South divide emerges in those holding N/SVQs. Scotland in this analysis sitsalongside London and the South East and West of England in the percentage take-up ofN/SVQs.
Figure 5 shows the regional differences in full-time participation in education by youngpeople. The North/South divide is again apparent in England with Scotland having similarparticipation levels in full-time post-16 education as the south of England.
Regional Differences within Scotland
Pursuing a regional analysis of the data Table VIII shows that there are signi� cant differencesin the take-up of SVQs by region in Scotland. In particular, there is a higher take-up of the
FIG. 4. Take-up of N/SVQs by GROs (% of working population). Source: NISVQ 1996/7.Note: NISVQ only cover approximately half of all NVQs awarded.
Dow
nloa
ded
by [
Uni
vers
ity o
f St
irlin
g L
ibra
ry]
at 0
1:45
21
June
201
2
‘Home International’ Comparisons in SVQs/NVQs 201
FIG. 5. Sixteen and 17-year-old participation in full-time education by GRO. Source: Regional Trends 33 (1998). Note:Scottish � gure includes 17 year olds in Higher Education.
awards in inner city and rural areas. The level of unemployment may not explain theseregional differences. Claimant count rates are highest in the central belt and the Highlandsof Scotland.
The SCOTVEC (SCOTVEC, 1995) report noted that Scotland is more rural than therest of the UK and that this might have an effect on SVQ take-up.
Other Factors
Size of organisation
There was no signi� cant difference in the take-up of N/SVQs by size of organisation in theLFS. However, it is known from the Skill Needs in Britain (IFF Research,1997,1998,1999)survey that awareness and participation in N/SVQs increases with employer size. The casestudy based on an Awarding Body also provides evidence that small-to-medium sized
TABLE VIII: Take-up of SVQs by region as a % of the economically activepopulation
Region % take-up SVQs SVQs % EAW*
Glasgow City 24 1.7Lothian 18 0.8Ayr 9 1.3Lanarkshire 8 0.5Grampian 7 0.5Tayside 6 0.5Highlands&Islands 6 0.5Fife 5 0.6Central 5 0.7Renfrew 3 0.4Borders 3 0.9Dunbarton 2 0.4
Source: NISVQ 1996/97.EAW: Economically Active Working Population.Note: The NISVQ covers approximately half of all NVQs awarded.
Dow
nloa
ded
by [
Uni
vers
ity o
f St
irlin
g L
ibra
ry]
at 0
1:45
21
June
201
2

202 R. Canning & M. Cloonan
businesses are problematic in terms of SVQ take-up. Nevertheless, it is important toacknowledge that even if a relationship could be established between the take-up of N/SVQsand size of company this does not mean that Scotland would be at a disadvantage comparedwith the rest of the UK. In fact Scotland has the lowest proportion of size ‘class zero’enterprises in the UK with similar proportions of organisations in the 50–249 and over 250employees range (Labour Market Trends, 1998). It is in the 1–49 employee number categorythat Scotland has the highest proportion of small businesses in the UK (35%). There may,therefore, be scope for undertaking further research into the take-up of the quali� cations bycompanies in the 1–49 employee category to establish potential growth in this importantmarket.
Employer awareness of N/SVQs
The level of awareness of N/SVQs by employers has reached saturation point. Overall,S/NVQs were the Government initiative the highest proportion of employers were aware ofand involved in during 1998. The 1997 Skill Needs in Britain report (IFF Research,1997)also indicates that there was little difference in the percentage of employers involved inS/NVQs in Scotland (50%) compared with England (52%) and Wales (56%). There is noevidence to suggest that employers lack an awareness of the existence of N/SVQs.
Penetration rate of N/SVQs within organisations
There is evidence from Skill Needs in Britain (IFF Research, 1999) that the penetration rateof N/SVQs within organisations varies by Government Regional Of� ce, size of organisationand industrial sector. The survey reports that ‘we can see a polarisation in the proportion ofemployees to whom the initiatives are on offer; 36% of employers are limiting thequali� cation to less than 20% of their staff, while 27% of employers offer N/SVQs to all’ (p.103). There is scope to expand the number of SVQs by pursuing a strategy of increasingpenetration rates of the take-up of SVQs within existing providers.
Participation in training
Labour Force Survey � gures consistently show a lower percentage of employees andself–employed people receive job-related training in Scotland than in the UK as a whole.However, the training that people receive in Scotland is longer and geared to the achievementof higher quali� cations (Bamford & Schuller, 1999). The exception to this � nding is women,who receive less job-related training and fewer opportunities to study for higherquali� cations.
Investors in People
Scotland is behind England and Wales in the number of organisations recognised as Investorsin People [12]. By March 1998, 9% of Scottish organisations employing 50–199 people, and22% of Scottish organisations employing over 200 people were recognised as Investors inPeople. This compares with 12% for smaller organisations and 29% for larger ones inthe UK. Assuming that there is a link between the existence of formal training plans and thetake-up of quali� cations by employees then it is reasonable to predict that any growth in thenumber of organisations achieving Investors in People will lead to a corresponding expansionin the take-up of SVQs.
Dow
nloa
ded
by [
Uni
vers
ity o
f St
irlin
g L
ibra
ry]
at 0
1:45
21
June
201
2

‘Home International’ Comparisons in SVQs/NVQs 203
Case Studies
The following case studies explore in more depth the issues raised in the literature anddatasets. There are four case studies, each representing a different N/SVQ provider: indepen-dent trainer, Awarding Bodies, Further Education College and private sector company.
The � rst case study is based upon an extended interview with two senior members of aprivate training company. The organisation had been formed by a former member of an FEcollege and still retains links with the college. The company provides a range of businessservices and mainly acts as consultants, making recommendations about training pro-grammes. This often includes taking-up SVQs, which the company itself provides. Thecompany offers a wide range of SVQs in such areas as Administration, IT, Customer Service,Business Administration and Motor Vehicle. The levels range between 2 and 5.
The � rst issue raised with the company was whether HNC/HNDs and NationalCerti� cate modules acted as a form of competition for SVQs. The respondents were � rm intheir belief that these were two different markets, although they conceded that there might bean overlap in such areas as Of� ce Administration. It was accepted that part-time NationalCerti� cates ‘might’ offer a form of competition, but this was not viewed as being particularlylarge scale.
When asked whether NVQs acted as a form of competition for SVQs, the companyanswered that they were, especially in some sectors, notably food, manufacturing, retail andelectronics. The company estimated that around half of its work involved NVQs, despite itsefforts to concentrate on SVQs.
In this company’s experience, decisions about whether to use NVQs or SVQs oftenrested with senior persons within an organisation, such as the Managing Director or HumanResources Manager. Often such decisions were dependent upon the location of an organis-ation’s head of� ce. For companies operating in both England and Scotland and where thehead of� ce is in England, there seems to be an in-built bias to using NVQs throughout thecompany.
The company had seen some demand for traditional vocational awards such as City andGuilds, which it believed were held in esteem by some sectors, especially the craft-basedsector. As with the Awarding Body we interviewed (see below), the training company saidSVQs had peaked within some industries (such as brewing) but were gradually picking up ina number of other areas.
When asked about the future, the company aimed to concentrate on awards at the higherlevel and possibly compete with HE, although the company was keen to point out that it soldservices, not SVQs. Its SVQ business was essentially an outcome of its other businessactivities.
Awarding Body
This second case study is based upon an extended interview which took place in early March1999 with a senior member of a major Awarding Body. The Awarding Body concerned offersa range of vocational quali� cations in a number of industrial sectors including Hairdressing,Electronics, Textiles, Motor Vehicle, and Agriculture.
The Awarding Body estimated that over two-thirds of its VQ work within Scotland wasin the form of NVQs. This was a clear example of how NVQs act as a form of competitionfor SVQs. The Awarding Body did not believe that there were sectors in which the preferencefor NVQs was particularly evident: ‘it’s just that some do one and some do another’.
Decisions within companies about which VQ employees should take were often deter-
Dow
nloa
ded
by [
Uni
vers
ity o
f St
irlin
g L
ibra
ry]
at 0
1:45
21
June
201
2
204 R. Canning & M. Cloonan
mined by the nature of the organisation concerned. The key variable in the private sectorappeared to be whether the company concerned was Scottish, whether its major distributioncentres were in Scotland, and whether its suppliers were in Scotland.
In this Awarding Body’s experience, there was still some existing demand for traditionalvocational quali� cations, but both NVQs and SVQs were slowly taking over in many sectors.A rough line could be drawn between sectors which had previously had few or no vocationalawards, where VQs (of both sorts) had entered a sector and become dominant (such asretailing), and other sectors which had a long tradition of vocational training (such asEngineering) where VQs had struggled to establish themselves, but were beginning to do so.The slow growth pattern in some sectors partly re� ected a growing trend whereby employerswere less willing to allow staff to attend day release courses (of the sort associated withNational Certi� cates) and were more amenable to work-based learning (of the SVQ variety).
Questions on the future of SVQs produced the response that take-up of the awards bythe industrial sector was likely to be mixed. Some industries such as Retailing had alreadypeaked, others, such as Motor Vehicle, were levelling off, while others still, such as Engineer-ing, were picking up. Again the picture described was that VQs had been successful in sectorswhere vocational education was new, and were establishing themselves in more traditionalindustries.
The respondent considered that the main problem area was smaller businesses thatstruggled to do any VQs.
The respondent argued that National Certi� cate modules were traditionally taken bystudents on day release, but that this was known to be in decline. However, it is not clearwhether such modules are being taken at other times or whether employers no longer seethem as being relevant. Survey evidence of this is required before any � rmer conclusions canbe drawn.
Further Education
The third case study is of a Further Education college. The college has around 90 SVQs inits portfolio. The SVQs included such areas as Special Needs, Childcare and Education,Information Technology, Business, and a range of Construction and Building VQs. Overall,SVQ comprise around 20% of the college’s work.
The vast majority of the college’s VQ work (over 95%) is in SVQs. However, the collegealso did a small number of NVQs. One example was provision of NVQs for the army which,as a UK-wide organisation, wanted NVQs rather than SVQs. The college was also aware ofother employers who preferred their staff to take NVQs rather than SVQs, especiallycompanies working in the � nancial sector.
When asked why certain companies chose NVQs over SVQs, the interviewees gave tworeasons. The � rst was simply that companies, which worked across the UK, wanted aquali� cation that was perceived as a UK-wide award rather than just a Scottish quali� cation.In this case, the fact that NVQs and SVQs are often exactly the same awards, was of littleimportance. The perception of difference was crucial. The second reason given was uncer-tainty about the future of SVQs in the context of the then forthcoming Scottish Parliament.
The interviewee from the college suggested that Modern Apprenticeships (MAs) [13]are likely to become an increasing percentage of its overall VQ work. This was especially truein the light of the government’s recent commitment to MAs.
When asked about traditional vocational quali� cations, the college replied that employ-ers placed a high value on awards with which they were familiar. To an extent, then, SVQssuffered from still being comparatively new. The college had experienced a growth in demand
Dow
nloa
ded
by [
Uni
vers
ity o
f St
irlin
g L
ibra
ry]
at 0
1:45
21
June
201
2

‘Home International’ Comparisons in SVQs/NVQs 205
for HNCs/HNDs and expected that, at the very least, it would be some time before SVQs,were able to compete with these traditional vocational quali� cations.
City and Guilds, in terms of their own awards, were seen as possible competitors forSVQs (although they provide many SVQs themselves). The craft-based sectors such asConstruction and Furniture Restoration were ones in which the traditional quali� cationsprovided by bodies such as City and Guilds remained strong.
The college felt that areas in which traditional vocational quali� cations had held theirlead over SVQs included Accounting and Management. This is partly because these profes-sions wanted quali� cations that could potentially lead into Higher Education. There can bedirect routes from HNC/HNDs into Masters of Business Administration (MBAs). This is nottrue of SVQs, and the college believes that this affects take-up rates, as some individuals donot see the point of taking quali� cations that have no direct progression path.
There are areas in which SVQs are replacing HNCs: Childcare and Education was citedas an example of this. The SVQ had the con� dence of employers, was ‘work-based’ and seenas a likely growth area in the light of the government’s commitment to nursery education andincreasing the numbers of classroom assistants. This was also seen as an area in which SVQsand HNC might join up in the future.
By way of comparison, the respondents pointed to Electronics and Computing asindustries which had not taken the SVQ route. This was especially true at the higher levelswhere technicians would expect to do an HNC/D rather than a SVQ.
The strength of the HNC was seen as being one particularly Scottish aspect ofcompetition for SVQs. The HNC/D is modularised, can be taken part-time, is � exible, wellknown and established, and meets many employers’ and employees’ needs. It is also bursarysupported in a way in which it is not in England and the college believed that this was a keyfactor in the continued high take-up of HNC/Ds, to the possible detriment of SVQs. Therewas a need to develop clear progression between SVQs and HE.
Retail Sector
The � nal case study is based on the retail sector. The � rst company we contacted had simplyabolished the distinction between NVQs and SVQs. All of its employees who gained thequali� cation received certi� cates marked ‘N/SVQ’. This was, said the company, because ithad a policy of equal opportunities and equal respect. The company runs its VQs via City andGuilds, with certi� cation within Scotland being provided by SQA.
This company’s VQs are all at Level 2 and form an integral part of its PerformanceManagement programme. Thus the VQs were modi� ed to incorporate company policy andlanguage. The company had recently re-appraised its attitude towards VQs and now sawthem as nothing other than personal development programmes, centring on individuals’needs whilst embracing company policy. They are thus available to all employees, who couldgather evidence towards their VQ as part of their daily work. There is an opportunity forevery member of staff to take a VQ, but none is obliged to.
This picture of contentment with SVQs can be seen as a marked contrast to the secondretailer we contacted. This company had been an early adopter of VQs but now saw demandlevelling off. Now those taking VQs were likely to be new recruits, of which there was adecreasing number. More worryingly, this organisation had moved away from offering SVQsin Scotland and now only delivered NVQs.
In summary, the case studies illustrate the complexity of making simple ‘Home Inter-national’ comparisons on the take-up of vocational quali� cations. Organisations increasingly
Dow
nloa
ded
by [
Uni
vers
ity o
f St
irlin
g L
ibra
ry]
at 0
1:45
21
June
201
2
206 R. Canning & M. Cloonan
take a UK perspective of educational issues and view quali� cation attainment in a lessfragmented and partial manner than the educational literature would suggest.
Discussion
The take-up of SVQs within Scotland is lower in percentage terms than that of NVQs inEngland. In terms of intra-national comparisons a number of well-rehearsed explanations canbe given for this: Scotland has traditionally had a higher unemployment rate than the rest ofthe UK; Scotland has a higher incidence of smaller companies within the 1–49 employeecategory then elsewhere in the UK. The literature also indicates that the take-up of vocationalquali� cations is concentrated in large companies with ‘head of� ces in England’ thus puttingScotland at a disadvantage with other parts of the UK.
If the reasons given above for the comparative low take-up of vocational quali� cationshold in Scotland, then a number of clear policy measures can be taken to improveScotland’s relative performance in vocational education in the UK. First, efforts should beconcentrated on encouraging small-medium sized businesses to participate more fullyin work-based vocational education. Secondly, a more inclusive policy of lifelong learningshould be pursued to bring the excluded in society back within mainstream education.These perspectives on policy do in fact re� ect current thinking in Scotland (Scottish Of� ce,1999).
However, if a regional analysis of the take-up of N/SVQs within the UK is undertakenthen a different set of policy outcomes emerges. Based upon an analysis of GovernmentRegional Of� ces the variable geography is signi� cantly associated with having N/SVQs. Thisis an interesting result as it shifts our attention from intranational UK comparisons of N/SVQtake-up to an analysis of regions within the UK. Here we see the existence a clearNorth/South divide for those holding N/SVQs. Scotland in this analysis sits alongsideLondon and the South East and West of England in the percentage take-up of N/SVQs. Thisshould not be surprising given the link between educational background and holdingN/SVQs.
If the analysis of N/SVQs in England and Scotland is made at the regional level then thetake-up � gure for SVQs may be disappointing, but it is not a cause for concern as it indicatesan improved performance in the achievement of academic and traditional vocationalquali� cations in Scotland.
Much more important, arguably, is a regional analysis of the datasets. Such an analysisindicates that there are signi� cant differences in the take-up of SVQs by region withinScotland. In particular, there is a higher take-up of the awards in inner city and rural areas.A key argument of this paper is that the regional differences in the take-up of SVQs aremore likely to be explained by a more subtle micro-analysis of local employment andsocio-economic conditions rather than factors identi� ed from national trends. Here it isnecessary to think the unthinkable in terms of vocational education and training policy. InScotland a higher take-up level of SVQs may indicate a higher level of institutionally ledactivity [14] in a region and a lower level of employer demand for training. In other wordsgovernment training schemes become a substitute for employment rather than a preparationfor work. If the former then a major rethink of the link between education and economicgrowth would be required. Within the ‘job de� cit’ regions a switch in public funds from lowskill vocational training to investment in economic infrastructure may offer a more sustain-able strategy for increasing employer demand for education.
The research would also suggest that the economic returns to the ‘new vocational’quali� cations are poor and compare unfavourably with degree level quali� cations and
Dow
nloa
ded
by [
Uni
vers
ity o
f St
irlin
g L
ibra
ry]
at 0
1:45
21
June
201
2

‘Home International’ Comparisons in SVQs/NVQs 207
traditional vocational quali� cations. This conclusion is supported by the literature (CubieReport, 2000) and resonates with the work of Grubb & Ryan (1999):
When, however, all that a public programme has to offer is informal, low leveltraining, and its clientele is predominately disadvantaged workers who face low skill,overstocked labour markets, evidence of failure hardly comes as a surprise.(pp. 103–104)
As long as S/NVQs are largely sponsored by government agencies and are targeted at thoseentering low skill jobs then they will add little to either the skills base of the country or,indeed, provide an adequate economic return to the individual. Young people are increas-ingly searching for ‘meaningful’ work and are willing to forgo immediate earnings in lieu ofstructured learning opportunities and the possibility of gaining a recognised nationalquali� cation that has currency within the labour market. It is not the case that ‘vocational’is always better when comparing the economic returns to the individual from investing ineducation. It is important here to differentiate conceptually between different types ofvocational quali� cations in making any comparative analysis of economic rates of return.Recent developments in Modern Apprenticeships in the UK point the way forward herethrough extending the range of occupations that can offer apprenticeship schemes andintegrating credentials with local labour market structures.
In conclusion it is argued that intra-national comparisons between nation states in theUK can be misleading in arriving at meaningful policy measures in vocational education. Aregional analysis both within a constituent country of the UK and across such constituentcountries may be more helpful in arriving at a broader socio-economic solution to what areperceived as local problems. This is certainly the case in the ‘new vocationalism’. Scotlanddoes under-perform in the take-up of N/SVQs but this should be seen as a positive outcomeindicating a higher level of educational achievement and a better mix between job opportuni-ties and labour market skills.
It is anticipated that further divergence will take place within the UK on vocationaleducation policy. Comparisons at a systems level are important, as are the commonfeatures of policy that emerge through the collaboration of interdependent nations within theUK. However, deeper sociological structures tend to persist across systems and time.The available research evidence suggests that social class, gender and spatiality largelydetermine participation levels in work-based, post-16 education and training. Althoughthe literature on youth transitions stresses the growing importance of the process of individ-ualisation and career trajectories, structural factors continue to be important. In theoreticalterms agency may indeed be bounded or constrained by structural inequalities. Thisis a tentative but important conceptual � nding that needs to be empirically tested. Inthe context of intranational comparative education policy it may not be suf� cient forgovernments to plan and design vocational education systems (curriculum and institutionalfactors) in isolation from, or as alternative pathways to, the mainstream. Instead suchvocational education systems need to be perceived as integral to, and incorporated within, theordinary.
Thus intranational comparisons in vocational education have a valuable role to play bothin policy formulation and in theorising about educational change. Such studies help toidentify both similarities and differences between systems and, in turn offer potential newsolutions to familiar problems. However, viewed from a wider international perspective thedivergence of policy making within the UK may seem less signi� cant and obscure theunderlying structural patterns of inequality that persist within these Isles.
Dow
nloa
ded
by [
Uni
vers
ity o
f St
irlin
g L
ibra
ry]
at 0
1:45
21
June
201
2
208 R. Canning & M. Cloonan
Acknowledgements
We gratefully acknowledge the support of The Data Archive in allowing us access to theQuarterly Labour Force Survey for Spring 1998.
NOTES
[1] Devolution is the transfer of powers from a central body to subordinate regional bodies. The UK Parliament atWestminster has devolved different powers to three bodies: the Scottish Parliament, the Welsh Assembly and theNorthern Ireland Assembly. In Scotland education policy making became a devolved area of responsibility.
[2] City and Guilds is a national awarding body in the UK for vocational quali� cations.[3] Since June 2001 this has become the Department for Education and Skills (DfES).[4] N/SVQs fall within a number of frameworks, which relate to occupational sectors, e.g. retail, engineering.[5] ( v 2 5 47.5, p , 0.001, df 5 3).[6] ( v 2 5 21.4, p , 0.001, df 5 2).[7] ( v 2 5 43.29, p , 0.001, df 5 3).[8] ( v 2 5 164.31, p , 0.001, df 5 2).[9] ( v 2 5 165.58, p , 0.001, df 5 18).
[10] ( v 2 5 315.15, p , 0.001, df 5 63).[11] ( v 2 5 957.64, p , 0.001, df 5 63).[12] Investors in People is a UK recognised quality standard for human resource development practices in organisa-
tions.[13] Modern Apprenticeships are government supported apprenticeship schemes for young people.[14] For instance from a local government funded agency such as the Local Enterprise Company.
REFERENCES
ASCETT (1998) Annual Report (Glasgow, ASCETT).ALPIN, C. & SHACKLETON, J.R. (1998) NVQs and Vocational Training in London (London, University of Westminster).BAMFORD, C.& SCHULLER, T. (1999) Divergence Between Initial and Continuing Education in Scotland (Edinburgh,
Edinburgh University).BELL, R. & GRANT, N. (1977) Patterns of Education in the British Isles (London, George Allen & Unwin).BLAKE, A & BOWMAN, L. (1998) Spotlight on Scotland, Labour Market Trends, April 1998, pp. 177–186.BROWNE, A. (1998) To have and have not—by postcode, Observer, 25 October 1998, Business Section, p. 3.CALLENDER, C. (1996) Individual Take-up of NVQ/SVQs: stimuli and obstacles (London, DfEE).CAMPANELLI, P. & CHANNELL, J. (1996) The Conceptualisation of Quali� cations by Individuals, Research Studies RS9
(London, DfEE).CANNING, R. (1998) The failure of competence-based quali� cations: an analysis of work-based vocational education
policy in Scotland, Journal of Education Policy, 13 (5), pp. 625–639.CUBIE REPORT (2000) Student Finance Fairness for the Future (Edinburgh, The Independent Committee of Enquiry into
Student Finance).DEPARTMENT FOR EDUCATION AND EMPLOYMENT (1998a) Education and Training Statistics for the United Kingdom
(London, DfEE).DEPARTMENT FOR EDUCATION AND EMPLOYMENT (1998b) Vocational Quali� cations in the UK (London, DfEE).FELSTEAD, A., GOODWIN, J. & GREEN, F. (1995) Measuring up to the National Training Targets: women’s attainment of
vocational quali� cations (Leicester, University of Leicester, Centre for Labour Market Studies).GRUBB, W.N. & RYAN, P. (1999) The Roles of Evaluation for Vocational Education and Training (London, Kogan Page).IFF RESEARCH (1997) Skill Needs in Great Britain and Northern Ireland (Shef� eld, DfEE).IFF RESEARCH (1998) Skill Needs in Great Britain and Northern Ireland (Shef� eld, DfEE).IFF RESEARCH (1999) Skill Needs in Great Britain and Northern Ireland (Shef� eld, DfEE).LABOUR FORCE SURVEY (1997/1998) The Data Archive (Colchester, University of Essex).LABOUR MARKET TRENDS (1998) Labour Market Trends, October (London, DfEE).NISVQ (1992–1996) NISVQ Tables (London, DfEE).NISVQ (1996–1997) NISVQ Tables (London, DfEE).RAFFE, D. (1998a) Investigating the education systems of the United Kingdom, Oxford Studies in Comparative
Education, 9 (2), pp. 9–28.RAFFE, D. (1998b) Does learning begin at home? The use of ‘home international’ comparisons in UK policy making,
Journal of Education Policy, 13 (5), pp. 591–602.
Dow
nloa
ded
by [
Uni
vers
ity o
f St
irlin
g L
ibra
ry]
at 0
1:45
21
June
201
2

‘Home International’ Comparisons in SVQs/NVQs 209
RAFFE, D., BRANNEN, K., CROXFORD, L. & MARTIN, C. (1999) Comparing England, Scotland, Wales and NorthernIreland: the case for ‘home internationals’ in comparative research, Comparative Education, 35 (1), pp. 9–25.
REGIONAL TRENDS (1998) Trends No. 33 (London, HMSO).ROBINSON, P. (1996) Rhetoric and Reality: Britain’s New Vocational Quali� cations (London, Centre for Economic
Performance).SCHAGEN, I., WATSON, P., HEWITT, D. & SIMS, D. (1997) Hitting The Targets (Slough, NFER).SCOTTISH OFFICE (1998a) Factsheet 13: the economy of Scotland (Edinburgh, Scottish Of� ce).SCOTTISH OFFICE (1998b) Objective 4 1998–99 Scottish Development Plan (Edinburgh, Scottish Of� ce).SCOTTISH OFFICE (1998c) The National Certi� cate 1996–97 (Edinburgh, The Scottish Of� ce).SCOTTISH OFFICE (1999) Opportunities and Choices: a consultative paper on post-school provision for 16–18 year olds,
(Edinburgh, Scottish Of� ce).SCOTTISH VOCATIONAL EDUCATION COUNCIL (SCOTVEC) (1995) SVQ Uptake Study (Glasgow, SCOTVEC).SHACKLETON, J.R. & WALSH, S.(1997).What determines who obtains national vocational quali� cations? Education
Economics, 5 (1), pp. 41–52.UNIVERSITY OF WESTMINSTER (1998) Labour Market Brie� ng (London, University of Westminster).
Dow
nloa
ded
by [
Uni
vers
ity o
f St
irlin
g L
ibra
ry]
at 0
1:45
21
June
201
2