Mycobacterium Tuberculosis-Associated Uveitis: Infection and ...

RESEARCH ARTICLE
Comparative Whole-Genome Analysis ofClinical Isolates Reveals CharacteristicArchitecture ofMycobacterium tuberculosisPangenomeVinita Periwal1,5, Ashok Patowary2, Shamsudheen Karuthedath Vellarikkal2,5, Anju Gupta4,Meghna Singh2,5, Ashish Mittal2, Shamini Jeyapaul2, Rajendra Kumar Chauhan2,Ajay Vir Singh3, Pravin Kumar Singh3, Parul Garg3, ViswaMohan Katoch3, Kiran Katoch3,Devendra Singh Chauhan3, Sridhar Sivasubbu2*, Vinod Scaria1*
1 GNRamachandran Knowledge Center for Genome Informatics, CSIR Institute of Genomics andIntegrative Biology (CSIR-IGIB), Mall Road, Delhi—110007, India, 2 Genomics and Molecular Medicine,CSIR Institute of Genomics and Integrative Biology (CSIR-IGIB), Mall Road, Delhi—110007, India,3 National JALMA Institute of Leprosy and other Mycobacterial Diseases, Post Box No.101,Tajganj, Agra-282001, India, 4 Open Source Drug Discovery Unit, Council of Scientific and Industrial Research (CSIR),Anusandhan Bhavan, 2 Rafi Marg, New Delhi 110001, India, 5 Academy of Scientific & Innovative Research(AcSIR), 2, Rafi Marg, Anusandhan Bhawan, New Delhi 110001, India
* [email protected] (VS); [email protected] (SS)
AbstractThe tubercle complex consists of closely related mycobacterium species which appear to
be variants of a single species. Comparative genome analysis of different strains could pro-
vide useful clues and insights into the genetic diversity of the species. We integrated ge-
nome assemblies of 96 strains fromMycobacterium tuberculosis complex (MTBC), which
included 8 Indian clinical isolates sequenced and assembled in this study, to understand its
pangenome architecture. We predicted genes for all the 96 strains and clustered their re-
spective CDSs into homologous gene clusters (HGCs) to reveal a hard-core, soft-core and
accessory genome component of MTBC. The hard-core (HGCs shared amongst 100% of
the strains) was comprised of 2,066 gene clusters whereas the soft-core (HGCs shared
amongst at least 95% of the strains) comprised of 3,374 gene clusters. The change in the
core and accessory genome components when observed as a function of their size re-
vealed that MTBC has an open pangenome. We identified 74 HGCs that were absent from
reference strains H37Rv and H37Ra but were present in most of clinical isolates. We report
PCR validation on 9 candidate genes depicting 7 genes completely absent from H37Rv and
H37Ra whereas 2 genes shared partial homology with them accounting to probable inser-
tion and deletion events. The pangenome approach is a promising tool for studying strain
specific genetic differences occurring within species. We also suggest that since selecting
appropriate target genes for typing purposes requires the expected target gene be present
in all isolates being typed, therefore estimating the core-component of the species becomes
a subject of prime importance.
PLOS ONE | DOI:10.1371/journal.pone.0122979 April 8, 2015 1 / 26
a11111
OPEN ACCESS
Citation: Periwal V, Patowary A, Vellarikkal SK,Gupta A, Singh M, Mittal A, et al. (2015) ComparativeWhole-Genome Analysis of Clinical Isolates RevealsCharacteristic Architecture of Mycobacteriumtuberculosis Pangenome. PLoS ONE 10(4):e0122979. doi:10.1371/journal.pone.0122979
Academic Editor: Yoshihiko Hoshino, NationalInstitute of Infectious Diseases, JAPAN
Received: August 8, 2014
Accepted: February 26, 2015
Published: April 8, 2015
Copyright: © 2015 Periwal et al. This is an openaccess article distributed under the terms of theCreative Commons Attribution License, which permitsunrestricted use, distribution, and reproduction in anymedium, provided the original author and source arecredited.
Data Availability Statement: All relevant data arewithin the paper and its Supporting Information files.Data sequenced are deposited at NCBI SequenceRead Archive (SRA) (http://www.ncbi.nlm.nih.gov/sra)with accessions SRR784917, SRR786188,SRR786373, SRR786397, SRR786667, SRR786668,SRR786669 and SRR786670. The correspondingcontig assemblies are available at http://genome.igib.res.in/Mtb_Pangenome and raw gene predictions areavailable at http://genome.igib.res.in/Mtb_Pangenome/Pred_genes.

IntroductionMycobacterium tuberculosis complex (MTBC) is the etiologic agent of tuberculosis (TB), one ofthe largest killer infectious disease causing worldwide morbidity and mortality. Bacterial strainsbelonging to the same species vary considerably in their genetic repertoire. The complex en-compasses a group of closely related gram-positive bacteria including,M. tuberculosis (Mtb)andM. africanum—the typical human pathogens [1,2];M. bovis—the bovine form [3];M.canettii—whose actual host is unknown; and several other lineages infecting mammals such asM.microti,M. caprae,M. pinnipedii [4] andM. orygis [5]. The species of the tubercle complexare not merely closely related but appears to be variants of a single species. TB manifests in avariety of clinically distinct and phenotypically diverse infections in humans with a distinctlylong sub-clinical latency period [6,7]. Despite numerous improved diagnostic methods, and aneffective combination therapy, the global emergence and spread of tuberculosis continues un-abated, with an estimated 8.7 million people getting new infections every year [8]. This scenariohas been complicated by widespread emergence of multidrug resistant (MDR) (resistance tofirst-line of Mtb drugs, isoniazid and rifampicin), extensively-drug resistant (XDR) (resistanceto any member of the quinolone family and one of the second-line injectable drugs in additionto first-line drugs isoniazid and rifampicin) [9] and lately, totally drug resistant (TDR) (resis-tance to a wide range of TB drugs) strains [10,11]. The infection also forms a lethal combina-tion when associated with clinical immunosuppressive states, which are either induced due tolong-term treatment using immune-suppressants [12] or its synergy with Human Immunode-ficiency Virus [13]. Recent studies on global phylo-geography of the pathogen and analysis ofits virulence and drug resistance have suggested strain-specific genetic differences and a geo-graphically constrained clonal population structure of MTBC [14,15]. Detailed studies of spoli-gotypes and associations with drug resistance phenotypes have been extensively reported ingeographically limited isolates [16–18]. MTBC is also known to have a large arsenal of genomicfeatures relating to the virulence, including its ability to persist and replicate in extremely hos-tile intracellular conditions and establish long-term infections in the host [7,19].
The availability of the complete genome sequence of Mtb laboratory strain H37Rv in 1998[2], provided useful insights into the biology of the pathogen. The reference H37Rv genome,encodes for a repertoire of close to 4,000 protein-coding genes [2]. Previous comparative ge-nome analysis of different strains has shown that such an approach could provide useful cluesand insights into the genetic diversity of the species [20]. The availability of high throughputand cost effective nucleic acid sequencing technologies has opened up new possibilities towardsunderstanding genomic diversity spanning a large number of members of the same species andhas revolutionized the in-depth analyses of complex microbial populations [21–23]. Previousstudies from other bacterial genera highlighted significant differences arising in the genomes oflaboratory strains and clinical isolates [24]. Recent studies involving re-sequencing of a largenumber of clinical isolates have also provided key insights into the genomic variability of thepathogen. The study revealed that the variability among MTBC strains is more widespreadthan was initially anticipated [25]. Nevertheless, extensive characterization of the genomicstructure and diversity in terms of gene repertoires of laboratory and clinical isolates has notbeen studied in detail. The recent availability of complete and near-complete sequences of clin-ical isolates of MTBC provides an interesting and novel opportunity to address the question ofconservation and variation to understand the pangenome of the species. A pangenome is aunion of entire genetic pool of several strains of a species under comparison, essentially con-sisting of a core genome containing genes and sequences shared in all strains and an accessorygenome comprising of genes and sequences, which may be absent from one or more strainsand genes that are unique to each strain [26].
Pangenome ofMycobacterium tuberculosis
PLOSONE | DOI:10.1371/journal.pone.0122979 April 8, 2015 2 / 26
Funding: The project was funded by Council ofScientific and Industrial Research (CSIR) Indiathrough Open Source Drug Discovery (OSDD)Programme (HCP001). The Sequencing facility issupported through SIP006 and FAC002 Grant fromCSIR, India and the computational analysis wasperformed at the CSIR centre for in-silico Biology atCSIR Institute of Genomics and Integrative Biology(IGIB).
Competing Interests: The authors have declaredthat no competing interests exist.
In the present study, we elucidate the pangenome structure ofM. tuberculosis complexusing 96 strains, which comprise both complete as well as draft genomes including eight ge-nomes of clinical isolates from India sequenced and assembled as part of this study. The datapool had MDR and XDR strains as well. We predicted genes for all the 96 strains and clusteredtheir respective CDSs to reveal a hard-core, soft-core and accessory genome component ofMTBC. Additionally, we also identified a subset of 74 gene clusters from the accessory compo-nent of MTBC, which was present in at-least a third of clinical isolates (i.e.>1/3rd of total data-set), but absent from the laboratory maintained reference strains (Mtb H37Ra and H37Rv).The study demonstrates the power of genomics based approach enabling close assessment anddetection of conserved gene sets within closely related strains of MTBC.
ResultsWe analyzed a total of 96 strains in the present study to describe the pangenome of MTBC.Briefly, the data pool comprised of 25 complete reference genomes and 71 draft assemblies.The draft assemblies comprised of eight Indian strains derived from the ‘Open Source DrugDiscovery (OSDD) open access repository’ and were sequenced and assembled in this study(Table 1). The sequencing and assembly protocols of the eight OSDD isolates has been de-scribed in detail in methods section. The 88 strains derived from public domain encompasseddiverse geographical locations around the globe and were sequenced and assembled using dif-ferent sequencing techniques and methodologies. Reference guided genome assemblies wereexcluded from our analysis as estimating the size of bacterial pangenome requires de-novo as-semblies of the genome in complete or partial genomes with large contigs. A detailed accountof the dataset including full organism name, their status of completeness, sequencing platformand coverage is presented in S1 Table.
Strain characterizationThe 96 MTBC strains comprised of five species—M. tuberculosis,M. bovis,M. canettii,M. orygisandM. africanum. The strains Mtb ATCC H37Rv andMtb ATCC H37Ra maintained at ATCC(American Type Culture Collection) have been referred to as reference and/or laboratory strainsin this study and any comparison attributing to H37Rv and H37Ra reference strains in ourstudy is in context with these ATCC strains only. Total genome sizes of all strains ranged from4.08MB to 4.57MB with an average GC content of 65.4%. Ten strains used in the present studywere phenotypically characterized as Multi-Drug Resistant (MDR) out of which five were al-ready described as MDR (Mtb CCDC5180, Mtb EAI OSDD271, Mtb KZN1435, Mtb OSDD105,andMtb OSDD515) and the other five (Mtb OSDD326, Mtb OSDD 386, Mtb OSDD071, MtbOSDD504 andMtb OSDD487) are newly sequenced strains on which Drug-Susceptibility Test-ing (DST) was done using a panel of 12 Mtb drugs comprising of first-line, second-line andcombination drugs. Additionally, six strains were characterized as Extensively-Drug resistant(XDR), Mtb CTRI-4, Mtb FJ05194, Mtb GuangZ0019, Mtb KZN605, Mtb OSDD493 andMtbUM1072388579. The detailed results of DST profiling are presented in S1 Fig. The spoligotypingresults on the 8 Indian strains suggested that three of them belonged to the clade CAS1_Delhi,which forms a major class of Mtb clinical isolates fromNorthern India, while two had novel spo-ligotype patterns (S1 Fig).
Genome sequencing and assemblyEstimating the size of the bacterial pangenome requires de-novo assemblies of the genome intocomplete or partial genomes with large contigs. De-novo genome assembly also provides an op-portunity to reveal differences in newly sequenced strains with respect to reference genomes. A
Pangenome ofMycobacterium tuberculosis
PLOSONE | DOI:10.1371/journal.pone.0122979 April 8, 2015 3 / 26
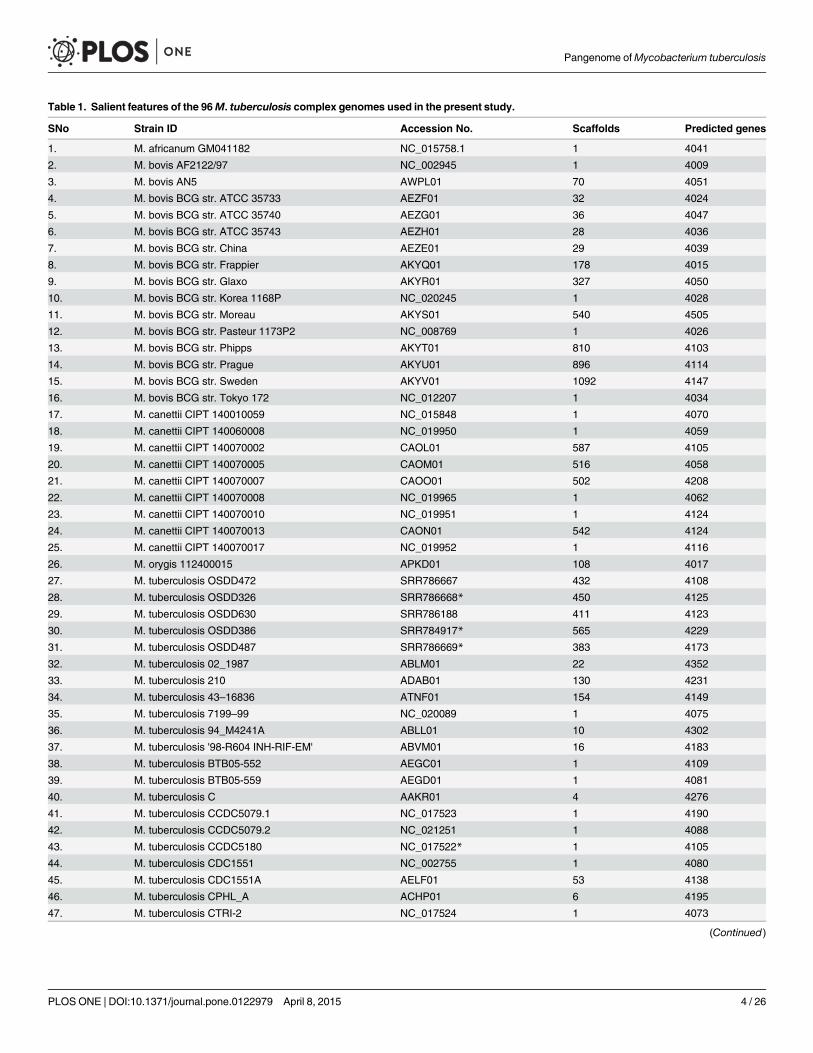
Table 1. Salient features of the 96M. tuberculosis complex genomes used in the present study.
SNo Strain ID Accession No. Scaffolds Predicted genes
1. M. africanum GM041182 NC_015758.1 1 4041
2. M. bovis AF2122/97 NC_002945 1 4009
3. M. bovis AN5 AWPL01 70 4051
4. M. bovis BCG str. ATCC 35733 AEZF01 32 4024
5. M. bovis BCG str. ATCC 35740 AEZG01 36 4047
6. M. bovis BCG str. ATCC 35743 AEZH01 28 4036
7. M. bovis BCG str. China AEZE01 29 4039
8. M. bovis BCG str. Frappier AKYQ01 178 4015
9. M. bovis BCG str. Glaxo AKYR01 327 4050
10. M. bovis BCG str. Korea 1168P NC_020245 1 4028
11. M. bovis BCG str. Moreau AKYS01 540 4505
12. M. bovis BCG str. Pasteur 1173P2 NC_008769 1 4026
13. M. bovis BCG str. Phipps AKYT01 810 4103
14. M. bovis BCG str. Prague AKYU01 896 4114
15. M. bovis BCG str. Sweden AKYV01 1092 4147
16. M. bovis BCG str. Tokyo 172 NC_012207 1 4034
17. M. canettii CIPT 140010059 NC_015848 1 4070
18. M. canettii CIPT 140060008 NC_019950 1 4059
19. M. canettii CIPT 140070002 CAOL01 587 4105
20. M. canettii CIPT 140070005 CAOM01 516 4058
21. M. canettii CIPT 140070007 CAOO01 502 4208
22. M. canettii CIPT 140070008 NC_019965 1 4062
23. M. canettii CIPT 140070010 NC_019951 1 4124
24. M. canettii CIPT 140070013 CAON01 542 4124
25. M. canettii CIPT 140070017 NC_019952 1 4116
26. M. orygis 112400015 APKD01 108 4017
27. M. tuberculosis OSDD472 SRR786667 432 4108
28. M. tuberculosis OSDD326 SRR786668* 450 4125
29. M. tuberculosis OSDD630 SRR786188 411 4123
30. M. tuberculosis OSDD386 SRR784917* 565 4229
31. M. tuberculosis OSDD487 SRR786669* 383 4173
32. M. tuberculosis 02_1987 ABLM01 22 4352
33. M. tuberculosis 210 ADAB01 130 4231
34. M. tuberculosis 43–16836 ATNF01 154 4149
35. M. tuberculosis 7199–99 NC_020089 1 4075
36. M. tuberculosis 94_M4241A ABLL01 10 4302
37. M. tuberculosis '98-R604 INH-RIF-EM' ABVM01 16 4183
38. M. tuberculosis BTB05-552 AEGC01 1 4109
39. M. tuberculosis BTB05-559 AEGD01 1 4081
40. M. tuberculosis C AAKR01 4 4276
41. M. tuberculosis CCDC5079.1 NC_017523 1 4190
42. M. tuberculosis CCDC5079.2 NC_021251 1 4088
43. M. tuberculosis CCDC5180 NC_017522* 1 4105
44. M. tuberculosis CDC1551 NC_002755 1 4080
45. M. tuberculosis CDC1551A AELF01 53 4138
46. M. tuberculosis CPHL_A ACHP01 6 4195
47. M. tuberculosis CTRI-2 NC_017524 1 4073
(Continued)
Pangenome ofMycobacterium tuberculosis
PLOSONE | DOI:10.1371/journal.pone.0122979 April 8, 2015 4 / 26

Table 1. (Continued)
SNo Strain ID Accession No. Scaffolds Predicted genes
48. M. tuberculosis CTRI-4 AIIE01~ 44 4048
49. M. tuberculosis EAI/OSDD271 AQQC01* 182 4248
50. M. tuberculosis EAS054 ABOV01 6 4240
51. M. tuberculosis F11 NC_009565 1 4085
52. M. tuberculosis FJ05194 ANBL01~ 112 4113
53. M. tuberculosis GM 1503 ABQG01 17 4367
54. M. tuberculosis GuangZ0019 ANFI01~ 97 4128
55. M. tuberculosis H37Ra AAYK01 272 4292
56. M. tuberculosis H37Ra NC_009525 1 4095
57. M. tuberculosis H37Rv NC_000962 1 4086
58. M. tuberculosis H37Rv NC_018143 1 4077
59. M. tuberculosis H37RvCO AJSF01 1 4088
60. M. tuberculosis K85 ACHQ01 1 4159
61. M. tuberculosis KZN 1435 NC_012943* 1 4079
62. M. tuberculosis KZN 4207 NC_016768 1 4065
63. M. tuberculosis KZN 605 NC_018078~ 1 4079
64. M. tuberculosis NA-A0008 ALYG01 280 4375
65. M. tuberculosis NA-A0009 ALYH01 310 4404
66. M. tuberculosis NCGM2209 BADQ01 107 4195
67. M. tuberculosis OSDD071 AHHX01/SRR786373* 393 4145
68. M. tuberculosis OSDD105 AUXD02* 181 4448
69. M. tuberculosis OSDD493 AVQJ01~ 193 4303
70. M. tuberculosis OSDD504 AHHY01/SRR786397* 631 4202
71. M. tuberculosis OSDD518 AHHZ01/SRR786670 404 4132
72. M. tuberculosis PR05 AOMG02 225 4142
73. M. tuberculosis S96-129 AEGB01 1 4112
74. M. tuberculosis SP21 AOUF01 30 4364
75. M. tuberculosis str. Erdman = ATCC 35801 NC_020559 1 4095
76. M. tuberculosis str. Haarlem NC_022350 1 4063
77. M. tuberculosis str. OSDD515 AUXC01* 127 4197
78. M. tuberculosis SUMu001 ADHQ01 79 4188
79. M. tuberculosis SUMu002 ADHR01 40 4246
80. M. tuberculosis SUMu003 ADHS01 63 4175
81. M. tuberculosis SUMu004 ADHT01 64 4178
82. M. tuberculosis SUMu005 ADHU01 55 4170
83. M. tuberculosis SUMu006 ADHV01 58 4193
84. M. tuberculosis SUMu007 ADHW01 41 4160
85. M. tuberculosis SUMu008 ADHX01 41 4183
86. M. tuberculosis SUMu009 ADHY01 46 4153
87. M. tuberculosis SUMu010 ADHZ01 52 4191
88. M. tuberculosis SUMu011 ADIA01 56 4248
89. M. tuberculosis SUMu012 ADIB01 93 4306
90. M. tuberculosis T17 ABQH01 22 4543
91. M. tuberculosis T46 ACHO01 8 4302
92. M. tuberculosis T85 ABOW01 17 4421
93. M. tuberculosis T92 ABLN01 31 4524
94. M. tuberculosis UM 1072388579 AMXW01~ 89 4035
(Continued)
Pangenome ofMycobacterium tuberculosis
PLOSONE | DOI:10.1371/journal.pone.0122979 April 8, 2015 5 / 26

recent report [27] suggests that the majority of genes in the prokaryotic genomes can be easilyre-constructed with short read sequencing technologies. The 96 MTBC genome sequences(Table 1) used in this study comprised of 25 complete reference strains sequenced and assem-bled elsewhere. The reference genomes included the two laboratory strains Mtb H37Ra andMtb H37Rv. The 71 draft genome assemblies obtained from NCBI comprised of scaffolds rang-ing from 4–1092. The remaining 8 strains sequenced in this study are part of the Open SourceDrug Discovery Open Access Repository and correspond to IDs: Mtb OSDD472, MtbOSDD326, Mtb OSDD071, Mtb OSDD504, Mtb OSDD630, Mtb OSDD386, Mtb OSDD487and Mtb OSDD518. DNA library preparation and sequencing was performed using standardprotocols as detailed in methods section. Sequencing reads from the eight newly sequencedstrains have been deposited at the Sequence Read Archive (SRA) service of NCBI with acces-sions SRR784917, SRR786188, SRR786373, SRR786397, SRR786667, SRR786668, SRR786669and SRR786670.
The 101bp paired-end raw sequence reads were de novo assembled at different k-mers as de-tailed in materials and methods. Majority of the samples had the best assembly at k-mer valueof greater than 50 with the highest N50 values ranging from 14Kbps-28Kbps. The entire assem-bly resulted in draft genomes of over 4.3Mbps. The genome assembly statistics for the strainsare summarized in Table 2. The finest contig assemblies generated from the de novo assemblyare available at http://genome.igib.res.in/Mtb_Pangenome.
Pangenome estimation and analysisGene prediction and clustering. Whole genome sequences (WGS) of the complete
MTBC genomes and scaffold/contig assemblies of draft genomes were used to predict theircoding sequences (CDS) / Open Reading Frames (ORFs). Standard bacteria/archaea translationcodes were used for CDS prediction. An account of the number of CDS predicted along foreach of the 96 strains is provided in Table 1. The predicted gene pool of the 96 strains was usedto estimate the pangenome of Mtb. The gene repertoire of each of the 96 Mtb isolates
Table 1. (Continued)
SNo Strain ID Accession No. Scaffolds Predicted genes
95. M. tuberculosis UT205 NC_016934.1 1 4120
96. M. tuberculosis W-148 ACSX01 1 4270
*—Denotes MDR strains,
~—Denotes XDR strains.
doi:10.1371/journal.pone.0122979.t001
Table 2. Genome Assembly Statistics of the eight Indian strains sequenced and assembled as part of the present study.
Strain_id Raw_reads k-mer N50 size (bp) Total contigs (bp) Largest contig size (bp) Assembly size (bp)
Mtb OSDD472 34645616 63 28444 432 98618 4360369
Mtb OSDD326 22694588 59 26414 450 94773 4343218
Mtb OSDD071 19113318 55 25700 393 103182 4324807
Mtb OSDD504 12027546 51 14067 631 49228 4291530
Mtb OSDD630 11407172 53 25990 411 91835 4300760
Mtb OSDD386 9535006 41 15827 565 72092 4339775
Mtb OSDD487 9234034 53 26861 383 84901 4356171
Mtb OSDD518 9495612 55 25234 404 105956 4316163
doi:10.1371/journal.pone.0122979.t002
Pangenome ofMycobacterium tuberculosis
PLOSONE | DOI:10.1371/journal.pone.0122979 April 8, 2015 6 / 26

comprises of 4,162 ± 119 genes (mean ± standard deviation). For some genomes the number ofpredicted genes could be an over-estimation because of the draft nature of the genomes andlower quality scaffolds with stretches of N’s. The protein translations of CDSs predicted fromthe complete genomes and scaffold assemblies of draft genomes were clustered based on se-quence identity using CD-HIT as detailed in the methods section. The clustering approach re-sulted in a total number of 8,099 Homolog Gene Clusters (HGCs), which represents the MTBC“pangenome”. The clusters are referred to as HGCs because a given cluster can have paralog se-quences as well.
Hard-core versus Soft-core. Genes shared amongst all strains of a species under study isreferred to as the ‘hard-core’ genome. A ‘soft-core’ genome of a species is the number of genesshared amongst a large proportion of genomes under study, say>90% of the strains underconsideration. The soft-core could perhaps serve to be more biologically relevant in view of thelarge number of draft quality genomes used in the analysis. The number of HGCs sharedamongst all 96 MTBC strains i.e. the ‘hard-core’ comprised of 2,066 HGCs and remaining6,033 HGCs formed the accessory gene pool. In order to choose an optimum threshold for de-fining the ‘soft-core’, we checked out for the presence of essential genes in the core component.Genes which are critical for the growth and survival of an organism are considered as essentialgenes for that organism. Three independent studies differing in the mycobacterium growthconditions have been performed in the past to define the essential genes ofMycobacterium tu-berculosisH37Rv [28–30] and have been catalogued in the Database of Essential Genes (DEG)[31].
We performed a BLAST search of all 8,099 representative cluster sequences against the es-sential genes of Mtb in the DEG database and identified 2,149 matches. Since the BLAST searchretrieved multiple and redundant matches we selected only the ones present in all the threestudies. There were 348 overlapping genes from the three studies and 597 sequences from ourdata had homology with these 348 genes. An optimal ‘soft-core’ was defined at 95% wheremaximum number of our essential gene matches was falling into the core component (S2 FigThus in our study, the ‘soft-core’ component of MTBC is defined as clusters present in at least95% of the strains. The soft-core of MTBC comprises of 3,374 HGCs and 4,725 HGCs are pres-ent in the accessory component.
The global phylogeny of MTBC. We investigated the genetic diversity within MTBCstrains by inferring phylogeny based on genes. In contrast to the single gene based trees whichhave low inter-species discriminatory power, multi-gene approaches offer more robust phylo-genetic trees [32,33]. In order to infer phylogeny of MTBC strains, we used the hard-core com-ponent i.e. genes shared amongst all the isolates under consideration. From the 2,066 hard-core, we removed the HGCs having paralogs thus leaving 971 orthologous gene clusters(OGCs) in the hard-core. CDS translations of the 971 OGCs from all 96 strains were subjectedto multiple sequence alignment followed by bootstrapping, generating a total of 100 resamples.Pairwise differences amongst sequences were estimated and the resultant distance matrix wasused to build the tree. The original and the resampled trees were compared and the resultanttree referred here as the core-gene tree, is presented in Fig 1 and the tree with comparativebootstrapped values is presented in S3 Fig.
The resultant tree of different species of MTBC is in concordance with the previously pub-lished reports whereM. canettii formed the most ancient lineage of the MTBC [4] and in ourresults also, all strains ofM. canettii formed a distinct clade.M. africanum was found to bemore closely related to animal adapted strains of MTBC depicting similar evolutionary historyas ofM. bovis andM. orygis which has been reported earlier as well [34]. Except MtbOSDD472, all other Indian clinical isolates sequenced in this study (orange colored in Fig 1)were all found to be clustering in a common clade and appeared to be very closely related. The
Pangenome ofMycobacterium tuberculosis
PLOSONE | DOI:10.1371/journal.pone.0122979 April 8, 2015 7 / 26

Mtb reference strains H37Rv and H37Ra also clustered distinctly, depicting their close associa-tion. We found that the phylogenomic relationship between human and animal adapted strainsand species identified by using the core-gene component was largely consistent with previousreports [4,34,35] and additionally such a multi-gene approach served to better resolve strainspecific genomic differences.
Core and accessory genome size evolution. In view of defining the size of MTBC pangen-ome the primary question that arises is whether sufficient number of genomes has been se-quenced to describe the core and accessory gene content of the species. For this we observed
Fig 1. Core-gene Tree. The un-rooted MTBC tree was created from alignment of 971 orthologous core-genes from 96 strains. A tree with Bootstrappedvalues is presented in S3 Fig (details in text).
doi:10.1371/journal.pone.0122979.g001
Pangenome ofMycobacterium tuberculosis
PLOSONE | DOI:10.1371/journal.pone.0122979 April 8, 2015 8 / 26

the change in the core and accessory gene component as a function of their size with increasingnumber of sampled genomes over the entire 96 genomes (Fig 2). The total genome componentof the 96 MTBC strains was analysed to study the core and accessory genome size evolution interms of exponential decay and growth models. The models are based on the median values ofthe conserved and accessory genome HGCs which in turn are obtained from the random per-mutations of genome comparisons and limiting the number of possible combinations to 100,for each new genome being added. The exponential decay model in Fig 2A suggests that thenumber of core HGCs tends to approach a plateau near 2,000 HGCs whereas the accessoryHGCs tends to reach a plateau near 6,000 HGCs (Fig 2B) for the 96 strains under comparison.Since there is no distinctly sharp plateau formation, we estimate that the MTBC has an openpangenome i.e. the number of distinct genes found in MTBC strains is infinite as opposed to fi-nite number of genes in a closed pangenome.
Annotation distribution of pangenome of MTBC. Each of the HGCs has a representa-tive sequence which is the parent sequence of every cluster. All HGCs (i.e. 8,099) were annotat-ed by querying their corresponding representative sequences against BLAST2GO as describedin methods section. The overall annotation distribution (Fig 3) obtained from BLAST2GOshowed that out of the 8,099 protein sequences, 47.77% (3,869) sequences were fully annotatedwith GO slim terms. 26.63% (2,157) sequences were without any BLAST hits (i.e. the sequencehad absolutely no homology to any of the sequences present in the NCBI databases). Based onthe results of BLAST hits obtained, the gene ontology mapping process retrieved GO terms dis-tributed in BLAST matches. 23.43% (1,898) sequences failed to retrieve any GO terms associat-ed with them.
Analysis of the soft-core component of the pangenome. In a total of 3,374 soft-core se-quences, 2,921 sequences had GO terms associated with them (i.e. fully annotated) and the re-maining ones had one or the other result missing (as in Fig 3 pie). The soft-core encompassedmajority of the essential genes of Mtb as described above. The major COG (Clusters of Ortho-logous Groups) classes represented in the essential genes were E (amino acid transport and me-tabolism), J (translation, ribosomal structure and biogenesis), H (coenzyme transport andmetabolism), R (general function), C (energy production and conversion), and M (cell wall ormembrane or envelope biogenesis). A detailed account of the spread of the COG categories ofessential genes is in S4 Fig.
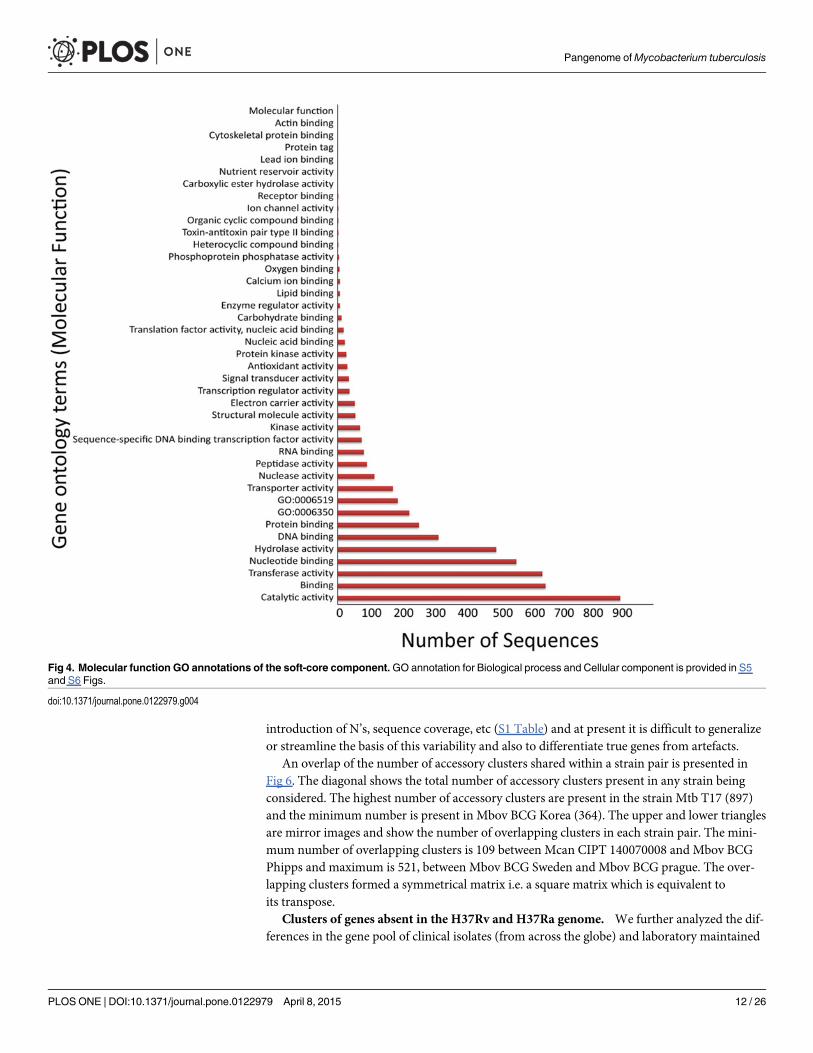
The three main Gene ontology terms under which all genes and gene products are repre-sented include molecular function, cellular component and biological process. The 3,374 soft-core HGCs were annotated with a total of 14,297 GO terms out of which 93 were unique GOcategories. Each sequence can have multiple GO terms associated with it, therefore represent-ing redundant terms. A total of 5,023 sequences were spread over 41 GO terms of molecularfunction category and a distribution of these terms in the soft-core component is presented inFig 4. The number of sequences in each GO term for the other two GO categories i.e. biologicalprocess and cellular component is represented in S5 and S6 Figs along with theirannotation terms.
Analysis of the variable component of the pangenome. The soft-accessory genome ofMTBC comprises of 4,725 HGCs. The 4,725 clusters were investigated to identify clustersshared among any given strain pair, unique to each strain and clusters with proteins present ingreater than 1/3rd of the clinical isolates but absent in the two laboratory strains i.e. MtbH37Rv and Mtb H37Ra. A distribution of the accessory genome component in different speciesof MTBC is depicted in Fig 5. Single strain ofM. africanum andM. orygis are present in 420and 429 HGCs respectively, 70 isolates ofM. tuberculosis are variably spread over 3,556 HGCs,15 strains ofM. bovis are present in 1,632 HGCs and 9 isolates ofM. canettii are spread over1,641 HGCs. The numbers in the center of flower plots and circular plots (Fig 5) are overlaps
Pangenome ofMycobacterium tuberculosis
PLOSONE | DOI:10.1371/journal.pone.0122979 April 8, 2015 9 / 26

Fig 2. Core and accessory genome size evolution. (A) Each point indicates the number of HGCsconserved in a genome. The red line indicates an exponential decay function based on the median values ofcore HGCs when each time a new genome is added to the analysis. (B) Accessory genome of MTBC. TheMTBC has an open pangenomemodel.
doi:10.1371/journal.pone.0122979.g002
Pangenome ofMycobacterium tuberculosis
PLOSONE | DOI:10.1371/journal.pone.0122979 April 8, 2015 10 / 26

amongst species and are not unique to the species. The number of genes unique to a particularstrain is represented in the leaves of the flower plots and in outer circles in case ofM. africanumandM. orygis. It was found that most of the genomes with a status of ‘complete sequence’ had avery low number of unique genes as compared to draft quality genomes which had highernumber of unique genes.
ThoughM. canettii CIPT140070017 andM. canettii CIPT140070010 have a complete ge-nome status but they showed a high number of unique genes (153 and 152 respectively) inthem. The possible reasons behind this could be presence of stretches of un-assigned bases de-noted by N’s in the sequence or the bigger genome size of these two genomes (4.53 and4.52MB) as compared to the average genome size of otherM. canettii (4.38MB) genomes. Weclosely inspected the predicted functional annotation of theseM. canettii unique genes ob-tained from BLAST matches. Majority of the BLAST hits were either self matches of the proteinor they showed homology with proteins of other species of mycobacterium such asM. kansasii,M. gastri,M. gilvum,M.marinum,M. yongonense,M. avium,M. abscessus. Some of the pro-teins also showed homology with other bacterial species such as Glaciibacter superstes, Gordo-nia kroppenstedtii, and Streptomyces griseus etc.
A closer look into unique genes of all other genomes suggested that there could be multiplefactors that can account for this intra- and inter- species variability such as genome size, natureof genomes (draft, complete or finished), size of contigs, genome scaffolds generated by
Fig 3. Summary of sequence annotation statistics from BLAST2GO. Representative sequences from allthe 8,099 HGCs were subjected to annotation out of which 47.77% (3,869) sequences were annotated withGO slim terms, 26.63% (2,157) sequences were without any BLAST hits, 23.43% (1,898) sequences hadonly blast results but didn’t had annotation and 1.65% (134) sequences retrieved mapping results but werewithout GO slim terms. A small fraction of 0.5% (41) sequences failed to fetch BLAST results.
doi:10.1371/journal.pone.0122979.g003
Pangenome ofMycobacterium tuberculosis
PLOSONE | DOI:10.1371/journal.pone.0122979 April 8, 2015 11 / 26
introduction of N’s, sequence coverage, etc (S1 Table) and at present it is difficult to generalizeor streamline the basis of this variability and also to differentiate true genes from artefacts.
An overlap of the number of accessory clusters shared within a strain pair is presented inFig 6. The diagonal shows the total number of accessory clusters present in any strain beingconsidered. The highest number of accessory clusters are present in the strain Mtb T17 (897)and the minimum number is present in Mbov BCG Korea (364). The upper and lower trianglesare mirror images and show the number of overlapping clusters in each strain pair. The mini-mum number of overlapping clusters is 109 between Mcan CIPT 140070008 and Mbov BCGPhipps and maximum is 521, between Mbov BCG Sweden and Mbov BCG prague. The over-lapping clusters formed a symmetrical matrix i.e. a square matrix which is equivalent toits transpose.
Clusters of genes absent in the H37Rv and H37Ra genome. We further analyzed the dif-ferences in the gene pool of clinical isolates (from across the globe) and laboratory maintained
Fig 4. Molecular function GO annotations of the soft-core component.GO annotation for Biological process and Cellular component is provided in S5and S6 Figs.
doi:10.1371/journal.pone.0122979.g004
Pangenome ofMycobacterium tuberculosis
PLOSONE | DOI:10.1371/journal.pone.0122979 April 8, 2015 12 / 26
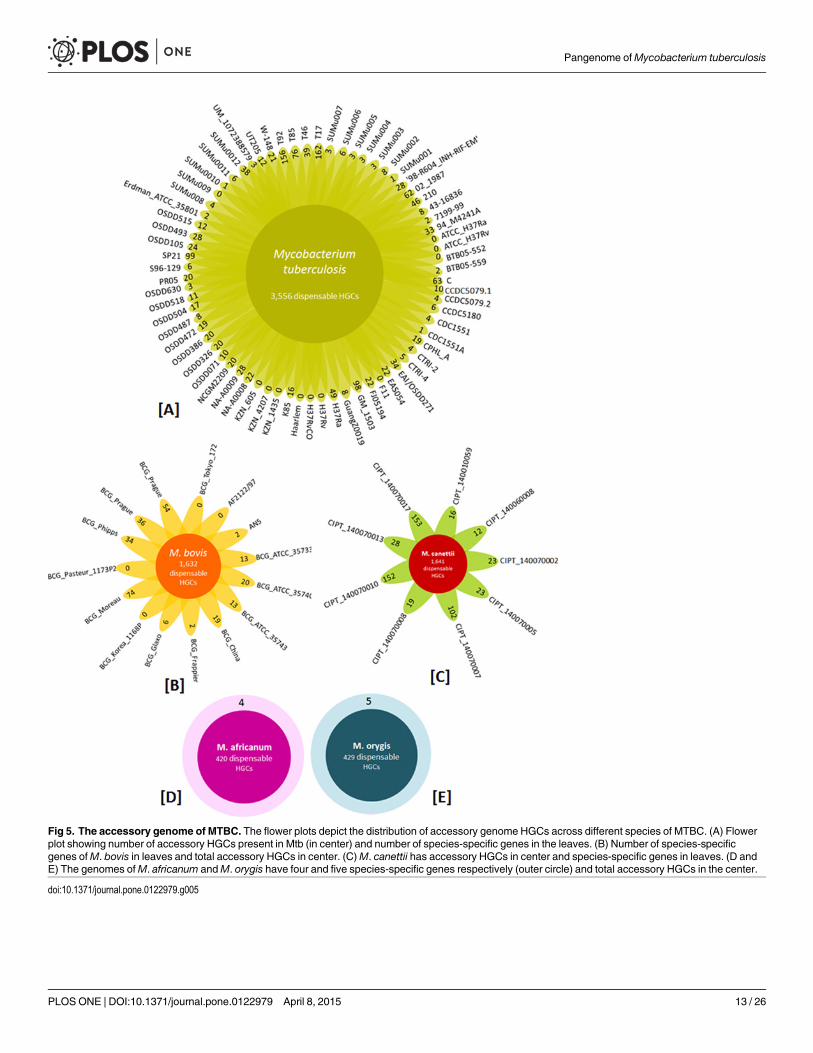
Fig 5. The accessory genome of MTBC. The flower plots depict the distribution of accessory genome HGCs across different species of MTBC. (A) Flowerplot showing number of accessory HGCs present in Mtb (in center) and number of species-specific genes in the leaves. (B) Number of species-specificgenes ofM. bovis in leaves and total accessory HGCs in center. (C)M. canettii has accessory HGCs in center and species-specific genes in leaves. (D andE) The genomes ofM. africanum andM. orygis have four and five species-specific genes respectively (outer circle) and total accessory HGCs in the center.
doi:10.1371/journal.pone.0122979.g005
Pangenome ofMycobacterium tuberculosis
PLOSONE | DOI:10.1371/journal.pone.0122979 April 8, 2015 13 / 26

strains by looking out for genes that were conspicuously missing in the genome assemblies ofthe laboratory strains, H37Rv and H37Ra, but were present in at-least or greater than 1/3rd ofthe clinical strains. We obtained 74 clusters meeting this criterion from the accessory genomeof 4,725 HGCs. A cross-validation of the 74 clusters against whole genome sequences ofH37Rv and H37Ra was done using BLAT [37]. We identified 10 clusters which had absolutelyno match with H37Ra and H37Rv genomes, whereas the other 64 shared partial homologywith H37Rv and H37Ra in variable regions of the genomes with a sequence length difference
Fig 6. Overlap of accessory orthologous clusters shared within each strain pair. The diagonal represent the number of clusters present in any givenstrain and divides the data into exactly similar halves. Color key indicates the distribution of clusters. The sharing is irrespective of the cluster being present inany other strain. The minimum number of shared clusters is 109 clusters between Mcan CIPT 140070008 and Mbovis BCG Phipps and maximum (521) isbetween Mbovis BCG Sweden and Mbovis BCG Prague9.
doi:10.1371/journal.pone.0122979.g006
Pangenome ofMycobacterium tuberculosis
PLOSONE | DOI:10.1371/journal.pone.0122979 April 8, 2015 14 / 26

in the alignment. Fig 7 shows the 74 clusters absent from H37Ra and H37Rv (first 4 columnsin Fig 7) but present in at-least 1/3rd of the clinical isolates along with their annotations.
Experimental validation of the genes in the pangenome specific to clinical isolates. Werandomly picked 9 candidate HGCs sequences (Fig 7, genes 1–9) from the 74 clusters whichwere present in most of the clinical isolates and employed a classical PCR approach to experi-mentally validate these putative genic loci. PCR validation was performed on genomic DNA ofthe eight Indian OSDD strains sequenced in this study and laboratory strains Mtb ATCCH37Ra and Mtb ATCC H37Rv procured from ATCC. We designed primers for the 8 availableOSDD strains using primer BLAST [37]. A detailed account of the forward and reverse primersused for the validation and their expected product sizes are summarized in S2 Table. All prim-ers provided amplification of genomic DNA in expected sizes, substantiating and validatingthe presence of these genes in the strains under consideration. The PCR result for these 9 genesequences are shown in Fig 8. Out of the 9 genes which were PCR validated, 7 genes were abso-lutely absent from H37Rv and H37Ra whereas 2 genes (Gene 4 and gene 8) displayed appear-ance of differentially sized gene products (these 2 genes shared partial homology with H37Raand H37Rv).
The PCR amplification of Gene 4 showed presence of differentially sized products in MtbATCC H37Rv and Mtb ATCC H37Ra genomes (Fig 8A). In order to reveal the nature of thesedifferentially sized products we used the predicted ORF sequence of Gene 4 (annotated as hy-pothetical protein) to align against the reference whole genomes of Mtb ATCC H37Rv andMtb ATCC H37Ra using BLAST [38] (Fig 8B). The sequence alignment of Gene 4 (Texts C
Fig 7. The heatmap shows 74 HGCs absent from reference strains Mtb ATCCH37Ra and Mtb ATCCH37Rv but present in most of the clinicalisolates. Predicted annotation of each of the cluster family is also represented. The genes validated using PCR are also shown adjacent to the annotations.
doi:10.1371/journal.pone.0122979.g007
Pangenome ofMycobacterium tuberculosis
PLOSONE | DOI:10.1371/journal.pone.0122979 April 8, 2015 15 / 26

Fig 8. (A) PCR validation of the 10 candidate genes (subset of 74 clusters identified) in 8 Indian clinical isolates (OSDD strains) and referencestrains ATCCH37Ra and ATCCH37Rv. Arrow heads indicate the variably sized products in ATCC H37Ra and ATCC H37Rv genomes. Gene 4 and Gene8 shares partial homology with laboratory strains and showed the presence of a differently sized product in ATCC H37Rv and ATCC H37Ra. (B) Thealignment of Gene 4 against reference genomes showed an insertion of 175bp sequence in Gene 4 of OSDD strains with respect to reference strains. (C)The alignment of Gene 8 against reference genomes showed a deletion of 1,352bp sequence in Gene 8 of OSDD strains.
doi:10.1371/journal.pone.0122979.g008
Pangenome ofMycobacterium tuberculosis
PLOSONE | DOI:10.1371/journal.pone.0122979 April 8, 2015 16 / 26

and D in S1 File) on the negative strand of Mtb ATCC H37Rv and Mtb ATCC H37Ra showedan insertion sequence of 175bp in Gene 4 of OSDD strains in comparison to the reference ge-nomes. Detailed insights into the genomic loci of Gene 4 alignment with reference strainsshowed partial overlapping of Gene 4 with hypothetical proteins in Mtb ATCC H37Rv andMtb ATCC H37Ra thereby resulting in the formation of differentially sized gene products (Fig-ures A and B in S1 File). The PCR results of Gene 8 also showed differentially sized products inMtb ATCC H37Rv and Mtb ATCC H37Ra genomes (Fig 8C). The alignment of the predictedORF sequence of Gene 8 (no annotation) against the reference whole genomes of Mtb ATCCH37Rv and Mtb ATCC H37Ra (Texts C and D in S2 File) showed a deletion of 1,352bp se-quence in Mtb OSDD strains. The genomic loci where Gene 8 aligns, majorly consists of repeatregion and IS6110 transposase subunits in Mtb ATCC H37Rv and Mtb ATCC H37Ra (FiguresA and B in S2 File). The corresponding insertion and deletion sequences of the putative ORFsof Gene 4 and Gene 8 respectively were confirmed by di-deoxy sequencing of their PCR prod-ucts in Mtb OSDD472, Mtb ATCC H37Rv and Mtb ATCC H37Ra (Texts A and B in S1 and S2Files).
The PCR results of Gene 4 and Gene 8 highlights the active role of genome re-arrangementstaking place in the Mtb genomes and how the pathogen evolves by means of structural varia-tions. Predicted functional annotation of the 9 candidate genes (Table 3) showed that ‘Gene 9’is a NADP-dependent oxido-reductase. Gene 1, 2, 4 and 5 are hypothetical proteins whereasGene 8 has no annotation associated with it. Genes 3 and 7 are involved in transcriptional andregulatory activity respectively and Gene 6 is a transposase involved in DNA binding.
DiscussionThe close association of different species of the MTBC complex presents a challenging issue inunderstanding the genetic pool of the species. The difficulty is further enhanced by the fact thatbacteria exchange genetic material in unique and unusual ways making the assessment of theircore and accessory gene repertoire evolution even more complex. The study of genetic variabil-ity within natural population of pathogens may provide insight into their evolution and patho-genesis. Comparative genome analysis of the species in terms of variation in the distribution ofSNPs, Indels, CRISPR-cas locus and nucleotide diversity has shown that their evolution is acomplex process [35]. Also high level of sequence variation in the PE/PPE genes has showedabsence of selective constraints and thereby suggesting neutral evolution [39]. The laboratorystrain,M. tuberculosisH37Rv, has long been considered as the representative reference tem-plate for tuberculosis and has been extensively used to uncover potential drug targets [40,41].However, selecting appropriate target gene/s for typing purposes requires that the expected
Table 3. Summary of gene clusters absent fromMtb ATCC H37Ra and Mtb ATCCH37Rv.
Gene Id Expected product size (bp) Predicted function
Gene 1 728 Protein
Gene 2 561 Hypothetical protein
Gene 3 547 Transcriptional regulator
Gene 4 496 Hypothetical protein
Gene 5 266 Conserved protein
Gene 6 225 Transposase
Gene 7 224 Iron regulated Elongation factor tu
Gene 8 195 NA
Gene 9 147 NADP-dependent oxidoreductase
doi:10.1371/journal.pone.0122979.t003
Pangenome ofMycobacterium tuberculosis
PLOSONE | DOI:10.1371/journal.pone.0122979 April 8, 2015 17 / 26

target gene should be present in all isolates being typed. Therefore, estimating the core-component of the species becomes a subject of prime importance. Over the course of evolutiongenomes can undergo many large and small scale changes. For instance, recombination causesgenome rearrangements, horizontal transfer introduces new sequences, and deletions removesegments of the genome [42,43]. Structural changes in the genome of closely related specieshave been reported in literature [44,45]. Such genome structural changes could also have phe-notypic correlates [46]. Earlier studies have shown the emergence of significant genetic differ-ences in genomes of laboratory strains and clinical isolates [24,25]. The newly emerging strainsof a pathogen may have genomic differences, which cannot be addressed adequately using asole reference genome. Over the past few years, WGS has widely been adopted for identifyinggenome-wide differences between related species [44,45], and significant work has been donefor establishing WGS as a standard typing tool [47].
The current work not only complements previously done studies [35,39,48] but also pro-vides an extensive characterization of the genomic structure of a large number of Mtb isolatesfrom across the globe and highlights the rich diversity present in their genetic catalogue.Though relatively low sequencing costs have provided useful means to re-sequence genomesand simultaneously perform large scale comparative studies on pathogenic isolates [21,49] butthe quality of the sequenced genomes remains a major concern. There is always a possibility ofaccidental incorporation of sequencing errors due to differences in sequencing protocols aswell as genome assembly methods. Thus owing to the large number of draft quality genomesused in this work, we describe both hard-core and soft-core genome component of MTBC.
Understanding the differences existing within MTBC and evolutionary forces shaping thesedifferences is not only crucial for uncovering its success as a pathogen but it is also expected toreveal key virulence mechanisms if any [50]. In the present study, we used a pangenome ap-proach to identify a core set of genes which is shared by 96 strains of MTBC, and includedmost of the key essential genes of the bacterium. Our study comprised of diverse strains ofMTBC from across the globe which included 10 MDR and 6 XDR strains and 8 Indian clinicalisolates sequenced and assembled in this study. Global phylogeny based on a multi-gene ap-proach involving 971 genes revealed the evolutionary relatedness of the 96 strains. The multi-gene tree was able to clearly differentiate between human- and animal- adapted strains andalso phylo-geographically separated strains such as the newly sequenced 8 OSDD strainswhich formed a distinct clade and the laboratory strains clustering together showing theirclose association.
The MTBC pangenome comprise of 8,099 HGCs of which 2,066 gene clusters were presentin the hard-core (100%) and 3,374 HGCs in the soft-core genome which was shared amongst95% of the total strains analyzed. The variable component of the pangenome comprised of4,725 gene clusters. Previous studies performed by Trost et al and Zakham et al on fourteenand twenty one mycobacterial genomes respectively have also shown that the mycobacteria hasa fairly small core genome as compared to the accessory genome component [48,51]. From theaccessory genome, a subset of 74 clusters was identified which was not represented in the refer-ence laboratory templates, Mtb ATCC H37Rv and Mtb ATCC H37Ra, but were present inmost of the clinical isolates being analyzed. We confirmed the complete absence of 7 candidategene sequences from the laboratory templates using PCR and 2 genes sharing partial homologyand having differentially sized gene products suggesting probable genome re-arrangementevents of insertion and deletion. We argue that using a sole reference genome based approachcould have severe limitations with under-representation of the actual repertoire of potentialdrug targets.
Our data suggest that a pangenome based approach applied to whole genome sequences cannot only identify conserved genome regions but also detect rich information on genomic
Pangenome ofMycobacterium tuberculosis
PLOSONE | DOI:10.1371/journal.pone.0122979 April 8, 2015 18 / 26

differences existing within strains of same species as has also been shown from previous com-parative genomic studies on Mtb [35,48,51]. In a recent study by Liu et al, a comparative analy-sis of 7 newly sequenced clinical isolates and 7 complete reference genomes of Mtb showedthat genomic variations might play an important role in the genomic plasticity of Mtb [35].Such comparative genomics approaches are a promising tool for studying strain specific genet-ic differences occurring within species. With the availability of cheaper and high-throughputDNA sequencing techniques, there are a large number of MTBC strains being sequenced andraw sequencing reads being deposited in SRA [52]. Therefore, we hope that we will be able toextend these analyses encompassing a much larger dataset with more representative sequencescorresponding to various geographical regions and strain types to elucidate the geographicalsignatures of pangenome components. We propose that a pangenome approach could identifynovel and functionally relevant subsets of gene clusters with distinct functional characteristicsand could provide a starting point towards re-looking at standard drug target discovery pipe-lines, which currently rely heavily on reference or template genomes.
Materials and Methods
The Strains and DNA isolationA total of 96 strains from the Mtb complex were used in this study to construct and analyse thePangenome architecture of MTBC. Out of these 96 genomes (data acquisition: 30-December-2013), 25 strains comprised of the whole genome sequences of MTBC and were obtained fromthe Refseq database of NCBI [53], 63 were draft genome assemblies present in the form of Scaf-folds and/or contigs in NCBI whereas the remaining 8 strains were clinical isolates from India(Table 1). The DNA of the 8 strains was procured from the Open Source Drug Discovery OpenAccess Repository and corresponds to strain IDs OSDD472, OSDD326, OSDD071, OSDD504,OSDD630, OSDD386, OSDD487 and OSDD518. The strains were originally isolated at the Na-tional JALMA Institute of Leprosy and other Mycobacterial Diseases, Agra, India. GenomicDNA was isolated using theMycobacterium tuberculosis genomic DNA isolation kit followingmanufacturer’s instruction (Premas Biotech, India, Cat No: PB-MTB-0200). Briefly, one ml ofculture was centrifuged at 6,000 rpm for one min and supernatant was discarded. The pelletwas re-suspended in 200 ul of WB1 buffer and incubated at 100°C for 5 min. The solution wascentrifuged at 8,000 rpm for one min at room temperature and the supernatant was discarded.To the pellet, 250 ul of LB1 buffer was added and vortexed for 20 sec followed by 5 min incuba-tion at room temperature. Buffer LB2 (250 ul) was added followed by 20ul of Proteinase K solu-tion (20mg/ml). The solution was mixed and incubated at 65°C for 20 min with intermittentvortex. To this 10ul of LB3 buffer was added and mixed, followed by incubation at 65°C for 10min. The solution was then centrifuged at 12,000 rpm for 1 min and the resultant supernatanttransferred to a fresh tube. To this an equal volume of Phenol:Chloroform was added andmixed followed by centrifugation at 12,000 rpm for 5 min. Carefully the aqueous phase wastransferred to a fresh tube and 800ul of chilled WB2 buffer was added followed by mixing. Thesolution was centrifuged at 12,000 rpm for 20 min and the supernatant was discarded. To this,400ul of chilled WB3 buffer was added and centrifuged at 12,000 rpm for 1 min. The superna-tant was discarded and the pellet was air-dried. Finally 100ul of RE buffer was added and theDNA solution was stored at 2–8°C.
Genome Sequencing, Spoligotyping and Drug sensitivity profilingBriefly, 101 base paired-end DNA libraries were generated using Illumina paired-end samplepreparation kit following standard manufacturer protocol [54]. 5 μg of genomic DNA (gDNA)was nebulized to generate double stranded DNA fragments of size less than 800 bp. The sticky
Pangenome ofMycobacterium tuberculosis
PLOSONE | DOI:10.1371/journal.pone.0122979 April 8, 2015 19 / 26
ends of the fragmented DNA were converted to blunt ends using T4 DNA polymerase and Kle-now enzyme and a single “A” base was added to 30 end using polymerase activity of Klenowfragments (30 to 50 exo minus). To this “A” overhang, manufacturer specified paired end adapt-er with a single “T” overhang was ligated. Of these ligated products,*350 bp fragment was se-lected from a 2% agarose gel and selectively enriched by PCR using adapter specific primers. Aminimum base quality of 30 was used for filtering the data. The DNA libraries were indexedand sequenced using the Illumina Genome Analyzer IIx platform following standard protocolsprovided by the manufacturer. The reads of newly sequenced genomes have been deposited inNCBI Sequence Read Archive (SRA) (http://www.ncbi.nlm.nih.gov/sra) with accessionsSRR784917, SRR786188, SRR786373, SRR786397, SRR786667, SRR786668, SRR786669 andSRR786670 [52]. Spoligotyping and drug sensitivity profiling were performed using standardprotocol and spoligotyping kit from Ocimum Biosolutions Ltd. by Premas Biotech, India.
De-novo AssemblyDe-novo assemblies were performed for the eight Indian OSDD isolates sequenced in thestudy. Raw paired-end reads obtained after sequencing were de novo assembled using Velvetsoftware [55] using different hash lengths (from 11 to 63). A 10 fold coverage cut-off was usedfor each hash length, and the best assembly for each of the strain was selected based on thehighest N50 values (N50 denotes the weighted median statistic meaning that 50% of the entireassembly is contained in contigs or scaffolds equal to or larger than this value) and also thetotal assembly size. It was observed that assemblies with higher N50 values and assembly sizetend to produce a decent and reliable assembled genome. Only contigs greater than 300bp wereincluded in the final assembly output for further analysis. The contig assemblies are available athttp://genome.igib.res.in/Mtb_Pangenome.
Gene Prediction and TranslationGene prediction and their corresponding protein translations were performed for all the 96Mtb strains using Prodigal (version 2.5) which has improved translation initiation site recogni-tion capability and produces less number of false positives [56]. Mtb gene prediction by Prodi-gal has been reported to be better than or equivalent to commonly used gene predictionalgorithms [56]. WGS of the reference MTBC genomes and scaffolds/contigs of draft genomeswere used to predict their CDS. We used Prodigal in normal mode with default parameters. Ge-nome sequences of each strain was provided as input and gene predictions along with its CDStranslations were obtained as output using standard command line options. We didn’t allowthe predicted genes to run off the edges of the contigs. The raw gene predictions are available athttp://genome.igib.res.in/Mtb_Pangenome/Pred_genes.
Homologous gene clusteringWe analysed the genomes using homologous clustering approach. Clustering tasks were per-formed with the tool CD-HIT [57], using an empirical threshold of 70% global sequence identi-ty which is calculated as number of identical amino acids in alignment divided by full length ofthe shorter sequence. Orthologous clusters were determined by selecting HGCs which hadonly one sequence from each strain. If a HGC had more than one sequence from same strain itwas considered a paralog cluster.
Core-gene treeA core-gene tree was calculated for all the 96 MTBC strains using the 100% core (i.e. hard-core) protein sequences using the approach followed by Kaas et al [47]. Briefly, in order to
Pangenome ofMycobacterium tuberculosis
PLOSONE | DOI:10.1371/journal.pone.0122979 April 8, 2015 20 / 26

create the core-gene tree, we used only orthologous clusters. A multiple sequence alignment ofthe protein sequences for each cluster was done using MUSCLE version 3.8.31 [58]. The align-ments were concatenated using FASconCAT [59]. Bootstrapping was done to generate 500 re-samples using Seqboot version 3.695 [60]. Distance matrices were calculated for both originalalignment as well as bootstrapped alignment using protdist version 3.695 [60]. Trees for boththe original and bootstrapped matrices were determined by FastME available from NCBI [61].FastME is based on the minimum evolution method and has been shown to have better accura-cy than other commonly used methods such as the Neighbor joining (NJ) [61]. A comparativestudy of trees obtained from original alignment and resampled alignment was done by Com-pareToBootstrap [62]. The final un-rooted core-gene tree was visualized in FigTree (http://tree.bio.ed.ac.uk/software/figtree/).
Evolution of Core and accessory genome sizeWe also estimated the change in the sizes of core and accessory gene content of MTBC eachtime a new strain is added to the analysis. For this we developed exponential decay (for corecomponent) and exponential growth (for accessory component) models using MATLAB (ver-sion R2009b). We first generated random combinations (limiting it to 100, to avoid the combi-natorial explosion) of genomes being sampled each time (i.e. 1, 2, 3, 4, . . ...96) using a bespokePerl script followed by counting the presence or absence of genes in these combinations. Sincethe aim was to observe the change in size of the core and accessory genome with each new ge-nome added to the analysis and to decide the saturation levels, we plotted the exponential mod-els of the median values of the counts obtained as has been reported previously also [63].
Pangenome estimation and annotationCore and Pangenome estimation was performed by clustering all the translated CDS sequencesof the 96 Mtb strains. The representative sequences of all clusters were then subjected to anno-tation using BLAST2GO [64]. The BLAST2GO basically performs annotation in three mainsteps: Firstly, it performs BLAST searches to find similar sequences for the input dataset usingNCBI BLAST; Secondly, the program extracts the GO terms associated to each of the obtainedBLAST hits using BLAST hit accessions using four different mappings and at last, returns anevaluated GO annotation for the query sequence(s) using an annotation rule [64]. Data miningon the results were carried out using custom Perl scripts. Data was parsed so as to reveal coreand accessory genome clusters, clusters unique to each strain, clusters shared among a givenstrain pair, clusters of genes (pertaining to their absence in laboratory strains, hence callednovel) present in greater than 1/3rd of the clinical isolates and absent from the laboratorystrains.
Gene sequences specific to clinical strainsFrom the accessory gene clusters, we filtered clusters which were absent in the laboratorystrains, Mtb H37Rv and Mtb H37Ra, but were present in more than 1/3rd of the clinical strainsbeing considered. The clusters were further matched against the laboratory whole genome se-quences using BLAT [36], so as to reveal the level of similarity if any, in the laboratory strains.
Validation of genes by PCRSome of the genes identified from the newly sequenced strains were validated using PCR am-plification followed by di-deoxy chain termination sequencing. List of validated genes, primerpairs and annealing temperature used for PCR has been summarized in S2 Table. PCR primers
Pangenome ofMycobacterium tuberculosis
PLOSONE | DOI:10.1371/journal.pone.0122979 April 8, 2015 21 / 26

were designed using the NCBI primer BLAST [37]. Apart from 8 clinical isolates obtainedfrom OSDD repository we have procured theMycobacterium tuberculosis reference strains(H37RV—ATCC 25618D-5 and H37Ra—ATCC 25177D-5) from ATCC for the PCR valida-tion. PCR mix constituted by 5 μl of 10X Taq buffer (Fermentas), 3 μl of 25mMMgCl2 (Fer-mentas), 2μl 10mM dNTP (Fermentas), 1 μl of respective forward and reverse primers(10mM), 36μl nuclease free water (Ambion) and 5 units Taq (Fermentas) along with 1 μl of re-spective sample DNA. Thermal cycling was performed by a PTC 200 thermal cycler (Biorad)with an initial denaturation by 94° for 5 minutes followed by 30 cycles of 94° for 45 seconds, re-spective annealing temperature as per S2 Table for 45 seconds, 72° for 45 seconds and a finalextension of 72° for 10 minutes. The resultant PCR product was checked in 2% agarose 1XTAE gel and thereafter performed di-deoxy chain termination sequencing as originally de-scribed by Sanger et al [65].
Supporting InformationS1 Fig. Spoligotyping and Drug Susceptibility testing results. Drug sensitivity performed ona panel of 12 drugs and spoligotyping results for the eight OSDD strains.(TIF)
S2 Fig. Describing the soft-core. Essential gene based criteria for setting threshold for definingsoft-core. We identified the number of overlapping essential genes by merging the three inde-pendent studies done onMycobacterium tuberculosisH37Rv (Mtb). The study resulted in 348genes shared amongst the three studies. After performing a BLAST search, 2,149 sequences outof the total 8,099 representative sequences matched with essential genes of Mtb. Out of the2,149 BLAST hits 597 genes matched with the 348 overlapping genes. To set an optimal thresh-old for defining the soft-core we looked out for maximum number of essential genes matchingwith the core. The most optimal cut-off was found to be at 95% after which there was no signif-icant rise in the number of essential genes falling in the core component and also assumingthat all the 348 genes will be present at least once in the 95% core (i.e. 485 genes shared withBLAST hits).(TIF)
S3 Fig. Core gene tree with bootstrapped values obtained after comparing original treewith resampled trees.(TIF)
S4 Fig. Distribution of essential genes of Mtb based on COG category.(TIF)
S5 Fig. The number of sequences in each GO term for the GO category. biological process.(TIF)
S6 Fig. The number of sequences in each GO term for the GO category. cellular component.(TIF)
S1 File. Gene 4 alignment with reference genomes H37Rv and H37Ra.(DOCX)
S2 File. Gene 8 alignment with reference genomes H37Rv and H37Ra.(DOCX)
S1 Table. Strains description. Detailed description of strains used in current study.(DOCX)
Pangenome ofMycobacterium tuberculosis
PLOSONE | DOI:10.1371/journal.pone.0122979 April 8, 2015 22 / 26

S2 Table. Primers used. List of forward and reverse primers used for the validation and theirexpected product sizes.(DOCX)
AcknowledgmentsThe authors thank CSIR Open Source Drug Discovery Consortium, India and NationalJALMA Institute Leprosy and other Mycobacterial Diseases, Agra, India, for providing accessto the strain repository. The authors also acknowledge inputs and help from Dr Swati Subodh(TCGA) and Dr Nupur Mehrotra (Premas Biotech, India) for scientific discussions and help inmaintaining the strains. AP and MS acknowledge Senior Research Fellowship from CSIR,India. Authors acknowledge scientific inputs and discussions with other colleagues at CSIRIGIB which has enriched the content of the manuscript. Authors also thank Dr S Ramachan-dran and Dr Sheetal Gandotra for reviewing the manuscript.
Author ContributionsConceived and designed the experiments: VP AP SS VS. Performed the experiments: AP SKVMS AM SJ RKC. Analyzed the data: VP AG VS. Wrote the paper: VP SS VS. Performed thedata collation, conceptualized and standardized the computational methodology and per-formed the analysis: VP. Did library preparation, standardization of the protocol and sequenc-ing of the strains: AP. Conducted the validation protocol: KVS. Assisted VP in genomeassembly and gene prediction: AG. Assisted AP in generating the sequencing libraries and se-quencing: MS AM SJ RKC. Carried out Mtb strain propagation and characterization: AVS PKSPG. Oversaw the patient selection, sample collection and maintenance of the JALMAMtbstrain repository: VMK KK. Oversaw the sample collection and maintenance of the JALMAstrain repository and the strain selection and propagation for the study and the culture: DSC.Conceptualised the study, oversaw the strain propagation, DNA isolation, sequencing of thestrains and computational analysis: SSB VS.
References1. de Jong BC, Antonio M, Gagneux S (2010) Mycobacterium africanum—review of an important cause of
human tuberculosis in West Africa. PLoS Negl Trop Dis 4: e744. doi: 10.1371/journal.pntd.0000744PMID: 20927191
2. Cole ST, Brosch R, Parkhill J, Garnier T, Churcher C, Harris D, et al. (1998) Deciphering the biology ofMycobacterium tuberculosis from the complete genome sequence. Nature 393: 537–544. PMID:9634230
3. Garnier T, Eiglmeier K, Camus JC, Medina N, Mansoor H, Pryor M, et al. (2003) The complete genomesequence of Mycobacterium bovis. Proc Natl Acad Sci U S A 100: 7877–7882. Epub 2003 Jun 7873.PMID: 12788972
4. Brosch R, Gordon SV, Marmiesse M, Brodin P, Buchrieser C, Eiglmeier K, et al. (2002) A new evolution-ary scenario for the Mycobacterium tuberculosis complex. Proc Natl Acad Sci U S A 99: 3684–3689.Epub 2002Mar 3612. PMID: 11891304
5. van Ingen J, Rahim Z, Mulder A, Boeree MJ, Simeone R, Brosch R, et al. (2012) Characterization ofMycobacterium orygis as M. tuberculosis complex subspecies. Emerg Infect Dis 18: 653–655. doi:610.3201/eid1804.110888 PMID: 22469053
6. Zhang Y (2004) Persistent and dormant tubercle bacilli and latent tuberculosis. Front Biosci 9:1136–1156. PMID: 14977534
7. Gomez JE, McKinney JD (2004) M. tuberculosis persistence, latency, and drug tolerance. Tuberculosis(Edinb) 84: 29–44. PMID: 14670344
8. WHO (2012a) http://www.who.int/tb/publications/global_report/en/index.html.
9. WHO (2012b) http://www.who.int/tb/publications/MDRFactSheet2012.pdf.
10. Rowland K (2012) Totally drug-resistant TB emerges in India.
Pangenome ofMycobacterium tuberculosis
PLOSONE | DOI:10.1371/journal.pone.0122979 April 8, 2015 23 / 26

11. Velayati AA, Masjedi MR, Farnia P, Tabarsi P, Ghanavi J, Ziazarifi A, et al. (2009) Emergence of newforms of totally drug-resistant tuberculosis bacilli: super extensively drug-resistant tuberculosis or totallydrug-resistant strains in iran. Chest 136: 420–425. doi: 410.1378/chest.1308-2427. Epub 2009 Apr1376. PMID: 19349380
12. Millar JW, Horne NW (1979) Tuberculosis in immunosuppressed patients. Lancet 1: 1176–1178.PMID: 86892
13. WHO (2011) http://www.who.int/hiv/topics/tb/hiv_tb_factsheet_june_2011.pdf.
14. Gagneux S, Small PM (2007) Global phylogeography of Mycobacterium tuberculosis and implicationsfor tuberculosis product development. Lancet Infect Dis 7: 328–337. PMID: 17448936
15. Wirth T, Hildebrand F, Allix-Beguec C, Wolbeling F, Kubica T, Kremer K, et al. (2008) Origin, spreadand demography of the Mycobacterium tuberculosis complex. PLoS Pathog 4: e1000160. doi: 10.1371/journal.ppat.1000160 PMID: 18802459
16. Sougakoff W (2011) Molecular epidemiology of multidrug-resistant strains of Mycobacterium tuberculo-sis. Clin Microbiol Infect 17: 800–805. doi: 810.1111/j.1469-0691.2011.03577.x PMID: 21682800
17. Bazira J, Asiimwe BB, Joloba ML, Bwanga F, Matee MI (2011) Mycobacterium tuberculosis spoligo-types and drug susceptibility pattern of isolates from tuberculosis patients in South-Western Uganda.BMC Infect Dis 11:81.: doi: 10.1186/1471-2334-1111-1181 PMID: 21453482
18. Malla B, Stucki D, Borrell S, Feldmann J, Maharjan B, Shrestha B, et al. (2012) First insights into thephylogenetic diversity of Mycobacterium tuberculosis in Nepal. PLoS One 7: e52297. doi: 52210.51371/journal.pone.0052297. Epub 0052012 Dec 0052226. PMID: 23300635
19. Pieters J (2008) Mycobacterium tuberculosis and the macrophage: maintaining a balance. Cell Host Mi-crobe 3: 399–407. doi: 310.1016/j.chom.2008.1005.1006 PMID: 18541216
20. Niemann S, Koser CU, Gagneux S, Plinke C, Homolka S, Bignell H, et al. (2009) Genomic diversityamong drug sensitive and multidrug resistant isolates of Mycobacterium tuberculosis with identicalDNA fingerprints. PLoS One 4: e7407. doi: 10.1371/journal.pone.0007407 PMID: 19823582
21. MacLean D, Jones JD, Studholme DJ (2009) Application of 'next-generation' sequencing technologiesto microbial genetics. Nat Rev Microbiol 7: 287–296. doi: 10.1038/nrmicro2122 PMID: 19287448
22. Shendure J, Ji H (2008) Next-generation DNA sequencing. Nat Biotechnol 26: 1135–1145. doi: 10.1038/nbt1486 PMID: 18846087
23. Zhao J, Grant SF (2011) Advances in whole genome sequencing technology. Curr Pharm Biotechnol12: 293–305. PMID: 21050163
24. Perna NT, Plunkett G 3rd, Burland V, Mau B, Glasner JD, et al. (2001) Genome sequence of enterohae-morrhagic Escherichia coli O157:H7. Nature 409: 529–533. PMID: 11206551
25. Fleischmann RD, Alland D, Eisen JA, Carpenter L, White O, Peterson J, et al. (2002) Whole-genomecomparison of Mycobacterium tuberculosis clinical and laboratory strains. J Bacteriol 184: 5479–5490.PMID: 12218036
26. Tettelin H, Masignani V, Cieslewicz MJ, Donati C, Medini D, Ward N, et al. (2005) Genome analysis ofmultiple pathogenic isolates of Streptococcus agalactiae: implications for the microbial "pan-genome".Proc Natl Acad Sci U S A 102: 13950–13955. Epub 12005 Sep 13919. PMID: 16172379
27. Kingsford C, Schatz MC, Pop M (2010) Assembly complexity of prokaryotic genomes using shortreads. BMC Bioinformatics 11: 21. doi: 10.1186/1471-2105-11-21 PMID: 20064276
28. Sassetti CM, Boyd DH, Rubin EJ (2003) Genes required for mycobacterial growth defined by high den-sity mutagenesis. Mol Microbiol 48: 77–84. PMID: 12657046
29. Griffin JE, Gawronski JD, Dejesus MA, Ioerger TR, Akerley BJ, Sassetti CM (2011) High-resolutionphenotypic profiling defines genes essential for mycobacterial growth and cholesterol catabolism.PLoS Pathog 7: e1002251. doi: 10.1371/journal.ppat.1002251 PMID: 21980284
30. Zhang YJ, Ioerger TR, Huttenhower C, Long JE, Sassetti CM, Sacchettini JC, et al. (2012) Global as-sessment of genomic regions required for growth in Mycobacterium tuberculosis. PLoS Pathog 8:e1002946. doi: 10.1371/journal.ppat.1002946 PMID: 23028335
31. Luo H, Lin Y, Gao F, Zhang CT, Zhang R (2014) DEG 10, an update of the database of essential genesthat includes both protein-coding genes and noncoding genomic elements. Nucleic Acids Res 42:D574–580. doi: 10.1093/nar/gkt1131 PMID: 24243843
32. Devulder G, Perouse de Montclos M, Flandrois JP (2005) A multigene approach to phylogenetic analy-sis using the genus Mycobacterium as a model. Int J Syst Evol Microbiol 55: 293–302. PMID:15653890
33. Mestre O, Luo T, Dos Vultos T, Kremer K, Murray A, Namouchi A, et al. (2011) Phylogeny of Mycobac-terium tuberculosis Beijing strains constructed from polymorphisms in genes involved in DNA
Pangenome ofMycobacterium tuberculosis
PLOSONE | DOI:10.1371/journal.pone.0122979 April 8, 2015 24 / 26
replication, recombination and repair. PLoS One 6: e16020. doi: 10.1371/journal.pone.0016020 PMID:21283803
34. Bentley SD, Comas I, Bryant JM, Walker D, Smith NH, Harris SR, et al. (2012) The genome of Myco-bacterium africanumWest African 2 reveals a lineage-specific locus and genome erosion common tothe M. tuberculosis complex. PLoS Negl Trop Dis 6: e1552. doi: 10.1371/journal.pntd.0001552 PMID:22389744
35. Liu F, Hu Y, Wang Q, Li HM, Gao GF, Liu CH, et al. (2014) Comparative genomic analysis of Mycobac-terium tuberculosis clinical isolates. BMCGenomics 15: 469. doi: 10.1186/1471-2164-15-469 PMID:24923884
36. Kent WJ (2002) BLAT—the BLAST-like alignment tool. Genome Res 12: 656–664. PMID: 11932250
37. Ye J, Coulouris G, Zaretskaya I, Cutcutache I, Rozen S, Madden TL (2012) Primer-BLAST: A tool to de-sign target-specific primers for polymerase chain reaction. BMC Bioinformatics 13: 134. doi: 10.1186/1471-2105-13-134 PMID: 22708584
38. Altschul SF, GishW, Miller W, Myers EW, Lipman DJ (1990) Basic local alignment search tool. J MolBiol 215: 403–410. PMID: 2231712
39. McEvoy CR, Cloete R, Muller B, Schurch AC, van Helden PD, Gagneux S, et al. (2012) Comparativeanalysis of Mycobacterium tuberculosis pe and ppe genes reveals high sequence variation and an ap-parent absence of selective constraints. PLoS One 7: e30593. doi: 10.1371/journal.pone.0030593PMID: 22496726
40. Raman K, Yeturu K, Chandra N (2008) targetTB: a target identification pipeline for Mycobacterium tu-berculosis through an interactome, reactome and genome-scale structural analysis. BMC Syst Biol2:109.: doi: 10.1186/1752-0509-1182-1109 PMID: 19099550
41. Asif SM, Asad A, Faizan A, Anjali MS, Arvind A, Neelesh K, et al. (2009) Dataset of potential targets forMycobacterium tuberculosis H37Rv through comparative genome analysis. Bioinformation 4:245–248. PMID: 20975918
42. Hacker J, Carniel E (2001) Ecological fitness, genomic islands and bacterial pathogenicity. A Darwinianview of the evolution of microbes. EMBORep 2: 376–381. PMID: 11375927
43. Tillier ER, Collins RA (2000) Genome rearrangement by replication-directed translocation. Nat Genet26: 195–197. PMID: 11017076
44. Azhikina T, Gvozdevsky N, Botvinnik A, Fushan A, Shemyakin I, Stepanshina V, et al. (2006) A ge-nome-wide sequence-independent comparative analysis of insertion-deletion polymorphisms in multi-ple Mycobacterium tuberculosis strains. Res Microbiol 157: 282–290. Epub 2005 Sep 2015. PMID:16239096
45. Doddapaneni H, Yao J, Lin H, Walker MA, Civerolo EL (2006) Analysis of the genome-wide variationsamong multiple strains of the plant pathogenic bacterium Xylella fastidiosa. BMCGenomics 7: 225.PMID: 16948851
46. Vishnoi A, Srivastava A, Roy R, Bhattacharya A (2008) MGDD: Mycobacterium tuberculosis genomedivergence database. BMCGenomics 9:373.: doi: 10.1186/1471-2164-1189-1373 PMID: 18681951
47. Kaas RS, Friis C, Ussery DW, Aarestrup FM (2012) Estimating variation within the genes and inferringthe phylogeny of 186 sequenced diverse Escherichia coli genomes. BMCGenomics 13: 577. doi: 10.1186/1471-2164-13-577 PMID: 23114024
48. Zakham F, Aouane O, Ussery D, Benjouad A, Ennaji MM (2012) Computational genomics-proteomicsand Phylogeny analysis of twenty one mycobacterial genomes (Tuberculosis & non Tuberculosisstrains). Microb Inform Exp 2: 7. doi: 10.1186/2042-5783-2-7 PMID: 22929624
49. Power PM, Bentley SD, Parkhill J, Moxon ER, Hood DW (2012) Investigations into genome diversity ofHaemophilus influenzae using whole genome sequencing of clinical isolates and laboratory transfor-mants. BMCMicrobiol 12:273.: doi: 10.1186/1471-2180-1112-1273 PMID: 23176117
50. Behr MA (2013) Evolution of Mycobacterium tuberculosis. Adv Exp Med Biol 783: 81–91. doi: 10.1007/978-1-4614-6111-1_4 PMID: 23468104
51. Trost B, Haakensen M, Pittet V, Ziola B, Kusalik A (2010) Analysis and comparison of the pan-genomicproperties of sixteen well-characterized bacterial genera. BMCMicrobiol 10: 258. doi: 10.1186/1471-2180-10-258 PMID: 20942950
52. Kodama Y, Shumway M, Leinonen R, International Nucleotide Sequence Database C (2012) The Se-quence Read Archive: explosive growth of sequencing data. Nucleic Acids Res 40: D54–56. doi: 10.1093/nar/gkr854 PMID: 22009675
53. Pruitt KD, Tatusova T, KlimkeW, Maglott DR (2009) NCBI Reference Sequences: current status, policyand new initiatives. Nucleic Acids Res 37: D32–36. Epub 2008 Oct 2016. doi: 10.1093/nar/gkn721PMID: 18927115
Pangenome ofMycobacterium tuberculosis
PLOSONE | DOI:10.1371/journal.pone.0122979 April 8, 2015 25 / 26

54. Patowary A, Purkanti R, Singh M, Chauhan RK, Bhartiya D, Dwivedi OP, et al. (2012) Systematic analy-sis and functional annotation of variations in the genome of an Indian individual. HumMutat 33:1133–1140. doi: 10.1002/humu.22091 PMID: 22461382
55. Zerbino DR, Birney E (2008) Velvet: algorithms for de novo short read assembly using de Bruijn graphs.Genome Res 18: 821–829. doi: 10.1101/gr.074492.107 PMID: 18349386
56. Hyatt D, Chen GL, Locascio PF, Land ML, Larimer FW, Hauser LJ (2010) Prodigal: prokaryotic generecognition and translation initiation site identification. BMC Bioinformatics 11: 119. doi: 10.1186/1471-2105-11-119 PMID: 20211023
57. Li W, Godzik A (2006) Cd-hit: a fast program for clustering and comparing large sets of protein or nucle-otide sequences. Bioinformatics 22: 1658–1659. Epub 2006 May 1626. PMID: 16731699
58. Edgar RC (2004) MUSCLE: multiple sequence alignment with high accuracy and high throughput. Nu-cleic Acids Res 32: 1792–1797. PMID: 15034147
59. Kuck P, Meusemann K (2010) FASconCAT: Convenient handling of data matrices. Mol PhylogenetEvol 56: 1115–1118. doi: 10.1016/j.ympev.2010.04.024 PMID: 20416383
60. Felsenstein J (1989) PHYLIP—Phylogeny Inference Package (Version 3.2). Cladistics 5: 164.
61. Desper R, Gascuel O (2002) Fast and accurate phylogeny reconstruction algorithms based on theminimum-evolution principle. J Comput Biol 9: 687–705. PMID: 12487758
62. Price MN, Dehal PS, Arkin AP (2010) FastTree 2—approximately maximum-likelihood trees for largealignments. PLoS One 5: e9490. doi: 10.1371/journal.pone.0009490 PMID: 20224823
63. Rasko DA, Rosovitz MJ, Myers GS, Mongodin EF, Fricke WF, Gajer P, et al. (2008) The pangenomestructure of Escherichia coli: comparative genomic analysis of E. coli commensal and pathogenic iso-lates. J Bacteriol 190: 6881–6893. doi: 10.1128/JB.00619-08 PMID: 18676672
64. Conesa A, Gotz S, Garcia-Gomez JM, Terol J, Talon M, Robles M (2005) Blast2GO: a universal tool forannotation, visualization and analysis in functional genomics research. Bioinformatics 21: 3674–3676.Epub 2005 Aug 3674. PMID: 16081474
65. Sanger F, Nicklen S, Coulson AR (1977) DNA sequencing with chain-terminating inhibitors. Proc NatlAcad Sci U S A 74: 5463–5467. PMID: 271968
Pangenome ofMycobacterium tuberculosis
PLOSONE | DOI:10.1371/journal.pone.0122979 April 8, 2015 26 / 26
Copyright © 2022 FDOKUMEN